estimating body fat in ncaa division i female athletes: a five-compartment model validation of...
TRANSCRIPT

ORIGINAL ARTICLE
Estimating body fat in NCAA Division I female athletes:a five-compartment model validation of laboratory methods
Jordan R. Moon Æ Joan M. Eckerson Æ Sarah E. Tobkin Æ Abbie E. Smith ÆChristopher M. Lockwood Æ Ashley A. Walter Æ Joel T. Cramer ÆTravis W. Beck Æ Jeffrey R. Stout
Accepted: 22 September 2008 / Published online: 21 October 2008
� Springer-Verlag 2008
Abstract The purpose of the present study was to
determine the validity of various laboratory methods for
estimating percent body fat (%fat) in NCAA Division I
college female athletes (n = 29; 20 ± 1 year). Body
composition was assessed via hydrostatic weighing (HW),
air displacement plethysmography (ADP), and dual-energy
X-ray absorptiometry (DXA), and estimates of %fat
derived using 4-compartment (C), 3C, and 2C models were
compared to a criterion 5C model that included bone
mineral content, body volume (BV), total body water, and
soft tissue mineral. The Wang-4C and the Siri-3C models
produced nearly identical values compared to the 5C model
(r [ 0.99, total error (TE) \ 0.40%fat). For the remaining
laboratory methods, constant error values (CE) ranged
from -0.04%fat (HW-Siri) to -3.71%fat (DXA); r values
ranged from 0.89 (ADP-Siri, ADP-Brozek) to 0.93 (DXA);
standard error of estimate values ranged from 1.78%fat
(DXA) to 2.19%fat (ADP-Siri, ADP-Brozek); and TE
values ranged from 2.22%fat (HW-Brozek) to 4.90%fat
(DXA). The limits of agreement for DXA (-10.10 to
2.68%fat) were the largest with a significant trend of -0.43
(P \ 0.05). With the exception of DXA, all of the equa-
tions resulted in acceptable TE values (\3.08%fat).
However, the results for individual estimates of %fat using
the Brozek equation indicated that the 2C models that
derived BV from ADP and HW overestimated (5.38,
3.65%) and underestimated (5.19, 4.88%) %fat, respec-
tively. The acceptable TE values for both HW and ADP
suggest that these methods are valid for estimating %fat in
college female athletes; however, the Wang-4C and Siri-3C
models should be used to identify individual estimates of
%fat in this population.
Keywords Air displacement plethysmography �Underwater weighing � Multi-compartment �Dual-energy X-ray absorptiometry
Introduction
Estimates of body composition characteristics are com-
monly used in both athletic and non-athletic populations to
identify general health status. For example, in athletes,
body fat has been shown to be highly related to the physical
demands of their respective sports (Fahey et al. 1975). In
addition, reference body composition values established for
professional athletes may be used by collegiate athletes and
their coaches to design nutrition and training programs in
an attempt to optimize performance.
Although laboratory methods such as hydrostatic
weighing (HW), air displacement plethysmography (ADP)
via the BOD POD�, and dual-energy X-ray absorptiometry
(DXA) are considered to provide the most accurate esti-
mates of body composition and are, oftentimes, accessible
to athletes, field techniques, such as skinfold measure-
ments, are more commonly used due to their low cost,
J. R. Moon � S. E. Tobkin � A. E. Smith �C. M. Lockwood � J. R. Stout (&)
Metabolic and Body Composition Laboratories,
Department of Health and Exercise Science,
University of Oklahoma, 115 Huston Huffman Center,
1401 Asp Ave, Norman, OK 73019, USA
e-mail: [email protected]
A. A. Walter � J. T. Cramer � T. W. Beck
Biophysics Laboratory, Department of Health and Exercise
Science, University of Oklahoma, Norman, OK, USA
J. M. Eckerson
Department of Exercise Science and Athletic Training,
Creighton University, Omaha, NE, USA
123
Eur J Appl Physiol (2009) 105:119–130
DOI 10.1007/s00421-008-0881-9
convenience, and ease of use. Conflicting findings regard-
ing the validity of the equations associated with the
laboratory methods mentioned above (Arngrimsson et al.
2000; Ballard et al. 2004; Clasey et al. 1999; Economos
et al. 1997; Ellis 2000; Genton et al. 2002; Oldroyd et al.
2003; Silva et al. 2006; Tylavsky et al. 2003; Van Der
Ploeg et al. 2003; Vescovi et al. 2002; Wang et al. 1998;
Williams et al. 2006; Withers et al. 1998) may also dis-
courage coaches and trainers from using these techniques
to assess the body composition of their athletes.
In the past, two compartment (2C) models, such as HW,
served as the criterion method to validate various field and
laboratory techniques (Vescovi et al. 2002). More recently,
however, multi-compartment models have become more
widely accepted as the preferred criterion method, and
equations have been developed using as many as six
compartments of body composition. In addition, Wang
et al. (1998) have reported that, when compared to a six-
compartment (6C) model, the most accurate equations for
estimating body composition are four-compartment models
(4C) and three-compartment (3C) models that include an
estimate of total body water (TBW). Recently, Wang et al.
(2002) developed a five-compartment model (5C) and a 4C
model that include TBW and also account for both bone
mineral and soft tissue mineral components, which may
provide even more accurate estimates of body composition
compared to earlier 4C models that use older estimations of
soft tissue mineral (Baumgartner et al. 1991; Friedl et al.
1992; Heymsfield et al. 1996). In an earlier study, Wang
et al. (1998) also reported that the Lohman 3C model
(Lohman 1986), Siri 2C (Siri 1961), Brozek 2C (Brozek
et al. 1963), and DXA produced similar estimates of body
composition because each of these models assume a con-
stant fat-free mass hydration (0.73%). In agreement with
Wang et al. (1998), several other studies have shown that,
when compared to multi-compartment models, DXA and
2C models, such as HW and ADP, provide valid group
estimates of percent body fat (%fat); however, the error
associated with the individual results may be too large to be
of practical value (Clasey et al. 1999; Fields et al. 2001;
Wang et al. 1998; Withers et al. 1998). Furthermore, Prior
et al. (2001) reported that athletes may have ‘‘systematic
deviations’’ in their density of fat free mass (FFM)
(=1.1 g/cm3) which, in turn, resulted in large group mean
errors (2–5%fat) when they compared a 2C model to a 4C
model. Moreover, Prior et al. (2001) suggests that 2C
models may not be accurate for estimating %fat in athletic
populations.
Although multi-compartment models are widely con-
sidered to be more accurate than 2C models for estimating
body composition, questions remain regarding whether 5C
and 6C models add any meaningful accuracy to 3C and 4C
models, and whether potential deviations in the density of
the FFM in athletes preclude the use of 2C models for
assessing body composition in this population. Moreover,
there is a lack of research in college age female athletes
and laboratory methods compared to a multiple-compart-
ment model, and, to the best of our knowledge, there have
been no validation studies comparing recently updated
DXA software, the Lunar Prodigy Advance DXA model, or
ADP in this population to a 4C or 5C model. Therefore, the
purpose of the current investigation was to compare %fat
estimates from the Wang-5C (Wang et al. 2002) model to
estimates from the Wang-4C (Wang et al. 2002), Siri-3C
(Siri 1961), Lohman-3C (Lohman 1986), Siri 2C (Siri
1961), Brozek 2C (Brozek et al. 1963), and DXA in
female, NCAA Division I, Caucasian athletes, and to
compare the density of FFM, and water, mineral, and
protein content in this population to the density of FFM
derived from a ‘‘reference body’’(Brozek et al. 1963). In
addition, this investigation sought to compare the Siri 2C
(Siri 1961) and Brozek 2C (Brozek et al. 1963) models as
calculated using both ADP and HW.
Methods
Study participants
Twenty-nine female, NCAA Division I, Caucasian athletes
�x� SD ¼ 20� 1 yearð Þ volunteered to participate in the
study. Descriptive characteristics of the subjects can be
found in Table 1. All 29 subjects were currently partici-
pating in one of three collegiate level sports: volleyball
(n = 7), softball (n = 16), or track and field (n = 6). Next to
professional athletes, NCAA Division I collegiate athletes
are of the highest caliber. Moreover, all athletes in the
current investigation were varsity level and currently
enrolled in an offseason strength and conditioning program
and had been training and participating in said sport for at
least one year prior to study participation. The purpose of
the study and a description of the testing protocol were
explained to each subject. Additionally, the study was
approved by the Institutional Review Board for human
subjects, and written informed consent was obtained from
all subjects prior to testing.
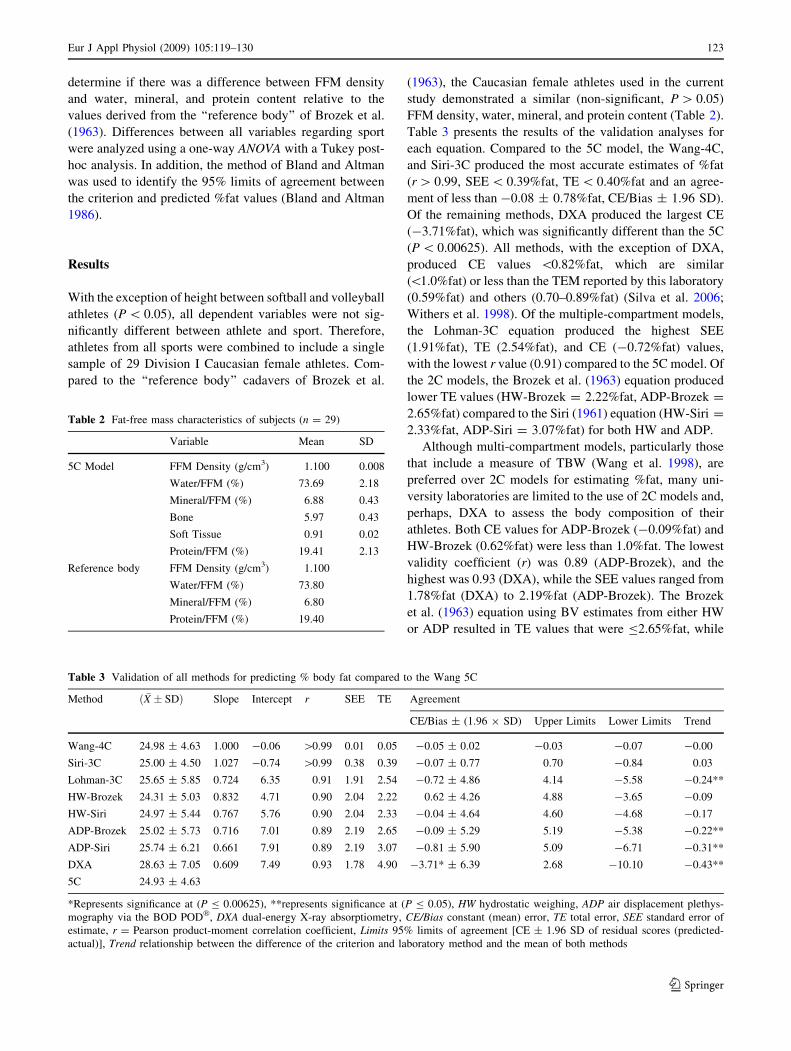
Table 1 Descriptive characteristics of subjects (n = 29)
Variable Mean SD Range
Age (years) 20 1 18–23
Height (cm) 172.0 6.0 159.0–182.0
Body mass (kg) 73.63 10.66 56.50–104.55
FFM (kg) 54.93 5.76 44.42–70.49
FM (kg) 18.71 5.86 8.99–34.06
120 Eur J Appl Physiol (2009) 105:119–130
123
Measurements
TBW was assessed using bioimpedance spectroscopy (BIS)
and incorporated into the Siri-3C (Siri 1961), and the 4C
and the 5C equations of Wang et al. (2002). Both ADP and
DXA procedures were performed prior to HW in no par-
ticular order. All body composition assessments were
performed on the same day following a 12-h fast (ad libi-
tum water intake was allowed), and the subjects were also
instructed to avoid exercise for at least 12 h prior to testing.
Height (HT) was measured to the nearest 0.5 cm using a
calibrated stadiometer, and body mass (BM) was deter-
mined using a calibrated clinical scale to nearest 0.01 kg
with subjects wearing a tight-fitting bathing suit or com-
pression shorts and sports bra.
Dual-energy X-ray absorptiometry
Dual-energy X-ray absorptiometry (enCORETM
2006,
v.10.50.086, Lunar Prodigy Advance, Madison, WI) was
used to estimate total body bone mineral content (BMC)
and %fat. BMC was then converted to total body bone
mineral (Mo) (Wang-4 and 5C) and total body mineral (M)
(Lohman-3C) using the following equations (Heymsfield
et al. 1989; Lohman 1986; Wang et al. 1998):
Mo ¼ total body BMC kgð Þ � 1:0436
M ¼ Mo � 1:235
.
Each day prior to testing, a quality assurance phantom
was performed to ensure calibration. Before each test, the
subjects’ HT, BM, sex, and race were entered into the
computer program. The subjects were positioned supine on
the DXA table with hands pronated and flat on the table.
Total body mode was selected for each scan, and scanning
thickness was determined by the DXA software. All DXA
scans were performed by a certified enCORETM
software
operator. Previous test-retest scans of 11 men and women
measured 24–48 h apart for Mo and %fat produced a
standard error of measurement (SEM) of 0.05 kg and
0.75%fat with ICC’s greater than 0.99, respectively.
Total body water
Bioimpedance spectroscopy was used to estimate TBW
following the procedures recommended by the manufac-
turer (ImpTM SFB7, ImpediMed Limited, Queensland,
Australia). This technique, explained elsewhere (Matthie
et al. 1998), uses a range of frequencies, encompassing
both low and high ranges that allow electrical current to
pass around and through each cell, and has produced valid
estimates of TBW when compared to a criterion method,
such as deuterium oxide (Matthie et al. 1998; Moon et al.
2008; Van Loan et al. 1993). Results from our laboratory
have also shown that the BIS device used in the current
investigation is a valid measurement tool for determining
TBW in healthy females when compared to deuterium
oxide (Moon et al. 2008). Furthermore, BIS has been used
to assess TBW for multi-compartment equations in previ-
ous validation studies (Minderico et al. 2007; Moon et al.
2007; Sardinha et al. 2003). Measurement of TBW was
taken while the subject was lying in a supine position on a
table with arms C308 away from the torso and legs sepa-
rated. Electrodes were placed at the distal ends of each
subject’s right hand and foot following the manufacturer
guidelines. Prior to electrode placement, excess body hair
was removed, and the skin was cleaned with alcohol at
each site. The average of two trials within ±0.05 L was
used as the representative TBW. Prior to analysis, each
subject’s HT, BM, age, and sex were entered into the BIS
device. The BIS utilized 256 frequencies internal to the
device to estimate TBW. The TBW estimate was then used
to estimate total body soft tissue mineral (Ms) using the
equation from Wang et al. (2002):
Ms ¼ 0:882� 12:9 TBWð Þð Þ þ 37:9½ �=1;000
Previous test-retest measurements of 11 men and
women measured 24–48 h apart for TBW using the
ImpTM SFB7 BIS produced a SEM of 0.48 L and an ICC
greater than 0.99.
Hydrostatic weighing
Body volume (BV) was assessed from HW as previously
described by our laboratory and others (Clasey et al. 1999;
Moon et al. 2007; Prior et al. 2001; Wang et al. 1998).
Residual volume was determined with the subject in a
seated position using the oxygen dilution method of Wil-
more et al. (1980) via a metabolic cart with residual
volume software (True One 2400�, Parvo-Medics, Inc.
Sandy, UT.). Subjects completed a minimum of two trials
and the average of the closest two trials within 5% was
used to represent residual volume.
Underwater weight was measured to the nearest
0.025 kg in a submersion tank in which a PVC seat was
suspended from a calibrated Chatillon� 15-kg scale (Model
# 1315DD-H, Largo, FL.), and the average of the three
highest values (six to ten trials) was used as the represen-
tative underwater weight. Percent body fat was calculated
using the 2C equations of Siri (Siri 1961) and Brozek et al.
(1963). Previous test-retest reliability data for HW from
our laboratory indicated that, for 11 young adults
(24 ± 2.4 years) measured on separate days, the ICC was
0.99 with a SEM of 0.8%fat and 0.34 L for BV with an ICC
greater than 0.99.
Eur J Appl Physiol (2009) 105:119–130 121
123
Air-displacement plethysmography
Body volume determined from ADP was assessed using the
BOD POD�, which was calibrated before each test using
the manufacturer’s instructions with the chamber empty
and using a cylinder of known volume (49.558 L). The
subject, wearing a swimming cap and tight-fitting bathing
suit or compression shorts and sports bra, entered and sat in
the fiberglass chamber. All ADP measurements were per-
formed by a BOD POD� certified investigator. Percent
body fat was calculated from ADP using the 2C equations
of Siri (1961) and Brozek et al. (1963). Previous test-retest
reliability data for ADP from our laboratory indicated that,
for 14 young adults (24 ± 3 years) measured on separate
days, the ICC was 0.99 with a SEM of 0.47%fat, which is
similar to the ICC reported by Fields et al. (2001)
(ICC = 0.98).
Five-compartment model calculations
The criterion estimate of %fat was calculated using the
5C model described by Wang et al. (2002), which
includes measurements of BV, TBW, Mo, Ms, and BM.
Fat mass (FM) and %fat were derived using the following
equations:
FM kgð Þ ¼ 2:748 BVð Þ � 0:715 TBWð Þ þ 1:129 Moð Þþ 1:222 Msð Þ � 2:051 BMð Þ
%fat ¼ FM=BMð Þ � 100
Fat-free mass calculations
Fat-free mass (FFM) was calculated by subtracting FM
from BM, while density of FFM was calculated using the
following equation (Wang et al. 2002):
FFM density ¼ 1= TBW=0:9937ð Þ þ Mo=2:982ð Þ½þ Ms=3:317ð Þ þ Protein=1:34ð Þ�
Protein ¼ BM� BF�Mo �Ms � TBW
Propagation of error
Although multi-component models are recommended over
2C models for assessing and tracking changes in body
composition, the potential propagation of errors due to the
inherent measurement error of each device used to assess
each variable may offset the improved accuracy of 5C
model estimates of body composition (Wang et al. 2005).
Wang et al. (2005) suggested calculating the propagated
error, sometimes referred to as the total error of measure-
ment (TEM) (Moon et al. 2007) to account for the accuracy
of the 4C equation. In the current study, the SEM from the
reliability data for the measurement of BV, TBW, and Mo
were used to calculate propagated errors for %fat using the
following equation:
5C TEM ¼ TBW SEM2þHW BV SEM2þMo SEM2� �1=2
5C TEM ¼ 0:482 þ 0:342 þ 0:052� �1=2
The results showed that the TEM was 0.59%fat, which
is similar (\1%fat) to values reported for 4C and 5C
models in other laboratories (0.70–0.89%fat) (Silva et al.
2006; Withers et al. 1998).
Equations used for validation
The following equations were used to calculate FM and
were converted to %fat (Wang et al. 1998):
Wang-4C (Wang et al. 2002):
FM (kg) ¼ 2.748(BV)� 0.699(TBW) + 1.129ðMoÞ� 2.051(BM)
Siri-3C (Siri 1961):
FM (kg) = 2.118(BV)� 0.78(TBW)� 1.351(BM)
Lohman-3C (Lohman 1986, 1998):
FM (kg)¼ 6.386(BV) + 3.916[total body mineral (M)]
� 6.09(BM)
Siri 2C (HW-Siri, ADP-Siri) (Siri 1961):
FM (kg) = 4.95(BV)� 4.50(BM)
Brozek 2C (HW-Brozek, ADP-Brozek) (Brozek et al. 1963):
FM (kg) = 4.570(BV)� 4.142(BM)
%fat ¼ FM=BMð Þ � 100
Statistical methods
The validity of the %fat estimates (Wang-4C, Siri-3C,
Lohman-3C, HW-Brozek, ADP-Brozek, HW-Siri, ADP-
Siri, and DXA) was based upon the evaluation of predicted
values versus the criterion or actual value from the 5C
model by calculating the constant error (CE = actual
(5C) - predicted %fat), r value, standard error of esti-
mate SEE ¼ SDffiffiffiffiffiffiffiffiffiffiffiffiffi1� r2p� �
; and total error TE ¼ðffiffiffiffiffiffiffiffiffiffiffiffiffiffiffiffiffiffiffiffiffiffiffiffiffiffiffiffiffiffiffiffiffiffiffiffiffiffiffiffiffiffiR½predicted� actual�
p 2=nÞ (Heyward and Wagner 2004).
The mean difference (CE) between the predicted and actual
(5C) %fat values was analyzed using dependent t-tests with
the Bonferroni alpha adjustment (P B 0.00625) (Keppel
and Wickens 2004). One-sample t-tests were performed to
122 Eur J Appl Physiol (2009) 105:119–130
123
determine if there was a difference between FFM density
and water, mineral, and protein content relative to the
values derived from the ‘‘reference body’’ of Brozek et al.
(1963). Differences between all variables regarding sport
were analyzed using a one-way ANOVA with a Tukey post-
hoc analysis. In addition, the method of Bland and Altman
was used to identify the 95% limits of agreement between
the criterion and predicted %fat values (Bland and Altman
1986).
Results
With the exception of height between softball and volleyball
athletes (P \ 0.05), all dependent variables were not sig-
nificantly different between athlete and sport. Therefore,
athletes from all sports were combined to include a single
sample of 29 Division I Caucasian female athletes. Com-
pared to the ‘‘reference body’’ cadavers of Brozek et al.
(1963), the Caucasian female athletes used in the current
study demonstrated a similar (non-significant, P [ 0.05)
FFM density, water, mineral, and protein content (Table 2).
Table 3 presents the results of the validation analyses for
each equation. Compared to the 5C model, the Wang-4C,
and Siri-3C produced the most accurate estimates of %fat
(r [ 0.99, SEE \ 0.39%fat, TE \ 0.40%fat and an agree-
ment of less than -0.08 ± 0.78%fat, CE/Bias ± 1.96 SD).
Of the remaining methods, DXA produced the largest CE
(-3.71%fat), which was significantly different than the 5C
(P \ 0.00625). All methods, with the exception of DXA,
produced CE values \0.82%fat, which are similar
(\1.0%fat) or less than the TEM reported by this laboratory
(0.59%fat) and others (0.70–0.89%fat) (Silva et al. 2006;
Withers et al. 1998). Of the multiple-compartment models,
the Lohman-3C equation produced the highest SEE
(1.91%fat), TE (2.54%fat), and CE (-0.72%fat) values,
with the lowest r value (0.91) compared to the 5C model. Of
the 2C models, the Brozek et al. (1963) equation produced
lower TE values (HW-Brozek = 2.22%fat, ADP-Brozek =
2.65%fat) compared to the Siri (1961) equation (HW-Siri =
2.33%fat, ADP-Siri = 3.07%fat) for both HW and ADP.
Although multi-compartment models, particularly those
that include a measure of TBW (Wang et al. 1998), are
preferred over 2C models for estimating %fat, many uni-
versity laboratories are limited to the use of 2C models and,
perhaps, DXA to assess the body composition of their
athletes. Both CE values for ADP-Brozek (-0.09%fat) and
HW-Brozek (0.62%fat) were less than 1.0%fat. The lowest
validity coefficient (r) was 0.89 (ADP-Brozek), and the
highest was 0.93 (DXA), while the SEE values ranged from
1.78%fat (DXA) to 2.19%fat (ADP-Brozek). The Brozek
et al. (1963) equation using BV estimates from either HW
or ADP resulted in TE values that were B2.65%fat, while
Table 2 Fat-free mass characteristics of subjects (n = 29)
Variable Mean SD
5C Model FFM Density (g/cm3) 1.100 0.008
Water/FFM (%) 73.69 2.18
Mineral/FFM (%) 6.88 0.43
Bone 5.97 0.43
Soft Tissue 0.91 0.02
Protein/FFM (%) 19.41 2.13
Reference body FFM Density (g/cm3) 1.100
Water/FFM (%) 73.80
Mineral/FFM (%) 6.80
Protein/FFM (%) 19.40
Table 3 Validation of all methods for predicting % body fat compared to the Wang 5C
Method �X � SDð Þ Slope Intercept r SEE TE Agreement
CE/Bias ± (1.96 9 SD) Upper Limits Lower Limits Trend
Wang-4C 24.98 ± 4.63 1.000 -0.06 [0.99 0.01 0.05 -0.05 ± 0.02 -0.03 -0.07 -0.00
Siri-3C 25.00 ± 4.50 1.027 -0.74 [0.99 0.38 0.39 -0.07 ± 0.77 0.70 -0.84 0.03
Lohman-3C 25.65 ± 5.85 0.724 6.35 0.91 1.91 2.54 -0.72 ± 4.86 4.14 -5.58 -0.24**
HW-Brozek 24.31 ± 5.03 0.832 4.71 0.90 2.04 2.22 0.62 ± 4.26 4.88 -3.65 -0.09
HW-Siri 24.97 ± 5.44 0.767 5.76 0.90 2.04 2.33 -0.04 ± 4.64 4.60 -4.68 -0.17
ADP-Brozek 25.02 ± 5.73 0.716 7.01 0.89 2.19 2.65 -0.09 ± 5.29 5.19 -5.38 -0.22**
ADP-Siri 25.74 ± 6.21 0.661 7.91 0.89 2.19 3.07 -0.81 ± 5.90 5.09 -6.71 -0.31**
DXA 28.63 ± 7.05 0.609 7.49 0.93 1.78 4.90 -3.71* ± 6.39 2.68 -10.10 -0.43**
5C 24.93 ± 4.63
*Represents significance at (P B 0.00625), **represents significance at (P B 0.05), HW hydrostatic weighing, ADP air displacement plethys-
mography via the BOD POD�, DXA dual-energy X-ray absorptiometry, CE/Bias constant (mean) error, TE total error, SEE standard error of
estimate, r = Pearson product-moment correlation coefficient, Limits 95% limits of agreement [CE ± 1.96 SD of residual scores (predicted-
actual)], Trend relationship between the difference of the criterion and laboratory method and the mean of both methods
Eur J Appl Physiol (2009) 105:119–130 123
123

DXA produced an unacceptable TE value of 4.90%fat. The
results for the regression analysis between the 5C model
and laboratory methods are depicted in Fig. 1.
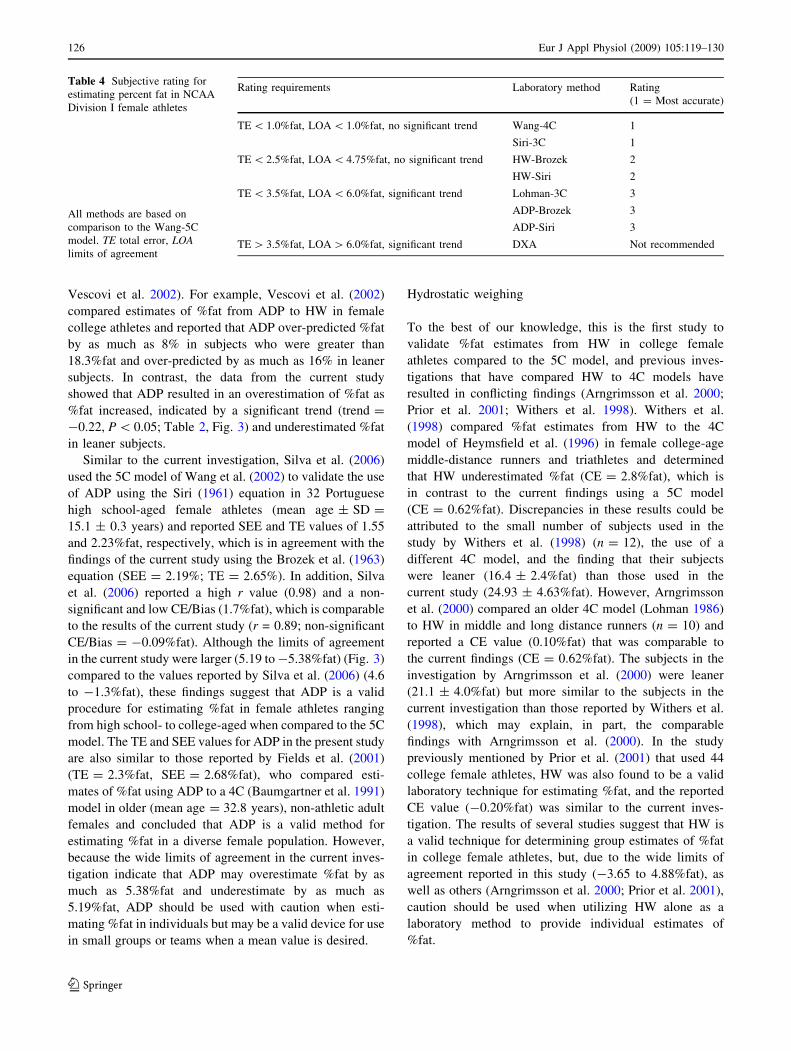
The individual estimates for %fat derived from the
equations presented in Table 3 were analyzed using Bland
and Altman plots, and the results are shown in Figs. 2, 3, 4.
The 95% limits of agreement (CE ± 1.96 SD of residual
scores (predicted–actual)) were large for DXA (Fig. 4)
(-3.71 ± 6.39%fat, -10.10 to 2.68%fat), while ADP-
Brozek and HW-Brozek produced smaller limits of agree-
ment (B0.62 ± 5.29%fat, less than or equal to -5.38 to
5.19%fat) (Fig. 3). Additionally, DXA and ADP-Brozek
produced a significant trend, indicating an overestimation
of %fat as total body fat increased (Figs. 3, 4). Of the
multiple-compartment models, the individual estimations
of %fat for the Lohman-3C model were similar to both the
ADP- and HW-Brozek 2C models (Fig. 3), while the
Siri-3C and Wang-4C models produced individual esti-
mations of %fat with greater accuracy (Fig. 2).
Discussion
The primary findings of the current study indicated that the
4C and 5C equations of Wang et al. (2002) resulted in
nearly identical results (Table 3, Fig. 2), and suggest that
the 5C model provides minimal added accuracy compared
to the most recent 4C model of Wang et al. (2002). The
Siri-3C (Siri 1961) model was the next most accurate
equation with an error of less than or equal to
-0.07 ± 0.77%fat (CE ± 1.96 SD) (Fig. 2); therefore, the
Wang-4C and Siri-3C models are recommended for esti-
mating %fat in this population. Specifically, of the 29
subjects, no subject produced different whole number
values (\0.1%fat) when comparing the Wang-5C to the
Wang-4C model, indicating that these models produce
virtually identical values. Nine of the 29 subjects produced
different whole number values when comparing the Wang
5C to the Siri-3C model; however, these differences were
less than 0.85%fat. Therefore, data suggests that, due to the
minimal difference between the Wang-5C compared to the
Wang-4C and Siri-3C models and the near-perfect corre-
lation (r [ 0.99), these three models can be considered
criterion methods for estimating %fat in this population.
Additionally, due to these nominal errors, any one of these
three methods can potentially be used as an accurate rou-
tine follow-up method to track changes in body
composition during training and over time. However, the
Siri-3C model is more practical than the Wang-4C model
because there is no required DXA measurement for BMC.
Therefore, considering relative degrees of cost, radiation
exposure, technical skill, and simplicity, the Siri-3C model
is suggested for routine use in female NCAA Division I,
Caucasian athletes. The Lohman-3C equation produced
similar accuracy to both ADP- and HW-Brozek 2C models
(Fig. 3), which suggests that the inclusion of BMC in a 2C
model (Siri 1961; Brozek et al. 1963) does not improve the
accuracy of %fat estimations in Division I NCAA female
athletes. Although the Siri (1961) and the Brozek et al.
(1963) 2C models resulted in similar and valid results, the
TE values associated with the Brozek et al. (1963) 2C
model were lower when using either HW or ADP to assess
Fig. 1 Regression analysis of percent body fat (%fat) estimations by
laboratory methods [hydrostatic weighing (HW), air displacement
plethysmography via the BOD POD� (ADP), dual-energy X-ray
absorptiometry (DXA)], and the criterion five-compartment model
(5C). The solid line represents the line of identity with a slope of one
and a y-intercept of zero
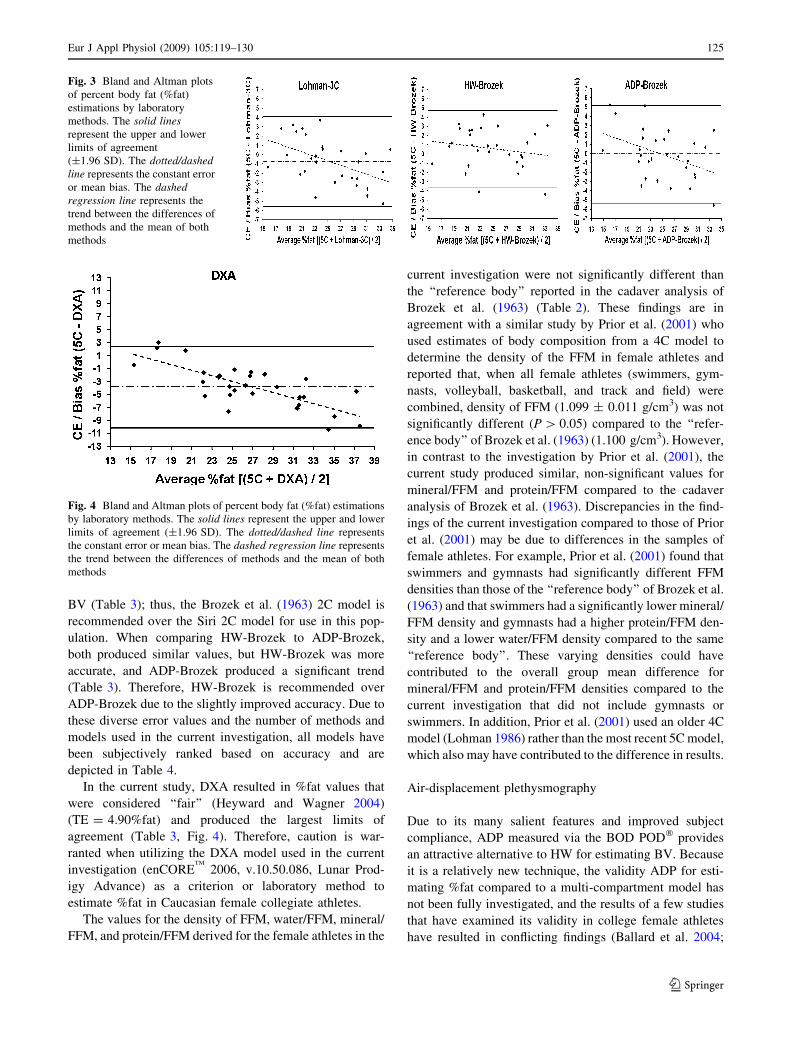
Fig. 2 Bland and Altman plots
of percent body fat (%fat)
estimations by laboratory
methods. The solid linesrepresent the upper and lower
limits of agreement
(±1.96 SD). The dotted/dashedline represents the constant error
or mean bias. The dashedregression line represents the
trend between the differences of
methods and the mean of both
methods
124 Eur J Appl Physiol (2009) 105:119–130
123
BV (Table 3); thus, the Brozek et al. (1963) 2C model is
recommended over the Siri 2C model for use in this pop-
ulation. When comparing HW-Brozek to ADP-Brozek,
both produced similar values, but HW-Brozek was more
accurate, and ADP-Brozek produced a significant trend
(Table 3). Therefore, HW-Brozek is recommended over
ADP-Brozek due to the slightly improved accuracy. Due to
these diverse error values and the number of methods and
models used in the current investigation, all models have
been subjectively ranked based on accuracy and are
depicted in Table 4.
In the current study, DXA resulted in %fat values that
were considered ‘‘fair’’ (Heyward and Wagner 2004)
(TE = 4.90%fat) and produced the largest limits of
agreement (Table 3, Fig. 4). Therefore, caution is war-
ranted when utilizing the DXA model used in the current
investigation (enCORETM
2006, v.10.50.086, Lunar Prod-
igy Advance) as a criterion or laboratory method to
estimate %fat in Caucasian female collegiate athletes.
The values for the density of FFM, water/FFM, mineral/
FFM, and protein/FFM derived for the female athletes in the
current investigation were not significantly different than
the ‘‘reference body’’ reported in the cadaver analysis of
Brozek et al. (1963) (Table 2). These findings are in
agreement with a similar study by Prior et al. (2001) who
used estimates of body composition from a 4C model to
determine the density of the FFM in female athletes and
reported that, when all female athletes (swimmers, gym-
nasts, volleyball, basketball, and track and field) were
combined, density of FFM (1.099 ± 0.011 g/cm3) was not
significantly different (P [ 0.05) compared to the ‘‘refer-
ence body’’ of Brozek et al. (1963) (1.100 g/cm3). However,
in contrast to the investigation by Prior et al. (2001), the
current study produced similar, non-significant values for
mineral/FFM and protein/FFM compared to the cadaver
analysis of Brozek et al. (1963). Discrepancies in the find-
ings of the current investigation compared to those of Prior
et al. (2001) may be due to differences in the samples of
female athletes. For example, Prior et al. (2001) found that
swimmers and gymnasts had significantly different FFM
densities than those of the ‘‘reference body’’ of Brozek et al.
(1963) and that swimmers had a significantly lower mineral/
FFM density and gymnasts had a higher protein/FFM den-
sity and a lower water/FFM density compared to the same
‘‘reference body’’. These varying densities could have
contributed to the overall group mean difference for
mineral/FFM and protein/FFM densities compared to the
current investigation that did not include gymnasts or
swimmers. In addition, Prior et al. (2001) used an older 4C
model (Lohman 1986) rather than the most recent 5C model,
which also may have contributed to the difference in results.
Air-displacement plethysmography
Due to its many salient features and improved subject
compliance, ADP measured via the BOD POD� provides
an attractive alternative to HW for estimating BV. Because
it is a relatively new technique, the validity ADP for esti-
mating %fat compared to a multi-compartment model has
not been fully investigated, and the results of a few studies
that have examined its validity in college female athletes
have resulted in conflicting findings (Ballard et al. 2004;
Fig. 3 Bland and Altman plots
of percent body fat (%fat)
estimations by laboratory
methods. The solid linesrepresent the upper and lower
limits of agreement
(±1.96 SD). The dotted/dashedline represents the constant error
or mean bias. The dashedregression line represents the
trend between the differences of
methods and the mean of both
methods
Fig. 4 Bland and Altman plots of percent body fat (%fat) estimations
by laboratory methods. The solid lines represent the upper and lower
limits of agreement (±1.96 SD). The dotted/dashed line represents
the constant error or mean bias. The dashed regression line represents
the trend between the differences of methods and the mean of both
methods
Eur J Appl Physiol (2009) 105:119–130 125
123
Vescovi et al. 2002). For example, Vescovi et al. (2002)
compared estimates of %fat from ADP to HW in female
college athletes and reported that ADP over-predicted %fat
by as much as 8% in subjects who were greater than
18.3%fat and over-predicted by as much as 16% in leaner
subjects. In contrast, the data from the current study
showed that ADP resulted in an overestimation of %fat as
%fat increased, indicated by a significant trend (trend =
-0.22, P \ 0.05; Table 2, Fig. 3) and underestimated %fat
in leaner subjects.
Similar to the current investigation, Silva et al. (2006)
used the 5C model of Wang et al. (2002) to validate the use
of ADP using the Siri (1961) equation in 32 Portuguese
high school-aged female athletes (mean age ± SD =
15.1 ± 0.3 years) and reported SEE and TE values of 1.55
and 2.23%fat, respectively, which is in agreement with the
findings of the current study using the Brozek et al. (1963)
equation (SEE = 2.19%; TE = 2.65%). In addition, Silva
et al. (2006) reported a high r value (0.98) and a non-
significant and low CE/Bias (1.7%fat), which is comparable
to the results of the current study (r = 0.89; non-significant
CE/Bias = -0.09%fat). Although the limits of agreement
in the current study were larger (5.19 to -5.38%fat) (Fig. 3)
compared to the values reported by Silva et al. (2006) (4.6
to -1.3%fat), these findings suggest that ADP is a valid
procedure for estimating %fat in female athletes ranging
from high school- to college-aged when compared to the 5C
model. The TE and SEE values for ADP in the present study
are also similar to those reported by Fields et al. (2001)
(TE = 2.3%fat, SEE = 2.68%fat), who compared esti-
mates of %fat using ADP to a 4C (Baumgartner et al. 1991)
model in older (mean age = 32.8 years), non-athletic adult
females and concluded that ADP is a valid method for
estimating %fat in a diverse female population. However,
because the wide limits of agreement in the current inves-
tigation indicate that ADP may overestimate %fat by as
much as 5.38%fat and underestimate by as much as
5.19%fat, ADP should be used with caution when esti-
mating %fat in individuals but may be a valid device for use
in small groups or teams when a mean value is desired.
Hydrostatic weighing
To the best of our knowledge, this is the first study to
validate %fat estimates from HW in college female
athletes compared to the 5C model, and previous inves-
tigations that have compared HW to 4C models have
resulted in conflicting findings (Arngrimsson et al. 2000;
Prior et al. 2001; Withers et al. 1998). Withers et al.
(1998) compared %fat estimates from HW to the 4C
model of Heymsfield et al. (1996) in female college-age
middle-distance runners and triathletes and determined
that HW underestimated %fat (CE = 2.8%fat), which is
in contrast to the current findings using a 5C model
(CE = 0.62%fat). Discrepancies in these results could be
attributed to the small number of subjects used in the
study by Withers et al. (1998) (n = 12), the use of a
different 4C model, and the finding that their subjects
were leaner (16.4 ± 2.4%fat) than those used in the
current study (24.93 ± 4.63%fat). However, Arngrimsson
et al. (2000) compared an older 4C model (Lohman 1986)
to HW in middle and long distance runners (n = 10) and
reported a CE value (0.10%fat) that was comparable to
the current findings (CE = 0.62%fat). The subjects in the
investigation by Arngrimsson et al. (2000) were leaner
(21.1 ± 4.0%fat) but more similar to the subjects in the
current investigation than those reported by Withers et al.
(1998), which may explain, in part, the comparable
findings with Arngrimsson et al. (2000). In the study
previously mentioned by Prior et al. (2001) that used 44
college female athletes, HW was also found to be a valid
laboratory technique for estimating %fat, and the reported
CE value (-0.20%fat) was similar to the current inves-
tigation. The results of several studies suggest that HW is
a valid technique for determining group estimates of %fat
in college female athletes, but, due to the wide limits of
agreement reported in this study (-3.65 to 4.88%fat), as
well as others (Arngrimsson et al. 2000; Prior et al. 2001),
caution should be used when utilizing HW alone as a
laboratory method to provide individual estimates of
%fat.
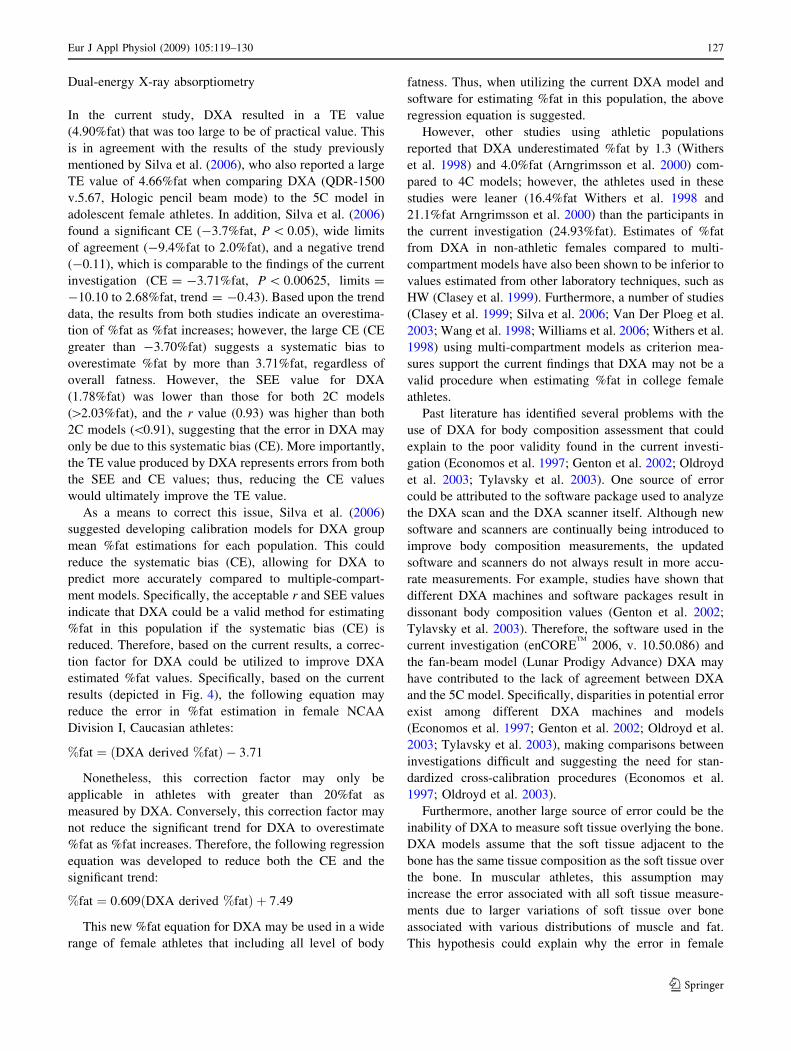
Table 4 Subjective rating for
estimating percent fat in NCAA
Division I female athletes
All methods are based on
comparison to the Wang-5C
model. TE total error, LOAlimits of agreement
Rating requirements Laboratory method Rating
(1 = Most accurate)
TE \ 1.0%fat, LOA \ 1.0%fat, no significant trend Wang-4C 1
Siri-3C 1
TE \ 2.5%fat, LOA \ 4.75%fat, no significant trend HW-Brozek 2
HW-Siri 2
TE \ 3.5%fat, LOA \ 6.0%fat, significant trend Lohman-3C 3
ADP-Brozek 3
ADP-Siri 3
TE [ 3.5%fat, LOA [ 6.0%fat, significant trend DXA Not recommended
126 Eur J Appl Physiol (2009) 105:119–130
123
Dual-energy X-ray absorptiometry
In the current study, DXA resulted in a TE value
(4.90%fat) that was too large to be of practical value. This
is in agreement with the results of the study previously
mentioned by Silva et al. (2006), who also reported a large
TE value of 4.66%fat when comparing DXA (QDR-1500
v.5.67, Hologic pencil beam mode) to the 5C model in
adolescent female athletes. In addition, Silva et al. (2006)
found a significant CE (-3.7%fat, P \ 0.05), wide limits
of agreement (-9.4%fat to 2.0%fat), and a negative trend
(-0.11), which is comparable to the findings of the current
investigation (CE = -3.71%fat, P \ 0.00625, limits =
-10.10 to 2.68%fat, trend = -0.43). Based upon the trend
data, the results from both studies indicate an overestima-
tion of %fat as %fat increases; however, the large CE (CE
greater than -3.70%fat) suggests a systematic bias to
overestimate %fat by more than 3.71%fat, regardless of
overall fatness. However, the SEE value for DXA
(1.78%fat) was lower than those for both 2C models
([2.03%fat), and the r value (0.93) was higher than both
2C models (\0.91), suggesting that the error in DXA may
only be due to this systematic bias (CE). More importantly,
the TE value produced by DXA represents errors from both
the SEE and CE values; thus, reducing the CE values
would ultimately improve the TE value.
As a means to correct this issue, Silva et al. (2006)
suggested developing calibration models for DXA group
mean %fat estimations for each population. This could
reduce the systematic bias (CE), allowing for DXA to
predict more accurately compared to multiple-compart-
ment models. Specifically, the acceptable r and SEE values
indicate that DXA could be a valid method for estimating
%fat in this population if the systematic bias (CE) is
reduced. Therefore, based on the current results, a correc-
tion factor for DXA could be utilized to improve DXA
estimated %fat values. Specifically, based on the current
results (depicted in Fig. 4), the following equation may
reduce the error in %fat estimation in female NCAA
Division I, Caucasian athletes:
%fat ¼ DXA derived %fatð Þ � 3:71
Nonetheless, this correction factor may only be
applicable in athletes with greater than 20%fat as
measured by DXA. Conversely, this correction factor may
not reduce the significant trend for DXA to overestimate
%fat as %fat increases. Therefore, the following regression
equation was developed to reduce both the CE and the
significant trend:
%fat ¼ 0:609 DXA derived %fatð Þ þ 7:49
This new %fat equation for DXA may be used in a wide
range of female athletes that including all level of body
fatness. Thus, when utilizing the current DXA model and
software for estimating %fat in this population, the above
regression equation is suggested.
However, other studies using athletic populations
reported that DXA underestimated %fat by 1.3 (Withers
et al. 1998) and 4.0%fat (Arngrimsson et al. 2000) com-
pared to 4C models; however, the athletes used in these
studies were leaner (16.4%fat Withers et al. 1998 and
21.1%fat Arngrimsson et al. 2000) than the participants in
the current investigation (24.93%fat). Estimates of %fat
from DXA in non-athletic females compared to multi-
compartment models have also been shown to be inferior to
values estimated from other laboratory techniques, such as
HW (Clasey et al. 1999). Furthermore, a number of studies
(Clasey et al. 1999; Silva et al. 2006; Van Der Ploeg et al.
2003; Wang et al. 1998; Williams et al. 2006; Withers et al.
1998) using multi-compartment models as criterion mea-
sures support the current findings that DXA may not be a
valid procedure when estimating %fat in college female
athletes.
Past literature has identified several problems with the
use of DXA for body composition assessment that could
explain to the poor validity found in the current investi-
gation (Economos et al. 1997; Genton et al. 2002; Oldroyd
et al. 2003; Tylavsky et al. 2003). One source of error
could be attributed to the software package used to analyze
the DXA scan and the DXA scanner itself. Although new
software and scanners are continually being introduced to
improve body composition measurements, the updated
software and scanners do not always result in more accu-
rate measurements. For example, studies have shown that
different DXA machines and software packages result in
dissonant body composition values (Genton et al. 2002;
Tylavsky et al. 2003). Therefore, the software used in the
current investigation (enCORETM
2006, v. 10.50.086) and
the fan-beam model (Lunar Prodigy Advance) DXA may
have contributed to the lack of agreement between DXA
and the 5C model. Specifically, disparities in potential error
exist among different DXA machines and models
(Economos et al. 1997; Genton et al. 2002; Oldroyd et al.
2003; Tylavsky et al. 2003), making comparisons between
investigations difficult and suggesting the need for stan-
dardized cross-calibration procedures (Economos et al.
1997; Oldroyd et al. 2003).
Furthermore, another large source of error could be the
inability of DXA to measure soft tissue overlying the bone.
DXA models assume that the soft tissue adjacent to the
bone has the same tissue composition as the soft tissue over
the bone. In muscular athletes, this assumption may
increase the error associated with all soft tissue measure-
ments due to larger variations of soft tissue over bone
associated with various distributions of muscle and fat.
This hypothesis could explain why the error in female
Eur J Appl Physiol (2009) 105:119–130 127
123
college athletes was larger than in high school-age athletes
as described by Silva et al. (2006). Thus, college athletes
are more physically developed and may have more muscle
mass associated with the soft tissue measurement, which
may explain the systematic overestimation in %fat as total
tissue (BM) increased. Specifically, based on the current
findings, it is hypothesized that the more total mass that is
estimated over bone, the larger the potential errors are in
estimating that tissue, regardless of the ratio of FFM and
fat next to the bone.
In addition, DXA is described as a 3C model because it
estimates bone, fat, and other soft tissue, yet, the final
analysis of fat is based on a 2C model of fat and all other
tissue (Ellis 2000). This 2C model has similar errors to HW
and ADP (Fig. 3), due to assumptions of FFM hydration
and TBW. However, Lohman et al. (2000) states that the
hydration of FFM is not a major factor in the agreement
between DXA and multi-compartment models and techni-
cal errors are introduced when the actual BM of the subject
does not match the sum of the tissue mass measured by the
DXA.
Based upon the unacceptably high TE values associated
with DXA compared to the 5C model, and a non-significant
FFM hydration status (73.69% compared to 73.8%), we
analyzed the tissue mass values and actual BM values to
determine if the variations in these values were the source
of error. Compared to actual weight, DXA produced a non-
significant CE (CE = -0.03 kg, P [ 0.05), indicating that
this was not the source of error, and, therefore, the inability
of DXA to estimate %fat is most likely due to several
factors rather than one specific element. Based upon these
results, the DXA model and software used in the current
investigation should be used with caution when estimating
%fat in college female athletes, even when utilizing the
above regression equation, due to the myriad concerns with
the DXA method and lack of research supporting the
validity of DXA for predicting %fat.
Menstrual status
Additional sources of error in estimating %fat in women
can be attributed to fluctuations of TBW through various
stages of the menstrual cycle (Bunt et al. 1989). Due to
potential increases in error, this fluctuation is particularly
important in the use of laboratory methods that assume a
constant FFM hydration, such as HW, ADP, and DXA
(Bunt et al. 1989). Bunt et al. (1989) determined that
errors can be reduced if subjects are measured outside of
peak BM periods. Furthermore, Bunt et al. (1989) stated
that the day of the menstrual cycle associated with peak
BM was not the same for all females. This understanding
may prove to be relevant when tracking changes or
assessing individual %fat. However, conducting body
composition assessments during non-peak BM days of the
month is not realistic in populations such as college ath-
letes. Therefore, menstruation status was not considered in
the current investigation, which could have increased the
error associated with HW and ADP. Nonetheless, these
methods provided valid estimations of %fat in this popu-
lation, regardless of menstrual cycle phase. More
importantly, an understanding of the limits of agreement
regarding 2C models to estimate %fat could aid in
reaching correct interpretations of %fat values estimated
by these methods. Specifically, HW-Brozek could under-
estimate %fat by 4.88%fat and overestimate %fat by as
much as 3.65%fat, while ADP-Brozek could underesti-
mate %fat by 5.19%fat and overestimate %fat by as much
as 5.38%fat.
Conclusion
The Wang-4C and Siri-3C models resulted in the lowest
TE values compared a criterion 5C model and, therefore,
are recommended for estimating %fat in Caucasian female
athletes and can be considered criterion methods. Although
the Lohman-3C equation also provided valid estimates of
%fat, the added accuracy of this equation by incorporating
BMC was negligible compared to the 2C models. There-
fore, because of the expense and training required to obtain
BMC, this model is not recommended over a 2C model that
uses either HW or ADP to determine BV.
In the current study, both 2C models produced low TE
values when compared to the 5C model of Wang et al.
(2002). However, due to the large limits of agreement, the
use of 2C models may not be appropriate when attempting
to identify individual assessments of %fat in athletic pop-
ulations due to variations in TBW and FFM hydration
(Clasey et al. 1999; Wang et al. 1998; Withers et al. 1998).
Therefore, whenever possible, multi-compartment models
should be used for assessing individual estimates of %fat or
to track changes in body composition following diet and
training interventions. Because the Wang-4C and Siri-3C
equations can be considered criterion methods, these
equations may be used in place of the 5C model. More
notably, the current results do not support the use of the
Lunar Prodigy Advance DXA with the enCORETM
2006
software version v.10.50.086 for use in estimating percent
body fat in Caucasian Division I NCAA female athletes.
However, utilizing the suggested regression equation
(%fat = 0.609(DXA derived %fat) ? 7.49) may produce
valid estimates of %fat in this population when utilizing
DXA alone.
Acknowledgments We would like to thank all of the athletes who
participated in this investigation and Vincent J. Dalbo for his efforts
128 Eur J Appl Physiol (2009) 105:119–130
123
during data collection. Additionally, we would like to thank Sarah
Cahill for her dedication and support as a strength coach.
References
Arngrimsson S, Evans EM, Saunders MJ, Ogburn CL, Lewis RD,
Cureton KJ (2000) Validation of body composition estimates in
male and female distance runners using estimates from a four-
component model. Am J Hum Biol 12:301–314. doi:10.1002/
(SICI)1520-6300(200005/06)12:3\301::AID-AJHB1[3.0.CO;
2-J
Ballard TP, Fafara L, Vukovich MD (2004) Comparison of BOD
POD and DXA in female collegiate athletes. Med Sci Sports
Exerc 36:731–735. doi:10.1249/01.MSS.0000121943.02489.2B
Baumgartner RN, Heymsfield SB, Lichtman S, Wang J, Pierson RN Jr
(1991) Body composition in elderly people: effect of criterion
estimates on predictive equations. Am J Clin Nutr 53:1345–1353
Bland JM, Altman DG (1986) Statistical methods for assessing
agreement between two methods of clinical measurement.
Lancet 1:307–310
Brozek J, Grande F, Anderson JT, Keys A (1963) Densitometric
analysis of body composition: revision of some quantitative
assumptions. Ann N Y Acad Sci 110:113–140. doi:10.1111/
j.1749-6632.1963.tb17079.x
Bunt JC, Lohman TG, Boileau RA (1989) Impact of total body water
fluctuations on estimation of body fat from body density. Med
Sci Sports Exerc 21:96–100. doi:10.1249/00005768-198902000-
00017
Clasey JL, Kanaley JA, Wideman L, Heymsfield SB, Teates CD,
Gutgesell ME, Thorner MO, Hartman ML, Weltman A (1999)
Validity of methods of body composition assessment in young
and older men and women. J Appl Physiol 86:1728–1738
Economos CD, Nelson ME, Fiatarone MA, Dallal GE, Heymsfield
SB, Wang J, Yasumara S, Ma R, Vaswani AN, Russell-Aulet M,
Pierson RN (1997) A multi-center comparison of dual energy
X-ray absorptiometers: in vivo and in vitro soft tissue measure-
ment. Eur J Clin Nutr 51:312–317. doi:10.1038/sj.ejcn.1600400
Ellis KJ (2000) Human body composition: in vivo methods. Physiol
Rev 80:649–680
Fahey TD, Akka L, Rolph R (1975) Body composition and VO2 max
of exceptional weight-trained athletes. J Appl Physiol 39:559–
561
Fields DA, Wilson GD, Gladden LB, Hunter GR, Pascoe DD, Goran
MI (2001) Comparison of the BOD POD with the four-
compartment model in adult females. Med Sci Sports Exerc
33:1605–1610. doi:10.1097/00005768-200109000-00026
Friedl KE, DeLuca JP, Marchitelli LJ, Vogel JA (1992) Reliability of
body-fat estimations from a four-compartment model by using
density, body water, and bone mineral measurements. Am J Clin
Nutr 55:764–770
Genton L, Hans D, Kyle UG, Pichard C (2002) Dual-energy X-ray
absorptiometry and body composition: differences between
devices and comparison with reference methods. Nutrition
(Burbank. Los Angeles Cty Calif 18:66–70
Heymsfield SB, Wang J, Heshka S, Kehayias JJ, Pierson RN (1989)
Dual-photon absorptiometry: comparison of bone mineral and
soft tissue mass measurements in vivo with established methods.
Am J Clin Nutr 49:1283–1289
Heymsfield SB, Lohman TG, Wang Z, Going SB (1996) Multicom-
ponent molecular level models of body composition analysis. In:
Roche AF, Heymsfield SB, Lohman TG (eds) Human body
composition. Human Kinetics, Champaign, pp 129–148
Heyward VH, Wagner DR (2004) Applied Body Composition
Assessments. Human Kinetics, Champaign
Keppel G, Wickens TD (2004) Design and Analysis: A Researchers
Handbook. Prentice Hall, Upper Saddle River
Lohman TG (1986) Applicability of body composition techniques and
constants for children and youths. Exerc Sport Sci Rev 14:325–
357. doi:10.1249/00003677-198600140-00014
Lohman TG, Harris M, Teixeira PJ, Weiss L (2000) Assessing body
composition and changes in body composition. Another look at
dual-energy X-ray absorptiometry. Ann N Y Acad Sci 904:45–
54
Matthie J, Zarowitz B, De Lorenzo A, Andreoli A, Katzarski K, Pan
G, Withers P (1998) Analytic assessment of the various
bioimpedance methods used to estimate body water. J Appl
Physiol 84:1801–1816
Minderico CS, Silva AM, Keller K, Branco TL, Martins SS, Palmeira
AL, Barata JT, Carnero EA, Rocha PM, Teixeira PJ, Sardinha
LB (2007) Usefulness of different techniques for measuring
body composition changes during weight loss in overweight and
obese women. Br J Nutr 1–10
Moon JR, Hull HR, Tobkin SE, Teramoto M, Karabulut M, Roberts
MD, Ryan ED, Kim SJ, Dalbo VJ, Walter AA, Smith AE,
Cramer JT, Stout JR (2007) Percent body fat estimations in
college women using field and laboratory methods: a three-
compartment model approach. J Int Soc Sports Nutr 4:16. doi:
10.1186/1550-2783-4-16
Moon JR, Tobkin SE, Roberts MD, Dalbo VJ, Kerksick CM, Bemben
MG, Cramer JT, Stout JR (2008) Total body water estimations in
healthy men and women using bioimpedance spectroscopy: A
deuterium oxide comparison. Nutr Metab (Lond) 5:7. doi:
10.1186/1743-7075-5-7
Oldroyd B, Smith AH, Truscott JG (2003) Cross-calibration of GE/
Lunar pencil and fan-beam dual energy densitometers–bone
mineral density and body composition studies. Eur J Clin Nutr
57:977–987. doi:10.1038/sj.ejcn.1601633
Prior BM, Modlesky CM, Evans EM, Sloniger MA, Saunders MJ,
Lewis RD, Cureton KJ (2001) Muscularity and the density of the
fat-free mass in athletes. J Appl Physiol 90:1523–1531
Sardinha LB, Silva AM, Teixeira PJ (2003) Usefulness of age-
adjusted equations to estimate body fat with air displacement
Plethysmography in male adolescent athletes. Acta Diabetol
40:51–55. doi:10.1007/s00592-003-0026-x
Silva AM, Minderico CS, Teixeira PJ, Pietrobelli A, Sardinha LB
(2006) Body fat measurement in adolescent athletes: multicom-partment molecular model comparison. Eur J Clin Nutr 60:955–
964. doi:10.1038/sj.ejcn.1602405
Siri WE (1961) Body composition from fluid spaces and density.
Analysis of methods. In: Brozek J, Henschel A (eds) Techniques
for Measuring Body Composition. National Academy of
Sciences, Washington, DC, pp 223–244
Tylavsky F, Lohman T, Blunt BA, Schoeller DA, Fuerst T, Cauley
JA, Nevitt MC, Visser M, Harris TB (2003) QDR 4500A DXA
overestimates fat-free mass compared with criterion methods.
J Appl Physiol 94:959–965
Van Der Ploeg GE, Withers RT, Laforgia J (2003) Percent body fat
via DEXA: comparison with a four-compartment model. J Appl
Physiol 94:499–506
Van Loan MD, Withers P, Matthie J, Mayclin PL (1993) Use of
bioimpedance spectroscopy to determine extracellular fluid,
intracellular fluid, total body water, and fat-free mass. Basic Life
Sci 60:67–70
Vescovi JD, Hildebrandt L, Miller W, Hammer R, Spiller A (2002)
Evaluation of the BOD POD for estimating percent fat in female
college athletes. J Strength Cond Res 16:599–605. doi:10.1519/
1533-4287(2002)016\0599:EOTBPF[2.0.CO;2
Wang ZM, Deurenberg P, Guo SS, Pietrobelli A, Wang J, Pierson RN
Jr, Heymsfield SB (1998) Six-compartment body composition
model: inter-method comparisons of total body fat measurement.
Eur J Appl Physiol (2009) 105:119–130 129
123

Int J Obes Relat Metab Disord 22:329–337. doi:10.1038/sj.ijo.
0800590
Wang Z, Pi-Sunyer FX, Kotler DP, Wielopolski L, Withers RT,
Pierson RN Jr, Heymsfield SB (2002) Multicomponent methods:
evaluation of new and traditional soft tissue mineral models by
in vivo neutron activation analysis. Am J Clin Nutr 76:968–974
Wang Z, Shen W, Withers RT, Heymsfield SB (2005) Multicompo-
nent molecular-level models of body composition analysis. In:
Heymsfield SB, Lohman TG, Wang Z, Going SB (eds) Human
body composition. Human Kinetics, Champaign, pp 163–176
Williams JE, Wells JC, Wilson CM, Haroun D, Lucas A, Fewtrell MS
(2006) Evaluation of Lunar Prodigy dual-energy X-ray
absorptiometry for assessing body composition in healthy
persons and patients by comparison with the criterion 4-compo-
nent model. Am J Clin Nutr 83:1047–1054
Wilmore JH, Vodak PA, Parr RB, Girandola RN, Billing JE (1980)
Further simplification of a method for determination of residual
lung volume. Med Sci Sports Exerc 12:216–218
Withers RT, LaForgia J, Pillans RK, Shipp NJ, Chatterton BE,
Schultz CG, Leaney F (1998) Comparisons of two-, three-, and
four-compartment models of body composition analysis in men
and women. J Appl Physiol 85:238–245
130 Eur J Appl Physiol (2009) 105:119–130
123