estimates state domestic product - yamuna river
TRANSCRIPT
GOVERNMENT OF NATIONAL CAPITAL TERRITORY OF DELHI
ESTIMATES OF
STATE DOMESTIC PRODUCT 2006-07
(BASE YEAR: 1999-2000)
DIRECTORATE OF ECONOMICS & STATISTICS ROOM No.148, OLD SECRETARIAT
DELHI-110 054
GOVERNMENT OF N. C. T. OF DELHI
ESTIMATES OF
STATE DOMESTIC PRODUCT 2006-07
(Base Year : 1999-2000)
DIRECTORATE OF ECONOMICS & STATISTICS ROOM NO.148, OLD SECRETARIAT, DELHI-110054
Tel: 23890183 Fax: 23890362 Email: [email protected] Visit us at: www.des.delhigovt.nic.in
PREFACEPREFACEPREFACEPREFACE The Estimates of State Domestic Product representing the value of all goods and services produced within the State is one of the important indictors used to measure the growth of the State’s Economy in a nutshell. The Directorate of Economics & Statistics, Delhi has been bringing out estimates of State Domestic Product since 1970, and making them up to date from time to time as per the guidelines and methodology provided by the National Accounts Division, Central Statistical Organisation, M/o Statistics and Programme Implementation, Govt. of India. This issue presents new series of Estimates of Gross/Net State Domestic Product of Delhi from 1999-00 to 2004-05 along-with provisional estimates 2005-06 and Quick Estimates for 2006-07 at current and constant prices with the base year 1999-00. The estimates and the report has been prepared by Mrs. Sharda Tiwari, Statistical Officer, Sh. Bal Krishna, Statistical Assistant, Sh. Sangeet Mathur, Statistical Assistant, Sh. Raj Kumar, Statistical Investigator and Smt. K. Madhulata, Stenographer under the supervision of Sh. Jitendra Singh, Statistical Officer. Dr. R.N. Sharma, Deputy Director, provided the guidance on key issues. The efforts put in by Sh. Bal Krishna, Statistical Assistant in the data collection/scrutiny and computer applications in the process of report making deserves special mention. The cooperation extended by various departments and organizations functioning in the National Capital Territory of Delhi, in the preparation of these estimates by providing required data is gratefully acknowledged. I hope that policy makers and research scholars may find this publication useful in the study of economic growth of Delhi State. Suggestions if any, for improvement of the coverage and contents of this brochure, are welcome. DELHI Dr. B.K. Sharma April, 2008 Director
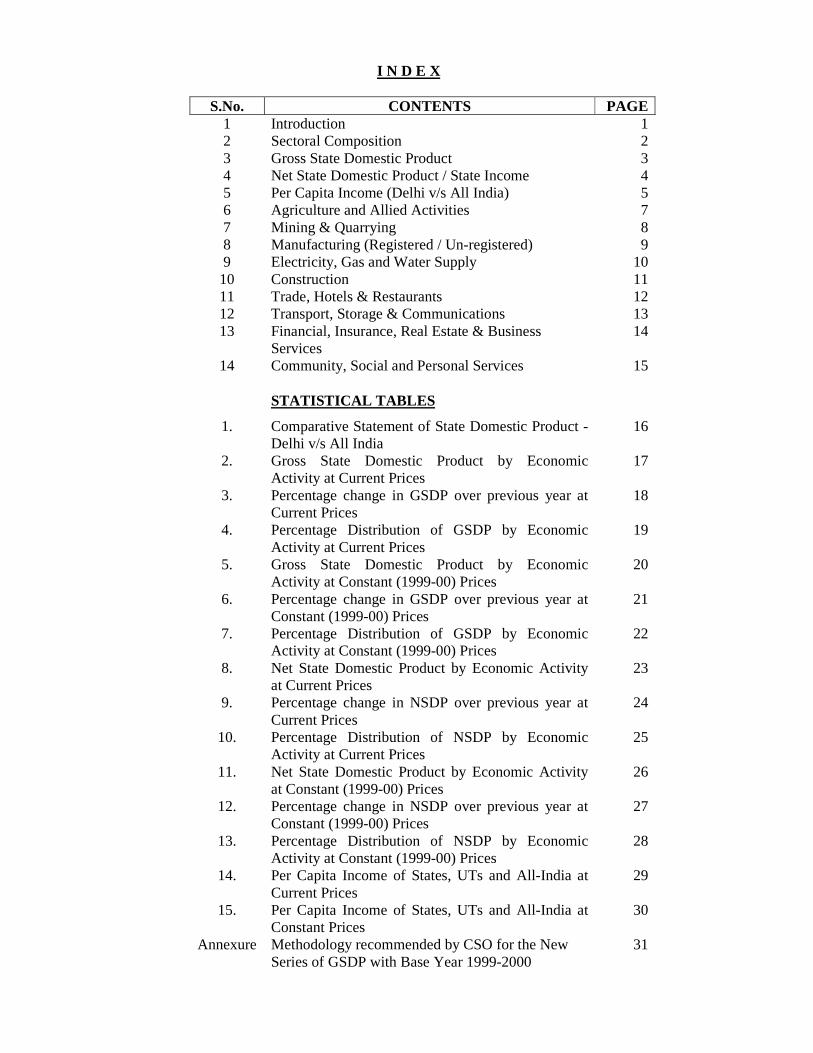
I N D E X
S.No. CONTENTS PAGE
1 Introduction 1 2 Sectoral Composition 2 3 Gross State Domestic Product 3 4 Net State Domestic Product / State Income 4 5 Per Capita Income (Delhi v/s All India) 5 6 Agriculture and Allied Activities 7 7 Mining & Quarrying 8 8 Manufacturing (Registered / Un-registered) 9 9 Electricity, Gas and Water Supply 10
10 Construction 11 11 Trade, Hotels & Restaurants 12 12 Transport, Storage & Communications 13 13 Financial, Insurance, Real Estate & Business
Services 14
14 Community, Social and Personal Services 15
STATISTICAL TABLES
1. Comparative Statement of State Domestic Product - Delhi v/s All India
16
2. Gross State Domestic Product by Economic Activity at Current Prices
17
3. Percentage change in GSDP over previous year at Current Prices
18
4. Percentage Distribution of GSDP by Economic Activity at Current Prices
19
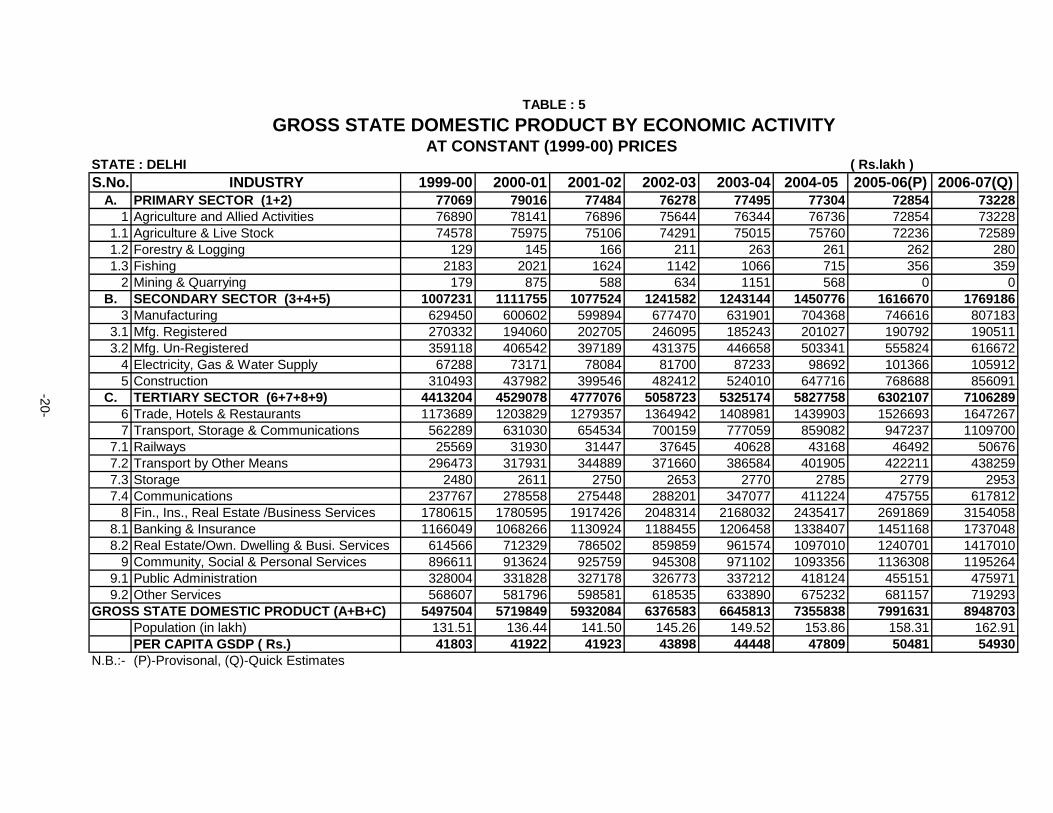
5. Gross State Domestic Product by Economic Activity at Constant (1999-00) Prices
20
6. Percentage change in GSDP over previous year at Constant (1999-00) Prices
21
7. Percentage Distribution of GSDP by Economic Activity at Constant (1999-00) Prices
22
8. Net State Domestic Product by Economic Activity at Current Prices
23
9. Percentage change in NSDP over previous year at Current Prices
24
10. Percentage Distribution of NSDP by Economic Activity at Current Prices
25
11. Net State Domestic Product by Economic Activity at Constant (1999-00) Prices
26
12. Percentage change in NSDP over previous year at Constant (1999-00) Prices
27
13. Percentage Distribution of NSDP by Economic Activity at Constant (1999-00) Prices
28
14. Per Capita Income of States, UTs and All-India at Current Prices
29
15. Per Capita Income of States, UTs and All-India at Constant Prices
30
Annexure Methodology recommended by CSO for the New Series of GSDP with Base Year 1999-2000
31
STATE DOMESTIC PRODUCT (BASE YEAR 1999-2000)
1. INTRODUCTION
tate Domestic Product is a measure in monetary terms of the volume of all goods and services produced by an economy during a given period of time accounted without
duplication. The measure obviously has to be in value terms as the different units of production and different measures of services are not directly additive. The estimates of State Domestic Product (SDP), of the National Capital Territory of Delhi, are prepared at current and constant prices by the Directorate of Economics & Statistics, Delhi. The estimates of SDP at current prices are obtained by evaluating the product at current prices prevailing during the year. The estimates of SDP at current prices, over the time do not reveal actual economic growth because these contain the combined effect of (i) the changes in volume of goods and services and (ii) the changes in the prices of goods and services. In order to eliminate the effect of price changes/inflation, the estimates of SDP are also prepared by evaluating the goods and services at the prices prevailing in the fixed year known as base year and are known as the estimates of State Domestic Product at constant prices. The estimates of State Domestic Product are prepared for all the sectors of economy both in terms of Gross and Net basis. The difference between the two is that in the gross estimates, no deduction is made for Consumption of Fixed Capital (CFC) which takes place in the process of production, whereas in the net estimates, CFC is subtracted from the gross value figures. Net State Domestic Product is also called State Income. Again, capital is one of the primary factors used in production and this results in the consumption of the fixed capital and hence, a reduction in the economic life of the capital. In other words, the capital depreciates as a result of its use in the process of production. The CFC measures the replacement value of that part of the capital stock, which has been used up in the production process during the year. The SDP estimates are being prepared by Directorate of Economics & Statistics from the sixth decade of the last century. First series of estimates was compiled for the period 1960-61 to 1977-78 with base year 1960-61. Second series covers the period from 1970-71 to 1986-87 with base year 1970-71. The third series was w.e.f. 1980-81 to 1996-97 with base year 1980-81. Fourth revision took place in nineties with base year 1993-94 and continued up to 2004-05. For the present series the base year has been revised to 1999-2000. Gradual improvement in the availability of basic data over the years compels the SDP series compilers to review the methodology with a view to update database and shift the base year to a more recent year. As a result, the base year of the present SDP series has been shifted to 1999-2000. Three major components influencing the present revision exercise include (i) revision to the base year to a more recent year (for meaningful analysis of the structural changes in the economy), (ii) complete review of the existing data base and methodology employed in the estimation of various macro-economic aggregates including choice of the alternative databases on individual subjects and (iii) to the extent feasible, implementing the recommendations of the System of National Accounts (1993 SNA) prepared under the auspices of the Inter Secretariat Working Group on National Accounts comprising of the European Communities (EUROSTAT), International Monetary Fund (IMF), Organisation for Economic Cooperation and Development (OECD), United Nations and World Bank.
S
2
In this revised series new economic activities viz (i) other private communication, (ii) renting of machinery and other equipment without operator, (iii) computer related activities in unorganized segment, (iv) coaching centres, (v) social work with accommodation, and (vi) recreation and cultural and supporting activities, have been included. Under the present series estimates of State Domestic Product of Delhi have been recompiled with effect from 1999-00 to 2004-05 after joint discussions with CSO held in April 2007 whereas provisional estimates for 2005-06 have been prepared on the basis of provisional data from CSO and other data providers. Quick estimates of SDP for the year 2006-07 have been projected by using extrapolation techniques/national trends at sub-economic activity level of various sub-sectors.
2. SECTORAL COMPOSITION
SECTOR WISE CONTRIBUTION OF GSDP AT CURRENT PRICES (in %age)
SECTOR 1999-00 2000-01 2001-02 2002-03 2003-04 2004-05 2005-06 2006-07
Primary 1.40 1.40 1.31 1.22 1.13 0.99 0.88 0.81
Secondary 18.32 19.40 18.10 18.92 18.21 20.16 20.69 20.75
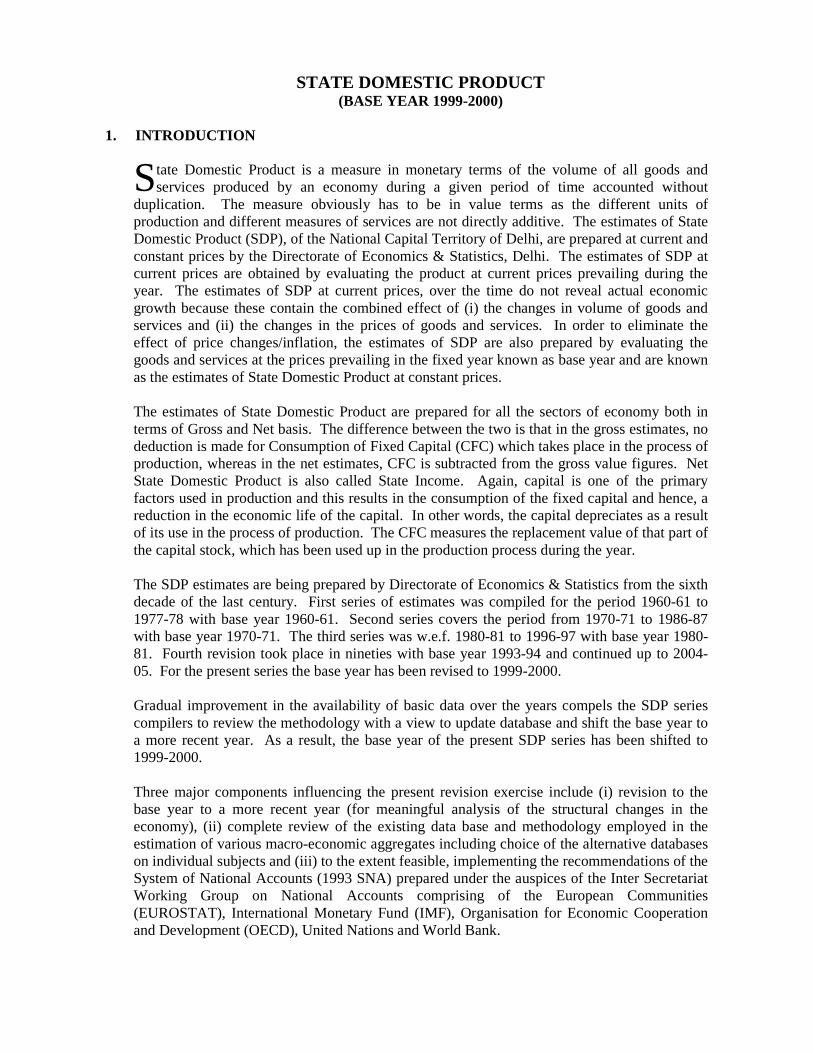
Tertiary 80.28 79.20 80.59 79.86 80.66 78.85 78.43 78.44 The analysis of sectoral composition of Gross State Domestic Product (GSDP) at current prices reveals that contribution of Primary Sector in the economy of Delhi (viz: Agriculture, Live Stock, Forestry, Fishing, Mining & Quarrying) losing regularly. Whereas contribution of Secondary Sector comprising of Manufacturing, Electricity, Gas, Water Supply and Construction, is enhancing by and large. The Tertiary Sector, also known as Service Sector, comprising of Trade, Hotels & Restaurants, Transport, Storage, Communication, Financial & Insurance, Real Estate, Business Services, Public Administration and Other Services, the major contributor in the economy of Delhi, is showing moderately declining trend. The contribution of the Primary Sector, which was 1.40% during 1999-00 has declined to 0.81% in 2006-07 at current prices. Whereas the contribution of Secondary Sector was recorded at 18.32% in 1999-00, has enhanced to 20.75% in 2006-07. On the other hand, contribution of Tertiary Sector has declined to 78.44% in 2006-07 from 80.28% during the base year. The overall view of sectoral composition of State Economy at current prices since 1999-00 to 2006-07 has been depicted in the following graphical presentation:
Sectoral Composition at Current Prices
80.2
8
79.2
80.5
9
79.8
6
80.6
6
78.8
5
78.4
3
78.4
4
18.32 19.4 18.1 18.92 18.21 20.16 20.69 20.75
0.810.880.991.131.221.311.41.4
0%
20%
40%
60%
80%
100%
1999-00 2000-01 2001-02 2002-03 2003-04 2004-05 2005-06 2006-07
Tertiary Secondary Primary
3
SECTOR WISE CONTRIBUTION OF GSDP AT CONSTANT PRICES (in %age)
SECTOR 1999-00 2000-01 2001-02 2002-03 2003-04 2004-05 2005-06 2006-07
Primary 1.40 1.38 1.31 1.20 1.17 1.05 0.91 0.82
Secondary 18.32 19.44 18.16 19.47 18.70 19.72 20.24 19.77
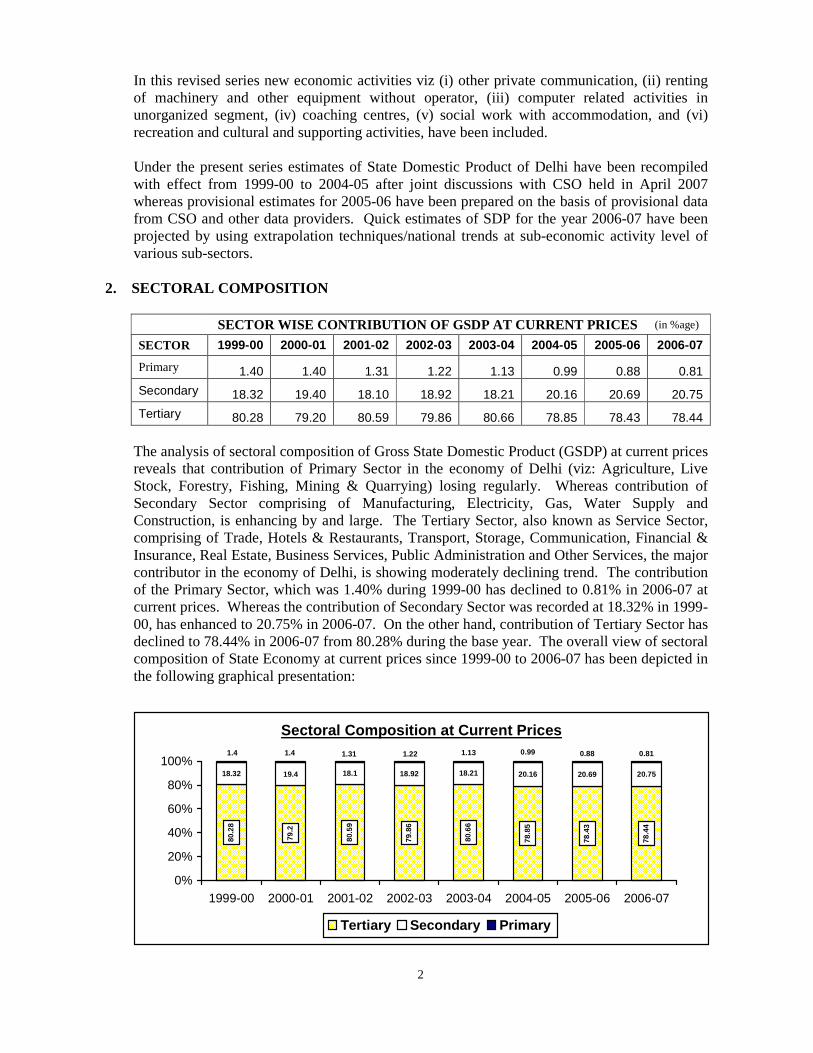
Tertiary 80.28 79.18 80.53 79.33 80.13 79.23 78.85 79.41 Analysis of sectoral composition of GSDP at constant (1999-00) prices is also revealing the same trend as that of current prices but with slight variations in percentages. During 2006-07, contribution of Primary, Secondary and Tertiary sector was recorded as 0.82%, 19.77% and 79.41% respectively. The reasons for change in the trend of sectoral composition of the Delhi’s Economy may be attributed to the rapid urbanization of Delhi and consequential reduction in agricultural and allied activities.
3. GROSS STATE DOMESTIC PRODUCT (Rs. Crore)
Prices 1999-00 2000-01 2001-02 2002-03 2003-04 2004-05 2005-06 2006-07
Current 54975 59732 64571 71070 78804 89920 101800 118240
Constant 54975 57198 59321 63766 66458 73558 79916 89487
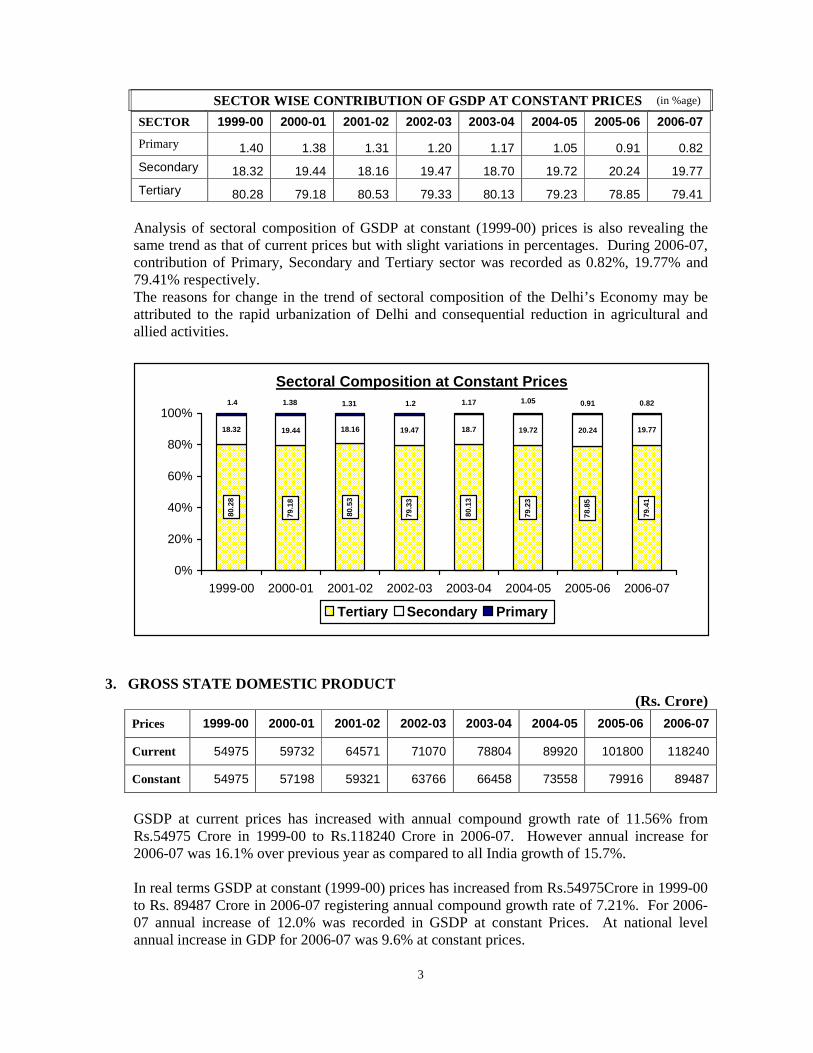
GSDP at current prices has increased with annual compound growth rate of 11.56% from Rs.54975 Crore in 1999-00 to Rs.118240 Crore in 2006-07. However annual increase for 2006-07 was 16.1% over previous year as compared to all India growth of 15.7%. In real terms GSDP at constant (1999-00) prices has increased from Rs.54975Crore in 1999-00 to Rs. 89487 Crore in 2006-07 registering annual compound growth rate of 7.21%. For 2006-07 annual increase of 12.0% was recorded in GSDP at constant Prices. At national level annual increase in GDP for 2006-07 was 9.6% at constant prices.
Sectoral Composition at Constant Prices
80.2
8
79.1
8
80.5
3
79.3
3
80.1
3
79.2
3
78.8
5
79.4
1
18.32 19.44 18.16 19.47 18.7 19.72 20.24 19.77
0.820.911.051.171.21.311.381.4
0%
20%
40%
60%
80%
100%
1999-00 2000-01 2001-02 2002-03 2003-04 2004-05 2005-06 2006-07
Tertiary Secondary Primary
4
For the 9th five year plan (1997-98 to 2001-02), average annual growth was recorded at 13.32% at current prices. Corresponding growth for the 10th five year plan (2002-03 to 2006-07) was recorded at 13.57% at current prices. In real terms, average annual growth of GSDP for the 10th five year plan at constant (1999-00) prices was recorded at 8.84% for Delhi as compared to 8.74% at national level.
4. NET STATE DOMESTIC PRODUCT/STATE INCOME (Rs. Crore)
Prices 1999-00 2000-01 2001-02 2002-03 2003-04 2004-05 2005-06 2006-07
Current 50859 55036 59447 65511 72615 82022 92856 108706
Constant 50859 52697 54657 58818 61151 67306 73200 82375
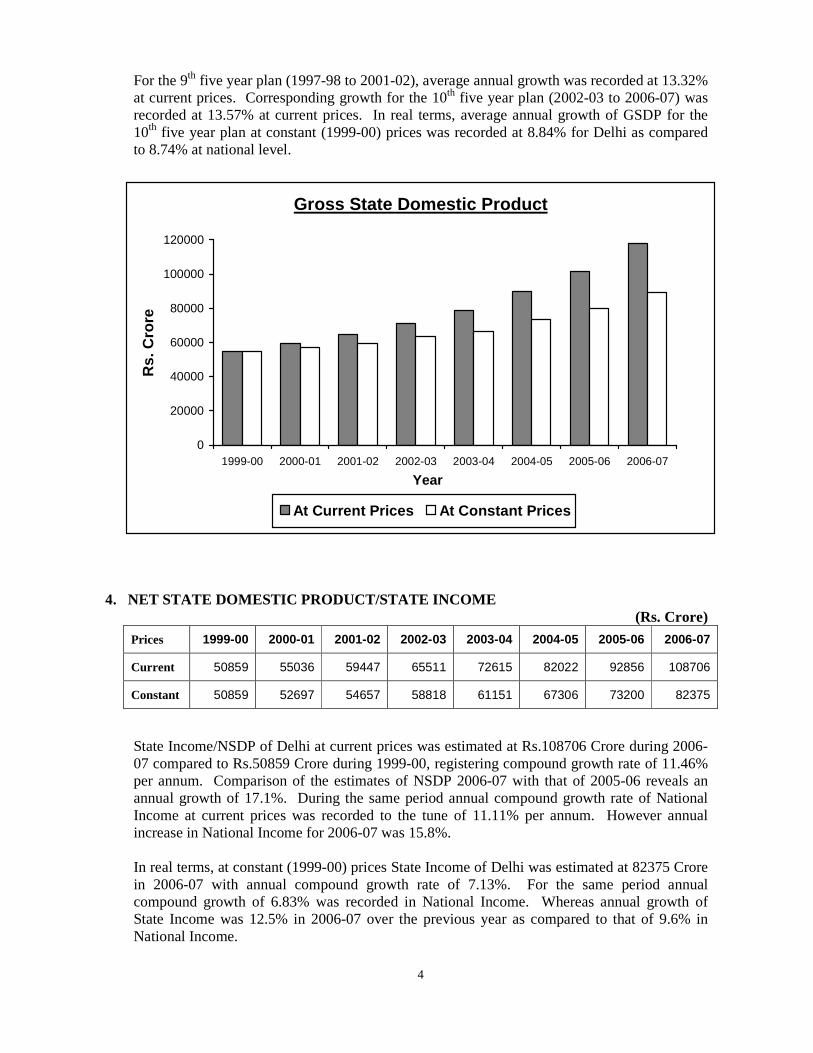
State Income/NSDP of Delhi at current prices was estimated at Rs.108706 Crore during 2006-07 compared to Rs.50859 Crore during 1999-00, registering compound growth rate of 11.46% per annum. Comparison of the estimates of NSDP 2006-07 with that of 2005-06 reveals an annual growth of 17.1%. During the same period annual compound growth rate of National Income at current prices was recorded to the tune of 11.11% per annum. However annual increase in National Income for 2006-07 was 15.8%. In real terms, at constant (1999-00) prices State Income of Delhi was estimated at 82375 Crore in 2006-07 with annual compound growth rate of 7.13%. For the same period annual compound growth of 6.83% was recorded in National Income. Whereas annual growth of State Income was 12.5% in 2006-07 over the previous year as compared to that of 9.6% in National Income.
Gross State Domestic Product
0
20000
40000
60000
80000
100000
120000
1999-00 2000-01 2001-02 2002-03 2003-04 2004-05 2005-06 2006-07
Year
Rs.
Cro
re
At Current Prices At Constant Prices
5
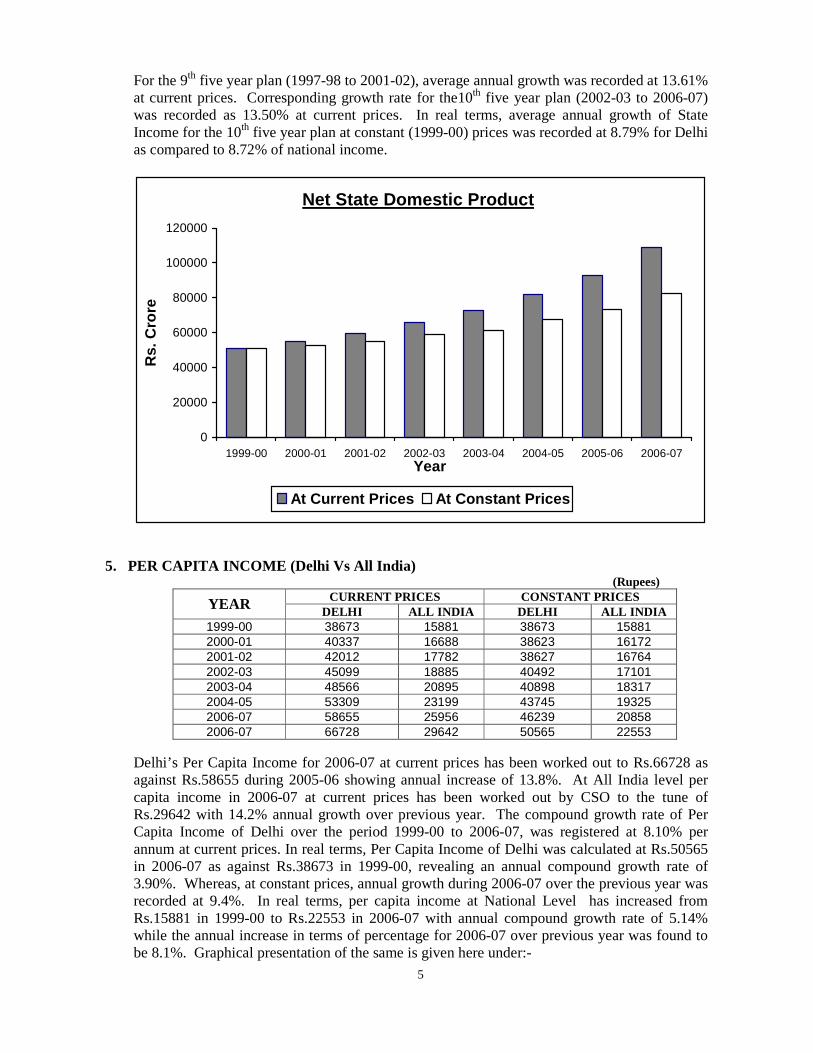
For the 9th five year plan (1997-98 to 2001-02), average annual growth was recorded at 13.61% at current prices. Corresponding growth rate for the10th five year plan (2002-03 to 2006-07) was recorded as 13.50% at current prices. In real terms, average annual growth of State Income for the 10th five year plan at constant (1999-00) prices was recorded at 8.79% for Delhi as compared to 8.72% of national income.
5. PER CAPITA INCOME (Delhi Vs All India) (Rupees)
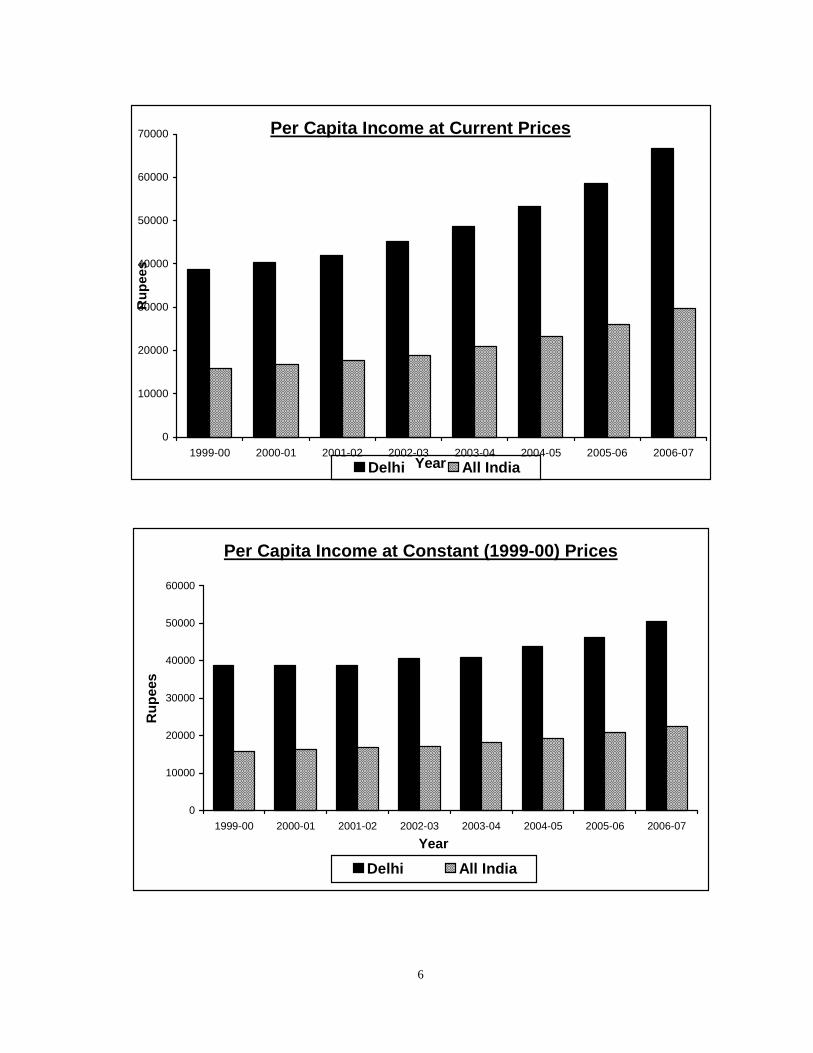
CURRENT PRICES CONSTANT PRICES YEAR DELHI ALL INDIA DELHI ALL INDIA 1999-00 38673 15881 38673 15881 2000-01 40337 16688 38623 16172 2001-02 42012 17782 38627 16764 2002-03 45099 18885 40492 17101 2003-04 48566 20895 40898 18317 2004-05 53309 23199 43745 19325 2006-07 58655 25956 46239 20858 2006-07 66728 29642 50565 22553
Delhi’s Per Capita Income for 2006-07 at current prices has been worked out to Rs.66728 as against Rs.58655 during 2005-06 showing annual increase of 13.8%. At All India level per capita income in 2006-07 at current prices has been worked out by CSO to the tune of Rs.29642 with 14.2% annual growth over previous year. The compound growth rate of Per Capita Income of Delhi over the period 1999-00 to 2006-07, was registered at 8.10% per annum at current prices. In real terms, Per Capita Income of Delhi was calculated at Rs.50565 in 2006-07 as against Rs.38673 in 1999-00, revealing an annual compound growth rate of 3.90%. Whereas, at constant prices, annual growth during 2006-07 over the previous year was recorded at 9.4%. In real terms, per capita income at National Level has increased from Rs.15881 in 1999-00 to Rs.22553 in 2006-07 with annual compound growth rate of 5.14% while the annual increase in terms of percentage for 2006-07 over previous year was found to be 8.1%. Graphical presentation of the same is given here under:-
Net State Domestic Product
0
20000
40000
60000
80000
100000
120000
1999-00 2000-01 2001-02 2002-03 2003-04 2004-05 2005-06 2006-07Year
Rs.
Cro
re
At Current Prices At Constant Prices
6
Per Capita Income at Current Prices
0
10000
20000
30000
40000
50000
60000
70000
1999-00 2000-01 2001-02 2002-03 2003-04 2004-05 2005-06 2006-07Year
Ru
pee
s
Delhi All India
Per Capita Income at Constant (1999-00) Prices
0
10000
20000
30000
40000
50000
60000
1999-00 2000-01 2001-02 2002-03 2003-04 2004-05 2005-06 2006-07
Year
Ru
pee
s
Delhi All India
7
6. AGRICULTURE AND ALLIED ACTIVITIES
(Rs. Crore)
Year Item
1999-00 2000-01 2001-02 2002-03 2003-04 2004-05 2005-06 2006-07
GSDP Current 769 828 842 866 882 887 900 961
GSDP Constant 769 781 769 756 763 767 729 732
NSDP Current 762 821 834 857 872 877 889 949
NSDP Constant 762 774 761 749 755 759 720 724
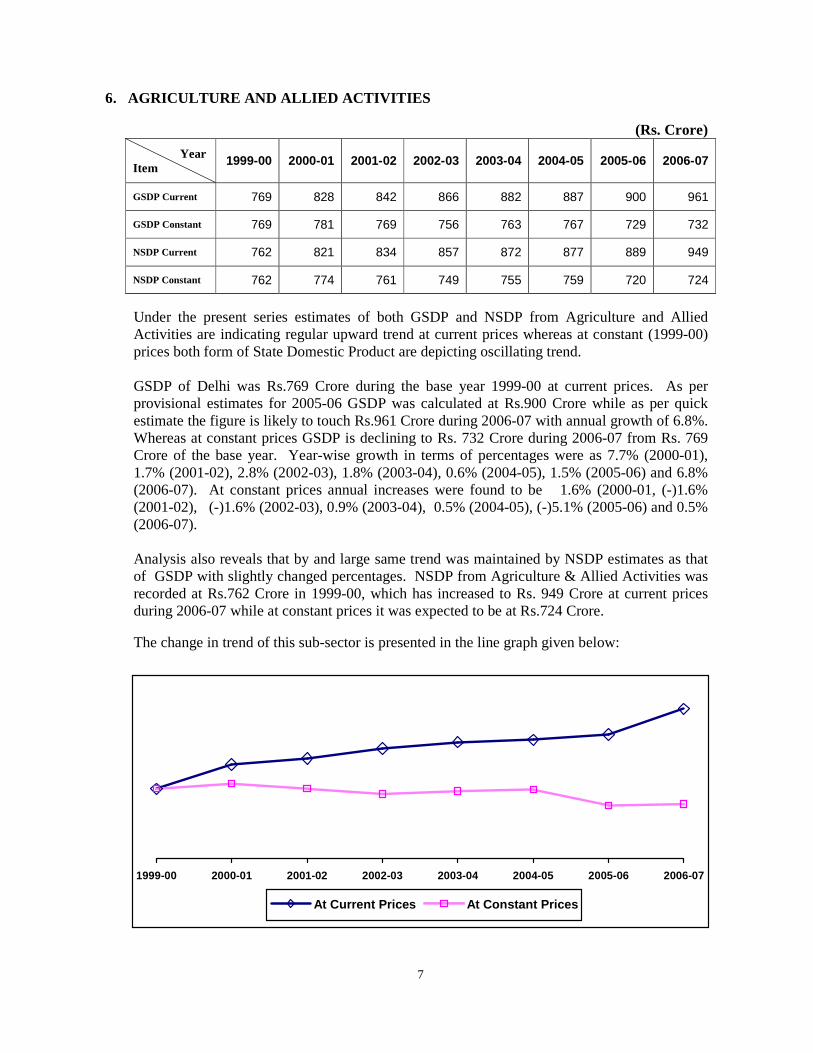
Under the present series estimates of both GSDP and NSDP from Agriculture and Allied Activities are indicating regular upward trend at current prices whereas at constant (1999-00) prices both form of State Domestic Product are depicting oscillating trend. GSDP of Delhi was Rs.769 Crore during the base year 1999-00 at current prices. As per provisional estimates for 2005-06 GSDP was calculated at Rs.900 Crore while as per quick estimate the figure is likely to touch Rs.961 Crore during 2006-07 with annual growth of 6.8%. Whereas at constant prices GSDP is declining to Rs. 732 Crore during 2006-07 from Rs. 769 Crore of the base year. Year-wise growth in terms of percentages were as 7.7% (2000-01), 1.7% (2001-02), 2.8% (2002-03), 1.8% (2003-04), 0.6% (2004-05), 1.5% (2005-06) and 6.8% (2006-07). At constant prices annual increases were found to be 1.6% (2000-01, (-)1.6% (2001-02), (-)1.6% (2002-03), 0.9% (2003-04), 0.5% (2004-05), (-)5.1% (2005-06) and 0.5% (2006-07). Analysis also reveals that by and large same trend was maintained by NSDP estimates as that of GSDP with slightly changed percentages. NSDP from Agriculture & Allied Activities was recorded at Rs.762 Crore in 1999-00, which has increased to Rs. 949 Crore at current prices during 2006-07 while at constant prices it was expected to be at Rs.724 Crore. The change in trend of this sub-sector is presented in the line graph given below:
1999-00 2000-01 2001-02 2002-03 2003-04 2004-05 2005-06 2006-07
At Current Prices At Constant Prices
8
7. MINING & QUARRYING
(Rs. Crore)
Year Item
1999-00 2000-01 2001-02 2002-03 2003-04 2004-05 2005-06 2006-07
GSDP Current 1.79 7.59 4.12 4.18 9.46 4.49 0.00 0.00
GSDP Constant 1.79 8.75 5.88 6.34 11.51 5.68 0.00 0.00
NSDP Current 1.42 6.09 3.29 3.50 7.90 3.67 0.00 0.00
NSDP Constant 1.42 7.29 5.12 5.74 10.17 5.03 0.00 0.00
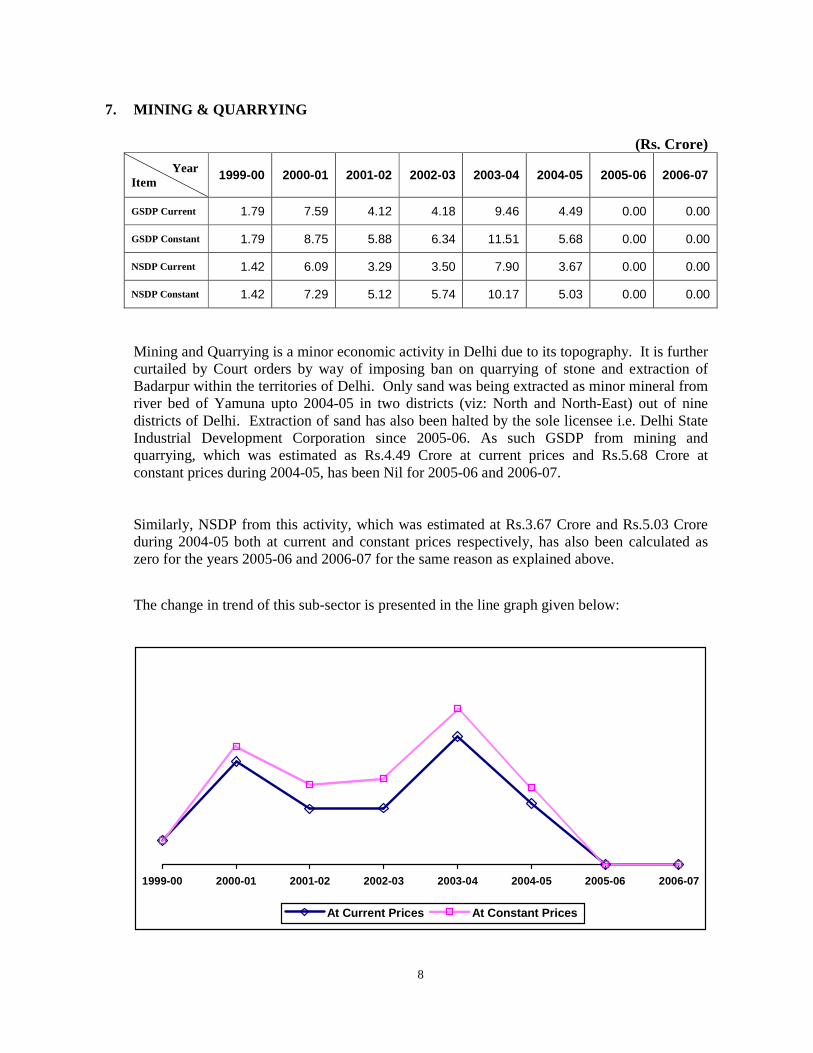
Mining and Quarrying is a minor economic activity in Delhi due to its topography. It is further curtailed by Court orders by way of imposing ban on quarrying of stone and extraction of Badarpur within the territories of Delhi. Only sand was being extracted as minor mineral from river bed of Yamuna upto 2004-05 in two districts (viz: North and North-East) out of nine districts of Delhi. Extraction of sand has also been halted by the sole licensee i.e. Delhi State Industrial Development Corporation since 2005-06. As such GSDP from mining and quarrying, which was estimated as Rs.4.49 Crore at current prices and Rs.5.68 Crore at constant prices during 2004-05, has been Nil for 2005-06 and 2006-07. Similarly, NSDP from this activity, which was estimated at Rs.3.67 Crore and Rs.5.03 Crore during 2004-05 both at current and constant prices respectively, has also been calculated as zero for the years 2005-06 and 2006-07 for the same reason as explained above. The change in trend of this sub-sector is presented in the line graph given below:
1999-00 2000-01 2001-02 2002-03 2003-04 2004-05 2005-06 2006-07
At Current Prices At Constant Prices
9
8. MANUFACTURING
(Rs. Crore)
Year Item
1999-00 2000-01 2001-02 2002-03 2003-04 2004-05 2005-06 2006-07
GSDP Current 6295 6337 6428 7399 7279 8685 9548 10845
GSDP Constant 6295 6006 5999 6775 6319 7044 7466 8072
NSDP Current 5283 5190 5159 6007 5675 6751 7277 8515
NSDP Constant 5283 4911 4854 5547 4975 5558 5833 6397
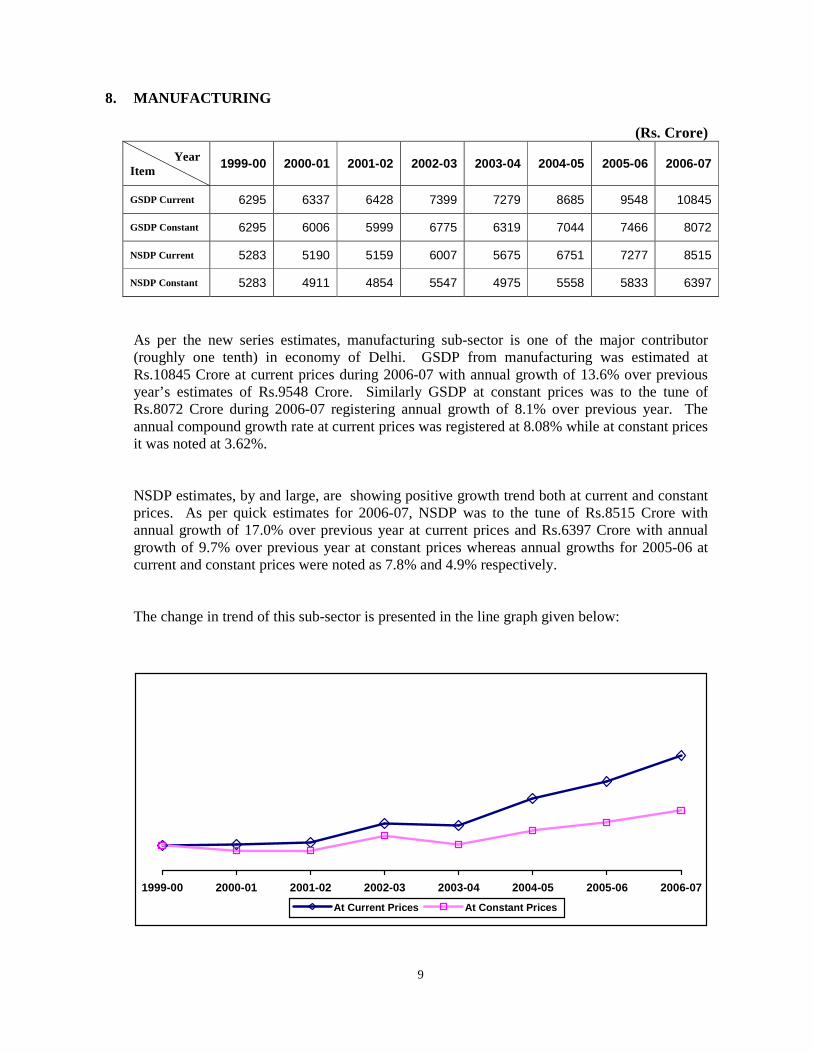
As per the new series estimates, manufacturing sub-sector is one of the major contributor (roughly one tenth) in economy of Delhi. GSDP from manufacturing was estimated at Rs.10845 Crore at current prices during 2006-07 with annual growth of 13.6% over previous year’s estimates of Rs.9548 Crore. Similarly GSDP at constant prices was to the tune of Rs.8072 Crore during 2006-07 registering annual growth of 8.1% over previous year. The annual compound growth rate at current prices was registered at 8.08% while at constant prices it was noted at 3.62%. NSDP estimates, by and large, are showing positive growth trend both at current and constant prices. As per quick estimates for 2006-07, NSDP was to the tune of Rs.8515 Crore with annual growth of 17.0% over previous year at current prices and Rs.6397 Crore with annual growth of 9.7% over previous year at constant prices whereas annual growths for 2005-06 at current and constant prices were noted as 7.8% and 4.9% respectively.
The change in trend of this sub-sector is presented in the line graph given below:
1999-00 2000-01 2001-02 2002-03 2003-04 2004-05 2005-06 2006-07
At Current Prices At Constant Prices
10
9. ELECTRICITY, GAS AND WATER SUPPLY
(Rs. Crore)
Year Item 1999-00 2000-01 2001-02 2002-03 2003-04 2004-05 2005-06 2006-07
GSDP Current 673 708 846 655 743 1410 1489 1587
GSDP Constant 673 732 781 817 872 987 1014 1059
NSDP Current 564 524 632 443 553 712 707 813
NSDP Constant 564 554 586 629 708 430 427 468
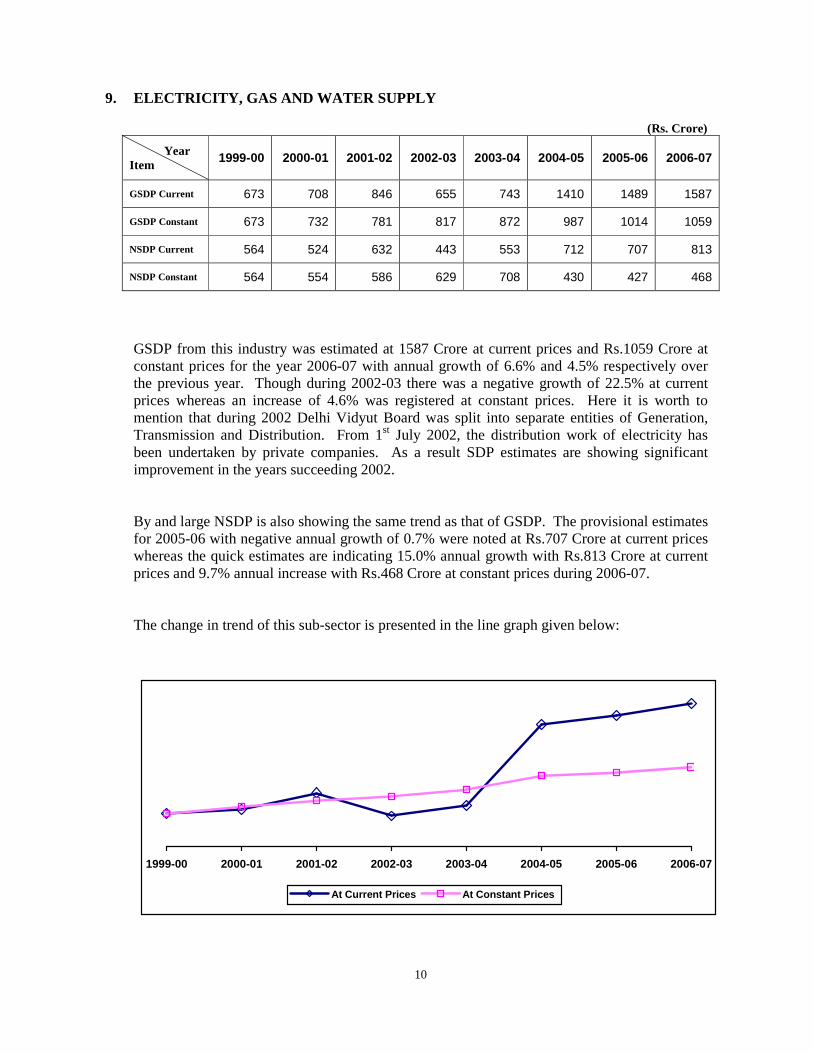
GSDP from this industry was estimated at 1587 Crore at current prices and Rs.1059 Crore at constant prices for the year 2006-07 with annual growth of 6.6% and 4.5% respectively over the previous year. Though during 2002-03 there was a negative growth of 22.5% at current prices whereas an increase of 4.6% was registered at constant prices. Here it is worth to mention that during 2002 Delhi Vidyut Board was split into separate entities of Generation, Transmission and Distribution. From 1st July 2002, the distribution work of electricity has been undertaken by private companies. As a result SDP estimates are showing significant improvement in the years succeeding 2002. By and large NSDP is also showing the same trend as that of GSDP. The provisional estimates for 2005-06 with negative annual growth of 0.7% were noted at Rs.707 Crore at current prices whereas the quick estimates are indicating 15.0% annual growth with Rs.813 Crore at current prices and 9.7% annual increase with Rs.468 Crore at constant prices during 2006-07. The change in trend of this sub-sector is presented in the line graph given below:
1999-00 2000-01 2001-02 2002-03 2003-04 2004-05 2005-06 2006-07
At Current Prices At Constant Prices
11
10. CONSTRUCTION (Rs. Crore)
Year Item
1999-00 2000-01 2001-02 2002-03 2003-04 2004-05 2005-06 2006-07
GSDP Current 3105 4545 4413 5389 6325 8029 10025 12101
GSDP Constant 3105 4380 3995 4824 5240 6477 7687 8561
NSDP Current 3009 4402 4258 5199 6108 7780 9731 11784
NSDP Constant 3009 4244 3855 4653 5049 6271 7455 8308
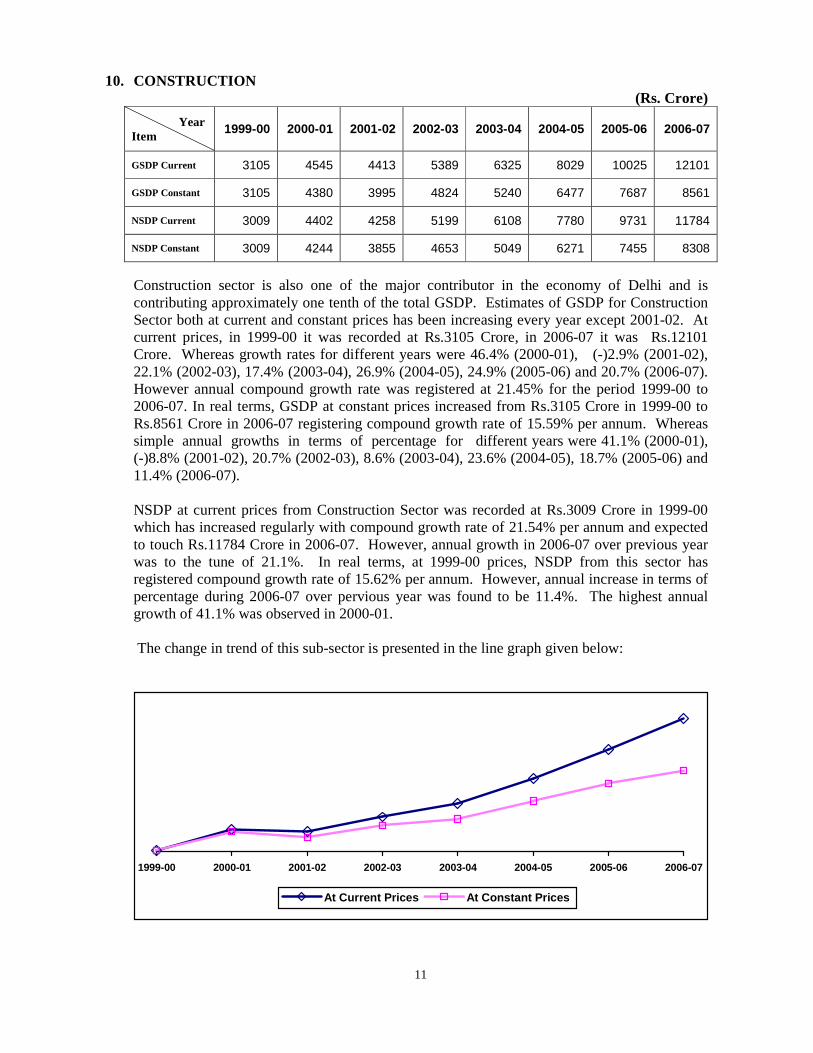
Construction sector is also one of the major contributor in the economy of Delhi and is contributing approximately one tenth of the total GSDP. Estimates of GSDP for Construction Sector both at current and constant prices has been increasing every year except 2001-02. At current prices, in 1999-00 it was recorded at Rs.3105 Crore, in 2006-07 it was Rs.12101 Crore. Whereas growth rates for different years were 46.4% (2000-01), (-)2.9% (2001-02), 22.1% (2002-03), 17.4% (2003-04), 26.9% (2004-05), 24.9% (2005-06) and 20.7% (2006-07). However annual compound growth rate was registered at 21.45% for the period 1999-00 to 2006-07. In real terms, GSDP at constant prices increased from Rs.3105 Crore in 1999-00 to Rs.8561 Crore in 2006-07 registering compound growth rate of 15.59% per annum. Whereas simple annual growths in terms of percentage for different years were 41.1% (2000-01), (-)8.8% (2001-02), 20.7% (2002-03), 8.6% (2003-04), 23.6% (2004-05), 18.7% (2005-06) and 11.4% (2006-07). NSDP at current prices from Construction Sector was recorded at Rs.3009 Crore in 1999-00 which has increased regularly with compound growth rate of 21.54% per annum and expected to touch Rs.11784 Crore in 2006-07. However, annual growth in 2006-07 over previous year was to the tune of 21.1%. In real terms, at 1999-00 prices, NSDP from this sector has registered compound growth rate of 15.62% per annum. However, annual increase in terms of percentage during 2006-07 over pervious year was found to be 11.4%. The highest annual growth of 41.1% was observed in 2000-01. The change in trend of this sub-sector is presented in the line graph given below:
1999-00 2000-01 2001-02 2002-03 2003-04 2004-05 2005-06 2006-07
At Current Prices At Constant Prices
12
11. TRADE, HOTELS & RESTAURANTS
(Rs. Crore)
Year Item 1999-00 2000-01 2001-02 2002-03 2003-04 2004-05 2005-06 2006-07
GSDP Current 11737 12753 13883 15183 16499 18068 20127 22950
GSDP Constant 11737 12038 12794 13649 14090 14399 15267 16473
NSDP Current 11445 12415 13503 14779 16032 17567 19561 22352
NSDP Constant 11445 11719 12449 13287 13688 13998 14838 16018
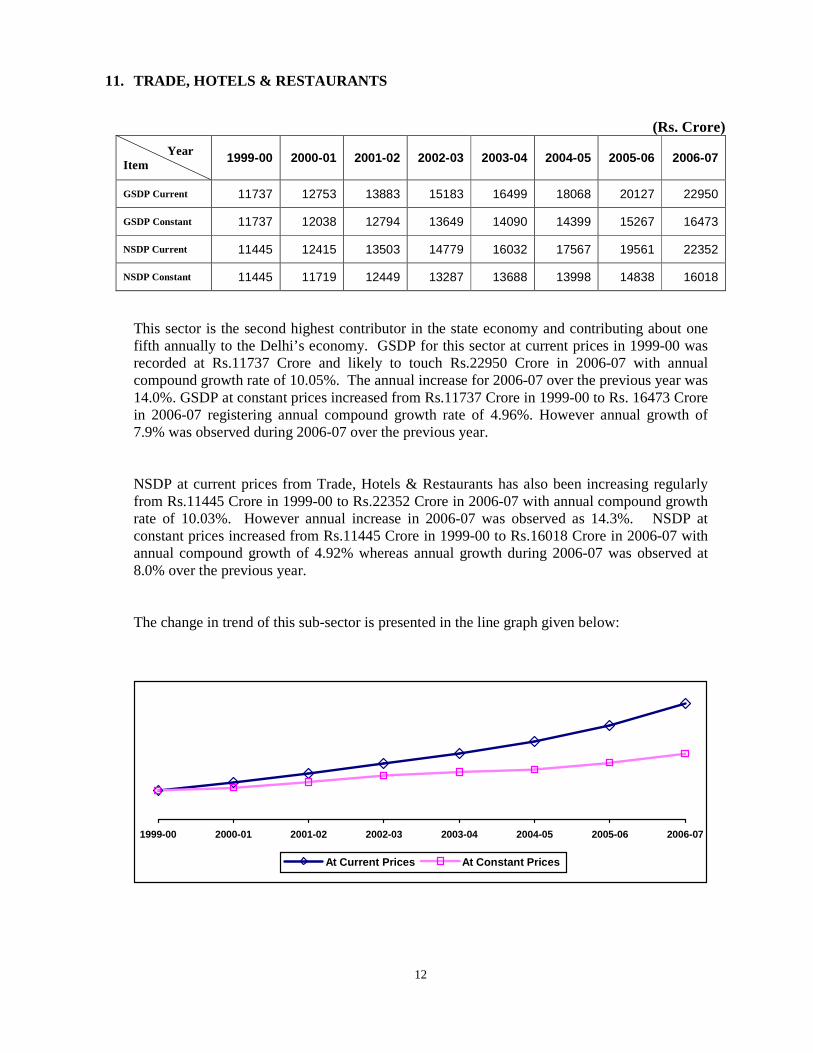
This sector is the second highest contributor in the state economy and contributing about one fifth annually to the Delhi’s economy. GSDP for this sector at current prices in 1999-00 was recorded at Rs.11737 Crore and likely to touch Rs.22950 Crore in 2006-07 with annual compound growth rate of 10.05%. The annual increase for 2006-07 over the previous year was 14.0%. GSDP at constant prices increased from Rs.11737 Crore in 1999-00 to Rs. 16473 Crore in 2006-07 registering annual compound growth rate of 4.96%. However annual growth of 7.9% was observed during 2006-07 over the previous year. NSDP at current prices from Trade, Hotels & Restaurants has also been increasing regularly from Rs.11445 Crore in 1999-00 to Rs.22352 Crore in 2006-07 with annual compound growth rate of 10.03%. However annual increase in 2006-07 was observed as 14.3%. NSDP at constant prices increased from Rs.11445 Crore in 1999-00 to Rs.16018 Crore in 2006-07 with annual compound growth of 4.92% whereas annual growth during 2006-07 was observed at 8.0% over the previous year. The change in trend of this sub-sector is presented in the line graph given below:
1999-00 2000-01 2001-02 2002-03 2003-04 2004-05 2005-06 2006-07
At Current Prices At Constant Prices
13
12. TRANSPORT, STORAGE & COMMUNICATIONS
(Rs. Crore)
Year Item 1999-00 2000-01 2001-02 2002-03 2003-04 2004-05 2005-06 2006-07
GSDP Current 5623 6231 6614 6948 7819 8692 9810 11320
GSDP Constant 5623 6310 6545 7002 7771 8591 9472 11097
NSDP Current 4484 5008 5348 5606 6394 7013 8008 9334
NSDP Constant 4484 5139 5381 5789 6512 7202 8023 9503
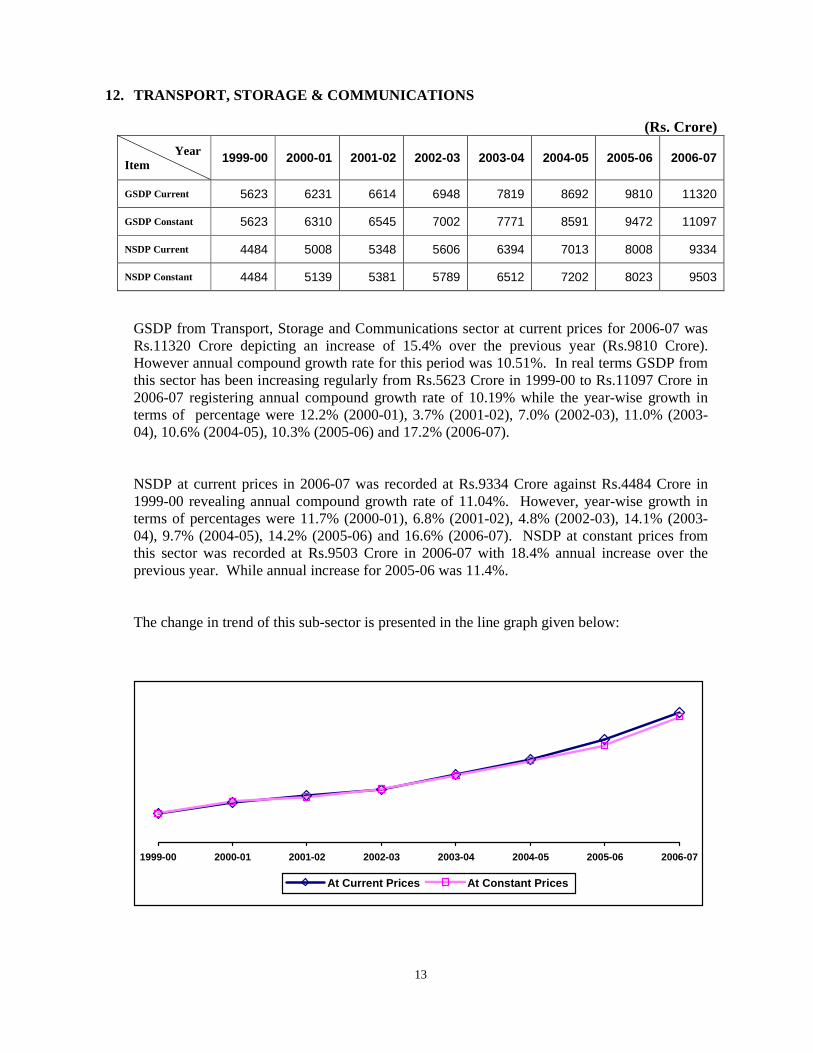
GSDP from Transport, Storage and Communications sector at current prices for 2006-07 was Rs.11320 Crore depicting an increase of 15.4% over the previous year (Rs.9810 Crore). However annual compound growth rate for this period was 10.51%. In real terms GSDP from this sector has been increasing regularly from Rs.5623 Crore in 1999-00 to Rs.11097 Crore in 2006-07 registering annual compound growth rate of 10.19% while the year-wise growth in terms of percentage were 12.2% (2000-01), 3.7% (2001-02), 7.0% (2002-03), 11.0% (2003-04), 10.6% (2004-05), 10.3% (2005-06) and 17.2% (2006-07). NSDP at current prices in 2006-07 was recorded at Rs.9334 Crore against Rs.4484 Crore in 1999-00 revealing annual compound growth rate of 11.04%. However, year-wise growth in terms of percentages were 11.7% (2000-01), 6.8% (2001-02), 4.8% (2002-03), 14.1% (2003-04), 9.7% (2004-05), 14.2% (2005-06) and 16.6% (2006-07). NSDP at constant prices from this sector was recorded at Rs.9503 Crore in 2006-07 with 18.4% annual increase over the previous year. While annual increase for 2005-06 was 11.4%. The change in trend of this sub-sector is presented in the line graph given below:
1999-00 2000-01 2001-02 2002-03 2003-04 2004-05 2005-06 2006-07
At Current Prices At Constant Prices
14
13. FINANCIAL, INSURANCE, REAL ESTATE & BUSINESS SERVICES
(Rs. Crore)
Year Item
1999-00 2000-01 2001-02 2002-03 2003-04 2004-05 2005-06 2006-07
GSDP Current 17806 18652 21418 23874 27852 30500 34775 41508
GSDP Constant 17806 17806 19174 20483 21680 24354 26919 31541
NSDP Current 17032 17784 20392 22747 26565 28983 33056 39651
NSDP Constant 17032 16975 18254 19497 20597 23192 25674 30198
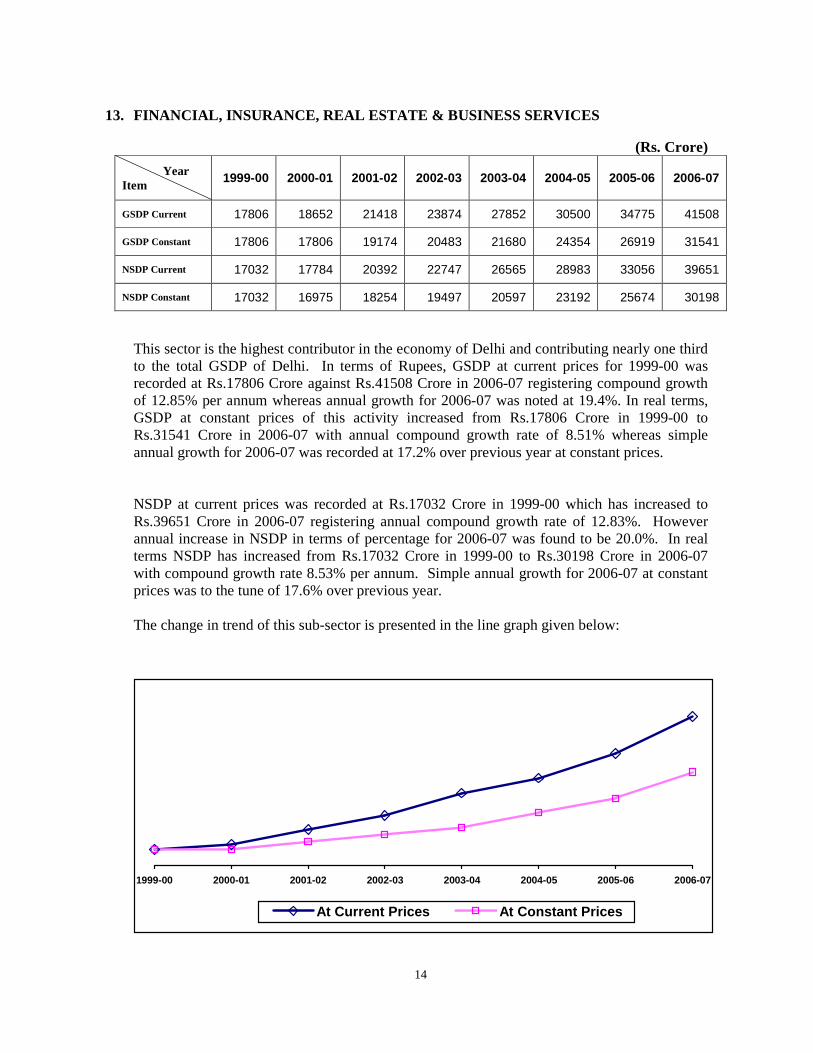
This sector is the highest contributor in the economy of Delhi and contributing nearly one third to the total GSDP of Delhi. In terms of Rupees, GSDP at current prices for 1999-00 was recorded at Rs.17806 Crore against Rs.41508 Crore in 2006-07 registering compound growth of 12.85% per annum whereas annual growth for 2006-07 was noted at 19.4%. In real terms, GSDP at constant prices of this activity increased from Rs.17806 Crore in 1999-00 to Rs.31541 Crore in 2006-07 with annual compound growth rate of 8.51% whereas simple annual growth for 2006-07 was recorded at 17.2% over previous year at constant prices. NSDP at current prices was recorded at Rs.17032 Crore in 1999-00 which has increased to Rs.39651 Crore in 2006-07 registering annual compound growth rate of 12.83%. However annual increase in NSDP in terms of percentage for 2006-07 was found to be 20.0%. In real terms NSDP has increased from Rs.17032 Crore in 1999-00 to Rs.30198 Crore in 2006-07 with compound growth rate 8.53% per annum. Simple annual growth for 2006-07 at constant prices was to the tune of 17.6% over previous year. The change in trend of this sub-sector is presented in the line graph given below:
1999-00 2000-01 2001-02 2002-03 2003-04 2004-05 2005-06 2006-07
At Current Prices At Constant Prices
15
14. COMMUNITY, SOCIAL & PERSONAL SERVICES
(Rs. Crore)
Year Item
1999-00 2000-01 2001-02 2002-03 2003-04 2004-05 2005-06 2006-07
GSDP Current 8966 9671 10124 10752 11396 13645 15127 16969
GSDP Constant 8966 9136 9258 9453 9711 10934 11363 11953
NSDP Current 8278 8886 9317 9869 10408 12337 13628 15308
NSDP Constant 8278 8373 8513 8661 8856 9889 10231 10759
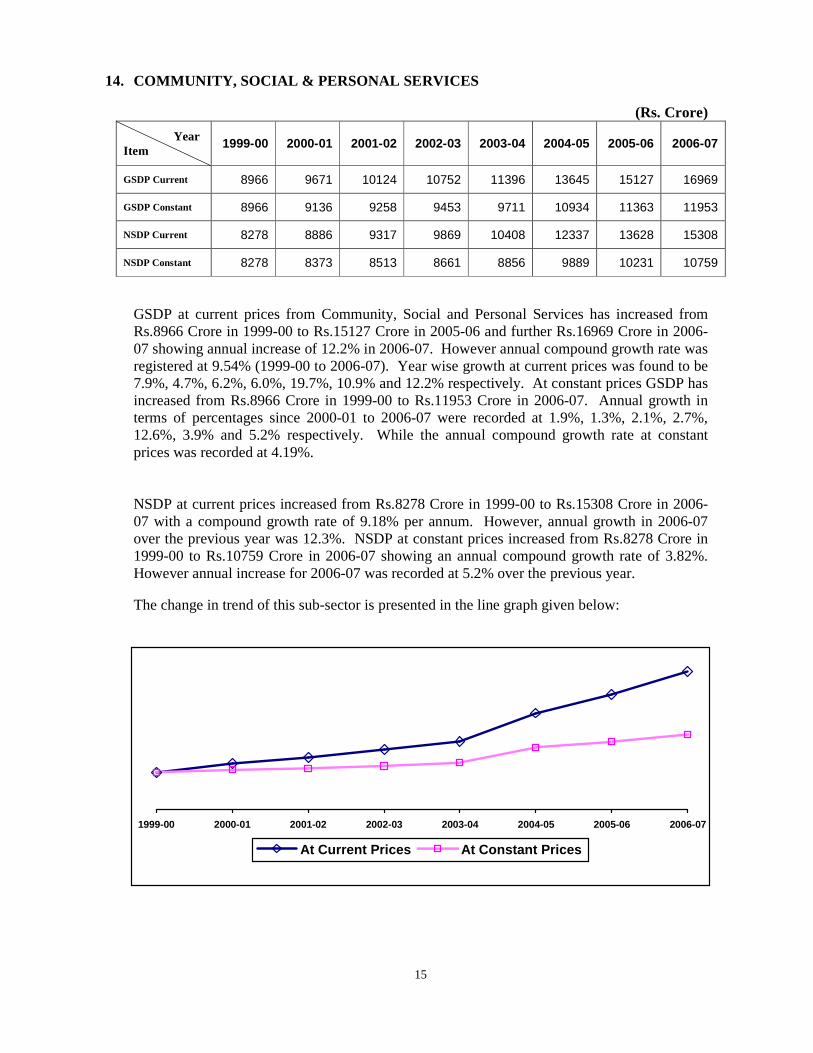
GSDP at current prices from Community, Social and Personal Services has increased from Rs.8966 Crore in 1999-00 to Rs.15127 Crore in 2005-06 and further Rs.16969 Crore in 2006-07 showing annual increase of 12.2% in 2006-07. However annual compound growth rate was registered at 9.54% (1999-00 to 2006-07). Year wise growth at current prices was found to be 7.9%, 4.7%, 6.2%, 6.0%, 19.7%, 10.9% and 12.2% respectively. At constant prices GSDP has increased from Rs.8966 Crore in 1999-00 to Rs.11953 Crore in 2006-07. Annual growth in terms of percentages since 2000-01 to 2006-07 were recorded at 1.9%, 1.3%, 2.1%, 2.7%, 12.6%, 3.9% and 5.2% respectively. While the annual compound growth rate at constant prices was recorded at 4.19%. NSDP at current prices increased from Rs.8278 Crore in 1999-00 to Rs.15308 Crore in 2006-07 with a compound growth rate of 9.18% per annum. However, annual growth in 2006-07 over the previous year was 12.3%. NSDP at constant prices increased from Rs.8278 Crore in 1999-00 to Rs.10759 Crore in 2006-07 showing an annual compound growth rate of 3.82%. However annual increase for 2006-07 was recorded at 5.2% over the previous year. The change in trend of this sub-sector is presented in the line graph given below:
1999-00 2000-01 2001-02 2002-03 2003-04 2004-05 2005-06 2006-07
At Current Prices At Constant Prices
.
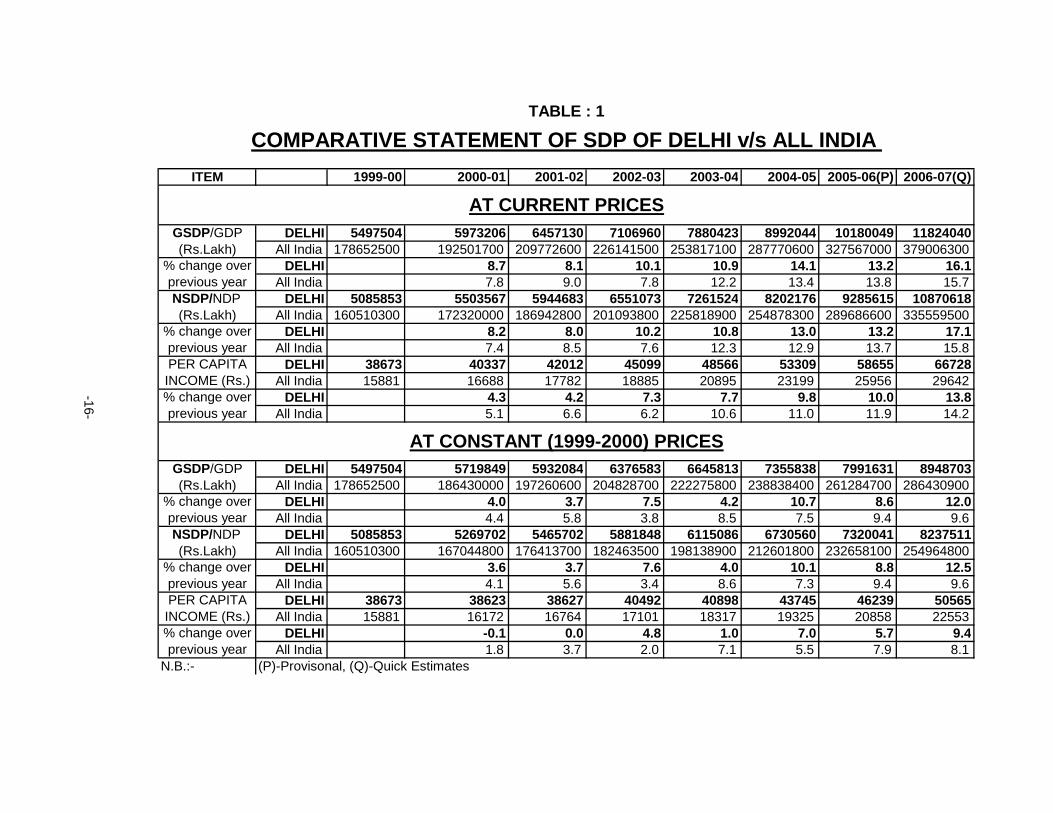
ITEM 1999-00 2000-01 2001-02 2002-03 2003-04 2004-05 2005-06(P) 2006-07(Q)
DELHI 5497504 5973206 6457130 7106960 7880423 8992044 10180049 11824040All India 178652500 192501700 209772600 226141500 253817100 287770600 327567000 379006300
DELHI 8.7 8.1 10.1 10.9 14.1 13.2 16.1All India 7.8 9.0 7.8 12.2 13.4 13.8 15.7
DELHI 5085853 5503567 5944683 6551073 7261524 8202176 9285615 10870618All India 160510300 172320000 186942800 201093800 225818900 254878300 289686600 335559500
DELHI 8.2 8.0 10.2 10.8 13.0 13.2 17.1All India 7.4 8.5 7.6 12.3 12.9 13.7 15.8
DELHI 38673 40337 42012 45099 48566 53309 58655 66728All India 15881 16688 17782 18885 20895 23199 25956 29642
DELHI 4.3 4.2 7.3 7.7 9.8 10.0 13.8All India 5.1 6.6 6.2 10.6 11.0 11.9 14.2
DELHI 5497504 5719849 5932084 6376583 6645813 7355838 7991631 8948703All India 178652500 186430000 197260600 204828700 222275800 238838400 261284700 286430900
DELHI 4.0 3.7 7.5 4.2 10.7 8.6 12.0All India 4.4 5.8 3.8 8.5 7.5 9.4 9.6
DELHI 5085853 5269702 5465702 5881848 6115086 6730560 7320041 8237511All India 160510300 167044800 176413700 182463500 198138900 212601800 232658100 254964800
DELHI 3.6 3.7 7.6 4.0 10.1 8.8 12.5All India 4.1 5.6 3.4 8.6 7.3 9.4 9.6
DELHI 38673 38623 38627 40492 40898 43745 46239 50565All India 15881 16172 16764 17101 18317 19325 20858 22553
DELHI -0.1 0.0 4.8 1.0 7.0 5.7 9.4All India 1.8 3.7 2.0 7.1 5.5 7.9 8.1
N.B.:- (P)-Provisonal, (Q)-Quick Estimates
% change over previous year
% change over previous yearNSDP/NDP (Rs.Lakh)
% change over previous yearPER CAPITA INCOME (Rs.)
-16-
% change over previous year
GSDP/GDP (Rs.Lakh)
AT CONSTANT (1999-2000) PRICES
% change over previous yearNSDP/NDP (Rs.Lakh)
% change over previous yearPER CAPITA INCOME (Rs.)
GSDP/GDP (Rs.Lakh)
TABLE : 1
COMPARATIVE STATEMENT OF SDP OF DELHI v/s ALL INDIA
AT CURRENT PRICES
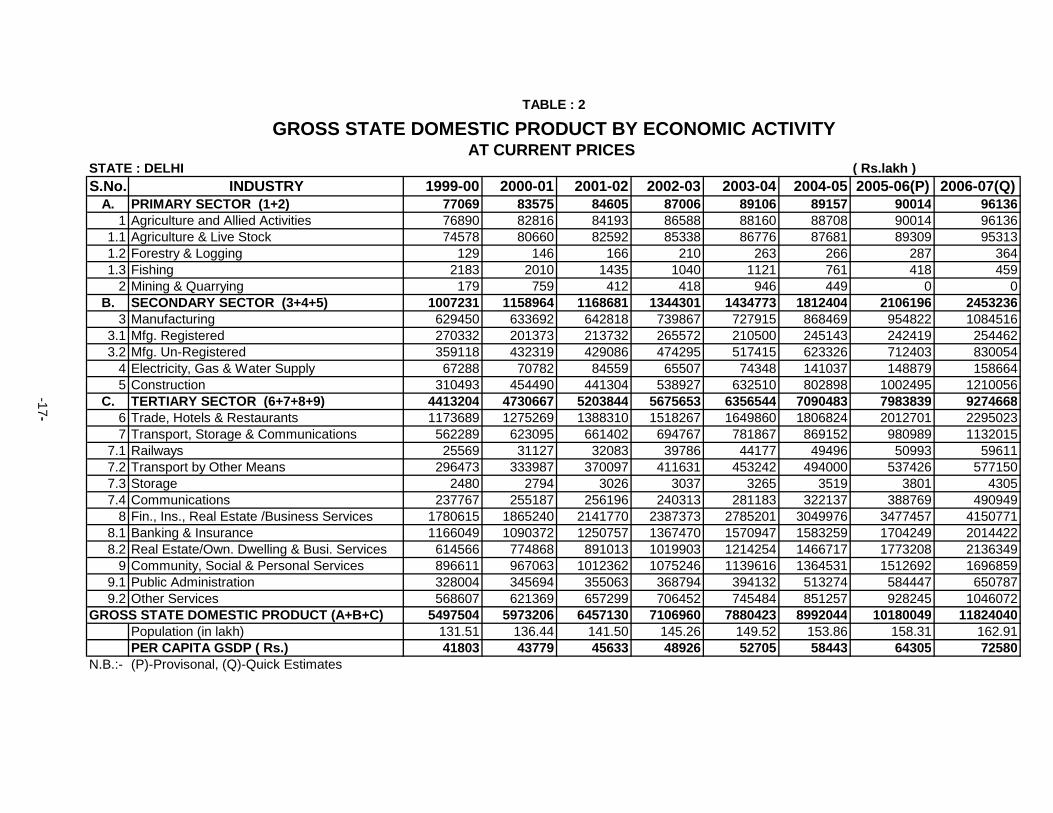
( Rs.lakh )S.No. INDUSTRY 1999-00 2000-01 2001-02 2002-03 2003-04 2004-05 2005-06(P) 2006-07(Q)
A. PRIMARY SECTOR (1+2) 77069 83575 84605 87006 89106 89157 90014 961361 Agriculture and Allied Activities 76890 82816 84193 86588 88160 88708 90014 96136
1.1 Agriculture & Live Stock 74578 80660 82592 85338 86776 87681 89309 953131.2 Forestry & Logging 129 146 166 210 263 266 287 3641.3 Fishing 2183 2010 1435 1040 1121 761 418 459
2 Mining & Quarrying 179 759 412 418 946 449 0 0B. SECONDARY SECTOR (3+4+5) 1007231 1158964 1168681 1344301 1434773 1812404 2106196 2453236
3 Manufacturing 629450 633692 642818 739867 727915 868469 954822 10845163.1 Mfg. Registered 270332 201373 213732 265572 210500 245143 242419 2544623.2 Mfg. Un-Registered 359118 432319 429086 474295 517415 623326 712403 830054
4 Electricity, Gas & Water Supply 67288 70782 84559 65507 74348 141037 148879 1586645 Construction 310493 454490 441304 538927 632510 802898 1002495 1210056
C. TERTIARY SECTOR (6+7+8+9) 4413204 4730667 5203844 5675653 6356544 7090483 7983839 92746686 Trade, Hotels & Restaurants 1173689 1275269 1388310 1518267 1649860 1806824 2012701 22950237 Transport, Storage & Communications 562289 623095 661402 694767 781867 869152 980989 1132015
7.1 Railways 25569 31127 32083 39786 44177 49496 50993 596117.2 Transport by Other Means 296473 333987 370097 411631 453242 494000 537426 5771507.3 Storage 2480 2794 3026 3037 3265 3519 3801 43057.4 Communications 237767 255187 256196 240313 281183 322137 388769 490949
8 Fin., Ins., Real Estate /Business Services 1780615 1865240 2141770 2387373 2785201 3049976 3477457 41507718.1 Banking & Insurance 1166049 1090372 1250757 1367470 1570947 1583259 1704249 20144228.2 Real Estate/Own. Dwelling & Busi. Services 614566 774868 891013 1019903 1214254 1466717 1773208 2136349
9 Community, Social & Personal Services 896611 967063 1012362 1075246 1139616 1364531 1512692 16968599.1 Public Administration 328004 345694 355063 368794 394132 513274 584447 6507879.2 Other Services 568607 621369 657299 706452 745484 851257 928245 1046072
5497504 5973206 6457130 7106960 7880423 8992044 10180049 11824040Population (in lakh) 131.51 136.44 141.50 145.26 149.52 153.86 158.31 162.91PER CAPITA GSDP ( Rs.) 41803 43779 45633 48926 52705 58443 64305 72580
N.B.:- (P)-Provisonal, (Q)-Quick Estimates
-17 -
GROSS STATE DOMESTIC PRODUCT (A+B+C)
STATE : DELHI
TABLE : 2
GROSS STATE DOMESTIC PRODUCT BY ECONOMIC ACTIVITYAT CURRENT PRICES
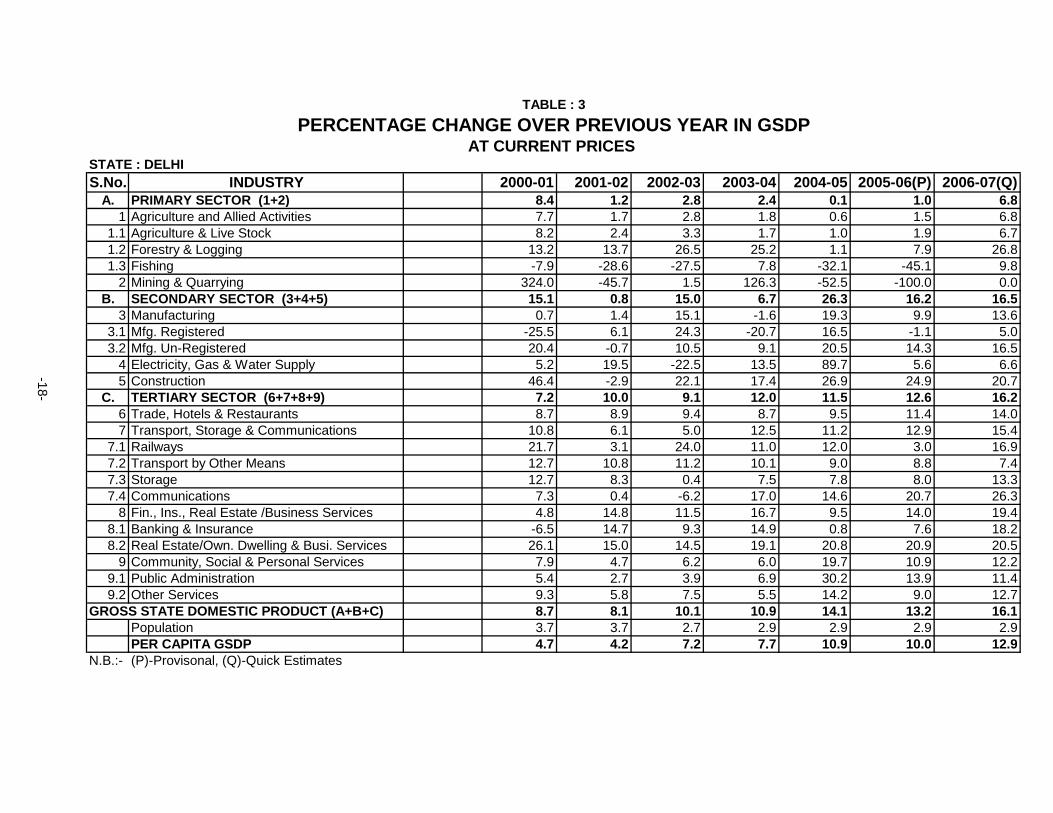
S.No. INDUSTRY 2000-01 2001-02 2002-03 2003-04 2004-05 2005-06(P) 2006-07(Q)A. PRIMARY SECTOR (1+2) 8.4 1.2 2.8 2.4 0.1 1.0 6.8
1 Agriculture and Allied Activities 7.7 1.7 2.8 1.8 0.6 1.5 6.81.1 Agriculture & Live Stock 8.2 2.4 3.3 1.7 1.0 1.9 6.71.2 Forestry & Logging 13.2 13.7 26.5 25.2 1.1 7.9 26.81.3 Fishing -7.9 -28.6 -27.5 7.8 -32.1 -45.1 9.8
2 Mining & Quarrying 324.0 -45.7 1.5 126.3 -52.5 -100.0 0.0B. SECONDARY SECTOR (3+4+5) 15.1 0.8 15.0 6.7 26.3 16.2 16.5
3 Manufacturing 0.7 1.4 15.1 -1.6 19.3 9.9 13.63.1 Mfg. Registered -25.5 6.1 24.3 -20.7 16.5 -1.1 5.03.2 Mfg. Un-Registered 20.4 -0.7 10.5 9.1 20.5 14.3 16.5
4 Electricity, Gas & Water Supply 5.2 19.5 -22.5 13.5 89.7 5.6 6.65 Construction 46.4 -2.9 22.1 17.4 26.9 24.9 20.7
C. TERTIARY SECTOR (6+7+8+9) 7.2 10.0 9.1 12.0 11.5 12.6 16.26 Trade, Hotels & Restaurants 8.7 8.9 9.4 8.7 9.5 11.4 14.07 Transport, Storage & Communications 10.8 6.1 5.0 12.5 11.2 12.9 15.4
7.1 Railways 21.7 3.1 24.0 11.0 12.0 3.0 16.97.2 Transport by Other Means 12.7 10.8 11.2 10.1 9.0 8.8 7.47.3 Storage 12.7 8.3 0.4 7.5 7.8 8.0 13.37.4 Communications 7.3 0.4 -6.2 17.0 14.6 20.7 26.3
8 Fin., Ins., Real Estate /Business Services 4.8 14.8 11.5 16.7 9.5 14.0 19.48.1 Banking & Insurance -6.5 14.7 9.3 14.9 0.8 7.6 18.28.2 Real Estate/Own. Dwelling & Busi. Services 26.1 15.0 14.5 19.1 20.8 20.9 20.5
9 Community, Social & Personal Services 7.9 4.7 6.2 6.0 19.7 10.9 12.29.1 Public Administration 5.4 2.7 3.9 6.9 30.2 13.9 11.49.2 Other Services 9.3 5.8 7.5 5.5 14.2 9.0 12.7
8.7 8.1 10.1 10.9 14.1 13.2 16.1Population 3.7 3.7 2.7 2.9 2.9 2.9 2.9PER CAPITA GSDP 4.7 4.2 7.2 7.7 10.9 10.0 12.9
N.B.:- (P)-Provisonal, (Q)-Quick Estimates
-18-
GROSS STATE DOMESTIC PRODUCT (A+B+C)
STATE : DELHI
TABLE : 3
PERCENTAGE CHANGE OVER PREVIOUS YEAR IN GSDPAT CURRENT PRICES

S.No. INDUSTRY 1999-00 2000-01 2001-02 2002-03 2003-04 2004-05 2005-06(P) 2006-07(Q)A. PRIMARY SECTOR (1+2) 1.40 1.39 1.31 1.22 1.12 0.99 0.88 0.81
1 Agriculture and Allied Activities 1.40 1.38 1.30 1.21 1.11 0.99 0.88 0.811.1 Agriculture & Live Stock 1.36 1.35 1.28 1.20 1.10 0.98 0.88 0.811.2 Forestry & Logging 0.00 0.00 0.00 0.00 0.00 0.00 0.00 0.001.3 Fishing 0.04 0.03 0.02 0.01 0.01 0.01 0.00 0.00
2 Mining & Quarrying 0.00 0.01 0.01 0.01 0.01 0.00 0.00 0.00B. SECONDARY SECTOR (3+4+5) 18.32 19.40 18.10 18.91 18.21 20.16 20.69 20.74
3 Manufacturing 11.45 10.61 9.96 10.41 9.24 9.66 9.38 9.173.1 Mfg. Registered 4.92 3.37 3.31 3.74 2.67 2.73 2.38 2.153.2 Mfg. Un-Registered 6.53 7.24 6.65 6.67 6.57 6.93 7.00 7.02
4 Electricity, Gas & Water Supply 1.22 1.18 1.31 0.92 0.94 1.57 1.46 1.345 Construction 5.65 7.61 6.83 7.58 8.03 8.93 9.85 10.23
C. TERTIARY SECTOR (6+7+8+9) 80.28 79.19 80.60 79.85 80.66 78.85 78.43 78.446 Trade, Hotels & Restaurants 21.35 21.35 21.50 21.36 20.94 20.09 19.77 19.417 Transport, Storage & Communications 10.23 10.43 10.25 9.77 9.92 9.66 9.64 9.57
7.1 Railways 0.47 0.52 0.50 0.56 0.56 0.55 0.50 0.507.2 Transport by Other Means 5.39 5.59 5.73 5.79 5.75 5.49 5.28 4.887.3 Storage 0.05 0.05 0.05 0.04 0.04 0.04 0.04 0.047.4 Communications 4.32 4.27 3.97 3.38 3.57 3.58 3.82 4.15
8 Fin., Ins., Real Estate /Business Services 32.39 31.22 33.17 33.59 35.34 33.92 34.16 35.118.1 Banking & Insurance 21.21 18.25 19.37 19.24 19.93 17.61 16.74 17.048.2 Real Estate/Own. Dwelling & Busi. Services 11.18 12.97 13.80 14.35 15.41 16.31 17.42 18.07
9 Community, Social & Personal Services 16.31 16.19 15.68 15.13 14.46 15.18 14.86 14.359.1 Public Administration 5.97 5.79 5.50 5.19 5.00 5.71 5.74 5.509.2 Other Services 10.34 10.40 10.18 9.94 9.46 9.47 9.12 8.85
100 100 100 100 100 100 100 100N.B.:- (P)-Provisonal, (Q)-Quick Estimates
STATE : DELHI
-19-
GROSS STATE DOMESTIC PRODUCT (A+B+C)
AT CURRENT PRICES
TABLE : 4
PERCENTAGE DISTRIBUTION OF GSDP BY ECONOMIC ACTIVITY
( Rs.lakh )S.No. INDUSTRY 1999-00 2000-01 2001-02 2002-03 2003-04 2004-05 2005-06(P) 2006-07(Q)
A. PRIMARY SECTOR (1+2) 77069 79016 77484 76278 77495 77304 72854 732281 Agriculture and Allied Activities 76890 78141 76896 75644 76344 76736 72854 73228
1.1 Agriculture & Live Stock 74578 75975 75106 74291 75015 75760 72236 725891.2 Forestry & Logging 129 145 166 211 263 261 262 2801.3 Fishing 2183 2021 1624 1142 1066 715 356 359
2 Mining & Quarrying 179 875 588 634 1151 568 0 0B. SECONDARY SECTOR (3+4+5) 1007231 1111755 1077524 1241582 1243144 1450776 1616670 1769186
3 Manufacturing 629450 600602 599894 677470 631901 704368 746616 8071833.1 Mfg. Registered 270332 194060 202705 246095 185243 201027 190792 1905113.2 Mfg. Un-Registered 359118 406542 397189 431375 446658 503341 555824 616672
4 Electricity, Gas & Water Supply 67288 73171 78084 81700 87233 98692 101366 1059125 Construction 310493 437982 399546 482412 524010 647716 768688 856091
C. TERTIARY SECTOR (6+7+8+9) 4413204 4529078 4777076 5058723 5325174 5827758 6302107 71062896 Trade, Hotels & Restaurants 1173689 1203829 1279357 1364942 1408981 1439903 1526693 16472677 Transport, Storage & Communications 562289 631030 654534 700159 777059 859082 947237 1109700
7.1 Railways 25569 31930 31447 37645 40628 43168 46492 506767.2 Transport by Other Means 296473 317931 344889 371660 386584 401905 422211 4382597.3 Storage 2480 2611 2750 2653 2770 2785 2779 29537.4 Communications 237767 278558 275448 288201 347077 411224 475755 617812
8 Fin., Ins., Real Estate /Business Services 1780615 1780595 1917426 2048314 2168032 2435417 2691869 31540588.1 Banking & Insurance 1166049 1068266 1130924 1188455 1206458 1338407 1451168 17370488.2 Real Estate/Own. Dwelling & Busi. Services 614566 712329 786502 859859 961574 1097010 1240701 1417010
9 Community, Social & Personal Services 896611 913624 925759 945308 971102 1093356 1136308 11952649.1 Public Administration 328004 331828 327178 326773 337212 418124 455151 4759719.2 Other Services 568607 581796 598581 618535 633890 675232 681157 719293
5497504 5719849 5932084 6376583 6645813 7355838 7991631 8948703Population (in lakh) 131.51 136.44 141.50 145.26 149.52 153.86 158.31 162.91PER CAPITA GSDP ( Rs.) 41803 41922 41923 43898 44448 47809 50481 54930
N.B.:- (P)-Provisonal, (Q)-Quick Estimates
-20-
GROSS STATE DOMESTIC PRODUCT (A+B+C)
STATE : DELHI
TABLE : 5
GROSS STATE DOMESTIC PRODUCT BY ECONOMIC ACTIVITYAT CONSTANT (1999-00) PRICES

S.No. INDUSTRY 2000-01 2001-02 2002-03 2003-04 2004-05 2005-06(P) 2006-07(Q)A. PRIMARY SECTOR (1+2) 2.5 -1.9 -1.6 1.6 -0.2 -5.8 0.5
1 Agriculture and Allied Activities 1.6 -1.6 -1.6 0.9 0.5 -5.1 0.51.1 Agriculture & Live Stock 1.9 -1.1 -1.1 1.0 1.0 -4.7 0.51.2 Forestry & Logging 12.4 14.5 27.1 24.6 -0.8 0.4 6.91.3 Fishing -7.4 -19.6 -29.7 -6.7 -32.9 -50.2 0.8
2 Mining & Quarrying 388.8 -32.8 7.8 81.5 -50.7 -100.0 0.0B. SECONDARY SECTOR (3+4+5) 10.4 -3.1 15.2 0.1 16.7 11.4 9.4
3 Manufacturing -4.6 -0.1 12.9 -6.7 11.5 6.0 8.13.1 Mfg. Registered -28.2 4.5 21.4 -24.7 8.5 -5.1 -0.13.2 Mfg. Un-Registered 13.2 -2.3 8.6 3.5 12.7 10.4 10.9
4 Electricity, Gas & Water Supply 8.7 6.7 4.6 6.8 13.1 2.7 4.55 Construction 41.1 -8.8 20.7 8.6 23.6 18.7 11.4
C. TERTIARY SECTOR (6+7+8+9) 2.6 5.5 5.9 5.3 9.4 8.1 12.86 Trade, Hotels & Restaurants 2.6 6.3 6.7 3.2 2.2 6.0 7.97 Transport, Storage & Communications 12.2 3.7 7.0 11.0 10.6 10.3 17.2
7.1 Railways 24.9 -1.5 19.7 7.9 6.3 7.7 9.07.2 Transport by Other Means 7.2 8.5 7.8 4.0 4.0 5.1 3.87.3 Storage 5.3 5.3 -3.5 4.4 0.5 -0.2 6.37.4 Communications 17.2 -1.1 4.6 20.4 18.5 15.7 29.9
8 Fin., Ins., Real Estate /Business Services 0.0 7.7 6.8 5.8 12.3 10.5 17.28.1 Banking & Insurance -8.4 5.9 5.1 1.5 10.9 8.4 19.78.2 Real Estate/Own. Dwelling & Busi. Services 15.9 10.4 9.3 11.8 14.1 13.1 14.2
9 Community, Social & Personal Services 1.9 1.3 2.1 2.7 12.6 3.9 5.29.1 Public Administration 1.2 -1.4 -0.1 3.2 24.0 8.9 4.69.2 Other Services 2.3 2.9 3.3 2.5 6.5 0.9 5.6
4.0 3.7 7.5 4.2 10.7 8.6 12.0Population 3.7 3.7 2.7 2.9 2.9 2.9 2.9PER CAPITA GSDP 0.3 0.0 4.7 1.3 7.6 5.6 8.8
N.B.:- (P)-Provisonal, (Q)-Quick Estimates
-21-
GROSS STATE DOMESTIC PRODUCT (A+B+C)
STATE : DELHI
TABLE : 6
PERCENTAGE CHANGE OVER PREVIOUS YEAR IN GSDPAT CONSTANT (1999-00) PRICES
S.No. INDUSTRY 1999-00 2000-01 2001-02 2002-03 2003-04 2004-05 2005-06(P) 2006-07(Q)A. PRIMARY SECTOR (1+2) 1.40 1.39 1.31 1.20 1.17 1.05 0.90 0.81
1 Agriculture and Allied Activities 1.40 1.37 1.30 1.19 1.15 1.04 0.90 0.811.1 Agriculture & Live Stock 1.36 1.33 1.27 1.17 1.13 1.03 0.90 0.811.2 Forestry & Logging 0.00 0.00 0.00 0.00 0.00 0.00 0.00 0.001.3 Fishing 0.04 0.04 0.03 0.02 0.02 0.01 0.00 0.00
2 Mining & Quarrying 0.00 0.02 0.01 0.01 0.02 0.01 0.00 0.00B. SECONDARY SECTOR (3+4+5) 18.32 19.44 18.18 19.47 18.70 19.72 20.24 19.77
3 Manufacturing 11.45 10.50 10.12 10.62 9.51 9.57 9.35 9.023.1 Mfg. Registered 4.92 3.39 3.42 3.86 2.79 2.73 2.39 2.133.2 Mfg. Un-Registered 6.53 7.11 6.70 6.76 6.72 6.84 6.96 6.89
4 Electricity, Gas & Water Supply 1.22 1.28 1.32 1.28 1.31 1.34 1.27 1.185 Construction 5.65 7.66 6.74 7.57 7.88 8.81 9.62 9.57
C. TERTIARY SECTOR (6+7+8+9) 80.28 79.19 80.53 79.33 80.12 79.22 78.85 79.416 Trade, Hotels & Restaurants 21.35 21.05 21.57 21.41 21.20 19.57 19.10 18.417 Transport, Storage & Communications 10.23 11.04 11.03 10.98 11.69 11.68 11.84 12.40
7.1 Railways 0.47 0.56 0.53 0.59 0.61 0.59 0.58 0.577.2 Transport by Other Means 5.39 5.56 5.81 5.83 5.82 5.46 5.28 4.907.3 Storage 0.05 0.05 0.05 0.04 0.04 0.04 0.03 0.037.4 Communications 4.32 4.87 4.64 4.52 5.22 5.59 5.95 6.90
8 Fin., Ins., Real Estate /Business Services 32.39 31.13 32.32 32.12 32.62 33.11 33.69 35.248.1 Banking & Insurance 21.21 18.68 19.06 18.64 18.15 18.20 18.16 19.418.2 Real Estate/Own. Dwelling & Busi. Services 11.18 12.45 13.26 13.48 14.47 14.91 15.53 15.83
9 Community, Social & Personal Services 16.31 15.97 15.61 14.82 14.61 14.86 14.22 13.369.1 Public Administration 5.97 5.80 5.52 5.12 5.07 5.68 5.70 5.329.2 Other Services 10.34 10.17 10.09 9.70 9.54 9.18 8.52 8.04
100 100 100 100 100 100 100 100N.B.:- (P)-Provisonal, (Q)-Quick Estimates
STATE : DELHI
-22-
GROSS STATE DOMESTIC PRODUCT (A+B+C)
AT CONSTANT (1999-00) PRICES
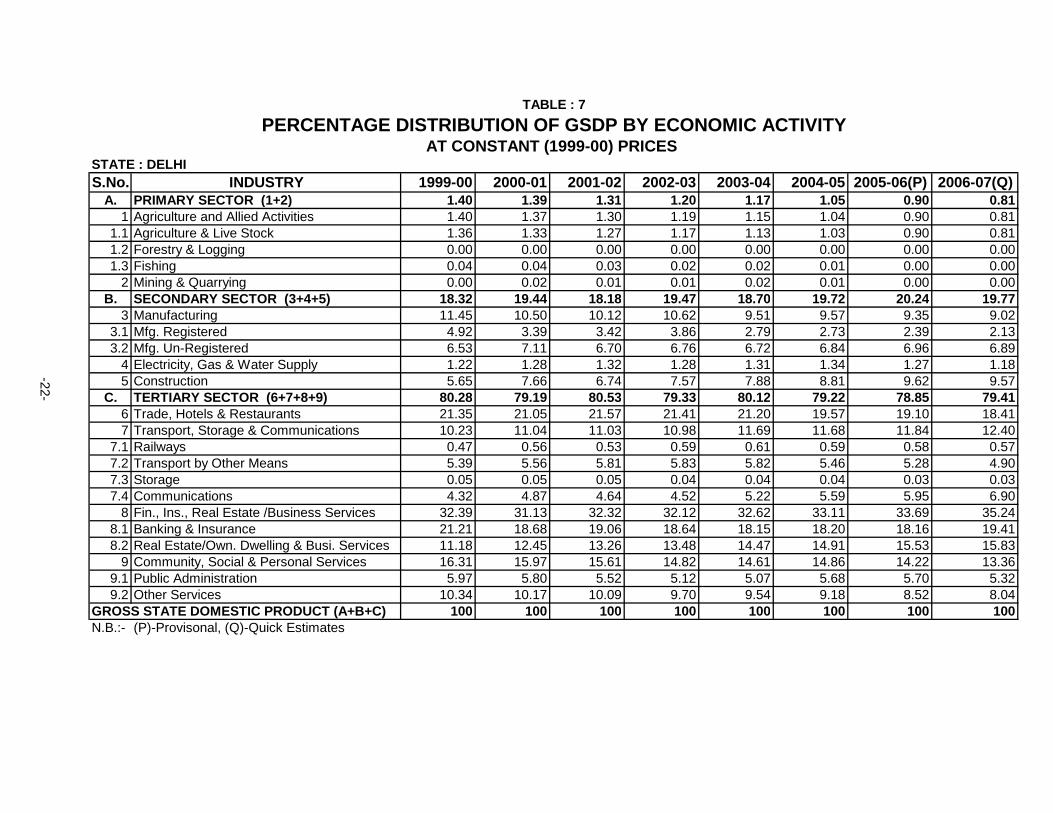
TABLE : 7
PERCENTAGE DISTRIBUTION OF GSDP BY ECONOMIC ACTIVITY
( Rs.lakh )S.No. INDUSTRY 1999-00 2000-01 2001-02 2002-03 2003-04 2004-05 2005-06(P) 2006-07(Q)
A. PRIMARY SECTOR (1+2) 76334 82679 83687 86080 88022 88059 88864 949181 Agriculture and Allied Activities 76192 82070 83358 85730 87232 87692 88864 94918
1.1 Agriculture & Live Stock 74103 80133 81983 84658 86030 86815 88326 942811.2 Forestry & Logging 125 141 155 198 250 253 273 3461.3 Fishing 1964 1796 1220 874 952 624 265 291
2 Mining & Quarrying 142 609 329 350 790 367 0 0B. SECONDARY SECTOR (3+4+5) 885616 1011522 1004926 1164918 1233662 1524200 1771494 2111185
3 Manufacturing 528329 518971 515948 600662 567545 675091 727745 8514553.1 Mfg. Registered 248451 176508 185905 235521 177256 206434 196862 2078523.2 Mfg. Un-Registered 279878 342463 330043 365141 390289 468657 530883 643603
4 Electricity, Gas & Water Supply 56412 52378 63194 44347 55298 71157 70694 813095 Construction 300875 440173 425784 519909 610819 777952 973055 1178421
C. TERTIARY SECTOR (6+7+8+9) 4123903 4409366 4856070 5300075 5939840 6589917 7425257 86645156 Trade, Hotels & Restaurants 1144491 1241549 1350300 1477854 1603153 1756677 1956058 22352057 Transport, Storage & Communications 448432 500849 534849 560619 639399 701263 800833 933386
7.1 Railways 21733 26827 27348 34497 37911 41810 42634 512467.2 Transport by Other Means 238591 265010 295912 330587 367007 393627 432201 4641807.3 Storage 2302 2599 2805 2806 2986 3139 3471 39757.4 Communications 185806 206413 208784 192729 231495 262687 322527 413985
8 Fin., Ins., Real Estate /Business Services 1703206 1778402 2039242 2274723 2656533 2898269 3305571 39651058.1 Banking & Insurance 1132235 1054441 1211442 1328267 1527895 1535039 1650496 19558388.2 Real Estate/Own. Dwelling & Busi. Services 570971 723961 827800 946456 1128638 1363230 1655075 2009267
9 Community, Social & Personal Services 827774 888566 931679 986879 1040755 1233708 1362795 15308199.1 Public Administration 273790 282982 294950 305148 324986 427939 484186 5381949.2 Other Services 553984 605584 636729 681731 715769 805769 878609 992625
5085853 5503567 5944683 6551073 7261524 8202176 9285615 10870618Population (in lakh) 131.51 136.44 141.50 145.26 149.52 153.86 158.31 162.91PER CAPITA INCOME ( Rs.) 38673 40337 42012 45099 48566 53309 58655 66728
N.B.:- (P)-Provisonal, (Q)-Quick Estimates
-23-
NET STATE DOMESTIC PRODUCT (A+B+C)
STATE : DELHI
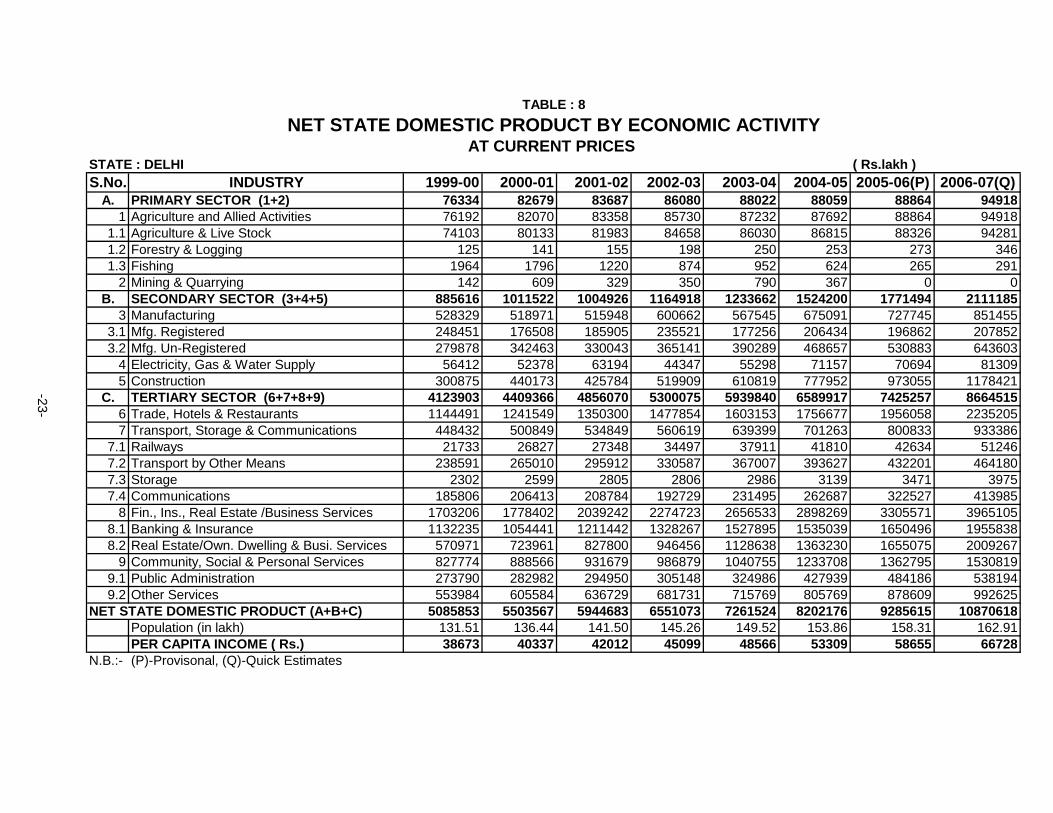
TABLE : 8
NET STATE DOMESTIC PRODUCT BY ECONOMIC ACTIVITYAT CURRENT PRICES
S.No. INDUSTRY 2000-01 2001-02 2002-03 2003-04 2004-05 2005-06(P) 2006-07(Q)A. PRIMARY SECTOR (1+2) 8.3 1.2 2.9 2.3 0.0 0.9 6.8
1 Agriculture and Allied Activities 7.7 1.6 2.8 1.8 0.5 1.3 6.81.1 Agriculture & Live Stock 8.1 2.3 3.3 1.6 0.9 1.7 6.71.2 Forestry & Logging 12.8 9.9 27.7 26.3 1.2 7.9 26.71.3 Fishing -8.6 -32.1 -28.4 8.9 -34.5 -57.5 9.8
2 Mining & Quarrying 328.9 -46.0 6.4 125.7 -53.5 -100.0 0.0B. SECONDARY SECTOR (3+4+5) 14.2 -0.7 15.9 5.9 23.6 16.2 19.2
3 Manufacturing -1.8 -0.6 16.4 -5.5 18.9 7.8 17.03.1 Mfg. Registered -29.0 5.3 26.7 -24.7 16.5 -4.6 5.63.2 Mfg. Un-Registered 22.4 -3.6 10.6 6.9 20.1 13.3 21.2
4 Electricity, Gas & Water Supply -7.2 20.6 -29.8 24.7 28.7 -0.7 15.05 Construction 46.3 -3.3 22.1 17.5 27.4 25.1 21.1
STATE : DELHI
-24-
AT CURRENT PRICES
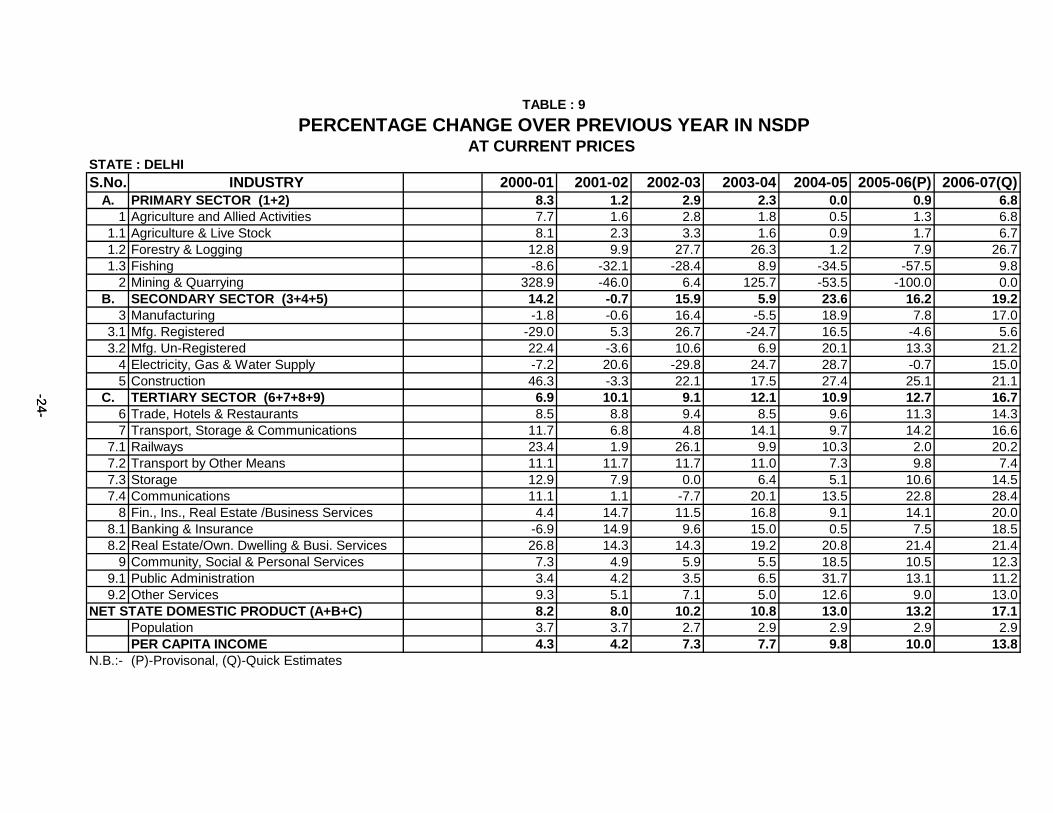
TABLE : 9
PERCENTAGE CHANGE OVER PREVIOUS YEAR IN NSDP
C. TERTIARY SECTOR (6+7+8+9) 6.9 10.1 9.1 12.1 10.9 12.7 16.76 Trade, Hotels & Restaurants 8.5 8.8 9.4 8.5 9.6 11.3 14.37 Transport, Storage & Communications 11.7 6.8 4.8 14.1 9.7 14.2 16.6
7.1 Railways 23.4 1.9 26.1 9.9 10.3 2.0 20.27.2 Transport by Other Means 11.1 11.7 11.7 11.0 7.3 9.8 7.47.3 Storage 12.9 7.9 0.0 6.4 5.1 10.6 14.57.4 Communications 11.1 1.1 -7.7 20.1 13.5 22.8 28.4
8 Fin., Ins., Real Estate /Business Services 4.4 14.7 11.5 16.8 9.1 14.1 20.08.1 Banking & Insurance -6.9 14.9 9.6 15.0 0.5 7.5 18.58.2 Real Estate/Own. Dwelling & Busi. Services 26.8 14.3 14.3 19.2 20.8 21.4 21.4
9 Community, Social & Personal Services 7.3 4.9 5.9 5.5 18.5 10.5 12.39.1 Public Administration 3.4 4.2 3.5 6.5 31.7 13.1 11.29.2 Other Services 9.3 5.1 7.1 5.0 12.6 9.0 13.0
8.2 8.0 10.2 10.8 13.0 13.2 17.1Population 3.7 3.7 2.7 2.9 2.9 2.9 2.9PER CAPITA INCOME 4.3 4.2 7.3 7.7 9.8 10.0 13.8
N.B.:- (P)-Provisonal, (Q)-Quick Estimates
-24-
NET STATE DOMESTIC PRODUCT (A+B+C)
S.No. INDUSTRY 1999-00 2000-01 2001-02 2002-03 2003-04 2004-05 2005-06(P) 2006-07(Q)A. PRIMARY SECTOR (1+2) 1.50 1.50 1.41 1.31 1.20 1.07 0.95 0.87
1 Agriculture and Allied Activities 1.50 1.49 1.40 1.30 1.19 1.07 0.95 0.871.1 Agriculture & Live Stock 1.46 1.46 1.38 1.29 1.18 1.06 0.95 0.871.2 Forestry & Logging 0.00 0.00 0.00 0.00 0.00 0.00 0.00 0.001.3 Fishing 0.04 0.03 0.02 0.01 0.01 0.01 0.00 0.00
2 Mining & Quarrying 0.00 0.01 0.01 0.01 0.01 0.00 0.00 0.00B. SECONDARY SECTOR (3+4+5) 17.42 18.38 16.90 17.79 16.98 18.58 19.08 19.42
3 Manufacturing 10.39 9.43 8.68 9.17 7.81 8.23 7.84 7.833.1 Mfg. Registered 4.89 3.21 3.13 3.60 2.44 2.52 2.12 1.913.2 Mfg. Un-Registered 5.50 6.22 5.55 5.57 5.37 5.71 5.72 5.92
4 Electricity, Gas & Water Supply 1.11 0.95 1.06 0.68 0.76 0.87 0.76 0.755 Construction 5.92 8.00 7.16 7.94 8.41 9.48 10.48 10.84
C. TERTIARY SECTOR (6+7+8+9) 81.08 80.12 81.69 80.92 81.80 80.35 79.95 79.706 Trade, Hotels & Restaurants 22.50 22.56 22.71 22.56 22.08 21.42 21.07 20.567 Transport, Storage & Communications 8.82 9.11 9.00 8.56 8.80 8.55 8.62 8.59
7.1 Railways 0.43 0.49 0.46 0.53 0.52 0.51 0.46 0.477.2 Transport by Other Means 4.69 4.82 4.98 5.05 5.05 4.80 4.65 4.277.3 Storage 0.05 0.05 0.05 0.04 0.04 0.04 0.04 0.047.4 Communications 3.65 3.75 3.51 2.94 3.19 3.20 3.47 3.81
8 Fin., Ins., Real Estate /Business Services 33.49 32.31 34.31 34.73 36.58 35.34 35.59 36.478.1 Banking & Insurance 22.26 19.16 20.38 20.28 21.04 18.72 17.77 17.998.2 Real Estate/Own. Dwelling & Busi. Services 11.23 13.15 13.93 14.45 15.54 16.62 17.82 18.48
9 Community, Social & Personal Services 16.27 16.14 15.67 15.07 14.34 15.04 14.67 14.089.1 Public Administration 5.38 5.14 4.96 4.66 4.48 5.22 5.21 4.959.2 Other Services 10.89 11.00 10.71 10.41 9.86 9.82 9.46 9.13
100 100 100 100 100 100 100 100N.B.:- (P)-Provisonal, (Q)-Quick Estimates
-25-
NET STATE DOMESTIC PRODUCT (A+B+C)
STATE : DELHI
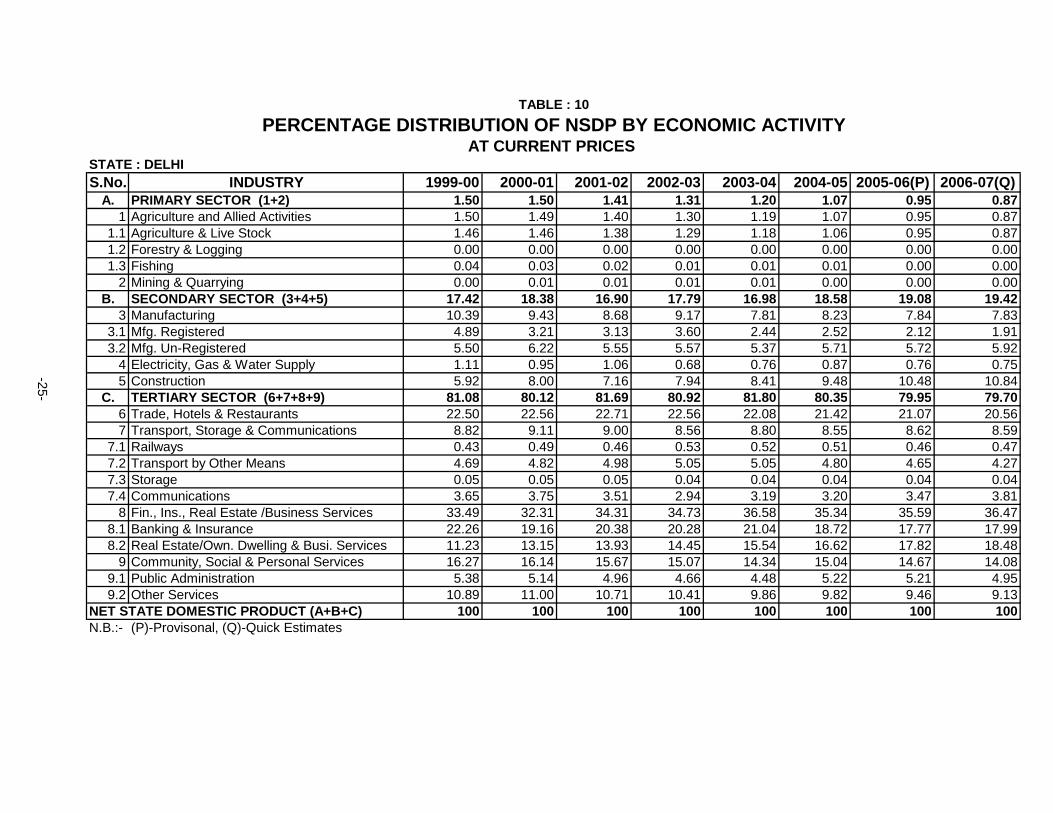
TABLE : 10
PERCENTAGE DISTRIBUTION OF NSDP BY ECONOMIC ACTIVITYAT CURRENT PRICES
( Rs.lakh )S.No. INDUSTRY 1999-00 2000-01 2001-02 2002-03 2003-04 2004-05 2005-06(P) 2006-07(Q)
A. PRIMARY SECTOR (1+2) 76334 78143 76639 75446 76554 76424 71980 723531 Agriculture and Allied Activities 76192 77414 76127 74872 75537 75921 71980 72353
1.1 Agriculture & Live Stock 74103 75459 74542 73681 74367 75069 71496 718491.2 Forestry & Logging 125 140 156 200 252 250 251 2681.3 Fishing 1964 1815 1429 991 918 602 233 236
2 Mining & Quarrying 142 729 512 574 1017 503 0 0B. SECONDARY SECTOR (3+4+5) 885616 970890 929394 1082949 1073297 1225999 1371492 1517292
3 Manufacturing 528329 491103 485372 554733 497525 555831 583313 6396753.1 Mfg. Registered 248451 170478 177522 219292 156418 169587 155655 1553743.2 Mfg. Un-Registered 279878 320625 307850 335441 341107 386244 427658 484301
4 Electricity, Gas & Water Supply 56412 55374 58565 62880 70841 43049 42653 467935 Construction 300875 424413 385457 465336 504931 627119 745526 830824
C. TERTIARY SECTOR (6+7+8+9) 4123903 4220669 4459669 4723453 4965235 5428137 5876569 66478666 Trade, Hotels & Restaurants 1144491 1171908 1244889 1328745 1368778 1399840 1483792 16018277 Transport, Storage & Communications 448432 513886 538080 578900 651158 720197 802250 950265
7.1 Railways 21733 27757 26922 32773 35664 38112 41326 453767.2 Transport by Other Means 238591 252585 276650 297780 308634 315529 332007 3427427.3 Storage 2302 2426 2550 2452 2536 2491 2538 27127.4 Communications 185806 231118 231958 245895 304324 364065 426379 559435
8 Fin., Ins., Real Estate /Business Services 1703206 1697529 1825382 1949736 2059725 2319160 2567437 30198388.1 Banking & Insurance 1132235 1034166 1095325 1153532 1169350 1299643 1410308 16937808.2 Real Estate/Own. Dwelling & Busi. Services 570971 663363 730057 796204 890375 1019517 1157129 1326058
9 Community, Social & Personal Services 827774 837346 851318 866072 885574 988940 1023090 10759369.1 Public Administration 273790 270663 271478 269566 276920 349230 378472 3952289.2 Other Services 553984 566683 579840 596506 608654 639710 644618 680708
5085853 5269702 5465702 5881848 6115086 6730560 7320041 8237511Population (in lakh) 131.51 136.44 141.50 145.26 149.52 153.86 158.31 162.91PER CAPITA INCOME ( Rs.) 38673 38623 38627 40492 40898 43745 46239 50565
N.B.:- (P)-Provisonal, (Q)-Quick Estimates
-26-
NET STATE DOMESTIC PRODUCT (A+B+C)
STATE : DELHI
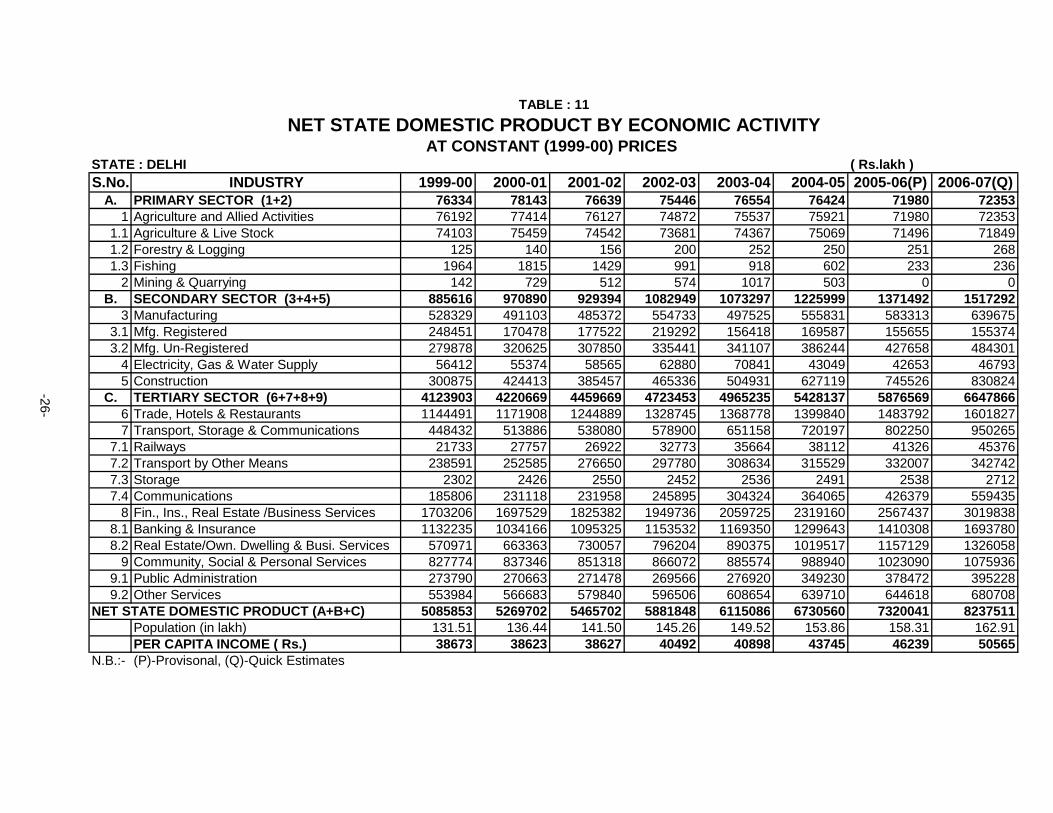
TABLE : 11
NET STATE DOMESTIC PRODUCT BY ECONOMIC ACTIVITYAT CONSTANT (1999-00) PRICES
S.No. INDUSTRY 2000-01 2001-02 2002-03 2003-04 2004-05 2005-06(P) 2006-07(Q)A. PRIMARY SECTOR (1+2) 2.4 -1.9 -1.6 1.5 -0.2 -5.8 0.5
1 Agriculture and Allied Activities 1.6 -1.7 -1.6 0.9 0.5 -5.2 0.51.1 Agriculture & Live Stock 1.8 -1.2 -1.2 0.9 0.9 -4.8 0.51.2 Forestry & Logging 12.0 11.4 28.2 26.0 -0.8 0.4 6.81.3 Fishing -7.6 -21.3 -30.7 -7.4 -34.4 -61.3 1.3
2 Mining & Quarrying 413.4 -29.8 12.1 77.2 -50.5 -100.0 0.0B. SECONDARY SECTOR (3+4+5) 9.6 -4.3 16.5 -0.9 14.2 11.9 10.6
3 Manufacturing -7.0 -1.2 14.3 -10.3 11.7 4.9 9.73.1 Mfg. Registered -31.4 4.1 23.5 -28.7 8.4 -8.2 -0.23.2 Mfg. Un-Registered 14.6 -4.0 9.0 1.7 13.2 10.7 13.2
4 Electricity, Gas & Water Supply -1.8 5.8 7.4 12.7 -39.2 -0.9 9.75 Construction 41.1 -9.2 20.7 8.5 24.2 18.9 11.4
C. TERTIARY SECTOR (6+7+8+9) 2.3 5.7 5.9 5.1 9.3 8.3 13.16 Trade, Hotels & Restaurants 2.4 6.2 6.7 3.0 2.3 6.0 8.07 Transport, Storage & Communications 14.6 4.7 7.6 12.5 10.6 11.4 18.4
7.1 Railways 27.7 -3.0 21.7 8.8 6.9 8.4 9.87.2 Transport by Other Means 5.9 9.5 7.6 3.6 2.2 5.2 3.27.3 Storage 5.4 5.1 -3.8 3.4 -1.8 1.9 6.97.4 Communications 24.4 0.4 6.0 23.8 19.6 17.1 31.2
8 Fin., Ins., Real Estate /Business Services -0.3 7.5 6.8 5.6 12.6 10.7 17.68.1 Banking & Insurance -8.7 5.9 5.3 1.4 11.1 8.5 20.18.2 Real Estate/Own. Dwelling & Busi. Services 16.2 10.1 9.1 11.8 14.5 13.5 14.6
9 Community, Social & Personal Services 1.2 1.7 1.7 2.3 11.7 3.5 5.29.1 Public Administration -1.1 0.3 -0.7 2.7 26.1 8.4 4.49.2 Other Services 2.3 2.3 2.9 2.0 5.1 0.8 5.6
3.6 3.7 7.6 4.0 10.1 8.8 12.5Population 3.7 3.7 2.7 2.9 2.9 2.9 2.9PER CAPITA INCOME -0.1 0.0 4.8 1.0 7.0 5.7 9.4
N.B.:- (P)-Provisonal, (Q)-Quick Estimates
STATE : DELHI
-27-
NET STATE DOMESTIC PRODUCT (A+B+C)
AT CONSTANT (1999-00) PRICES
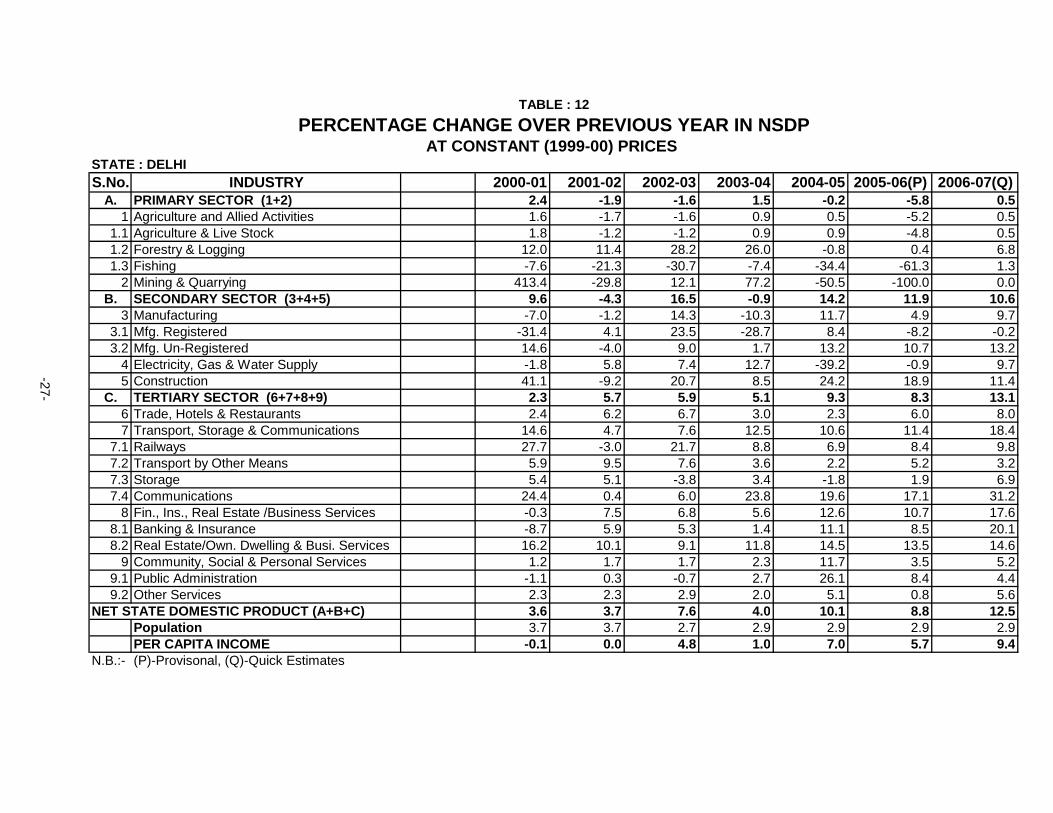
TABLE : 12
PERCENTAGE CHANGE OVER PREVIOUS YEAR IN NSDP
S.No. INDUSTRY 1999-00 2000-01 2001-02 2002-03 2003-04 2004-05 2005-06(P) 2006-07(Q)A. PRIMARY SECTOR (1+2) 1.50 1.47 1.40 1.28 1.26 1.14 0.98 0.87
1 Agriculture and Allied Activities 1.50 1.46 1.39 1.27 1.24 1.13 0.98 0.871.1 Agriculture & Live Stock 1.46 1.43 1.36 1.25 1.22 1.12 0.98 0.871.2 Forestry & Logging 0.00 0.00 0.00 0.00 0.00 0.00 0.00 0.001.3 Fishing 0.04 0.03 0.03 0.02 0.02 0.01 0.00 0.00
2 Mining & Quarrying 0.00 0.01 0.01 0.01 0.02 0.01 0.00 0.00B. SECONDARY SECTOR (3+4+5) 17.42 18.42 17.00 18.41 17.56 18.22 18.73 18.43
3 Manufacturing 10.39 9.32 8.88 9.43 8.14 8.26 7.97 7.773.1 Mfg. Registered 4.89 3.24 3.25 3.73 2.56 2.52 2.13 1.893.2 Mfg. Un-Registered 5.50 6.08 5.63 5.70 5.58 5.74 5.84 5.88
4 Electricity, Gas & Water Supply 1.11 1.05 1.07 1.07 1.16 0.64 0.58 0.575 Construction 5.92 8.05 7.05 7.91 8.26 9.32 10.18 10.09
C. TERTIARY SECTOR (6+7+8+9) 81.08 80.10 81.60 80.30 81.19 80.66 80.28 80.706 Trade, Hotels & Restaurants 22.50 22.24 22.78 22.59 22.38 20.80 20.27 19.457 Transport, Storage & Communications 8.82 9.76 9.84 9.84 10.65 10.71 10.95 11.53
7.1 Railways 0.43 0.53 0.49 0.56 0.58 0.57 0.56 0.557.2 Transport by Other Means 4.69 4.79 5.06 5.06 5.05 4.69 4.54 4.167.3 Storage 0.05 0.05 0.05 0.04 0.04 0.04 0.03 0.037.4 Communications 3.65 4.39 4.24 4.18 4.98 5.41 5.82 6.79
8 Fin., Ins., Real Estate /Business Services 33.49 32.21 33.40 33.15 33.68 34.46 35.08 36.668.1 Banking & Insurance 22.26 19.62 20.04 19.61 19.12 19.31 19.27 20.568.2 Real Estate/Own. Dwelling & Busi. Services 11.23 12.59 13.36 13.54 14.56 15.15 15.81 16.10
9 Community, Social & Personal Services 16.27 15.89 15.58 14.72 14.48 14.69 13.98 13.069.1 Public Administration 5.38 5.14 4.97 4.58 4.53 5.19 5.17 4.809.2 Other Services 10.89 10.75 10.61 10.14 9.95 9.50 8.81 8.26
100 100 100 100 100 100 100 100N.B.:- (P)-Provisonal, (Q)-Quick Estimates
-28-
NET STATE DOMESTIC PRODUCT (A+B+C)
STATE : DELHI
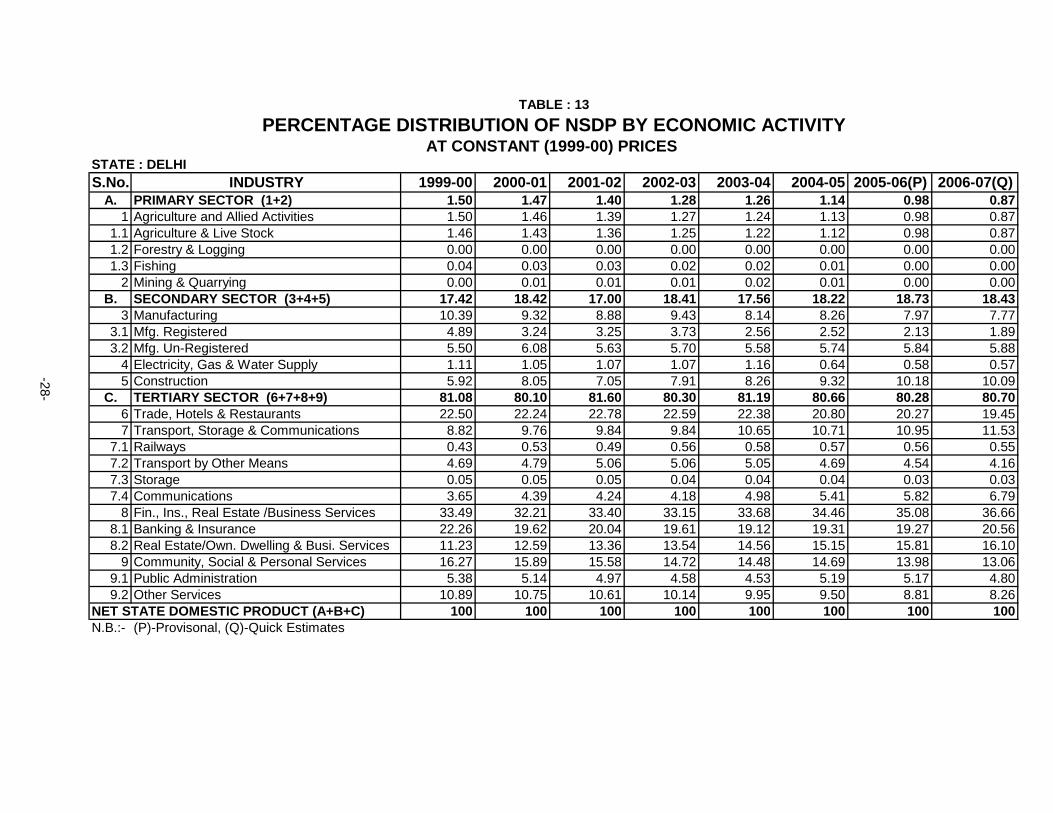
TABLE : 13
PERCENTAGE DISTRIBUTION OF NSDP BY ECONOMIC ACTIVITYAT CONSTANT (1999-00) PRICES
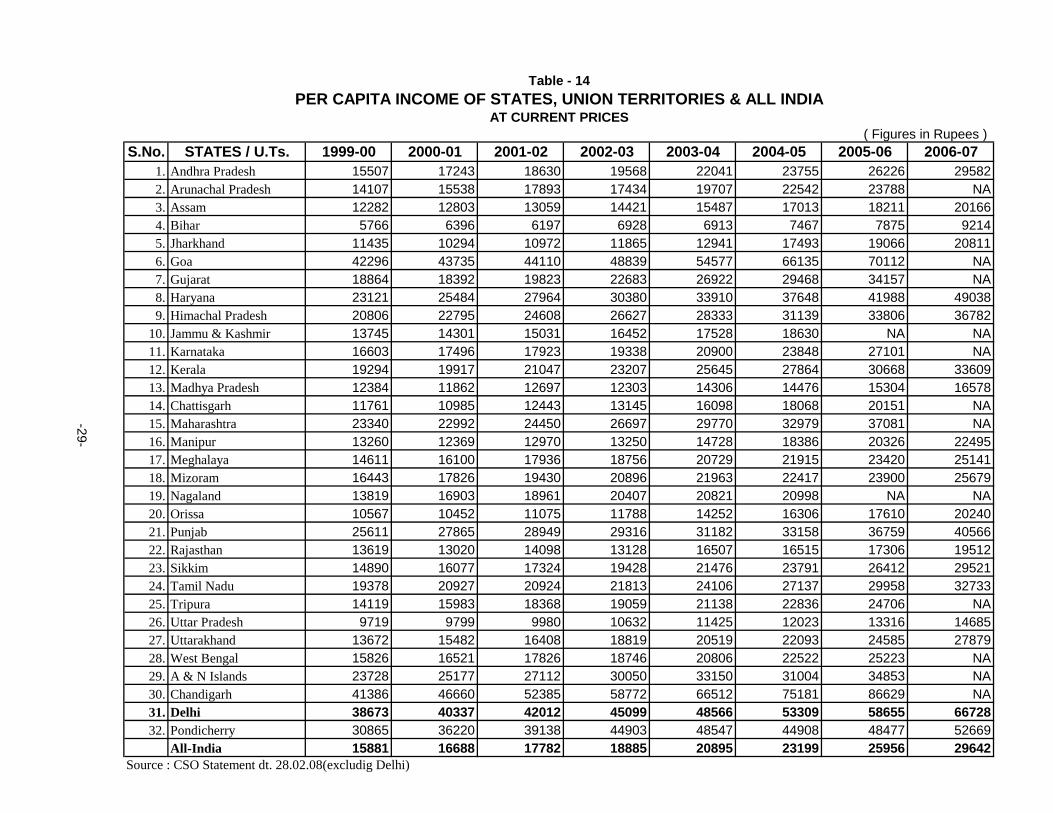
( Figures in Rupees ) S.No. STATES / U.Ts. 1999-00 2000-01 2001-02 2002-03 2003-04 2004-05 2005-06 2006-07
1. Andhra Pradesh 15507 17243 18630 19568 22041 23755 26226 29582 2. Arunachal Pradesh 14107 15538 17893 17434 19707 22542 23788 NA 3. Assam 12282 12803 13059 14421 15487 17013 18211 20166 4. Bihar 5766 6396 6197 6928 6913 7467 7875 9214 5. Jharkhand 11435 10294 10972 11865 12941 17493 19066 20811 6. Goa 42296 43735 44110 48839 54577 66135 70112 NA 7. Gujarat 18864 18392 19823 22683 26922 29468 34157 NA 8. Haryana 23121 25484 27964 30380 33910 37648 41988 49038 9. Himachal Pradesh 20806 22795 24608 26627 28333 31139 33806 36782
10. Jammu & Kashmir 13745 14301 15031 16452 17528 18630 NA NA11. Karnataka 16603 17496 17923 19338 20900 23848 27101 NA12. Kerala 19294 19917 21047 23207 25645 27864 30668 3360913. Madhya Pradesh 12384 11862 12697 12303 14306 14476 15304 1657814. Chattisgarh 11761 10985 12443 13145 16098 18068 20151 NA15. Maharashtra 23340 22992 24450 26697 29770 32979 37081 NA16. Manipur 13260 12369 12970 13250 14728 18386 20326 2249517. Meghalaya 14611 16100 17936 18756 20729 21915 23420 2514118. Mizoram 16443 17826 19430 20896 21963 22417 23900 2567919. Nagaland 13819 16903 18961 20407 20821 20998 NA NA20. Orissa 10567 10452 11075 11788 14252 16306 17610 2024021. Punjab 25611 27865 28949 29316 31182 33158 36759 4056622. Rajasthan 13619 13020 14098 13128 16507 16515 17306 1951223. Sikkim 14890 16077 17324 19428 21476 23791 26412 2952124. Tamil Nadu 19378 20927 20924 21813 24106 27137 29958 3273325. Tripura 14119 15983 18368 19059 21138 22836 24706 NA26. Uttar Pradesh 9719 9799 9980 10632 11425 12023 13316 1468527. Uttarakhand 13672 15482 16408 18819 20519 22093 24585 2787928. West Bengal 15826 16521 17826 18746 20806 22522 25223 NA29. A & N Islands 23728 25177 27112 30050 33150 31004 34853 NA30. Chandigarh 41386 46660 52385 58772 66512 75181 86629 NA31. Delhi 38673 40337 42012 45099 48566 53309 58655 6672832. Pondicherry 30865 36220 39138 44903 48547 44908 48477 52669
All-India 15881 16688 17782 18885 20895 23199 25956 29642Source : CSO Statement dt. 28.02.08(excludig Delhi)
Table - 14PER CAPITA INCOME OF STATES, UNION TERRITORIES & ALL INDIA
AT CURRENT PRICES
-29-
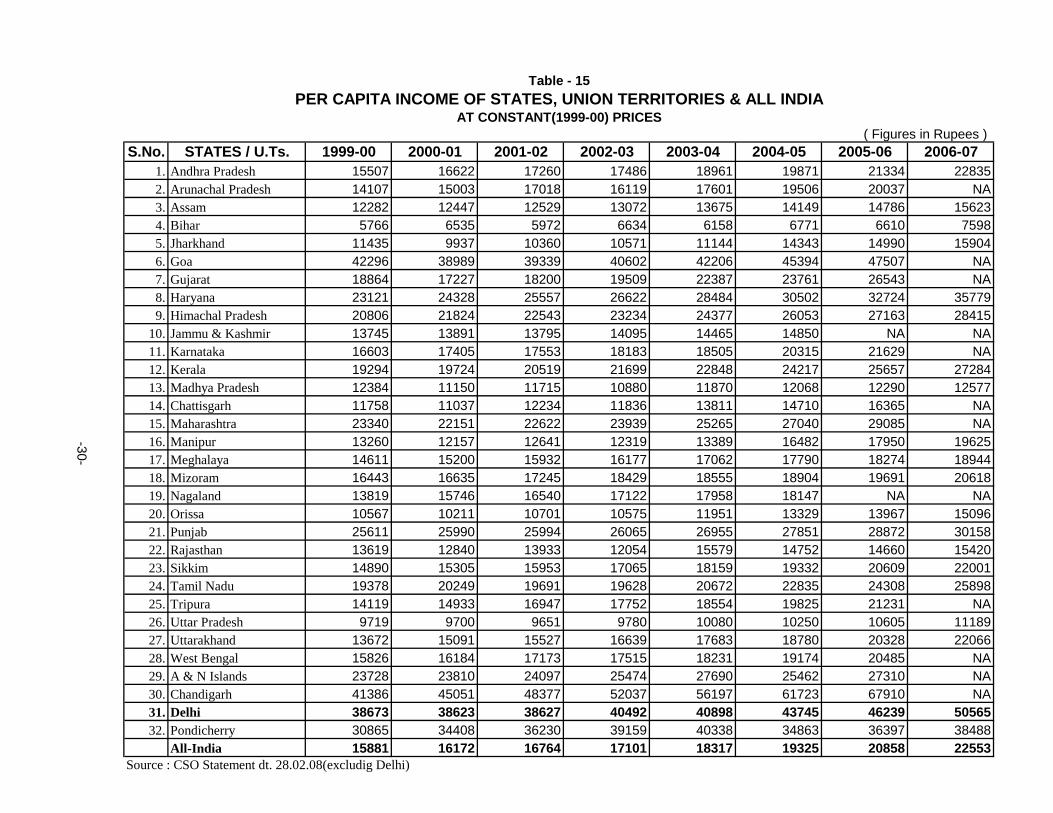
S.No. STATES / U.Ts. 1999-00 2000-01 2001-02 2002-03 2003-04 2004-05 2005-06 2006-07 1. Andhra Pradesh 15507 16622 17260 17486 18961 19871 21334 22835 2. Arunachal Pradesh 14107 15003 17018 16119 17601 19506 20037 NA 3. Assam 12282 12447 12529 13072 13675 14149 14786 15623 4. Bihar 5766 6535 5972 6634 6158 6771 6610 7598 5. Jharkhand 11435 9937 10360 10571 11144 14343 14990 15904 6. Goa 42296 38989 39339 40602 42206 45394 47507 NA 7. Gujarat 18864 17227 18200 19509 22387 23761 26543 NA 8. Haryana 23121 24328 25557 26622 28484 30502 32724 35779 9. Himachal Pradesh 20806 21824 22543 23234 24377 26053 27163 28415
10. Jammu & Kashmir 13745 13891 13795 14095 14465 14850 NA NA11. Karnataka 16603 17405 17553 18183 18505 20315 21629 NA12. Kerala 19294 19724 20519 21699 22848 24217 25657 2728413. Madhya Pradesh 12384 11150 11715 10880 11870 12068 12290 1257714. Chattisgarh 11758 11037 12234 11836 13811 14710 16365 NA15. Maharashtra 23340 22151 22622 23939 25265 27040 29085 NA16. Manipur 13260 12157 12641 12319 13389 16482 17950 1962517. Meghalaya 14611 15200 15932 16177 17062 17790 18274 1894418. Mizoram 16443 16635 17245 18429 18555 18904 19691 2061819. Nagaland 13819 15746 16540 17122 17958 18147 NA NA20. Orissa 10567 10211 10701 10575 11951 13329 13967 1509621. Punjab 25611 25990 25994 26065 26955 27851 28872 3015822. Rajasthan 13619 12840 13933 12054 15579 14752 14660 1542023. Sikkim 14890 15305 15953 17065 18159 19332 20609 2200124. Tamil Nadu 19378 20249 19691 19628 20672 22835 24308 2589825. Tripura 14119 14933 16947 17752 18554 19825 21231 NA26. Uttar Pradesh 9719 9700 9651 9780 10080 10250 10605 1118927. Uttarakhand 13672 15091 15527 16639 17683 18780 20328 2206628. West Bengal 15826 16184 17173 17515 18231 19174 20485 NA29. A & N Islands 23728 23810 24097 25474 27690 25462 27310 NA30. Chandigarh 41386 45051 48377 52037 56197 61723 67910 NA31. Delhi 38673 38623 38627 40492 40898 43745 46239 5056532. Pondicherry 30865 34408 36230 39159 40338 34863 36397 38488
All-India 15881 16172 16764 17101 18317 19325 20858 22553Source : CSO Statement dt. 28.02.08(excludig Delhi)
-30-
Table - 15PER CAPITA INCOME OF STATES, UNION TERRITORIES & ALL INDIA
AT CONSTANT(1999-00) PRICES( Figures in Rupees )
ANNEXURE
METHODOLOGY
RECOMMENDED BY CSO
- 31 -
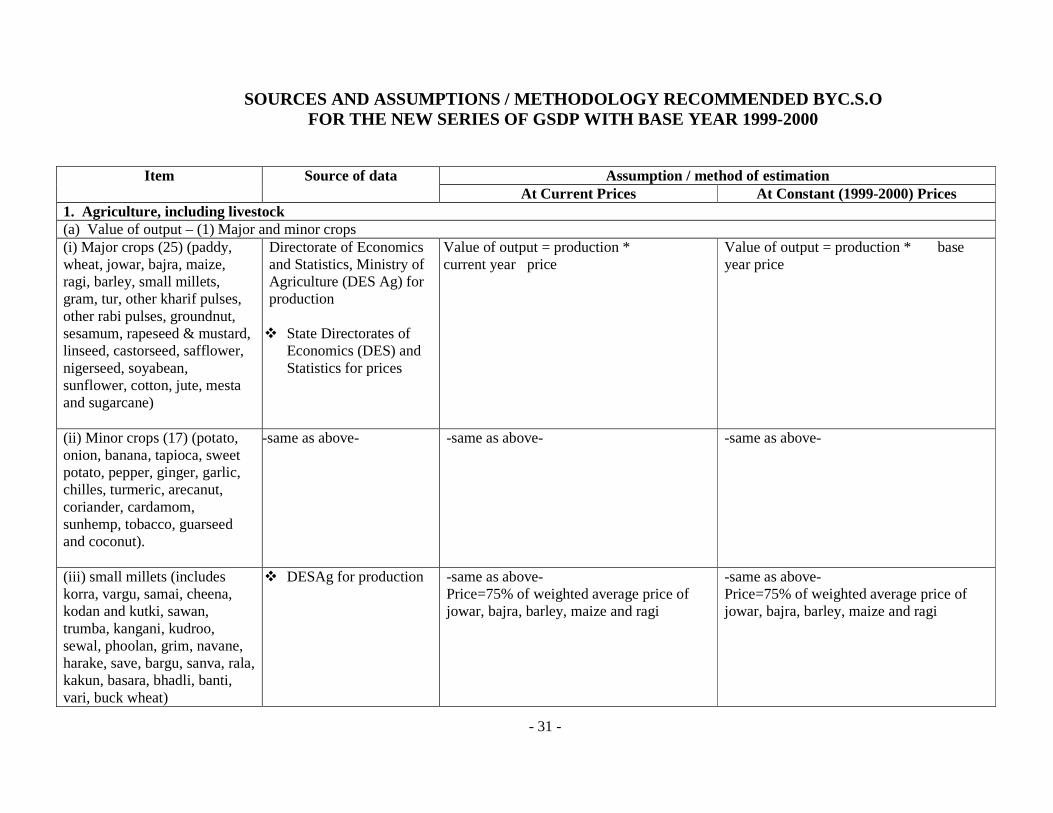
SOURCES AND ASSUMPTIONS / METHODOLOGY RECOMMENDED BYC.S.O FOR THE NEW SERIES OF GSDP WITH BASE YEAR 1999-2000
Assumption / method of estimation Item Source of data
At Current Prices At Constant (1999-2000) Prices 1. Agriculture, including livestock (a) Value of output – (1) Major and minor crops (i) Major crops (25) (paddy, wheat, jowar, bajra, maize, ragi, barley, small millets, gram, tur, other kharif pulses, other rabi pulses, groundnut, sesamum, rapeseed & mustard, linseed, castorseed, safflower, nigerseed, soyabean, sunflower, cotton, jute, mesta and sugarcane)
Directorate of Economics and Statistics, Ministry of Agriculture (DES Ag) for production
� State Directorates of
Economics (DES) and Statistics for prices
Value of output = production * current year price
Value of output = production * base year price
(ii) Minor crops (17) (potato, onion, banana, tapioca, sweet potato, pepper, ginger, garlic, chilles, turmeric, arecanut, coriander, cardamom, sunhemp, tobacco, guarseed and coconut).
-same as above- -same as above- -same as above-
(iii) small millets (includes korra, vargu, samai, cheena, kodan and kutki, sawan, trumba, kangani, kudroo, sewal, phoolan, grim, navane, harake, save, bargu, sanva, rala, kakun, basara, bhadli, banti, vari, buck wheat)
� DESAg for production -same as above- Price=75% of weighted average price of jowar, bajra, barley, maize and ragi
-same as above- Price=75% of weighted average price of jowar, bajra, barley, maize and ragi
- 32 -
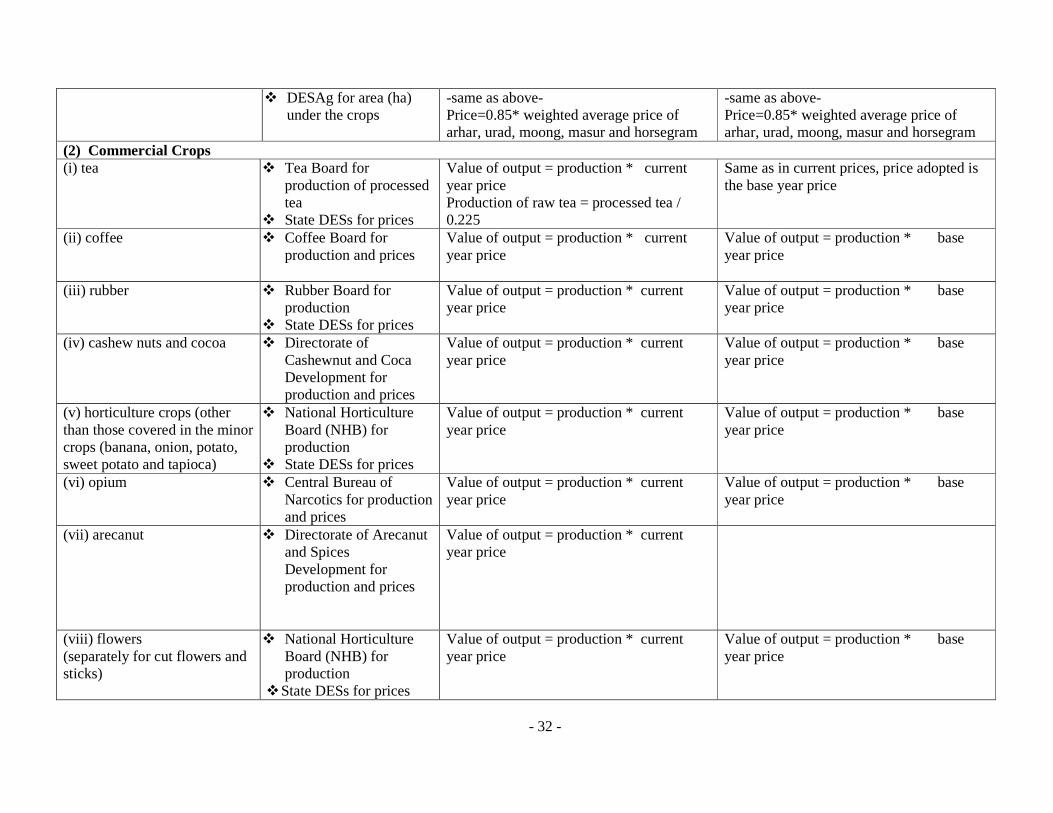
� DESAg for area (ha) under the crops
-same as above- Price=0.85* weighted average price of arhar, urad, moong, masur and horsegram
-same as above- Price=0.85* weighted average price of arhar, urad, moong, masur and horsegram
(2) Commercial Crops (i) tea � Tea Board for
production of processed tea
� State DESs for prices
Value of output = production * current year price Production of raw tea = processed tea / 0.225
Same as in current prices, price adopted is the base year price
(ii) coffee � Coffee Board for production and prices
Value of output = production * current year price
Value of output = production * base year price
(iii) rubber � Rubber Board for production
� State DESs for prices
Value of output = production * current year price
Value of output = production * base year price
(iv) cashew nuts and cocoa � Directorate of Cashewnut and Coca Development for production and prices
Value of output = production * current year price
Value of output = production * base year price
(v) horticulture crops (other than those covered in the minor crops (banana, onion, potato, sweet potato and tapioca)
� National Horticulture Board (NHB) for production
� State DESs for prices
Value of output = production * current year price
Value of output = production * base year price
(vi) opium � Central Bureau of Narcotics for production and prices
Value of output = production * current year price
Value of output = production * base year price
(vii) arecanut � Directorate of Arecanut and Spices Development for production and prices
Value of output = production * current year price
(viii) flowers (separately for cut flowers and sticks)
� National Horticulture Board (NHB) for production
� State DESs for prices
Value of output = production * current year price
Value of output = production * base year price
- 33 -
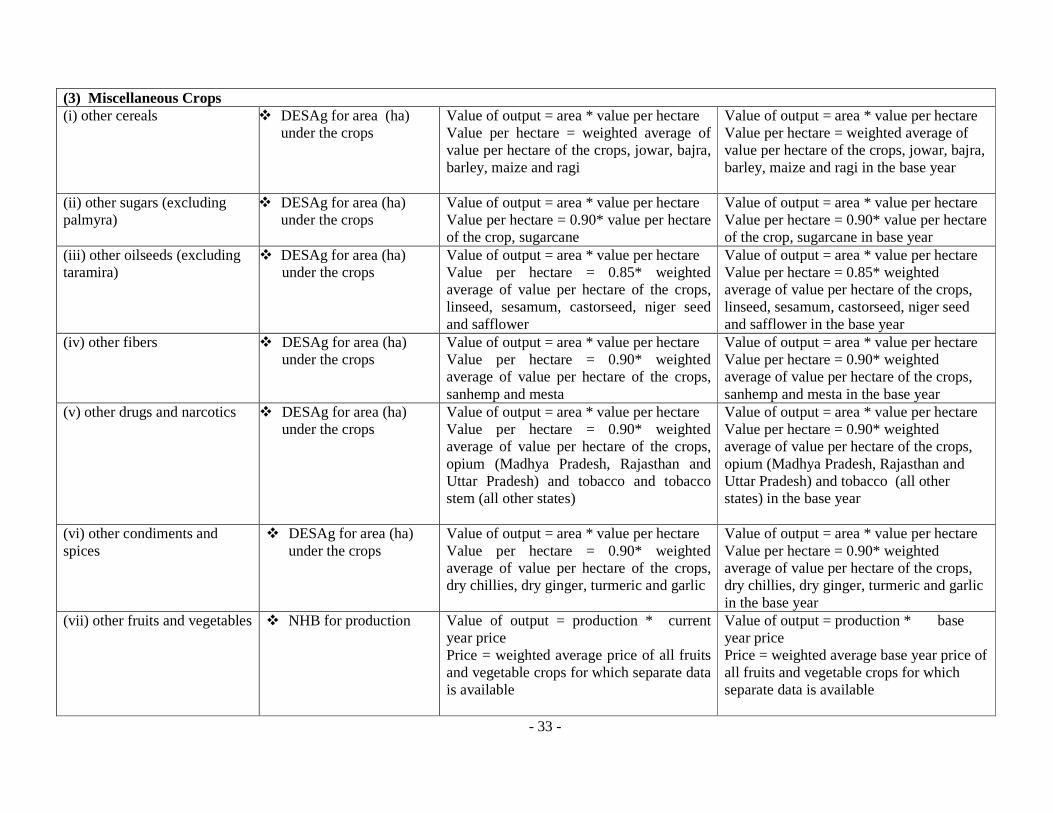
(3) Miscellaneous Crops (i) other cereals � DESAg for area (ha)
under the crops Value of output = area * value per hectare Value per hectare = weighted average of value per hectare of the crops, jowar, bajra, barley, maize and ragi
Value of output = area * value per hectare Value per hectare = weighted average of value per hectare of the crops, jowar, bajra, barley, maize and ragi in the base year
(ii) other sugars (excluding palmyra)
� DESAg for area (ha) under the crops
Value of output = area * value per hectare Value per hectare = 0.90* value per hectare of the crop, sugarcane
Value of output = area * value per hectare Value per hectare = 0.90* value per hectare of the crop, sugarcane in base year
(iii) other oilseeds (excluding taramira)
� DESAg for area (ha) under the crops
Value of output = area * value per hectare Value per hectare = 0.85* weighted average of value per hectare of the crops, linseed, sesamum, castorseed, niger seed and safflower
Value of output = area * value per hectare Value per hectare = 0.85* weighted average of value per hectare of the crops, linseed, sesamum, castorseed, niger seed and safflower in the base year
(iv) other fibers � DESAg for area (ha) under the crops
Value of output = area * value per hectare Value per hectare = 0.90* weighted average of value per hectare of the crops, sanhemp and mesta
Value of output = area * value per hectare Value per hectare = 0.90* weighted average of value per hectare of the crops, sanhemp and mesta in the base year
(v) other drugs and narcotics � DESAg for area (ha) under the crops
Value of output = area * value per hectare Value per hectare = 0.90* weighted average of value per hectare of the crops, opium (Madhya Pradesh, Rajasthan and Uttar Pradesh) and tobacco and tobacco stem (all other states)
Value of output = area * value per hectare Value per hectare = 0.90* weighted average of value per hectare of the crops, opium (Madhya Pradesh, Rajasthan and Uttar Pradesh) and tobacco (all other states) in the base year
(vi) other condiments and spices
� DESAg for area (ha) under the crops
Value of output = area * value per hectare Value per hectare = 0.90* weighted average of value per hectare of the crops, dry chillies, dry ginger, turmeric and garlic
Value of output = area * value per hectare Value per hectare = 0.90* weighted average of value per hectare of the crops, dry chillies, dry ginger, turmeric and garlic in the base year
(vii) other fruits and vegetables � NHB for production Value of output = production * current year price Price = weighted average price of all fruits and vegetable crops for which separate data is available
Value of output = production * base year price Price = weighted average base year price of all fruits and vegetable crops for which separate data is available
- 34 -
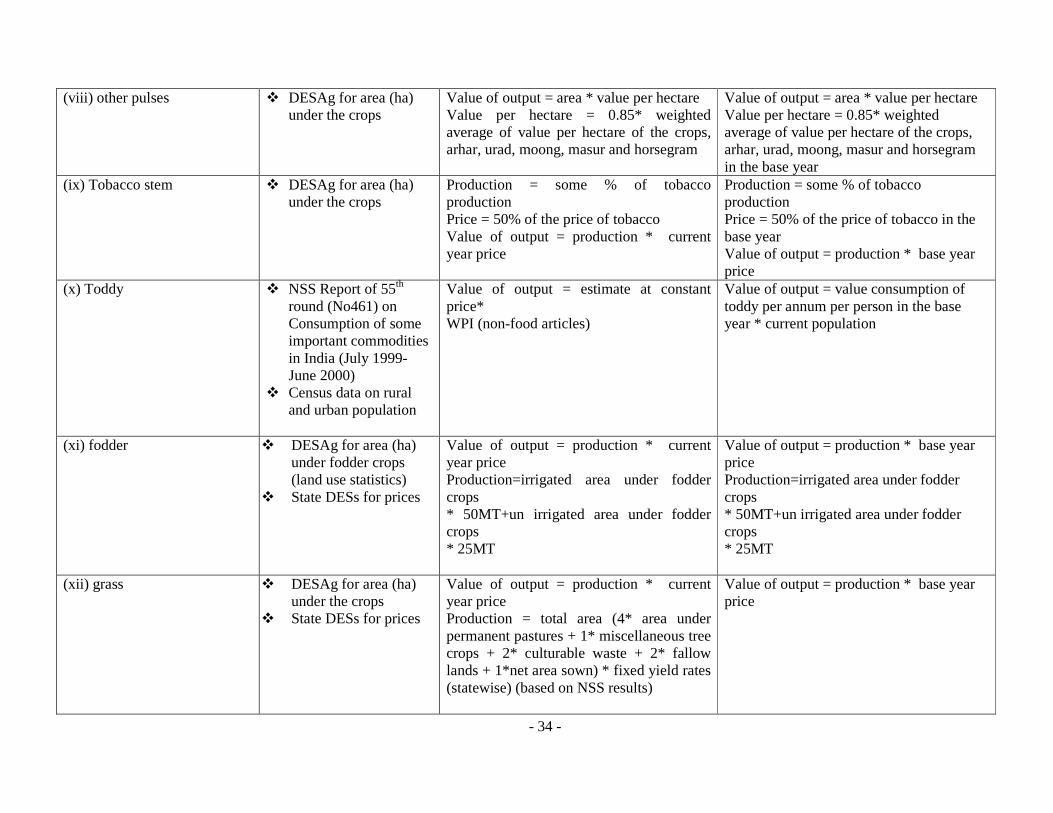
(viii) other pulses � DESAg for area (ha) under the crops
Value of output = area * value per hectare Value per hectare = 0.85* weighted average of value per hectare of the crops, arhar, urad, moong, masur and horsegram
Value of output = area * value per hectare Value per hectare = 0.85* weighted average of value per hectare of the crops, arhar, urad, moong, masur and horsegram in the base year
(ix) Tobacco stem � DESAg for area (ha) under the crops
Production = some % of tobacco production Price = 50% of the price of tobacco Value of output = production * current year price
Production = some % of tobacco production Price = 50% of the price of tobacco in the base year Value of output = production * base year price
(x) Toddy � NSS Report of 55th round (No461) on Consumption of some important commodities in India (July 1999-June 2000)
� Census data on rural and urban population
Value of output = estimate at constant price* WPI (non-food articles)
Value of output = value consumption of toddy per annum per person in the base year * current population
(xi) fodder � DESAg for area (ha) under fodder crops (land use statistics)
� State DESs for prices
Value of output = production * current year price Production=irrigated area under fodder crops * 50MT+un irrigated area under fodder crops * 25MT
Value of output = production * base year price Production=irrigated area under fodder crops * 50MT+un irrigated area under fodder crops * 25MT
(xii) grass � DESAg for area (ha) under the crops
� State DESs for prices
Value of output = production * current year price Production = total area (4* area under permanent pastures + 1* miscellaneous tree crops + 2* culturable waste + 2* fallow lands + 1*net area sown) * fixed yield rates (statewise) (based on NSS results)
Value of output = production * base year price
- 35 -
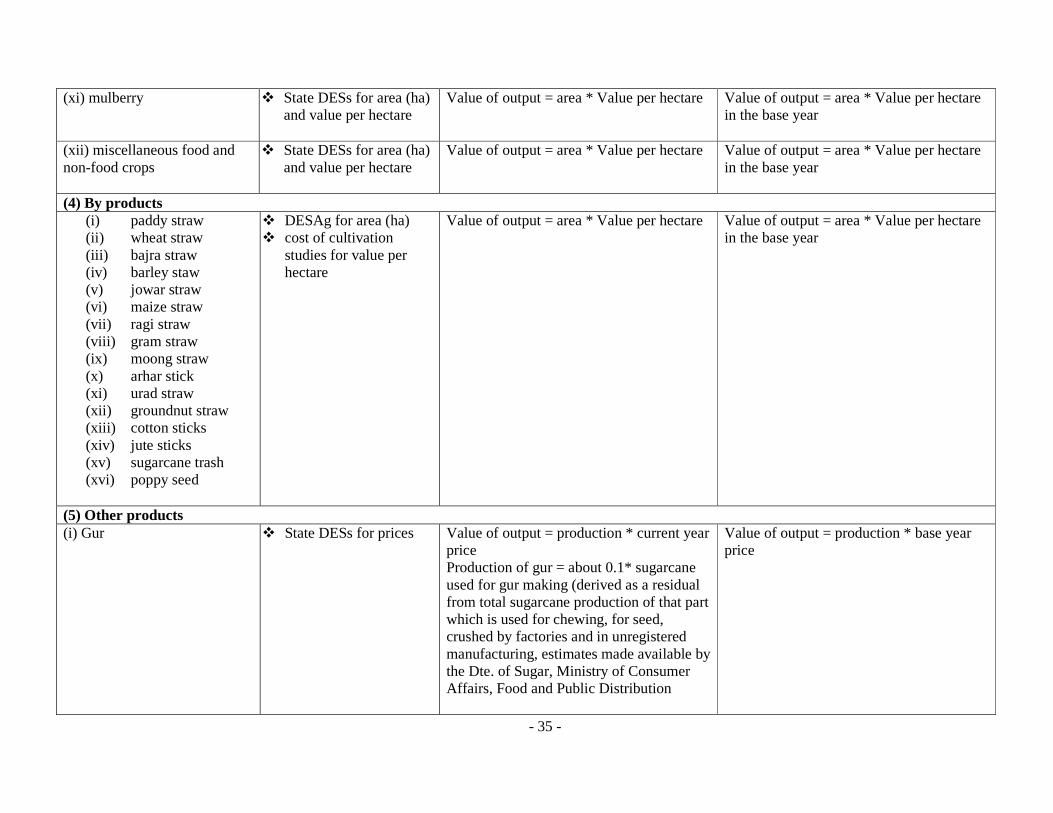
(xi) mulberry � State DESs for area (ha) and value per hectare
Value of output = area * Value per hectare Value of output = area * Value per hectare in the base year
(xii) miscellaneous food and non-food crops
� State DESs for area (ha) and value per hectare
Value of output = area * Value per hectare Value of output = area * Value per hectare in the base year
(4) By products (i) paddy straw (ii) wheat straw (iii) bajra straw (iv) barley staw (v) jowar straw (vi) maize straw (vii) ragi straw (viii) gram straw (ix) moong straw (x) arhar stick (xi) urad straw (xii) groundnut straw (xiii) cotton sticks (xiv) jute sticks (xv) sugarcane trash (xvi) poppy seed
� DESAg for area (ha) � cost of cultivation
studies for value per hectare
Value of output = area * Value per hectare Value of output = area * Value per hectare in the base year
(5) Other products (i) Gur � State DESs for prices Value of output = production * current year
price Production of gur = about 0.1* sugarcane used for gur making (derived as a residual from total sugarcane production of that part which is used for chewing, for seed, crushed by factories and in unregistered manufacturing, estimates made available by the Dte. of Sugar, Ministry of Consumer Affairs, Food and Public Distribution
Value of output = production * base year price
- 36 -
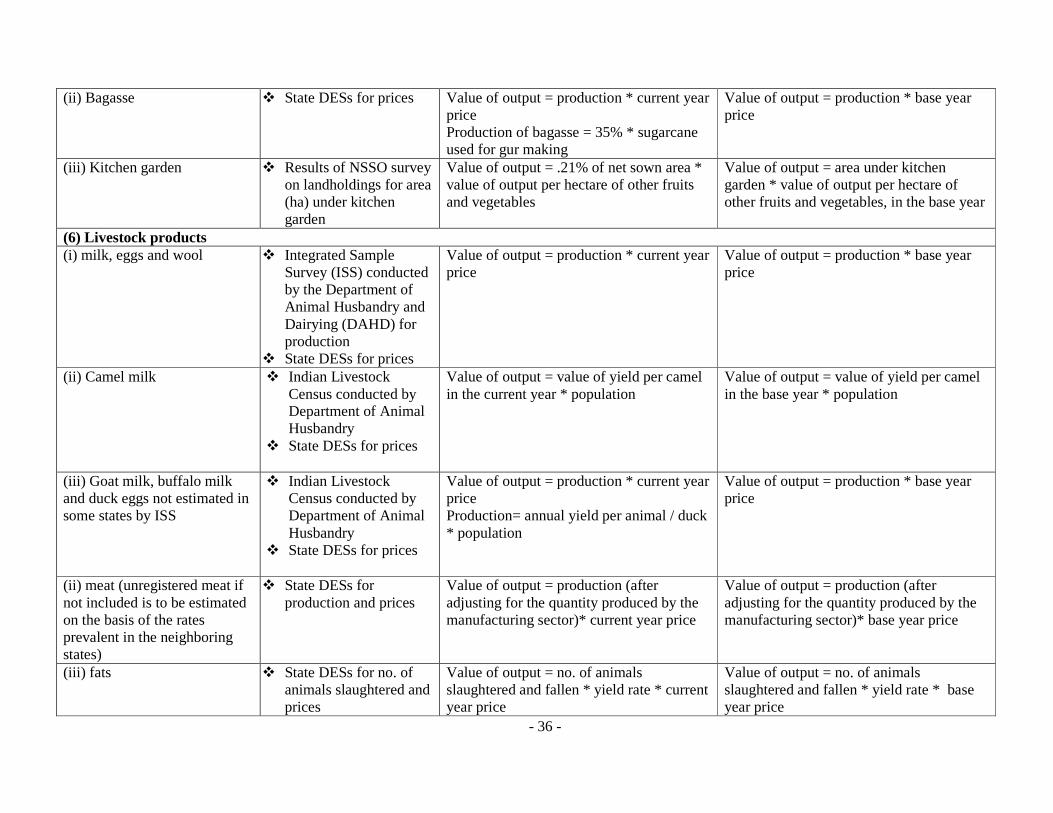
(ii) Bagasse � State DESs for prices Value of output = production * current year price Production of bagasse = 35% * sugarcane used for gur making
Value of output = production * base year price
(iii) Kitchen garden � Results of NSSO survey on landholdings for area (ha) under kitchen garden
Value of output = .21% of net sown area * value of output per hectare of other fruits and vegetables
Value of output = area under kitchen garden * value of output per hectare of other fruits and vegetables, in the base year
(6) Livestock products (i) milk, eggs and wool � Integrated Sample
Survey (ISS) conducted by the Department of Animal Husbandry and Dairying (DAHD) for production
� State DESs for prices
Value of output = production * current year price
Value of output = production * base year price
(ii) Camel milk � Indian Livestock Census conducted by Department of Animal Husbandry
� State DESs for prices
Value of output = value of yield per camel in the current year * population
Value of output = value of yield per camel in the base year * population
(iii) Goat milk, buffalo milk and duck eggs not estimated in some states by ISS
� Indian Livestock Census conducted by Department of Animal Husbandry
� State DESs for prices
Value of output = production * current year price Production= annual yield per animal / duck * population
Value of output = production * base year price
(ii) meat (unregistered meat if not included is to be estimated on the basis of the rates prevalent in the neighboring states)
� State DESs for production and prices
Value of output = production (after adjusting for the quantity produced by the manufacturing sector)* current year price
Value of output = production (after adjusting for the quantity produced by the manufacturing sector)* base year price
(iii) fats � State DESs for no. of animals slaughtered and prices
Value of output = no. of animals slaughtered and fallen * yield rate * current year price
Value of output = no. of animals slaughtered and fallen * yield rate * base year price
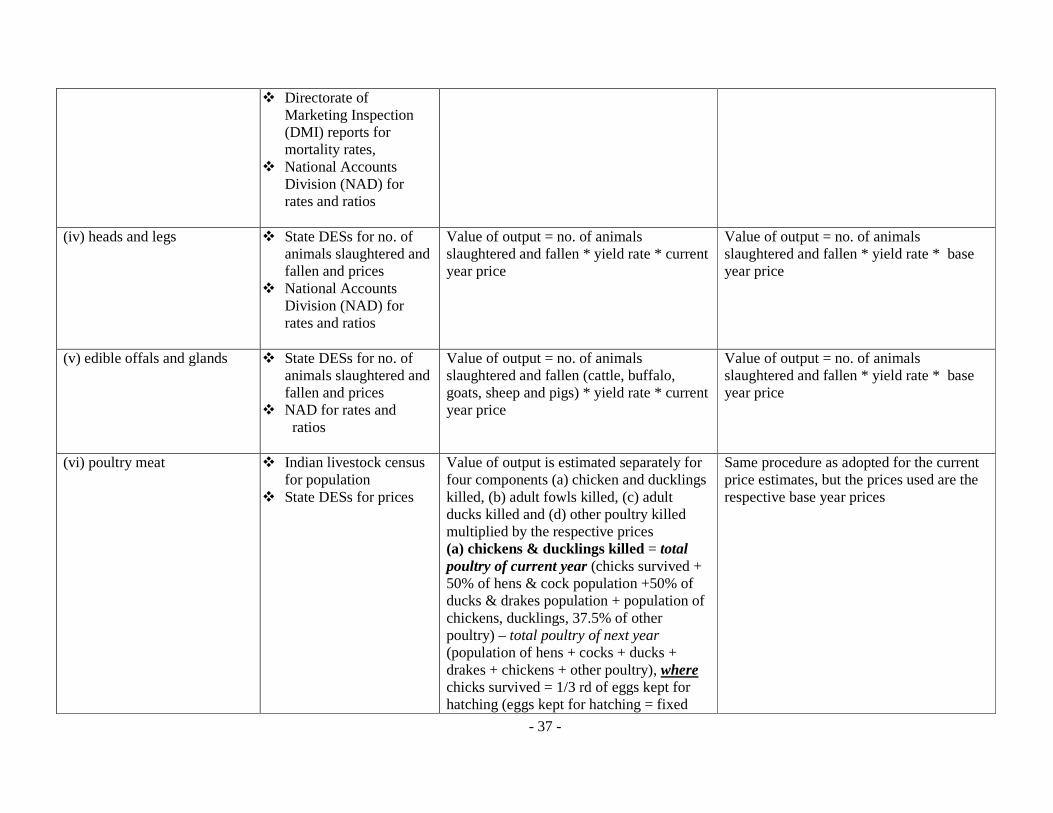
- 37 -
� Directorate of Marketing Inspection (DMI) reports for mortality rates,
� National Accounts Division (NAD) for rates and ratios
(iv) heads and legs � State DESs for no. of
animals slaughtered and fallen and prices
� National Accounts Division (NAD) for rates and ratios
Value of output = no. of animals slaughtered and fallen * yield rate * current year price
Value of output = no. of animals slaughtered and fallen * yield rate * base year price
(v) edible offals and glands � State DESs for no. of animals slaughtered and fallen and prices
� NAD for rates and ratios
Value of output = no. of animals slaughtered and fallen (cattle, buffalo, goats, sheep and pigs) * yield rate * current year price
Value of output = no. of animals slaughtered and fallen * yield rate * base year price
(vi) poultry meat � Indian livestock census for population
� State DESs for prices
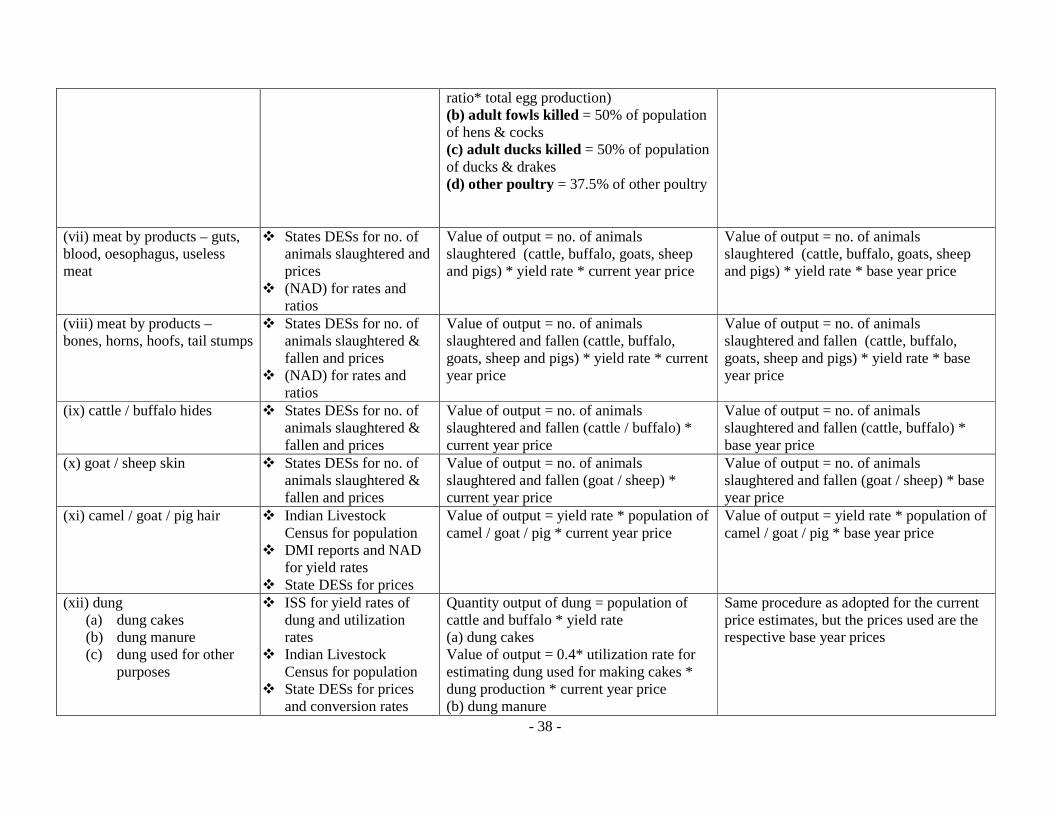
Value of output is estimated separately for four components (a) chicken and ducklings killed, (b) adult fowls killed, (c) adult ducks killed and (d) other poultry killed multiplied by the respective prices (a) chickens & ducklings killed = total poultry of current year (chicks survived + 50% of hens & cock population +50% of ducks & drakes population + population of chickens, ducklings, 37.5% of other poultry) – total poultry of next year (population of hens + cocks + ducks + drakes + chickens + other poultry), where chicks survived = 1/3 rd of eggs kept for hatching (eggs kept for hatching = fixed
Same procedure as adopted for the current price estimates, but the prices used are the respective base year prices
- 38 -
ratio* total egg production) (b) adult fowls killed = 50% of population of hens & cocks (c) adult ducks killed = 50% of population of ducks & drakes (d) other poultry = 37.5% of other poultry
(vii) meat by products – guts, blood, oesophagus, useless meat
� States DESs for no. of animals slaughtered and prices
� (NAD) for rates and ratios
Value of output = no. of animals slaughtered (cattle, buffalo, goats, sheep and pigs) * yield rate * current year price
Value of output = no. of animals slaughtered (cattle, buffalo, goats, sheep and pigs) * yield rate * base year price
(viii) meat by products – bones, horns, hoofs, tail stumps
� States DESs for no. of animals slaughtered & fallen and prices
� (NAD) for rates and ratios
Value of output = no. of animals slaughtered and fallen (cattle, buffalo, goats, sheep and pigs) * yield rate * current year price
Value of output = no. of animals slaughtered and fallen (cattle, buffalo, goats, sheep and pigs) * yield rate * base year price
(ix) cattle / buffalo hides � States DESs for no. of animals slaughtered & fallen and prices
Value of output = no. of animals slaughtered and fallen (cattle / buffalo) * current year price
Value of output = no. of animals slaughtered and fallen (cattle, buffalo) * base year price
(x) goat / sheep skin � States DESs for no. of animals slaughtered & fallen and prices
Value of output = no. of animals slaughtered and fallen (goat / sheep) * current year price
Value of output = no. of animals slaughtered and fallen (goat / sheep) * base year price
(xi) camel / goat / pig hair � Indian Livestock Census for population
� DMI reports and NAD for yield rates
� State DESs for prices
Value of output = yield rate * population of camel / goat / pig * current year price
Value of output = yield rate * population of camel / goat / pig * base year price
(xii) dung (a) dung cakes (b) dung manure (c) dung used for other
purposes
� ISS for yield rates of dung and utilization rates
� Indian Livestock Census for population
� State DESs for prices and conversion rates
Quantity output of dung = population of cattle and buffalo * yield rate (a) dung cakes Value of output = 0.4* utilization rate for estimating dung used for making cakes * dung production * current year price (b) dung manure
Same procedure as adopted for the current price estimates, but the prices used are the respective base year prices
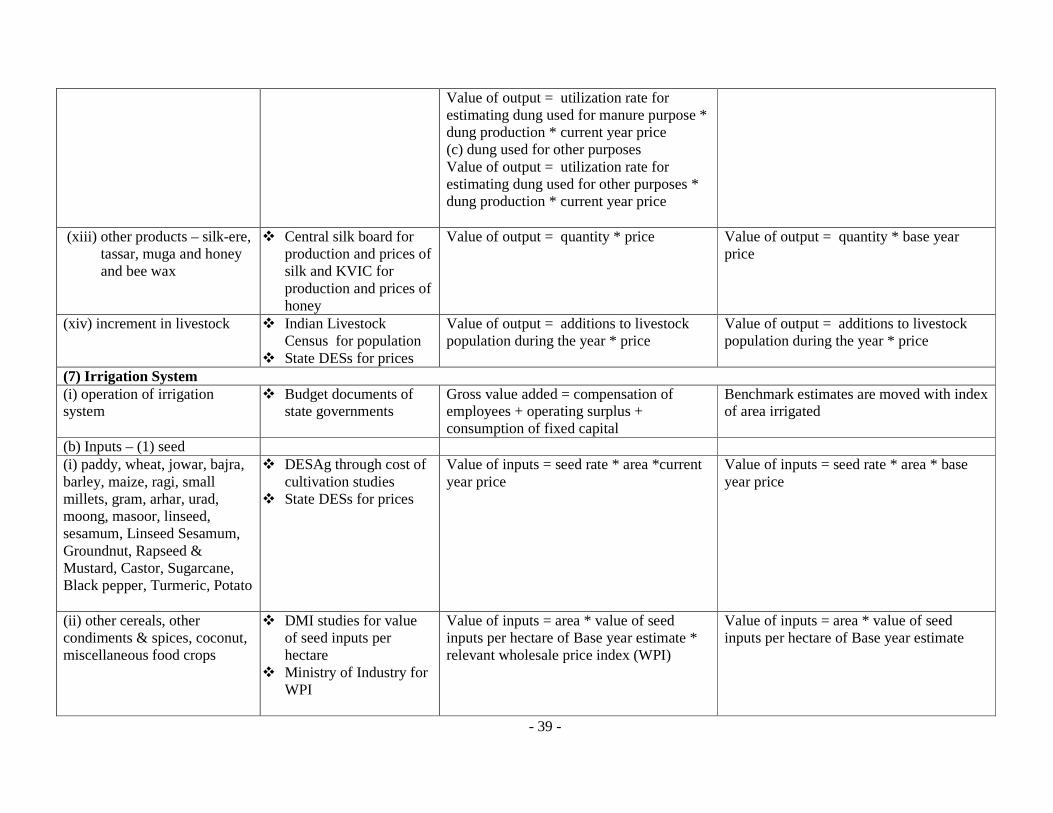
- 39 -
Value of output = utilization rate for estimating dung used for manure purpose * dung production * current year price (c) dung used for other purposes Value of output = utilization rate for estimating dung used for other purposes * dung production * current year price
(xiii) other products – silk-ere, tassar, muga and honey and bee wax
� Central silk board for production and prices of silk and KVIC for production and prices of honey
Value of output = quantity * price Value of output = quantity * base year price
(xiv) increment in livestock � Indian Livestock Census for population
� State DESs for prices
Value of output = additions to livestock population during the year * price
Value of output = additions to livestock population during the year * price
(7) Irrigation System (i) operation of irrigation system
� Budget documents of state governments
Gross value added = compensation of employees + operating surplus + consumption of fixed capital
Benchmark estimates are moved with index of area irrigated
(b) Inputs – (1) seed (i) paddy, wheat, jowar, bajra, barley, maize, ragi, small millets, gram, arhar, urad, moong, masoor, linseed, sesamum, Linseed Sesamum, Groundnut, Rapseed & Mustard, Castor, Sugarcane, Black pepper, Turmeric, Potato
� DESAg through cost of cultivation studies
� State DESs for prices
Value of inputs = seed rate * area *current year price
Value of inputs = seed rate * area * base year price
(ii) other cereals, other condiments & spices, coconut, miscellaneous food crops
� DMI studies for value of seed inputs per hectare
� Ministry of Industry for WPI
Value of inputs = area * value of seed inputs per hectare of Base year estimate * relevant wholesale price index (WPI)
Value of inputs = area * value of seed inputs per hectare of Base year estimate
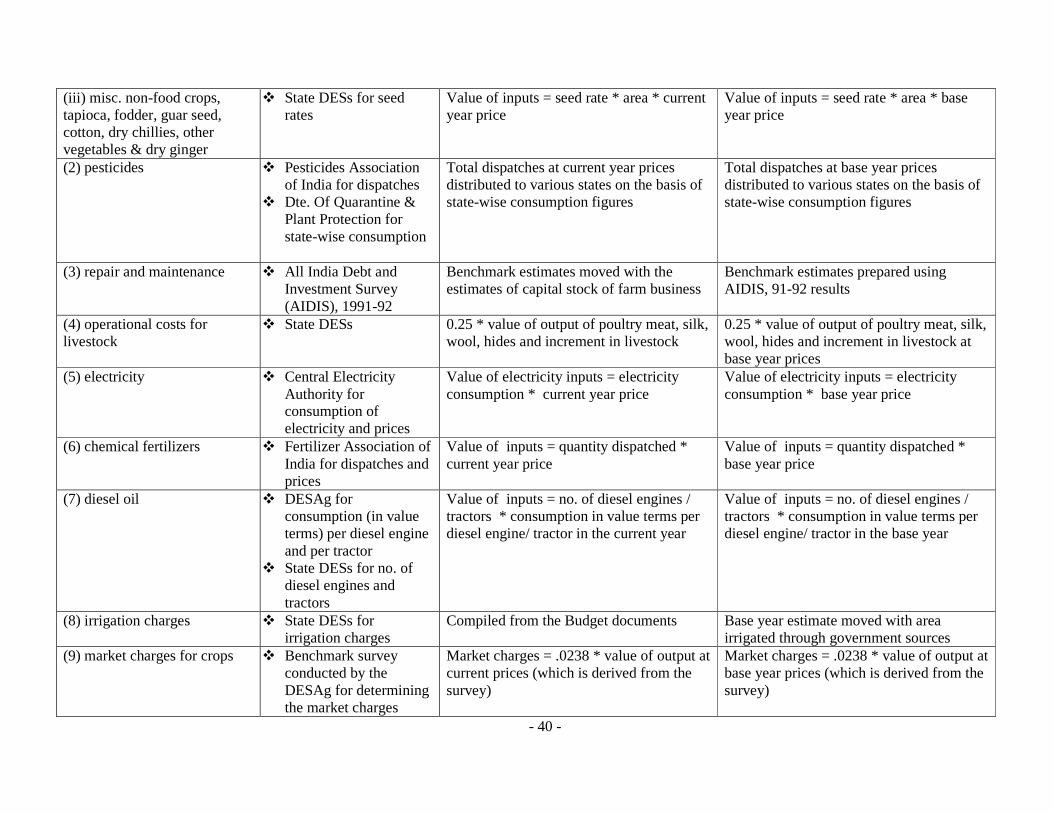
- 40 -
(iii) misc. non-food crops, tapioca, fodder, guar seed, cotton, dry chillies, other vegetables & dry ginger
� State DESs for seed rates
Value of inputs = seed rate * area * current year price
Value of inputs = seed rate * area * base year price
(2) pesticides � Pesticides Association of India for dispatches
� Dte. Of Quarantine & Plant Protection for state-wise consumption
Total dispatches at current year prices distributed to various states on the basis of state-wise consumption figures
Total dispatches at base year prices distributed to various states on the basis of state-wise consumption figures
(3) repair and maintenance � All India Debt and Investment Survey (AIDIS), 1991-92
Benchmark estimates moved with the estimates of capital stock of farm business
Benchmark estimates prepared using AIDIS, 91-92 results
(4) operational costs for livestock
� State DESs 0.25 * value of output of poultry meat, silk, wool, hides and increment in livestock
0.25 * value of output of poultry meat, silk, wool, hides and increment in livestock at base year prices
(5) electricity � Central Electricity Authority for consumption of electricity and prices
Value of electricity inputs = electricity consumption * current year price
Value of electricity inputs = electricity consumption * base year price
(6) chemical fertilizers � Fertilizer Association of India for dispatches and prices
Value of inputs = quantity dispatched * current year price
Value of inputs = quantity dispatched * base year price
(7) diesel oil � DESAg for consumption (in value terms) per diesel engine and per tractor
� State DESs for no. of diesel engines and tractors
Value of inputs = no. of diesel engines / tractors * consumption in value terms per diesel engine/ tractor in the current year
Value of inputs = no. of diesel engines / tractors * consumption in value terms per diesel engine/ tractor in the base year
(8) irrigation charges � State DESs for irrigation charges
Compiled from the Budget documents Base year estimate moved with area irrigated through government sources
(9) market charges for crops � Benchmark survey conducted by the DESAg for determining the market charges
Market charges = .0238 * value of output at current prices (which is derived from the survey)
Market charges = .0238 * value of output at base year prices (which is derived from the survey)
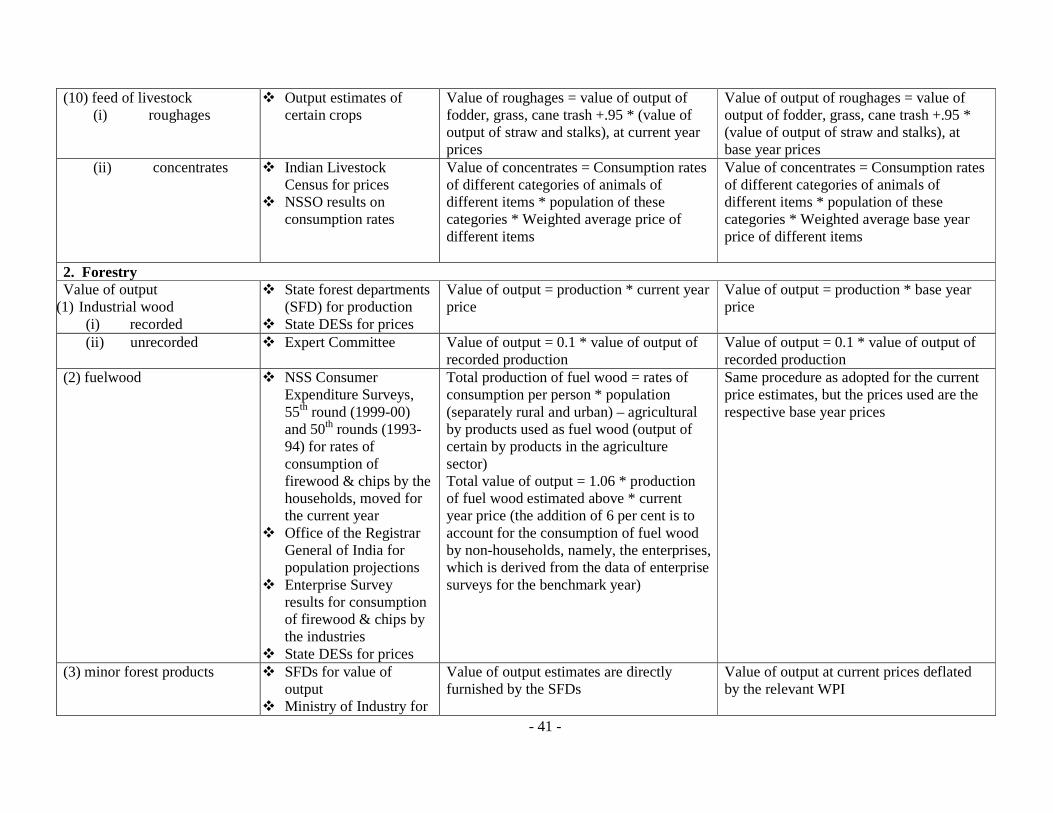
- 41 -
(10) feed of livestock (i) roughages
� Output estimates of certain crops
Value of roughages = value of output of fodder, grass, cane trash +.95 * (value of output of straw and stalks), at current year prices
Value of output of roughages = value of output of fodder, grass, cane trash +.95 * (value of output of straw and stalks), at base year prices
(ii) concentrates � Indian Livestock Census for prices
� NSSO results on consumption rates
Value of concentrates = Consumption rates of different categories of animals of different items * population of these categories * Weighted average price of different items
Value of concentrates = Consumption rates of different categories of animals of different items * population of these categories * Weighted average base year price of different items
2. Forestry Value of output
(1) Industrial wood (i) recorded
� State forest departments (SFD) for production
� State DESs for prices
Value of output = production * current year price
Value of output = production * base year price
(ii) unrecorded � Expert Committee Value of output = 0.1 * value of output of recorded production
Value of output = 0.1 * value of output of recorded production
(2) fuelwood � NSS Consumer Expenditure Surveys, 55th round (1999-00) and 50th rounds (1993-94) for rates of consumption of firewood & chips by the households, moved for the current year
� Office of the Registrar General of India for population projections
� Enterprise Survey results for consumption of firewood & chips by the industries
� State DESs for prices
Total production of fuel wood = rates of consumption per person * population (separately rural and urban) – agricultural by products used as fuel wood (output of certain by products in the agriculture sector) Total value of output = 1.06 * production of fuel wood estimated above * current year price (the addition of 6 per cent is to account for the consumption of fuel wood by non-households, namely, the enterprises, which is derived from the data of enterprise surveys for the benchmark year)
Same procedure as adopted for the current price estimates, but the prices used are the respective base year prices
(3) minor forest products � SFDs for value of output
� Ministry of Industry for
Value of output estimates are directly furnished by the SFDs
Value of output at current prices deflated by the relevant WPI
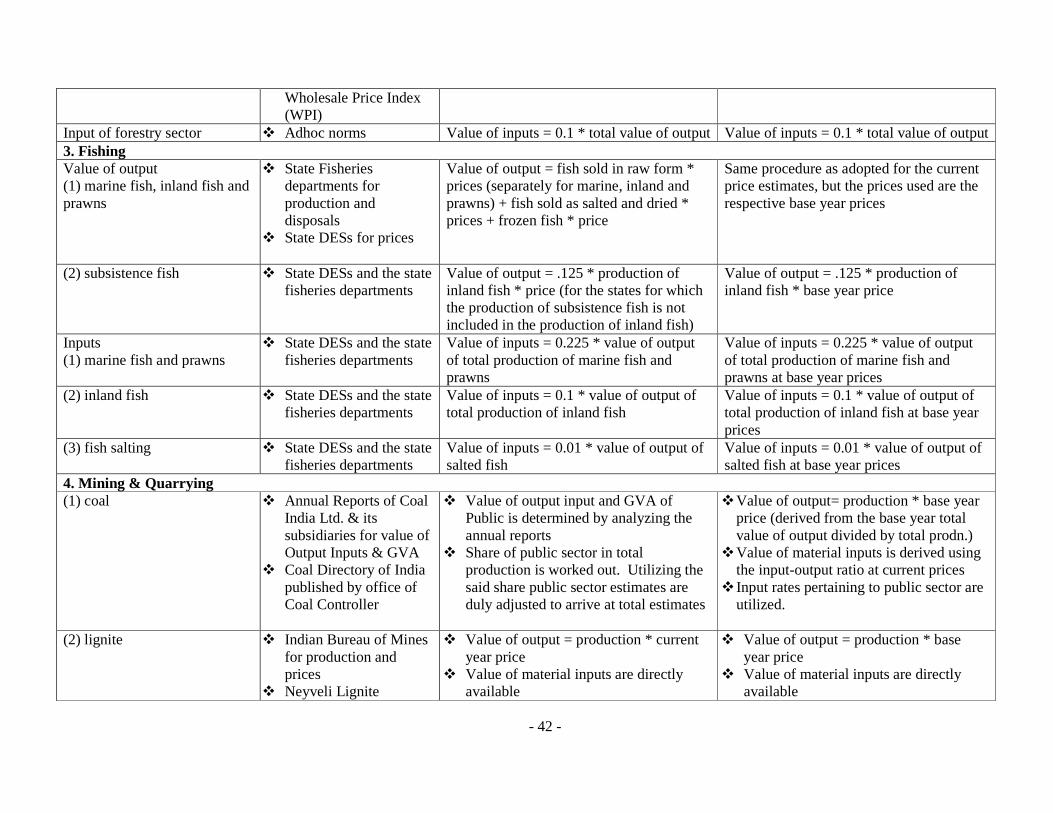
- 42 -
Wholesale Price Index (WPI)
Input of forestry sector � Adhoc norms Value of inputs = 0.1 * total value of output Value of inputs = 0.1 * total value of output 3. Fishing Value of output (1) marine fish, inland fish and prawns
� State Fisheries departments for production and disposals
� State DESs for prices
Value of output = fish sold in raw form * prices (separately for marine, inland and prawns) + fish sold as salted and dried * prices + frozen fish * price
Same procedure as adopted for the current price estimates, but the prices used are the respective base year prices
(2) subsistence fish � State DESs and the state fisheries departments
Value of output = .125 * production of inland fish * price (for the states for which the production of subsistence fish is not included in the production of inland fish)
Value of output = .125 * production of inland fish * base year price
Inputs (1) marine fish and prawns
� State DESs and the state fisheries departments
Value of inputs = 0.225 * value of output of total production of marine fish and prawns
Value of inputs = 0.225 * value of output of total production of marine fish and prawns at base year prices
(2) inland fish � State DESs and the state fisheries departments
Value of inputs = 0.1 * value of output of total production of inland fish
Value of inputs = 0.1 * value of output of total production of inland fish at base year prices
(3) fish salting � State DESs and the state fisheries departments
Value of inputs = 0.01 * value of output of salted fish
Value of inputs = 0.01 * value of output of salted fish at base year prices
4. Mining & Quarrying (1) coal � Annual Reports of Coal
India Ltd. & its subsidiaries for value of Output Inputs & GVA
� Coal Directory of India published by office of Coal Controller
� Value of output input and GVA of Public is determined by analyzing the annual reports
� Share of public sector in total production is worked out. Utilizing the said share public sector estimates are duly adjusted to arrive at total estimates
� Value of output= production * base year price (derived from the base year total value of output divided by total prodn.)
� Value of material inputs is derived using the input-output ratio at current prices
� Input rates pertaining to public sector are utilized.
(2) lignite � Indian Bureau of Mines
for production and prices
� Neyveli Lignite
� Value of output = production * current year price
� Value of material inputs are directly available
� Value of output = production * base year price
� Value of material inputs are directly available
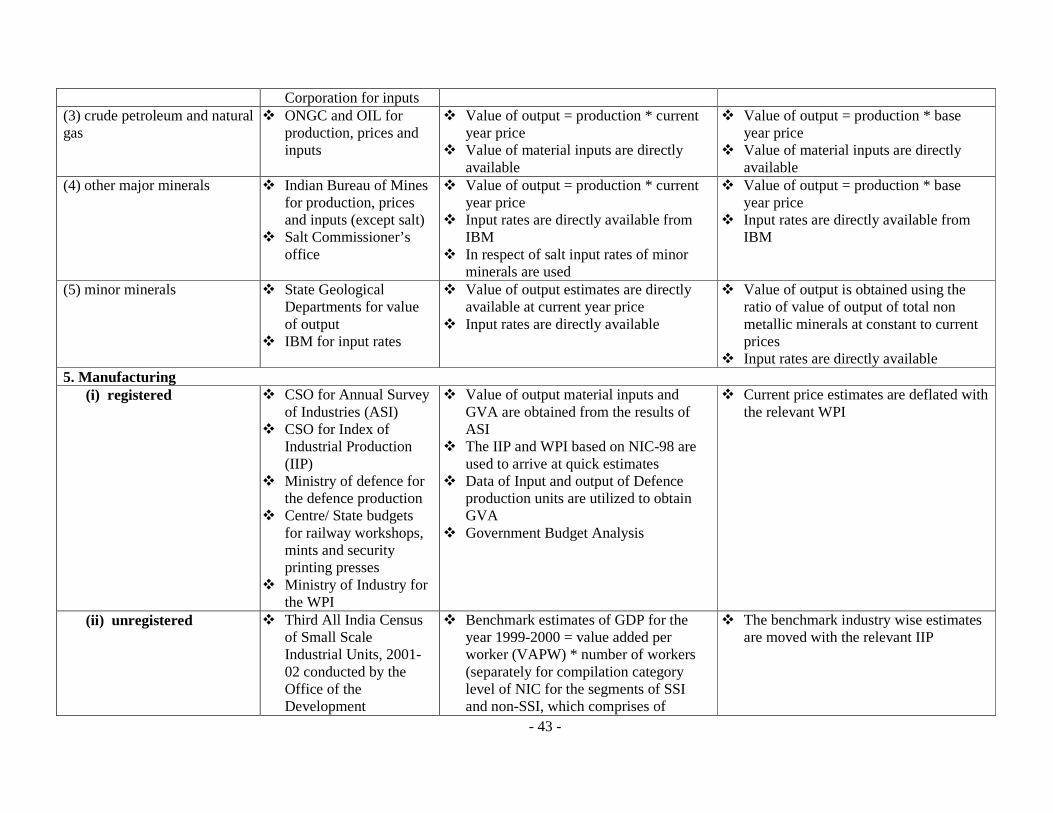
- 43 -
Corporation for inputs (3) crude petroleum and natural gas
� ONGC and OIL for production, prices and inputs
� Value of output = production * current year price
� Value of material inputs are directly available
� Value of output = production * base year price
� Value of material inputs are directly available
(4) other major minerals � Indian Bureau of Mines for production, prices and inputs (except salt)
� Salt Commissioner’s office
� Value of output = production * current year price
� Input rates are directly available from IBM
� In respect of salt input rates of minor minerals are used
� Value of output = production * base year price
� Input rates are directly available from IBM
(5) minor minerals � State Geological Departments for value of output
� IBM for input rates
� Value of output estimates are directly available at current year price
� Input rates are directly available
� Value of output is obtained using the ratio of value of output of total non metallic minerals at constant to current prices
� Input rates are directly available 5. Manufacturing
(i) registered � CSO for Annual Survey of Industries (ASI)
� CSO for Index of Industrial Production (IIP)
� Ministry of defence for the defence production
� Centre/ State budgets for railway workshops, mints and security printing presses
� Ministry of Industry for the WPI
� Value of output material inputs and GVA are obtained from the results of ASI
� The IIP and WPI based on NIC-98 are used to arrive at quick estimates
� Data of Input and output of Defence production units are utilized to obtain GVA
� Government Budget Analysis
� Current price estimates are deflated with the relevant WPI
(ii) unregistered � Third All India Census of Small Scale Industrial Units, 2001-02 conducted by the Office of the Development
� Benchmark estimates of GDP for the year 1999-2000 = value added per worker (VAPW) * number of workers (separately for compilation category level of NIC for the segments of SSI and non-SSI, which comprises of
� The benchmark industry wise estimates are moved with the relevant IIP
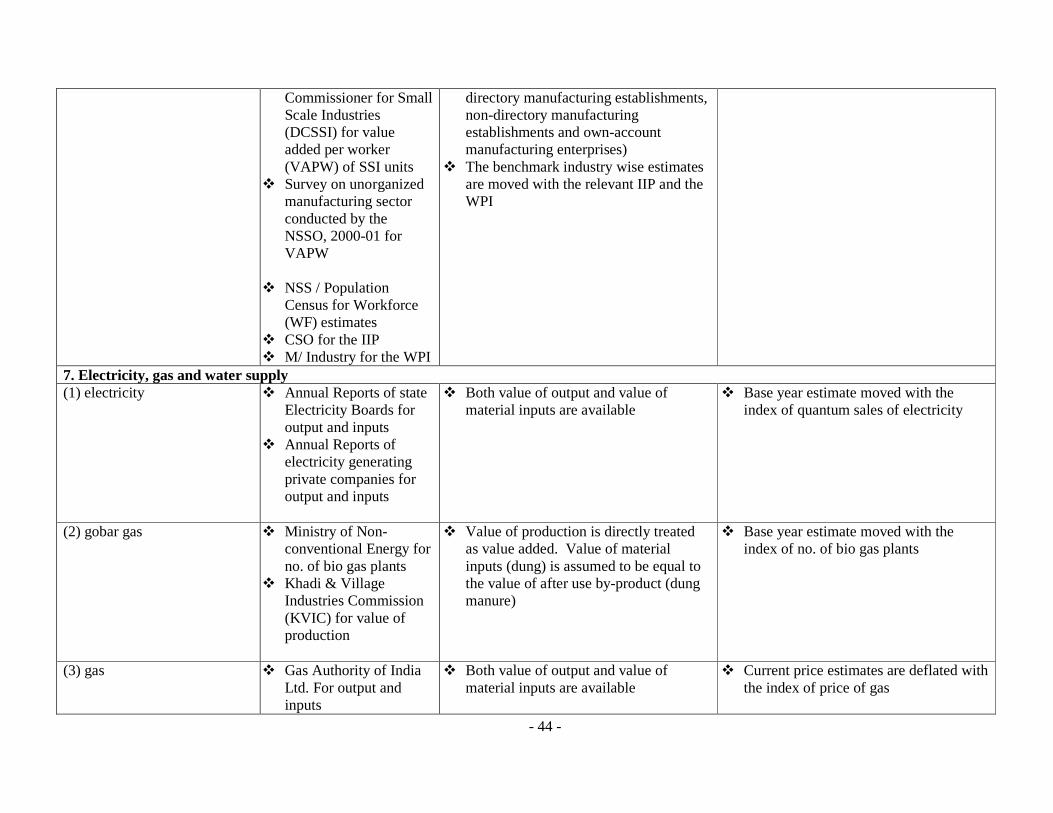
- 44 -
Commissioner for Small Scale Industries (DCSSI) for value added per worker (VAPW) of SSI units
� Survey on unorganized manufacturing sector conducted by the NSSO, 2000-01 for VAPW
� NSS / Population
Census for Workforce (WF) estimates
� CSO for the IIP � M/ Industry for the WPI
directory manufacturing establishments, non-directory manufacturing establishments and own-account manufacturing enterprises)
� The benchmark industry wise estimates are moved with the relevant IIP and the WPI
7. Electricity, gas and water supply (1) electricity � Annual Reports of state
Electricity Boards for output and inputs
� Annual Reports of electricity generating private companies for output and inputs
� Both value of output and value of material inputs are available
� Base year estimate moved with the index of quantum sales of electricity
(2) gobar gas � Ministry of Non-conventional Energy for no. of bio gas plants
� Khadi & Village Industries Commission (KVIC) for value of production
� Value of production is directly treated as value added. Value of material inputs (dung) is assumed to be equal to the value of after use by-product (dung manure)
� Base year estimate moved with the index of no. of bio gas plants
(3) gas � Gas Authority of India Ltd. For output and inputs
� Both value of output and value of material inputs are available
� Current price estimates are deflated with the index of price of gas
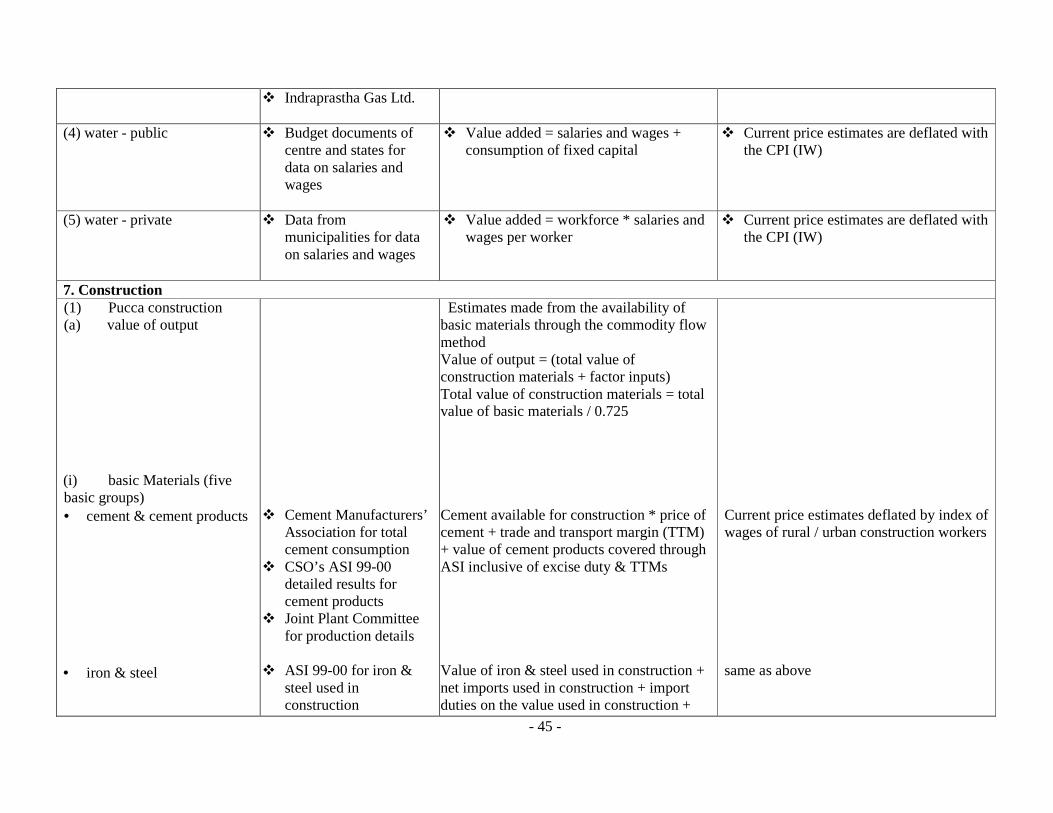
- 45 -
� Indraprastha Gas Ltd.
(4) water - public � Budget documents of centre and states for data on salaries and wages
� Value added = salaries and wages + consumption of fixed capital
� Current price estimates are deflated with the CPI (IW)
(5) water - private � Data from municipalities for data on salaries and wages
� Value added = workforce * salaries and wages per worker
� Current price estimates are deflated with the CPI (IW)
7. Construction (1) Pucca construction (a) value of output (i) basic Materials (five basic groups) • cement & cement products • iron & steel
� Cement Manufacturers’
Association for total cement consumption
� CSO’s ASI 99-00 detailed results for cement products
� Joint Plant Committee for production details
� ASI 99-00 for iron &
steel used in construction
Estimates made from the availability of basic materials through the commodity flow method Value of output = (total value of construction materials + factor inputs) Total value of construction materials = total value of basic materials / 0.725 Cement available for construction * price of cement + trade and transport margin (TTM) + value of cement products covered through ASI inclusive of excise duty & TTMs Value of iron & steel used in construction + net imports used in construction + import duties on the value used in construction +
Current price estimates deflated by index of wages of rural / urban construction workers same as above
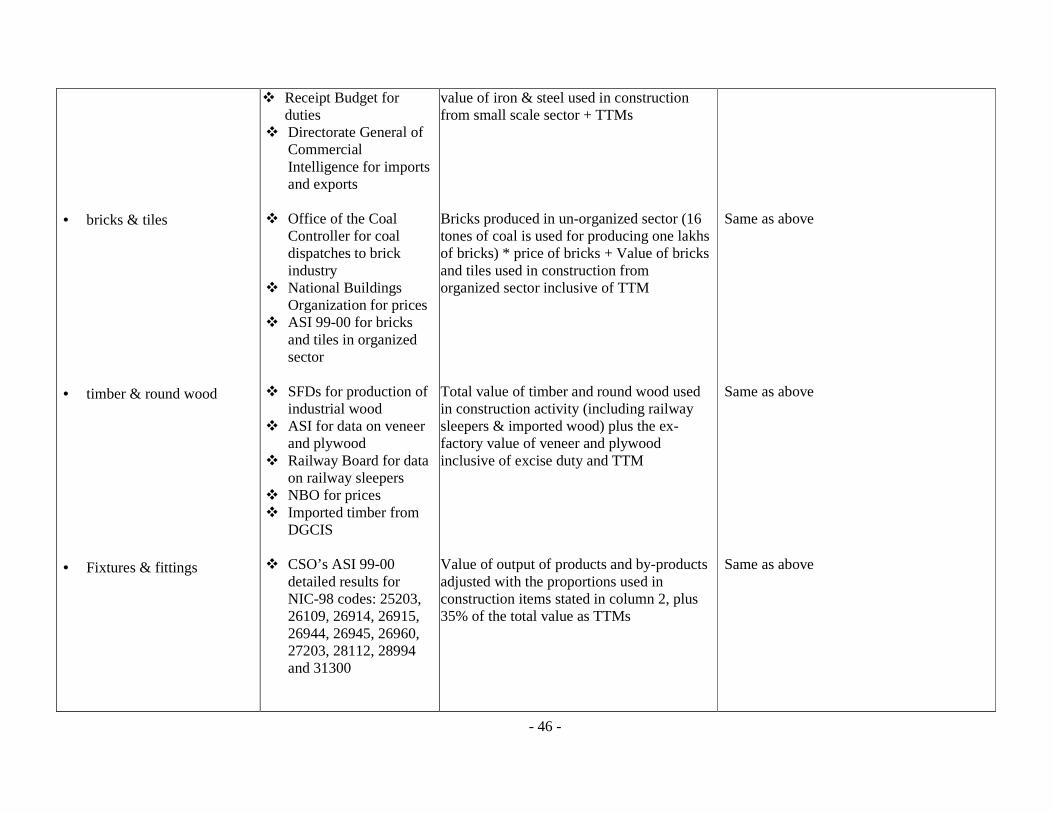
- 46 -
• bricks & tiles • timber & round wood • Fixtures & fittings
� Receipt Budget for duties
� Directorate General of Commercial Intelligence for imports and exports
� Office of the Coal
Controller for coal dispatches to brick industry
� National Buildings Organization for prices
� ASI 99-00 for bricks and tiles in organized sector
� SFDs for production of
industrial wood � ASI for data on veneer
and plywood � Railway Board for data
on railway sleepers � NBO for prices � Imported timber from
DGCIS � CSO’s ASI 99-00
detailed results for NIC-98 codes: 25203, 26109, 26914, 26915, 26944, 26945, 26960, 27203, 28112, 28994 and 31300
value of iron & steel used in construction from small scale sector + TTMs Bricks produced in un-organized sector (16 tones of coal is used for producing one lakhs of bricks) * price of bricks + Value of bricks and tiles used in construction from organized sector inclusive of TTM Total value of timber and round wood used in construction activity (including railway sleepers & imported wood) plus the ex-factory value of veneer and plywood inclusive of excise duty and TTM Value of output of products and by-products adjusted with the proportions used in construction items stated in column 2, plus 35% of the total value as TTMs
Same as above Same as above Same as above
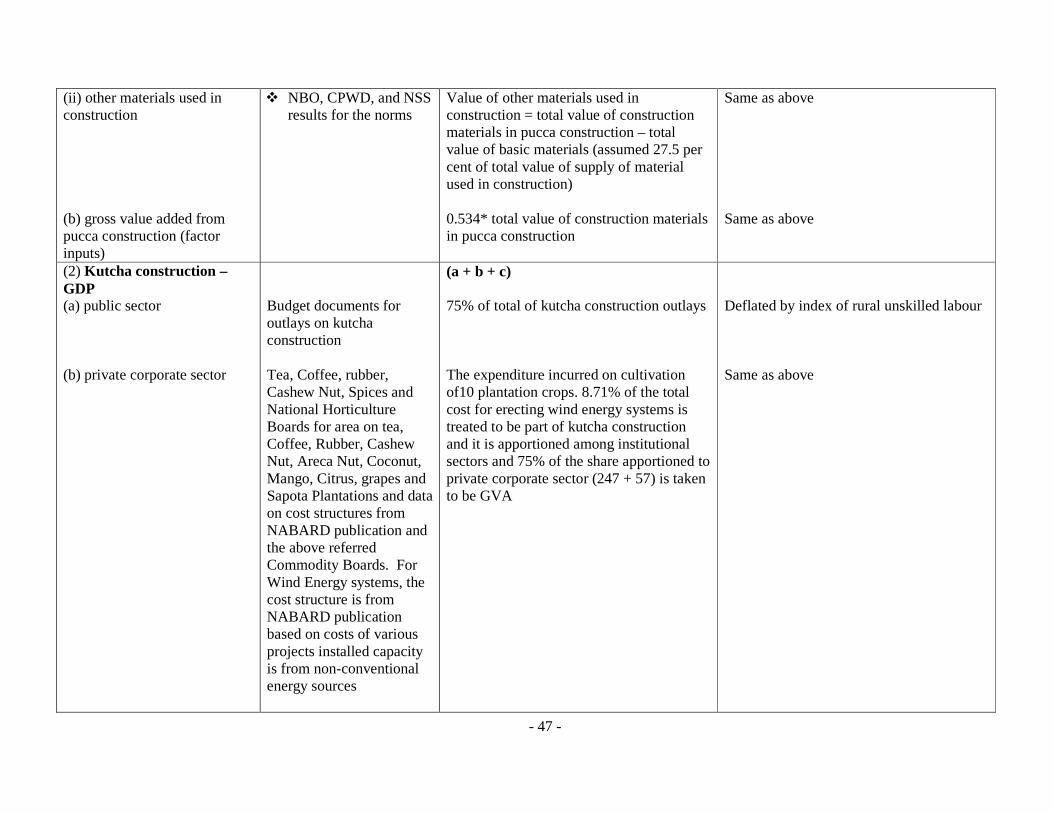
- 47 -
(ii) other materials used in construction (b) gross value added from pucca construction (factor inputs)
� NBO, CPWD, and NSS results for the norms
Value of other materials used in construction = total value of construction materials in pucca construction – total value of basic materials (assumed 27.5 per cent of total value of supply of material used in construction) 0.534* total value of construction materials in pucca construction
Same as above Same as above
(2) Kutcha construction – GDP (a) public sector (b) private corporate sector
Budget documents for outlays on kutcha construction Tea, Coffee, rubber, Cashew Nut, Spices and National Horticulture Boards for area on tea, Coffee, Rubber, Cashew Nut, Areca Nut, Coconut, Mango, Citrus, grapes and Sapota Plantations and data on cost structures from NABARD publication and the above referred Commodity Boards. For Wind Energy systems, the cost structure is from NABARD publication based on costs of various projects installed capacity is from non-conventional energy sources
(a + b + c) 75% of total of kutcha construction outlays The expenditure incurred on cultivation of10 plantation crops. 8.71% of the total cost for erecting wind energy systems is treated to be part of kutcha construction and it is apportioned among institutional sectors and 75% of the share apportioned to private corporate sector (247 + 57) is taken to be GVA
Deflated by index of rural unskilled labour Same as above
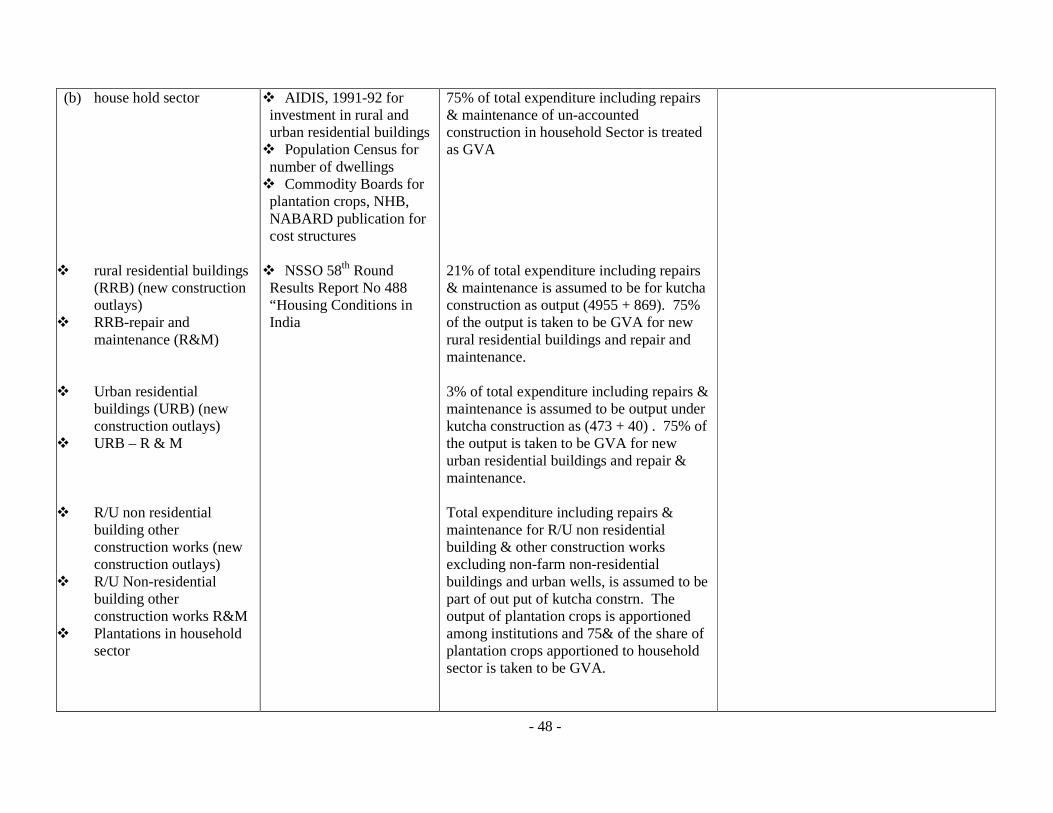
- 48 -
(b) house hold sector � rural residential buildings
(RRB) (new construction outlays)
� RRB-repair and maintenance (R&M)
� Urban residential
buildings (URB) (new construction outlays)
� URB – R & M � R/U non residential
building other construction works (new construction outlays)
� R/U Non-residential building other construction works R&M
� Plantations in household sector
� AIDIS, 1991-92 for investment in rural and urban residential buildings � Population Census for number of dwellings � Commodity Boards for plantation crops, NHB, NABARD publication for cost structures
� NSSO 58th Round Results Report No 488 “Housing Conditions in India
75% of total expenditure including repairs & maintenance of un-accounted construction in household Sector is treated as GVA 21% of total expenditure including repairs & maintenance is assumed to be for kutcha construction as output (4955 + 869). 75% of the output is taken to be GVA for new rural residential buildings and repair and maintenance. 3% of total expenditure including repairs & maintenance is assumed to be output under kutcha construction as (473 + 40) . 75% of the output is taken to be GVA for new urban residential buildings and repair & maintenance. Total expenditure including repairs & maintenance for R/U non residential building & other construction works excluding non-farm non-residential buildings and urban wells, is assumed to be part of out put of kutcha constrn. The output of plantation crops is apportioned among institutions and 75& of the share of plantation crops apportioned to household sector is taken to be GVA.
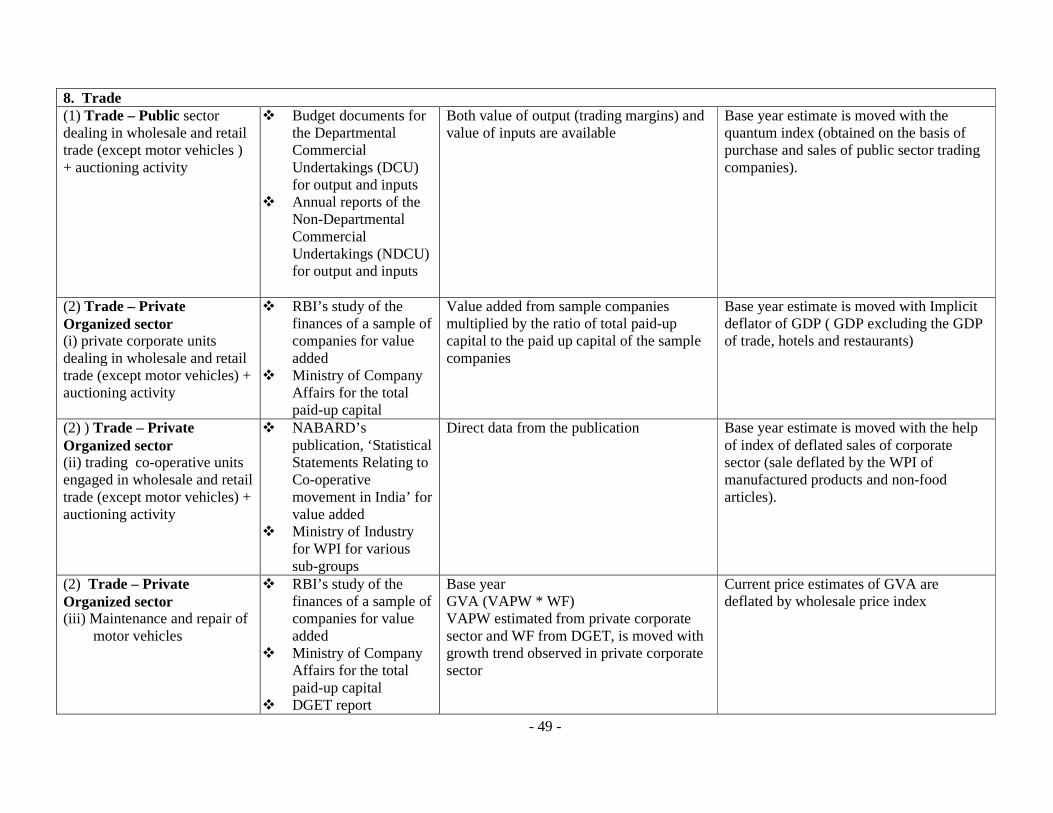
- 49 -
8. Trade (1) Trade – Public sector dealing in wholesale and retail trade (except motor vehicles ) + auctioning activity
� Budget documents for the Departmental Commercial Undertakings (DCU) for output and inputs
� Annual reports of the Non-Departmental Commercial Undertakings (NDCU) for output and inputs
Both value of output (trading margins) and value of inputs are available
Base year estimate is moved with the quantum index (obtained on the basis of purchase and sales of public sector trading companies).
(2) Trade – Private Organized sector (i) private corporate units dealing in wholesale and retail trade (except motor vehicles) + auctioning activity
� RBI’s study of the finances of a sample of companies for value added
� Ministry of Company Affairs for the total paid-up capital
Value added from sample companies multiplied by the ratio of total paid-up capital to the paid up capital of the sample companies
Base year estimate is moved with Implicit deflator of GDP ( GDP excluding the GDP of trade, hotels and restaurants)
(2) ) Trade – Private Organized sector (ii) trading co-operative units engaged in wholesale and retail trade (except motor vehicles) + auctioning activity
� NABARD’s publication, ‘Statistical Statements Relating to Co-operative movement in India’ for value added
� Ministry of Industry for WPI for various sub-groups
Direct data from the publication Base year estimate is moved with the help of index of deflated sales of corporate sector (sale deflated by the WPI of manufactured products and non-food articles).
(2) Trade – Private Organized sector (iii) Maintenance and repair of
motor vehicles
� RBI’s study of the finances of a sample of companies for value added
� Ministry of Company Affairs for the total paid-up capital
� DGET report
Base year GVA (VAPW * WF) VAPW estimated from private corporate sector and WF from DGET, is moved with growth trend observed in private corporate sector
Current price estimates of GVA are deflated by wholesale price index
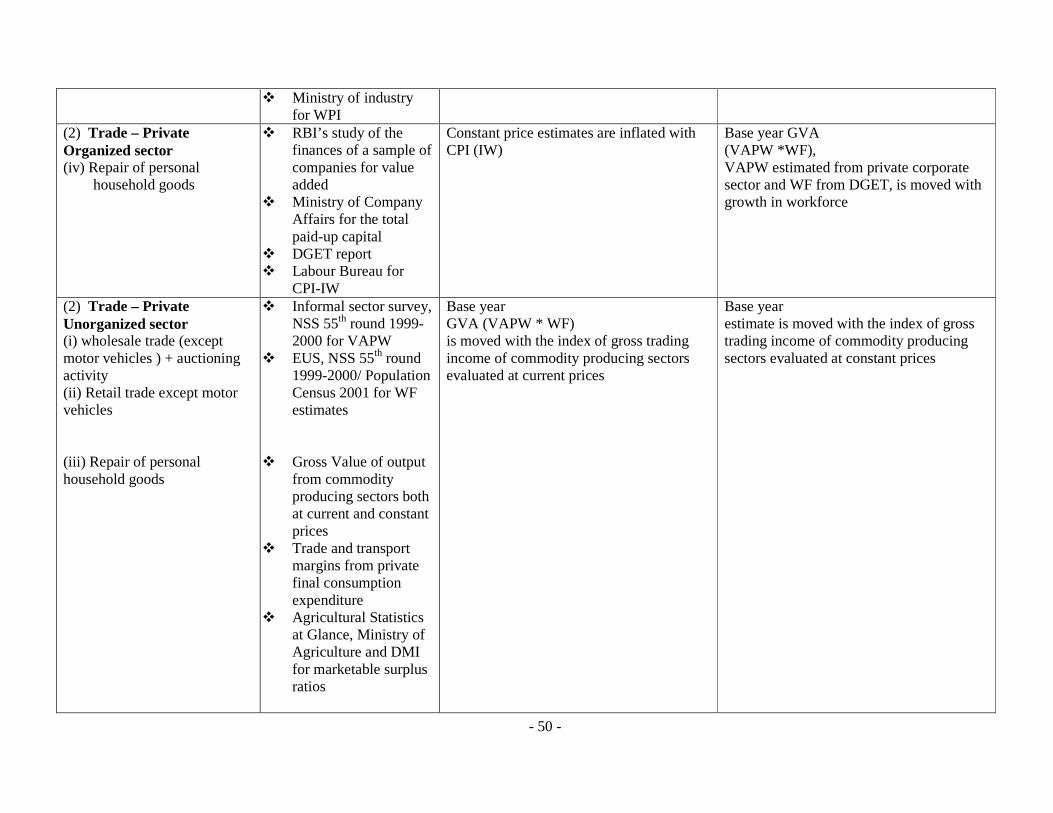
- 50 -
� Ministry of industry for WPI
(2) Trade – Private Organized sector (iv) Repair of personal
household goods
� RBI’s study of the finances of a sample of companies for value added
� Ministry of Company Affairs for the total paid-up capital
� DGET report � Labour Bureau for
CPI-IW
Constant price estimates are inflated with CPI (IW)
Base year GVA (VAPW *WF), VAPW estimated from private corporate sector and WF from DGET, is moved with growth in workforce
(2) Trade – Private Unorganized sector (i) wholesale trade (except motor vehicles ) + auctioning activity (ii) Retail trade except motor vehicles (iii) Repair of personal household goods
� Informal sector survey, NSS 55th round 1999-2000 for VAPW
� EUS, NSS 55th round 1999-2000/ Population Census 2001 for WF estimates
� Gross Value of output
from commodity producing sectors both at current and constant prices
� Trade and transport margins from private final consumption expenditure
� Agricultural Statistics at Glance, Ministry of Agriculture and DMI for marketable surplus ratios
Base year GVA (VAPW * WF) is moved with the index of gross trading income of commodity producing sectors evaluated at current prices
Base year estimate is moved with the index of gross trading income of commodity producing sectors evaluated at constant prices
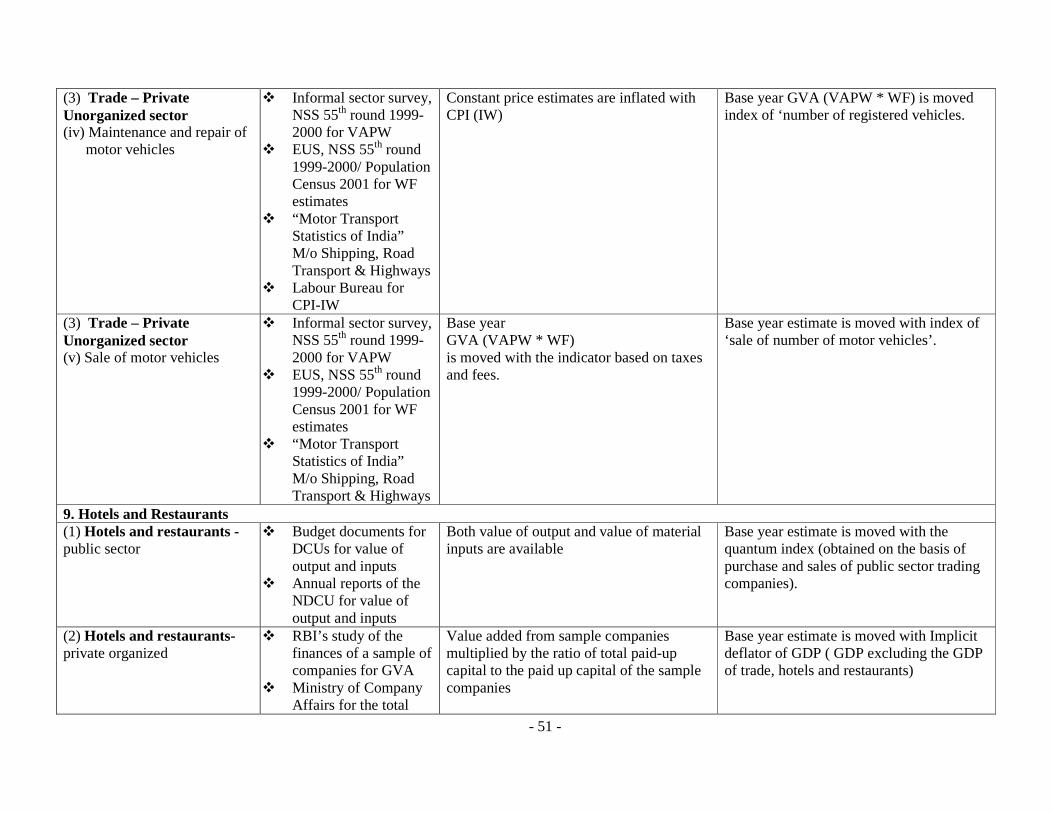
- 51 -
(3) Trade – Private Unorganized sector (iv) Maintenance and repair of
motor vehicles
� Informal sector survey, NSS 55th round 1999-2000 for VAPW
� EUS, NSS 55th round 1999-2000/ Population Census 2001 for WF estimates
� “Motor Transport Statistics of India” M/o Shipping, Road Transport & Highways
� Labour Bureau for CPI-IW
Constant price estimates are inflated with CPI (IW)
Base year GVA (VAPW * WF) is moved index of ‘number of registered vehicles.
(3) Trade – Private Unorganized sector (v) Sale of motor vehicles
� Informal sector survey, NSS 55th round 1999-2000 for VAPW
� EUS, NSS 55th round 1999-2000/ Population Census 2001 for WF estimates
� “Motor Transport Statistics of India” M/o Shipping, Road Transport & Highways
Base year GVA (VAPW * WF) is moved with the indicator based on taxes and fees.
Base year estimate is moved with index of ‘sale of number of motor vehicles’.
9. Hotels and Restaurants (1) Hotels and restaurants -public sector
� Budget documents for DCUs for value of output and inputs
� Annual reports of the NDCU for value of output and inputs
Both value of output and value of material inputs are available
Base year estimate is moved with the quantum index (obtained on the basis of purchase and sales of public sector trading companies).
(2) Hotels and restaurants- private organized
� RBI’s study of the finances of a sample of companies for GVA
� Ministry of Company Affairs for the total
Value added from sample companies multiplied by the ratio of total paid-up capital to the paid up capital of the sample companies
Base year estimate is moved with Implicit deflator of GDP ( GDP excluding the GDP of trade, hotels and restaurants)
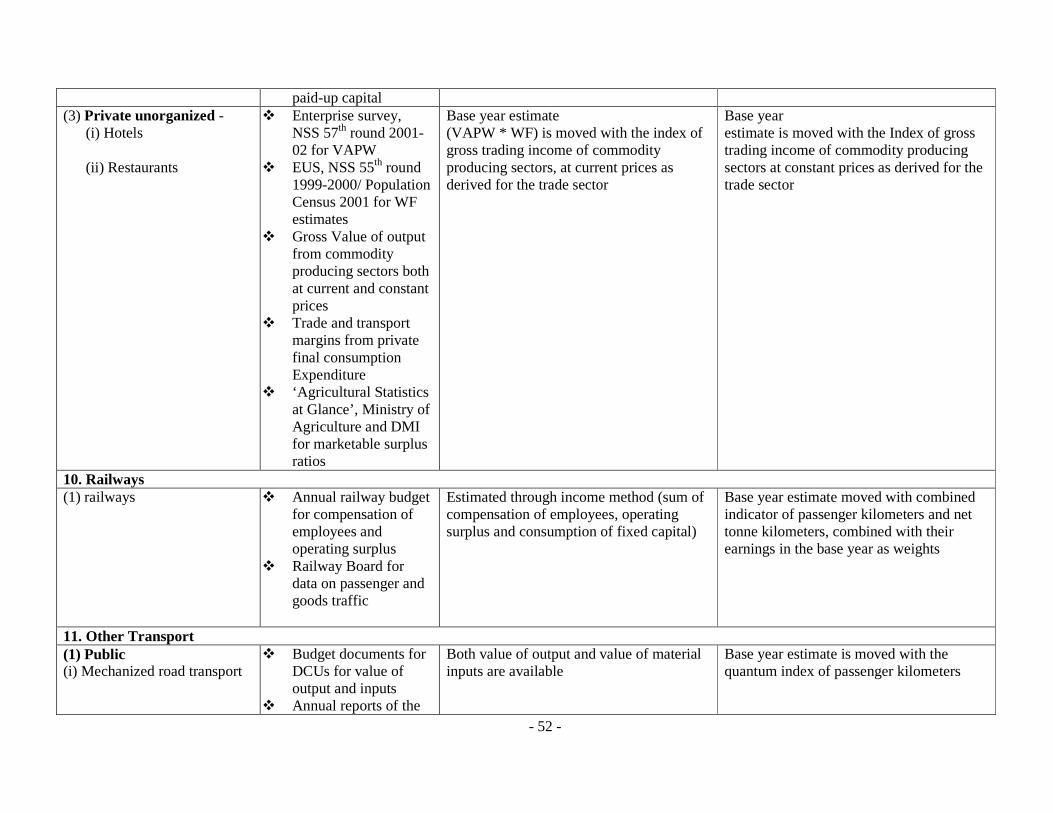
- 52 -
paid-up capital (3) Private unorganized -
(i) Hotels (ii) Restaurants
� Enterprise survey, NSS 57th round 2001-02 for VAPW
� EUS, NSS 55th round 1999-2000/ Population Census 2001 for WF estimates
� Gross Value of output from commodity producing sectors both at current and constant prices
� Trade and transport margins from private final consumption Expenditure
� ‘Agricultural Statistics at Glance’, Ministry of Agriculture and DMI for marketable surplus ratios
Base year estimate (VAPW * WF) is moved with the index of gross trading income of commodity producing sectors, at current prices as derived for the trade sector
Base year estimate is moved with the Index of gross trading income of commodity producing sectors at constant prices as derived for the trade sector
10. Railways (1) railways � Annual railway budget
for compensation of employees and operating surplus
� Railway Board for data on passenger and goods traffic
Estimated through income method (sum of compensation of employees, operating surplus and consumption of fixed capital)
Base year estimate moved with combined indicator of passenger kilometers and net tonne kilometers, combined with their earnings in the base year as weights
11. Other Transport (1) Public (i) Mechanized road transport
� Budget documents for DCUs for value of output and inputs
� Annual reports of the
Both value of output and value of material inputs are available
Base year estimate is moved with the quantum index of passenger kilometers
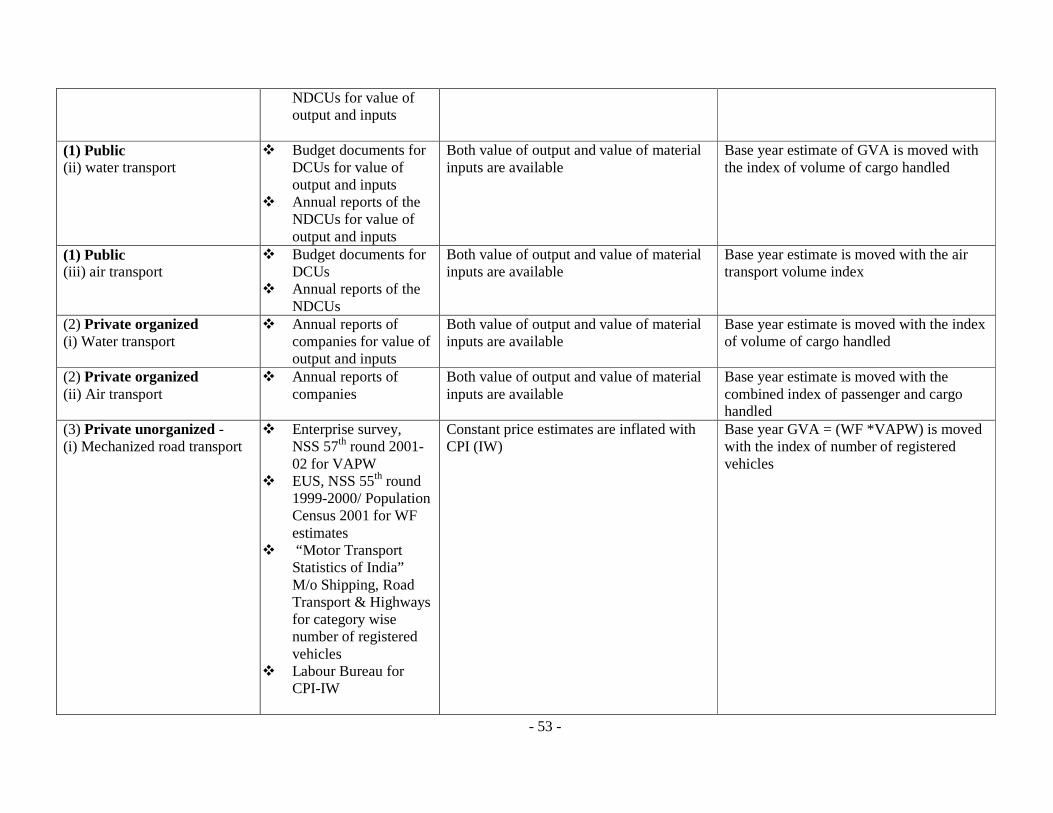
- 53 -
NDCUs for value of output and inputs
(1) Public (ii) water transport
� Budget documents for DCUs for value of output and inputs
� Annual reports of the NDCUs for value of output and inputs
Both value of output and value of material inputs are available
Base year estimate of GVA is moved with the index of volume of cargo handled
(1) Public (iii) air transport
� Budget documents for DCUs
� Annual reports of the NDCUs
Both value of output and value of material inputs are available
Base year estimate is moved with the air transport volume index
(2) Private organized (i) Water transport
� Annual reports of companies for value of output and inputs
Both value of output and value of material inputs are available
Base year estimate is moved with the index of volume of cargo handled
(2) Private organized (ii) Air transport
� Annual reports of companies
Both value of output and value of material inputs are available
Base year estimate is moved with the combined index of passenger and cargo handled
(3) Private unorganized - (i) Mechanized road transport
� Enterprise survey, NSS 57th round 2001-02 for VAPW
� EUS, NSS 55th round 1999-2000/ Population Census 2001 for WF estimates
� “Motor Transport Statistics of India” M/o Shipping, Road Transport & Highways for category wise number of registered vehicles
� Labour Bureau for CPI-IW
Constant price estimates are inflated with CPI (IW)
Base year GVA = (WF *VAPW) is moved with the index of number of registered vehicles
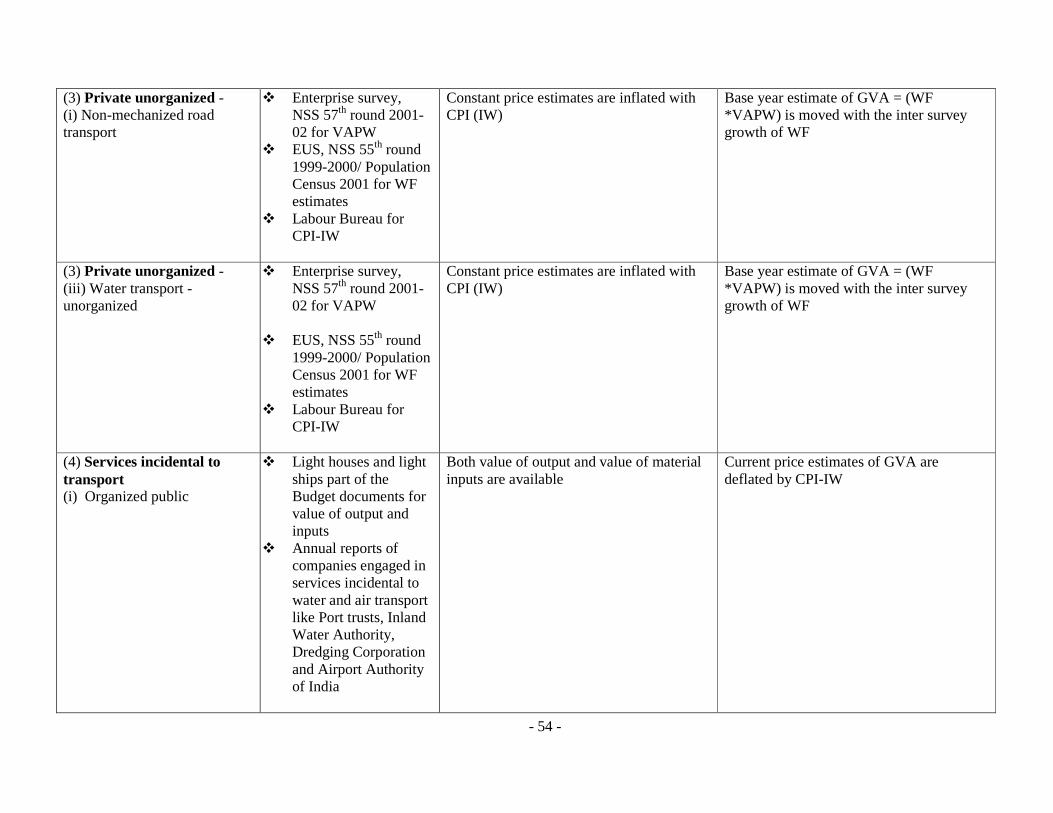
- 54 -
(3) Private unorganized - (i) Non-mechanized road transport
� Enterprise survey, NSS 57th round 2001-02 for VAPW
� EUS, NSS 55th round 1999-2000/ Population Census 2001 for WF estimates
� Labour Bureau for CPI-IW
Constant price estimates are inflated with CPI (IW)
Base year estimate of GVA = (WF *VAPW) is moved with the inter survey growth of WF
(3) Private unorganized - (iii) Water transport -unorganized
� Enterprise survey, NSS 57th round 2001-02 for VAPW
� EUS, NSS 55th round
1999-2000/ Population Census 2001 for WF estimates
� Labour Bureau for CPI-IW
Constant price estimates are inflated with CPI (IW)
Base year estimate of GVA = (WF *VAPW) is moved with the inter survey growth of WF
(4) Services incidental to transport (i) Organized public
� Light houses and light ships part of the Budget documents for value of output and inputs
� Annual reports of companies engaged in services incidental to water and air transport like Port trusts, Inland Water Authority, Dredging Corporation and Airport Authority of India
Both value of output and value of material inputs are available
Current price estimates of GVA are deflated by CPI-IW
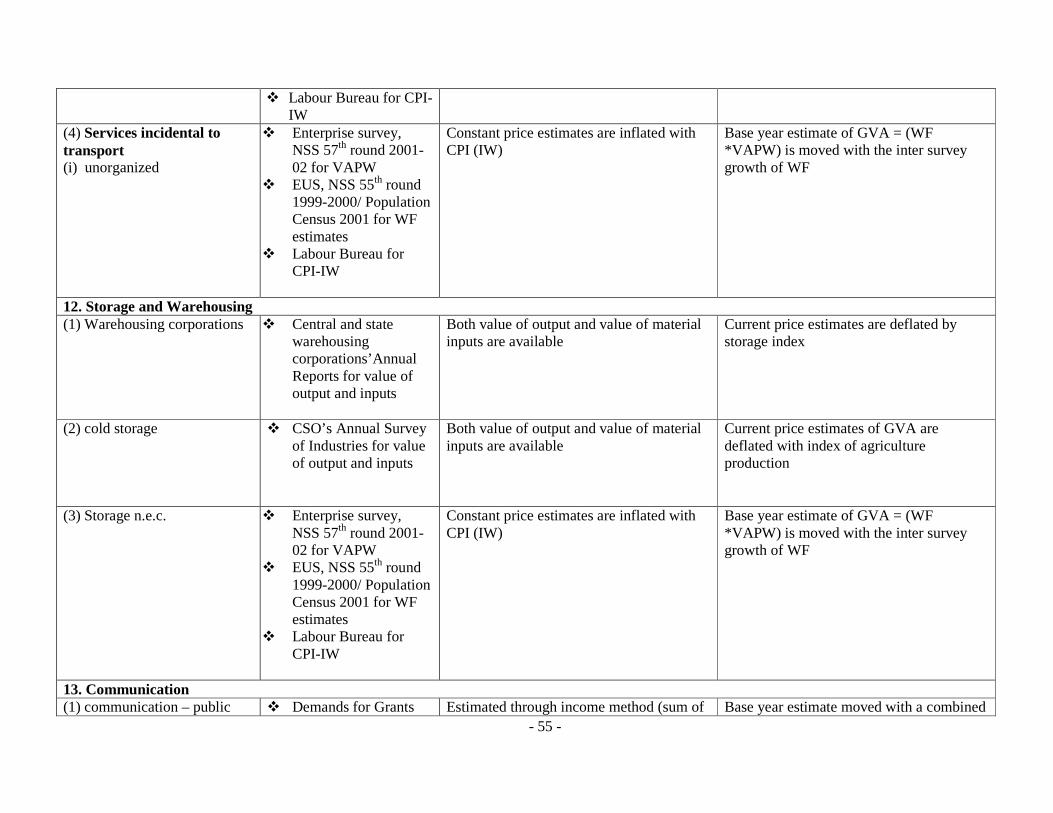
- 55 -
� Labour Bureau for CPI-IW
(4) Services incidental to transport (i) unorganized
� Enterprise survey, NSS 57th round 2001-02 for VAPW
� EUS, NSS 55th round 1999-2000/ Population Census 2001 for WF estimates
� Labour Bureau for CPI-IW
Constant price estimates are inflated with CPI (IW)
Base year estimate of GVA = (WF *VAPW) is moved with the inter survey growth of WF
12. Storage and Warehousing (1) Warehousing corporations � Central and state
warehousing corporations’Annual Reports for value of output and inputs
Both value of output and value of material inputs are available
Current price estimates are deflated by storage index
(2) cold storage � CSO’s Annual Survey of Industries for value of output and inputs
Both value of output and value of material inputs are available
Current price estimates of GVA are deflated with index of agriculture production
(3) Storage n.e.c. � Enterprise survey, NSS 57th round 2001-02 for VAPW
� EUS, NSS 55th round 1999-2000/ Population Census 2001 for WF estimates
� Labour Bureau for CPI-IW
Constant price estimates are inflated with CPI (IW)
Base year estimate of GVA = (WF *VAPW) is moved with the inter survey growth of WF
13. Communication (1) communication – public � Demands for Grants Estimated through income method (sum of Base year estimate moved with a combined
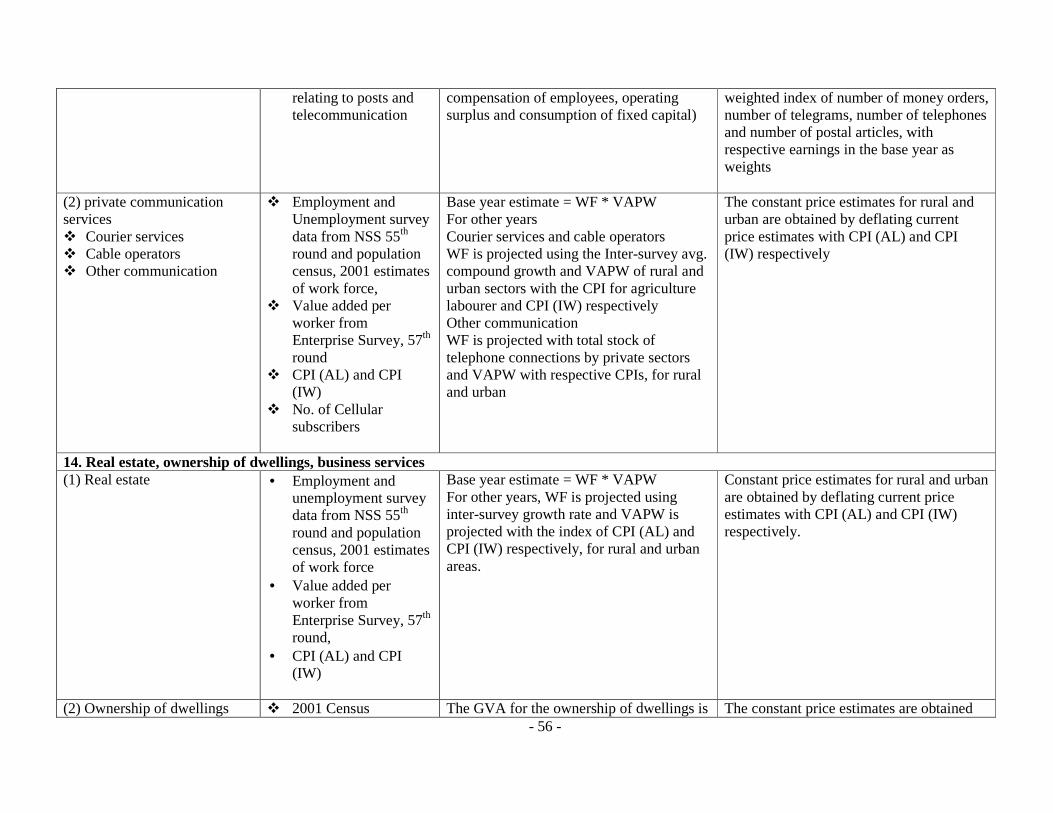
- 56 -
relating to posts and telecommunication
compensation of employees, operating surplus and consumption of fixed capital)
weighted index of number of money orders, number of telegrams, number of telephones and number of postal articles, with respective earnings in the base year as weights
(2) private communication services � Courier services � Cable operators � Other communication
� Employment and Unemployment survey data from NSS 55th round and population census, 2001 estimates of work force,
� Value added per worker from Enterprise Survey, 57th round
� CPI (AL) and CPI (IW)
� No. of Cellular subscribers
Base year estimate = WF * VAPW For other years Courier services and cable operators WF is projected using the Inter-survey avg. compound growth and VAPW of rural and urban sectors with the CPI for agriculture labourer and CPI (IW) respectively Other communication WF is projected with total stock of telephone connections by private sectors and VAPW with respective CPIs, for rural and urban
The constant price estimates for rural and urban are obtained by deflating current price estimates with CPI (AL) and CPI (IW) respectively
14. Real estate, ownership of dwellings, business services (1) Real estate • Employment and
unemployment survey data from NSS 55th round and population census, 2001 estimates of work force
• Value added per worker from Enterprise Survey, 57th round,
• CPI (AL) and CPI (IW)
Base year estimate = WF * VAPW For other years, WF is projected using inter-survey growth rate and VAPW is projected with the index of CPI (AL) and CPI (IW) respectively, for rural and urban areas.
Constant price estimates for rural and urban are obtained by deflating current price estimates with CPI (AL) and CPI (IW) respectively.
(2) Ownership of dwellings � 2001 Census The GVA for the ownership of dwellings is The constant price estimates are obtained
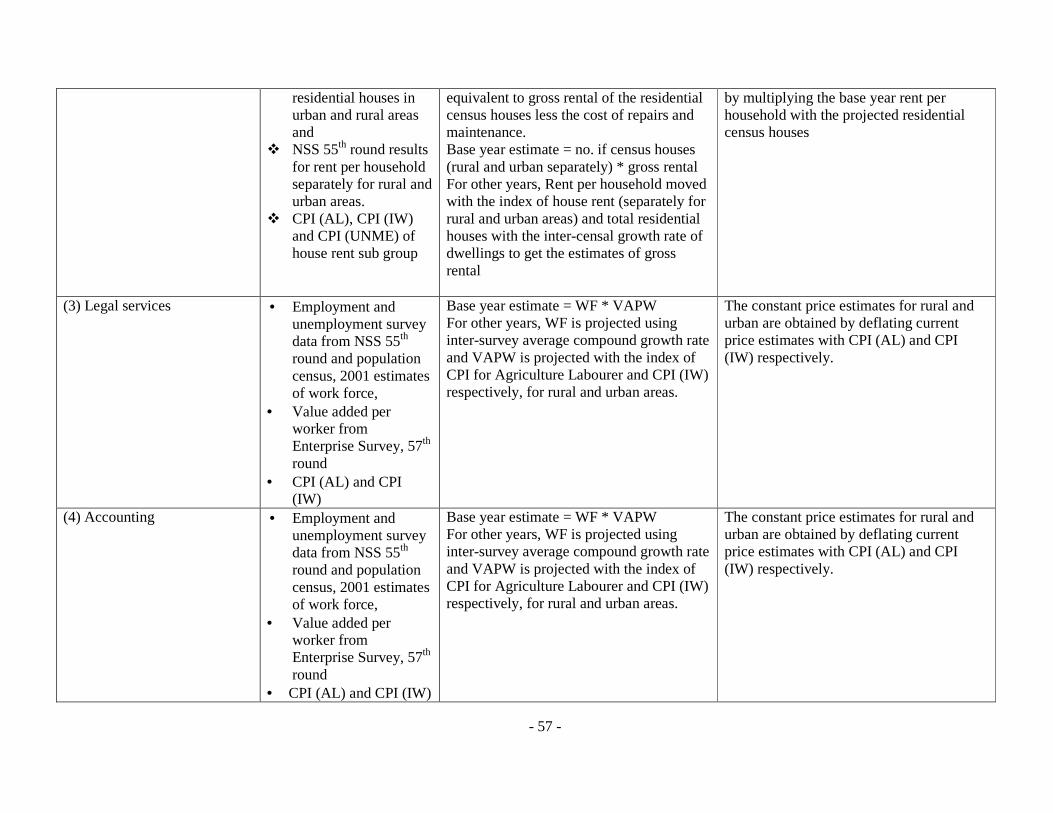
- 57 -
residential houses in urban and rural areas and
� NSS 55th round results for rent per household separately for rural and urban areas.
� CPI (AL), CPI (IW) and CPI (UNME) of house rent sub group
equivalent to gross rental of the residential census houses less the cost of repairs and maintenance. Base year estimate = no. if census houses (rural and urban separately) * gross rental For other years, Rent per household moved with the index of house rent (separately for rural and urban areas) and total residential houses with the inter-censal growth rate of dwellings to get the estimates of gross rental
by multiplying the base year rent per household with the projected residential census houses
(3) Legal services • Employment and unemployment survey data from NSS 55th round and population census, 2001 estimates of work force,
• Value added per worker from Enterprise Survey, 57th round
• CPI (AL) and CPI (IW)
Base year estimate = WF * VAPW For other years, WF is projected using inter-survey average compound growth rate and VAPW is projected with the index of CPI for Agriculture Labourer and CPI (IW) respectively, for rural and urban areas.
The constant price estimates for rural and urban are obtained by deflating current price estimates with CPI (AL) and CPI (IW) respectively.
(4) Accounting • Employment and unemployment survey data from NSS 55th round and population census, 2001 estimates of work force,
• Value added per worker from Enterprise Survey, 57th round
• CPI (AL) and CPI (IW)
Base year estimate = WF * VAPW For other years, WF is projected using inter-survey average compound growth rate and VAPW is projected with the index of CPI for Agriculture Labourer and CPI (IW) respectively, for rural and urban areas.
The constant price estimates for rural and urban are obtained by deflating current price estimates with CPI (AL) and CPI (IW) respectively.
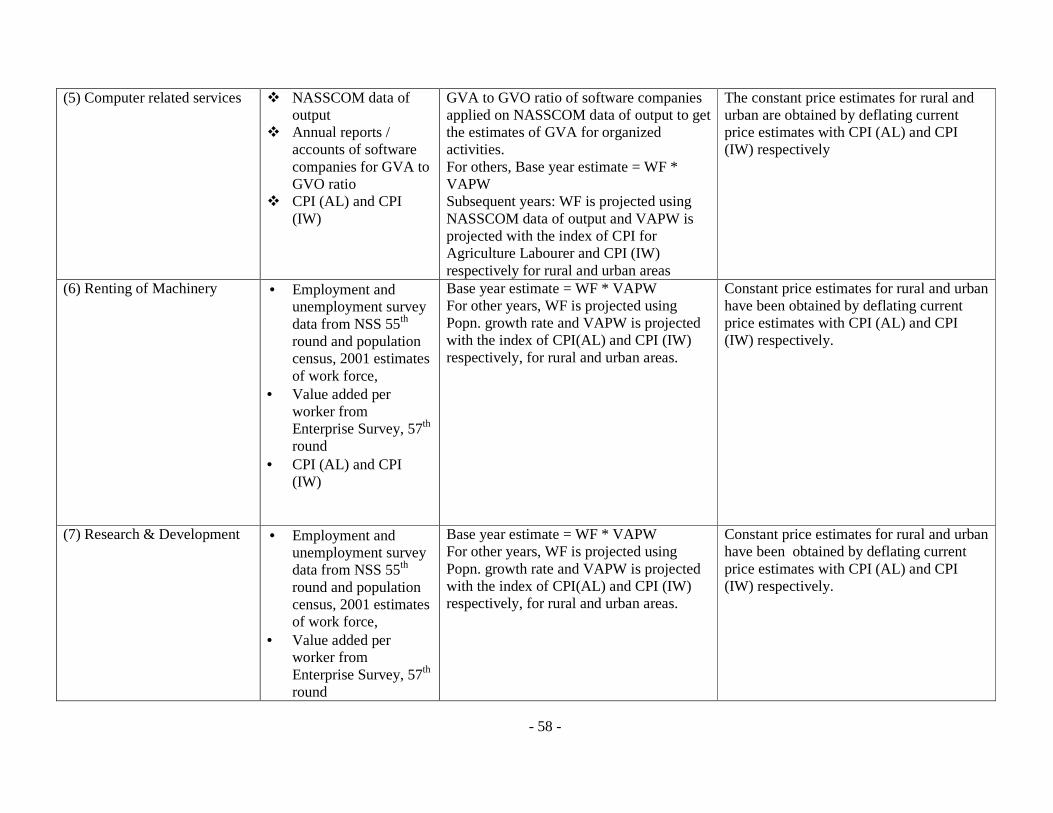
- 58 -
(5) Computer related services � NASSCOM data of output
� Annual reports / accounts of software companies for GVA to GVO ratio
� CPI (AL) and CPI (IW)
GVA to GVO ratio of software companies applied on NASSCOM data of output to get the estimates of GVA for organized activities. For others, Base year estimate = WF * VAPW Subsequent years: WF is projected using NASSCOM data of output and VAPW is projected with the index of CPI for Agriculture Labourer and CPI (IW) respectively for rural and urban areas
The constant price estimates for rural and urban are obtained by deflating current price estimates with CPI (AL) and CPI (IW) respectively
(6) Renting of Machinery • Employment and unemployment survey data from NSS 55th round and population census, 2001 estimates of work force,
• Value added per worker from Enterprise Survey, 57th round
• CPI (AL) and CPI (IW)
Base year estimate = WF * VAPW For other years, WF is projected using Popn. growth rate and VAPW is projected with the index of CPI(AL) and CPI (IW) respectively, for rural and urban areas.
Constant price estimates for rural and urban have been obtained by deflating current price estimates with CPI (AL) and CPI (IW) respectively.
(7) Research & Development • Employment and unemployment survey data from NSS 55th round and population census, 2001 estimates of work force,
• Value added per worker from Enterprise Survey, 57th round
Base year estimate = WF * VAPW For other years, WF is projected using Popn. growth rate and VAPW is projected with the index of CPI(AL) and CPI (IW) respectively, for rural and urban areas.
Constant price estimates for rural and urban have been obtained by deflating current price estimates with CPI (AL) and CPI (IW) respectively.
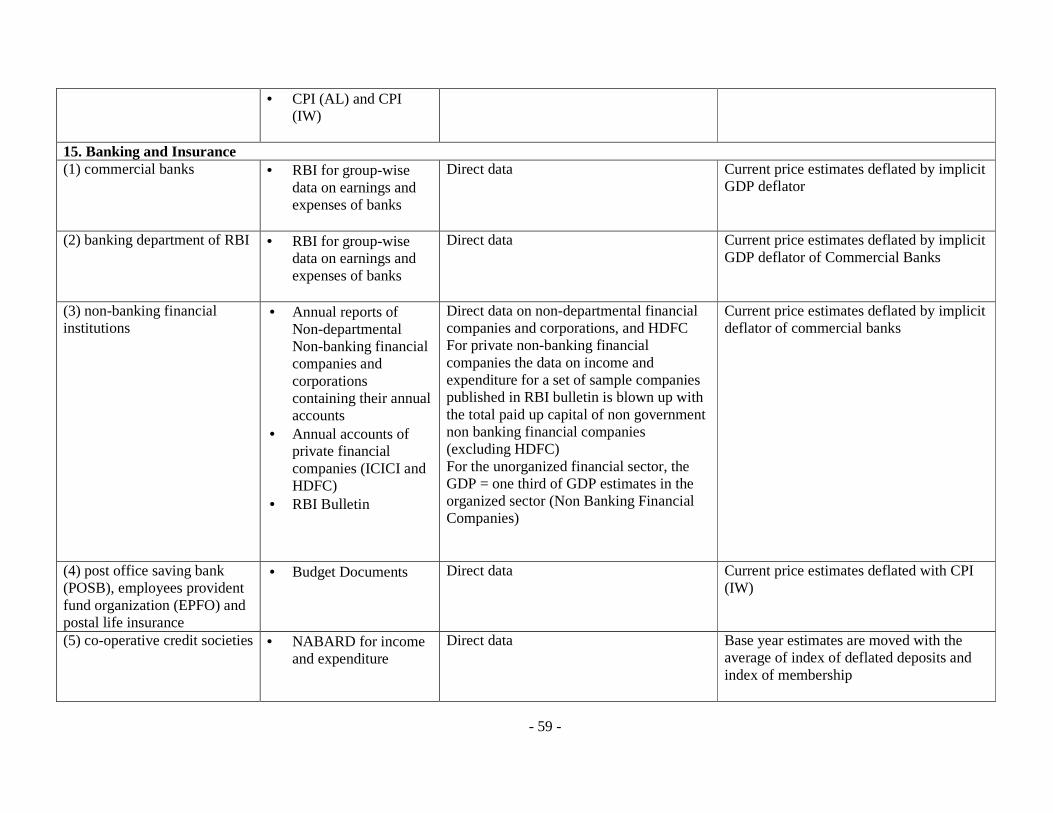
- 59 -
• CPI (AL) and CPI (IW)
15. Banking and Insurance (1) commercial banks • RBI for group-wise
data on earnings and expenses of banks
Direct data Current price estimates deflated by implicit GDP deflator
(2) banking department of RBI • RBI for group-wise data on earnings and expenses of banks
Direct data Current price estimates deflated by implicit GDP deflator of Commercial Banks
(3) non-banking financial institutions
• Annual reports of Non-departmental Non-banking financial companies and corporations containing their annual accounts
• Annual accounts of private financial companies (ICICI and HDFC)
• RBI Bulletin
Direct data on non-departmental financial companies and corporations, and HDFC For private non-banking financial companies the data on income and expenditure for a set of sample companies published in RBI bulletin is blown up with the total paid up capital of non government non banking financial companies (excluding HDFC) For the unorganized financial sector, the GDP = one third of GDP estimates in the organized sector (Non Banking Financial Companies)
Current price estimates deflated by implicit deflator of commercial banks
(4) post office saving bank (POSB), employees provident fund organization (EPFO) and postal life insurance
• Budget Documents Direct data Current price estimates deflated with CPI (IW)
(5) co-operative credit societies • NABARD for income and expenditure
Direct data Base year estimates are moved with the average of index of deflated deposits and index of membership
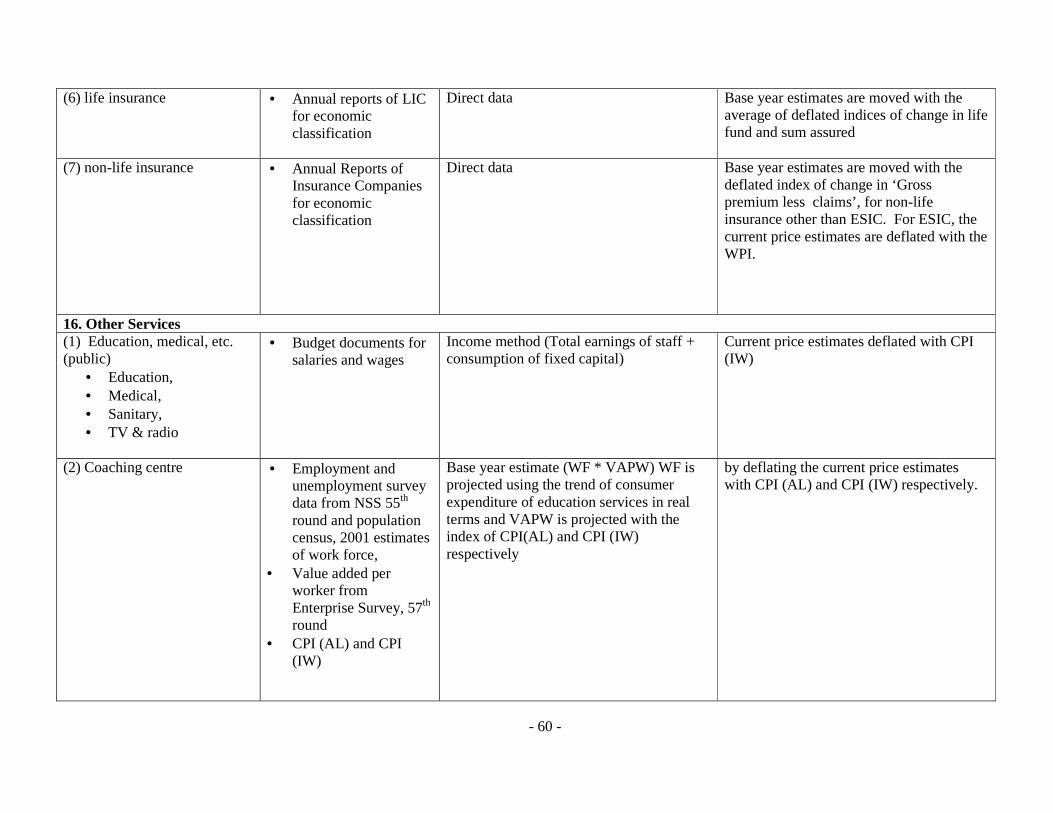
- 60 -
(6) life insurance • Annual reports of LIC for economic classification
Direct data Base year estimates are moved with the average of deflated indices of change in life fund and sum assured
(7) non-life insurance • Annual Reports of Insurance Companies for economic classification
Direct data Base year estimates are moved with the deflated index of change in ‘Gross premium less claims’, for non-life insurance other than ESIC. For ESIC, the current price estimates are deflated with the WPI.
16. Other Services (1) Education, medical, etc. (public)
• Education, • Medical, • Sanitary, • TV & radio
• Budget documents for salaries and wages
Income method (Total earnings of staff + consumption of fixed capital)
Current price estimates deflated with CPI (IW)
(2) Coaching centre • Employment and unemployment survey data from NSS 55th round and population census, 2001 estimates of work force,
• Value added per worker from Enterprise Survey, 57th round
• CPI (AL) and CPI (IW)
Base year estimate (WF * VAPW) WF is projected using the trend of consumer expenditure of education services in real terms and VAPW is projected with the index of CPI(AL) and CPI (IW) respectively
by deflating the current price estimates with CPI (AL) and CPI (IW) respectively.
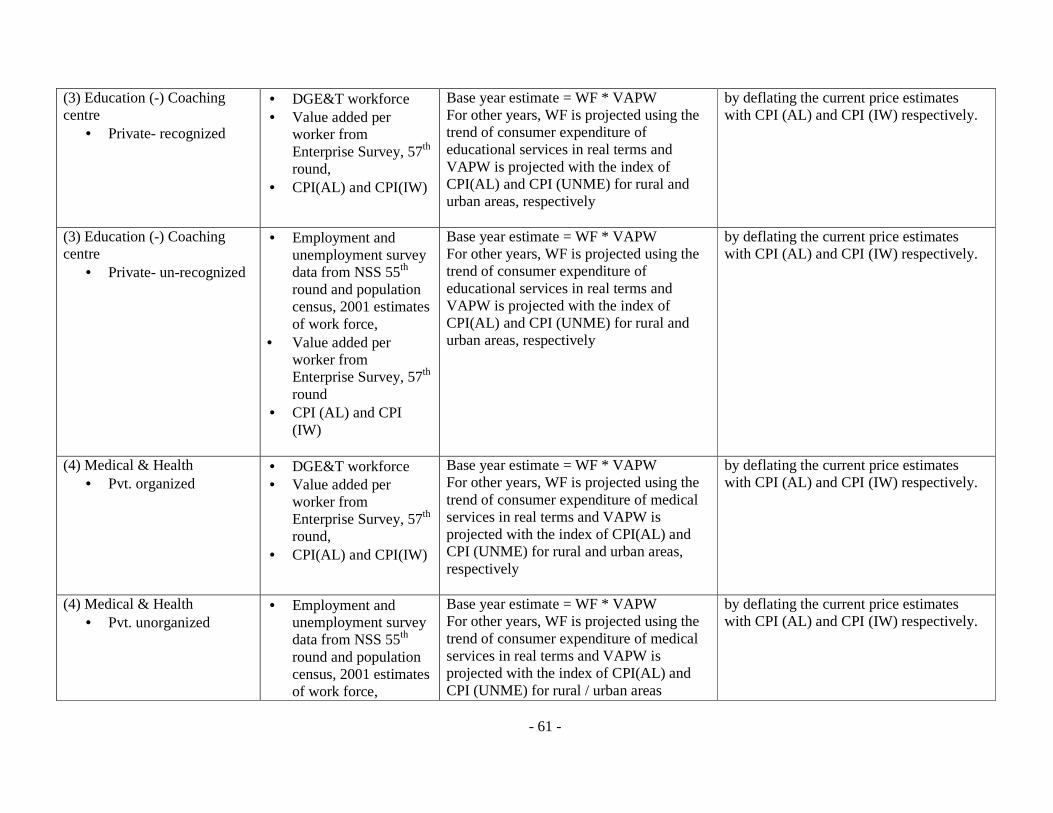
- 61 -
(3) Education (-) Coaching centre
• Private- recognized
• DGE&T workforce • Value added per
worker from Enterprise Survey, 57th round,
• CPI(AL) and CPI(IW)
Base year estimate = WF * VAPW For other years, WF is projected using the trend of consumer expenditure of educational services in real terms and VAPW is projected with the index of CPI(AL) and CPI (UNME) for rural and urban areas, respectively
by deflating the current price estimates with CPI (AL) and CPI (IW) respectively.
(3) Education (-) Coaching centre
• Private- un-recognized
• Employment and unemployment survey data from NSS 55th round and population census, 2001 estimates of work force,
• Value added per worker from Enterprise Survey, 57th round
• CPI (AL) and CPI (IW)
Base year estimate = WF * VAPW For other years, WF is projected using the trend of consumer expenditure of educational services in real terms and VAPW is projected with the index of CPI(AL) and CPI (UNME) for rural and urban areas, respectively
by deflating the current price estimates with CPI (AL) and CPI (IW) respectively.
(4) Medical & Health • Pvt. organized
• DGE&T workforce • Value added per
worker from Enterprise Survey, 57th round,
• CPI(AL) and CPI(IW)
Base year estimate = WF * VAPW For other years, WF is projected using the trend of consumer expenditure of medical services in real terms and VAPW is projected with the index of CPI(AL) and CPI (UNME) for rural and urban areas, respectively
by deflating the current price estimates with CPI (AL) and CPI (IW) respectively.
(4) Medical & Health • Pvt. unorganized
• Employment and unemployment survey data from NSS 55th round and population census, 2001 estimates of work force,
Base year estimate = WF * VAPW For other years, WF is projected using the trend of consumer expenditure of medical services in real terms and VAPW is projected with the index of CPI(AL) and CPI (UNME) for rural / urban areas
by deflating the current price estimates with CPI (AL) and CPI (IW) respectively.
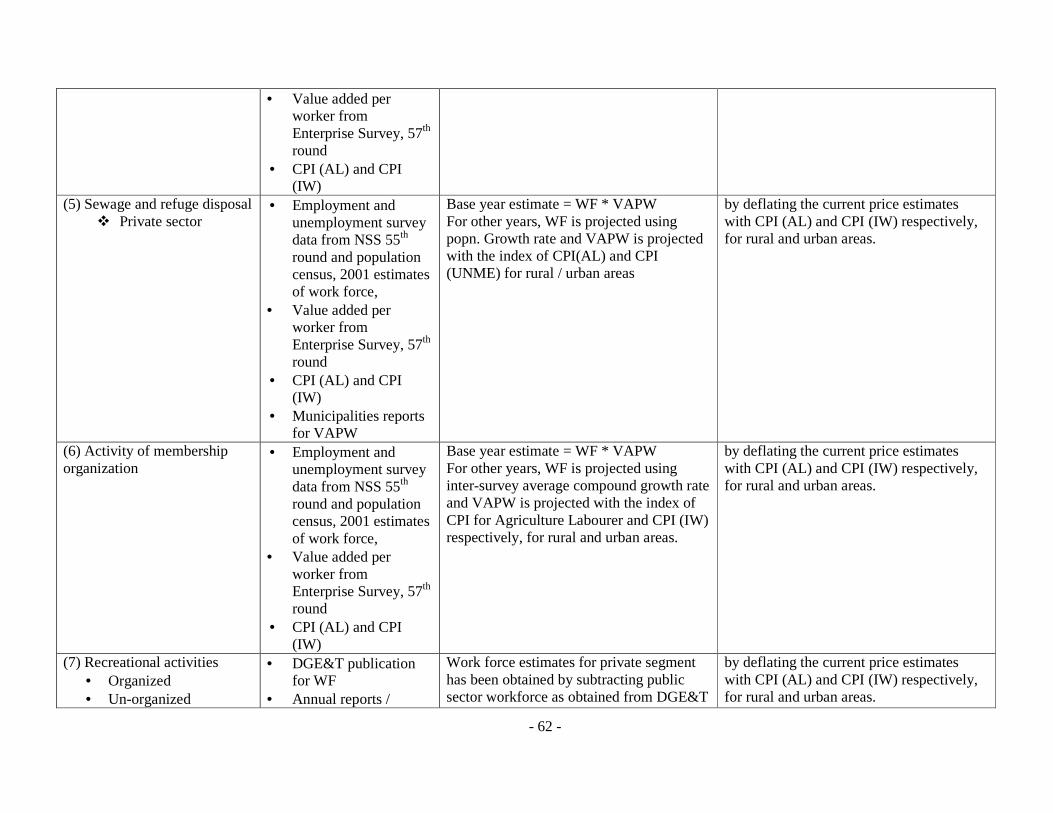
- 62 -
• Value added per worker from Enterprise Survey, 57th round
• CPI (AL) and CPI (IW)
(5) Sewage and refuge disposal � Private sector
• Employment and unemployment survey data from NSS 55th round and population census, 2001 estimates of work force,
• Value added per worker from Enterprise Survey, 57th round
• CPI (AL) and CPI (IW)
• Municipalities reports for VAPW
Base year estimate = WF * VAPW For other years, WF is projected using popn. Growth rate and VAPW is projected with the index of CPI(AL) and CPI (UNME) for rural / urban areas
by deflating the current price estimates with CPI (AL) and CPI (IW) respectively, for rural and urban areas.
(6) Activity of membership organization
• Employment and unemployment survey data from NSS 55th round and population census, 2001 estimates of work force,
• Value added per worker from Enterprise Survey, 57th round
• CPI (AL) and CPI (IW)
Base year estimate = WF * VAPW For other years, WF is projected using inter-survey average compound growth rate and VAPW is projected with the index of CPI for Agriculture Labourer and CPI (IW) respectively, for rural and urban areas.
by deflating the current price estimates with CPI (AL) and CPI (IW) respectively, for rural and urban areas.
(7) Recreational activities • Organized • Un-organized
• DGE&T publication for WF
• Annual reports /
Work force estimates for private segment has been obtained by subtracting public sector workforce as obtained from DGE&T
by deflating the current price estimates with CPI (AL) and CPI (IW) respectively, for rural and urban areas.
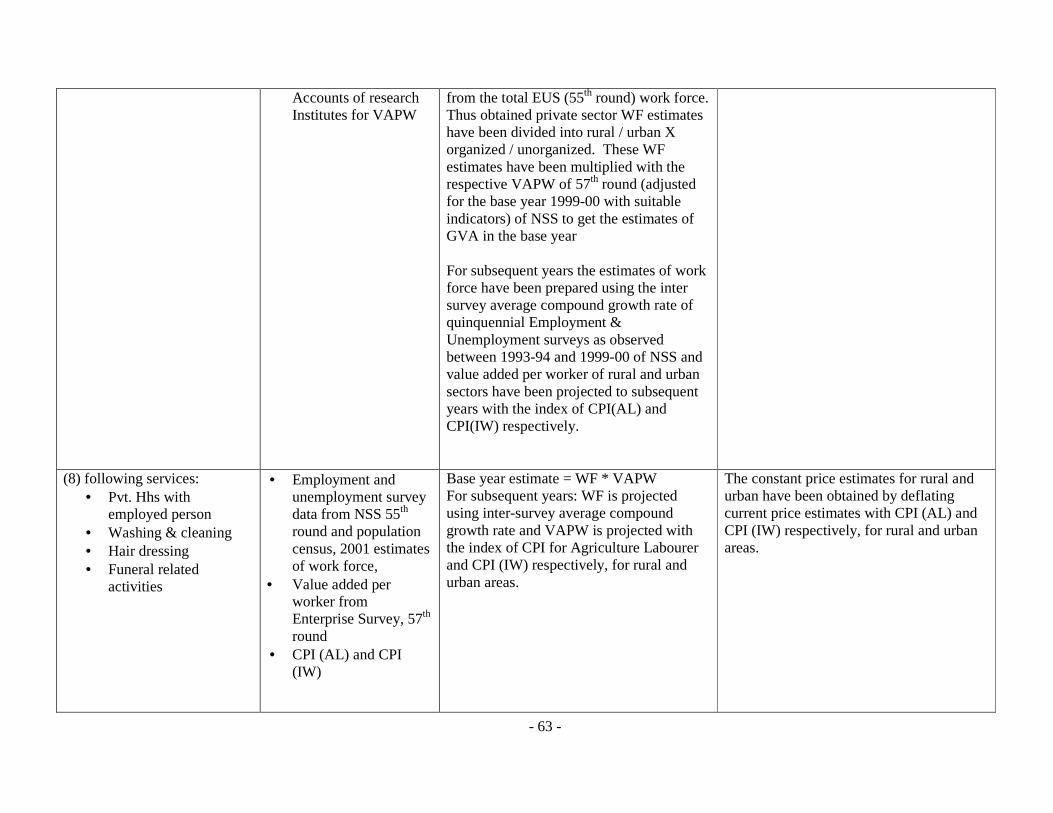
- 63 -
Accounts of research Institutes for VAPW
from the total EUS (55th round) work force. Thus obtained private sector WF estimates have been divided into rural / urban X organized / unorganized. These WF estimates have been multiplied with the respective VAPW of 57th round (adjusted for the base year 1999-00 with suitable indicators) of NSS to get the estimates of GVA in the base year For subsequent years the estimates of work force have been prepared using the inter survey average compound growth rate of quinquennial Employment & Unemployment surveys as observed between 1993-94 and 1999-00 of NSS and value added per worker of rural and urban sectors have been projected to subsequent years with the index of CPI(AL) and CPI(IW) respectively.
(8) following services: • Pvt. Hhs with
employed person • Washing & cleaning • Hair dressing • Funeral related
activities
• Employment and unemployment survey data from NSS 55th round and population census, 2001 estimates of work force,
• Value added per worker from Enterprise Survey, 57th round
• CPI (AL) and CPI (IW)
Base year estimate = WF * VAPW For subsequent years: WF is projected using inter-survey average compound growth rate and VAPW is projected with the index of CPI for Agriculture Labourer and CPI (IW) respectively, for rural and urban areas.
The constant price estimates for rural and urban have been obtained by deflating current price estimates with CPI (AL) and CPI (IW) respectively, for rural and urban areas.
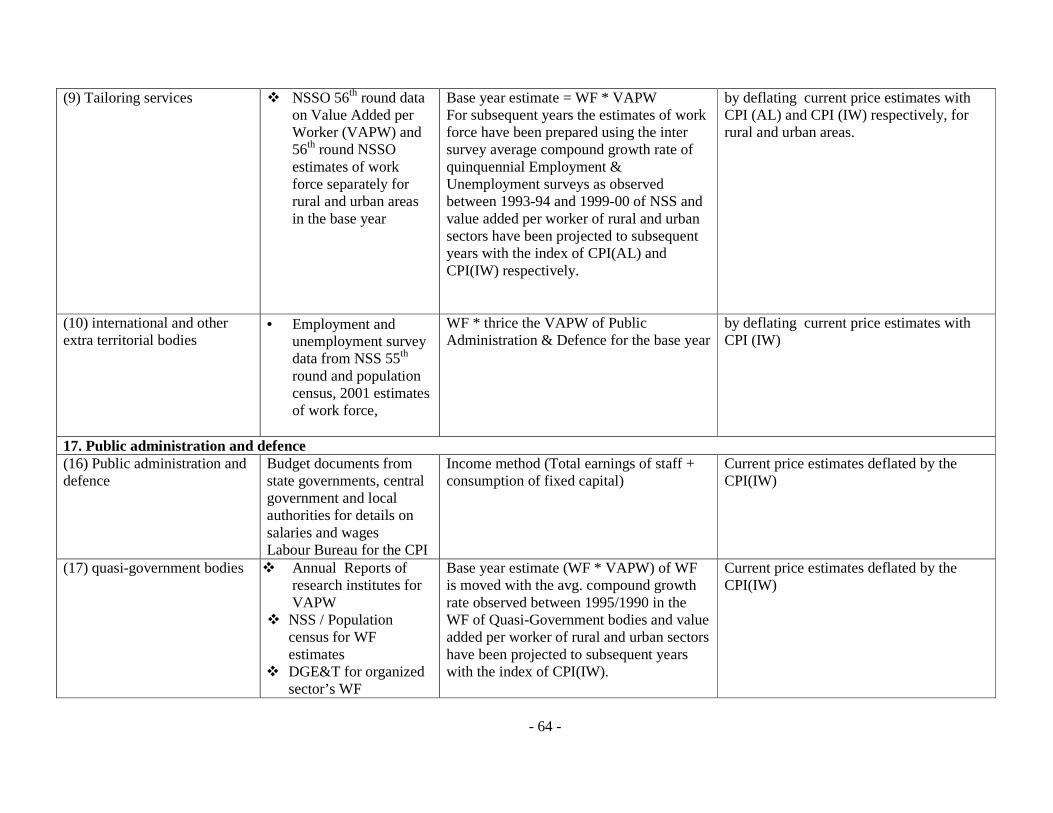
- 64 -
(9) Tailoring services � NSSO 56th round data on Value Added per Worker (VAPW) and 56th round NSSO estimates of work force separately for rural and urban areas in the base year
Base year estimate = WF * VAPW For subsequent years the estimates of work force have been prepared using the inter survey average compound growth rate of quinquennial Employment & Unemployment surveys as observed between 1993-94 and 1999-00 of NSS and value added per worker of rural and urban sectors have been projected to subsequent years with the index of CPI(AL) and CPI(IW) respectively.
by deflating current price estimates with CPI (AL) and CPI (IW) respectively, for rural and urban areas.
(10) international and other extra territorial bodies
• Employment and unemployment survey data from NSS 55th round and population census, 2001 estimates of work force,
WF * thrice the VAPW of Public Administration & Defence for the base year
by deflating current price estimates with CPI (IW)
17. Public administration and defence (16) Public administration and defence
Budget documents from state governments, central government and local authorities for details on salaries and wages Labour Bureau for the CPI
Income method (Total earnings of staff + consumption of fixed capital)
Current price estimates deflated by the CPI(IW)
(17) quasi-government bodies � Annual Reports of research institutes for VAPW
� NSS / Population census for WF estimates
� DGE&T for organized sector’s WF
Base year estimate (WF * VAPW) of WF is moved with the avg. compound growth rate observed between 1995/1990 in the WF of Quasi-Government bodies and value added per worker of rural and urban sectors have been projected to subsequent years with the index of CPI(IW).
Current price estimates deflated by the CPI(IW)