establishments report, part iii-a, series-18, rajasthan
TRANSCRIPT
CENSUS OF INDIA 1971
SERIES 18
RAJASTHAN
PART III .. A
ESTABLISHMENTS REPORT
V. S. VERMA-
OF THE INDIAN ADMINISTRATIVE SERVICE
Director of Census Op.erations. Rajasthan

PREFACE
A SEP.AR:ATE establishment schedule was canvassed alongwith the houselist during the Houselisting Operations which preceded the Census "'count in 191r. Unlme 1961, where a few details of manufacturing establishments alone were collected, the 1911 estabUshment schedule collected a variety of information on manufact~g, trade as well as all other establishinents in the unorganised sector run in the state. The tabulation of this data, on full count basis, has generated a set of four tables presenting the distribution of estab1.i!hment"S by broad types; distribution of ma.nufaoturing, processing or servicing establishments other than household industries by regis~ered factories, unregistered workshops and size of employment, also by industry, fuel/l'ower or manual used and size of employment, and, distribution of household industry establishments \by industry, fuel/power used and size of employment; distribution of trade/commercial establishments by the type of business or trade and size of employment and, distribution of establishments (other than manufacturing, processing, servicing or business and trade establishments) by size of employment. These four tables have, however, been issued separately as pa.rt B of this report. This volume presents a write up based on these tables and on the subaidlaly tables, also given in this volume, wherein proportions have been worked out to help better comprehension of the subject matter .
.As in 1961, this time also, this publication attempts to fill up to some extent gaps in the existing mowledge on our establishments. Wit:q all its limitations and drawboo:k:s, it provides vital information on certain ASpects of our establishments and furnishes material on the structure of industrial segments for further study and :research. \
This report is entitled 'Report on Establishments' whereas the corresponding volume for 1961 census was called 'Report on Housing and Establishments'. A volume called 'Housing Report and Tables' has been issued separately this time.
Shri H. K. L. Khattar, Deputy Director, has laboured hard in preparing the present volume ably, a.ssisted by Tabulation Officer Slni N. K. Purohit and Sarvashri Bhupendra Goyal and D. N. Pareek Computers. Other members of the staff who were associated with the preparation of this work at various stages ha.ve been. mentioned overleaf.
Rambagk Palace Anneu Jaipu'f 2nd OctobeT, 1973
l\ILB(DtlBGI-l
v. S. VERMA Directm
Oemus OpB'fations, Rajasthan
OTHER MEMBERS OF STAFF ASSOCIATED WITH TIDS WORK
In Typing :
1.,Shri G. M. Sharma
2: Kumari Saraswati Amma
In Printing :
1. Shri Moti Singh
2. Shri T. C. Patni
3. Shri Hassan Mohd.
4. Shri Da.leep Singh Cha.ndrawat
Computer
Assistant Compiler
Statistioal Assistant
Statistical Assistant
Proof Reader
Proof Reader
iv
PART III-A
ESTABLISHMENTS REPORT
LIST OP PUBLICATIONS
CENSUS Oli' INDIA 1971-SERIES-18 RAJASTHAN IS BEING PUBLISHED IN THE FOLLOWING PARTS:
Part I-A
Part I-B
Part I-C
Part II-A
Pllrt II-A Part II-B(i)
Part II-B(ii)
Part II-C(i)
Part II-CCii) partn-D Part III-A
part III-B
Pa.rt IV
Part V
Pa.rt VI-A Part VJ-B pa.rt VI-C
Part VIII-A
Part VIII-B
Part IX
"Part IX-A
Pa1't X-A & X-B
Pa.rt x-c
A-GoVERNMENT OF INDIA PUBLICATIONS
General Report.
An analysis of the dcmo~aphio, socia.l, cultural and migration patterns.
Subsidiary Tables.
General Population Tables. (Published)
Supplement.
Eoonomic Tabl~s (Tables B-T Part B Bnd B-lI)
Economic Table9 (Table .. B-1 Part B, and B-III to B-IX)
Soc!al,and Cultural Tables (Tables O-V, O-VII and O-VIII)
Sooial & Cultural Tables (Tables C-l to O-IV, O-VI and Fertility Tables) Migration Tahles Establishments Report (The Present Volume).
Establishment Tables.
Housing Report and Ta.ble!'!. (Published).
Special TII.bles and Ethnograr)hic Notes on Scheduled CastCfl & Scheduled Tribes.
Town Directory.
S}eo-isl Survey Report on;"Selected Towns.
Survey Report on Selected Villages.
Administration Report-Enumeration. }
Administration Report-Tabulation.
Com-us Atks.
Administrative Atlas.
Fo]! official use only.
B-GOVER:8MENT OF RAJASTHAN PUBLICATIONS
District Census Hand Book-Town and Village Directory &I Primary Census Abstract.
Distriot Census Hand Book- Ccnf'1.:.s Ta.bles c.nd Offici!!.! Statistics. Population StatilStics 1971 (Pocket book).
PREFACE
ClUPTER I
CRAPTER II
CltAPTEB III
CHAPTER rv\ CKAPTEB V
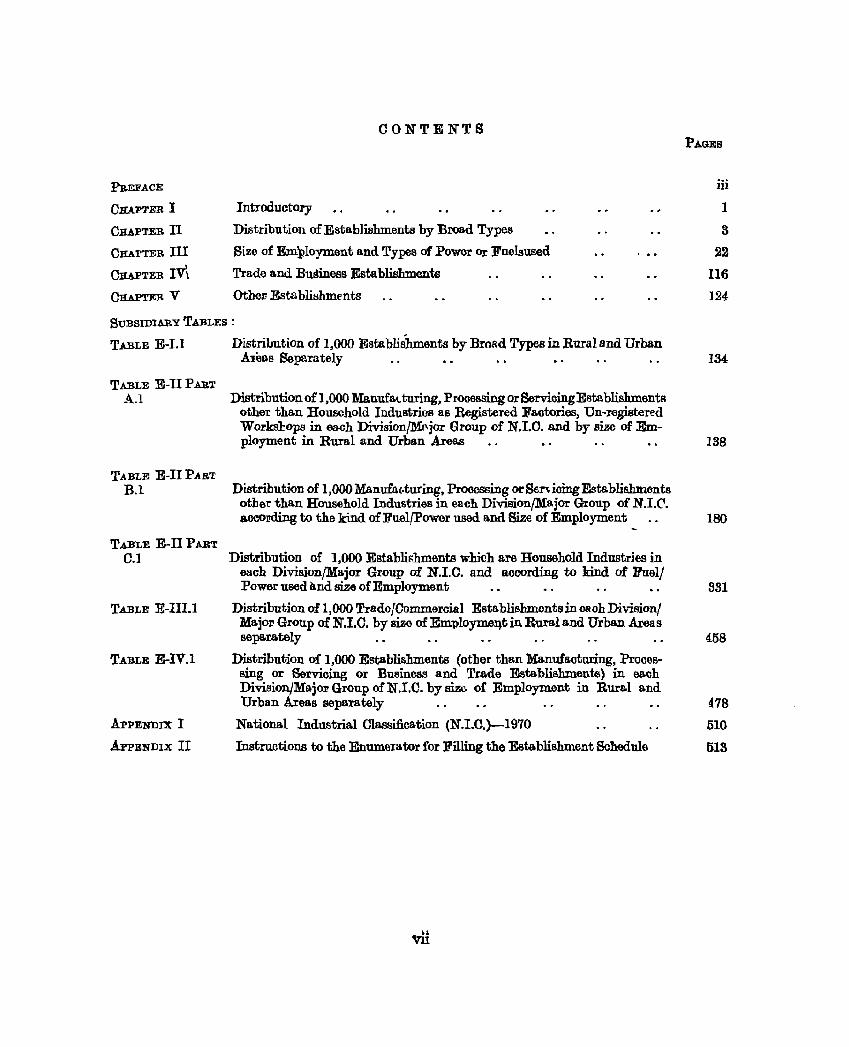
CONTENTS
Introductory
Distribution of Establishments by Broad Types
Size of Employment and Types of Powor or Fuelsused
Trade a.nd Bu~iness Establishments
Othe!' Establishments
SUBSIDIARY TA.BLES :
TABLE E-I.I DistrilJUtion of 1,000 Establislunents by Broad Types in Rura18nd Urban
PA.GES
iii
1
3
22
116
124
Allca8 Separately 134
TABLE E-U PART A.I
TABLE E-II PART
B.I
TABLE E-II PART
C.1
TA.BLE E-III.l
TABLE E-IV.l
APPENDIX I
APPENDIX II
Distributiop. of 1,000 Ma.nufIM. turing, Processing or Servioing Establishments other than Household Industries as :Registered Factories, Un-registered Worksl:ops in eaoh Division/Mt"jor Group of N.r.O. and by size of Employment in Rural and Urban Areas
Distribution of 1,000 Manufs(.turing, Prooessing or 861"\ icing Establishments othel' than Household Industries in each DivisionfMajor Group of N.r.C. &OCOI!ding to the kind of FuelfPower used and Size of Employment
Distribution of 1,000 EstabliF:hments which aI'S Household Industl'ies in each Division/Major Group of N.r.C. and according to kind of Fuel/ Power used and size of Employment
Distribution of 1,000 Trade/Commeroial Establishments in each Division! MajOl' Group of N.I.C. by siro of EmploytneIJtin Rural and Urban Areas separately
Distribution of 1,000 Establishments (other than Manufacturing, Processing or Servicing or Business and Trade Establishments) in eaoh Division/Majol' Group of N.I.C. by size. of Employment in Rura.l and Urban Areas separately
National Industrial Classification (N.I.C.)-1970
Instructions to the Enumerator for Filling the Establishment Schedule
188
180
331
458
478 510
513

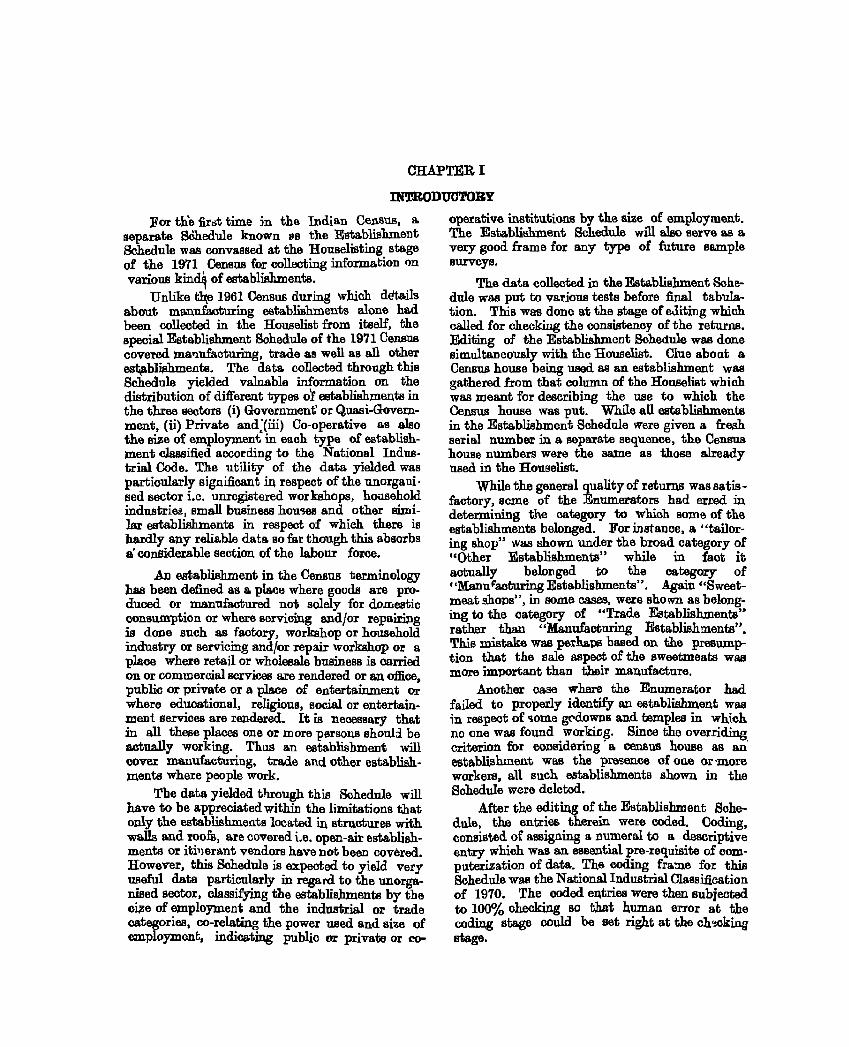
CHAPTER I
INTRODUCTORY
;For the nrl:lt time in the India.n Census, a. separate SChedule known 8S the Esta.blishment Schedule was convassed at the House1isting stage of the 1971 Census foI' collecting information on various kincI1 of establishments.
Unlike t}(e 1961 Census during which de'tails about manufacturing esta.blishments alone ha.d been collected in the Houselist from itself, the special Establishment Schedule of the 1971 Oensus covered ma'lufacturing, trade as well as all other es~blililimellts. The data collected through this Schedule yielded valuable information on the distribution of different types of establishments in the three eeotOts (i) Government' or Quasi--Government, (ii) Private andJiii) Co-operative as also the size of employment in each type of establishment classified according to the National Industrial Code. The utility of the data yielded was partioularly significant i.Q respect of the unorgaui· sed sector i.e. unregistered workshops, household industriel, small business hou~ and other similar establishments in respect of which there is h"rdly any reliable data so far though this absorbs 3' considerable section of the labour force.
.All establishment in the <knsus terminology has been defined as a place where goods are produced or manufactured not solely for domestic consumption or where servicing a;nd/or repairiJlg is done such as factory, workshop or household industry or servicing and/or repair workshop or a place where retail or Wholesale business is carried on or commercial services are rendered or an. office, publio or private or a place of enterta.inment Or where educational, religious, social or entertainment services are rendered. It is necessary that in all these places one or more persons shoul;l be actually working. Thus an establishment will cover manufacturing, trade and other establishments where people work.
The data yielded through this Schedule will have to be appreciated within the limitations tha.t only the establishments loca.ted in structures with walls and roofs, are covered Le. open-air establishments or iti1lerant vendors ha.ve not been covered. However, this Schedule is expecl;ed to yield very useful data partioularly in regard to the unorganised sector, classifying the establishments by the ci.ze of employment and the industrial or trade categories, co-relating the power used and 8i~ of employment, indicating publio or private or co-
operative institutions by the size of employment. The Establishment Schedule will also serve a.s a very good frame for any type of future sa.m.ple surveys.
The data. collected. in the Establishment Schedule was put to various tests before final tabulation. This was done at the sta.ge of eJiting which called for cheoking the consistency of the returns. Editing oJ the Establishment Schedule was done simultaneously with the Houselist. Clue aboat a Cens1l,S house being used as an establishment was gathered from tha.t column of the Houseliat which was meant for describing the use to which the Census house was put. While aU establishments in the Establishment Schedule were given a fresh seria.l number in a separate sequence, the Census house numbers were the same as those already used. in the Houselist.
While the general quality of returns was satisfactory, Bcme of the Enumerators had erred in determining the category to whioh some of the establishments belonged. For instanoe, a "tailoring shop" was shown under the broad category of ..Other Establishments" while in faot it actually belonged to the category of "Manu4-"acturing Esta.blishments". Again "Sweetmeat shops", in soma oases, were shown as belonging to the category of "Trade Establishments" rather tha.n "Manufacturing Establishments". This mistake W88 perha.'P8 based on the presumption that the sale aspect of t.b.e sweetmeats was more impOrtant than their manufacture.
Another ca.se where the Enumerator had failed to properly identify an establishment was in respect of c;ome g<'doWDs and. temples in which no one was found workirig. Since the overriding oriterion for considering' a census house as an' establishment was the presence of one or 'more workers, aU such establishments shown in the Schedule were deleted.
After the editing of the Establishment Schedule, the entries therein were coded. Coding, consisted. of assigning a. numeral to a d.escriptive entry which was an essential pre-requisite of computerization of data. The coding fra~e for this Schedule was the National Industrial Classifioation of 1970. The ooded entries were then subjected to 100% checking 80 t.hat human error at the coding stage could be set right at the ch'~ckin.g stage.
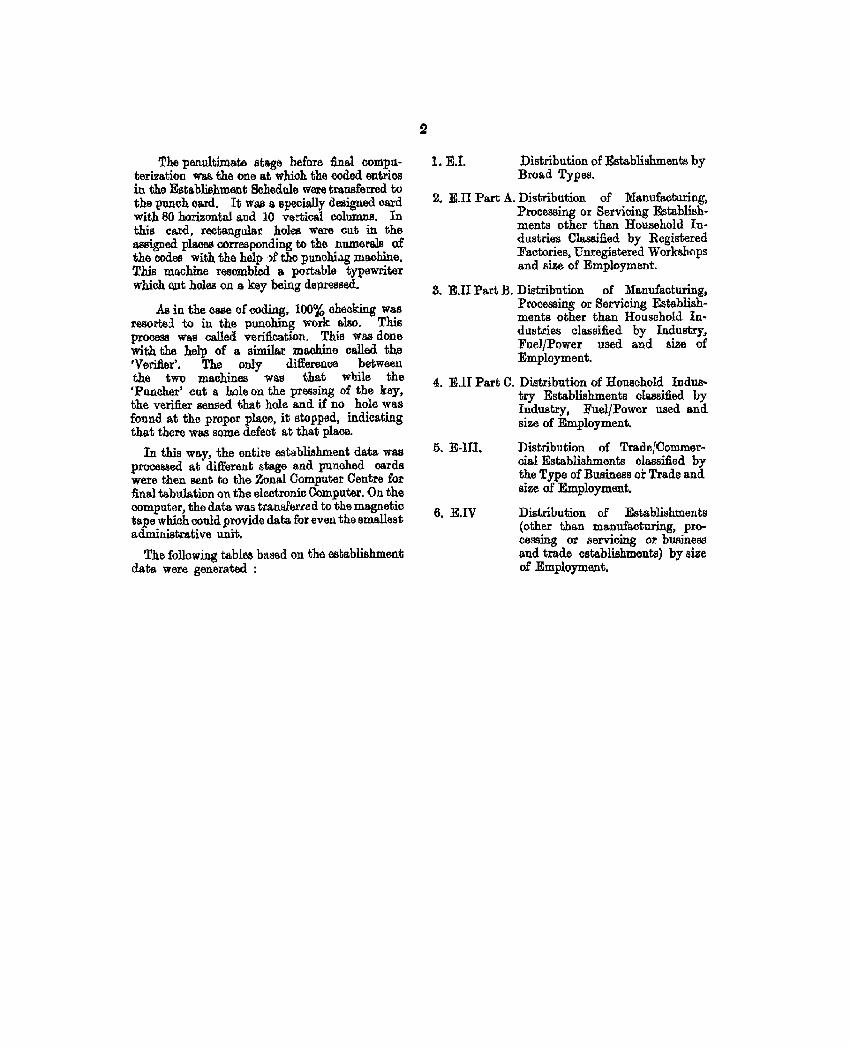
· '1'~e penultimate stage before nnal computerIzatIon was. the one at whioh the coded entries in the Establishment Schedule were transferred to t~e 'PUllch ~. It Wall a specially designed oard wIth 80 honzontal and 10 vertical columns. In this card, rootangular holes were out in the assigned places corresponding to the numerals of th~ codes ~ith the help o)f tho punohi.lg machine. This machme resembled a JlQrtable typewriter which CJlt holes on a key bei.Il.g depressed.
As in the case of ooding, 100% oheclcing was resortei to in the punohing work a.lso. This process was oalled verification. This was done with the help of a simila.r machine called the 'Verifier'. The only difference between the two machines was that wlJile the • Puncher' cut a hole on the pressing of the key, the verifier sensed that hole and it no hole was fonnd at tho proper place, it stopped, indica.ting that there was some defect at that place.
In this way, the entire establishment da.ta was processed at different stage and punched cards were then sent to the Zonal Computer Centre for fina.l tabulation on the electronic Computer. On the oomputer, the data was transfl;lued to the magnetic tape whioh could provide data. for even the smallest administrative unit.
The following tables ba:36d on the esta.blishment data were generated :
1. E.I. Distribution of Establishments by Broad Types.
2. E.Il Part A. Distribution of Manufacturing, Processing or Servioing Establishments other than Household Industries Classified by Registered Factories, Unregistered Workshops and size of Employment.
3. E.Il Part B. Distribution of Manufacturing, Processing or Servicing Establishments other than Household Industries classified by Industry, Fuel/Power used and size of Employment.
4. E.lI Part C. Distribution of Household Industry Establishments classified by Industry, Fuel/Power used and size of Employment.
5. E-Ill.
6. E.IV
Distribution of Trade/Commeroial Establishments classified by the Type of Business or Trade and size of Employment.
Distribution of Establishments (other than manufacturing, precessing or servioing or buamess and trade establishments) by size of Employment.
eRAPTER II
DISTRIBUTION OF ESTABLtSHMENTS BY BROAD TYPES
This chapter a.ims to show the distribution of establishments in the three broad categories viz., (i) Manufacturing, processing aud Repairing establiahments, (ii) Trade or BUfliness establishments and (iii) Other establishments, in the State and various districts. Figures for the rural and the urban areas and those of the cities have been separately presented.
An attempt has been made to categorise the districts according to the predominance or otherwise of the three categories of establishments as also to associate the predominance of the establishments of a particular typ,e with the economic characteristics of the district.
An attempt has also been made to show the distribution of establishments of each category into different sectors of economy viz., Government or Quasi Governmellt, Private and Co-operative.
Total Number of Establishments There were 498,740 csta blishmcntB of all
kinds in the whole State. Out of this 314,385 representing 63'04% were located in the rura.! areas and 184,355 representing 36· 96% in the urban areas.
Of the total number of establishments in the State, 60,796 representing 10'19% were accounted for by the Government ox Quasi Government sector, 444,693 representing 89 '16% by the Private sector and a meagre 3,~51 representing O' 65% by the Co-oper&tive sector.
In the rural areas, the distribution of establishments in tne above three sectors was 38,192 (7·66%), 2,74,274 (54'99%) and 1,919 (0'38%) respectively while similar distribution in the urban areas wa.s 12,604 (2'53%),170,419 (34,17%) and 1,332 (0' 27%) respectively.
In terms of percentages, the rural areas claimed 75,19% of the establishments that were either Government or Quasi Government while the urba.n areas claimed the remaining 24·81%. From out of the establishments owned by the private sector, the rural areas accounted for 61· 68% and the urban areas 38' 32%. The establishments in the co-operative sector were sha.red by the ru.ral and the urban areas to the extent of 59· 93% and 40·97% respectively.
The position with regard to the distribution of cstabliabments in the difi'erentsectors in the various districts of the state revealed that Jaipur with a
3
percentage of 9·12 of Government owned establishments stood at the top followed by Udaipur which had 8'27% of such establishments. Jaisalmer with a percentage of 1· 23 stood at the bottom.
In respect of establishment8 in the private sootor, it was Jaipur once again which topped with a percentage of 11·71 followed by Udaipur which had 7· 61 % of such establishments. J aisalmer with a percentage of O' 54 came last.
In the Co-operative sector, J aipur was again at the top with a percentag6 of 10· 58 establishmentB.. Ajmcl' came next, with 8'31% establishments .. Jaisalmer continued to remain at the bottom in this sector also with a percentage of O· 92 establishments.
The distl'ibution of establishments in the three sectors in the rural areas of the various districts revealed that Udaipur stood at the top with a percentage of 6· 57 so far as establishments in the Government or Quasi Government sector were conccrned. Jaipul" followed with a percentage of 5· 92. Jaisalmer had the lowest perce'lltage of 0·92 of such establishments.
The distribution of privately owned establishments in the rural areas of various districts showed thatJaipur occupied thetop place with a percentage of 5· 94 closely followed by Udaipur with 5· 36%. J aisaImer had as Iowa percentage as O· 35 of such establishments.
The position of establishments in the oo-opera.tive sector showed tha.t the highest percentage (5·54) was found in Jaipur with Udaipur coming closely next with 5· 48%. Jaisalmer stood at the bottom with 0·58%.
A similar position with regard to the urban areas showed that the highest percentage (3· 20) of establishments in the Government or Quasi Government seotorwa.s found in Jaipur. Jodhpur with a percentage of 1· 95 came next. Dungarpur had the lowest percentage orO·27.
In respect of establishments in the private sector, the highest percentage of?· 77 was found in Jaipur followed by Aimer which had a percentage of 3·56 of such establishments. The lowest percentage of 0·19 was found in Jaisalmer.
For the establishments in the co-operative .sector, the highest percentage of~' 04 was found in Jaipu'l. followed by Jodhpur ~hlCh had 3';tS01o of such establishments. Jalor WIth a percentage of 0·12 stood a.t the bottom.
4
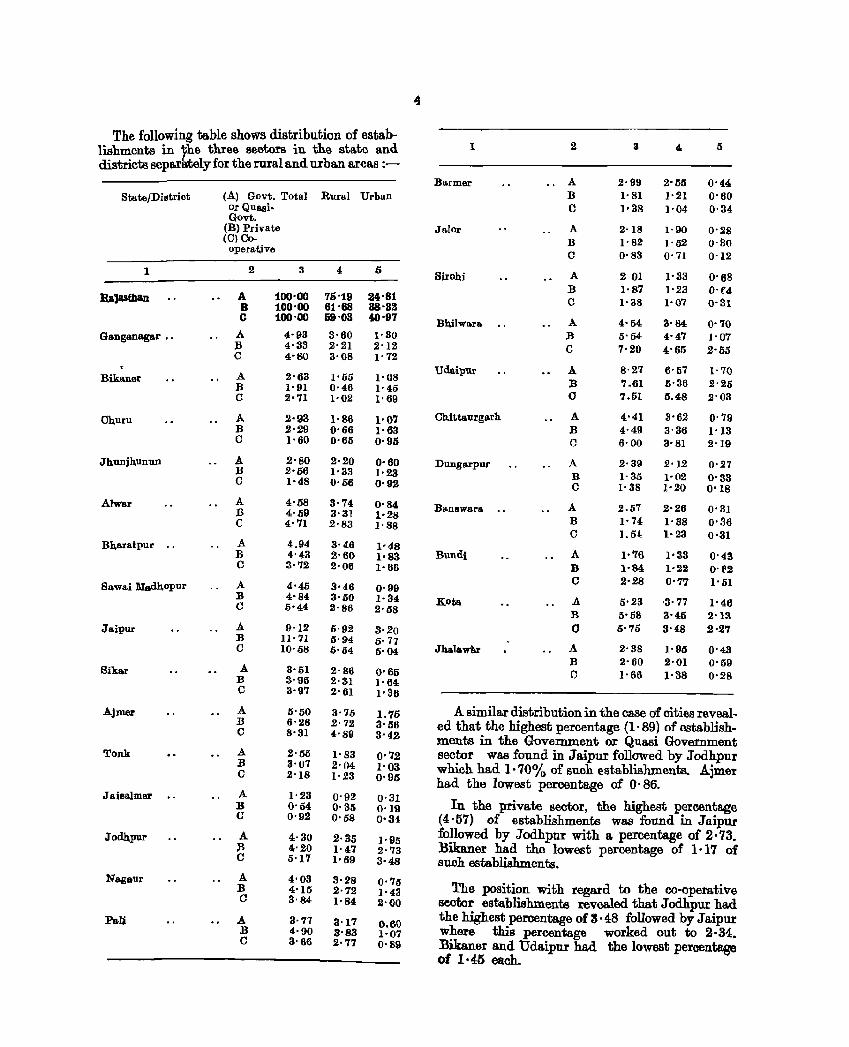
The following table shows distribution of estab-lishments in ~he three seetors in the state and districts separately for the rural and urban areas :-
1 2 3 " 5
Bu.rmer A 2·99 2'55 0'44 Stu.tejDistrict (A) Govt. Total Rural Urban B 1'81 }'21 0'60
or Quasi. C 1·38 1'04 0·34 Govt.
(B) Privu.te Jalor A 2'18 1·90 0'28 (e) Co- B 1'82 1'52 O'SO opera~ve
C 0'83 0'71 0'12 1 2 3 4 5
Sirohi A 2 01 }'33 0'68 B 1'87 ]'23 0'C4
RaJasthan A 100-00 75'19 24-81 C 1·38 1-07 0-31 B 100'00 61'68 38'8Z C 100-00 59'03 40'97 Bhilwara A 4'54 3'S4 0'70
Ganganagar •. A 4'93 3'60 1·30 B 5'54 4'47 1'07 l3 4'33 2'21 2'12 C 7·20 4'65 2'55 C 4'80 3'08 1'72
Udaipur A 8·27 6'57 1'70 Biku.ner A 2'63 1'55 1'08
B 7.61 5'36 2'25 B 1'91 0'46 1'45 C 2'71 1'02 1-69 0 7.51 5.48 2'03
Churn A 2'93 1,86 1'07 Cb,ittaurgarh A 4'41 3-62 0'79 B 2'29 0'66 1'63 B 4'49 3·36 1'13 C 1'60 0'65 0'95 e 6·00 3'81 2' 19
Jh,unjhunun A 2'80 2·20 0'60 Dungarpur A 2·39 2'12 0'27 B 2'06 1,33 1-23 B 1·35 1'02 0'33 C 1'48 0'66 0'9.2- C 1'38 1'20 0'18
Alwar A 4'08 3·74 0'84 Ba.nswara A 2.57 2·26 0'31 B 4'09 3'31 1·28 ..
C 4'71 2'83 1'88 B 1'74, 1'38 0'36 C 1.51 1·23 o·:n
Bh,aratpur .. A 4.94 3·46 1-48 B 4'43 2-60 1'83 Bundi A 1·76 1-33 0'43 C g'72 2-06 1'66 B 1-84 1'22 0,.,2
Sawai l\Iadh,opur A 4'45 3'46 C 2'28 0'77 l'/n 0-99 B 4'84 3'60 1-34 Kota A 5'23 ,g. 77 1'46 C 0'44 2-86 2'58 B 5'58 3-45 2'13
Jaipur A 9-12 0'92 3-20 0 5,75 3'4.8 2·27 B 11'71 5'94 5'" C 10-08 6-li4 5'04 Jha.lawhr A 2'38 1-96 0'43
B 2'60 2'01 0'59 Sikar A 3-51 2'86 0'65 C 1'66 1'38 0'28 B 3'95 2-31 1'6~
C 3-97 2'61 1'36
Ajmer A 5'50 3'75 1.75 A similar distribution in the case of cities reveal-B 6-28 2'72 3'56 ed that the highest percentage (1- 89) of establish-C 8-31 4'S9 3'4.2- ments in the Government or Quasi Government
Tonk A 2'65 I' 83 0·72 sector was found in J aipur followed by Jodhpur B 3-07 2'04 1'03 which. had 1· 70% of such establishments. Ajmer C 2-18 1·23 0'90 had the lowest percentage of O' 86.
Jaisalmer A 1'23 0'92 0·31 B 0'54 0·35 0'19 In the private sector, the highest percentage c 0'92 0'58 0'31- (4'57) of establishments was found in Jaipur
Jodhpur A 4'30 2-35 1'95 followed by Jodhpur with a percentage of 2·73. ;S ~'20 1'47 2·73 Bikaner had the lowest percentage of 1·17 of c 0'17 1'69 3'48 such establishments.
Nag.ur A 4'03 3·28 0,75 B 4'15 2'72 1'43 The position with regard to the co-operative C 3'84 1'84 2'00 sector establishments revealed that Jodhpur had
Pal1 A 3·77 3'17 0.60 the highest percentage of 3·48 followed by J aipur B 4,90 3'83 1'07 where this percentage worked out to 2·:34. c 3'66 2·77 0-89 Bikaner and Udaipur had the lowest peraentage
of 1· 45 each.
The following -table sho.ws percentage distribution of establishments in each city in different sectors of the economy:-
City
Bbtu.ner
.Taipur
Ajmer
\ j
JI)ilb.par
Udaipur
Kota
(A) Govt. or Quasi Govt.
CB) Private (0) Co.operative
A B C
A B C
A B C
A B C
A B C
A B C
Peroentage
0-92 1·17 1-45
1·89 4-57 2'34
0'86 1'80 1'60
1·70 2·73_ 3·48
1-23 I-50 1'45
1'06 1-48 1'69
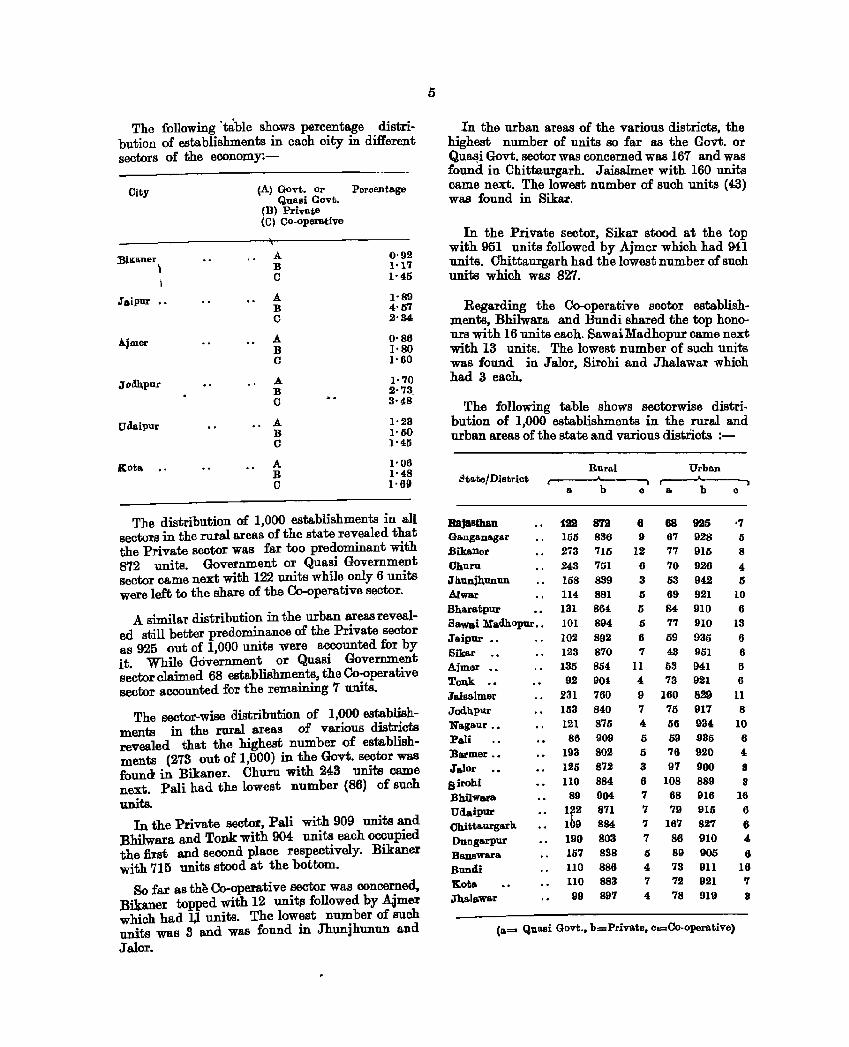
The distribution of 1,000 establishments in all sectors in the rural areas of the state revealed that the Private sector was far too predominant with 872 units. Government or Quasi Government sector came next with 122 units while only 6 units were left to the share of the Co-operative sector_
A similar distribution in the urban areas reveal-ed still better predominance of the Private sector as 925 out of 1 000 units were aooounted for by it. While GOv~rnment or Quasi Govemm~nt sector claimed 68 establishments, the Co-operatIve sector aooounted for the remaining 7 units.
The sector-wise distribution of 1,000 establish-ments in the rural areas of various districts revealed that the highest number of establish-ments (273 out of 1,000) in :the Govt. se?tor was founa in Bikaner. Chum WIth 243 UnIts came next. Pali had the lowest number (86) of such units.
In the Private sector, Pali with 909 units and Bhilwara and Tonk with 904 units each occupied the first and second place respectively_ Bikaner with 716 units stood at the bottom.
So far as the Co-operative sector waS concerned, Bikaner topped with 12 unit" followed by ~mer which had 1~ units. The lowest number of such units was 8 and was found in Jhunjhunun and Jalor.
5
In the urban areas of the various districts, the highest number of units so far as the Govt. or Qua~i Govt. sector was concerned was 167 and was found in Chittaurgarh_ Jaisalmer with 160 units came next. The lowest number of such units (43) was found in Sikar.
In the Private sector, 8ikar stood at the top with 951 units followed by Ajmer which had 941 units. Chittaurgarh had the lowest number of such units which was 827.
Regarding the Co-operative sector establishments, Bhilwara and Bundi shared the top honours with 16 units each. SawaiMadhopur came next with 13 units_ The lowest number of 8uch units was found in Jalor, Sirohi and Jhalawar which had 3 eaoh.
The following table shows sectorwise distribution of 1,000 establishments in the rural and urban areas of the state and various distriots :-
State/District
RajaBthan Ga.ngansgar Bikaner Churu iJb.unjhunun Al war Bharatpur Bawai l\l'adhopur .. iJaipur •• Sikar Ajmer •• T~k . . Ja.isa.lmer Jodb,pur Nagaur •• Pa.li ::Oarmer .• Ja.lor sirohi Bhilwara Uda.pur Chitta.urgarh Dungarpur Ba.nswara Bundi '!tota Jha.l"war
Rural r--o-'------'l abo
1a2 8'19 8 155 836 9 273 715 12 243 751 6 158 839 3 114 881 5 131 864 5 101 894 6 102 892 6 123 870 7 135 854 II 92 90' 4.
231 760 9 153 840 7 121 875 4 86 909 5
193 802 5 125 872 3 110 884 6
89 904 7
Ib2 871 7 1 9 884 7 190 803 7 157 838 IS
110 886 4 110 883 7 99 897 4
flo
88 67 77 70 53 69 84 77 59 43 53 73
160 75 56 59 76 97
108 68 79
167 86 89 73 72 78
Urban
b
925 928 915 926 942 921 910 910 935 951 941 921 829 917 934 t85 920 900 889 916 915 827 910 905 911 921 919
...., o
'7 5 8 4 5
10 6
13 6 6 6 6
11 8
10 6 4
8 3
16 6 6 4,
6 16 7 3
(a.= Quasi Govt_. b=Private. c=Co.operative)
The sectorwise distribution of 1,000 establishments in the cities revealed that the highest number (85) of units in the Govt. or Quasi Govt. sector was fbund in Uda.ipur followed by Bikaner which had 82 such units. The lowest number of 45 units was found in Jaipur.
In the private sector, .Taipur stood at the top with 951 units followed by Ajmer which had 942. Udaipur came last with 909 units.
As regards the co-operative sector establishments Bikaner, Jodhpur and Kota had 8 units each. Jaipur had only 4 such units.
The following table shows distribution of 1,000 establishments in different sectors in all the oities:-
Cit.y
Bikaner Ja.ipur Aj:mer Jodhpur Udaipur Kota.
82 45 52 77
85 75
b
910 951 942 915 909 917
o
8 4
6 8 6 8
(a=Govt. Or Quui Govt., b=Priva1e. c=('o.ope:rOtiV6)
Manufacturing. J'rocessing Or Servicing Establishments
There were 192,918 establishments which belonged to this category. It represented 38·68% of all establishments in the State. Out of this, 130,526 units representing 67 ·66% were looated in the rural areas and 62,392 representing32'3,!% in the urban areas.
The establishments in the ahove category were further divided mto three sub categories viz., (a) Registered faotories, (b) Unregistered workshops a.nd (0) Household industries.
(a) Registereil Factories :-There were 1 735 registered factories representing 0·35% or' all establishments in the whole State. Out of this 470 :wpresenting 27 '09% were located in the rural areas and 1,265 representing 72· 91 % in the ur-ban areas. The preponderance of registered factories in the urban areas over the rural a.reas is quite ohvious from the above. In other wor~ it may be stated that industrialization is concentrated in the urban areas.
The position with regard to the existence of registered factories in various districts of the state revealed tha.t Jaipur had the highest percentage (16·14). Ajmer with 15'04% units came closely next. J alor had the lowest percentage of 0·29 of such units.
6
In the rural areas of the various distriots, Udaipur stood at the top with a percentage of 2·48 followed in the second place by Bhilwara which had such establishments to the tune of 2· 30%. The lowest peroentltge of o· 18 was found in Churu.
In the urban areas of the districts of 'the state, .Taipur and Ajmer with percentages of 14·~ and 13 ·36 respeotively oocupied the first and the seoond place. J alor and Dungarpur oocupied the hottom plaoe with 0·06% units each.
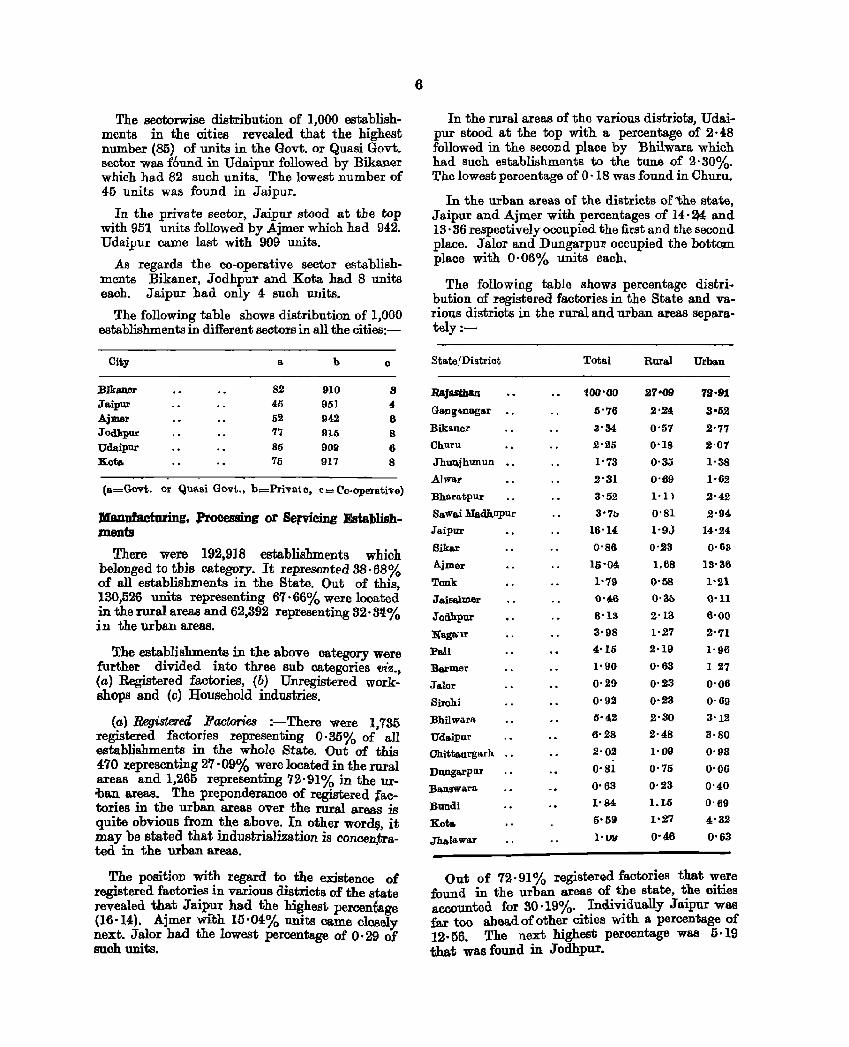
The following table shows percentage distribution of registered faotories in the State and various distriots in the rural and urban areas separa.tely:-
State!Distriot
Rajasthan
Gang ... nagar
Bik!l.ner
Chul'U
JhUD.jhunun
AI war
Bharatpur
Sawai Madhopur
Jaipur
Sika.r
A.jmer
Tonk
Jaisolmer
Jodhpur
N'aga'\r
ral.l
Barmer
Jalor
Sirohi
Bhilwara
Udaipur
Chittaurgarh
Dungarpur
Ba1l9wara.
Bundi
Kota
J1Ialawar
Total
100'00
0'76
3'34
2'25
1'73
2'31
3'52
3'7b
16'14
0'88
10'04-
1'79
0'46
8'13
3'98
4'U;
1'90
0'29
0'92
5'42
6'28
2'02
0'81
0'63
1'84
5'59
l' 011
Rural Urban
27·09 79·91
2'24 3'52
0'57 2'77
0'18 2'01
0'3.) 1'38
0'69
1·11
0'81
1·9.}
0'23
1.68
0'58
0'3b
2'13
1'27
2'19
0'63
0'23
0'23
2'30
2'48
1'09
0'75
0'23
1.15
1'27
0'46
1·62
2'42
2'94.
14'24
0·63
13'36
1'21 0'11
6'00
2'71
1'96
1 27
0'06
0'69
3'12
3·80
0'93
0'06
0'40
0'69
4'32
0'63
Out of 72·91 % registerad faotories that were found in the urban areas of the state, the cities accounted for 30 ·19%. Individually Jaipur was far too ahea.d of other cities with a percentage of 12.1)6. The next highest percentage was 5·19 that was found in Jodhpur.
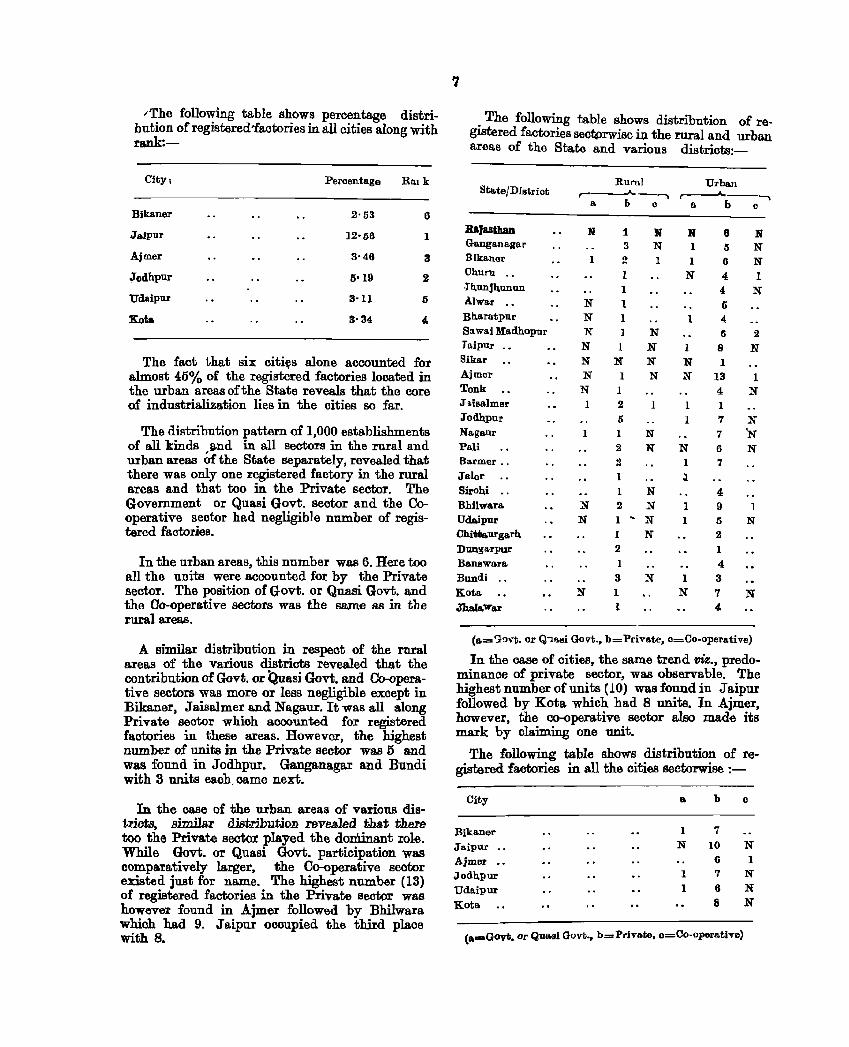
;The following table shows percentage distribution of registered'factories in all cities along with rank:-
City, Peroentage Balk
Bikaner 2'53 6
Jaipur 12'06 1
Ajmer 3'46 3
Jodhpur 5'19 2
Udaipur 3'U 5
Kota S'34 4,
The fact that six citi\)s alone accounted for almost 46% of the registered factories located in the urban areas of the State reveals that the core of industrialization lies in the cities so far.
The distribution pattern of 1,000 establishments of all kinds a.nd in all sectors in the rural and urban areas afthe State separately, revealed that there was only one registered factory in the rural areas and that too in the Private sector. The Government or Quasi Govt. sector and the Cooperative sector had negligible number of registered factories.
In the urban areas, this number was 6. Here too all the units were accounted for by the Private sector. The position of Govt. or Quasi Govt. and the Oo-operative sectors was the same as in the rural areas.
A similar distribution in respect of the rural areas of the various districts revealed that the contribution of Govt. or Quasi Govt. and Co-operative sectors was more or less negligible except in BUmner, Jaisalmer and Nagaur. It was all along Private sector which accounted for registered factories in these areas. However, the highest number of units in the Private sector was 5 and was found in Jodhpur. Ganganagar and Bundi with 3 units each. came next.
In the case of the urban areas of various distriotB, simila.r distribution .revealed that thel'8 too the Privat.e sector played the dontinant role. While Govt. or Quasi Govt. participation was compa.ratively larger, the Co-operative sector existed just for name. The highest number (13) of registered factories in the Private sector was however found in Ajmer followed by Bhilwara which had 9. Jaipur occupied the third place with 8.
7
. The following table shows distribution of regIStered factories sectiprwise in the rural and urban areas of the State and various districts:-
Sta.tejDistrict
RaJasthan Ganganagar Bikaner
Churn .. .Jb,unjb,unun Alwar .•
Bharatpur
Sil wai Madhopur To.ipur Sikar
Ajmer
Tonk Jlisaimer Jodhpur Nagallr
Pali Barmer ..
Jalor
Sirohi •. Bhilwara
Udaipur Chitta.urgal"b. Duogarpur
Banswo.ra Bundi .. Koto. JhaJa,war
Rural Urba.n ,---..A. __ --.. ~ __ --..
a. II cab 0
N
1
N N N N N N N 1
1
N N
N
1 3 N 2 1
1 1
1 1 1 N
1 N N N
I N 1
2 1
5 1 N 2 N 2
1
1 N 2 N 1 ~ N
1 N 2
1
3 N 1 1
N 1
1
N
1
1 N N
1
1
N 1 J.
1 1
1 N
6 5
6
4 4 5 ... fI
8 1
13 4
1 7 7
6 7
4 9
5 2
1
4 3 7 4,
N N N 1
N
2
N
1 N
N N N
1
N
N
(a,='}()V1;. or Q·lIJ.si Govt., b=Private, o=Co-operative)
In the case of cities, the same trend viz., predominance of private sector, was observable. The highest number of units (10) was found in J aipur followed by Kota which had 8 units. In Ajmer, however, the co-operative sector also made its mark by claiming one unit.
The following table shows distribution of registered factories in all the cities sectorw'ise :-
City
Bikaner
Jaipur .,
Ajmer .• Jodb,pur Udaipur Kota
a
1
N
1
1
b
7
10
6 7
6
8
c
N 1
N N N
(a.=oGOVI;. Or Quasi Govt .• b=Private, o=Co-operative)
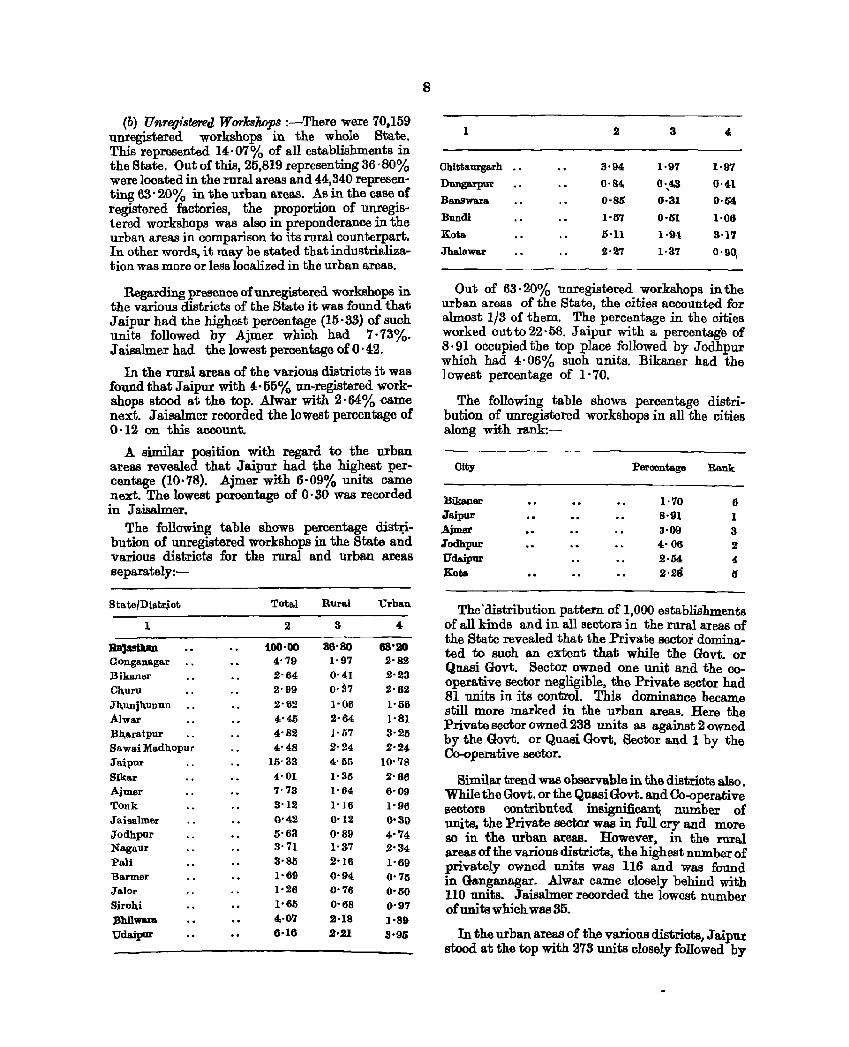
(b) Unregistered WO'T'kskops :-There were 70,159 unregistered workshops in the whole State. This represented 14·07% of all establishments in the State. Out of this, 25,819 representing 36·80% were located in the rural areas and 44,340 representing 63' 20% in the urban areas. As in the case of registered factories, the proportion of unregistered workshops was also in preponderance in the urban areas in comparison to its rural counterpart. In other words, it may be stated that industrialization was more or less localized in the urban areas.
Regarding presence of unregistered workshops in the various districts of the State it was found that Jaipur had the highe~t percentage (15·33) of such units followed by Ajmer which had 7·73%. J aisalmer had the lowest percentage of 0·42.
In the rural areas of the various districts it was found that Jaipur with 4·51)% un-registered workshops stood at the top. Alwar with 2'64% -came next. J aisalmer recorded the lowest percentage of O· 12 on this account.
A similar position with regard to the urban areas revealed that J aipur had the highest percentage (10·78). Ajmer with 6·09% units came next. The lowest percentage of 0·30 was recorded in Jaisalmer.
The following table shows percentage dist~bution of unregistered workshops in the State and various districts for the rural and urban areas separa.tely:-
State/District
1
Ra,asthan Gongana.ga.r Bika.nar Ch,uru Jh, lUIjb,unun
Alwar Bh,aratpur Sawai Madhopur Jaipur Sikar Ajmer Tonk Jaiaalmer Jodhpur Nagaur Pa]i Barmer .Tal Or
Sirohi Bhllwam Udaipur
2 3
100'00 36'80 4'79 1·97 2-64 0-41 2'99 0,S7 2'62 1'06 4'45 2'64 4'82 1'07 4'48 2'24
15'33 4'55 4'01 1·35 7' 73 l' 64
3'12 1'16 0'42 0'12
5'63 0'89 3·71 1'37 3'85 2'18 1'69 0'94 1·26 0'76
1'65 0'68 4·07 2·18 6·16 2'21
4
63'20 2'82 2'23 2'62 1'56
1'81 3'25 2'24
10·78 2'66 6'09 1'96 0'30 4'74 2'34 1'69 0'75 0'00 0-97 1'89 3'95
8
1 2 3 4:
Chittaurg&rh 3'94 1·97 1'97
Dunga.rpur 0'84, 0',43 0'41 BlUlSwara 0·85 0-31 O·1S4,
Bundi }'67 0·1)1 1·06
Kota 0·11 1'9,1 3'17
Jha.lawa.r 2·27 lol17 O'9~
Out of 63·20% unregistered workshops in the urban areas of the State, the cities accounted for a.lmost 1/3 of them. The percentage in the oities worked out to 22·58. J aipur with a percentage of 8'91 occupied the top place followed by Jodhpur whioh had 4·06% such units. Bikaner had the ] owest percentage of 1· 70.
The following table shows percentage distribution of unregistered workshops in all the cities along with rank:-
City :Percentage Rank
Bikaner 1·70 6 Jaipur 8·91 1 Ajmer 3'09 3 Jodhpur 4·06 2 Udaipur 2·54 4 :Kata 2'28 Q
The'distribution pattern of 1,000 establishments of all kinds and in all sectors in the I1ll"al areas of the State revealed that the Private sector dominated to such an extent that while the Govt. or Quasi Govt. Sector owned one unit and the cooperative sector negligible, the Private sector had 81 units in its control. This dominance became still more marked in the urban areas. Here the Private sector owned 238 units as against 2 owned by the Govt. or Qua.si Govt. Sector and 1 by the Co-operative sector.
Simila.r trend wa.s observable in the districts also. While the Govt. or the Quasi Govt. and Co-operative sectors contributed inBignifi.can~ number of units, the Private sector was in full cry and more SO in the urban areas. However. in the rural areas of the various districts, the highest number of privately owned units was 116 and Was found in Ganganagar. Alwar came closely behind with 110 units. Jaisalmer recorded the lowest number of units which was 35.
In the urban areas of the various districts, Jaipur stood at the top with 278 units closely followed by
Tonk which had 270. The lowest number of such units was 178 and was found in Barmer and Dungarpur.
The following table shows distribution ofumegistered workshops by each sector from out of 1,000 establishmel).ts of all kinds in the rural and urban areas of the State and districts:-
State/District
RaJasthan Gongs nagar Bihner Ch1l1"1l J'hunjhunun Alwa.r Bharatpur Sa.wai Madhopur Jaipur 8ikar Ajmer Tonk Jaisalmor Jodhpur Nagaur Pa.1i Barmer Jalor BiroID Bhilwara Udaipur Chitt urga.rh Dungarpur Banswa.ra. Bundi Kota Jhalawa.r
.,.
Rural Urban ~ r'--~-~'~--~, abo a b
1 81 1 116
2 97 1 66 1 105 1 110
N 89 N 90 1 106 1 79 1 80
N 81 6 36 1 79
N 69 N 81 2 97
69 1 76
N 69 N 56 1 81
N 02 N 30 N 58 N 78 N 96
If N N
s asB 9 194 2 220 1 234,
9 186 N 1 204 N 1 254. NI 2 238 1 1 273
N 1 243 I I 262
N 5 270 N 11 204 N 3 24,7
I 1 239 N 2 2.29
2 178
N N N N N
N N
1 238 1 210 1 252 4 250 1 80 2 178 3 211
246 2 213 1 222
c
1
N N N 1 N 1 I
N N 1
N
1
1
1 N N N
! 1 N
(a...."Govt. or Quasi Govt., b=Privato, o=Co-operative) (N Negligible)
A similar distribution in the case of cities also revealed complete dominance of the Private sootor. Jaipurwith 292 units stood at the top followed by Ajmer which had 253 units_ Bikaner with 206 units occupied the bottom place.
The following table shows distribution of unregistered workshops in each sector in each city:-
City
Bilmner Ja.ipur Aimer Jodhpur Udaipur Kota
a
2 1 2 3 4 3
b
206 292 203 252 238 219
o
N N N 1 N I
(a-,Govt. or Qua~i GOTt •• b=Private. o=Co-operatlv8)
M/B(D)IRGI -2
9
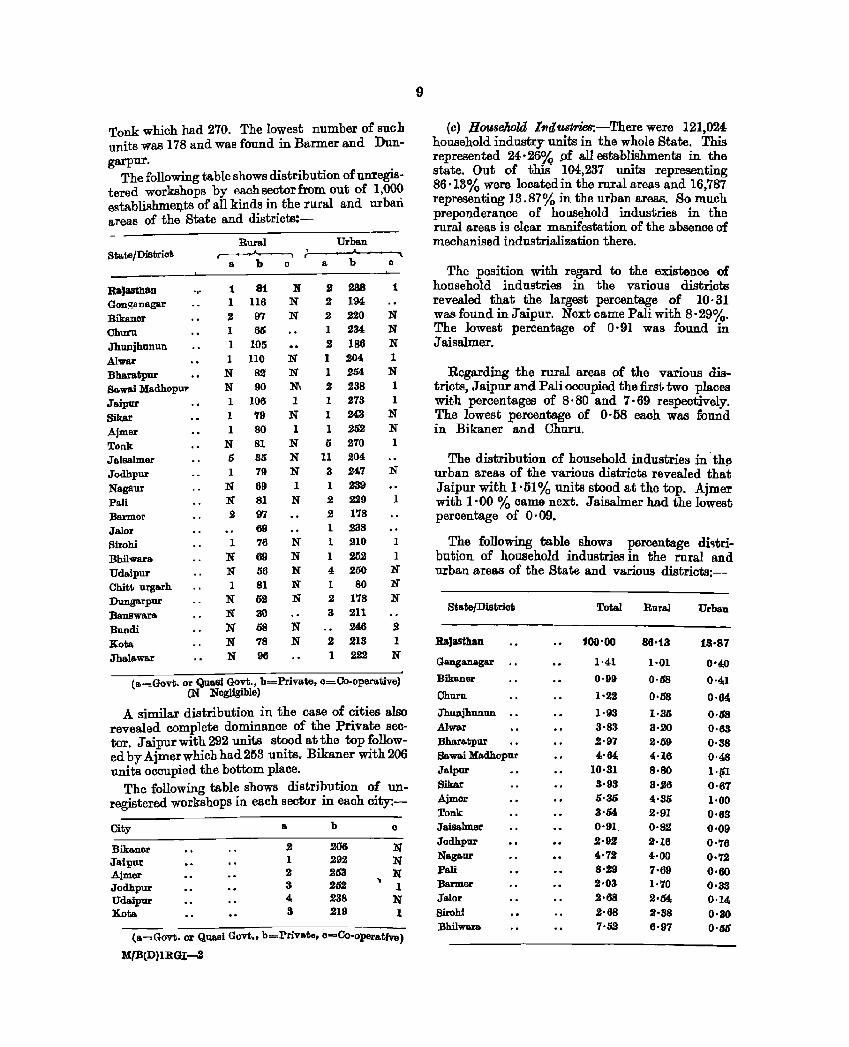
(c) BQuse}w1A1 l'll(lustries:-There were 121,024-household industry units in the whole State. This represented 24·26% pf all establishments in the state. Out of this" 104,237 units representing 86-13% were located in the rura.l areas and 16,787 representing 13.87% in the urban areas. So much preponderanoe of hOU8~hold industries in the rural areas is clear manifestation of the absence of mechanised industrialization there.
The position with regard to the existence of household industries in the various districts revealed that the largest percentage of 10· 31 was found in Jaipur. Next came Pali with 8-29%. The lowest percentage of 0-91 was found in J aisalmer_
Regarding the rural areas of the various districts, J aipur and Pali occupied the first two places with percentages of 8·80 and 7·69 respectively. The lowest percentage of 0-68 each was found in Bikaner and Churn.
The distribution of household industries in" the urban areas of the various districts revealed that Jaipur with 1'01 % units stood at the top_ Ajmer with 1 -00 % came next. Jaisalmer had the lowest percentage of 0·09.
The following table shows percentage dhtribution of household industries in the rural and urban areas of the State and various districts:-
Sta.te/District Tota.I Rural Urb&D
Rajasthan 100·00 86·13 13·87
Ganganagar 1·41 1·01 0'40 Bikaner 0·99 0·58 0·4;1 Churn 1·22 0·58 0·64 Jhunjhunun 1·93 1·35 0·68 A1_r 3·83 3·20 0·63 Bha.ra.tpur 2·97 2·59 0·38 Sawai Madhopur 4·64, 4·16 0·48 Jaipur 10·31 8·80 1·~1 Sikar 3·93 3·26 0·67 Ajmer 0·36 4·35 1·00 Tonk: 3·64, 2·91 0·63 Jaisalmer 0·91 0·82 0·09 Jodhpur 2·92 2·16 0·76 Na.ganr 4·72 4,·00 0·72 Pa.li 8·29 7·69 0·60 Banner 2·03 1·70 0·33 Jalor 2·68 2·54, 0·14. Birahi 2·68 2'38 0·30 Bhilwara. 7-li2 6'97 0·00
StaUl/Distriot Table Rural Urban
Udaipur 8'26 7·41 0'85
Chittaurgarh 1)·23 '·56 0·67
Dungarpur 1'64, 1'42 0·,22
Ba.nBwar& 2·71 ~h17 0·24
Bundi 1·79 1·46 0·34
Kotu, IHU '·73 0·48
JheJawar 3'S9 3·04 0'26
Out of 13·87% household industry units in the urban areas of the State, the cities accounted for 2·62% out of it. Relatively leBBer proportion of such units in the cities lends further support to the fact that the largest majority of household industries have rural character.
Wit'hin the cities, Jaipur had the highest percentage of 0·78 while Kota, the lowest (0'22). The following table shows percentage distribution in each city with rank:-
City PerClllDtage Rank
Bikaner 0'27 0
Jaipur 0·78 1
Ajmer 0·42 4
Jodhpur 0·43 3
Udaipur 0'00 2
Xota 0·,22 6
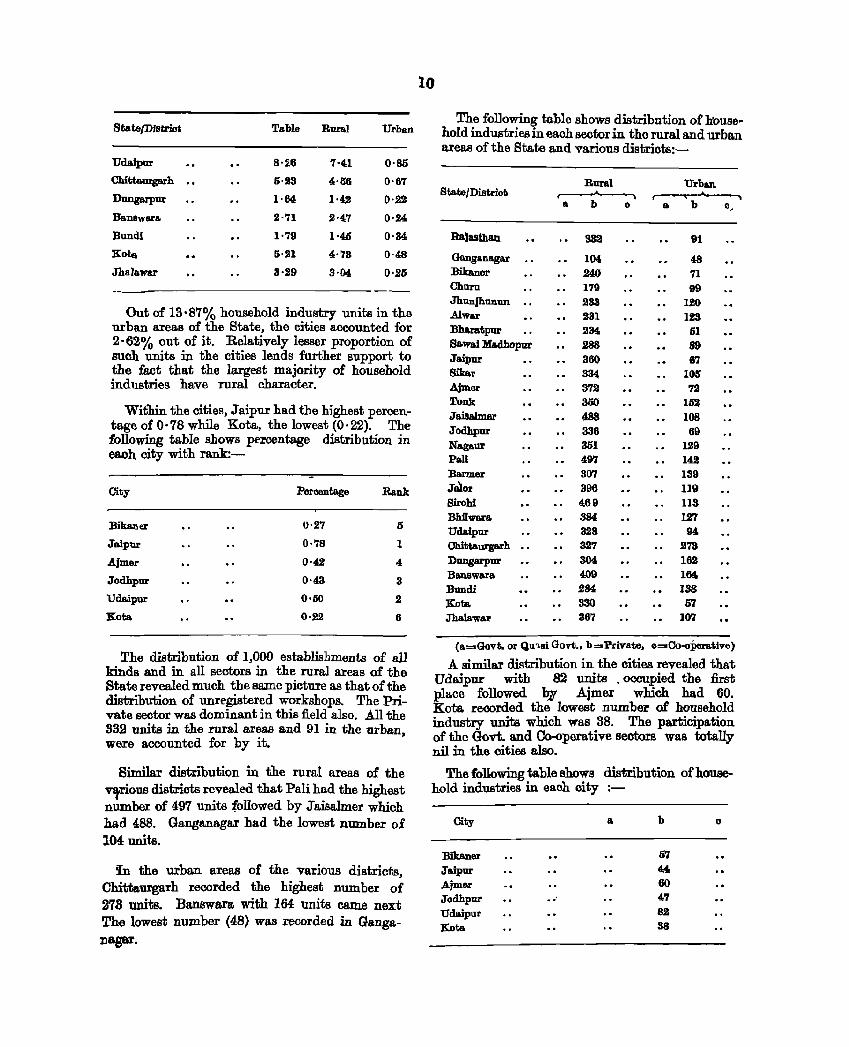
The distribution of 1,000 establishments of all kinds and in all sectors in the rural areas of the State revealed much the same picture as that of the distribution of unregistered workshops. The Private sector was dominant in this field also. .All the 832 units in the rural areas and 91 in the urban, were accounted for by it.
Similar distribution in the rural areas of the v,nous districts revealed that Pali had the highest number of 497 units followed by .J aisalmer which had 488. Ganganagar had the lowest number of 104 units.
in the urban areas of the various districts, Chittaurgarh recorded the highest number of 273 units. Banswara with 164 units came next The lowest number (48) was recorded in Gang&IIagar.
10
The following table shows distribution of h'ousehold industries in each Bootor in the rural and urban areas of the State and various distriots:-
Rural Urban State/Distriot ~ A
a b 0 a. b ",
Ra'asthan SS2 91
Ganganagar 104 48 Bibner 240 71 Churn 179 99 Jhllnjhunun .. 233 120 Alwar 231 ISS Bharatpur 234 61 Sa.wai Madhopur 288 89 Jaipur 860 67 Sibr 33( 106 A.jmer 372 72 Tou 300 162 Jaisa.Jme.r 488 lOS Jodhpur 336 69 Nagaur 361 1.29 Pali 497 142 Barm.er 307 139 Jaior 396 119 Sirohi 469 113 BhilWIIol'a 384 127 Udaip1ll' 328 94-Chittaurga.rh 327 273 Dllllgarpur 304 162 Banswara 409 164 Bundi 284 138 Kota 330 m Jhalawar 367 107
(a=Govt. or Qu.'1si Govt •• b=Private. o=Co-opera.tive)
A similar distribution in the cities revealed that Udaipur with 82 units . occupied the .first place followed bJ' Ajmer which had 60. Kota recorded the lowest number of household industry units which was 3B. The participation of the Govt. and Co-operative sectors was totally nil in the cities also.
The following table shows distribution of household industries in each city :-
City a b 0
Bikaner 07 Jaipur 44 Ajm!!r 60 Jodhpur .. 47 Udaipur 82
Kota 38
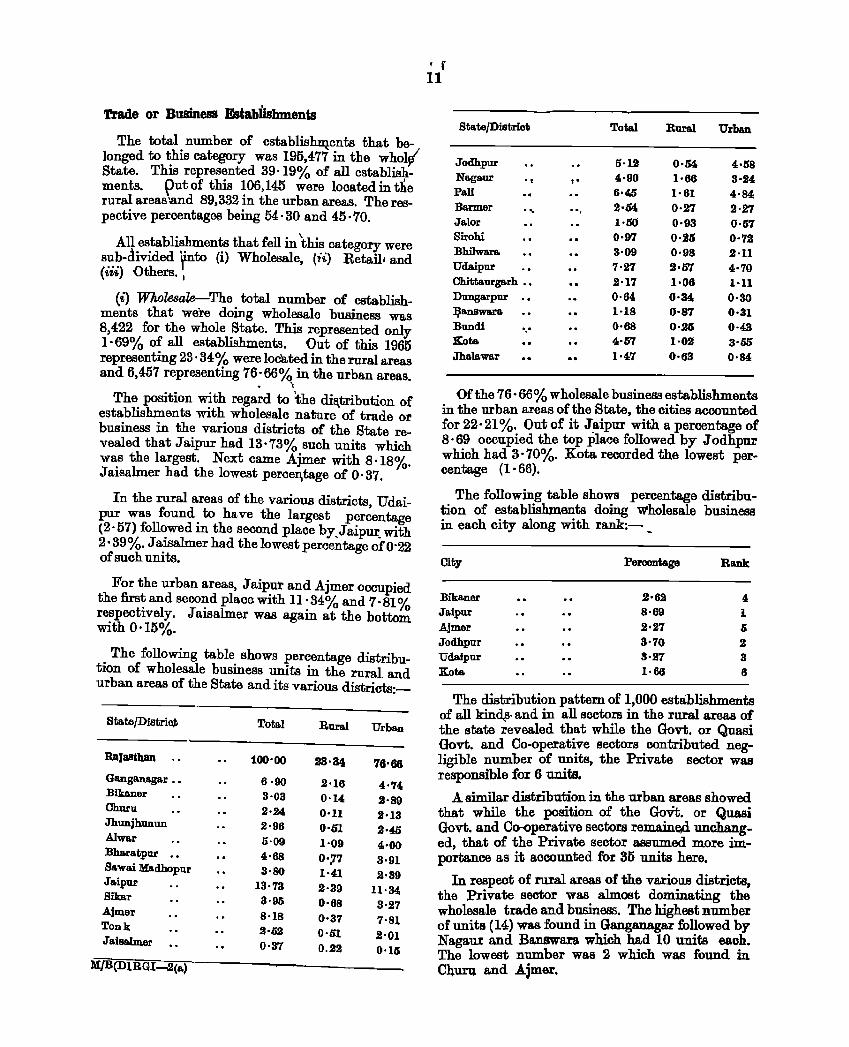
Trade or Business Establishments
The total number of establis~entB that belonged to this category was 196,477 in the whol{ State. This represented 39 '19% of all establishments. putof this 106,145 were located in the rural areas '.and 89,332 in the urban areas. The respective percentages being 54· 30 and 45·70.
All.es.tabli~~ent:s that fell in 'thi~. category were sub-dIVided Fto (1) Wholesale, ("') RetaiVand (iii) Others. I
(i) Wholesale-The total number of establishments that we're doing wholesale business was 8,422 for the whole State. This represented only 1· 69% of all establishments. Out of this 1966 representing 23· 34% were located in the rural areas and 6,457 representing 76'66% in the urban areas. . ,
The position with regard to the dis.tribution of establishments with wholesale nature of trade or business in the various districts of the State revealed that Jaipur had 13'73% such units which was the largest. Next came Ajmer with a.18o/c Jaisalmer had the lowest perceJ:\tage of 0.37. o·
In the rural areas of the various districts, Udaipur was found to have the largest percentage (2'5'Q foll~wed in the second place by_Jaipur. with 2·39 Yo. J alSalmer had the lowest percentage of 0'22 of such units.
For the urban areas, Jaipul' and Ajmer occupied the :firs~ and seco~d place with 11 . 34 % and 7· 81 % re~pectlvely. Jalsalmer was again at the bottom WIth 0'15%.
. The following table shows percentage distributIOn of wholesale business units in the rural and urban areas of the State and its various districts:-
Stllote/DistrioJ; Totllol Rurllol Urban
RaJasthan 100'00 S3'34 76'66 Ga.nganagar •• 6 ·90 2'16 4:'74: Bikaner 3'03 0'14 2'89 Ohuru 2·24 0'11 2·13 Jhunjhunun 2·96 0·51 2·45 A1war 5'09 1'09 4,·00 Bharatpur .. 4'68 0·77 3·91 Bawai Madhopur 3'80 1'4:1 2'39 Jaipur 13·73 2·39 11·34 Sikar 3'95 0'68 3'27 Ajmer 8·18 0'37 7'81 Tonk 2·6.2 0'01 Jaisalmer 2'01
0'37 0.22 0'15 MJB(D1RGI :2(&)
, f 11
StateJDistriot Toml Rural Urban
Jodhpur 5·12 0·54, 4:·58 Nagaur ., t· "90 1'66 3'24: Pall 6·45 1·61 4'84 Barmer ..._ .. , 2'64 0'27 .2·27 Jalor 1·50 0·93 0·57 Sirohi 0·97 0·25 0'72 Bhilwara. 3·09 0·98 2'11 Udaipur 7·27 2·57 4:·70 Chittaurgarh •• 2'17 1·06 1·11 DllDgarpur 0·64, 0·34, 0·30 ~answa.ra 1·18 0·87 0·31 Bundi 0·68 0·25 0·43 Kota 4·57 1·02 3·65 Jha.lawar 1·4:7 0'63 0·84
Of the 76·66% wholesale business establishments in the urban areas of the State, the cities accounted for 22·21 %. Out of it Jaipur with a percentage of 8·69 occupied the top place followed by Jodhpur which had 3'70%. Kota recorded the lowest percentage (1· 66).
The following table shows percentage distribution of establishments doing wholesale business in each city along with rank::-_
City Peroentage Rank
Bikaner 2'62 , Ja.ipur 8·69 1 Ajm.er 2·27 5 Jodhpur 3'70 2 Udaipur 3'27 3 Kota 1·66 6
The distribution pattern of 1,000 establishments of all kin<\s· and in all sectors in the rural areas of the state revealed that while the Govt. or Quasi Govt. and Co-operative sectors contributed neg-ligible number of units, the Private sector was responsible for 6 units.
A simila.r distribution in the urban areas showed that while the position of the Gon. or Quasi Govt. and Co-operative sectors remaine,d unohang~ ed, that of the Private sector assumed more im-parlance as it accounted for 36 units hexe.
In respect of rural areas of the variollS districts, the P.rivate sector was almost dominating the wholesale trade and business. The highest number of units (14) was found in Ganganagar followed by Nagaur and Ba.nswara which had 10 units each. The lowest number was 2 which was found in Churu and Ajmer.
12
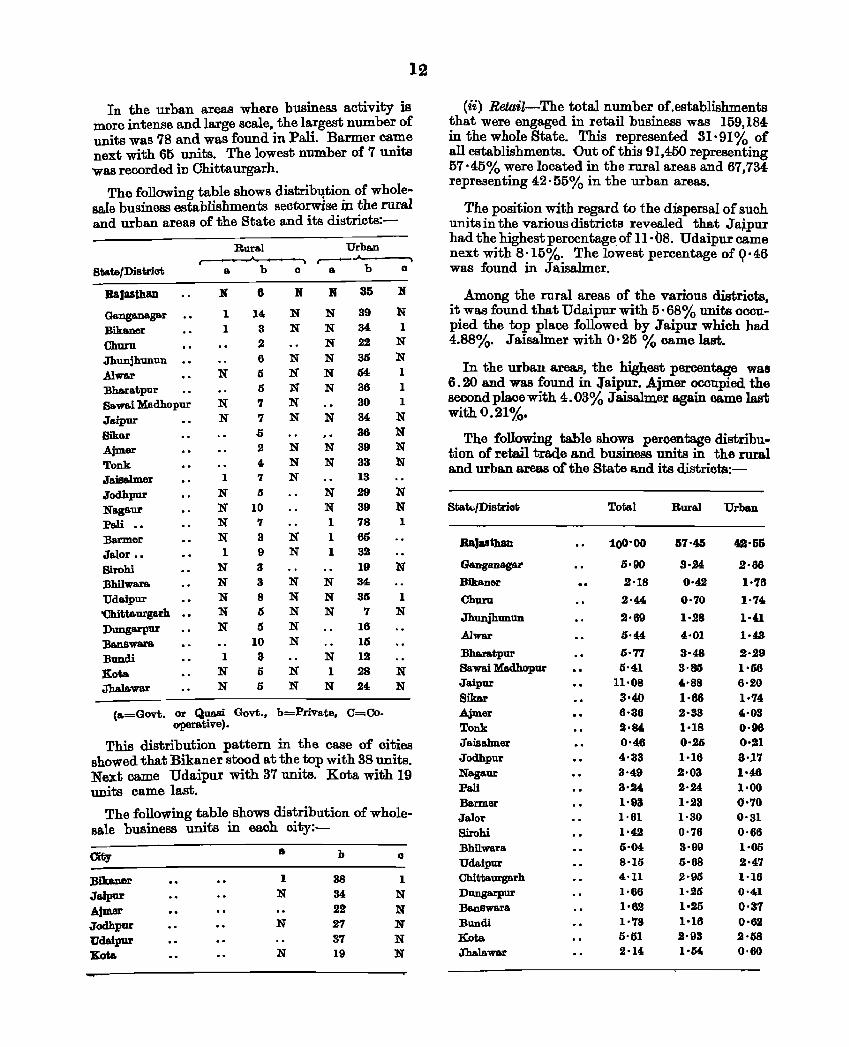
In the urban areas where business activity is (ii) Retail-The total number of. establishments more intense and large scale, the largest number of that were engaged in retail busmesB was 159 184 units was 78 and was found in Pall. Barmer came in the whole State_ This represented 31'91% of next with 65 units_ The lowest number of 7 units all establishments_ Out of this 91,450 representing was recorded in Chittaurgarh. 57· 45% were located in the rural areas and 67,734-
The following table shows distrihqtion of whole-representing 42-55% in the urban areas_
sale business establishments sectorwise in the rural The position with regard to the dij;persaI of such and urban areas of the State and its districts:- units in the various districts revealed that J a~pur
Rura.l Urba.n had the highest percentageof 11· os. Udaipur came
,---.- ..... next with 8-15%_ The lowest percentage of 9.46 State/District a. b 0 a b 0 was found in Jaisalmer_
Rajasthan N 6 N N 35 N Among the rural areas of the various districts Ganganagar 1 14 N N 39 N it was found that Udaipur with 5· 68% units occu: Bikaner 1 3 N N 34 1 pied the top place followed by J aipur which had
ChlU'U 2 N 22 N 4.88%_ J a.isalmer with 0 -25 % came last. Jhunjhunun 6 N N 35 N
.Alwar N 5 N N 54: 1 In the urban areas, the highest percentage was
Bhara.tpur 5 N N 36 1 6_20 and was found in Jaipur. Ajmer occupied the
Ba.wai Madhopur N 7 N 30 1 secondpla.cewith 4.03% Ja.iaa.lmer a.gain came last
Jaipux N '1 N N 34 N with 0.21%.
Sikar .5 36 N The following table shows percentage distribu-Ajmer 2 N N 39 N tion of retail trade and business units in the rural Tonk 4 N N 33 N and urban areas of the State and its districts:-Jaifla,1mer 1 7 N 13
Jodhpur N 5 N 29 N
Na.ga.ur N 10 N 39 N Statu/Distrio1i Total Rural Urban
Pali •• N 7 1 78 1
Barmer N 3 N 1 65 RaJasthan 100-00 Ja.lor •• 1 9 N 1 32
57-45 42-55
Sirohi N 3 19 N Ganganaglll' 6-90 3-.24 2-66
Bhilwaro. N 3 N N 34 Bik.a.ner 2-1S 0-42 1·'18 Udaipur N S N N 35 1 Chum 2·44 0·70 1·74 'Cbitta.urgarh N 5 N N 7 N Jhunjhunun 2-69 1-28 1·4.1 Dunga.rpur N 5 N 16
l3a.nswara. 10 N 15 Alwar .5-4;4 4-01 1'4:3
Bundi 1 3 N 12 l3ha.ra.tpur 5-77 3·48 2-29
Koto. N 5 N 1 28 N Bawa.i Madhopur 5·41 3-85 1'56
Jhala.war N 5 N N 24 N Ja.ipur n-os '·S8 6·20 Sikar 3'40 1-66 1·74
(o.=Govt_ or Qua.si Govt., b=Private, C=Co- Ajm.er 6·36 2'33 '-03 operative)_ Tonk 2-S4 1·18 0-96
This distribution pattern in the case of cities Jaisa.lmer 0-46 0·25 0'21
showed that Bikaner stood at the top with 38 units_ Jodhpur 4·33 1-16 S-17
Next came Udaipur with 37 units. Kota with 19 No.gaux 3·49 2·03 1'46
units came last. Pa.li 3-24 2·24 1·00
The following table shows distribution of whole-Barmer 1-03 1·23 0·70 Ja.lor 1·61 1·30 0-31
sale business units in each city:- Sirohi 1'42 0·78 0·66
City • b Bhilwara 0-04 3-99 1-05
0 UdaJ.pux 8-15 0-88 2-47
Bika.ner 1 38 1 Chittaurgarh 4·11 2·95 1·16
Jalpur N 34 N Dungarpur 1·06 1-25 0·41
Ajmer 22 N Ba.nswa.ra 1'62 1'25 0'37
Jodhpur N 27 N Bundi 1-78 1·18 0'62
Uclaipur 37 N Kota 5·51 2·93 2-OS
Keto. N 19 N Jha.lawar 2-14 1·64 0·60
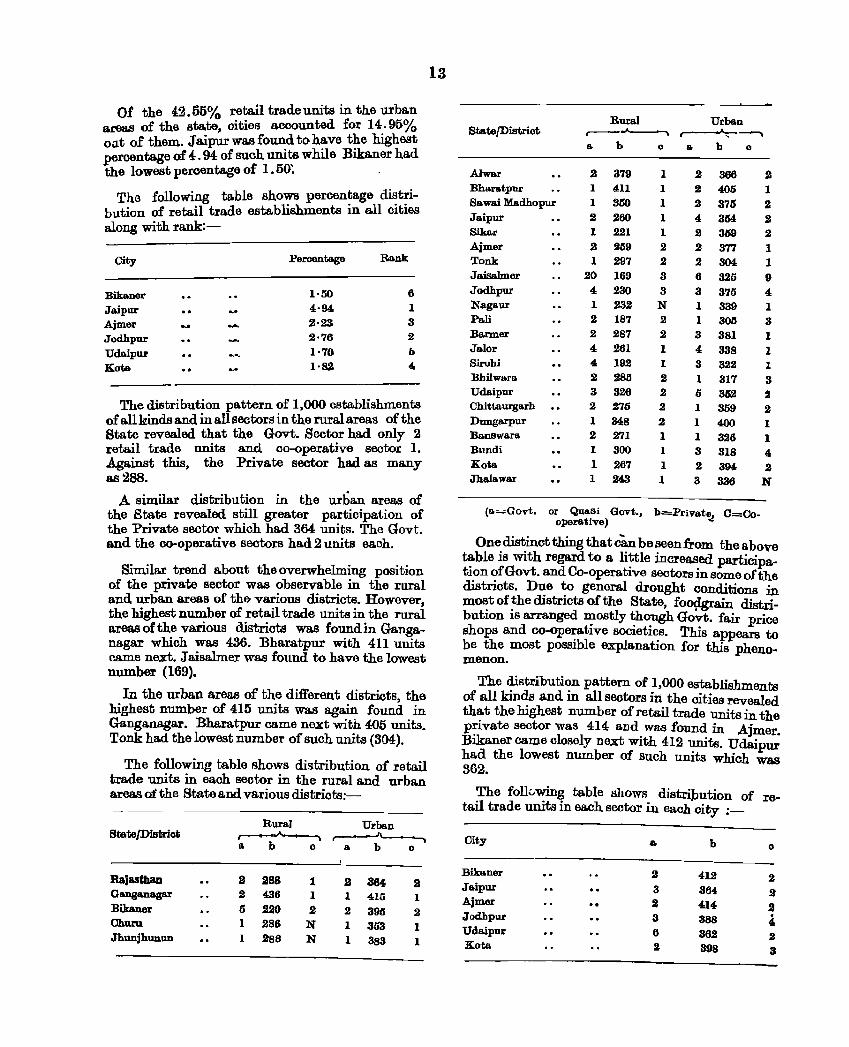
Of the 42.55% retail trade units in the urban ateaS of the state, oities accounted for 14: 95% oilt of them. Jaipur was found to have the hIghest percentage of 4.94 of suoh units while Bikaner had the lowest peroentage of 1.50: .
The following table sho~s percon~age di~t~ibution of retail trade estabhshments III all Cltles along with rank:-
City Peroentage Rank
Bikaner 1·50 6
Jaipur 4·94, 1
Ajmer 2'23 3
Jodhpur 2·76 2
Udaipur 1·70 b
Kot& 1·82 4.
The distribution pattern of 1,000 establishments of all1cinds and in all sectors in the rural areas of the State revealed that the Govt. Sector had only 2 retail trade units and co-operative sector 1. Against this, the Private sector had as many 80S 288.
A similar distribution in the urban area.., of the State revealed still greater participation of the Private sector which had 364 units. The Govt. and the co-operative sectors had 2 units eaoh.
Similar trend about the overwhelming position of the private sector was observable in the rural and urban areas of the various districts. However, the highest number of retail trade units in the rural areas of the various districts was found in Ganganagar which was 436. Bharatpur with 411 units came n~t. J aisalmer was found to have the lowest number (169).
In the urban areas of the different districts, the highest number of 415 units was again found in Ganganagar. Bharatpur came next with 405 units. Tonk had the lowest number of" such units (304).
The following table shows distribution of retail trade units in each sector in the rural and urban areas of the State and various districts:-
Rural Urban State/Distriot ~ \
a b 0 a b 0
Rajasthan a 288 1 a 3S4 a Oanganagar 2 436 1 1 415 1 Bik&ner 5 220 .2 2 395 2 Chum 1 286 N 1 353 1 Jhunjhunun 1 288 N 1 383 1
13
Rural Urban StatefDistriot r---~ ~~
a b 0 a b 0
A1war 2 379 1 .2 366 2 Bharatpur 1 411 1 2 405 1 Sawai Madhopur 1 350 1 2 375 .2 Jaipur Sikar Ajmer Tonk JaisaJmer Jodhpur Nagaur Pall Harmer Jalor Sirubi Bhilwara Udaipur Ohittaurgarb Dungarpur Banswara Bnndi Kot& Jhalawar
2 260 1 4 354 1 221 1 2 359 .2 259 2 2 377 1 297 2 2 304
20 169 3 6 325 4 230 3 3 375 1 232 N 1 339 2 187 2 1 300 2 287 2 3 381 4 261 1 4 338 4 192 1 3 322 2 285 2 1 317 3 326 2 5 352 2 275 2 1 359 1 348 2 1 400 2 271 1 1 326 1 300 1 3 318 1 267 1 2 394 1 243 1 3 336
or QuaSi Govt., b=Privat~ 0=00-operative)
2 2 1 1 9 4: 1 3 1 1 1 3 2 2 1
1 4 2
N
Onedistinctthingthatc8nbeseenirom theabove table is with regard to a little increased participation of Govt. and Co-opera.tive sectors in some of the districts. Due to general drought conditions in most of the districts of the State, fo~ain distribution is arranged mostly though Govt. fair price shops and oo-ope~ative societi~s. This appears to be the most posslble explanatlOn for this phenomenon.
The distribution pattern of 1,000 establishments of all kinds and in all sectors in the cities revealed that the highest number of retail trade units in the private sector was 414 and was found in Ajmer. Bikaner came closely next with 412 units. Udaipur had the lowest number of such units which was 362.
The follvwing table shows distribution of retail trade units in each sector in each city :_
City a b 0
Bikaner .2 412 2 Jaipur 3 364 .2 Ajmer .2 414 .2 Jodhpur 3 388 .
4. Udaipur 6 362 .2 Kota .2 398 3
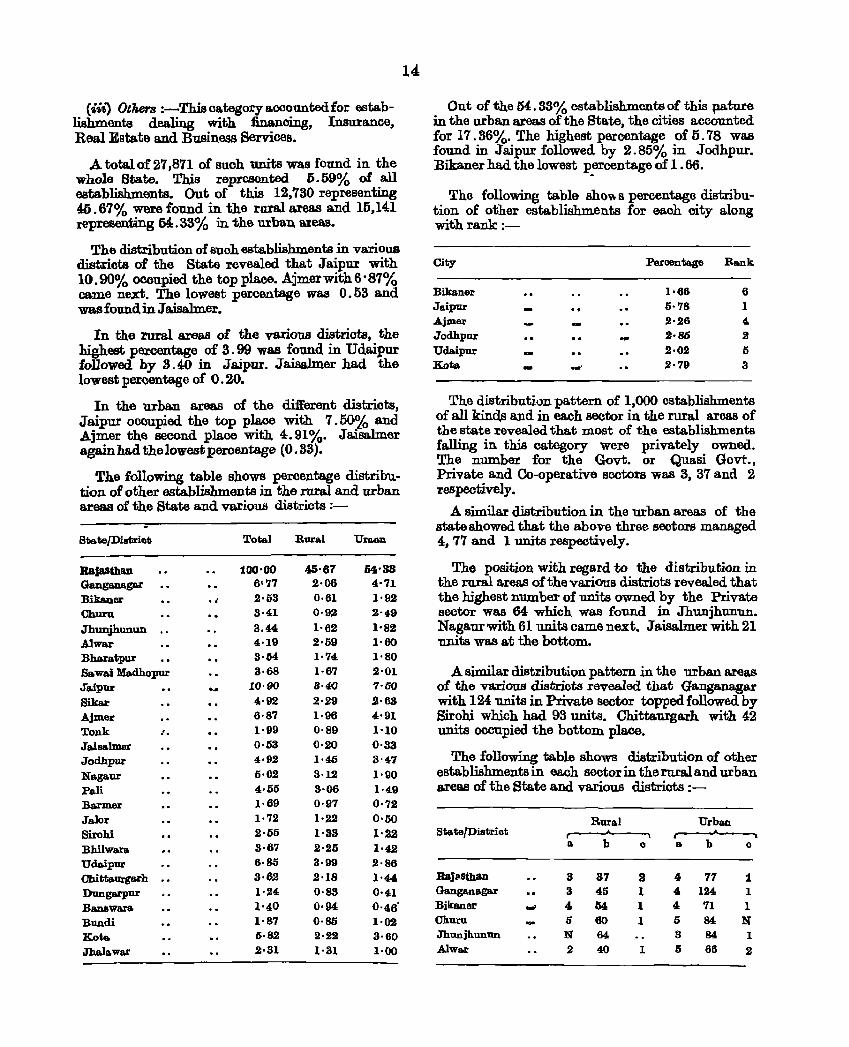
(iii) Others :-Thiscategoryaooountedfor establishments dealing with finanoing, Insurance, Real Estate and Business Services.
A total of 27,871 of suoh units was found in the whole State. This represented 6,59% of all establishments. Out of this 12,730 representing 45.67% were found in the rursJ areas and 15,141 representing 54:.33% in the urban. Meas.
The distribution of suoh establishments in various districts of the State revealed that Jaipur with 10.90% occupied the top place. Ajmerwith 6·87% came next. The lowest percentage was 0.53 and was found in J a.isaJmer.
In the rural areas of the various districts, the highest percentage of 3.99 was found in Udaipur followed. by 3.40 in Jaipur. Ja.isalmer had the lowest perQentage of 0.20.
In the urban areas of the diJIerent districts, Jaipur occupied the top place with 7.50% and Ajmer the second place with 4.91%. Ja.isalmer again had the lowest percentage (0.33).
The following table shows percentage distribution of other establishments in the rural and urban areas of the State and varioua districts:-
Btate/District
Bibner Chura
JbunjbunUD , . Alwar Bharatpur Sawai Madhopur Ja.ipur Sikar Ajmer Tonk .'. Jaisa.lmer Jodhpur Nagaur Pali Barmer Jalor Sirohi Bhilwara Udaipur Chittaurgarh •• Dunga.rpur Banawara Bundi Kata. JbaJawar
Total
100·00 6'77
• J 2·53 8·41 3_44 4·19 8·04 3·68
.... 10·90 4·92 6·87 1·99 0·53 4-92 5-02 4·55 1·69 1·72 2·55 S·67 6·85 3·62 1,24 1·40 1·87 5·82 2,81
Bura.l Urllo&Il.
45·67 64·S3 2·06 4·n 0·61 1·92 0·92 2-4-9 1'62 1·S2 2·59 1,60 1·74 1·S0 1·67 2·01 8·4.0 7·00
2·29 .2·63 1·96 4'91 0-S9 1·10 0·20 0·33 1-45 3·47 3·12 1·00 3·06 1·49 0·97 0·72 1·22 0·50 1·S3 1·22 2·25 1·42 3-99 2·86 .2·18 1·44 0·83 0·41 0·94 0·46' 0·85 1'02 2,22 3·60 1·31 1'00
14
Out of the 54.33% establishments of this t:mture in the urban areas of the State, the cities accounted for 17.36%, The highest percentage of 6.78 was found in Jaipur followed by 2.85% in Jodhpur. Bikaner had the lowest p~rcenta.ge of 1.66.
The following table shov. s percentage distribution of other establishments for each city along with rank :-
City Percentage Rank
Bikaner 1·66 6 Jaipur 5·78 1 Ajm.er .2·.26 4
Jodhpur - 2·86 2 Udaipur .2·02 5 Kota. _" 2·79 3
The distribution pattern of 1,000 establishments of all kinds and in each sector in the rural areas of the state revealed that most of the establishments falling in this category were privately owned. The number for the Govt. or Quasi Govt., Private and Co-operative sectors was 3, 37 and 2 respectively.
A similar distribution in the urban areas of the state showed that the above three sectors managed 4,77 and 1 units respectively.
The position with regard to the distribution in the rural areas of the various districts revealed that the highest number of units owned by the Private sector was 64 which was found in Jhunjhunun. Nagaurwith 61 units came next. Jaisalmer with 21 units was at the bottom..
A s.imilar distribution pattern in the urban areas of the various districts revealed that Ganganagar with 124 units in Private sector topped followed by Birohi which had 93 units. Ohittaurgarh with 42 units occupied the bottom place.
The following table shows distribution of other establishments in each sector in the rursJ and urban areas of the State a.nd various districts:-
Rura.l Urban State/Distl.'ict ~ ~
a b 0 a b 0
Rajl'sthan 3 37 a 4 71 1 Ganganagar 3 45 1 4 124 1 Bikaner _' 4 54 1 4 71 1 Churu 5 60 1 5 84 N Jhunjhunun N 64 3 84 1 Alwa.r 2 40 1 5 66 2
Bural Urban Sta.tefDistriot r-----A---,. r----A-~
a b 0 & b 0
, Bharatpur 3 33 1 5 51 1
Sa wai Madhopur •• .2 24 1 4 80 1
Jaipur 2 29 1 3 72 1
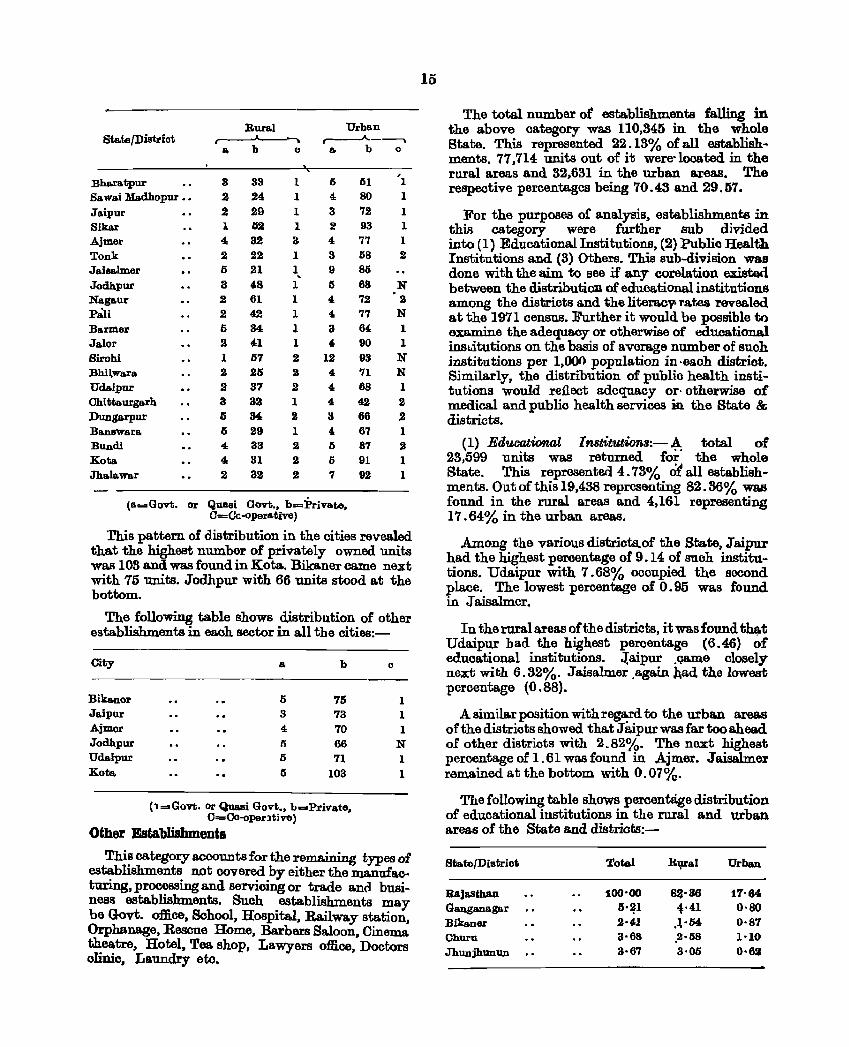
Sikar 1 WI 1 2 93 1 Ajmer 4 82 3 4 77 1 Tonk 2 22 1 3 58 2 Jaisalmer 5 21 1, 9 S5 Jodhpur 3 48 1 5 68 N Nagaur 2 61 1 4 72 2 PO:li 2 42 1 4 77 N Barmer 5 S4 1 3 64 1 Jalor 2 41 1 4 90 1 Birahi 1 57 2 12 93 N Bhi~W'a.ra. 2 25 S 4, 71 N Udaipur 2 37 2 4 68 1 Chittaurgarh 3 32 1 4, 4S 2 Dungarpur 6 34 2 3 66 2 Ba.nBw&ra 5 29 1 4 67 1 Bondi " 33 2 5 87 2 Kata 4 31 2 5 91 1 Jhalaw8r 2 32 2 7 92 1
(8=GOVt. or Quasi Govt., b=Private. C=Cc·operative)
·.rhis pattern of distribution in the cities revealed that the highest number of privately owned units was 103 and was found in Kota. Bikaner came next with 75 units. Jodhpur with 66 units stood at the bottom.
The following table shows distribution of other establishments in each sector in all the citias:-
City a b 0
Bibner 5 75 1 Jaipur 3 73 1 Ajmer 4 70 1 Jodhpur 5 66 N Udaipur 5 71 1 Kata 5 103 1
(\=Govt. or QU&IIi Govt •• b=Priva,te. C=Co-operltive)
Other Establishments
This category a.ccounts for the remaining types of establishments not covered by either the manufacturing, processing and servioing or trade and business establishments. Such establishments may be Govt. office, School, Hospital, Railway station, Orphanage, Rescue Home, Barbers Saloon. Cinema. theatre, Hotel, Tea shop, Lawyers office. Doctors olinic. Laundry etc.
15
The total number ot establishments taIling in the above category was 110,345 in tlle whole State. This represented 22.13% of all establishments. 77.714 units out of it were-located in the rural areas and 32.631 in the urban areas. The respective percentages being 70.43 and 29.67.
For the purposes of analysis, establishm.e~t:s in this category were further Bub dIVIded into (1) Educational Institutions. (2) Public Health Institutions and (3) Others. This sub-division was done with the aim to see if any corela.tion existed between the distributiOD of educational institutions among the districts and the literac}'ll'at.es revealed. at the 1971 census. Further it would be possible to examine the adequacy or otherwise of ~ducation.a.l insllitutions on the basis of avorage number of such institutions per 1,000 population in ·eaoh distriot. Similarly, the distribution of publio health institutions would reflect adequacy or· otherwise of medical and public health services in the State & districts.
(1) Educatio'll4l Institutioo8:-~ total of 23,599 units was returned for the whole State. This represented 4.73% of all establishments. Out of this 19,438 representing 82.36% was found in the rural areas and 4,161 representing 17.64% in the urban areas.
.Among the various districta.of the State, Jaipur had the highest percentage of 9.14 of moh institutions. Udaipur with 7.68% occupied the second place. The lowest percentage of 0.95 was found in J aisalmer.
In the rural areas of the districts, it was found t~t Udaipur had the highest percentage (6.46) of educational institutions. J,aipur .«tame closely ne~t with 6.32% . .TaiseJmer .again had the lowest percentage (0.88).
A similar position with reg~d to the urban areas of the districts showed that Jaipurwas far too ahead of other districts with 2.82%. The next highest percenta.ge of 1.61 was found in Ajmer. J aisa.lmer ramained at the bottom with 0.07%.
The following table shows percentage distribution of educational institutions in the rural and urban areas of the State and distriots:-
State/Distriot Total Blp'al Urban
Rajasthan 100·00 8'1·86 11·64 Ganganaga.r 3·~1 .-41 O·SO Bikaner 2·41 .~ .54: 0·S7 Churu 3·68 .2·58 1·10
Jhunjhunun 3·67 3·05 0·62
Sto.telD~iot Total Rural Urban
Alwar 5'23 4·67 0·56 Bharatpur 5·70 4·85 0·85 Sawai Ha.dhopur 4·56 4·10 0·46 Jaipur 9·14 6·32 2·82 Siqr 4·35 3·57 0·78 Ajm.er 4·97 3·36 1·61 Tonk 2·37 1·93 0'44 Jaisalmer 0·95 0,88- 0·07 Jodhpur 4·37 2·92 1·45 Nagaur 4'40 3'92 0·48 Pali 3·51 3·08 0·43 Barmer 2·87 2·70 0·17 Jalor 2'23 2'16 0·07 Sirohi 1·54 1'23 0·31 Bhilwara 4·11 3·64 0'47 Udaipur 7·68 6·46 1·22 Chittaurgarh 3·66 3'28 0'38 Dungarpur 2·51 2·35 0'16 Banswaro. 2·95 2·80 0·15 BlJDdi 1·40 1-17 0·23 Koto. 4·37 3'49 0·88 Jhalawar 2'16 1·90 0·26
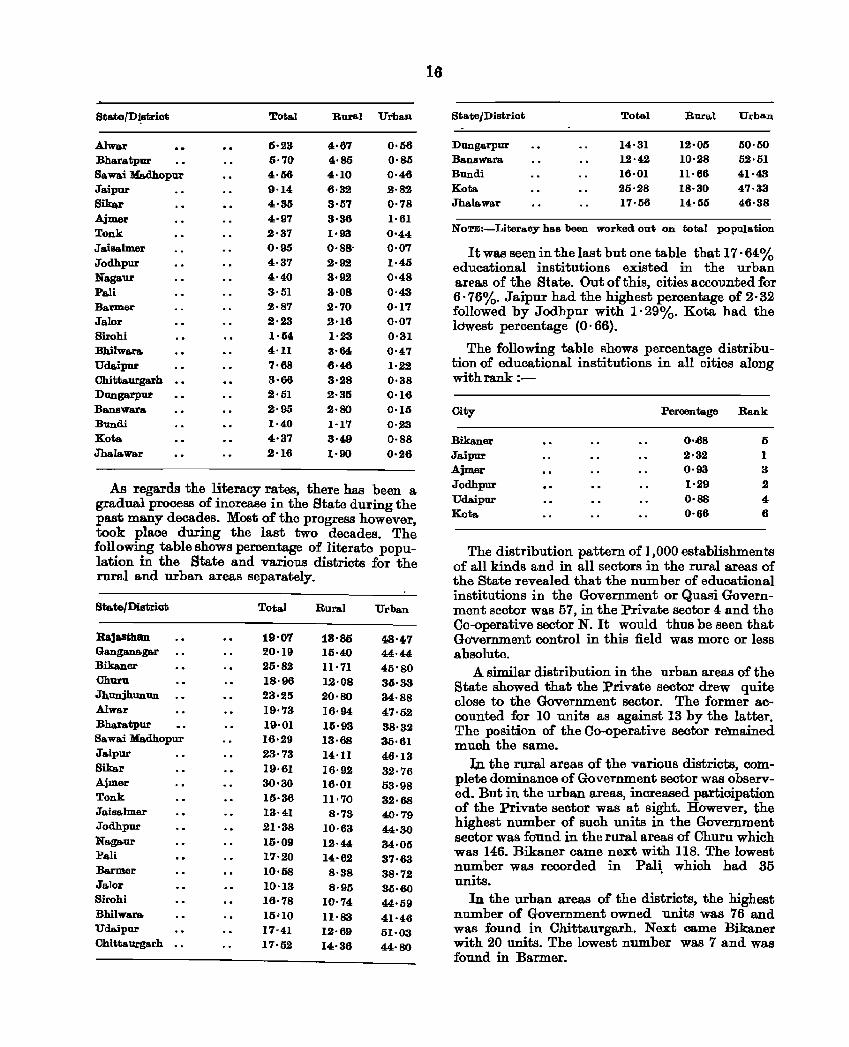
As regards the literacy rates, there has been a gradual process of inorease in the State during the past many deca~es. Most of the progress however, took place durmg the last two decades. The following table shows peroentage of literate popu-lation in the State and various distriots for the rural and urban areas separately.
State/Dilltrict Total Rural Urban
RaJasthan 19'01 18'85 48'407 Gangana.gar 20'19 15·40 44·44 Bikaner 25'82 11·71 45'80 Churu 18'96 12·08 35'33 Jhunjhunun 23·25 20·80 34·88 Alwar 19'73 16'94 47·52 Bharatpur 19'01 15·93 38'32 Sawai Madhopur 16·29 13·68 35·61 Jaipur 23'73 14·11 46'13 Sikar 19·61 16·92 32·76 Ajmer 30·30 16·01 53·98 Tonk 15'36 11·70 32·68 Jaisalmer 13-41 8·73 40·79 Jodhpur 21'38 10·63 44'30 Naga.ur 15'09 12·44 34·05 Pali 17·20 14·62 37·63 Ba.rmer 10'58 8'38 38'72 Jalor 10'13 8·95 35·60 Sirohi 16·78 10·74 44'59 Bhilwara. 15'10 11·83 41·46 Udaipur 17-41 12·69 51'03 Chittaurgarh 17'52 14·36 44'80
16
State/Distriot Total Rural Urban
Dungarpur 14·31 12·05 50·50 Ba.nswara 12·42 10·28 52·51 Bundi 16·01 n·68 41·43 Kat .. 25·28 18·30 47·33 Jhalawar 17·56 VI· 55 46·38
NOTE:-Literaoy MS been worked out on total population
It was seen in the last but one table that 17·64% educational institutions existed in the urban areas of the State. Out of this, cities aocounted for 6· 76%. J aipur had the highest percentage of 2·32 followed by Jodhpur with 1· 29%. Kota had the lowest percentage (0' 66).
The following table shows peroentage distribution of educational institutions in all cities along withrank:-
City Peroen tage Rank
Bikaner 0·068 5 Jaipur 2·32 1 Ajmer 0·93 3 Jodhpur 1'29 2 Udaipur 0·88 4 Kota 0'68 6
The distribution pattern of 1,000 establishments of all kinds and in all sectors in the rural areas of the State revealed that th.e number of educational institutions in the Government or Quasi Government sector was 57, in the Private sector 4 and the Co-operative sector N. It would thus be seen that Go'Vernment control in this field was more or less absolute.
A similar distribution in the urban areas of the State showed that the Private sector drew quite close to the Government sector. The former accounted for 10 units as against 13 by the latter. The position of the Co-operative sector remained much the same.
lin the rural areas of the various district8, complete dominance of Government sector was observed. But in the urba.n areas, increased participation of the Private sector was at sight. However, the highest number of such units in the Government sector waS found in the rural areas of Chum which was 146. Bikaner came next with 118. The lowest number was recorded in Pali, which had 35 units.
In the urban areas of the districts, the highest number of Government owned units was 76 and was found in Chittaurgarh. Next came Bikaner with 20 units. The lowest number was 7 and was found in Barmer.
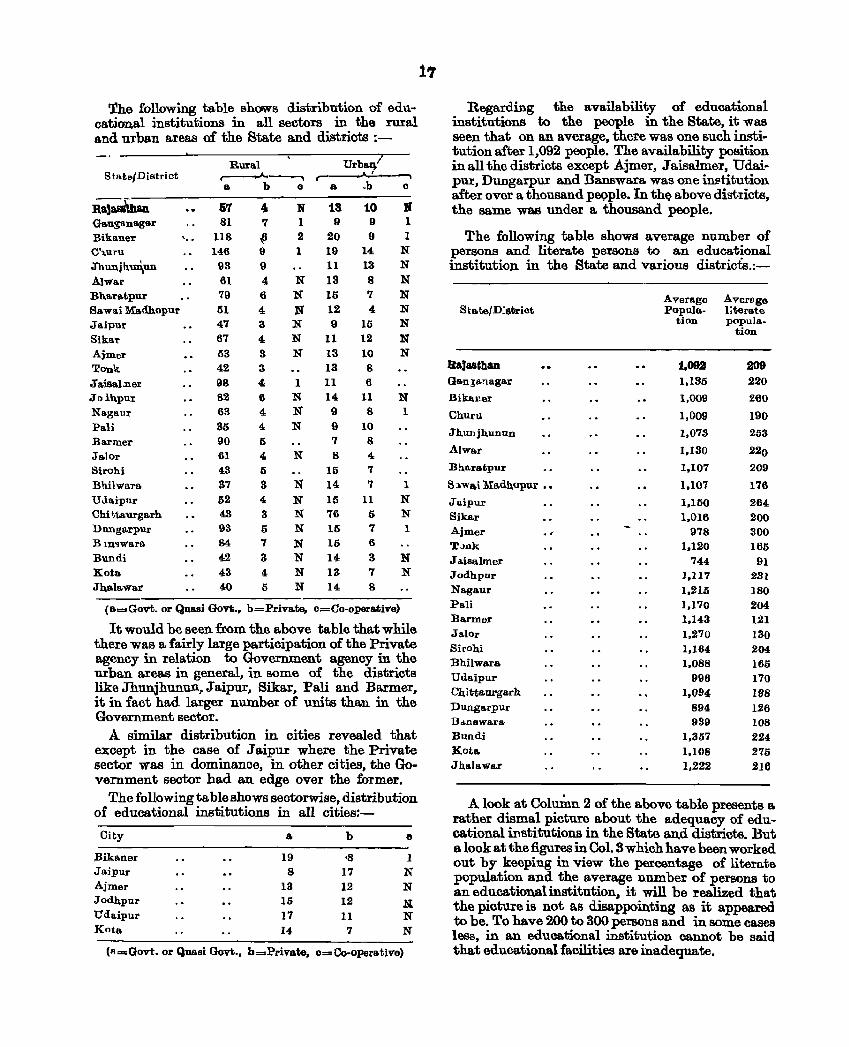
The following table shows distribution of educational institutions in all sectors in the rural and urban areas of the State and districts :-
State/District
Ra,ass'ihan Ga.1l$8Da.ga.r Bikaner C'l,uru
Jbunjh,m\UD. Alwar Bh,a.ra.tpur Sawd Madhopur Jaipur Sika,.. Ajmer Tonk Ja.isal.ner Jolb.pur Nagaur
Pali Barmer Ja.Jor Sirohi
Bhilwara UJaipur Chi ~taurgarh Dungarpur B1Dogwara Bundi Kota Jhalawar
Rural ...... ~
a. b 0
67 81
'.. 118 146
93 61 79 51 47 67
53 42 98 82 63 35 90 61 43 37 62 43 93
84 42 43 40
• 'l
.tJ 9 9 4 6 4 3
4 3 3 4-6 4 4
5 4 5 3 4,
3 5 7
3 4 5
13 I 9 2 20 1 19
11 N 13
10 9 9
14 13
8 N 15 7 N 12 4 N 9 15 N 11 12
N 13 10 13 8
1 11 6 N 14 11 N 9 8 N 9 10
7 8 N 8 4
15 7 N 14 7
N 15 11 N 76 5 N 15 7
N N N N
15 14 13 14
6
3 7 8
R 1 1
N N N N N N
N N
N 1
1 N N 1
N N
(a=Govt. or Quasi Govt •• b=Private. c=Co-operative)
It would be seen from the above table tha.t while there was a fairly large participation of the Private agency in relation to Government agency in the urban areas in general, in some of the districts like Jhunjhunun, Jaipur, Sikar, Pali and Barmer, it in fact had larger number of units than in the Government sector.
A similar distribution in cities revealed that except in the case of J aipur where the Private sector was in dominance, in other cities, the Government sector had an edge over the former.
The following table shows sectorwise, distribution of educational institutions in all cities:-
City
Bikaner Jaipur
Ajmer Jodhpur Udaipur Knta
19 8
13 15 17 14
b
'8 17 12 12
11 7
o
1 N N
lit N N
("_Govt. or Quasi Govt., b=Private, o=Co.operative)
17
Regarding the availability of educational institutions to the people in the State, it was seen that on an average, there was one such institution after 1,092 people. The availability position in all the districts except Ajmer, J aisalmer, Udai~ pur, Dungarpur and Banswara was one inf!'titution after over a thousand pe9ple. In th'} above districts, the same was under a thousand people .
The following table shows average number of persona and literate persons to an educational institutio}1 in the State and various districts.:-
State/D:strict
RaJasthan Ga.n~anagar
Bikaner
Churu
Jh,unjhunnD
Alwar
Bh.arBtpnr
Slowa.i Madhopur ••
Jaipur Sikar Ajmer . ~ TJJlk
Jdoisalmer Jodhpur Nagaur Pali Barmer Jalor Sirohi BhilwBra Udaipur C'hittaargarh Dungarpur Bd.DSWarB Bnndi Kota Jha.lawar
Average Aversge Popnla- litera.te
tion popula-tion
1,093 209 1,135 220
1,009 260
1,009 190
1,073 253
1,130 220
1,107 209
1,107 176
I.HiO 264 1.016 200
978 300 1,120 165
744 91 J,1l7 281 1,215 180 1,170 204 1,143 121 1,270 130 1.164 204 1.088 165
996 170 1,094 198
894 126 939 108
1,357 224 1,108 275 1,222 216
A look at Column 2 of the above table presents a rather dismal picture about the adequacy of educational institutions in the State and districts. But a look at the figures in Col. S which have been worked out by keeping in view the percentage of literate population and the average number of persons to an educational institution, it will be realized that the picture is not as disappointing as it appeared to be. To have 200 to 300 persons and in some cases less, in an eduoational institution oannot be said that educational facilities are inadequate.
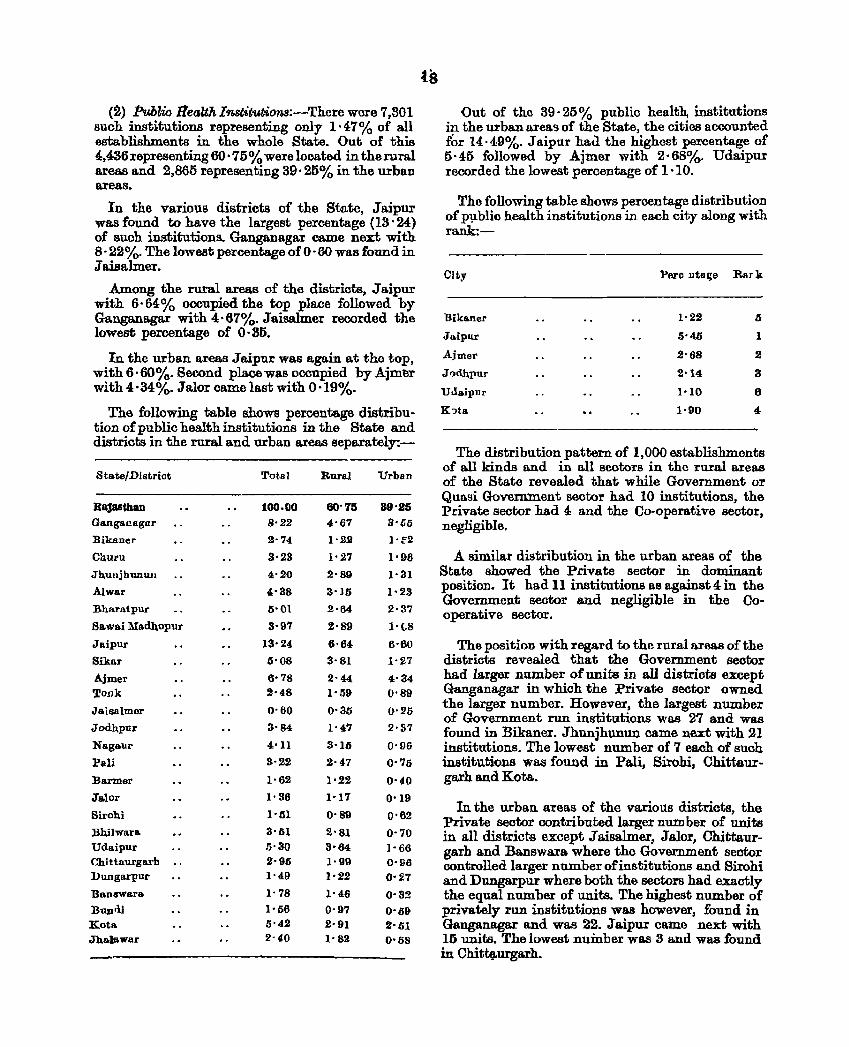
(2) Public ReaUh lnstitutions:-There were 7,301 such institutions representing only 1·47% of all establishments in the whole State. Out of this 4,436 representing 60·75% were located in the rural areas and 2.865 representing 39·25% in the urban areas.
In the various districts of the State, .r aipur was found to have the largest percentage (13·24) of such institutions. Ganganagar came next with 8·22%. The lowest percentage of 0- 60 was found in JaisaJmer.
Among the rural areas of the districts, J aipur with 6·64% occupied the top place followed by Ga.nganagar with 4·67%. Jaisalmer recorded the lowest percentage of 0·85.
In the urban areas Jaipur was again a.t the top, with 6·60%. Second place was occupied by Ajm~ with 4 ·34%. Jalor came last with 0 ·19%.
The following table shows percentage distribution of public health institutions in the State and districts in the rural and urban areas separately:-
State/ Dist.rict Tot·81 Rural Urb8n
RaJaSthan 100·00 60'75 89'25 Gangal1agar 8'22 4·67 a·56
Bikaner 2'74 1'.22 l'c2
Churu 3'23 1·27 1·96
Jb.unjhunull 4·.20 2'89 1·31
Alwar 4·38 3'15 1-23
Bharatpur 5·01 2·64 2-37
Sa.wai Madhopur 3-97 2'89 1'(,8
Jaipur 13'24 6'64 6'60
Sikar 5'08 3'81 1'27
Ajmer 6·78 2'44 4'34 Tonk 2-48 1·59 0'89
Jaisulmcr 0'60 0-35 0'25
Jodhpur 3-84 1·47 2':;7
Nagaur 4·11 3·16 0'96
PaU 3-22 2-47 0'75
Banner 1'62 1'.22 0'40
Ja.lor 1'36 1·17 0'19
Sirohi 1'61 0'89 0'62
Bhilwara S·ol 2·81 0-70 Udaipur 5'30 3'64 1-66 Chittaurgarh 2'96 1·99 0-96 Dungarpur 1'49 1'22 0·li:7
"Banllwara 1-78 1-46 0'32 BUD,lj 1·56 0'97 0-69 Kota 5'4.2 2·91 2'61 Jb.alawnr 2'40 1'82 0·08
ts Out of the 39· 25 % public health, institutions
in the urban areas of the State, the cities accounted f~r 14·49%. Jaipur had the highest percentage of 5·45 followed by Ajm.er with 2'68%. Udaipur recorded the lowest percentage of 1,10.
The following table shows percentage distribution of Pllblic health institutions in each city along with rank:-
City Perc llt81,te Bark
Bikaner 1·22 5
Ja.ipur 5·46 1
Ajmer 2'68 .2
Jodhpur 2'14 3
UJaipllr 1'10 6
K~ta 1·90 4
The distribution pattern of 1,000 establishments of all kinds and in all sectors in the rural areas of the State revealed that while Government or Quasi Govemment sector had 10 institutions, the Private sector had 4 and the Co-operative sector, negligible.
A similar distribution in the urban areas of the State showed the P.rivate sector in dominant position. It had 11 institutions as against 4 in the Government sector and negligible in the Cooperative sector.
The position with regard to the rural areas of the districts revealed that the Government sector had larger number of units in all districts except Ganganagar in which the Private sector owned the larger number_ However, the largest number of Government run institutions was 27 and was found in Bikaner. Jhunjhunun came next with 21 institutions. The lowest number of 7 each of such institutions was found in PaJi, Sirohi, Chittaurgarh and Kota.
In the urban areas of the various districts, the Private sector contributed larger number of units in all districts except J aisa1mer. J alor, Chittaurgarb and Banswara where the Government sector controlled larger number of institutions and Sirohi and Dungarpur where both the sectors had exactly the equal number of units. The highest number of privately run institutions was however, found in Ganganagar and was 22. J aipur came next with 15 units. The lowest nuinber was 3 and was found in Chit~urgarh.
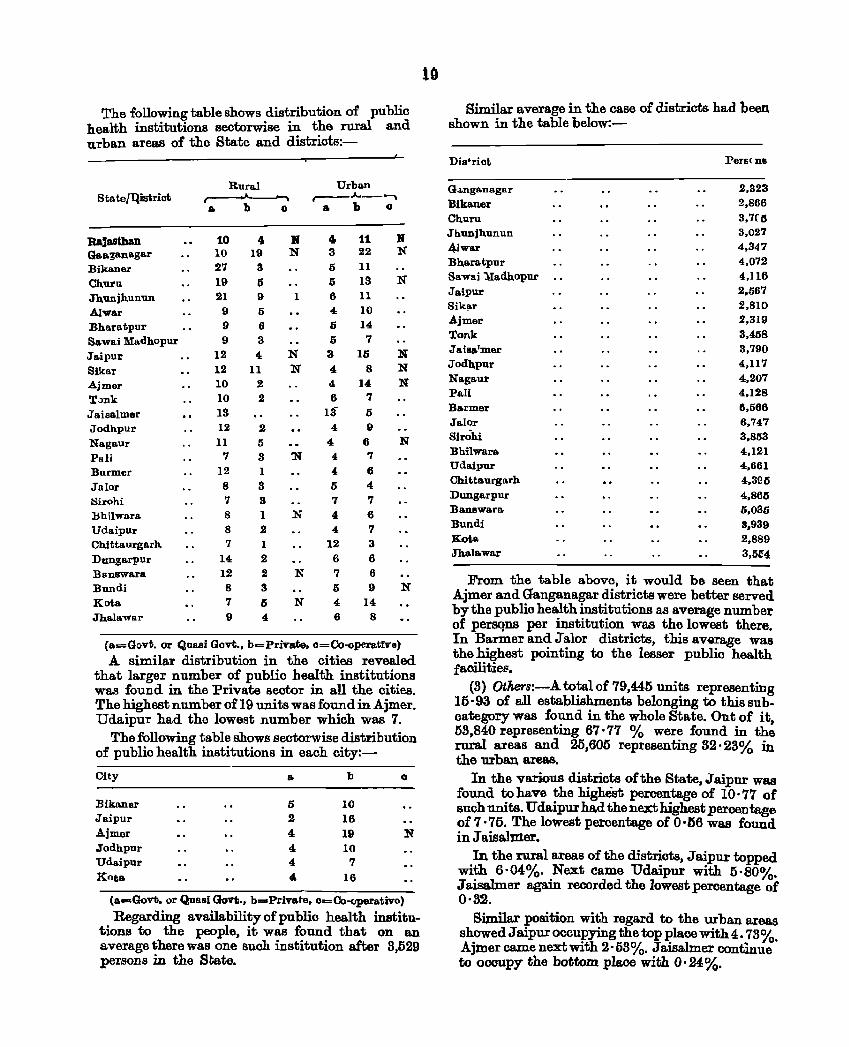
The following table shows distribution of public health institutions sootorwise in the rural and urban areas of the State and districts:-
Btate{Qistriot
RaJasthan Qa.a.ganagar Bikaner Churu Jhunjhunun AIwar Bharatpur Bawai Madhopur Jaipur Sikar Ajmer T·)nk Jaisalmer Jodhpur Nagaur PBli Barmer Jalor 8irohi Hhilwara Udaipur Chjttaurgarh.
Dnngarpur BanBwara Bundi Kots. Jhala",var
Rural r--oA.~ .. b 0
10 4 10 19 27 3
19 5 21 9
9 6 9 6 9 3
12 4 12 11 10 2 10 2 13 12 2 11 6
7 8 12 1 8 3 7 3 8 1 8 2 7 1
14 2 12 2 8 3 7 5 9 4
If N
1
N N
'N
N
N
N
Urban r---A.-"",,,
.. b 0
4 11 3 22
5 11
5 13
6 11 4 10
Ii 14
5 7
3 15 4 8 4 14 6 7
13 5 4 9
4 6 4 '1 4, 6
5 4
7 '1
4 6 4 7
12 3
6 6 7 6 5 9 4 14 6 8
R N
N
N N N
N
N
(a=GCtvt. or Quasi Gov!;., b=Private, o=Co-operatIve) A similar distribution in the cities revealed
that larger number of public health institutions was found in the Private sector in all the cities_ The ~ghest number of 19 units was found in Ajmer_ Udalpur had the lowest number which was 7.
The following table shows sectorwise distribution of public health institutions in each city:-
City a. b o
Bikaner 5 10 Jaipur 2 16 Ajmer 4, 19 N Jodhpur 4, 10 UdB.ipur 4 '1 Kota iI. 16
(IIo=Oovt. or Quasi Govt., b=Private, o=Co-operBtivo)
Regarding avaiIabilityofpublic health institutions to the people, it was found that on an average there was one such institution after 3 529 persons in tlte State. '
10
Similar average in the case of districts had been shown in the table below:-
Dis'riot. PenH ns
G.J.nga.nagar 2.323
Bibner 2,866
Churu 3.7(5
Jhnnjb.unun 3,027
4Jwar 4,347
Bh.a.ratpur 4,072
Sawai lIadhopur 4.] 16 Jaipur 2,667
Sika.r 2.810 Ajmer 2.319 Tonk 3,458
Jailla'mer 3,790
Jodhpur 4.117 NagBur 4,207 Pali 4.128 Barmer 1'1,566 Ja.IQr 6.747 Birahi 3,853 BhilwarB 4,121 Uda.ipur 4,661 Chittaurgarh 4,31"!5 Dungarpur 4,865 Banllwara 5,035 Bnndi 3,939 Kata 2,889 Jha]s.war 3,5E4
From the table above, it would be seen that Ajmer and Ganganagar districts were better served by the public health institutions as average number of persqns per institution was the lowest there. In B~rmer an~ .J ~lor districts, this average was the highest pomtmg to the lesser publio health facilitiee.
(3) Others:-A total of 79,445 units representing 16·93 of all establishments belonging to this suboategory was f0"?D.d in the whole State. Out of it, 63,840 representmg 67·77 % were found in the rural areas and 25,605 representing 32· 23% in the urban areas.
In the various districts of the State, Jaipur was found to have the highest percentage of 10·77 of such units. Udaipur had the next highest percentage of 7·75. The lowest percentage of 0 ·56 was found in.T aisalmer.
.In the rural areas of the distriots, J aipur topped WIth 6·04%. Next came Udaipur with 5'80CX .T aisalrn er again recorded the lowest percentage ~f 0·32.
Similar position with regard to the urban areas showed J aipur occupying the top place with 4. 73'3{ AjlDer came next with 2'53%. Jaisalmer continu:' to occupy the bottom place with 0'24%.
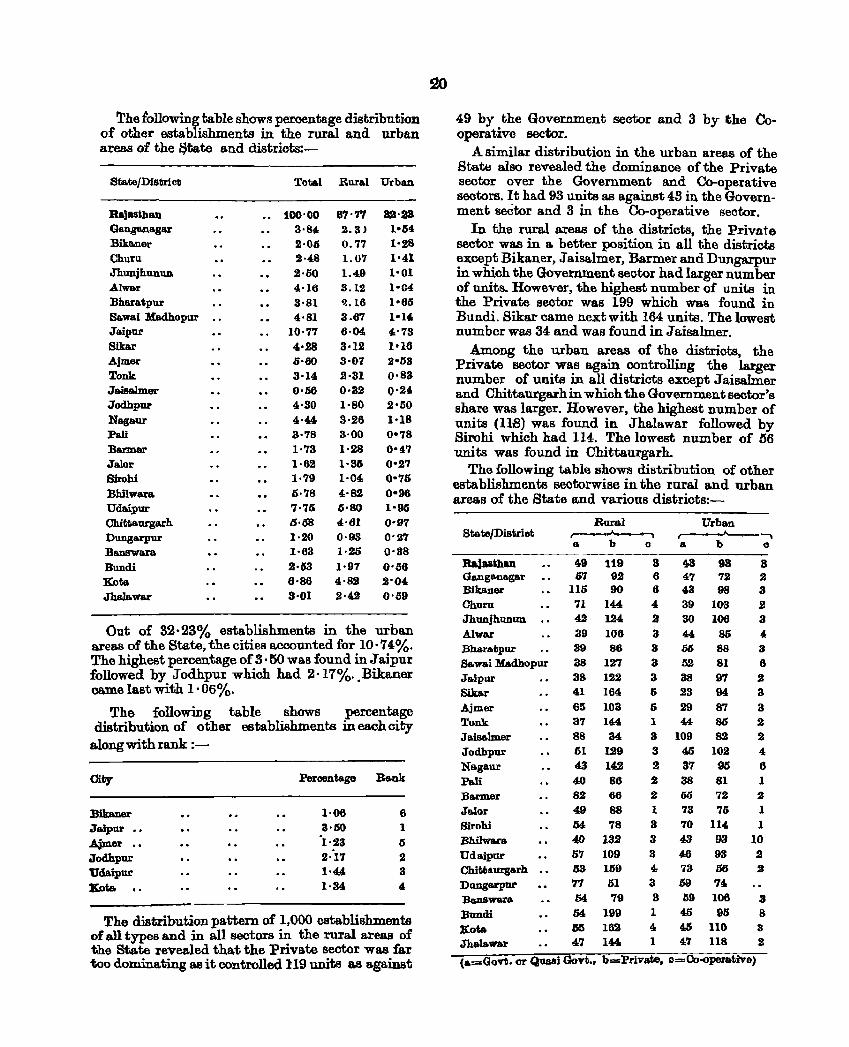
The following table shows percentage distribution of other establishments in the rural and urban areas of the ~tate and districts:-
State/District
Rajas~bBD
Ganga.na.gar Bika.ner Churu Jhunjhunun AIWBr Bharatpur SaWBi Hadhopar Jaipur Sikar Ajmer Tonk Jaisalmer Jodhpur Nagaur Fali Banner Jalor Shobi Bhilwara Udaipur Chitf;a.urgarh DUDgarpur BanB'Wara Bundi Kat.. Jh&l&war
Total Rural Urban
•• 100'00 3·84 2·05 2·48 2·50 4·16 3·81 4·81
10'77 4·28 0'60 3·14 0·56 4·30 4·44 3·78 1·73 1·62 1·79 0·78 7·76 6·58 1·20 1·63 2·53 6'86 3'01
67'77 2.3' 0.77 1.07 1.49 3.12 '1..16 3.67 6·04 3·12 3·07 ,2·31 0·3,2 1'80 3·26 3·00 1·28 1·35 1·04
4'82 6·80 4'61 0·93 1·25 1·97 4·8.2 2·42
sa'28 1 0 64 1'28 1'41 1'01 1'04 1'65 10 14 4'73 1-16 2·53 0·83 0'24 2'50 1·18 0·78 0'4'7 0'2'7 0°75 0·96 l'go 0'97 0'27 0'38 0'06 2'04 0'09
Out of 32·23% establishments in the urban areas of the State, the cities accounted for 10·74:%. The highest percentage of 3·50 was found in Jaipur followed by Jodhpur which had 2·17% .. Bikaner came last with 1· 06%.
The following table shows percentage distribution of other establishments in each city
aJongwithrank :-
City
llikaner Jaipnr •• Ajmer •• Jodhpur tJde.ipur ltota.
Peroontage Bank
1'06 6 3·50 1 '1'23 5
2'17 2 1·44 3 1·34 4
The distribution pattern of 1,000 establishments of aU types and in aU sectors in the rural axeas of t.he State revealed that the Private sector was far too dominating as it controlled U9 units as against
49 by the Government sector and 3 by the Cooperative sector.
A similar distribution in the urban areas of the Stat~ also revealed the dominance oftha Private sector over the Government and Co-operative sectors. It had 93 units as against 43 in the Government sector and 3 in the Co-operative sector.
In the rural areas of the districts, the Private sector was in a better position in all the districts except Bikaner, J aisalmer, Barmer and Dungarpur in which the Government sector had larger number of units. However, the highest number of units in the Private sector was 199 which was found iu Bundi. Sikar came next with 164 units. The lowest number was 34 and was found in J aisalmer.
Among the urban areas of the districts, the Private sector was again oontrolling the larger number of units in all districts except J aisahner and Chittaurgarh in which the Government sector's share was larger. However, the highest number of units (lIB) was found in Jhalawar followed by Sirohi which had 114. The lowest number of 56 units was found in Chittaurgarh.
The following table shows distribution of other establishments sootorwise in the rural and urban areas of the State and various districts:-
State/Distriot
RaJasthan Ga.nga.na.gar BiksDGr Ohuru Jhunjhunun Alwar Bharatpur Sa.wai Madhopur Ja.ipur Sikar Ajmer Tonk Jaisalmer Jodhpur Na.gaur Pali Banner Jalor Birohi BhilWlW'& Udaipur Ohittaurgarb Dungarpur Banswara Bundi Kota Jhalawar
49 119 67 92
116 90 '11 144 42 124 39 106 39 86 38 127 38 122 41 164 65 103 37 144 88 34 51 129 43 142 40 86 82 66 49 88 54 78 40 13B 57 109 53 169 77 61 54 79
54 199 65 162 4.7 144
Urban r-----"---. abo
8 43 98 6 47 72 6 43 98 4 39 103 a 30 106 3 44 85 3 DO 88
3 52 81 3 38 97 5 23 94 5 29 87 1 44 86 3 109 82 3 45 102 2 37 915 2 38 81 2 05 72 1 73 75 3 70 114 3 43 93 3 46 93 4. 73 56 3 59 ,4. 3 59 106 1 45 95 4. 45 110 1 47 118
8 2 3 2 3 4 3 6 2 3 3 2 2 4 6 1 2 1 1
10 .2 .2
3 8 3 2
(a=Oovt. or Quasi Govt., b_Private. c Co·operative)
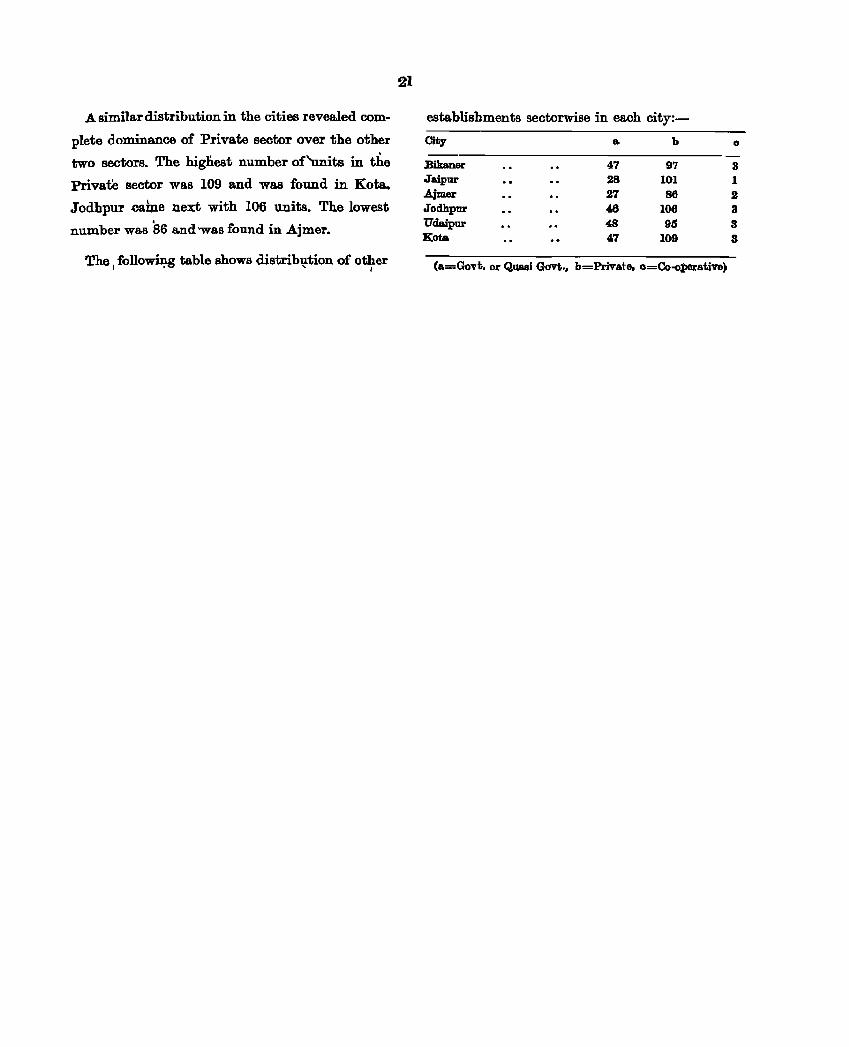
A similar distribution in the cities revealed com
plete dominance of Private sector over the other
two sectors. The highest number of 'units in the
Private sector was 109 and was found in Kom.
Jodhpur .came next with 106 units. The lowest
number was 86 a.nd 'Was found in .A.jmer.
The follo...nno table shows distribution of other I .-r~ "' I
21
establishments sectorwise in each city:-
~ • b
Bikaner 47 97 Jaipur 28 101 Ajmer 27 86 Jodhpur 46 106 Udaipur 48 95 Kata 47 109
(a=Govt. or Quaai Govt •• b=Private. o=Co·o;perative)
o
3 1 2: 3 3 3
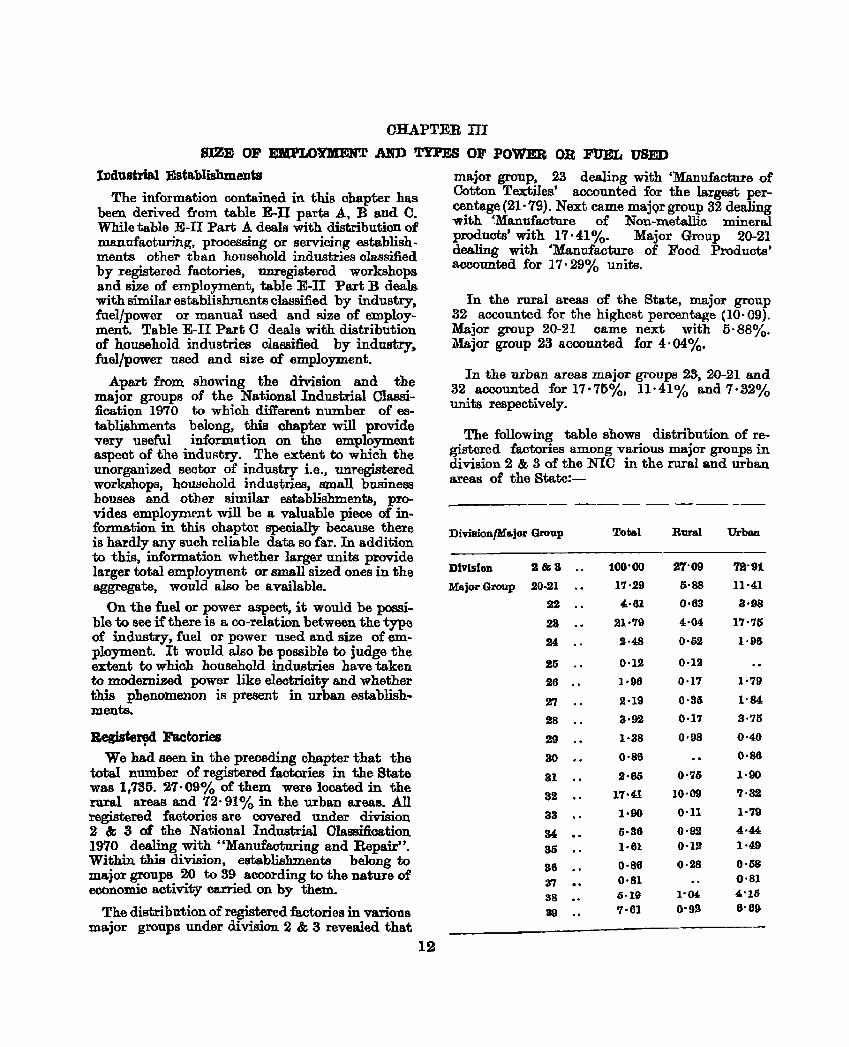
OHAPTER III
SIZE OF EMPLO¥MENT AND TYPES OF POWER OR FUEL USED
IDdustrial Establishments
The information contained in this chapter has been derived from table E-II pads A, Band C. While table E-II Part A deals with distribution of manufacturing, processing or servicing establish· ments other than household industries classified by registered factories, unregistered workshops and size of employment, table E-IJ Part B deals with similar establishments classified by industry, fuel/power or manual used and size of employment. Table E-II Part C deals with distribution of household industries classified by industry, fuel/power used and size of employment.
Apart from showing the division and the major groups of the National Industrial Classification 1970 to which dift'erent number of establishments belong, this chapter will provide very useful information on the employment aspect of the indUl~try. The extent to which the unorganized sector of industry i.e., unregistered workshops, household industries, amall business houses and other similar establishments, provides employment will be a valuable piece of information in this chaptm: specially because there is hardly any such reliable data so far. In addition to this, information whether larger units provide larger total employment or small sized ones in the aggregate, would also be available.
On the fuel or power aspect, it would be possible to see if there is a co-relation between the type of industry, fuel or power used a.nd size of employment. It would also be possible to judge the extent to which household industries have taken to modernized power like electricity and whether this phenomenon is present in urban establishments.
Registe~ Factories We had seen in the preceding chapter that the
total number of registered factories in the State was 1,735. 27·09% of them were located in the rural areas and 72· 91% in the urban areas. All registered factories are covered under division 2 & 3 of the National Industrial Olassifioation 1970 dealing with "Manufacturing and Repair". Within this division, establishments belong to major groups 20 to 39 according to the nature of economic activity ca.rried on by them.
The distribution of registered factories in various major groups under division 2 & 3 revealed that
12
ma.jor group, 23 dealing with 'Manufacture of Cotton Textiles' accounted for the largest percentage{21·79)_ Next came majQrgroup 32 dealing with ',Manufacture of Non-metallic mineral products' with 17·41 %. Major Group 20-21 dealing with 'Manufacture of Food Products' accounted for 17· 29% units.
In the rural areas of the State, major group 32 accounted for the highest percentage (10· 09). Major group 20-21 came next \vith 5·88%_ l\lajor group 23 accounted for 4:·04%.
In the urban areas major groups 23, 20-21 and 32 accounted for 17·71>%, 1l·41% and 7'32% units respectively.
The following table shows distribution of regist-cred factories among various major groups in division 2 & 3 of the NIC in the rural and urban areas of the State:-
DivisionJMa]or Group Total Rural Urban
DIVision 2&8 .. 100-00 27·09 72·91
Major Group 20-21 17·29 0·88 n·41
22 .. 4.·61 0·63 3·98
23 21·79 4-04 17·75
24 2·48 0·02 1-96
25 0·12 0·12
26 1-96 0·17 1·79
27 2·19 0·36 1-84
28 .. 3·92 0·}7 3·75
29 .. I·S8 0·98 0-40
30 0·86 0·S6
31 .. 2·as 0-75 1·90
32 .. 17-4.1 10·09 7·32
33 1·90 o·n 1·79
S4 5·36 0·92 4.·44
3l) .. 1·61 0·12 1·49
86 0·S6 0-28 0·58
"n O·SI O-SI
38 .. 0·19 1·04- 4-15
39 .. 7·61 0·92 6·69
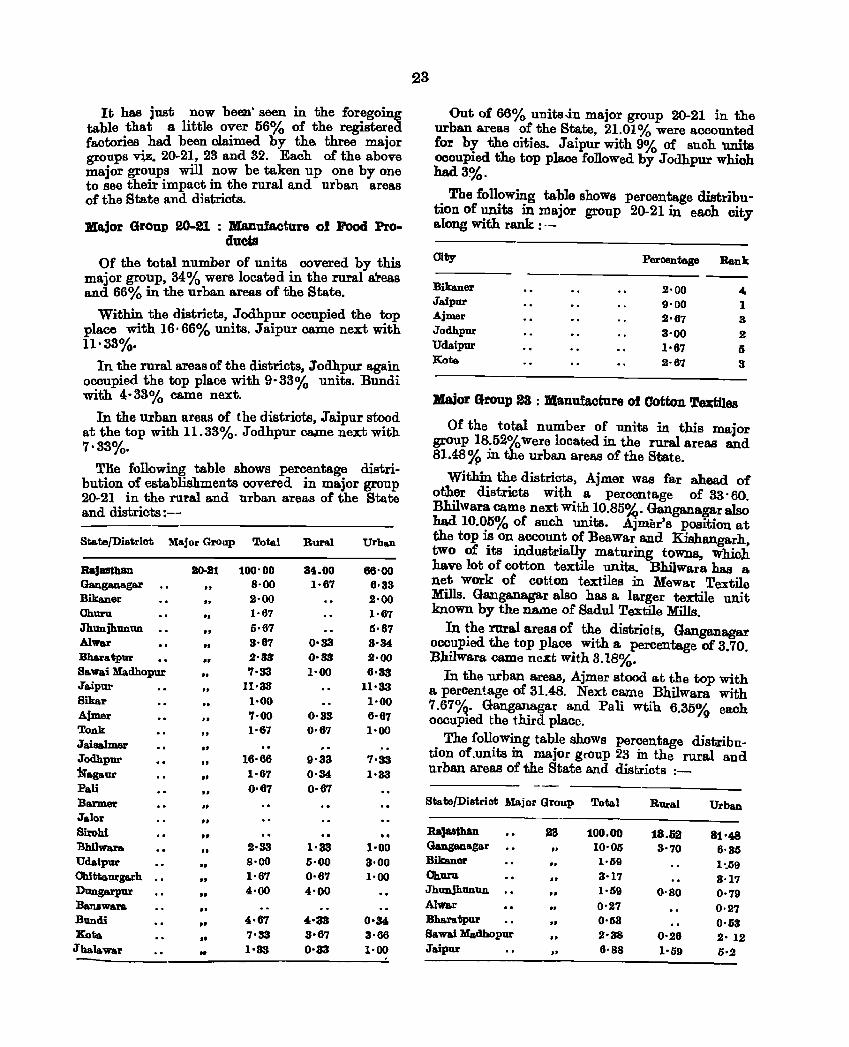
It has just now been'seen in the foregoing table that 8 little over 56% of the registered faotories had been olaimed by the. three major groups viz. 20-21, 23 and 32. Each of the above major groups will now be taken up one by one to see their impaot in the rural and urban areas of the State and distriots.
Major Group 20-21 : Manufaoture 01 Food Products
Of the total number of units covered by this major group, 34% were located in the rural areas and 66% in the urban areas of the State.
Within the distriots, .Jodhpur occupied the top place with 16·66% units. Jaipur came next with 11·33%.
In the rural areas of the distriots, Jodhpur again occupied the top plaoe with 9-33% units. Bundi with 4- 33% came next.
In the mban areas of the distriots, J aipur stood at the top with 11.33%. Jodhpur ca;me next with 7·33%.
THe following table shows percentage distribution of establishments covered in major group 20-21 in the rural and urban areas of the State and districts :--
Sta.tefDistriot Major Group Total Rural
Rajasthan Ganganagar Bikaner Churn Jhunjhunun Alwar Bharatpur Sawa.i Mad.hopur Jaipur Sikar Ajm.er Tonk Jaiaalm.er Jodhpur Nagaur Pali Banner Jalor Sirohi BhUwara Udaipur Chittaurga.rh Dungarpur Banawara Bundi Kota Jutawar
20-21
" .. .. " .. •• .. .. ••
.. .. •• •• •• .. .. .. .. .. .. .. .. .. ..
100·00 8·00 2·00 1·67 5·67 3·67 2·33 '7·33
11·33 1·00 '7·00 1·67
16·06 1·67 0·07
2·33 8·00 1·67 4·00
4·67 7·33 1·33
84.00 1·07
0·33 0-33 1-00
0·33 0·07
9'33 0'34, 0·67
1·33 5·00 0·07 4·00
4,·33 3·67 0·33
Urban
68·00 6·33 2·00 1·67 5·67 S'34, 2·00 6'S3
11'33 1·00 0·07 1·00
7·33 I'S3
1·00 3·00 1·00
0·34, 3·66 1·00
23
Out of 66% units...in major group 20-21 in the urban areas of the State, 21.01% were accounted for by the cities. Jaipur with 9% of such units ocoupied the top place followed by Jodhpur whioh had 3%.
The follOWing table shows percentage c1istribution of units in major group 20-21 in each city along with rank :-
City Percentage Bank
Bikaner 2·00 4. Jaipur 9'00 1 Ajmer 2·67 3 Jodhpur 3'00 2 Udaipur 1·67 5 Xote. 2·67 3
Maior Group 23 : Manufacture of Cotton Textiles
Of the total number of units in this major group 18.52% Were located in the rural areas and 81.48 % jn the urban areas of the State.
Witlrln the districts. Ajmer was far ahead of other districts with a percentage of 33' 60. Bhilwara came next with 10.85%. Ganganagar also had 10.05% of such units. Ajmer's position at the top i~ on.accoun.t of Beawar and Kishangarh, two of Its mdustrlally maturing towns, which have lot of cotton textile units. Bhilwara has a net work of cotton textiles in Mewar Textile Mills. Ganganagar also has a larger textile unit known by the name of Sadul Textile Mills.
In the rural areas of the districts, Ganganagar occupied the top place with a percentage of 3.700 Bhilwara came next with 8.18%.
In the urban areas, Ajmer stood at the top with a percentage of 31.48. Next came Bhilwara with 7.67%. Ganga.nagar and Pall wtih 6.35% each occupied the third place .
The follOWing table shows percentage distribution of.units in major group 23 in the rural and urban areas of the State and dis!;riots :_
State/Diatrict Major Group Total Rural Urban
RaJas&b.an 28 100.00 18.68 81 0 48 Ganganagar .. 10·06 3'70 6·35 Bikaner 1·69 1.059 Ohuru .. 3·17 S·17 Jhunjhunun .. 1·59 0·80 0·79 Alwar •• 0·21 0·27 Bharatpur .. 0·53 0·53 Sawai Madhopur .J 2·38 0·26 2· 12 Jaipur II 6·88 1·59 0·2
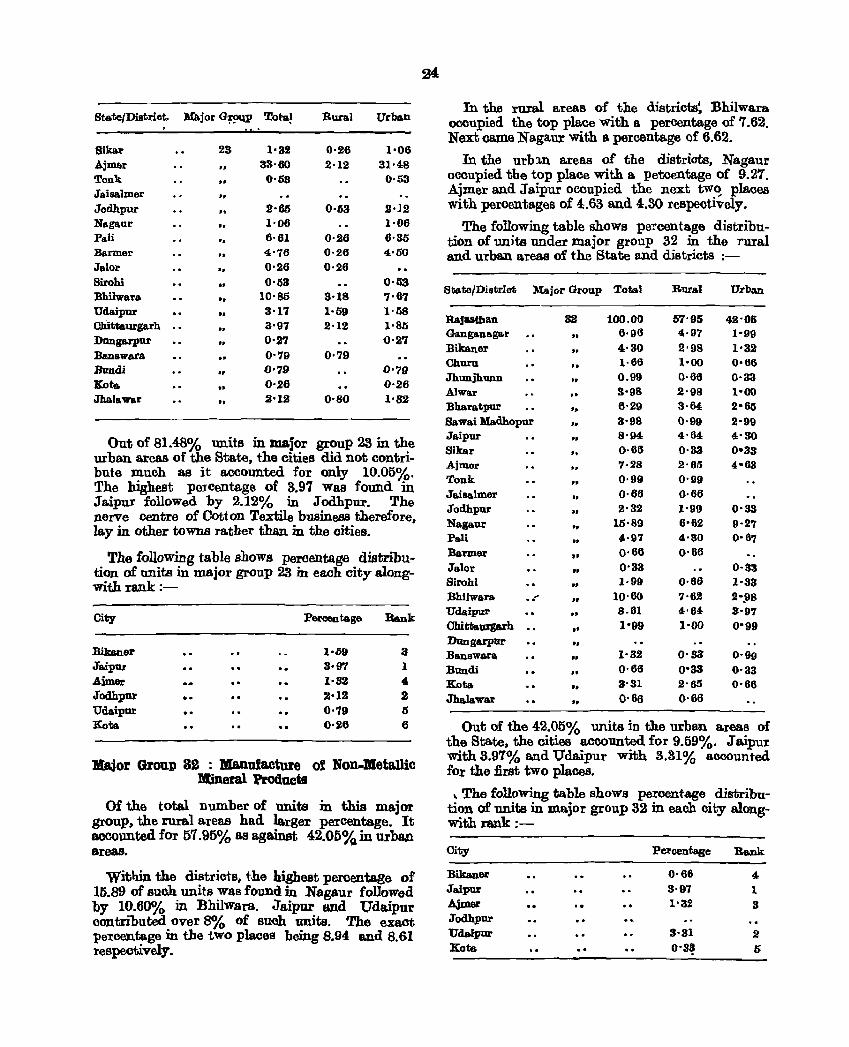
Btate/Distriet. mjorG~ Tota~ Rural Urball , ,
SikB.r 23 I'S2 0'26 1'06 Ajmer .. 33'60 2'12 31·48 Tonk 0·58 0·53 Jaisalmer " Jodhpur ,. 2'65 0·03 .2·12 Naga.ur .. 1·06 1·06 Pali ., 6·61 0·26 6·S5 Banner " 4·76 0·26 4·liO Jalor " 0·26 0·26 8irohi .. 0'53 0·53 Bhilwara ., 10·85 3·18 7·67 Udaipur .. s·n 1'59 1·58 Ohittaurgarh .. S·97 2·12 1,S5
Dangarpur " 0'27 0·27 .Banswara 0'79 0·79 Brzadi .. 0'79 0·79 Kota .. 0·,26 0·26 Jha.lawar .. 2'12 O'SO 1'82
Out of 81.48% units in major group 23 in the urban areas of the State, the cities did not contribute much as it accounted. for only 10.05%. The highest percentage of 3.97 was found in Ja.ipur followed by 2.12% in JodhplU". The nerve centre of Cotton Textile bus:iness therefore, lay in other towns ratber than in the oities.
The following table shows percentage distribution of units in major group 23 in each city alongwith rank :-
City Percentage Bank
:Bikaner 1'09 3 Jaipur 3·97 1
Almer 1·82 ... Jodhpur .. 2'12 2 Udaipur 0'79 5 Kota 0'26 6
llajor Group 82 : Manufacture of Non-Metallic Mineral Products
Of the total number of units in this major group. the rural areas had larger percentage. It accounted for 57.95% as against 42.05% in urban areas.
Within the districts, t,he highest percentage of 15.89 of such units was found in Nagaur followed by 10.60010 in Bhilwara. Jaipur and Udaipur contributed Over 8% of such units. The exact percentage in the two places being 8.94 and 8.61 respectively.
In the rural areas of t.he di8tricts~ Bhilwara occupied the top pla.ce with a percentage of 7.62. Next oame Nagaur with a percentage of 6.62.
In the urb:m areas of the districts, Nagaur occupied the top place with a petcentage of 9.27 . Ajmer and Jaipur occupied the next tw.~ places with percentages of 4.63 and 4.30 respeotively.
The following table shows pe::."centage distribution of units under major group 32 in the Tural and urban areas of the State and districts :-
St;ate/Diatriot Major Group Total RlU'al Urban
Rajasthan 82 100.00 57'95 42-05 Gangana.ga.r .. 6·96 4·97 1-99 Bikaner .. 4·30 2·98 1'32 Chura .. 1·66 1'00 0·66 Jhunjhunn •• 0.99 0·66 0·33 Alwa.r S'98 2'98 1·00 Bharatpur " 8·29 3·64, 2-65 Sawai Madhopur .. S'98 0·99 2·99 Jaipur ., 8·94 4·64 4'30 8ikar .. 0·66 0·33 0-33 Ajmer .. 7·28 2·65 "-63 Tonk .. 0·99 0·99 Jaisalmer .. 0·66 0·66 Jodhpur .. 2·32 1·99 0·33 Nagaur ., 15·89 0'62 9·27 Pali .. 4·97 4·30 0·67 Ba~er .' 0·06 0'66 Jalor .. 0·S3 0-33 Sirohi .. 1·99 0·66 1-33 Bhilwara .~ " 10·60 7·62 2-,98 Udaipur .. 8.61 4dJ4 3-97 Ohittaurgarh
" 1·99 1'00 0-99
Dangarpur .. Banswara .. 1·32 0·33 0'99 Bundi .. 0·66 0·33 0·33 Koto. .. 3·31 2·65 0·66 Jha.lawar "
0·66 0·66
Out of the 42.05% units in the m:ban areas of the State. the cities accounted for 9.59%. Jaipur with 3.97% and Udaipur with 3.31% aocounted for the :first two places.
, The following table shows percentage distribu-tion of units in major group 32 in each oity along-with rank:-
City P~centage Rank
Bikaner 0·66 4 Jaip1l1" S'97 1 Ajmer 1'32 S JodhpDl' Udaiplll" 3'31 2 Kota 0'8~ I).
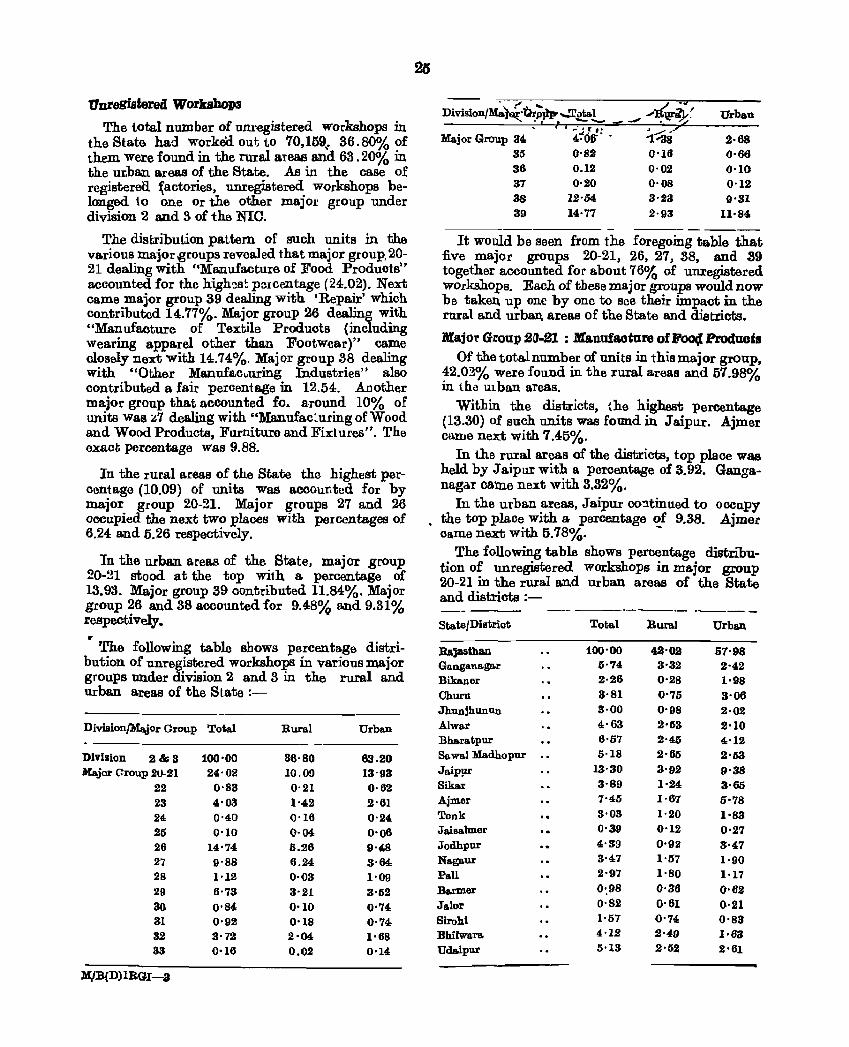
Unregistered Workshops
The total number of unregistered workshops in the State. had workeCl out to 70,159 .. 36.80%?f them were found in the rural areas and 63.20% In the ur.ba.n areas of the State. As in the case of registered {actories, unregistered workshops belonged to one Or the other major group under division 2 and 3 of the NIC.
The distribution pattern of such units in the various major €roups revealed that major group, 20-21 dealing with "Manufacture of Food Produots" acoounted for the high9st percentage (24.02). Next came major group 39 dealing with 'Repair' whioh contributed 14.77%. Major group 26 dealing with "Manufacture of Textile Products (including wearing apparel other than Footwear)" came closely next with 14.74%. Major group 38 dealing with "Other Manufacuuring Industries" also contributed a fair percentage in 12.54. Another major group tha.t accounted fo.. arOund 10% of units was ",,7 deaJing with "Manufac~uring of Wood and Wood Products, Furnituro and FixLures". The exact percentage was 9.88.
In the rural areas of the State the highest percentage (10.09) of units was accounted for by major group 20-21. Major groups 27 and 26 occupied the next two places with percentages of 6.24 and 6.26 respectivciy.
In the urban areas of the State, major group 20-21 stood at the top with a percentage of 13.93. Major group 39 contributed 11.84%. Major group 26 and 38 accounted for 9.48% a.nd 9.31% respectively. ..
The following table shows percentage distri-bution of unregistered workshops in various major groups under division 2 and 3 in the rural and urban a.reas of the Slate :-
Division}Ma.jor Group Total Rural Urban
DiviSion 2&8 100·00 86·80 63.20 Major Group 20-21 24'02 10.09 13'93
22 0'83 0'21 0·62 23 4'03 1--41,2 2'61 24 0'40 0'16 0'24 20 0'10 0·04 0'06 26 14'74 0.26 9'48 27 9'88 6.24 3·M 28 1'12 0'03 1'09 29 6'73 3'21 3'02 30 0'84 0'10 0'74 31 0'92 0'18 0·74-32 3'72 2'04 1'68 33 0'16 0.02 0'14
M,lB(D)IBGI-a
Division/L)u(Q~~~.-T~L __ ..... l(1P"~: Urban
r • ~~dlr . -~7 Major Group 34 2·68 35 0'82 0'16 0'66 36 0.12 0'02 0'10 37 0'20 O'OS 0'12 38 12'64 3-23 9'31 39 14·77 2'93 U'84
-------It would be seen from the foregomg table that
five major groups 20-21, 26, 27, 38, and 39 together accounted for about 76% of unregistered workshops. Each of these major groups would now be taken. up one by one to see their impact in the rura.l and urban, areas of the State and districts.
Bajo\' Group 2(J-21 : Manufacture of FoocJ Products Of the total number of units in this major group,
42.02% were found in the rural areas and 57.98% in 1.ha Ulban areas.
Within the districts, the highest percentage (13.30) of such units was found in Jaipur. Ajmer caIIle next with 7.45%.
In the rural areas of the districts, top pIa ce was held by Jaipur with a percentage of 3.92. Ganganagar ca:m.e next with 3.32%.
III the urban areas, Jaipur CO'!1tinued to oocupy the top place with a percentage of 9.38. Ajmer Came next with 5.78%. -
The following table shows percentage distribution of unregistered workshops in major group 20-21 in the rural and urban areas of the State and districts :- --_ ... _---.- ._---_ State/Distriot Total Rural Urban
Raiasthan 100'00 42'02 57'98 Ganganago.r 5'74 3'32 2'42 Bikaner 2·26 0'28 l'S8 Churu 3'81 0'75 3'06 Jhunjhunun 3·00 0'98 2·02 Alwar 4'63 2'53 2'10 Bharatpur 6'57 2'45 4'12 Sawai Madhopur 5'18 2'65 2'53 Jaip!ll' 13'30 3'92 9'38 Sikar 3'S9 1'24 3·65 Ajmor 7'45 1·67 0'78 Tonk 3'03 1'20 I'SS Jaisalmer 0'39 0'12 0'27 Jodhpur 4'39 0'02 3'47 Nagaur 3'47 1'07 1'90 Pali 2'97 1'80 1'17 Barmer 0:98 0-36 0'62 Jalor 0'S2 0'61 0·21 Sirohi 1'57 0'74 0'83 BbiIW6ra 4·12 2'40 1·63 Uda.ipur 5'13 2'52 2'61
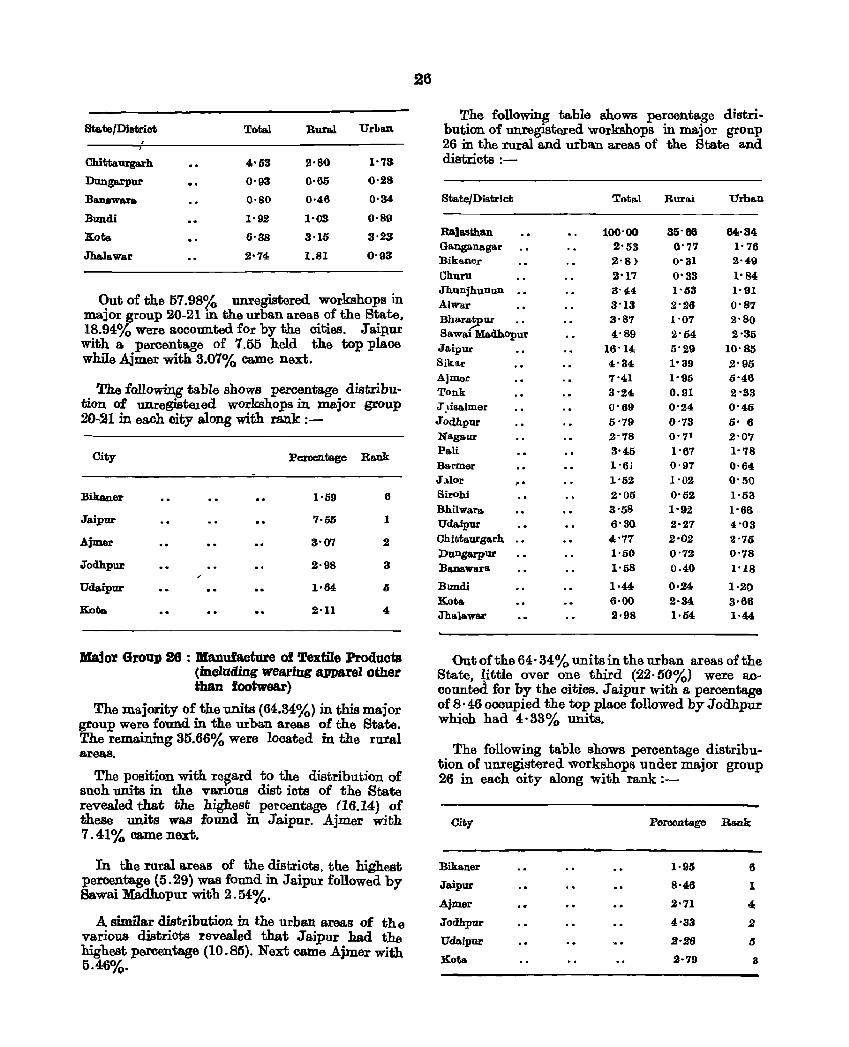
Sta.te/DiBtriot Total Rural Urban
Chittaurgarh 4'53 2'80 1'73
Dungarpur 0'93 0,65 0'28
BanBwara 0,80 0,46 0'34
Bundi 1'92 1'03 0,89
Xota 6-38 3·15 3'23
tThaIaw&r 2'14 1.81 0'93
Out of the 57.98% unregistered workshops in major group 20-21 in the urban areas of the State, 18.94% Were aocounted for by the oities, J aipur with a. percentage of 7,55 held the top plaoe while .Ajmer with 3.07% came next.
The following table shows percentage distribution of unregisteled workshops in major group 20-21 m ea.ch city along with rank :-
City Percentage Rank
Bikaner 1'59 6
Jaipur 7,55 1
Ajm.er 3'07 2
Jodhpur 2-98 3
Uda.ipur 1·64 0
Kate. 2,11 4
Major Group 26 : Manufacture of Textile Products (including wearing apparel ollier than footwear)
The m.ajority of the units (64:.34:%) m this major group were found in the urban areas of the State. The remaining 35.66% were looated in the rural areas,
The position with regard to the distribution of such units in the various dist icts of the State revealed that the highest percentage (16.14) of these units was found In Jaipur, Ajmer with 7.41% oame next.
In the rural areas of the districts, the highest percentage (5 -29) was found in Jaipur followed by Sawai Madhopur witb 2.54:%.
A similar distribution in the urban areas of th e various districts revealed that Jaipur had the highest percentage (10.85)_ Next came Ajmer with 5.46%.
26
The following table shows percentage distri-bution of unregistered workshops in major group 26 in the rural and urba.n areas of the State and districts :-
State/District Tota.l Rura.i Urban
RaJasthan 100'00 85'60 64,34 Ganganagar 2'53 0'77 1'76 Bikaner 2-S) 0'31 2'49 Churu 2'17 0'33 1'84 Jhunjhunun 3°44 1'53 1'91 Ahrar S-13 2'26 0'87 Bhara;Pur 3 0 S7 1'07 2'80 Sawai Madhopur 4'89 2°54 2'35 Ja.ipur 16'14 5'29 10·S3 Sik!l.r 4'34 1'39 2'95 Ajm.ar 7°41 1'95 5'46 Tonk 3'24 0,91 2·33 J .tisa.lmer 0'69 0'24 0'46 Jodhpur 5'79 0-73 o· 6 Nagaur 2'78 0' 71 2'07 Pali 3'45 1-67 1'78 Blumer l'6J 0°97 0'64 Ja.lor .. 1'52 1'02 0'50 Sirohi 2'05 0'52 I-53 Bhilwara. 3'58 1'9.2 1'66 Udaipur 6'30 2'27 4-03 Chil;taurga.rh 4'77 2'02 2-75 Dungarpur 1'50 0-72 0'78 Ba.uswara. 1'58 0.40 1'IS
Bundi 1·44 0·24 1·20 Kota 6·00 2,34 3-66 Jhalawa.r 2-98 1·54 1,44
Out of the 64:'34:% units in the urban areas of the State, little over one third (22·50%) were accounted for by the cities, Jaipur with a percentage of 8·46 occupied the top place followed by Jodhpur which had 4· 33% units.
The following table shows percentage distribution of unregiatered workshops under major group 26 in each city along with rank:-
City Percentage Rllnk
Bikaner 1·95 6
Jaipur 8-46 1
Ajmar 2'71 4
Jodhpur 4'33 2
Udaipur 2·26 5
Kota 2'79 3
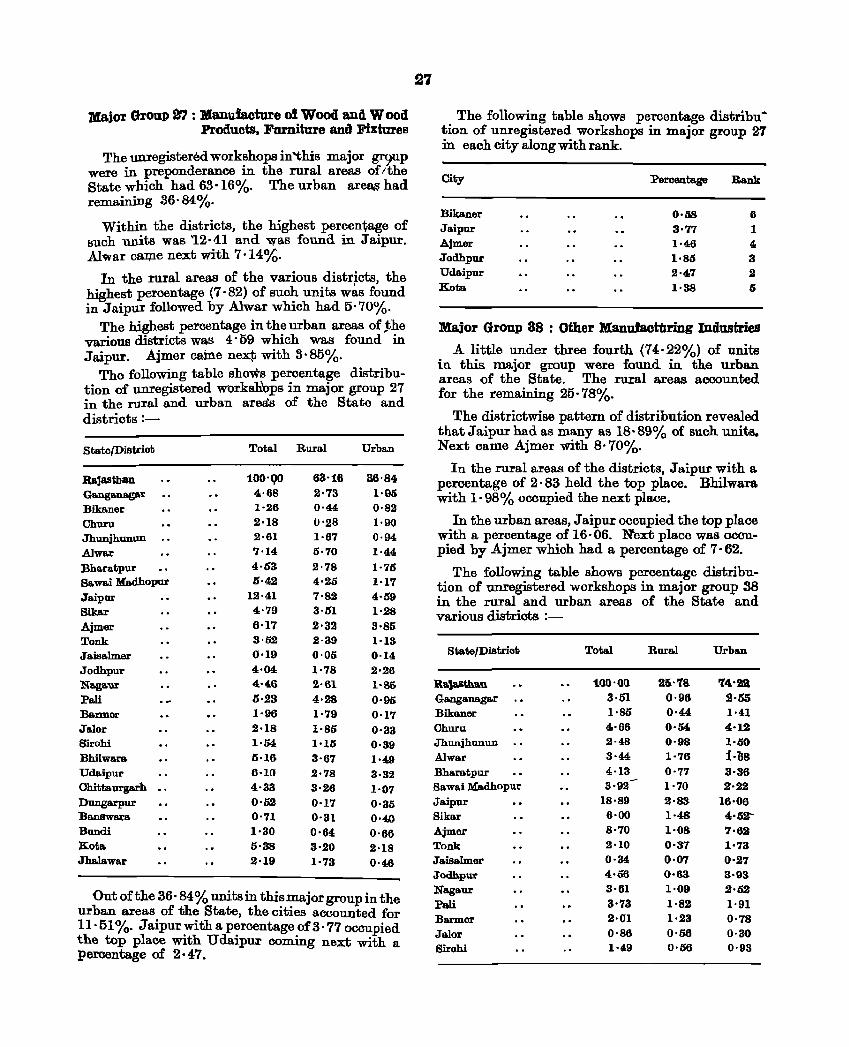
lVIajor Group 27: Manufacture of Wood and Wood Products, Farniture and Fixtures
'1'he unregistered workshops in'this major gr~p were in preponderance in the rural areas of I the State which had 63·16%. The urban ar~ had remaining a6· 84%.
Within the districts, the highest percen~age of such units was '12·41 and was found in Jaipur. Alwar oa:rpe next with 7· 14%.
In the rural areaS of the various districts, the highest percentage (7,82) of suoh units was found in .Jaipur followed by Alwar which had 5'70%.
The highest percentage in the urban areas of .the various districts was 4'09 which was found in .Jaipur. Ajmer came nexp with 3'85%.
The following table shows percentage distribution of unregistered worksh'ops in major group 27 in the I'lll'al and urban are:ts of the State and districts :-
State/Distriot Total Rural UrblLIl
Rajastban 100'QO 63'16 36'84 Ga.nga.n.a.gar 4·68 2·73 1'00 Bikaner 1·26 0·44 0·82 Churu 2·18 0'28 1'90 Jhunjhunun 2·61 1·67 0·94 Alwar 7·14 5·70 1·44 ]3.ha.ratpur 4·63 2·78 1·75 Sa.wa.i Madhopur 6·42 4·25 1·1'1 Ja.ipur 12·41 7·82 4·59 Sika.r 4·79 3·61 1·28 Ajmer 6'17 2'32 3'85 Tonk. 3·52 2·39 1·13 Jaisa.lmer 0·19 0·05 0·14 Jodhpur 4·04 1·78 2·26 Naga'\lr 4'il6 2.·61 I-B5 Pill 6·23 4·28 0·95 Barmer 1'96 1'79 0'17 Jalor 2·18 1·86 0·33 Sirohi 1'54 1'15 0'39 Bhilwara. 5'16 3'67 1'49 Uda.ipur 6·10 2·78 3·32 Chittaurgarh 4'33 3·26 1·07 Dungarpur 0·1)2 0·17 0'35 Ba.nswara 0'71 0'31 0'40 Bundi 1-30 0'64 0'66 Kota 0·38 3'20 2'18 Jha.lawar 2·19 1'73 0·46
Out of the 36'84% units in this major group in the urban areas of the State, the oities accounted for 11· 51 %. Jaipur with a percentage of 3· 77 occupied the top place with U daipux coming next with a percentage of 2·47.
27
The following table shows percentage distribution of unregistered workshops in major group 27 in each city along with rank.
City Percentap Rank
Bikaner 0·08 6 Ja.ipur 3·77 1 Ajmer 1·46 4. Jodhpur 1'85 3 Udaipur 2·47 2 Keto. 1·38 5
Major Group 38 : Other Manufacturing Industries
A little under three fourth (74·22%) of units in this major group were found in the urban areas of the State. The rural areas accounted for the remaining 25·78%.
The districtwise pattern of distribution revealed that Jaipur had as many as 18· 89% of such units. Next came Ajmer with 8· 70%.
In the rural areas of the districts, .Jaipur with a percentage of 2·83 held the top place. Bhilwara with 1· 98% occupied the next place.
In the urban areas, J aipur occupied the top place with a percentage of 16·06. Next plaoe was ocoupied by Ajmer whioh had a percentage of 7·62.
The following table shows percentage distribution of unregistered workshops in major group 38 in the rural and urban areas of the State and various districts :-
State/Distrio1; Total Rural Urban
R'IoJa.sth1m 1oo'0n 25''7& '14'22 Ganga.naga.r 3·51 0·96 2·55 Bika.ner 1·86 0·44: 1'41 Churu 4'66 0·64, 4'12 Jhunjhuuun 2·48 0·98 1·50 Alwar 3·44 1'76 1·b8 Bharatpur 4·13 0·77 3·36 -Sawai Madhopur 3·92 1·70 2'22 Jaipur 18·89 2'83 16·06 Sikar 6·00 1·48 4'5Z" Ajmer 8'70 1·08 7'62 Tonk 2'10 0·37 1'73 Jaisalmer 0·34 0·07 0'27 Jodhpur 4-06 ()·6S 8·93 Naga.ur 3·61 1·09 2·52 Pa.li 3'73 1·82 1'91 Barmer 2·01 1·23 0'78 Jalor 0·86 0·56 0·30 Birahi 1·49 0·66 0·93
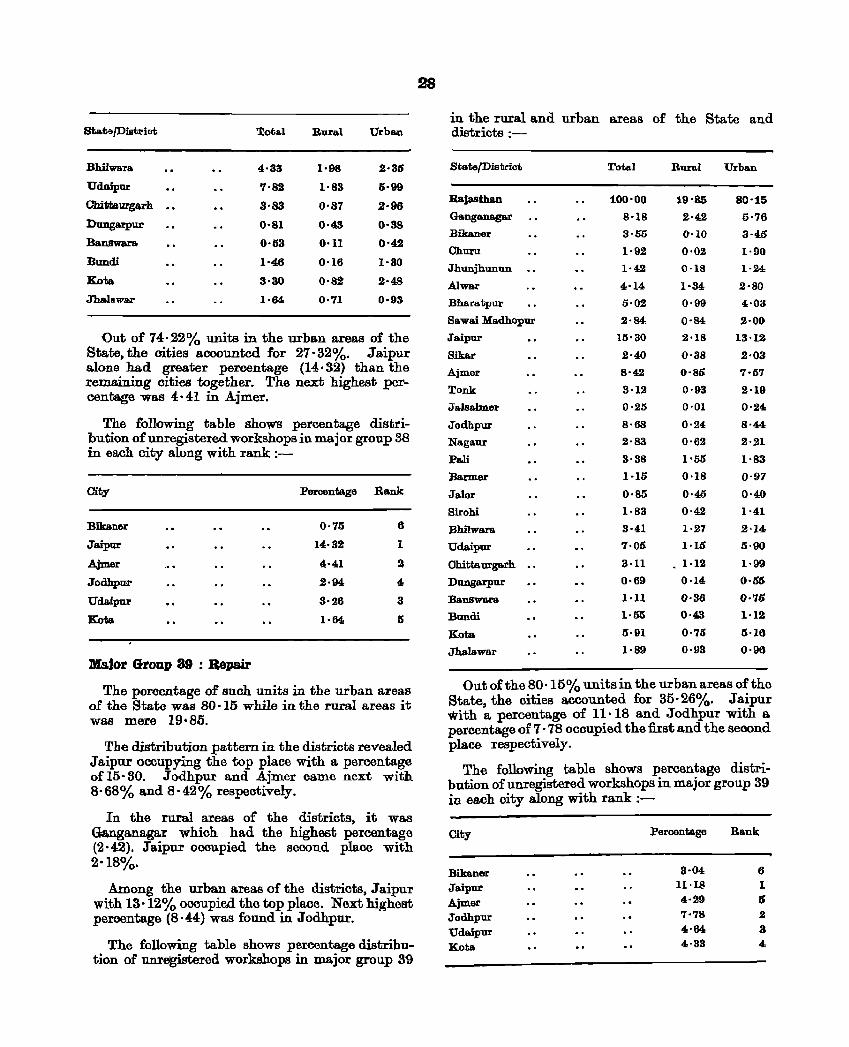
StatefDistriot 'lobi Rural Urban
BhiIwara 4·33 1·98 2·36
Udaipur 7·82 1·83 5·99
Ohittaurgarh 8'83 0'87 2·98 DUDgarpur 0·81 0·43 0·38
Banswara 0·53 0·11 0'42
Bundi 1·46 0·16 1·30
Kota 3·30 0·82 2·48
Jhalawar 1·64, 0·71 0·93
Out of 74·22% units in the UIban areas of the State, the cities accounted for 27·32%. Jaipur alone had greater percentage (14·32) than the remaining cities together. The next highest percentage was 4·41 in Ajmer.
The following table shows percentage distribution of unregistered workshops in major group 38 in each oity along with rank :-
City Percentage Rank
Bik.aner 0·75 6
Jaipar 14·32 1
Ajm.er 4·41 2
Jodhpu.r 2'94 4
Udaipur 3'26 .3
Kota 1·64: 5
])fs.jor Group 39 : Repair
The percentage of such units in the urban areas of the State was 80·15 while in the rural areas it was mere 19*85.
The distribution pattern in the districts revealed J aipur occupying the top place with a percentage of15·30. Jodhpur and Ajmer came next with 8' 68% and 8· 42% respectively.
In the rural areas of the districts, it was Ganganagar which had the highest percentage (2,42). Jaipur occupied the second place with 2'18%.
Among the urban areas of the districts, Jaipur with 13· 12% occupied the top place. Next highest percentage (8·44) was found in Jodhpur.
The following table shows percentage distribution of unregistered workshops in major group 39
28
in the rural and urban areas of the State and districts :-
StatefDistriot
Rajasthan
Ganganagar
Bikaner
Churn
Jhunjhunun
AJwar
Bhara.tpur
Bawai Madhopur
Jaipur
Bikar
Ajmer
Tonk
Jaisalmer
Jodhpur
Nagaur
Pali
:Banner
Jalor
Birohi
Bhilwara
Udaipur
Ohitta. urgarh
Dungarpur
Banswv.m
Bondi
Kota.
Jhalawar
Total
100'00
8·18
3·50
1·92
1-42
4·14
5·02
2·84
15'30
2·40
8'42
3·12
0'25
8·68
2·83
3·38
1·15
0'85
1·83
3·41
7-05
3·Il
0·69
1·11
1·55
0·91
1·89
Rural
19'85
2·42
0-10
0·02
0-18
1·34
0·99
0'84
2'18
0·38
0'85
0·93
0'01
0·24
0'62
1'00
0·18
0·45
0·42
1·27
I·ll;
_ 1·12
0·14
0·36
0-43
0·75
0·93
Urban
80'15
5·76
3-45
1·90
1-24
2·80
4,·03
2·00
13'12
2-03
7·57
2·19
0'24
8·44
2·21
1·83
0-97
0·40
1·41
2'14
5·90
1·99
0-55
0·76
1·12
5·16
0·96
Out of the 80 '15% units in the urban areas of the State, the cities accounted for 35·26%. Jaipur with a peroentage of n'18 and Jodhpur with a percentage of 7· 78 occupied the first and the second place respectively.
The following table shows percentage distribution of unregistered workshops in major group 39 in each city along with rank :-
City
Bikaner Jaipur Ajmer Jodhpur Udaipur Kota.
Percentage
3·04 H·IS 4-29 7'78 4·64: 4·33
Ra.nk
6 1 I)
2
3 4
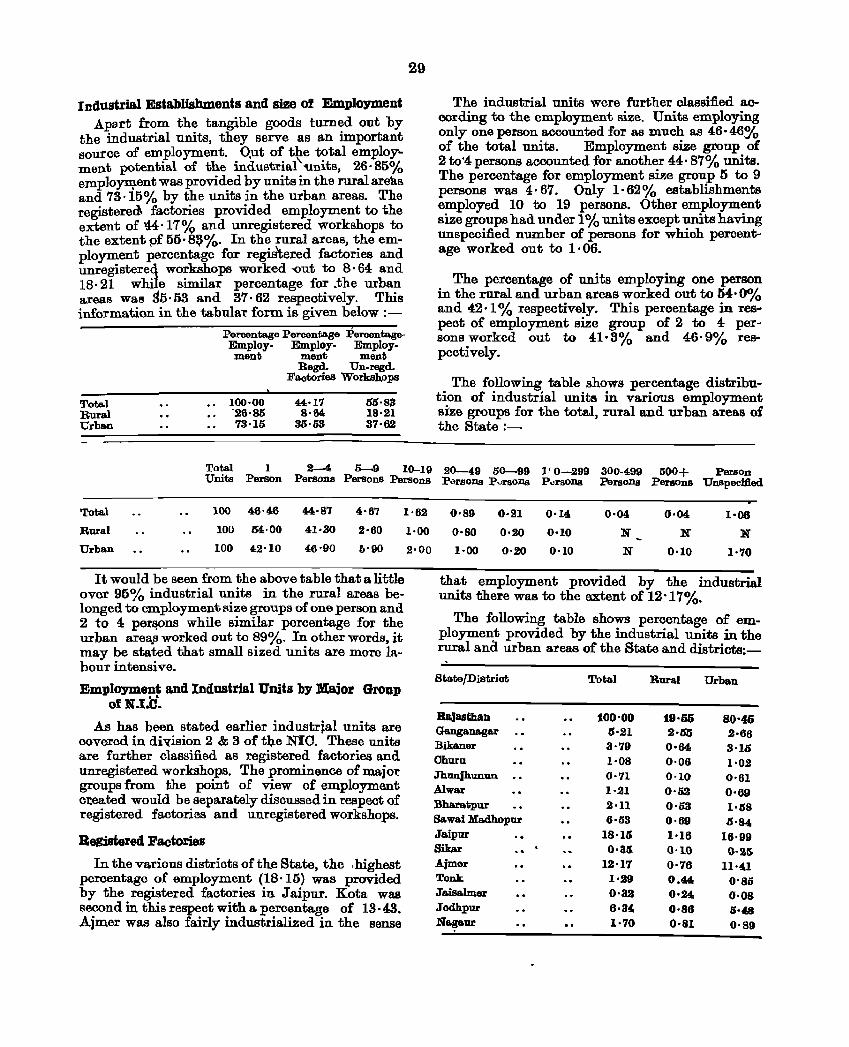
Industrial Establishments and size of Employment Apart from the tangible goods turned out by
the industrial units, they serve as an important source of employment. qut of the total employment potential of the induBtrial'units, 26·85% employ~ent was provided by units in the rural areas and 73·15% by the units in the urban areas. The registered. factories provided employment to the extent of «·17% and unregistered workshops to the extent pf 55· 8~%. In the rural areas, the employment percentage for registered factories and unregistereq workshops worked 'Out to 8· 64 and 18·21 while similar percentage for .the urban areas wal5 !in· 53 and 37· 62 respectively. This information in the tabular form is given below ;-
Total Rural "Crban
Percentage Percentage PeroentageEmploy. Employ- Employ. ment ment ment
100·00 -26,85 73'15
Regd. Un.regd. Faotorie.s Workshops
44·17 8·64
35·53
1)5'83 18·21 37'62
29
Total 1 2---4 5-9 10-19 Units Person PersoDs Persons Persons
Total 100 46·46 44·87 4'67 1'62
Rural IOU 04·00 41·30 2'60
Urban 100 42-10 46'90 0'00
It would be seen from the above table that a little over 96% industrial units in the rural areas belonged to employment size groups of one person and 2 to 4 per&ons while similar percentage for the urban area.s worked out to 89%. In other words, it may be stated that small sized units are more 111.bour intensive.
Empl~en~ and Industrial Units by Major Group of N.t.C.
Aa has been stated earlier industrjal units are covered in division 2 & 3 of the mo. These units are further classified. as registered factories and unregistered workshops. The prominence of major groups from the point of view of employment cJ:eated would be separately disoussed in respect of registered faotories and unregistered workshops.
Registered Factories
In the various distriots of the State, the ,highest percentage of employment (18'15) was provided by the registered factories in J aipur. Kota was s~nd in this respect with a percentage of 13·43. AJmer was also fairly industrialized in the sense
1·00
2'00
The industrial units were further classified according to the employment size. Units employing only one person accounted for as much as 46·463/0 of the total units. Employment size group of 2 to'4 persons accounted for another 44· 87% units. The percentage for employment size group 5 to 9 persons was 4· 67. Only 1· 62 % establishments e~ployed 10 to 19 persons. Other employment SIze groups had under 1 % units except units having unspecified number of persons for which peroentage worked out to 1· 06.
_ The percentage of units employing one person m the rural and urban areas worked out to 54-0% and 42· 1 % respectively. This percentage in respeot of employment size group of 2 to 4: persons worked out to 41· 3% and 46· 9% respectively.
The following table shows percentage distribution of industrial units in variO'1ls employment size groups for the total, rural and urban areas of the State;
20-49 50-99 l r O-299 300·499 500+ Person PdrsoDs pu"l"Sons P"rsoDs Persons PersoDs Unspecified
0'89 0·21 0'14 0'04 0·04 1'06
0'80 0'20 0·10 N N N 1·00 0·20 0'10 N 0·10 1'70
that employment provided by the industrial units there was to the extent of 12 '17o/c o·
The following table shows percentage of em-ployment provided by the industrial units in the rural ana urban areas of the State and districts:-
State/Di8triot Total Rural Urban
RaJasthan 100'00 19·56 80'45 Gang_gar 5·21 2·55 2·66 Bikaner 3'79 0·64 3'16 Chura 1·08 O'OB 1'0.2 Jhunjhunun 0-71 0-10 0'61 Alwar 1·21 0'52 0'69 Bharatpur 2'11 0'03 1'~8 Sawai Ma.dhopur 6·53 0'69 0'84 Jaipur 18·16 1'16 16'99 Sibr 0·35. 0'10 0'25 Ajmer 12'17 0'76 11'41 Tonk 1'29 0.44 0'85 Jaisalmer 0'32 0·24 0·08 Jodhpur 6·34. 0·88 S'48 Nagaur 1'70 0-81 0'89
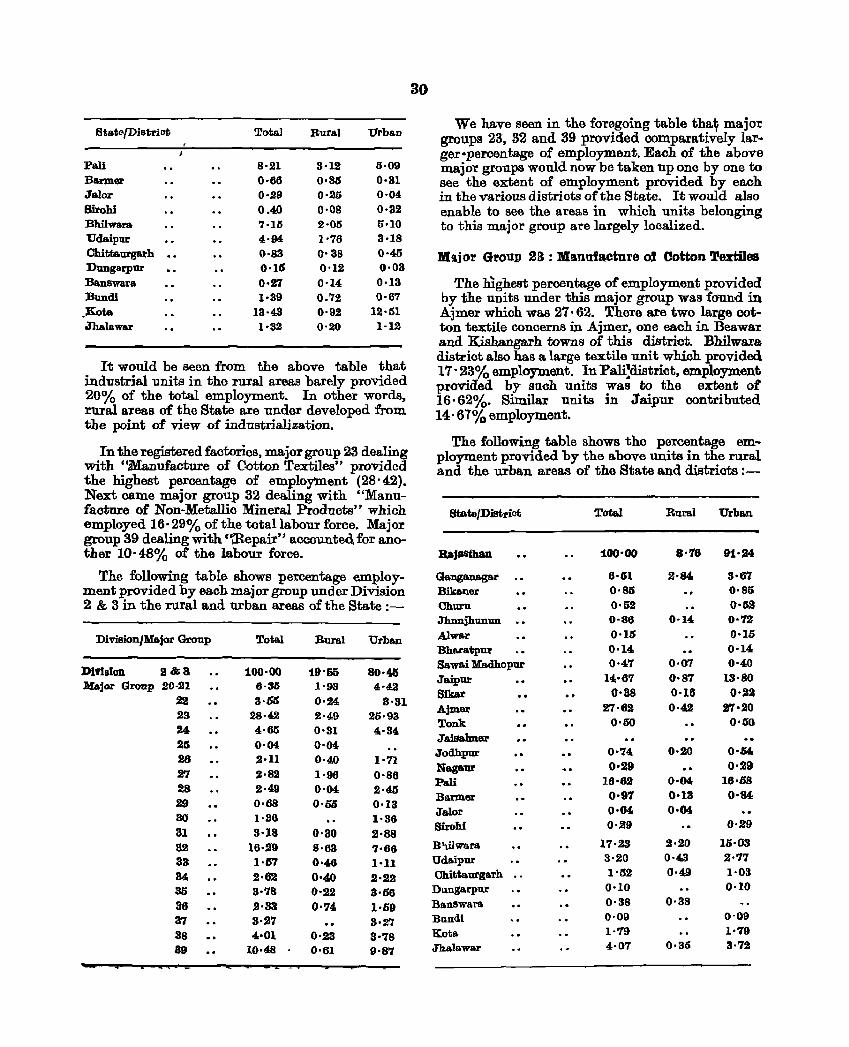
StateofDistriot Total Rural Urban
PoJi 8·21 3·12 5·09 Banner 0·66 0·35 0·31 JaJor 0·.29 O·2Q 0·04-Birohl 0.40 0·08 0·32 Bhilwara 7·15 2·05 5·10 Udaipur 4·94 1'76 3·18 Chittam"gM"b 0·83 0'38 0·45 Dungarpur 0·15 0'12 0·03 Banswara 0·27 0·14 0·13 Bundi 1·39 0.72 0·67
.Kota 13·43 0'92 12·51 olhalawar 1·32 0'20 1·12
It would be seen from the above table that industrial units in the r1ll'al areas barely provided 20% of the total employment. In other words, rural areas of the State are under developed from the point of view of industrialization.
In the registered faotories, major group 23 dealing with "Manufacture of C.otton Textiles" provided the highest percentage of employment (28' 42). Next came major group 32 dealing with "Manufaoture of Non-Metallic Mineral Produots" which employed 16· 29% of the total labour force. Major group 39 dealing with ",Repair" accounted for another 10· 48% of the laboux force.
The following table shows peroentage employment provided by eaoh lllajor group under Division 2 & 3 in the rural and urban areas of the State :-
Division/Major Group Total Rural Urban
DiVision 2&8 100·00 19'55 80·45 Major Group 20·.21 6·33 1'98 4·42
22 a·SO 0'24 3'31 23 28·42 2'49 .25·93 24 4·65 0'31 4·34 25 0'04 0'04 26 2·11 0'40 1·71 27 2·82 1'96 0'86 28 2·49 0'04 2·45 29 0·68 0'66 0·13 80 1·36 1·36 31 3·18 0'30 2,88 32 16·29 8'63 7·66 33 1'5'7 0'46 1'11 34 2·62 0,40 !N!2 35 3·78 0'22 3·66 36 ,2·33 0''14 h'i9 37 3·27 3·27 3S 4·01 0'23 3·78 89 10·48 0'61 9'87
30
We have seen in the foregoing table tha~ major groups 23, 32 and 39 provided comparatively larger·percentage of employment. Each of the above major groups would now be taken up one by one to see the extent of employment provided by each in the various districts of the State. It would also enable to see the areas in which units belonging to this m.a.jor group a-re largely localized.
Mljor Group 23: Manufacture 01 Cotton Textnes
The hIghest percentage of employment provided by the units under this major group was fo-und in Ajmer whioh was 27·62. There are two large cotton textile conoerns in Ajmer, one each in Beawar and Kishangarh towns of this district. Bhilwara. district also has a large textile unit which provided. 17' 23% employment. In Pa1i!district, employment provided by such units was to the extent of 16·62%. Sitnilar units in Jaipur contributed 14· 67% employment.
The following table shows the percentage employment provided by the above units in the rural and the urban areas of the State and distriots :-
State/District ToW Rural Urban
llaJ~ 100'00 8'76 91·24
Ganganagar 6·61 2·84, 3·67 Bikaner 0·85 0'85 Churu 0·52 0·52 Jhnnjhunun 0·S6 0·14. 0·72 Alwar 0'15 0·15 Bb.&ratpUl' 0·14, 0·14 Sawai Madhopur 0·47 0·07 0·40 JaipUl' l4.·67 0,87 13·80
Sikar 0·38 0·16 0'22 Ajmer 27·62 0'42 27·20 Tonk 0·50 0'60 Jaisalmer Jodhpur 0'74 0·20 0'34, Nagaur 0·29 0·29 Pali 16·62 0·04 16'1SS Bo.rmer 0·97 0·13 0·84 Jalor 0·04. O·M Biram 0·29 0·29
B'Ulwara 17·23 2·20 15·03 Udaipur 3·20 0·43 2·77 Chittaurgarh 1'52 0·49 1·03
Dlltlgarpur 0·10 0·10
BlIonSwlu"a. 0·38 0·38
Bandi 0·09 0'09
Kota 1·79 1·79 Jhalawar 4'()7 0·35 3·72
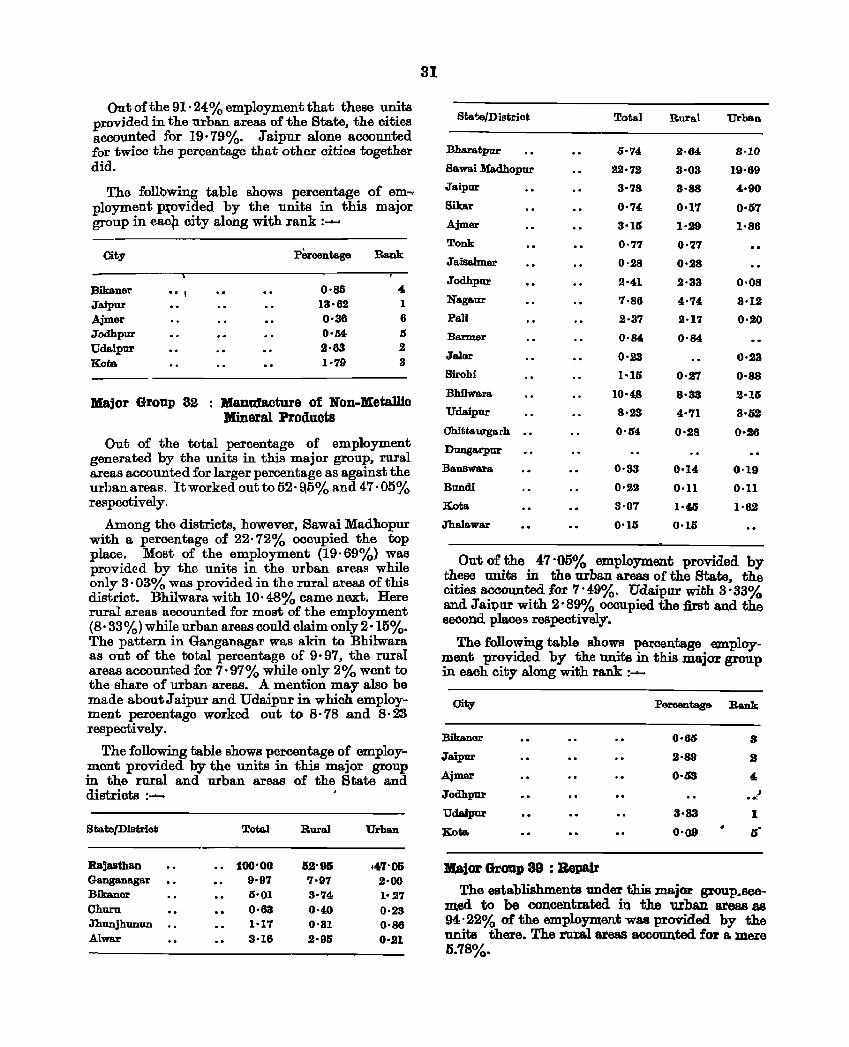
Out of the 91·24% employment that these units provided in the urban areas of the State, the cities accounted for 19·79%. Jaipur alone accounted for twice the percentage that other cities together did.
The follbwing table shows percentage of em-, ployment p:tovided by the units in this major group in eaclI city along with rank : ......
City pe...centage Rank
Bikaner •• I 0·85 4 Jaipur 13·62 1 Ajm.el" 0·36 6 Jodhpur 0·.54, IS
Udaipur 1·63 2 Kota 1·79 3
lVIajor Group 32 : Manufacture of Non-Metallic Mineral Products
Out of the total percentage of employment generated by the units in this major group, 1'Ul'al areas accounted for larger percentage as against the urhan areas. It worked out to 52· fl5% and 47·05% respectively.
Among the districts, however, Sawai Madhopur with a percentage of 22· 72% occupied the top place. Most of the employment (19,69%) was provided by the units in the urban areas while only 3·03% was provided in the rural areas of this district. Bhilwara with 10· 48% came next. Here rural areas accounted for most of the employment (8· 33%,) while urban areas could claim only 2· US%. The pattern in Ganganagar was akin to Bhilwara as out of the total percentage of 9'97, the rural areas accounted for 7· 97% while only 2% went to the share of urban areas. A mention may also be made aboutJaipur and Udaipur in which employment percentage worked out to 8·78 and 8·23 respectively.
The following table shows percentage of employment provided by the units in this major group in the rural and urban areas of the State and districts :--
State/Distriot Tota.l Rural Urban
Ralasthan 100'00 52'9& .47'05 Ganganaga.r 9·97 7·97 2·00 Bikaner 0'01 3'74 l' 27 Churn 0·63 0·40 0·23 Jhunjhunun 1'17 0'31 0'86 Alwar 3·16 2·95 0·21
31
Sta~/Di8triot
Bharatpur
Sawai Madhopur
Jaipor
Bikar
Ajmer
Tonk
JaisaJmer
Jodhpur
Naga.ur
Pali
Barmer
Jalor
Sirohi
Bhilwa.ra
Udaipur
Chittaurgarh
Dtmgarpur
Banswa.ra
Bundi
Kota
Jha.la.war
Total
0'74
22'72
3'78
0'74:
3'Ui
0·77
0'28
2·4:1
7·86
2·37
0·84:
0'23
1·15
10'48
8·23
0·64:
0·33
0'22
3'07
0'15
Rural
2·64,
3'03
3·88
0'17
1'29
0''27
0·28
2·33
4:'74:
2·17
0'84:
0·27
8·33
4'71
0·28
0'14:
0·11
1·40
0·15
Urba.n
3·10
19·69
4:·90
0·57
1·86
0·08
3·12
0·20
0·23
0·88
2·15
3·02
0'26
0·19
0·11
1'62
Out of the 47 '05% employment provided by these units in the urban areas of the State. the cities aooounted for 7'49%. Udaipur with 3'33% and Jaivur with 2'89% occupied the first and the second places respectively.
The following table shows percentage employment provided by the units in this major group in each city along with rank :--
Oity Percentage Rank
Bikaner 0·60 S
Jaipur 2'89 2
Ajmer 0·63 4-
Jodhpur .. ~) UdaipUl' 3·33 1
Kota 0'09 6'
Major GrOUP 39 : Bepair
The establishments under this major group.seemed to be concentrated in the urban. areas as 94:' 22% of the employment was provided by the units there. The rural areas aoooun.ted for a mere 5.'18%.
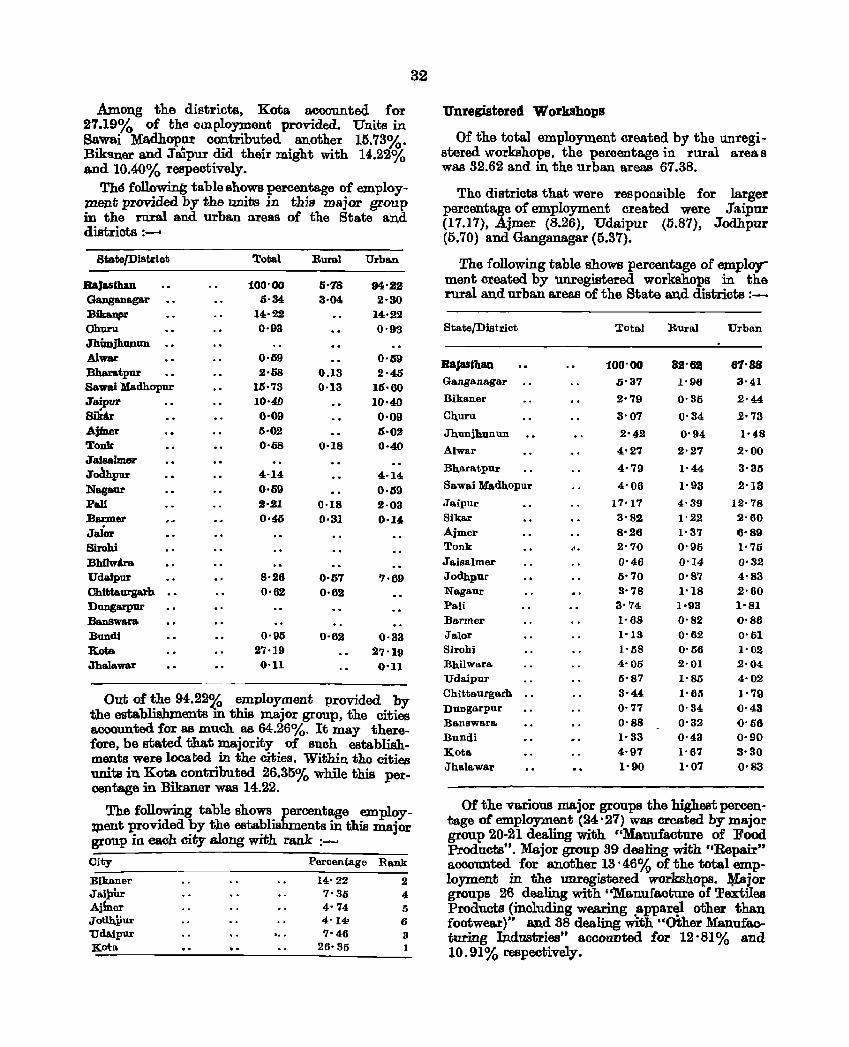
.AJn,ong the districts, Kota accounted for 97.19% of the employment provided. Units in Sawai Madhopur contributed another 15.73%. Biksner and J'a'ipur did their might with 14.22% and 10.40% respectively.
Thd following table snows percentage of employment provided by the units in this major group in the rural and urban areas of the State an.d districts :-
State/Distriot
RaJasOum Gangana.gar :Bika.D,er Churu Jhimihanun Alwar Bharatpur Sawai Madhopur Jaipur Bik&r Ajfner Tou JaisaJmer Joc\hpur Nagaur Pa.li Barmer Jal~r Birabi Bhilw4ra Udaipur Chittaurgal'h DUDga.rpur BanSWal."llo Bundi Kota Jhalawar
Total
100'00 6·34
14·22 0·93
0·59 2·58
15·73 10'40 0·09 5·02 0'08
4·14 0·59 2·21 0'45
8·26 0'62
0'95 27·19 0·11
Rural Urban.
6'18 94'22 3·04 2·30
0.13 0·13
0'18
0·18 0·31
0'57 0·62
0·62
14'22 0'98
0'59 2·45
15'60 10'40 0'09 5·02 0·40
4·14 0·59 2·03 0·]4.
7'69
0·33 27'19 0'11
Out of the 94.22ra employment provided by the establishments ill this major group, the cities accounted. for as much. as 64.26%. It may therefore, be stated that majority of such establishments were located in the cities. Within the cities units in Kota contributed 26.35% while this percentage in Bikaner was 14.22.
32
The following table shows percentage employlJlent provided by the establishments in this major group in each city along with rank : ........
City Percentage Rank
Bikaner 14'22 2 Jaipur 7'35 4 Aj~er 4'74 5 Jotl.b.pur 4'14- 6 Uda.ipur ',. 7'46 3 Kota 26'35 1
Unregistered Workshops
Of the total employment created by the unregistered workshops, the percentage in rural area s was 32.62 and in, the urban areas 67.3B.
The districts that were responsible for larger percentage of employment created were Jaipur (17.17), Ajmer (8.26), Udaipur (5.87), Jodhpur (5.70) and Ganganagar (5.37).
The following table shows percentage of employment created. by unregistered workshops in the rural and urban areas of the State an.d districts :--
State/District Total Rural Urban
Rajasthan 100'00 82-62 6'1'88 Ganganagar 0'37 1'96 3'41
Bikaner 2'79 0'35 2'44 Churu 3'07 0'34 2·73
Jhunjhunun 2'42 0'94 1'48 Alwar 4'27 2'27 2'00
Bhara.tpllJ." 4'79 1'44 3'35
Sa.wa.i Madhopur 4'06 1'93 2'13
Ja.ipur 17'17 4·39 12·78 Sikar 3'82 1'22 2'60 Ajmer 8'26 1'37 6'S9 Tonk ... 2'70 0'95 1'75 Ja.isalmer 0'46 0'14 0'32 Jodhpur 5'70 0'87 4'S3 Naga.ur 3'78 1'IS 2'60 Pali 3'74 1·93 1'81 Barmer 1'68 0'S2 0'S6 Jalor 1'13 0'62 0'51 Sirobi 1'58 0'56 1'02 :Bhilwara 4'05 2'01 2'04 Udaipur 5'S7 l' 8J5 4'02 Chittaurgarh 3'44 1'65 1''79 Dungarpur 0·77 0'34 0'43 Banswara. 0'88 0'32 0'56 Bundi I'S3 0'43 0'90 Kota. 4'97 1'67 3·30 Jhalawar 1'90 1'0'7 0·S3
Of the various major groups the highest percentage of employment (24' 97) was created by major group 20-21 dealing with "Manufacture of Food Producte". Major group 39 dealing with "Repair" accounted for another 13' 46% of the total employment in the unregistered ·workshops. ¥ajor groups 26 dealing with ''Manufacture of Textiles Products $includwg wearing .appar~ other than footwear)' and 3B dealing with "Other Manufacturing Industries" accounted for 12'81% and 10.91% respectively.
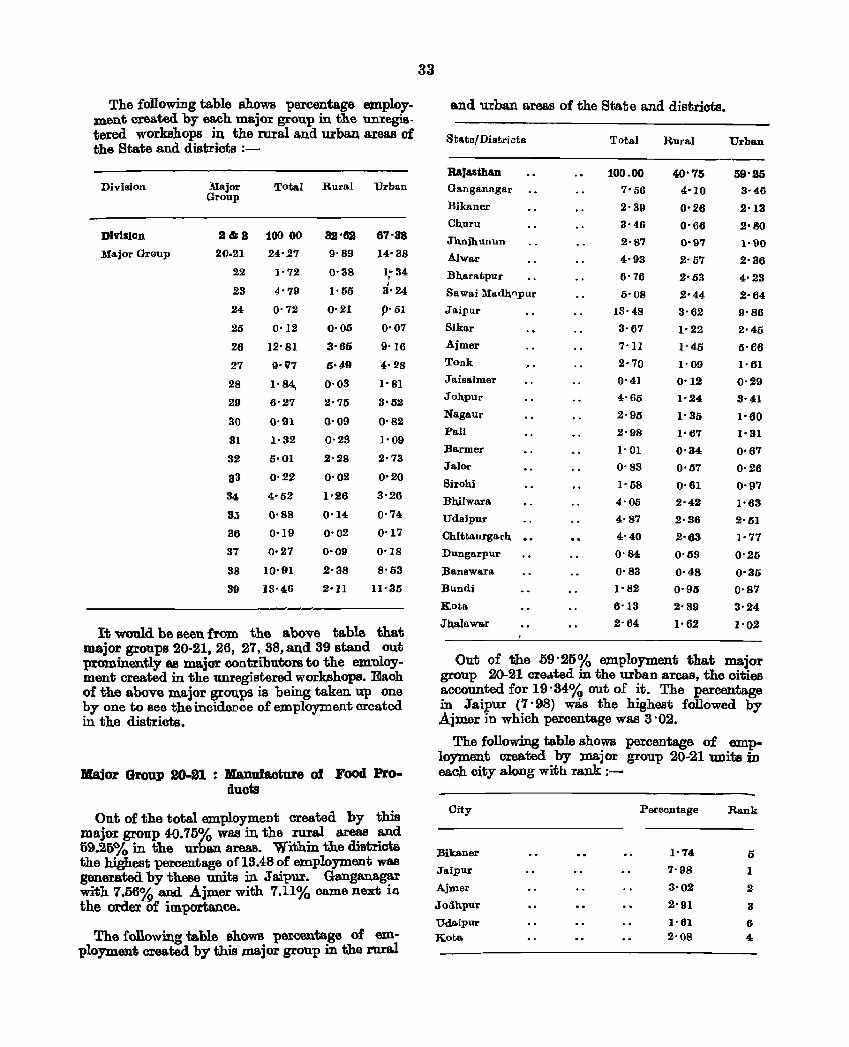
The following ta.ble shows percentage employ. ment created by each ma.jor group in the unregis-tered workshops :in the rural and uxban areas of the State and districts :-
Division Major Total Rural Urban Group
Division 2&8 100 00 82'62 67-3S
l\'[ajor Grcmp 2().21 24'27 9'89 14'38
22 1-72 0·38 I" 34 I
23 4'79 1'55 ,
3'24
24 0'72 0'21 P'51
25 0'12 0'05 0'07
26 12'81 3'66 9'16
27 9'V7 0'49 4·28
28 l' 84, 0'03 1'81
29 6-27 2'75 3'52
30 0·91 0'09 0'82
31 1·32 0'23 1'09
32 5'01 2·28 2·73
33 0·22 0'02 0'20
34 4'52 1'26 3'26
83 0'88 0'14 0'74
36 0'19 0'02 0'17
37 0·27 0-09 0'18
38 10·91 2'38 8'63
39 13'46 2'11 11'35
It would be seen from the above table that out major groups 20-21, 26, 27. 38, and 39 stand
prominently e.s ma.jor contributors to the em'Oloy· ment created in the unregistered workshops. Ea.ch of the above major groups is being taken up one by one to see the incideDce of employment created in the districts.
Major GroUlJ 20-21 : Manufacture 01 Food Products
Out of the total employment created by this major group 4-0.70% was in. the rural areas and 69.25% in the urban areas. Within the districts the highest percentage of 13.48 of employment was generated by these units in J aipur. Ganganagar with 7.06% and Ajmer with 7.11% came next ill the order Of importance.
The following table shows percentage of em· ployment created by this major group in the rural
33
and urban areas of the State and districts.
State/ Di9~ricts Total Rural Urban
-----------------RaJasthan Ganganngar
Rikaner
Cb.uru
Jhnjhunun
Alwar
Bb.aratpur
Sawai :lIadhnpur
Jaipur
Sikar
.Ajmer
Tonk
Jaisalmer
Johpur
Nagaur
Pali
Barmer
Jalor
Sirohi
BbJlwara
Udaipur
Chit~aurg&rb.
Dungarpur
Ranswara
Bundi
Kota
Jb,alawar
100.00
7'56
2'39
3'46
2'87
4'93
6- 76
6'08
13-48
3-67
7'11
2'70
0·41
4'65
2-96
2-98
1'01
0-83
1-58
4'05
4'87
4'40
0-84
0'83
1'82
6-13
2'64
40'75
4'10
0·26
0'66
0-97
2'57
2'53
2'44
3'62
1'22
1'45
1'09
0'12
1-24
1'35
1'67
0-34
0'07
0'61
2'42
2·36
2'63
0'69
0'48
0'95
2'89
1'6.2
59'25 3'46
2'13
2'1'10
1-90
2'36
4'23
2'64
9'86
2'45
5'66
1'61
0'29
3-41
1-60
l' 31
0'67
0'26
0'9'7
1'63
2'01
l' 77
0'25
0'35
0'87
3'24
l' 02
Out of the o9'25'}'o employment that major group 20-21 cred.ted In the urban areas, the cities a.ccounted for 19'34% out of it. The percentage in Jaipur (7 '98) was the highest followed by Ajmer in which percentage was 3 ·02.
The following table shows percentage of employment created by IJla.jor group 20-21 units m each city along with rank :-
City Percentage Rank
Bikaner 1'74 0
Jaipur 7-98 1
.Ajmer 3'02 2
Jo,ib.pur 2-91 3
Ud,a.ipur 1'61 6 Kot-a. 2-08 4
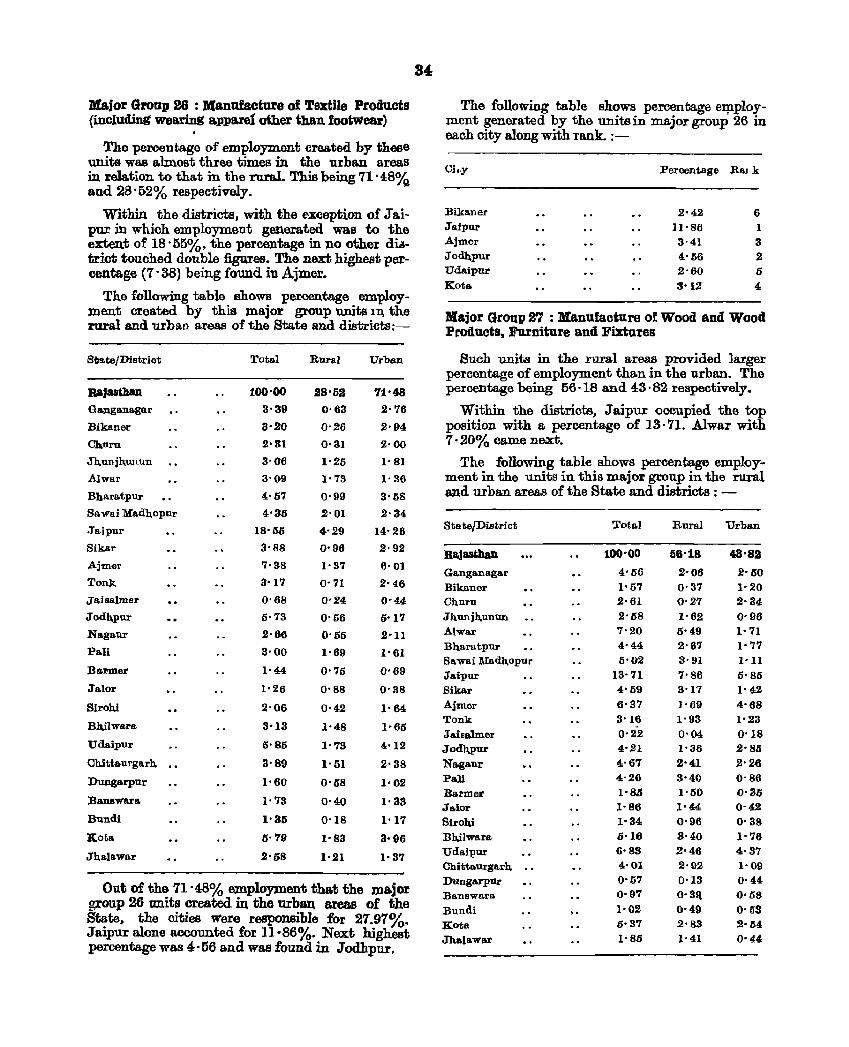
Major Group 26 : Manufacture of Textile Products (including wearing apparet other than footwear)
,
The percentage of employment created by these units was almost three times in the urban areas in relation to that in the ruml. This being 71'48% and 28' 52% respectively.
Within the districts, with the exception of .r aipur in which employment genera.ted was to the extent of 18' 55%, the percentage in no other diatriot touched double figures. The next; highest percentage (7' 38) being found iu Ajmer.
The following table shows percentage employment created by this major group units In the rural and urban areas of the State and districts:-
St!l.tejDistrict Total Rural Urban
RaJas&han 100'00 2S'52 71'48 Gangana.gar 3'39 0'63 2'76
13ikaner 3'20 0'26 2'94
Churn 2'31 0·31 2'00
Jb.unjb.wlUn 3'06 1'25 I' 81
Alwar 3'09 1'73 1'36
Bhara.tpur 4'67 0'99 3'6S
Sawai Madhopllr 4'35 2'01 .2'34
.Taipur 18'50 4'29 14'26
Sikar 3'88 0'96 2'92
Ajmer 7'38 1'37 6'01 Tonk 3'17 O· 7I 2'46
Jaisalmer 0'68 0'24 0'44 Jodh,pur 5·73 0'56 5'17
Nagaur 2'66 0'65 2'11
Ps.li 3'00 1'69 l' 61
13armer 1'44 0'75 0-69
Ja.lor 1'26 0'88 0'38
Siroh,i 2'06 0·42 1'64
Bhilwara. 3'13 1'48 1'66
Udaipur 5'85 1'73 4'12
Chittaurgarh, 3'89 1'51 2'38
Dungarpur 1-60 0'58 1'02
13a.nswaro. 1'73 0'40 1'33
Bundi 1'35 0'18 1'17
Koto. 5·79 1'83 3'96
Jh,ala.war 2'08 1'21 1·37
Out of the 71' 48% employment that the major group 26 units created m the urb811 areas of the State, the cities were responsible for 27.97%. Jaipur alone accounted for 11'86%. Next highest percentage was 4·56 and was found in Jodhpur,
34,
The following table shows percentage e:q:tployment generated by the unitsin major group 26 in each oity along with rank, :-
Oi'Y Percentage RaJ k
Biko.ner 2'42 6 Jaipur 11'86 1 Ajmer 3'41 3 Jodb,pur 4'56 2 Udaipur 2'60 6 Koto. 3'12 4
Major Group 27 : Manufacture of Wood and Wood Products, Furniture and FiXtures
Such units in the rural areas provided largex percentage of employment than in the urban. The percentage being 66·18 and 43·82 respectively.
Within the districts, J aipur occupied the top position with a percentage of 13·71. Alwar with 7·20% came ne.xt.
The following table shows percentage employment in the units in this ma.jor group in the rural and urban areas of the State and districts:-
State/District Total Rural Urban
Ra)uthaD 100'00 56'18 43'82
Ganganagar 4'56 2'06 2'50 Bikancr 1'57 0'37 1'20 Churn 2'61 0'27 2'34 Jhunjl\unun 2'58 1'62 0'96 Alwar 7'20 6'49 l' 71 Bh,aratpul" 4'44 2'67 1'77 Sawai 1\Iadb,opur 5'02 3'91 I'll Jaipur 13'71 7'86 6'85 Sikar 4'59 3-17 1'42 Ajmer 6'37 1'69 4'68 Tonk 3-16 1'93 1'23 Jabalmer 0'22 0-04 0'18 Jodh,pur 4'21 1'36 2-86 Na.ga.ur 4'67 2'41 2'26 Pali 4·26 3-40 0'86 13armer 1'86 1'50 0-36 JlIolor 1'86 1-44 0'42 Siroh,i 1'34 0-96 0'38 13b.ilwara. 6'16 3-40 1'76 Udaipur 6'83 2'46 4·37 Chittaurga.rh, 4'01 2'92 l' 09 Dungarpur 0'57 0'13 0'44 BlIonswara 0'97 0·311 0'58 Bundi 1'02 0·49 0'63 Kota 5-37 2'83 2·54,
Jhalawa.r 1'86 1'41 0'44
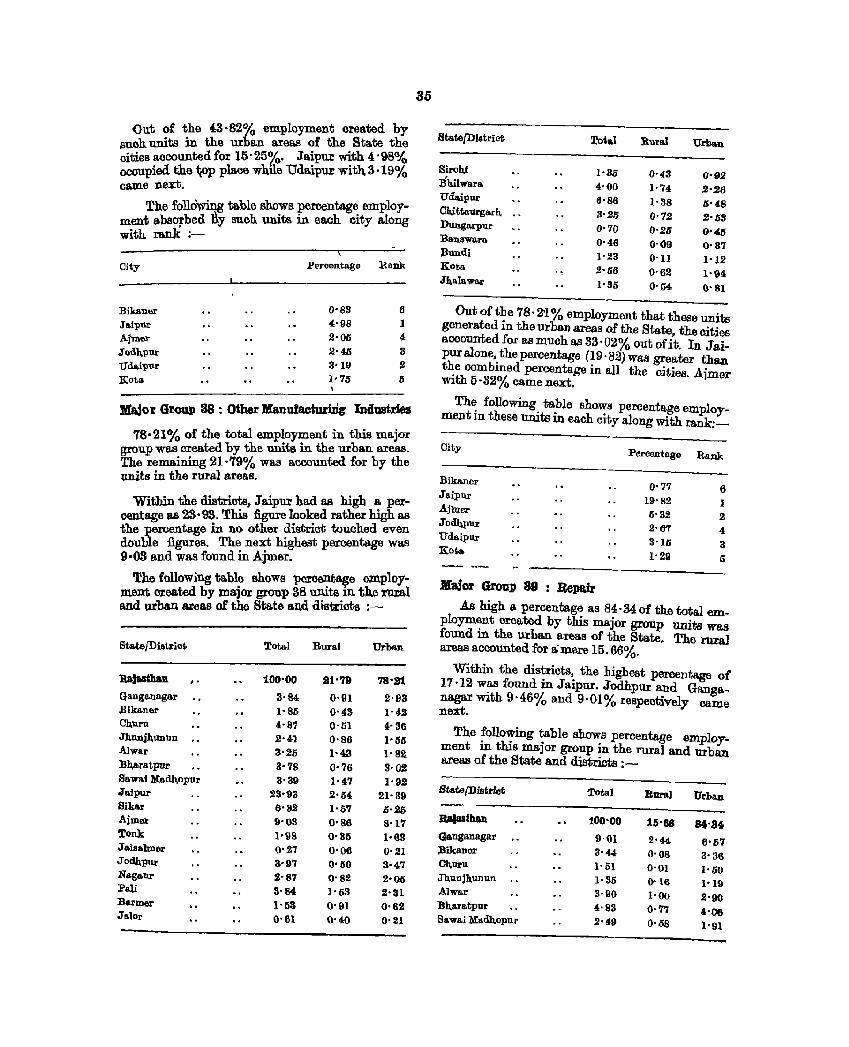
Out of the 43'82% employment created by suoh. units in the urban a:rea.s of the State the cities accounted for 15' 25%_ Jaipw: with 4:' 980..{, occupied the ~op place while Udaipw: with 3 ,19% came next.
The follOwing table shows percentage employment absorbed By such units in eaoh city along with rank :-
City Percentage Rank
Bikan6l" 0-83 6
Jaipur 4'98 1 Ajmer 2-06 4
Jodh,pur 2'40 3 Uda.ipur 8'19 2 Kota 1'75 IS
Ma,jor Group 38 : Other Manufacturirlg Industries
78·21% of the total employment in. this major group was created by the units in the urban areas. The remaining 21-79% was accounted for by the units in the rural areas.
Withln the districts, J s.ipur had as high a. percentage as 23· 93. This figure looked rather high as th.e percentage in n.o other district touched even double figures. The next h.ighest percentage was 9·03 and was found in Ajmer.
The following table shows percentage employment created by major group 38 units in the rural and urban areas of the State an.d districts :-
Bta.teJDiII~ict Total Rural Urban
llaJa.sthan , . iOO'OO 21'79 78'31 Ga.nganagar 3-84 0·91 2'93 Bika.ner 1'85 0'43 1'42 Ch,uru 4'87 0'51 !l'S6 J'hnnj.b,unun .. 2'41 0'86 I-55 Alwar 3'25 1·43 1-82-Bb.arstpur 3'78 0'76 9'02 B8wai Madb,opur 3'39 }'47 1-92 Jaipur 23'93 2'54, 21-39 Bikar 6'82 1'57 0·.25 Ajmer 9'OS 0'86 8'17 Tonk 1'98 0-35 HIS Jaisalmer Q'27 0'06 0'21 Jodb.Plll" 3-97 0'60 3'47 Nag&lIr 2'87 0'82 2'05 Pali 3'84, 1'53 2'31 Barmer 1'53 0'91 0'62 Jalor 0'61 0'40 0'.21
35
State/Dietl'jet !:eot.al Rural Urban
Birohi 1'35 0'43 0'92 Bh.ilwara. 4'00 1'74 .2'.26 Udaipur 6'86 1'38 5'48 Chlttaurgarb. 3'25 0'72 .2'63 Dungarpur 0'70 0'25 0'45 Banswara 0'46 0'09 0-37 :Bundi 1'23 0'11 1-12 Kota 2'66 0'6.2 1'94 Jh,ahl.war 1'35 0'54 0'81
Out of the 78· 2'1 % employment that these units generated in the urban areas of the State, the cities 80000unted for as much as 33· 02% out of it. In Jaipuralone,.thepercentage (19'82) was greater than the combmed percentage in all the oitie8. Aimer with 5·32% came next_
Th~ following. ta?le sho~8 percentage employment In these unIts In each CIty along with rank:-
City Percentage Rank
Bika.ner 0'77 6 Jaipur 19'82 1 Ajmer 5'32 2 Jodh,pur
2'67 4 Uda.ipllr 3'15 3 Kota. 1'29 5 -- -.-Major GrOUP 39 : Repair
A.s high a. percentage a.s 84·34 of the total employment created by this major group units was found in the urban areas of the State. The rural areas accounted for a'mere 15,66%.
Within the dis~icts, the bighest percentage of 17·12 w~s found in Jaipur_ Jodhpur and Ga.nganagar WIth 9·46% and 9'01% respectively came next.
The following table shows percentage employment in this major group in the rural and urban areas of the State and diatrictB ;_
Sta.te/DiBtriot Total Rural Urban
RaJaS·bah 100·00 15'68 8.'34 Ganganagar 9·01 2'44- 6'07 ;Bik;aner 3'44 0'08 3-36 Cb.uru 1'51 0'01 I-50 Jb,unjh,llnun .. 1'35 O'HI 1-19 Alwar 3'110 1'00 2'00 Bharatpur "83 0·77 4'06 Sawai MBilhopur 2'49 0'58 1'91
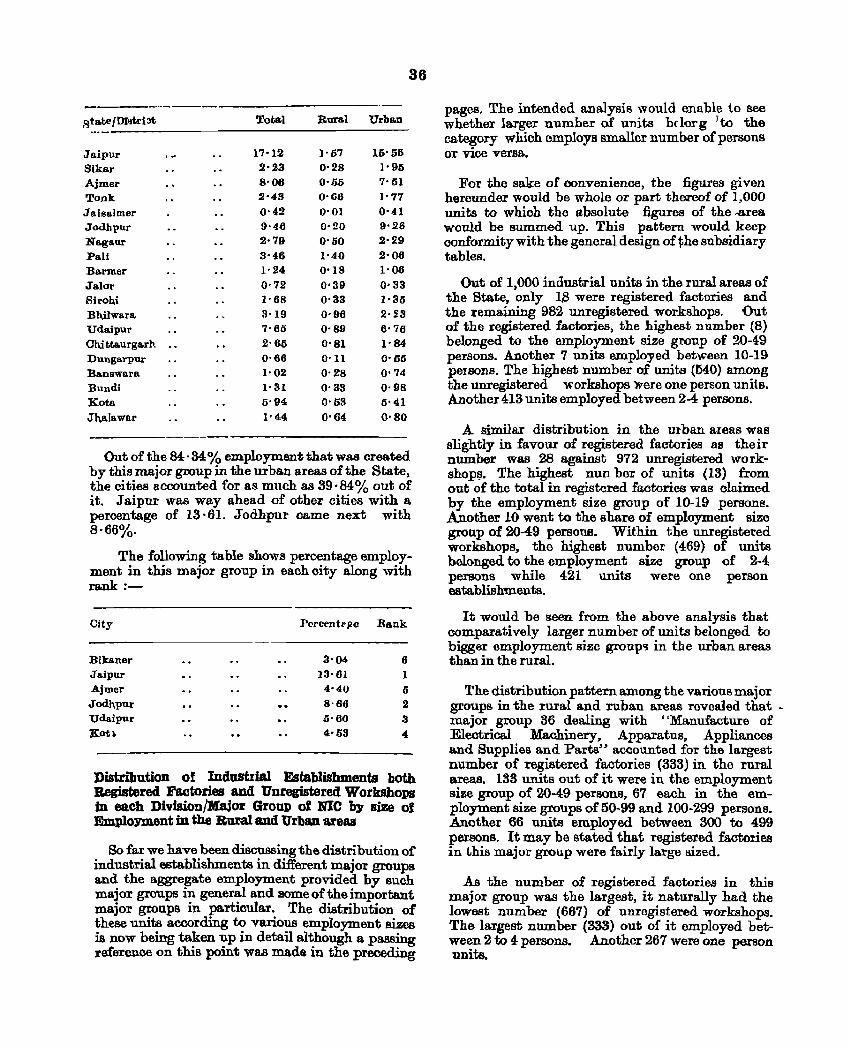
36
_------------state IDll5td3t To~a.l Buml Urba.D
Jaipur 17-12 1'67 16-56 Sikar 2-23 0'28 1-95 Ajmer 8-06 O-lW 7-51
Tonk 2-43 0-(;6 1-77
J aisalmer 0'42 0'01 0-41 Jodhpur 9'46 0-20 9' .26 Na.gaur 2-79 0-50 2'29 Pa.li 3-46 1-40 2'06 Ba.rmer 1'24 0'18 1-06 Jalor 0-72 0-39 0-33 Sirohi 1-68 0-33 1-S5 Bhilwa.ra 3-19 0'96 2-~3
Udaipur 7-65 0'S9 6'76 OW ttaurgarh _. 2'65 O'Sl 1'84 Dunga.rpur 0'66 0-11 0'55 Banswora. I' 02 0'28 0'74 Bundi I'ln 0'S3 0,98
Kota 5'94 0'53 5'41 JI\&Iawar 1'44 0'64 0'80
Out of the 84·34% employment that was created by this major group in the urban areas of the State, the cities accounted for as much as 39·84% out of it, Jaipur was way ahead of other cities with a percentage of 13·61. Jodhpur came next with 8·66%.
The following table shows percentage employment in this major group in each city along with rank :-
City Percentl'flc Rank
Bibner 3'04 6 Jaipur 13'61 I Ajmer 4'40 5 Jodb,pur 8'66 2 Udaipur 0'60 3 KotJ. 4'53 4
Distribution of IndustIial Establishments both Registered Factories and Unregistered Workshops in each Division/Major GrollP of me by size of Em.;plo:vment in the Rural and Urban areas
So far we have been discussing the distribution of industrial establishments in different major groups and the aggregate employment provided by such major groups in general and Bomeoftheimportant major grollpS in particular. The distribution of these units according to various employment sizes is now being taken up in detail although a passing reference on this point was made in the preceding
pages, The intended analysis would enable to see whether larger number of units bdorg Ito the category which employs smallcr number of persons or vice versa.
For the sake of convenience, the figures given hereunder would be whole or part thez-cof of 1,000 units to whioh the absolute figures of the -area would be summed up. This pattern would keep conformity with the general design of ~he subsidiary tables.
Out of 1,000 industrial units in the rural areas of the State, only 1,g were registered factories and the remaining 982 unregistered workshops_ Out of the registered factories, the highest number (8) belonged to the empl~yment size group of 20-49 persons. Another 7 UDlts employed between 10-19 persons, The highest number of units (640) among the unregistered workshops )Vere one person units. Another 413 units employed between 2-4 persons.
A similar distribution in the urban areas was slightly in favour of registered factories as their number was 28 against 972 unregistered workshopr;;. The highest nun bet' of units (13) from out of the total in registered factories was claimed by the employment size group of 10-19 persons. Another 10 went to the share of employment size group of 20-49 persons. Within the unregistered workshops. the highest number (469) of units belonged to the employment size group of 2-4 persons while 421 units were one person establishments.
It would be seen from the above analysis that comparatively larger number of Wlits belonged to bigger employment size group~ in the urban areas tha.n in the rural.
The distribution pattern among the various major groups in the rural and ruban areas revealed that -major group 36 dealing with "Manufacture of Electrical Machinery, Apparatus, Appliances and Supplies and Parts" accounted for the largest number of registered factories (333) in the rural areas. 133 units out of it were in the employment size group of 20-49 persons, 67 each in the employment size groups of 50-99 and 100-299 persons. Another 66 units employed between 300 to 499 persons, It may be stated that registered factories in this major group were fairly large sized,
As the number of registered factories in this major group was the largest, it naturally had the lowest number (667) of unregistered workshops. The largest number (333) out of it employed between 2 to 4 persons. Another 267 were one person unite.
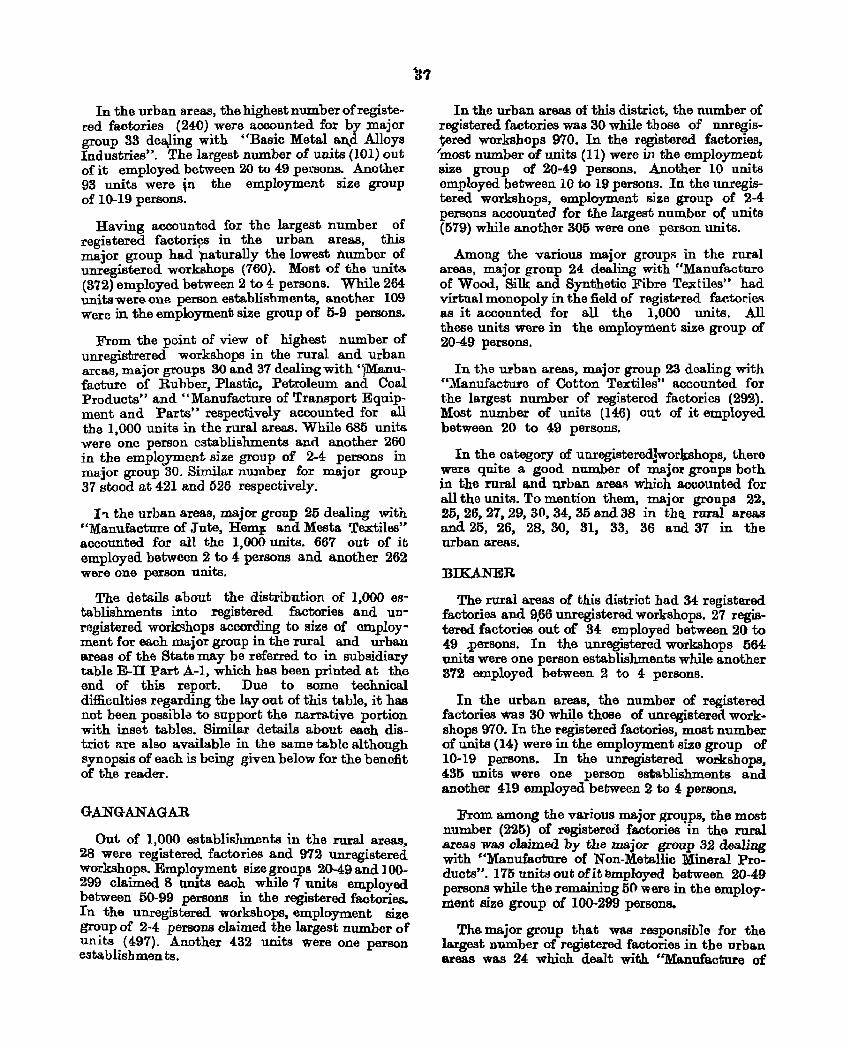
In the urban areas, the highest number ofregistered faotories (240) were accounted for by major group 33 de~ling with "Basic Metal an.d Alloys Industries". The largest number of units (101) out of it employed between 20 to 49 persons. Another 93 units were- in the employment size group of 10-19 persons.
Having accounted for the largest number of registered factori~s in the urban areas, this major gxoup had paturally the lowest number of unregisterod workshops (760). Most of the units. (372) employed between 2 to 4 persons. While 264 unitswereone person establishments, another 109 were in the employment size group of 5-9 persons.
From the point of view of highest number of unregistrered workshops in the rural and urban area.s, major groups 30 and 37 dealing with 'JManufacture of Rubber, Plastic, Petroleum and Coal Products" and "Manufacture of Transport Equipment and Parts" respectively accounted for all the 1,000 units in the rural areas. While 685 units were one person establishments and another 260 in the employment size group of 2-4 pereons in major group '30. Similar number for major group 37 stood at 421 and 526 respectively.
1'1. the urban areas, major group 25 dealing ,vith "Manufacture of .Tute, Hem, and Mesta Textiles" accounted. for all the 1,000 units. 667 out of it em.ployed between 2 to 4 persons and another 262 were one person units.
The details about the distribution of 1,000 establishments into registered factories and unregi.~tered worbhops according to size of employment for each major group in the rural and urban areas of the State may be referred to in subsidiary table E-ll Part A-I, which has been printed. at the end of this report. Due to some technical difficulties rf'garding the layout of this table, it has not been possible to support the narra.tive portion with inset tables. Similar details about each district are also a.vailable in the same table although synopsis of each is being given below for the benefit of the reader.
GANGANAGAR
Out of 1,000 establishments in the rural areas, 28 were registered factories and 972 unregistered workshops. Employment size group3 20-49 and] 00-299 claimed 8 tmits each while 7 units employed. between 50-99 persons in the registered factories. In the unregistered workshops, employment size group of 2-4 persons claimed the largest number of units (497). Another 4.32 units were one person establisllmen ts.
In the urban areas of this district, the number of registered factories was 30 while those O'f unregistered workshops 970. In the registered factO'ries, 'most number O'f units (11) were in the employment size group of 20-49 persons. Another 10 units employed between 10 to' 19 persoIls. In the unregistered workshops, employment size group of 2-4 persons aooounted for the largest number of units (579) while another 305 were one person units.
Among the various majO'r groups in the rural areas, major group 24 dealing with "Manufacture O'f Wood, Silk and Synthetic Fibre Textiles" had virtual monopoly in the field ot registf'red factories as it accounted for all the 1,000 units. All these units were in the employn1ent size group of 20-49 persons.
In the urban a.reas, major group 23 dealing with "Manufacture of Cotton Textiles" accounted for t.he largest number of registered factories (292). Most number of units (146) out of it emplO'yed. between 20 to 49 persons.
In the ca.tegory of unregistered!workshops, thero were quite a good number of major groups both in the rural a.nd urban areaR which accounted for all the units. To mention them, major groups 22, 25, 26, 27, 29, 30, 34, 35 and 38 in th~ rural areas and 25, 26, 28, 30, 31, 33, 36 and 37 in the urban areas.
BIUNER
The rural areas O'f this district had 34 registered faotories and 9,66 unregistered workshops. 27 registered. facto~ies out or 34 employed between 20 to 49 .persons. In the unregistered workshops 564 units were one person establishments while another 372 employed between 2 to 4 persons.
In the urban areas, the number of registered factories was 30 whi~e those of unregistered workshops 970. In the registered factories, most number of units (14) were in the employment size group of 10-19 persons. In the unregistered woMshops. 435 units were one person esta.blishments and another 419 emplO'yed between 2 to 4 persons.
From among the various major grol!ps, the most number (225) of registered factories in the rural areas W&<;I claimed by t.he major group 32 dealing with "Manufaoture of Non-Metallic Mineral Products". 175 units out of it employed between 20-49 persons while the remaining 50 were in the employment size group of 100-299 persons.
The major group that was responsible for the large.'3t number of registered factO'ries in the urban areas was 24 which dealt with "Manufacture of
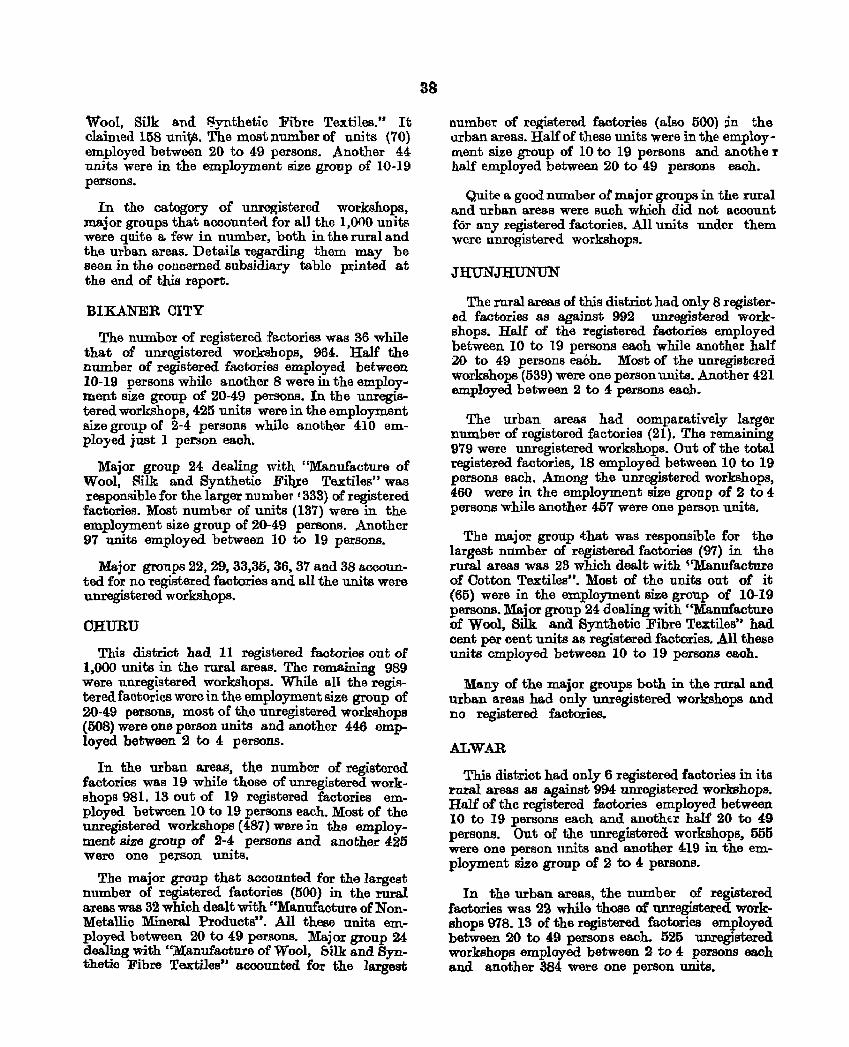
Wool, Silk and Synthetic Fibre Textiles." It claimed 158 uni~. The most number of units (70) employed between 20 to 49 persons. Another 44 units were in the employment size group of 10-19 persons.
In the category of unregistered workshops, major groups that accounted for all the 1,000 units were quite a few in number, both in the rural and the urban areas. Details regarding them may be seen in the concerned subsidiary table printed at the end of this report.
BlKANER CITY
The number of registered factories was 36 while that of unregistered workshops, 964-. Ralf the number of registered factories employed between 10-19 persons while another 8 were ill the employment size group of 20-49 persona. In the unregistered workshops, 425 units were in the employment size group of 2-4 persons while another 410 employed just 1 person each.
Major group 24 dealing with "Manufacture of Wool, Silk and Synthetic Fib>e Textiles" was responsible for the larger number f 333) of registered faotories. Most number of units (137) were in the employment size group of 20-49 persons. Another 97 units employed between 10 to 19 persons.
Major groups 22, 29, 33,35, 36, 37 and 38 a.ccounted for no registered factories and all the units were unregistered workshops.
CHURU
This district had 11 registered factories out of 1,000 units in the rural areas. The remaining 989 were unregistered. workshops. While all the registeredfactories were in the employment size group of 20-49 persons, most of the unregistered workshops (508) were one porson units and another 446 employed between 2 to 4 persons.
In the urban areas, the number of registered factories was 19 while those of unregistered workshops 981. 13 out of 19 registered factories employed between 10 to 19 persons eaoh. Most of the unregistered workshops (487) were in the employment size group of 2-4 persons and another 425 were one pe;rson units.
The major group that accounted for the largest number of registered factories (500) in the rural a.reas was 32 which dealt with "Manufa.cture of NonMetallic Mineral Products". All these units employed between 20 to 49 persons. Major group 24 dealing with "Manufacture of Wool, Bilk and Synthetic Fibre Textiles" accounted for the largest
38
Dumber of J:egistered factories (also 500) ~n the urban areas. Half of these units were in the employment size group of 10 to 19 persons and anothe r half employed between 20 to 49 persons each.
Quite a good numboI' of major groups in the rural and urban area.s were such which did not account for any registered factories. All units under them were umegister('d workshops.
JHUNJHUNUN
The rural areas of this district. had only 8 registered factories as against 992 unregistered workshops. Half of the registered factories employed between 10 to 19 persons each while another half 20 to 49 persons each. Most of the unregistered workshops (539) were one person units. Another 421 employed between 2 to 4 persons each.
The urban areas had comparatively larger numbe-r of registered factories (21). The remaining 979 were unregistered workshops. Out of the total registered factories, 18 employed between 10 to 19 persons each. Among the unregistered workshops, 460 were in the employment size group of 2 to 4 persons while another 457 were one person units.
The major group <that was responsible for the largest number of registered factories (97) in the rural areas was 23 which dealt with ~'Manufacture of Cotton Textiles". Most of the units out of it (65) were in the employment size group of 10-19 persons. Major group 24 dea.ling with ''Manufacture of Wool. Silk and Synthetic Fibre Textiles" had cent per cent units as registered factories. All these units employed between 10 to 19 persons each.
Many of the major groups both in the rural and urban areas had only unregistered 'WOl'kshops and no registered factories.
ALWAR
This district ha.d only 6 registered factories in its rural areas as against 994 unregistered workshops. Half of the registered factories employed between 10 to 19 persons each and anothEr half 20 to 49 persons. Out of the unregistered: workshops, 555 were one person units and another 419 in the employment size group of 2 to 4 persons.
In the urban areas, the number of registered factories was 22 while those of unregistered workshops 978. 13 of the registered factories employed between 20 to 49 persons each. 525 unregistered workshops employed between 2 to 4 persons each and another 384 were one person units.
The major group tha.t accounted for the largest number of registered factories {106} in the rttral areas was 32 which dealt with "Man...ufacture of No~-Metani(}Mineral Prod.ucts." M.ost of the units (59) were.in the employment size group of 20 to 49 persoIlS.
This major gJ;oup was also responsible for the highest n'pmber of registered factories (120) in the urban areas. One third of the unitS were in the employm~t size g_roup of 10 to 19 persons, another one third in the etnployment size group of 20 to 49 persons and. the remaining one third had unspecified number of persons.
The number of ma.jor groups whioh did not account for any registered factory but had all the units as unregistered workshops in the rural and urban area!;! Was quite large in this district.
BHARATPUR
The rural areas of this district had 17 registered factories as against 983 registered workshops. Employment size group of 10 to 19 persons claimed largest number of registered factories {IO}. The largest number of unregistered workshops (504) was claimed by employment size group of 2 to 4 persons. Another 458 unregistered workshops were one person units.
In the urban areas, the number of registered factories was 18; 7 being in th6 employment size group of 20 to 49 persons and another 6 in 10 to 19 persons. Out of the total number of 982 unregistered workshops, 505 employed between 2 to 4 persons each a.nd another 416 one person each.
Major group 22 dealing with "Manufacture of Beverages, Tobacco and Tobacco Products" accountel! for cent per cent registered fa.ctories in th e rural areas. All these units employed between 10 to 19 persons each. in the urban areas, maj or gToup 36 dealing with "Manufacture of Electrical Machinery Apparatus, Appliances and Supplies and Parts" accounted for the highest number of registered factories (250), all of which <'mployed be.tween 50 to 99 persons.
Major group 26, 28, 35, and 37 did not account for any registered factory in the rural and urban areas. Cent per cent units under them were unregistered workshops.
SA WAI MADHOPUR
While the rural a.reas of this district had 9 registered factoties out of 1,000 industrial establishments, the urban areas had 31. The number of unregistered ~orkshops being 991 a.nd 969 respectively. Most of the rep;istered factories (5) in the rural areas
employed between 20 to 4-9 persons ea.ch while most of the unregistered workshops (547) were one p~rson units. In the urba.n areas 12 units employed between 10 to 19 persons each while another 10 between 20 to 49 persons each. Most of the unregistered workshops (472) employed between 2 to 4 persons eaoh.
Major group 28 dealing with "Manufacture of Paper and Paper Products aud Printing, Publishing and Allied Industries" accounted for cent per cent units a.s registered factorics in the rural areas. All these units employed between 10 to 19 persons ea.ch. In the urban areas major group 22 dea.ling with "Manufacture of Beverages, Tobacco and Tobacco Products" accounted for the largest number (455) of registered. factories. Most number of units (273) employed between 20 to 49 persons each.
Major groups 31, 33, 34, 35 and 37 had all the industrial units a.'I unregistered workshops in the rural and urban areas.
JAIPUR
The number of registered factories in the rural arOlLS of this dishrict wa.s 10. Out oI this, 6 employed between 20 to 49 parsons each. 514 out of 990 unregistererl, workshops were one person units. The number of registered fa.ctories in the urban areas worked out to 32 while those of umogistered workshops to 968. Although most of the registered faotories (16) were in the omployment size group of 10 to 19 persons. There wore 2 units in the employment size gFouP of 100 to 299 persons; one each in 300 to 499 persons and 500 + persons. It would thus be seen that bigger units provide larger employment than the small sized ones in the aggregate. Most of the unregistered workshops (521) were in the employment sjze group of 2 to 4 persons.
Major group 31 dealing with "Ma.nufacture of Chemicals and Chemical Products (except products of Petroleum and Coal)" accounted for the largest number of registered factories (143) in the rural areas. 95 of them employed between 10 to 19 persons each and the remaining 48 between 20 to 49 persons each. Major group 33 dealing with "Basio Metal and Alloy Industries" wa.s responsible for the largest number (448) of registered. factories in the urban areas. Most of the units (241) employed between 20 to 49 persons each while another 138 between 10 to 19 persons each.
While ccnt per cent units as unregistered workshops in the rura.l areas were found under major group3 20-21, 24 j 28, 30, 33, 34,35.36,37 and. 39,
major group 25 only had such a. monopoly in the urban areas. 'Majority of the units in both the areas were either dne person units or employed between 2 to 4 persons each.
JAlPUR CITY
40
The city had proportionately larger nllmber of registered factories than the urban a.reas of this district. The number being 34. Half of this number employed between 10 to 19 persons each while another 11 between 20 to 49 persons each. One unit each employed. between 300 to 499 persons and 500+ persons.
Out of the 966 unregistered workshops, 527 employed between 2 to 4 persons each.
Although major group 33 dealing with "Basic Metal and Alloys Industries It accounted for the largest number of registered factories (429). major group 36 dealing with "Manufacture of Eleotrica.l Machinery, Apparatus, Appliance and Supplies and Parts" was more signHicant from the point of view of providing employment. 56 UJrits out of 333 employed 500+ persons.
Major group 29 dealing with "Ma.nufacture of Leather and Leather and Fur Products (except Repair) was responsible for the highest number of unregistered workshops; cent per cent units falling in this categor:r.
SIKAR
This district had only 4 registered factories out of 1,000 industrial units in the rural areas. The remaining 996 were unregistered workshops. 2 out of the 4 registered factories employed between 20 to 49 persons each. 527 unregistered workshops were one persQD units while another 441 employed between 2 to 4- persons each.
r n the urban areas, the number of registered factories was 6 and those of unregistered workshops 994. 4 out of the 6 registered factories employed between 10 to 19 persons each. 493 unregistered workshops employed between 2 to 4-persons each while another 452 ware one person units.
Major group 24 dealing with "Manufacture or Wool, Silk and Synthetic Fibre Textiles" had the largest number ot registered factories (200) 8011 of which employed between 20 to 49 persons each. Major group 22 dealing with "Ma.nufacture of Beverages, Tobacco and Tobacco Produots~' accounted for the large.~t .m.umber of registered factories (100) in tbe urban areas, all of whioh employed .etween 20 to 49 persons each.
'Most of the industrial units in this district were unregistered workshops as majority ofmajor groups both in the rural and urban a.reas had no registered factories.
AJMER
Bath the rural and the Uo ban areas of this district seemed to abound in the regi,stered factories in comparison to other districts.' The runl a~eas had 27 rsgistered factories and tbe Ul ban areas 52. While 11 registeredfa.ctorieF in the rural areas employed between :!o to 49 paiSOn.; each, another 10 Were in the employment size group of 10 to 19 persons. Similarly 23 registered factor:es employed 10 to 19 perSons eaoh and the same number 20 to 49 persons each in the urban areas.
Out of the 975 unregistered workshops in the rural areas, 605 were one person units and another 431 employed between 2 to 4 persons each. The urban areas had 948 unregistered workshops. 453 employed between 2 to 4 persons each a.nd another 401 just one person each.
The major group tha.t was r('sponsible for the largest number of registered factories (667) in the rural areas was 36 which dealt with "Manufacture of Electrical Machinery, Apparatus, Appliances a.nd Supplies and Parts". Half of the units were in the employment size group of 20 to 49 and another half in 100 to 299 persons.
Major group 37 dealing with "Manufacture of Transport Equipment and Parts" accounted for the largest number of registered factories (600) in the urban areas. While 400 out of it employed between 10 to 19 persons each, the remaining 20u were in the employment size group of 20 to 49 persons.
The proportion of major groups having all the units as unregistered workshops was larger in the rural areas of this district.
AJMER CITY
The number of registered factories in this city w~ 27 as against 973 unregist-ered workskops. 14 of the registered factories employed. between 10 to 19 persons each and a.nother 10 between 20 to 49 persons each. Out of 973 unregistered work!ahops; 476 were in the employment size group of 2 to 4 persons while 397 were one person units.
Major group 37 dealing with "Manufaoture of Transport Equipment and Parts" accounted for the largest number (600) of registered factories. Two tbirds of them employed between 10 to 19 persons each while another one third, between 20 to 49 persons each.
g&jor groups 27, 29; 35 alld.36 had all the industrial units as unregistered workshops in the rural and the urban areas.
TONK
This distriet had 12 units out of 1,000 as regil'ltered factories and 988 unregistered workshops in the rural areas. This number for the urban areas ~orked out to 15 and 985 respectively.
9 out of 12 registered factories in the rural areas employed between 20 to 49 persons each and ilO out of 15 in the urban also this number. Similarly 584 unregistered workshops in the rural areas were one person units and another 388 employed between 2 to 4 persons each. In the urban areas, 542 Ullre-gistered workshops employ~ only one perBon while 405, between 2 to 4 persoDs each.
Major group 32 dealing with "Manufac~~ of Non-Metallic Mineral Products" accounted for t"he la.:rges~ number (86) of r~gistered factories in the rural 8r.eas. Most, of the units (67) employed between 20 to 49 persons each.
In the urban areas, major group 22 dealing ",ith "Manufacture .of Beverages, Tobacco and Tobacco Products" accounted for most number of registered factories (267). 233 out of it employed between 20 to·49 pereons each.
Tber,e were a. good number of major groups which had all tho units as unregistered worksh~ps in the rural and urban areas.
.T A.IB.A.LMER
The rural areas of this district seemed to abound in registered factories in relation to their numbsr in tbe urban areas. The number was 67 and 9 respectively. Of the total registered. fa.ctories in the rura.l areas, 45 of them employed between 20 to 49 persons each. 5 out of 9 registered factories in the urban areas employed between 50 to 99 persons each.
Out of the 933 unregistered workshops in the rural areas, 472 were 1 person units and another 371 employed between 2 to 4 persons each. Similarly, out of 991 u~egistered workshops in the urban areas, 472 were 1 person units and a. similar n:llmbel: employed betwoon 2 to 4: persons ea.eh.
For the highest number of registered factories in the rural areas,. major group 32 dealing with "Manufacture of Non-Metallio Mineral PrOOucts" accounted for half the number of units. Out of this total, one half employed between 10 to 19 persons each and another half between 20 to '9 persons each.
X/B(D)lRGI-4
. 41
._ , Major group 24 dealing with "M&nnlactu.re of
Wool, Silk and Synthetic Fibre Textiles" accounted for the largt?st number (333) of registered factories in the urban areas . .All these units were in the employment size group of 20 to 49 persons.
With the e;xoeption of few major groups, two of which have also been mentioned above. most of the others had no registered factories in the rural Ol"
urban areas. All units were unregistered workshops.
.JODHPUR
In this district also, the number of registered factories in the rural areas was greater than that in the urban. It being 56 and 39 respectively. Most of the units (32) in the rllral areas and (14:) in the urban employed between 10 to 19 persons each.
Most number of unregistered workshops (527 out of 944) in the rural areas and (439 out of 970) in the urban areas were one person units.
Major group 28 dealing with "Ma.nufa.cture of Paper and Paper Products and Printing, Publishing and Allied. Industries" had all the industrial uni ts as registered. factories in ~e rural areas. .All ef'them employed between 10 to 19 persons each.
In the urban areas, major group 33 dealing with ·'BasicMetala.ndAlloys Industries" was responsible for the largest number of registered factories (429). 286 out of it employed between 2() to 49 perSODS each.
Major groups 24 and 25 had all the industrial units as unregistered workshops both in the :rural and the urban areas.
JODHPUR CITY
There were 31 registered factories and 969 UD.
registered workshops in this city. 13 out of 31 registered factories in this city employed betweeJl 10 to 19 persons each. The number of unregistlerea workshops employing only o:ne person and 2 to 4: persons was almost equal. It being 429 and 427 respectively.
Major group 33 dealing with "Basic Metal and .Alloys Industries" accounted for the largest num~ ber of registered factories (462).308 out. of it employed between 20 to. 49 persons each.
Major groups 24, 25, 32 and 36 had all the indU'JmaI units as unregistered workshop8.
NAGAUR
This district had 22 registered factories out of 1,000 industrial units in the mral areu. The
remaining 978 ~ing uQ,registered workshops. SimilarJ~ tbe urb~ areas had 28 registered factories ap.<1 972 unregistered worlmhops.
Most of the registered factories in the rura.J and urban areas (10 & 15 respectively) were in the emplo~ent size group' of 10 to 19 persons w hioh was the sm.a.llest grpup among this category. 8ip:rllarly, most 1JIlregistered workshops in both areas (569 & 4'72 respectively) also belonged to the -smallest employment size group viz one person only in that category.
The major group that was responsible for the I.a.rgest number of registered factories in the rural areas (235) was 32 which dealt with the "Manufacture of Non-Metallic Mineral Produots" 118 wiits 'out of it employ~d between 10 to 19 persons each.
In the urban areas, major group 83 dealing with 'Basio Metal and Alloys Industries" accounted
f or tho largeRt number of registered factories (333). A,ll these units were in th,e employtneD:t siz~ ~eup of 20 t~ 49 peJ:SODS.
Quite a large number of major groups were responsible for having all the industrial units as UlLregistered workshops both in the rural and the urban areas.
PALl
The rural areas of this district had 24 registered factories. and 976 u~egistered worklshops while this number in tho urba.n are;:tB wo:.;ked .out te 28 and 97i respectively. •
Out of the 24 registered factories in the r1g801 areas, half of them employed between 20 to 49 persons oa.oh. 18 out of 28 registered faotories in the urba.n areas belonged to the employment size group of 10 to 19 persons while anoths:D 8 to 20 to 49 pm:sons.
In the qategory. of unregistered.. W'o~kshops, 553 out of 976 in the rura.l areas were one, person units and 456 out of 972 in the urban areas also belonged to this group.
Major group 33 dealing with "Basio Metal- and Alloys Industries" was responsible for tho largest number of registered factories (500) in the rural areas. All these units employed between 10 to 19 perso~ ea.oh.
In the urban areas, major group 28 dealing with 'Manufacture of Cotton Textiles" &o<>.ounted for most number of registered. factories (~86). 155 out of. it were in the employment size group of io to 19 persons.
Quite 80 good number ot major groups botH. m. the rural and urban areas did not have any fagistered factories; all units being unregistered workshops.
BARMEB
While the rural areas had 16 registered. factories out of 1,000 industrial units, the urblloll areas liad 40. Most of the registered factories in the mral'a.reas (12) eIp.ployed between 20 to 49 peraons each. l.n the urban areas, 33 out of 40 registered factories were in the employment size group of 10 to 19 persons.
580 out of 984 unregistered workshops in the rural areas were one person unite, but in the urba.n areas .. roost unite (495 out of 960) employed. bet:.. ween 2 to 4 persODS each.
Major group 31 dealing with nHanu.footllre of Chemicals and Chemical Products (exooptProducte Qf P-etr.ulll) aooolUlted fpI the largest number of registered. factories (667). !l1 these units eml)loyed between 20 to 49 persons each.
Tbe distinction of having the largest numbsr of registered factories in the urban areas went to major group 24 dealing with "Manufacture of Wool, Bilk and Synthetic Filire Textiles" and, 28 dealw,g with '''M.anufacture of Paper and Paper Products and Printing, ~WishiD.g and Allied In~ dustrie9" which had 333 units each. All the 'O.Doits in both major groups employed between 10 to 19 persons each.
A good number of maj.or groups. m the mrd and 'tUh'an areas could not oontribut& to the eaftego~ of registered factories .. AllllDlts being \1Dregistered workshops.
JAL_OR
The nwnber of registered factories and unregistered workshops in the rural areas of this district was 'I and' 993 respootively. Tli.is number for the orban &reM being 3 and 997 respectively.
5 out of 7 registered factories in lIhe rw:al areas employed between lOt to 19 persons each while all the 3 registered factories in the urban areas were in the emplo_ymeJ!t s.ize group ofl20·,to 49: persons. Similarly 681 UDreg1stered workshops out of.993 in the ~al 81"688 were olle person units. :But! ~e larger number of such unite (4178 out of 99f'_in the urban areas employed between·2 to 4:1 per80ns each. Another 4" units- were ODe person estab.L lishmentcJ.
rhe largest number of registered factories in the rural areas (250) was claimed by major group 35 dealing with "l\1a.nufacture of Machi ~ery, Machine Tools and Parts except Electrical'Maohinery". Tho eJnploymont size groups to which all these units belonged was 100 to 299 persons.
1\'Iajor group 32 dealing with "Manufacture of Non-Metallic Mineral Products" accounted for the largest number of rp.gistered factories (111) m the urban areas.:All these units employed between 20 to 49 persons ~h.
Except for the two major groups mentioned above and a few more, the others drew a complete blank: in respect of registered. factories. All units under them being unregistered workshops.
SIRom
This district had only 8 registered factories in the rural areas, equally divided in the employmen.t size group of 10 to 19 persons and 20 to 49 persons. The urban areas had 17 registered factories. 9 out of them employed between 10 to 19 persons each.
Out of the 992 unre~istcred workshops in the rural areas, 577 were one person u'1its. In the urban areas 1504 out of 983 unregistered workshops employed between 2 to 4 persona each.
Major group 32 dealing with ''Manufacture of Non-Metallic :Mineral Products" was Tesponsible for the highest number of registered factories both in the rural and urban areas. The number being 42 and 286 respectively. While registered factories in the rural areas were equally distributed in the employment size groups of 10 to 19 and 20 to 49 persons, most of such units (143) in the urban areas employed between 50 to 99 persons each.
The number of major groups that had all the units as unregistered workshops was quite large in this district also.
BHILWARA
. From the number of registered factories both In the rural and urban areas of this district, it can be gathered that it is comparatively advanced in respect of industrialization. The number of suoh units in the rural and urban areas worked out to 26 and 39 respectively. Halfthe number of registered factories in the rural areas employed between 20 to 49 persons each. Similarly 17 out of 39 establishments in the urban areas also belonged to this employment size group.
43
Of the 974 unregistered workshops in the rural areas, 613 were one person units and another 423 em.ployed between 2 to 4 persons each. 464 units out of 961 in the urban areas belonged to the latter employment size group while 414 to the former.
Itlajor group 23 dealing with "'Manufacture of (Jotton Textiles" was responsible for the highest number of registered factories both in the urban and the rural a.reas. The exact num,ber of units was 316 and 341 respectively. 132 out of the formel' and 176 out of the latter units employed between 10 to 19 persons each. Another 24 units in the urban areas belonged to the employment size group of 5004- persons.
Quite a good number of major groups could not account for any registered factories. All units under them being unregistered workshops.
UDAIPUR
This distriot had greater number of registered factories in the rural areas than in the urban. The respective number being 27 and 23. In both the areas, the larger number (13 and 10 respectively) of registered factories employed between 10 to 19 persons each.
The larger number of unregistered workshops, 576 out of973 in theruralaredB and460 out of 977 in the urban, were one person units.
Major group 33 dealing with "Basic Metal and Alloys Industries" had the larger number of registered factories in the rural areas. All the units that were there in this major group were registered factories and were in the employment size gr. up of 100 to 299 pcrsoD.R.
Major group 37 dealing with "Manufacture of Transport Equipment and Parts" was responsible for the largest number of registered faotories (333) in the urban areas. All these UllitB employed between 10 to 19 persons each.
In the category of unregistered workshops, major groups 24, 26 and 35 had absolute monopoly both in the rural and the urban areas.
UDAIPUR CITY There were 29 registered factories and 971
unregistered workshops in this city. While 11 registered factories employed between 10 to 19 persons each, the other 6 were ~ ~he empl~Jlllent size group of 20 to 49 persons. Sunilarly, while .. 4'111 unregistered workshops were one person uniw, another 443 employed between 2 to 4 persons each.
, I From the ·point of view of number of units,
·m:lojor group 32 dealing with c'Manufacture of NonMetallic Minerdl Products" was prominent as it accounted for 250 registered factories; 75 employing betw"een 10 to 19 persons each and another 75, 50 to 99 persons each but from the point of view of employment, major group 23 dealing with "Manufacture of Cotton Textiles" was jmportant as 17 units out of 53 employed 500 + persons.
Major groups 24,26. 29, 35 and 36 were prominent in the category of unregistered workshops as all the units under them were unregistered workshops. .All the units in major group 36 employed between 5 to 9 persons each.
e;S:ITTAURG kR;H
The number of registered factories in the rural areas was 14 while the urban areas had 11. Employment size groups of 10 to 19 and 20 to 49 persons accounted for 6 registered factories each in the rural areas. In the urban areas, 5 units were in the former employment size group whlie 4 belonged to the latter.
Most number of unregistered workshops (529 out of 986 in the rural areas and 509 out of 989 in the urban) were one person units.
Major group 28 dealing with "Manufacture of Paper and Paper Products and Printing, Publishing and Allied Industries" had all the units under it as registered factories. All these units employed between 20 to 49 persons each.
Major group 23 dealing with crManufacture of Cotton Textiles" accounted for the largest number of registered factories in the urban areas. Most of the units were evenly dispersed in the employment size groups of 10 to 19, 20 to 49 and 50 to 99 persons. The number being 31. 32 and 32 respooti vely.
In the category of unregistered workshops, quite a good number of major groups bad all the, units as such both in the rural and urban areas. In other words they did not account for any registered factori es. '
DUNGARPUR
The number of registered factories in the rural areas was many times larger than that in the urban. It being 41 and 3 respectively. While all the units in the rural areas employed between 10 to 19 persons each, in the urban, they belonged to the employment size group of 20 to 49 persons.
Out of the 959 unregistered workshops' in the rural areas, 573 were one person units while another 373 employed between 2 to 4 persons each. In the urban areas, while most of the units, 447 and 440 belonged to the above two employment size groups, 4 units were such which employed betV{een 10 to 19 persons each.
Major group 35 dealing with "Manufacture of Machinery, Machine Tools and Parts exoept Electrical Machinery" had the largest number (250) of registered faotories in the rural areas, All these units were in the employment size group of 10 to 19 persons.
In the urban areas, moat registered factories (143) were found in major~group 23 dealing with ., Manufacture of Cotton Textiles". They all employed between 20 to 49 persons each.
Since this district had hardly any industrial base, prominenoe of majority of major groups in the rural and the urban areas was only in the field of unregistered workshops.
BANSW.A.RA
The rural and the urban areas of this district had the same number (18 each) of registered fact tories. In the former, 13 units were in the ~ployment size group of 20 to 49 persons while another 5 employed between 50 to 99 persons each. In the latter the above employment size groups accounted for 5 and 3 units respectively, while another 10 belonged to the employment size group of 10.to 19 persons.
Most of the unregistered workshops in the rural and the urb::m areas (578 and 504 respeotively) employed between 2 to 4 persons each. 4 and 3 units respectively were in the employment size group of 10 to 19 persons.
Major group 23 dealing with '!Manufa.cture of Cotton Textiles" o.coounted for the largest number (600) of registered factories in the rural areas. 400 of them employed between 20 to 49 persons each while the remaining 200 were in tho employment size group of 50 to 99 persons.
Major group 29 dealing with "ManufactUre of Leather and Leather & Fur Products (except Repair) was responsible for the largest number (250) of registered factories in the urba.n areas. All of them employed between 10 to 19 persons each.
The economy of this district was also akin to that of the neighbouring district Dungarpur and as such majority of major groups both in the rtll'al and the urban areas abounded in unregistered workshops.
BUNDI
The roral areas of this distriot had 53 registered factories as against 16 in the urban.,29 of the registered factories in the rural a.reas employed between 20 to 49 persons each. Another (; units were such which engaged between 100 to 299 persons eaoh. In thc urban areas 5 units were in the employttlent size group of 20 to 49 persons, and another 4 in 50 to 99 persons. One 'Unit was such whioh· employed between 300 to 499 persons.
, I
Out of the 947 unregistered workshops in t4e rural areas, 497 were one person units and another 434 employed between 2 to 4 persons each. In the urban areas out of 984 unregistered workshops 560 belonged to the former employment group while another 388 to the latter.
Major group 39 dealing with "Repair" had the largest number of registered factories (81) in the rural areas. 61 ofthem employed between 10 to 19 persons each while the remaining 20 were in the employment size group of 20 to 49 persons.
In the urban areas, major group 37 dealing with "Manufacture of Transport Equipment and Parts" was responsible for the largest number (500) of registered factories. All these units employed between 20 to 49 persons each.
This district also had a good number of major groups in which all the units were unregistered workshops both in the rural and the urban areas.
KOTA
The urban areas of this district had more than twice the number of registered factories than those in the rural. The respective number being 33 and 16. Employment size groups of 10 to 19 and 20 to 49 persons accounted for 7 and 6 units respectively in the.rural areas. In urban areas, they had 13 and II umts respectively. 3 units each also in the urban areas were claimed by employment size groups of 50 to 99, 100 to 299 and 500 + persons.
Qut of the 984 unregistered workshops in the rural areas, 553 were one person units and 405 employed between 2 to 4- persons each. Another 4 employed between 10 to 19 persons each. In the urban areas, out of 967 unregistered workshops, the number for the above employment size groups was 467,420 and 11 respectively.
Major group 36 dealing with "Manufacture of Elect~cal Machinery, Apparatus, Appliances, and Supplies and Parts", had all the units under it as registered factories. All these units employed between 100 to 299 persons each. This phenomenon was "present in major group 24: dealing with
"Manufacture of Wool, Silk and Synthetic Fibre Textiles" in the urban areas. Here half the number employed between 100 to 299 persons ea.ch while in another half the number of persons could not be ascertained.
In the oategory of unregistered workshops, major group 29 dealing with '~"Manufacture of Leather ahd Leather & Fur Products (except Repair)" accounted. for the absolute number of units in the rural and the urban areas.
KOTA CITY
There were 35 registered factories and 965 unregistered workshops in this city. This city is coming up very fast from the point of view of industrialization and it would be no wonder if one day it is regarded as a nerve centre of industry in the State. This faot is supported by the distribution of registered factories into different employment size groups. While larger number of units lie in the smaller employment groups, there were 3 units in the employment size group of 100 to .299 persons, 1 in 300 to 499 persons and 4 in 500+ persons.
Out of the 965 unregistered workshops, the largest number of units no doubt belonged to smaller employment size groups, but there were 56 units which employed between..5 to 9 persons and another 8 between 10 to 19 persons.
Major group 24 dealing with "Manufacture of Wool, Silk and Synthetic Fibre Textiles" held prominent place as all the units under it were registered factories pointing to the .large seale nature of the industry. Half of the units employed between 100 to 299 persons each while another half 500+ persons each. With this distribution, this major group assumes further importance so far as 18.fge scale nature of this industry was 9Oncemed.
Another major group whioh played dominant part in the industrial field was 36 dealing with "Manufacture of Electrical Machinery, Apparatus, Appliances and Supplies and Parts". Out of the 750 registered factories under it 2/3 were in the employment size group of 50 to 99 ~:rsons and the remaining 1/3 in 500+ persons.
In the field of unregistered workshops, the moet dominant place W8.8 held by ma.jor group 29 dealing with "Manufacture of Leather and Leather & Fur Products (except Repair). In this category all the units belonged to this major group.
.THALAWAR
The rural ar~ of this district had 8 registered factories as agains1i 17 in the urban, leaving gg2 and 983 units as umegiat.ered workshops.
Most of the registered factories both in the rural and the urban_areas (4 and 12 respectively) employ-ed between 10 to 19 persoIlB each. Similarly most of the unregistered workshops in both the areas (615 and 505 respectively) were one person units.
Major group 22 dealing with "Manufacture of Beverages, Toba.ooo e.nd Tobaooo Products" claimed largest number (250) of registered factories in the rural areas. All the units were in the employment size group of 20 to 49 persons.
In the urban areas, major group 23 dealing with "Manufacture of Cotton Textiles" was responsible for the largest number (167) of registered factories. While 67 units out of it employed between 10 to 19 persons each, another 33 units were in the employment size group of 50<4- persons. One need not gej; alarmed by this number in such a big employment size group in a district like Jhalawar which has hardly any standing as an industrial town. It is just proportion of the absolute number which Ur. l'Ounded off to 1,000 for the purposes of present tation.
Quite a large number of major groups had all the units under them as unregistered workshops both in the rural and the urban areas.
T.vPes of Powe:r or Fuel used
As some kind of fuel or power is needed for productive economic activity, it has been broadly divided into two groups; (1) All fuels and power .eomprising of (a) electricity, (b) liquid fuel, (c) coal, wood and bagQsse, (d) other power and (2) ManuaL The information contained on this subject is based on the figures picked up from table E-II Part B ~d its au bsidiary E-II Part B.I.
Of the total number of units in Division 2 and 3 of the NIC, 45· 29% were run by all fuels and power and 54· 71 % by manual power. Out of the former, ~l· 67% were run by coal, wood and bagasse and ~other 16·44% by electricity.
In the rural areas which had 36· 57% units, 20·85% were run by manual power while the remaining 15· 72% by all fuels and power. Within the latter, coal, wood and bagasse accounted for 6-·49% while another 5-54-% were accounted for by liquid fuel. The share of electric power was 8'06%.
Conforming to the pattern in rural areas the percentage of units using manual power' was greater in urban areas also. It was 33· 86~ as against 29·57% in all fuels and power. WithinOthe latter, coa.!-, wood and baga.sse accounted for fS'18% unIts While electricity, 13' 38%.
46
As stated above 16'44% units out of the total in the State used electricity as source of power. The distribution pattern of this percentage in the districts revealed that Jaipur with 2'98% occu, pied the top place. Ajmer with 1· 66% came next. J" aisalmer had as low a percentage as 0·03_
Again coal, wood and bagasse as source of power was used by 21· 67% units as stated earlier. Within the districts Jaipur with 3·09% units using this source of power stood at the top with Ajmer coming next, with 1· 57%. J aisalmer had the lowest percentage (0'09) of such units.
Of the 54· 71 % units using manual power in the State, Jaipur again had the highest percentage (8·78) among the districts. Ajmer with 4·32% came next. The lowest percentage of 0·27 was again found in J aisalmer.
We had earlier seen that coal, wood and bagasse and liquid fuel were in prominence in the rural areas with 6·49% and 5·54% units respectively. The distribution of the former fu the rural areas of the districts revealed that J aipur and Sawai Madhopur with percentage of 0·73 and 0-45 respectivelyoccupied the first two places. Jaisalmer had as Iowa percentage as 0·01. Out of the percentage units in the latter case, Ganganagar with 0·52 per cent units topped while Jaipur with o· 39% came next. Bikaner and J aisalmer were at the bottom with a percentage of 0·02 each.
Of the 20·86% un ita run on manual power in the rural areas of the State, the highest percentage of 2·99 was found in the rural areas of J aipur district. Alwar with 1· 68% came next. The lowest percentage of 0·09 was found in Jaisalmer.
In the urban areas, we had seen that coal, wood and bagasse and electricity were more prominent as source of power. Their respective percentage were 15· 18 and 13·38. The distribution pattern of the former in the districts revealed that J"aipur with a percentage of 2·36 occupied the top place while Ajmer with a percentage of 1·35 came next. Barmer with a percentage 0·07 was at the bottom. A similar pattern for the latter showed J aipur occupying the top place with a percentage of2·64. Ajmer with 1·60% came next. J"aisalmer had the lowest percentage of 0·03 units.
Out of the 33'86% units using manual power in the urban areas, Jaipur with 5-79% and Ajmer with 3· 31 % units occupied the first two places. J"aisalmer with 0·18% was at the bottom.
The following table shows percentage distribution of establishments according to fuel/power and manual used in the rural and the urban areas of the State and districts:-
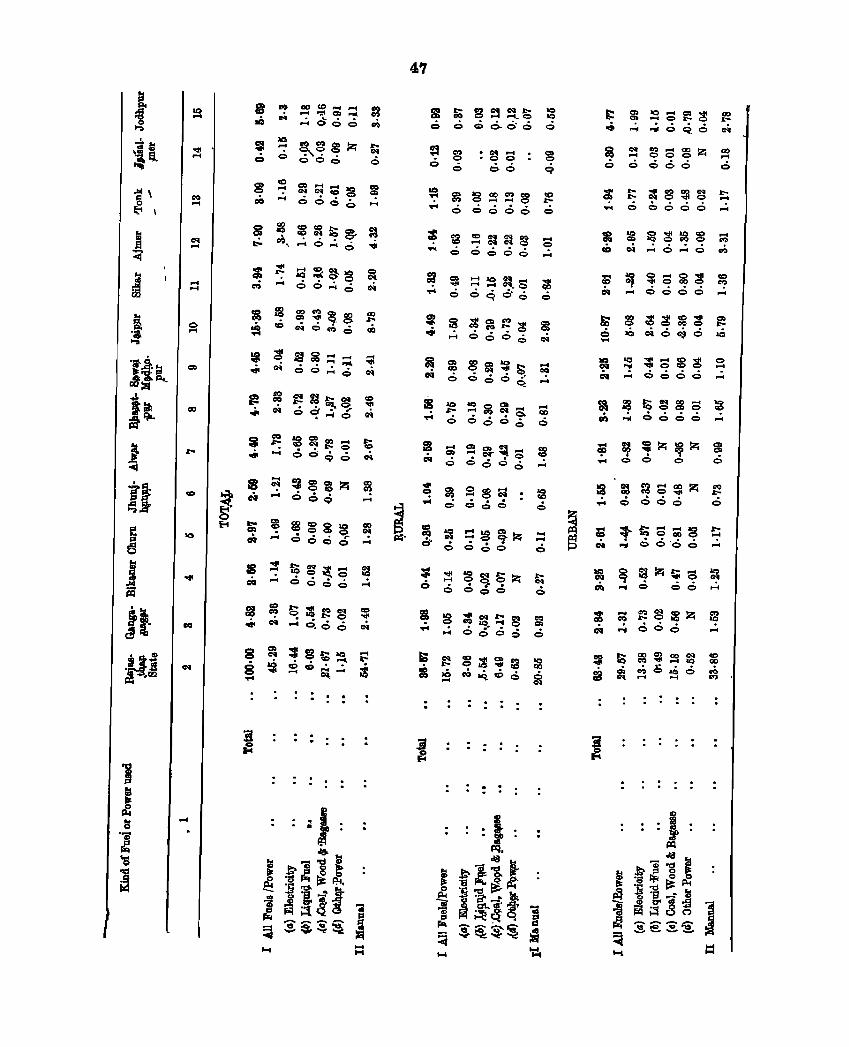
-a-i.;; li~ j;1; i3'1lL
f ~
*5-~J
j ~
11· ft!
cq .....
..... .....
o ....
GO
...
g~~~S~gg 0:0..:.006 0 .....
: ~ S::~:g ~ Pi .... o 6..:. c:,; ~
~ ~ ~ ~ ~ eN 0":' 6 .x,
.fd~:::= ; .. cq 00':'0 cq
~ ~ ~ g ~ Q 0 Q 0" ....
~~~C:: ~ 00 Q 0 ..:.
. . . .
4'7
s= ~ S~~~ :g o 0 Q 0.. 0- 6 0
• cq .... • C? C?
0- 0
~~~~~sre .... 0 0000 0
= &3 ~~~~ c:: .... 06 0 0 0..:,
~ $ ~~~~ ~ ... ..:, 0006 cq
~g:~s ii;l c)6Q~ ...:.
iI S ~gf~.S ~ cqc:,;oQ 0 6":'
"'0 ~ ~
.... 0 s::~~ ~ 000. = :::~~~ ::: 6 cO 6
s ~ ~~~~ ~ '" .:. 6e;oQ Q
:
. . . .
i:: ~ ~C::l?!~ ~ ...... ,;,oq.o eN
~ ~Sc::~Z ~ g 0600 0
~ ~ QllS~~ ~ ..... Q 0060 ...:.
~ ~ ~~~~ ;.! CD ~ ":'0":'0 ..;
§) :g ~;g:s;g ~ c. IQ ~o~o lI:I ....
~ ~ :;C::$~ s:: C\'I .... <:) <:) 0 0 ..:,
=~fO~~e:~ cQ .... 0000 ....
~ ~~ZiZ g .... 0 0 0 0
18 ~~S~Z ~ .:. 6 c:)oc:,; 0
~ ~t;s;;~ ~ CII1 .... 00'0';' ...
~ ~~Z~a ~ C\'I .... 0 .;,.;, ....
~ ;; ~~:gZ ~ ~ .... .:..;,.;, ....
: :
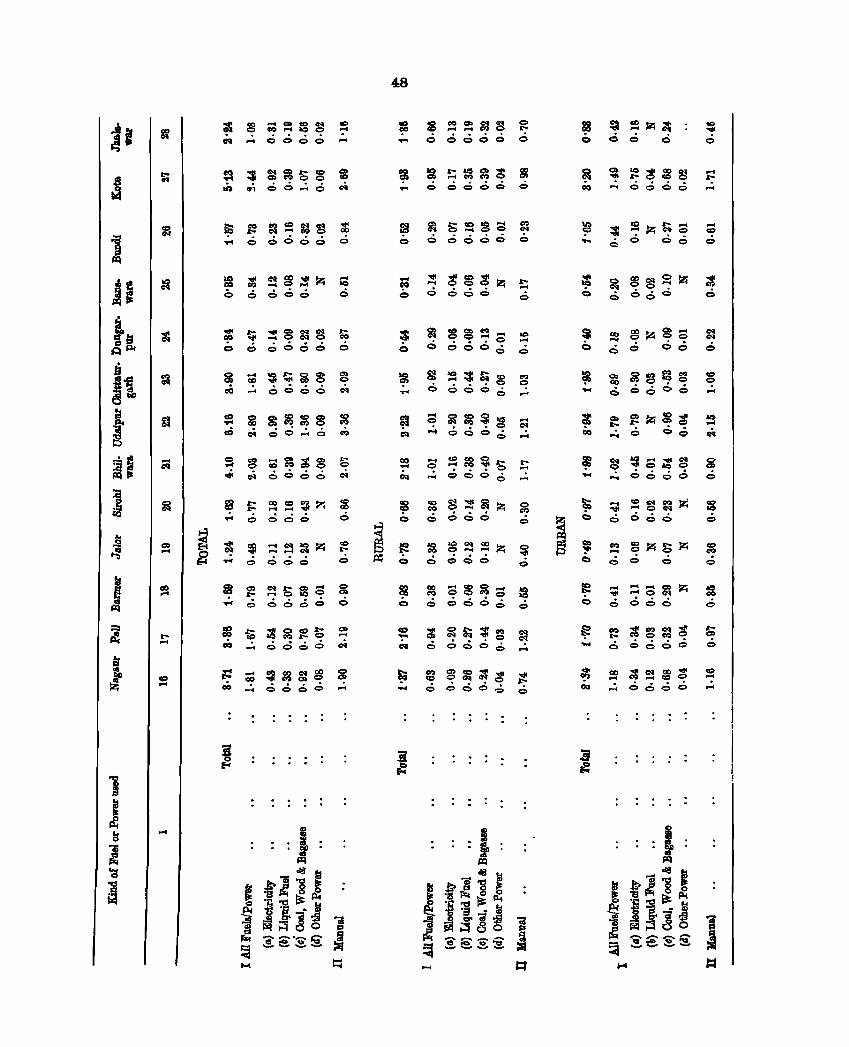
GO ...
I:"...
...
~ ~ C;~:8g ~ cq ... 0000 ...
= ~S:~S8 $ IQ 1:'1 0':''':' 0 ~
fj; f! a:t::: f3 S ~ .... 0 6066 6
~ ~ ~~~~ :;; I:) 6666 6
~ ~ ~~~~ ~ 0006600
8 ~ ~~~g g ca ..... 6666 COil
~ ~ g~~g ~ I'D COil 00":'6 ~
~ ~ a;gs~g ~ ..;. C'I 0000 COil
~:::~~ ~ 000 0
;::~~z ;.e 000 I:)
it Y! ~Sm8 g ..;.. 606660
~ ~ itgIeS ~ cQ ...:. 6066 c-1
~ ;:;; ~~8}~ ~ eo 6666-
. . . . . . . .
48
~ !3~8:~ ~ 6 6600 0
:g ~~~g Sl 6 6066 .:>
~ S~:g~ ~ 6 0666 0
~ g:!:~l2; g 6 666 00
~ ~~~l2; ~ o c:) 6 0
fJ g~~~ ~ 6 066.:,; I:)
-
~ ~ ~ ~ ~ 6666
~ ~ Z ~ 8 o 0 Q 6
~ gam s 6 66 6 6
s ~ 8.i2: g ... <6.6 6 6
:; ::: g ~ :z; Q 0.6 6
:; ::: 8 g IZ< .; .6.6 6
~ ~ s ~ ~ .; .6 6 6.6
~ ~ ~ ~ ~ ..:. 6.6 6.6
.... ....
-".. ....
.... co o
CCI I:)
..:.
g <6
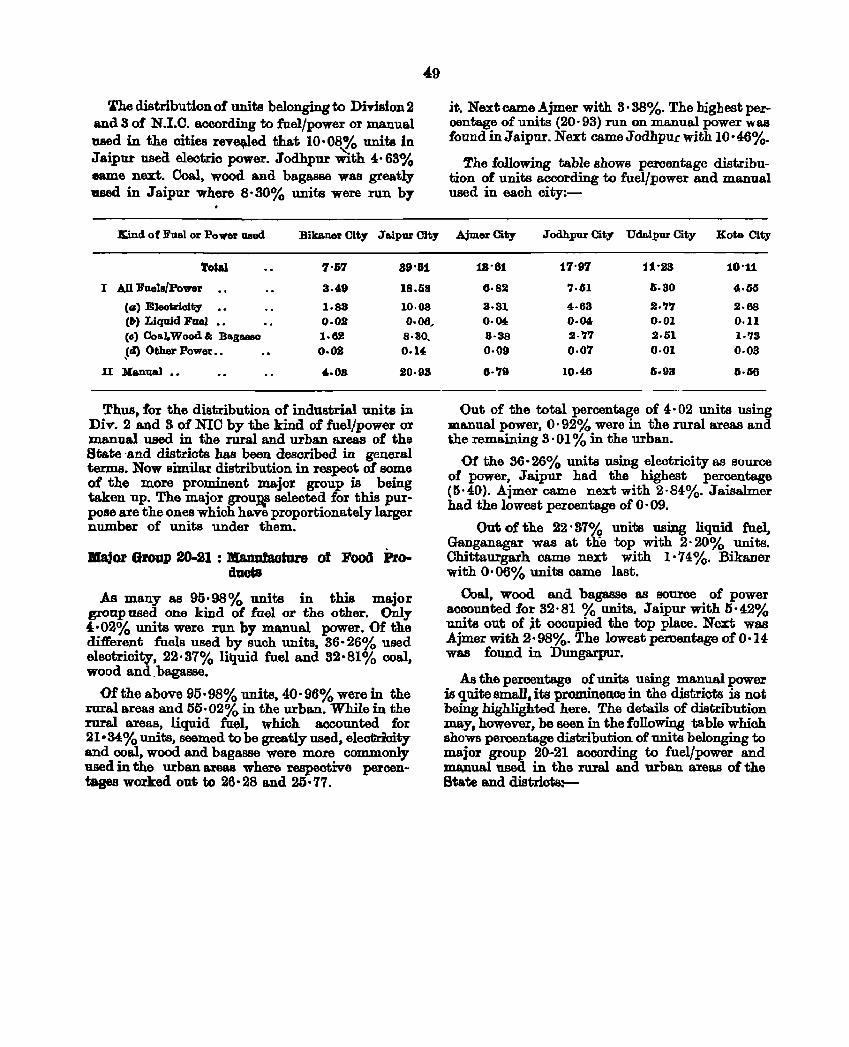
The distribution of unite belonging to Dlrislon 2 and 3 of N.I.C. according to fuel/power or manual used in the cities reTe~ed that 10'08% units in Jaipur usea electrio power. Jodhpur ~th 4,,63% eame next. Coal, wood and bagasse was greatly used in J aipur where 8·30% units were run by
49
Kind of Fool or Power used Bibner Cit,. Jaipur City
Tolal 7·67 89'B1
I All Fuels/PoWOl' .. 3.49 18.liB
(e) Eleotriolty .. 1.83 10·08 (&) Liquid hel •• 0.0.8 0.06, (Il) CoaI.Wood& Bagaase 1.62 8·80. _ell) Other Power .• 0.01 0.14.
II llanual ._ '·08 .20·93
Thus, for the distribution of industrial units in Div. 2 and S of NIC by the kind of fuel/power or manual used in the rural and urban areas of the State ·and distriots has been described in general terms. Now similar distribution in respect of some of the more prominent major group is being taken up. The major grou~s seleoted for this purpose are the ones which have proportionately larger number of units under them.
lIIajor Group 20-21 : JIanufaoture of Food Pr0-ducts
As many as 95·98 % units in this major group used one kind of fuel or the other. Only 4:·02% units were run by manual power. Of the different fuels used by such units, 36·26% used electricity, 22·37% liquid fuel and 32'81% coal, wood and. bagasse.
Of the above 95'98% units, 40'96% were in the rural areas and 55·02% in the urban. While in the rural areas, liquid fuel, whioh a.coounted for 21.34% units, seemed to be greatly used, electricity and coal, wood and bagasse were more commonly 1lSed in the urban areas where respective percentages worked out to 26·28 and 25·77.
ii. Next came Ajmer with s· 38%. The highest percentage of units (20·93) run on manual power W8.8
found in Jaipur. Next came Jodhpur with 10·46%.
The following table shows pel'Oentage distribution of units according to fuel/power and manual used in each city:-
AjmerCity Jodhpur City Udo.ipur City Kota City
18'61 17'97 :11'23 10'11
6·82 7·1H G·30 '.05 3·81 4·63 2. '1'1 2.68 0·04: 0·04: 0·01 0.11 3·38 2·'1'1 2.61 1·'13 0·09 0·07 0·01 0·03
.,. '19 10·46 G·93 6·66
Out of the total percentage of 4·02 units using manual power, O· 92% were in the rural areas and the remaining 3· 01 % in the urban.
Of the 36·26% units using electricity as source of power, Jaipur had the highest percentage (5·40). Ajmer came next with 2·84%. Jaisalmer had the lowest percentage of 0·09.
Out of the 22' 37% units using liquid fuel, Ganganagar was at tlie top with 2· 20% units. Chittaurgarh came next with 1'74%. Bikaner with 0'06% units came last.
Coal, wood and bagasse as source of power accounted for 32·81 % units. Jaipur with 5'42% units out of .it occupied the top place. Next was .A.jmer with 2·98%. The lowest percentage of 0·14 was found in Dungarpur.
As the percentage of units using manual power is quite small. its prominenoe in the districts is not being highlighted here. The details of distribution may, however, be seen in the following table which shows percentage distribution of units belonging to major group 20-21 according to fuel/power and manual used in the rural and urban areas of the State and distriots2-
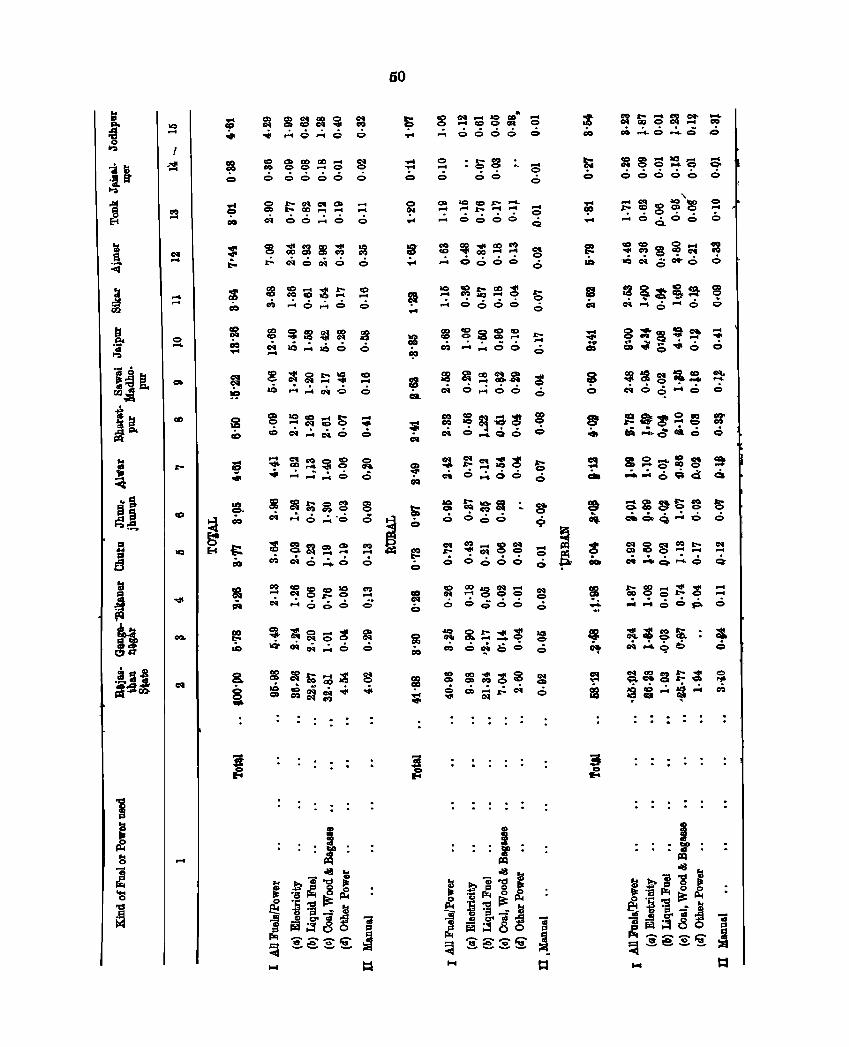
>Q ....
..... ....
....
~ ~~~s ~ o 0066 6
~f:~~~ ::: c<. 66..:.6 6
~ :::~~~ ~ .;. c:<.6c<.6 0
~ ~~~~ ~ cQ "':'6..:.6 6
~ ~f8~~ f8 ~ .0"':'106 6
~ Q!l~~~ <0 .... aQ ..:...:. eN 0 6
~ !S~~S ; - c<.":'c<.6 6
~ ~ ~~:8 R ~ ...:.,..;..:. 6 Q
~ ~aasC!: :i: lQ' 01 c<. ..:. 6 6
. . . .
60
., :8 ~~ggc s ... 6666 Co
o ... 6
t2 ~~~~ S ..:. 6666 6
~ ~£;~~ S ..:. 6666 0
f8 g: ~ ~~ ;! c<. 6"';66 6
~ ~~~g S ~ 6":'~6 6
:i §Qg-gc:.. 2' .0 6.:) 6 .;.
~ I ~ ~ ~:8 ~ Co .:) 6.:).:)
~ ~~~S ~ o 6 Q .:).:) .0
~ &~;:!!.;!! ~ CQ 6~Q.:) Co
g -, ..... ..
~fijs=::t ;t o;..:..=~o 0
<0= .... "'_ .... "00 ... ·0 C?' 66660 0
~~g~~ : ·,,;c<.o~6 0
~ ~~;~ ~ 01 .... 6 .... 0 0
gct~~~ ~ &"0"'6 0
&~S':gg~ ':''':'69.Q Q
Sg 9S S S ftQ.~":' 6 6
01001CQ~ 01 C)COoP"'4 .... __
" .... Q.~o Q
fij ~ S ~ C!: ::: .:. .:. 6 6 P. 6
C'l~8~ : ~ ~..4q~ 0
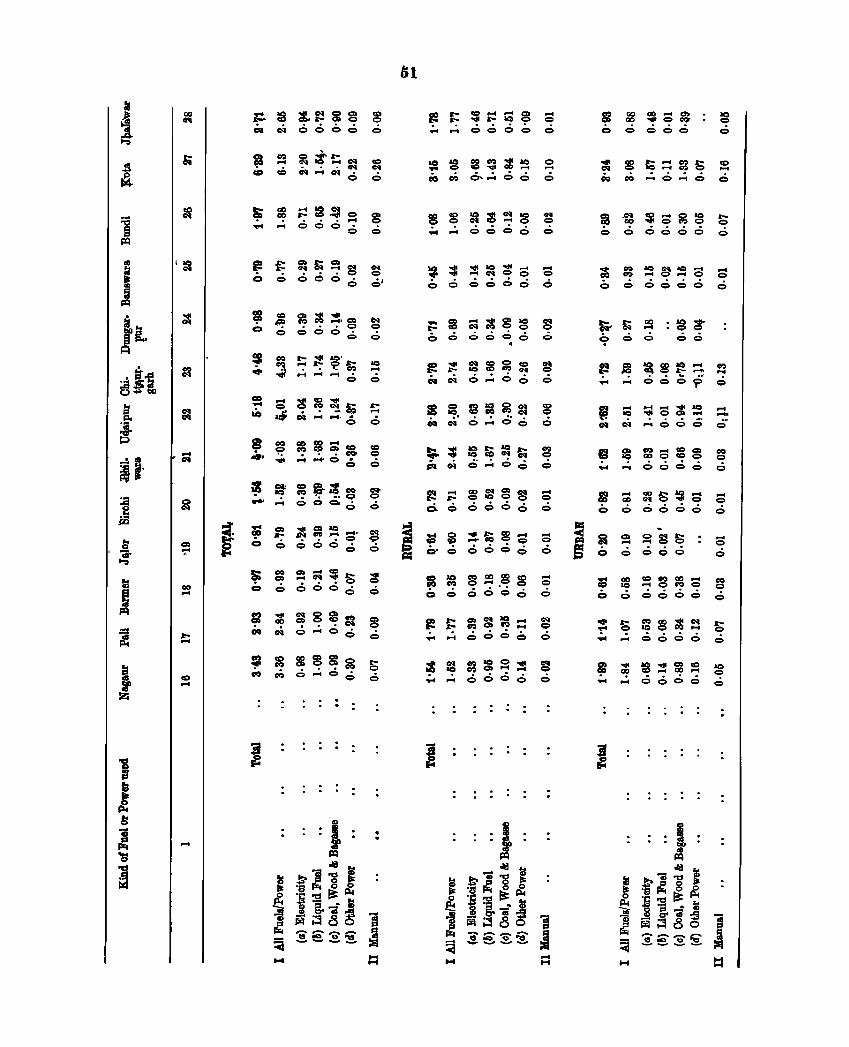
:a l
GO .....
".. .....
cg .....
.....
~:8&~8g 8 WeN66c66
~~~gg~s eo CO) .:...:..:..:. .:.
. .
in
1!2 ~ ~~~9 c: ........ .:..:. 0 0 0
~ g f8~;;~ ~ co Cf) 6 ... ..:.=0 _
88~;g~g~ .;.. .... .:. 66 0 0
~ ~ :!:~~c:; a o.:.06oc;:; 0
te i! =:8~~ ~ .,.. Oil .:.":' 6 0 0
:s g f8~~~ :g " eN' 0 ..:. Q 6 0
~:: :gs~~ a i'l eN Q":'06 0
~ ~ ~~g~ c:; 000';'':'00
~ i: ~ ~~~a c:; ~ C'o 660 0 6
~ ~ a~~8 c:; o 0 .:. 0'6 0 0
~ ~ ~8!~::: S .;.. ... 606 0 6
=, :=: gg~S~ ~ ....... 606 0 0
l2 gs ~a~ o Q 000
:: ~ f;:::ggS ~ CI;J eo ":'0":'6 0
~ f: ~:::g:g s o 0 0060 0
; ~ ~~~c:; ::: CI 0 0606 0
~.~~:g~ 9 0 0 0':'
~~~~~:::.~ ......... ooot? 6
II ~ ::S:8g a ........ 6600 0
" ;; g'ls~a ::: 0000':'00
-s ~ S : S 660 6
c: :8 :::SggS a c CI 0660 0
:: s :g~~~ s ... ..:. 60':'6 6
~ ;:: :8:::!:~~ :g ........ 6606 0
.... . ...
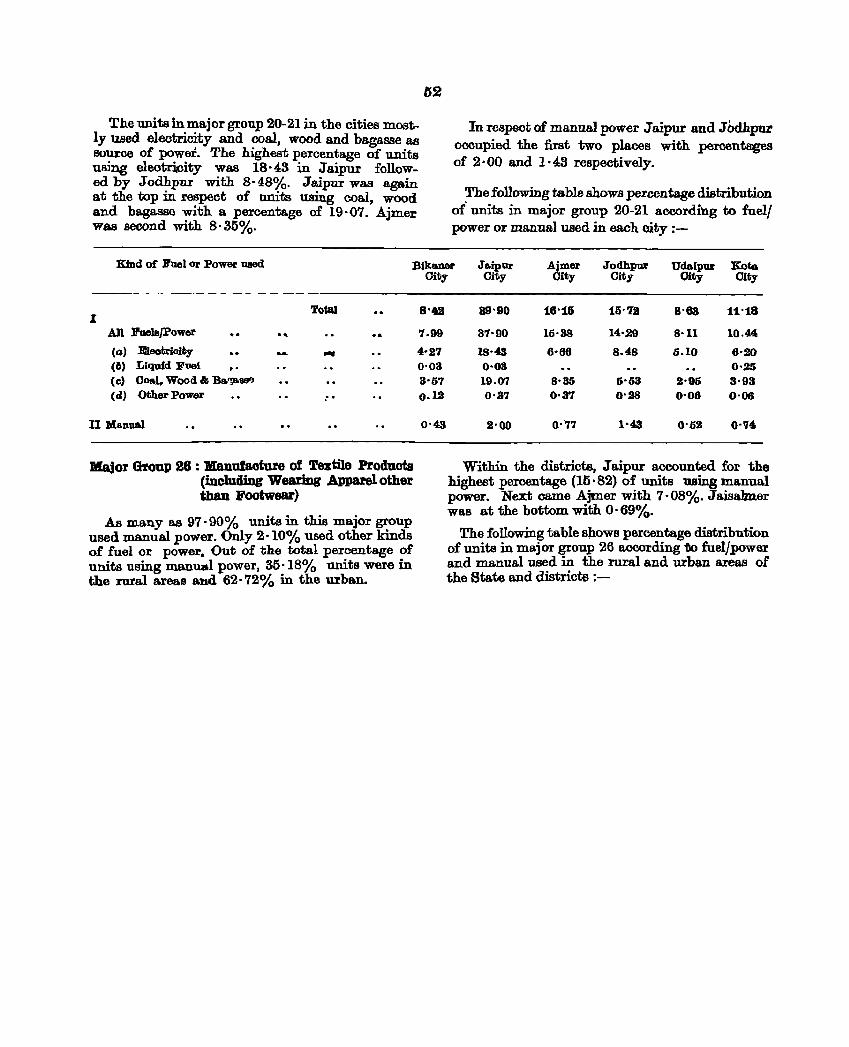
The unita in major group 20-21 in the cities mostly used electricity and coal, wood and bagasse as source of power. The highest percentage of units usjng electricity was 18·43 in Jaipur followed by Jodhpur with 8· 48%. Jaipur was again at the top in. respect of units using coal, wood and bagasse with a percentage of 19·07. Ajmer was second with 8'315%.
52
In respect of manual power Jaipur and JOdhpur occupied the first two places with percentages of 2· 00 and 1· 43 respectively.
The following table shows percentage distribution of units in major group 20-21 according to fuell power or manual used in each city :-
Kind of Fuel or Power used Ajmer Jodh~ Udaipor Kota City City Ofty City
Bikaner Ja~ur City Cit.y
Total I
All l!'uelsJPower ... .. (G) Eleotrioity .... (6) Liqufd Fuel .. (0) Coal. Wood & Ba~B81) (,z) Other Power ,"
II Manual
Major GroUP 26 : Manufacture of Textile Products (incluiliDg Wearing Apparel other thaD Footwear)
As many as 97·90% units in this major group used manual power. Only 2·10% used other kinds of fuel or power. Out of the total percentage of units using manual power, 315'18% units were in the rural areas and 62· 72% in the urban.
8'g
'7.99
4'27 0'03 3'57 0·1.2
0'43
89'90 18'16 115' 71 8'63 11'18
37'90 15·38 14'29 8·11 10.44
18·43 6'68 8.48 0.10 8'20 0'03 0·25 19.07 8'35 0'53 2'95 3'93 0·37 0·37 0'98 0'06 0'06
2'00 0'77 1'43 0'52 0''14
Within the districts, J aipur accounted for the highest percentage (16· 82) of units using manua.l power. Next came Ajmer with 7'08%. Jaisalmer was at the bottom with o· 69%.
The following ta.ble s)lows percentage distribution of units in major group 26 a.coording flo fuel/power and manual used in the rural and urban areas of the State and districts ;-
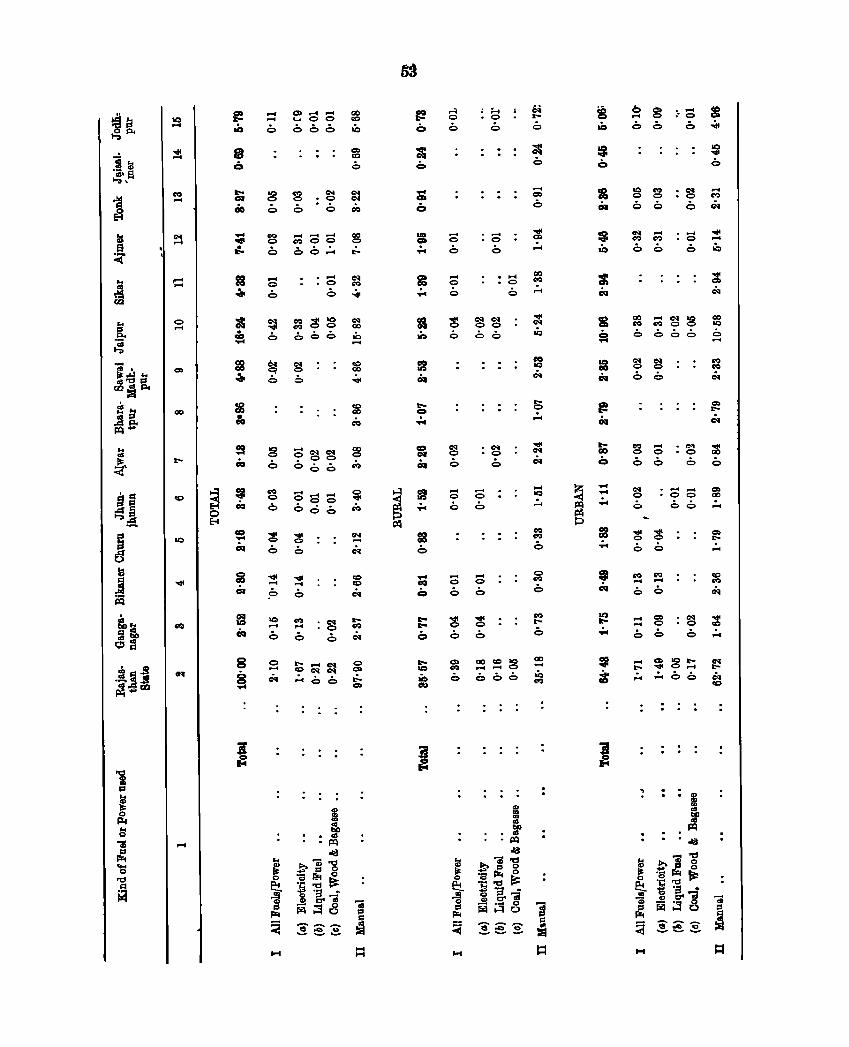
IC ....
o ....
GO
8 §
.... ~ ........ CO
....-t '-'.00 CQ
6 666 ,Q
..... o 6
............ ~oo
66':"
~ ~~:g ~ 6 666 .0 ....
lQ ~ .... .... 6 6
sa
.... co 6
..... o 6
.... o 6
.... (;)
o
.... o 6
.... (;)
6
;;... ·0
6
.... o 6
• C'l • 0
.... o 6
.... o 6
6
.... o 6
.... . . o . 6
CD
'" '" iii till
•• iii • • j:Q
diJ
.... = 6
.... lQ
.:..
too CIO 6
~ ~ :. c:; i 6 6 6 ~
• C'l o .:,
.... o o
~ ~ 2 ~ 6 660
.... o o
.... .... (;) 0
00
C'l o o
~ ~ :g ~ .:.. ,!.c 66
. . J
• .ta
co lQ
o ....
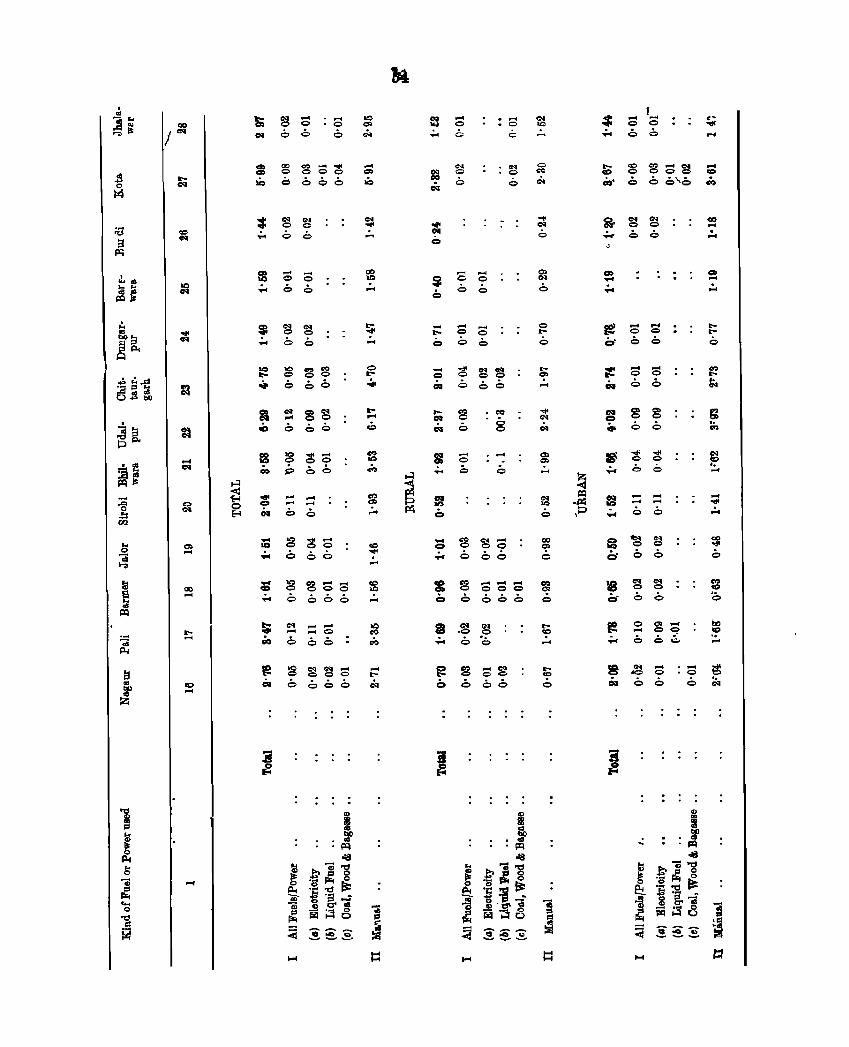
. ._ .. '" ;::! ~P<
... ;f
C) ....
co ....
.,. ....
CC> ....
....
.... o o
~ s::; ~ 6 000
....... o 0
b b
IN C) IN ... 00
b 6 b
..... .... .... ....
.::, .:,
,.:..,
c: ~ Sc;c: ~ ..;.. .::, 060 ,;..,
:g ~ ~ S o 660
cr.I .... ... 0
~ b
.... .... c c o 0
.... o C
IN o o
... C)
....
IX) 0=
C
= f:5 c;Sc; fi 060060
.,. ..., o
, .... .... o 0
6 b
fj; ~~c;~ 00' 6 6 6'6
........ o 0
o 6
s S 6 .:,
... .... ... ... o 0
o C) .... ... 00 o b':;
..... ·0
6
:ll !
• • iii • • j:q
.-J
....
.,. .,. o
~ ' . ...
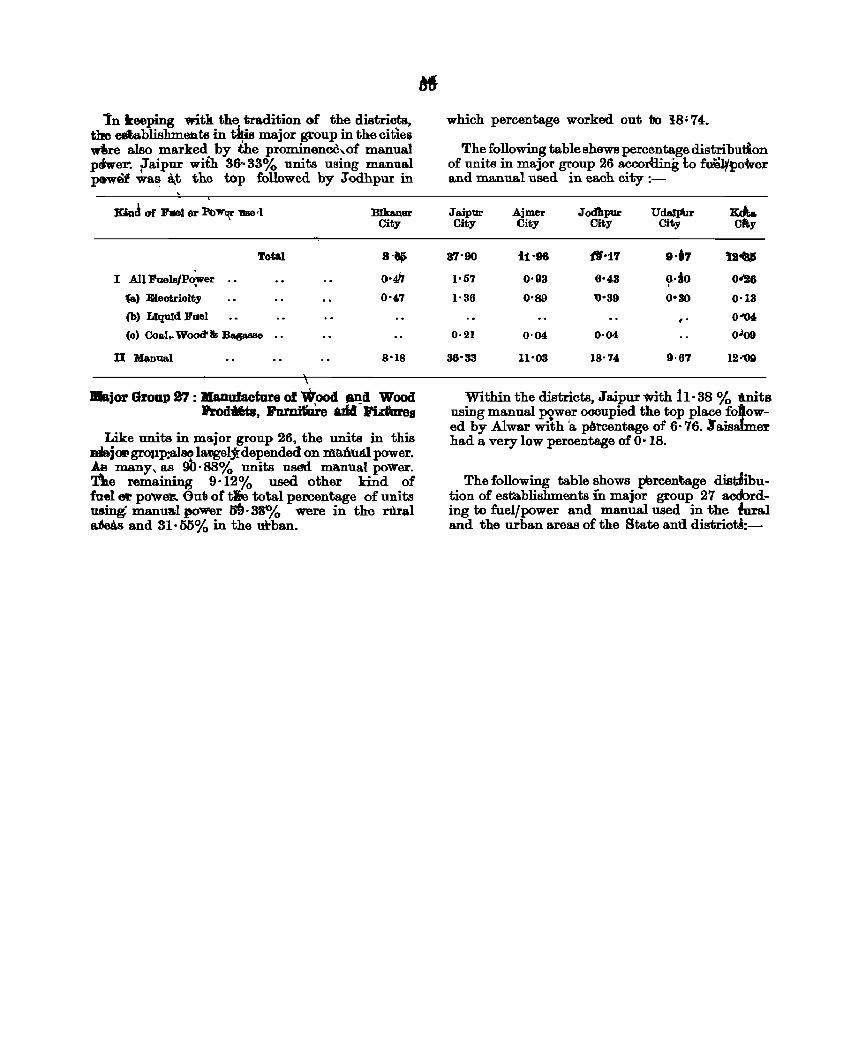
ln keeping witk the tradition of the districts, tbe elitablishme13.ts in ~s major group in the citielil w'IIre also marked by the prominence,of manual plhver: :Taipur with 36 .. 33% units using m_anual pctwef was a.t the top followed by JQdhpur in
. JaaA of l!'el &r Pow~ 1IIIe'1 BIkaner
City
Total S·tsj)
I All J!uels/PO'!'er O·4h '(a.) Eieotrioity 0-47
(b) LiquId l!'ael
(0) Coal •. Wood' & BIIfJ&I!88
D UIIoDuaJ. S'lS
.jor Group rt : Manufacture of Wood and Wood Prod.ta, li'llrnit1ire *114 -lUfores
Like units in major group 26, the units in this majoo gt'OIlp:al80 IMlgeljrdepended on Itltl.ft'lld.l power. Ail many \ as 9b. 88% units usdd manual poWer. fte remaining 9'12% used other kind of fuel e!: power .. Oui! of th total percentage of units using: manu&! power 59·33% were in the rUral akAs and 31, 55% in the urban.
which percentage worked out 110 i8~ 74_
The following table shews percentage distribution of units in major group 26 accodling lo f'trel;t>ower and manual used in each city :-
Jo.ipur Ajmer Jodhpur UdaJItur ~ City City City City c1t;y
37-90 i1'98 {f'17 9"7 ta~
1·57 0'93 0'43 ~·jo 0~6
1·36 0'89 '0'39 0·30 0·13
, . 0"04
0·21 0·04 0·04 0.709
36'33 11'03 IS· 74 9·67 12·'09
Within the districts, Jaipur with 11· 38 % t.nits using manual Nwer oocupied the top place foj!wed by Alwar with 'a petcentage of 6· 76. Jam er had a very low percentage of O' 18.
The following table shows pbrcenb.ge distlibution of establishments in major group 27 acdording to fuel/power and manual used in the lural and the urban areas of the State and district8:-
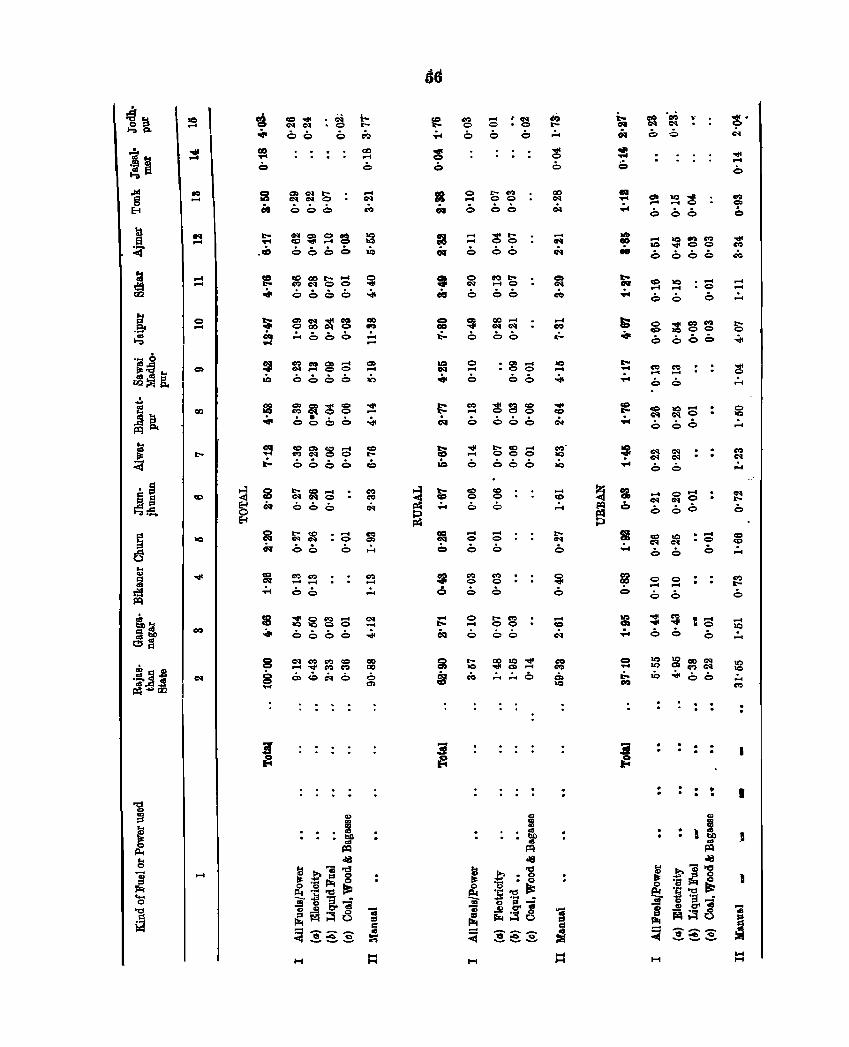
.. ....
... ....
C ....
ao
CCI..... . ~ i:oo C"IC"I .. 0 t-
06 0 C<:i . . . .
egaor-'" C':IC'lCO
6000
O>C'I ..... eo OooC'lO
;"000.
C':I 1M 0> .... Col .... oO 6066
~i!t~g . . . . 0000
ao .... 6
ao eo .:.. .... 0> .... .t:,
~~gS :,e 6000 cO
~ ~ : g ~ Q 6 6.:...
CI) C':I ........ 00
CI) .... ..:..
IS ~~SS ~ ... 0000 ..,d.
<N CI) CI) CCI ...-I"IIIIdf~C¥:II
c.cC~o
o .... o .... .... o
o .... 6
co .... o
.. ..
t- C') o 0
00
..... t-00 00
cot.... 0
06
• go .... .0<:> 00
..... t- cc ....
.... coo o 660
........ <:> <:> o 0
co CI) <:> 0 o 0
o t- co .... co o 00
1-1
-... ,;:.
ac .... ~
CQ' ac .0
.... cc .:..
.... ac..,CQ ac ..... 0 0
Q 6 Q 0
CI) co .... .... o 0
o 0 ........ o 0
:i ~ ~ IS ~ -6 0 0
:g ~ ~ ~ .0 ~ -6 0
.... ....
..:..
o IQ
..:..
.... 10
.:..
IQ 10
I
: I
••
-j
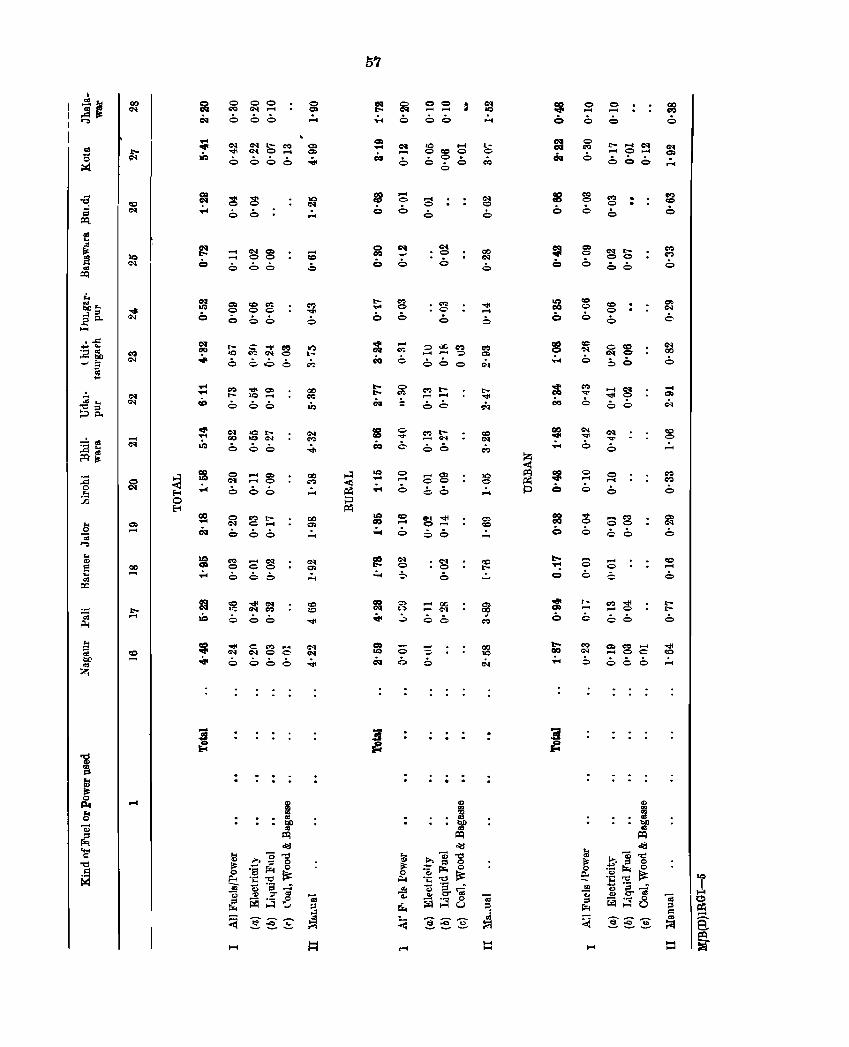
1 1
c:» -CCI
co -
~ ~ ~ ~ 6 666
\Q ;;; ~ ;g 6 __ 0 ::,
~ ~ ~::; o 666
o = ,:.,
10 IN ,:.,
-co .:,
5'1
6
.... 0:>
o
o ...,
o -b
co .... b
o b
00 --66
.... o 6
Mt--66
,.:.,
.~ t-,.:.,
o -6
o M
6
co <::> 6
;:; 6
o .... 6
M • o • 6
CCI o 6
,.... o
co o ,:.,
CCI .... 6
tt-
6
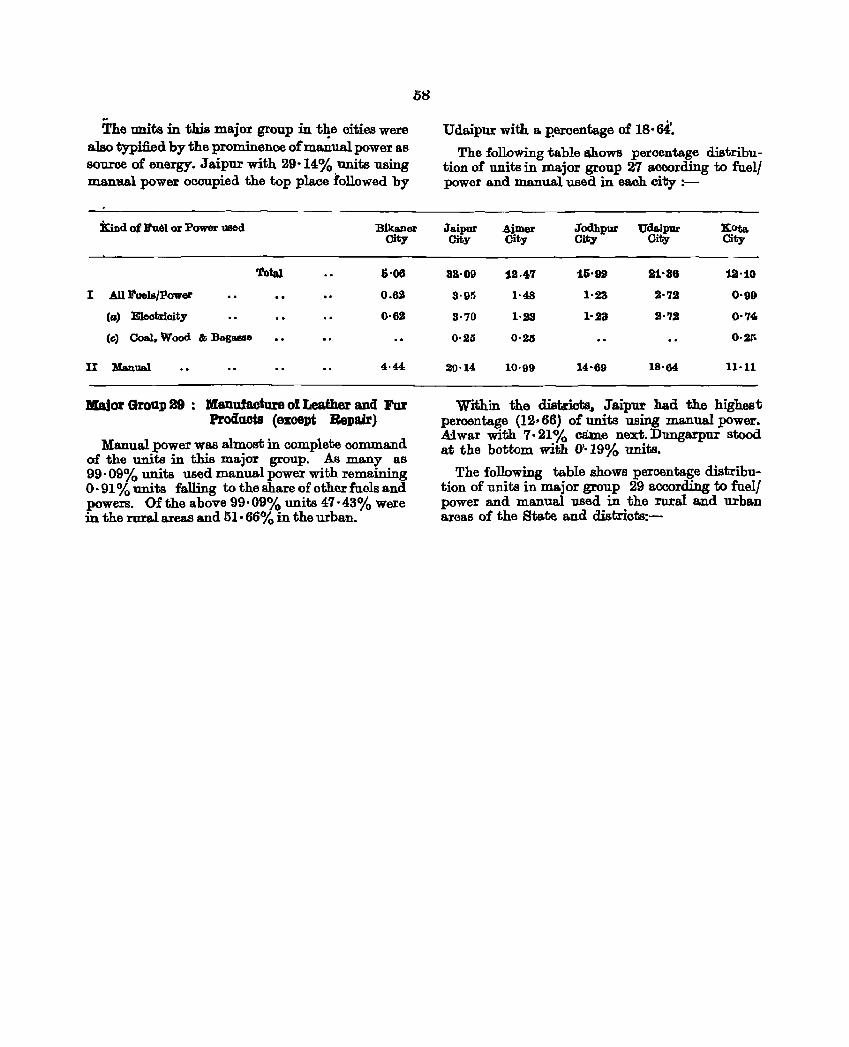
.. The units in this major group in the oities were
also typified by the prominence of manual power as 8Our06 of energy. Jaipur with 29'14% units using manual power occupied the top place followed by
58
Kmd of li'u61 or Power uaed BikaDeI.' City
I Allll'uels/Power
(II) Eleotrioity
(a) Coal. Wood & BaglUllla
n :Manual
'total 5'06
0.62
0·62
Major Group 29: Manufacture of Leather aneI Far Products (except Repair)
:Manual power was almost in complete command of the units in this major group. As many as 99·09% units used manua.l power with remaining 0·91 % units falling to the share of other fuels and powers. Of the above 99·09% units 47'43% Were in the rural areas and 51· 66% in the urban.
Udaipur with a. p'ercentage of 18·6{.
The following ta.ble ahows percentage distribution of units in major group 27 according to fuell power a.nd manual used in each city :-
Jaipur Ajmer City City
38'09 12.47
3'95 1'48
3'70 1'23
0·25 0'25
29'14 10'99
Jodhpur Uda.ipur City City
15·n 21'8e
1'23 2'72
1'23 2'72
14'69 18'64
Kota. City
12'10
0'99
0'74
0'2~
11'11
Within the districts" Jaipur had the highest percentage (12· 66) of units using manual power • .A:lwar with 7· 21% came next. Dungarpur stood at the bottom with 0"19% units.
The following table shows percentage distribution of units in major group 29 according to fuel! power and manual used in the rural and urban areas of the State and districts:-
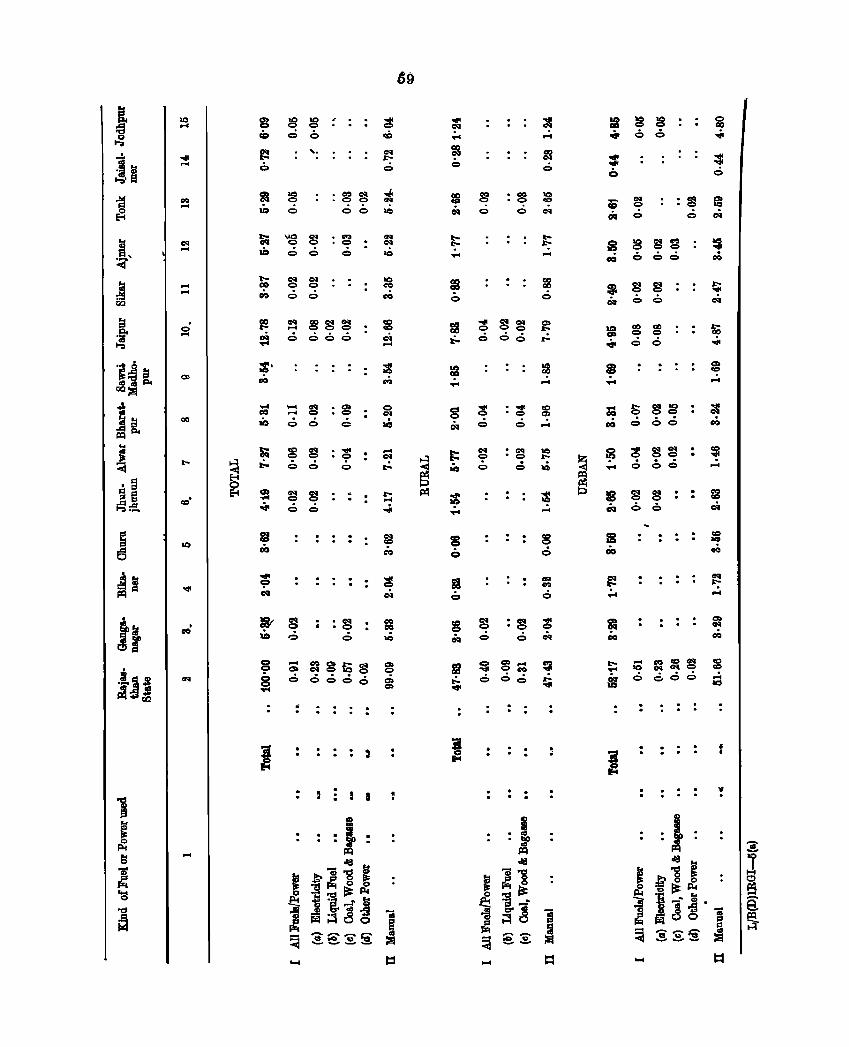
1.0 .....
.... ....
.... .....
C'I ....
..... .....
o ....
<DO
.....
~.
CIQ
• C'Q • Q
10
6 Q
c:q CIO c:q IN! .... 10 10 Q
6 666
. . . .
· -= • 10
e
• "011 ·10 10 6 10
" ·
· ·
· .. · .
o cq • 10
co
. .
I
69
o " • 10
10
· . · .
~ ~ ~ ~ 6 66 .;.
o • · .
o ..... o 10
6 ....
9 10
• cq o 10
6
· . · .
8 ~ : ~ ~ 0IlI Q 6';"
$ 8:;; ~ Q 6 Q ~
. .
: : ~ 6
:
. . . . . .
....
• •
v ·
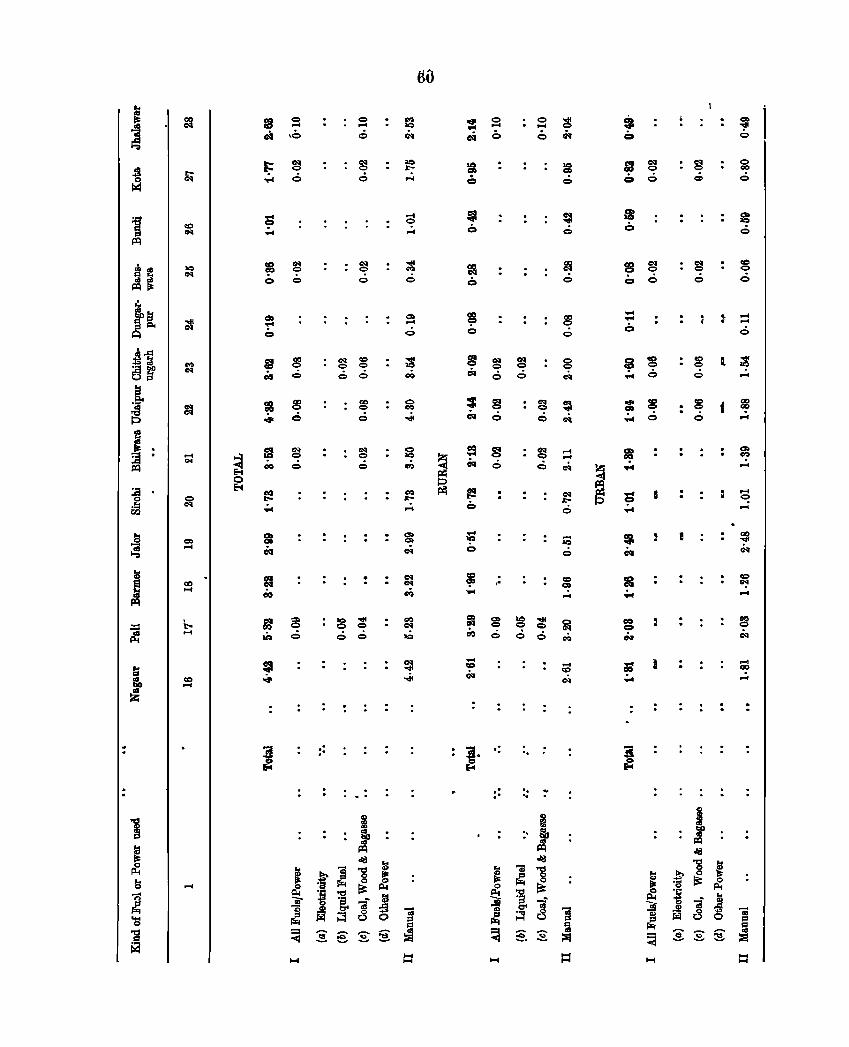
. .
00 ....
co ....
....
s ...
: .
o .... 6
:
. . .
.... o ....
CI> .... <>
o ... Q
. ..
o ... cO
m ~ ~ ~ cO 6 6 6
:.
. .
. , ' .
.... .... o
g 8 .... 6
CCI o CN
I
o GO
6
... .... 6
... o ...
.... 00
..:.
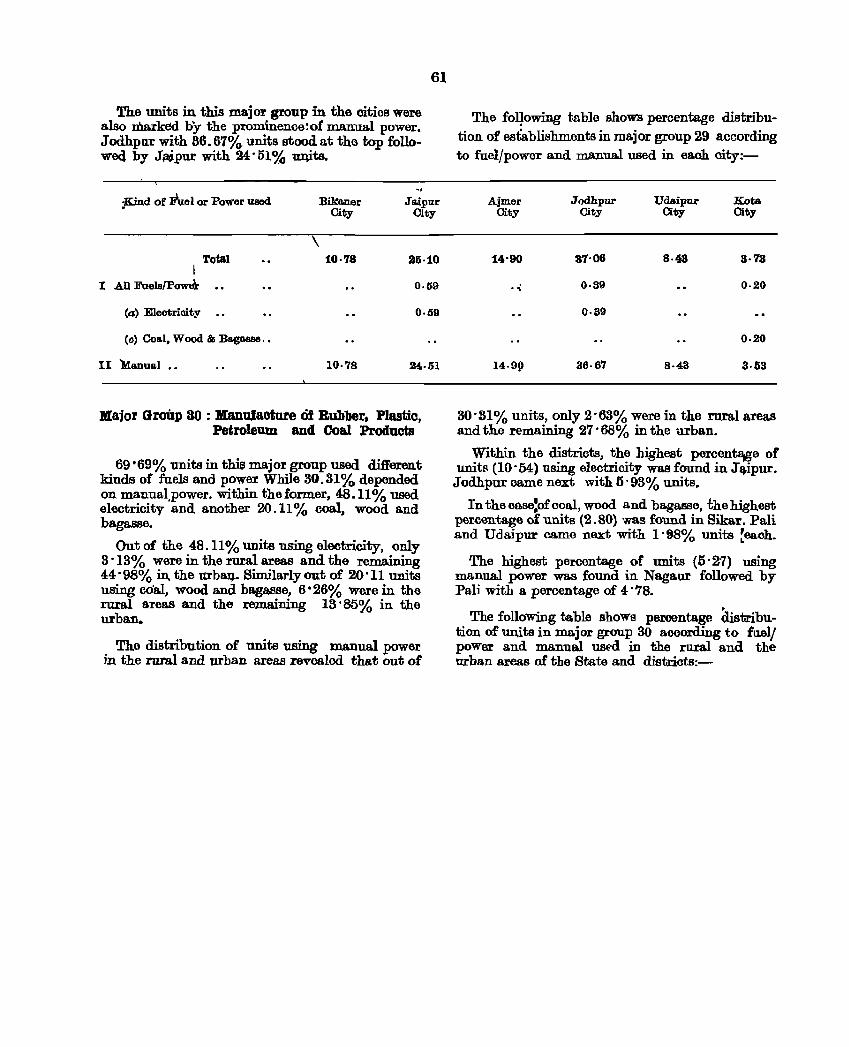
The units in this major group in the cities were also marked by the prominence: of manual power. JodhpllX with 36.67% units stood at the top followed by IN.pur with 24·51% mPts.
of
61
jKind of 1i\J.el or Power used Bikaner Je.ipur
Total
I AU Fuels/Fowe\-
(a) Eleotricity .•
Co) Coa.l, Wood & Ba.gasse .•
II Ma.nual ••
\
City City
10·78 a5·10
0·59
0·59
10·78 24,·51
Major Groilp 30 : Manufacture of Rubber. Plastic, Petroleum and Coal Products
69 ·69% units in this major group used dUJerent kinds of fuels ana power While 30.31% depended on manual,power. within the former, 48.11% used electricity and another 20.11 % coal, wood and bagasse.
Out of the 48.11% units using electricity, only 3 '13% were in the rural areas and the remaining 44'98% in, the mba!).. Similarly out of 20'11 units using coal, wood and bagasse, 6'26% were in the rural areas and the remaining 13·85% in the urban.
The distribution of units using manual power jn the rural and urban areas revealed that out of
The fol10wing t.able shows percentage distribution of establishments in major group 29 according to fuel/power and manual used in each city:-
Ajmer Jodhpur Udaipur Kota City City City City
14'90 37'06 8·43 S·73
... 0·89 0·20
0·39
0·20
14.9p 36·67 8·43 3·53
30'31% units, only 2'63% were in the rural areas and the remaining 27' 68% in the urban.
Within the districts, the highest percentaee of unitfl (10'54) using electricity was found in Jq.ipur.
Jodhpur came next with 5'93% units.
In the case:of coal, wood and bagMSe, the highest percentage of units (2.80) was foun.d in Sikar. Pali and Udwpur came next with 1'98% units ~each.
The highest percentage of units (5'27) using manual power was found in Nagaur followed by Pali with a percentage of 4' 78.
The folloWing table shows peroentage distribution of un,its in major group 30 aooording to fll.elj power and manual ust'd in the rural and the urban areas of the State and districts:-
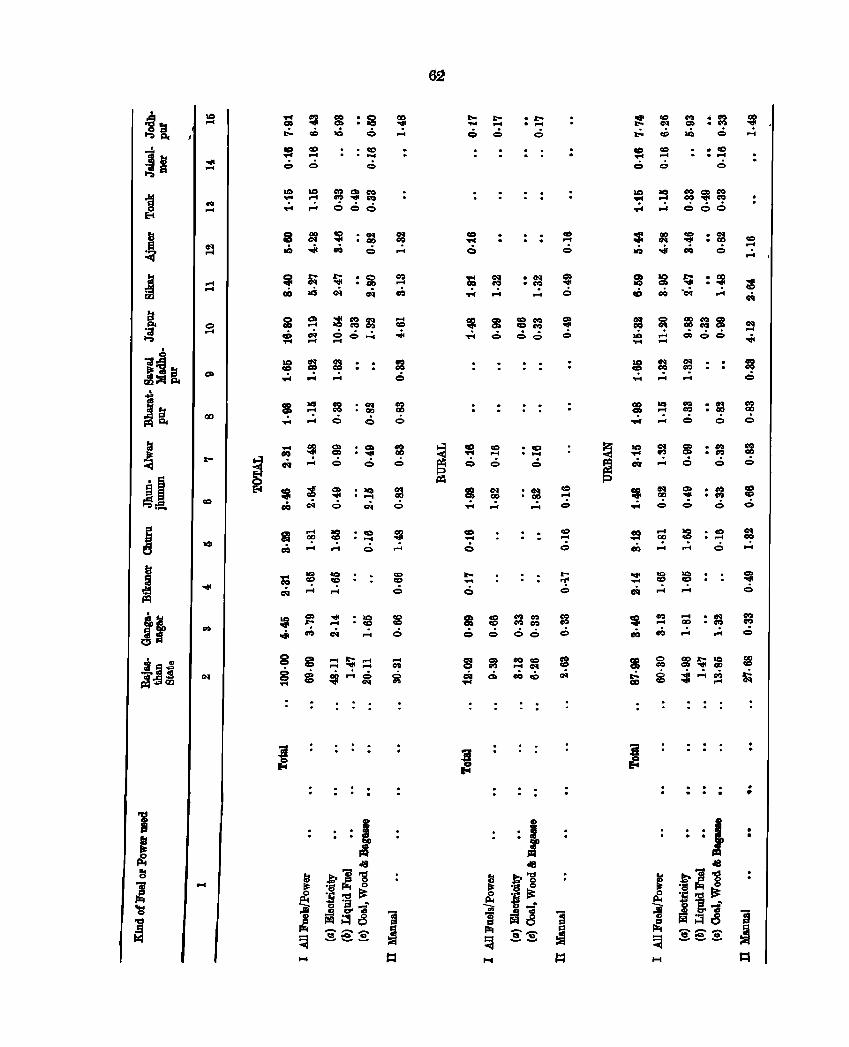
... ...
....
• o:c · .... 6
~ ~ = ~ ~ ..;.. .... 666
• c;q • "II 6
.c::> • "II
0<.
~ ~ >!i3~ ~ ::::1 ~ 6..:.
• C'I • CD
Q
· ~ · """ 6
• IQ · .... 0<.
• ceo · ,_, cO .... ,..:, 6
· . · . cQ .... ,..:,
• lQ • CC> ,_,
8 ~ :::~::: § g ~,..:, ~
... . . .
j
62
....
J =
· .,.. · .... 6
· . · .
:
• IN • CQ ..:.
CCI .... e
~ g ~:::s ~ ,.. 6 00 e
CD CC> ,.. .... CI 0
.... ....
CD .... 6
• C> · .... o
• oq • "II ....
· . · .
~ ~ ~ ~ = a. ..Q a:.
· . · .
....
CC> .... <6
• cc · ... 6
~ ~ :::S~gg ..;.. .... 666
· "" • co 6
Ii ~ ~ :~ cD coil -0<. ..:.
= ~ ~fgg 10 .... =66 .... ....
· . · .
= ~ .......
• fO • CQ
6
• CD · ... <6
:.a : : cQ ... ....
· '" • fO .:.
..:.
C> ... ....
CD CD
6
s ~ ~~~ f8 ~ ~ ~..:.~ ~
. . . . . .
: : !
:1 . ..
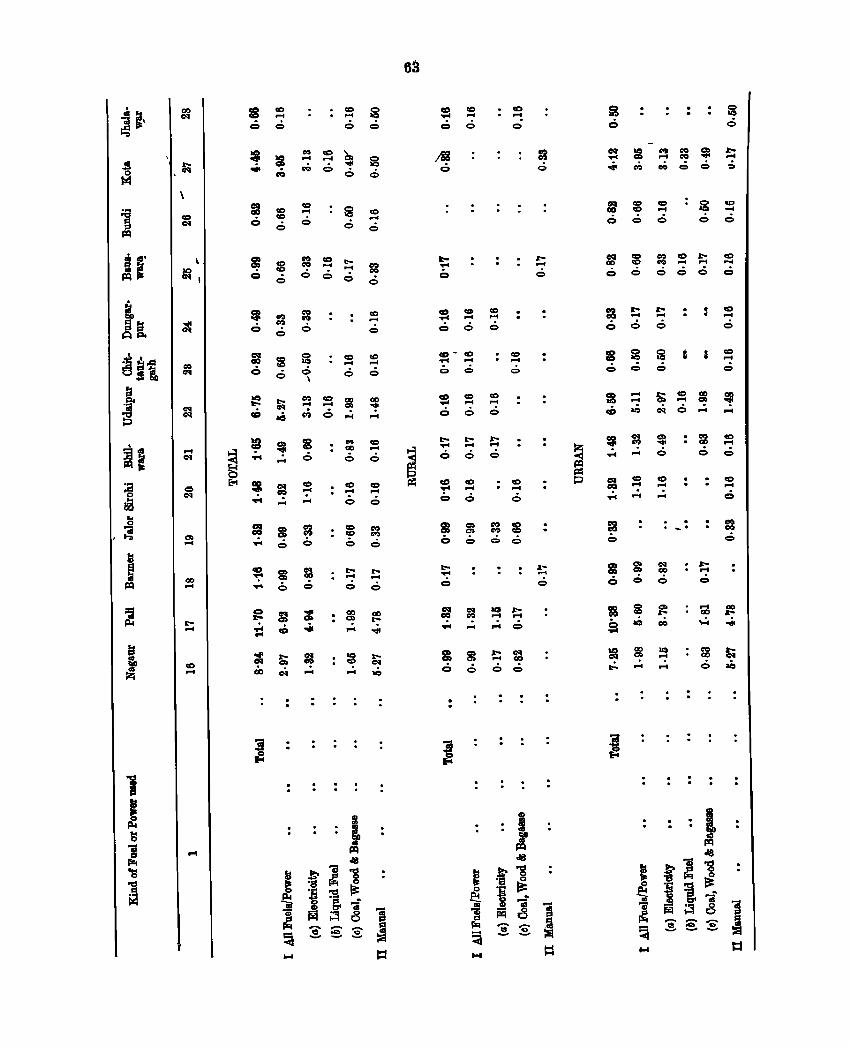
• II'
!~
..., 01
..... 01
o C'I
'" .....
co .....
= .....
:: .;..
~ Q
\
<C> ..... 6
..., co Q
.,.. ..... 6
..:.
<C> .... 6
CQ ..... 6
= .... 6
= .... 6
,,_ .... 6
63
<C> ..... 6
= .... 6
.,.. ..... 6
= ..... 6
<C> .... 6
<C> .... 6
CQ .... 6
= .... 6
: ~ 6
>0 ~ ........ ..:. .:.
fD ..... 6
.,.. ..... 6
o o
$ G I 6
<C> ..... ..:.
IN co Q
lQ ..... ..:.
. .
o _o
:
o o
~ .... <>
= .... <>
0= .... 6
= .... <:)
....
0= .... <>
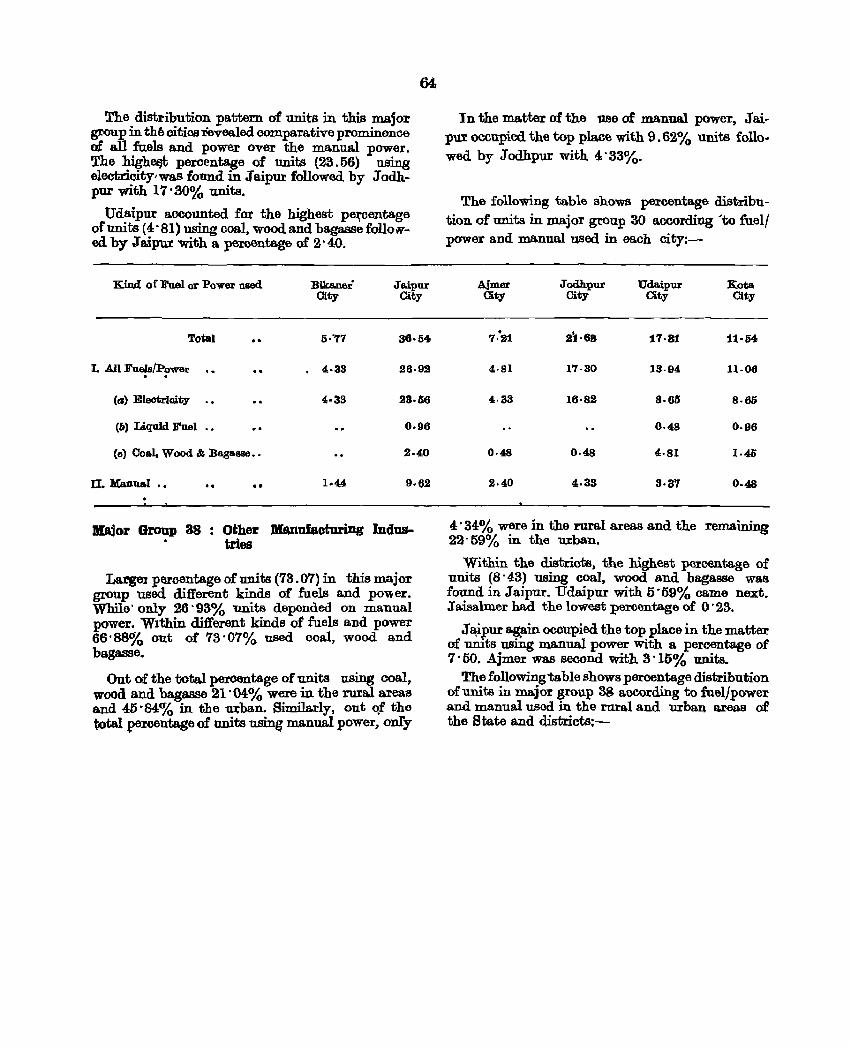
The distribution pattern of units in this major group in the cities revealed compara.tive prominonce of all fuels and power O'\Ter the manual power. The highefji percentage of writs (23.56) using electricity,was found in Jaipm followed by Jodhpur with 17' 30% units.
Ud~ipur accounted for the highest peJ,'centage orumts (4'81) using coal, wood and bagasse followed by Jaipur with a. percentage of 2·4().
KiD.d of Fuel or Power used
Toilll
(CI) Eleotrioity
(b) Liquid Fuel "
(0) Coal. Wood & Bagasse ••
n. Manul .•
Bika.nei City
4·33
4·38
Je.i.pur City
36·540
26·92
29·56
0.96
2.40
9·62
Major Group 88 Other Manufacturing Industries
LargeJ percentage of units (73.07) in this major group used different kinds of fuels and power. While' only 26 '93% units depended on manual power. WIthin different kinds of fuels and power 66' 88% out of 73' 07% used coal, wood and ba.gasse.
Out of the total percentage of units using coal, wood and bagasse 21'04% were in the rural areas and 45'84% in the w;ban. Similarly, out o,f the total ,peroentage of units us~ manual.(lower. omy
In the matter of the use of manual power, JaiplU occupi.ed the top place with 9 .62% units followed by Jodhpur with 4' 33%.
The following table shows percentage distribution of units in major group 30 according 'to fuell power and m.a.n.ual used in each city:-
Aimer Jodhpur City City
Udaipur Kota City City
7'-at 2~·6S 17·81 11·54
4·81 17·30 13·94 11·06
4·33 16·82 8.60 8.65
0·48 0·96
0·48 4·81 1·40
2.40 4·33 3·3'1 0·48
4' 34% were in the rural areas and the remaining 22'59~ in the uxban.
Within the districts, the highest percentage of units (8'43) using coal, wood and bagasse was found in Jaipur. Udaipur with 5'59% came next. J aisalmer had the lowest percentage of o· 23.
J ~ipur ag_ain occupied the top place in the matter of units using manual power With a peroentage of 7' 50. Ajmer was second with 3 '15% units.
The following table shows percentage distribution of units in major group 38 according to fuel/power and manual used in the rural and uxban areas of the State and distriotB:-
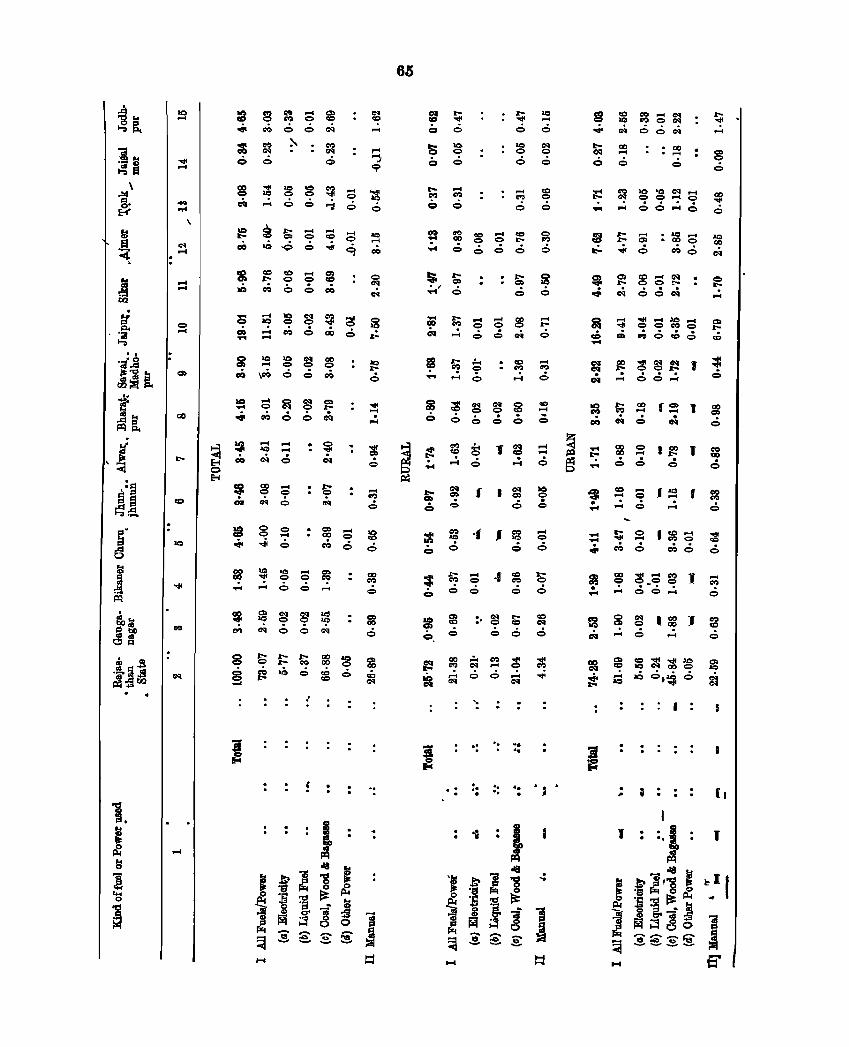
. iii .. bIlliI
~i
:
..,jI ....
.... .... \
.... ....
o ....
:8 a ~ ~ ~ .!c ~.6.6C'1
:; .6
~ gS~~~ ~ GO aO-Qo";'q ~
s re8~. ~ ..; ~oocQ
c; ~~g~e: g = :::c:.,caoo z:.
8 ~ ~ g ~ cO \~ .6 6 cQ
:5 8 -
......
.IQ ....
c<. 0
o 0 o .... ..,jI 6
;:!l . ....
65
~ ~ ~ ~ ~ ..... 0 .6 0 0
;; ~ s ~ ~ CQ ...:. 0 = ~
'" .... 6
... .,... o
c:c .... C'Q C'Q
... 0
~ <1:~gg CI 0 .0 Q 0
.: ._ ::
... .... 6
~ . Q
-
<C ct.I .... C'I '" ~ 0 C'I c<. 6.6 c<. .... <Xl ... .6
: ~ ;; g 6 0
co IO'CC'o::t ..... eN 00 .... 0
... 06":' 6
::I f: ;; :~8 .;. ..;, 6 ~ 6
SlI F!8~~: ~ ... ~ =':'01 ...:.
~ ~ I~ 1 ~ Q Q 0 ..:;
:::: !; ~ .~~ • c:.. Q COO
~ . .... 9 ~_s a .... 06,...:.
J CQ o
mg~'~J:2 -c = ...:.
: : i :
· . · . · ..
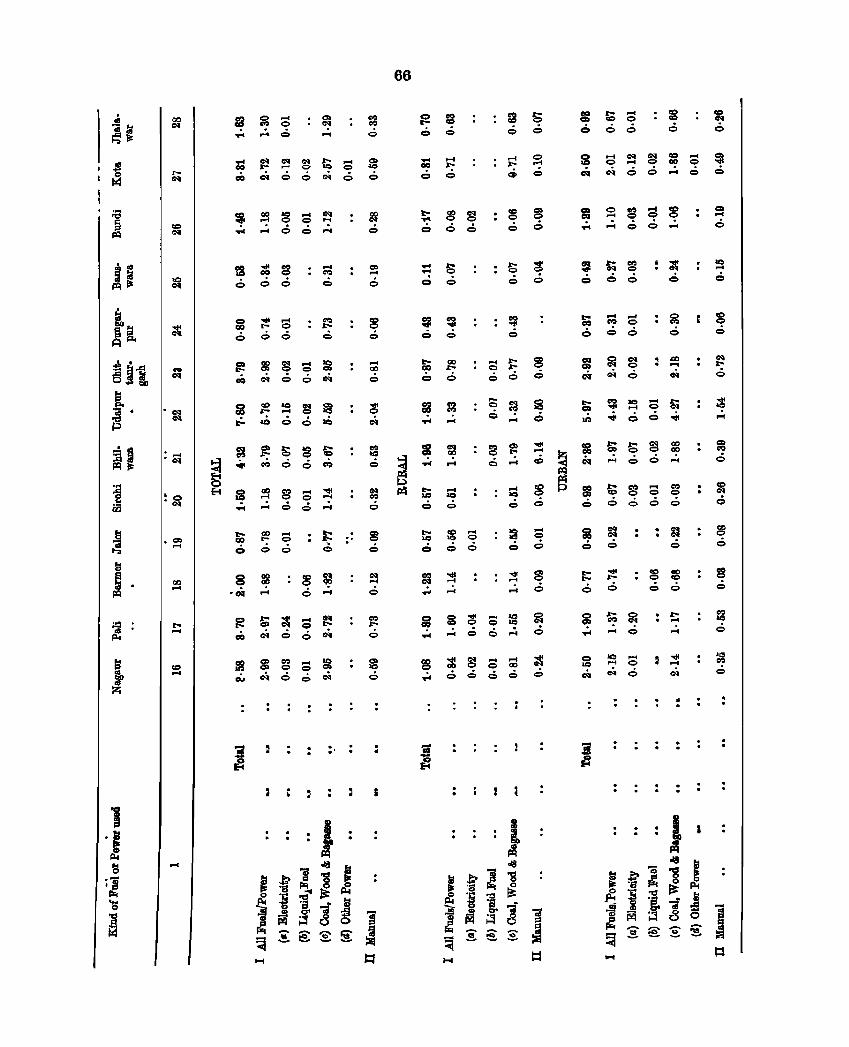
co .....
<0 ....
....
= f.!~~t;~ co CNO<:>c<.C
........ t- <:> <:> 0
~ ~:!:1S:i CO Cot 0 <:> c<.
:ii3te.~g~ .,:. >CIOO.Q
~ S ~ ::!: ,.:. 0 Q ..:.
}:: '. Q.
~ SC1lS~ CO cNOOc<.
18 gS~:i 0.. c<t 0 <:> c<.
. . '
66
;: s Q 0
~ $C!:Q:8 ~ ~ "':'06':'':'
~ ~ :!:1 Q ~ ~ ~ Q Q Q <:> 0
~ ~ S :g S CN Q C ..:. <:>
..... ... .,q
CD .... Q
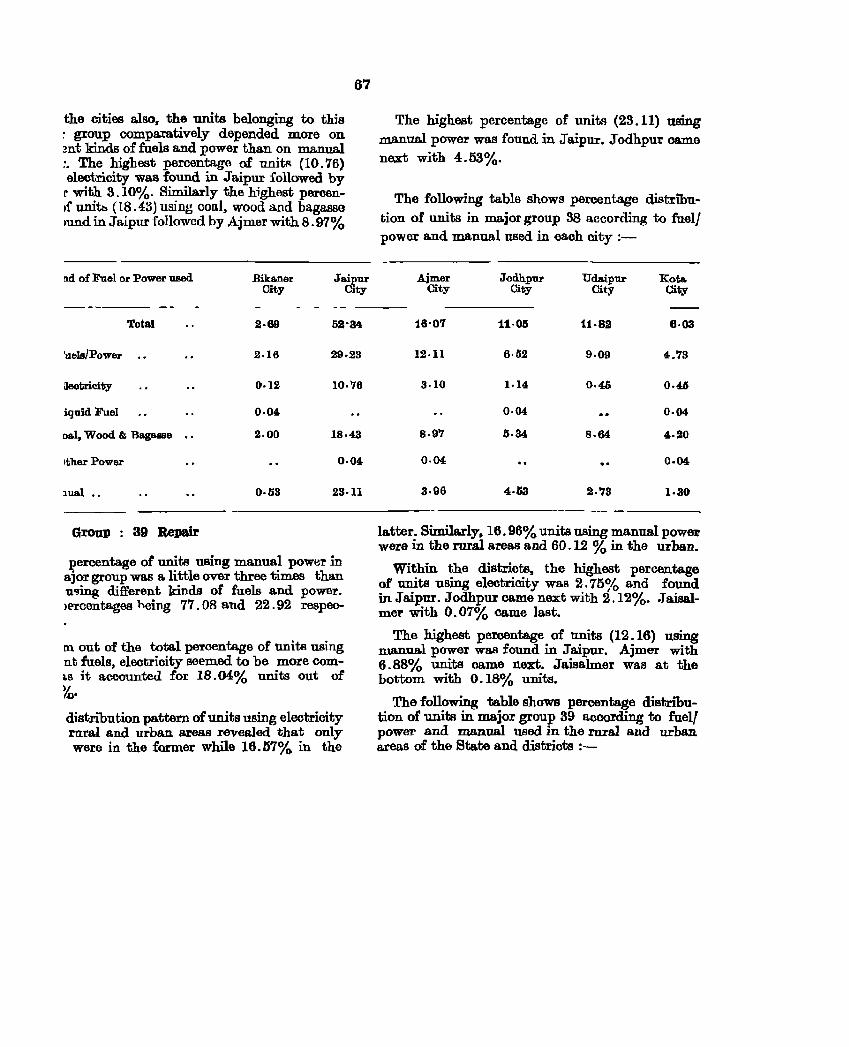
67
the cities also, the units belonging to this : group comparatively depended more on mt kinds of fuels and power than on manual :. The higbest percentage of unitR (10.76) electricity was found in Jaipur followed by ~ with. 3.10%. Similarly the hlghest peroonIf unitb (18.43) using coal, wood and bagasse ,und in J aipur followed by Ajmer with 8.97%
lid of Fuel or Power used Bika.ner Ja.ipur City City
- - --Total 2·89 52'34
'nels/Power 2·16 29·23
ileotricity 0·12 10·76
iquid Fuel 0·04
Dal. Wood & Bagasse 2·00 18·43
ItherPower 0·04
lual •. 0·li3 23·11
The highest percentage of units (23.11) 11Sing manual power was found in Jaipur. Jodhpur came next with 4.53%.
The following table shows percentage distribution of units in major group 38 acconling to fuel! power and manual used in each city ;-
Ajmer City
18'07
12·11
3·10
8·97
0·04
3·96
Jodhpur City
11·05
6·5.2
1.14
0·04
a·34
Uda.ipur City
11·82
9·09
0·46
8·64
2.73
Kota City
6·03
4.73
0·45
0·04
4·20
0·04
1·30
------------ ---------- --- - ----~ GMU11 39 Repair
percentage of units using manual power in ajor group was 8. little over three times than U'3ing different kinds of fuels and power. I£'rcentages heing 77.08 and 22.92 respec-
m out of the total percentage of units using nt fuels, electricity seemed to be more com~s it accounted for 18.04% units out of ~.
distribution pattern of units using electricity rllral and urban areas revealed that only were in the former while 16.57% in the
la.tter. Similarly, 16.96% units using manual powmr were in the rural a-reas and 60.12 % in the urban.
Within the districts, the highest percentage of units using electricity was 2.75% and found in Jaipur. Jodhpur came next with 2.12%. JaisaJ.mer with 0.07% came last.
The highest percentage of units (12.16) using manual power was found in Jaipur. Ajmer with 6.88% units came next. Jaisalmer was at the bottom with 0.18% units.
The following table shows percentage distribution of units in major group 39 according to fuel! power and manual used in the rural and urban areas of the State and districts ;-
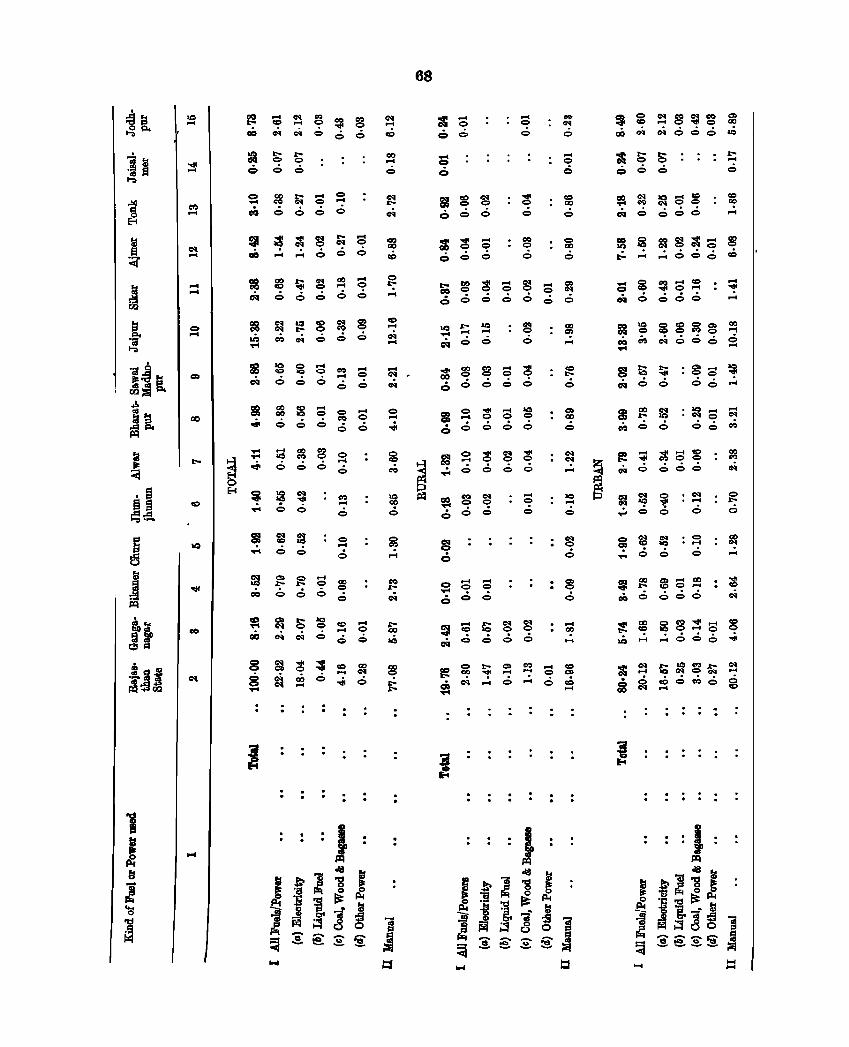
! .§ ~ g ~::S.
e ~
J Il=I
m,:s !a:f ~I'I
... ... o ...
t! ~~g~~ cO .N.N';~0
~ ~ ~ ~ s c::. 0 0 0 6
" ~~~~~ GO ........ 000
= $~S~~ ~ c:q06660 ....
118 ~~8~g ~ c<I 6 0 6
<:> .... 6
~ ~te~~ ci:t 0 6 0 6
J
....
68
c: o
.... o <:>
.... o e
~~(!!;o·~S~~ o 0 60<:> 6
eli ~ ~ ~ (!!; o 0 <:> <:> <:>
.... 00 ....
~ ~ ~ S :g .... 0 ,.:, <:> <Q ....
=g~8~:g~ cO.N .N666.Q
... ~ • • • r-I
~~:ftS8 c:q <:> 666
6
~ lE ~S~C: ~ to- .... ..:.666 r:i>
c:g~s~:~ c:q60c6 ....
SfQ~:g~~ c:q<:><:> c6":'
~~~ :~:::~ ci:t 6 6 66"';
8 ~ fd : S .... 0 6 6
= ~ ~:::~ 000666
l!! ~ ~S::!:::: 8 aQ"""":'ooo";'
. . . .. . . . .
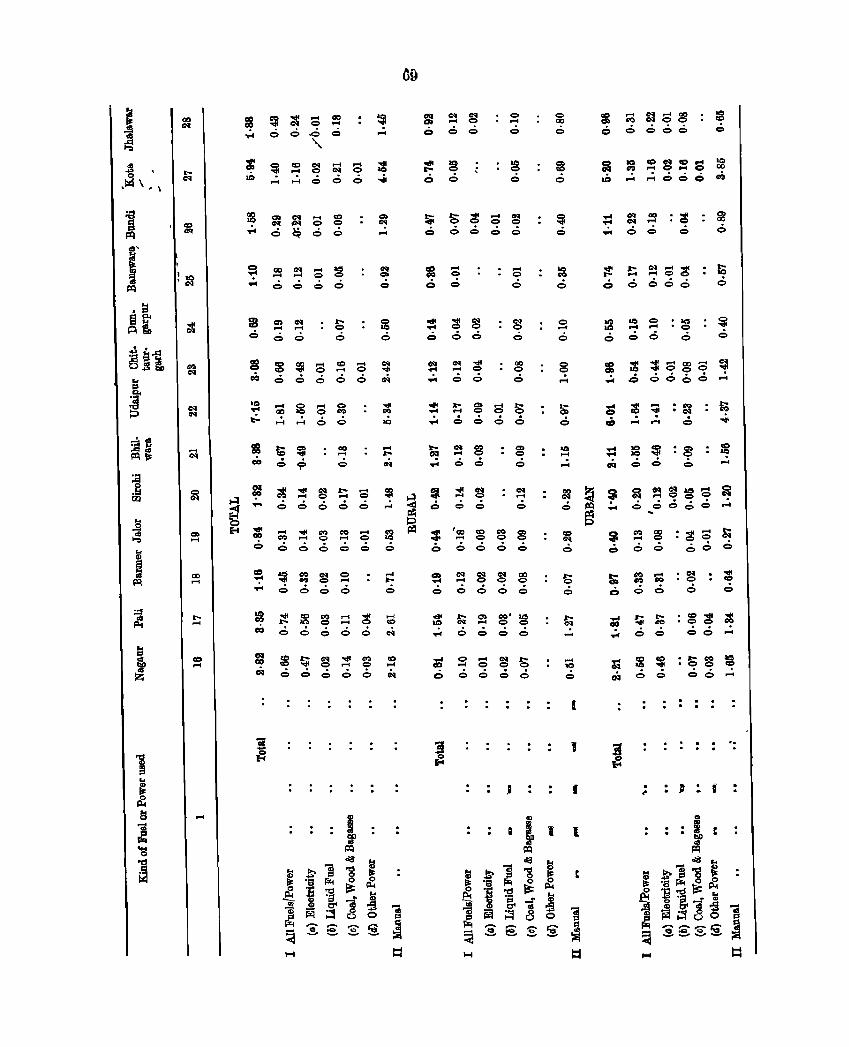
~ ,~ \, \
cS'
I
1 !
, :~
.... 01
00 ......
co ......
......
c ..... .....
~ C1: ~ ~ Q 6 ,Q 0::)
" ~ !e ~ ~ ~ ..:, ..:, 0 0 6
c= 01 .......... 6 6
s o
:g ~ ~ !e :=; 6 6 6 6 6
<>0 .... 6
;c ~ S ~ S 6 6 6 0 6
...... '014 C':I 1:0 ...... ~ ..... 0 ..... 0-
06066
~ :g ~ ::: ~ 00660
~ ~ ~ ;::!I ~. 00600
....
...... I:-
o
o ... 6
~ S ~ :=; ~ 00660
... o o
...... o o
~ g :=; S .:, .6 0 0
S I~ :g ~ g CI 6000
~ ~ g g ~ CI 6000
.1
o 00
o
o .... o
8 ..:,
S o
I
f
:i O;;~~~ CI 0000
:i ~ ~S~S ~ .;" ..:, ":'ooc 011
~ ~ ~ ~ g o 0 06 0
1Q 0::> • .., ......... '0
0<6 0
s ~~~~:=;~ .;.. 00666 ...
• 011 • 01 o
• CO> • 0
o ....
~~Sg8~ o 0666 ...
~ ~ : ~ 8 ~ 0660 0
~so:8~~ 0000 ....
~~:s~~ o 0 0 Q ....
. ~
. . . .
.D' :. I
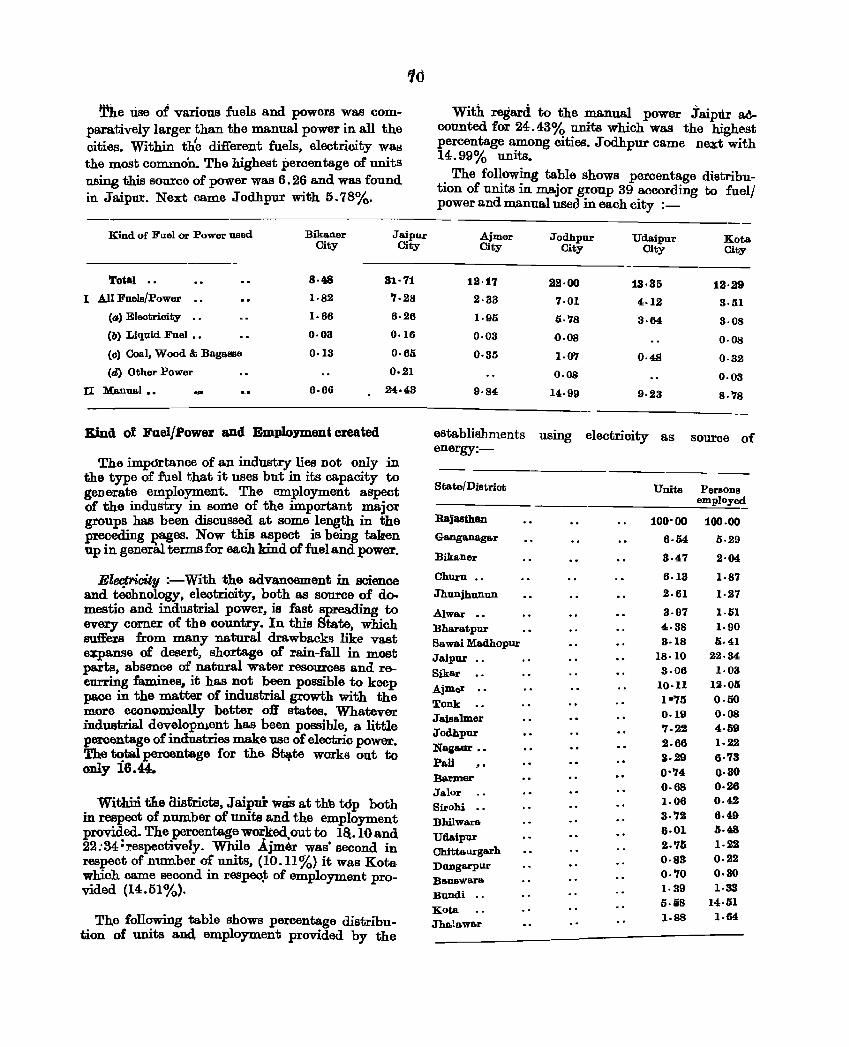
The lise oj various fuels and powers was comparatively larger than the manua.l power in all the cities. Within th'e difierent fuels, electricity watl the most common. The highest percentage of units using this source of power was 6.26 and was found in Ja.ipur. Next came Jodhpur with 5.78%.
'10
Kind of Fllel or Power used Bikaner Jaipur City City
Tota) .. 8·4.8 31·71
I All Fuels/Power 1·82 '7.28
Ca) Eleotrioity 1·66 6·26
(lI) Liquid Fuel •• 0·03 0.16
(0) Coal, Wood & Bagasse 0·13 0·6li
(d) Other Power 0·21
n Manual •• 6·66 24.43
Kind of Fuel/Power and Employment created
The impcjrtance of an industry lies not only in the type of fuel that it uses but in its capacity to generate employment. The employment aspect of the industry in some of the important major groups has been discussed at some length in the preceding J?ages. Now this aspect is being taken up in general terms for each kind of fuel and power.
Electrir:ity :-With the advancement in science and technology, electricity, both as source of do-meatic and industrial power, is fast spreading to every corner of the country. In this State, which suffers from many natural drawbacks like vast ~anse of desert, shortage of rain-fall in most parts, absence of natural water resources and recurring famines, it has not been possible to keep pace in the matter of industrial growth with the more economically better off states. Whatever industrial development has been possible, a little percentage of industries make use of electric power. The ~t&l peroentage for th& Stlf.te works out to only 16.44.
WithUi tIle rusmcts, Jaipui: was at thb tdp both in respect of number of units and the employment provided. The percentage worked, out to 1&. 10 and 22:34:respectively. Wbile Ajmer was' second in respect of number of units, (10.11%) it was Kota which c.ame second in respec~ of employment provided. (14.51%).
The following table shows percentage distribution of units and employment provided by the
With regard to the manual power jaip11r adcounted for 24.43% units which was the highest percentage among cities. Jodhpur came next with 14.99% units.
The following table shows percentage distribution of units in major group 39 according to fuell power and manual used in each city :_
Ajmer Jodhpur Udaipur Koto. City City City City
12·17 22·00 13·85 12·29 2·33 7·01 4.12 3·51 1·95 5·'78 3·64 3·08 0·03 0·08 0·08 0·35 1·0'7 0·48 0·32
0·08 0·03 9·84 14·99 9·23 8·'18
establishments using electricity as source of energy:-
State/Dismot Units Persons employed
Rajasthan 100'00 100.00 Ganganagar 6·54 5.29
Bikaner 8·47 2·04:
Churn •. 6·18 1·87 Jhunjhunun 2.61 1·27
Alwar .. 3·97 1.ln
Bharatpur 4·38 1·90 Sawai Madhopur 3·18 li.n Jaipur 18·10 22·34
Sikar 3·06 1·03
AjmQl' 10·11 12·05
Tonk 1·'15 0·50
Jaisalmer 0.19 0·08
Jodhpur 7·22 4·59
Nagaur •• 2·66 1·22
Pall 3·29 6·73 , . 0''74 0·30 Barmer
Ja.lor 0·68 0·26
Sirohi 1.06 0·4,2-.. 3·'72 6·49 Bhilwara 6·01 5·48
Udaipur 2.'16 1·22
Chittaurgarh 0·83 0.22
Dungarpur 0·'70 0·80
Ba.nswara 1·39 1·33
Bundi .. 5·i8 14·51
Kota 1·88 1.64
Jhalawar
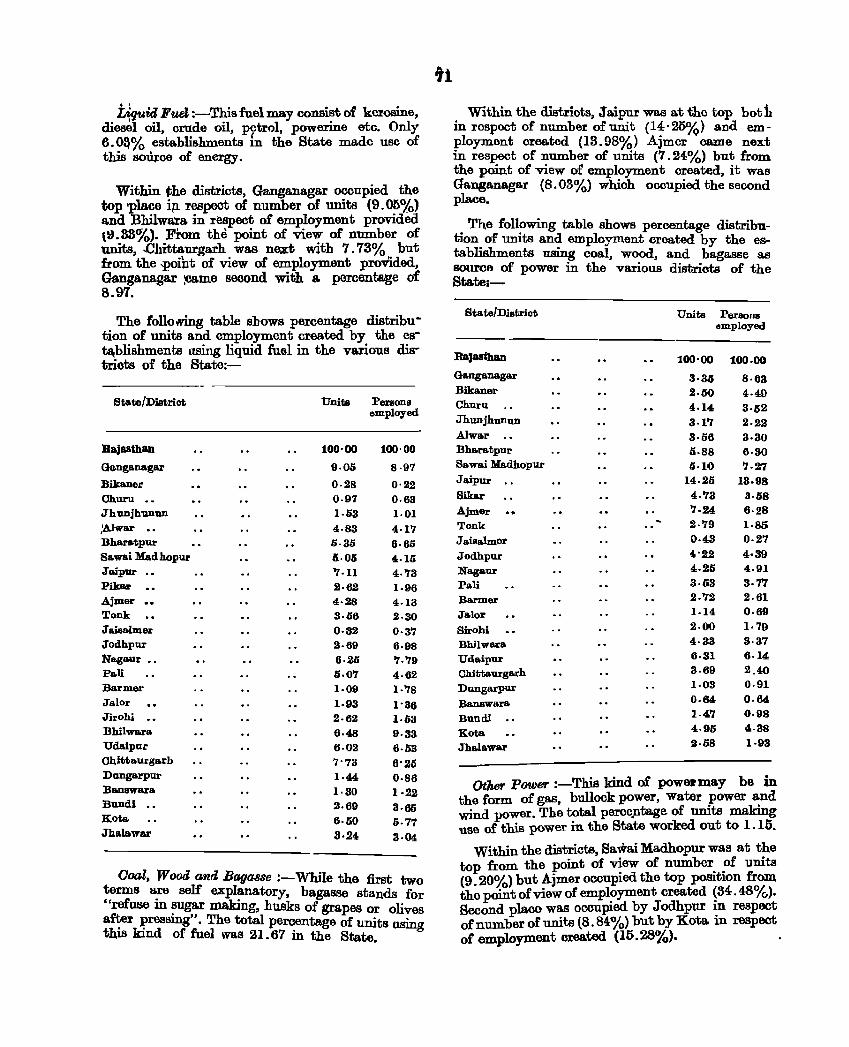
LWuitl Fuel :-This fuel may consist of kerosine, diesel oil, crude oil, p~trol. powerine etc. Only 6.0&% establishments in the State made use of this sowce of energy.
Within ihe districts, Ganganagar occupied the top 'Place ip. respect of number of units (9.01}%) and Bhilwara in respect of employment provided \9.33%). From the point of view of number of units, -Chittaurgarh was next with 7.73% but from the 'Point of view of employment provided, Ganganagar :came second with a percentage of 8.97.
The follomng table shows percentage distribution of units and employment created by the estl\blisbments using liquid fuel in the various districts of the State:-
State/Distriot Units Persons employed
Rajasthan 100'00 100'00 Ganganagar 9·05 8·97 Bikaner 0·28 0·22 Churu .. 0·97 0·63 Jhunjhun1ln 1·53 1·01 :Alwar .. 4·83 4·1'7 Bharatpur 6·3li 6·6li Sawai Madhopur &·05 4·15 Jaipur '1·11 4·73 Pikar 2·62 1·96 Ajmer 4·28 4·13 Tonk 3·66 2·30 Jaisalmer 0·32 0·3'7 Jodhpur 2·69 6·98 Nagaur •• 6·26 '7·'79 PaU 6·0'7 4·62 Barmer 1·09 1·'78 Jalor 1·93 1'36 Jirohi . . 2·62 1'03 Bbilwaxa 6·48 9·33 Udaipur 6·02 6·53 Chittaurgarb 7'73 6'25 Dungarpur 1·44 0·86 Banswara 1·30 1·22 Bundi .. 2·69 3·65 Kota 6·1i0 0.77 Jhalaw&l' 3·24 3·04
Coal, W DOd and Bagasse :-"While the first two terms are self explanatory, bagasse stands for "refuse in ~ug.~ making, husks of grapes or olives af~er ~ressmg . The total percentage of units using thIS kind of fuel was 21.67 in the State.
91
Within the districts, Jaipur was at the top both in respect of number of unit (14'25%> and employment created (13.98%) Ajmer came next in respect of number of units (7.24%) but from the point of view of employment created, it was Ganganagar (8.03%) whioh occupied the second place.
The following table shows percentage distribution of units and employment created by the establishments using coal, wood, and bagasse as source of power in the various districts of the States-
State/Distriot Units Persons employed
RaJasthan 100'00 100.00 Ganganagar 3·36 8·tl3 Bikaner 2·60 4·49 Churu 4.14 3·52 Jhunjhuoun 3·1'7 2·22 AlwlLr 3·56 3·30 Bharatpur 1i·88 6·30 Sawai Madhopur 1)·10 '7·27 Jaipur 14.25 13.98 Sikar 4:·'73 3·58 Ajmer '7.24 6·28 Tonk 2·79 1·85 Jaisalmer 0·43 0·27 Jodhpur 4'22 4·39 Nagaur 4·25 4·91 Pa1i 3'03 3·7'7 Barmer 2.'12 2.61
Jalor 1.14 0.69
Sirohi 2·00 1.79
BhHwara 4·33 3·37
Udaipur 6·31 6·14
Chittaurgarh 3.69 2.40
Dungarpur 1·03 0.91
BanswlLra 0.64 0·64
Bundi 1.4:'7 0·98 .. Kota 4·95 4·38
JhalawlU" 2·58 1·93
Oth6'r power :-This kind of powelmay be in the form of gas, bullock power, water power a:nd wind power. The total perceptage of umts making use of this power in the State worked out to I. 15.
Within the districts, Sa..wai Madhopur was at t~e top from the point of v~ew of number. .of uruts (9.20%) but Ajmer OCCUpIed the top pOSItIOn ~om the point of view of employment created (34.48 Yc.). Second placo was occupied. by Jodhpur ~n respect of number of units (8.84%) but by Kota m respect of employment created (15.28%). .
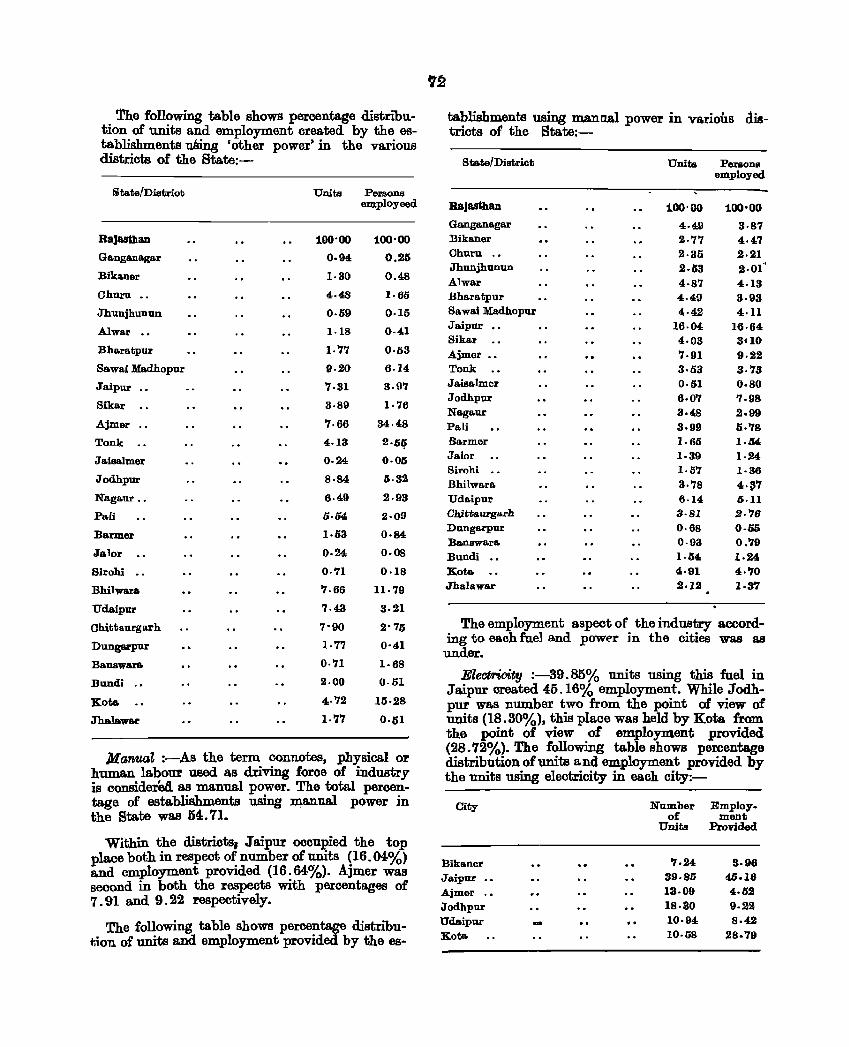
The following table shows percentage distribution of units and employment created by the establishments uSing 'other power'in the various districts of the State:-
State/Diatriot Units Persons employeed
Rajasthan 100'00 100'00
Ganganagar 0.94 0.25
Bikaner 1·30 0.48
Churn .. 4·48 1·65
Jhunjhunun 0·59 0·15
Alwar .. 1.18 0·41
Bhs.ratpur 1-'17 0'03
Sawai Madhopur 9·20 6·14
Jaipur 7·31 3·97
Siks.r 3·89 1.76
Ajmer 7·66 34·48
Tonk 4.13 2·5~
J s.isalmer 0·24 0·05
Jodhpur 8·84 5·32
Nags.ur .• 6·49 2.93
Pa.D (j.ij4, 2·09
Barmer 1·53 0·84
Jalor .. 0·24, 0·08
Birohi .. 0·71 0·18
Bhilwara '7·66 11·79
Udaipur 7·43 3·21
Chittaurgarh 7'90 2'75
Dungarpur 1·77 0'41
BaDSwars. 0·'71 1·68
Bundi .. 2·00 0.51
Kot&. 4·'72 15·28
Jhalawar 1.'7'7 0·51
ManuaZ :-,A.s the term connotes, physical or human labour used as driving force of industry is consider6d as manual power. The total percentage of establishments using ~a.nua.l power in the State was 54.71.
Within the districts; Jaipur occupied the top place both in respect of number of units (16.04%) a.nd employment provided (16.64%). Ajmer was second in both the respects with percentages of 7.91 and 9.22 respectively.
The following table shows percentage distribut.ion of units and employment provided by the es-
,~
tablishments using mana.a.l power in various dis-tricts of the State:-
State/District Units Persons employed
Rajas&han 100'00 100'00 Ganganagar 4·49 3·87 Bikaner 2·7'7 4.47 Churn .. 2·35 2.21 Jhunjhunun 2·53 2·01' Alwar 4·87 4·13 Bbaratpur 4.49 3·93 Sawai Madhopur 4·42 4·11 Jaipur .. 16·04 16·64 Sikar 4·03 3~10
Ajmer •• '7·91 9.22 Tonk 3·53 3·73 Jaisalmer 0·51 0.80 Jodhpur 6·07 '·98 Nagaur 3·48 2.99 Pali 3·99 5·78 Barmer 1·66 I.M Ja.lor 1·39 1.24 Sirobi .. 1·57 1·36 Bbilwara 3·78 4.S'7 Udaipur 6·14 6·11 Chittaurgarh 3·8l 2·78 Dungo.rpur 0·68 0·55 Banswa.rs. 0·93 0.79 Bundi .. 1·64 1.24. Kata 4·91 4·70 Jhalawar 2·12 1·37
The employment aspect of the industry according to each fuel a.nd pow('r in the cities was as under.
Elecf:riqity :-39.85% units using this fuel in Jaipur created 45.16% employment. While Jodhpur was number two from the point of view of units (18.30%), this place was held by Kota from the point of view of employment provided (28. '12%). The following table shows percentage distribution of units and employment provided by the units using electricity in each city:-
City
Biko.ner Jaipur •• Ajmer .• Jodhpur Udaipur Kota
Number of
Units
'1·24 39·85 13·09 18·30 10·94 10·58
Employ-ment
Provided
8·96 40.16 4·62 9.22 8·42
28.79
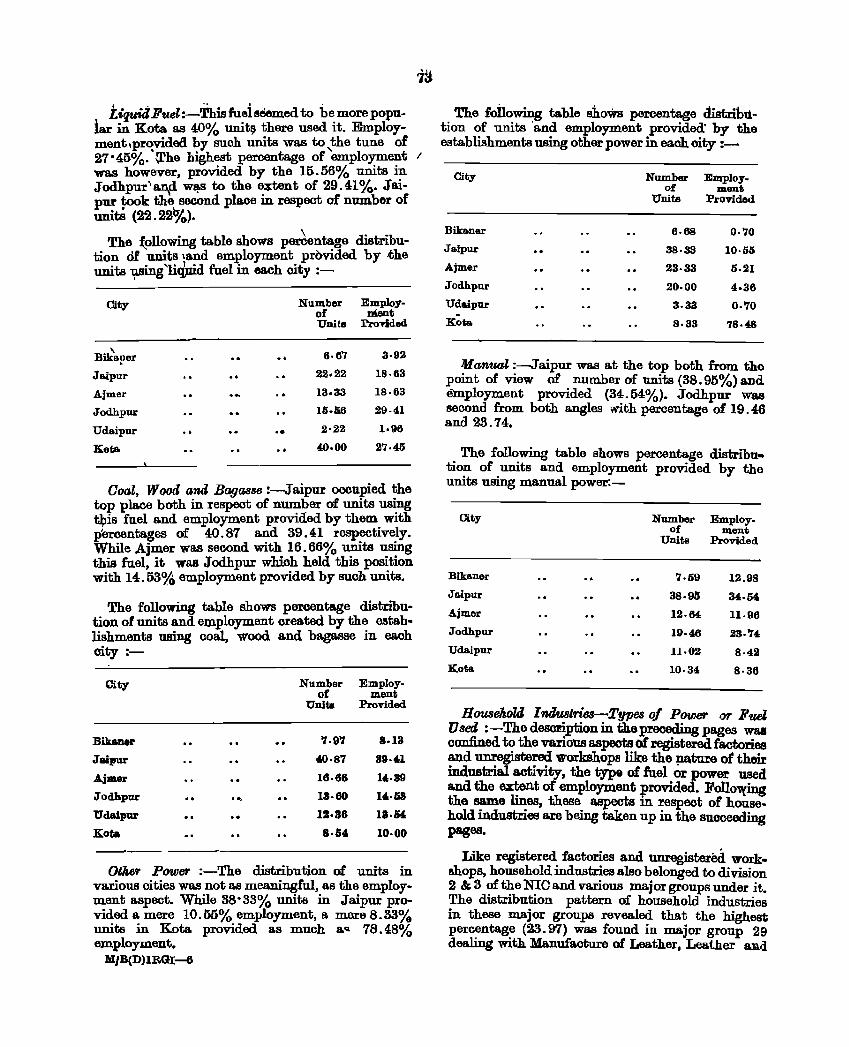
Llquiii Duel :-This fuei seemed to be more popular in Kota as 40% unit~ there used it. Employment,provided by suoh units was to the tune of 27·45% .• ~he highest percentage of ~mployment I
was however, provided by the 15.56% units in Jodhpur'~ W~9 to the e3:tent of 29.41%. Jaipur took the second place in respect of number of unitS (22.22%).
The (ollowing table shows pe~entage distribution df units ~and employment provided. by ,the units -ysing'licpnd fuel in each city :-
City Number Employ-of mant Unit. Pro .... ded
Bik'aper 6·6'1 3·92
J&ipur 22.22 18·63
Ajmer 13.33 18·63
Jodhpur IS.56 29·41
Udaipur 2·22 1.96
Kota 40.00 27·41)
Goal, Wood and Bagasse :-Jaipur occupied the top place both in respect of number of units using t:bis fuel and employment provided by them with percentages of 40.87 and 39.41 respectively. While Ajmer was second with 16.66% units using this fuel, it was Jodhpur whioh held this position with 14.53% employment provided. by such units.
The following table shows percentage distribution ot units and el;llployment created by the establishments using coal, wood and bagasse in eaoh city:-
City
Bikaner
Jaipur
.A.jaer
JodJlpur
Udaipur
Kot.
...
Number of
Units
7·97 40·87
16·66
13·60
12·36
8·S'
Employ-mant
Provided
1.13
39·41
14.39
14·li8
11·54,
10·00
----- -----------------Oth6r Power :-The distribution of units in
various oities was not as meaningful, as the employment aspect. While 38·33% units in Jaipur provided a mere 10.55% employment, a mere 8.33% units in Kota provided as much &"" 78.48% employment.
MJB(D)IBGI-6
The foiIowing table shoWs percentage distrihution of units 'and employment provided' by the establishments using other power in eaoh oity :-
City
Bikaner
Jaipur
.A.jmer
Jodhpur
Udaipur
Kota
Number of
Units
6.68
38·33
23·33
20·00
3.33
8·33
Employ-DLant
Provided
0·70
10·55
5.21
4·36
0·70
78.~
lIlanual :-Jaipur was at the top both from the point of view of number of units (38.95%) and employment provided (34.54%) • .Jodhpur was second from both angles with percentage of 19.46 and 23.74.
The following table shows percentage distribution of units and employment provided by the units using manual power:-
City
Bikaner
Jaipur
Ajmer
Jodhpur
Udaipur
Kota
Number of
Units
7·59
38·95
12·64
19·46
1l.02
10·34
Employ-ment
Provided
12.98
34·54
11.96
23·'74
8·42
8·36
Houselw7il Industries-Types qf Power 0'1' FueZ U sea : -The description in the preceding pages wal confined to the various aspects of registered factories and unregistered workshops like the ~ture ot their industrial activity, the type of mel or power used a.nd the anent of employment provided. Following the same lines, these aspects in respect of household industries are being taken up in the suoceeding pages.
Like registered factories and unregistered workshops, household industries also belonged to division 2 & 3 of the me and various major groups under it. The distribution pattern of household industries in these major groups revealed that the highest peroentage (23.97) was found in major group 29 dealing with Manufacture of Leather, Leather o.d
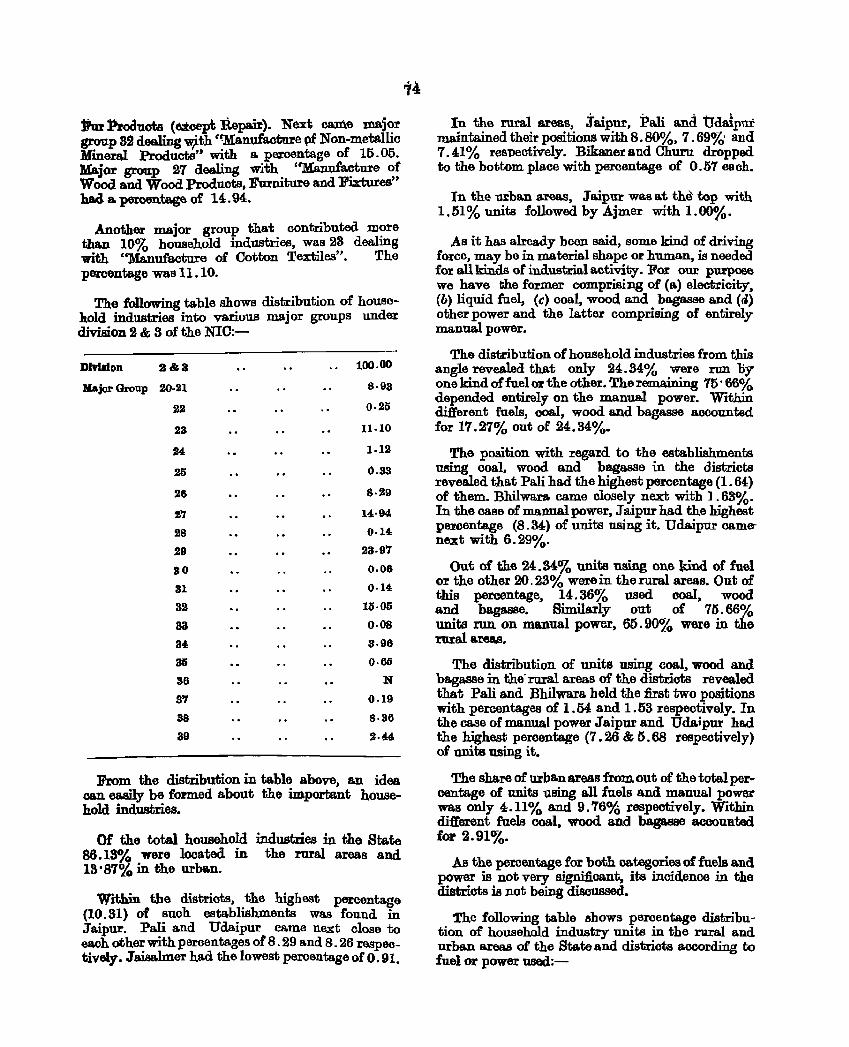
Iur Produots (~oept Repair). Next callie major group 32 dealing w).th C!Manufacture ~f Non-metallic Mineral Products" with So percentage of 15.05. Major group 27 dealing with u){a,nuiacture of Wood and Wood Produots, Furniture and Fixtures" had & percentage of 14:.94:.
Another major group that contributed more than 10% household industries, was 23 dealing with "Manufacture of Cotton Textiles". The percentage was 11.10.
The following table shows distribution of household industries into various major groups under division 2 & 3 of the NIC:-
Division 2&3 100.00
MajorGronp 20·21 8·93
22 0·25
23 11·10
24 1·12
25 0.33
26 8·29
tl1 14·94
28 0.14
29 23·97
SO 0·08
31 0·14
32 15·05
33 0·08
34 3·96
SIS 0·60
36 N
3'7 0·19
38 8·36
39 2·"
From the distribution in table above, an idea can easily be fo:rmed about the important household industries.
Of the total household industries in the State 86.13% were located in the rural areas and IS '87% in the urban.
Within the distric-te, the highest percentage (10.31) of suoh establishments was found in Jaipur. Pa.li and Udaipur came next close to each other with peroentages of 8.29 and 8.26 respectively. Jaisalmer had the lowest peroentage of O. 91.
74
In the rural areas, j"aipur, Pa.li and tJdalpur maintained their positions with 8.80%, 7.69%' and 7.41 % respectively. Bikaner and Churn dropped to the bottom place with percentage of 0.57 each.
In the mban areas, Ja.ipn wa.sat th~ top with 1.51 % units followed by Ajmer with 1.00%.
As it has already been said, some kind of driving force, may be in material shape or human, is needed for all kinds of industrial antivity. Por our purpose we have the former comprising of (a) electricity (b) liquid fuel, (c) coal, wood and bagasse and (d) other power and the latter comprising of entirely manual power.
The distribution of household industries from this angle revealed that only 24.84% were run by one kind or fuel or the other. The remaining 75' 66% depended entirely on the manual power. Within different fuels, coal, wood and bagasse accounted for 17.27% out of 24.34%.
The position with regard to the establishments ming ooal, wood and bagasse in the districts revealed tha.t Pali ha.d the highest peroentage (1.64:) of them. Bhilwara came closely next with 1.63%. In the case of manual power, J aipur had the highest pementage (8.34:) of units using it. Udaipur camenext with 6.29%.
Out of the U. 84% units using one kind of fuel or the other 20.23% werein the rural areas. Out of this percentage, 14.36% used coal, wood and bagasse. Similarly out of 75.66% units run on manual power, 65.90% were in the rural area.s.
The distribution of units using coal, wood and bagasse in the· rural areas of the distric-ts revealed that Pall and Bhilwara held the first two positions with percentages of 1.54 and 1.53 respectively. In the case of manual power Jaipur and Udajpur had. the highest percentage (7.26 & 5.68 respeotively) of units using it.
The share of urban areas from out of the total percentage of units using all fuels and manual power was only 4.11% and 9.76% respectively. Within different fuels ooal. wood and bagasse accoun.ted for 2.91%.
AJ;, the percentage for both categories of fuels and power is not very significant, its inoidence in the distric-ts is not being discussed.
fie following table shows peroentage distribu~ tion of household industry units in the rural and urban areas of the State and distriots according to fuel or power used:-
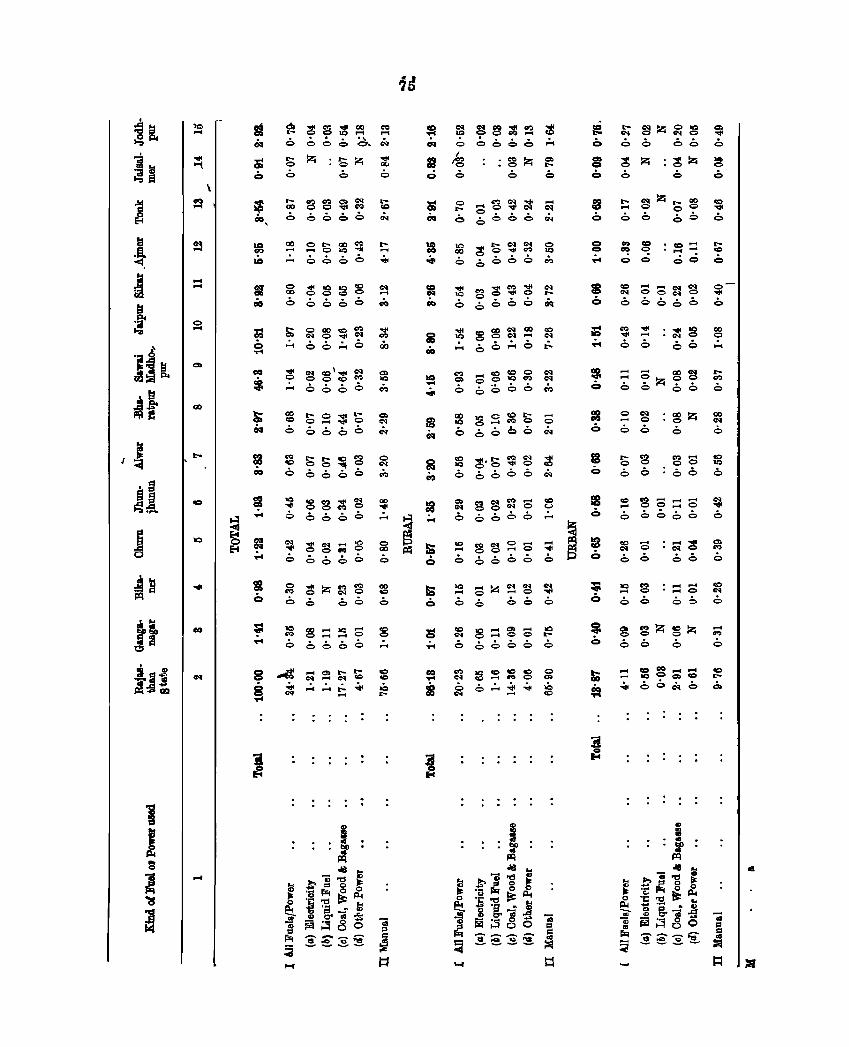
j o
. .. Jt
.... ....
....
* ;:!:~~~ ~ 6o~o~~
~ ~ ~ ~ ~ 6 66'::' 6
co 0"" 00 «> r-1 1""""1 0 lQ --:tI
..=.t 0660
o <1'1010<0 co OOCQO
6 6666
~ ~ ~ ~ ~ ~ 66..:.c';'
~ ~ 81~ ~ ..:.. 000 0
~ g S ~ g 6 6666
:s bg~8 o 0060
~ ~ 8 ~ ~ o 6066
~ ;:!: ~ .. ~ o 06.0 0
liS ~Z~S 6 6 60
~ ~=:sc: 6 6666
1'0 <=> .:..
~ ~~~~ ~ o ~ooo':"
~ C!b~~ ~ 6 6606 Ct:.
~ 8 ~ ~ ~ ~ 6 6066 Qq
~~~~~~ .:.. 6 c,':" c, .;..
~~~~~~ c, ooc,o it:.
~~S~b::; QoC,ooQq
:g ~'b ~ ~ ~ ! 060 000N -
~ 8 ~ ~ ~ ~ 6 b b 0 cO ~
~ 'S 2 :=! 8 o 6';' 0 0 ~ ; ~ ~ ~Ze:!~ ~ 6 0 60 6
~ ~:::~~ ~ 6 0000 0
«> IQ <0 '" '" 0 C"'I CCI r-1 C'I") 0 <= o 0':"";"";" .Q "" .... 1'0
~ ~ Z ~ :g 6 6 66
:; ~ ::e=: <:> <:> 0 <:>
~ e!8~2 6 6666
s s ~::; o 0 : 0 6
= co ...... """"' ...... ..... 00 ..... 0
o 60 0 6
~ C; :;q~ 6 6 0 6
..........
...... <=> 06
::: ~~;!C: ..;.. 60Qq6
00
"" o
.... «> C,
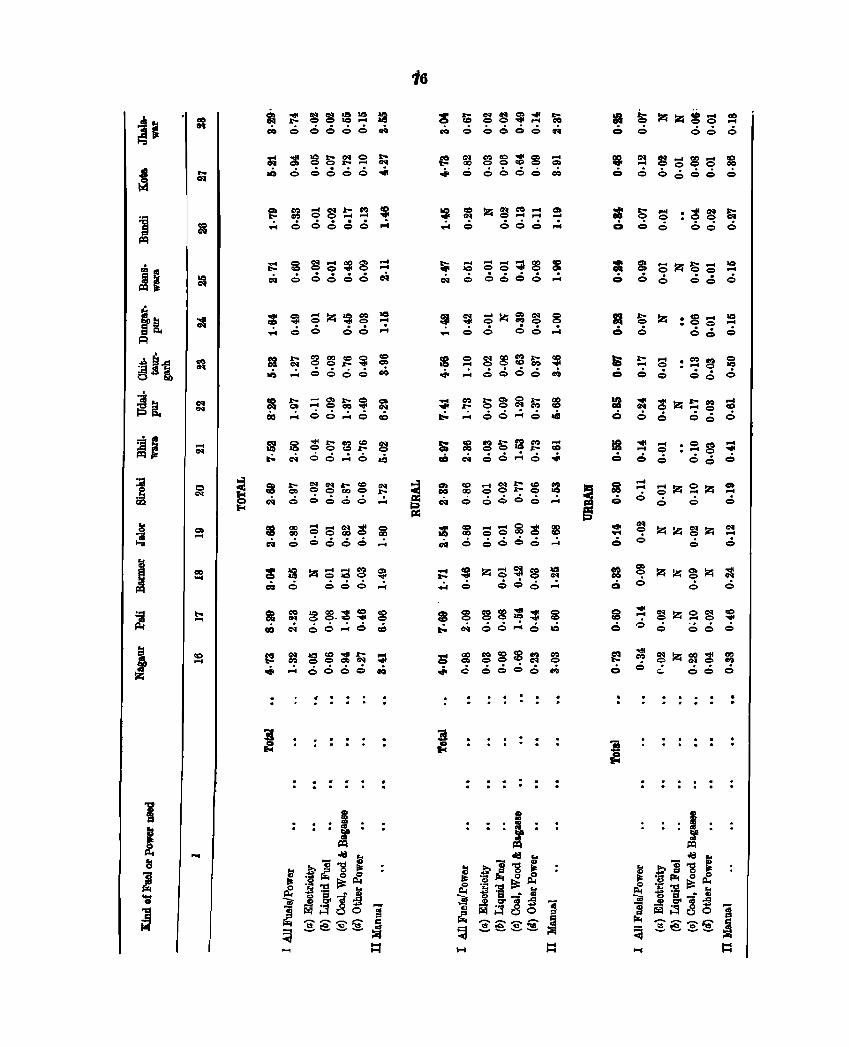
ti ~ r=l
~ji! ~ o ~
J
...
~;ssm~:a OOQ66660<.
10 I'- cq Q I'QQI'-_ c<II
6066 "'"
~ i:1 8~~~ $ ~ oOC>QQ ....
t:= $ Sg~g::= cQ Q =.:.c,Q ~
:: ~ C:::Z;~~ ~ ~ Q 0 Q Q ..!t
f3 ~ ~~,ie~ 8 .0 0066 eo;
f§~~S~~~ .;."60,...6 10
@S;S~~8~ cil Q 6 oo o,.:,
~ ~ c::c::~C!: ~ c06 6 666_
3mI!!t8;a~~ c0666 6 ,.:,
a ~ :g ~-~ $ ~ 110 cq 00":'0 ~
t!~g~~~~ ";'-6000"
~ . . . . . . .
:
J
3t;SS~~~ cQ':' 0666 cq
i'! ~ ~~~g g: ... 0000010
~~z~~::=~ .. 10 QOC,":'
~~88~~~ cQ Q =oec,":'
~~gZ~~8 .... =0 =6':'
18~~~~~~ .. ..:. 6006 cO
=~S8~~:8 ~ ... oQ":'o~
s; ~ SSf3~ ;; G"oo,,:,o..;.
~ ~ 8~t:8 f3 cQOQQCo":'
i:~8g~~:8 ~66Q06"':'
~ ~ ZC::~~ ~ ,.:.66 0 0_
lB8S~~~~ ~ cq 00":'0.0
~~S8$~~ ..;. e 660 0 co
. . . .
5 ~~8~8~ 6 0 0666 Q
:I: SS:i!~~ o 6 Q 6 Q Q
:; ~QzSs~ .:. = 0 Q e Q
=SZ:88~ .:. = cO C = ta ~s :~~f6 06 0 QoQ
= ~ i!:z;~! S gooooQ
18 :!:g:~!~ o 0 Q 0 Q 6
a ::= 8Z:::.:Z; ~ Q 6 6 Q 6
$ :::!:~Z~~!S o Q o 000
f!! = ~:Z;~i! ~ -= 0c:. 600
. .
. . . . . .
The pattern of dil'ltribution in the citie.'I revealed tha.t Jaipur h&d the highest percentage (29.75) of nch units. Next came Uda.ipurwith 19.06%. Kota ha.d. the lowest perqentage of 8.58.
Regarding fuel &nd power used, eleotricity, coal, wood and bagasse apd manual power were most COm.nlOnly used by such units in the cities. The highest percentage of units (4.40) using electricity was found in Jaipur followed by 2.' 01 % in
Kind of Fuel or l"owe'l' used Hibner City
Total 10'19
I. All Fuel./Po_r 4·50
(II) Eleotrlolt,r 1'10 (II) Liquid Fuel (e) Coal. Wood II Ba,_ s·os (cI} Other Power 0'32
U. Manual &H19
Thus far, discussion on various aspects o¥ household industries was confined to the entire cIa.ss i.e. division 2 & 8 of the NIO. Now those aspects would be taken up according to the nature of industriaJ. activity i.e. for the various niajor groups ranging from 20-21 to 89 in division 2 & 3. As such a discussion would be meaningful only in respect of important major 8foupB. The ones selected are 20-21, 23, 26, 27, 29, '32 and 38. It is in these major groups in which majority of household industries lie.
Major Group 20-11 : l'IIanufaoture 01 Food Products
Out of the total units in this major group, 82.05% were located in the rural areas and 11.95% in th.e urban.
Within the districts. the highest peroentage (10.85) of such units was found in Bhilwara followed. by Udaipur with 8.08%. Jaisa.lmer h.ad the lowest percentage of 0.07.
In the rural areas of the districts, the first two pla.ees were again held by Bhilw&r80 and Udaipur with percentage of 10.28 and 7.08 respectively. Jaisalmer had as Iowa. percentage as 0.01.
In the mban areas of the distriots, the top place went to Ajmer where percentage worked out to 2.25, Jaipur ca.m.e next with 1.88%. Jaisalmer wail apin at the bottom with 0.06%.
RegardiD,g fuel and power used, &8 many a. 95.88% units in this major group used one kind of fuel or the other. Only 4. 12% depended <m manual pow ...
77'
Ajmer. In the oase of coal, wood and bagasae' Jodhpur wa.s a.t the top with a percentage of 5' 54 followed by J aipur with 5.22%. J aipur was again at th., top with a percentage of 19.09 in the matter of use of manual power. Udaipur with 13.52%ca.me n~.
The following table shows percentage distribution of household industry unite according to fuel or power used in eaoh oity.
Jaip1U" AjDler Jodhpur Udaipur Ko_ City Cit1' Cit1' City 0iV
29'75 16'00 16'42 19'06 S'18
10·68 5'06 6·92 5·540 S'154
"40 Z'Ol 0'72 1'20 0·60 0·06 0'08 0'09
5t22 2'64 5·64. 4'09 1-79 1·04 0·91 0·60 0·22 0'06
lSl'09 10·44 9·00 13·OJ 00'4
Within the different kinds of fuels, the highest percentage (51.85) was a.co01ll\ted. for by 'Other power'. Coal, wood and bagasse oame next with 22·19%.
The distribution of units using other power in. the districts revealed that Bhilwara had the highest percentage (8'51) of them. Naxt came Pali with 5.15%. In the case of units using coal, wood and bagasse, J aipur had the highest percentage (2.87 followed by Kota with 2.20%.
In the rural areas, 79.48% out of 95.88% units belonged to the category using one kind of fuel or the other. Tho percentage using manllal powar was 2'57 out of 4'12.
Within different fuels 'Other Power' a.ooounted for the highest peroenfiag6 (41). 09) of units followed by coal, wood and bagasse with 15.91% in the rural areas.
The highest percentage of units (8.13) using other power in the rural areas of the districts was found in Bhilwar~ foll?wed by Pall with 4.87%. In the case of umts USIng coal, wood and bagasse Jaipur with 1.66% and Kota with 1.55% occupied the first two places respectively.
ThQ share of the urban areas for units using different fuels was 17.95% and those using manual power 1.55%. Within different fuels, other power and coal, wood and bagasse were more commonly used having percentages of 6.76 and 6.28 ;rae.. pectively.
The following table shows percentage diatriblltiOll of household industries belonging to majCD group 20-21 in the rural and urban areas 01 the State and districts aooording to fuel or power used 1_
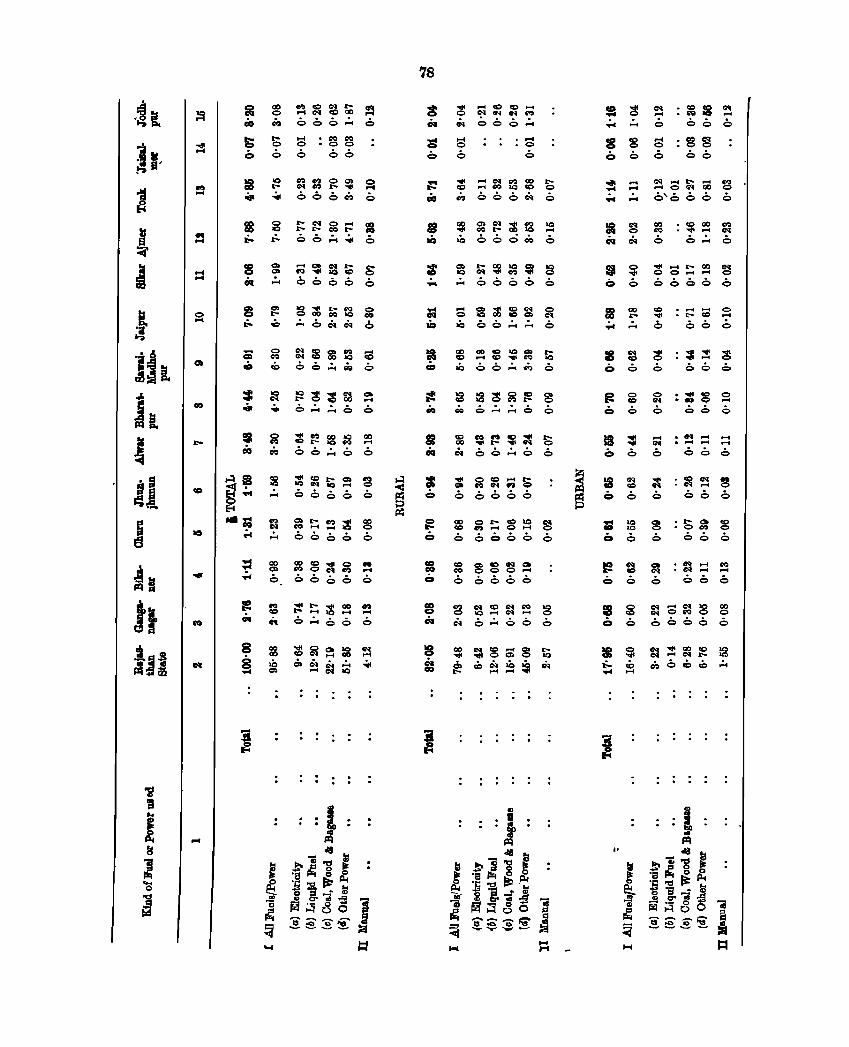
iii ~a
J !~
11 !~I
.... ....
...
s ~ ~~~~::3 Co Co 666':' 6
S ~ S :~~ 6 6 6 66
:8 ~ ~~~~::: .. ..:.. 666cQ 6
= g ~~g~~ .;.. ~ 66':''':'' 6
8 g ~~~~ S cR .:. 6666 6
g ~;g~tS c; cC 6 6 .:..;; 6
I!:~~~ ~ 6 .:. .:. 6 6
""" I') co 10 00 f.C .t- IQ C'I') .....
66':'6 6
~m l8 ~~t;~ ~ g.;.c .:. 6666 6 Eo! ... = ~ ~~~~ ~
;.. .:. 6666 6
i ~
~ ~8~g ~ 6 6666 6
~ ~~~~ ~ " 6':'66 6
. . . . . .
78
i ~
;:!: C:;~~;; eN Q66":' ...... .. ... ..... o .... 00
6 6
""" .... CNC':ICO.,. <Q .... v.l1O<Q0
cQ666~6
~ ~ ~ ~ ~ ~ .o66ocQ6
~~~~*~ .:. 6666 6
c: ~~~~ ~ .Q 6 6 .:..:. 6
CIO CIO cc 10.,. .,. co .... (g ... ~ IQ
.Q 66":'c::. 6
:8 :g~g~ ~ cQ o~~o 0
~~r?!$::~ eN 66':'6 6
: g~t;S 6 6666
~g~8~~ 6 6666 6
CC> .,. C e<I c=-I') 000 ....
6 6666
2 ~:::~~ ~ eN 6":'66 6
~~8:;;g~ g: cC~~~ ~
. .. .. .. . ...
~;:!: ~:~Ii~ .;...:. 6666
S 8 S :~~ 6 6 6 66
=: = ~S~;l~ .;.. ..:. 6'666 6
=~ ~:~~~ OIItN 66':'6
= ~ ~S~~~ o 6 6666 6
.. P""4I ...... 0 • t"- co ....... 66 0
:8~ ~:~;:!:~ 066666
~~ ~:;!;:gS 666 66 6
6 6 6 6 6 6
~~ ~:~~S 666666
:;: :g g :Sg 8 666666
te ~ ~ :~:::~ 6 6 6 6 6 6
II g ~ S~ ~ ~ o 6 6666 6
:I ~ ~~~~:g .;.. .g cQ 6 cO cO .:. ...c ...
i ~
,.
.. .... .. .. ... .
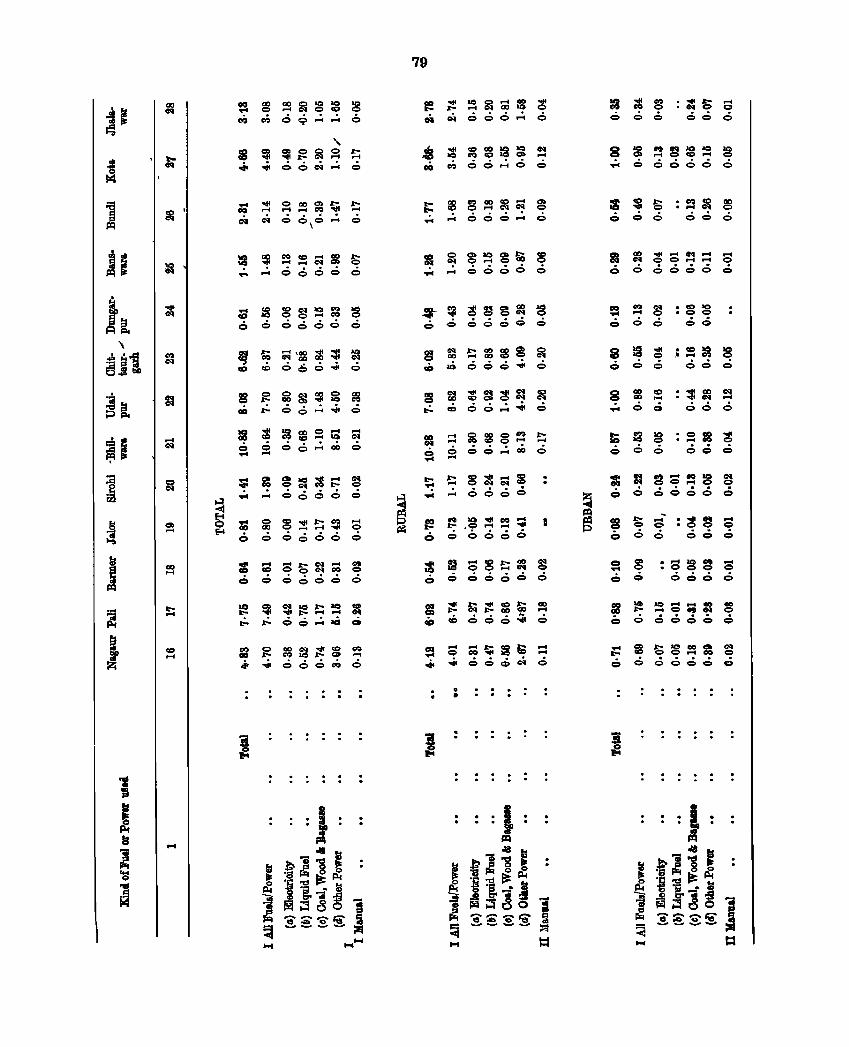
...... CII
eo> ......
co ......
= ......
....
~~~~:g~:g 0; cO oc?":''':' 6
" ~ *~j2~~~ .;. ~ 66c<.":' 6
.... "'" OClOC:O>~ ~ 00 ................ ~ "'" .... c<. 0:<. 6 6,6":' 6
~ ~~~~~S .... ..:. 6666 0
S~8~~~:g 6666066
~ t; ~'~ ~ ~ ~ CCI <D 666"';' 6
~ g ~~~15 gs 00';"6 0 ":'''';'0
:I CS~~~S~ 5= S 6 0 ":'00 0
8:!:~~ g 6666 0
is Ci:I SS~;::! 0666660
~ * ~~~~ ~ .;.,;.. 6 0 ":'oG ci
~~~~;!8~ .. ...;. 606~ 6
. . . . . . . .
79
~;! ~~CX;:'& ~ cqCll666":'6
'* i'! ~~~~ ~ cO C') 60":'0 0
~ ~ 8~~~ ~ .... ...... 666":' 0
B a.i ~~~&i ~ .......... 6666 0
.~~Sg~g 6066606
g ~ ~~::8~ a.i cO.o 606 "';'6
~ ~ ~8}~:l ~ .,:. = 66":'''';' 6
.::: ~~8~ ~ 5= ~ 66":' cO 6
~ ~ 8~~:8 .... ..:. 6666
~ ~ ,g ~ ~:;jI I 600600
:~S8~gg~ 0606060
SI i! ~~~&i ~ ., <D 060~ 6
= g c;::~:gfD::: .. "'" oo~c<. 0
· . . . .. · . . . .
· ·
8~~S~~:g ,:. 60060 6
iI~S::3~~ o 0 6 6 0 6
"'" .... CII...... .... 00 .......... 0 0600 6
t;f8g:~=~ o 0 0 00 0
:; I: aS~g ~ OOOOQOQ
~s:i:~~C? o 0 0 66 0
~g :SgaS 666000
= t!! ~g;;= ~ 0006000
~ $S:g~=~ OCOOQOO
. . . . . . . .
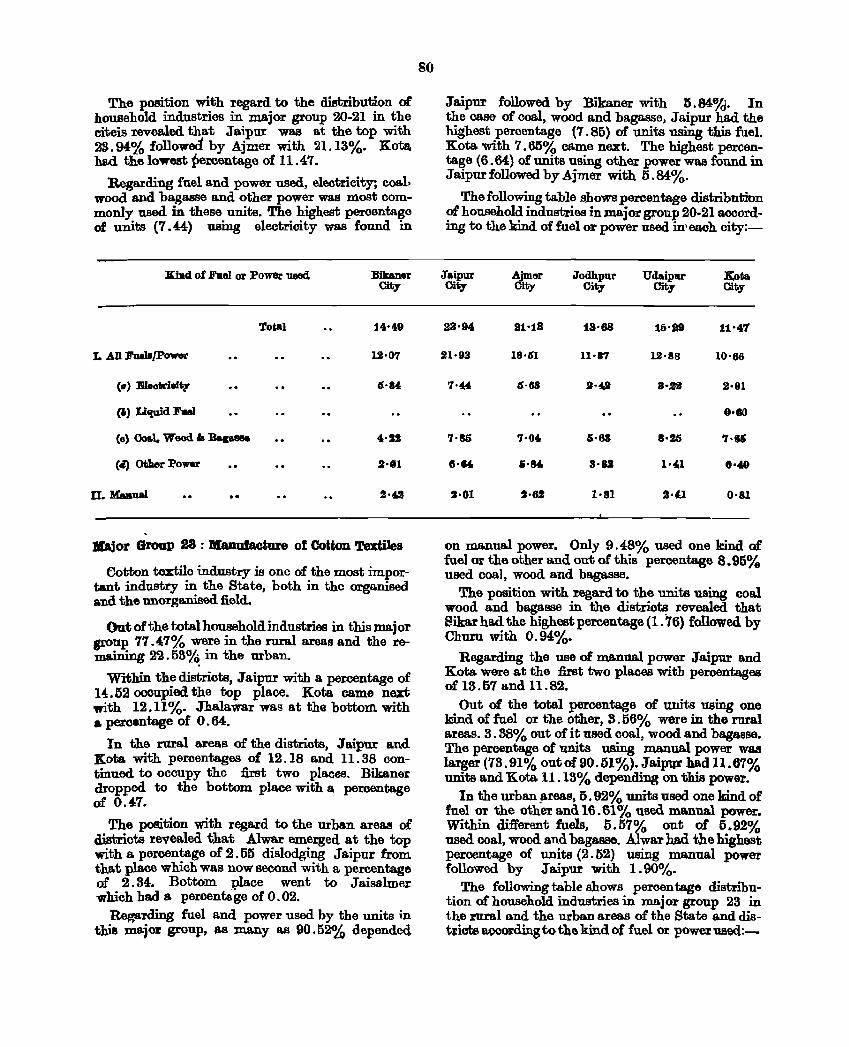
The position with regard to the distribution of household industries in major group 20-21 in the citeis revealed that Jaipor was at the top with 23.94% followed by Ajmer with 21.13%. Kota had the lowest percentage of 11.47.
Regarding fuel and power used, electricity; coal, wood and bagal!lSe and other power was roost commonly used in these units. The highest percentage of units (7.i4) using electrioity was found in
I'md of Faal or Power UII6d
L All ~fPower
c.) :mIeofrrioiiiF
ClI) Li'luid 1!'ul
(e) Coal. Weod .. BalaHe
(Ii) Otller Poww
II. Maaual
,
Total
:Hibner CiV
14,'49
12'07
G'"
4,'SI
2·11
!.4,Z
:Major Group 28 : Manufacture of Cotton Textiles
eotton textile industry is one of the most important industry in the State, both in the organised and the unorganised :field.
Ou.t of the total household industries in this majo!' group 77.4:7% were in the rural areas and the remaining 22. 53~ in the orban.
Within thedistriots, Jaipur with a percentage of 1~.52 occupied the top place. Kot&. came next with 12.11%. Jhalawar was a.t the bottoID. with .. percentage of 0.64.
In the rural areas of the districts, J aipur and Kota with percentages of 12. 18 and 11.38 continued to occupy the first two places. Bikaner dropped to the bottom place with a percentage of 0.4:7.
The position with regard to the urban areu of districts revealed. that Alwar emerged at the top with a percentage of 2.55 dislodging Jaipur from that place which was now second with a percentage of 2.34. Bottom place went to J aisalmer which bad a percent6ge of 0.02.
Regarding fuel and power used by the units in this major group, J).S many as 90.52% depended
80
Jaipur followed by Bikaner with 5.84%. In the case of coal, wood and bagasse, Jaipur had the highest percentage (7.85) of units using this fuel. Kota with 7.65% C8rme next. The highest percentage (6.64) of units using other power was found in Jaipur followed by Ajmer with 5.84%.
The following table shows percentage distribution of household industries in major group 20-21 according to the kind. of fuel or power used in' each city:-
Jaipur ,AJmM' Jodhpur Udaipv ]to. CiV City CiV City City
23'94 21'13 18·. 16'. 11'47
21·93 18·61 11·17 12·88 10'66
7·4.4: G·g i'.4rJ 3'22 2·81
9·10
7·85 7'040 5·83 1·25 7·15
G'14o ,.84, 3·U 1·4.1 "40
1·01 1·61 1'81 2·4,1 0'81
on manual power. Only 9.48% used one kind of fuel or the other and out or this percentage 8.95% used ooal, wood and bagasse.
The position with regard to the units using coal wood and baga.sse in the distric~ revealed that Sibr had the highest percentage (1.76) followed by Churn with 0.94:%.
Regarding the use of manual power Jaipur and Kota were a.t the :first two places with peroentages of 13.57 and 11.82.
Out of the total percentage of units using one lcind of fuel or the other, 3.56% were in the rural areas. 3.38% out of it used coal, wood and bagasse. The percentage of units using manual power was larger (73.91% out of 90. 51%). Jaipur had 11.67% units and Kot& 11.13% depending on this power.
In the urba.n ~rea8, 5.92% units used one kind of fuel or the other and 16.61% used manual power. Within different fuels, 5.57% out of 5.92% used coal, wood and ba.gasse. AIwar had. the highest percentage of units (2.52) using manual power followed by J a.ipur with 1.90%.
The following table shows percentage distribution of household industries in major group 23 in the rural and the urban areas of the State and distficte aoeordingto the. kind of fuel or power used:-
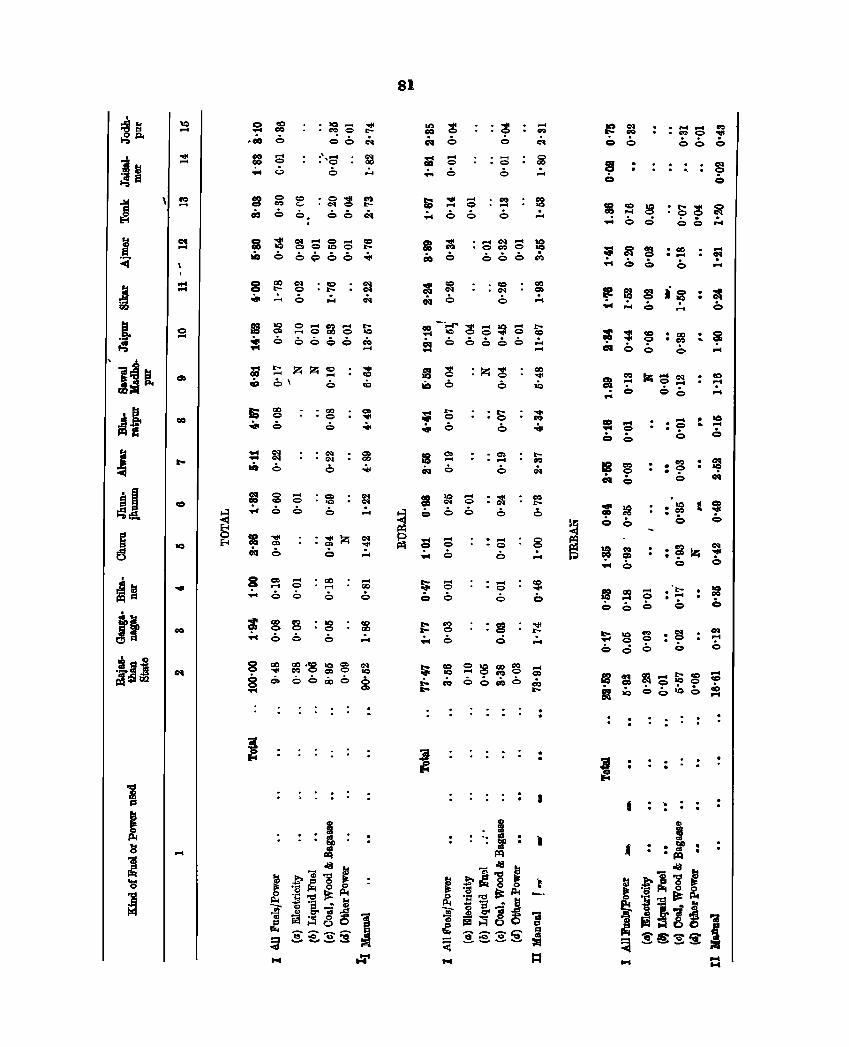
, 13 l
~I ~ Al ~ ~~
it .til I!::SUl
lQ -, .... -
o -
...
g~~8g8i!!! aO,;,,;,~,;,,;,~
8~2::e:~ ~~6.!t ~
o ..... C'I")..... t'-0000 lQ
,;, ,;, ,;,,;, 0,
- 00 '0
,;,
• c:<I • C'I
,;,
• 00 · -,;, • lQ • 0
,;,
....
-00
.:.
~.~ :g ~ ~ 00 eX:.';' ,;,
.... . . . . CD
81
:~ o
· ... • 0
,;,
· ~ · ... ,;,
.... ... rN o go
.:..
: S ~ S ~ ,;,,;,,;, ~
• co • C'I ,;,
00 CD
.:..
GO --...r "'" _ lQ - ~ 'P'4 lQ 00 .... 0 co Go:io,;,,;,,;,,;,':" .... ....
· ~ '0 ,;,
• CD · .... ,;,
- "'" • C'I ,;,
--• 0 ,;,
· ... • <:>
,;,
. .. . . .. .
. . D
. . : : : S <:,
:g :S~ ~ .... OQ 00'"
-00 · .... o
~ ~ s i~ : all ...... <> ..... 0
• 00 · ... <>
· ~ · -o
, :s 8 :'~ coo 0
= g ~ :? o Q 0 <:»
I ' . .
:. ~ .... (0 --....
• lQ io. ...
o
011 ... co
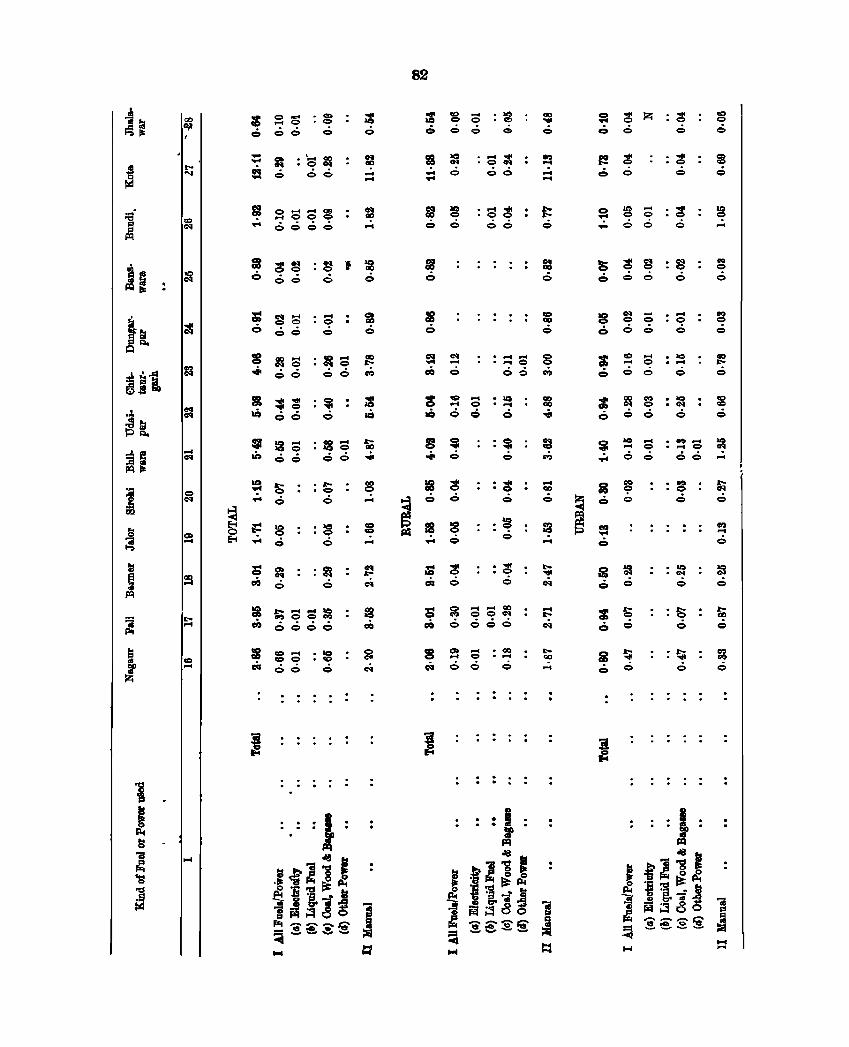
.,.!t~...::I .- 1:1 13 ~StoO
~l
cc ....
::S~:g o 0 c::. 0
81 ..... SSS~ 0000
· .... • Q
Q
... ...
=~~:~: ~ ~c)6 c) 10
~:8S ::gS t; aQ 00 c)c) •
• It:'-• Q o
• >e • Q
c::.
:~ o
:i f;;SS~ ~ Oc)c)O
· . · .
82
.... ~ • Q '" 66
• .-4 ~ • Q Q
Q Q
• >e · ... c)
: $ c.
: ~ Q
· """ • Q Q
8 ::! S :~ ciI 6 Q 6
· . · .
.., ... ... ...
.... GO
c::.
.,... QO
....
· "'" • Q o
· ~ • Q
Q
."'" • Q o
• C'I • Q
Q
· ..... • Q o
• IC · ..... o
• IQ • eN
Q
... Q
o
~ ~ S :~S ::1 ';'OQ 00":'
• IQ • C'I
Q
• It:'-• Q
Q
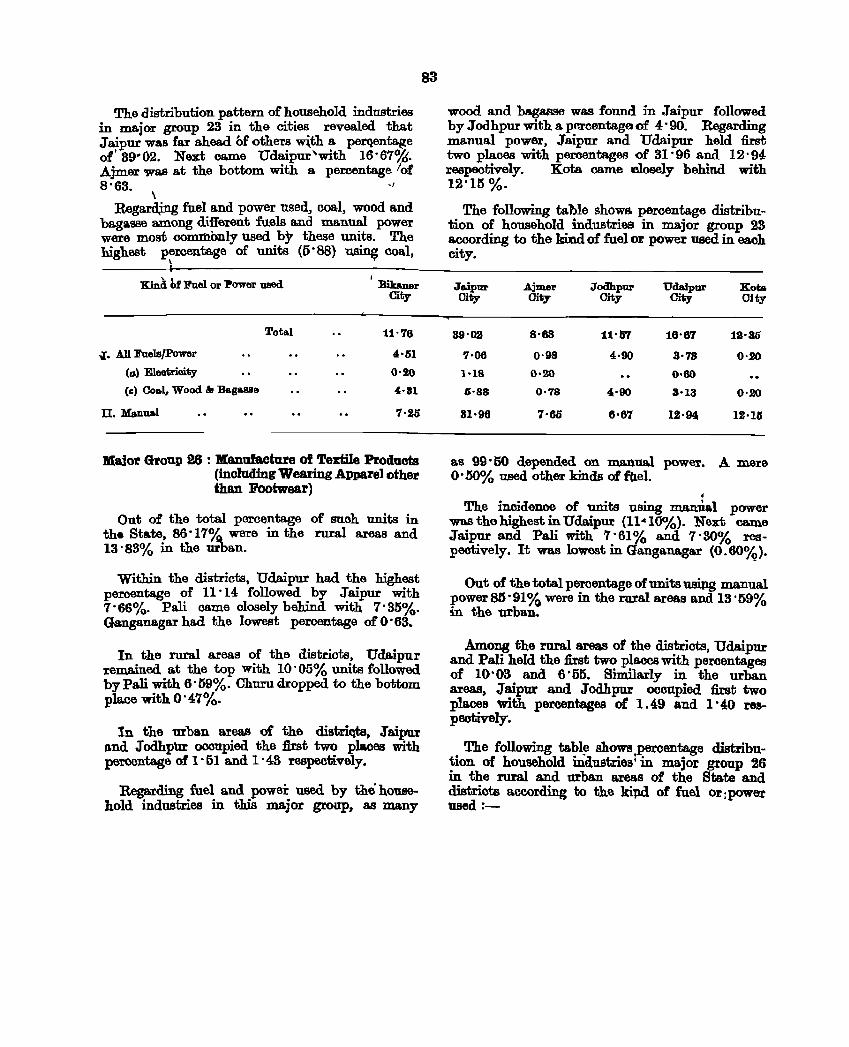
The distribution pattern of household industries in major group 23 in the cities revealed that J aipur was far ahead of others with a perqentage of' 39~02. Next came Udaipur'with 16·67~. Ajmer was at the bottom with a percentage lof 8'63. .,
\ Regard,ing fuel and power used, coal, wood and
bagasse among different fuels a.nd manual power were most commonly used by these units. The highest percentage of units (f)'88) us~ coal,
\
Kind bf l!'uel or :Power 'QSed Bikaner City
Tota.l 11-76
-l. A.ll Faels/power !h'51
(a) Eleetrioity 0'20
(c) Coal, Wood. '" Ba.g&S88 4·11
II, Manual 7'!Mj
Maior Group 26 = Manufacture of Textile Products (including Wearing Apparel other than Footwear)
Out of the total percentage of BUch units in the Sta.te. 86 '17%. were in the rural area.s and 13' 83% in the urban.
Within the districts, Udaipur had the highest percentage of 11 '14 followed by Jaipur with 7' 66%. Fuji came closely behind with 7' 35%. Ganganagar had the lowest percentage of 0' 63.
In the rural areas of the distriots, Udaipur remained. a.t the top with 10' 05% units followed. by Pall with 6' 59%. Chum dropped to the bottom pmce with O· 47%.
In the urban MeaB of the distriqts. Jaipur and Jodhpur occupied the first two places with p6TOentage of 1'51 and 1'43 respectively.
Regarding fuel and power used by the' household industries in this major group, as many
83
wood and bagasse was found in Jaipur followed by Jodhpur with a. percentage. of 4' 90. Regarding manual power, Jaipur and Udaipur held first two places with percentages of 31'96 and 12'94 respectively. Kota came closely behind with 12'15 %.
The following taMe shows percentage distribution of household industries in major group 23 according to the kind of fuel or power used in eaoh city.
Ja.iPlJr Ajm.er Jodhpur Udaipur Xota City City City City City
89'02 8'68 11'57 16'67 12'35
7·06 0·98 "·90 3'73 0'.20
1-18 0-20 0-60
G·88 0·78 4'90 3-13 0'20
31'96 7'65 6'67 H·94, 1.2,15
as 99' 50 depended on ma.nual power. A mere 0' 50% used other kinds of ftlel.
• The incidence of units using manual power
wasthehighestinUdaipur (11"'10%). Next came Jaipur and Pall with 7'61% and 7'30% respectively, It was lowest in Ganganagar (0.60%).
Out of the total percentage of units usipg manual power 85' 91% were in the rural areas and 13' 59% in the urban.
Among the rural areas of the districts, Udaipur and Pali held the first two places with percentages of 10'03 and 6'55. Similarly in the urban Mea8, Jaipur and Jodhpur occupied first two places with peTOentages at 1.49 and l' 40 rupeotively.
The following tabl~ shows percentage distribution of household industries: in major group 26 in the rural and urban areas of the State and districts according to the kipd of fuel or : power used =-
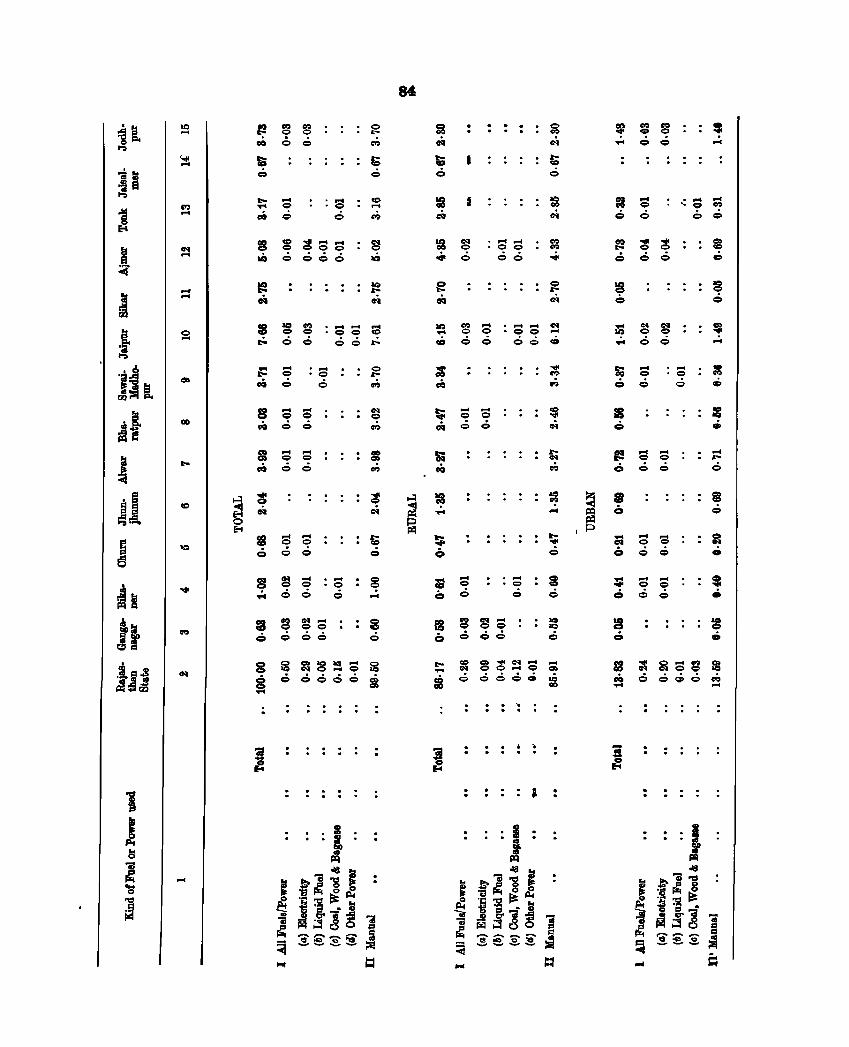
1 1
IN ... .... ... e ...
...
· ... • Q
e
~ 8 ~:::::::: .a 0 0 0 0
.. . .
;; :::: ::::: .. ~ cOo 0 ~
· .... • Q o ...
~~:s:::: l5 oc>c>c> 81 . . . . . . . .
84
....
: : :
....... • Q 0
c>c>
· . . · ..
• • • c:g
· .... • Q
Q
~
= CD....,." .......... IN OQ .... e 0>
o ooo~ 10
. . '. . . . . . -. .
GO
.... • Q
o
s •
• ~ ~ Q S m = C>OOQ~
. .
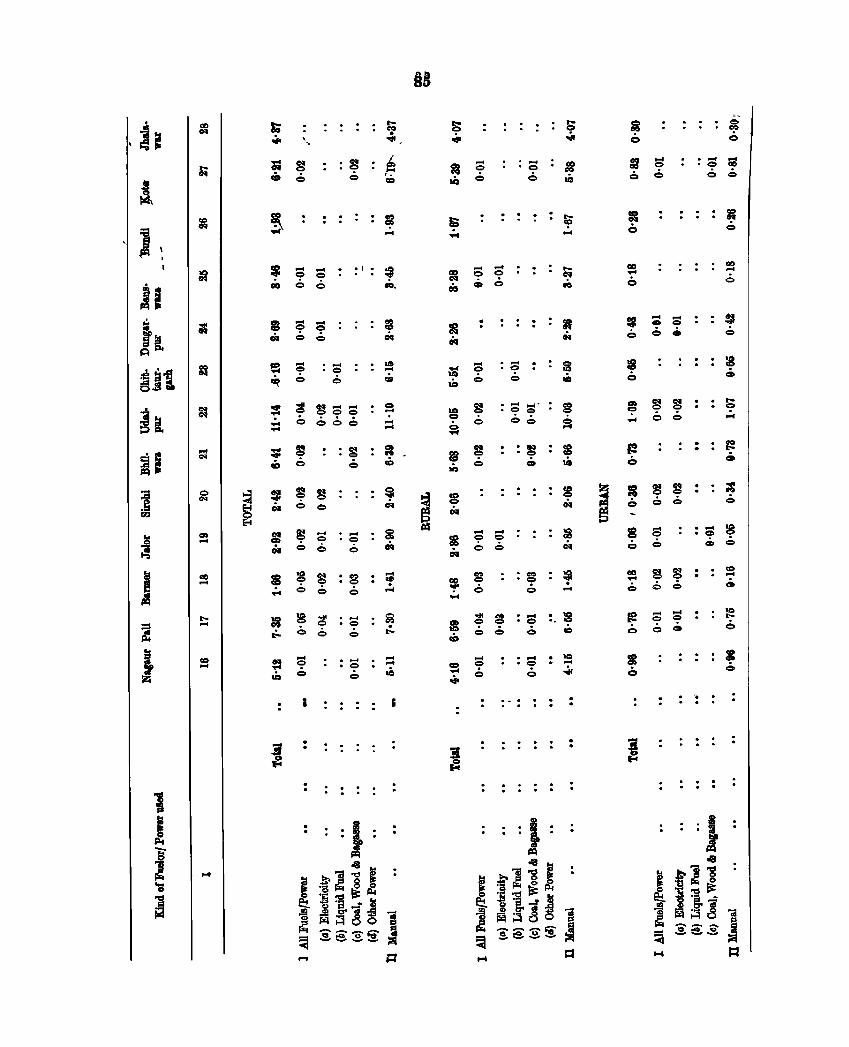
AB
i~ 00 SO t- t<- o S 0 0 o<iI C'-I
0 . 0 0 0 eo ~ .. , .... .. .,j, , 0 10
t- O; ~ o o<iI ,~ .... 0 .... gg 0-1 o .... ....
IN 00 a 0 ' 0 GO 0 00 GO
eD 0 6 6 c:w:I
Q 6
!\ 0 CI:I lQ .0 0 0
c:c ~ ~ fj; ff IS ~ :a oq
..-( ... .;.. Q 0
A ...
~ = ... ... 0' 0 ~
.... ... ~
co GO
9 9 co 10 10 ... ...
II " ca. 0 = 6 10 0 0 10, ei.s I'Q
.:. m .... .... !Ie ,; ~ ... ... = i~
0 0 CI:I ~ 0 I • 0
ci1 0 <:> .. ... Q 0 • 0
~Il< " :e~-; " ~ - 0"" ~ - . ...
~ ~ ~ "
0 , 10 ... ~ c '9
t3.s ... ~ 0 0 cia lQ C> <:> U. 0 ~
~& ~ .. ~ g-- 0 ~
........... co ~ ~ 0'1 ~ "':" <:> 0 .... lr.I ,0 <:> 0 0 0
.:. 000 ..:.. 0 ' , ... Q 0 00 0 ... 0 0 ... ... ... ... ....
~I ... ::;: ~ • o<iI
5 ~ .1t'I :8 I! · ..., o<iI 00 .. (8 o 0 · t-
eD 6 .; c:Q 0 .0 <iI lr.I
~ 0
1 0 ~ =- ~ ~ 0 . ~ I · : ~
~ S ~ ~ e1:
C'I . CI:I · ~ "
10 0 0'1 0 ci1 = .; 0 rD "
0
~ en 8: ~ .... · .... 0 - ... lj 8 .... o .... 8 - 0 • 10
CD
= '? 10 0 'C?
~ c.. 6 10 0 ciq 0 6 Ot Q .; • .;
cq
IS ., II 8 ~ • c:w:I .... S • C'-I ~
co S o<iI · : CI:I
J ... o <:> fI! co • 0 - 9 · -.... <:> 6 .; - .. .; .:. - .; c 0 <iI
.;..
t- 18 ~ ~ · .... 0 'OIl a o _
:. ~ Ie -- 10
~ - • <:> ~ :I <:> • 0 0 0 t-
.;.. .:. 6 .; t- o 0 0 CI:I .; 0 os 10
eD
!:i CI:I ... .... , t ~ · ... - · - 10 :i ... <:>
• <:> .....
~ 0 • 0
..... .D 0 <:> .0 0 0 .,j, 0
0 ... ; : : I 0 · : '.
! .
! 11 .
~
1 I • IB i
I
oJ: : :i
I llQ I 08 ... <18 .. 018 ...
.& 1 '8 E .t- "i! -g s: .. ... ~ eo. , ..
~ ~~ 0
0 '03 r;q ! '03 ~ ~ ~ '0 0
~ ~:aa:~ :§"CI 1"CI1i: ~ ~ g.~ j ! G) 'g. ~ 11 Pg. .~ ..:
~ r;i1~ 0 I ~~ 0 l ! iia~8 1 ~ ~e;~~ :;a :!:e~~ ~
:$e;~
.... t:t t-I = t-I 1:1
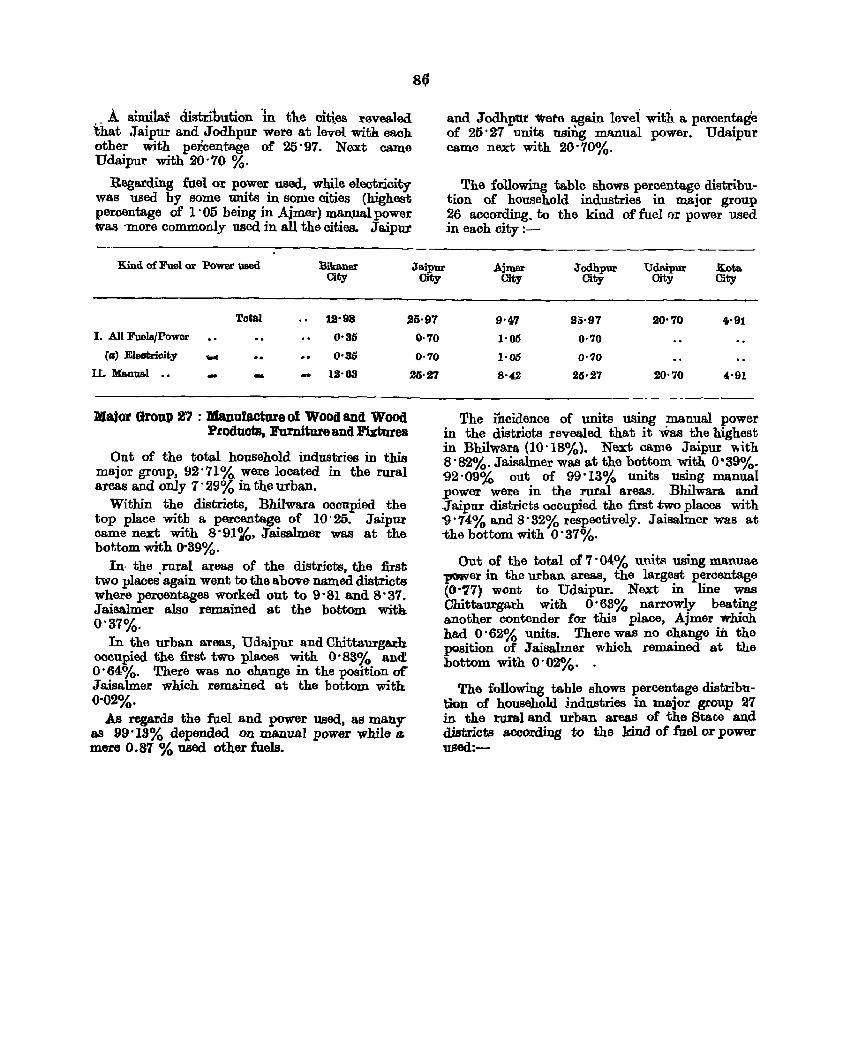
.A. sim.i.1a.r distribution 'in the dties revealed 'that Jaipur and Jodhpur Vlere at lev'el with each other with percentage of 25'97, Next came Udaipur with 20'70 %.
Regarding fuel or power used, while electricity was used by some units in some cities (highest percentage of l' 05 being in ,Aimer) manual power tvas more commonly used in all the cities. Jaipur
and Jodhpur 1kete again levei with a percentage of 25'27 units usIDg manual power. Udaipur came next with 20' 70%.
The following tablo shows percentage distribution of household industries in m.ajor group 26 according. to the kind of fuel f)r power used in eaoh city !--
Kind of Fuel or Power used Bikaner Ja.ipur Aj:mer Jodhpur City
Udl\ipur City
Kota. City City City
Total 1a'98 25'97
I. All Fuels/Power
(a) EleGtrioity
IL Ms.nua,l •• -... -0'35
0'35
- 12'63
Major GrouP Pl1 : Manufacture 01 WoOd and Wood Ptoducts, Furniture and Fixtures
Out of the total household industries in this major group, 92'71%. were located in the rural areas and only 1'29% in the urban.
Within the districts, Bhilwara ocoupied the top place with a percentage of 10'25. Jaipur came next with 8'91%. Jaisalmer was at the bottom with 0'39%.
In· the rural areas of the districts, the first two places' again went to the above named districts where percentages worked out to 9' 81 and 8' 37. Jaisalmer also remained at the bottom with 0'37%.
In the urban areas, Udaipur and Chittaurga.rh. occupied the first two places with 0'83% and. o . 64%. There was no change in the position or Jaisalmer which remained at the bottom with: 0'02%.
As regards the fuel and power used, as many as 99 '13% depended on manual power while 1&
mere 0.87 % used other fuels.
0·70
0·70
2li'27
City
9'47
1'05
1'05
8'42
2;;·97
0·70
0·70
25·27
20'70
20'70 4'91
The i'hcidence of units using manual power in the distriots revealed that it was the highest in Bhilwara (10'18%). Next came Jaipur v.ith 8'82%. Jaisalmer was at the bottom with 0'39%. 92'09% out of 99'13% units using manual power were in the rural areas. Bhilwara and .Jaipur districts ocoupied the :first two places with '9'74% and 8'32% respectively. Jaisalmer was at -the bottom with O· 37%.
Out of the total of 7 . 04% units using manuae ~er in the urban areas, the largest percentage (0-'17) wont to Udaipur. Next in line was Chittaurgarh with o· 63% narrowly beating another contender for this place, Ajmer which had O· 62% units, There was no ohange in the position of Jaisalmer which remained at the bottom with 0'02%. .
The following table shows percentage distribu'1;ion of household industries in major group 27 in the rural and urban areas of the Stalie ~d districts according to the kind of fuel or power used:-
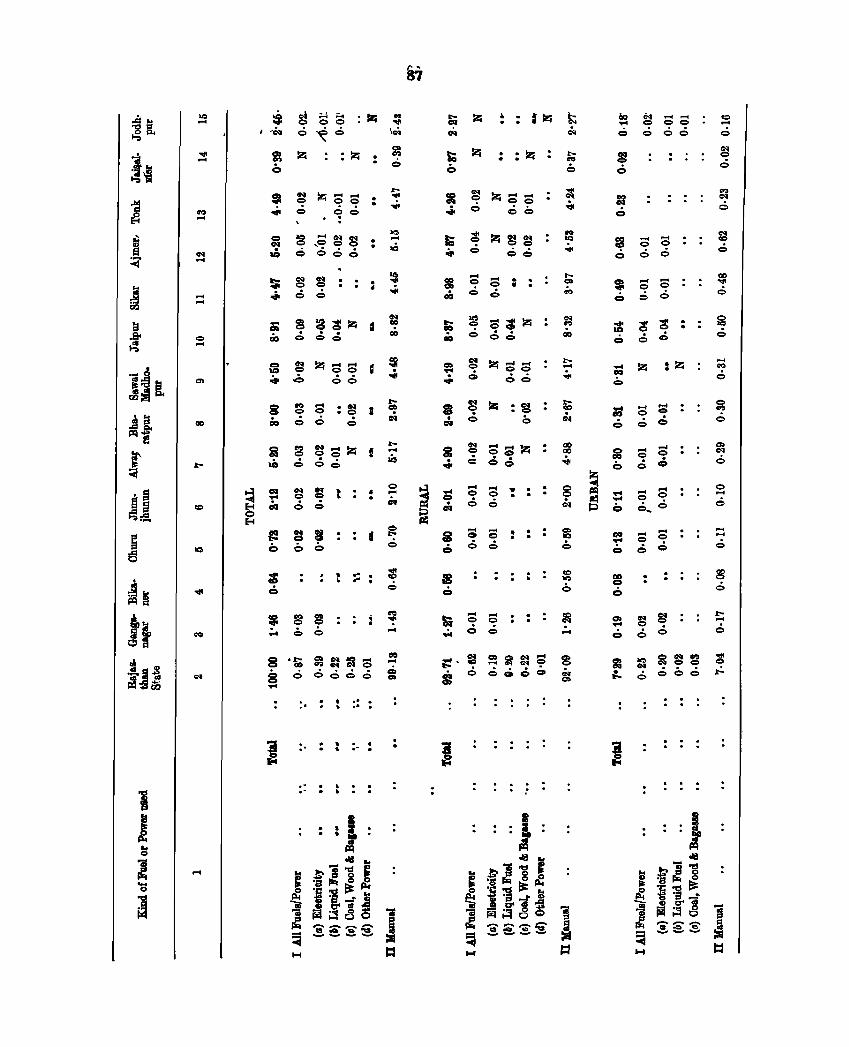
lQ -'01< -'" -
-.... <:> ....
co
o~o , . 'c<I
: : Z 00 ~ o
$ ~ t;!!;c:c: .... 0 0 Q
e :
g ~ ,c: ~ ~ ..; ~ 006
:s ~ZSS ';'.0 c:. 6
• eq • <:> Q
~ ~ ~ S Z 10 0 00
~ ~ ~ ~ t ~ OJ 0 6
~ S I o 0 0
.e
e' • e' •
, e' · .. : ...
o ~ · ~ >0 · .... • .c
· ~ e' ..
!t-." ... .;,
o ~ .... o ..
." ~ ..:.
l' ,
87
: : Izc
to ~ Z~S .;. 6 06
· . • •
50 :g c:;: IZ4 ., Q c:. c:.
z-c <:> CO <:>
o ON • <:>
C.
. .
.... . ...
lao ~--..... 0 <:> 0
o 0 00
. . • e
COl - ... '!" 0 0 c 6 0
~ : : c
<0 -o
~ ON
o
o ... 6
... ....
.;.
8t ~ ~~~ ~ ~ 6 666 ..,:.
. . . . . .
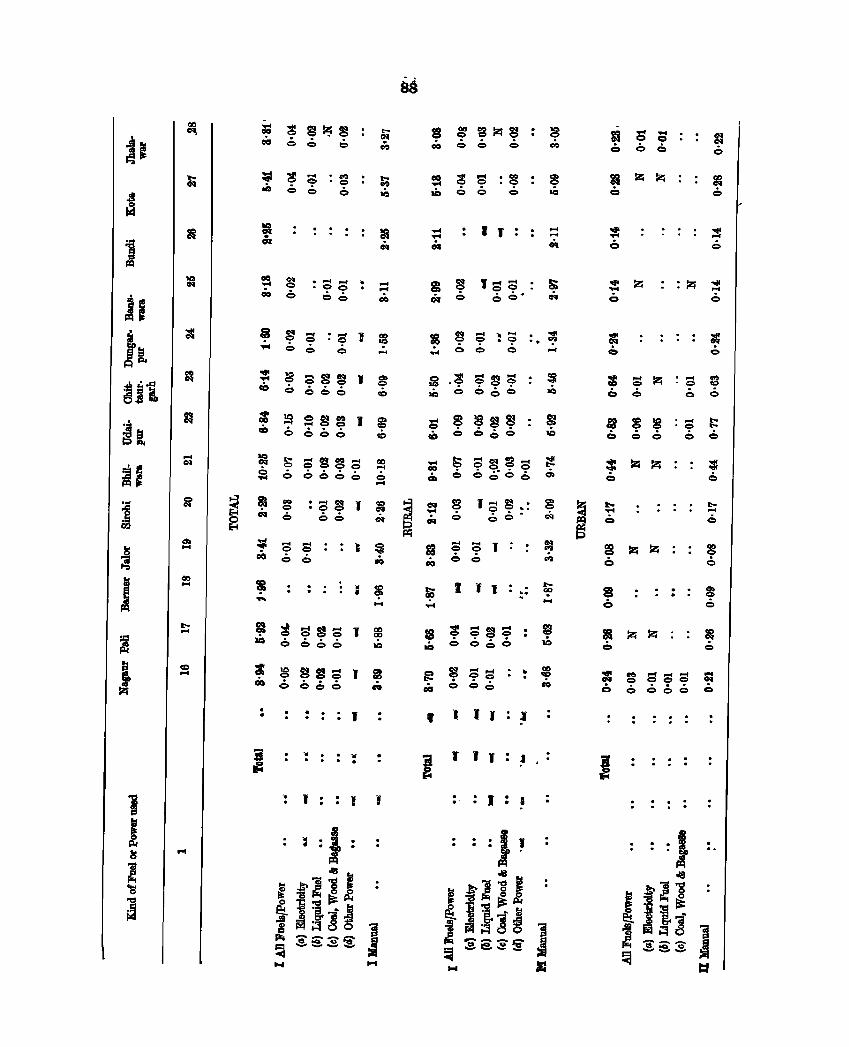
00 ...
.,.. ....
co ....
o co:. o Q
6
. ........ . .... . co· .... ;0 6 cO
0 .... 0Q
Q
s ~ ~ 1 ~ 666 co
SSg S !!!l 666 b Q ....
~ S :S~ J ~ C<lI 6> 66 cq
.... ....
g ~SSC:J ~ .0 6600 Ie
= :g~~SJ a Co 0 b e 6 C'O
. •
.. .
I
.. . :
.: I I I
I , :
-..... • <:>
Q
IS .~ s ~ S .a Q 666
.... .... Cca
:. ~ ....
B ~ ~~~ : ~ tis Q66 6 IQ
I 1 1 : to: t;
........ 00 ee
If ., 1 I .l
, , , :. I: I
....
:g :8 .; 0
.. ~ 6
= a sse: ; .; 66';6 co
. . o •
:} . . .
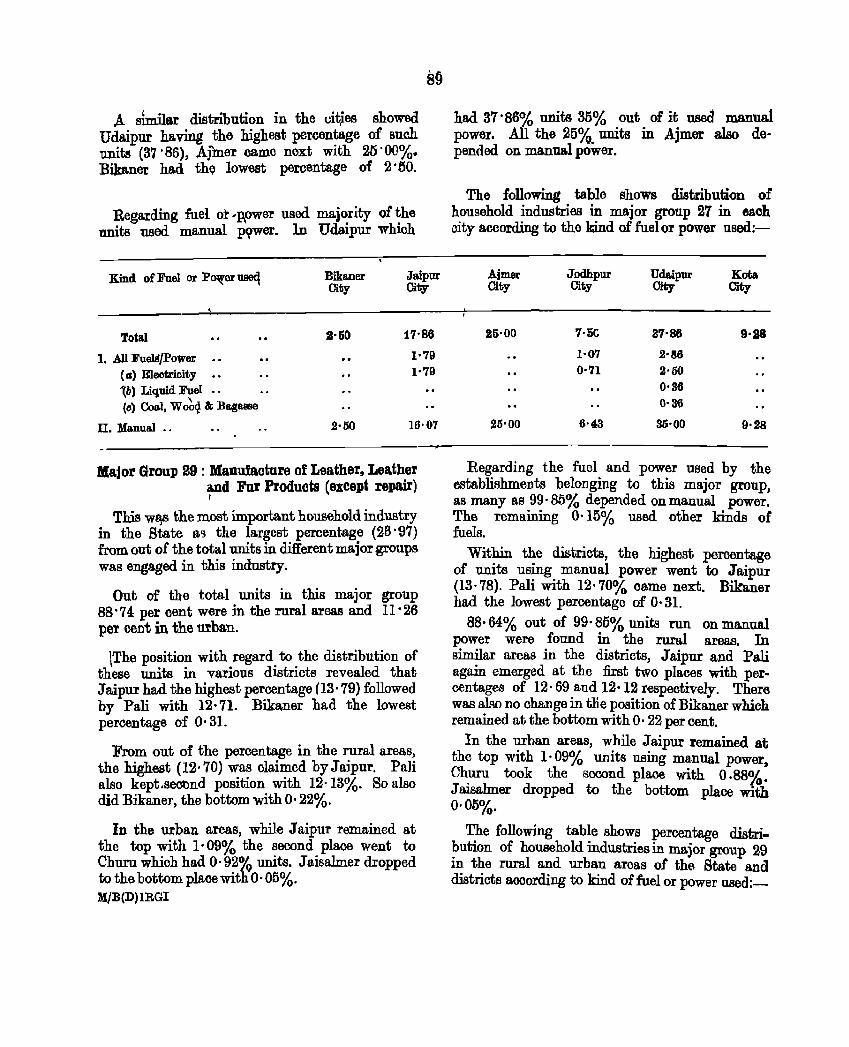
A similar distribution in the cit,es showed Udaipur having the highest peroentage of BUM
units (37 '86), Afmer oa.me next with 25 '00%. Bikaner had the lowest peroentage of 2 . 50.
Regarding fuel or 'p"ower used majority of the units used. manua.l pywer. In Udaipur whioh
Kind of Fuel or P~er ~ Bika.ner Jaipur City City
Total 2'50 17'86
1. All Fuehl/Po1Ver 1·79 (,..) Eleotrioity •• 1'79 '(b) Liquid Fuel .. . .
\ to) Coal, Woo,! &; B&gasse
II. Manual .. 2·50 16·07
Major Group 29 : Manufacture of Leather, Leather and Fur Products (except repair) r
This w~s the most important household industry in the State 0.'3 the largest percentage (28' 97) from out of the total units in different major groups was engaged. in this industry.
Out of the total units in this major group 88' 74: per oent were in the rural areas and 11' 26 per cent in the mban.
\The position with regard to the distribution of these units in various distriots revealed that J aipur had the highest percentage (13,79) followed by Pali with 12·71. Bika,ner had the lowest percentage of O' 31.
From out of the percentage in the rural areas, the highest (12·70) was claimed by Jaipur. PaJi also kept,second position with 12· 13%. So also did Bikaner, the bottom with o· 22%.
In the urban areas, while Jaipur remained at the top with 1· 09% the second place went to Churn whioh had O· 92% units. Jaisalmer dropped to the bottom plaoe with O· 05%. l\I/B{D)lRGI
had 37' 86% units 35% out of it used manual power. All the 25% units in Ajmer also de· pended on manua.l power.
The following table shows distribution of household industries in major group 27 in eaoh aity according to the kind of fuelo! power used:-
Ajmer Jodhpur City City
25'00 7·5G
1'07 0·71
20'00
Udaipur City
87'86
2'86 2'50 0'36 0'36
35'00
Kota City
9'28
9·28
Regarding the fuel and power used by the establishments belonging to this major group, as many as 99·85% depended on manual power. The remaining 0·15% used other kinds of fuels.
Within the districts, the highest percentage of units using manual power went to Jaipur (13·78). Pali with 12'70% oame next. Bikaner had the lowest percentage of O· 31.
88· 64% out of 99· 86% units run on manual power were found in the rural areas. In similar areas in the districts, J aipur and Pali again emerged at the :first two places with percentages of 12· 69 and 12·12 respectively. There was also no change in tlie position of Bikaner whioh remained at the bottom with O· 22 per oent.
In the urban areas, while J aipur remained at the top with 1· 09% units using manual power, Ch_uru took the second place with 0.88%. J aisalmer dropped to the bottom place with 0·05%.
The following table shows percentage distribution of household industries in major group 29 in the rural and urban areas of the State and districts aocording to kind of fuel or power used:-
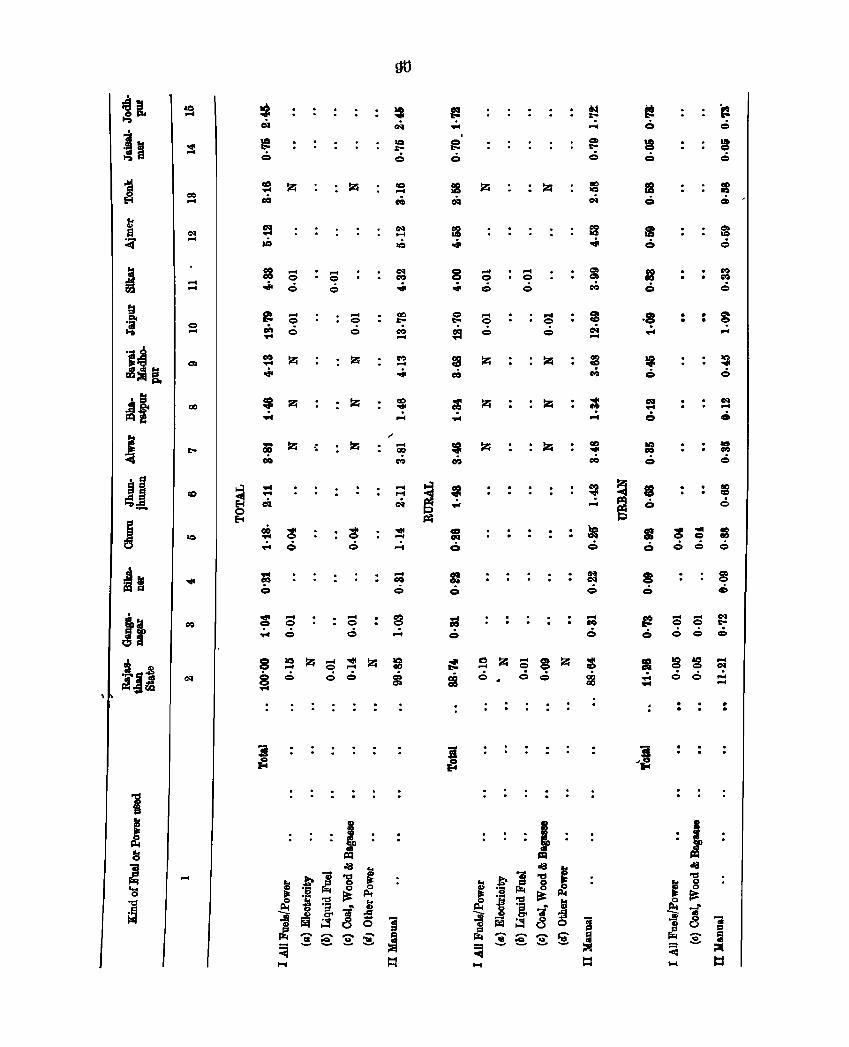
co ....
.... ....
<:> ....
= CI
.... <:> 6
..... <:> <:>
.... <:> 6
" .... QI)
co
.... .... ~
.... 00
<:>
, g 6
.... <:> 6
... <:> <:>
...
szSgz ;& 6 <:> 6 ~
·8 .... . .
. .
co co <:>
:
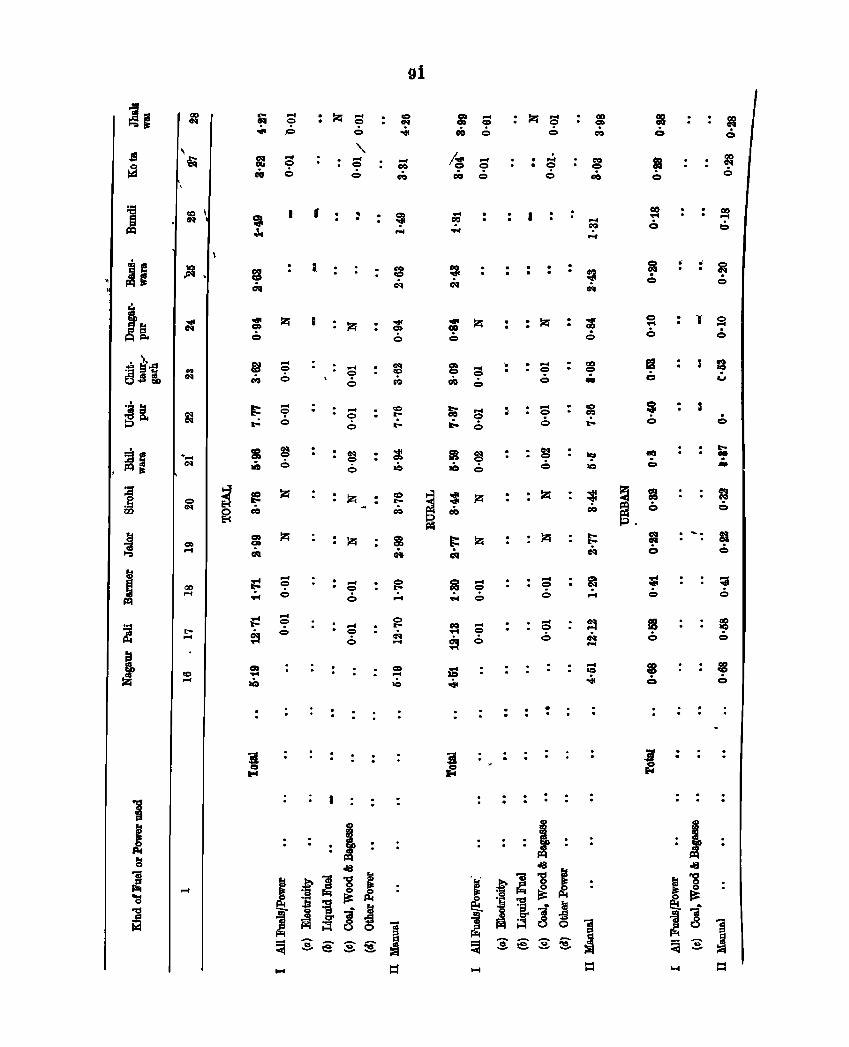
1 J
ccl • IN
00 ....
~ ....
cc ...
....
g CCI
.... <:)
p
.... 9 Q
.... <:> <:)
.... <:> <:>
.... 9 Q
.... 9 Q
f
I
"-8 Q
..... 9 Q
.... Q
Q
..... <= <=
J
CD .... .0
9i
'. ·
· ·
I
: z
: S o
s <=
:
. . .... ~ ....
: ~ <:)
9 -
<:>
<:> ... o
<:>
" .
. ~ <:>
.' <:) . ~ <:)
• -. 8;1
. .
e
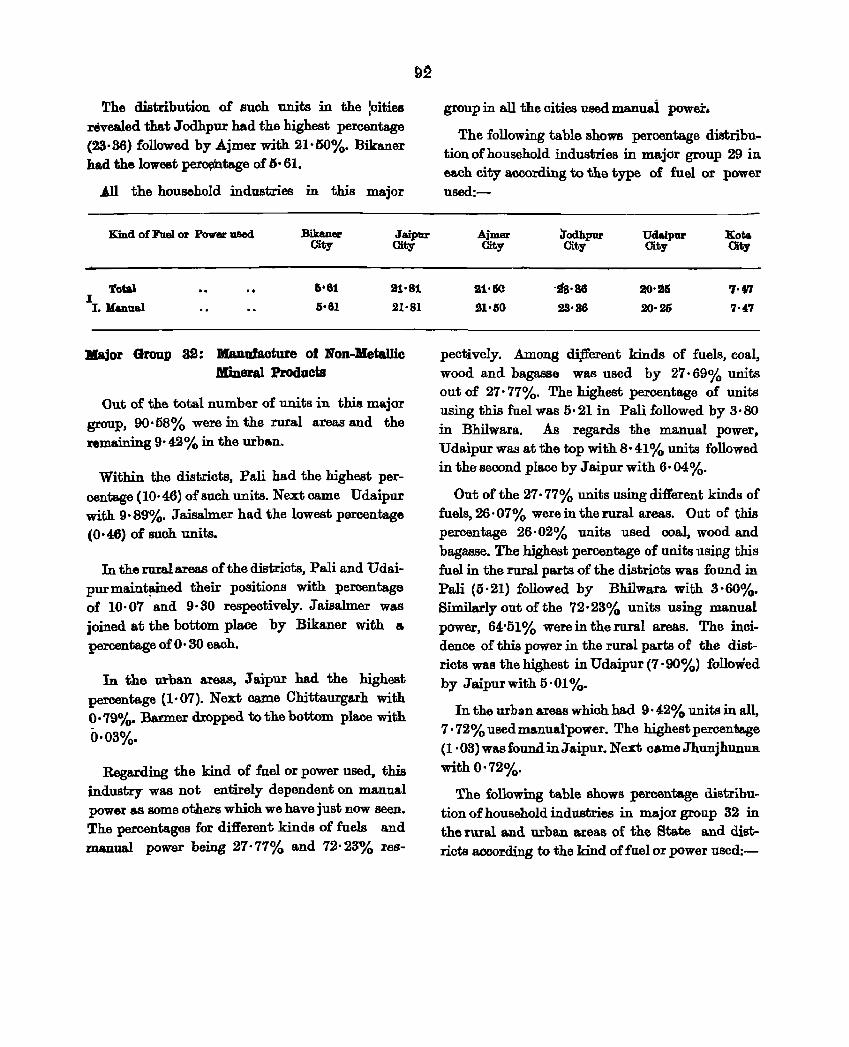
The distribution of such units in the :citiee revealed that Jodhpur had the highest percentage (23·36) followed by Ajmer with 21'50%. Biktmex had the lowest p~ta.ge of 6· 61.
.All the household industries in this major
Kind of Fuel or Power used
ToW .. I I. llanual
Bika.ner City
Jaip'llr City
21'81
21'81
Major Group 32: Manufacture 01 Non-MetalJic Mineral Products
Out of the total number of units in this major group, 90·68% were in the rural areas and the remaining 9· 42% in the urban.
Within the districts, Pali ha.d the highest percentage (10·46) ohuch units. Next came Udaipur with 9·89%. Ja.isalmer had the lowest percentage (0·46) of such units.
In the rural areas of the districts, Pali and Udaipurmaint~ed their positions with percentage of 10·07 a.nd 9·30 respectively. Jaisalmer was joined at the bottom place by Bikaner with 8.
percentage of 0·30 each.
In the urban areas, J aipur had the highest percentage (1·07). Next came Chittaurgarh with 0'79%. Barmer dropped to the bottom place with
0·03%.
Regarding the kind of file! or power used, this industry was not entirely dependent on manual power as some others which. we have just now seen. The percentages for different kinds of fuels and manual power being 27· 77% and 72· 23% re8-
group in all the cities used manuai power.
The following table shows percentage distribution of household industries in major group 29 in each city according to the type of fuel or power used:-
Ajmer City
5&1'50
21'50
Jodhpur City
'.'86
23'36
Udaipur Cit,.
Kota City
pectively. Among di.:fferent kinds of fuels, coal, wood and bagasse was used by 27· 69% units out of 27' 77%. The highest percentage of units using this fuel was 0·21 in Pali followed by 3·80
in Bhilwara. As regards the manual power, Uda.ipur was at the top with S' 41 % units followed in the second place by Jaipur with 6·04%.
Out of the 27· 77% units using different kinds of fuels, 26· 07% were in the rural areas. Out of this percentage 26· 02% units used coal, wood and bagasse. The highest percentage of units uS:$g this fuel in the rural parts of the districts was found in Pali (5,21) followed by Bhilwara with 3'60%. Similarly out of the 72·23% units using manual power, 64,01% were in the rural areas. The incidence of this power in the rural parts of the districts was the highest in Udaipur (7'90%) followed by Jaipurwith 0·01 %.
In the urban areas which had 9·42% units in all, 7 '72% usedmanual'power. The highestperoen1!&ge (1 ·03) was found in.J aipur. Next came JhunjhunUR with 0·72%.
The following table shows percentage distribution of household industries in major group 32 in the rural and w:ban arreas of the State and districts aooording to the kind of fuel or power used:-
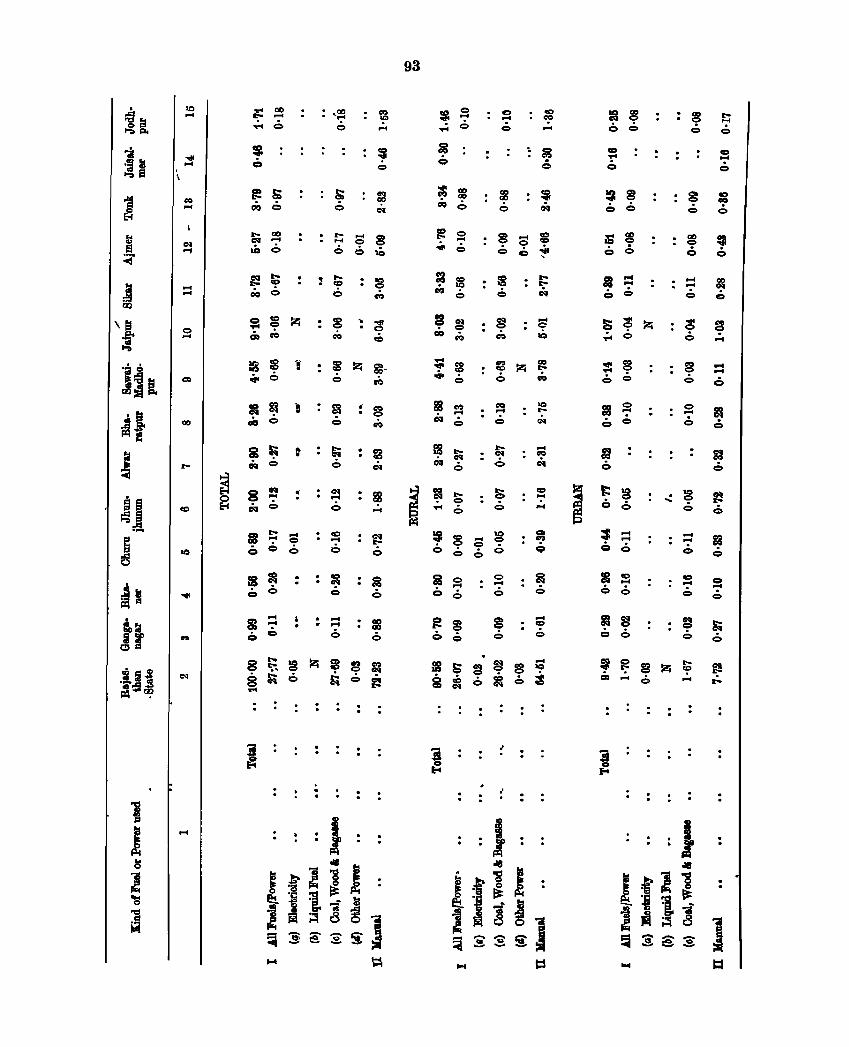
j c
1 I
. \
10 ....
.... ...
... ...
o ...
....
.... 6 • 00 . ' ....
o
~8Z:8 .:~ m CO .... ec
.. . .,..
m .... 0 ..... GO .:.. o - ~
ec .... 6
· .... · .... o
· · · ·
gg <:>
93
o .... 6
<:> ... 6
9 <:>
s ~ Z . . .... 0
9 <:>
.,.. .... <:>
= .... eo
9 9 <:> ...
.... .... 6
= .... 6
9 <:>
.... ... 6
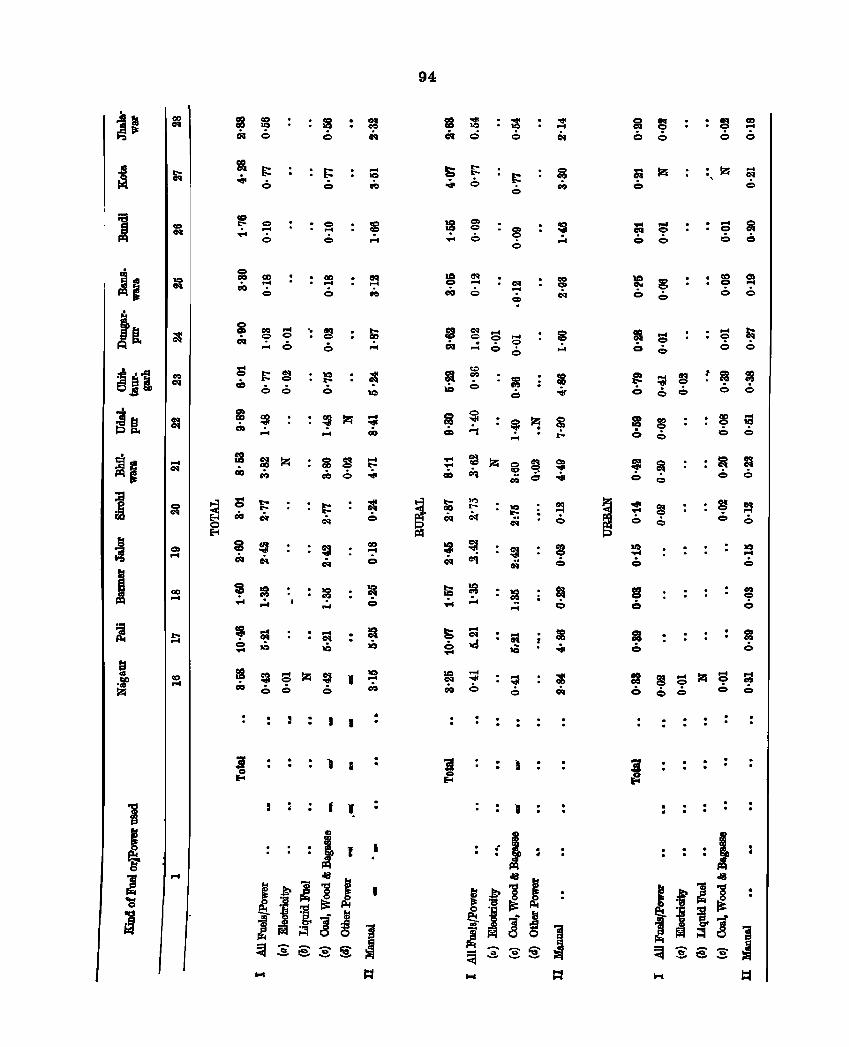
CD I"'t
GO I"'t
co I"'t
I"'t
te c> ........ b
~ al .:.. ... - b
GO ... e
I I
l I
GO ... o
94
.... ... 00 c> 00 c>
: -.
'.
g ...
J
10 -e
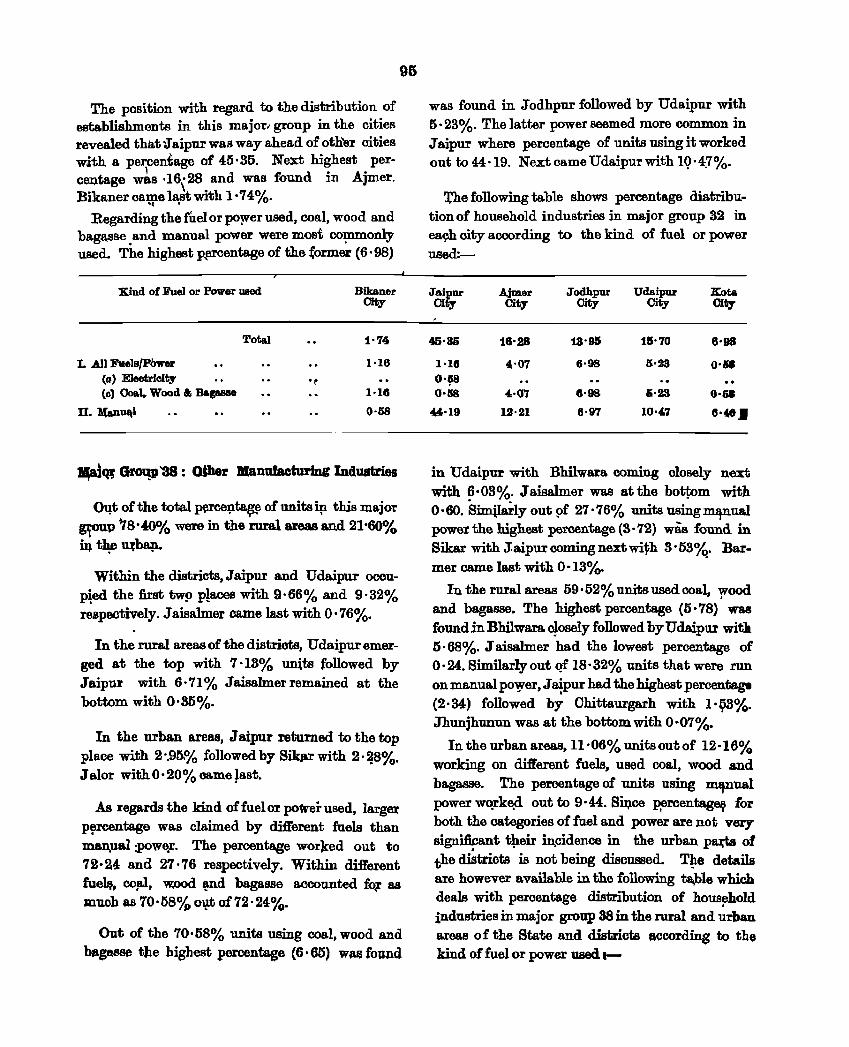
The position with regard to the distribution of establishments in this major- group in the cities revealed that ~ aipur was way ahead of oth'er cities with a percentage of 45· 35. Next highest percentage w~s ,16·28 and was found in Ajmer. Bikaner cawe 18:~t with 1· 74%.
Regarding the fuel or po~er used, coal, wood and bagasse. and manual power were most co~only used. The highest p~rcentage of the tormer (6·98)
Kind of Fuel or Power used Bikaner City
Total 1·74
I. All Faels/pbwer 1·16 (a) Electricity 'f (0) Coal. Wood & Bagasse I·U.
n. l(a,nu,,1 0·58
-.1Qf Groqp'38: Oiher IlanufaoturintC Industries
~t of the total ~rce~ta~ of units ip this major ~ou'P 78'40% were in the:rural areas and 21'60% U. t~ utbap..
Within the districts, Jaipur and Udaipur oooup~ed the first tw9 p!aces with 9·66% and 9'32% respectively. jaisalmer came last with 0·76%.
In the rural areas of the districts, Udaipur emerged at the top with 7 '13% units followed by Jaipur with 6·71% Jaisalmerremained at the bottom with 0·35%.
In the urban areas, J aipur returned to the top place with 2 '.95% followed by Silqu- with 2· ~8%. J alar with 0·20% came Jast.
96
As regards the kind of fuel or power used, larger p~roentage was claimed by different fuels than man}1al ;pow~r. The percentage worJced out to 72·24 and 27 ·76 respectively. Within different fue~, copl, w,ood ~d bagasse accounted fOI as much as 70'08% o-y.t of72·24%.
Out of the 70·158% units using coal, wood and bagasse the higbest percentage (6· 615) was found
was found in Jodhpur followed by Udaipur with 5·23%. The latter power seemed more common in J aipur where percentage of units using it worked out to 44 ,19. Next came Udaipur with 1Q' 47%.
':the following table shows percentage diatribution of household industries in major group 32 in eBQh oity according to the kind of fuel or power used:-
Jaipur Ajmer Jodhpur Udaipur Xot& City City City City City
45'85 18'28 13'95 115'70 8'98
I·US 4'07 6·98 5'23 0'. 0'98 0'58 4,·(J7 6'98 &'23 0'.
44·19 12'21 6·97 10·407 8'4,6 .I
in Udaipur with Bhihvara. coming closely next with ~·03%. Jaisalmer was atthe bot1;om with 0·60. SimiIaXlyout 9f 27'76% units usingm'tllual power the highest percentage (3,72) was found in Sikar with Jaipurcomingnextwi~h 3·53%. Barmer came last with 0·13%.
In the rural areas 59·52% units used coalJ ,,"ood and bagasse. The highest percentage (5'78) was found in Bhilwara. c!osely followed by Udaipur witlt 5·68%. Jaisalmer had the lowest percentage of 0·24. Similarly out qf 18-32% units that were run on manual po)Ver, J a!pur had the highest percentage (2·34) followed by Chittaurgarh with 1·93%Jhunjhunun was at the bottom with 0 0 07%.
In the urban areas. 11'06% units out of 12·16% working on dift'erent fuels~ used coal, wood and bagasse. The percentage of units using IIUplual
power w~rke.d out to 9·44. Si.J;tce p,ercentag~ for both the categories of fuel and power are not very signiDfant t\leir in.cidenoe in the urban paJ;ta of the distriots is not being disoussed. The details are however available in the following taJ>le which deals with percentage distribution of hous!"hold industries in major group 38 in the rural and urban areas of the State and districts aooording to the kind of fuel or power used I-
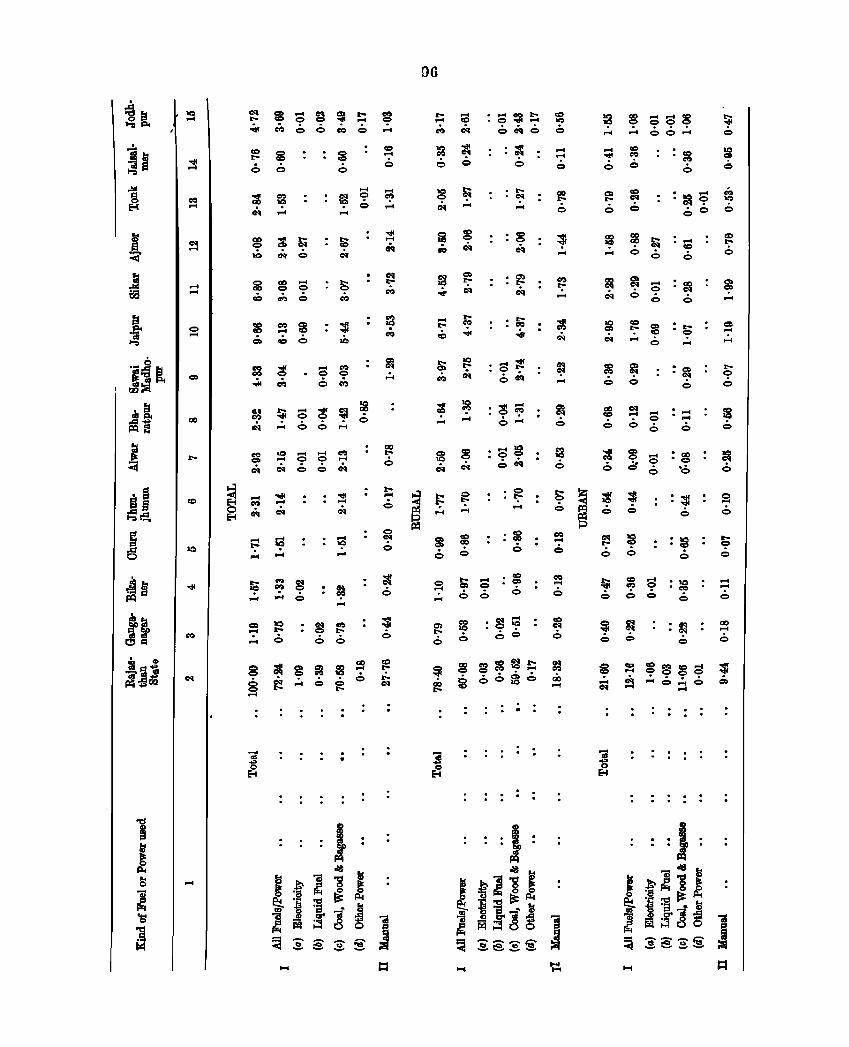
1C ...
... -00 -
00
...
~ ~gS~~ ~ "'II< .;:, 0000 CCI 0 ...
... m 0
..:.. 0
g ~C;~~: '" _ 0 0 ...
o .
I
-CCI ...
00 1:-0
o
00
-
:ac 00
o 1:-0 o C'I
.:..
0= 000
cOl
o ~ o 1:-0
C'I
o "'" ;:: o '? 0
0-
0- g o '? 0
OC'l
00 or;-....
0= o~
00
o ~ rei o Q';
o 0
o •
--o
00 1:-0
::>
--
: 10 S C'I 0
';0
0_ = o
000
O~
o
:s ..:.
o Cl> O~
o
o .... o ....
Q
g....c:ooo ~ 0 ~ 0 '6
::8 o
o 1C o CCI
o
o 0 . .
• 0 I .. I
ell -..:.
00 -.;
--o
00 .... 6
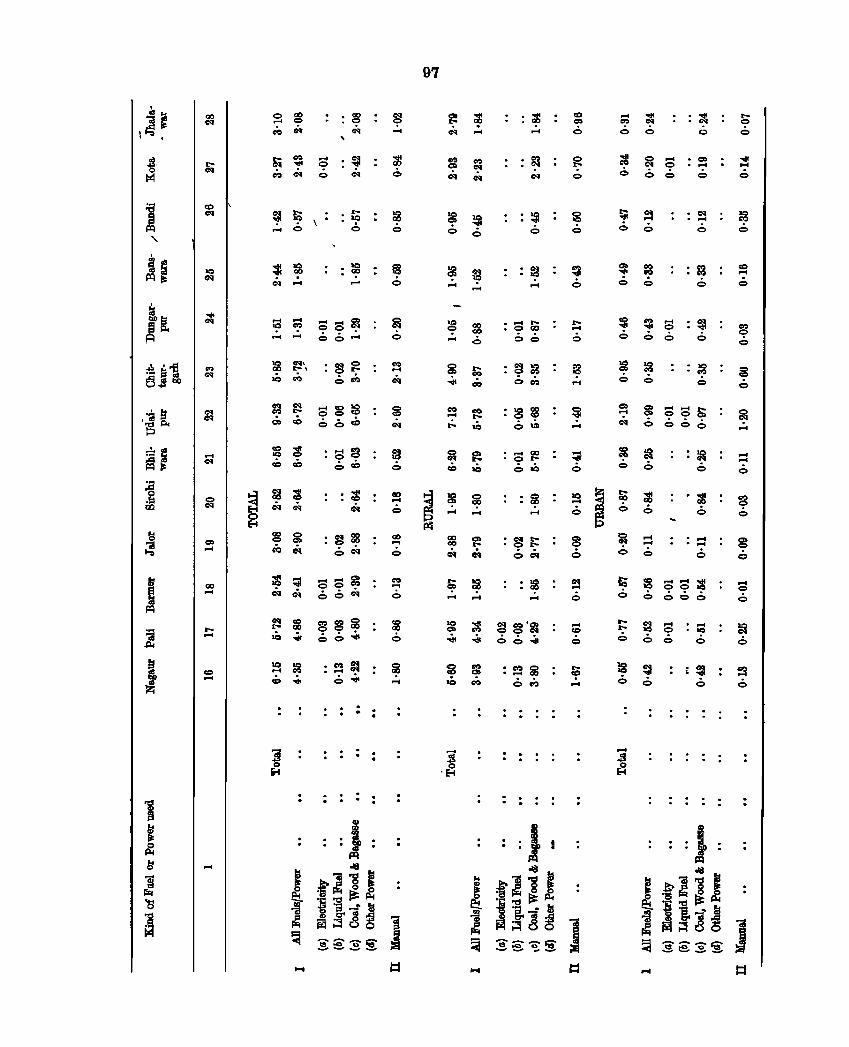
co \ ~
.... ~
0> ....
co ....
r-....
co ....
....
~ ~ ........
. .
,
.10 . ~ ....
: : ~ ~
: : : :
GO .... .:.
....
97
....
.... ....
:CI: ..:.
:~
:~ ..:.
: ~ ..:.
: : ~ ..:.
. . . . . .
. .
.... ....
.:.
....
o
.0> · .... .:.
.~ · .... .:.
• eo • CQ .:.
:~
• >Q • CQ
Q
:~ Q
.~
Q
· .... · .... 6
:}
co .... Q
-.... 6
9 Q
s co
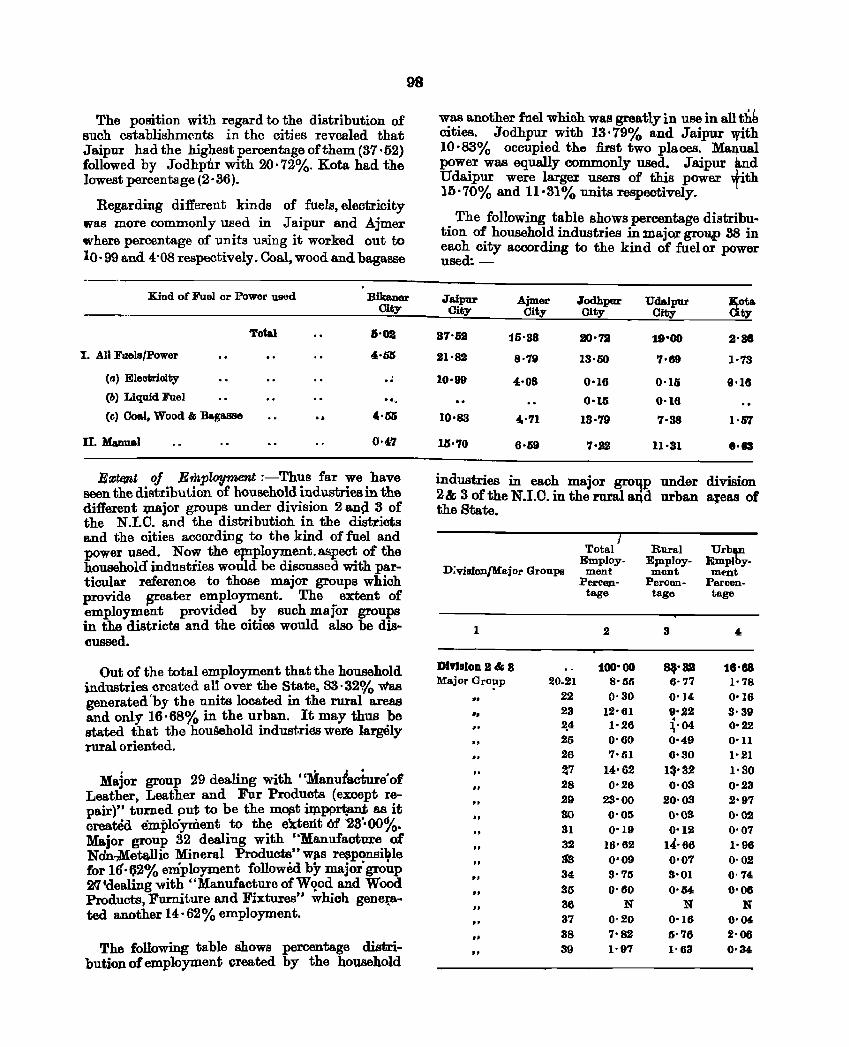
The position with regard to the distribution of such establishments in tho cities revealed that .Jaipur had the highest percentage of them (37 ·52) followed by .Jodhpfir with 20·72%. Kota had the lowest percentage (2·36).
Regarding different kinds of fuels, electricity was more commonly used in Jaipur and Ajmer where percentage of units uRing it worked out to 10·99 and 4 ·08 respectively. Coal, wood and bagasse
98
was another fuel which was greatly in use in all thl, cities. .Jodhpur with 13·79% and Jaipur '\fith 10·83% occupied th.e :first two places. ~ual power was equally commonly used. J aipur iwd Udaipur were larger users of this powex ~th 15·70% and 11·31% units respectively.
The following table shows percentage distribution of household industries in majo,r grou,p 38 in each city according to the kind of fuel or power used; -
Kind of Fuel or Power used Bibner Jaipur Ajmer Jodhpur Udaipur ~ot .. ____________________ --=c.::it~'Y __ __.:C~i~tyL __ ~C~it~y __ ~O~i~ty~ __ ~C~it~:y~ __ ~~ty
I. All Fuels/Power
(Il) Eleetrioity
(b) Liquid Fuel
(c) Coal, Wood 85 Bagasse
II. Manual
Total
.. .. '. 4·00
0·47
BZt$tt oj Empl~ :-Thus far we have seen the distribution of household industries in the different J;Il8jor groups under division 2 an~ 3 of the N.I.C. and the distributioh in the districts and the cities according to tbe kind of fuel and power used. Now the eJIlployment.aspect of the household industries woUld be discussed with particular reference to those major groups which provide ~eater employment. The extent of employment provided by such major groups in the districts and the oities would also be discussed.
Out of the total employment that the household industries created an over the State, 83·32% was generated'by the units located in the rural areas and only 16·68% in the urban. It may thus be stated that the houSehold industri~s were largely rural oriented.
Major group 29 dealing with • 'Manu/actore" of Leather Leather and Fur Products (except repair)" t~ed ?u~ to be the mO#'!t i:rp.P9~ as it oreated employment to the eXtent 6f '23·00%_ Major group 32 dealing with "Manufacture of Ndn,Metq.]]ic Mineral Produots" WitS r~ponsil?le for HH}2% employment followed by major group 217 ldealing with "Manufacture ofW~od and Wood Products, Furniture and Fixtuxes" whioh gene~ated another 14-62% emp10yment.
The following table shows percentage distribution of employznent created by the household
87·5a
21·82
10·99
10·83
10·70
15·88
8·'19
4·08
4,·'11
ao·7! 13·50
0-16
o-u; 13-'19
19-00
'1·89
0·15
0·16
7·38
n·31
a·88 1·73
9·15
e·13
industries in each major gro-qp under division 2& 3 of the N.I.C. in the rural atid urban aJ'eaB of the State_
n;viBion/Major Groups
Total Employment
Percentage
1
DIViSion a & 8 Major Gro!,p
•• 'J .. ., .. .. ., .. .. .. .. .. ., .. ., .. ..
2
100-00 20-21 8'55
22 O· 30 23 12· 61 ~4 1·26 25 0'60 26 7·01 ~7 14·62 28 0·26 29 23'00 SO 0·05 31 0'19 32 16·62 00 0"09 34 3·75 35 0'60 36 N 37 0·20 38 7· 82 39 1·97
Rural Eptployment
Percentage
3
q·aa 6·77 0·14 9·,22 ,·04 0-49 6·30
1:t·32 0·03
20·03 0·03 0·12
14·66 0·07 3-01
0·04 N
0·16 0·76 1·63
Urblj.Il Emplbym~Dt
Percentage
16·es 1·78 0'16 3·39 0·22 O·U 1·21 1·30 0·23 2·97 0·02 0·07 1·96 0·02 0'74 0·06
N 0·()4,
2·06 0·34
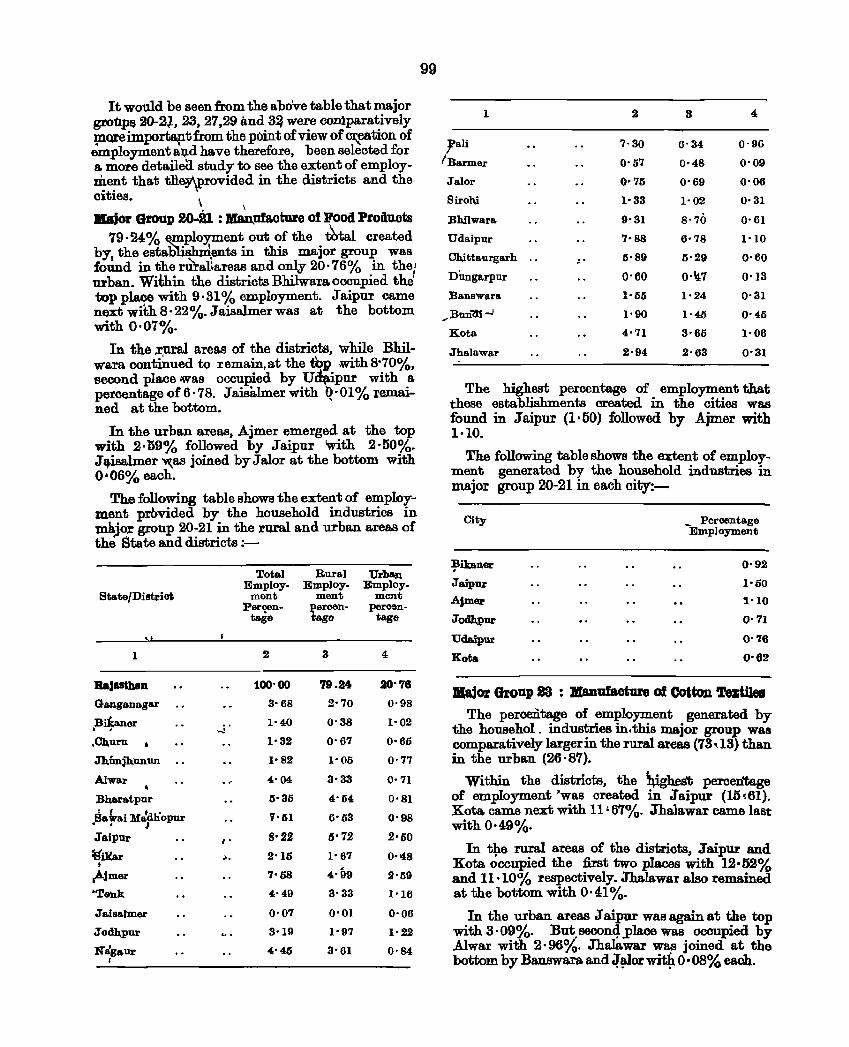
It would be seen from the above table that major grotJ.p~ 20-2J, 23, 27,29 and 3~ were comparatively !llQIe importapt from the point of view of c~tion of employment aT,ld have therefore, been selected for a more detailea study to see the extent of employment that t1i6¥\Provided in the districts and the cities. \ . \
lIIdor Group 20-21 : Man.ufacture of Food Prod1.1Cts 79·24% ~mplo:r.ment out of the ~tal created
by, the estabush.J:ri,ents in this major group was found in the ru'raHareas and only 20·76% in the} urban. Within the districts Bhilwara occupied the' top place with 9·31% employment. J aipur came n«)xt with 8· 22%. J aisalmer was at the bottom with 0·07%.
In the ,r;ural areas of the districts, while Bhilwara continued to remain,at the tbp with 8'70%. 'second place was occupied by U~ipur with a percentage of 6· 78. J ais8Jmer with Q. 01 % remained at the bottom.
In the urban areas, Ajmer emerged at the top with 2'09% followed by Jaipur With 2·50%. J~isalmer "'{as joined byJalor at the bottom with 0'06% each.
The following table shows the extent of employment prbvided by the household industries in mh.jo~ group 20-21 in the rural and urban areas of the State and districts :-
State/DistriClti
1
BaJasihln Ganganagar
Bi:kaner , . • Ch.uru
Jhfmjh.unun
Alwar • Bharatpur
8a tvai M~dliopur " I Jaipur
:Siltar • ~jmer
'Tenk
J&isalmer
Jodhpur
Nagaur ,
Total Employ.
mont Perqen-
tage
2
100'00
3'68
1-40
1-32
1-82
4'04
5-35
'i-51
I- 8'22
~. 2-15
7-58
4'49
0'07
3-19
4-45
Rural Urba..n Employ. Employ-
ment ment ~ercen- percen-age tage
3 4
79.24- 20'78
2-70 0'98
0'38 1-02
0-67 0-65
1-05 0'77
3-33 0-71
4-64 0'81
6-53 0'98
5'72 2'50
1-67 0·<4,8
4-99 2'59
3-33 1'16
0-01 0-06
1'97 1·22
3-61 0'84
99
1 2 3 4:
yali 7·30 0'34 0'96
I Barmer 0-57 0-48 0'09
Jalor 0·75 0-69 0-06
Sirohi 1-33 1-02 0·31
Bhilwara 9-31 8'70 0-61
Udaipur 7'88 6-78 1'10
Chittaurgarh .. - 5'89 5'29 0- fiO
nungarpur 0'60 0·\17 0'13
Banswara 1'55 1'24 0'31
.... Bun1!t -i 1'90 1'45 0'45
Kota 4'71 3'65 1'06
Jhalawar 2'94 2'63 0-31
The highest percentage of employment that these establishments created in the cities was found in JaipUl' (1'00) followed by Ajmer with 1·10.
The following table shows the extent of employment generated by the household industries in major group 20-21 in eaoh oity:-
City
¥ikaner
Jaipur
Ajmer
Jodhpur
Udaipur
Kota
_ Peroentage Employment
0'92
I-50
1-10
0-71
0-76
0-62
Jlaj01' GroUp 23 ; I!&nufaoture of OottoA 'laWel The percentage of employment generated by
the househol. industries in,this major group was comparatively larger in the rural areas (73\13) than in the urban (26·87).
Within the distriots, the ip,ghes't percen'tage of employment 'was created in Jaipur (10~61). Kota. came next with 11 ~ 67%. Jhalawar came last with 0-49%_
In tlJ,e ru;al areas of the districts, Jaipur and Kota occupIed the :first two places with 12 0 52% and 11·10% respectively_ Jha.lawar also remained at the bottom with 0-41%_
In the urban areas J aipur was again at the top with 3 -09%_ But seoon4 'place was occupied by Alwar with 2·96%. JhaJawar was joined at the bottom by Banswara and ~~or wi~ 0 008% each_
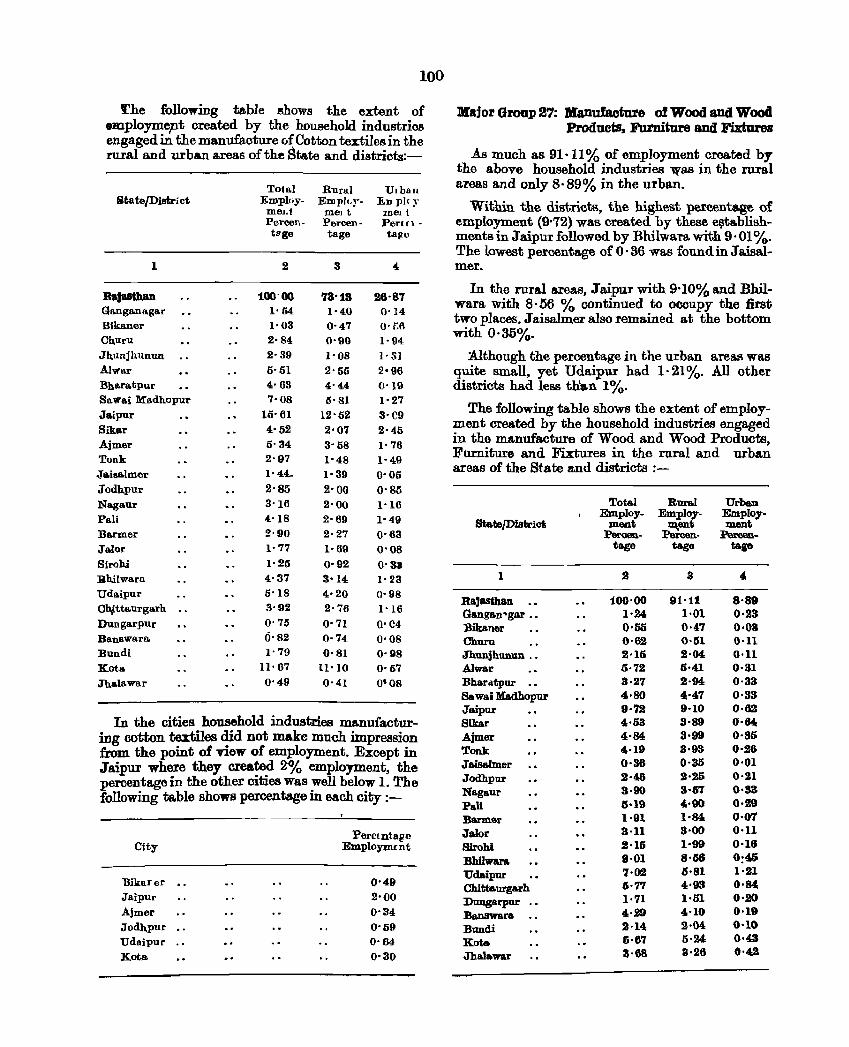
100
I'he following table MOWS the extent of em.ploymept crea.ted by the household industries engaged in the manufacture dCotton textiles in the rural and urban areas of the State and districts:-
~ta te/Distri ct
1
Rajasthan Gango.nagar Bikaner Cb,uru Jh,unjhunun Alwar BhlLrlLtpur Sawo.i Madhapur Ja.ipur
Sika.r Ajmer Tonk Ja.isalmer Jodhpur
Nagaur Pa1i Barmer Jalor Sirah.i Bhilwara Udaipur Cb;.ttaurgarh
Dungarpur Banllowara Bundi
Kota J"halo.war
TOlal Employ
mel_I Percentflge
2
100-00 1- 54 1-03 2·84 2·39 5·51 4·63 7·08
15·61 4·52 5-34 2-97 1-44.-2-85 3-16 4·18 2-90 1- 77 1-25 4-37 5-18 3-92 0-75 6-82 1-79
u- 67 0-49
Rural EmpILy
mel t Percentage
3
'18-18 1-40 0-47 0-90 1-08 2-55 4-« 0-81
12-52 2-07 3-08 1·48 1·39 2·00 2·00 2-69 2·27 1-69
0·92 3·14
4·20 2-76 0-71 0-74 0·81
11·10 0-41
Ulbsn EDPI(~
mel t Peru\ -taftc
16-87 0-14 0-::6 1-94 1-:;]
2·96 0-19 1-27 3-C9
2·45 1-76 1-49
0·05 0-85 1-16 1·49 0-63 O'OS 0-33 1-23
0·98 1-16 O'N 0'08 0-98 0'57 0'08
In the cities household industries manufacturing cotton textiles did not make much impression from the point of 'riew of employment. Except in Jaipur where they created 2% employment, the percenta.ge in the other cities was well below 1. The following table shows percentage in each city :-
City
13ikarer Jaipnr Ajmer
Jodhpur Udaipur Kata
Perc(utagc Employment
0'49 2-00
0-34
0-09 0-64-
o-ao
Major Group 27: Manufacture of Wood and Wood Products, Furniture and Fixtures
As much as 91-11 % of employment created by the above household industries was in the rural areas and only 8· 89% in the urban_
Within the dist-ricts, the highest percentage of employment (9·72) wa.s created by these e~tablishmenta in .T aipur followed by Bhilwara. with 9 -01 %_ The lowest percentage of 0·36 was found in J a.isalmer.
In the rural areas, J aipur with 9-10% a.nd Bhilwara with 8· 06 % continued to occupy the first two places_ J aisalmer also remained at the bottom with 0-35%_
:Although the percenta.ge in the urban areas was quite sma.ll, yet Udaipur had 1· 21 %_ All other districts had less th'an 1%.
The following table shows the extent of employment created by the household industries engaged in the manufacture of Wood and Wood Products, Furniture and Fixtures in the rural and urban areas of the State and districts :-
StateJDistri~
1
Ra,asthan Gangan·gar .• :Bikaner Churn Jhunjhunun __
.Alwo.r Bharlltpur ._ Sawai Madhopur Jaipur Sikar Ajmer Tonk JaisalIner Jodhpur Nagaur Pali Ba.nner Jalor Strohi Bbilwara Udaipur Chittaurga.rh Dtmgarpur Ba.nswara Bundi Kato. Jhalawar
Total Employ
ment Peroen-
t&ge
100-00 1-24 0'05 0-62 2-16 5·72 3-27 4·80 9-72 4-53 4·84 4·19 0·36 2·46 3-90 0-19 1-91 3-11 2·15 9-01 7-02 0-77 1·71 4-.29 2-14 6-67 3-68
Rural Employ
Iq,,8D.t Peroon
tago
3
91·11 1-01 0-47 0-51 2-04 G-41 2-94 4·47 9·10 3·S9 3·99 3-93 0-35 2'25 3-07 4.·90 1·84, 3-00 1-99 8-56 o-Sl 4-93 1·51 4-10 2-04 5-24 8-26
Urban Employment
Peroentap
a-89 0·.23 0-08 o-n 0-11 0·31 0-33 0-33 0·62 0-64, 0-85 0-26 0'01 0-21 0-33 0·29 0·07 0-11 0-18 0:405 1·.21 0-84. 0-20 0-19 0-10 0'4,3
0'42
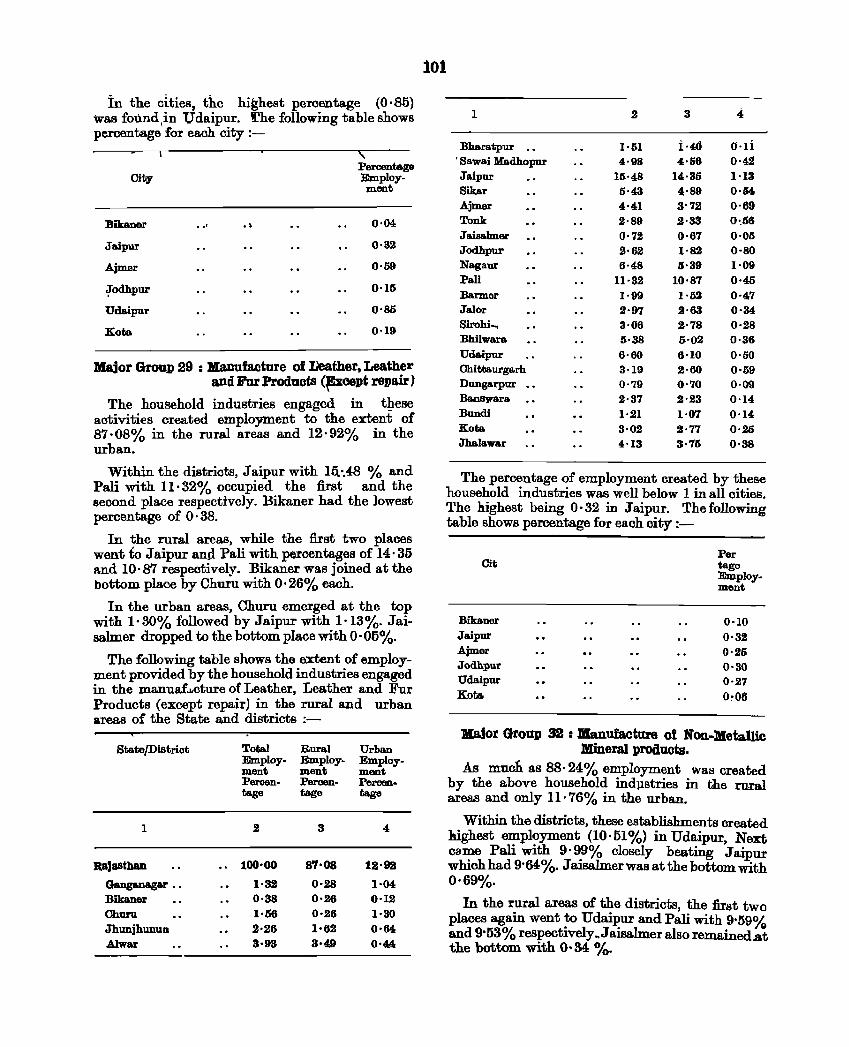
in the cities, the highest percentage (0·85) was fou.nd,in Udaip~r. I'he following table shows percentage for each CIty :-
Percentage City Employ-
ment
Bikaner .. ' . , 0·04
Jaipm 0·32
Ajmer 0·59
.;Todhpur 0'15
Udaipur 0·85
Kota 0·19
Major Group 29 : Manufacture 01 Deather, Leath~r and Fur Products (~cept rellall' )
The household industries engaged in t!tese activities oreated employment to the extent of 87·08% in the rural areas and 12'92% in the urban.
Within the districts, Jaipur with 1&,.48 % and Pall with 11· 32% occupied the first and the second place respectively. Bikaner had the lowest peroentage of 0·38.
In the rural areas, while the first two places went to J aipur and PaH with percentages of 14·35 I\nd 10·87 respectively_ Bikaner was joined at the bottom place by Churn with 0·26% each.
In the urban areas, Churu emerged at the top with 1'30% followed by Jaipur with 1'13%. Jaisalmer dropped to the bottom plaoe with O· 06%.
The following table shows the extent of employment provided by the household industries engaged in the manuaf..a.cture of Leather, Leather and Fur Products (except repair) in the rural and urban areas of the State and districts :-
State/Diamot
1
RaJasthan Glmganagar .• Bikaner Churu Jhunjbunuo Alwar
..
Total Employment Percentage
2
too· 00
1·32 0·38 1·56 2'26 3·93
Rural Employment Percentage
3
87'08
0-28 0'26 0·26 1-62 3-49
Urban Employment Percentage
4
12'92
1·04 0·12 1·30 0'64 0'44
101
1 2 3 4
Bharatpur 1·51 i·4(j o'li , Sawai Madhopur 4·98 4·56 0·42 Jaipur 15'48 14·35 1·13 Sikar 5·43 4'89 0·54 Ajmer 4'41 3'72 0·69 Tonk 2·89 2·33 0·.56 Jaisalmer 0·72 0·67 0·05 Jodhpur 2·62 1·82 0·80 Nagaur 6·48 0'39 1·09 Pan 11·32 10·87 0·45 Harmer 1·99 1·1)2 0·47 Jalor 2·97 2·63 0·34 Sirohi ... 3-06 2·78 0-28 Bhilwara 5-38 5-02 0·36 Udaipur 6·60 6·10 0·50 Chittaurgarh 3·19 2-60 0-59 Dongarpur 0·79 0·70 0·09 Banswara 2·37 2·23 0·14 Bundi 1-21 1-07 0'14 Kota 3·02 2·77 0·25 Jha.lawar 4·13 3·75 0'38
The percentage of employment created by these household industries was well below 1 in all cities. The highest being 0·32 in Jaipur. The following table shows percentage for each city :-
Cit
Bikaner Jaipur Ajmer Jodhpur Udaipur Kota
Per tage Employment
0-10 0-32 0-25 O'SO 0-27 O~06
lIaior Group 32 : lIIanufacture of Non-Metallic Mineral products.
As mucn as 88·24% employment was created by the above household ind]lstries in the mral areas and only 11· 76% in the urban.
Within the districts, these establishments created highest employment (10'61%) in Udaipur, Next came Pali with 9'99% closely beating Jaipur which had 9'64%. Jaisalmerwasatthe bottom with 0'69%.
In the rural areas of the distriots, the first two places again went to Udaipur and Pall with 9'59% and 9'53% respectively ~J aisalmer also remained at the bottom with 0- 34 %.
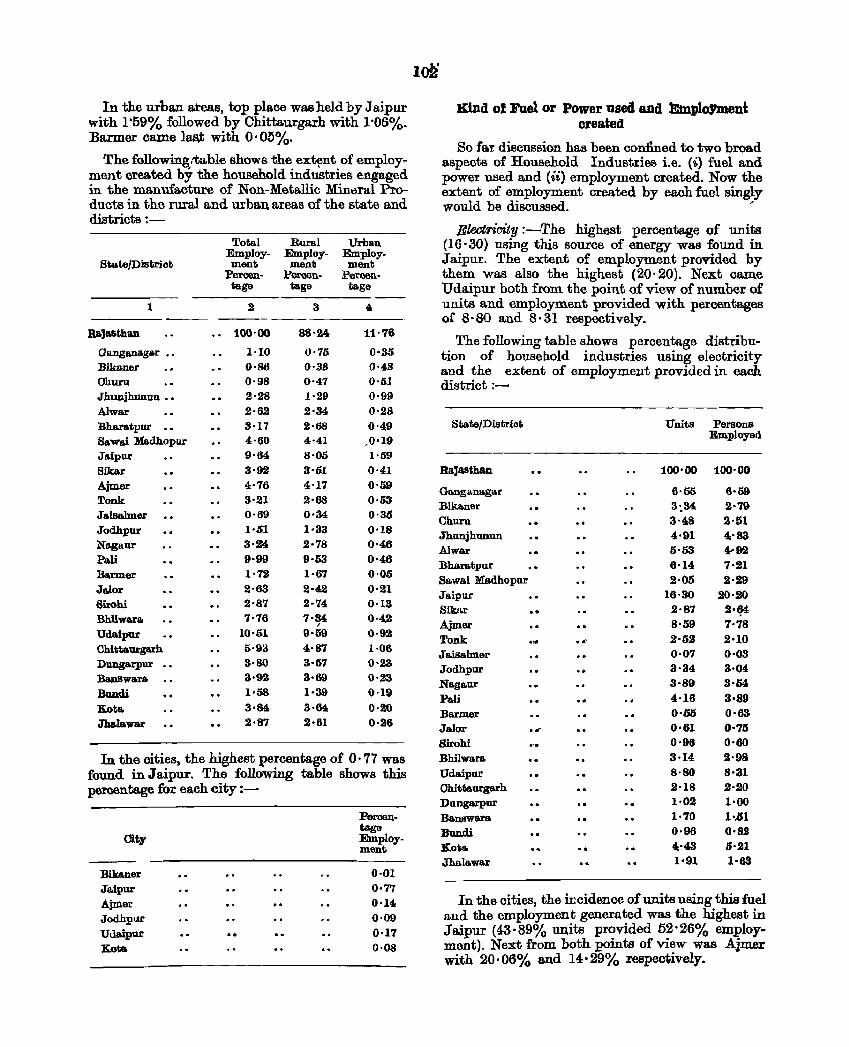
In the urban areas, top place was held by J aipur with 1'59% followed by Chittaurgarh with 1-06%_ Banner came last with 0, 05%_
The following:table shows the ex~nt of employ~ ment crea.ted by the household industries engaged in the manufacture of Non-Metallic Min~ral Pro-ducts in the rural and urban, areas of the state and districts :-
Total Rural Urban Employ- Employ- Employ-
State/Distriot ment ment ment Peroon- Peroen- Percen-tage tage tage
1 2 3 4. ---
RaJasthan 100-00 88'24 11'76
Ganganagar •. 1·10 0'75 0-35 Bikaner 0·86 0·38 0·4.8 Churu 0·98 0'47 0·51 Jhunjhunun _. 2·28 1·29 0-99 AIw&r 2·62 2·34 0·28 Bharatpur -. 3'17 2'68 0'49 Sawai Madhopur 4'60 4·41 .0'19 Jaipur 9'64- 8'05 I-59 Sikar 3·92 3·tH 0·41 Ajmer 4'76 4'17 0'59 Tonk 3'21 2'68 0·53 Jaisa.lmer 0·69 0·34 0'36 Jodhpur 1·61 1·33 0-18 Nagaur 3·24: 2·78 0·46 Pall 9·99 9·53 0·46 Barmer 1'72 1-67 0·05 JaJor 2·63 2·42 0'21 Bilow 2·87 2·74 0·13 BhUwara. 7'76 7·34 0·42 , Udaipur 10·61 9·69 0·92 Chittaurgarh 0·93 4·87 1·06 Dungarpur 3·80 3·67 0·23 Bauswara 3'92 3'69 0·23 Bmw 1·68 1·39 0·19 Kota 3·84 3·64 0·20 Jhala.war 2·87 2'81 0·26
In the oities, the highest percentage of o· 77 was found in J aipur. The following table shows this percentage for each city :-
Percen-
City tage Employ. ment
Bika.ner 0·01 Ja.ipur 0·77 Ajmer 0·14 Jodhpur 0·09 Udaipur 0·17 Kota. 0·08
l~
Kind of Fuel or Power usea and EmploYment created
So fa.r discussion has been confined to two broa.d aspects of Household Industries i.e. (i) fuel and power used and (ii) employment created. Now the extent of employment created by each fuel singly would be disCWlsed. '
Blectricity:-The highest percentage of units (16·30) using this source of energy was found in J aipur. The extent of employment provided by them was also the highest (20,20). Next came Udaipur both from the point of view of number of units and employment provided with percentages of 8·80 and 8·31 respectively.
The following table shows peroentage distribution of household industries using eleotrioity and the extent of employmellt provided in each district :-
Sl;ate/Distriot Units Persons Employed
Ralasthan 100'00 100'00
Ganganagar 6·55 6·59 BikAner 3:34 2-79 Churn 3'48 2·51 Jhnnjhunun 4'91 4'83 Alwar 5'53 4-92 Bharatpur 6'14 7·21 Sawo.i Madhopur 2'05 2'29 Jaipur 16·30 20-.20 Siktt.r 2'87 2'~ Ajmer 8'09 7'78 Tonk .. ' 2'52 2'10 J&iso.hner 0·07 0'03 Jodhpur 3'34 3'04: Nagaur 3-89 3·04 Pali 4·16 3·89 Barmer 0'55 0'63 Jalor ... 0·61 0'75 Birahi 0'96 0'60 Bhilwara 3·14 2-98
Udaipur 8·80 8'31 Chitrtaurgarh 2·18 ,t·ao Dungarpur 1·02 1'00 Banswara 1·70 1'.01 Bun.di 0·96 0·82 Kats 4'43 5-21 Jhalawar 1'91 1·63
In the cities, the incidence of units using this fuel and the employment generated was the highest in J aipur (43' 89% units provided 52' 26% employment). Next from both Eoints of view was Ajmer with 20-06% and 14·29% respectively.
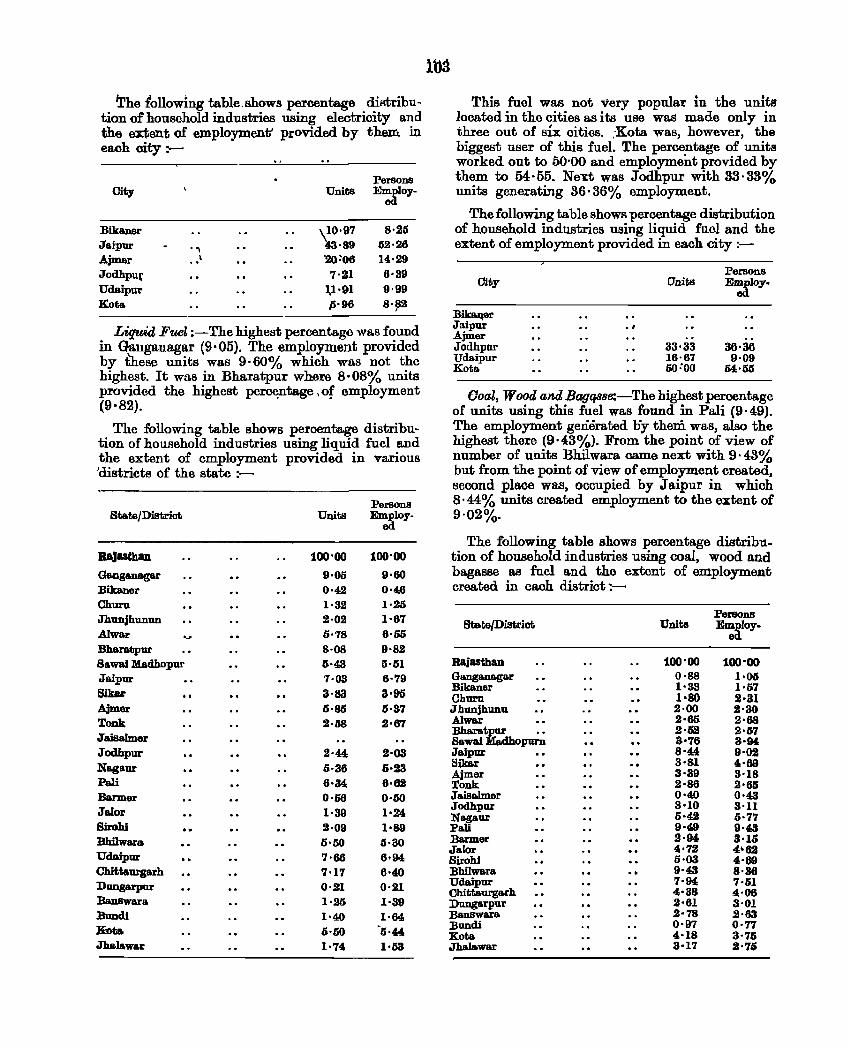
The following table.shows percentage distribution of household industries using eleotricity and the ext;ent of employment' provided by them in each city :--
Persons Cit,. Units ~IOY-
Bikaner \10·97 8·25 Jaipur . , 13'89 52·26 Ajmer .. I "2O~06 14·29 JodhpUf 7'21 6'39 Udaipur 1,1'91 9·99 Kota p'96 8'~2
Liquid Fuel :-The highest percentage was found in Gauganagar (9'05). The employment provided by these units was 9'60% which was not the highest. It was in Bharatpur where 8·08% units provided the highest per~ntage. of employment (9'82).
The following table shows percentage distribution of household industries using liquid fuel and the extent of employment provided in various 'districts of the state :-
Persons State/District Units Employ.
ed
RaJasthan 100'00 100'00
Ganga.nagar 9'05 9·60 Bikaner 0·4,2 0·46 Churu 1·32 1·25 Jhunjhunuu 2·02 1'67 Alwar OJ 0'78 6·05 Bharatpur 8·08 9·82 Sawai l4adhopur 5'43 5·51 Jaipur 7·03 6·79 6ikar 3'83 3·95 Ajm.er 5·85 5·37 Tonk 2·58 2·67 Jaisalmer Joclhpur 2'44 2·03 Na.gaur 5·36 5·23 Pall 6·34; 6·62 Banner 0'56 0·50 JaIor 1·39 1'24 8irohi 2·09 1'89 Bhilwara 5'50 5·30 Udaipur 7'66 6·94 Chittaurgarh 7'17 6'40 Dungarpur 0·21 0'21 BanBwara 1'25 1'39 Bundi 1'40 1·64 K-ota 5·50 "5'44 Jhalawar 1'74 1·53
100
This fuel was not very popular in the units located in the cities as its use was made only in three out of SIX cities. :Kota was, however, the biggest user of this fuel. The percentage of units worked out to 50'00 and employment provided by them to 54·55. Ne"l:t was Jodhpur with 33·33% units generating 36· 36% employment.
The following table shows percentage distribution of household industries using liquid fuel and the extent of employment provided in each city :-
Persons Ciliy Units Ez:a1oy•
B:iltaqer Jaipur • I
Ajmer Jodhpur 33'33 36·36 Udaipur 16·67 9·09 Kota 50:00 54·05
Ooril, Wooa ana Bagqsse:-The highest percentage of units using this fuel was found in Pali (9,49). The employment generated liy them was, also the highest there (9·43%). From the point of view of number of units Bhilwara came next with 9·43% but from the point of view of employment created, second place was, occupied by J aipur in which 8· 44% units created employment to the extent of 9'02%.
The following table shows percentage distribu. tion of household industries using coal, wood and bagasse as fuel a.nd the extent of employment created in each district~-
Persons State/District Units E~roy-
Rajasthan 100'00 100'00 Ganga.nagar 0·88 1'06 Bikaner 1'33 1'57 Churn 1'80 2·31 Jhunjhunu 2·00 2'30 Alwar 2'65 2'68 Bharatpur 2·52 2'57 Sawai Madhopurn 3'76 3·94, Jaipur 8'44 9'02 Sikar 3'81 4'69 .Ajmer 3·39 3'18 Tonk 2'86 2·65 Jaisalmer 0·40 0'43 Jodhpur 3·10 3'11 Nagaur 0·42 0'77 Pali 9·49 9'43 Barmer 2·94 3·1S Jalar "72 4'62 Birahi 0·03 4'69 Bhilwara 9'43 8'36 Udaipur 7'94 7'01 Chittaurgarh 4·38 4'06 Dungarpur 2·61 3'01 Banswara 2'78 2·63 Buudi 0·97 0'77 Kota 4·18 3'75 Jhalawar 3·17 2'75
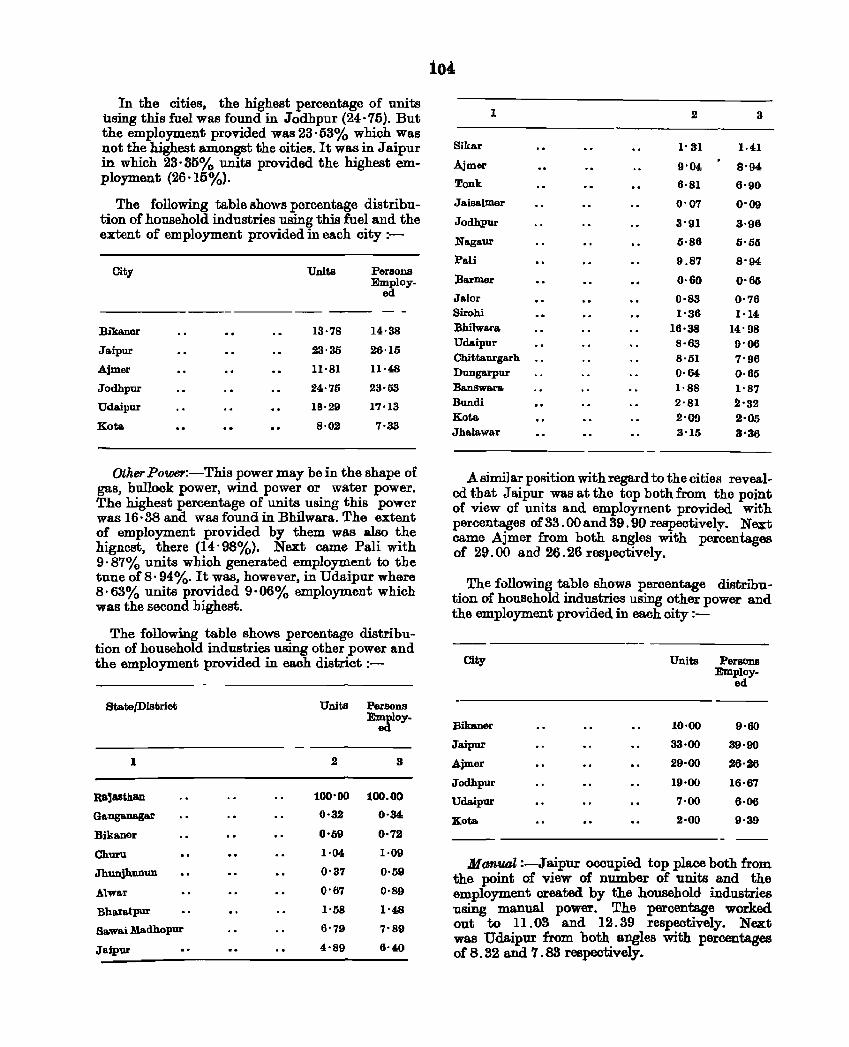
In the cities, the highest percentage of units bsing this fuel was found in Jodhpur (24,76). But the employment provided was 23'63% which Was not the highest amongst the cities. It wa~ in Jaipur in which 23'36% units provided the hIghest em-ployment (26,15%).
The following table shows percentage distribu-tion of household industries using this fuel and the extent of employment provided in ea.ch city :-
City Units Persons Employ-
ed
---Bika.ner 13·78 14·38
Jaipur 23·35 26·15
Ajmer 11·81 11·48
Jodhpur 24.·75 23·53
Uda.ipur IB·29 17·13
Kota 8·02 7·33
Other Power:-This power may be in the shape of gas, bullock power, wind po~er or. wa~r power. The highest percentage of uruts USlDg thIS power was 16·38 and was found in Bhilwara. The extent of employment provided by them was also the higncst, there (14'98%). Next came Pali with 9· 87o/t units which generated employment to the tune of 8· 94%. It was, however, in Udaipur where 8· 63% units pro:vided 9· 06% employment which was the second hIghest.
The follow:i.ng table shows percentage distribution of household industries using other power and the employment provided in each district :-
State/Distriot
1
Ralasthan
Ganganaga.r
Bikaner
Churu
JhunjhUDun
Alwo.r
Bbaratpur
Sa.wa.i Ma.dhopur
JBipur
Units
2
100'00
0·32
0'59
1·04
0'37
0'67
1'58
6'79
4'89
Persons ~IOy-
3
100.00
0·34,
0'72
1·09
0'59
0·89
1'48
7'89
6'40
104
1 2 3
Sikar l' 31 1·41
,Ai mer 9'04 S'94
Tonk 6'81 6'90
Jaisalmer 0'07 0'09
Jodhpur 3'91 3'98
Nagaur 0'86 0'50
Pali 9.87 S'94
:Harmer 0·60 0'65 Jalor 0·83 0'76 Sirohi 1'36 1·14 Bhilwara 16'38 14'98 Udaipur 8·63 0'06 Chittaurgarh 8·51 7'96 Dungarpur 0'64, 0·65 Banswara. 1·88 1'87 Bundi 2'81 2'32 Kota 2'00 2'05 Jha.la.war 3'15 3'36
A similar pORition with regard to the cil;ies revealed that J aipur was at the top both from the point of view of units and employment provided with percent.ages of 33.00 and 39 . 90 respectively. Next came Ajmer from both angles with percentages of 29.00 and 26.26 respectively.
The following table shows percentage distribution of household industries using other power and the employment provided in each city :-
City
Biklmer
Jaipur
Ajmer
Jodhpur
Udaipur
Kota.
Units
10'00
33·00
29'00
19·00
7·00
2·00
Persons Employ-
ed
9·60
39'00
26·26
16·67
6·06
9·39
- --Manual :-J wpux occupied top place both from
the point of view of number of units and the employment created by the household industries using manual power. The percentage worked out to 11.03 and 12.39 respectively. Next was Udaipur from both angles with percentages of 8.32 and 7.83 respectively.
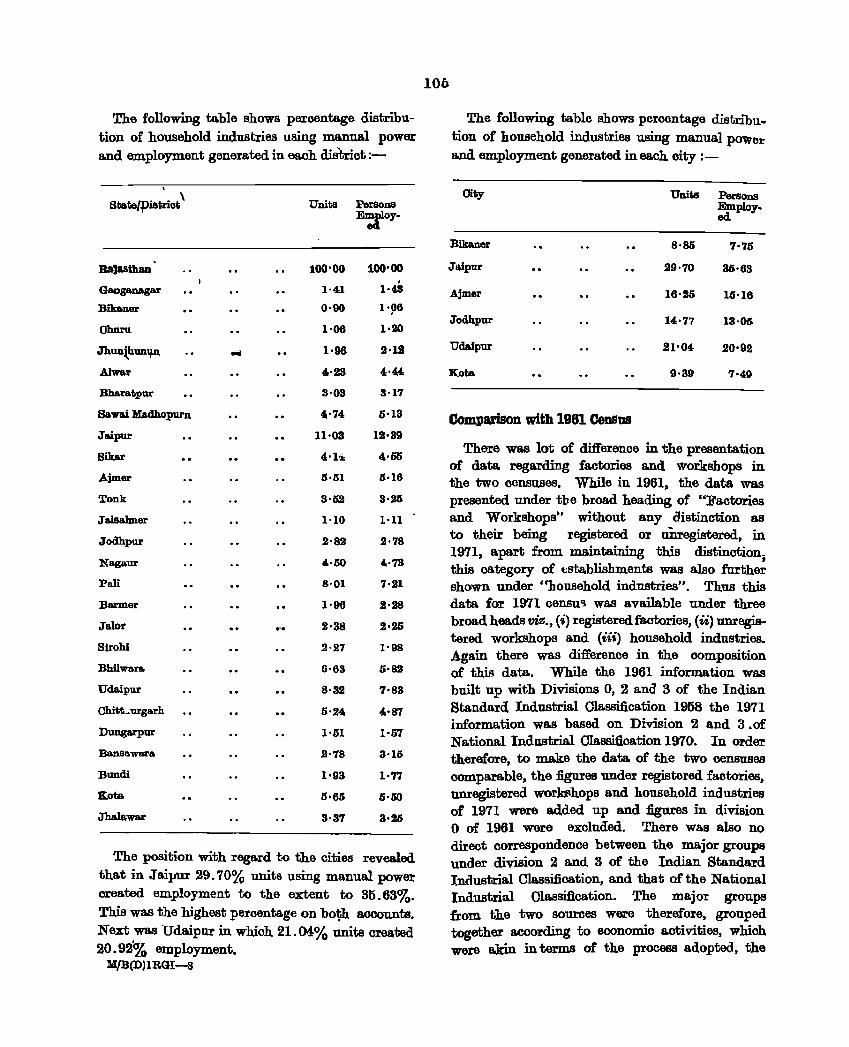
The following table shows peroentage distribution of household industries using manual power and employment generated in each distriot :-
. State/pistrioli ' Units I'er8oIlS
E~OY·
RaJasthan 100'00 100'00
Ga.nganagar 1·41 1·43
Bilamer 0·90 1'96
Churu 1'06 1·20
.Jhun.~hun.¥JI. -e 1·96 2·12
Alwar 4,·23 4·44
Bharatpur 3'03 3·17
Sawai MadhopurD "74 5'13
Jaipur 11'03 12·39
Sikar 4'h 4·55
Ajm8l' 0'01 0·16
Tonk 3·1)2 3·25
Jaisalmer 1'10 1·11
Jodhpur 2'82 2·78
Nagaur 4'00 4'73
Pali 8'01 7·21
Banner 1'96 2·28
Jalor 2·38 2·25
Sirohi 2·27 1'98
Bhllwara 6'63 5·82
Udaipur 8'32 7·83
Chitt~urgarh 0'24 4'87
Duugarpur 1'01 1·5'1
Bansawara 2'78 3·10
Bun.di 1'93 1'77
Kota 5'65 0'50
Jha.lawar 3·37 3'25
The position with regard to the cities revealed that in Jail'ur 29.70% units using manual power oreated employment to the extent to 35.63%. This was the highest percentage on bo~ aooounts. Next was Udaipur in which 21.04% units created 20.92% employment.
K/B(D)IRGI-S
lOb
The following table shows peroentage distribution of household industries using manual pOwer and employment generated in each city :-
Oity Units PersollS Employ. ed
Bikaner 8·s.; 7'75
Jaipur 29'70 35'63
.A.jmer 16·25 15'16
Jodhpur 14'77 13·05
Udaipur 21'04 20'92
Kota 9·39 7'49
Comparison with 1961 Census
There was lot of difference in the presentation of data regarding factories and workshops in the two oensuses. While in 1961, the -data was presented under the broad heading of "Factories and Workshops" without any distinction as to their being registered or tiDregistered, in 1971, apart from maintaining this distinction; this category of t:stablishments was also further shown under "household industries". Thus this data for 1971 censu~ was available under three broad heads viz., (i) registered factories, (ii) unregistered workshops and (iii) household industries. Again there was difference in the composition of this data. While the 1961 information was built up with Divisions 0, 2 and 3 of the Indian Standard Industrial Cla.ssifi.cation 1968 the 1971 information was based on Division 2 and 3.of National Industrial Olassification 1970. In order therefore, to make the data of the two censuses comparable, the figures under registered factories, unregistered workshops and household industries of 1971 were added up and figures in division o of 1961 wore excluded. There was also no direct correspondence between the major groups under division 2 and 3 of the Indian Standard Industrial Classification, and that of the National Industrial Olassification. The major groups from the two sources were therefore, grouped together according to economic activities, which were akin in terms of the process adopted, the
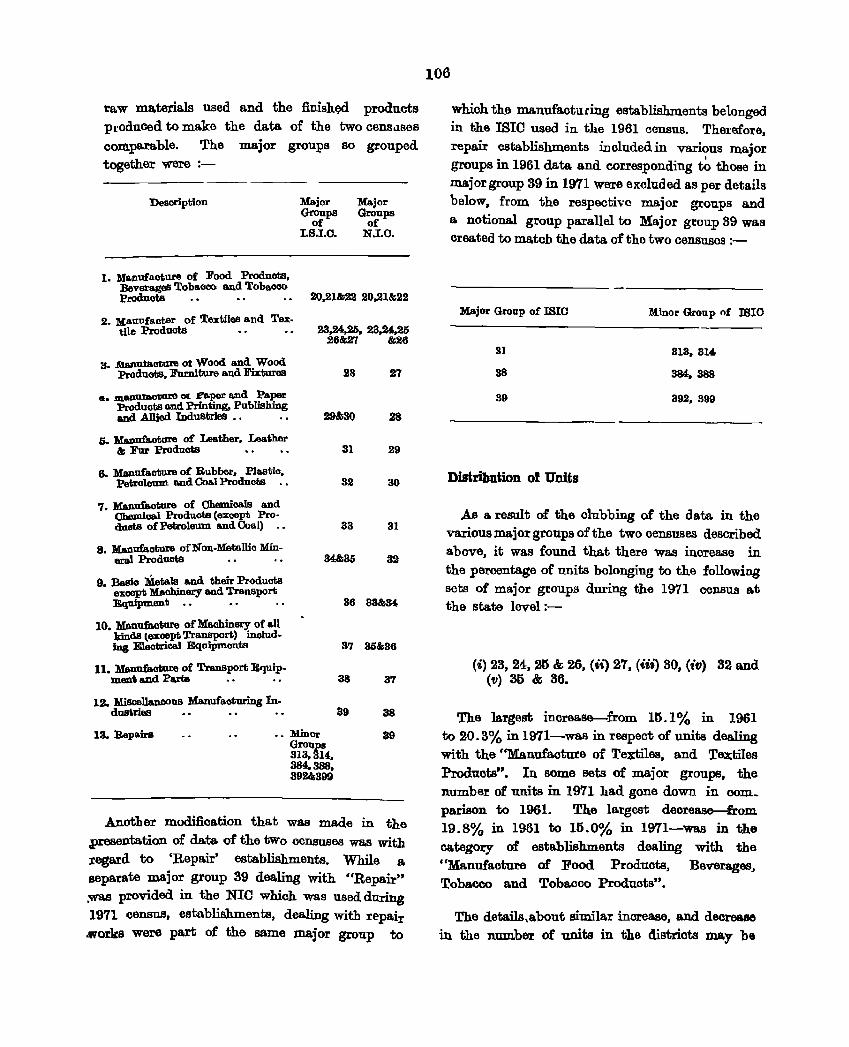
raw materials used and the finish¢ products produced to make the data of the two censolses comparable. The major groups so grouped together were :-
Description Major Groups
of I.8.1.0.
Major Groups
of N.I.C.
1. Manufacture of Food Products, Beverages Tobacco and Tobaeoo Produots 20,21&22 20,21&22
2. ]!,[aaufacter of Textiles and Tex. tile Products • • • • 23,24,25, 23,24,25
26&27 &26
3 .M.an11lll.cture ot Wood a.nd Wood • Produots, Furniture and Fixtures
., m.an11Ia01;OrO 01 .l"aper a.nd Paper
28 27
• Products and Printing, Publishing and Allied Industries ., 29&30 28
G. Manufactare of Leather. Leather & Fur Products • • • •
6. Manufaotore of Rubber, Plastio, petrolemn and Coal Products .•
7. Manufacture of Chemicals a.nd Chemical Produots (except Pro· duots of Petroleum. a.ndCua!) .•
31 29
32 30
33 31
8. Manufacture of Non· Metallic Min· eral Products 34&35 32
9. Basio :Metals and their Produots except Machinery and Transport Equi:pm.enli ••
10 Manufacture of Machinery of all • kinds (except Transport) includ. ing Electrical Equipments
11. Manufaoture of Transport Equip. ment a.ud Parts
12. M.iBoellaneoUB Manufacturing In. dust.ries
13. Repairs •• Minor Groups 313.314, 384.388, 392&399
36 33&34
37 35&36
38 37
39 38
89
Another modification that was made in the .presentation of data of the two censuses was with regard to 'Repair' establishments. While a separate major group 39 dealing with "Repair'" ;was provided. in the NIC which was used during 1971 census, establishments, dealing with repair ..works were part of the same major group to
106
which the manufacturing establishments belonged in the ISlC used in the 1961 census. Therefore, repair establishments includedin various major , groups in 1961 data and corresponding to those in major group 39 in 1971 were excluded as per details below, from the respective major groups and a notional group parallel to :Major group 39 was created to match the data of the two censuses :-
Major Group of ISlO
3]
38
39
Distribution 01 Units
M.inor Group of ISlO
313,314
384, 388
392, 399
As a result of the olubbing of the data in the various major groups of the two censuses described above, it was found that there was increase in the percentage of units belonging to the following sets of major groups during the 1971 census at the state level:-
(i) 23, 21, 25 & 26, (ii) 27, (iii) 30, (iv) 32 and (11) 35 & 36.
The largest increase-from 15. 1 % in 1961 to 20.3% in 1971-was in reapect of units dealing with the ''Manufacture of Textiles, and Te.xtiles Products". In some Bets of major groups, the number of units in 1971 had gone down in com_ parison to 1961. The largest deorease--from 19.8% in 1961 to 15.0% in 1971-wBB in the category of establishments dealing with the "Manufacture of Food Produots, Beverages, Tobacco and Toba.cco Products".
The details , about similar increase, and decrease in the number of units in the distriots may be
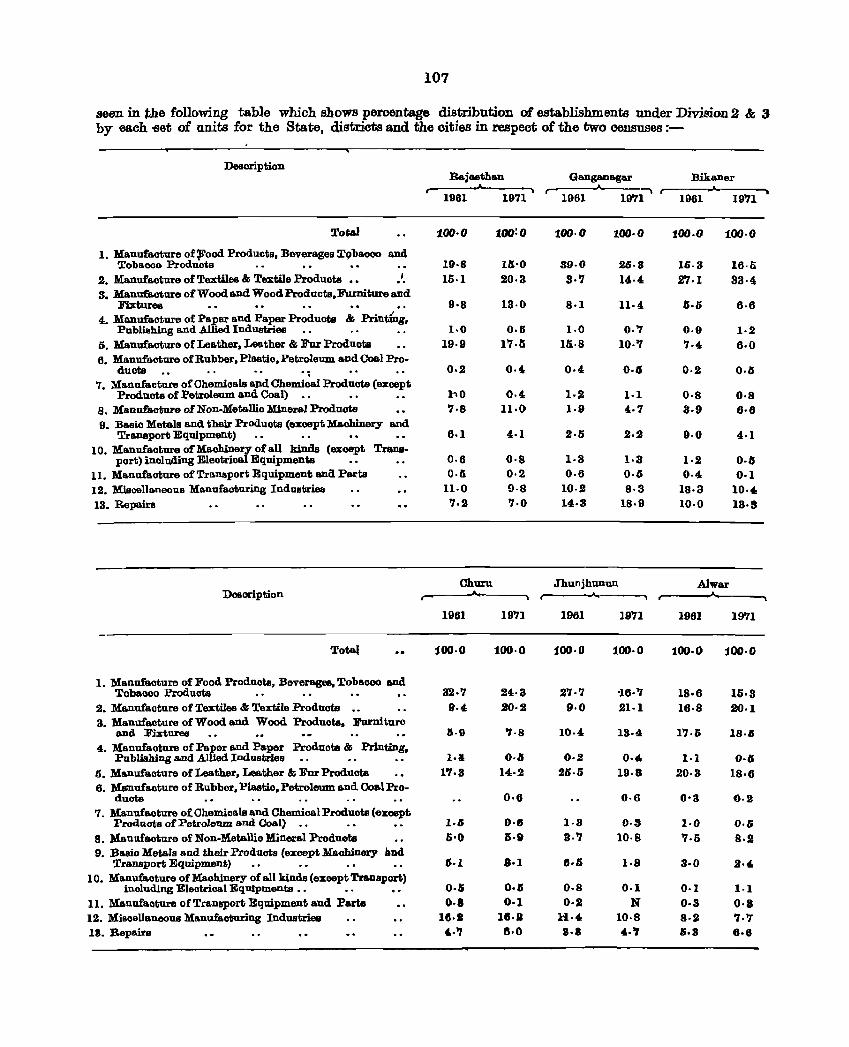
107
seen in the following table which shows percentage distribution of establishments under Division 2 & 3 by each 'fIet of units for the Stat.e, districts and the oities in respect of the two censuses :-
Description Rajasthan Ganganagar Bikaner . .
r==" ~ ~ ... 1961 1971 1961 19'11 1961 19'71
Tot;&) 100-0 100:0 100-0 100-0 100.0 100·0
1. Manufaoture of1l'ood Produots, Beverages !I'9baooo and Tobaooo Products . . • • • • 19·8 10·0 39·0 26·8 16·3 16·S
2. Manufaotnre of Textiles & Textile Products •• I 15·1 20·3 3·'1 14·4 2'1.1 33·4 3. Manu£a.oture of Wood and Wood Prodacts,FurDitDre and
Fixtures 9·8 13·0 8·1 11·4 5·5 6·6 4. Manufaoture of Paper and Paper Products & Printi'ng,
Publishing a.nd Allied Industries .. .. .. 1·0 0.5 1·0 0.'1 0·9 1·2 5. Manufacture of Leather. Leather & Fur Products 19·9 17·5 lli·S 10·" '1·4 6·0 6. Manufaoture of Rubber, Plastio, Petroleum and Coal Pro·
duots . 0·2 0·4 0·4 0·6 0·2 0·6 7. ManuCacture of Chemioals ap.d Chemical ProduotB (except
Products of Petroleum and Coal) • • • • • • 1·0 0·4 1·2 1·1 0·8 0·8 8. Manufacture of Non·Metalllo Mineral Products '1·8 11·0 1·9 4·'1 3·9 6·6 9. Basio Metals and their Produots (exoept Ma.ohinery and
Transport Equipment) 6·1 4·1 2·5 2·2 9·0 4·1 10. Manufaoture of Maohinery of all kinde (except TraDS-
port) including Eleotrical Equipments • • • • 0·6 O-s 1·3 1·3 1·2 0·5 ll. Manufacture of Transport Equipment ana Parts 0·6 0·2 0·6 0·6 0·4 0·1 12. Miscellaneous Ma.nufaoturing Industriea 11·0 9·8 10·2 S·3 18·3 10·4, 13. Repairs '1·2 '1·0 14·3 18·9 10·0 13·S
Chum Jhunjhnnun Alwar Description r=="
,.,. . .. 1961 19'11 1961 19'11 1961 1971
Totat :100·0 100·0 100·0 :100·0 100·0 100·0
1. Manufaoture of Food Products, Beverages, Tobaoco and Tobaooo J.>roduota 32·'1 24·3 2'1·'1 '16·'1 IS·6 16·3
2. Manufaoture of Textiles & Textile ProduotB .. 9·4 20·2 9·0 21·1 16·8 20·1 3. Manufacture of Wood and Wood Produots. ]j'urniture
and Filll:tures 1S·9 '·8 10·' 13·' 1'1.1) 18·S 4. Manufacture of Paper and Paper Produots & Printing,
PubliBhing and Allled Industries • . • • • • 1·4 O·li 0·2 0·4, 1·1 0·0 o. Manufa.oture of Leather. Leather &; Fur Products 1'1·3 14·2 26·0 19·3 20·3 18·6 6. lIrIImufaoture of Rubber, Plastio, Petroleum and Coal Pro-
ducts 0·6 0·6 O'S 0·2 7. Manufaoture ot: Chemioals and Chemical Produots (except
Produots of Petroleum a:nd Coal) .• I·S o·e 1·3 0·3 1·0 O·S 8. Manufa.oture of Non·Metallio Mineral Produots 5'0 6·1 3·'1 10·8 '1.5 8·2 9. BaBio Metals and their Products (exoept Machinery and
Transport Equipment) 6·1 8·1 8·1i 1-8 3·0 2·4-10. Manufaoture of Maohinery of all kinds (except Transport)
O·S 0·5 0·8 0·1 inoluding Electrical EqUipments •. 0·1 1·1 ll. Manufaoture of TraDBport Equipment and Faria 0·1 0·1 o·a N 0·3 o·a 12. Misoellaneous Manufacturing Industries 18·1 It,·. l'l·4 10·8 8·2 '1.'1 18. Repairs "., 8·0 8·1 , . ., 1.3 6·8
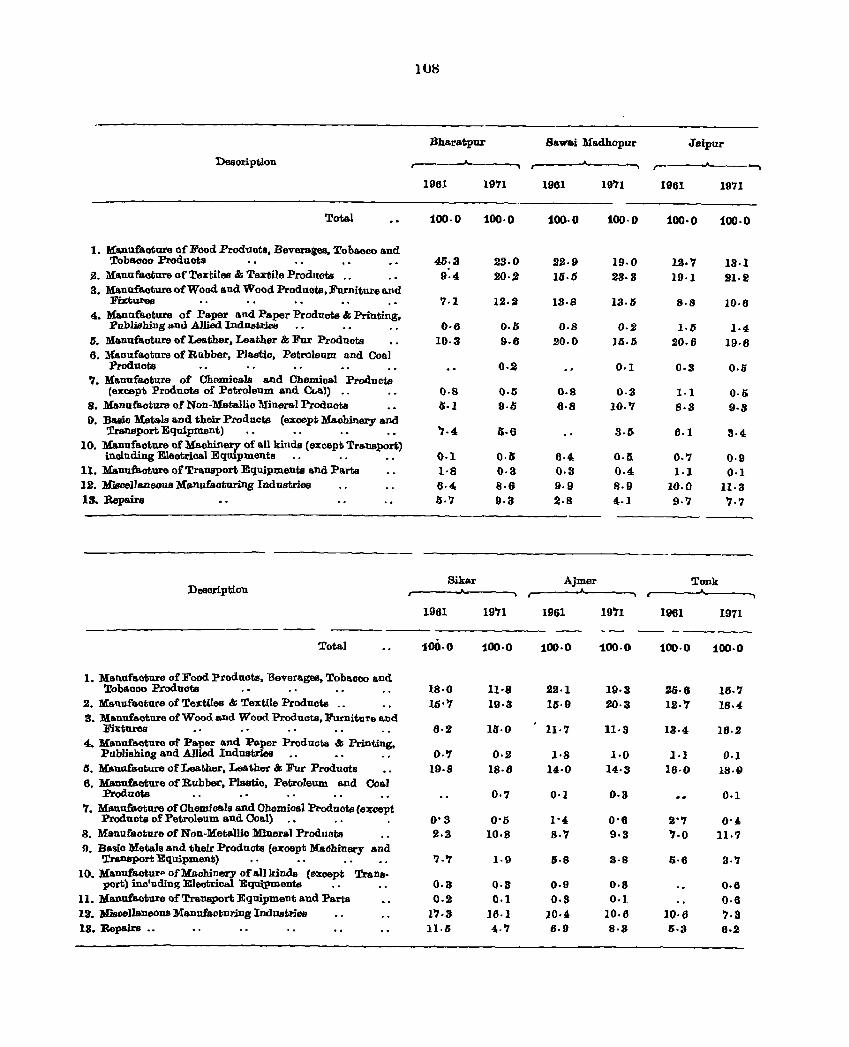
}08
Bharatpur 8a.wai Madhopur Jaipur
Desoription r- t' A.-
1961 1911 1961 19'71 1961 19'71
TotaJ 100·0 100·0 100·0 100·0 100·0 100·0
1. Manufacture of Food Produots, Beverages, Tobacco a.nd Tobaooo Products 45·3 23·0 22·9 19·0 1.2·7 13·1
2. Mq,nufa.ctare of Textiles & Tenile Products .. 9:4 20·2 16·6 23·3 19·1 21·2 3. Manufacture of Wood and Wood Produots, Furniture a.nd
Fixtures 7·1 12·2 13·8 13· IS 8·8 10·6 4. Manufa.cture of Paper and Paper Products & Printing,
PubJ.iBhing and Amed Industrres 0·6 0.1) 0.8 0·2 }·6 1·4 5. Manufaoture of Leather. Leather & Ful' Products 10·3 9·6 20.0 JJi.l) 20.6 19·6 6. 1\{anaf'acture of Rubber, Plastio, Petroleum a.nd Coal
Products 0·2 0.1 0·3 0.6 7. Ma.nufaoture of Chamicale and Chemical Products
(except Prodnots of Petroleum and Ct.al) .. .. 0·8 O·tS 0·8 0·3 1·1 0·5 8. Manufaoture of Non-Metallio Mineral Products ~·1 9·li 6·8 10.7 B·3 9·3 9. Basio Metals and their Products (except Machinery and
Transport Equipment) '7·4 G·6 3.5 6·1 3·4 10. Manufaot1l1'8 of Ma.ohinery of all kinds (except Transport.)
0·6 inoluding Eleotrioal Eqnipments 0·1 6·4 0.5. 0·' 0·9 11. Manufaoture ofTra.DspoJ.1; Equipments and Parts 1·8 0·3 0·3 0·4 1.1 0·1 12. Miscellaneous Manufaoturing Industries 6·4 8·6 9.9 8.9 10.0 11·3 13. Repaire Is· '7 9·3 2·8 4·1 9·' '7·7
Sikar Ajmer Tonk Desoription ..... ,
1961 19'71 1961 19'n 1961 1971
-- -----Total 100.0 100·0 100·0 100·0 100·0 100·0
1. Ma.nufaoture of Food produots. "Beverages, Tobaoco and Tobaooo Products 18·0 11-8 22·1 19·3 .20·6 16·'7
2. Ma.nufa.oture of Textiles & Textile Products .. 15''7 19·3 15·9 20·3 12.'1 18·4 3. Manufacture of Wood and Wood Prodncts, Furniture a.nd
Finures 6·2 15·0 11·7 }l·3 13-4 16.2 4. Manufacture of PlIoper and Paper Produots & Printing.
Publishing and Allied Industries _ . • • . . 1)·7 0·2 1·8 1·0 1·1 D·} 5. Manufaoture of Leathel', Leather & Fur Produots 19·8 18·6 14·0 14·3 16·0 18·0 6. Manufa.oture of Rubber, Plastio, Petroleum. and Coal
Produots 0., 0·1 0·3 0·1 '1. Manufaoture of Chemicals and Ohemioall'J.ood.uots (except
Produots of Petroleum and Coal) . • . . . 0'3 0'0 I" 0'6 2''1 0" S. Manufaoture of Non-Metallio Mineral Produots 2·3 10·8 8·'1 9·3 '7·0 11·' n. Basio Metals and their Products (except Madhinery and
Transport Equipment) '1-'1 1·9 6·8 3·8 5-6 3·'7 10. :Manufaotul'f' of Maohinery oralJ kinds (except Trane-
port) ino'ndin~ :Electrical Equipments ., .. 0·3 o·a 0·9 0·8 0·6 11. Manufa.oture of Trall8POrt Equipment and Parts 0.2 0·1 0·8 0·1 0·6 12. Miscellaneous Manufa.oturlDg Indust.ries 1'7·3 16·1 lO·' 10·6 10·8 7·3 18. :Repairs .. 11·5 4·'7 6·9 8·3 5·3 6·,2
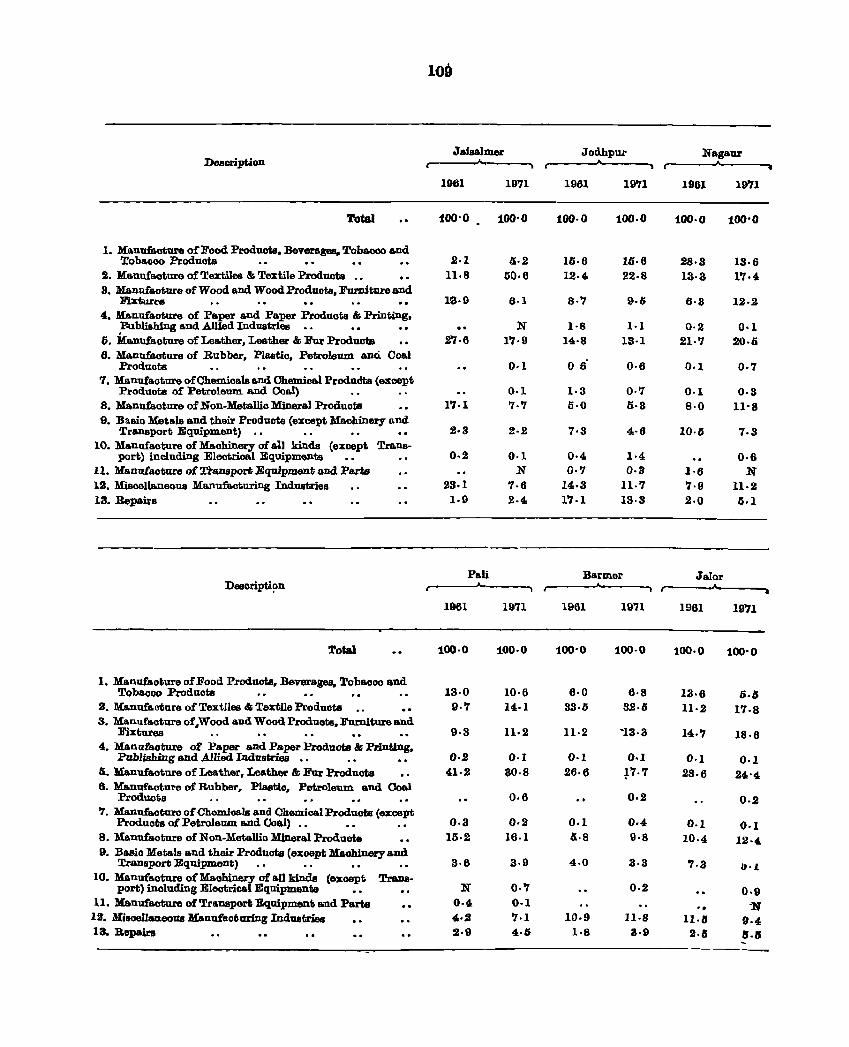
109
JaisaJmer Jodhpur Nagaur Deaoription
1961 19'71 1961 19'71 1961 19'71
Total 100'0 100'0 100·0 100.0 100·0 100'0
1. Manufaoture of Food Prod.ncts. Beverages. Tobaoco and Tobacco Products • • • • • • • • .2·1 a·2 16·6 16·6 .28·3 13·6
2. Manuf80ture of Textiles & Textile Pmduots .. 11·8 50·6 12·4 22·8 13·3 1'1·4 3. Manufaoture of Wood and Wood. Products. Furniture and
Fixtures 13·9 6·1 8·'1 9·1) 6·3 12·2 4. Manufaoture of Paper and Paper Produots " Printing,
,P.u.blishiDg and Allied Industries :N 1·8 1·1 0·2 0·1 6. Manufaoture of Lea.ther. Leather & Fur Products 2'1·6 1'7·9 14·8 13·1 21-'1 20·6 6. Manufaoture of Rubber, Plaatio, Petroleum aDO. Coal
Products 0·1 06' 0·6 0·1 0·'7 7. Manufaoture of Chemicals and Chemioal Produdts (except
Produota of Petroleum a.nd Coal) . . . . 0·1 1·3 0·' 0·1 0·3 8. Ma.nufacture of Non-Metallio Mineral Produots 17·1 7·'1 5·0 ii·3 8·0 11'8 9. Basio Metals and their Produata (except Machinery and
Transport Equipment) .• 2·3 2·2 7·3 4·6 10·6 7.3 10. Manufaoture of Machinery of all kinds (except Tra.ns-
port) including Eleotrioal Equipments •• 0·2 0·1 0·4 1·4 0·6 11. Manufaoture of TraZIBport Equipment and Parts N 0·'1 O·S 1·6 N 12. Miscellaneous Ma.nufaoturing Industries 23·1 7·6 14·3 11·'1 7·9 11·2 13. Repairs 1·9 2.4 1'1·1 13·3 2·0 5·1
Pa.li Barmer Jalar Desoripti!>n
1961 19'11 1961 19'11 1961 1971
----Total 100·0 100·0 100'0 100·0 100·0 100'0
1. Manllfa.oture of Food Produota. Beverages. Tobaooo and Tobaooo Produots • • • • • • • • 13·0 10·6 6·0 6·8 13·6 6·S
2. Ma.nufaDture of Textiles" Textile Produots 9·'1 14·1 33·6 32·5 11·2 17·8 3. Ma.nllfaoture of. Wood and Wood Products. Fu.rnitu.re and
Fixtures .. .. .. •• •• 9·3 11·2 n·2 "i3· 3 14.'1 18·6 4. Mano.faoture of Paper and Paper Produots 85 Printing,
Publishing and Allied IndllStries •• • • • • 0·2 0·1 0·1 0·1 0·1 0·1 6. Manufaoture of Leather, Leather & Far Prodncts 41·2 30·8 26·6 ~7.7 28·6 24'4 6. Manufacture of Rubber, Plaatio, Petroleum and Coal
Produots 0·6 0·2 0·2 7. Manufacture of Chemicals and Chemical Prodaots (except
Produots of Petroleum a.nd Coal) .. • • • • 0·3 0·2 0.1 0·4 0·1 0·1 8. Manufa.oture of N on-Meta.llio Mineral Produota 15·2 16·1 a·8 9·8 10., 12·4 9. Basio Metals and their Produot& (except Maohinery and
3·9 4·0 3·3 Transport Equipment) • • • . • • • _ 3·6 "·3 I) • .1 10. Manufaoture of Maobinery of all kinds (except Trana-
port) inoillding Eleotrical Equipment. •• N 0·'1 0·2 0·9 1I. Manufaoture of Transport Equipment and Pa.rta 0·4 0·1 'N la. Misoellaneous Manufaoturing Industries 4·.2 '1.1 10·9 11·8 11·8 9·4, 13. Repairs 2·9 4·6 1·8 3·9 2·8 S.1I
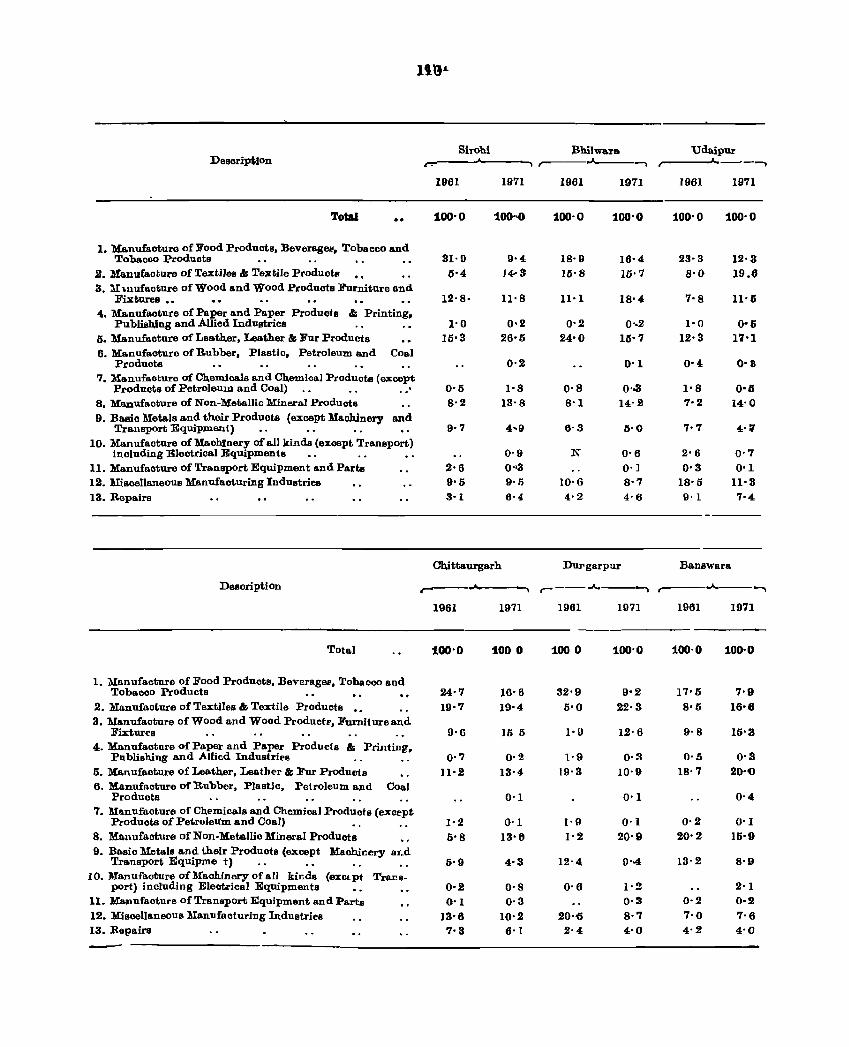
SiTohi Bhilwa.ra Udaipur Desoription r-----.....__~ .
r . --. 1961 1971 1961 1971 1961 1971
Total 100·0 100·-0 100·0 100·0 100·0 100·0
I, l\Ia.nufaoturo of Food Products, Bevera.gel!, Tobacco and Tobaooo Products 31·0 9·4 18·9 16·4 23·3 12·3
2. Manufaoture of Textiles & Textile Products 0·4 ] .... 3 10·8 10·7 S·O 19.6 3. ::'II ulufaoture of Wood and Wood Produots Furniture and
Fixtures ,. 12·8· 11·S 11·1 18·4 7·S 11·6 4. Manufaoture of Paper and Paper Products & Printing.
Publishing and Allied Industries .. .. 1·0 0·2 0·2 0 ... 2 1·0 0·5 6. Manufaoture of Leatb.er. Leather &; Fur Products 15·3 20'5 24·0 15·7 12·3 17·1 6. Ma.nufaoture of Rubber, Plastic, Petroleum and Coal
Produots 0·2 0·1 0-4 0'8 7, Ma.nufacture of Cb.emioa]s and Chemical Produots (exoept
Products of Petroleum a.nd Coal) . . . . . .• 0·5 I·S O·S 0·03 I·S 0'5 S, Manufaoture of Non-Metallic Mineral Produots S·2 13·S S·1 14·2 7-2 14·0 9. Basio Metals a.nd their Produots (except Machinery and
Transport Equipmen1) •. •• .. .. 9·7 4-9 6·3 5·0 7·7 4·; 10. Manufaoture of Machinery of all kinds (except Transport)
including Eleotrical Equipments . . . . • . 0·9 N 0·6 2·0 0·7 11. Manufaoture of Transport Equipment and Parts 2·0 0·'3 O· ] 0·3 0·1 12. Misocllaneous Manufaoturing Industries 9·5 9·1; 10·6 S·7 IS·5 11·3 13. Repairs 3·1 6·4 4·2 4·6 9·1 7·4
Cb,ittaurgarh DUl'garpur Banswara
Description r- ..... "''1 r----..A..---""""\ r----..A..-----~
1961 1971 1961 1971 1901 1971
Total 100·0 100 0 100 0 100·0 100·0 100·0
1. Manufacture of Food Products, Beveragel', Tobacco and Toba.ooo Products • • , • , • 24·7 10·0 32·9 9'2 17·5 7·9
2. Manufacture of Textiles & Tcxtile Products , - 19·7 10·4 5'0 22·3 S'5 16'6 3. Manufaoture of Wood and Wood Productf, Furniture and
Fixtures 9·0 16 5 1·0 12·6 9·S l{i·3 4. Manufaoture of Paper and PaFer Products &; PrintiD~,
Publishing and Allied Industries .. .. 0·7 0·2 1·9 0·:3 0·5 0·3 5. Me.nufaoture of Leather, Leather &; Fur Products U·2 13·4 19·:3 10·9 IS·7 20·'0 6. Manufacture of Rubber, Plastic, Petroleum and Coal
Products 0·1 0·1 0·4 7. Manufaoture of Chemicals and Chemical Products (except
Produots of Petroleum and Coal) • . . . 1·2 0·1 1·9 0·1 0·2 0·1 8. Manufacture of Non-Metallic Mineral Products 5·S 13·0 1·2 20·9 20·2 15·9 9. Basio lIetals and their Products (except Machinery ar.d
Transport Equipme t) . . . . .. .. 6·9 4·3 12·4 0·04 13·2 S·g 10. Manufacture of Machinery of all kiIlds (SXCf.pf Trar.s·
port) including Eleotrical Equipments •. 0·2 0·8 0·6 1·2 2·1 11. Manufaoture of Transport EqUipment and Parta 0·1 0·3 0·3 0·2 0,2 12. Miscellaneous Manufacturing Industries 13·6 10·2 20·-5 S·7 7·0 7·6 13. Repairs 7·S 6·1 2·4 4·0 4·2 4·0 -
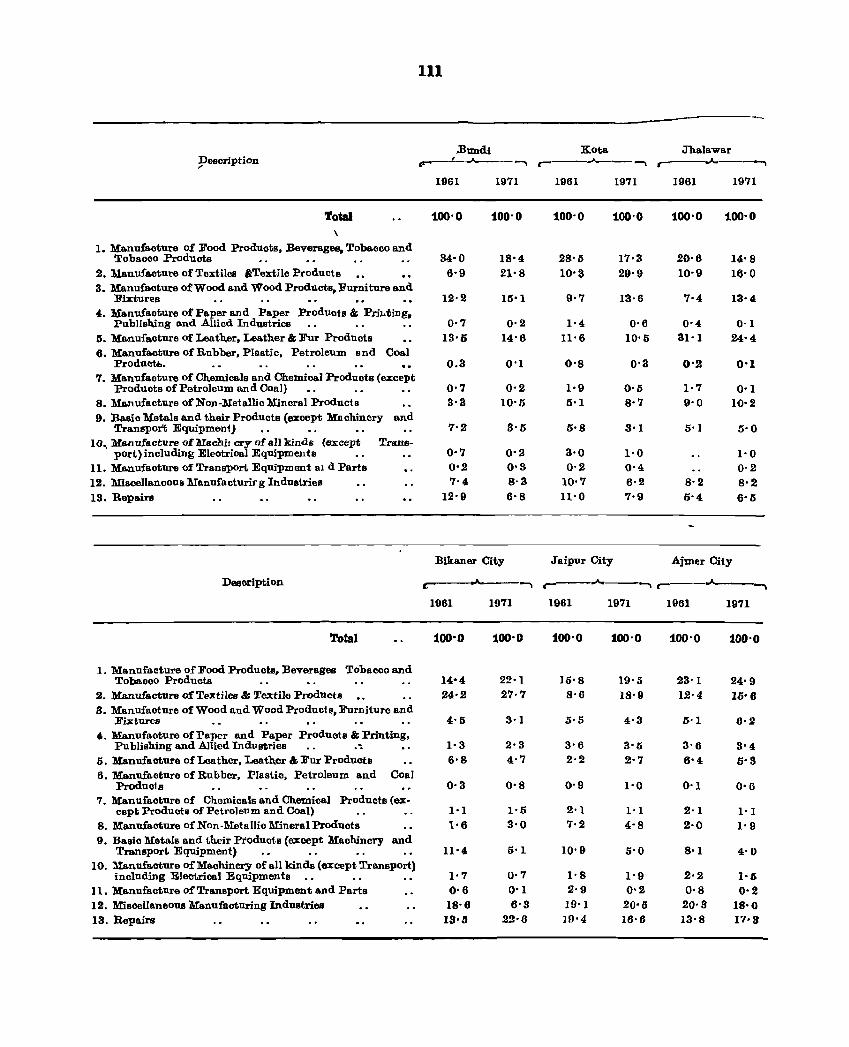
111
.Bundi Kot& Jhalawar pescription - -, r----.J.--- -, r- ~
1961 1971 1961 1971 1961 1971
To1al 100'0 100'0 100'0 100'0 100'0 100'0 \
1. Manufaoture of Food Produots, Beverages, Tobaoco and Tobaooo Produots • . • • . . . . 84'0 18'4 28'5 17·8 20'6 14'8
2. Manufacture of Textiles aTextile Products 6'9 21'8 10'3 29'9 10'9 16'0 3. Manufaoture of Wood and Wood Products, Furniture and
Fixtures 12'2 15'1 9'7 13'6 7·4 13'4 4. Manufaoture of Paper and Paper Produots & PriLting.
Publishing and Allied Industries .. .. .. 0'7 0'2 1'4 0'6 0'4 0-1 5. Manufaoture of Leather, Leather & Fur Produots 13'5 14'6 11'6 10'5 31'1 24'4 6. Manufaoture of Rubber. Plastic, Petroleum and Coal
Produot!.. O.S 0'1 0'8 0'3 0'2 0'1 7. Manufaoture of Chemicals and Chemica) Produots (except
Produots of Petroleum and Coal) •. .• •. 0'7 0'2 1,9 0'5 1·7 0'1 8. lIanufacture of Non-Metallic Mincral Products 3'S 10'5 5'1 8·7 9'0 10·2 9. Basio Metals and their Products (except Machinery and
Transport Equipmen1) 7'2 3'5 5'8 8'1 5'] 5'0 lO~ Hanufacture oClIaahir ery of an kinds {excelJt Traus-
port) including Electrical Equipmentl! •• 0'7 0'2 3'0 1'0 1- 0 11. Manufaoture of Transport EqUipment 61 d Parts 0'.2 0'3 0'2 0'4 0'2 12. Miscellaneous Yanufneturir g Industries 7'4 8·3 10'7 6'2 8'2 8'2 13. Repairs 12'9 6'8 11'0 7·9 0'4 6'5
Bikaner City Jaipur City Ajmer City
Desoription r:- "A. ~ r- .JI..-~ r- oJ> ~
1961 1971 1961 1971 1961 1971
Total 100'0 100'0 100'0 100'0 100'0 100'0
1. Manufaoture of Food Products. Beverages Tobacco and Tobaooo Prodllcts 14'4 22·1 15'8 19'5 23'1 24'9
.2. Manufacture of Textiles & Textile Products 24·2 27·7 8'6 18'9 12'4 Hi' 6 3_ Manufaoture of Wood and Wood Produch. Furniture and
Fixtures 4-5 3'1 :;-5 4-3 0'1 6-2 4. Manufaoturo ofI'aper and Paper Products & Printing.
Publishing and Allied Indvstries _. .":. ._ 1·3 2-3 3-6 3'0 3'6 3-4 O. Manufacture of Loathcr. Leather & Fur Products 6'8 4-7 2·2 2-7 6-4 5'3 6. Manufacturo of Rubber. Plastic, Petroleum and Coal
Producfs 0-8 O-S 0-9 1-0 0'1 0'6 7 _ Manufacture of Chomicals and Chemical Products (ex-
cept Products of Petroleum and Coal) I-I 1-0 2'1 1'1 2-1 1'1 8. Manufacture of Non -:&IetalJie Mineral Products 1'6 3'0 7·2 4-8 2'0 1-9 9. Basio Metals and their Products (except Machinery and
Transport Equipment) . • . • . . 11-4 0'1 10'9 5-0 8-1 4'0 10. lIanufaoture of Machinery of all kinds (except Transport)
including Electrioal Equipments • _ _ . • _ 1'7 0·7 I'S 1-9 2-2 1'0 11. Manufacture of Transport Equipment and Parts 0-6 0-1 2'9 0'2 0'8 0-2 12. Misoellaneous Manufacturing Industries 18-6 6'8 19'1 20-5 20'3 18'0 13. Repairs 13'5 22'0 J!)-4 16'6 13'8 17'3
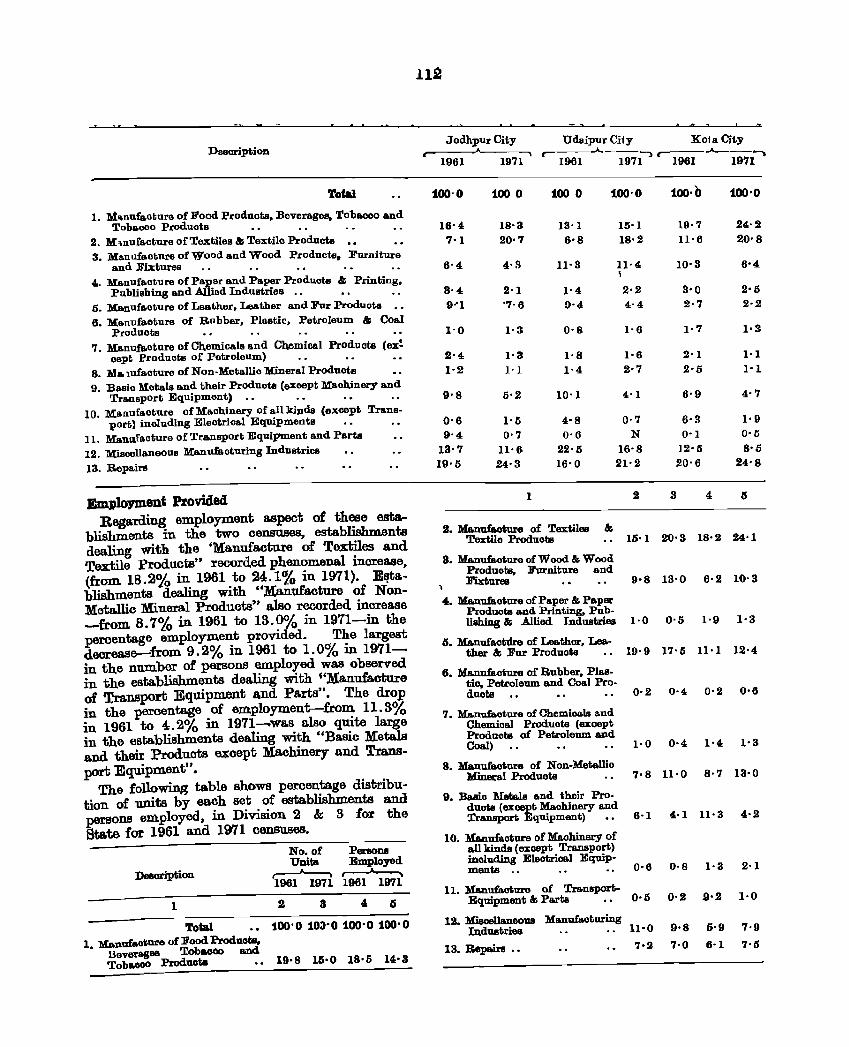
Description
Total
1. ~bnufe.oture of Food Produots. Beverages, Tobacoo and Tobaooo Produots _ _ . _ - - __
2. Muufacture of Textiles &; Textile Products •• 3. Ma.nufaoture of Wood and Wood Products, Furniture
and Fixtures _. . - _. . - .• 4. l\Ia.nufa.oture of Paper and Paper Produots &; Printing.
Pilblisbing and Allied Industries .• •• _. 5. Manufaoture of Leather. Leather and Fur Products __ 6. l\Ia.nufaoture of Rubber. Plastic, Petroleum &; Coal
Produots 7. Manufaoture of Chemioals and Chemical Products (ex~
oept Products of l'etroleu:m) g_ :M &1Ufaoture of Non -:Metallio Mineral Produots 9_ Basio Metals and their Produots (except Maohinery and
Transport Equipment) • -10. Manufaoture ofMaohinery of all kiDds (except Trans-
port) inoluding Eleotrical Equipments 11. Manufacture of Transport EqUipment and Parts 12. Misoellaneous Manufacturing Industries
13. Repairs
EmPlo)'Dlent Provided Regarding employment aspect of these esta
blishments in the two censuses, establishments dealing with the 'Manufacture of Textiles and Textile Products" recorded phenomenal increase, (from 18.2CYo in 1961 to 24.1% in 1971). E"tablishments dealing with "Manufacture of NonMeta.llic Mineral Products" also recorded inorease -from 8.7% in 1961 to 13.0% in 1911-in the percentage employment provided_ The largest decrease-from 9.2% in 1961 to 1.0% in 1971-in the number of parsons employed was observed in the establishments dealing with "Manufacture of Tra.nsport Equipment a.nd Parts". The drop in the percentage of employment-from 11.3% in 1961 to 4_2% in 1971--.wa.s also quite large in the establishments dealing with "Ba.sic Metals and their Produots except Machinery and Transport Equipment".
The following table shows percentage distribution of units by each set of establishments and persons employed, in Division 2 & 3 for the State for 1961 and 1971 censuses.
No. of Persona Units Employed
Desoription (1961 Jj, 197i r1961 " 197i
1 3 4 6
Total 100'0 103-0 100'0 100'0 1. Manufaoture of Food Praduota.
Beverages Tobaooo and Toba.eoo Produotll 10'9 15'0 1S-5 14'3
11.Q
Jodhpur City --.
Udaipur City Kota City r---..A.----:\ r---..A.---'-
1961 1971 1961 1971 1961 1971~
100'0 100 0 100 0 100'0 100'0 100'0
16'4 lS-3 13'1 7'1 20'7 6'S
15-1 18-2
19·7 11-6
24-2 20'S
6-4 4-a U·3 11'4 10-3
3'4 2'1 1-4 9"1 '7-6 0-4
1-0 1-3 O-g
2-4 1'3 I'S 1-2 1'1 1'4
9'9 5-2 10-1
0'6 1'5 4'8 9'4 0'7 0-0
, 2-2 4-4
1-6
1·6 2-7
4'1
0·7 N
3'0 2·7
1-7
2-1 .2-5
6-9
6-3 0-1
1'1 1'1
13·7 11-6 22'5 16-9 1.2'5
1-9 0-5 9'5
19'5 24-3 16'0 21-2 20-6 24-S
1
2. Manufacture of Textiles &; Textile Produots
3. Manufacture of Wood & Wood Produets. Furniture and Fixtures
4. Manufacture ofPa.per & Paper Produots and Printing, Publishing &; Allied Industries
5. Manufaotlire of Les.ther. Leather &; Fur Produots
6. Manufacture of Rubber. Plastic, Petroleum and Coal Produots
7 _ Manufaoture of Ohemioals a.nd Chemioal Produots (except Products of Petroleum and Coal)
8. Manufaoture of Non-Metallio Mineral Products
9. BaBio Mets.1s and their Produots (except Maohinery and Transport Equipment) ••
10_ Ma.nuf&oture of Maohinery of all kinds (except Transport) inoluding Eleotrioal Equipmenta ..
3 4 5
10'1 20'S 18'2 24'1
9'S 13'0 6-2 10-3
1-0 0-5 1-9 1'3
19-9 17-5 11-1 12-4
0-2 0-4 0·2 0'6
1-0 0-4 1-4 l'S
7'9 11·0 9-7 13'0
6-1 4·1 11·3 4·2
0'6 o·g 1-3 2-1
11. Ma.nufaoture of Tranaport-Equipment & Parts O' 5 0·2 1-0
12. :Misoellaneous Manufacturing ID,dnstries n· 0
13. Repairs ••
9'9
7-0
5'9
6-1
7'9
7-5
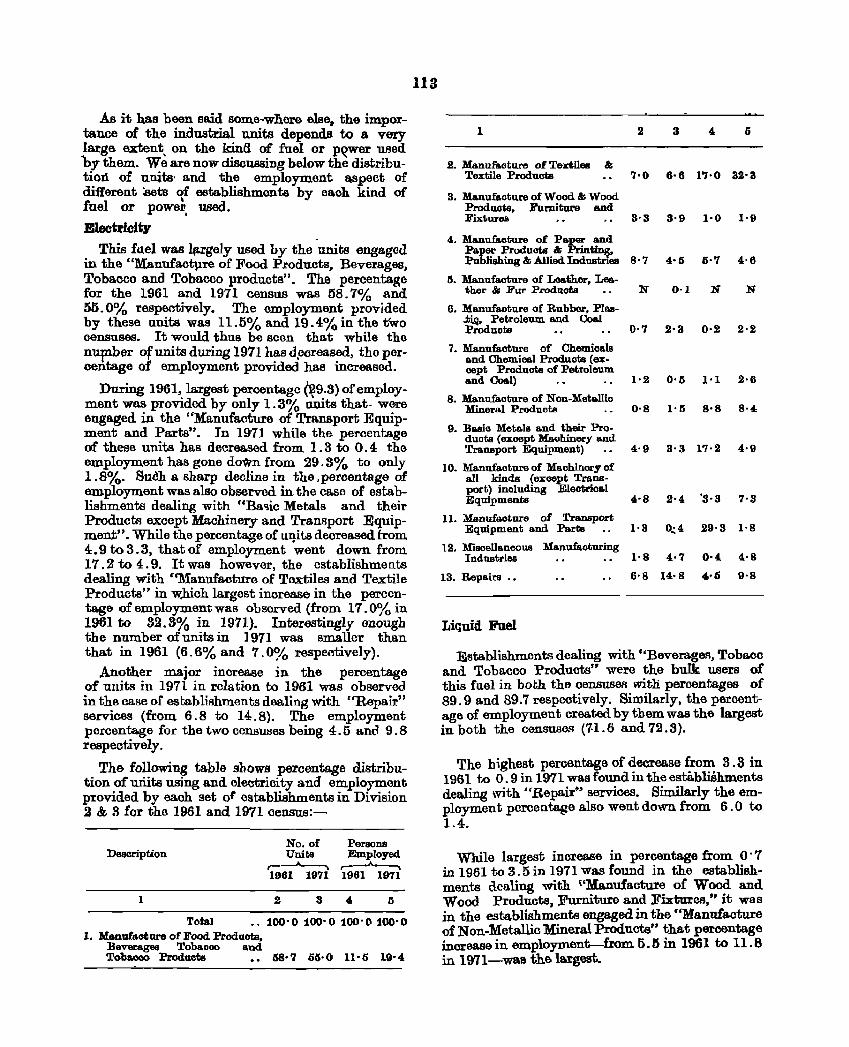
As it has been said some-where else. the importance of the industrial units depends to a very large extent, on the kind of fuel or p~wer URed "by them. We are now discUBSing below the distributiOI:!. of units' and the employment "8 pect of different Bets of establishments by each kind of fuel or powe1. used.
Eleciricity
This fuel was l~ly used by the 'units engaged in the "Manufactp.re of Food P.roducts~ Beverages, Tobacco and Tobacco products". The percentage for the 1961 and 1971 census was 58.7% and 55.0% respectively. The employment provided by these units was 11.5% and 19.4% in the tWo censuses. It would thus be seen that wbile the nu:p:l.btlr of units during 1971 has d!3oreased, tho percentage of employment provided has increased.
During 1961,. largest percentage (¥9.3) of employment was proVIded by only 1.3% ru;rits that- were engaged in the "Ma.nufaoture of Transport Equipment and Parts". In 1971 while the peroentage of these units has decreased from 1.3 to 0.4 the employment has gone doWn from 29.3% to only 1 . 8%. Su~h a sharp decline in the, peroentage of employment was also observed in the ca.se of establishments dea.ling with "Basio Metals and their ProductR except MachineIY and Transport Equipment". While the percentage of uq.its decreased from 4.9 to 3.3, that of employment went down from 17.2to4.9. It was however, the establishments dealing with "Manufacture of Textiles and Textile Products" in w.h,ich largest increase in the percentage of employment was observed (from 17.0% in 1961 to 32.3% in 1971). Interestingly enough the number of units in ] 971 was smaller than that in 1961 (6.6% and 7.0% respectively).
Another major increase in the percentage of units ill 1971 in relation to 1961 was observed in the case of establishments dealing with "Repair" servioes (from 6.8 to 14.8). The employment percentage for the two cellsuses being 4.5 ano 9.8 respectively.
The following table shows percentage distribution of uriits using and electricity and employment provided by each set of establishments in Division 2 & 3 for the 1961 and 1971 census:-
No. of Persons Description Units Employed
r- , r---'-----. 1961 1971 1961 1971
1 2 3 5
Total 100· 0 100· 0 100' 0 100· 0 1. Manufaotare of Food Products,
Beverages Tobll.ooo II.nd Tobr.ooo Products • • 58· 7 50· 0 n· 5 19· 4
118
1 2
2. Manufaoture of Textiles & Textile ProduGts 7·0
3. Ms.nufaoture of Wood &; Wood Products, Furniture and ~xtureB 3'S
4. Ms.nufaoture of Paper and
3 o
6·6 17·0 32'3
3'9 1·0 1'9
PII.per Products &; Printing, Publishing&;AIliedIndllStries S·7 4·5 6·7 4'6
5. Manufaoture of Leather, Lea-ther &; Fur Products NO,1 N N
6. Manufaoture of Rubber, PlaB.J;i.Q. Petroleum and Coal Produots •• " 0·7 2·3 0·2 2'2
7. Manufaoture of Chemioals and Chemioa.l ProduoUs (ex-oept Produots of Petroleum and Coal)
S. Manufaoture of Non-Metallio Mineral Produots
9. Basio 'Metals and their Produots (except Maohinery and Transport Equipment)
10. Ma.nufa.oture of Maohineryof all kinds (except Trans· port) including Electrioal Equipments
11. Manufaoture of Transport Equipment and Parts
12. lfisoellaneouB Manufaoturing Industries
13. Repairs .•
Liquid Fuel
1·2
0·8
4'9
4-8
1'3
1'8
6'S
0'5 1·1 2'6
1'5 8·8 8·4
3·3 17·2 4'9
2'4 ·3'3 7'3
0,:4 29·3 I'S
4·7 0·4 4·8
14·8 4·0 9'S
Establishment.<;; dealing with "BeverageR, Tobacc and Tobacco Products" were the bulk users of this fuel in both the censuses witli percent..ages of 89.9 and 89.7 respectively. Similarly, the percentage of employment created by them was the largest in both the censuses (7-1.6 and 72.3).
The highest percentage of decrease from 3.8 in 1961 to 0.9 in 1971 was found in the es.t&blishments dealing with "Repair" services. Similarly the employment percentage also went down from 6.0 to 1.4.
While largest increase in peroentage from O· 7 in 1961 to 3.5 in 1971 Was found in the establishments dealing with ('Manufacture of Wood and Wood Products, Furniture and Fixtures," it was in the establishment.'3 engaged in the "Manufacture of Non-Metallic MineraI Products" that percentage increase in employmentr-from 5.5 in 1961 to 11.8 in 1971-wo.s the largest.
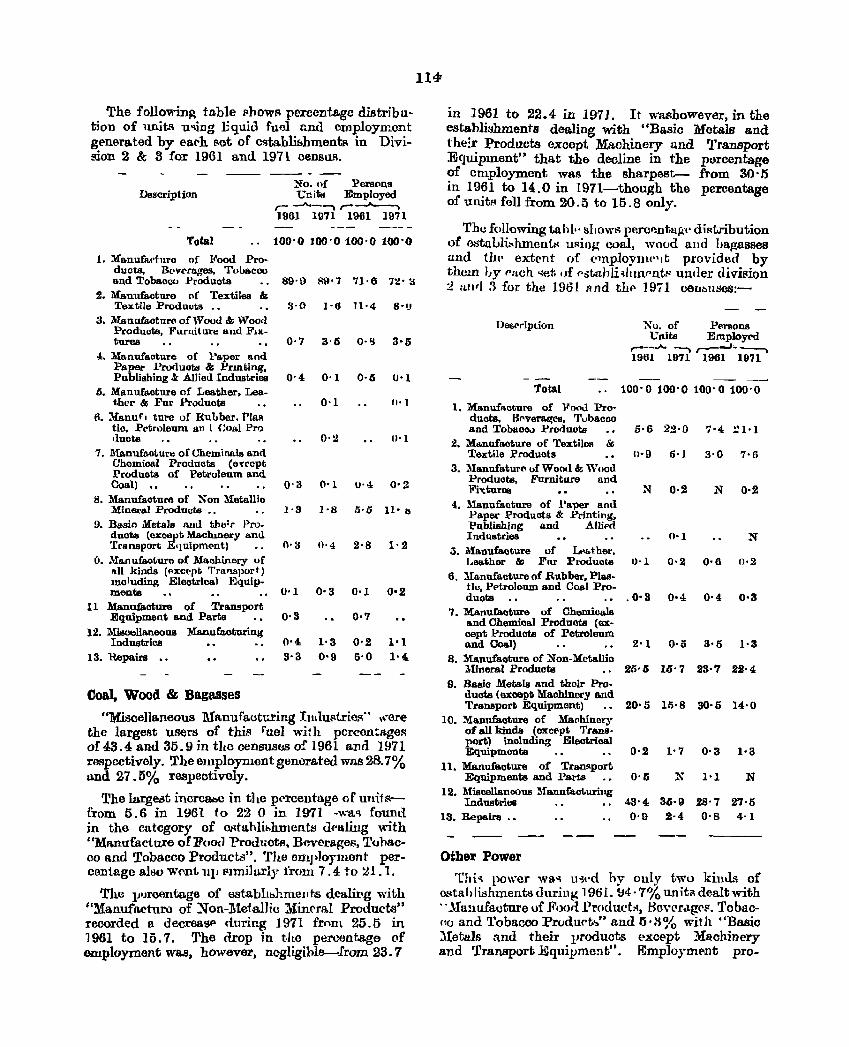
The followinA table flhowf' percentage distribution of llnitl~ u~ing Equid fupJ und emploYIr..ent gl"nel'ateci by ea('h ['lot of c~l"babli&hmentR in Division 2 &; 3 for 1961 and 1971 census.
Description :lSo. of Persons t:nits Employed
r- ...J..._~ ,-- __"'_-"'I
1961 1971 1961 1971
Total 100'0 100'0100'0 100'0
1. Manufal'turo of Foot! Products, BtwE'rnges, TuUacco and Tobaccu Produots 89' I) ~9' 7 71· 6 72' a
2. Manufacturo or Textiles & Textile Products .• :~·O 1'6 11'4 S'U
3. Manufo.otul"fI of'Vootl & Wooel Products. FurIlitare Rnd FIx. tures 0·7 3'5 0·'1 3'5
4. Manufaoture of Paper and Paper Produotl! & Prmt.ing. Publishing &: Allied Industries O' 4 O· 1 O· 5 0'1
o. Manufacture of Leather, Lea. tbl'l" & FlU' Products O' 1 ,.. 1
fl. l£a.nufl ture of Rullber, Plas. tic. Petroleum an 1 Coal Pro liucts o· 2 0'1
7. l\to.nufaot.urOl of eheminals lionel Chemioal Products (e~ccpt Produots of Petroleum and Coal) .. 0'3 0'1 u·4 0'2
8. MIIoIlufacture of Non }Ieto.lIio Mineral Products .. 1·3 1'8 .5, 0 11' ~
9. Basic Metals amI the;r Pro. ducts (except Machinery ... nll Transport E'IUipmf'nt)
O. Manufaoture of Ma.ohinery 01" 1111 kinds (I>xc{'pt 'T'ra'lSport) !Deluding j4Jleotrica.l Equipmenta
11 Manufa.oture of Transport Equipment a.nd Parts
12. Miauellaneous Mllonufl1oturing Ind11Btrica
13. 'Repairs ••
Coal, Wood & Bagasses
o·a 0'4 2'8 1·2
0'1 0'3 0·1 0·2
0·3 0·7
0'4 1'3 0'2 1'1 3'3 0'9 6'0 1'4
"Miscellaneous l\1anufautG-ring lHllu~trio~" ,,'ere the largest users of this ruel wi! h pcrecn!;age!'l of 43.4 and 35.9 in tlle ccnsUBus of 1961 and 1971 respectively. The employment genorated was 28.7% u.nd 27.5% respectively.
The largest incrcabc in the pt'rceutage of unit,;:.from 5.6 in 1961 to 22 0 in 1971 -wac> found. in the catcgory of ORtahli"hment!:l u('aliug with "Manufacture of Food ProduotR. Bcvera.gc8,l'ohacco and Tobacco Products". The employment percentage also wf'ni 111) l"lmi]uxly from 7 . 4 to ~1 . 1.
The IJ'Jrcentage of establil)hmellts dealil'S with "Manufnctl.1ro of ~on-:alef.al]iu lIinE'ral Products" recorded Ii decl"cas~ au ring 1971 frnm 25.5 in 1961 to 15.7. The drop ill t·ILe percent.age of employment was, however, nogligihle--Irom 23.7
114r
ill 1961 to 22.4 in 1971. It washowever, in the estahliahments dealing with "Basic Metals and t he!r Products except Maohinery tlond Transport Equipment" that the decline in the porcentage of employment was the sharpest- from 30' 5 in 1961 to 14.0 in 1971-though the percentage of units fell from 20.5 to 15.8 only.
The following ta h t.· sl lOWR perop.nt.agt· diRtribution of BstaLlkhmcntl'l uRing coal, wood alld hap:asBes and tIll' extent of C'lfiploymt"lt provided by them JJy "fLch 'let of (·."tahlhlnnf'utl'l unl1er division 'i Itwl 3 for the 1961 and thf' 1971 c8Ul>l1Ses:-
Det;('l"iplion
Total
1. Manufacture of 'Fo,,1]. Produots. Bt'veTa.~e9. TubacDO and Tobaco.> Prorluota
2. Milonufacture of Textiles & Textile Produots
3. Manufo.tuTf'I ur Wood & "'c 'od Produots. Furniture and Fh;turea
4. l\1anufacture of Paller and Paper Products & Printing, Publishing and A.1lif'rl Industries
ol. Manufaoture uf r..'I.tber. J.eather &i Fill' Ptoduots
6. llanufa.eture of Rubber. Plastic, Pf'ttolOllDl and CO&I Produots
7. Manufaoture of Chemicals and Chemioa.l Produats (ex· oept Productl! of Petroieum. and CO&I) • • • ,
8. Manufaoture of :Non·Metallio Mineral Produots
9. Basie Metals And their Pro· duots (excepli Maohinery Bond Transport Equipment)
10. Mannfa.oture of Mar-binary of all kinds (excf'pt 'T'rans· port) including Electrioal Equipments
Xu. of Pf!l'!lons enits Employf'd
r---Ao --, ~._--. 1961 1971 1961 1971
-- --100'0100'0100'0100'0
5·6 22'0 'j'4 !! 1'1
0'9 0'1 3·0 7·6
N 0·2 N 0·2
0'1 N
1,)-1 0·2 0·6 0·2
.0'3 0·4 0'4 0·3
2'1 0'0 3'5 1·3
25'6 16' 7 23·7 22'4
20'5 Iii' 8 30'0 14·0
0'2 1'7 0'3 1'3 11. Manufaoture of Tra.nsport
Equipmenta and PartB 0'5 ~ 1'1 N 12. :M:isooll&nuoull ~ranufacturing
Industries 13. Repairs .•
other Power
43'4 0'9
36·9 28'7 27·5 2·4 0'8 4·1
Tlti'l power W8'1 llwd hy only twu killJs of C8tahlishmentsdurill~ 19tH. !J4· 7% unit~ dealt with .. )Iallufacture uf 11'oon l')l'(lduct~, BCV(lrc1g('l'!. 1'obac-1:0 and Tobacco Prudu('t"," and ij':i% with "Basic :\Ietuls and their products except Machinery and Transport .Equillment". IDmploymp-nt pro-
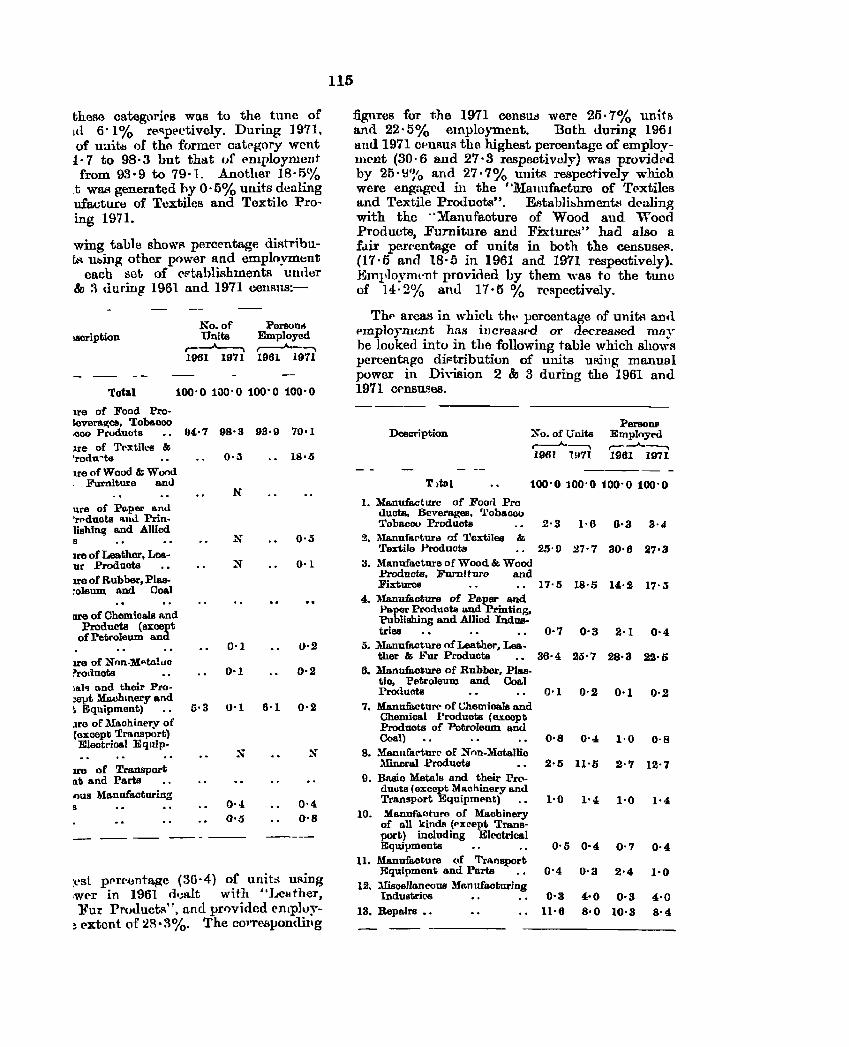
these oategori('s wa.s to the tune of III 6'1% r('o~pt'ctively. During ]971, of uaito of the formcT catf'-gory went
1· 7 to 98·3 but that uf t~mploylllent from 93· 9 to 79· 1. Another 18· 5%
_t was generated hy 0'5% units dealing ufacture of Textiles and Textile Proing 1971.
wing table ShOWR percentage diRtribu~:,l, UbUlg other power and employmunt
each set of ~t"tahlishlUents under & :~ during 1961 a.nd 1971 0011",n8:-
lBoription No. of Persond Units Employed
,----A...-.-..., r---I'-----... 1961 1971 1961 1971
Tota.l 100'0100'0 100'0 100'0
Ire of Food Pro· loverar;p;e8. Tobaoco ,000 Produots 04'7 98'3 93·9 70·1 ll'e of Tl"xtile8 & 'ro,lu~t6
Ire of Wood & Won,l Furniture and
ure of Paper a.nu 'rl'duots II.UU Prin· lishin~ and Allied B
Ire of Leather. Lea· ur Products U'e of Rubber, Plas· :olemn and Coal
~ of Chemicals a.nd Products (except
of Petroleum and
Ire of Nnn-M"taluc ~roducts
lo.l"1 Bnd their Pro::01't Ma.ohmery and ~ Equipmcnt) o· 3 .Ira of Machinl'ry of (exoopt Transp,>rt) Electrical Equip.
11'0 of Tmnsport [1t and Parts onus Manufa.cturing
0'0) 1S·5
N
N 0'')
0'1
0'1 0·2
0'1 0·2
0'1 6·1 0·2
0·4 0'8
:t'st pl'r('ontap;e (30' 4) of llnit~ UI~ing ,w('r in 1961 d,;alt with "l"cather, Fur Pruuucts". and provided enlp]uy
~ ('nent of:.!R· ::\(Yo. The C01TNI):Jondil'g
115
figures for the 1971 census were 25·7% unitf'> and 22·5% employment. Both uurin~ 1961 alllil971 Cf'nSUR the highest percentage of employUl('nt (30· 6 and 27·3 respectivoly) was providl'd by 25'~% and 27·7% units respectively which were engaged in the "l\Iauufacture of T('xtilcs and Textile Products". Establibhmcnttl d('uling with the ")Ianufaeture of Wood and "Tood Products, Furniture and FixturcB" had also a f.lir pereentagc of units in both the CenE-USNI.
(17·5 and 18'0 in 1961 and 1971 respectively). Bml'}oyml'nt provided uy them was to the tunc of 14·2% anu 17'0 % r('spectively.
Thf' areas in which tht· percentage of unit.~ ancI PIllploynwnt has iIlcreasfod or decreased mny be looked intu in tue following table which shows pcrcentap:e dif'tribution of units mUllg manual power in Division 2 & 3 during the 1961 and 1971 Cf'nBuses.
Desaription ~o. ofUoits ....---'----.. 1961 11-171
PersoDl' Employpd ,...--..A-_ ... 1961 1971
100'0100'0 100'0 100'0
1. lIanufacture of Foorl Pro ducts. Beverages. 'l'obacco Tobacco Products 2'3 1·6 0'3 3'4-
2. l\Ianufarture of Textiles & Textile Products 2.';'0 27'7 30·6 27'3
3. :\Ianufacture of Wood & Wood Products. Furniture and Fixtures 17·5 18'5 14·2 17':;
4. l\Irmufa.ct-ure of Paper and Paper Products and Printing. Publishing and AlIicd Ind1lll-tries 0'7 0'3 2'1 0'4
5. Mrmufact-ure nfLeather, Lea· ther & Fur Products .. 36'4 25'7 28·3 22·6
6. Manufacture of Rubber, Plas· tio, Petroleum and Coa.l Produnts 0'1 0'2 0'1 0'2
7. Mo.nufa.cturr ofChemioals rmd Chemical Produots (exoopt Products of Petroleum and Coal) 0·8 0'4 1·0 o·s
8. l:lanufat'turl' of N nn.Mctallio IDnoral Products 2'5 11'5 2'7 12'7
9. Basio Metals and their Pro-duuts (except Machinery and Transport Equipmeoot) 1-0 hi 1·0 1'4
10. Manufacture of Machinery of all kindll ("xC'ept Trans-port) including Electrical Equipments 0'5 0'4 0'7 0'4
11. ~ufaoture of Transport J<~quipment and Parts 0'4 0'3 2'4 1·0
12. lIisoello.nC'ous Manufaoturing Industrios 0'3 4·0 0·3 4'0
13. Repairs ., 11'6 8·0 10'3 8'4
- -- -
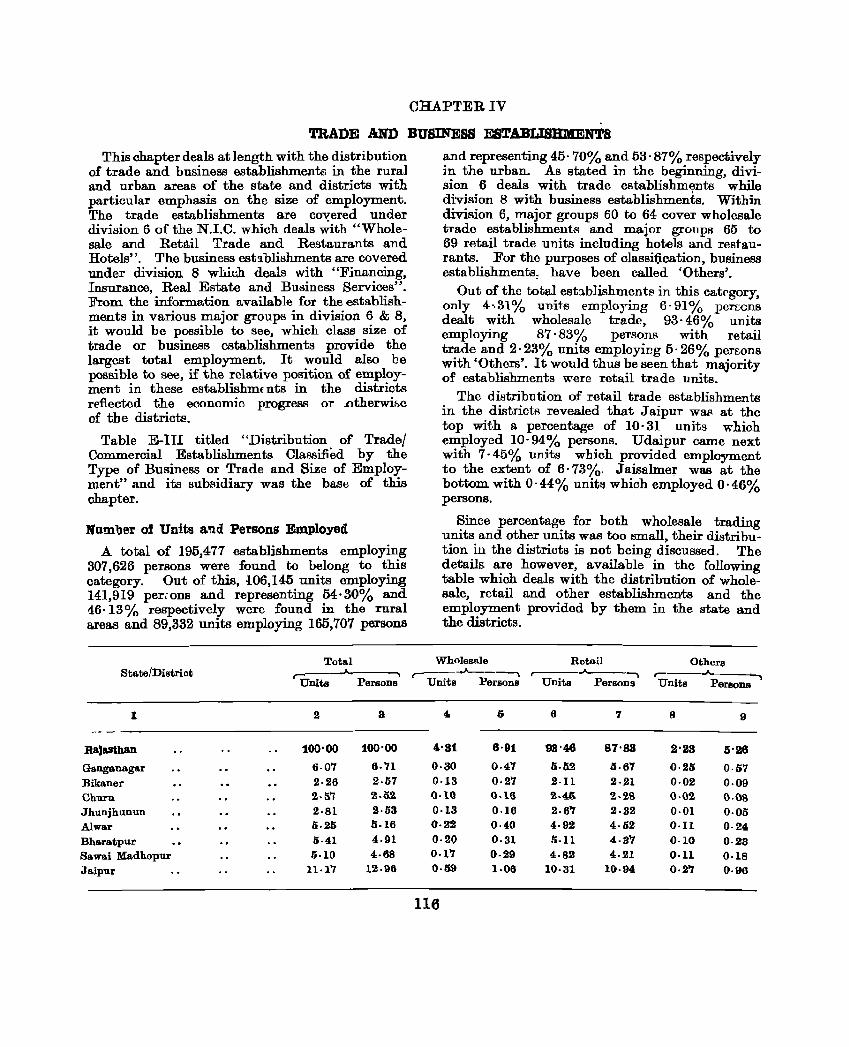
CHAPTER IV
TRADE AND BUSINESS ESTABLISBlVIENTS This chapter deals at Jength with the distribution
of trade and business establishments in the rural and urban areas of the state and districts with particular emphasis on the size of employment. The trade establishments are covered under division 6 of the N.I.C. which deals ~ith "Wholesale and ReMil Trade and Restaurants and Hotels". The business est~blishments are covered under division 8 whiuh deals with "Financing, Insurance, Real Estate and Business Services". From the information available for the establishments in various major groups in division 6 & 8, it would be possible to see, which class size of trade or business establishments provide the largest total employment. It would also be possible to see, if the relative position of employment in these establishm< nts in the districts reflected the economic progress or .otherwif>c of the district!'!.
Table E-III titled "Distribution of Trade! Commercial Establishments Classified by the Type of Business or Trade and Size of Employment" and its subsidiary was the base of this chapter.
Number of Units a~d Persons Employed
A total of 195,477 establishments employing 307,626 persons were found to belong to this category. Out of this, 106,145 units employing 141,919 per.-ons and representing 54·30% and 46·13% respectively were found in the rural areas and 89,332 units employing 165,707 persons
Total State/District r:-:_---.A.
Units PersoDs
1 2 3
RaJasthan 100'00 100·00
Ganganagar 6·07 6·71 Bikaner 2.26 2·57 Churu 2·5'1 2·52
Jhunjhunun 2·81 2·53 Alwar 5·26 5·16 Bhara.tpur 5·41 4·91 Sawai Madhopur 5·10 4·68 Jaipur 11.1'7 12·96
and representing 45· 70% and 53·87% respectively in the urban. As stated in the beginning, division 6 deals with trade establishments while division 8 with business establishments. Within division 6, major groups 60 to 64 cover wholesale trade establishments and major grOllpS 65 to 69 retail trade units including hotels and restaurants. For the purposes of classi(ication, business establishments, have been called 'Others'.
Out of the total est:l.blishments in this category, only 4,31% units employing 6·91% pen:cns dealt with wholesale trade, 93· 46% units employing 87·83% personR with retail trade and 2·23% units employir.g 6·26% perwns with 'Others'. It would thus be seen that majority of establishments were retail trade units.
The distribution of retail trade establishments in the districts revealed that J aipur waR at the top with a percentage of 10· 31 units which employed 10-94% persons. Udaipur came next with 7·45% units which provided employment to the extent of 6·73%. J aisalmer was at the bottom with 0·44% unit~ which employed 0·46% persons.
Since percentage for both wholesale trading units and other units was too small, their distribution in the districts is not being discussed. The details are however, available in the following table whioh deals with the distribution of wholesale, retail and other establishments and the employment provided by them in the state and the districts.
Wholesale Retail Others .---.A.------, .A. ___ --., .----"",
PersOD8~ Units Persona Units Persons Units
4 6 6 7 8 9
4·S1 6·91 9S·46 87·83 2·23 5-26 0·30 0·47 5·112 (i. 67 0·25 0·57 0·13 0·27 2·11 2·21 0·02 0·09 ()·I() (l·IS 2·46. 2·28 (}·O2 ()·OS 0·13 0·16 2·6'7 2·32 0·01 0·05 0·22 0·40 4·92 4·52 0·11 0·24 0.20 0·31 li·n 4·3'7 0·10 0·23 0·1'1 0·29 4·82 4·21 0·11 0·18 0·69 1·06 10·31 10·94 0·2'7 0·96
116
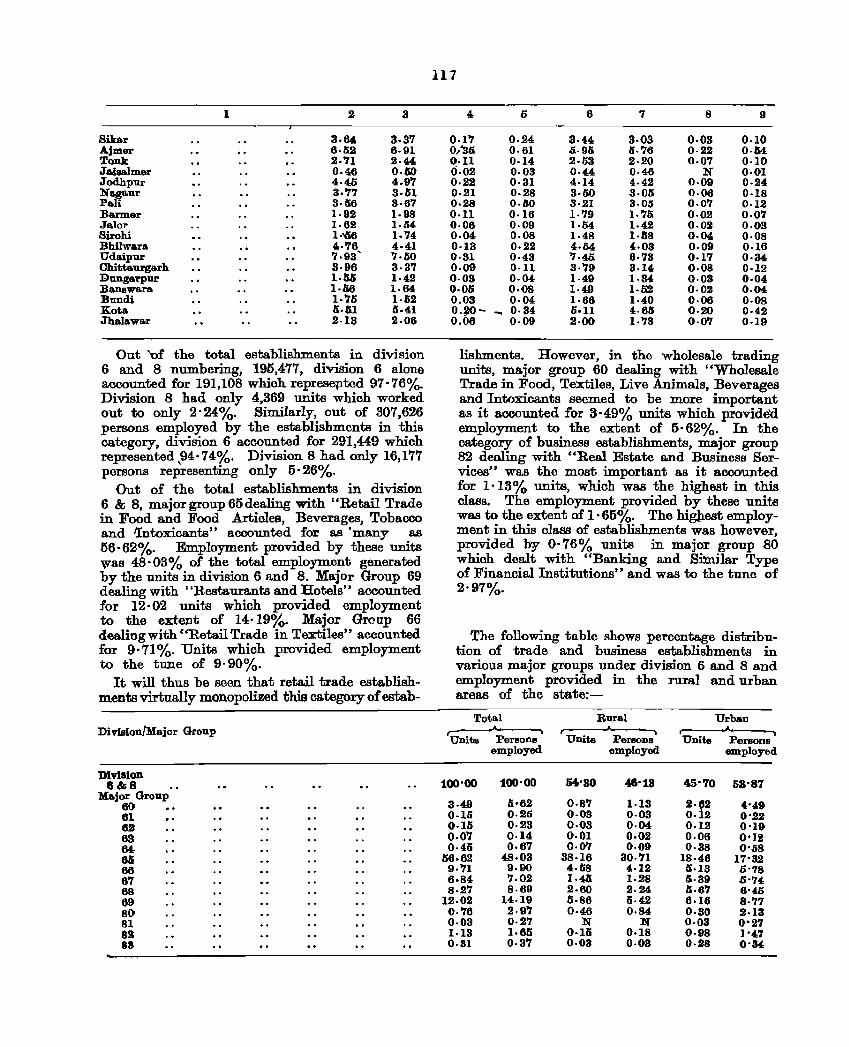
1 2 3
Sikar 3·84 3·3'1 Ajmer 6·52 6·91 Tonk 2.'11 2·44 Jaisalmer 0·46 0·00 Jodhpur 4·45 4.9'1 Nagaur 3·7'1 3·61 PaU 3·li6 3·67 Barmer 1·92 1.98 Jalor 1.62 I.M Birohi 1·"li6 1.'14 Bhilwara 4-'16 4·41 Udaipur 7.93' 7·60 Chittaurgarh S·96 3·3'1 :9ungarpur 1·55 1·42 Banswara I·M 1·64 Bundi 1.'76 1·62 Kota Ii. til 5.41 Jhalawar 2·13 2.06
Out 'of the total establishments in division 6 and 8 numbering, 195,477, division 6 alone accounted for 191,108 which repres6p.tcd 97· 76%. Division 8 had only 4,369 units which worked out to only 2'24%. Similarly, out of 307,626 persons employed by the establishments in this category, division 6 accounted for 291,449 which represented ,94,74%. Division 8 had only 16,177 persons representmg only 5· 26%.
Out of the total establishments in division 6 & 8, major group 65 dealing with "Retail Trade in Food and Food Articles, Beverages, Tobacco and 'lntoxicants" accounted for as 'many as 56·62%. Employment provided by these units was 48·03% of the total em.ployment generated by the units in division 6 and 8. Major Group 69 dealing with "Restaurants and Hotels" accounted for 12·02 units which provided employment to the extent of 14·19%. Major Group 66 dealing with t'Retail Trade in Textiles" accounted for 9'71%. Units which provided employment to the tune of 9'90%.
It will thus be seen that retail trade establishments virtually monopolized this category of estab-
DiviBion/Major Group
DIvision 8&8
Hajor Group 60 61 62 63 64 6li 66 6'1 68 69 80 81 811 88
117
4 6 6 7 8 9
0·1'1 0·24 3·44 3·03 0·03 0·10 0,'30 0·61 0·95 5.76 0·22 O·M o·n 0·14 2·53 2·20 0·07 0·10 0.02 0·03 {)·44 0.46 N 0·01 0.22 0·31 4·14 4.42 0·09 0·24 0.21 0·28 3·50 3·0li 0.06 0·18 0·28 0·60 8·21 3·05 0.07 0·12 o·n 0·16 1·'19 1.7li 0·{)2 0·07 0.06 0.09 1·54 1.42 0.02 0.03 0·04 0.08 1·48 1·1S8 0·04 0·08 0·13 0.22 4·64 4·03 0·09 0·16 0·31 0·43 '7·4li 6·73 0.17 0·34 0.09 o·n 3·'79 3·14 0·08 0·12 0·03 0·04 1·49 1-34 0·03 0·04 O·Oli 0·08 1·49 1·02 0·02 0·04 0.03 0·04 1·66 1·40 0·06 0·08 0.#0- 0·34 6.n 4·66 0·20 0.42 0.06 0·09 2·00 1·78 0·07 0·19
li.'!hments. However, in the wholesale trading units, major group 60 dealing with "Wholesale Trade in Food, Textiles, Live Animals, Beverages and Intoxicants seemed to be more important as it accounted for 3·49% units which provide'd employment to the extent of 5·62%. In the category of business establishments, major group 82 dealing with "Real Estate and Business Services" was the most important as it accounted for 1'13% units, which was the highest in this class. The employment provided by these units was to the extent of 1 ·65%. The higllest employment in this class of establishments was however, provided by O· 76% units in major group 80 which dealt with "Banking and Similar Type of Financial Institutions" and was to the tune of 2'97%.
The following table shows percentage distribu-tion of trade and business establishments in various major groups under division 6 and 8 and employment provided in the rural and urban areas of the state:-
Total Rural Urban A .. r- ~
'Units , ,
Persons Units Pel"BODB Units Persons employed employed employed
100'00 100-00 54'SO 48·18 45'70 58'87
3·49 5'62 0·8'1 1·13 2'r2 ,,'4,9 0·16 0·25 0·03 0·03 O· 2 0'.22 0·15 0·23 0·03 0·04 0·12 0'19 0.0'1 0·14 0·01 0.02 0·06 0'11 0·45 0·67 0·0'1 0·09 0·38 0'.08
06·62 48·03 38·16 30·'71 18·46 17'32 9·71 9·90 4·li8 4·12 5·13 6'78 6·84 7.02 1·40 1·28 5·89 6'74 8·27 8.69 2·60 2.24 Ii. 6'7 0·45
12.02 14.19 5·86 5·42 6·16 8·77 0·'76 2·9'7 0·46 0·84 O·SO 2·13 0·03 0·27 N N 0·03 0'27 1·13 1·65 0·15 0·18 0·98 )·47 0·31 0·3'7 0·03 0·08 0·S8 0'S4
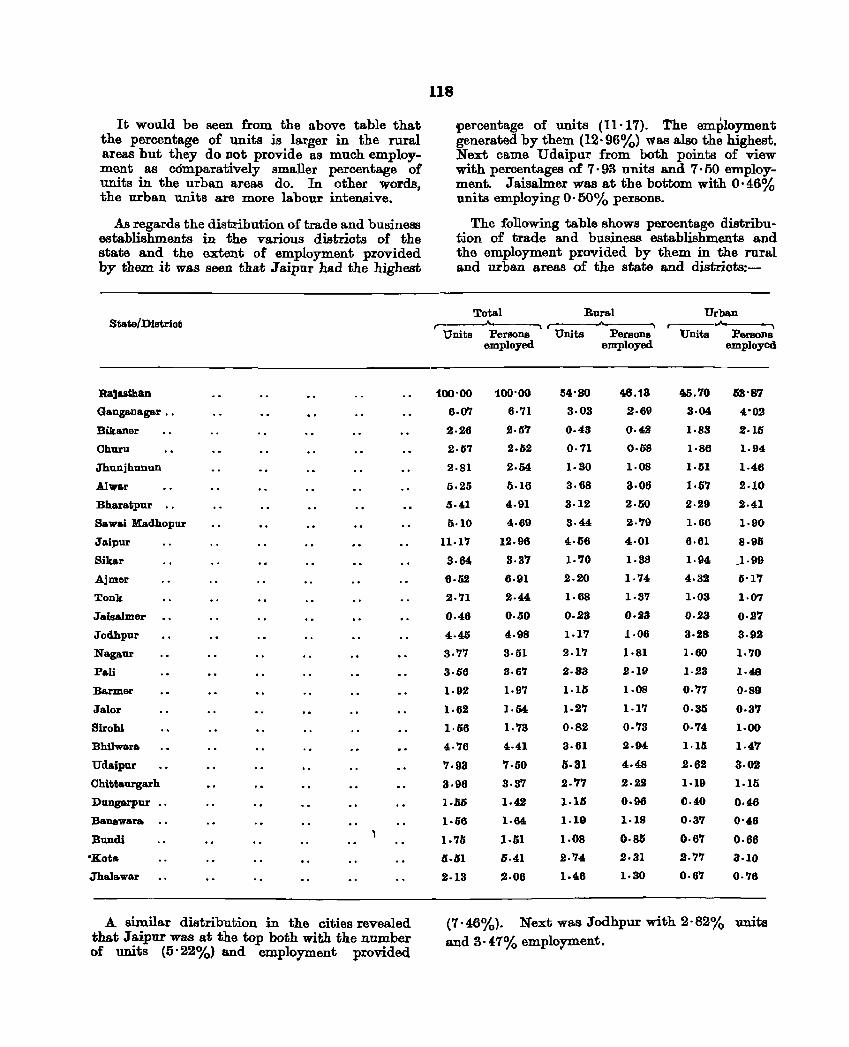
It would be seen from the above table that the percentage of units is larger in the rural areas but they do Dot provide as much employment as cdmparatively smaller percentage of units in the urban areas do. In other words, the urban units are more labour intensive.
As regards the distribution of trade and business establishments in the various distriots of the state and the extent of employment provided by them it was seen that .T aipur had the highest
State/District
RaJasthan
Ganganagar ..
Bikaner
Churn
JhunjhunllD
Alwar
Bharatpur "
Bawai Madhopur
Jaipur
Sikar
Ajmer
Tonk
Jaisalmer
Jodhpur
Nagaur
Pa.ri
Barmer
Jalor
Birohi
Bhilwara
Udaipur
Chittallrgarh
Dungarpur
BanBwara
Bundi
"Kot ...
Jhaillowar
A similar distribution in the cities revealed that J aipur was at the top both with the number of units (5' 22%) and employment provided
118
percentage of units (11'17). The employment generated by them (12·96%) \Vas also the highest. Next came Udaipur from both points of view with percentages of 7· 93 units and 7·50 employment. J aisalmer was at the bottom with O· 46% units employing O· 50% persons.
The following table shows percentage distribution of trade and business establishments and the employment provided by them in the rural and urban areas of the state and districts:-
Total Rural Urban r----A.-----.. r-'--_ .... --.........
Units Persons Units Persons r----,..... .
Units Pel'llOns employed employed employed
100'00 100'00 54'30 46.13 45.70 03'87
6·07 6·71 3·03 2·69 3·04 4'02
2·26 2·57 0·43 0·4,2 1·83 2·16
2·67 2.62 0·71 0'08 1·86 1.94
2·81 2·04 1·30 1·08 1·61 1·46
5·25 5.16 3·68 3·06 1·67 2·10
5.41 4·91 3·12 2·50 2·29 2·41
5·10 4·69 3·44 2·79 1.66 1·90
11·17 12·96 4·66 4·01 6·61 8·95
3·64 3·37 1.70 1·38 1·94 .1·99
6·52 6·91 2.20 1·74 4·32 5'1'1
2·71 2·44 1·68 1·3'7 1·03 1·07
0·46 0.50 0·23 0·23 0·23 0·27
4·45 4.98 1.17 1·06 3·28 3·92
3·77 3·51 2.1'1 1·81 1·60 1.'70
3·G6 3·6'1 2.83 2·19 1·.23 1·48
1·92 1.97 I.U; 1.08 0·77 0·89
1·62 ].04 1.27 1·17 0·35 0·37
1·56 1·73 0·82 0·73 0·74 1·00
4·76 4.41 3·61 2·94 1·15 1.4'1
'1·93 '7·50 6·31 4·48 2·62 3·02
3·96 3·3'1 2." 2.22 1·19 1·11i
] • iii) 1.4,2 1·11; 0·96 0·40 0·46
1·G6 1.64, 1·19 1·18 0·37 0'46
1.'75 1·61 1.08 0·85 0.6'7 0.66
5·61 6·41 2.74 2·31 2. '1'1 3·10
2·13 2.06 1.46 1·30 0·67 0·'16
(7·46%). Next wa.s Jodhpur with 2·82% units and S· 47% employment.
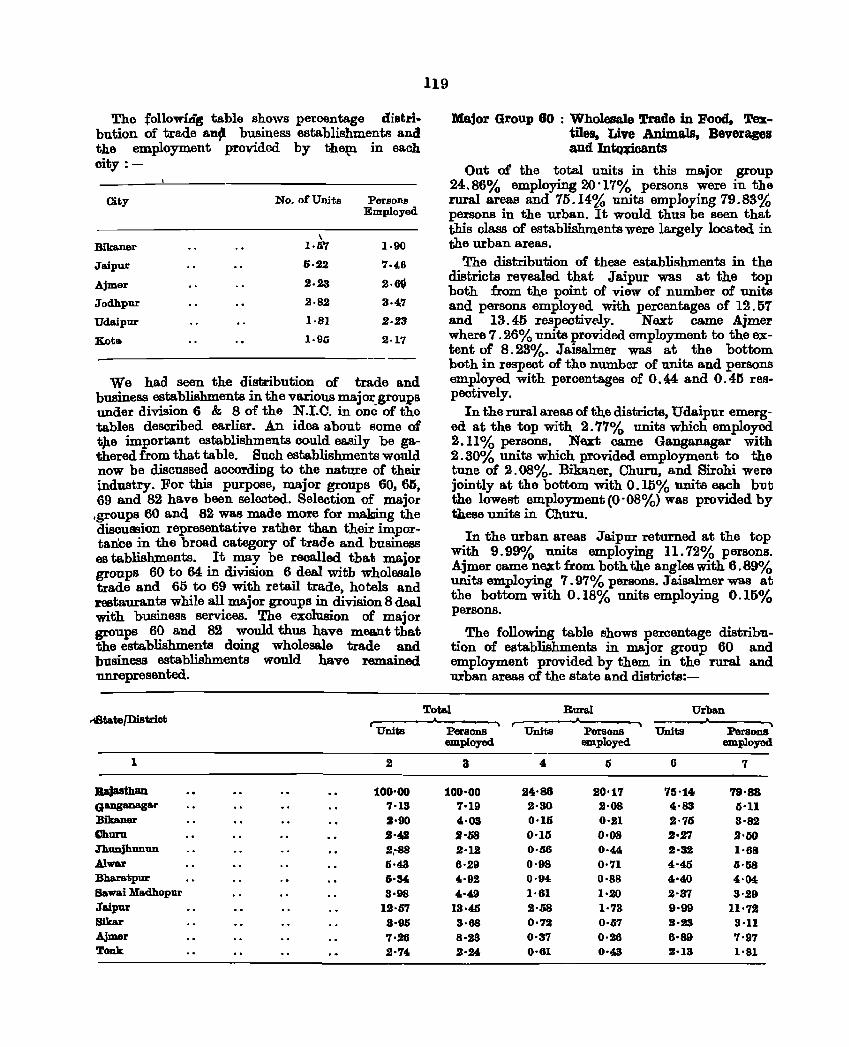
The followiti'g table shoW's percentage distri. bution of trade ansi business establishments and the employment provided by the:tn in each oity :-
City No.olUnits Persons Employed
, Bikaner 1·li'7 1·90
Jaipur 6·22 '-46
Ajmer 2.23 2.6~
Jodhpur 2·82 3·47
Udaipur 1·81 2·23
Kat .. 1·95 2·17
We had seen the distribution of trade and business establishments in the various major_groups under division 6 & 8 of the N.I.C. in one of the tables described earlier_ An idea about some of t)1e important establishments could easily be gathered from that table. Such establishments would now be discussed according to the nature of their industry. For this purpose, major groups 60,65, 69 and 82 have been selected. Selection of major
.groups 60 and 82 was made more for making the discussion representative rather than their importance in the broad category of trade and business es tablishments. It may be recalled tbat major groups 60 to 64: in division 6 deal with wholesale trade and 65 to 69 with retail trade, hotels and restaurants while all major groups in division 8 deal with business services. The exclusion of major groups 60 and 82 would thus have meant that the establishments doing wholesale trade and business establishments would have remained unrepresented.
rJ8tate/Distriot Units
1 2
Rajasthan 100'00 Ganganagar 7·13 Bika.ner 2·90 O1uru 2·4,2 Jhunjhunun 2,~88
.Alwar 6·43 Bharatpur IHK Bawai Madhopur S·08 Jaipur 12·57 Sikar S-95 Ajmer 7·,26 Tonk 2'74
119
Major Group 60 : Wholesale Trade in Food, Textiles. Live Animals, Beverages and IntQ¥icants
Ont of the total units in this major group 24:.86% employing 20·17% persons were in the rural areas and 75.14% units employing 79.83% persons in the urban. It would thus be soon that this class of establishments were largely located in the urban areas.
The distribution of these establishments in the districts revealed that Jaipur was at the top both from the point of view of number of units and persons employed with percentages of 12.57 and 13.45 respectively. Next came Ajmer where 7 . 26% units provided employment to the extent of 8.23%_ J aisalmer was at the bottom both in rospeot of tho number of units and persons employed with percentages of 0.4:4 and O. 4rs respectively.
In the rural areas of the districts, Udaipur emerged at the top with 2.77% units which employed 2.11% persons. Next came Ganganagar with 2.30% units which provided employment to the tune of 2.08%. Bikaner, Churn, and Birohi were jointly at the bottom with O. US% units each but the lowest employment (0'08%) was provided by these units in Chum.
In the urban areas Jaipur returned at the top with 9.99% units employing 11.72% persons. Ajmer came n~t from both the angles with 6.89% units employing 7.97% persons . .Jaisalmer was at the bottom with 0.18% units employing 0.15% persons.
The following table shows percentage distribution of establishments in major group 60 and employment provided by them in the rural and urban areas of the state and districts:-
Total Rural Urban
Persons Units Persons Units Persons employed employed employed
3 4 5 6 7
100-00 24·86 20·17 75·14 79·88 7-19 2·30 2·08 4·83 5·n 4·03 0·15 0·21 2·75 3·82 2-1)8 0·10 O·OS 2·27 2·00 2-12 0·56 0'44 2·32 1·68 6·29 0·98 0·71 4-45 5·58 4·92 0·94 0·88 4'40 4·04: 4-49 1·61 1·20 2·37 3·29
13·45 2·58 1·73 9·99 11·72 3·68 0·72 0·57 3·23 s·u 8-23 0·37 0·26 6-89 7·97 2-24 0·61 0·43 2·13 1·81
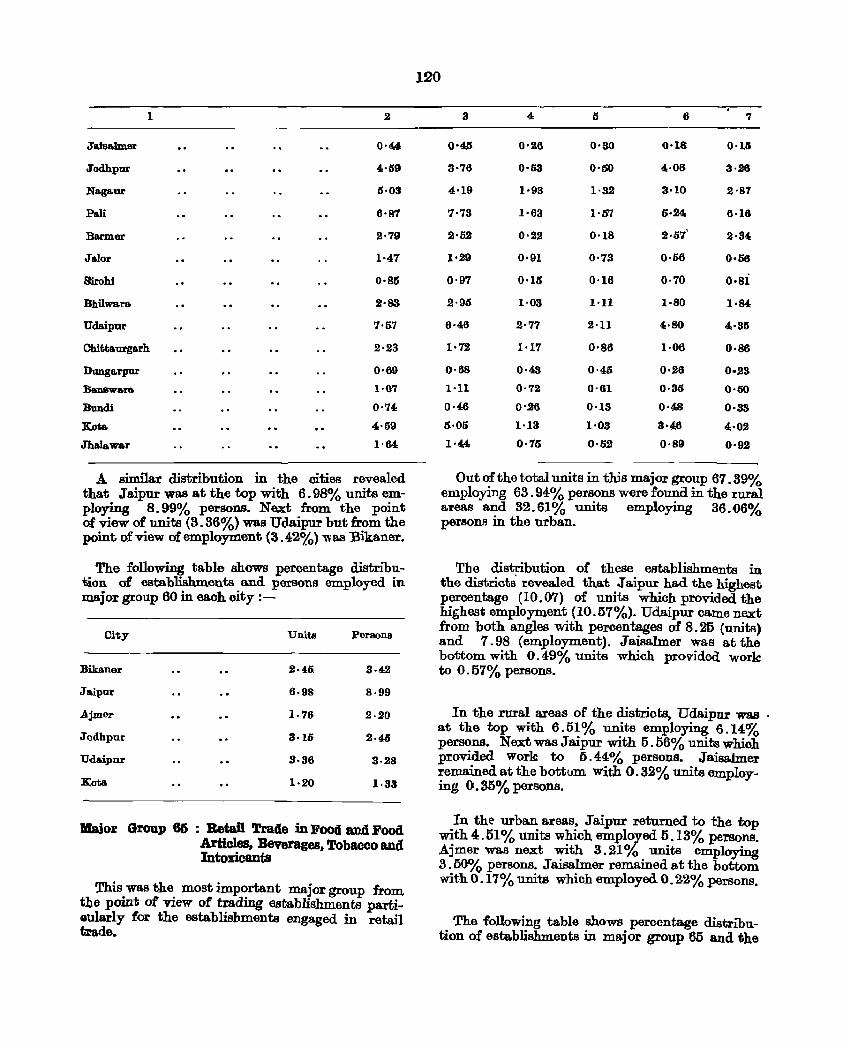
1 2
JaislIolmer 0·(4
Jodhpur 4·59
Nagaur 5·03
Pali 6'87
Barmer 2·79
Jalor 1·47
Sirohi 0·85
Bhilwara 2·83
Udaipur 7·57
Ohittaurgarh 2·23
Dungarpur 0·69
BlIonswlIora 1·07
Bundi 0·74
Kota. 4·59
Jhala.war 1'64,
A similar distribution in the cities revealed that Jaipur was at the top with 6.98% units employing 8.99% persons. Ne.xt from the point of view of units (3.86%) was UeJa.ipur but from the point of view of employment (3.42%) was 'Bikaner.
The following table shows percentage distribution of establishments and persons employed in major group 60 in each city :-
City UnitB Persons
Bikaner 2·45 3·4,2
Jaipur 6·98 8·99
Ajmor 1.76 2·20
Jodhpur 3·15 2·46
Udaipur 3·36 3·28
Kota. 1·20 1·33
Major Group 65 : Retail Trade in Food and Food Articles, Beverages. Tobacco and Intoxicants
This was the most important major group from the point of view of trading establishments partiGularly for the establishments engaged in retail trade.
120
3 4 5 6 7
0'45 0'26 0'30 0·18 O·US
3·76 0·53 0'50 4,·06 3·26
4·19 1·93 1·32 3·10 2·87
7'73 1'63 1'57 5·24 6·16
2'52 0'22 0'18 2·57' 2·34
1'29 0·91 0'73 0·56 0·56
0·97 0·15 0'16 0·70 o·si .2·95 1'03 1·11 1·80 1'84
6'46 2'77 2·11 4·80 4·35
1·72 1'17 0'86 1·06 0·86
0·68 0'43 0'45 0·26 0·23
1·11 0·72 0'61 0·35 0·50
0·46 0'26 0'13 0·48 0·33
0·05 1·13 1'03 3·46 4·02
1'44 0·75 0·52 0·89 0·92
Out of the total units in this major group 67.39% employing 63.94% persons were found in the rural areas and 32.61% units employing 86.06% persoDB in the urban.
The distribution of these establishments in the distriots reveaJed that J aipur ha.d the highest percentage (10.07) of units which provided the highest employment (10.57%). Udaipur camene;x:t from both angles with percentages of 8.26 (units) and 7.98 (employment). Jaisalmer was at the bottom with 0.49% units which provided work to 0.57% persons.
In the rural areas of the districi;s. Udaipur was . at the top with 6.51% units employing 6.14:% persons. Next was Jaipur with 5.56% units which provided work to 5.44% persons. Jaisalmer remained at the bottum with 0.82% units employing 0.35% persons.
In the urban areas, Jaipur returned to the top with 4.51 % units which employed 6.18% persons. Ajmer was next with 3.21 % units employing 3.50% persons. J aisalmer remained a.t the bottom with 0.17% units which employed 0.2-2% persons.
The following table shows percentage distribution of establishments in major group 65 and the
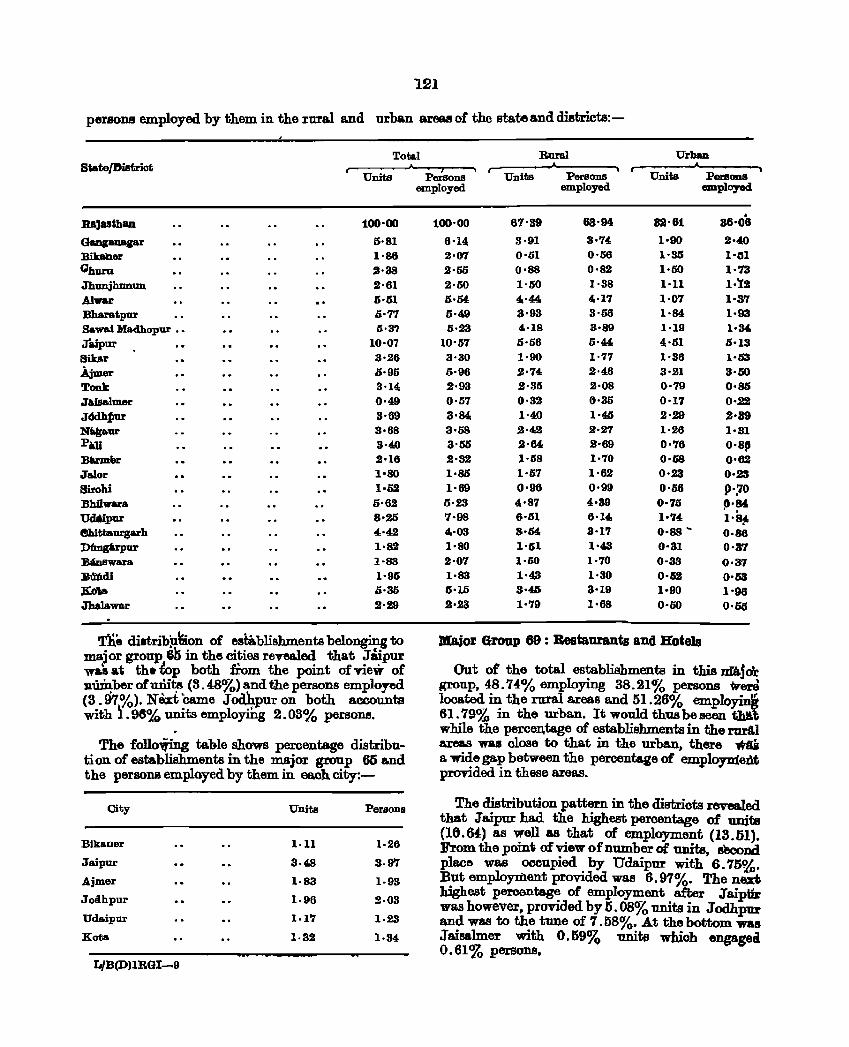
121
persons employed by them in the rural and urban areas of the stateanddistricts:-
Total Rural Urban State/Distriot
Units PersoDB Units PersoDB Units PersOJla employed mnployed employed
RaJasthan
GauglUlAlar BikaIler Qhuru JhunjhlDlun .Alwar :Bharatpur Sawai Madhopar •• J'aipur Sikar A.jmer Tonk JMs&lmer J6dh:(lur Nft.~aur Pm :BImner Jalor Birohi Bhilwara Udaipur ehittaurgarh Dtmprpur BlIoBwara Btidi KcYI;a Jhalawar
100'00
5·81 1'86 2·38 2·61 6·61 0·77 5·3?
10·07 3·26 6·95 3·14 0·49 3·69 3·68 3'40 2·16 1·80 1·52 5·62 8·25 4·4:2 1·82 1·8S 1·95 0·35 2·29
T1:i.e di.tribp.50n of establishments be1ong~ to major group G5 in the cities revealed that .r aipur wail at the top both flom the point of new of JI.~ber of~~ (3.48%) and the persons employed (3.97%). Nut 'came JOdhpur on both accounts with ~. 98% units employing 2.03% persoD.l!l.
The folloiing table shows percentage distributi on of establishments in the major group 65 and the persons employed by them in each city:-
City Units Persons
Bikaner 1·11 1·26
Jaipur 3·48 3·97 Ajmer 1·83 1·93
JoElhpur 1·96 2·0S
Uda.ipur 1.1'7 1·23
Kota 1·32 1·34
LJB(D)lRGI-9
• 100'00 67'S9 68·94 82·61 86'06
6·14; S·91 3·74. 1·90 2·<&0 2'07 0'01 0'06 1·30 1·01 2'00 0'88 0·82 1·50 1·73 2·60 1'50 l'S8 l·ll 1·'12 5·04 4;·44 4·17 1·07 1·37 5·49 3·93 3'66 1·84: 1·93 0·23 £·18 3·89 1·19 1·34
10'57 5·56 0'44 4;·61 5·13 3'SO 1·90 1·77 1·S6 1·53 5·96 2·74 2·46 3·21 3·50 2·93 2·35 2·08 0·79 O'SO 0·57 0'32 «t·S5 0'17 0·22 3'84 1'40 1'45 2'29 2'89 3·58 2·4,2 2·27 1·26 1·31 3'00 2'64, 2·69 0·76 O·S!' 2·82 1·58 1·70 O'OS 0'62 1·86 1·67 1·62 0'23 0·23 1·69 0'96 0'99 0'56 p·,O 5·23 4·87 4·39 0·75 ~·84 '1·98 6'01 6'14 1'74- 1'8~ 4'03 3'54, 3·17 0·88 - 0·S6 1·80 1'51 1'43 O·Sl 0·37 2·07 1·50 1·'70 O·SS 0·37 1·83 1·4;3 1·30 0·52 0'63 6'15 3·40 3'19 1·90 1'96 2'23 1''79 1·68 0·50 0'65
Major Group 69 : Restaurants and Hotels
Out of the total establishments in thls n:r.ajor group, 48. U% employing 38.21% persons ~ere located in the rural areas and 51.26% employini! 61.79% in tho urban. It would thus be seen thiLt while the percen,tage of establishments in the rurAl areas wall close to that in the urban, there 1WiiI a wide gap between the percentage of employment proTided in these areas.
The distribution pattern in the districts revea.1.ed that J aipur had the highest percentage of unj:ts (16.64:) as well as that of employment (13.61). From the point of view of number of units second place was oocupied by Udaipur with' 6.75%. But employment provided was 6.97%. The nen highest percentage of employment after Jaipu was however, provided by o. 08% units in Jodhpur and was to the tune of 7.58%. At the bottom was J aisalmer with 0.69% unittl whioh engages 0.61% persons.
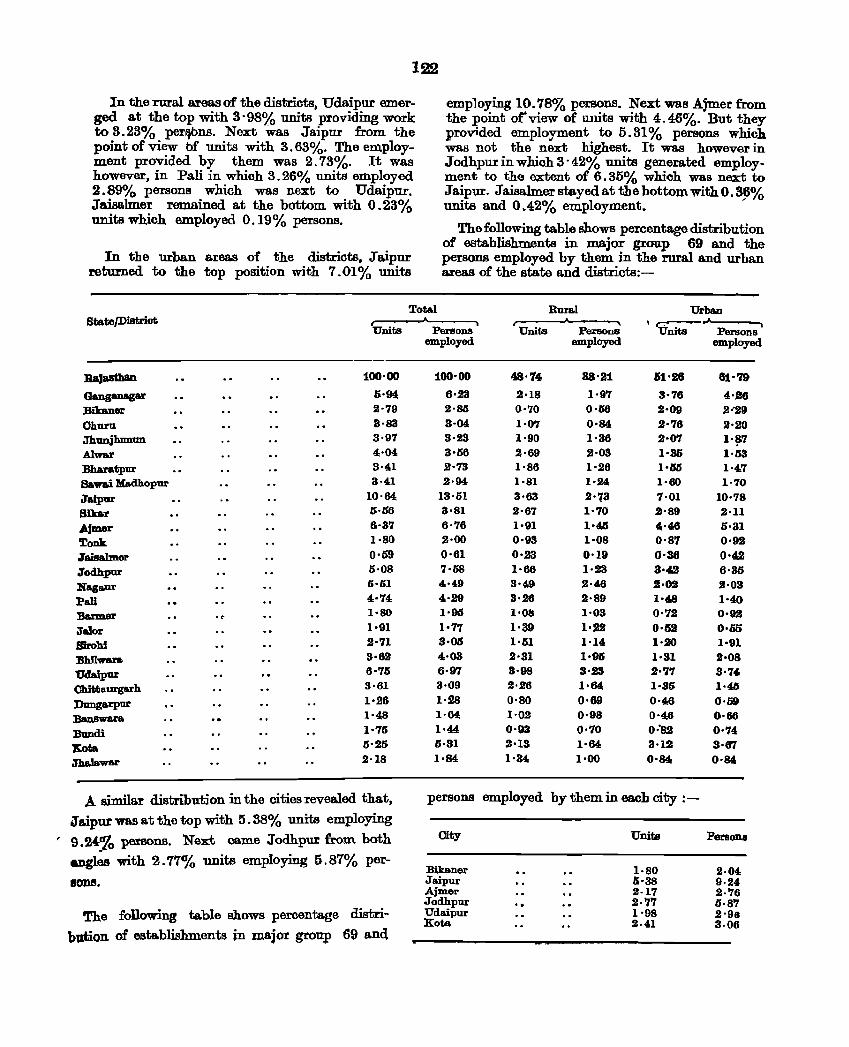
,
122
In the rural areas of the distriots, Udaipur emerged at the top with 3·98% units providing work to 3. 23% per~ns. Next was J aipur from the point of view hf units with 3.63%. The employment provided by them was 2.73%. It was however, in Pali in whioh 3.26% units employed 2.89% persons which was next to Udaipur. Jaisa.lmer remained. at the bottom with 0.23% units whioh employed 0.19% persons.
In the urban areas of the districts, Jaipur retmned to the top position with 7.01% units
employing 10.78% persons. Next was Ajmer from the point orview of wlits with 4.46%. But they provided employment to 5.31% persons whioh was not the next highest. It was however in Jodhpur in which 3·42% units generated employment to the extent of 6.35% which was next to Jaipur. Jaisalmerstayedatthe bottom withO.36% units and 0.42% employment_ '
The follol\ing table shows percentage distribution of establishments in major group 69 and the persons employed by them in the rural and urban areas of the state and districts:-
Total Rural Urban BtateJDistriot . , (""';! - ,
Units Persons Units Persons Units PersonS employed employed employed
BaJasthan 100'00 100'00 48·74 38·21 &1·26 81'79
G&nganagar 5·94 6·.23 2·18 1·97 3·76 4'B6 Bikaner 2·79 2·85 0.'70 0·66 2-69 2"29 Ohura. 3·83 3·04 1·67 6·84 2·76 2·20 Jhunjhunun 3'97 3·23 1·90 1·36 2·0.7 1'~7 Alwar 4'04 3·56 2·69 2·63 1·35 1·53 Bharatpur 3·41 2·73 1'86 1'26 1·05 1·4.7 &wa.i Madhopur 3·41 2·94, 1·81 1·24 1·60 1·70 Jaiplll' 10·64 13·51 3'63 2·73 7·01 10'78 Sikar 0·56 3·81 2·67 1'70 S·89 2·U
Ajmer 6·37 6·76 1'91 1·46 4,·46 5·31 Tonk 1·80. 2·00 0'93 1·0.8 0.·87 0.·92 .J&is&lm.er 0·69 0·61 0·.23 0'19 0'36 0'42 .Jodhpur 5·08 7·58 1'66 1·23 3·4.2 6·35 Nagaur 5·51 4·49 3'49 2·46 ,2·62 2·03
PalJ 4·74 4·29 3·26 2·89 1·48 1'40 Banner 1·80 1·00 1·0& 1·03 0'72 0·92
Ja.1or 1·91 1·77 1·39 1·22 6·52 O·l)5
SIrohi 2·71 3·05 1·1S1 1·14: 1·20 1'91
:Bhflwara. 3'6.2 4·03 2·31 1·95 1'31 2·08
'Udaipur 6·75 6·97 3·98 S·23 2·77 3·74-Chittaurgarh 3·61 3·09 2·26 1'64 1·35 1·40
Dungarpur 1·26 1·28 0·80 0·69 0'46 0·58 Ban,swa.ra 1·48 1·64 1·02 0·98 0'46 6·00
Bundi 1·75 1·4.4 0'93 0·70 0:82 0·74
ltof;a 5'25 5·31 2'13 1'64 3·12 3·67
:rhal&war 2·18 1·84 1'34 1·00 0·84, 0·84
A simi.la.r distribution in the cities revealed that, persons employed by them in each city ;-
Jaipur was at the top with 5.38% units employing
9.24.10 persons. Next came Jodhpm from both City Unite Persona
angles with 2.77% units employing 5.87% per-Bikaner 1·80 2·04
II~. Jaipur 0·38 9·24 .Ajmer 2·17 2·76 Jodhpur 2.'77 6·87
The following table shows percentage distri- Udaipur 1·98 2·90 Kota. 2·41 3·06
blltiQn of establishments in major group 69 and
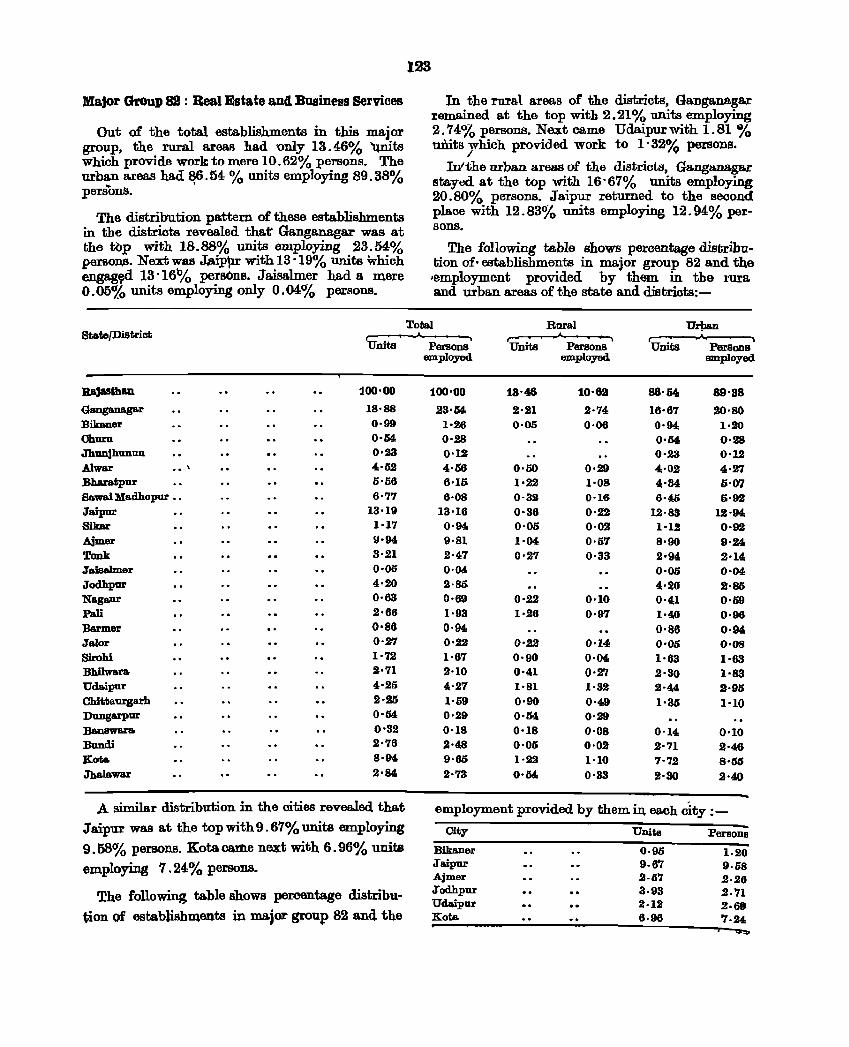
Major Group 82 : Real Estate and Business Services
Out of the total establishments in this major group, the rural areas had 'Only 13.46% 'qnits which provide work to mere 10.62% persons. The urban areas had 86.54 % units employing 89.38% persons. '
The distribution pattern of these establishments in the districts revealed that' Ganganagar was at fihe top with 18.88% units employing 23.54% persons. Nextw8s J.aip~ with 13·19% units which engag~d 13'16% perSOns. Jaisalmer had a mere 0.05% units employing only 0.04% persons.
State/District
Ralasthan Ganganagar Bikaner Chum JhUDjhunun Alwar _. \ Bharatpnr 8a.wa.i Madhopur __
Jaipur Sikar Ajmer Tonk JaieaJmer Jodhpur Nagaur Pall Barmer Jalor Sirohi Bhilwara Udaipur Chittanrgarh DaDgarpur Ba.nSwara Bundi Jtota. Jhalawar
r-Units
:100·00
18·88 0-99 0-04 0·23 4·52 5·56 6·77
13·19 1·17 Y·94 3-21 0-05 4·20 0·68 2·66 0·S6 0-27 1·72 2·71 4·25 2-Jlj 0·04 0-32 2·76 8-94 2·84
A similar distribution in the oities revealed that
Jaipur was at the top with 9.67% units employing
9.58% persons. Kota came ne.xt with 6.96% units employing 7 _ 24% persons.
The following table shows percentage distribu
tion of establishments in major group 82 and the
123
In the rural areas of the districts, Ganganagar remained at the top with 2.21% units employing 2.74% persons. Next came Udaipurwith 1.81 % uirits which provided work to 1'32% persons.
/
Jnlthe urban areas of the districts, Ganganagw: stayed at the top with 16-67% units employing 20.80% persoDS_ Jaipur returned to the seco.nd place with 12_83% units employing 12.94% perSODS.
The following table shows percentage distribuliion of· establishments in major group 82 and the .employment provided. by them in the rura and urban areas of the state and districts:-
Total Rural UrPa,n . - \
Persons Units Persons Units Persons employed employed employed
100·00 18·46 10·Sa 86·54 89·88 23·04 2·21 2-74 16·67 2O.8()
1·.26 0·05 0-06 0·94 1·20 0·28 0·04 0·28 0'12 0·23 0-12 4·06 0·50 0·29 4·02 4-27 6·10 1·22 1·08 4·34 0-07 6·08 0-32 0·16 6-45 6·92
13'16 0·36 0-22 12-83 12-94 0'94 0-05 0·02 1·12 0-92 9·81 1-04 0·57 8·90 9·24 2'47 0·27 0·33 2·94 2·14 0·04 0·00 0·04 2·85 4·20 2·85 0'69 0·22 0·10 0·4,1 0·59 1·93 1·26 0·97 1·4,0 0·96 0·94 0·S6 0·94 0·22 0·22 0·14 0'06 0·08 1·67 0-90 0·04 1·63 1·68 2'10 0-41 0·27 2·aO 1·83 4'27 1·81 1·32 2-« 2-96 1·59 0·90 0-49 1·35 1·10 0·29 0·64 0·29 0'18 0·18 0·08 0-14 0-10 2'48 0'05 0·02 2-71 2·46 9'65 1·22 1·10 7-72 8·05 2·73 0·54 0·33 2·30 2'40
employment provided by them in. each city :-
City Units PersoDS
Bikaner 0-95 1·20 Jaipur 9-6'7 9·68 Ajmer 2·6'7 2·26 .Todhpur 3·93 2-71 Uda.ipur 2-12 2·69 Kot& 6·96 7-24
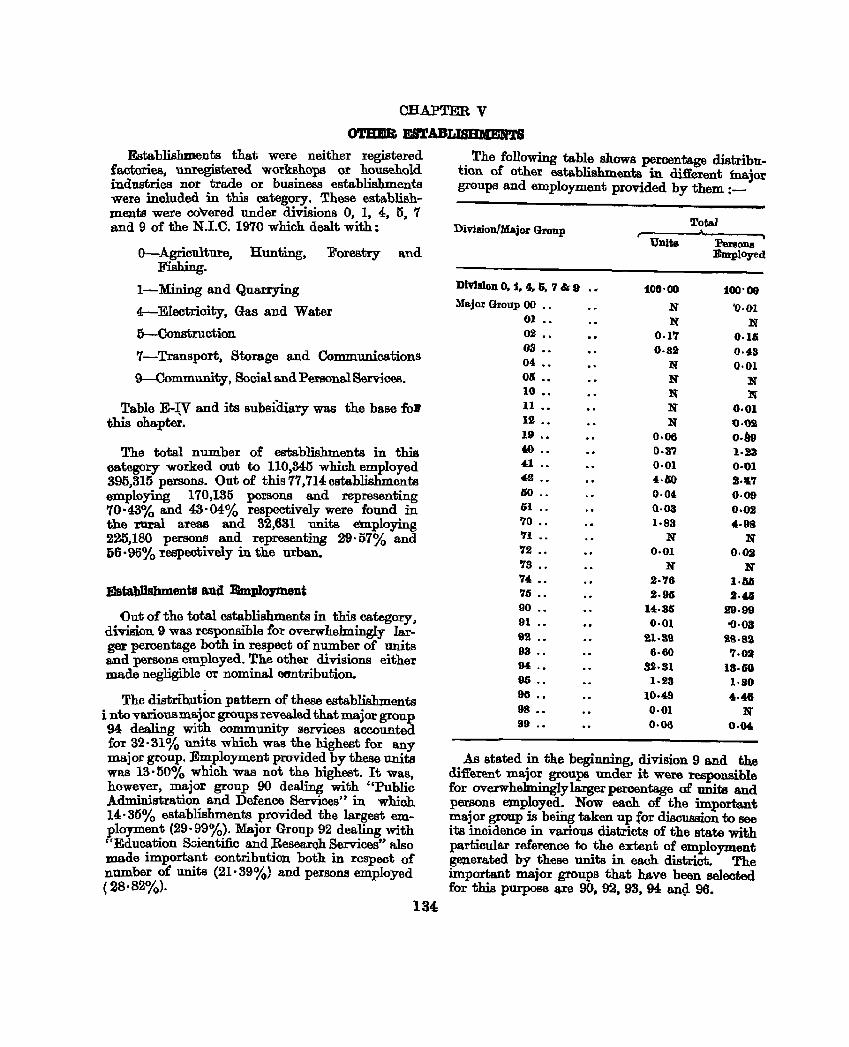
CHAPTER V
OTBEB ESTABLISIDIBlft'S
Establishments that were neither registered factories, umegistered worksh.ops or h.ouseh.old industries nor trade or business establishments were inoluded in this category. These establishments were co\Y-ered under divisions 0, 1, 4, 5, 7 and 9 of the N.I.C. 1970 which dealt with:
O-Agriculture, Hunting, Forestry and Fishing.
I-Mining and Quarrying
4-Electricity, Gas and Water
5-Construction
7-Transport, Storage and Communications
9-Community, Social and Persona.l Services.
Table E-:J;V and its subsidiary was the base folP this ohapter.
The total number of establishments in this oategory worked out to 110,345 which employed 395,315 persons. Out of this 77,714 establishments em.ploying 170,135 persons and representing 70·43% and 43·04% respectively were found in the rural areas and 32,631 units em.ploying 225,180 persons and representing 29·57% and 56·96% :respectively in the urba.n.
Establishments and EmploJ1l18D.t
Out of the total establishments in this category. division 9 was responsible for overwhelmingly larger percentage both in respect of number of units and persons employed. The other divisions either made negligible or nominal «l8ntribution.
The distribution pattern of these establishments i nto various ma.jor groups revealed that major group 94 dealing with community services accounted for 32·31% units whieh was the highest for any :major group. Employment provided by these units was 13·50% which was not the highest. It was, however, major group 90 dealing with "Publio Administration and Defence Services" in which 14·35% establishments pronded the largest employment (29·99%). Major Group 92 dealing with "Education S~ienti:fic and ResearQh Services" also made important contribution both in respect of number of units (21· 39%) and persoM employed (28·82%).
134
. The following table shows percentage distribution or other esta.blishments in di.:lIerent major groups and employment provided by them :_
Division!Major Group
DIvision O. 1, 4, S. 7 & 9
M&jo:r Group 00 •. 01 •• 02 •• 03 •• 04 •• 05 •• 10 •• 11 •• 12 •• 19 •• to .. 4,1 •• 42 ••
00 •• 61 •• '10 •• '11 ••
'12 •• 'IS •• '14 •• '115 •• 90 •• 91 •• 92 .• 93 •• 94 .• 96 .• 96 •• 98 •• 99 .•
r-Unit.
too· 00
N N
0·1'1 0·82
N N N N N
0·06 ().3'1
0·01 4·liO 0·0' Q·oa 1·83
N 0·01
N 2·'16 2·96
14·S1 0·01
21·39 6·60
3.2·31 1·23
10·49 0·01 0·06
Tota)
Persona Employed
100'08
'0·01 N
O·Ui 0·43 0·01
:N :N
0·01 Q·OO 0.&9 1·23 0·01 2·117 0·09 O·O! 4,.98
N 0·02
N I·M 2·41
29·99 -0·03
28.82 '1. OS
IS· GO 1·80
4·48 N
0·04
As stated in the beginning, division 9 and the different major groups under it were responsible for overwhelmingly larger percentage of units and persons employed. Now each of the impo:rte.nt major group is beiilg taken up for discussion to see its incidence in various districts of the state with particular reference to the extent of employment generated by these units in each district. The important major groups that have been selected for this purpose are 90, 92, 93, 94 anp. 96.
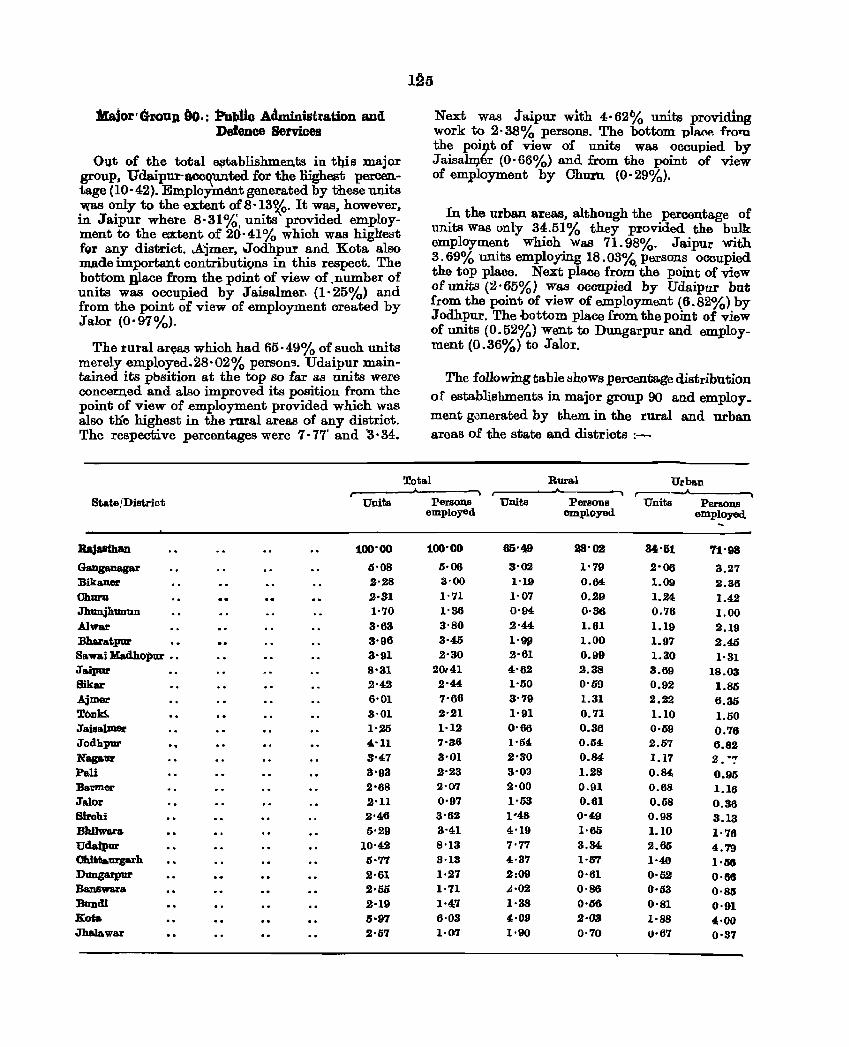
Major' GroUIl AG.: Publio Administration and Defence Services
OQ.t of the total e~tablishm.en,ts in t4is major group, Udaipur-ace~unted for the liighest percentage (10· 42). Em.ployment generated by these units was only to the extent of 8·I3~. It was, however, in Jaipur where 8·31%, units provided employment to the eoctent of 20·41% which was higlrest fqr any district . ..Ajmer, Jodhpur and Kota also made important contributiQns in this respect. The bottom dace from the pdint of view of ,number of units was occupied by J a.isalmer. (I'25%) and from the point of view of employment created by Jalor (0,97%).
The rura.l ar~as which had 65'49% of such units merely employed.28·02% persons. Udaipur maintained its pbsition at the top so far as units were concerned and also improved its position from the point of view of employment provided which was also tlie highest in the rural areas of any district. The respective percentages were 7·77' and '3'34.
Next was Jaipur with 4'62% units providlng work to 2· 38% persons. The bottom pl.A.t'.A "'1'0ra. the poi9-t of view of units was occupied by JaisalD}.~r (0·66%) and from the point of view of employment by Churu (0·29%).
In the urban areas, although the percentage of units Was only 34.51% they provided the bulk employment whioh Was 71.98%. Jaipur with 3. 69% units employing 18.03%. persons occupied the top place. Next plaoe from the point of view of units (2'65%) was occupied by Udaipur but from the point of view of employment (6.82%) by Jodhpur. The bottom place from the point of view of units (0.52%) went to Dungarpur and employment (0.36%) to Jalor.
The following table I:lhows percentage distribution of establishments in major group 90 and employ_ ment g.3nerated by them in the rural and urban. areas of the sta.te and districts :-
Total Rural Urban ---10-___ --. r---,_,J< State !District Units Persons Units Persons Units Persons
employed employed employed -RaJasthan 100'00 100'00 65'49 28'02 84'51 71'98
Ganganagar o·os 0·06 3'02 1'79 2'06 3.27 Bika.ne.r 2'28 3-00 1'19 0.64 1.09 2.36 Churu 2·31 1'71 1'07 0.29 1..24 1.42 Jhunjhunun 1'70 1'36 0'94 0·36 0.76 1.00 A.lwar 3'63 3'80 2'44 1.61 1.19 2.19 Bharatpur 3'96 3'45 1'99 1.00 1.97 2.40 Sawai Kadhopur •• 3'91 2'30 2'61 0.99 1.30 1'81 Jaipur 8'81 20r41 4'62 2.38 8.69 18.08 Sikar 2'42 2'44 1'50 0'69 0.92 1.80 Ajmer 6'01 7'66 3'79 1.31 2.22 6.30 T()D~ 3'01 2'21 1'91 0.71 1.10 1.50 JaiaaJ.mer 1'20 1·12 0'66 0.36 0'69 0.76 Jodhpur ., 4'11 7'36 1'54 0.54 2.67 6.82 Naga.1I1' 3'47 3'01 2'80 0.84 1.17 2 • ..,
Pali 3'93 2'23 3'0:.1 1.28 0.84 0.95 Ba.1:mer 2'68 2'07 2'00 0.91 0.68 1.16 Jalor 2'11 0'97 1'53 0.61 0.58 0.36 Birohi 2'46 3'62 1'48 0'49 0.98 3.13 :Bhilwa.ra 0'29 3'41 4'19 1'65 1.10 1'76 Ud&1'pur 10'42 8'13 7'77 8.34 2.66 4.79 Ohi1lfla.urgarh 5'77 3·13 4·37 1·157 1'40 I'M Dungarpur 2'61 1·27 2:09 0·61 0·5,2 0'88 Banswara 2·56 1·71 .<!·02 0·86 0'53 0·8lJ Buudl 2'19 h\7 1·38 0'06 0'81 0'91 Kola iNn 6·03 4·09 2·03 1·88 4;'00 Jha1awar 2'57 1·07 1'90 0'70 0'67 0·37
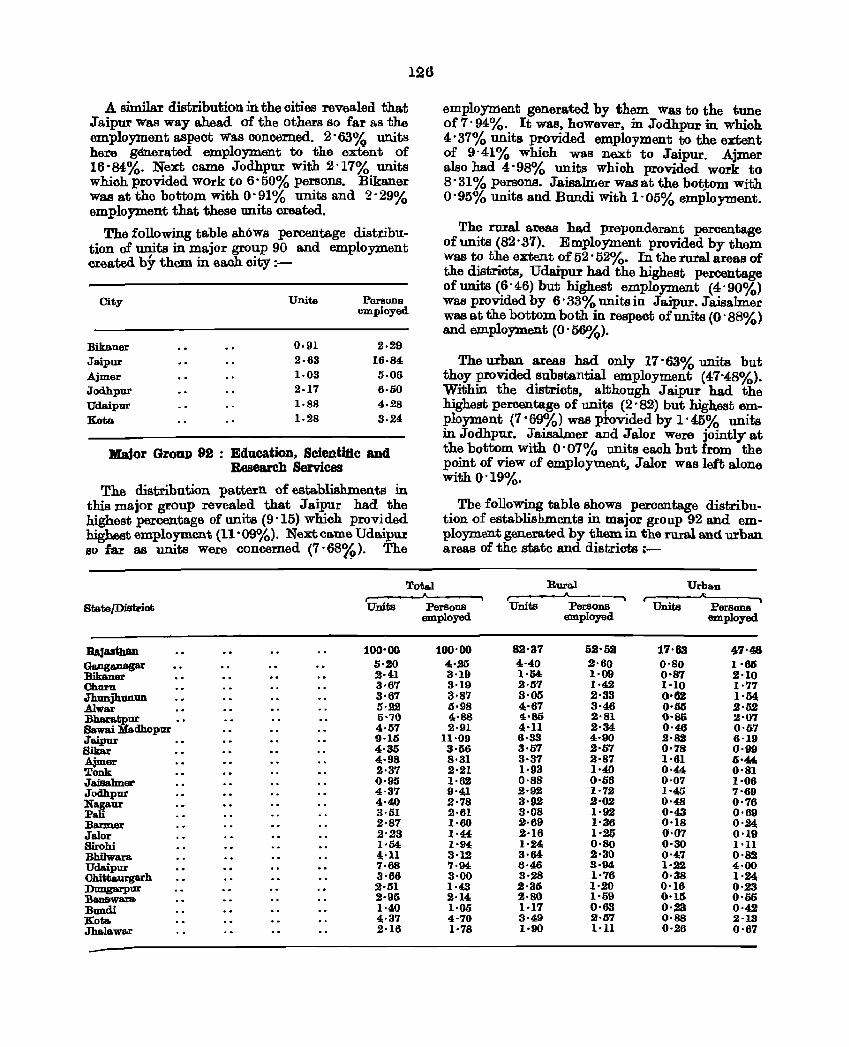
126
A similar distribution in the cities revealed that J aipur was way ahead of the others so far as the employment aspect was ooncerned. 2' 63% units here g®.erated employment to the extent of 16'84%. Next came Jodhpur with 2'17% units which provided work to 6'50% persons. Bikaner was at the bottom with O· 91 % units and 2' 29% employment that these units created.
The following table shows percentage distribution of units in major group 90 and employment created by them in each city :-
Units Persons City employed
Bikaner 0·91 2·29 Jaipur 2·63 16·84 Ajmer 1·03 5·06 Jodhpur 2·17 6·50 Udaipur 1·88 4·28 Kota 1·28 3·24
Major Group 92 : Education, Scientific and Research Services
The distribution pattern of establishments in this major group revealed that Jaipur had the highest percentage of units (9 '15) which provided highest employment (11'09%). Next came Udaipur so far as units were concerned (7' 68%). The
TotaJ
employment generated by them 'Was to the tune of 7' 94%. It was, however, in Jodhpur in which 4:' 37% units provided employment to the extent of 9'41% which was next to Jaipur. Ajmer also had 4'98% units which provided work to 8'31% persons. J.aisalmer was at the bottom with o· 95% units and Bundi with l' 05% employment.
The ruxaJ. areas had preponderant percentage of units (82·a7). Employment provided by them Was to the extent of 52' 52%. In the rural areas of the districts, Udaipur had the highest percentage of unite (6'46) but highest employment (4'90%> was provided by 6' 33% units in Jaipur. Jaisahner was at the bottom both in respect of units (0' 88%) and ew.ployntent (0' 56P.Io).
The urban. areas had only 17'63% units but they provided substantial employment (47'48%). Within the districts, although J aipur had the highest percentage of units (2' 82) but highest employment (7' 69%) was ptovided by l' 45% units in Jodhpur. Jaisalmer and Jalor Were jointly at the bottom with 0'07% units each but from the point of view of employment~ Jalor was left alone with 0'19%.
The- following table shows percentage distribution of establishments in major group 92 and employment generatE'd by them in the rural and urban areas of the state and districts :-
Rural Urban ~---, ~
A' ., State/Distriot Units PersOnB Units PerSons Units Persons
employed employed employed
RaJasthan 100'00 100'00 82'37 52'52 17'63 47'48 Ga.nga.nagar 5·20 4;'20 4,·40 2'60 0'80 1'66 Bibner ~H'} 3·19 l·M 1·09 0'87 2·10 Churu 3·67 3·19 2'07 1·42 1·10 1·77 Jhunjhunun 3·67 3'87 3'05 2'33 0'62 I'M .Alwa.r 5·22 0·98 4'67 3·46 0·1)5 2'52 Bbara.tp.ur 0'70 4'88 4'85 2'81 0'86 2'07 Sawai Madhopur 4;·57 2·91 4·Il 2·34 0·4,6 0'07 Jaipur 9·16 H'09 6·33 4·90 2·82 6·19 Bibr 4·35 3·66 3'67 2·67 0·78 0'99 Ajmer 4·98 8·31 3·37 2·87 1·61 0'« Tonk 2·37 2·21 1·93 1'40 0·44 0·81 Jaisabar 0·95 1·62 0·88 0·66 0·07 1·06 Jodhpur 4·37 9'41 2·92 1·72 1'45 7'69 Nagaur 4·40 2·78 3'9.2 2'02 0'48 0·76 Pali 3·61 2·61 3·08 1·92 0'43 0'69 Barmer 2·87 1·60 2·69 1'36 0'18 0'24 Jalor 2'23 1'4:4 ,2'16 1'2li 0·07 0'19 Sirohi 1'54 1'94; 1·24 0'80 0'30 1'1l Bhilwara ,,·Il 3·12 3·64 2·30 0'47 0·82 Udaipur 7·68 7·94 6·46 3·94 1·22 4·00 Chittaurgarh 3·66 3·00 3'28 1·76 0·38 1·.24, Dungarpur 2·61 1·43 2·36 1·20 0'16 0'23 "BanBwa.ra 2·95 2·14 2·80 1·59 0'15 0·55 Bundi 1'40 1·05 1·17 0'63 0·23 0·42 Kota 4·37 4·70 3·49 2·57 0·88 2·13 Jhals.war 2·16 1·78 1·90 1·11 0·26 0'67
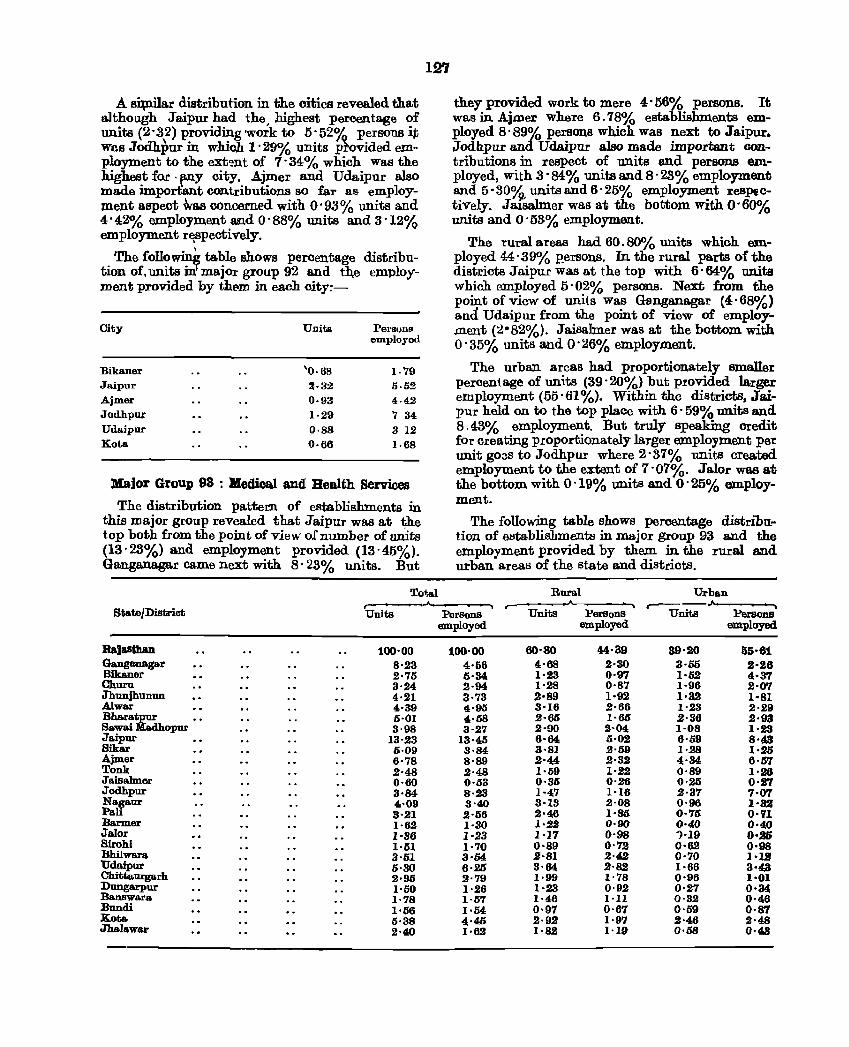
.A. ~r distribution in the cities revealed that although Jaipur had the, highest percentage of units (2·32) providing 'Work to .5·52% persons it weB Jodhpur in which 1·29% units ptovided employment to the ext':!nt of 7·34% which Was the highest for . my city. .A.jmer and Udaipur also made important contributions so far as employment aspect ~as concerned with 0·93 % units and 4·42% employment and 0·88% units and 3 ·12% employment r~speetively.
The followin~ table shows percentage distribution of, units in major group 92 and the employment provided by th£'m in each city:-
City Units Persuns employed
Bikaner '0·68 "'79 Jaipur ~·32 5·52 Ajmer 0·93 4·42 Jodhpur 1·29 7 34 Udaipur 0·88 3 12 Kota 0·66 1·68
Major Group 93 : Medical and Health Services
The distribution pattern of establishments in this major group revealed that Jaipur was at 1!he top both from the point of view of number of units (13·23%) and employment provided (13'45%). Ganganagar came next with 8·23% units. But
127
they provided work to mere 4·56% persons. It was in Ajmer where 6.78% establishments employed 8'89% persons which was next to Jaipur. Jodhpur and Udaipur alBo made important 00Il
tributions in respect of units and persons employed, with 3·84% units and 8' 23% employment and 5'30% units and 6'25% employment respectively. Jrusalmer was at the bottom with 0·60010 units and o· 53% employment.
The rural areas had 60.80% units whioh employed 44·39% p'ersons. In the rural parts of the districts J aipur was at the top with 6' 64% units which employed 5'02% persons. Next from the point of view of units Was Ganganagar (4' 68%) and Udaipur from the point of view of employment (2-82%). JaisaImer was at the bottom with o ·35% units and O· 26% employment.
The urban areSS had proportionately smaller percentage of units (39·20%) but provided larger employment (55·61%). Within the districts, Jaipur held on to the top place with 6· 59% units and 8.43% employment. But truly speaking oredit for creating proportionately larger employment per unit g03s to Jodhpur where 2'37% units created. employment to the extent of 7'07%. Jalor was at the bottom with 0'19% units and 0'25% employment.
The following table shows percentage distribution of establis.bments in major group 93 and the employment provided by them in the rural and urban areas of the sta.te and districts.
Tot.al Rural Urban
StatejDistriot Units PerSons Units Persons r--:units Persons employed employed employed
RaJasthan 100'00 100·00 60·80 44·S9 89'20 55·61 Ganganagar 8·23 4·66 4·68 2·30 3·65 2·26 Bibner 2·75 5·34 1·23 0·97 1·02 4·37 Churn 3'24 2·94 1·28 0·87 1·96 2·07 Jhunjhunun 4·21 3·73 2·89 1·92 1·3.2 1'81 Alwar 4·39 4·95 3·16 2·66 1'23 2·29 Bh&ratpur 5·01 4·68 2-66 1·66 2·36 2·93 Sawai Madhopur 3·98 3·27 2-90 2-04 1·08 1·23 Jaipur 13·23 13'45 6-64 5·02 6'59 8·4:3 Sikar 5·09 3-84 3·81 2·59 1·.28 1·25 Ajmer 6·78 8·89 2-44 .2·32 4-34, 6·57 Tonk 2·48 2·48 I-59 1·,2,2 0-89 1'26 Jaisalmer 0·60 0·53 0-35 0·26 0·25 0'27 Jodhpur 3·84- 8·23 1·47 1·16 2·37 7·07 No.~aur 4·09 3'40 3-13 2·08 0·96 1·82 Pall 3·21 2·56 2·46 1·85 0·75 0·'11 Banner 1·62 1·30 1·.22 0·90 0·40 0·40 JaJor 1·36 1·23 1-17 0·98 1·19 0·26 Sirohi 1·51 1·70 0-89 0·72 0·62 0·98 Bhilwara 3·51 3·M .2-81 2·42 0·70 I·U Udaipur 5·30 6·25 3'64 2'82 1·66 3·4;3 Ohittaurga.rh 2·95 2·79 1·99 1·78 0·96 1·01 Dungarpur 1·50 1·26 1-23 0·92 0·27 0·340 Ba.nswara. 1·78 1·57 1·46 l·ll 0·32 0'4;6 Bundi 1·56 1·54 0·97 0·67 0·59 0·87 Kota. 5·38 4,·45 2'92 1·97 2·46 2·48 Jb.aJawar 2·40 1·62 1·8.2 1·19 0·68 0·48
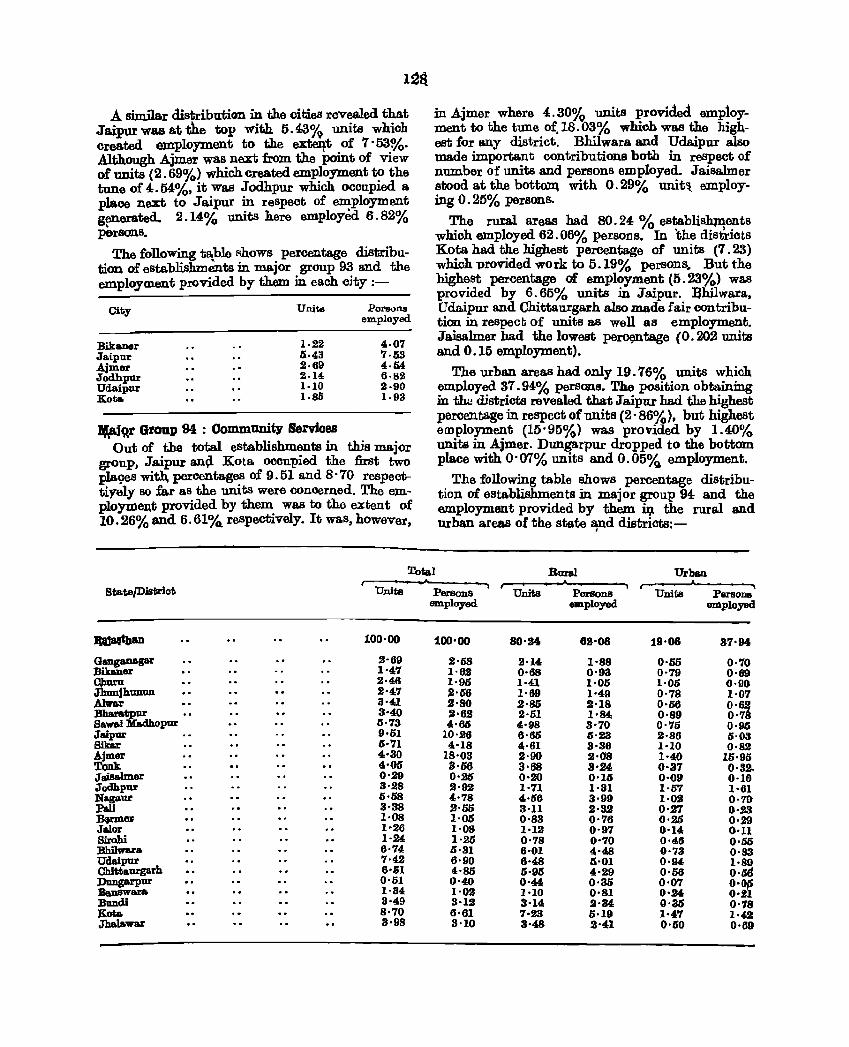
.A similar distributiGll in the oities revealed that Ja.ipur was at the top with. 5.43% units whioh oreated employment to the exteq.t of 7' 53%. .Although Ajmer was next from the point of view of units (2.69%) which created employment to the tune of 4:.54:%. it was Jodhpur which occupied a place next to Jaipur in respect of employment g~erated. 2.14% units here employed 6.82% persons.
The following tl\ble shows percentage distribution of establishments in major group 93 and the employment prOvided by them in each oity :-
City Units Persons employed.
Bikaner 1·22 4·07 Jaipur li·43 '1·li3 Ajmer 2·69 4·04 Jodhpur 2-14 6·82 Udaipur 1-10 2-90 Kot&. 1-85 1·93
l(aj~r Group 94 : Community Services Out of the total establishments in this major
group, Jaipur an~ Kota occupied the first two pIa96s with, percentages of 9.51 and 8 -70 respecttiyely so far as the units were conoerned. The employm«mt provided by them was to the extent of 10.26% and 6.61% respectively_ It was. however.
in Ajmer where 4:.30% units provided employment to the tune of.18_03% which was the highest for any district. Bhilwara and Udaipur also made important contributions both in respect of number of units and persons employed. JaisaImer stood at the bottoD\ with 0.29% unit'l employing 0.25% persons.
The rural areas bad 80.24: % establishJIlcnts which employed 62.06% persons. In the districts Kota had the highest percentage of units (7.23) which provided work to 5.19% persons~ But the highest percentage of employment (5.23%) wBS
provided by 6_65% units in Jaipur. :ahilwara. Udaipur and Chittaurgarh also made fair contribution in respect; of units as well as employment. Jaisalmer had the lowest pe~ntage (0.202 units and 0_15 employment).
The urban areas had only 19.76% units which employed 37.94% persons. The position obtaining in the districts revealed. that Jaipur had the highest percentage in respect of units (2- 86%). but highest employment (15'95%) was provided by 1.40% units in Ajmer. Dungarpur dropped to the bottom place with o· 07% units and 0 _ 05% employment.
The following table shows percentage distribution of establishments in major group 94 and the employment provided by them iJ}. the rural and urban areas of the state ~d districts:-
Total RtI1'81 Urban . StateJDistriot Units Persons Units Persons Units Persons
employed employed employed
JtIl8liiban 100'00 100-00 SO·2t. 6a·08 19·08 37·94
G.mganagar 2-69 2'58 2-14: 1-88 0·65 0''10 Bwmer 1'47 1·62 0-68 0-93 0-79 0'69 ()JlU1'1J. 2·46 1·96 1·4.1 1·05 1·05 0·90 Jhunjhuuun 2'47 ,2·66 1·69 1·49 0-78 1·07 Ahrar 3'41 2·80 2'86 2-18 0'66 0-62 Bharatpur •• 3'40 2'62 2·51 1'84; 0-89 0'7~ Sawai :Ma.dhopur 6·73 4'66 4'98 3'70 0'75 0·90 Jaipur 9·61 10·26 6·66 0·23 2-86 0·03 8ika.r 6·'11 4-18 4·61 3·36 1-10 0·8.1
~ 4·30 18'03 2·90 2·08 1-40 16·95 4'06 3'06 3'68 3'M 0'37 0-32.
Jaisa.lmer 0·29 0'20 0-20 0'16 0'09 0-16 Jodhpur 3·28 2-92 1-71 1·31 1·67 1-61 Na.gaur 0·58 4'78 4,-56 3·99 1·02 0-79 Pa.li 3·38 2-55 3·Il 2·32 0·27 0·23 ~ 1'08 1'06 0·83 0''16 0·26 0·29 Jalor 1'26 1-08 1·12 0-97 0-14 0'11 Sirohi 1-24 1·25 0'78 0-70 0'46 0·50 Bbilwara 6·74 6·31 6-01 4'48 0-73 0·83 Udaipur 7·42 6'90 6·48 5·01 0·94 1-89 Chittaurgarh 6·51 4-85 6-95- 4-29 0'56 0·511 Dongarpur 0'61 0'40 0·" 0·35 0·07 0'01$ :&answara 1·34 1·02 1-10 O'Sl 0·24 0·21 Band! 3·49 3-12 3-14 2·34 g·35 0·18 Kota 8·70 6'61 7·23 5·19 1·47 1'42 Jhalawar 3·98 3·10 3·48 2'41 0'60 0'69
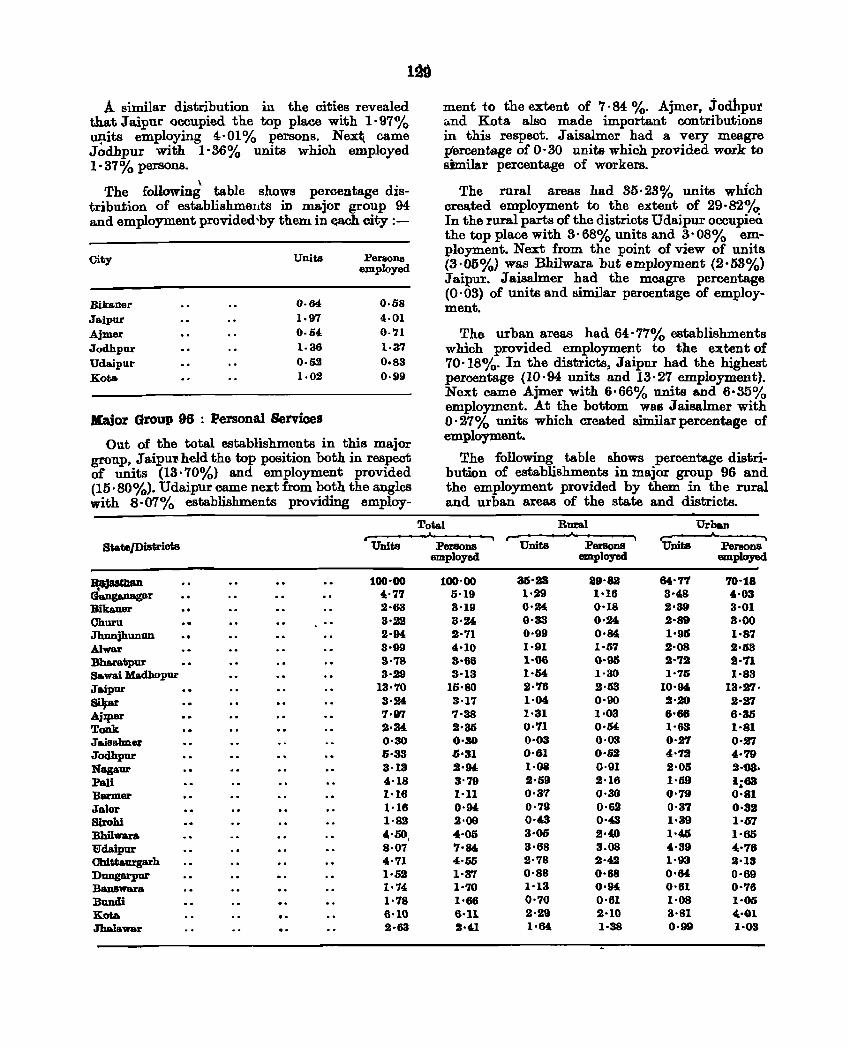
1~9
.A. similar distribution in the cities revealed that Jaipur occupied the top place with 1·97% ~its employing 4·01% persons. Next. came Jodhpur with 1·36% units which employed 1· 37% persons.
\ The following table shows percentage dis-
tribution of establishments in major group 94 and employment provided'by them in ~ach city :-
City Units Persons employed
Bika.ner 0·64 0·58 Jaipur 1·97 4,·01 Ajmer 0·5' 0·'71 Jodhpur 1·36 1·37 Udaipur 0·52 0·83 Kota 1·02 0·99
DIaior Group 96 : Personal Services
Out of the total establishments in this major gronp. Jaipul!heId the top position both in respect of units (13·70%) and employment provided (15·80%). Udaipur came next from both the angles with 8·07% establishments providing employ-
State/Disfiriot& Units
JlMlstbaD 100·00 • 4·77 (Ja.nga.nagar
Bika.ner 2'63 Churn 3·22 Jhunjhunun 2·04 Al_ 3·99 Bbaratpur 3'78 S.wa.i Madhopur 3·29 Jaipur 13'70 Silfar 3·24-AjIpBr 7·97 Tonk 2·34: Ja.isa1mef 0·30 Jodhpur 6·33 Nagaur 3·13 Pali 4·18 Banner 1·16 Jalor 1'16 Sirohi 1·82 Bhilwara "'50, "E'daipur 8·07 Cbittaurgarh 4''71 Dongarpur h52 Banswara 1·74 Bondi 1·78 Kota. 6·10 Jhalawar 2·63
ment to the extent of 7·84 %. Ajmer. j orlhput dond Kota. also made important contributions in this respect. J aisalmer had a very meagre percentage of 0·30 units which provided work to similar percentage of workers.
The rural areas had 85·23% units whIch created employment to the extent of 29·820/0-In the rural parts of the districts Udaipur occupieci the top place with 3·68% units and 3·08% employment. Next from the point of view of units (3·01>%) was Bhilwara but employment (2'53%> J aipur. J aisaImer had the meagre percentage (0·03) of units and similar percentage of employment.
The urban areas had 64·77% establishments which provided employment to the extent of 70'18%. In the districts, Jaipur had the highest percentage (10·94 units and 13·27 employment). Next came Ajmer with 6·66% units and 6·35% employment. At the bottom was J aisalmer with 0·27% units which created similar percentage of employment.
Total
The following table shows percentage distribution of establishments in major group 96 and the employment provided by them in the rural and urban areas of the state and districts.
Rmal Urban -Persons Units Persons 'Units Persons
employed employed employed
100·00 as·as 89·sa 84·7'1 '10·18 5·19 1·29 1·16 3'48 4·03 S·19 0'24 0'18 2'39 3·01 3'24- 0'33 0'24 2'89 3·00 2·71 0·99 0'84 1'95 1'87 4·10 1·91 1·57 2·08 2'63 3'66 1-06 0·95 2''12 1·71 3·13 1·&4: 1·30 1·'75 I·S3
16'80 2·'16 2·53 10·94, 13'27· 3·17 1·04 0·90 2·20 2·27 7'38 1·31 1·03 6·66 6·36 2·35 0''11 0·04: 1·63 1'81 0·30 0·03 0·03 0·2'7 0·27 6'31 0·61 0·02 4'72 4·79 2·94, 1·08 0·91 2'05 2·03· 3'79 2·59 2·16 1'59 1~63 l·n 0'3't 0·30 0'79 0·81 0·94, 0'79 O·Bi 0·37 0·32 2'00 0·43 0'43 1·39 1'07 ... ·05 3·06 2·41) 1'45 1·61) 7'84 3'68 3.08 4·39 4'76 4·50 2·'78 2·42 1·93 2'13 1·37 0'88 0·68 0'" 0'69 1·70 1·13 0·94 0'61 0'76 1'66 0'70 0·61 1·08 1·05 6-n 2·29 2'10 3'81 4·Q1 2·'1 I·" 1·38 0·99 1·03
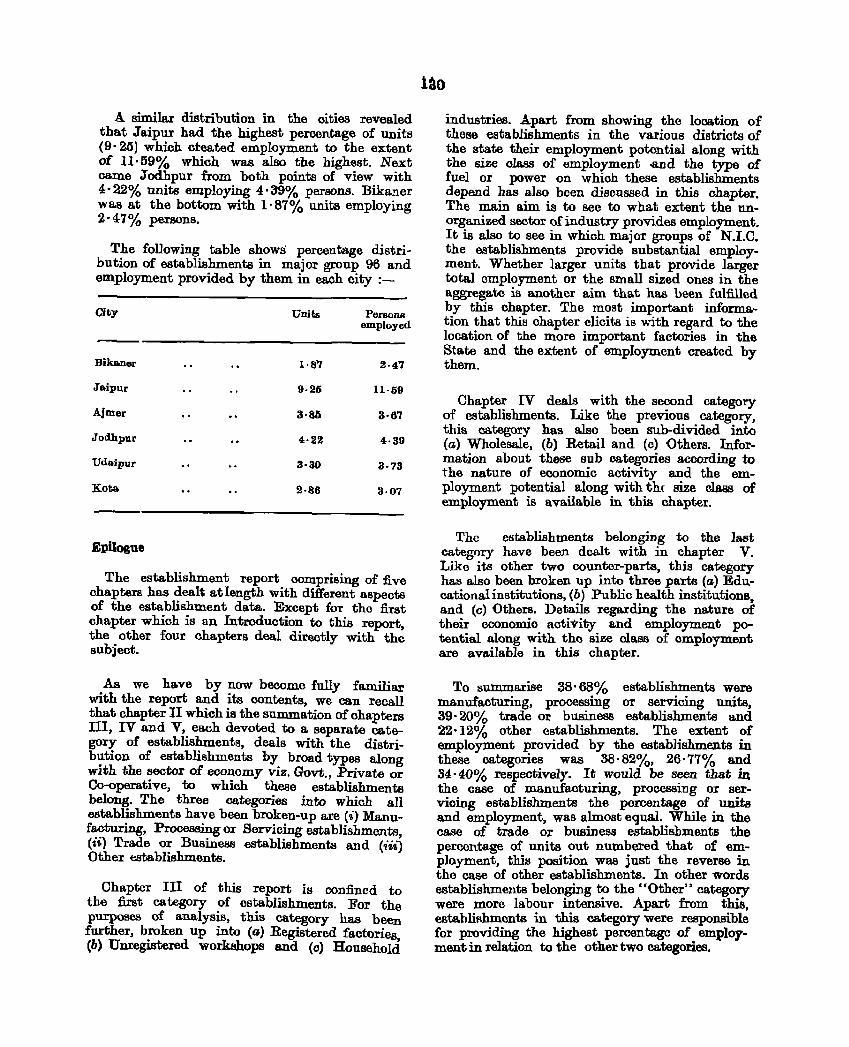
A similar distribution in the cities revealed that Jaipur had the highest percentage of units (9· 26) which cteated employment to the extent of 11·69% which was also the highest. Next came Jodhpur from both points of view with 4'22% units employing 4·39% persons. Bikaner was at the bottom with 1· 87% units employing 2· 47% persons.
The following table shows percentage distribution of establishments in major group 96 and employment provided by them in each city :-
City
Bika.ner
Jaipur
Ajmer
Jodhpur
Udaipur
Kota
EpUogue
Unitt;
1'87
9·26
3·86
4·22
3·30
2·86
Persons employed
2·47
11·09
3·67
4·39
3·73
The establishment report comprising of five chapters has dealt at length with different aspects of the establishment data. Except fOT the first chapter which is an Introduction to this report, the other four chapters deal directly with the subject.
As we have by now become fully familiar with the report and its contents, we can recall that chapter II which is the summation of chapters III, IV and V, each devoted to a separate category of establishments, deals with the distribution of establishments by broad types along with the sector of economy viz. Govt., Private or Co-operative, to which these establishments belong. The three categories into which all establishments have been broken-up are (i) Manufacturing, Processing or Servicing establishments, (ii) Trade or Business establishments and (1'ii) Other ~stablishments.
Chapter III of this report is confined to the first category of establishments. For the pru:poses of analysis, this category has been further, broken up into (a) Registered factories (b) Unregistered workshops and (0) HousehOld
lao
industries. Apart from showing the location of these establishments in the various districts of the state their employment potential along with the size class of employment oftlJd the type of fuel or power on which these establishments depend has also been discussed in this chapter. The main aim is to see to what extent the unorga...""lized sector of industry provides employment. It is also to see in which major groups of N.I.C. the establishments provide substantial employment. Whether larger units that provide larger total employment or the small sized ones in the aggregate is another aim that has been fulfilled by this chapter. The most important informa.tion that this chapter elicits is with regard to the location of the more important factories in the State and the extent of employment created by them.
Chapter IV deals with the second category of establishmentB. Like the previous category, this category has also been sub-divided into (a) Wholesale, (b) Retail and (c) Others. Information about these sub categories according to the nature of economic activity and the employment potential along with the size class of employment is availa.ble in this chapter.
The establishments belonging to the last category have been dcalt with in chapter V. Like its other two counter-parts, this category has also been broken up into three parts (a) Educationalinstitutions, (b) Public health institutions, and (0) Others. Details regarding the nature of their economic activity and employment potential along with the} size class of employment are available in this chapter.
To summarise 38' 68% establishments were manufacturing, processing or servicing units, 39· 20% trade or business establishments and 22'12% other establishments. The extent of employment provided by the estabHshments in these categories was 38· 82%, 26· 77% and 34'40% respectively. It would be seen that .in the case of manufacturing, proccssing or servicing establishments the percentage of units and employment, was almost equal. While in the case of trade or business establishments the perccntage of units out numbered that of employment, this position was just the reverse in the case of other establishments. In other words establishments belonging to the "Other" category were more labour intensive. Apart from this, establiRhmcnts in this category were responsible for providing the highest percentage of employment in relation to the other two categories.
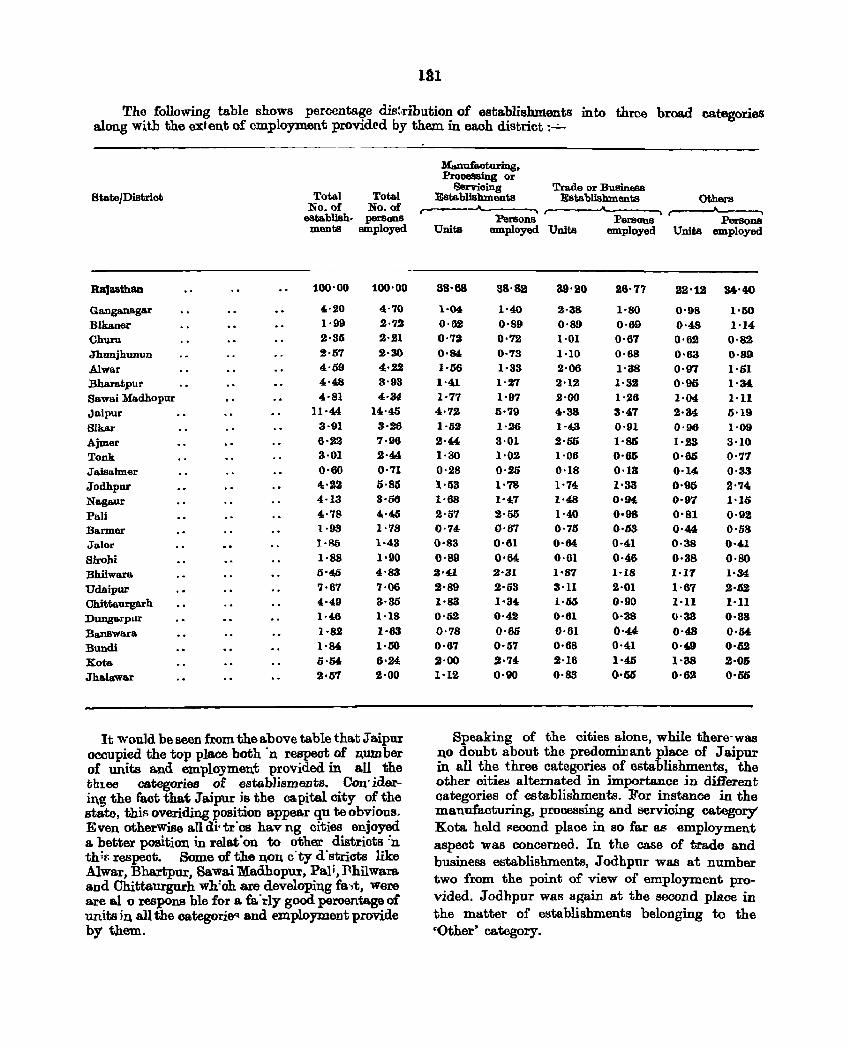
Tho following table shows percentage dis:.ribution of establishments into throe broad categories along with the extent of employment provided by them in each distriot:-'-
BtatejDistriot
Rajasthan
Ga.nga.no.gar Bikaner Churu Jhunjhunun Alwar Bbaratpur So.wai Madhopur Jaipur Sikar Ajmer Tonk Jo.iso.lmer Jodhpur Nagaur Pali Barmer Jalor Sirohi Bhilwara Udaipur Chittaurgarh DUD8a.rpur Ba.n8wara Bundi Koto. Jhalawar
Total Total lS"o. of No. of
establish· persons ments employed
100'00 100'00
4·20 4'70 1·99 2'72 2'35 2-21 2·57 2-30 4·59 4-22 4-48 3'93 4·81 4·34
11'44 14'40 3·91 3·26 6-22 7·96 3·01 2·44 0·60 0·71 4'22 5·85 4·13 3·56 4·78 4·40 1·93 1·78 1·86 1·43 1·88 I-gO
o'4Jj 4'83 7·67 ,,06 4·49 3'85 1·46 1·18 }·82 1-63 1·84 1·50 5·54 6·24 2·51 2'00
It would be seen from the above table tha.t J a.ipur occupied the top place both . 11, respect of number of units and employment provided in all the tble6 catego.ties of estab1isments. Con'iderin,g the foot that J aipur js the ca pital city of the state, thil> overiding position appear qu te obvious_ Even otherWise a.ll di,tr'os hav ng cities enjoyed a better position in relat' on to other distriots:n thir; respect. Some of the non c"ty d'striota like Alwar, Bhartpur. Sa.wai Madhopur, Pali,P.hilwo.ra and Chittaurgurh wh!oh are developiI\g fa,t, Were are al 0 respons ble for a. fa. 'rly good peroentage of units in all the oategorieq and employment provide by them.
Manufacturing, Processing or
gervicing Establishments
Trade or Business Establishments __ -----A~--__ ~ ~--~ __ ~ __ --__
Persons' Units employed Units
38'68 88'88 39'20
1'04 1'40 2'38 0·62 0'89 0'89 0·72 0-72 1'01 0·84, 0·73 1-10 1·56 1·33 2·06 1'41 1'27 2'12 1-77 1·97 2-00 4'72 5-79 4'38 1·52 1·26 1-43 2·" 3·01 2·55 1·30 1'02 1'06 0·28 0'25 0·18 1'53 1'78 1'74 1-68 1'47 1·48 2'57 2'55 1'40 0·74 0'67 0·76 0·83 0·61 0·64 0·89 0'64 0·61 2'41 2-31 1'87 2·89 2·53 3·11 1'83 1·34- 1·55 0·52 0·42 0·61 0'78 0·65 0·61 0'67 0·57 0·68 2'00 2'74 2·16 1·12 0·90 0'S8
Persons employed
26'77
1'80 0·69 0'67 0·68 1'38 1'32 1'26 3'47 0·91 1·81)
0·65 0·13 1'33 0'94. 0·98 0'53 0·41 0·46 1-18 2,·01 0·90 0·38 0·44 0·41 1·41) 0'55
Others ,-----JI---.....,
.Purson8 Units employed
22'12 34'40
0'98 1'50 0-48 1·14 0'62 0-82 0-63 0·89 0-97 1'01 0·96 l·M 1·04 1·11 2·34 5'19 0'96 1'09 1·23 3·10 0·66 0·'17 0·14 0·33 0·95 2'74 0·97 1'10 0'81 0'9S 0'44 0·58 0·38 0·41 0·38 0·80 1'17 1'34
1·67 2·52 1·11 1·11 0·33 0·38 0·43 0·54 0'49 0·52 1'38 2·06 0'62 0·51)
Speaking of the cities alone, while there-was no doubt about the predominant place of Jaipur in all the three categories of establishments, the other cities alternated in importance in different categories of establishments. For instance in the manufacturing, processing and servioing category' Kota held ~econd place in so far as employment aspect was concerned. In the ease of trade and business establishments, Jodhpur was at number two from the point of view of employment provided. Jodhpur waR again at the second place in the matter of establishments belonging to the 'Other' category.
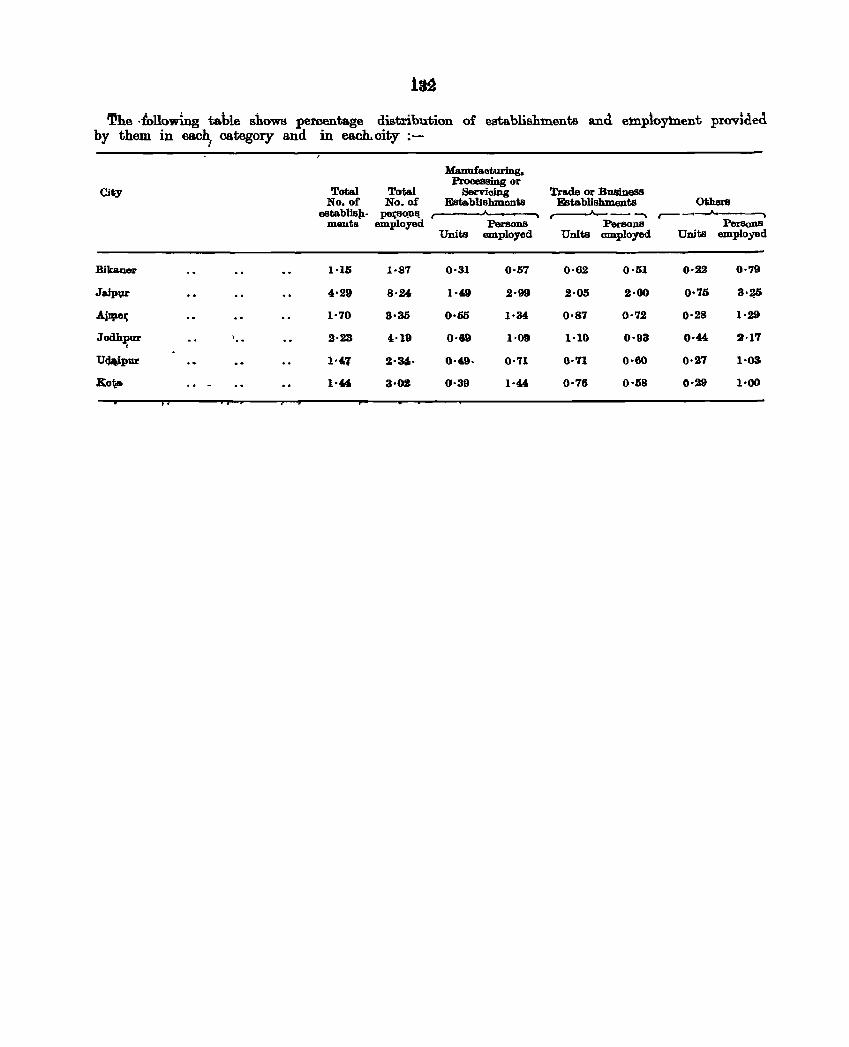
13~
'he .following table shows peroentage distribution of establishments and employment provided. by them in each, category and in each.oity :-
City
Bibner
Jaip\U
Ajl¥elj
Jodhl,'ur
Uwpur
Xofta
, ..
Total No. of
establish-meuts'
1·15
4:'29
1·70
2·23
1·4.7
1·44
Total No. of
pe~q,D!!. employed
1·87
8'24
3·35
4'19
2·3i1o·
3·02
Manufaoturing. Processing or
Servicing Establishments
..... Porsoos
Units 8JJlployed
0·31 0-57
1'4:9 2·99
0·65 1·34:
0'19 1·09
0·49. 0-71
0·39 1-44
Trade or B1I8iness Establishments Others ~----. ,.--- __,____...--~
PerSOns PersollS Units employed Units 8JJlployed
0·62 0·51 0·22 0·79
2·05 2-00 0·75 3·~5
0·87 0·72 0·28 1'29
1·10 0'93 0·4:4: 2'17
0·'11 0·60 0,27 l'OS
0·78 0·58 0·29 1'00
SUBSIDIARY TABLES
133
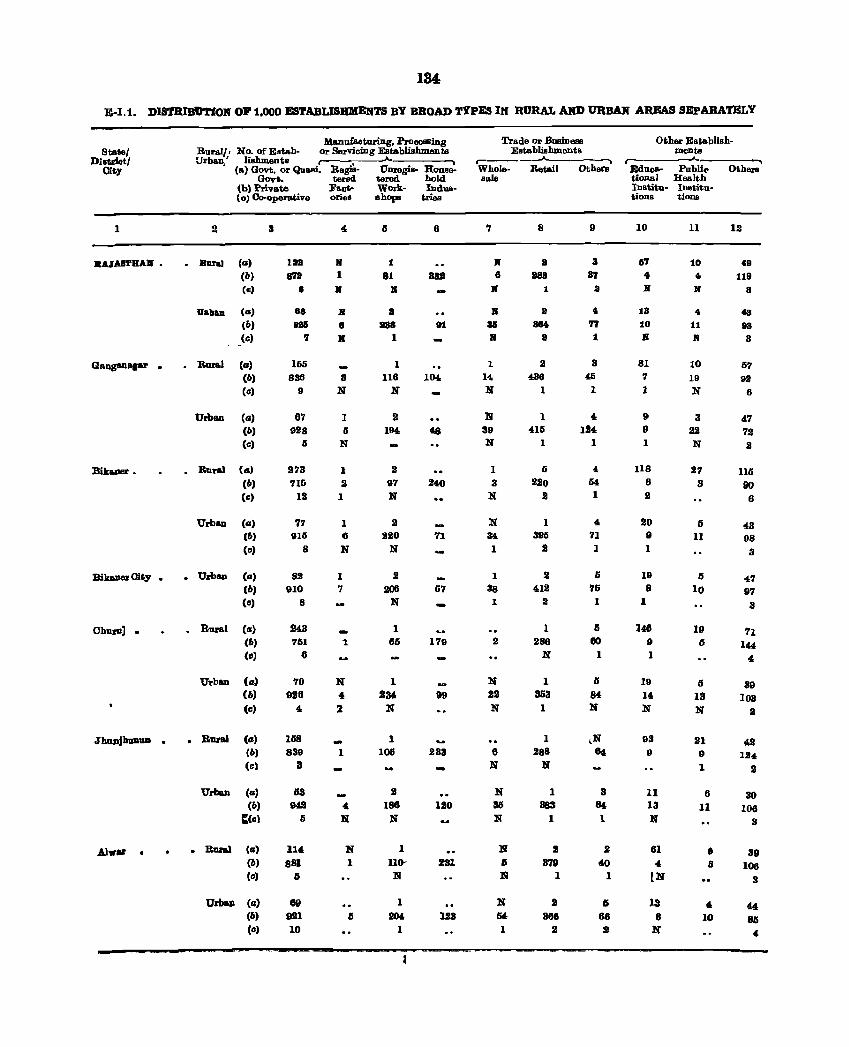
134:
E-I.1. DIS'tRIB'O'rION 0"1 1.000 ES'I'ABLISBl'tIENTS BY BROAD TYPES IN RURAL AND URBAN AIlEAS SEPARATELY
State/ District/
City
1
RAIA-STRAM •
Gang&IL .....
Bibner •
OhurP] •
JhuDjhuDlIII •
Aiwar
.M.anofo.oturing. Prooessing Rural/, No. of E~tab- 01' SerVioing Establishments Urban' lishments r--.-,,----...... ------.
, Ca) Govt. or Quui. Rogis- Uuregis- HOOBe-GOV!;. terild tered hold
(b) Private Fall.... Work- Indus-(0) Co-operativo ories shops trieo
2
_ RuraJ Ca)
(b) (c)
UablP (a)
(6)
(CI)
• Rural (a) (6)
(CI)
Urban (a) (6) (c)
• RUl'a! (a) (6)
(c)
Urbau (a) (6)
(c)
• Urbau (a) (6) (c)
• Rural (a) (6)
(el
Ul'bAD (a) (6)
(c)
• Rural (a) (6)
(c)
Urban (a) (6)
I:(c)
• Rural (a)
(6)
(c)
Ul'ball (a) (6)
(c)
3
IBll
872 .. 8S 8lI6
7
lIi5
836 9
67 928
5
273 715
12
77 910
8
82 910
8
243 761
6
70 928
4
158 839
3
68 941
5
114 881
Ii
69 921 10
• I II
M
8
M
3
N
I 5
N
1 2
1
1 6
N
1
'1
1.
N 4
l
1
4 III
N 1
5
1
81
• a
a8S 1
1 116
oN
2 194
2
97 oN
2 220
N
2
206 N
1 66
1 234
oN
1 105
S 188 N
1 nDN
1
204 1
6
an
91
104
240
57
179
99
233
UlO
231
123
Trade or Business EstabliehmentB
r----.....A.-~ Whole- Retail Othera sale
'1
1'1 6
• ]I
3&
• 1
14
N
oN 39 N
1
3 oN
oN 34-1
1
38 1
2
oN 22 N
6 oN
oN IllS N
N 54 1
8
a 3SS
1
II
884
II
2 436
1
1 415
1
6
220 2
1 396
2
.8 412
2
1 286
N
1 353
1
1 288
oN
I 383
1
J
3'111 1
2 386
2
9
3 87 a
.. 77 1
3 45
1
4 124
1
4 54 I
4 71 1
5
75 1
5 60
1
5 84 oN
3 ~
1
2 40
1
Ii 66
:!I
Other Establlsh-ments
r-.------~------~ Educ&- Public.> Othera tiODal Health IDstitu- Institu-tiODs tioDS
10
67
40 X
13
10
• 81 7
1
" 9 1
U8 6
2
20 9
1
19
8 1
146
" 1
19 14 N
93
" 11 13 N
61 4
(N
13 8
N
11
10 40
• ..
11
• 10 19
oN
3 22 N
27
3
5
11
6 10
19 6
IS
13 N
21 o 1
6 11
• Ii
" 10
12
019
119 S
t3
98 3
57 92
6
4'1 72 2
115
90 6
43 98
3
47 97
3
39 103
2
42 124
2
30 108
3
39 106
3
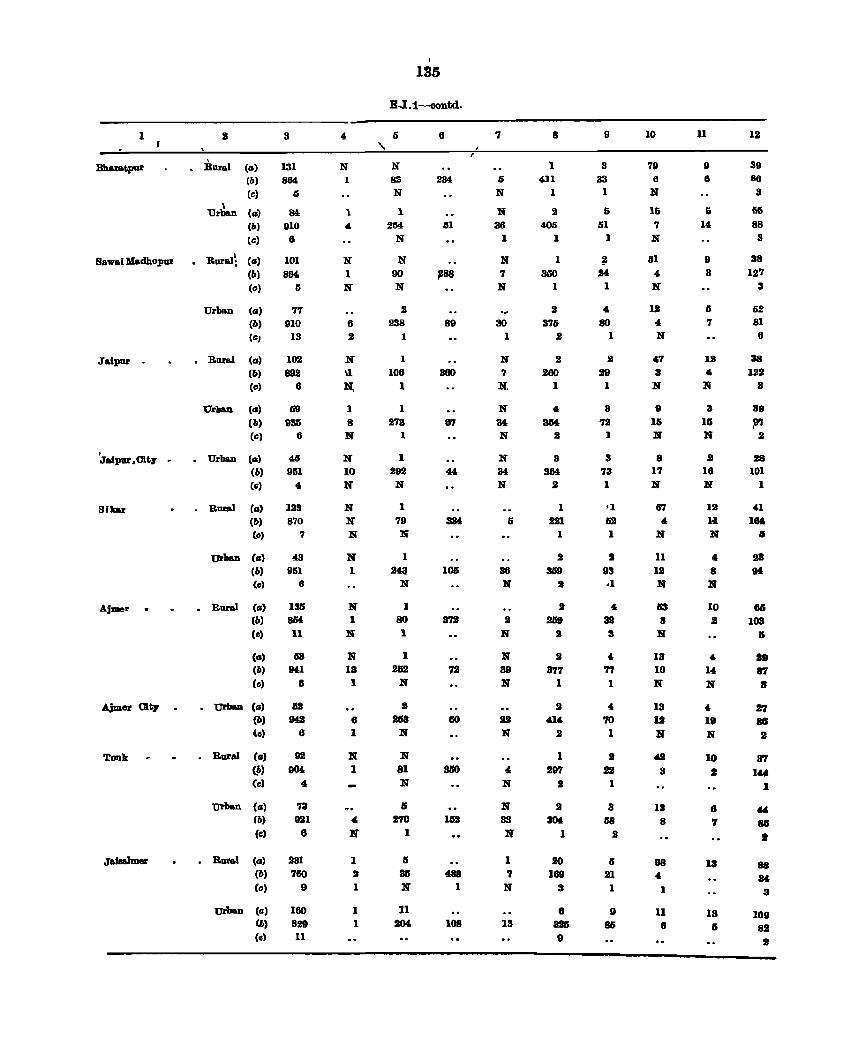
1
Bharatpur • Rural (al (b)
(c) \
Urban ts) (b)
(c)
Bawa.iKadhopur • Burl1J~ (a)
Ja.ipur •
Sikar
Ajmer
A,jmer Clt,F
Tonk
(b)
(c)
Urba.n (s)
(6)
(C)
• RuraJ (s) (6)
(c)
UrllaD (s)
(6) (c)
• Urba.n (s> (6)
(c)
• Rural (a> (b) (e)
~1Ia.n (s1 (6) (el
• Rural Ca> (11)
(c)
Ca) (6)
(e)
• Ul'ba.n Ca) (11)
'e)
• Rural (II> (~) (c)
~ba..n (II) (b)
(e)
• Rural (s) (11)
(e)
~baD (a) (6)
Cel
3
131 864
6
M 910 6
101 894
6
77 910
13
102 892
6
59
935 6
4S
951 4
129 870
7
43 951
6
135 aM 11
63 941
6
152 942
6
73 921
" 231 760
9
160 829 11
4
N 1
1 4
N 1 N
6 2
N 11
N,
1
8
N
N 10 N
N N N
N 1
N 1
N
N 13 1
6
1
N 1
4
N
1 2 1
1 1
"
135
E..I.1-contd.
5
N HZ N
1 2M
N
N 90 N
2 238
1
1
106 1
1 273
1
1
292 N
1
79 l.'Ii
1 2Q
N
1 80 1
1 25a
N
2 283
N
N 81 N
IS 2'70
1
II 31 N
11 2M
6
234
lil
89
360
8'7
100
72
60
3liO
Ie
488 1
108
7
6
N
N 36
1
N 7 N
30
1
N
7 III'.
N M N
N 34 N
5
36 N
2 N
If 89
N
22 N
\I N
N 33
If
1 7 If
13
8
1 411
1
2 406
1
1 3iSO
1
2 375
2
2
260 1
4.
3M 2
3
364 2
1
221 1
2 359
2
II 377
1
II 414
2
1 297
2
II 3(H,
1
20 169
3
6
B!lI 9
9
9 33
1
5 51
1
4
80 1
2
29 1
3
'12 1
3 73 1
52 1
I 93 .1
" 3B 3
4
77 1
4
70 1
2 22
1
3 88
2
IJ 21 1
9 86
10
79 6
N
15 7
N
51 4
N
12 4
N
47 3
N
9
15 N
8 17 N
67
4 N
11 12 N
53 S
N
13 10 N
13 12 If
42 S
13 8
98 4
1
11 6
11
U 6
5 14
9 8
5 7
12 4 If
3
15 N
2
16 N
III
H N
" 8 N
10 2
4 14
N
\I 19 N
10 2:
6
7
13
13 IS
39 86
3
65 88
3
38
127 3
52 81 6
38 122
3
38
1" 2
28 101
1
41 164.
6
28
" 6IS
103 G
19 87 S
27 88 2
fl7
1" 1
" 8Ii
J
88 M 3
109 82 2
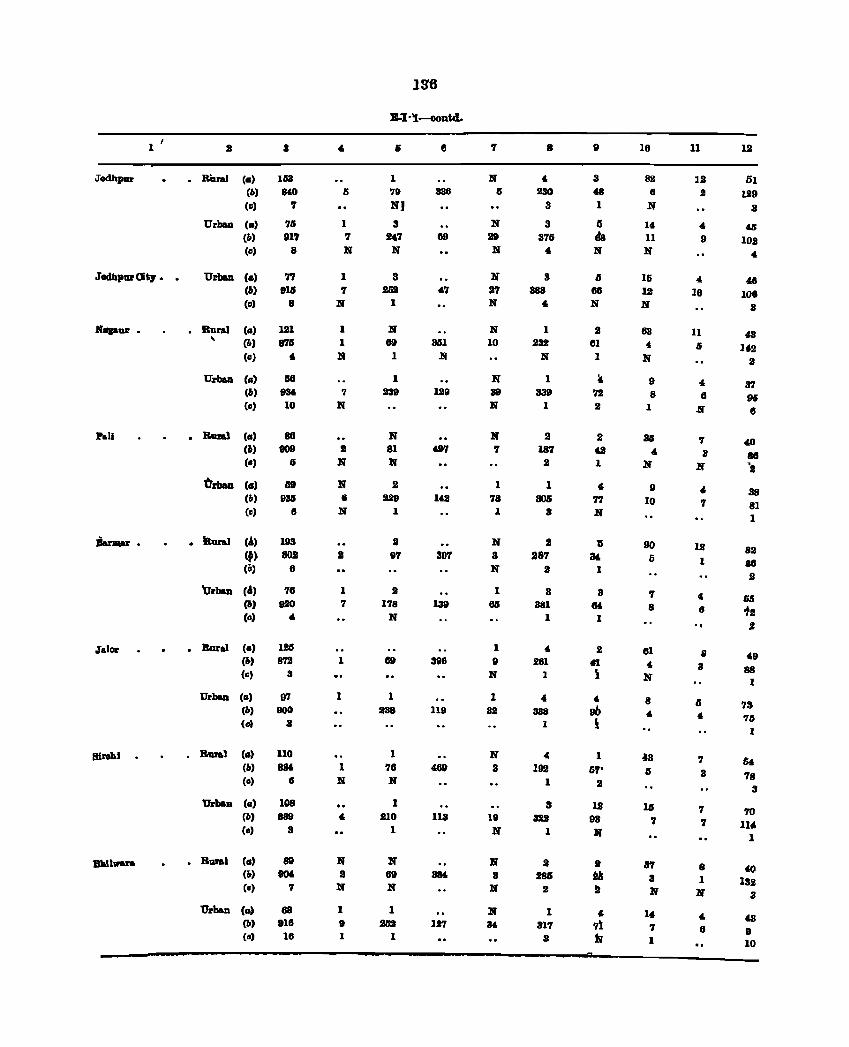
1 I
Jodhpllr
Jadllpur at,.. .
.NapUl' •
Pall
.Talar
Blrolli
a
• Raral (II) 103 (b) IUO
(c) 7
UrbaD (II) (b)
(0)
UrbaD (II)
• Rural ,
(b) (c)
(II) (6)
(o)
UrbaD (II)
eb) (0)
• Rum! (II) (b) ,.)
trrblm (II) (b) (0)
• Rural (A) (f) (c)
'Ul'ban (4) (11) (0)
• Bural (II) (jI)
(c)
Urban (II) (b)
(oa
• Bva,1 (II)
<II) (0)
Ul'ba. (II) (b)
(0)
• BQI'&I ell) (jI)
(c)
Urb&n (II) (11)
(a)
711 917
8
77 ,III
8
lSI 87rs ..
rs8 93& 10
88 009
6
69 9M
6
193 80S
6
78 920 .. 123 m
3
m 900
3
110 88&
6
108 889
3
88 918 18
1 7 N
1 7
N
1 1
N
,. N
:I N
N
• N
1 7
1
1
1 N
..
N II
N
1 9 1
18'6
B-l·'1-oontd.
• 1 79 NI 3
24.7 N
3 2GB
1
N 69
1
I 239
N 81 N
S 229
1
S
97
S 178
N
1 238
1 76 N
1 210
1
N 69 N
1 2li!
1
8
338
SGI N
129
14.2
307
139
396
119
"89
113
127
7
N II
N !9 N
N 27 N
N 10
N 39 N
N 7
1 78 1
N 3 N
1 6IJ
1
9 N
1 32
N 3
18 N
N 8
1lf
N 3&
• 4.
230
3
3 376
4.
3 888
4.
1 232
N
1 339
I
2 187
2
1 BOll
8
2 281
2
3 381
I
4. 2M
1
" 388 1
4 192
1
3 1122
1
2 28G
2
1 317
3
9
3 48 I
IS da N
6 66
N
S 61
1
2 d 1
4 77 N
'6
Sf. I
3 eli
I
2 4.1 i
1 Gf-
2
12 93 X
10
82 6
N
14 11 N
16 12 N
63 4
N
9 8
1
8Ii
" N
9 10
90 Ii
7 8
61
" N
8 4.
III 7
B7 3 N
14.
7 1
11
4.
9
" 18
11 Ii
7 3
N
" 7
12
1
"
4. 6
8 3
IS 4.
7
3
7 7
8 1 ]I
IS
01 1.119
a 4.5
102
" 48
101 a
43
142 2
37 91 6
88 81 1
82 18 S
49 88
I
73 73
I
" 18 3
70
lI4 )
40 IS2
3
43 9 10
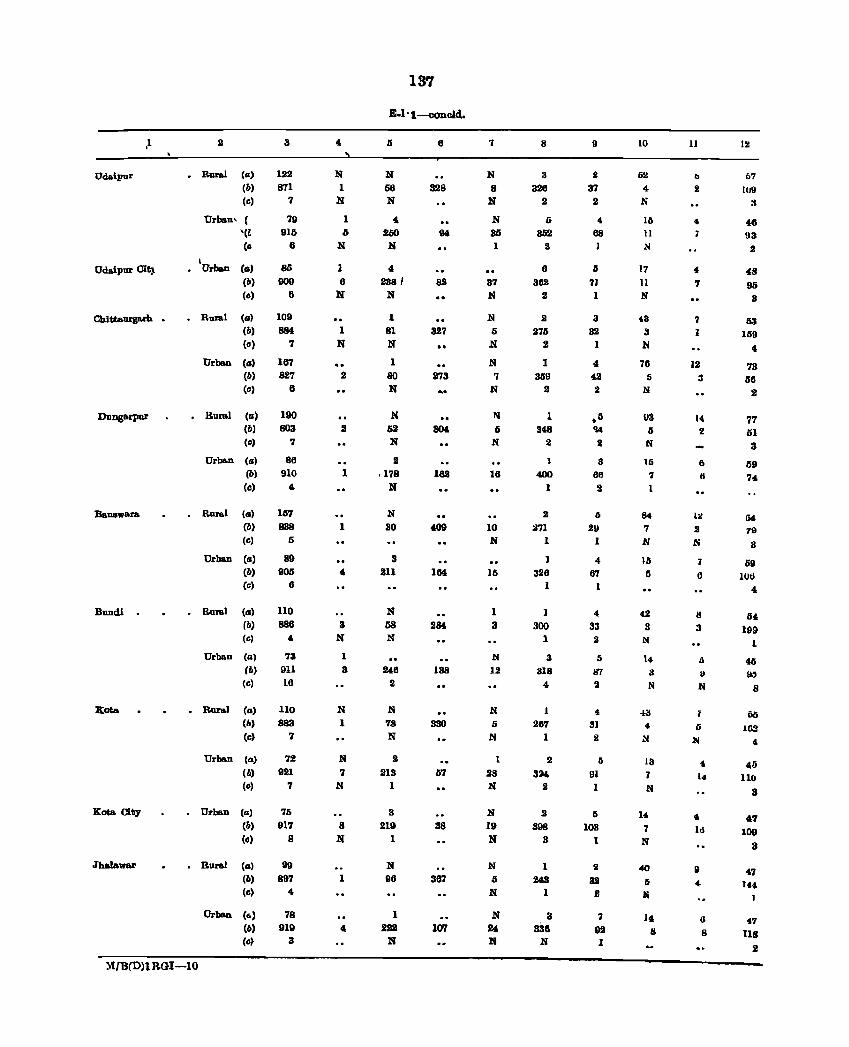
,I
Ud&ipur
Udaipur Cit)
Chitt&urga.rb. •
Dnngarpnr
Danawara
Bundi •
Kota
Kota. City
2
• Rural (4)
(b)
(c)
I
Urban' ( '(Z (0
Urban (IJI (lI)
(0)
° Rural (a) (lI)
(c)
Urban (a)
(6)
(c)
• Rural (a)
(6)
(c)
Urban (al
eb) (c)
° Rural (al (6)
(c)
Urban (al (b)
(c)
• Rural (a) (6)
(c)
Urban Ca) (b)
(c)
• Rural (a)
(b)
(c)
Urban (4)
(6)
(c)
° Urban (a)
(b)
(c)
° Rural (4)
(b) (c)
Urban (6) (6)
(c)
ltrB(D)lRGI-10
3
122
871 '1
'111 915
6
B6 909
6
109 884
7
167 827
6
190 803
7
86 910
4
157 838
5
89 905
6
110 886
4
73 911 16
110
883
7
72
921 7
75 917
8
99 897
4
78 919
3
N 1
N
1 5
N
1 6
N
1 N
2
2
1
1
4
3 N
1
3
N 1
N 7
N
8
N
1
4
137
E.I° t-ooncld.
N 56 N
4
200 oN
4 288/
N
1 81 N
1 80 N
N 02 N
2 ,178
N
N 30
3 211
N 58 N
246 2
oN 78 N
2
213 1
3
219 1
N 96
1 !lSI
N
6
828
327
273
163
164
284
138
330
67
38
367
10'1
7
N 8 N
N
31i 1
87
N
N
6
N
N 7
N
1\1
Ii N
16
10
N
15
1 3
N 12
N
Ii
oN
1
28 N
N 19 N
N
Ii N
8
3
326 2
5
352 2
6
362
2
2
276 2
1 359
2
1 348
2
400
1
2
271 1
326 1
I 300
1
3 318
4
267 1
2
334-2
2
398 3
1 243
1
3 336
N
9
2
37 2
" 68
6
7)
1
3
32
4 42 2
6
211 1
4.
67
1
" 33 2
Ii
87
2
4
3]
2
5
91
1
5
103 1
2
32 2
'1 DII 1
10
52
4
N
16
11
oS
17
11
N
"3 3 N
76 5
N
113 5
N
16
7
1
84 7
N
16
6
42 3
N
14
a N
13
7
N
14
7 N
40
Ii
K
J& 8
1]
to
2
" 1
4
'1
7
12 3
6 II
l2
2
N
7
6
8 3
.. 111
" " 6
8
12
67
IU9
3
46 93 2
48 95 3
63
159 4
73 1i6
2
77 61 3
69 74
64 79
3
69 lOti
4
Ii&
199 1
46 II;')
8
D/j
162
" 46
no 3
47 109
3
47
1"
47
118 2
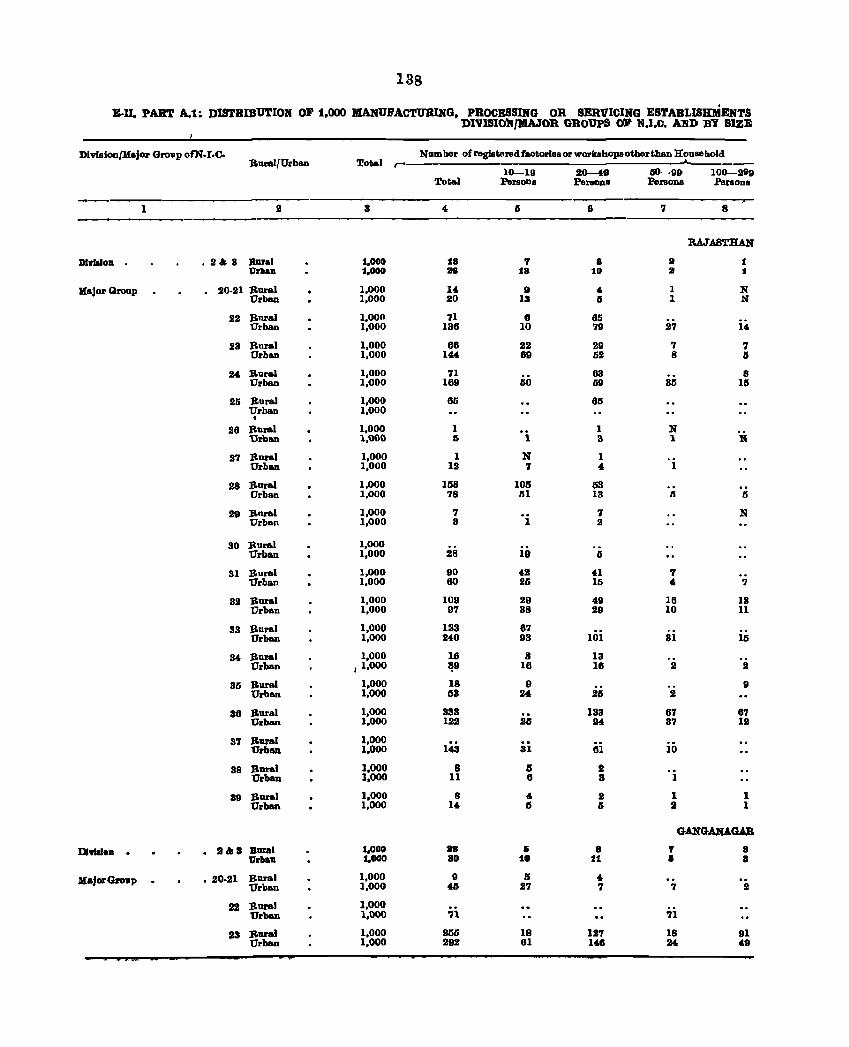
138
B-D. PART A.t: DISTRIBUTION OF t.OOO 1¥IANU.FACTl1BING. PROCESSING OR SERVICING ESTABLISHMENTS DlVISIOil}lt'IAJOR GROuPS 0'" lU.O. A~D BY SIZE
Division/Major Group oiN.I.C. RuralfUrban Total
NlImber of1'8giataredfaotorios or wOl'ksbopsotbortban Household ---"------
10--19 20--49 60-99 100--299 Total PenoD. Penon. PenODs .PenonB
1 9 3 " IS 8 7 8
RAJASTHAN
DlvllloD • 2& 3 Bua • 1.000 18 7 8 II 1 lJ'1'1wl 1,000 28 1a 10 II 1
VaJor Qronp 20·21 RUI'al 1,000 14 9 4 1 N Urban 1,000 20 13 15 1 N
22 Rmal 1.00(1 il 8 65 Urban 1,000 136 10 79 27 14
23 Rural 1,000 66 22 29 7 7 Urban 1,000 144 69 52 8 IS
24 Rural 1,000 71 63 8 Urban 1,000 169 50 59 35 15
25 Rural 1,000 85 65 Urban 1,000 •
26 Rural 1,000 I 1 N Urban 1,000 5 1 3 1 N
27 Rural 1,000 1 N 1 Urban 1,000 12 7 4 1
28 ].\arai 1,000 168 105 53 Urban 1,000 78 ill 13 6 6
29 Rural 1,000 7 7 N Urban 1,000 3 1 2
30 Rural 1,000 Urban 1,000 28 19 IS
31 :Rural 1,000 90 42 41 7 Urban 1,000 60 25 15 " '1
32 :Rural 1,000 109 29 49 16 13 Urban 1,000 97 38 29 10 11
33 :Bnral 1,000 133 67 Urban 1,000 240 93 101 31 16
34 Rnral 1,000 16 3 13 Urban J 1,000 ~9 16 16 2 2
35 Rural 1,000 18 9 9 Urban 1,000 53 24 25 2
36 :Rural 1,000 383 133 67 67 Urban 1,000 1:12 215 24 37 12
37 Rural 1,000 UrblUl 1,000 143 31 61 10
88 Rural 1,000 8 I) 2 UrblUl 1,000 11 8 3 1
89 Rural 1,000 8 4 2 I I Urban 1,000 14- 15 5 l! 1
GANGAKACUB
DwilloD . . 2&8 Bura. 1,000 :88 6 8 7 8 'Urban 1,000 80 10 11 I I
Major Group .20·21 :Rural 1,000 9 IS 4 Urban 1,000 45 27 '1 7 2
22 :Sural 1,000 Urban 1,000 'n '11
23 :Rural 1,000 255 18 127 18 91 Urban 1,000 292 61 146 24 49
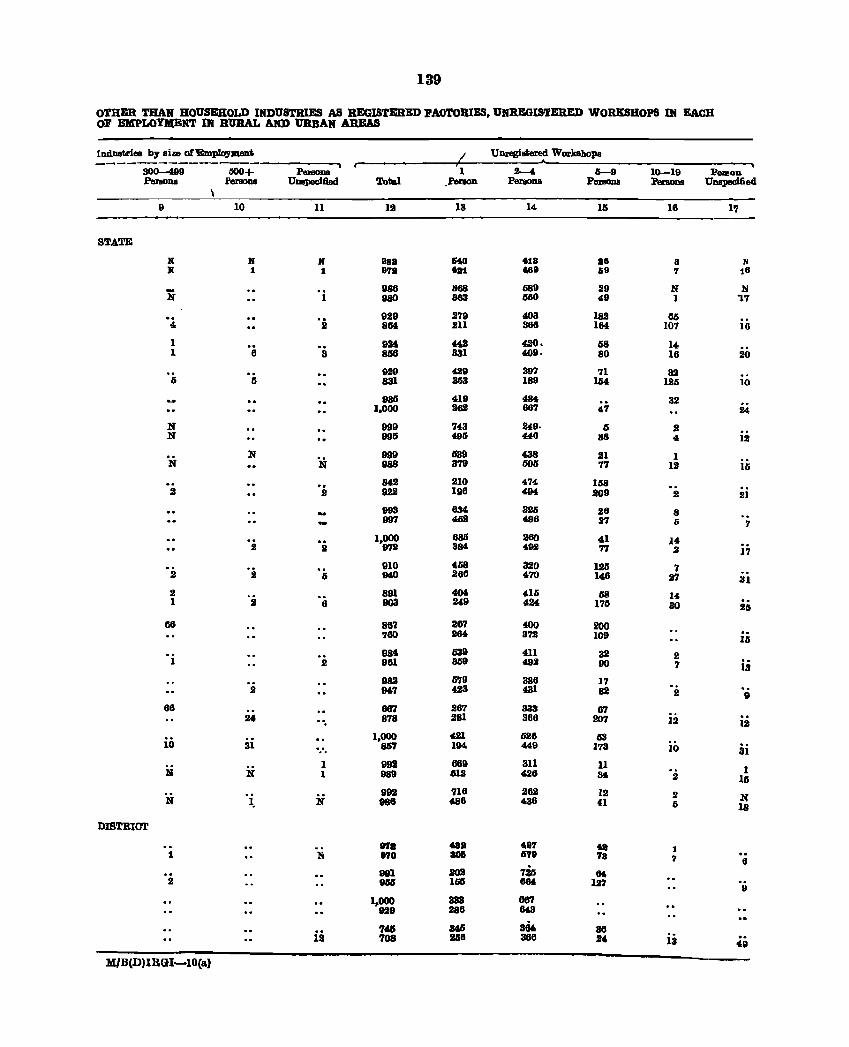
139
OTHER THAN HOUSEHOLD INDUSTRIES AS REGISTERED FAOTORIES. UNREGI&TERED WORKSHOPS IN EAcH OF EMPLOYl\lENT IN RURAL AND URBAN AREAS
Industries by aim of'Employment / Unregistered Workshops ------------- , " 300--4II9 500+ p- I 2---4 6-9 10-19 P_on Peraona 1'enIonB UlJ8lII!Cifted Total _l'erIon PelIIODB Perscms Persona UlI8pecified
9 10 11 III IS 14 16 18 1'1
STATE
K K If eBlI 540 418 a8 8 N R 1 1 87a 4.1 688 58 7 16
- 986 868 689 29 N N N 1 980 883 560 49 1 "17
.. '2 929 279 403 182 EI6 4 864 211 366 164 107 16
1 ., 934 442 420. 68 1, I 6 3 866 331 409. 80 16 20
.. 929 429 397 71 as 6 6 831 363 189 1M 126 10
985 419 4M .. 32 1.000 262 667 47 24
N 999 743 249· 6 2 N 8911 4911 446 88 4 12
N N
899 lI39 438 Jl 1 N 988 379 liOO 77 12 15
.. M2 210 474 168 2 922 186 'IN
.. 2 209 2 21
993 11M 826 26 8 997 462 4.96 37 6
'0
7 .. 1.000 685 260 41 14 2 2 972 384 492 77 2 H
.. 810 4118 320 1211 7 2 2 6 NO 266 470 146 27 31 2 891 40& '111 68 14 1 2 6 903 249 '24 1711 30 25
GO 861 261 400 200 780 2M 872 109 ..
16 98& 539 411 32 :I 1 2 861 869 482 90 7 ia 882 579 386 17
2 04.1 423 4.31 82 :I 8 66 687 267 833 67
24 878 281 386 207 12 o. 0 12
iii 1,000 421 626 63 31 867 194 449 173 10 ai ..
I 992 669 311 11 I Ii N 1 988 6lS 426 lK 2 16
N 892 '116 2U 12 :I N N l,. 886 488 436 41 Ii 18
DISTRlar
87. 48. 497 4a 1 t N 870 806 M9 7a 7 .. 8
991 202 7it; 64 2 966 105 684 127 II
1,000 383 88'1 829 286 843
'1415 3411 a84 88 12 '108 Ji6 366 24 13
.. 49
M/B(D)lRGI-IO(a)
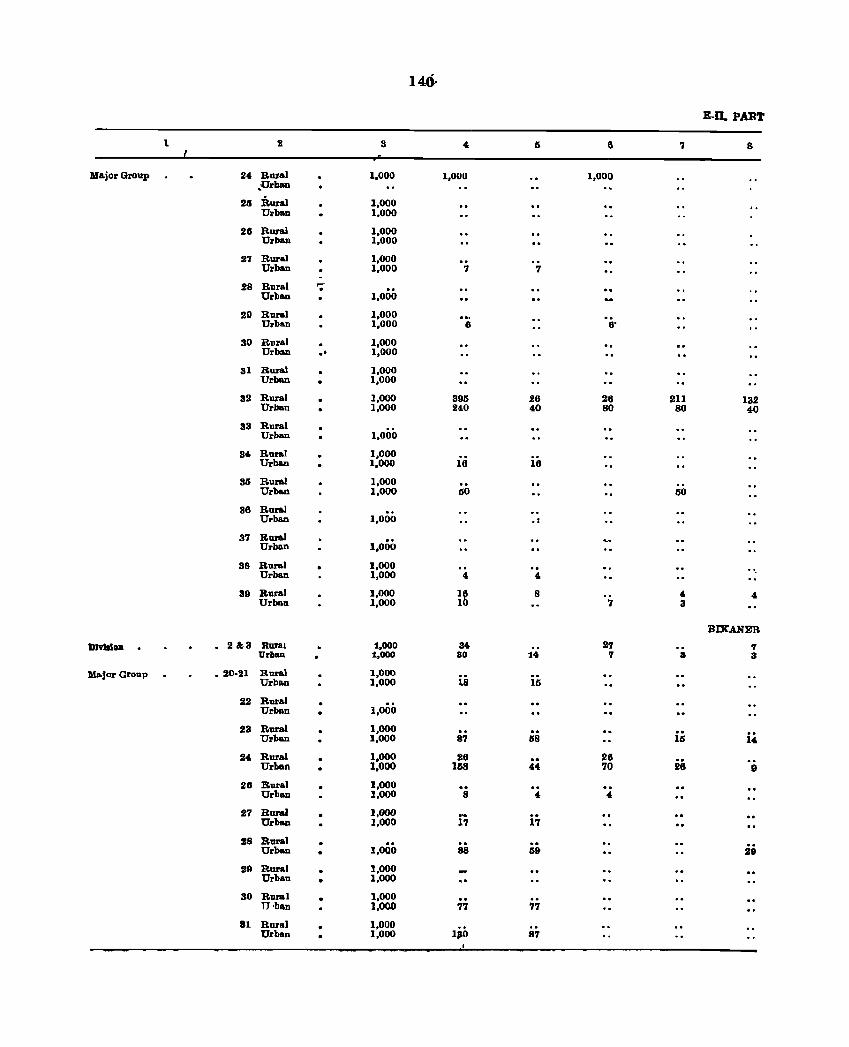
140-
E-D. PABT
1 2 3 4- 6 IS 7 8
UajorGroup 24 Rural .Urban
1,000 1,000 1,000
211 Rural 1,000 Urban 1,000
26 Rural 1,000 Urban 1,000
27 Rural 1,000 Urban 1,000 '7 '7
28 Rural ..... 00 ,
Urban 1,000
20 Rural 1,000 Urban 1,000 (I 8'
30 Rural 1,000 Urban " 1,000
31 Rural 1,000 Urban 1,000
32 Rural 1,000 395 26 26 211 132 Urban 1,000 240 40 80 80 40
33 Rural Urban 1,000
34 Rural 1,000 Urban 1,000 16 16
36 Rural 1,000 Urban 1,000 50 50
36 Rural Urban 1,000 ..
37 Rural Urban 1,000
38 Rural 1,000 Urban 1,000 4 4-
39 Rural 1,000 l& 8 4 4-Urban 1,000 7 3
BIKANER
DlvWDD 0 2 &3 Rural 1,000 84 27 7 Vrllan 1,000 80 14 7 8 3
l'4ajor Group • 20·21 Rural 1,000 Urban 1,000 18 15
22 Rural Urba.n 1,000
23 Rural 1,000 .. i4 Ul'ban 1,000 87 58 US
24- Rural 1,000 26 28 26 Urban 1,000 168 44 70 B
26 Bural 1,000 Urban 1,000 8 4 4-
27 RU1'81 1,000 i7 Urban 1,000 17
28 Rural 1,000 ii Urban 88 69
29 Rural 1,000 Urban 1,000
30 Rural 1,000 00
n ,ban I,OOD 77 77
31 Rural 1,000 Urban 1,000 1110 87
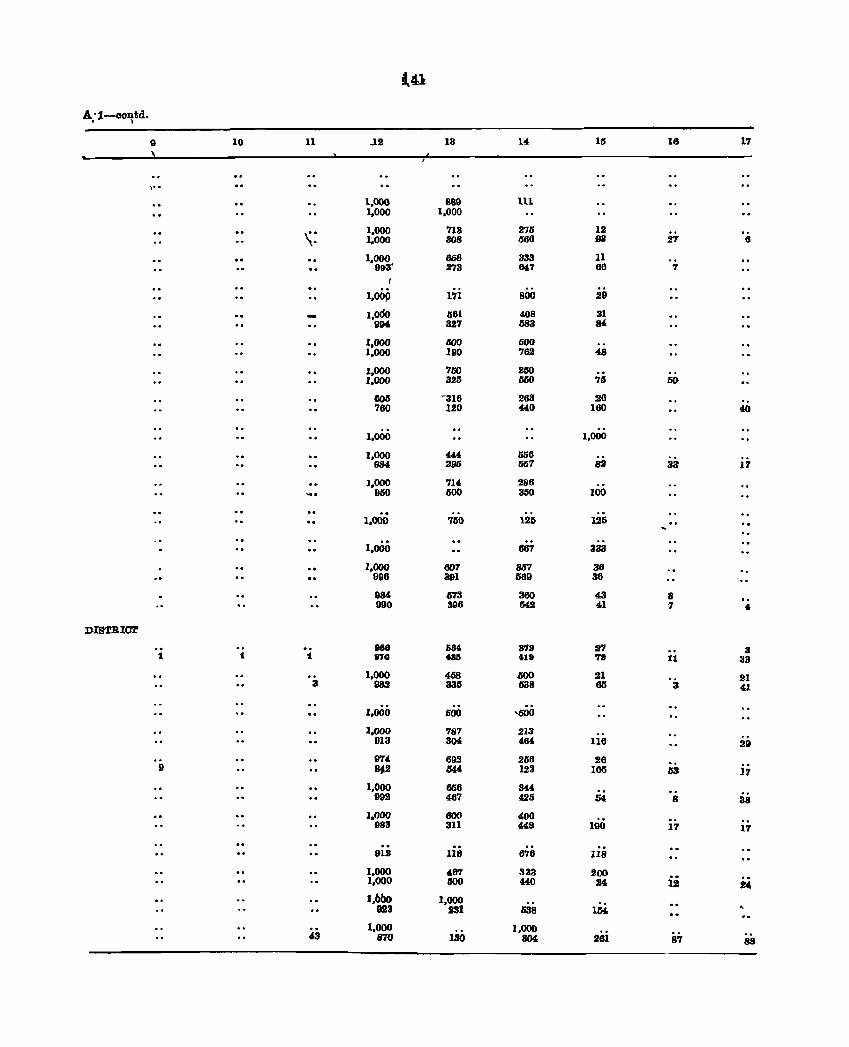
(41
A'1-contd. • I
9 10 11 .12 13 14 15 18 17
," 1.000 889 111 1.000 1,000
\' 1.000 718 276 12 , . 1.000 308 666 98 27 6
1.000 666 333 11 99S' 273 647 66 7
I
l,cop 17i 800 29
l.ado 361 408 31 994 327 683 84
1.000 aoo 500 1.000 190 762 48
1.000 760 200 1.000 325 550 76 50
605 -318 288 28 760 120 440 160 40
1.000 1.000
1.000 444 556 984 296 067 82 33 17
1,000 714 286 960 500 350 100
1.000 750 125 125
1.000 667 333
1.000 007 367 36 998 391 1189 38
11M 573 380 43 8 .. 990 396 542 41 7 "
DIS".rRlcr
888 58' 37lJ :n 3 1 1 1 870 408Ii '19 7lt 11 33
1.000 468 000 21 21 3 982 335 1538 85 3 41
1.000 600 '500
1.000 787 213 913 304 464 118 29 974 692 256 26
9 Sf! 044 123 105 63 17
1,000 656 344 992 467 425 54 8 38
1,000 800 400 983 311 448 100 17 17
.. 912 118 676 U8
1.000 467 333 200 1,000 500 440 24 i:i 24 l,bOO 1,000 ..
923 231 538 1M 1,000 1,000
43 870 130 304 261 87 88
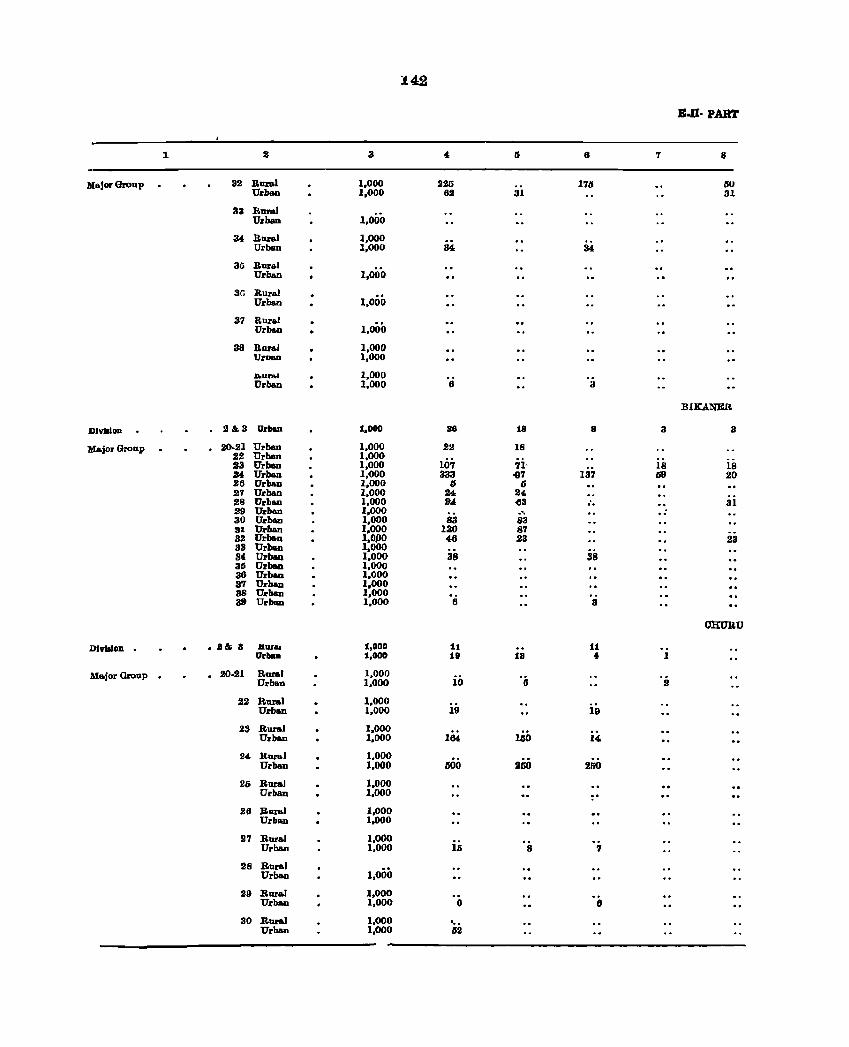
142
B.,JI· PART
1 11 3 4 5 6 7 8
M .. jorGrouP 32 Ruml 1,000 225 176 110 Urban 1,000 62 31 31
33 Rural Urban 1,000
34 BlIl'&l 1,000 Urban 1,000 34 34
36 Rur .. 1 Urba.n 1,000
3G Bur .. 1 Urb&n 1,000
37 Rur .. 1 1,000 Urba.n
38 Bur&J 1,000 tJrllfloD 1,000
.a.ura.' 1,000 Urban 1,000 6 3
IHKANER
DIYIIlOD 2&3 UrlJaD 1,000 88 18 8 3 3
Major Group 20·21 Urban 1,000 22 18 22 Urban 1,000
l()7 ii-S3 Urban 1,000 18 18 :14 Urban 1,000 333 {}7 137 59 20 26 Urban 1,000 5 I) 27 Urban 1,000 24 24 21.1 Urba.n 1,000 JU ~3 .. 31 29 Urban 1,000 .', " 30 Urba.n 1,000 83 83 31 Urban 1,000 130 87 32 UrbaD 1,000 46 23 23 33 Urban 1,000 84 Urban 1,000 38 38 35 Urban 1,000 36 Urban 1,000 87 Urban 1,000 38 Urban 1,000 38 Urban 1,000 6 3
OlIURU
DIV'IIlon . • a& a Kar .. 1,000 11 11 UrllllD 1,000 111 18 4 1
UajorGroup . . 20.S1 RmaJ 1,000 iil '6 Urblm 1,000 2
22 Rural 1,000 Urban 1,000 19 19
23 Bural 1,000 1GO Urban 1,000 164 14
24 Rural 1,000 Urban 1,000 500 250 250
26 Rural 1,000 Urban 1,000
" 26 Rural 1,000
Urba.n 1.000
27 Rural 1,000 Urban 1,000 15 8 7
28 Bural 1,000 Urban
29 Rural 1,000 Ul'bao 1,000 6 II
30 Rural 1,000 ' .. Urban 1,000 1S2
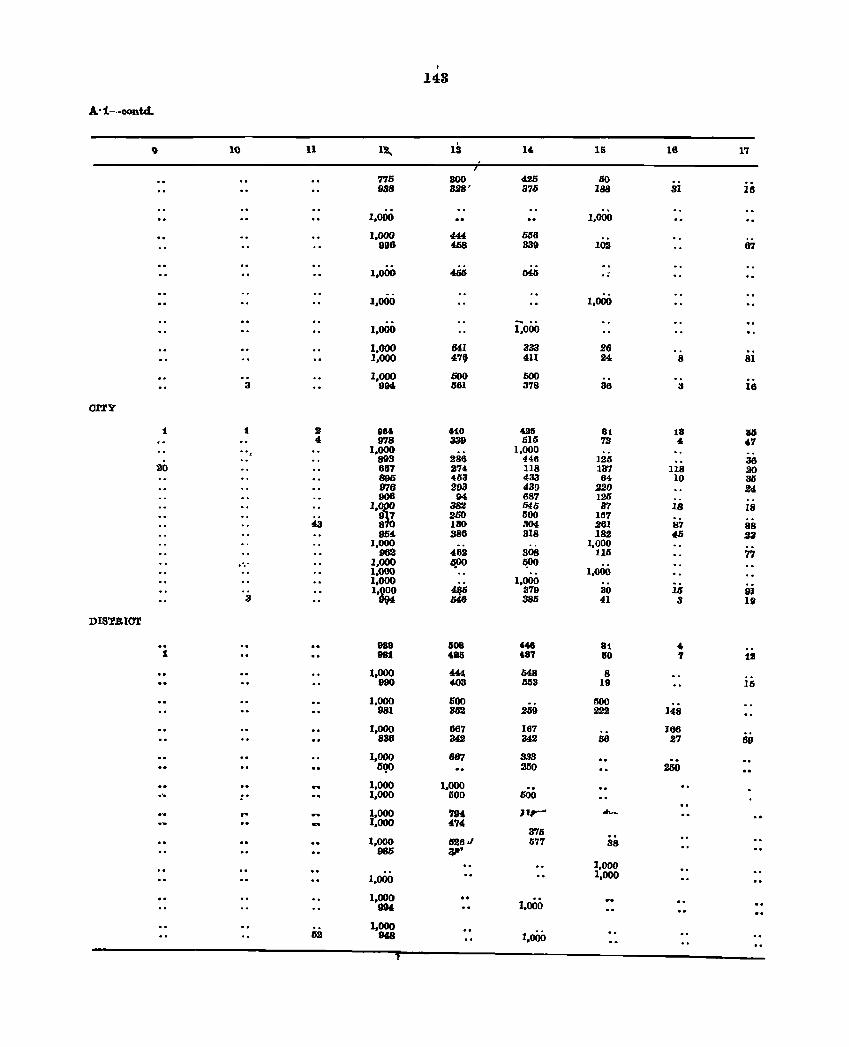
148
A-i-oontd_
.., 10 11 1~ 13 14 15 16 17
775 300 425 SO 938 328' 876 188 81 16
1,000 1,000
1,000 444 568 998 4li8 839 102 67
1,000 45G Mil --1,000 1,000
-. 1,000 1,000
1,000 641 333 26 1,000 470 411 24 8 81
1,000 500 500 3 9~ 561 378 36 3 16
CITY
1 1 2 1161 liD 1115 8t 18 U 4 978 339 615 73 " 47 --, 1,000 1,000
893 286 446 125 36 20 887 274 118 137 118 20
895 4113 433 64 10 81S f176 293 439 220 24 9()8 M 687 125
I'm 382 546 87 18 18 250 500 167
43 180 804 261 87 88 D5!!. 386 318 182 45 23
1,000 1,000 962 482 308 115 77 •... 1,000 ~ ~
1,000 1,000 1,000 1,000 1,z: ~ 379 30 16 91
3 646 385 41 3 19
DISTRICT
989 609 448 8t 1 t 981 11116 487 &0 7 till
1,000 444 048 8 990 403 563 19 15
1.000 500 IlOO 981 352 259 222 148
1,000 667 167 166 836 342 342 66 27 69
1,000 867 338 5QO 250 250
1.000 1,000 000 ... . 1,000 !lOO
... 1,000 '194 ",.-M ..... -1,000 474
375 I,OOD 1l26J (;77 38
985 :f,I" 1,000
1,000 1,000
1,000 1.000 994,
1m 1,000
9«8 1,000
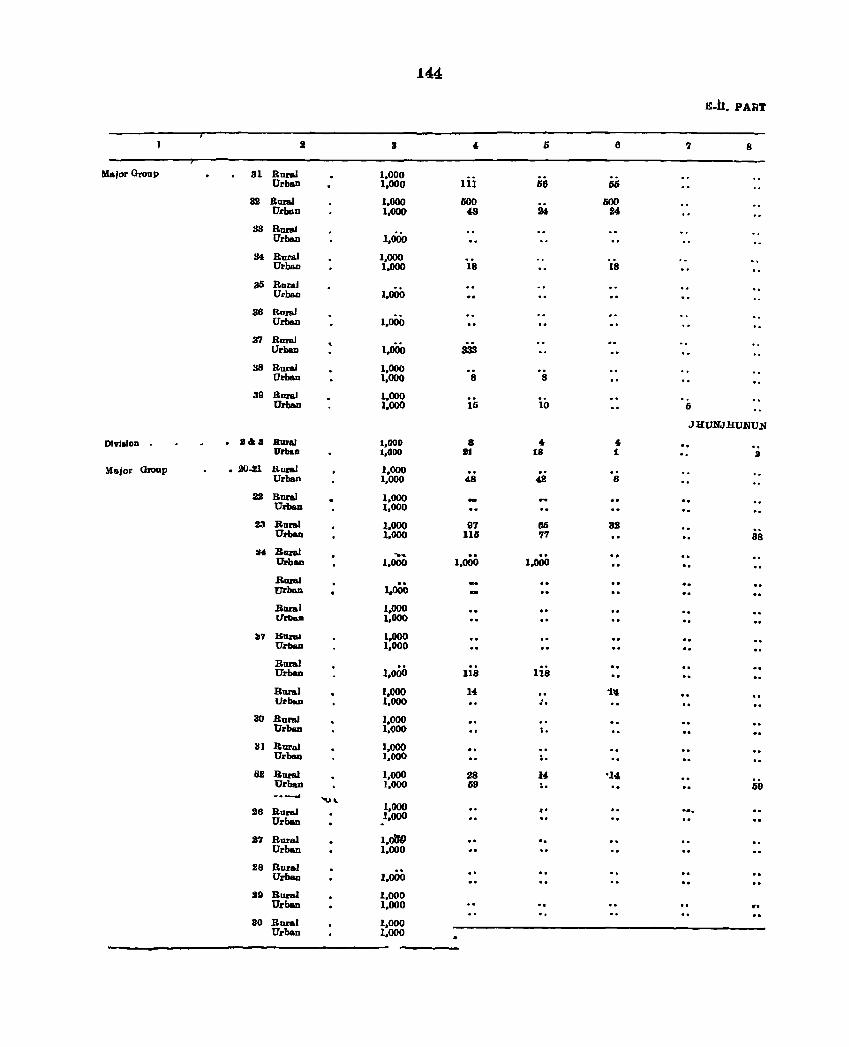
144
E-b. PART
2 3 , 6 6 7 S
MaiorOroup 31 Rural 1,000 Iii Urbau 1,000 &6 5&
32 RuraJ 1,000 500 500 Urban 1,000 48 24 24
33 Rural Urban 1,000
34 RnraJ 1,000 Urban 1,000 18 IS
ali Rural 1,000 Urban
36 B.tuBI Urban 1,000
37 Rural Ur_ 1,000 333
38 B.unJ 1,000 Urban 1.000 8 S
39 Rural 1,000 Urban 1.000 15 10 (j
J l{UNJ MUNU.N
Dlvllion lI&a RUa! 1.000 8 .. .. D'rllan 1,000 81 18 1 a
Major Group • ,ZO-21 l~Ul'II.I 1.000 .. Urban 1,000 4S 4.2 6
ti RumI 1,000 Urban 1,000
23 Rnral 1.000 97 65 32 Urba.D 1,000 115 77 88
M RnraJ -.. 1.000 .. Urban 1,000 1.000
Rural 1.000 Urban
Rural 1.000 lIrDaD 1,000
217 KllnJ,J 1,000 UrDaD 1,000
Rural 1,000 .. lis Urba.D lIS
Rural 1,000 14 1 .. VrbJaD 1,000 ..
30 .R.nml 1,000 UrbaD 1.000 ..
31 Rural 1,000 Urba.D 1.000 :.
81l RuraJ 1.000 118 14 '14 .. Urban 1,000 59 \. 59 -.__, .... '"
26 aural 1.000 , . . ... Urban 1,000
2'1 Rural l.oIJ9 ., Urban 1.000
28 Rural .. Urban 1,000
29 Rural 1,000 Urban 1.000 ."'
aD Rural 1.000 Urban 1,000
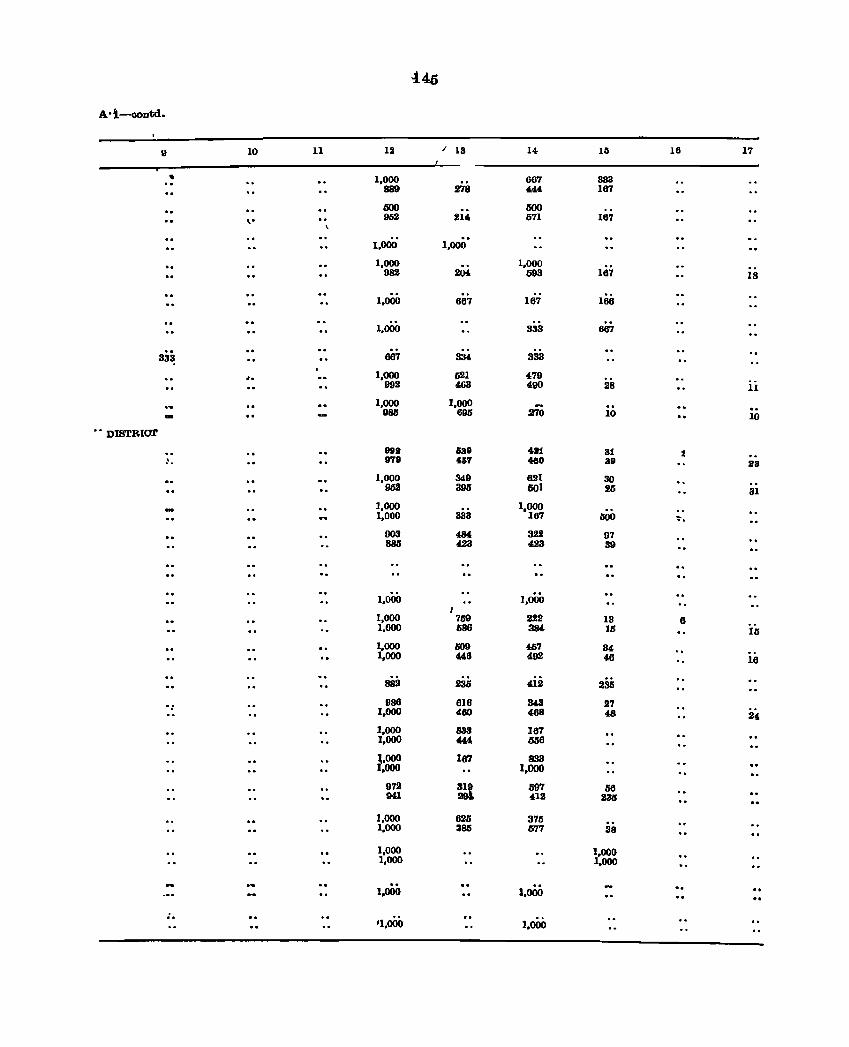
-145
A'i-OODtd.
u 10 11 12 / 13 14 15 15 17
• 1,000 667 333 889 278 ~ 167
500 500 \. 952 2U, 571 167
., 1.000 1,000
1,000 1,000 982 204 593 167 18
1,000 667 167 166
1,000 333 667
, . 331! 667 334 333 .. 1,000 521 479
992 463 490 28 11
1,000 1,000 ~ - 98ll 695 370 10 10
,. DIBTBIC1l'
998 539 481 31 , 979 457 480 39 88
1,000 349 621 30 962 395 501 25 31
1,000 1,000 1,000 333 167 600 ..
003 484 322 97 885 423 423 39
1,000 1,000 J
1,000 759 222 13 6 1,000 686 384 16 15
1,000 609 457 34 1,000 446 492 46 16
s82 236 412 235 986 816 343 27
1,000 460 468 48 2" 1,000 833 167 1,000 444 556
1,000 187 833 1,000 1,000
972 319 597 56 941 2M 412 23lS
1,000 820 375 1,000 385 fi77 38
1,000 1,000 1,000 1.000
1,000 1,000 ..
'1,000 1,000
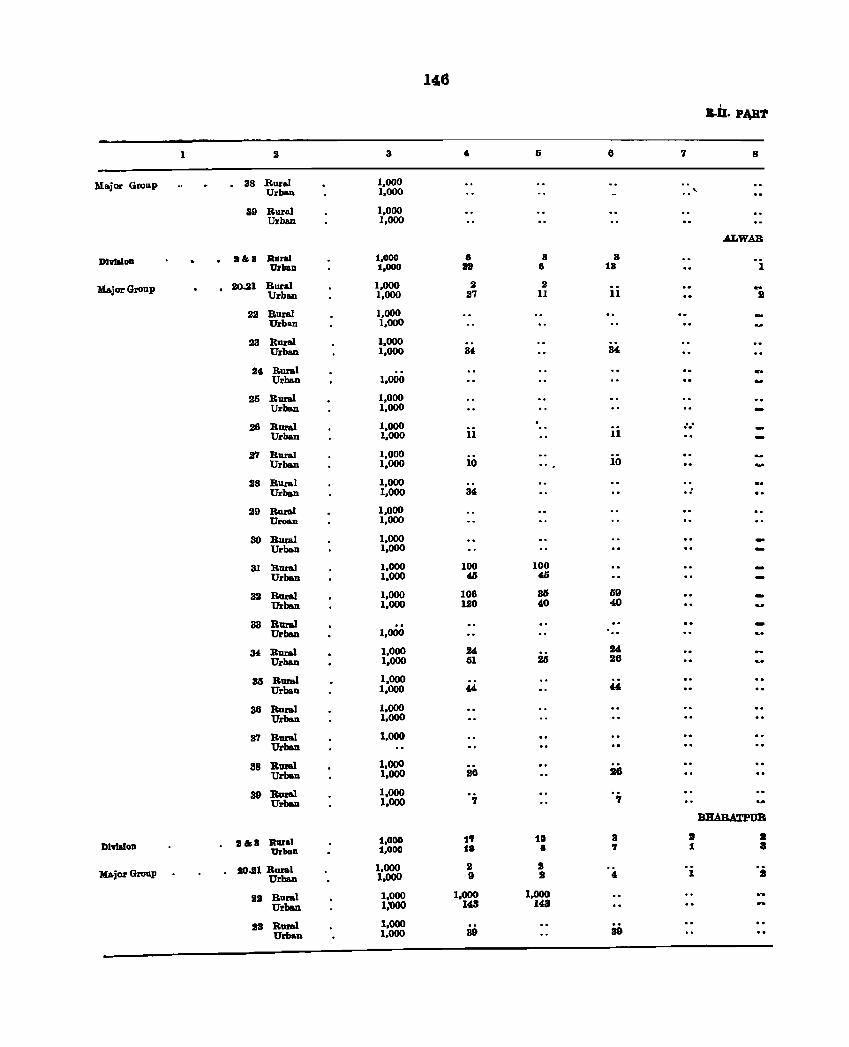
146
8-11. p~'t
1 2 3 4- 6 8 7 8
Major Group 38 Rural 1,000 Urban 1,000 ,
39 Rural 1,000 Urban 1,000
ALWAR
DlvIalDD .&8 Rural 1,000 8 8 8 Urban 1,000 811 a 13 1
Major Group . 20021 Rural 1,000 2 2 .. Urba.n 1,000 27 11 11 B
22 Rural 1,000 Urban 1,000
23 Rural 1,000 Urban 1,000 3' M
24 Rural Urban 1,000
26 Rural 1,000 Urban 1,000
28 Rural 1,000 .. .. Urban 1,000 11 11
111 Rural 1,000 Urban 1,000 10 10
28 Rural 1,000 Urbaon 1,000 3' ..
29 Rural 1,000 Uroan 1,000
30 Rural 1,000 Urban 1,000
31 Rural 1,000 100 100 Urban 1,000 46 46
as Rural 1,000 108 36 69 Urban 1,000 120 40 40
88 Rural .. Urban 1,000 . ..
34 Rural 1,000 24 24 Urban 1,000 51 2lS 26
35 Rural 1,000 Urbaon 1,000 44 "
38 Rural 1,000 Urban 1,000
WI Rmal 1,000 Urban
88 Rmal 1,000 Urban 1,000 26 26
39 Rural 1,000 Urban 1,000 7 7
BBARA'l'PUB
Dl'l'IldDn 1111. Raral 1,000 1., 10 8 D I urban 1,000 1. a 'I 1 a
Major Group 2O..JI Rural 1,000 2 2 'j Urban 1,000 9 2 .. 1
29 Rural 1,000 1,000 1,000 Urban 1;000 143 148
28 Rural 1,000 Urban 1,000 89 39
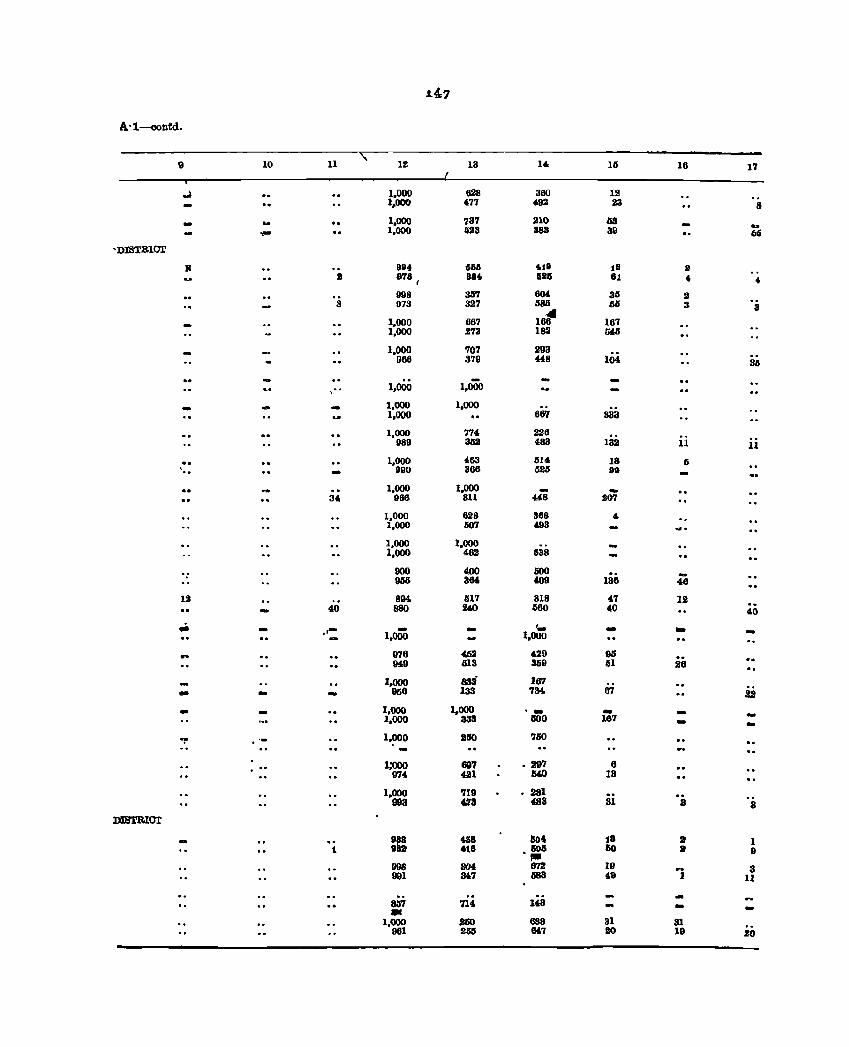
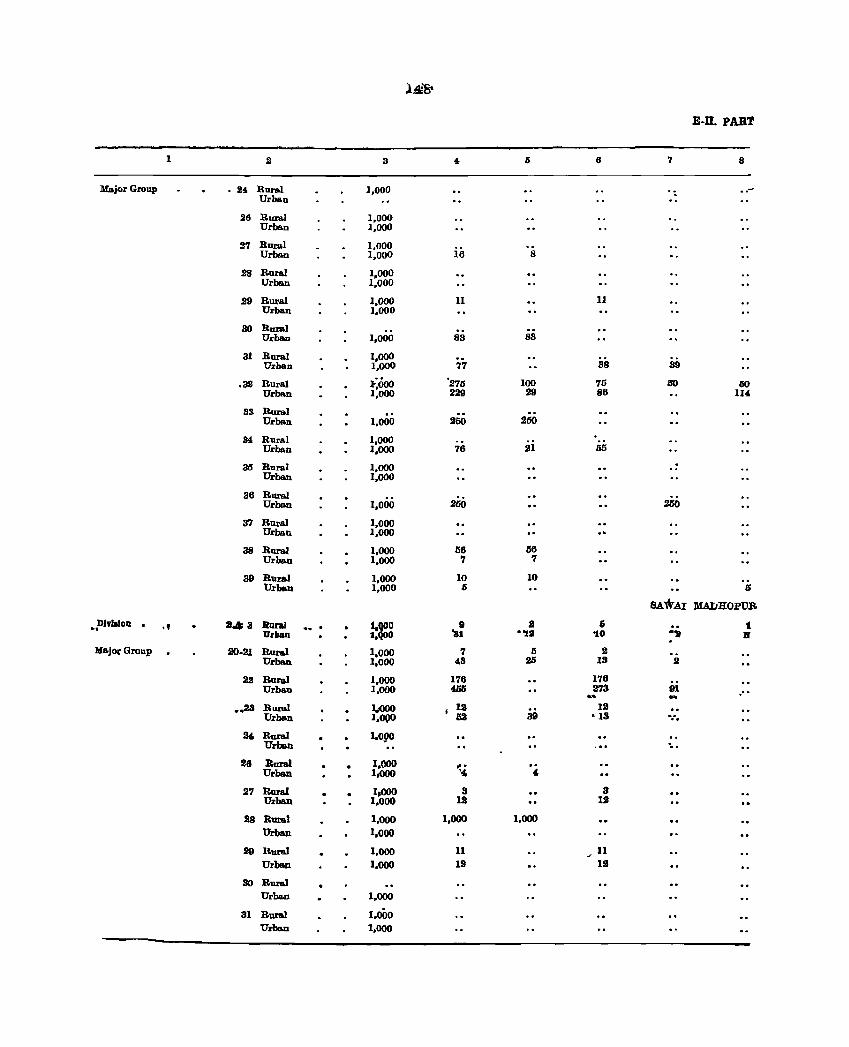
.1418-
E-n. PART
1 2 3 4 I) 6 '1 8
Major Group lI4 Rural 1,000 . .. Urban
26 Rural 1,000 Urban 1,000
27 Rural 1,000 Urban 1,000 16 8
28 RuraJ 1,000 Urban 1,000
29 Rural 1,000 11 11 Urban 1,000
30 Rural Urban 1,000 83 83
31 Rural 1,000 Urban 1,000 77 38 39
.32 Rural .:000 '275 100 75 1m 50 Urban 1,000 229 29 86 114
83 Ruml Urban 1,000 250 260
M Rural 1,000 Urban 1,000 76 21 55
35 Rural 1,000 .. Urban 1,000
36 RumI 260 Urban 1,000 2lSO
37 Rural 1,000 Urban 1,000
38 Rural 1,000 56 56 Urban 1,000 '1 7
39 Rural 1,000 10 10 Urban 1,000 5 5
SAltAI lILUJROPUB
Dhlidoll , •• • ..,,8 Rural .. . 1'8:0 8 • 6 .. 1 . , Urllall 1, 0 '81 "II '.10 -'2 B
Major GrollP 20-21 RuraJ 1,000 7 5 2 Urban 1,000 43 25 18 2
22 Rural 1,000 176 176 Urb&lJ 1,000 46li 273 Itl ' . ...
•• 23 Rural l,,(IOO 12 12 Urban 1,0(10 52 39 '13 ..
24 Rural I,Ogo Urban ' ..
26 Rural 1,000 ... Urban 1.000 ." 4
27 Rural 1,000 3 3 Urban 1,000 12 12
28 Rural 1,000 1,000 1,000 Urban 1,000
29 Rural 1.000 II 11 Urban 1,000 12 12
30 Rum! Urban 1.000
31 Rural 1.000 Urban 1,000
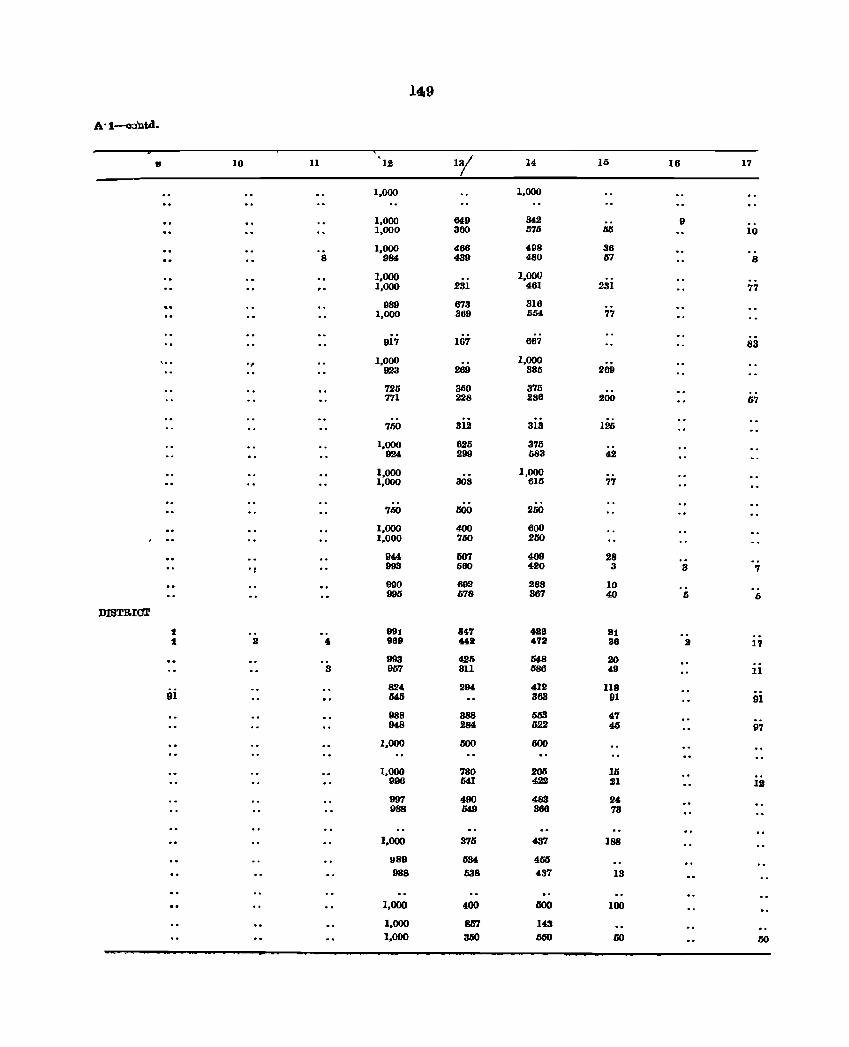
1"9
A ·1-O:l'Dtd.
" 10 11 lJI ly 14 15 16 17
1,000 1,000
1,000 649 342 9 1,000 360 570 05 10
1,000 466 498 36 8 984 439 480 57 8
1,000 1,000 1,000 231 461 231 77
989 673 816 1,000 869 554 77
917 167 667 83
" 1,000 1,000 923 269 885 269
725 850 375 771 228 286 200 57
750 812 318 125
1,000 625 375 924 299 683 42
1,000 1,000 1,000 308 615 77
7150 ISOO 250
1,000 400 600 1,000 750 250
944 1S07 409 28 993 560 420 3 3 7
990 692 288 10 995 678 867 40 5 5
DISTRICT
t .. 991 147 488 81 .. t 8 • 969 .48 472 88 2 17
993 425 548 20 3 957 311 lI86 49 11
oi 824 294 412 118 545 363 91 91
988 388 558 47 948 284 022 45 97
1,000 500 500
1,000 780 205 15 996 541 4.22 21 12
997 490 483 24 988 549 366 73
1,000 375 487 188
989 534 4liD 1188 538 437 13
1,000 400 500 100
1,000 857 143 1,000 350 550 50 50
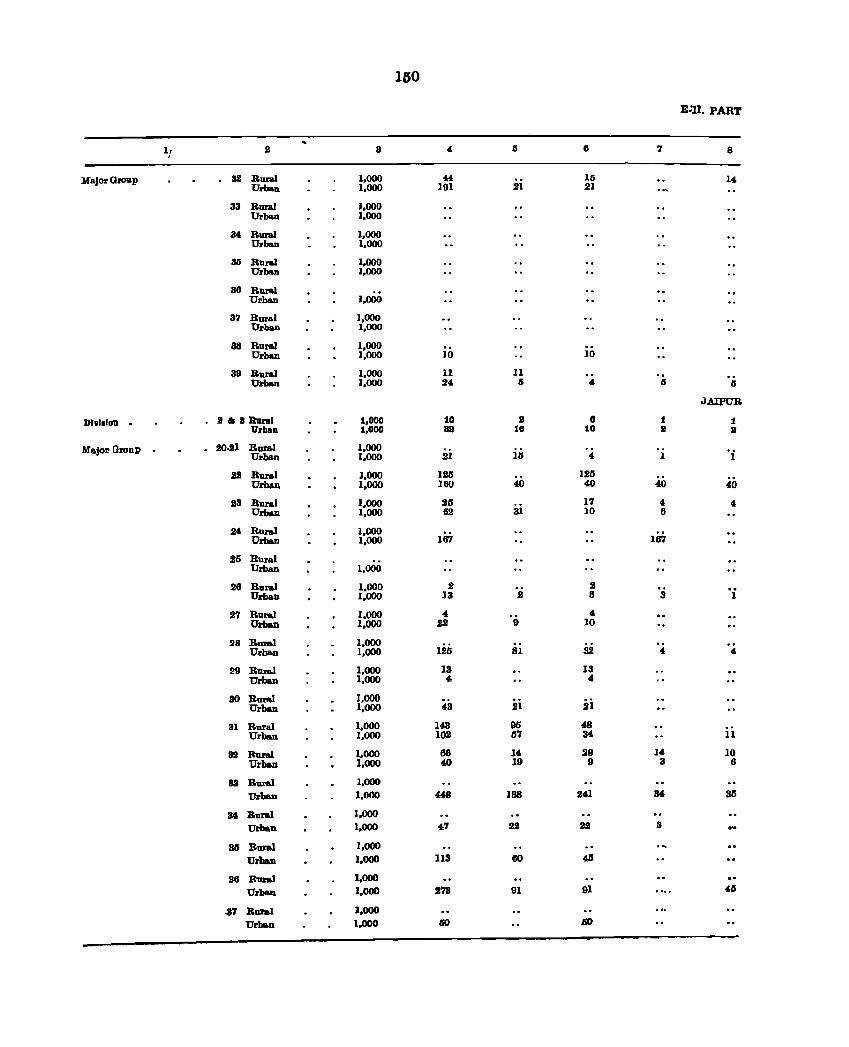
150
E~ll. PART
If 2 3 4 5 6 7 8
Major Group 32 Rmal 1,000 44 15 14 Urban 1,000 ]91 21 21
33 Rural 1,000 Urban 1,000
3" Rural 1,000 Urban 1,000
35 Rural 1,000 Urban 1,000
36 Rural Urban 1,000
37 Rural 1,000 Urban 1,000
38 Rural 1,000 Urban 1,000 10 10
39 Rural 1,000 11 11 Ul'ban 1,000 24 5 4 5 5
JAlfUR
DI,'.'on . 8 .. a Rural 1,000 10 8 8 1 1 Urban 1,000 82 111 10 II II
Major Gronp . 2{).21 Rural 1,000 Urban 1,000 21 15 4 1 1
22 Rural ],000 125 125 Urban 1,000 160 40 40 40 40
23 Rural 1,000 25 17 4 4 Urban 1,000 62 31 10 6
24 Rural 1,000 Urban 1,000 167 167
25 Rural Urban 1,000
26 Rural 1,000 2 2 Urban 1,000 13 2 6 3 °i
27 Rural 1,000 " '0 " Urban 1,000 22 10
28 Ruml 1,000 .. Urban 1,000 125 81 32 4 4
29 Rural 1,000 13 13 Urban 1,000 " 4
30 Rural 1.000 Urban 1,000 43 21 21
31 Rural 1,000 143 95 48 Urban 1,000 102 57 34 11
S2 Rural 1,000 86 14 28 14 10 Urban 1,000 40 19 9 3 6
sa Rural 1.000
Urban 1.000 448 138 241 34 35
34 Rural 1,000
Urban 1,000 47 22 as 8
38 Rural 1,000
Urban 1,000 113 60 4JS
36 Rural 1,000
Urban 1,000 278 91 91 45
!J7 Rural 1,000
Urban 1,000 50 Jj()
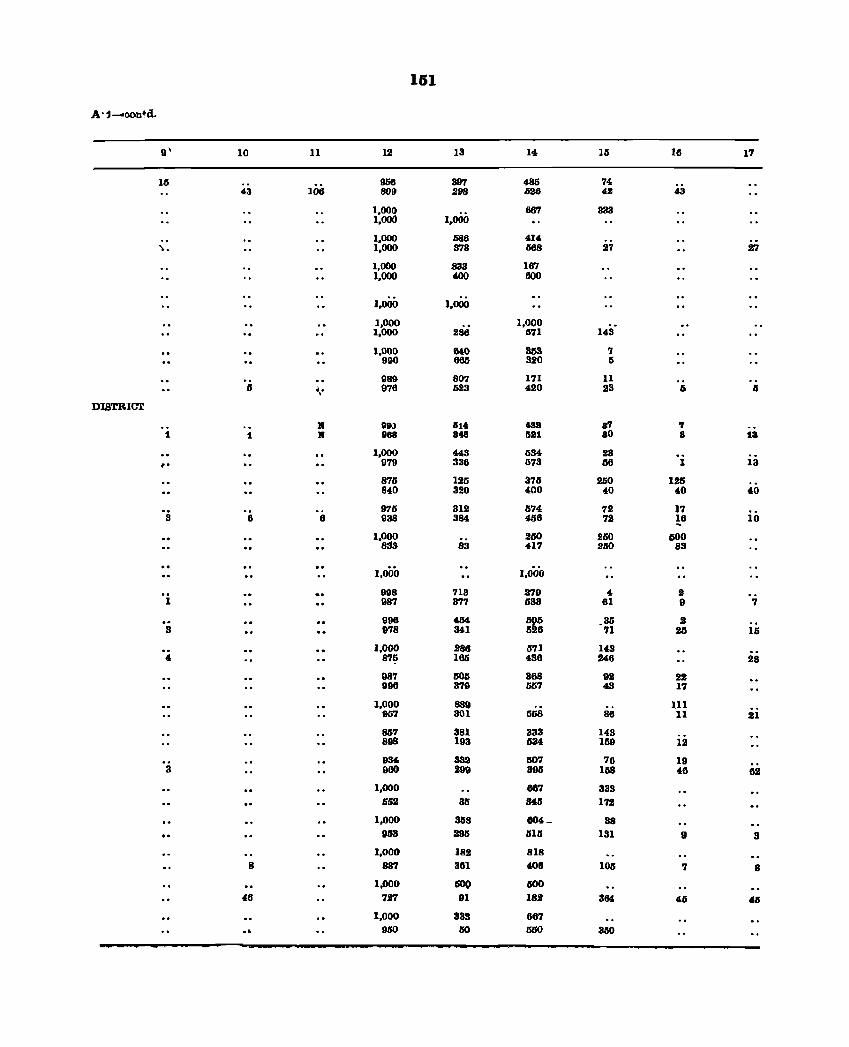
151
A·1-ooutd.
9' 10 11 12 13 14 15 16 17
15 100
956 397 4-85 74 43 809 298 626 42 43
1,000 1,000
667 333 I,OOd
1,000 586 414 .... 1,000 378 668 27 27
1,000 833 187 1,000 400 000
1,000 1,000
1,000 1,000 1,000 286 671 143
1,000 MO 353 ., 990 665 320 6
989 807 171 11 5 .,' 976 523 420 23 I; II
DISTRI<Yr
• 99l IIt4 43S a't ., 1 1 • 988 848 liS1 80 8 18
1,000 443 534 23 ., 979 336 573 56 1 13
875 125 375 250 126 840 320 400 40 40 40
.. 975 312 574 72 17 3 6 6 938 384 456 72 16 10
1,000 250 250 600 8S3 83 417 21i0 83
1,000 1,000
998 713 279 4 2 1 987 377 533 61 9 '1
996 4M :g~ .35 .2 8 978 34-1 11 25 15
1,000 286 671 143 4 87~ 165 436 246 28
987 605 368 92 22 996 379 657 43 17
1,000 889 111 967 301 558 86 11 21
857 381 333 143 ii 898 193 534 169
934 3aa MY1 76 19 3 980 299 395 158 46 62
1,000 667 333 552 36 34,5 17S
1,000 358 1104 - 38 "3 295 515 131 9 3
1,000 182 818 8 887 361 406 105 7 8
1,000 500 500 46 '127 91 182 3& 45 lIS
1,000 833 667 .. 950 50 550 350
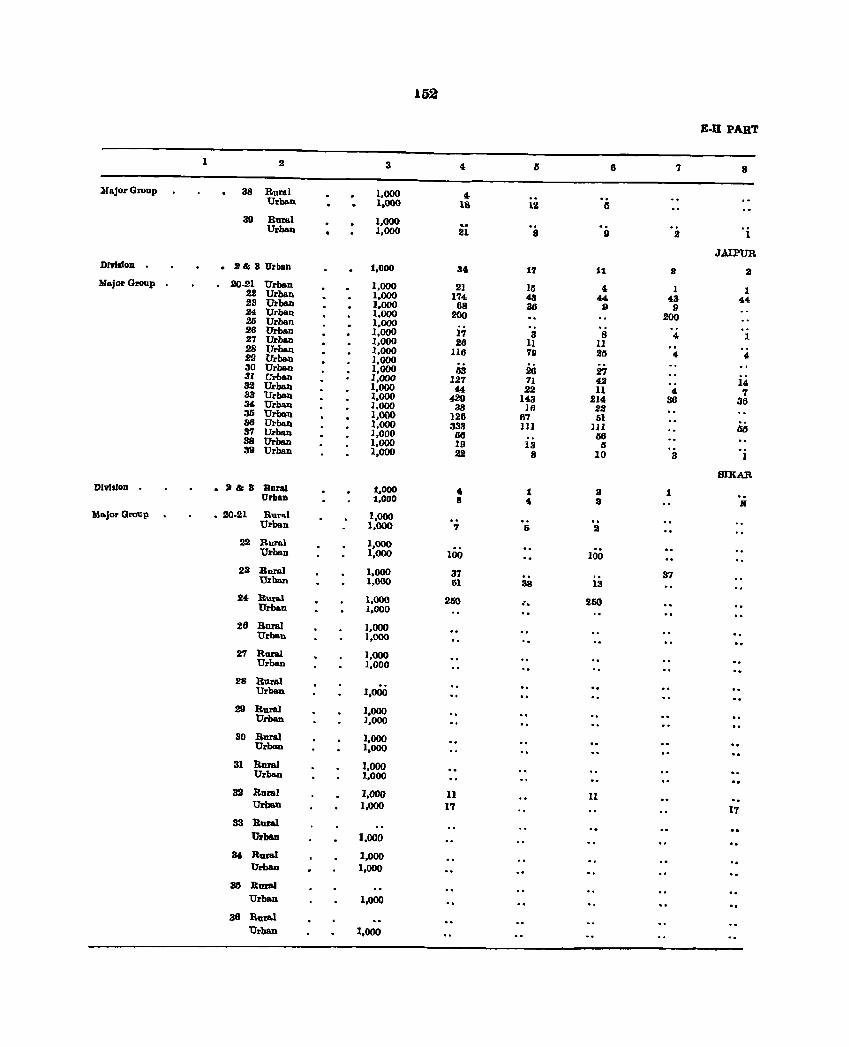
162
E-n PART
1 2 3 4 15 II 7 8
Major Groop 38 Roral 1,000 4 Urban 1,000 18 1Z 5
30 Rural 1.000 ... 'i Urban 1,000 21 8 g 2
JAIPUR DIvision . :I &; 8 Urban 1,000 3 • 17 it 2 a MajorGroop 20-21 Urban 1,000 21 15 4 1 1 22 Urban 1,000 174 43 44 43 44 23 Urban 1.000 68 36 9 9 24 Urban 1.000 200 200 2li Urban 1.000
26 Urban 1,000 17 3 8 4 1 27 Urban 1,000 26 11 11 28 Urban 1,000 116 79 211 4 4 29 Urban 1,000 30 Urban 1,000 63 26 27 31 Urban 1,000 127 7I 4.2 14 32 Urban 1,000 44 22 11 4 7 33 Urban 1,000 420 143 214 36 36 34 Urb:m ].000 38 HI 22 35 Urlmtl 1,000 126 67 51
M 36 Urban 1,000 333 III ]Jl 37 Urban 1,000 66 66 38 Urban 1,000 19 18 5 3D Urban 1,000 22 8 10 3 1
SlKAR DlvlsIoD • lJ &; 3 Rural 1,000 • 1 a 1 Urban 1,000 8 • a II' 'M&jo~ Group • 20-21 Rurd 1,000 .. Urban 1,000 7 6 fa
22 Rural 1,000 100 Urban 1,000 100
23 Rural 1,000 37 37 Urban 1,000 51 38 13
24 Rural 1,000 2150 l. 260 Urban ],000
26 Rur&l 1,000 Urban 1,000
27 Rural 1,000 Urban 1,000
28 Rural Urban 1,000
29 Rural 1,000 Urban 1,000
30 Rural 1,000 Urban 1,000
31 Rur&l 1,000 Urban 1,000
32 Ruml 1,000 II II Urban 1,000 17 17
33 Rural Urban 1,000
34 RuraJ 1,000 Urban 1,000
311 Rural Urban 1.000
36 Rural Urban 1,000
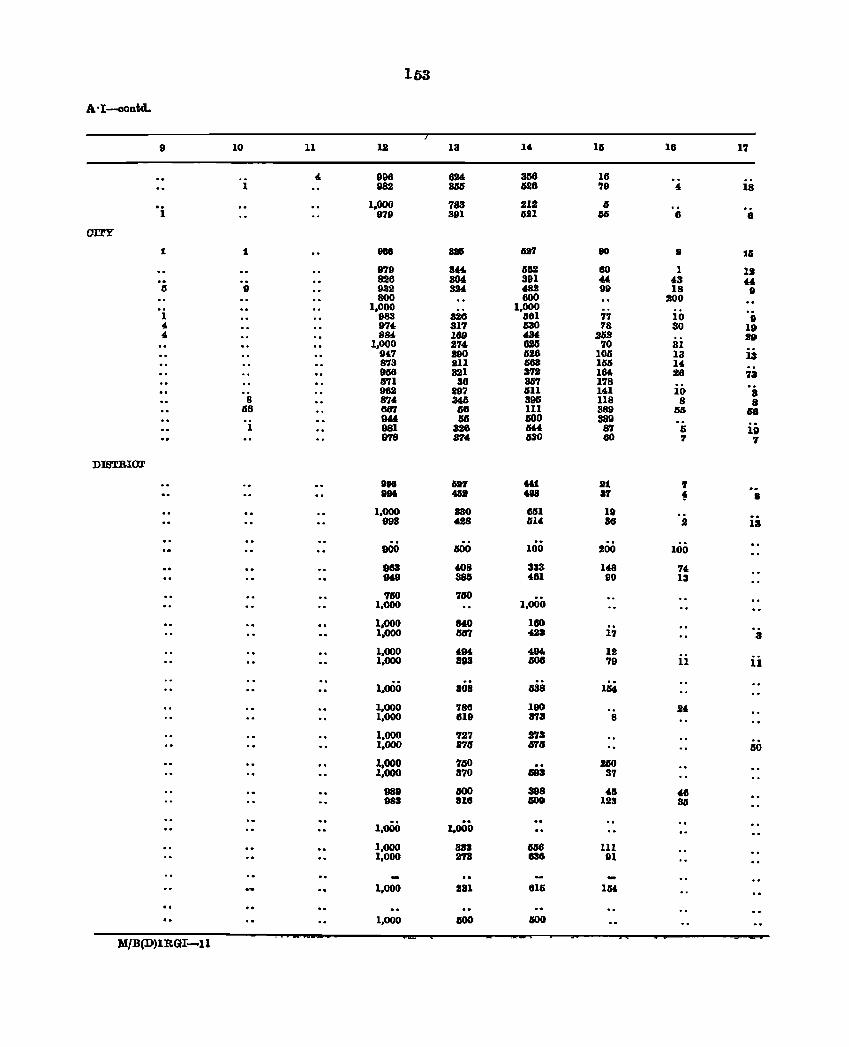
153
A'I-CODtd.
9 10 11 12 13 14 16 18 17
~ 996 624 3GB 16 1 1182 3S6 .528 79 4 18
.. 1,000 783 JIJ Ii 1 979 391 621 GG 8 8
OrrY
1 1 988 83& 6l1'l 10 8 16
979 IK4. 6112 80 1 11 .. 826 30' 391 44 43 44 5 9 932 324 482 99 18 9
800 600 200 1,000 1,000
1 983 328 561 77 10 9 4- 974 31'1 530 78 80 19 4- 884 169 434 252 ltO
1,000 27' U5 70 31 947 290 528 105 13 13 873 III 663 165 14 958 321 372 184 26 73 5'71 36 357 178 962 297 611 141 10 3
8 874 M3 396 118 8 8 0116 667 0118 111 389 65 18
OM lII5 BOO SS9 1 981 326 Ii44 87 I) ig
8'18 374 01130 60 7 '1
DIBTRIOT
1198 IIH "1 21 7 .. 881 4&B 6U 87 ~ 8
1,000 330 ClDI 18 098 428 614 36 2 ii .. .. .,
800 ISOO 100 200 100
963 408 333 148 7' 949 386 481 90 13
70lI0 70lI0 1,000 1,000
1,000 MD 100 .. 1.000 1RS7 423 17 3
1.000 4tH 4tH 12 1,000 393 606 79 11 ii
1,000 308 538 IN
1,000 786 190 2' 1,000 819 373 8
1,000 727 273 1,000 37tS 575 50
1,000 7BO .. 1110 1,000 370 593 37
989 600 398 45 48 98S SIll 500 123 35
1,000 '0
1,000
1,000 ass IRI6 111 1,000 278 888 III
1,000 1181 8Ui 1M
1,000 600 100
:M/B(D)IRQI-ll
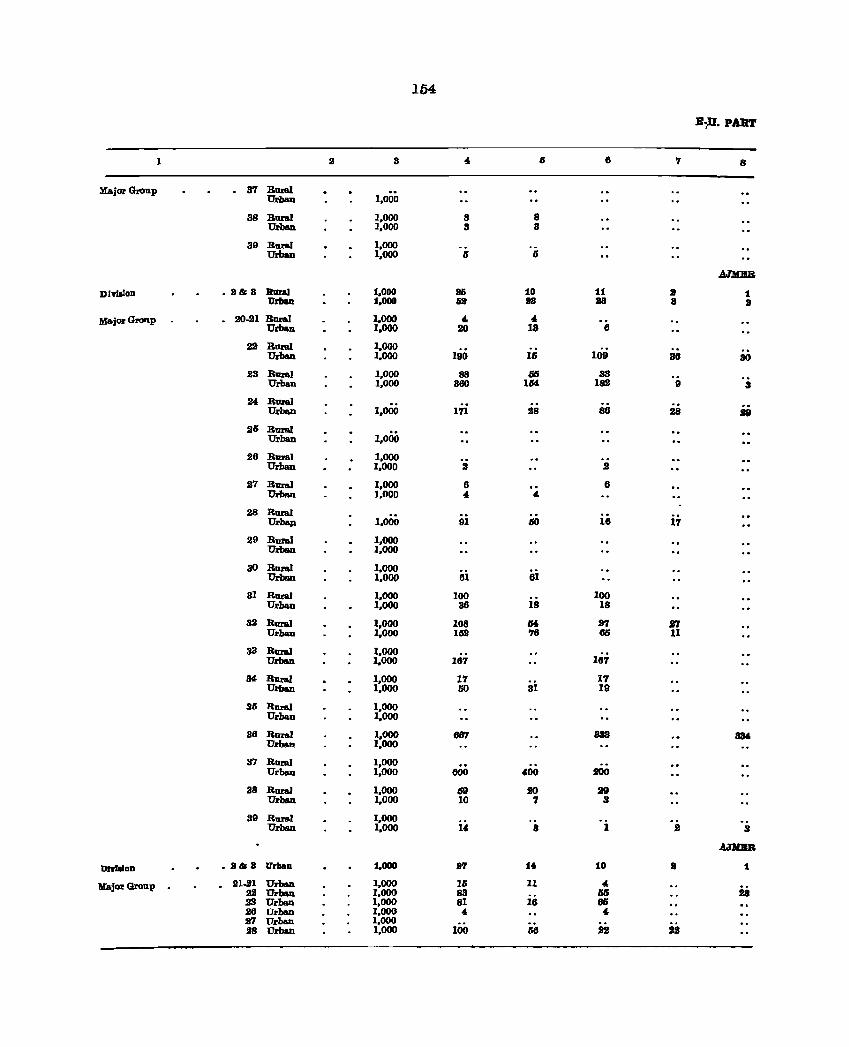
164
.E~n. PART
1 2 3 4 6 8 7 8
Major Group 31 R'IU.'IIJ Urban 1,000
38 Rural 1,000 8 8 Urban 1,000 3 3
39 Rural 1,000 Urban 1,000 5 IS
AJMEB
DlvIBIDn .2&8 Baral 1.000 26 10 11 2 1 lJ'rlllm 1.000 62 88 38 8 3
MajOl' <honp 20.21 Rural 1.000 4- 4. ·iI Urban 1.000 20 13
22 Rural 1.000 Urban 1,000 190 lIS 109 38 30
23 Rural 1,000 88 6lS aa Urban 1.000 360 1M 182 9 3
24 R1II6l Urban 1,000 171 28 88 28 29
26 R'IU.'IIJ 1.000 Urban
26 Rur&] 1,000 Urban 1.000 2 2
27 Rum) 1.000 6 8 Urban 1,000 4. 4.
.28 Rur&] 1,000 UrbaJl 91 ISO 18 17
29 Rural 1.000 Urban 1,000
30 Rural 1,000 isi Urban 1.000 81
31 R'IU.'IIJ 1,000 100 100 Urban 1.000 38 18 18
32 Rural 1,000 108 /SA 27 111 Urban 1.000 15Jl 76 6IS 11
33 Rural 1.000 167 Urban 1.000 187
34 Rural 1.000 17 17 Urban 1.000 50 31 19
35 Rnral 1.000 Urban 1.000
36 Rum} 1.000 667 833 3M Urban 1,000
37 Rnral 1.000 Urban 1.000 600 400 JOe)
38 R1I1'&.I 1.000 IS9 20 29 Urban 1,000 10 7 3
39 R1Jl'IlI 1,000 Urban 1.000 14 8 1 2 3
A.JJrIBB
DI'fIalDn .3&8 Urban 1,000 27 14 10 8 1
VajorGroup 21.21 Urban 1,000 IS 11 4. ii 22 Urban 1,000 83 ISS
23 Urban 1,000 81 16 6IS 26 Urban 1,000 4 4. 27 Urban 1,000 28 Urban 1,000 100 68 n JI
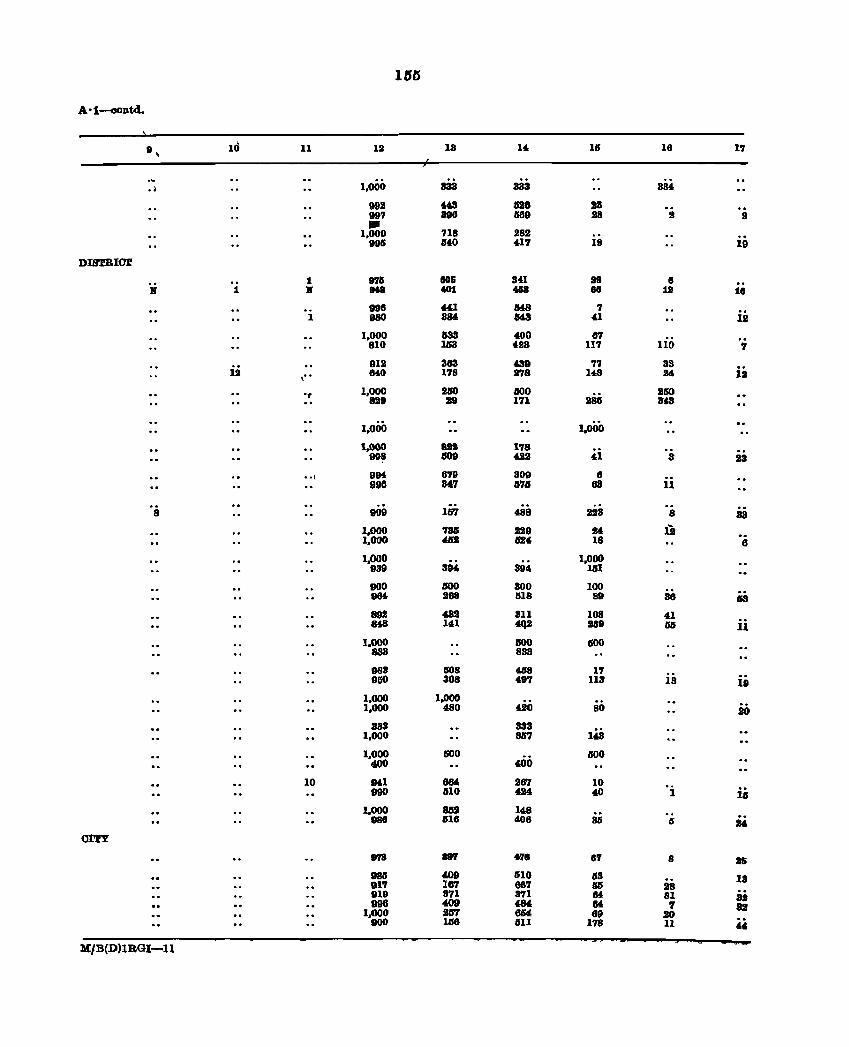
IlJ5
A ·1--OODtcl.
8, ui 11 12 13 14, 15 18 17
.j 1,000 333 333 334,
992 fod 328 518 897 898 189 S8 S I ..
1,000 718 S8S 896 5~ 4,17 18 19
DlSTBlor
1 87& 80& 341 H 8 11 1 11 M8 to1 4&8 88 19 111
998 4.4.1 M8 7 1 980 884, M3 41 12
1,000 ass 400 87 810 1&3 4,23 117 110 7
912 388 ~8 7'1 33 iii 12 ," 4UO 178 J'78 148 24
.~ 1,000 UO 800 150 828 28 171 288 3D
1,000 1,000
1,000 lIB 178 89~ IS09 4J2 4,1 3 23
.. , 994 679 309 8 9911 847 1S7li 63 11
8 909 157 488 223 8 88
1,000 733 229 M IS 1.000 4lJ2 4S24 18 8
1,000 1,000 939 3N 394 181
900 800 300 100 884 288 518 88 36 G8
89J 43S 311 108 41 848 141 4,Q:I 239 58 ii
1,000 IlOO 600 833 833
983 IS08 488 17 8150 368 497 113 13 ii
1.000 1,000 1,000 480 420 80 20
383 383 1,000 887 143
1,000 1100 600 4.00 ~O
10 IHI 864 267 10 980 ISI0 4M 40 1 18
1,000 aM 148 088 516 406 35 6 24
OITY
8'18 387 fill 87 8 as 98Ij 409 610 ISS 13 01'1 lel'l 667 IS& 28 019 371 371 84 81 as 898 409 484 84 7 n 1.000 257 8IS4 69 20 000 156 511 178 11 "
K/B(D)lBGI-ll
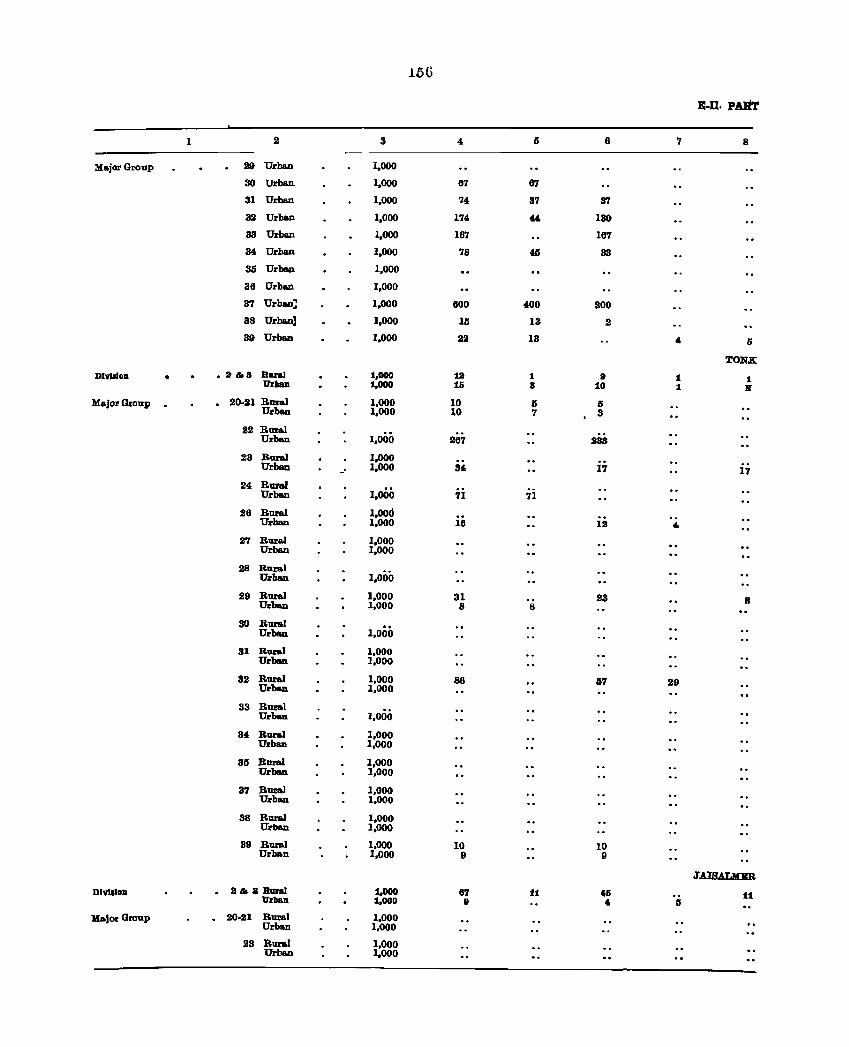
15G
B-D. PART
1 2 3 4 IS 6 7 8
Major Group 29 Urban 1,000
30 Urban 1,000 67 67
31 Urban 1,000 74 37 In
32 Urban 1,000 174 44 130
33 Urban 1,000 167 167
34 Urban 1,000 78 45 33
35 Urban 1,000
36 Urban 1,000
37 Urban~ 1,000 600 400 200
38 Urban] 1,000 15 13 2
39 Urban 1,000 22 13 4 Ii
TONK
DIYlalOD • .» &8 Rural 1,000 1a 1 9 1 1 Urban 1,000 15 8 10 1 If
Major Group . 20-21 Rural 1,000 10 I) I) Urban 1,000 10 7 3
22 Rur&! Urban 1,000 267 233
23 Rural 1,000 Urban .' 1,000 34 17 17
24 Rural 1,000 Urban 71 71
26 Rural 1,00d Urban 1,000 16 12 4
27 Rural 1,000 Urban 1,000
28 Rural 1,000 Urban
29 Rural 1,000 31 23 8 Urban 1,000 8 8
30 Rural 1,000 Urban
31 Rural 1,000 Urban 1,000
32 Rural 1,000 86 17 29 Urban 1,000
33 Rural 1,000 Urban
34 Rural 1,000 Urban 1,000
35 Rural 1,000 Urban 1,000
37 Rural 1,000 Urban 1,000
38 Rur&! 1,000 Urban 1,000
39 RDrIIoI 1,000 10 10 Urban 1,000 9 9
JAmuMBR
DIYIIIOD a & a Rural 1,000 87 11 16 11 Vrllan 1.000 8 • IS
Hajor Group . 20-21 Rural 1,000 Urban 1,000
23 Rural 1,000 Urban 1,000
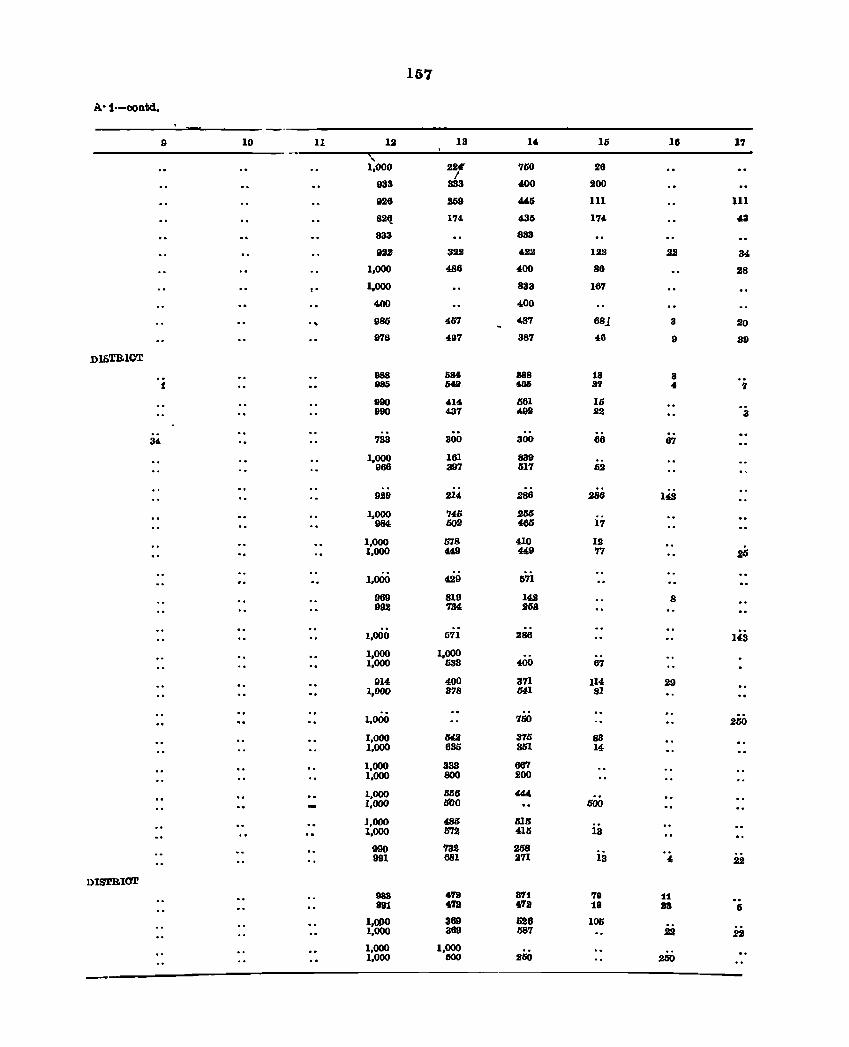
157
A·t--contd.
9 10 11 12 13 14 15 18 17
1,000 224' 760 28 /
933 333 400 200
926 259 44,6 III III
82Q 174 435 174 43
833 833
9m1 322 422 122 22 34
1,000 486 400 86 28
,. 1,000 833 167
400 400
98G 457 487 68j 3 20
978 497 387 46 9 39
DlEiTRlCT
888 5M 888 18 8 1 INI6 H2 40D 37 • 'I
990 414 061 10 990 437 4.IIB ~B 3
34 733 300 300 66 6'1
1,000 161 839 966 397 517 Ii2
929 214 .286 .286 143
1,000 745 .255 984 DOlt 466 1'1
1,000 5'18 410 12 1,000 449 449 77 26
1,000 429 571
969 819 142 8 992 '134 268
1,000 671 286 143
1,000 1,000 1,000 533 400 67
914 400 371 I14 29 1,000 378 Ml 81
1,000 760 260
1,000 642 376 83 1,000 636 351 14
1,000 333 667 1,000 SOO 200
1,000 556 44.4 1,000 1itJ0 600
1,000 486 515 1,000 W72 411S 13
990 73! 258 991 681 271 13 4 22
DISTRIOT 988 01'19 8'71 '79 11 881 4ft 4'78 18 18 6
1,(1)0 369 528 106 1,000 369 687 22 22 1,000 1,000 1,000 600 2GO 250
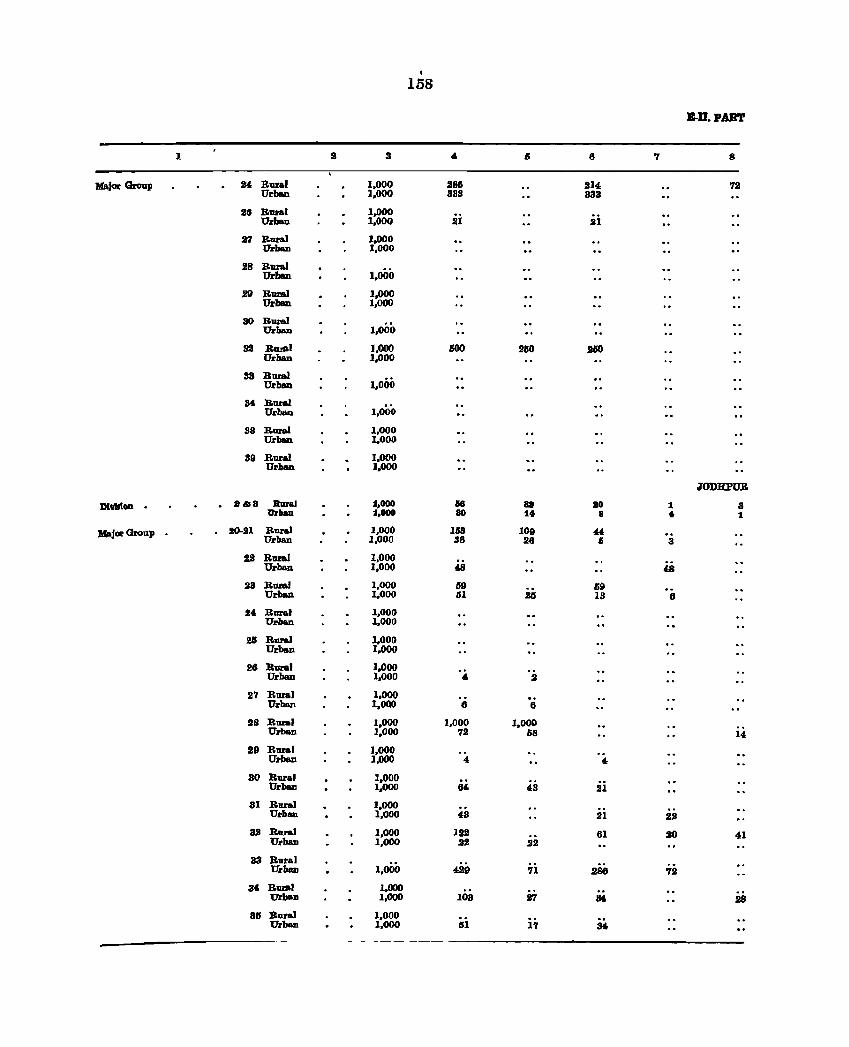
, 158
B-D.PART
1 2 3 4 Ij 8 7 8
MaJor Group Sf, Rural 1,000 286 !l4 72 Urba.n 1,000 883 333
26 Rural 1,000 Urba.n 1,000 21 21
27 Rural 1,000 Ur ..... 1,000
28 Rural Urbm 1,000
29 Rural 1,000 Urba.n 1,000
30 Rural Urban 1,000
32 R_I 1,000 600 260 160 Urban 1,000
83 Rural 1,000 Urban
34 Rural Urban 1,000
S8 Roral 1,000 Urban 1,000
39 Rural 1,000 Urban 1,000
J'ODHPUB
mvlllon . . a&a BuRl :a,ooD 18 aa 80 1 8 UI'IIan :a,00D 80 :at • t 1
Major Group 20-21 Rural 1,000 153 109 44, Urban 1,000 38 26 lS 3
D Rural 1,000 Urba.n 1,000 48 48
23 Roral 1,000 tiD 59 Urban 1,000 til 26 13 8
24 Rural 1,000 Ur ..... 1,000
~ Rural 1,000 Urban 1,000
26 Rural 1,000 ., Urban 1,000 2
27 Rural 1,000 Urban 1,000 8 6
28 Rural 1,000 1,000 1,000 Urban 1,000 72 58 14
29 Rural 1,000 UrblloD 1,000 4 4
30 Bural 1,000 Urba.n 1,000 64 43 21
81 Rural 1,000 Ul'blUl 1,000 43 21 22
82 Rural 1,000 122 61 20 41 UrblloD 1,000 22 22
83 Rural 1,000 UrblloD 429 71 .288 72
3C Rural 1,000 Urban 1,000 103 27 84 28
81 Rural 1,000 Ul'bIIoD 1,000 81 17 34
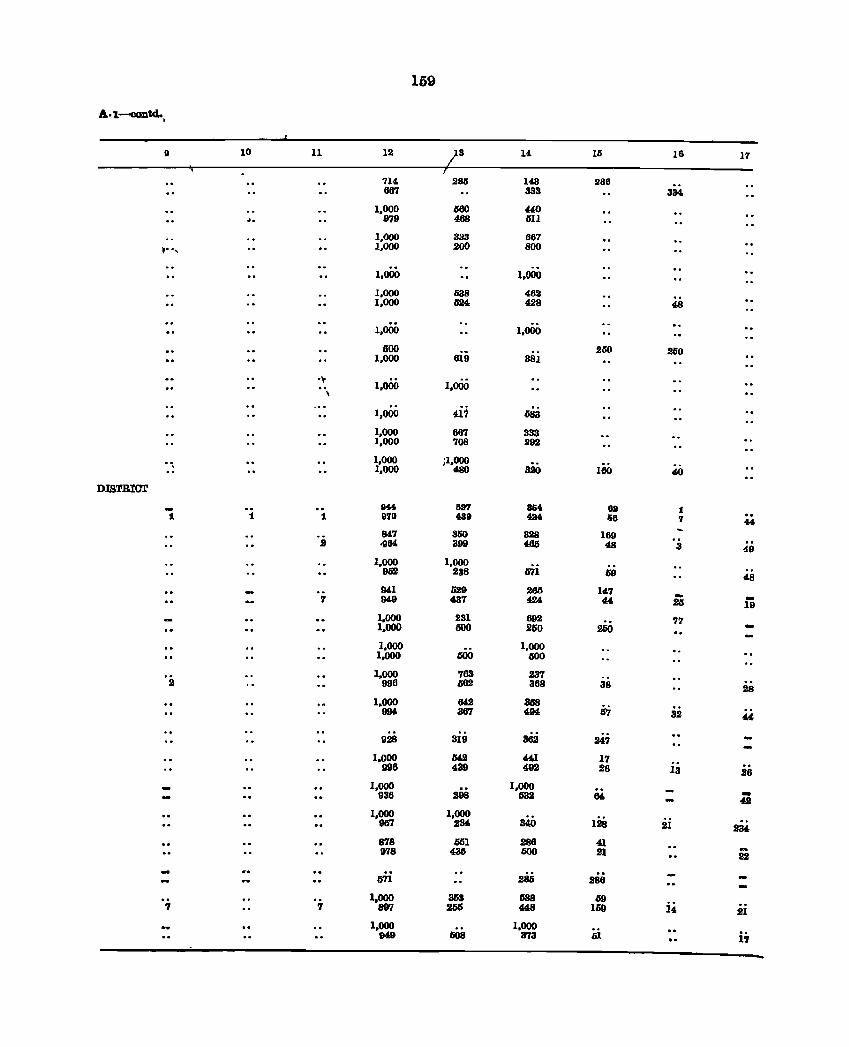
169
A.l~tKI.,
D 10 11 12 )3 J
14 15 16 17
'114- 285 143 286 667 333 334
1.000 660 440 ~. 979 468 611
1,000 383 667 ., . .. , 1,000 200 800
1,000 1,000
1,000 638 462 1.000 624 428 48
1.000 1.000
600 6ig
250 260 1,000 381
''f 1,000 1.000 .\
1,000 4i1 683
1.000 667 333 1.000 708 292
1.000 jl,ooo 320 1.000 480 160 40
DISTBIor
941 8a7 86. 6a :I 1 1 1 970 488 4H 56 7 M
84.7 300 328 169 S ·964 399 463 48 3 49
1.000 1.000 962 238 671 69 48 941 629 265 147
'1 949 437 4.24 44. i3 -19 1.000 231 692 " '17 1.000 600 260 260
1,000 1,000 1.000 liOO 400
'2 1,000 763 237
996 662 368 38 28 1.000 M2 308
57 1194 367 494 32 4.4
928 3iB a62 247
1.000 M9 4.41 17 996 4.39 4.92 26 13 26
1,000 1.000 -936 298 632 64. 42 1.000 1.000
128 9S7 234. 340 21 234. 878 661 286 41 -978 436 600 21 22
671 286 286
1,000 363 G88 69 i4 '1 '1 89'l 266 44.8 159 21
1.000 1,000 iii i7 949 608 373
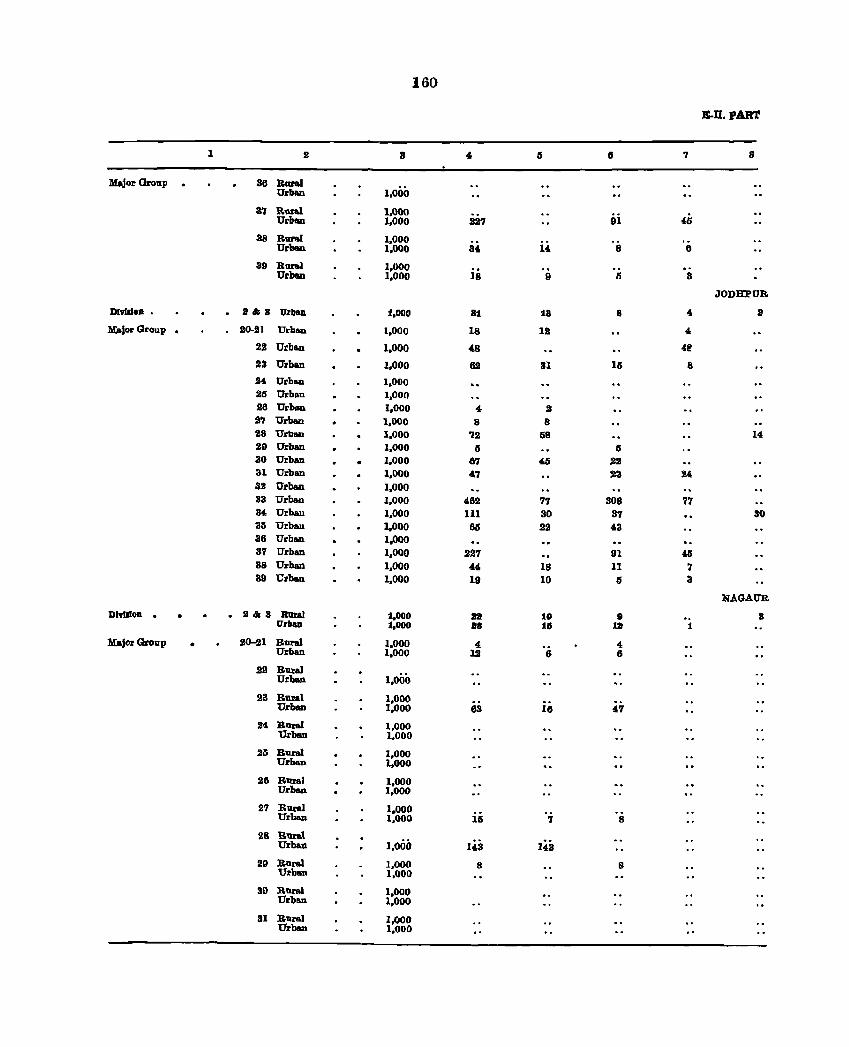
160
B-n. PART
1 2 3 4 15 6 7 8
Major Group 36 Rural 1,000 Urban
31 Booml 1.<100 Iii Urban 1,000 227 'D
38 Rural 1,000 Urban 1,000 34 14 8 8
39 Rural 1,000 Urban 1,000 18 9 II 3
JODHPUR
DlvldoD • II&B U'lblUl 1.000 81 18 8 4 I
MIlior Group • 20-111 Urban 1,000 18 12 4
22 Urba.n 1,000 48 41!
23 Urba.n 1.000 62 31 11 8
24 Urban 1,000 25 Urban 1,000 26 Urban 1,000 4 2 2'7 Urban 1,000 8 8 28 Urban 1,000 '12 68 14 29 Urban 1,000 6 5 30 Urban 1.000 87 45 22 31 Urban 1.000 47 23 24 32 Urban 1.000 33 Urban 1.000 462 77 308 77 34 Urban 1,000 III 30 37 30 35 Urb_ 1.000 65 22 43 36 Urban 1,000 37 Urban 1.000 227 91 " 88 Urban 1,000 44 18 11 7 89 Urban 1.000 19 10 IS 3
NAGAUR.
DI'l'lJloD. . • . 11&3 Rural 1,000 a2 10 9 .. 3 Urban 1,000 88 16 18 1
Major Group • 20-21 Bural 1.000 4 4 Urban 1.000 12 6 6
22 Rural 1,000 Urban
23 Rural 1,000 iii Urban 1,000 63 47
24 R_I 1,000 Urban 1.000
.25 Rural 1,000 Urban 1.000
26 Rural 1,000 Urban 1,000
27 Bural 1,000 Urban 1,000 15 7 8
28 BlIft.l 1,000 14.3 143 Urban
29 Rural 1,000 8 8 Urban 1,000
30 Rural 1.000 Urban 1,000
31 Rural 1,000 Urban 1,000
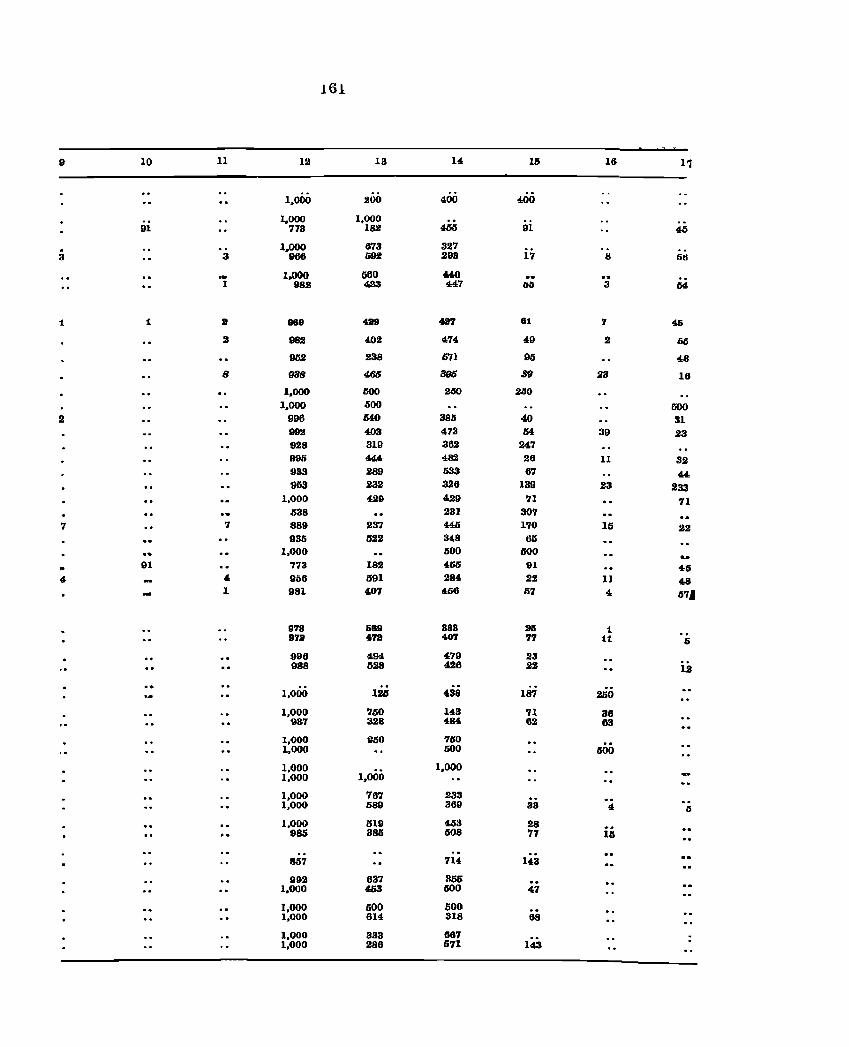
161
9 10 11 12 13 14 115 16 11
1,000 200 400 400
1.000 1,000 91 773 182 465 91 46
. 1.000 673 327 3 3 966 692 293 17 8 511
- 1.000 560 440 .. I 982 423 447 r;{j 3 54
1 1 2 989 429 427 81 7 46
.2 982 402 474 49 2 li(j
952 238 671 95 48
8 988 41J6 8f16 8fI 23 16
1.000 500 250 250
1,000 500 500 .2 996 MO 385 40 31
992 403 473 54 39 23 928 319 362 247 995 '" 482 26 11 32 933 289 033 67 44 903 232 326 139 23 233
1,000 429 429 71 71 538 23) 307
7 7 889 237 445 170 15 22 935 522 348 65
1,000 500 500 ~
91 773 182 455 91 46 4- 4 956 391 284 22 1) 48
1 981 407 456 57 4 571
978 689 888 2& 1 1172 478 407 77 11 &;
996 494 479 23 988 628 426 22 1.2
1,000 125 438 187 250
1,000 750 143 71 36 937 328 484 62 63
1,000 1:50 760 1,000 500 500
1,000 1.000 1,000 1,000
1,000 767 233 1,000 589 369 33 4 5
1,000 519 453 28 ii; 986 385 508 77
857 714 143
992 637 355 1,000 453 600 47
1,000 500 500 1,000 614 318 68
1,000 333 667 1,000 286 571 143
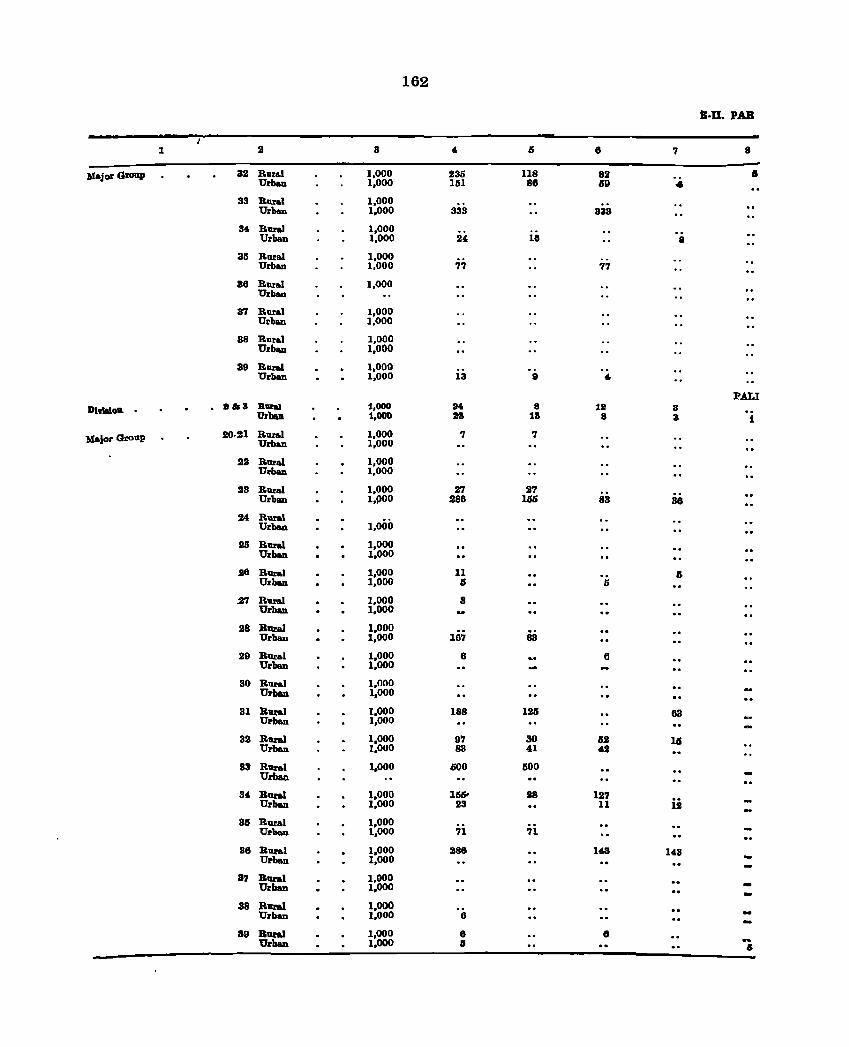
162
s·u. PAR
1 2 3 4 l5 6 '1 8
Major Gzoup 32 Raral 1,000 235 118 82 .. Urban 1,000 151 86 69 ..
33 RDI'al 1,000 Urban 1,000 333 883
34 RUI'al 1,000 Urban 1,000 24 16 a
35 RDI'M 1,000 Urban 1,000 '1'1 '1'1
86 RDI'al 1,000 Urban
3'1 RDI'al 1,000 Urb&n 1,000
88 RUI'al 1,000 Urb&n 1,000
89 RIlI'al 1,000 Urban 1,000 13 9 "
PALl DI'IIIIoll . . alia R1II'III 1,000 114 8 19 8
Urban 1,000 28 18 8 3 1
Major Group 20·21 Rami 1,000 '1 '1 Urb&n 1,000
22 RUI'M 1,000 Urban 1,000
23 Rural 1,000 2'1 2'1 Urba.n 1,i)OO 286 1150 83 36
M Rum' 1,000 Urban
25 RUI'M 1,000 Urban 1,000
26 Rural 1,000 11 .. Urban 1,000 I) 5
"'1 Rural 1,000 8 Urban 1,000
28 RURl 1,000 00
Urban 1,000 16'1 83
29 Rural 1,000 6 6 Urban 1,000
30 Rami 1,000 Urban 1,000
31 R1I1'&1 1,000 188 125 68 Urban 1,000
32 Rural 1,000 9'1 30 U 11 Urban 1,000 83 41 4..
88 R1I1'&1 Urban
1,000 600 500
34 Rural 1,000 155- 18 127 ii Urban 1,000 23 11
35 Rural 1,000 Ulrban 1,000 71 '11
86 R1II'&1 1,000 Urban 1,000
288 14.3 148
3'1 Rural 1,000 Urban 1,000
38 Rural 1,000 Urban 1,000 6
39 B1I1'aI 1,000 8 0 Urban 1,000 15 ...
15
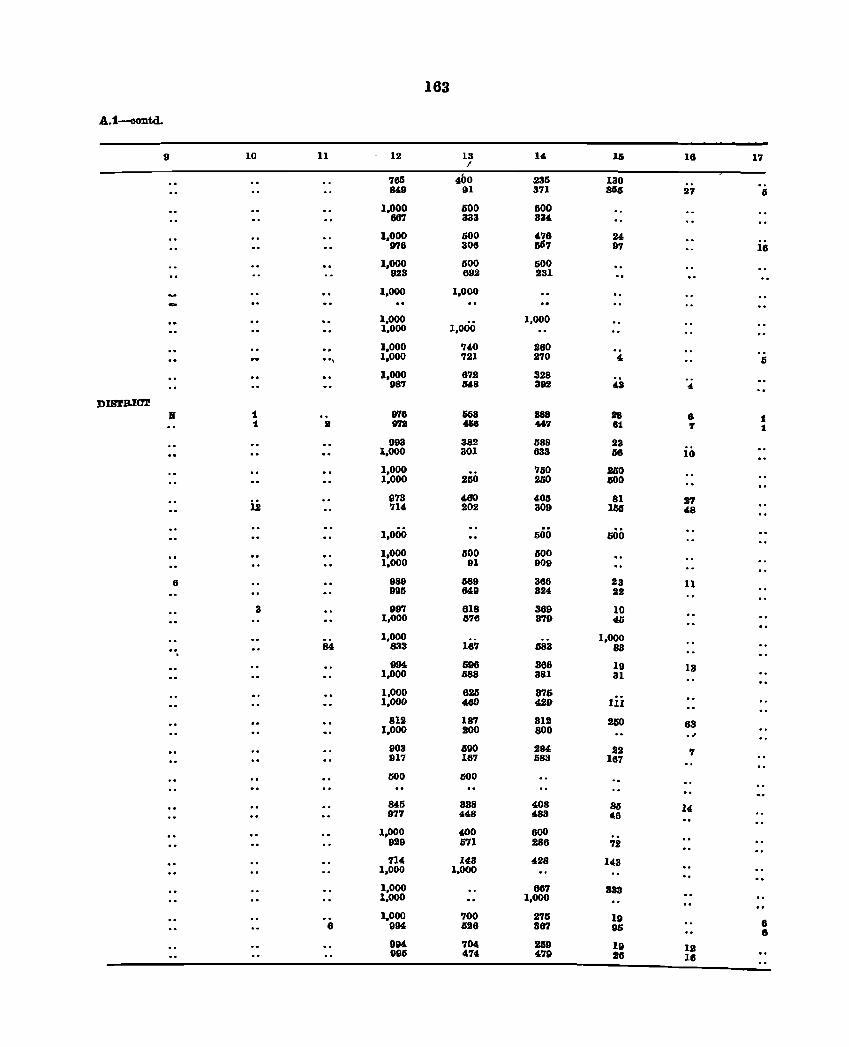
163
A.1~td.
9 10 11 12 13 14 16 16 17 /
760 460 236 130 849 91 3'71 806 27 II
1.000 600 .600 667 333 834
1.000 500 476 24 976 306 61)7 97 16
1.000 600 600 923 692 231
1.000 1.000
1.000 1,000 1.000 1.000
1.000 740 260 .. , 1.000 721 270 , 6
1.000 672 328 .. 987 64-8 392 4S '"
DIS'rRIar 11 1 878 658 888 28 6 1 t a 97lI 4&8 '"7 81 'I 1
993 382 588 23 1.000 301 633 56 10
1.000 760 IISO 1.000 200 200 1100
973 460 406 81 ~ 12 714 202 309 166 48
1.000 600 000 1,000 600 .600 1.000 91 909
6 989 689 366 23 11 995 649 324 22
3 997 618 369 10 1.000 576 379 ~
1,000 1.000 84 833 187 583 83
994 696 366 19 13 1.000 588 381 31
1,000 626 376 Iii 1.000 460 429
812 187 312 IISO 63 1,000 200 800 .J'
903 590 284 22 '7 91'7 16'7 1i83 167
500 000
846 338 408 85 14 977 448 483 46
1.000 400 600 .. 929 671 286 72
714 143 428 143 1.000 1,000
1,000 687 333 1.000 1.000
1.000 700 2711 19 6 8 994 626 867 95 8 994 704 SlID 19 IS 995 474 479 26 16
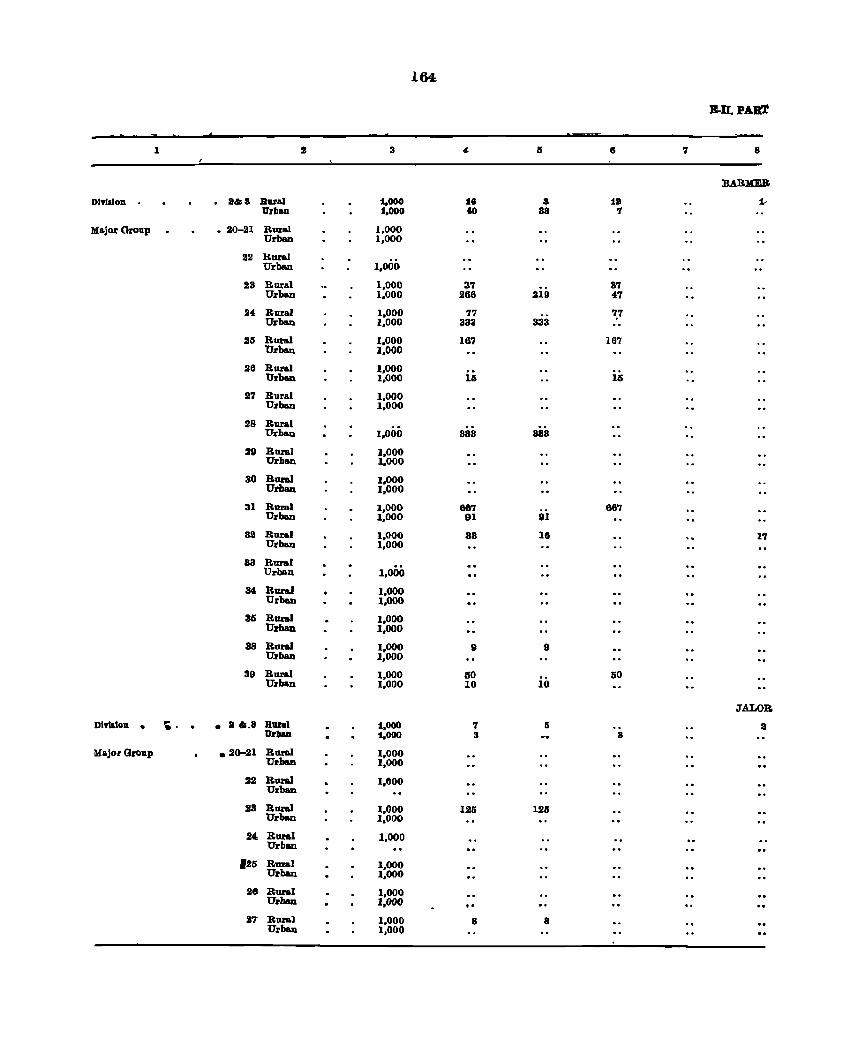
164
B-n. PARr
1 , 3 15 6 7 8
B.ARMEB
DIYllioll . lI&a Bural 1,000 18 a 151 1-'U'rllaD 1,000 60 88 7
Major Group • 20-21 Rural 1,000 Urban 1,000
22 Rural Urban 1,000
23 Rural 1,000 37 37 Urban 1,000 266 219 47
24 Rural 1,000 77 7,7 Urban 1,000 3311 333
25 Rural 1,000 167 167 Urban 1,000
26 Rural 1,000 Urban 1,000 15 16
27 Rural 1,000 Urban 1,000
28 Rural Urban 1,000 833 883
29 Rural 1,000 Urban 1,000
30 Rural 1,000 Urban 1,000
31 Rural 1,000 667 887 Urban 1,000 91 91
32 Rural 1,000 38 18 1'1 Urban 1,000
83 RUl'al Urball 1,000
34 RuraJ 1,000 Urban 1,000
315 Rural 1,000 Urban 1,000
38 Rural 1,000 9 " Urban 1,000
39 Rural 1,000 60 60 Urball 1,000 10 10
JALOB
DIYlalon . .. • 11 •• 8 Ruml 1.000 '1 5 II .. 'U'rllaD 1,000 3 3
Major Group .20-21 Rural 1,000 Urban 1.000
22 Rural 1,600 Urban
23 Rural 1,000 125 125 Urban 1,000
24. Rural 1,000 Urban
125 Rural 1,000 Urban 1,000
28 Rural 1,000 Urban 1.000
27 Rural 1,000 8 8 Urban 1,000
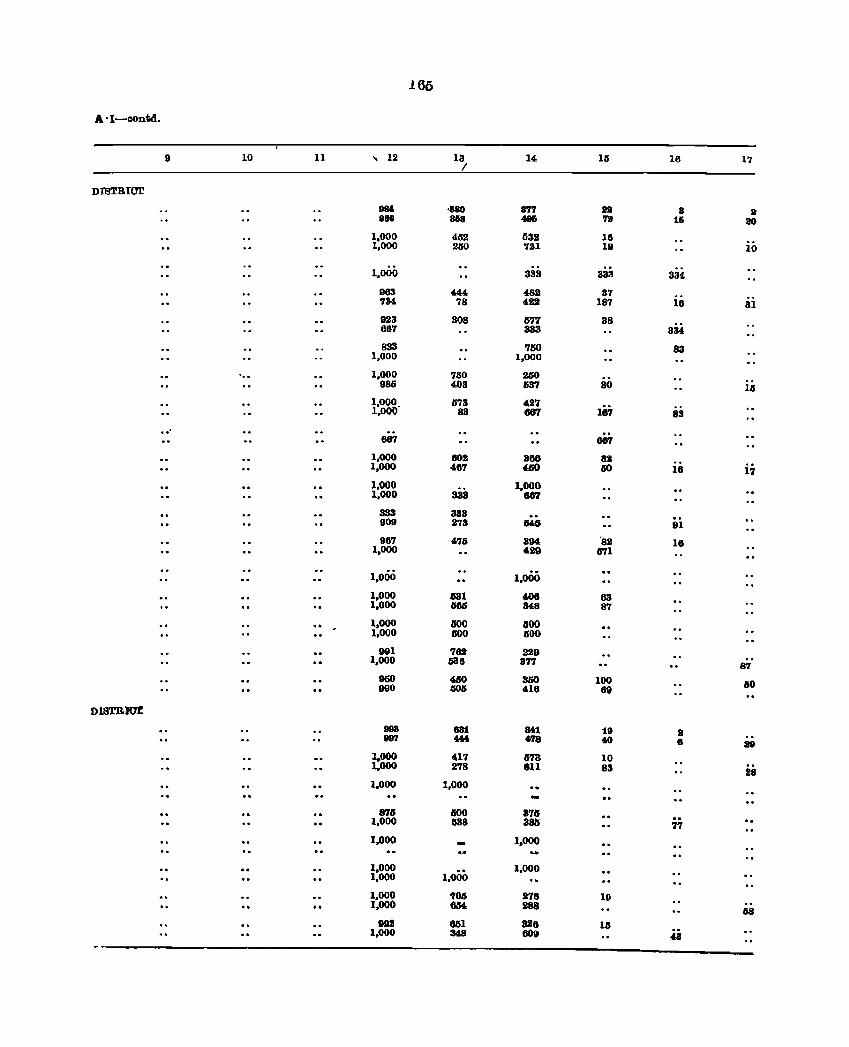
165
A·I-oontd.
9 10 11 , 12 13 14 16 16 17 /
DIBTRIC1r
9U ·680 8'1'1 n a II 880 868 486 'lII 16 ao
1,000 462 532 16 io 1,000 200 '121 19
1,000 333 333 334
963 444 482 37 '134 78 422 187 18 31 923 308 677 38 667 333 334
833 750 83 1,000 1,000
' .. 1,000 760 200 980 403 637 30 16
1,000 673 427 187 1,000- 88 867 83
.. ' 667 68'l
1,000 802 866 82 1,000 467 460 00 16 1'1 1,000 1,000 1,000 333 86'l
333 333 909 278 640 91
967 476 894 '82 16 1,000 429 571
1,000 1,000
1,000 581 ~6 63 1,000 666 348 8'1
1,000 100 GOO 1,000 1100 100
991 762 229 1,000 536 377 87
950 480 350 100 80 990 006 416 69
DlSTBolal
998 881 841 18 l!I 987 444 4'l8 40 8 88
1,000 417 873 10 1,000 278 811 83 28 1,000 1,000
875 500 875 1,000 538 3M 77 1,000 1,000
1,000 1,000
1,000 1,000
1,000 '01 278 19 1,000 634 288
ISS 992 661 828 15
1,000 348 609 43
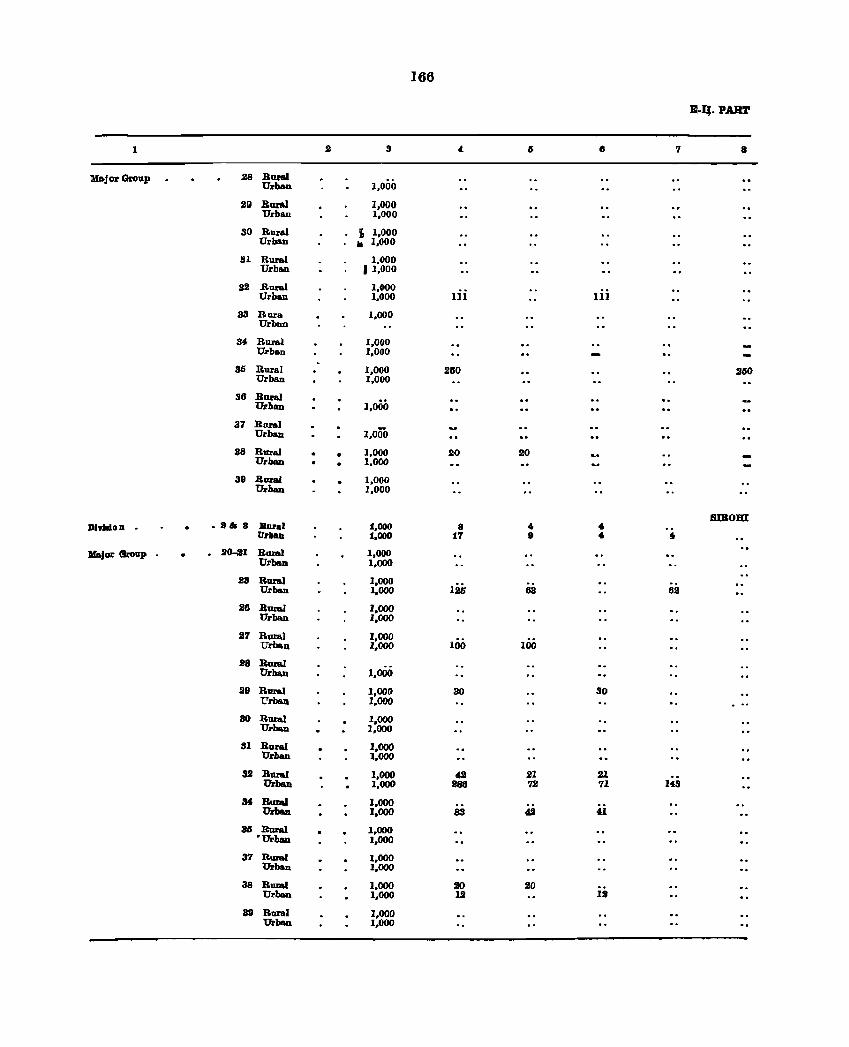
166
B-q. PART
1 2 3 <l 6 6 7 8
MajOl' Group 28 Rural Urban 1,000
29 Rural 1,000 Urban 1,000
30 Rural , 1,000 Urban II 1,000
31 Rural 1,000 Urban I 1,000
32 Rural 1,000 Urban 1,000 III III
a8 Bura 1,000 Urbun
34 Rural 1,000 Urban 1,000
36 Rural 1,000 260 260 Urban 1,000
36 Rural 1,000 Urban
37 Rual 1,000 Urban
38 Rural • 1,000 20 20 Urban 1,000
39 Rural 1,000 Urban 1,000
8IBom DI ..... on . aa. 8 Bural 1,000 8 " " Urban 1,000 17 9 " " :u.jor &vBp 2041 R11l801 1,000
Urbe.n 1,000
28 Rural 1,000 1.26 Urban 1,000 63 82
26 Rural 1,000 Urban 1,000
27 Rural 1,000 100 Urball 1,000 100
28 Rural Urban 1,000
29 Rural 1,000 80 80 t'"rban 1,000
30 Rural 1,000 Urban 1,000
81 Rural 1,000 Urban 1,000
32 Rural 1,000 42 21 21 Urban 1,000 288 72 71 148
34 Rural 1,000 Urban 1,000 83 42 41
35 Rural 1,000 'Urban 1,000
37 Rural 1,000 Urban 1,000
88 Rural 1,000 20 20 Urban 1,000 12 IS
39 Rural 1,000 Urban 1,000
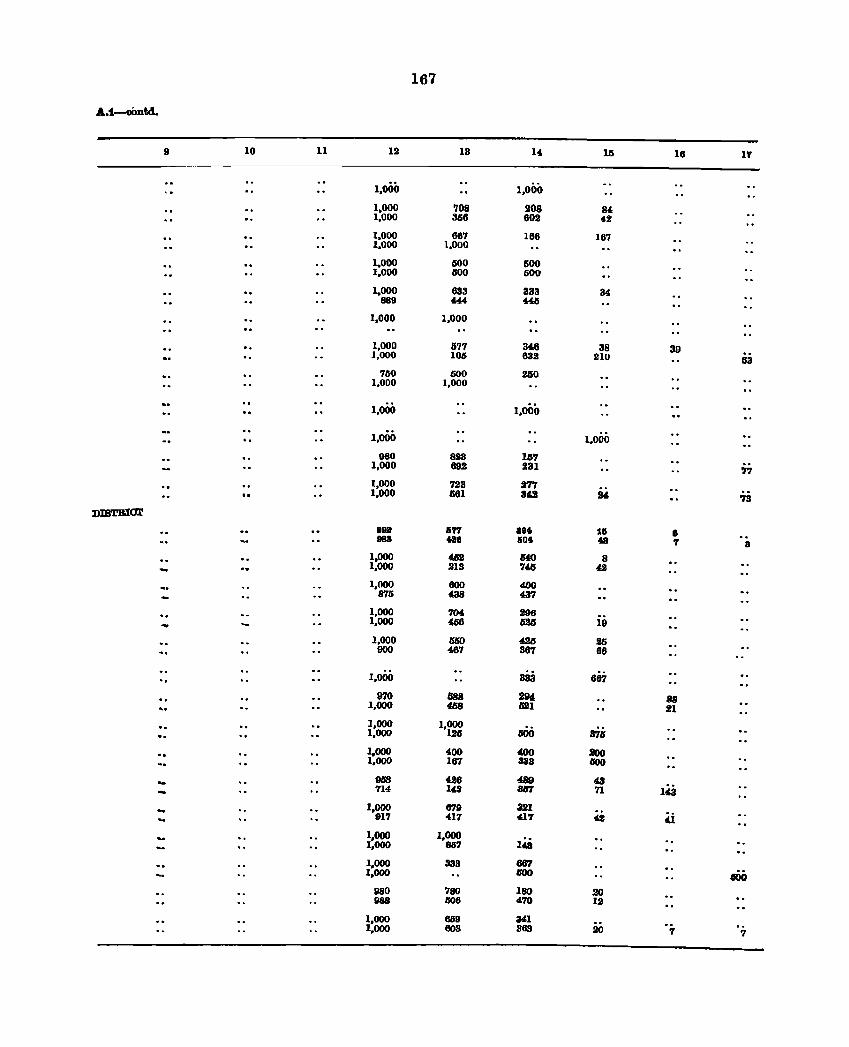
167
A.t-oOntd.
9 10 11 12 13 14 115 16 If
1,000 1,000
1,000 '108 208 84 1,000 368 602 42
1,000 667 166 167 1,000 1,000
1,000 600 liDO 1,000 500 500
1,000 633 333 34 889 U4 "II
1,000 1,000
1,000 1177 346 38 39 ],000 lOll 632 210 63 760 500 260
1,000 ],000
1,000 1,000
1,000 1,000
980 823 167 1,000 892 231 77 1,000 723 277 1,000 681 80 24 73
J)IBTB1ar
eea &77 8e. 111 8 988 • 8 liD • 48 '1 a
1,000 4a MD 8 1,000 213 746 42
1,000 800 400 876 438 437
1,000 '104 296 ... 1,000 466 6alJ 19
1,000 4IiO 425 25 000 467 387 66
1,000 333 887
970 588 294 88 1,000 468 521 21
],000 1,000 000 s7'; 1,000 126
1,000 400 400 200 1,000 167 383 ISOO
9IS8 426 489 43 143 714 148 3In 71
1,000 879 au 917 417 "17 4S 41
1,000 1,000 1,000 857 143
1,000 383 867 1,000 600 400
980 780 180 .20 988 1108 470 12
1,000 669 311 1,000 603 883 .20 7 '1
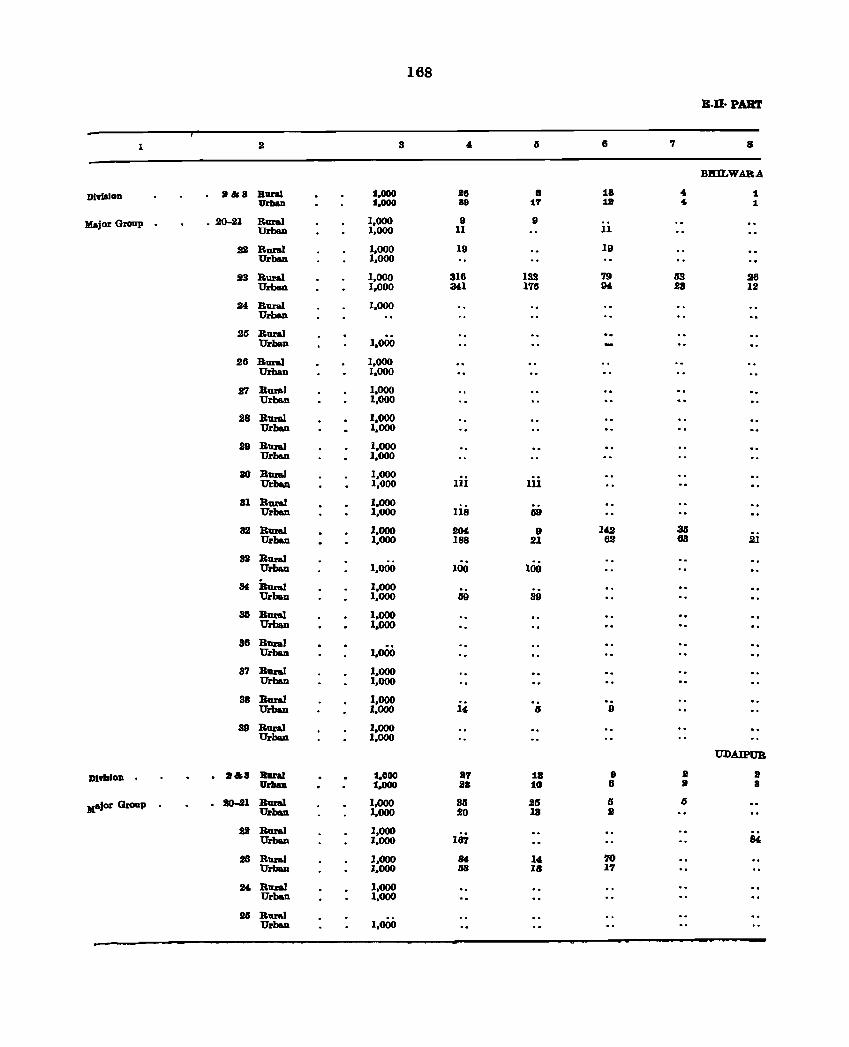
168
B-Il- PART
1 2 3 5 6 7 8
BmLWABA
DIYlalon .lIa B1I1'Il 1.000 28 8 1a .. 1 Urban 1.000 88 17 18 .. 1
Major Group . _ 20-21 Rural 1,000 9 9 Urban 1,000 11 11
22 Rural 1,000 19 19 Urban 1,000
.13 RuraJ 1,000 316 132 79 63 26 Urban 1,000 341 176 94 28 12
24 Bural 1,000 Urban
25 Rural Urban 1.000
26 Rural 1,000 UrbaD 1,000
27 Rural 1,000 Urb&n 1,000
J8 Rural 1,000 Urban 1,000
J9 Rural 1,000 Urban 1,000
ao Rural 1,000 .. Ur"_ 1,000 111 111
31 BuraJ 1,000 lis Urban 1,000 59
32 RumI 1,000 204 9 142 8lS Urban 1,000 188 21 62 63 .Ill
81 Rural 1.000 100 Urban 100
34 Bural 1.000 .. UrbaD 1.000 li9 89
36 Rural 1,000 Urban 1.000
36 Rura,l 1,000 Urban
37 Rural 1.000 Urban 1,000
311 Rural 1,000 i, Urba.n 1.000 ,; 9
39 Rural 1,000 Urba.n 1.000
UDAIPUR
Dlmlon .&a Baral 1.000 11'7 18 8 a II UrltaD 1.000 liB 1G 6 II 8
Major Gl,'01Ip . 20-21 Rural 1.000 88 JIS IS 6 Urba.n 1,000 20 13 .2
22 RumI 1.000 167 Urban 1,000 84.
~ Rural 1,000 84 14 70 Urban 1.000 liS 18 1'1
~" Rural 1,000 Urban 1,000
25 Rural 1,000 Urban
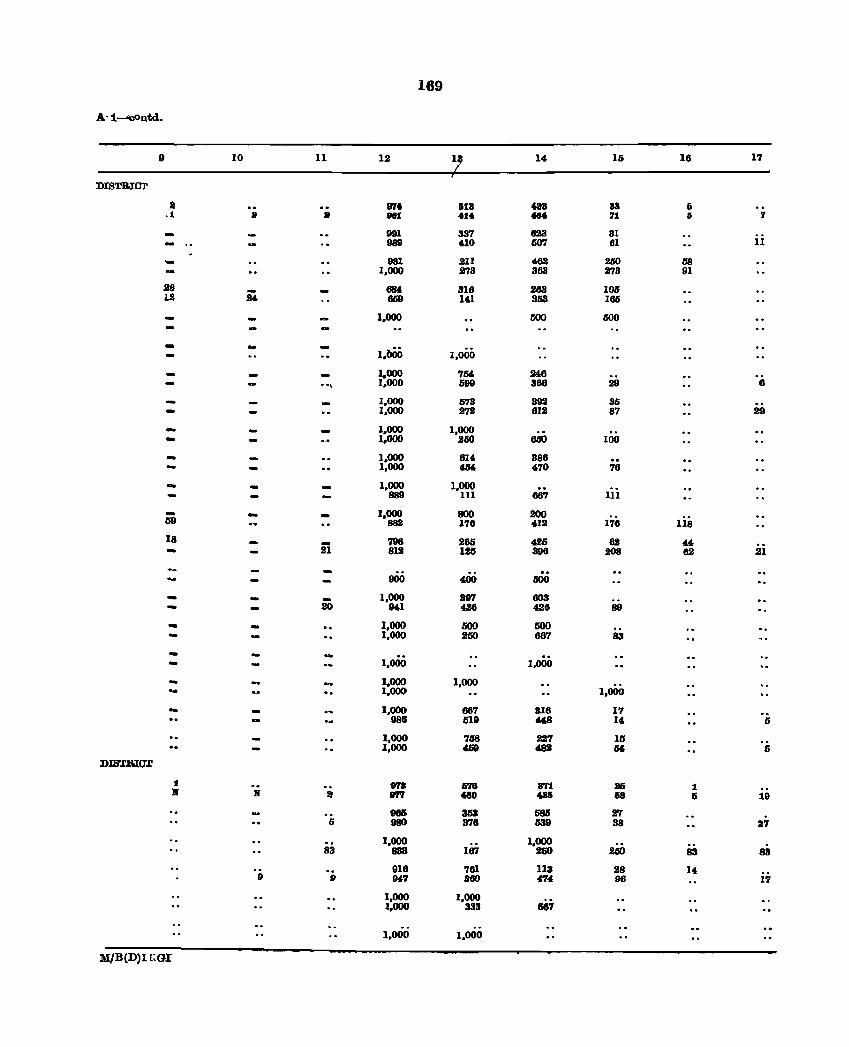
169
A·i-"CoQtd..
9 10 11 12 lJ 14 15 16 17
DISTRICT
a 97. 1i18 438 88 Ii .1 a a 881 41. iIU 71 D 7
991 337 623 31 989 410 607 61 11
- 981 211 462 200 ISS 1.000 273 363 273 91
as - 684 316 263 106 12 24 669 141 358 166
1,000 IlOO 600
- l.bOO 1.000
1,000 7M 246 .. \ 1.000 599 366 29 ., 1.000 573 392 36 1.000 272 612 87 29
1,000 1.000 - 1,000 260 660 100
1.000 614. 386 1.000 464 470 76
1.000 1.000 889 111 667 111
- 1.000 800 200 lis tl9 882 176 412 176
18 - 796 266 425 62 « 21 812 125 396 208 62 21
900 400 600
- 1.000 397 603 20 941 426 426 89 - 1.000 500 500 - 1.000 250 667 83
1.000 1,000
1.000 1,000 - 1,000 1,000 - 1,000 667 816 17 986 519 448 l' 5
1,000 768 227 15 1,000 4.59 4.82 M 5
DISTBIO'l'
1 878 fiB 871 Jt6 1 • • :Il fI'I'1 0180 tali 68 6 19
96IS 3113 585 27 5 980 376 539 38 27
1.000 1,000 83 883 167 250 .IUSO 83 83
916 761 Il3 28 14 9 9 947 BOO 474 96 17
1.000 1,000 1.000 333 887
1,000 1.000
M/B(D)ll~GI
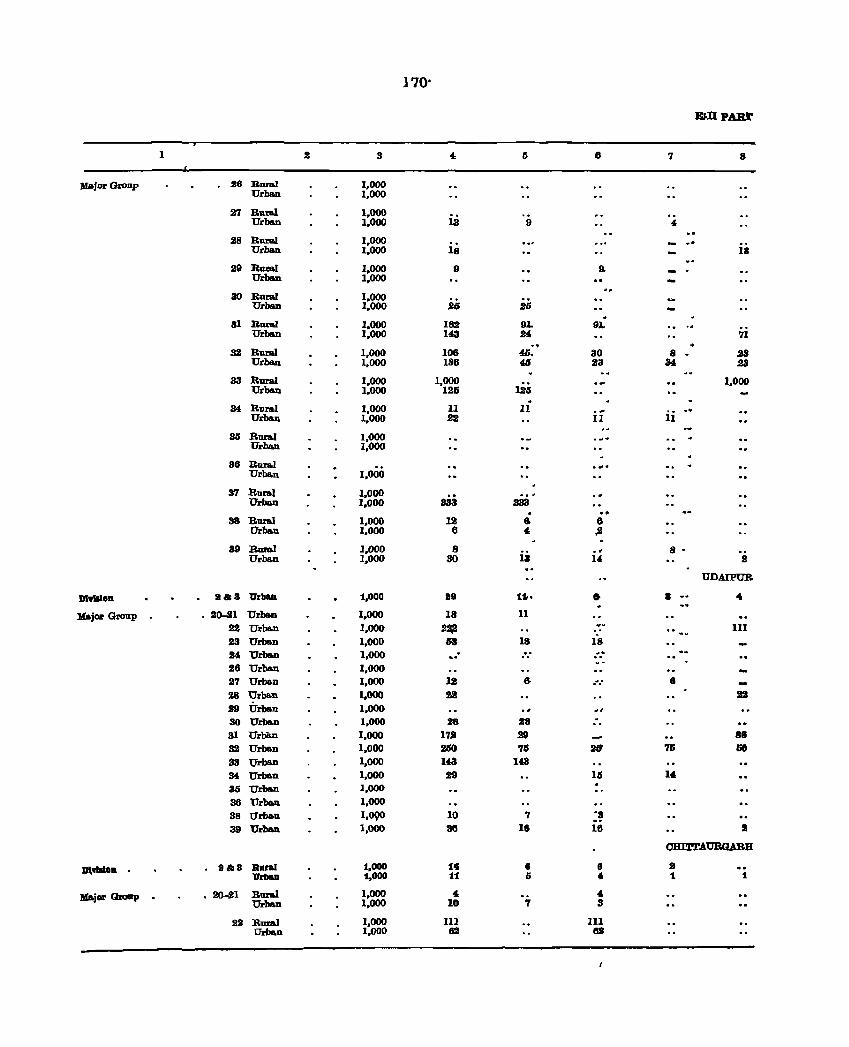
170'
aD PARI'
1 2 3 4. 5 ., 7 8
:ar.jOl' Group 26 BnraJ 1,000 Urban 1,000
27 Rural 1,000 Urban 1,000 13 9 4
28 Rural 1,000 " .-Urban 1,000 18 I.
29 Rural 1,000 0 9. Urban 1,000
30 Rural 1,000 " .. Urban 1,000 J6 25
81 Rural 1,000 182 9L 91, Urban 1,000 143 24 71 ..
32 Rural 1,000 106 40. 30 8 . 23 Urban 1,000 186 46 23 34 23
33 Rural 1,000 1,000 1,000 Urban 1,000 126 125
34 Rural 1,000 II 11 Urban 1,000 n II II
35 Rural 1,000 Urban 1,000
86 Bur&! .... Urblm 1,000
37 Rural 1,000 Urban 1,000 333 333 .
38 Rural 1.000 12 a 8 Urban 1.000 6 4. ;J
39 :aural 1,000 8 8 • Urblm 1.000 30 13 14 2
UDAIPUR
DI'IIIIOD 8&;8 trrllall 1,000 89 11.. • • ... Major Group 2~1 Urban 1,000 18 11
aa Urban 1.000 22;a 111 23 Urban 1.000 63 18 18 24 Urban 1,000 .. .. ........
28 Urban 1,000 27 Urban 1.000 12 8- ....... e Z8 Urban 1,000 aa 22 29 Urban 1,000 .. 30 Urban 1,000 28 28 . .. 31 Urbim 1.000 17' 29 88 32 Urban 1,000 2lSO 75 28 75 50 33 Urban 1,000 143 143
34 Urban 1,000 29 15 14 35 Urban 1,000
38 Urban 1.000 38 Urban 1,090 10 7 ·S 39 Urban 1,000 38 UI 16 I
OBl'l'TAUBGARJI
DI, .... o .. a&8 Rural 1.000 1'1 • 6 B Urban 1,000 11 5 • 1 1
:Major Grollp 2O-lU Rura1 1,000 4. 4 Urban 1,000 10 7 8
22 Rural 1,000 111 III Urban 1.000 62 es
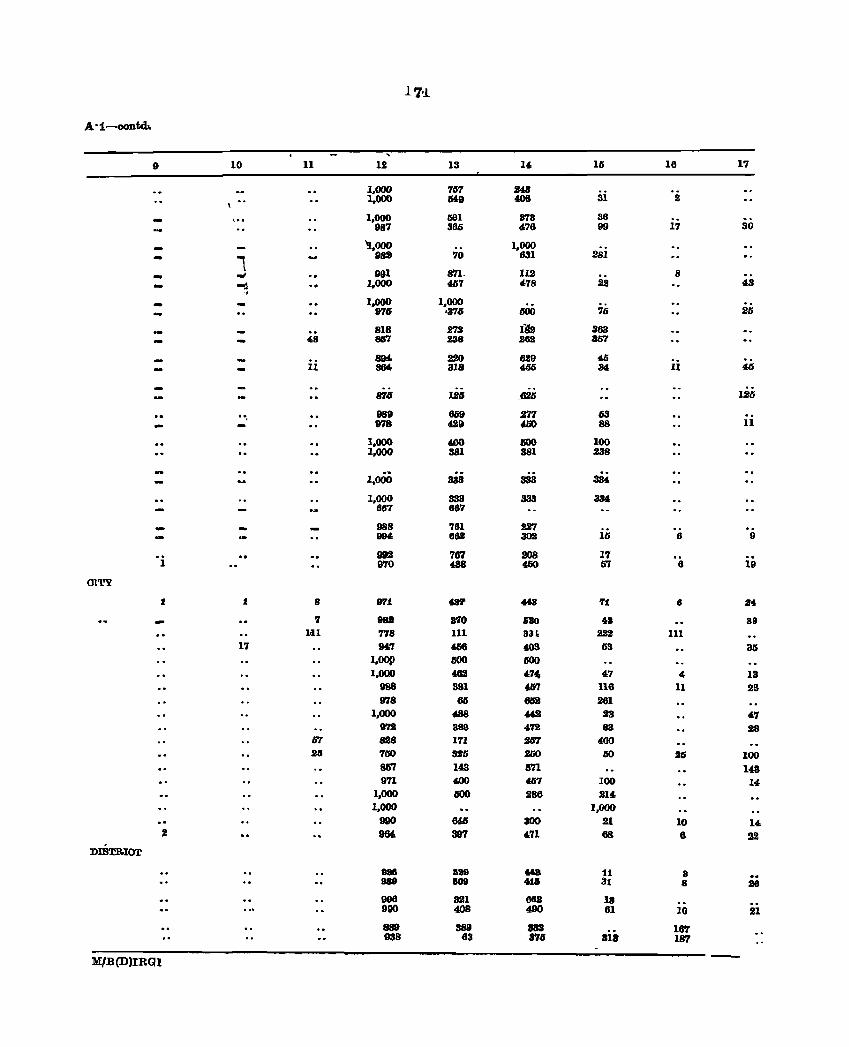
l'1'l
A"1-oontd\
9 10 11 12 13 14 16 16 17
1,000 767 .248 1,000 1549 408 31 2
1,000 1591 373 36 987 366 476 99 17 30
'!,OOO 1,000 281
1 982 70 631
oW 991 871- 112 8 -.: 1,000 467 478 .22 "3 -,
1,000 1,000 26 976 ·376 600 76
818 273 iila 363 48 815'7 238 262 367
890i 220 629 46 11 864 318 4li6 84 11 46
876 UiJ _626 126
.. 1189 669 2'l7 63 978 429 460 88 11
1,000 400 100 100 1,000 381 381 238
1,000 833 383 a3i 1,000 333 333 au
667 887
988 '781 22'7 9N 682 302 15 6 9
'i 99J 767 208 17 .. 970 488 450 5'1 6 19
Ot'l'Y
:l 1 8 8'11 fBI' 448 '11 6 24
'I 881 8'10 no 48 89 IiI 778 111 BiH 222 III
17 947 466 403 53 sa l,oop tSOO 600 1,000 482 47, 47 " 13
988 381 457 116 11 23 978 65 652 261
1,000 488 442 28 47 972 389 472 83 28
67 828 171 S6'1 400 25 7150 326 250 lSO 25 100
BIi'l 143 5'71 148 on 400 457 100 14
1,000 GOO 286 214. 1,000 1,000
9110 64.15 300 21 10 14 .2 964: 39'l 471 68 6 22
DIBTB.IOT
888 6. MB 11 8 988 &09 41. 3t 8 28
1196 ail 6U 18 080 408 490 61 10 21
889 3B9 883 167 938 63 87lJ aut 187
M/B(D)IRG1
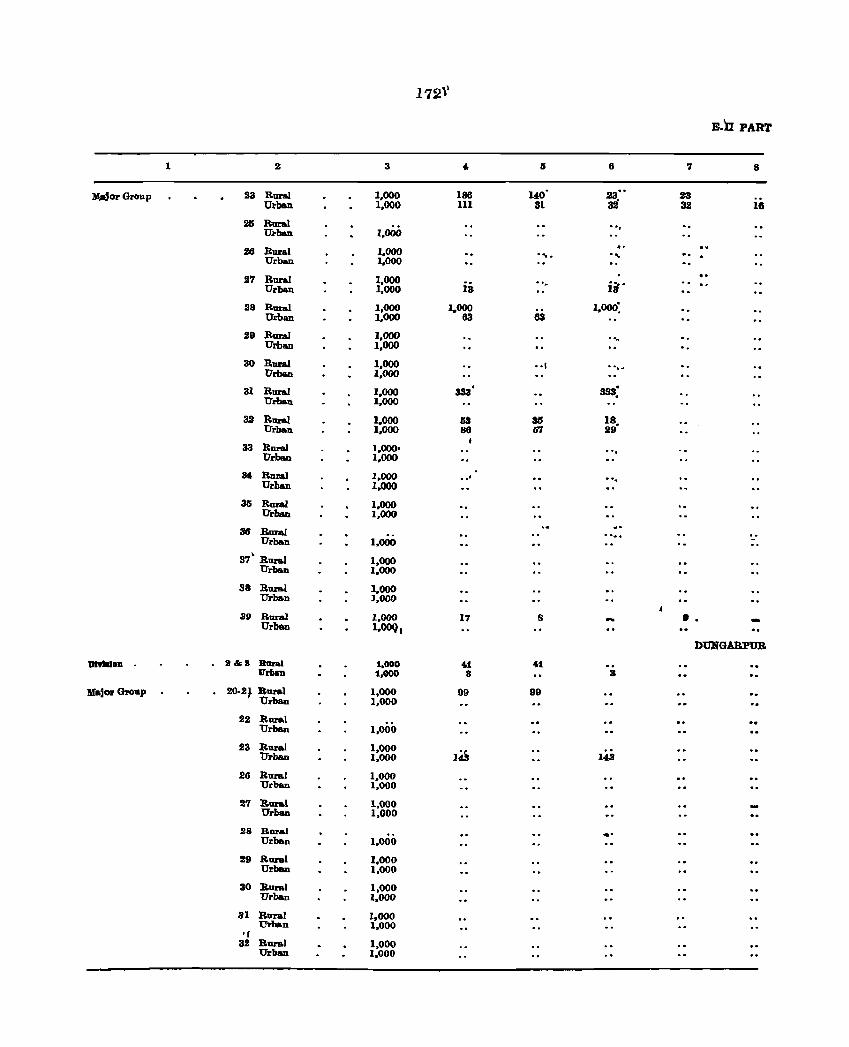
172\\
E-ll PART
1 2 3 4- IS 6 7 8
)I";or Grou p 23 Rura.! 1,000 186 14.0' 23' , .23 Urban 1,000 III 31 :d 32 18
2lS R-aral ", Urban 1,000
26 Rural 1,000 ... . ' .. Urban 1,000
27 R-aral 1,000 ,-
Urban 1,000 is ' '. iir 28 Rural 1,000 1,000 1,000:
Urban 1,000 63 83
29 RuraJ 1,000 .... Urban 1,000
30 Rur&.! 1,000 .. I .. _ .. Urban 1,000
31 Rur&.! 1,000 333' 383: Urba.n 1,000
32 Rur&! 1,000 Il3 35 18, Urban 1,000 86 07 29
33 Rur&l 1,000' ", Urba.n 1,000
U Ru1'&l 1,000 .. ' ", Urban 1.000
3G Rural 1.000 Urban 1,000
36 Rural ...... Urban 1,000 -
37' Rur&! 1,000 Urba.n 1,000
38 Ru:r&l 1.000 Urban ],000
39 Rural 1.000 17 S •• Urban 1.0091
DUNGAB.PUB
'OlwMOD 2&. Rani 1.000 401 401 Urnu 1,000 8 8
Major(houp 20-2J Bural 1,000 99 99 "Orban 1,000
22 Rural Urban 1,000
23 Rural 1,000 143 Urban 1,000 14.3
26 Rural 1,000 Urban 1,000
27 Rural 1,000 Urban 1,000
28 Roral .' Urban 1.000
29 Rural 1.000 Urban 1,000
30 Rural 1,000 Urban 1,000
81 Rural 1,000 Urban 1,000
" 82 Roral 1,000
Urban 1.000
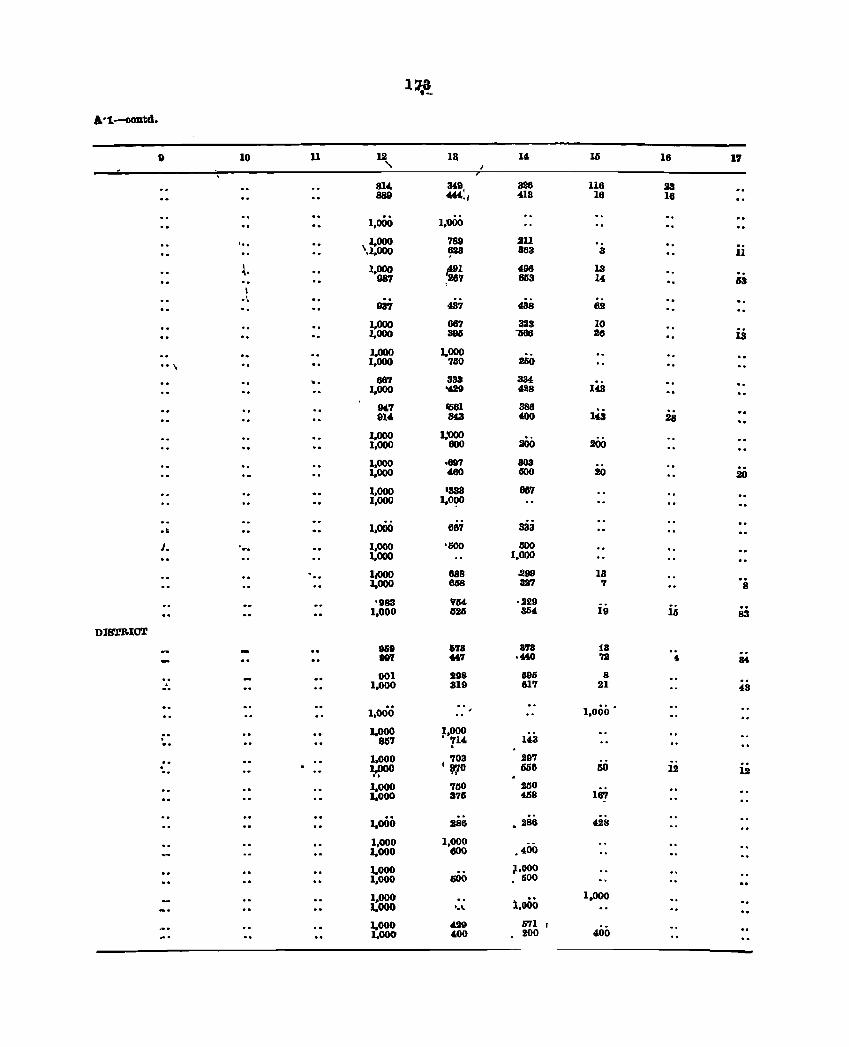
l'}!_
.·1-ooutd.
9 10 11 12 la 14, 15 16 17 , 814- MD 326 116 23 888 444:1 413 16 16
1,000 1,'000
' .. \ 1,000 788 .211 .1,000 ~ 863 3 ii
I 1,000 ~~ 496 13 'I.'
087 663 14 sa I . .. ei7 437 4!18 6.2
1,000 667 323 10 1,000 380 1J66 26 is 1.000 1,000
26:0 .. \ 1,000 760
-. 667 333 334 1,000 "429 428 143
94.7 f061 386 143
.. 914 3d '1)0 28
1,000 1:000 200 200 1,000 600
1,000 .611'1 803 1,000 480 500 20 20
1,000 1333 667 1,000 I,OC?O
.~ 1,000 667 333
J. r. 1,000 '500 500 1,000 1,000
. " 1,000 888 .:.199 13
1,000 6118 :1.27 7 8
'083 '54 ,.1129 io 1,000 624S 364 16 .. 83
DIS'l'lloIOT
868 1'18 8'78 18 88'1 417 .~ '1lI t. H
001 .1198 696 8 . 1,000 819 817 21 43
1,00'0 1,000 •
. 1,000 1,000 8157 • 714 143
.. 1.000 1703 297 .
~ '10 656 50 1.11 1.11
1,000 760 250 1.000 376 468 187
1.000 .1186 .286 4,28
1,000 1,000 ,400 1,000 eoo 1,000 }"OOO 1,000 500 • 600
1,000 i,ooo 1,000 1,000 '.\
1,000 429 671 r 1,000 400 200 400
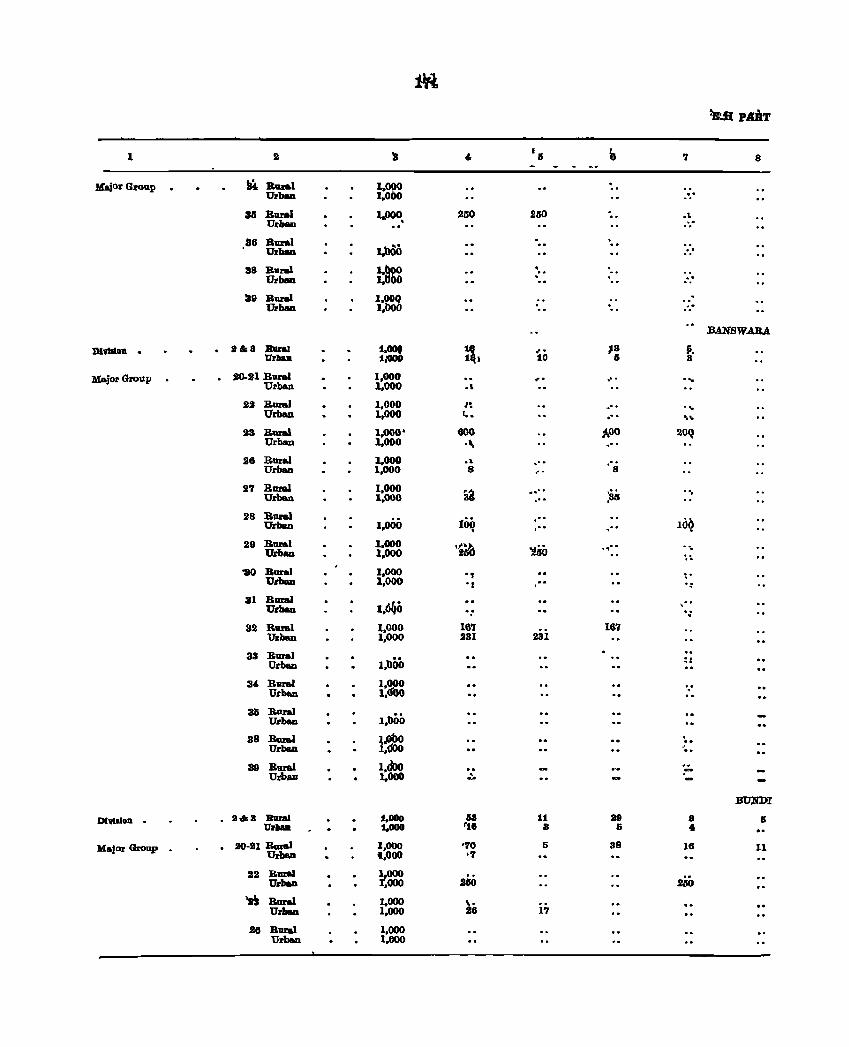
'B:.B PdT
1 2 '8 ~ 's e '1 8
Kajor Group M RU:r&l 1.000 ,
Ul'b_ 1,000 .,
31S BUI'IlI 1 .. 000. 250 250 ., ,\ UI'Itaa. ,-
86 RUI'IlI . 1.bOO
-. UrbeD ' .
38 Rural 1~3ro " . '. Ul'ban 1. 0 , , . '89 Bural 1.000
Urban 1.000 .. .,
BAN"BWA.B.A
»I'dlien . . 8&8 ;Bur&l 1.009 ~I ... ,8 P. UrllaD 10'000 10 & 3
Major Grou II 20-21 BlIl'al 1,000 ... ," . ... Urban 1.000 .,
22 BlIl'al 1,000 1\ " . . .. Urban 1.000 I •• .' . .. ..
23 B1II'IIl 1,000' 600 AOO 20C! Urban 1,000 ., " .
26 Bural 1,000 .. .' . "S Urban 1,000 8 '" 27 Bural 1,000 aa ..... ;36 ",
Ul'baD 1,000 " .. 28 BuaI
1.000 100 ,"
lO~ Urban , .' . . " 29 Rural 1.000 \i~ ':!i;o .. .. "",
Urban 1.000 ~\
"30 RlIl'al 1.000 " , Ul'bao 1,000 'r .. ·
31 Baral 1.660 " , Urban .. · 32 Raml 1.000 16'7 167
Ul'ban 1,000 231 231
33 Bnral l,bOO Urban ..
3~ Rural I,: Ul'ban 1, ·
ali RUl"aI l,boo Ul'baD
38 BumI J.PPO , .. Urban 1,000 ..
39 BumI l.doo .. -Uzbau 1,000 . .. -BONDI
DlYlIIOD . 9&3 IhIraI 1.GOo &3 11 liD 8 & Ur ... 1,000 "1.8 8 6 ..
Ma.jOl' Choup . 20-11 Bual 1,000 '70 5 38 16 11 UrbaD ~,oOO -'1
22 Kuzel ~ooo 2isO Urban ,000 JIiO
.. !J Bnnl 1,000 \,.
Ul'brm 1,000 28 1'1
26 Rual 1,000 Urban 1,000
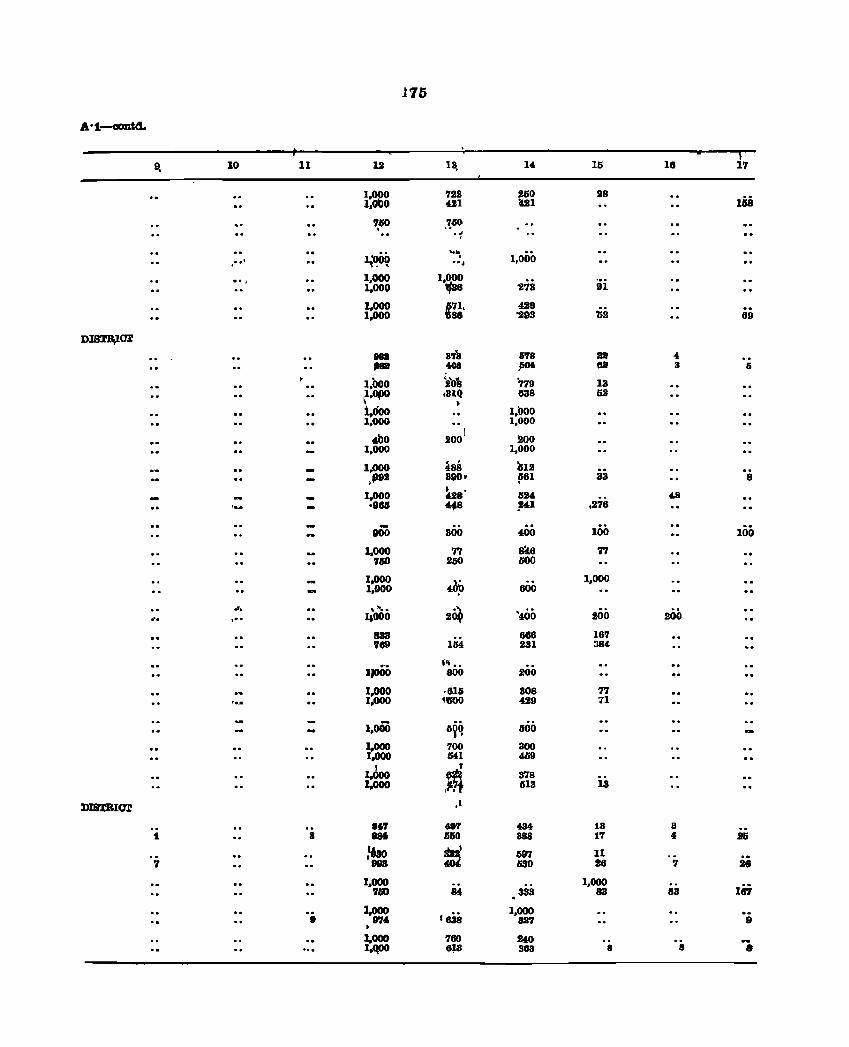
175
A·l-conta.
~ 10 11 12 13, 14 15 18 17
l'GGO 722 260 28 Iii 1. 0 421 III
~OO :~OO .~
1~ '"": 1,000 .. ' ", .. " 1,000
1,000 1,000 iii '438 ~78
1,000 tnL 428 1.000 88 '293 02 69
DmrIV-<7r
881 878 1178 sa 4,
pas 408 .fiH ea 8 II
1,000 ~'011 779 13 ~,opo .81Q 838 52
)
i,o'oo 1 ,boo 1,000 1,000
4bo I
200 200 1,000 1,000
1,000 488 isu Pit 880- p81 83 8
I • . 1,000 4.28 15M 4.8
,~ ·885 ~8 ~1 ,178
eGO 300 400 100 100
1,000 77 H6 77 700 250 500
1,000 43p
1,000 1.000 600
... ~:too ••
I~ '4,00 ... ," 4000 200 200
833 688 187 789 1M 231 384,
1,000 ,~ .. 800 200
1,000 ,615 808 77 1.000 IGOO 4,29 71
1,000 oyq 500 1.000 700 300 1,000 54.1 409
I ,
1,000 ,m 378 1,000 613 13
DIS'.fBI<7r ,I
867 49'1 484 13 8 t 8 1M li50 888 17 4, 25
~ ~ 597 11 .. 7 D83 630 26 7 U
1,000 1,000 187 7110 ~ 333 83 83
• 1,000 874 leiS 1,000
327 8 , 1.000 760 UO • + .. lAOO 8J8 383 8 8
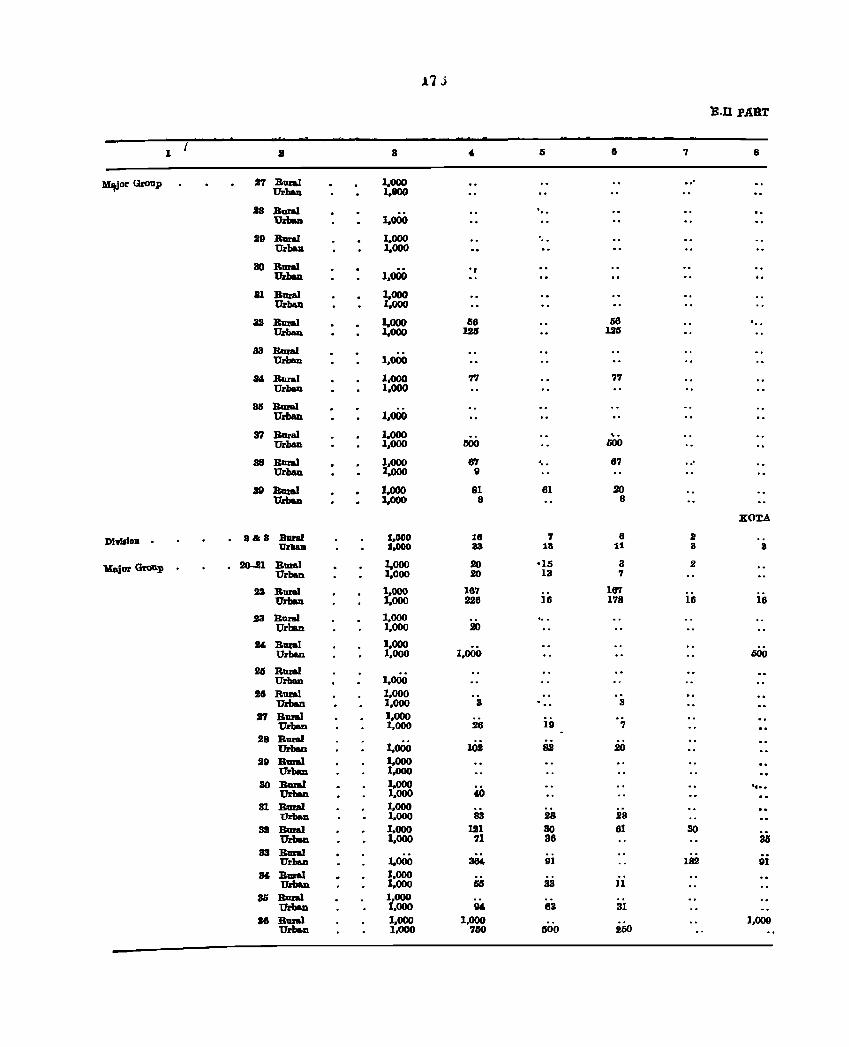
11 j
'E.n PART
1 f 3 8 " 15 6 7 8
u"ior Group H R1I1'al 1.000 .," Urban 1.100
.118 Rural --. Urban 1.000
29 Rural 1.000 .. Urbaa 1.000
30 Rural ., Urban 1,000
31 Bural 1.000 Urban 1.000
a2 R1UaI 1.000 li8 li6 ' .. Urban 1.000 125 125
33 R1U8l Urban 1,000
34 Rural 1,000 77 77 Urban 1.000
3IS Bual Urban 1,000
tf1 B1I1'al 1,000 ... Urban 1,000 1500 500
38 Rural 1.000 67 ',. 87 ..' Urban 1,000 D
3D BaraI 1.000 81 61 .20 Urban 1.000 8 8
XOTA.
DlvIIloD . 8&8 Rural 1.000 18 7 8 8 .. Urban 1,000 aa 18 11 8 8
'Major Group 2Ch21 Buml 1,000 .20 '15 3 .I Urban 1,000 .20 13 7
22 Rural 1,000 167 16'1 Urban 1.000 226 16 178 16 16
Jl3 Rural 1,000 Urban 1,000 20
24 Rural 1,000 Urban 1,000 1,000 DOO
25 R1U8l Urban J,ooo
28 R1U8l 1,000 Ur'be.n 1,000 3 3
S'I Bural 1,000 iii Urban 1,000 26 7
28 R1U8l 1,000 Urban 102 82 .20
29 Rur&l 1.000 Urban 1.000
30 Rur&l 1,000 w •••
UrIIuJ 1,000 ~
31 Rural 1,000 UrINm 1,000 83 .28 .28
U Bural 1.000 121 30 61 30 Urban 1,000 71 38 38
33 Rural Urh&D 1.000 364. 91 18.2 91
M Bural 1,000 Urban 1,000 5lS 33 11
35 Rual 1,000 Urban 1,000 IN. 63 31
16 Rural 1.000 1,000 1,000 Ur'be.n 1,000 750 500 260
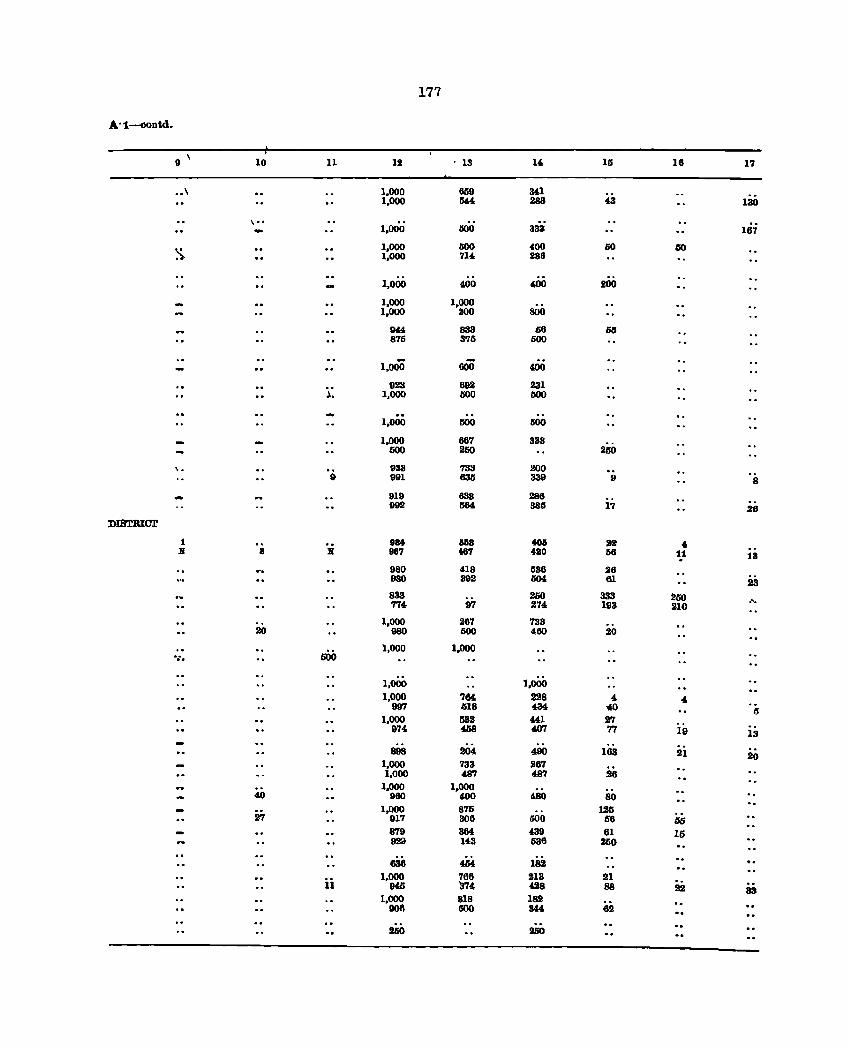
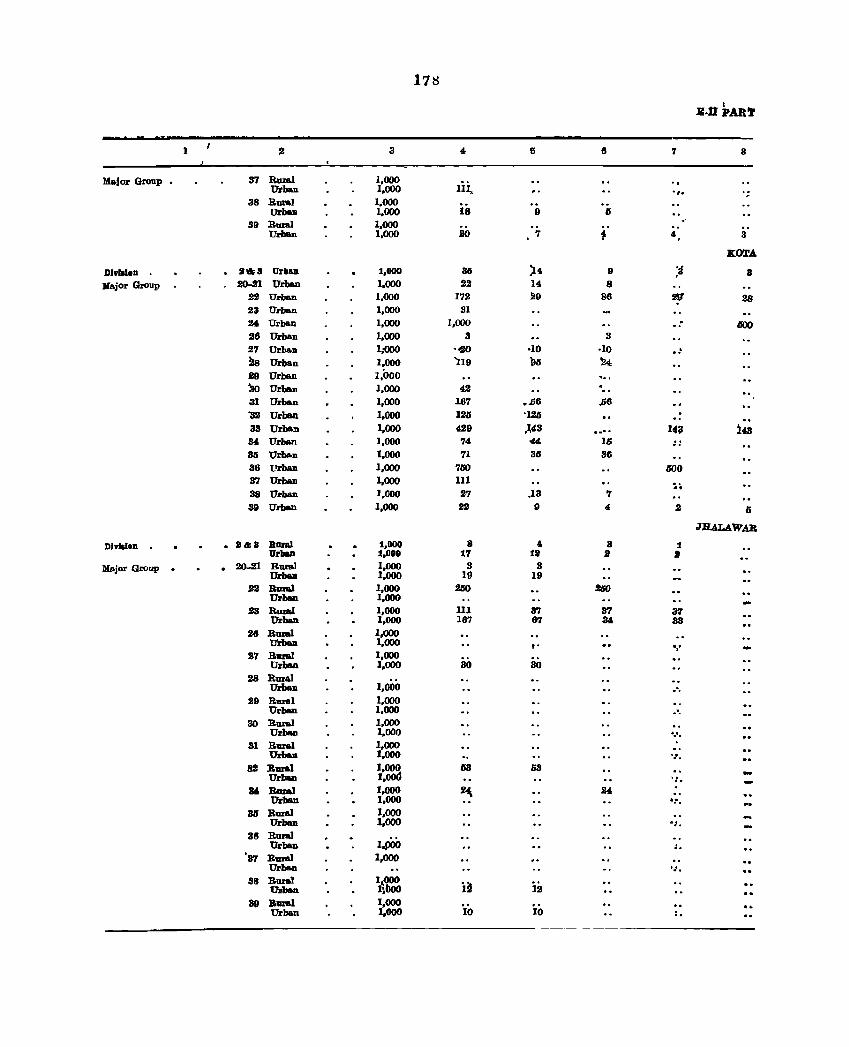
17t!
.B.D PAR1'
1 2 3 4. fi 8 7 8
Major Group. 37 Rur&l 1,000 Urban 1,000 Ill, .,. ,
38 Rur&! 1,000 UrbIUI 1,000 18 9 5
39 Rural 1,000 Urban 1,000 20 7 1- 4. . 3
KO'l'A
DlvllloD ll\t=3 UrbaD 1,000 36 )4 9 ;3 8 :Major Group 20-21 Urban 1,000 22 14 8
2! Urban 1,000 172 29 88 2IJ' 28 23 Urban 1,000 31
24 Urbtul 1,000 1,000 . 000 28 Urban 1,000 3 3 27 Urban 1;000 ·o!O ·10 .10 .t
as Urban 1,000 'l19 bo 'l!4 £9 Urban 1,000 ' .. M Urban 1,000 42 31 Urban 1,000 1.67 • ..56 ..56
"32 Urban 1,000 125 '126 . .. 33 Urban 1,000 429 .~43 .. ,,-. 1.3 i43 34 Urban 1,000 74 '" 16 .. 35 Urban 1,000 71 36 86 36 Urban 1,000 750 600 37 UrbIUI 1,000 111 38 Urban 1,000 27 .13 7
.. 39 Urban 1,000 22 " 4 2 I;
JBALAlVAR
Dlvlalon . • 2&8 Bur&) 1,000 8 4. a 1 Urllu 1,000 17 1a J J
lllajor Group . . 20-.21 Rural 1,000 3 3 Urb&n 1,000 19 19
22 Rural 1,000 250 .t6O Urba.n 1,000
23 Rural 1,000 III 37 8'1 37 Urba.n 1,000 167 67 34 33
26 Rum] 1,000 Urba.n 1,000 t' ','
S7 Rural 1,000 Urban 1,000 30 30
28 Rural 1,000 Urban .',
29 Rtmll 1.000 Urban 1,000 .',
30 Rural 1,000 Urban 1,000 ....
al Rural 1,000 Urban 1,000 .~,
39 Rural 1,000 as li3 Urban I,cod I: •
34 B.maJ 1,000 U. 24 Urban 1,000 .:".
36 Rural 1,000 Urban 1.000 OJ,
38 Rura] Urban 1.poo ..
'87 RUl'IIl 1,000 Urban '.I.
38 Ruzal I~OOO i~ UJ:ban l~boo 12
39 BaraJ. 1,000 io io UrlNm 1.000 ..
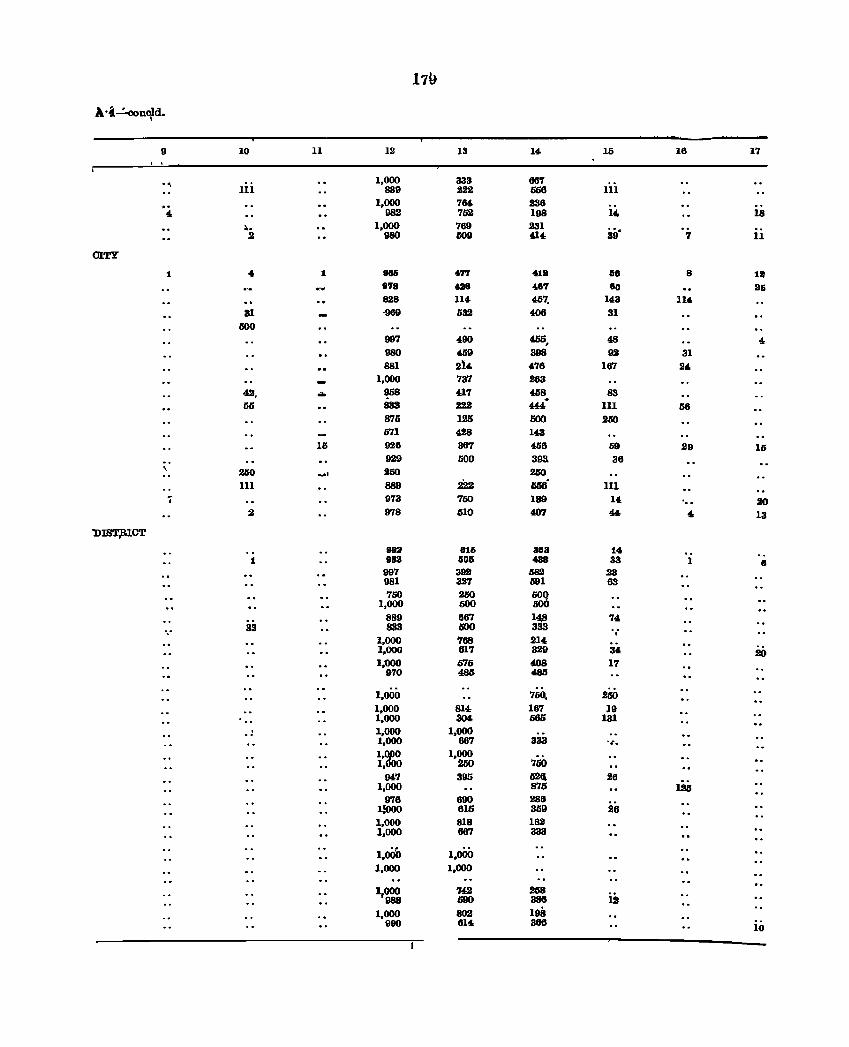
179
A. ,.f -=-OOn~d.
9 10 11 12 13 14 15 16 17
., Iii
1,000 333 667 889 222 556 HI .. 1,000 764 236
4- 982 752 198 14- 18 ;I.. 1,000 769 231
39" 2 980 GOg 4.14- 7 11
CITY
1 .. 1 98Ii 4,., .. 18 liS 8 1a 878 4a8 48'1 80 a5 828 114 457. 1'3 11'
31 -969 532 406 31 1500
997 490 4,55, 4.8 4 980 459 398 92 31 881 214 476 167 24
1,000 737 263
42, .- 968 '17 458 83 56 833 222 444,4 III 56
875 125 500 250 671 428 143
15 928 387 458 59 29 15 929 500 393. 38 ,
250 250 250 ... , 111 889 222 506' 111 .. 973 '150 189 14
" 20 2 978 610 407 4.4 4 13
DISorp.ICT
993 815 883 14 1 888 506 488 38 1 "
8 997 392 582 23 981 327 591 83 '150 250 50Q
1,000 500 1500 889 687 1~ 74
',' 33 833 1500 333 . 1,000 768 214 1,000 817 329 34 20 1,'000 575 408 17
970 485 485
1,000 750, 250 1,000 814 167 19 1,000 304 565 131
, 1,000 1,000 1,000 667 333 -... 1,~ 1,000 I, 250 700
947 395 52!! 28 1,000 875 125
978 690 286 l!OOO 615 359 26 1,000 818 182 1,000 667 333
1,000 1,000 1,000 1,000
1,000 742 258 988 590 388 12
1,000 802 198 990 814 366 10
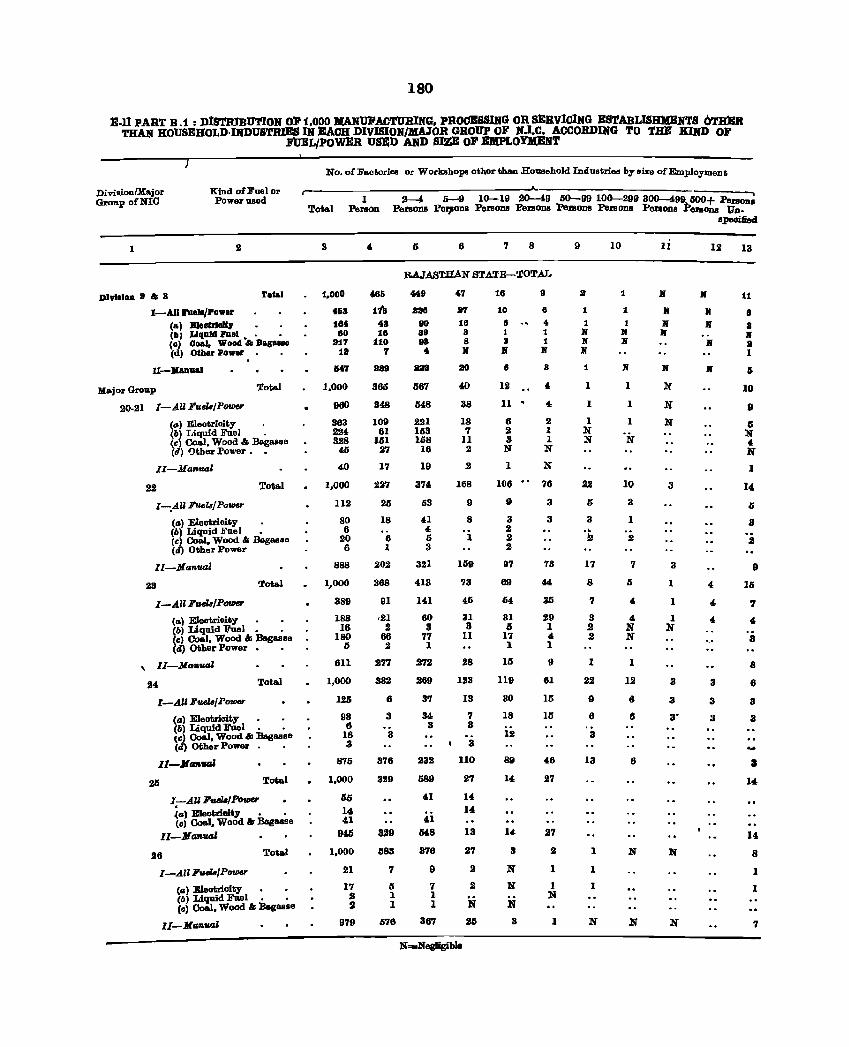
180
E-ll PART B.1 : DtSTRIBUTlOB 0]1' 1,000 MAH1JFACTUBING. PROCESSING OR Sli:RvlCb,G ESTABLlSID[EJfTS OTHlilR THAN HOUSEHOLD·nmUSTlllBS IN EACH DIVISION/lII[AlOR GROuP OF B.I.C. ACCORDIlfG TO THE KlRD OF
.F'UELJPOWER USl!lD AND SIZE OF ElI[PLOYI(BNT
Divi8ioniMajor GrollP ofNICI
Kind ofll'uel or Power used
1
Total
1-Alll'lle .. /power (a) B1eaUlel&, (Ill L1qllld FIlal.. • (0) Goal, Wood.to Bacaue (d) Ofller Power •
n-Jlan1l&l
:Major Group Total
20.21 I-AU FuelB/P_
(a) Eleotrioity (6) Liquid Foel . (c) Coal. Wood '" Baguse (d) Other Power •
II-Mamud
22 Total
I-.AU F .... 18/POfDU
(II) Eleotrloity (b) Liquid Fuel -(c) Coal, Wood'" Baguse (tI) Other Power
II-.Manual
23 Total
I-All FHk/P_
(II) Eleotrioitly (6) Liquid Fuel - . (c) Coal, Wood '" Bagaslle (d) Other Power" •
\ II-MtJfIuaJ
24 Total
I-All FuelB/P01IHI
(II) Eleotrioity (6) Liquid Fuel. " (e) Coal, Wood'" lIaguse (d) Other Power. •
II-JlGflVGI
Total
I-AU Fv.iJ8/Power ~a) EIeotrioity " 0
(c) Coal. Wood", :Bagasse
II-JlIIRUfJl
26 Total
I-All FuelB/Powu
(a) E1eotrioity (b) Liquid Fuel 0 0
(c) Coal. Wood '" Bagasse
II-JIll" ... '
No. of Factories or Workshops other than HO'IIBehold Industries byeize of Employ mont
r-'----~--~~~~~~~~~'~~~~=_~~~~------~ 1 2--4, 5-9 10-19 20-49 50-99 100-299 300--499. 500+ PoMonll
Total Person Porsons PelJlons Persons Penona PeraoDs Pe1'llODa PIl1'IIODS Pel'llODll Un
3
1.0110
4lia 164 60
217 18
IS47
1,000
960
363 224 328 45
40
1,000
112
80 6
20 6
888
1,000
389
188 16
180 5
611
1,000
125
98 6
18 3
875
1.000
56 14 41
945
1,000
21
17 S 2
979
4
406&
17'b 48 16
110 7
288
365
348
109 61
151 27
17
227
25
18
6 1
202
368
91
.21 2
66 2
277
382
6
3
3
3'16
329
329
G88
7
is 1 1
G76
6 7 8
RAJASTHAN BTA'IE-!1'OTAL
M9
2211
80 88 ea
4.
U8
667
548
221 153 168 16
19
37'
63
41 4 5 3
321
413
141
60 3
77 1
272
269
3'7
34 3
232
589
41
41 548
3'76
9
7 1 1
367
47
27
16 8 8 If
SO
40
38
18 7
11 2
2
168
9
8
1
159
'13
45
31 3
11
28
123
13
7 3
3
110
27
14 14
13
27
2
2
N IG
16
10
" 1 3 If
" 12
9
6 .. 1 1 N
3 , 11' 4,
6 2 2 1 3 1 N N 1 N
106
9
3 2 2 2
97
69
54
31 5
17 1
15
119
30
18
12
89
14
14
3
N
N
N
8
76
3
3
'13
44
35
'9 1 4 1
9
61
15
15
46
27
27
2
1
1 N
1
9
» 1
1 N N If
1
1
1
1 N N
22
5
3 .. 2
17
8
7
3 2 2
1
22
9
6
3
13
1
1
1
N
10
1
1 1
II N
.N
1
1
1
oN
10
3
1
2
7
5
4.
4-N N
1
12
6
6
6
N
Ii
N
N
N If
l'r
N
N
N
3
3
1
1
1 N
3
3
3"
N
N
IIpooiJiod
12
N
If
If
JI'
If
3
3
3
13
11
6 a 1(
a 1
Ii
10
D
I> N
" N
1
14
I>
a 2
9
15
7
4.
8
8
6
8
3
3
14
14
8
1
1
7
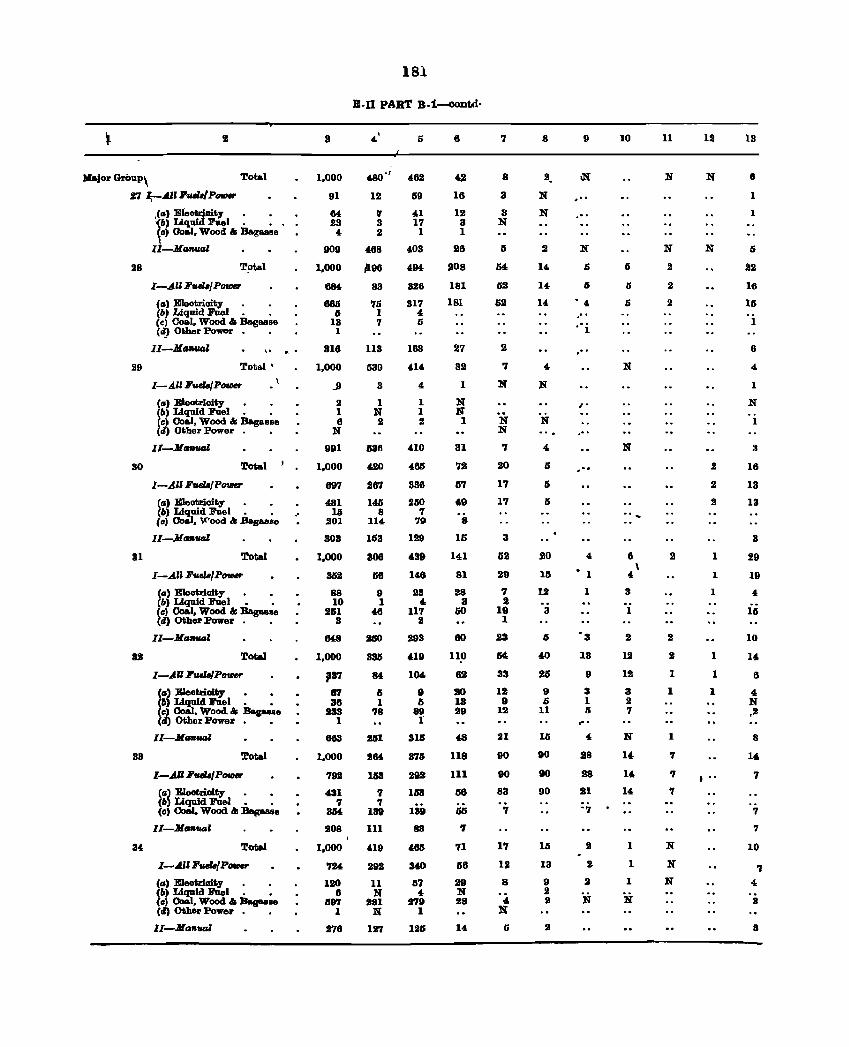
)bjor GrOup, Total
27 I;-.... lIl'uih/P-
28
29
30
.c II) EleotriDity , , '(6) Liquid Fuel, , ~G) Ooal, Wood & Baguse
It-HII_1Il
T~I
l-AlIF ... /Po_
(II) Eleotrioity (b) Liquid Fuel _ , (c) Coal. Wood & Bagasse (tI) Other Power, ,
\. . .. Total'
l-AU,..,./Po_
(II) Eleotrioity (6) Liquid Fue!, _ (c) Coal, Wood & Bagaaae (tI) Other Power
ll-MllfHIGl.
Total
l-AlJFuel./Po_
(II) Eleotlioity , _ (6) Liquid Fuel, _ te) Co8J. Wood & .Raguse II-H __
31 Total
33
34
I-An Fuels/P_
(II' Eleotrioity (6) Liquid Fuel _ _ (c) Coil. Wood & Bagasse (d) Other Power, _
II-Ma_1
Total
I-AU 7ueliJ/PtltHr
(a) Eleotrioit,o _ (Ii) Liquid hel, _ (c) Coal. Wood & Bagasse (tl) Other Power, _
lI-M_ual
Total
I-AU ItIfU/P_
(a) E1eotrioity (Ii) Liquid Foel _ _ (0) Coal. Wood & ~IWIBe
I1-B_1
Total
I-AllF __ /P_
(a) EJeotrioity (6) Liquid l!'uel, _ Ce) Coal, Wood & Bagasse (cI) Other Power, ,
ll-Maftual
3
1,000
91
04 23
4
909
1,000
684
886 6
13 1
316
1,000
..9
2 I 6
N
991
1.000
697
481 15
:.l01
303
1.000
362
88 10
261 3
048
1.000
pl7
ffI 36
233 1
883
1.000
792
431 '1
3M
208
1.000
'724
120 8
1197 1
278
181
E-n PART B-1-..«)ntd-
6
480'/ 482
12 69
" 3 2
468
1196
83
'16 1 7
113
639
3
1 N 2
636
420
287
146 8
114
163
306
1S8
9 1
48
2llO
336
84
II I
78
261
2M
1153
7 7
139
III
419
292
n N
281 N
127
41 17
1
403
494
326
317 4 6
168
414
4
1 1 2
410
486
336
200 '1
79
129
439
146
23
" 117 2
293
4111
104
9 6
89 I
311S
376
2112
163
139
83
486
340
67 4
2711 1
126
8
~
18
12 3 1
28
208
181
181
27
32
1
N N 1
31
72
57
49
8
16
141
81
28 3
60
80
110
62
20 18 29
48
118
111
158
66
'1
71
1S8
29 N 28
14
'1
8
3
3 N
5
54
52
62
2
7
N
N N
7
20
17
17
3
52
29
'7 2
19 1
23
54
33
12 9
12
21
90
90
83
'7
17
12
8
4-N
5
8
2,
N
N
2
14
14
14
4
N
4
:;
I)
15
20
lIS
12
3
5
~
26
9 :;
11
15
90
90
90
lIS
13
9 2 2
9
." ,- ,
N
:;
.. , 4
." "i
.- ,
"
.-'
4
• 1
1
'3
IS
9
3 1 6
" . "
18
28
21
'7
2
2
2
N
10
5
6
IS
N
N
8 \
4
3
1
2
12
12
3 2 7
N
14
14
14
1
1
1
N
11
N
N
2
2
2
2
2
2
1
1
1
7
7
7
N
N
N
12
N
N
2
2
2
1
1
1
1
1
1
, "
13
II
1
1
6
22
16
16
1
8
4
1
N
1
3
16
13
13
3
29
19
4
lIS
10
14,
6
" N ,2
8
14.
7
7
7
10
7 4
3
3
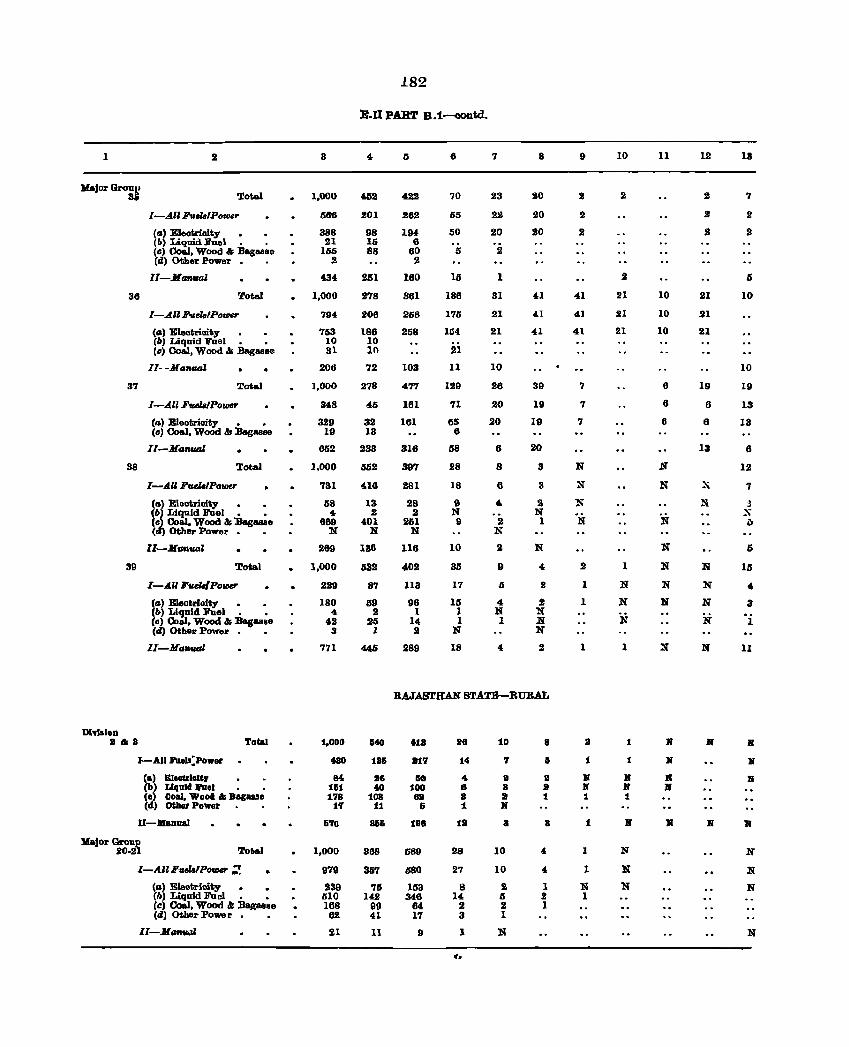
1 2
MajOl' Grou!' 8i Total
I-A.llFueliJIPower
(ta) Eleotrioity • (r.) Liquid Jl'D.ol. • (c) 00&1. Wood & Bagaaae (d) Other Powel'. •
II-Man"al
36 Total
I-A." FueliJlPQ1I1er
(a) Eleotriaity (II) Liquid Fuel. • (e) Coal, Wood &; BagaaBe
11- -ManfUJl
37 Total
I-A,ll Fv.cl8IPowa'
(ta) Eleotrioity • • (a) Coal, Wood I/; Bagasse
II-Man"al
38 Total
I-A.U FudiJlPo~r
(a.) Eleotrioity • (6) Liquid FOel. • (e) Coal, Wood I/; :Bagasse <d) Other Power _ •
lI-MGflwd
39 Total
I-A.U Fuel8/PolDV
(a) Eleotrioity • (II) Liquid Fuel. • Ce) Coal. Wood I/; BagaBse Cd) Other Powor _ _
II-M"Jlilial
DI91llloD 8&8 Total
I-AJll'1IeJa:Power
Ca) Bl..ulaltr (b) Liquid l'1Iel _ (a) DoaJ. Wood & Bagaue (d) Otller Power
U-llanual
Total
I-A.ll FuelalPOfDef' ~
(a) Eleotrioity (b) Liquid FUel. _ (e) Coal, Wood &: Bagaase (ti) Other Powe r. •
lI-Mma..u
3
1,000
Mil
388 21
155 2
434
1,000
794
753 10 31
206
1,000
348
329 19
652
1,000
731
58 4
689 N
269
1,000
229
180 4
42 3
771
1,000
taO
84< 1&1 178
1'1
6'l0
1,000
979
239 510 168 62
21
182
E.D PART B.1--contd_
4
452
201
98 15 88
251
278
206
186 10 ]0
72
278
45
32 13
233
652
416
13 2
401 N
136
632
87
59 2
26 1
446
422
262
194 6
60 2
180
381
258
258
103
477
161
161
316
397
281
28 2
261 N
116
402
113
96 1
14 2
289
8
70
55
50
5
15
186
175
164
21
11
129
71
65 6
58
28
18
9 N
" 10
35
17
15 1 1
N
18
7
23
22
20
2
1
31
21
21
10
26
20
20
6
8
6
4-
2 N
2
" I)
4 N 1
4
8
20
20
20
41
41
41
39
19
19
20
3
3
2 N 1
N
4
2
2 N N N
2
RAJASTHAN STATE-RURAL
540
185
116 40
108 11
86li
368
357
'75 142
119 41
11
418
817
50 100 88
5
188
689
580
153 346
64 17
9
26
14
4 8 8 1
12
28
27
8 14
2 3
1
10
7
III a a If
8
10
10
2 o 2 1
N
8
5
III a 1
8
4,
4
1 2 I
9
2
2
2
41
41
41
7
7
7
N
N
N
2
1
1
1
II
1
H If 1
t
1
1
N 1
10
2
2
21
21
21
1
N
N
N
1
1
1
K If 1
N
N
N
11
10
10
10
6
6
6
bT
N
N
:N
N
N
N
If
If
H If
11
12
21
21
21
19
6
6
13
X
N
N
N
N
N
N
111
7
2
2
IS
10
10
19
13
13
6
12
7
:.l :x i)
IS
lIS
4
3
1
11
If
If
If
11
N
N
N
N
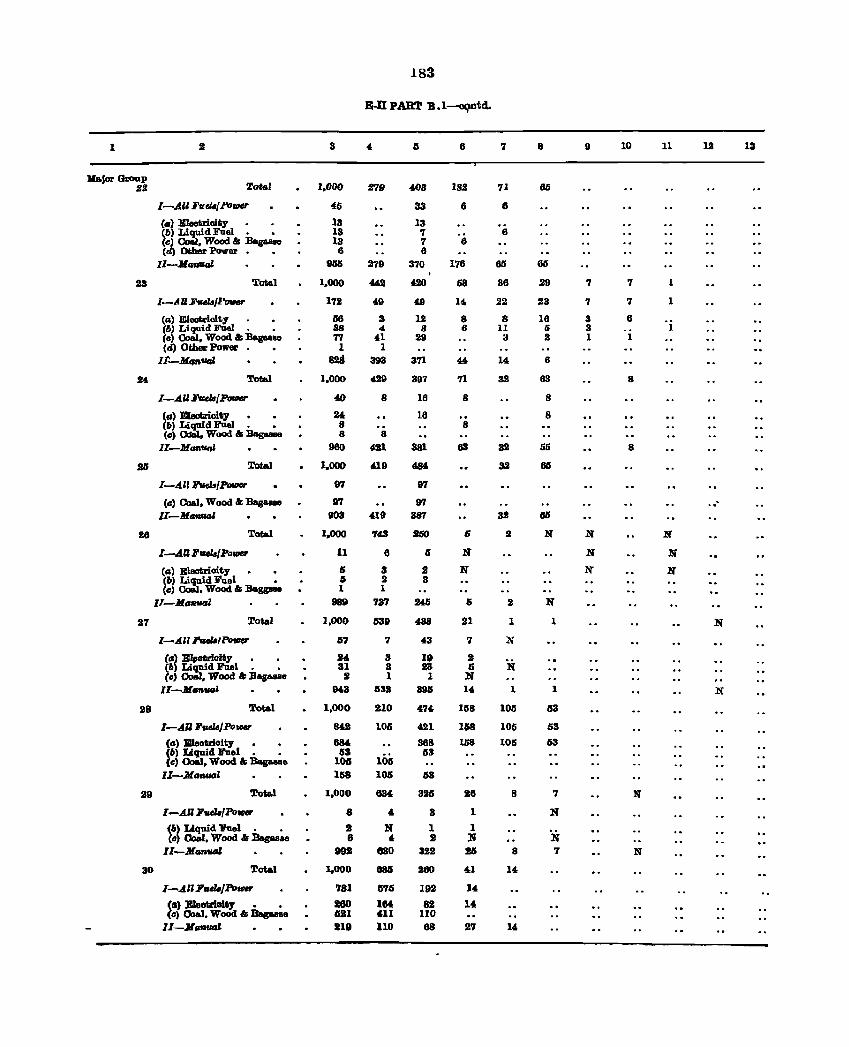
183
B-D PART B.l-oqntcL
1 2 3 4 a 6 7 8 9 10 11 12 13
Jla.jor Gzoup flS 1'0&01 1.000 279 403 182 71 66
I~AII Ffl~/Po_ 45 33 6 6
C.) Eleotrioity 13 13 (6) Liquid Fuel. • 18 7 6 (c) 00I&I. Wood & 1Jagaase 13 7 6 Cd) Other Power. - 6 6
II-}ifG __ 806 279 370 176 6li 65
28 Total 1,000 442 420 68 36 29 7 7 1
I-A 11 1i'1uJa/''mDar 172 49 49 14- 22 23 7 7 1
(GI) Eleotriaity 56 3 12 8 8 16 3 6 (6) Liquid FUel. • 8B '" 8 6 II Ii 3 1 (c) Ooal, Wood. &; BagaaEIII 77 41 29 3 2 1 1 (d) Other Power 1 1
Ir-M4R_ W 393 371 44 14 6
24 Total 1,000 429 397 71 32 63 8
I-AUFtul8/~ 4D 8 16 8 8
(a) Eleotrioity • • 24 16 8 (b) Liquid Fuel. • 8 8 (c) Odal, Wood & Bag8ll1lO 8 8
II-MGflUql 960 421 381 63 32 55 8
SIS TotaJ. 1.000 419 tIM 32 6li
l-.dn hsb/Powcr 97 97
(c) Coal, Wood. &; Bagaue D7 97 .. II-.II_1 903 419 887 32 GIS
26 Total 1.000 7«3 1160 6 2 N N N
l-AUF ... r./po_ 11 6 IS N N !if
(G) Bleotrioity Ii 3 S N N N (1'1) Liquid FUel • 6 2 3 (c) Coal. Wood &; Baggae 1 1
IT-MGIf_l 989 737 2415 15 2 !if
27 Total 1,000 1539 438 SI 1 1 N
I-A.U Pu.,Pof/1v 67 7 43 7 lS
(CI) EJ,otrioity H 3 19 2 N (PI) Liquid ll'tial. • 31 3 23 5
(c) 00&1. Wood & Bagas.e 11 1 1 N II-MCl3_' 943 53lt 896 14 1 1 N
28 Total 1,000 210 47C. 168 105 53
I-All ,.eltJJPo_ 842 105 421 168 105 53
(a) B1eotrioity 684. 368 158 105 63 (6) Liquid hal. • 53 53 (e) Coal, Wood &; Bagasse 105 105 II-M_l 158 105 63
29 Total 1,000 634 325 26 8 7 N
I-AU FueltJIPoVl8S' 8 40 3 1 N
(6~ Liquid Fuel. • 2 N 1 1 Co Coal. Wood "' .BagaaEIII 8 , 2 ].I}' N
II-MauUlll 892 830 322 25 8 7 N
30 Total 1,000 686 260 4.1 14
I-All Fud6jPo_ 781 6715 192 14
~") Eleotriolty • • 280 1M 82 14: c) Coal. Wood "' Bagasse 1521 611 110
l.l-MafltJtJl 219 110 68 27 14
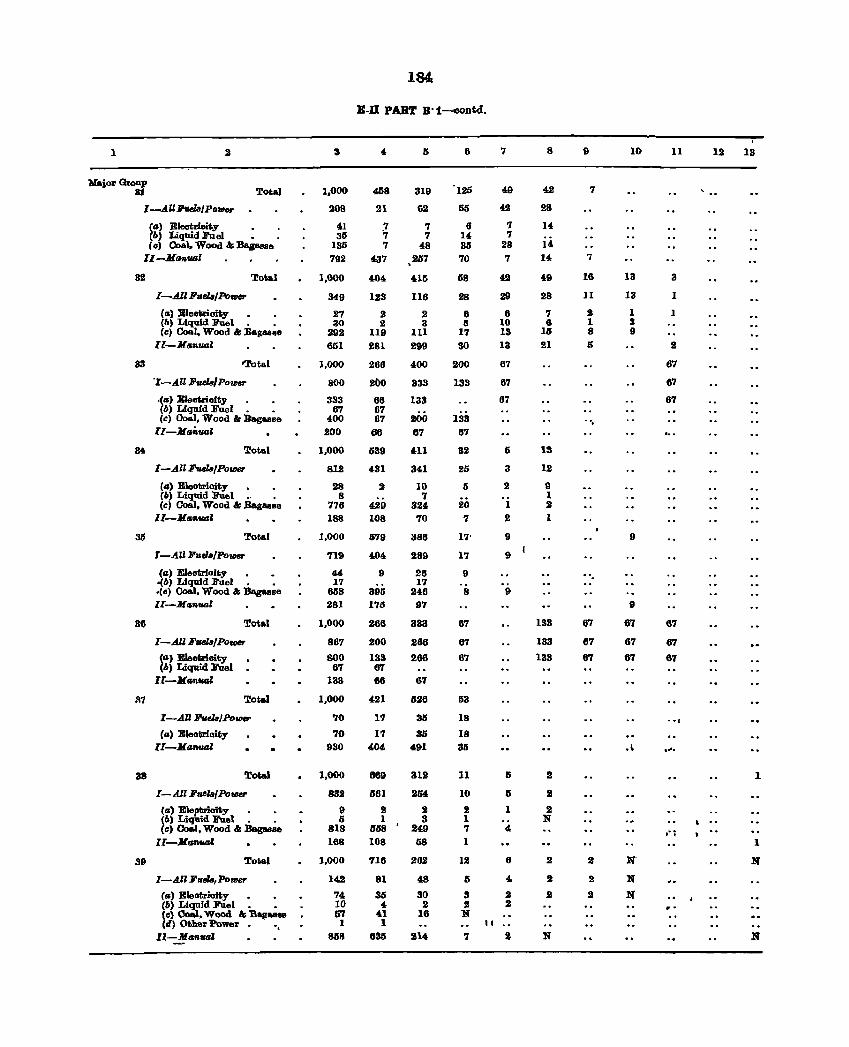
1 It
Major Group a1 Total
I ---.AU Ji'Uela1 Power
(II) Eleotrioity 0
(6) Liquid Fuel 0
(c) Ooal. Wood & Bagll8lle II-M"",,_l
32 Total
I-All Fuu./Po_
(II) Eleotrioity (b) Liquid FUel 0 0
(c) Ooal, Wood & Bagas8e II-Mllnuo.l
33 'Total
36
36
117
38
39
·I-All P"elB/Po'IIJer
.(11) Eleotrioity {b> Liquid Fuel 0 0
(cl 00&], Wood & Baguse ll-MtSRUII'
Total
I-.A.II helB/PotDer
(4) Eleotrioity (6) Liquid FUel o. ,
Ccl Ooal, Wood & Bagasse II-MII_l
Total
I-All Pue1It/Power
(a) E1eotrioity o(b) Liquid FUel, , .(c) Coal, Wood &I Bagasse II--Mllnuo.l
Total
I-All Ji'.elB/Po_
(II) Eleotrioity (b) Liquid FUel
II-MllnUtJI:
Total
I-AlIlJ'udtt/Po_
(a) Eleot;rioity II-Ma'llUlll
Total
I-All F~"'IPo_
(II) Eleotrioity (6) LiqUid lI'uel, , (c) Coal, Wood & Bagasse
Il-Mamu:d
Total
I-AUPIIN,Po_
C II) Bleotrioity (6) Liquid Fuel, • (c) Ooel, Wood & 'Bagasae (el) Other Power "
Il-Mall"al
3
1,000
208
41 35
135 792
1,000
349
27 30
292 651
1,000
800
333 67
400 200
1,000
812
28 8
776 188
1,000
719
44 17
658
281
1,000
867
SOO 67
133
1,000
'10
'10
930
1,000
832
9 I;
818 168
1,000
142
74 10 67
1 868
184
Boll PART Bo1-oontdo
458
21
5
319
62
.7 7 7 7 7 48
437 ,257
404
123
2 2
119 281
266
2bo
66 67 67
66
539
431
2
429 108
579
404
9
395 173
266
200
133 67 66
421
1'1
17 404
889
561
2 1
558 108
716
81
3li 4
41 1
835
415
116
2 3
III 299
400
333
133
200 67
&11
341
10 7
324 70
386
289
26 17
246 97
333
266
266
67
526
3lI
35 491
312
254
2 3
2'11 68
262
48
30 2
16
214
6
'125
55
6 14 35 70
58
28
8 5
17 30
200
133
133 67
32
25
5
20 7
17'
17
9
8
67
87
67
1i3
18
18 31i
11
10
2 1 7 1
12
7
49
e 7 7
28 7
42
29
8 10 13 13
67
67
67
6
3
2
1 2
9
9
9
5
5
1
4
6
5 4
3 2 2 2
N II
7 It
8
42
28
14
14 14
49
28
7 6
15 21
13
12
9 1 2
1
133
133
133
II
II
2 N
2
2
2
N
9
7
7
16
11
2 1 8 5
67
67
67
2
2
2
10
13
13
1 3 9
9
9
67
67
67
oL
N'
N
N
11
3
1
1
2
67
67
67
67
67
67
'0'
... '.
, .
1.2 13
. .. 1
1
N
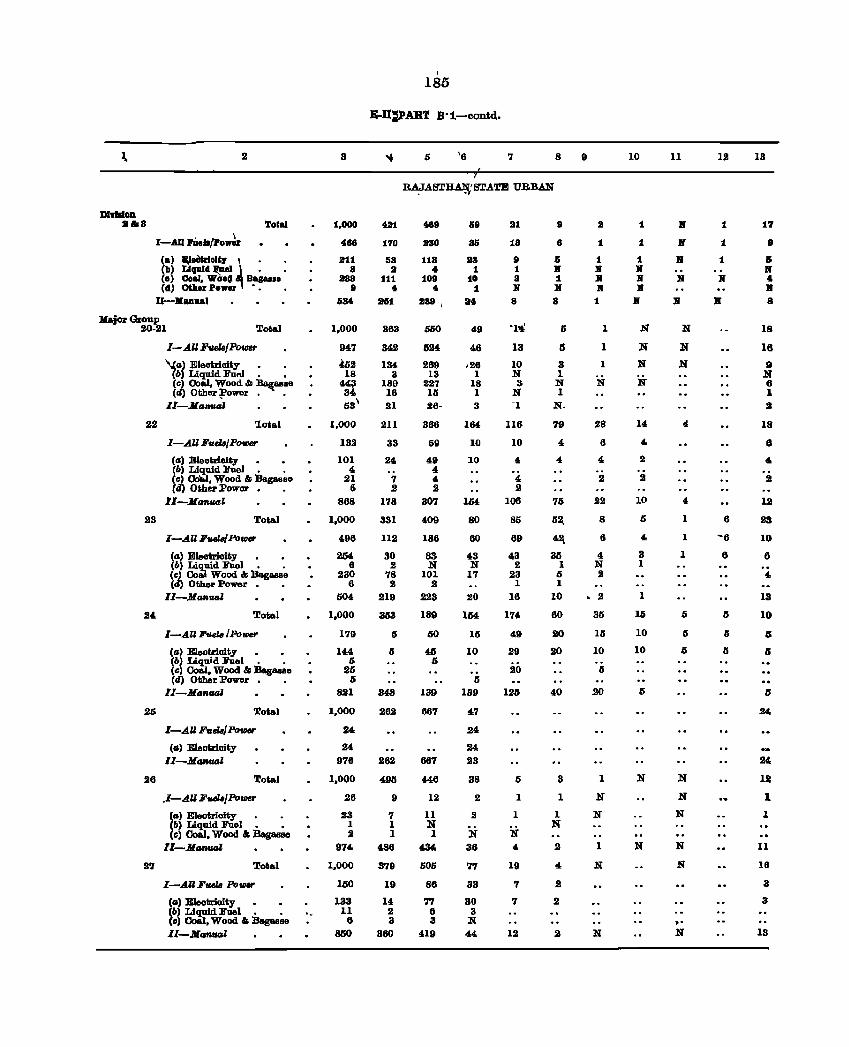
DI'IIIlon .&8
2
Total
I-AU h8"/PO~ (a) _.URleIQ I . . (b) Uqllld ~el ~. • (e) CeaJ, WGe' Ba,lIA. (4) O&har Power '. •
U-Kanual
Major Group 20.21 Total
22
1-All Fuel8/ Power
\Ca) Eleotrioity • • (6) Liquid FUel. • (c) Coil, Wood & :Ba~asse (d) Other~ower •
II-Man_1
'lotal
I-All Fuel8/Po_
(a) Eleok"loity (6) Liquid FUel. . fc) Oda.I, Wood & Bagasse (d) Othlll'Powor. •
11-JL __ 1
23 Total
I-AU Fuels/PolDer
(a) Eleotrioity • • (6) Liq_uid FIleI. • (c) Co8.1 Wood & Bagasse (d) Other Power. •
II-Ma,uud
24. Total
25
26
27
I-All Fuel8/PoUJe1"
(a) Eleotrioity • (6) Liquid Fuel. • (cl Coal, Wood & Bagasse (d) Other Power •
II-Aianuol
Total
I-All Fuel8/Po_
(a) Eleotrioity
II-Aia'Hlrd
Total
.I-All Fuel8/PolDflr
(a) Eleotrioity • • (6) Liquid Fuel. • (cl Coal, Wood I; Bagasse
II-Marw.aZ
Total
I-AnF". Po_
(a) Bleotrioity (6) Liquid Fuel. • '. (CI) Coal, Wood & Bagasse II-Manual
3
1,000
488
211 8
lI88 9
584
1,000
947
452 18
~l 53'
1,000
132
101 4
21 IS
868
1,000
496
254 6
230 6
504
1,000
179
144 5
25 5
821
1,000
24
24 976
1,000
26
23 1 2
974
1,000
150
133 11
6 850
I
185
~-n=,AR'l B·i-wntd.
'6 7 8
RJ¥AST~STATE URBAN
4111
1'70
53 2
111 4
251
363
342
134 3
189 16 21
211
33
24
., 2
178
331
112
30 2
78 2
219
353
5
5
348
262
2~
495
9
7 1 I
486
379
19
14 2 3
360
469
a30
118 4
109 .. aa9 I
650
524
269 13
227 15 26-
366
59
49 4 4 2
307
409
186
83 N
101 2
223
189
50
45 5
139
667
66'1
446
12
11 N 1
434
505
86
7'1 6 3
419
59
ali
28 1
10 1
at
49
46
.26 1
18 1
3
164
10
10
154
80
60
43 N
17
20
154
15
10
5 139
4.7
24
24 23
38
2
2
N 36
7'1
33
30 3
N 44
al
18
9 1 8 X
8
13
10 N 3
N -1
116
10
4
4 2
106
85
69
43 2
23 1
16
174
49
29
20
1.20
5
1
1
N 4
19
., .,
12
9
8
5 X 1 l(
8
5
IS
3 1 N 1
N.
'18
4
4
75
52,
~ 35
1 5 1
10
60
20
20
40
3
1
1 N
2
4
2
2
2
9
II
1
1 X l(
X 1
1
1
1
N
28
6
4
2
22
8
6
4 N 2
• 2
35
15
10
5
1
N
N
1
N
N
10
1
1
1 X X l(
l(
N
N
N
if
14
4
2
2
10
5
4
3 1
1
15
10
10
5
N
N
11
l(
If
X
N
l(
N
N
N
4
4
1
1
1
5
5
5
N
N
N
N
oN
O'
N
12
1
1
1
X
•
6
-6
6
5
Ii
5
13
17
8
& N .. If 8
18
16
9 N 6 1 2
18
6
4.
2
12
23
10
6
4.
13
10
5
5
24
12
1
1
II
18
3
3
13
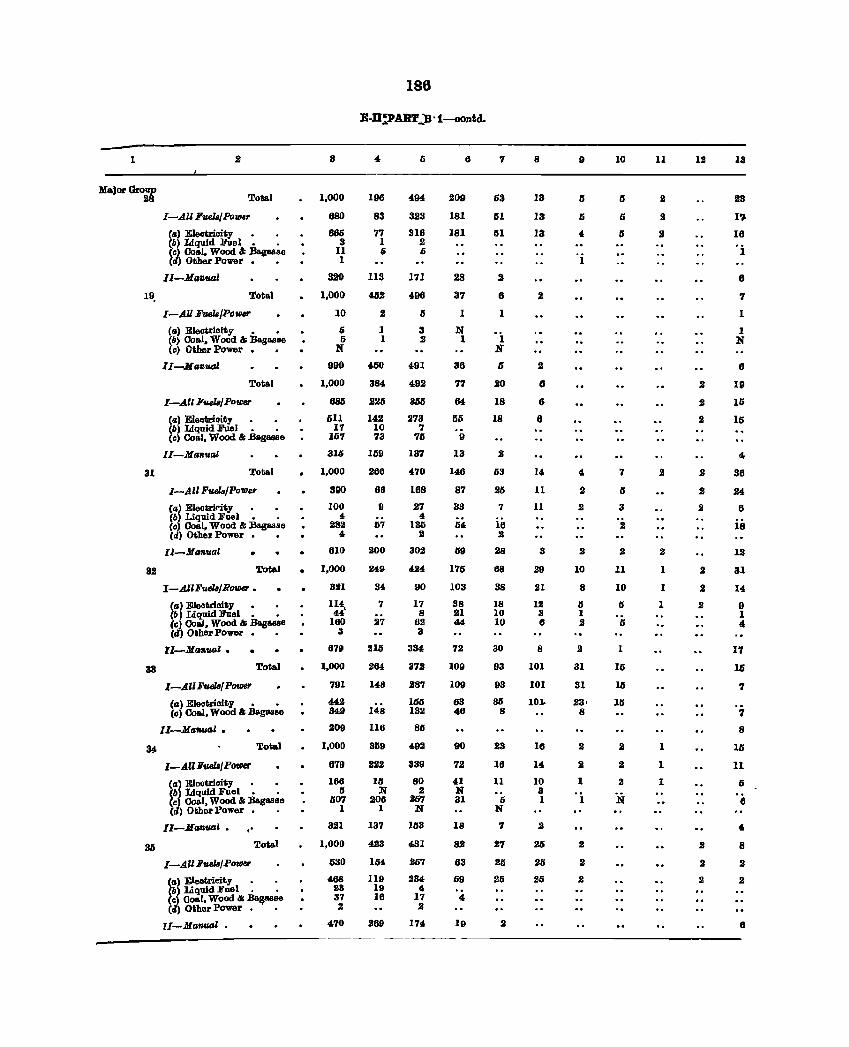
1
Ma.jor Group 28
19,
31
32
33
Total
I-All Fvel8/Powe,.
(a) Eleotrioity (6) Liquid FUel ° 0
Ccl Coal. Wood & .Bag8llse Cd) Other Power °
II-MaBUfJl
Total
I-AU FVAl8jPo_
(a) ElectrIcIty ° ° (0) Ooal. Wood &; Bagasse (c) Other Power °
II-Manual
Total
I-All Fuel8j Power
(a) Eleotrioity (b) Liquid Fuel. 0
(c) Coal, Wood & Bag8llse
II-MaRual
Total
I-All FueJ../POfD6f'
Ca) Eleotril'ity ° ° ell) Liquid Fuel ° • (c) Ooal, Wood &: :B&guse (d) Other Power ° •
II-Manual • Total
I-AlIFuel8jRower °
Ca) EleCltrioity ° • (6) Liq_uid Fuel. • (c) Ooal, Wood '" Bagasse (d) Other Power ° °
II-Mllnual •
Total
I-AllFuel8/P-
(a) Eleotrioity ° • (c) Coal, Wood'" Bagasse
II-MII",ual •
Total
I-AUlluels/ POTIII?f'
(a) Eleotrioity (6) Liqllid Fuel. . (e) 00801, Wood'" Bag&!!se (d) Other Power. •
II-J[a",ual ° "
Total
I-A~llluel8fPolDer
(a) Eleotricity (b) Liquid Fuel. • (c) 00801. Wood 0'lil Ba~asse (I) Other Power. •
l/-Manual •
8
1,000
680
666 3 II 1
320
1,000
10
Ii Ii
N
990
1,000
6&5
611 17
1117
316
1,000
390
100 4
282 4
610
1,000
321
114 44<
160 3
679
1,000
791
4@ 349
209
1,000
679
166 5
1107 1
321
1,000
1130
468 23 37 2
470
196
83
77 1 Ii
113
~2
2
I 1
450
384
220
142 10 73
169
266
66
II
67
200
2411
34
7
27
215
264
148
148
116
359
222
III N
206 I
137
423
154
119 19 16
269
188
II
494
323
316 2 6
171
496
5
3 2
491
492
356
273 7
76
137
470
168
27 4
136 2
302
424
90
17 8
62 3
334
372
287
1M 132
811
492
339
80 .2
257 N
163
431
257
234 4
17 2
174
6
209
181
181
28
37
1
N 1
36
77
64
56
9
13
146
87
33
54
59
175
103
38 21 44
72
109
109
63 46
90
72
41 N 31
18
82
63
69
4
19
7
53
51
51
2
6
1
°i N
6
20
18
18
2
63
26
7
16 2
28
68
38
18 10 10
30
93
93
86 8
23
16
11
5 N
7
27
25
25
2
8
13
13
13
2
6
6
6
14
11
11
3
29
III
III 3 6
8
101
101
10}'
16
14
10 3 1
2
25
25
115
9
6
5
4
1
4
2
2
2
10
8
" 1 2
2
31
31
23· 8
.2
2
1
1
.2
.2
2
10
5
5
5
7
Ii
3
2
2
11
10
5
5
1
16
16
15
.2
2
2
N
11
2
2
.2
2
1
1
1
1
1
1
2
2
2
.2
2
2
2
2
.2
13
23
1'].
16
I
6
7
1
1 N
6
19
15
15
4
36
24
6
iii
12
31
14
9 1 4.
17
16
7
7
8
15
11
6
6
4
8
J
.2
6
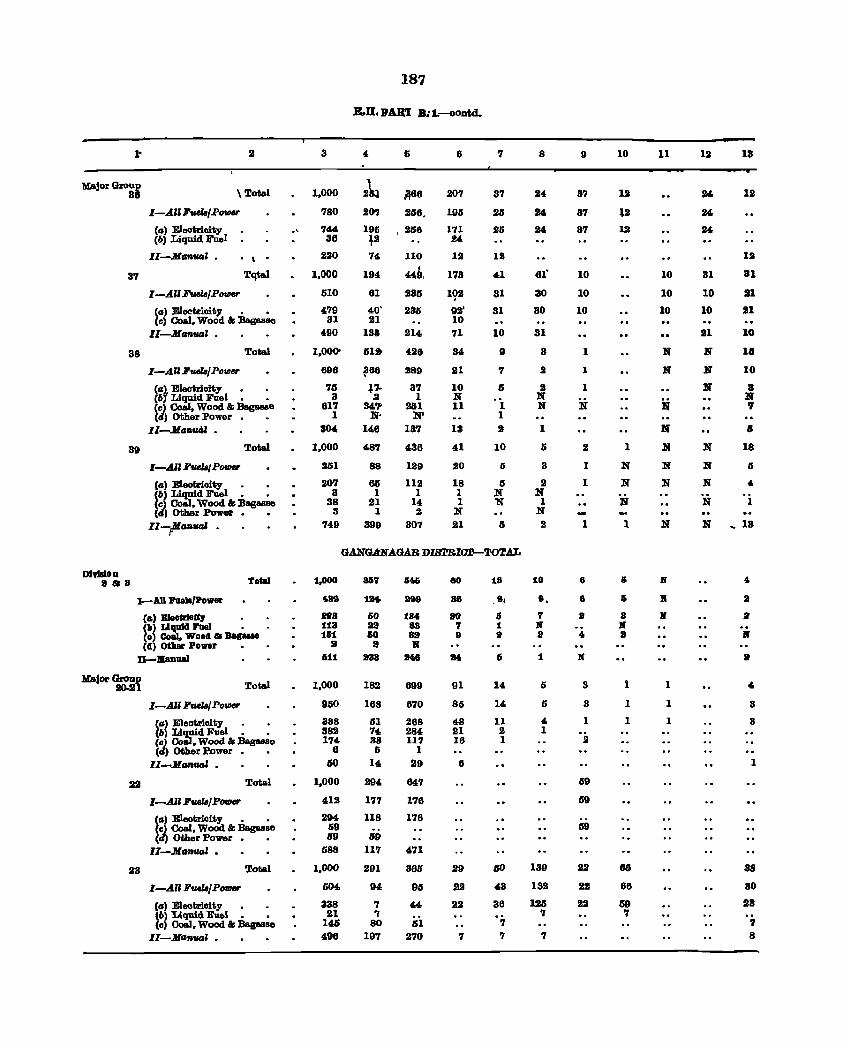
MaJor Group 88
37
38
89
mvlllOD .&8
2
\ Total
.I-AU 1!vels/POIIIU'
(a) Eleotriaity (b) Liquid Fuel
Z.l-Manuol • . , Tqta.1
.I-AUll'uelll/P_
(a) E100trioity • • (Il) Coal. Wood & Baguse
II-MafluoJ •
Total
.I-AU Fuez./Po",er
(al Eleotrioity • • (bY Liquid Fael. • (Il) Coal. Wood & Bagasse (d) Other Power
II-ManuGJ •
Total
I-All Fvels/P_
(a) Eleotrioity (b) Liquid Fuel. • (Il) Coal. Wood & Baguso (tI, Other :Power. •
.II-fMaf&UG1 •
Total
I-AU JhlaJaJPower
(a) EleetrJeKy (b) Liquid l'ual • (0) Coal. Wood &; Bapue (4) OOlor Power
n-lIImual
MaJor(koup 20-21
28
Total
I-An FudB/PolIJeI"
(a) Eleotrioity • • (b) Liquid Fu81. • Ccl CoIiJ. Wood & Bag&llse (d) Other PDwer. •
II-MGf&UGl •
Total
I-AU FudBlP(1IJ1N'
(a) Eleotrioity • • (c) Coal. Wood & Bagasse (tI) Other Power. •
II-Maf&UGJ •
Total
.I-All FtHl8/P_
(a) Eleetrioity (b) Liquid E'uel. • (a) Coal. Wood & BagUBe
II-Maf&UG1 •
.'
3
1.000
780
744 36
220
1.000
510
470 31
490
1.000'
696
75 3
617 1
304
1.000
261
207 3
38 8
749
1.000
4.89
aaa 113 161
8 lill
1.000
950
388 382 174
6
&0
1.000
412
294 59 69
588
1.000
604.
338 21
145 406
187
B.JI.IJAIl'! B: l.-oontd.
4
20'1
6
A66
256.
195 ,266 l2 74
194
61
40' 21
133
51g.
il86
l-'J. -2
84? N'
146
487
88
85 1
21 1
399
110
449, 235
235
214
42&
289
37 1
261 N'
13'1
436
129
112 1
14 2
307
6
207
105
171 24
12
1711
192
02' 10 71
84
21
10 N 11
13
41
20
18 1 1
N 21
7
37
25
26
12
41
81
31
10
9
'1
&
1 1 2
10
I)
5 N N
GANGANAGAR DISTRlaJ.'--TOTAL
857
tat.
60 aa 60
• 238
182
168
lSI 74 38 Ii
14
29'
177
118
59 117
291
94 ., 7
80 197
699
670
268 284 117
1 29
647
176
176
471
365
91S
" &1 270
60
as ."
7 9
91
85
48 21 16
6
29
22
22
7
18
14
14
11 2 1
60
43
36
'7 7
8
61'
30
80
31
8
2
2 N N
1
&
3
2 N
1 N 2
10
9.
f :R a
1
IS
IS
4 1
139
132
126 ., 7
9
37
37
37
10
10
10
1
1
1
N
2
1
1
1
8
6
B
3
3
1
2
59
69
59
22
22
21
10
12
t2
12
1
N
N
N
1
6
6
3 :R It
1
1
1
86
66
69 .,
11
10
10
10
N
If
ii If
N
If
N
If
:R
B
l!I'
1
1
1
12
31
10
10
21
N
N
If
N
13
12
12
31
21
21
10
UI
10
3 N ., a
18
N Ii
N 4-
N 1
N _ 13
4.
II
:It
If
4-
3
3
1
38
30
23
7 8
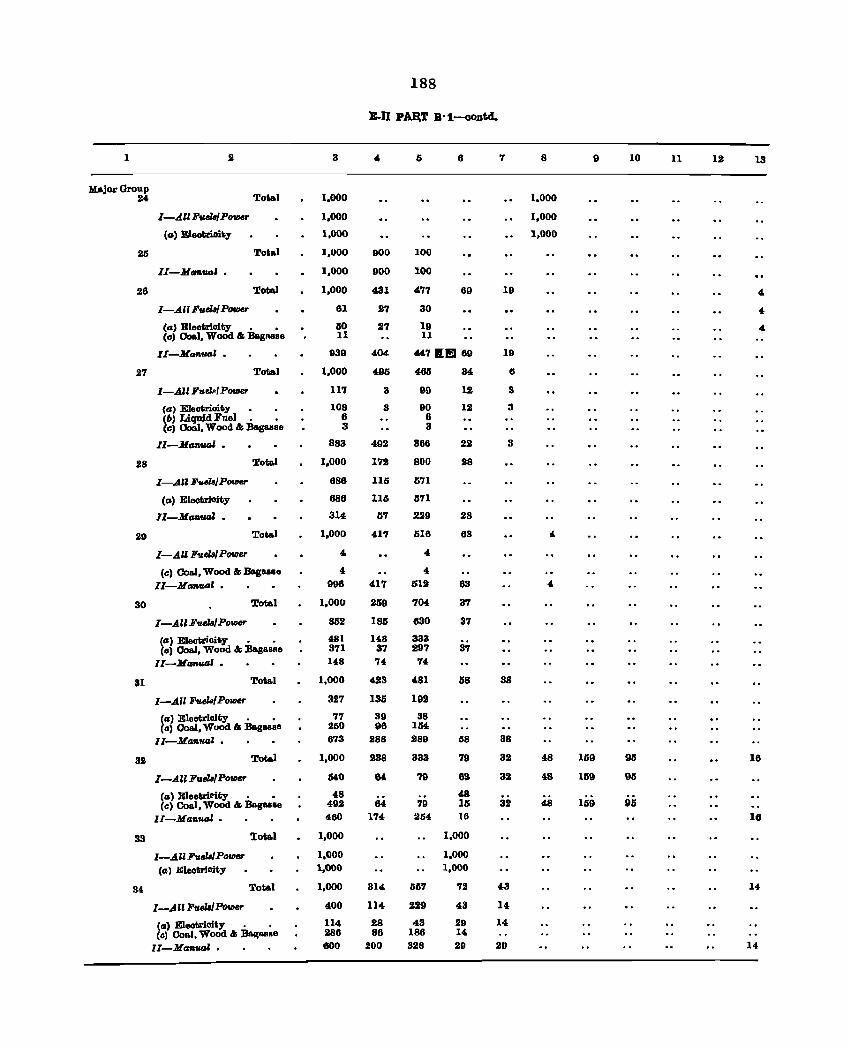
188
B-U PAI\T B·l-oo.otd.
1 2 3 6 7 8 9 10 11 12 13
Major Group 24 Total 1.000 1,000
I-AlIF.w./Povnr 1.000 1.000
(II) Eleotriaiiy 1,000 1.000
25 Tot&l 1.000 gOO 100
II-MGA,"d. 1.000 900 100
28 Total 1.000 431 477 69 19 4
I-AU FuelB/ Power 61 27 30 4
(d) Electrioity • • ISO 27 19 4, (c) 00&1. Wood 6; Bagasse 11 11
ZI-MGA"ud • 1139 404 447 lUll 69 19
27 Total 1.000 490 465 34 6
I-AU Fuel./ POUIer 117 3 99 12 3
(a) Eleotrioity 108 3 90 12 3 (b) Liquid Fnel. • 6 6 (c) 0001. Wood 6; Bag&ll8e 3 3
II-Manual • 883 492 366 22 3
28 Total 1.000 172 800 28
I-All FuiZ./P_ 686 115 571
CCI) Eleotrioity 686 115 571
II-ManUGI • 314 57 229 28
29 Total 1.000 417 518 88 4.
I-All FuelB/PWleT 4- 4-
(e) Co&l. Wood 6; BagasBe 4. 4-
lI-Ma_' 996 417 512 83 4
30 Total 1.000 259 704 37
I-AU FuelB!Power 852 185 630 37
~a) Electrioity • • 4.81 148 333 eo) CoaJ, Wood & B&gaBl'le 371 37 297 37
lI-M __ ' • 14.8 74 74
31 Total 1,000 423 481 58 38
I-All Fuels! Power 327 135 192
(II) Eleotrioity • • 77 39 38 (0) 00&1, Wood 6; Ba.gBBBe 250 98 1M
lI-MaAual. 678 288 289 58 38
32 Tot&} 1.000 238 333 79 32 48 169 95 16
I-All FuelBIPolIJ8f' 540 64 79 63 32 48 159 95
(II) Eleotricity • • 48 48 (c) Co&l. Wood 6; Ba.gBBBe 492 64 79 16 32 48 159 95
Il-MaAual • 460 174 254 16 16
33 'Iotal 1.000 1,000
I-All FueJB/PolI.'U' 1,000 1,000
(a) Eleotricity 1.000 1,000
34 Total 1,000 314 557 72 43 14
I-All PuelB/ POIIJ8f' 400 114 229 43 14
(II) Electrioity • • 114 28 43 29 14 (c) Co&I, Wood & Ba.p:IloIIBe 286 86 186 14
II-Manual. 600 200 328 29 2D 14
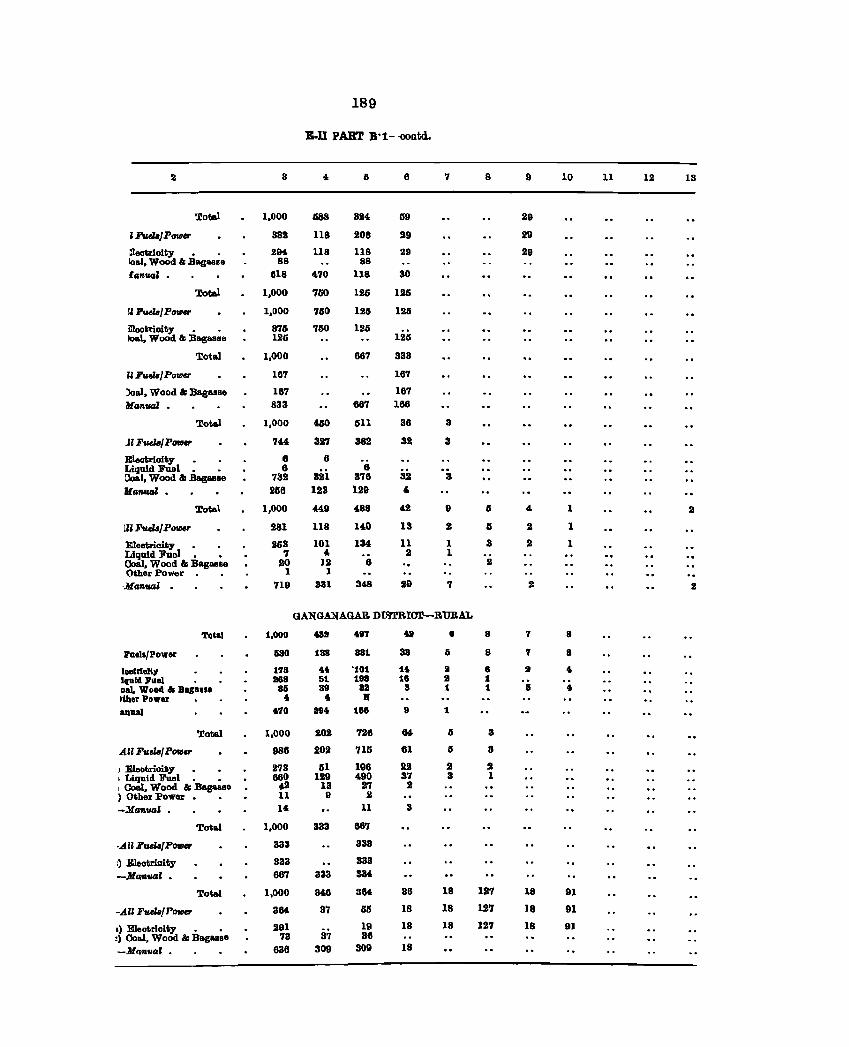
189
E.ll PART B'1- -oontd.
2 3 4 5 8 7 8 9 10 11 12 13
Total 1.000 Ii88 824 59 29
l1!'v.dsJPOIDer 382 U8 208 29 29
:leotriolty • • 21K U8 118 29 29 Ioal, Wood'" Bagasse 88 88 {GnUCII • 818 4'70 118 30
Total 1,000 'JGO 126 125
r, PtHlBj Po",er 1,000 '760 125 125
llleottioity • • 876 700 126 :Oal, Wood'" Bag&8BII 126 126
Total 1,000 687 333
UFuez.jPo'lPl/W' 187 18'7
)Gal, Wood &; Ba.guBII 187 167 HGnUCIl • 833 68'J 186
Total 1,000 &00 611 38 3
.11 FutlB/ POlDer '7" 327 382 32 3
Jl:leottioity 6 6 LiQuid Fuel. • 6
8ii 6
Ooal, Wood &; BagBBBe 732 8'78 32 3 HGlluM • 268 128 129 ,
Total 1,000 449 488 42 9 6 4 1 2
lU 1!'v.ez./ P_ 181 118 140 18 2 ,; 2 1
Eleatricity 253 101 134 11 1 3 2 1 Liquid Fuel. • 'J 4 2 1 Coal, Wood 6; Bagasse :SO 12 8 2 Other Power 1 1
-J(G_I 719 331 348 29 7 2 2
GA1iGA..~AGAB DL'RBIOT-RURAL
Total 1,000 40111 4087 40a 8 8 7 8
I'uels/Power &80 138 881 33 & 8 7 8
'BOkloU)' 178 4040 '101 it II 8 a 40 Iquld Fuel 888 51 188 18 a 1 oal, Wood &; Bagasse 85 89 sa 8 1 1 5 40 Ither Power • • l(
anual 1'l0 a840 188 8 1
Total 1,000 202 726 64 IS 8
An Fadsl Poyer 986 202 '716 61 Ii II
, Eleotrioity • 2'13 51 108 22 2 2 , Liquid Fuel. • 880 129 400 37 3 1 , Coal, Wood &; Baguse 42 13 2'7 2 ) Other Power 11 9 2 -MGnUCII • 14 11 3
Total 1,000 333 687
·.AU FtUI4/Pouer 333 338
I) Eleotrioity 333 333
-MClllIUJZ • 687 333 334
Total 1,000 346 384. 36 18 12'7 18 91
-All Fuds/P_ 364 3'7 55 18 18 127 ]8 91
.) Eleotrioity • • 291 37 19 18 18 127 18 91 :) 00801, Wood &I Baga.s.e '73 38
-M 1111"0.' • 636 309 309 18
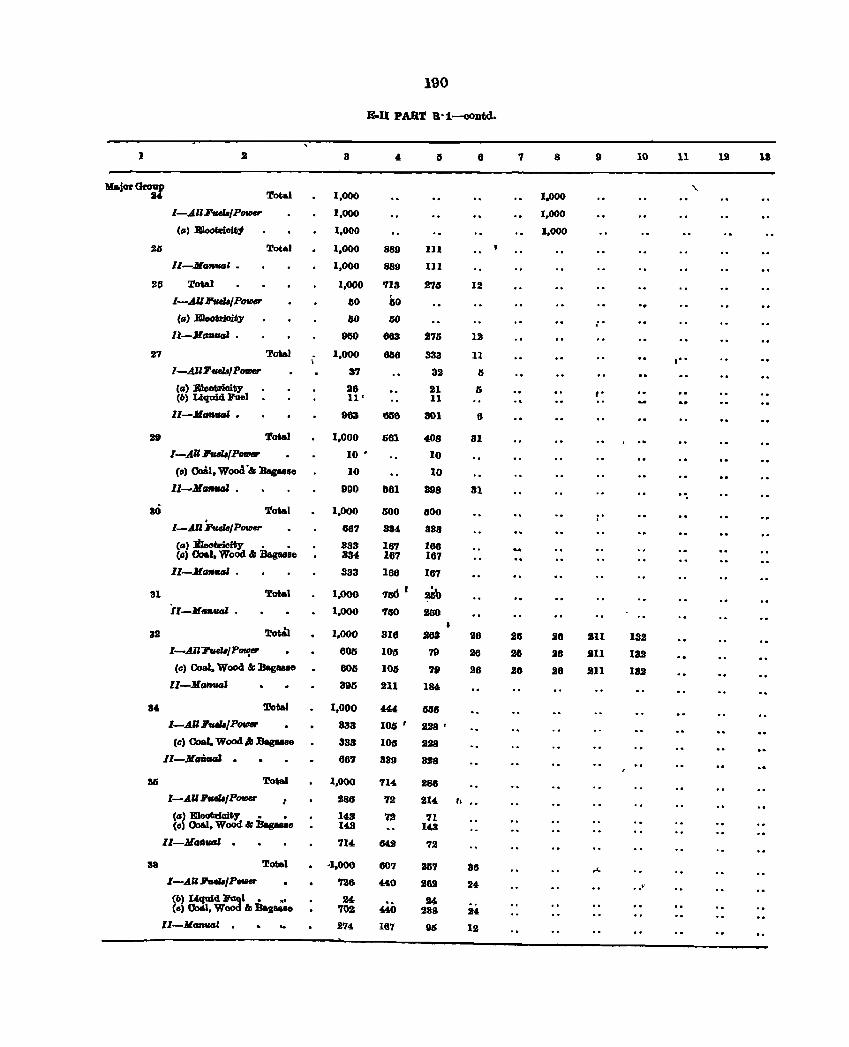
190
&U PART B·1-11Ontd.
1 3 8 7 8 9 10 11 12 13
MaJor GJ:oup " 2~ Total 1,000 1,000
I-All.FueZ./P_ 1,000 1,000
(II) Eleotrioit1 1,000 1,000
23 Tot •• 1,000 889 III
11-1111.1"_' • 1,000 889 III
26 Total 1,000 713 276 12
I-AUlJ'fHllI/P_ 60 30
(II) .EJeotrioiliy lW lW ;. ll-M_UGJ . 950 683 275 12
27 Total 1,000 1136 333 11 " . I-AU FudB/P_ 37 32 15
(1.1) EIeotiriofty 2& 21 5 , . (b) Liqtdd FueJ II' 11
II-JlIPHIGI • D63 6GB 301 6
2. Total 1,000 561 408 31 . . . I-All 1I'ul6/P_ 10 • 10
(c) 00&1, Wood.·&; :Bagaalo 10 10
Il-MtlfIfIIIJ 990 &61 398 31
sci Tot&l 1,000 500 600 .. .. I-AIl~/P_ 887 334 333
(II) EJeotricity • • 838 187 168 (0) Coal, Wood &; BagRIIBe 334 167 167
11-MQfJUtJl . 333 166 167
31 Tota.l 1,000 7&4 I ~ II-M-.UGJ • 1,000 750 160
32 Tot&l 1,000 316 263 26 26 26 211 132 l-AII'FudB/PMI!r.r 606 105 79 26 28 26 211 132
(c) Coal. Wood. &; Bagaa.e 806 106 79 26 26 26 211 132 ll-MGfIoUGJ 3915 211 184
34 Tot&1 1,000 444 1iS6 I-AU FvtiM/P_ 333 106 f 228 •
(e) Coal. Wood", lJaguBe 333 1011 228
11-lLrm-J · 667 339 328
S5 Tot&I 1,000 714 286
I-All FfMII/P_ I 286 72 214 r. (IJ) Eleotrlcity • • 143 72 'll (0) Oo&l. WoOd &; :&paBD 1.:1 143
11-lLotl._1 · 714, 842 '12
38 Totel .1,000 607 35'1 88 .J"
l-AU:Ji'ver./P_ '126 '"0 2U 24 ,.
(b) Liquid ~I • ., 24, «0 24 (e) Ooai.l, W 61 Bagaalle '702 238 24
II-MGfiucU · .. 2'14 187 95 12
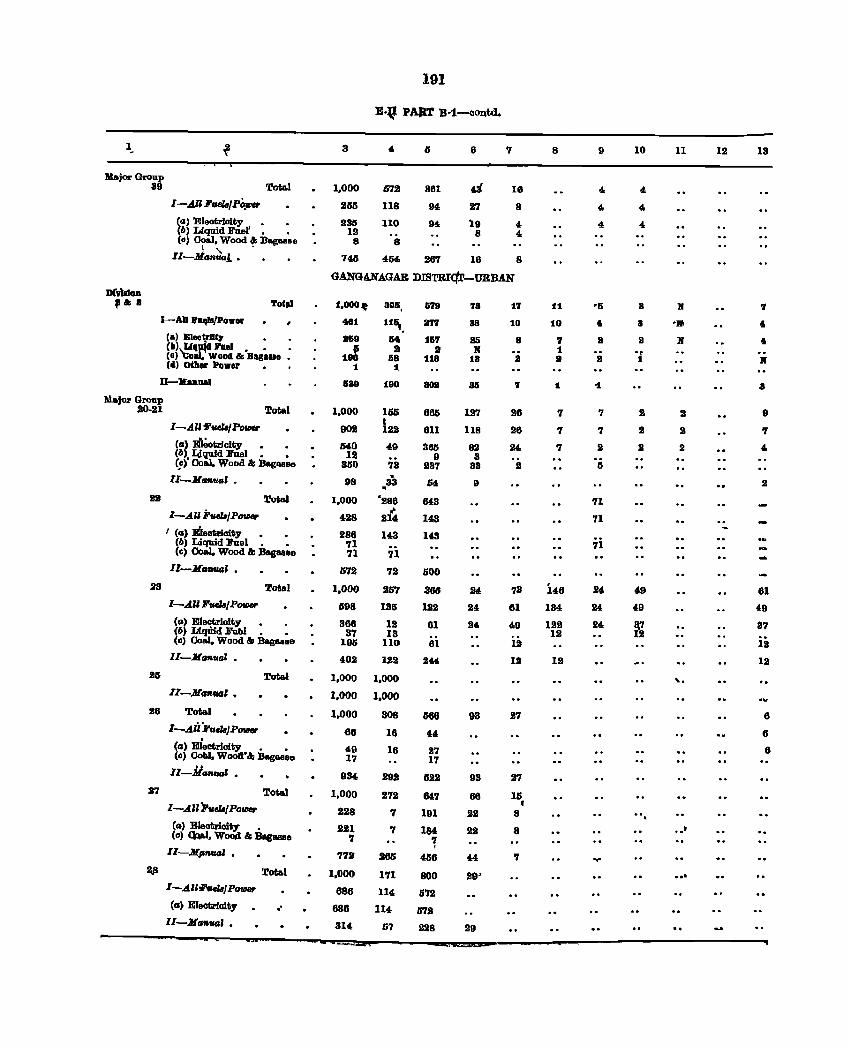
191
E.\! PAJlT B·1-oontd.
I. ~ 3 4 li 6 7 8 9 10 11 12 13
MAjor Group 39 Total 1,000 572 861 ,:/ 16 4 4
I-All hBlII/ Pol"" 265 118 94 27 8 4 4 (0) ~Ieotrioity 285 110 94 '10 4 4 4 (6) Liquid Fuel'. • 12 8 4 (c) Coal. Wood'" BaglWl86 8 8
II-.Jon~!. -. • 745 4M 267 16 8
GANGANAGAR DIS1'Rr<f.r-UKBAN DrvlaloD
P"" 8 Totlll 1.000~ 801i, 679 78 17 11 '6 8 X 7
I-AU 1'a~/Pow8r I 0181 111\ 3'l7 88 10 10 • 8 '110 4 (a) Blee&rlliJ' • 269 64 157 85 8 7 8 8 II • (II) Uq~ hel • •
1.J '" '" K 1. .. (e) 'Coat. Wool"" Bagsull 1S8 118 18 8 a 2 1 X (d) other Power 1. 1.
n-][anUlll 1189 190 8011 86 7 1. of 8 I4.ajoz Group
20-21 Total 1.000 166 666 127 26 '1 7 2 2 9
I-A"~uelB/Po_ 902 t 122 611 118 26 7 7 2 2 7
(ai. m80tricity • • MD 4,9 385 82 24. 7 2 2 2 " (6 14quid Fuel. • 12 0 3 's ~t 00 .... Wood &; Bagaalle 350 73 S37 33 S II-M_-' . 98 33 . 5f, 9 2
22 Total 1.000 "286 M3 71 I-.AII Fud6/P_ ".
71 428 214 148 I (a) :Weotricity • • 286 148 1!13
(6) Liquid Fuel. • 71 71 (Il) Coal, Wood &; Bagaslle 71 71
II-MCI_I, 572 72 600 23 Total 1,000 267 366 24 78 146 24. 4.9 61
I-All FuelB/P_ 598 135 122 2f, 61 1M 24 49 49 (a) Eleotrioity • 366 12 61 2f, 49 122 24 N 37 (6) UqUid Fo"I. • 37 13 12 (c) 00aI. Wood & BagUBo 195 110 61 12 III
Il-M_ual . 402 122 244 12 12 12 21S Total 1,000 1,000 \0,
I.l-MGf'fMlI , 1,000 1,000 26 Total 1.000 308 566 98 27 6
I-.Ali 'uelBlPo_ 68 18 44 6 (a) Eiectrioity • • 49 16 27 6 (0) CoM. WoOa"& BagaeIlO 17 17
II-M_val • 934 292 622 93 27 27 Total 1,000 272 647 68 1&
I-.Allil"elB/Po_ J
228 7 191 22 8 .. . (CI) Bleotrioity • 221 '1 1M 22 8 . .. (c) ClAal. Wood &; BagSSIlO '1 7
I II-Mp1lftGi • 772 286 466 44 '1 ...
2JI Total 1.000 171 800 29' .. , I-.AlI"vclB/P_ 686 114 672 (II) Eleotrioity
" 688 114 672 I1-MCI_I. 314 57 228 29
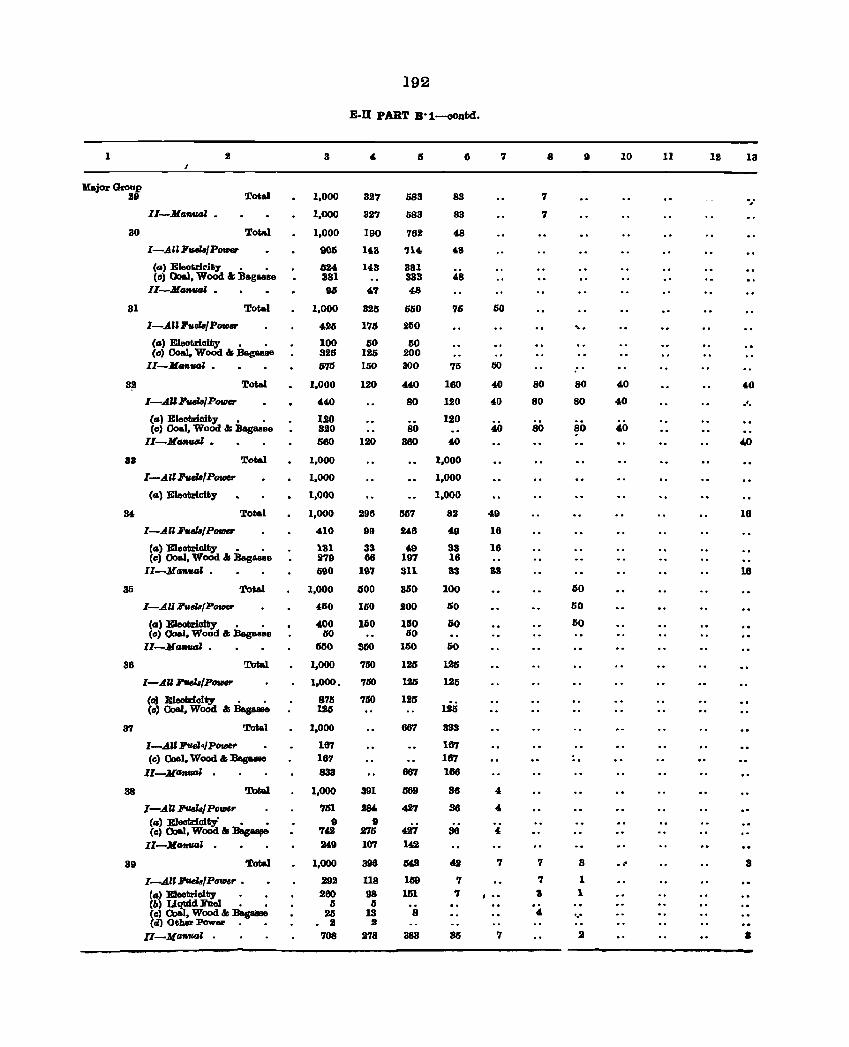
192
E-D PART B·1-oontd.
1 2 3 5 6 7 8 9 10 11 12 13
Major Group 29 Total 1,000 327 583 83 7 ,
II-Man_' 1,000 327 583 83 7
30 Total 1,000 190 762 48
I-AU FueZa/P_ 905 148 '114 48
(a) Eleotrieity . • ~24 143 381 (0) Ooa.l, Wood & ]3aglWls8 381 333 48
II-M--Z • IllS 4,7 48
31 Total 1,000 32lS 6liO 76 50
I-AU hlll8/ POlDer 4,25 175 250 ... (1'1) EJeot;r.iaity • , 100 50 lIO (0) Coal, Wood &; BaglWlse 326 125 200
II-Man_l. 675 150 300 71S 50
3~ Total 1,000 120 440 160 40 80 80 40 40
I-AJIPtulBjPOIDer 440 80 120 40 80 80 40 .', (ta) Electrioity • • 120 120 (0) 00&1, Wood &; Bagasse 320 80 40 80 80 40
II-Mta,,_, • 660 120 380 40 40
33 Total 1,000 1,000
I-AllF .. !P_ 1,000 1,000
(a) Eleatdcity 1.000 1.000
34 Total 1,000 298 lStl7 82 49 16
I-All Fv..z.!P_ 410 99 246 49 18
Ca) Eleotrioity • • 131 33 49 33 18 (c) Coal, Wood & Bagasse 279 68 197 18
II-MII,""d • 590 197 311 33 33 lCS
35 Total 1,000 500 350 100 50
I-All F .. al8/P_ ,,50 150 200 ISO 50
Ca) E1eotrioity • , 400 100 150 50 ISO Cc) Ooal, Wood &; Bagasse l)O 50
II-MI'I_I. 650 360 150 50
38 Total. 1,000 760 125 125
I-AU Fwel8/P_ 1.000. 71SO 125 125
Cal Bleotr.icity • • 8711 760 Il15 US Co) Coal, Wood "Bag_ 125
37 Total 1.000 687 333
I-AU P'IIeIo/P_r 167 167 (0) Coal. Wood " :Bagaeae 167 167 .. II-Mlln- 833 887 168
38 Total 1,000 391 689 38 " I-An J!"IIeh! POV/U' 751 J84 427 38 4-(.) Eleotrioity' • • 9 9
427 (0) Ooal, Wood & Bag .. 742 275 36 4-
II-MtJf&_J . 249 107 142
89 Total 1,000 398 lS42 4,2 7 7 3 .1' 3
l-Al~J!'UeL!Po_" • 292 118 169 7 7 1 Ca) Eleotricity , , 280 98 151 '1 ... 3 1 (b) ~aidFllel , , 5 IS .. (c) • Wood &; Bagaue lI5 13 8 4- '.' Cd) Other Power . 2 2
II-Mafl'llGl 708 278 883 35 7 iii I
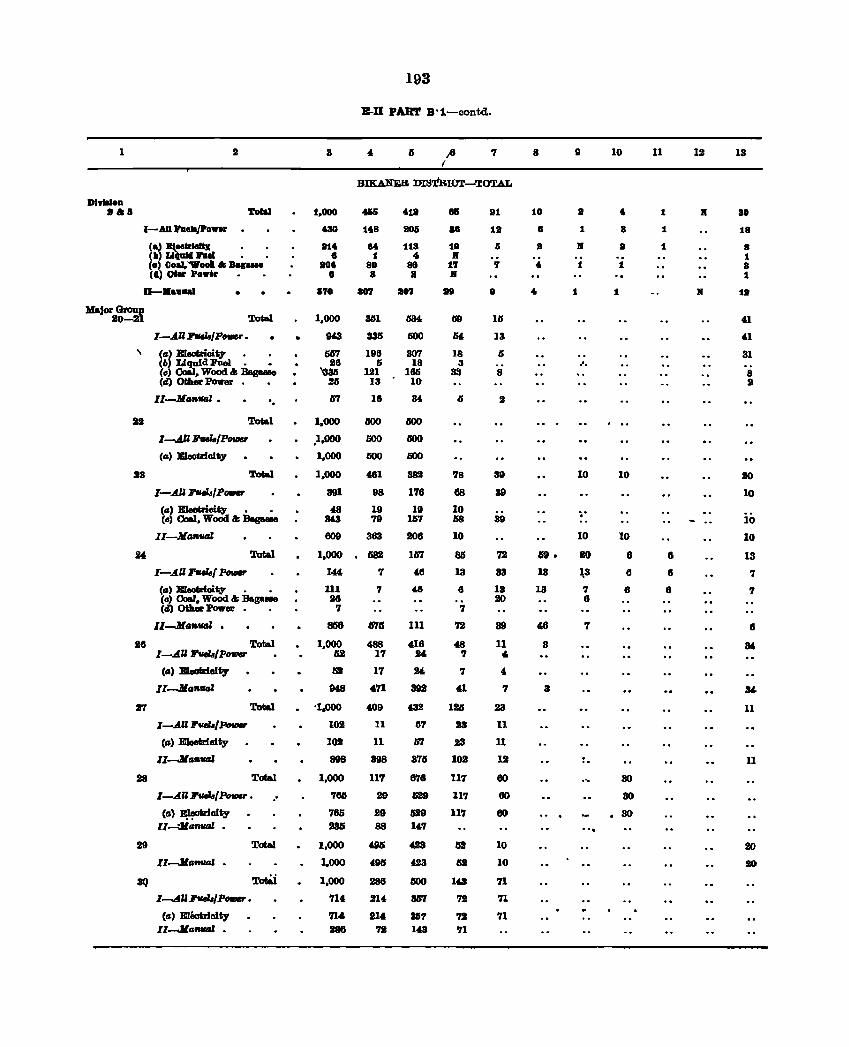
1
D1Y111 •• :11&8 Total
f~~-:-=" : (.) Ooal. ".011 .. Ba, .... (4) Oler P .... r
D-JlaDuI
Major Group 20-21
\
'. :as Total
l-.AU hMa,PovIer
(G) EIeotrioit)'
28 ~
l-.AUFtItL/P_
(G) BIeotrioit)' , , (c) Coal. WoOd &;:&ga.e
II-MG_~
24. Total
l-.Al1,..., p_".
(G) liIlaotdoity • , (c) Coal. Wood &; B&gaaae (II) Other Power
II-JlGJI,vaJ •
26 Total 1-.AU I'tIels/P_
(G) Eleaf;riaity
11-JIGJI,fItJ~
27 Totr.l
29
l-.AUrvMs/~
(G) EleaIzloity
ll-J1a ••
Total
1-.AIU'veIa/'PovIer ,
(0) ~oity lI_..:JlGf'I_
lI-M __ J ,
"
3Q Tot6i I-.AUI'tIeI&/P_ ,
(a) E1eotr101ty lI-JlGftwJ ,
193
B-II PAR'l' B'1-oontd,
3 7
BIKANEB ms..tBIOT-'l!OTAL
411
ISO 1"8 :a06
11.. 81 113 a 1 ..
:aOI 80 88 8 8 a
570 811'1 :110'1
1.000
,1,000
1,000
1,000
391
48 au 809
31)1
3315
198 6
121 13
16
500
ISOO
liOO
461
98
19 79
363
1.000 • 581
144 7
III 26
7
856
1,000 52
1m
948
7
IY1fi
488 17
17
471
'1.000 ~9
102 11
102 11
898 898
1,000
786
711S 285
1.000
1,000
1,000
714
714 J86
117
S9
29 88
4INS
4915
286
214
214 711
634.
500
307 18
166 10
34
500
500
500
382
176
19 167
208
167
46
46
III
418 M
M
392
i32
Ii'l
57
3715
876
GlI9
Gl!9 147
423
423
500
am 31)1 10&3
8&
88
1. If
17 If
S9
tID
54
18 3
33
78
68
10 as 10
85
13
8
7
72
48 7
7
41
1215
113
23
102
117
117
117
Ii!
6!
163
7J
7J 71
81
111
Ii
7
8
15
13
5
8
39
39
39
7J
33
IS 20
39
11 .. 4
7
23
11
11
IS
eo 80
eo
10
10
71
71
71
8
10
8
I)
.. ..
19,
IS
13
~
3
3
9
8
1
If
t
1
,',
10
10
BO
~3
'1 8
7
",
10
1
.. 8
a
1
...
10
10
6
8
8
30
30
.30
11
1
1
t
6
6
8
12
If
If
13
80
18
8 1 8 t
18
41
41
31
8 I
10
10
10
10
13
7
7
6
Sf,
lJ4.
11
11
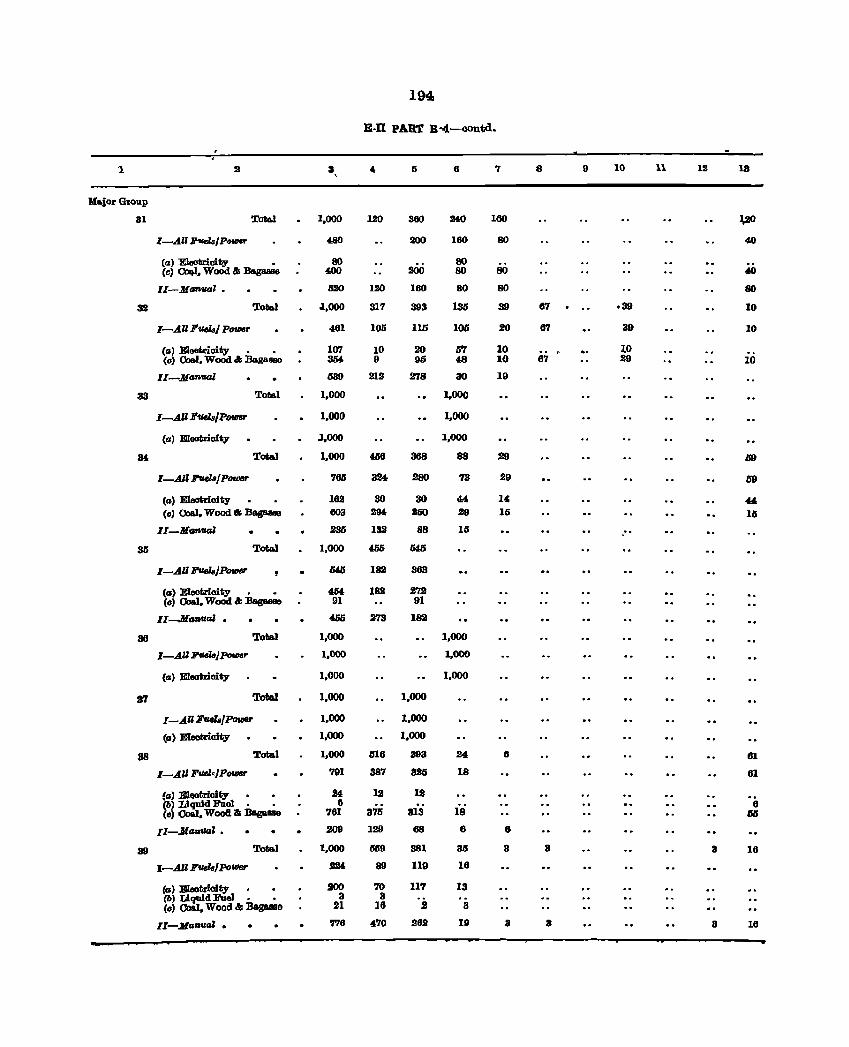
194
E·n PART B··1-oontd.
'1 2 3 5 6 '1 8 9 10 11 12 13 ,
Major G-roup
31 Total 1,000 120 360 240 160 \20
I-All '1IaZs/P_ 480 200 160 80 40
(a) E1eotrioity • 80 200
80 (c) 00ItI. Wood &; BagaEllle 400 80 80 40
II-M_al. 5ro 120 160 80 80 80
32 Total .1,000 317 393 135 39 67 .39 10
I-All F'IIClsJ p_r 461 105 115 105 20 67 39 10
(a) .Eleotrioity • • 107 10 20 5'1 10 lO (c) Cb&l. Wood & Bagasae 354 9 !IIi 48 10 67 29 10
II-Manual 539 212 278 30 19
33 Total 1,000 1.000
I-All Ifuela/POfIJU' 1,000 1.000
(a) EIeotriaity 1.000 1,000
34. Total 1,000 £Ii6 368 88 29 69
I-All J!tW,aJP- 765 324 280 73 29 59
(a) Eleotricity 162 30 30 44 14; 44 (c) OoaI, Wood" Baga81111 003 294 250 29 15 15
II-M_Z 235 132 88 15 :.
36 Total 1,000 455 545
I-All J"uMsJPOIIIer 545 182 363
(a) .Electricity • • 464, 182 272 (c) Ooal, Wood & BagIlll8e 91 91
II-MofluaZ • 455 273 182
36 Total 1,000 1,000
I-AU Ji'tIilBJpower 1,000 1,000
(a) mectricity 1,000 1,000
WI Total 1,000 1,000
I-All Fueh/Power 1,000 1,000
(a) Eleotr:icity 1,000 1,000
B8 Total 1,000 516 393 24 6 61
I-AI' FtIBl./P_" 791 387 825 18 61
!a) :Electricity 24 12 D (1J) Liquid Fuel. • 8 6 (c) Coal, Wootl it; BagaIl8e 761 375 313 18 55
II-Manual • .209 129 68 6 8
39 Total 1.000 559 381 35 8 3 3 16
I-AlllJ'fIeL/ poUlSr !24 89 119 16
(a) Eleat:riaity 1100 '10 117 13 (1J) Liquid Fuel. • 3 3 (c) Coal, Wood &; Bagasse 21 16 2 8
II-Maflual • '176 470 262 19 II 3 3 16
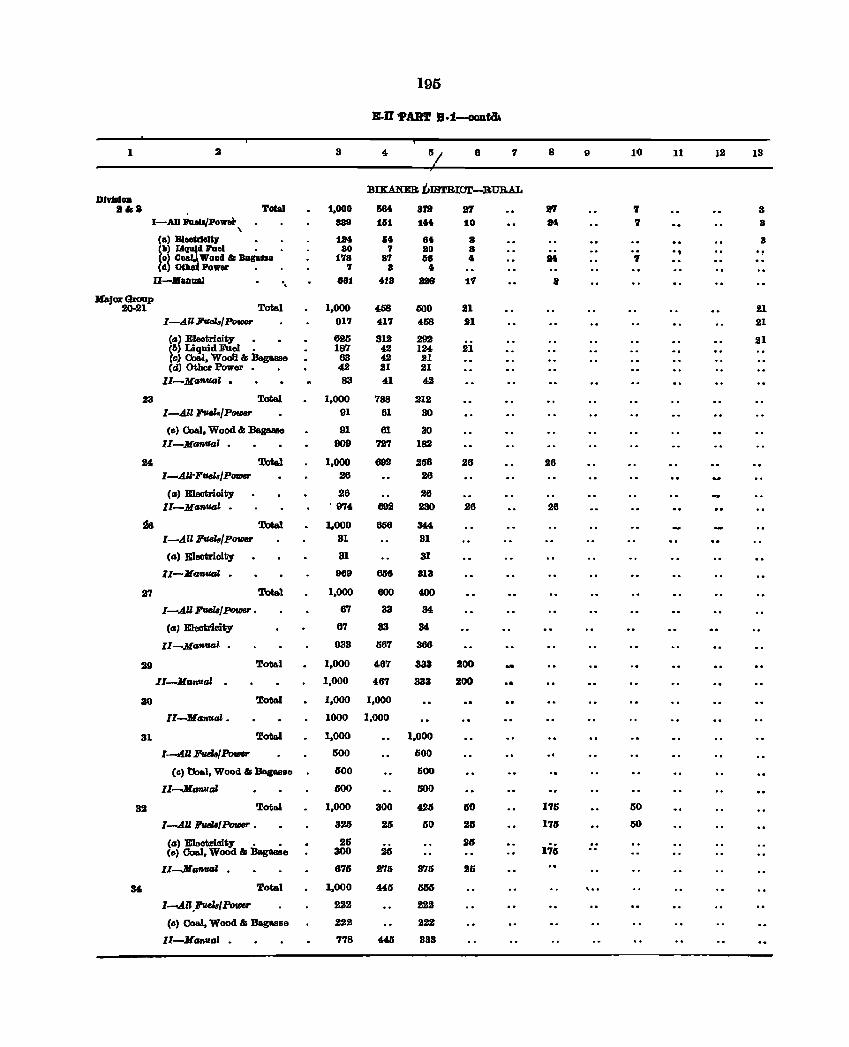
195
B-1I 'PART B.1-aont&
1 2 3 " 5L 6 7 8 9 10 11 12 13
;
BIKANEB LISTRIC1I'-BURAL DlvlsloD
alia Total 1,000 58. 872 liI'1 ff'I ., 8 I-AU JIuob/POWD~ 889 161 1" 10 lK 'I a ..
(a) BlecUlell, . 1lK &. 61 8 a ~II) ~:Sd Fael , 80 7 ao 8 . , " D) C Wood & BagasH 178 87 &8 .. :1M ., (d) 0011 Power , 7 3 4r
D-.anaal ., 881 113 na 11 It
Major Group 20-21 Total 1,000 458 000 21 21
I-..tU Fuela/Po_ 917 417 458 21 21
(a) Eleotrioity • • 626 312 292 21 (&) Liquid Fuel _ 187 42 124 .II Ccl Coal, Woo1i & Bagasse 63 42 21 (dJ Other Power 4.2 .II 21
II-Maflfl41 • 83 41 42
23 Total 1,000 788 212 I-..tll FvaZ./P_ 91 61 30
(c) Coal, Wood & BagaMe 91 61 30 II-Mt.lfI/fltsl • 909 7.2'1 182
24. Total 1,000 692 256 26 126 I-.dll-Fueh/P_ 26 26
(a) Eleotrici ty 26 26 II-MtlR'IIt.Il • • 9'14 692 230 26 26
:ta Total 1,000 656 344 I-..tU Ii'tJ.els/ POVlU' 31 31
(a) Electricity 31 31
lI-JeGR'IIt.Il • 969 656 313
2'1 Total 1,000 600 400
I-AU Fvel8/]'Io&D8r' , 6'1 33 34
(0:' Eleotricity 67 83 34
lI-MGR'IIt.Il , 933 56'1 366
29 Total 1,000 467 333 200 ... Il-Manual 1,000 467 333 200 ..
30 Total 1,000 1,000
lI-Jltlnual. 1000 1,000
31 Total 1,000 1,000
l---.tll FueIs/Po_ 500 600
(c) tloa.l, Wood & Bagasso 1500 500
II-Manual 500 500
32 Total 1,000 300 425 60 176 ISO
I-.d.U B'ua1.8/ Pov1er , 325 26 5D 25 175 50
(a) Elsotricity , • 215 215 173 (c) Coa.l, Wood & Bagasse 300 26
II-JlafWIZI • 6715 275 375 25
34 Total 1,000 445 1555
l--.l.II,Fueh/ PotDU' 222 222
(c) Coa.l, Wood & Bagasse 222 222
Il-M_al • 7'18 4411 333
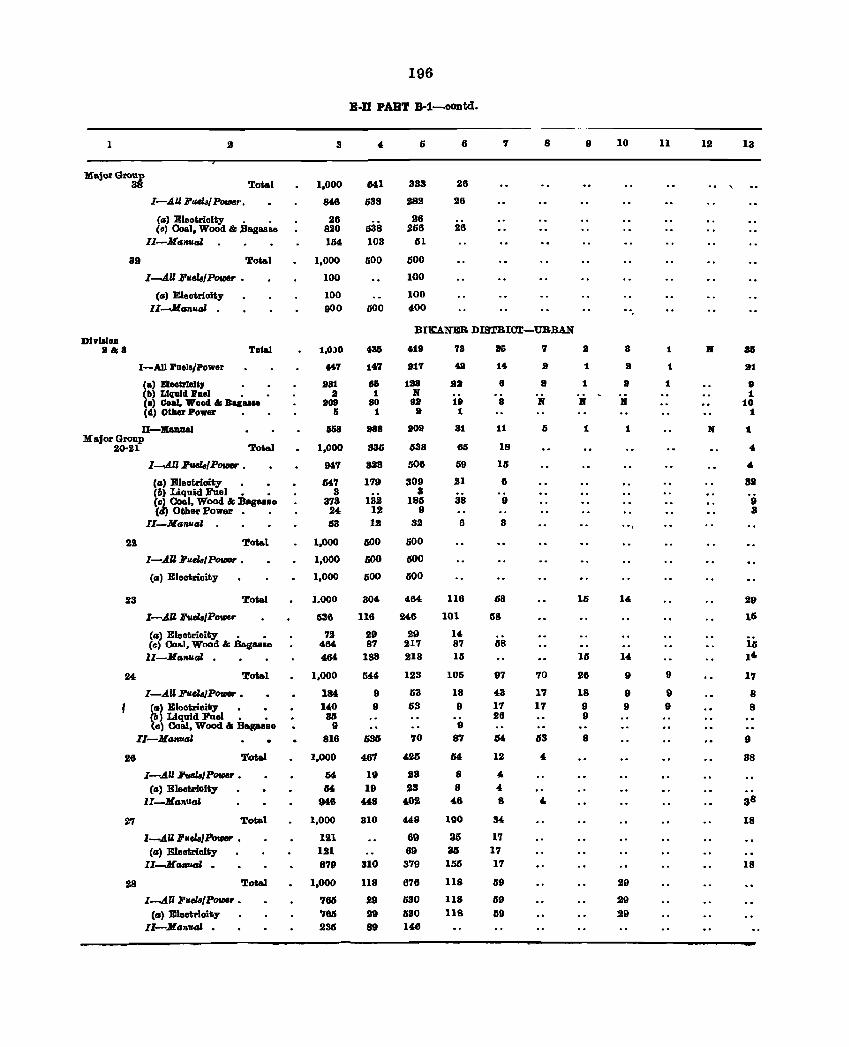
1
Major Group 38 Total
I-AU I'u.dal p_,.. (II) Eleotrioity . . (e) Coal, Wood & Bagasae
II-MIlIIVaJ
39 Total
DI9b10D 8&8
I-.AU I'llelsIPOVIIf' •
(G) E1eotrioity II-M1I7u,GJ •
I-All Fuels/Power
Ca) B1.otrlalQ (II) Llqulll I'D.I •
Toial
(a) Co ... Wooll & Bac .... (II) Otller Power
II-lIIlIDaaI Major Group
20-21 Total
I-A.U BueIs/P_r •
(II) Eleotrioity (6) Liquid Fuel. • (c) Coal, Wood & BagaaBo (d) Other Power. •
II-MII7IVII' •
22 Total
23
I-AU l'urlslPouler •
(II) Eleotrioity
Total
I-AU JiIueIa/p"",",
(II) Elootrioity • • (e) 00&1, Wood & B&gasso
ll-.Il1l7lulil •
24 Total
16
J7
28
I-A"1!lleHJ~ • (II) Eleotrioity (6) Liquid Fael. • (0) Ooal, Wood & Ba.gaaBO
II-MII'AVII'
Total
I-AU FuelB/P_r • (II) Eleatrioity
II-MGJlulil
Total
I-A.IZ l'llde/Povler • (II) E1eotrioity
II-MII'Aual _
I-A.U Fuels/POVIIr •
(1'1) Eleotrioity II-MII7IuGI •
Total
3
1,000
846
26 820 154
1,000
100
100 900
1,OlO
4407
881 a
809 II
IiS8
1,000
94'1
647 3
373 24 53
1,000
1,000
1.000
1.000
G36
72 464. 464
1,000
1M UO 8li
9 816
1,000
54 M
946
1.000
121 121 879
1,000
7fIIJ '181 235
196
B-D PART B-1-00Dtd.
" 64.1
538
538 103
500
500
435
147
66 1
80 1
888
S35
323
179
132 12 12
500
SOO
500
304
116
29 87
188
544.
9 9
535
461
19 19
448
310
310
118
29 29 89
5
333
982
26 256
51
flOO
100
100 4.00
6
26
26
26
'1 8
BIK:A.NER DISTRICT-URBAN
ti9
817
118 If 91
It
aOIl
838
506
309 3
1815 9
32
500
500
500
464
246
29 21'1 218
123
53 53
70
4.25
.113 23
4.02
448
69 69 319
676
530 1530 146
78
411
a. 19
1
81
os 59
21
38
6
116
101
14 87 15
105
18 9
9 8'1
M-
8 8
46
190
35 35 155
118
118 118
86
14
6
8
11
18
15
6
9
3
68
58
58
97
43 17 26
54
12
4
4 8
34
1'7 11 17
59
59 159
7
• • If
15
70
17 17
63
4
9
I
1
1
If
1
15
15
26
18 9 9
8
10
3
a I
If
1
",
14
14
9
9 9
:29
29 29
11
1
1
1
9
9 9
12
If
13
36
81
9 1
10 1
t
4
" 811
'0 3
29
15
15 14
11
8
8
9
38
38
18
18
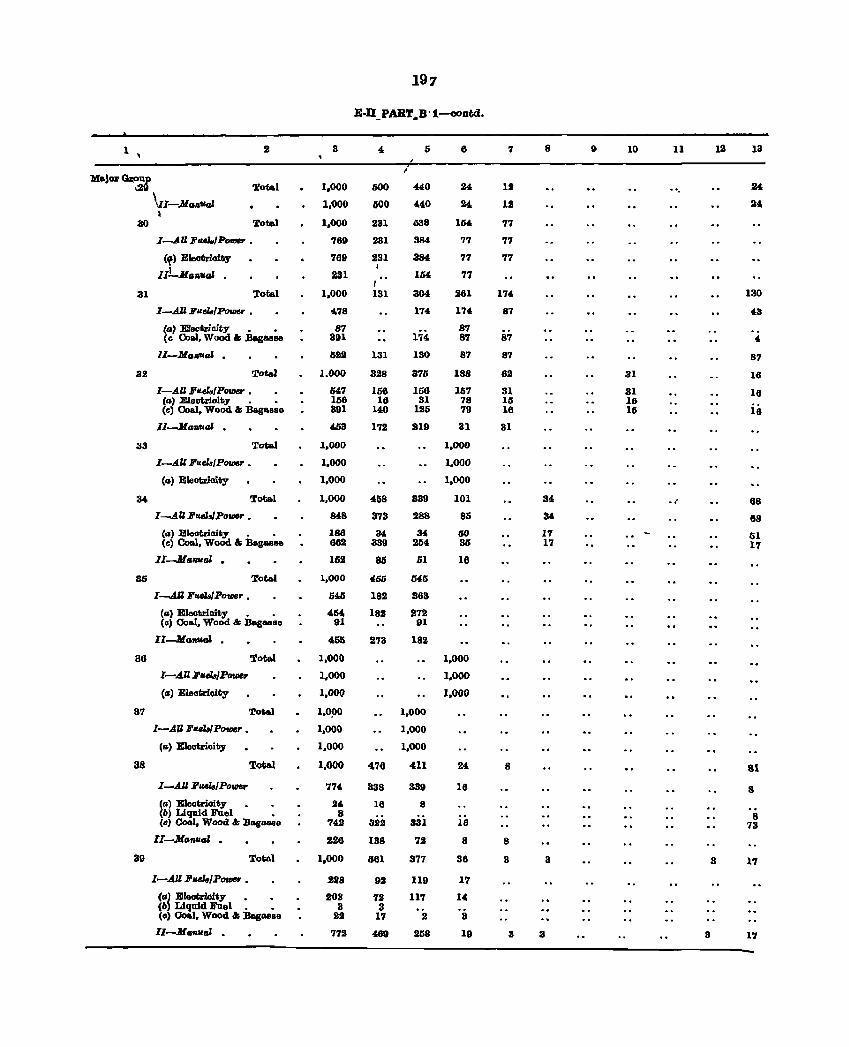
197
B-U_PART .... B·l-oontd.
1 , 3 4 5 6 7 8 9 10 11 12 13
Ma.joI'G~up Total 1.000 5()0 440 24 12 ~" ,29 ".
\ 1,000 000 440 24 12 24. \lI-Manua,! I
30 To1i&l 1.000 231 638 154 77
I-AU FueL/Po_" • 769 231 384 77 77
<If) Electrioity 769 231 384 77 77
IlL.JranvgJ 231 154 77 , 31 'l'otal 1.000 131 304 261 174 130
I-AUJI'ueL/Power. 478 174 174 87 43
(a) Electricity _ • 87 174
87 (c 00801, Wood I: .Bagasse 891 87 87 4
ll-Ma1lfl,d • 622 131 130 87 87 87
32 Total 1.000 328 876 188 62 31 16
I-All FueJsfPolDI!I' • 547 166 166 167 31 31 16 (a) Eleotrioit.y • • 156 16 31 78 15 16
iil (c) Coal, Wood &; Bagasso 891 140 125 79 16 15
Il-Jrlcmud . 453 172 219 31 31
33 Total 1.000 1.000
I-AU J!'u.e1.afP_r • 1,000 1.000
(a) Eleotrioity 1,000 1.000
34 Total 1,000 458 839 101 34 .. ' 68 I-AU li'u.elJ}PotD&r • 848 373 288 85 34 68
COl) Eleotricity • • 186 3' 34 60 17 61 (c) Coal, Wood &; Bagasse 682 339 254 35 17 17
II-MaJf.ud . 152 85 51 16
36 Total 1.000 465 545
l-AU Fuela/PotD&r • 546 182 363
(a) Eleotrioity • • 454 182 272 (c) Coa.I, Wood & Baga.sse 91 91
II-Mcsn1lCl1 • 455 273 182
36 Total 1,000 1.000
I-AU Fu.e1.aJP_ 1,000 1.000
(a) Eleolirioity 1,000 1.000
37 Total 1.~0 1.000
I-AU1!uelaIPo'lDer. 1.000 1,000
(a) Eleotrioity 1.000 1,000
38 Total 1,000 476 411 24- 8 81
l-AU J!'UAlafPo'lDe' 774 838 339 16 8 (a) Eleotrioity 24 16 8 (6) Liquid hel • 8 8 (c) Coal, Wood &; Bagasse 74.8 322 331 16 73
lI-Mrl1&flGl . 226 138 72 8 8
39 Total 1,000 661 377 36 3 3 3 1'7
I-AU li'usZ,/PotD&r • 228 92 119 17
(a) Eleatriclty • 203 '12 117 14 (6) Liquid Fuel. • 3 3 (0) 00801. Wood &; Bagasse 22 17 2 B
II-Ma.ud . 77! 469 2158 19 3 3 3 17
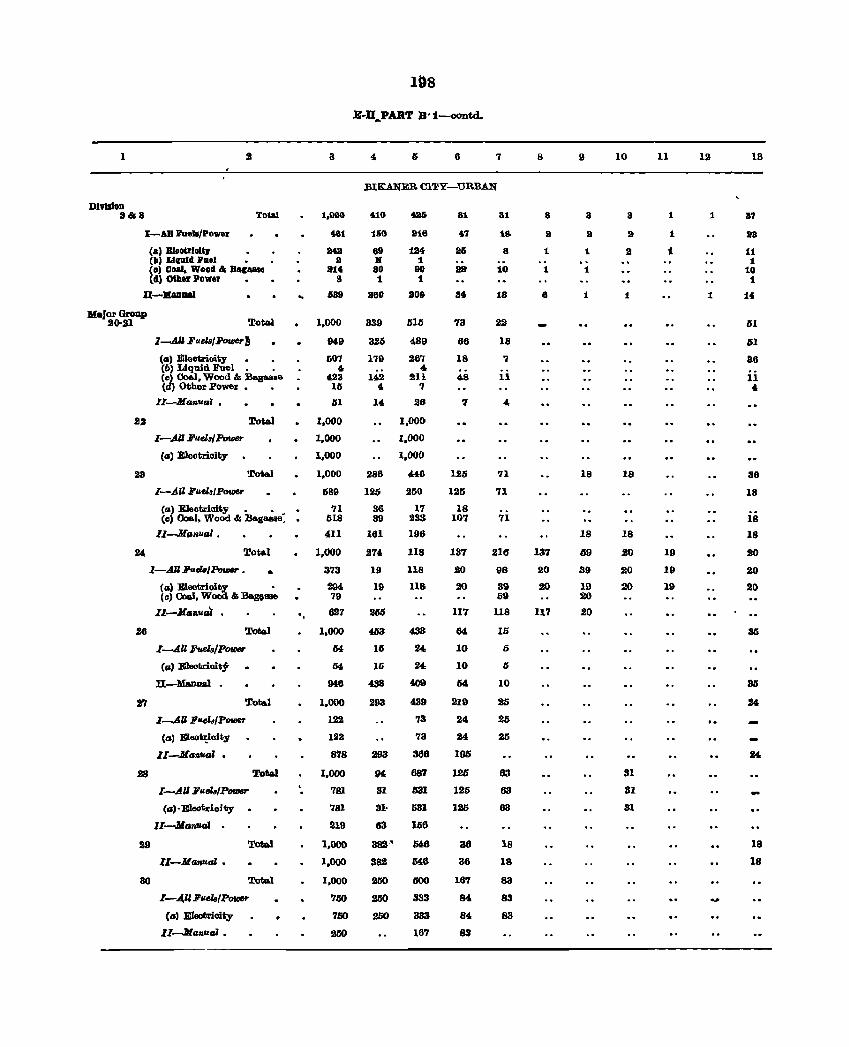
1
DlvWon 1&8 Total
I-AU hell/Powu
(A) Bl.eoUlaltr (II) Llqldd 'u.al • (8) eoal. Wood &; BagUll8 (d) Other Power
U-llaDaaI
HaJor Group 21)-21 Total
I---tlJ Fuel8/Power!
(0) Eleot.rioity • (6) Liquid Fuel. • (e) Coal, Wood & Bagaaae (d) Other Power • •
II-Ma .... al.
23 Total
I-.4U FuelslPou18r
(0) Eleotrioity
Total
I-JiU Fuel./Power
..
(ta) Eleotrioity. • • (a) 00 .. 1, Wood &; Ba.g&lll!e:
116
II-MfllI'Ilal •
Total
• (ta) Eleotrioit;r • Ca) Coal, Wood '" Ba.psae
II-Man,uGl •
Tot..:l
l-.AU Ji'ueh/POIIJU'
(0) Eleotrioity
B-Manual .
Total
1........4." Fuel../Powe,.
(a) Eleota:_ioity
lI-.Mtmual •
2S Tot&)
29
30
I-.4U Fuels/P_
(a)·Electrioity
II-Monual
Total
Total
I-A.llFuel8lpOfMr
(II) Eleotrioity
Il--Jll tJnua). •
"
3
461
lMlI a
814 8
589
1,000
949
50'1 4
423 15
51
1,000
1,000
1,000
1,000
589
71 518
411
1,000
373
294 79
627
1.000
54
M
IK8
1,000
122
122
878
1.000
781
781
219
1,000
1,000
1,000
750
750
250
IUS
E-D ... PART B·1-contd.
5 6 '1
BlKANER CITY-UB.:B..A.N
ItO
150
89 II ao t
8ao
339
325
1'79
142 4
14
286
125
36 89
161
274
19
19
26Jj
453
15
15
438
293
293
94
31
31·
63
_Ii 216
184-1
90 t
a09
615
489
267 4.
211 '1
28
1.000
1,000
1,000
U6
250
17 233
196
118
118
118
433
24,
24
409
439
73
73
366
687
531
531
156
382" 646
S82 646
2ISO
250
250
500
333
333
167
81
1'7
115
118
84
73
66
18
48
'1
126
125
18 107
137
20
20
117
64
10
10
M
219
24
24
19Jj
125
126
125
36
36
167
84
84
83
31
is
8
10
18
22
18
'1
11
'11
'71
71
216
98
39 59
118
lli
Ii
Ii
10
25
25
25
83
63
63
18
18
83
83
83
8
8
2
1
1
8
137
20
20
117
9
8
2
1
1
1
18
18
69
39
19 20
.20
10
8
a
1
18
18
20
20
20
31
31
31
11
1
1
t
19
19
19
12
1
1
13
87
28
11 1
10 t
1t
61
51
86
11 4
36
18
18
18
20
20
20
33
24
18
IS
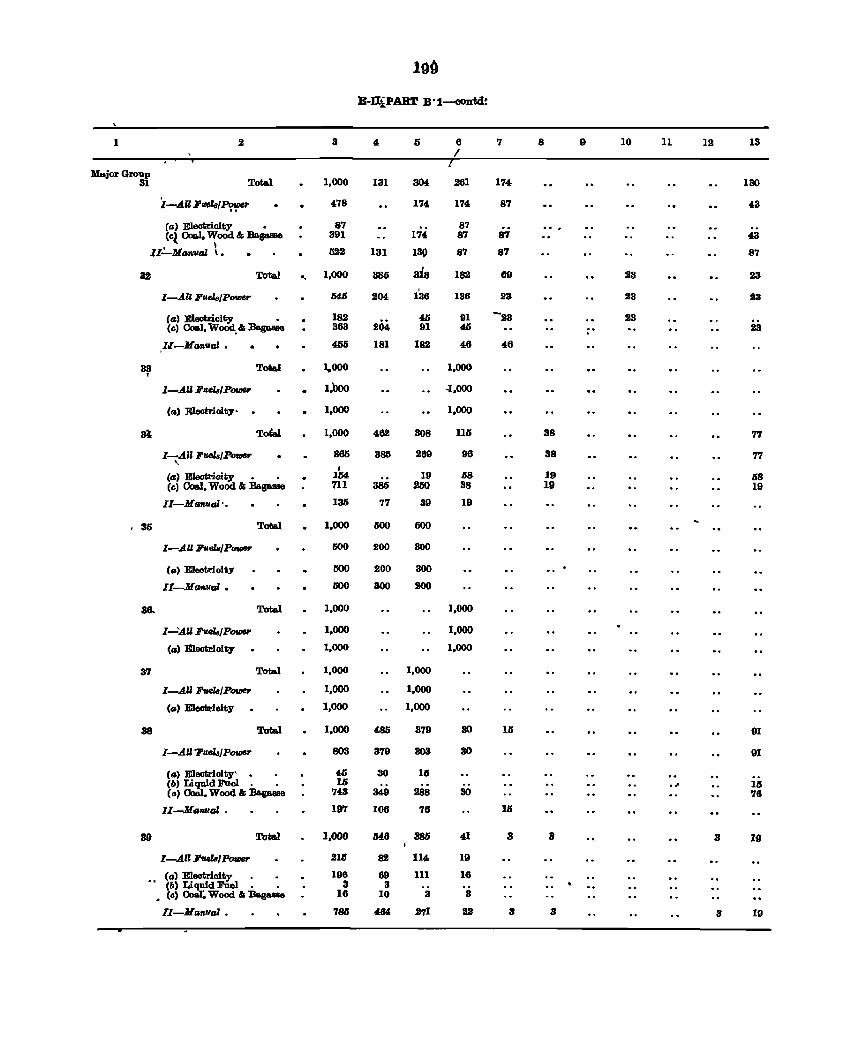
lOs}
B-lliPART B'l-contd:
1 3 6 7 8 9 10 11 12 13 I
Major Group 31 Total 1,000 131 304 261 174 130
:C-AUF_IP~ 478 174 174 87 43
fa) Eleotricity • 87 87 (cl Coal, Wood &: lJagasae 391 174 87 87 43
II:....Man~r.U \. 522 131 13Q 87 87 87
32 Total .. 1,000 386 31.8 182 69 23 23
I-AU J!'uels/P_ M6 204 136 136 23 23 23
(a) Eleotricity • 182 4l) 91 -23 23 Ccl Coal, Wood,&: :Bagaaee 363 2M 91 4l) 23
I.e-Manual • 4lili 181 182 46 46 ,
33 Total 1.000 1,000 , I-AU J!'uela/P_,. 1,000 -1,000
(a) E1eotrioity' 1,000 1,000
M To&.! 1,000 482 308 115 38 77
I-All J!'uels/Powe,. , 865 385 269 96 38 77 j
(a) EIeotrioity • • 164 19 J)8 19 68 (cl Coal, Wood &: :Bagaue 711 386 250 38 19 19
II-M anval·. 130 77 39 19
, 35 Total 1,000 500 500
I-AU Ji'I.<elB/P_ 500 200 300
Ca) Eleotrioity 500 200 300
II-Mrmval • 500 300 200
30.. Total 1,000 J,OOO
I-':AU Fuels/P_,. 1,000 1,000
(a) ltleotrioity 1,000 1,000
37 Total 1,000 1,000
I-AU JIueIa/P_,. 1,000 1,000
(a) E1eetricity 1,000 1,000
38 Total 1,000 485 379 30 15 91
I-AII?ud,,/P_" 803 379 303 30 91
Ca) E1ectrioity' • 45 30 115 (6) LiguidFnel. . 15 ... 115 (IS) Coal. Wood &: :Bagaeae 743 349 288 30 76
II-Manvr.U • 197 106 76 18
39 Total 1,000 54.8 38li 41 8 8 3 19
l-AU JluelalPOV18r 215 82 114 19
(a) Electrioity 196 69 111 16 •• (b) Liquid FUel. • 3 3
• Ccl 00&1", Wood &: Eagaasa 16 10 3 3
II-Manual • 7811 464 Jl71 92 3 3 B 19
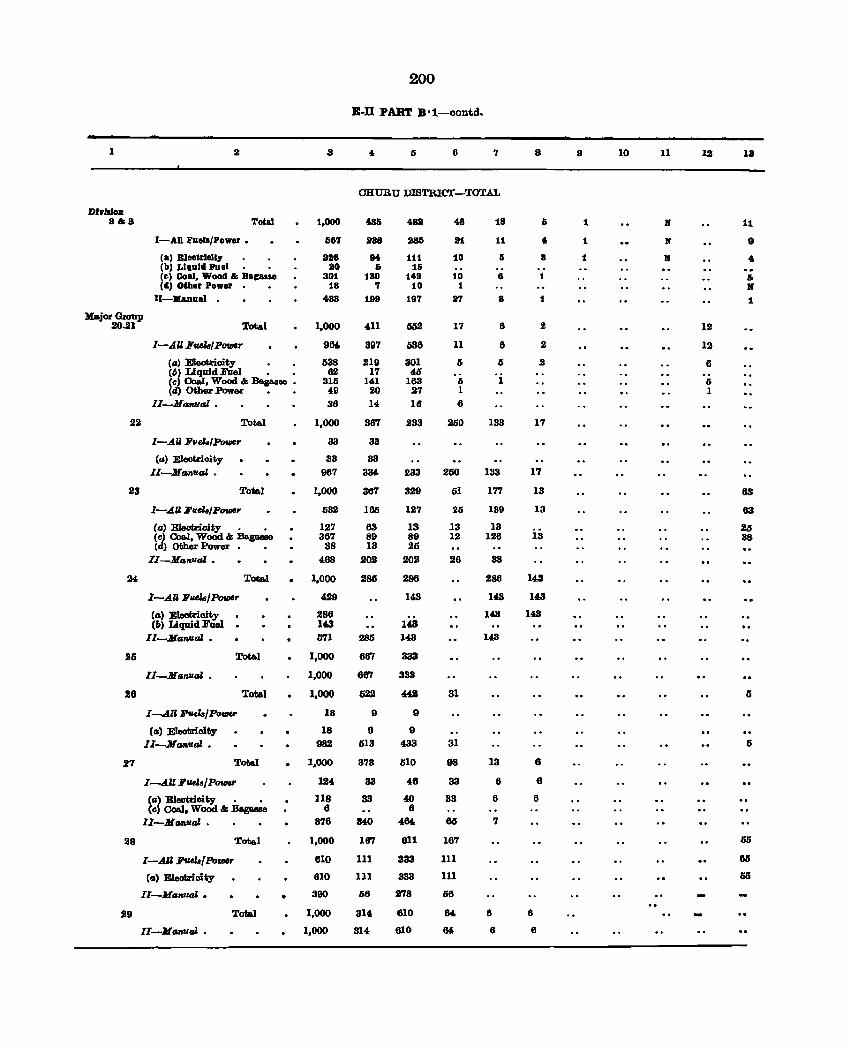
200
E-n PART B'1-contd.
1 2 4 6 7 8 9 10 11 12 13
CHunu :DIBTRICT-TOTAL
D'rJdolJ: 8&8 Total t,OOO 436 481 48 18 6 1 X 11
I-All Fu. ... /Power • 687 238 186 2t 11 4 1 X 9
(.) EleotrJoU,. als 84 111 10 6 3 1 I( ... (lJ) Liquid I'u.l 10 I> 16 (0) Coal, Wood & Bagaue 301 130 149 to 6 1 I> (d) Oth.r Pow.r 18 7 10 1 II
lI-lIIaDuai 4.33 198 197 27 8 1 1
Major Group 20..21 Total 1,000 411 552 17 6 2 12
1-,AUF_IPOVICr 964. 397 036 11 6 2 12
(a) Eleotrioity , , 538 219 301 6 6 2 6 (6) Liquid Fuel • • 62 17 46 (c) Coal, Wood &; Baga.aee , 316 141 163 6 1 6 (d) Other Power 49 20 27 1 1
II-ManvaJ . 36 14 16 6
22 Total 1,000 367 233 21i0 133 17
I-.AU FuelBlPowe,. 33 33
(a) Electrioity 33 33
II-Manual. • 967 334 233 260 133 17
23 Total 1,000 367 329 51 177 13 83
l-.AU Fu.elBIPowe,. 632 1116 127 211 139 13 83
(a) Eleotrioity • • 127 63 13 13 13 20 (c) CoaJ, Wood & Bagaeao 367 89 89 12 126 13 38 (d) Other Power 88 13 26
II-ManUM • 468 202 202 26 38
24 Total 1,000 286 286 286 143
I-.AU Fuels/Powe,. 429 143 143 1403
(a) Electricity 286 143 143 (b) Liquid FUel lILa 143
II-MaNuaI. , 571 286 143 143
as Total 1,000 667 333
II-Manval • 1,000 667 333
26 Total 1,000 022 442 31 is
I-All Ji'ueZ3/Powe,. 18 9 9
(a) E1eotr.ioity 18 9 9
lI-M_uaZ , 982 513 433 31 6
27 TotaI 1.000 373 510 98 13 8
I-.AU Fv.dsJPower 124 83 46 33 6 6
(a) Electricity . , I18 83 40 33 6 6 (c) Coal, Wood &; Bagaaae 8 6
II-Mara'llaZ • 876 340 464 66 7
28 Total 1,000 167 611 167 66
I-AU FudB/Po_r 610 III 333 111 M
(IS) Eleotrioity 610 III 333 111 615
II-Mllnua' • 390 56 278 56
29 Total 1,000 314 610 64. 6 6
II-MARval • 1,000 314 610 64 6 6
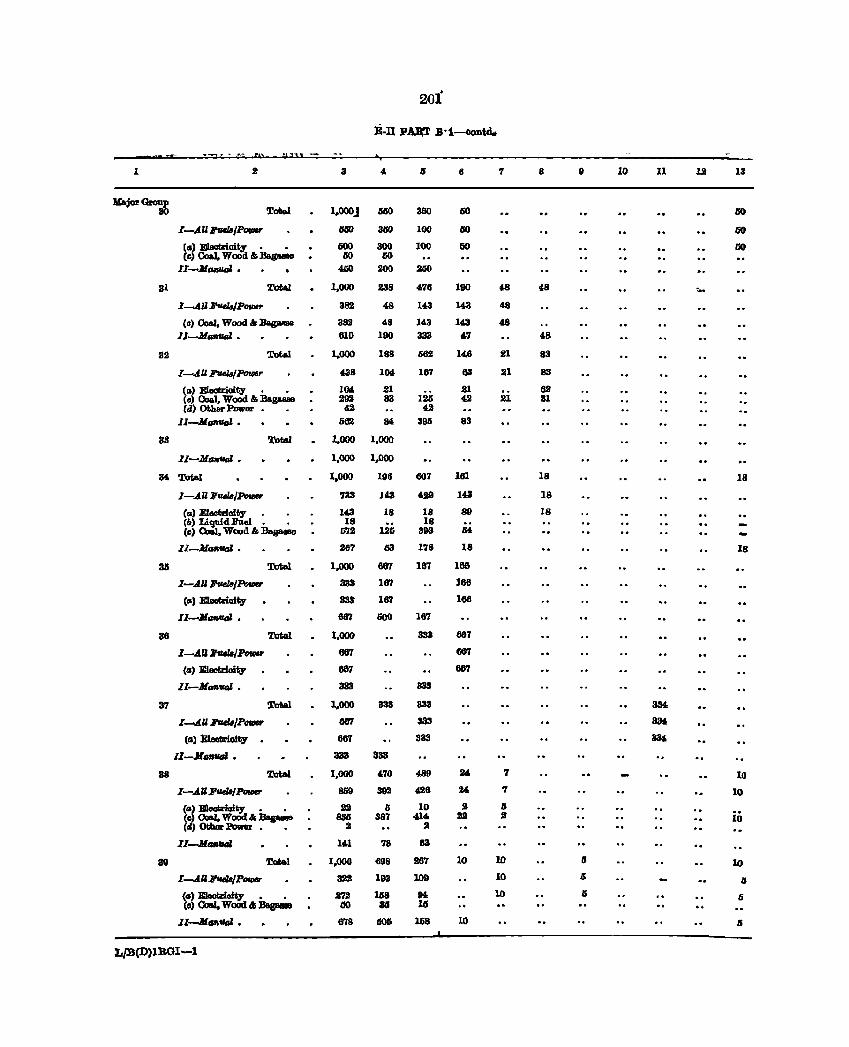
20i
B-n PAll'!' B·1-contd.
1 2 3 4 IS II 7 8 10 11 12 13
Major <houp 30 Total 1,000J 1560 360 fiG 60
.l-AU ,../PovI&r lSlJO 340 100 fiG 60
(II) Eleotrioi~. • IiOO 300 100 60 50 (c) Coal, Wood &;:Bag_ 60 60
.ll-MfMluoJ • 4.50 200 200
31 Total 1,000 .1138 4711 180 £8 48 ,. . .l-.AU J'rJas/P_r 31m 48 143 143 &8
(c) Coal, Wooci &; lIagasse 38J 48 143 143 4$
Il-Mts'llttoJ • 610 190 333 4,7 48
39 Total 1.000 188 6112 14.6 21 83
r -Alll!'lMl8/ Po'IDIJr 438 IN 167 63 .111 83
(II) EIaotrioity • • 10!1. .21 .21 62 (c) Coal, Wooci &; Baga.aae .292 83 126 42 21 21 (tI) other Power 42 42
Il-Mts'IIVoI. 662 8& 3911 83
83 Total 1,000 1,000
II-M_ttoJ • 1,000 1,000
K Total 1,000 196 607 161 18 18
I-AU F_/Pr>tIM 733 143 429 143 18
ell) Elactricity • • 143 18 18 89 18 Cb) Liquid Fuel. • 18 18 (c) CoW, Wood &; Bagaaae 5'12 1.115 393 54
ll-Mts'llUal • 267 03 178 18 18
311 Total 1.000 667 187 168
I-All FaeUIPo'IDIJr 333 187 186
(II) EIeoZoIty 333 187 166
Il-Jl_UaI • 667 600 187
30 Total 1,000 333 667
I-tll :I'acl8/PovJv 687 667
(II) 1ilJ.aotr.icity 687 667
ll-.J[lIftuoJ • 383 333
37 Total 1,000 333 333 334.
.l-AU Fwl4/P_ 667 333 33Ii
(II) BIeotrioity 687 333 33!f,
Il-lltmvoJ • 333 333
38 Total 1,000 470 489 24 7 10
I-AU:r_IPauIcr 85Il 399 426 24- '1 10
(II) Bleolaioiliy. • 22 IS 10 .2 ,; (c) a.J, WoOd":Baa- 886 387 414 U 2 iii (4) 0tbBr Power. • 2 :.I
lI-M __ 141 78 83
39 To&al 1,000 698 267 10 10 5 10
.l-tUF,../P_ 321 193 109 10 IS JJ
(a' lIlIeofdoity • • 272 158 K 10 ,; Q (0) Coal, WoOd" :BIlgaaa8 110 311 Ie;
ll-MGflttoJ • 678 505 158 10 Ii
Lf.B(D)lBGI-l
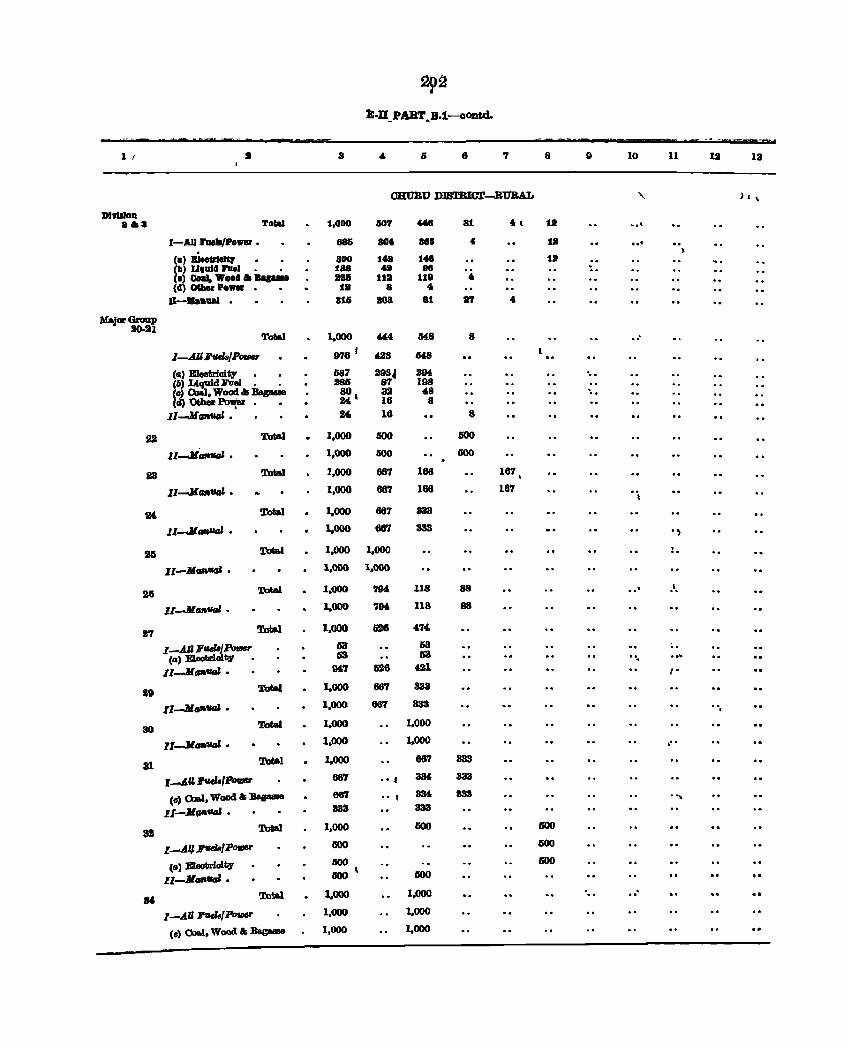
29~
l!:-D _PART .B.l-oontd.
1 I • 3 Ii 6 7 8 9 10 U 13 13
ORORU DJBTBWl'-BUBAL "- ) I \
DlYII'IoD .a.. ToW! 1,000 607 ... 81 4t 11 .. ' I-AU Fu..,.tpoYler • 885 80. 885 • 11 .. -(.) JUH&rIefV 800 1t1 148 11 (II) U,1II11 l'Del 188 tI 88 .. (I) 0.,... Wooll II ....... 38& 113 118 4 (II) CHher '.YIIt 18 a 4
n-... u.l . 816 loa 81 8'1 .. MajorGroap
2MIl Total 1,000 "" M8 8 "
1--4.11lwlB/POfIIBI' 976 I 4.ZS 6(8
(tI' E100trioity 587 .293j 294 ' .. (6) Liquid Foal. • 286 WI 198 ill) Coal, Wood as __ 80. 32 68 .. d) 'OOIer~. • 24. 16 8
11-14_-' . 24. 16 8
22 Total 1,000 600 600
II-JtlGflVGI • 1,000 500 600
i3 Total 1,000 667 168 167.
II-JranVGI • 1,000 667 168 187 , 2'- Total 1,000 667 333
Il-.ltl_VGI • 1,000 667 333 . , 215 Total 1,000 1.000 ,
1I-.Jl_VGI • 1,000 1,000
26 Total 1,000 79£ 118 88 .. ' .'. II-MfJfIfItIJ • 1,000 7M 118 88
2? Total 1.000 6B8 474
I-All Futl3jPov1sr 63 03 .. (II' EJ.eotrioity • 63 63 . '.
II-M __ - 0411 526 dl ... 29 Total 1,000 667 383
II-MGfI- • 1,000 66'7 333 ,
30 Total 1.000 1,000
I1-MGflvaJ • 1,000 1.000 ,"
31 TotIJ 1,000 8tJ'l 333
1......A.&l ,udalPovler 687 •• t 3IH 333
(0) 00&1. Woocl& .... 867 ., . 3M 333 . '. II-Jl""vaJ • 333 833
S3 Total 1.000 500 GOO
I_A',BGds/PotD&r 600 GOO
<II) B1eof;rIoit;y GOO IiOO
II--JlGfl-' • GOO' lJOO
IN Tota.l 1.000 1.000 .. . I-AU 1!'ueh/Pov# 1,000 1.000
(0) Cloaol. Wood. &0 ~ 1,000 1,000
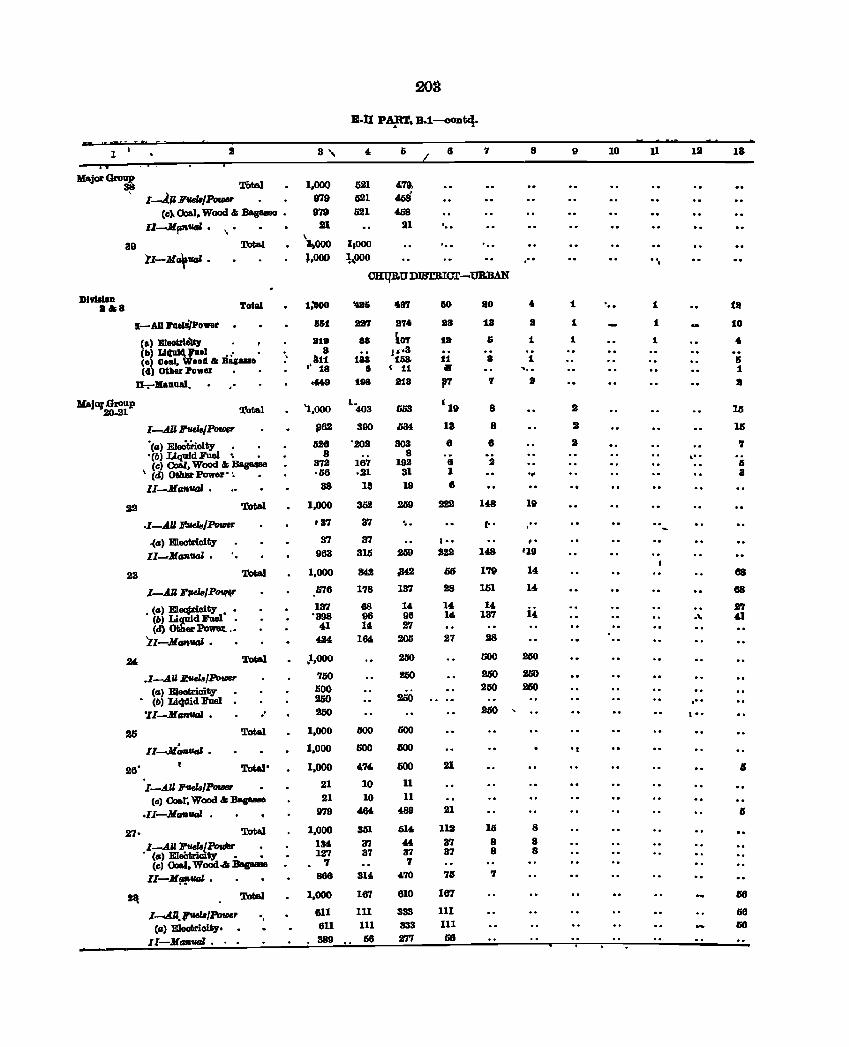
20a
B-II Pi\RT. B,1--o0Dt'I,
1 I 2 3, 4 Ii II 7 8 9 10 11 12 IS
IIIIjor Gmup TOtal 1,000 311 521 479,
I-lJJ :J/Vel8/Pawar 979 521 4li8 (c). Coal, Wood & Bagaa&e • 9'79 521 458
11-.MfI"VGI , 21 21 , " \
\
39 Total ~ooo 1,000 '. , " ,
II-M~VGI , ~,OOO ~,OOO " , , "
CHqRUDIBTBIDr-'OB1lAN
DIYIalon Ilia Total 1;000 .. 6 1187 60 10 • 1 " 1 18
I-All PIHJi/powar 66t. 887 17. II 18 8 1 1 t.o
(a) B1eeirlll&, , 318 8a iM t.a s 1 1 1 • (b) LI(u1VU.1 • .. • .. 8 .,.3 (0) Coal, oDd &I Hac-. 811 183 16& 11 8 1 Ii (4) Other Power .' 18 8 ~ 11 ... ' .. 1
n ........ anw. , ,6409 198 118 ,., 7 I • MajorGzoup
Total '1,000 L. 1
19 20..21 403 fili3 8 !: 15
I-AlllJ'vtJs/Potl# $III!: 390 .Ii34 18 8 !: 15
'(II) E10citiicity 528 '202 303 8 8 2 7 • (6) Liquid Fuel \ • 8 8
Cc) Ooal, Wood & Bagaaso 372 167 198 II 2 ," \ (d) Othel- Power' ~ , .1)6 .21 31 1
5 'It' 3
ll-.MGIIVGI • 38 13 19 8
22 Total 1,000 3li2 !:69 222 148 19
.I-AU ]hI.eI",/ PovJer 137 37 '" r" " " -.(11) Electricity 37 37 I, , . '
11-MGlltIrB • 963 316 259 222 148 '19
23 Total 1,000 342 ..'J4,2 D6 1'79 14 88
I-AU ll'fUls/P0t,f4r 576 178 137 28 151 14 68
• (II) El.city • ' 137 68 14 14- 14 i4. !:7
(6) ~dFuel , '398 96 96 14- 137 (d) er Power. .' 401 140 27
," 4]
'Il-M,..VGI , 40840 164 206 27 28
.24. Total }Iooo 2110 500 2GO
.l-AU EvtJs/Po1Dar 750 2liO 260 2GO
(II) Electricity 600 250 260 (6) Li¢did1!'uel 250 250 ,"
'II-.MGIIUGJ , .. 250 250 l' ,
2Ii Total 1,000 000 GOO
II-.M:'UtII • 1,000 600 GOO ':
26' Total' 1,000 47' GOO 21 45
I-AU lJ'vtJs/PoI/IM' 21 10 11
(0) OJ&l', Wood & BagaMa 21 10 11
.II-M_uaI. • 979 464 4089 21 5
27· Total 1,000 351 614- 112 16 8
I-AU 7!'uelBll'oulllr ' 134 37 44 37 8 8 • (II) EIeOtrioity , , 12'1 37 37 37 8 8
(c) OoaI, Wood.& Bapaae - '7 7
II-M~VGI • 866 3140 470 76 '7
~ Total 1,000 167 810 167 10
I-AU.:rva.!PrnDer , 611 111 333 111 66 . (II) Eleatrioity, 611 111 333 III 10
II-MGIIVGI • • 389 .. 10 m 58
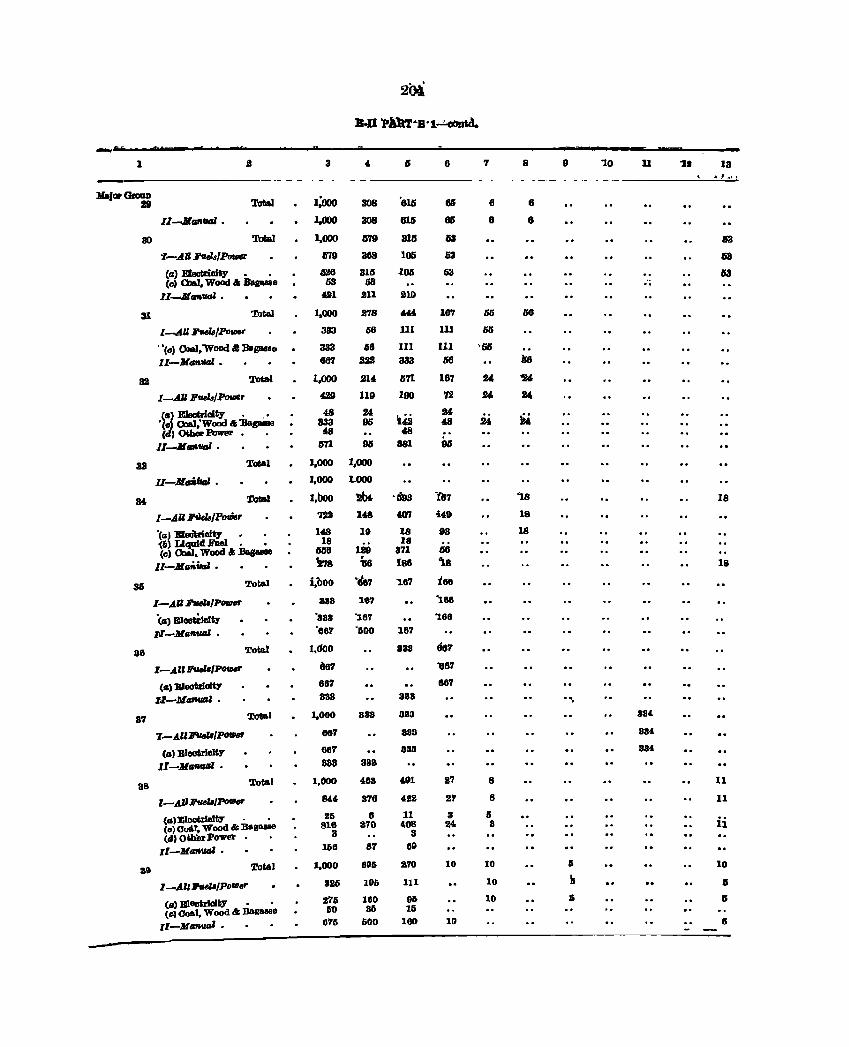
2~
.·n 'pAltT4B'l~tct..
- 1 3 " 6 6 7 8 9 "10 11 "lI 13 .. J .... ' ,
:MaJar GMa.D J9 l'otaI 1;000 308 '61:1 65 e 8
II -Manual , I.OOO 308 61:1 65 8 8
30 TaIBI l,,000 0'19 316 63 sa :I-AB ~/Por.t# Ii79 388 105 53 63
(a) EIeobiaity , , 026 315 too 53 13 (cl 0I&l. Wood" Bagaa&e 53 53 "
II-M_VGl, 421 .911 D10
31 Total J.OOO .2'18 "' 167 55 IS8
I-.AU F1Ith/Po_ 383 56 Jll III 55
"CCI) ONlI, 'Wood" :Begallie 333 G6 111 111 "61)
II-MdflllGl • 867 l!2J 333 66 116
82 Total 1.000 214 1171 167 24 ~
l-.AU lI'tUL/PouIer 4.29 119 100 7ll 24 24
<"' BIeotriaity • . ' 48 24 '142 24
!i6 '(e) Coal:Wood & 'Baa- 333 DO 48 24 (41 Other PowEor 48 48
Il-MlIflvol ' rm DO 381 U
33 1'of;a1 1.000 1,000
lI-M";'''''' , 1,000 1.000
M Total l,boo W4 'tl9a 1117 '18 18
l--.AU 'l'UdB/Prnier 'iD 148 WI i'. 1&
'(a) BJecil;riaity , , 148 19 18 98 18 '(6) ~d.Foel, , 18 18 Ccl • Wood Illlag.- 006 1.99 371 IS6
lI-MaiaiJaJ , Ma - 1&8 '\8 18
85 Total i,oOO '.107 '107 :i66
I-AU~/P_r 388 167 '166
'Ca) B100trlclW '888 "167 "'188
~-MGf&UIJl • '687 '500 187
86 Total l,doo 883 667
I-AIl1ltuh/P- 667 '867
<II) Eleotdoltlr 607 887
Z.l-MfJfIVIII ' 883 388 , "
87 Total 1.000 388 383 884
T-AU"""{PMI18r 667 883 884
(III BleotrIalt,. 667 883 884
I1-MllfIUIIl • 888 383
38 Total 1,000 463 0191 87 8 11
l-AJ,J~/PotDer 801' 878 422 27 8 11
(.)EIBIltrfoItlr . • 25 6 11 8 II
(e> Oo4f, Wood '" :Bagaase 816 370 '08 24- II 11
(4) Ot.hin' Power 3 8
II-MdfIUtd • 166 87 69
31l Total 1,000 695 B70 10 10 5 10
l_AUll'tHlI/PofIJef' 825 195 111 10 I; 5
(II' EleotrlaitY • • :z'15 160 96 10 II IS
(cl Ooal, Wood &: BaIl61188 50 85 15
Il-M_' . 675 500 160 10 15
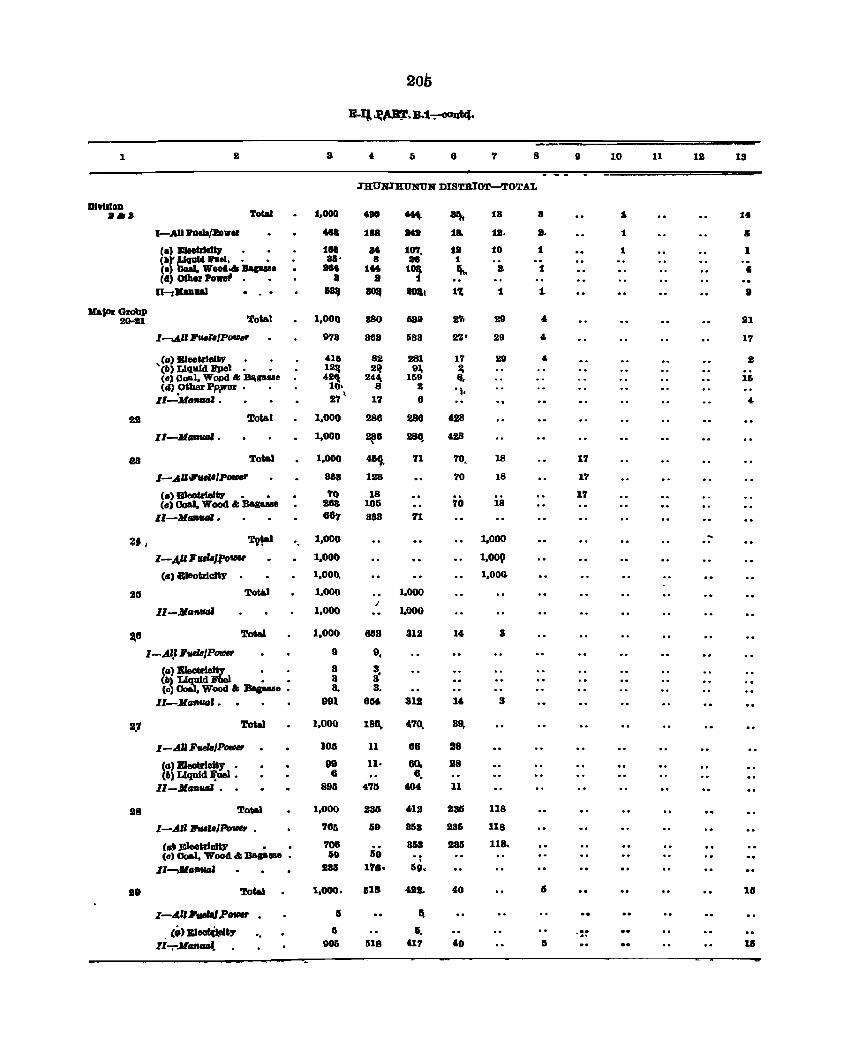
206
E-IJ. J:(tJl'J, B.1-;-OOQt4.
1 3 ~ li 8 '1 8 9 10 11 12 13
.THUN.THUNUN DISTBlOT-TOTAL
DI¥IIlDD ".,. To&al 1.000 480 ~ ~ 18 8 :I. 1.
I-AU hllljP..,w. 488 188 sa 1& 1l1. lI. 1 iii
Ca) m ... _ . • 188 84 107, 11 10 1 1 I (lIY {;!:'1114 "'eI" • 311' S 88 1 C.) ... Wood'" B., ... aM 1M t, Ih. I. 1 • (4) other Pawl. • a lI'
D"""7XUluJ . . . Iq ~ SQI 1't 1 1- 8
Valor Grobp Total 1,000 880 639 2'1,' 29 ~ 20-111 21
I -....lll Ptur.IPQ~'" 978 868 698 H' 29 ~ 1'1
ell) BlectrlclW 415 82 281 17 29 4 2 '(b) Llquld Fpet. • 1211 21! 91" ~
(c) coal, Wood oil Bllllasae ~2i1l 244& 169 a 15 (d) .Other P~or • 10' S 2 • j.
II-Mo'AlItII • 27' 17 0 " 2B Total 1,000 280 288 428
:cI-MllflfIIII • 1,000 2(10 288.. ~l!B
ea Total 1,000 "" 71 70, 18 17
I-AU""""'/PotI1ef' 888 128 70 18 17
(II) Bleotrlolt7 • • 70 18 17 (c) Coal, Wood oil Bagaue soa 105 70 18
II-MIIfIfMII • 8&, 889 71
~t I T9taJ . 1,000 1,000 -.. 1-,4"'1",'-/1'0" 1,000 I,OOQ
ell) Blootrlcl')' 1,000. l,OOIl
35 TotM 1,000 1,000 I
II-MlltMIIII 1,000 I.Ooo
~II Tenal 1,000 8113 312 1~ 3
I-A~I J' __ /P_ 9 9,
(II) Eleotrioiile . . 3 3, (b) Li~uid 1 • • 3 3 (0) Coo • Wood '" Bapaaa • 3. 3.
II-.ltll_l. 991 85& 312 14 3
IJ Total 1,000 180. 470. 39,
I-AU FurJ./PotDer 105 11 88 18
ill) EleoIiI'imy • 89 n· 00. 28 61 Liquid lfDal ' 8 6,
II -MII"IIAI • 891S 473 .04 11
28 Tot;aI 1,000 1315 4112 236 118
I-All ...... /Potll8r • 786 69 853 286 118
(a) Eleotrielt7 . . 708 868 285 118. (0) Coal, Wood & Bag •• o • 59 159 ,
II--,Manual 188 17 •• 59.
II Total 1,000. 618 411.. 40 15 lIS
l-A.lI '-"I }'ower Ii ~
c,;) BlaotilaIt,. '. IS 6, .~~
Ii-;-,JIIIfIUII( 996 618 417 40 6 11
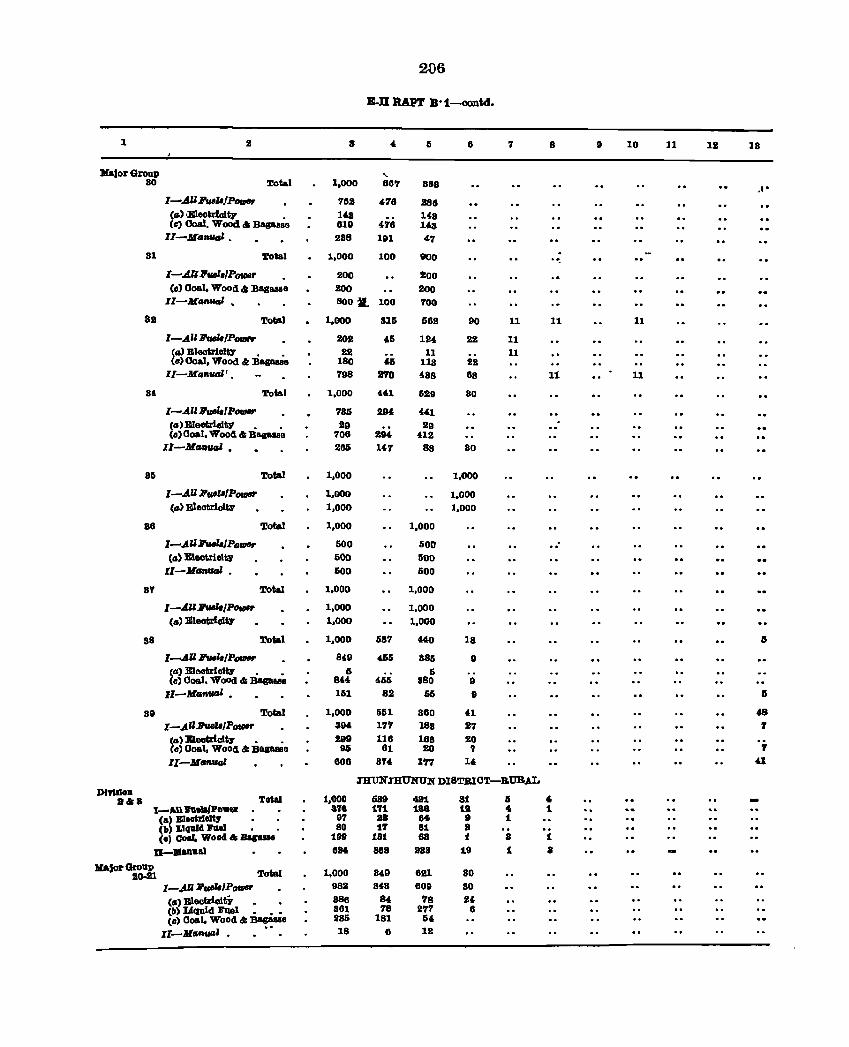
2DS
B-D RAPT B·1-00ntd.
1 2 8 4 5 6 7 8 9 10 11 12 18
){alar Group , 80 !rotAl 1,000 867 888
" l-.AU"""!P"",,, 762 476 SSG (IJ) ·Eleotdotty • U8 143 (C) Ooal. Wood & Bagas8e 6111 476 Us
l'l-MantItJ' • 288 191 47
81 !rotal 1,000 100 900
I-.AU7wl,/POI/JIIr 200 200 (0) Ooal, Wood & Bagasse 200 200
II-M_IIG& • 8002.. 100 '700
sa Total 1,000 315 562 90 11 11 11
I-AUJIuh/Powr 202 45 124 22 11 <a) Bleotr.iCllt)" • • 22 11 11 (c)Ooal, Wood cI: Bapsae 180 " 113 22
II-ManVAl' • 798 B'rO 488 68 11 11
84 Total 1,000 441 529 80
I-AU lIuel1/P_ 785 294 4"1 (IJ)Bleotrlctfi1 • , 29 So (o)Ooal, Wood&BBopsse 706 294 412
II-lIEu",,' • 265 147 88 80
85 Total 1,000 1,000
I-.AU 1I'1I#IIIPomer 1,000 1,000 (IJ) Eleotr1oltlr 1,000 1,000
86 ':rotal 1,000 1,000
I-AUIl'tHh/PQ&I1CIr 600 500 .. (IJ) lIIlect.ricl.tF 500 500
II-lIE_VAl • 500 500
87 Total 1,000 1,000
I-AU,,",,/PGuM 1,000 1,000 (IJ) Eleotrlc1w 1,000 1,000
88 Total 1,000 68'7 440 18 5
I-AU lI'wh/PQIIJCIr 8411 466 886 II (tI) Eleotrlcl.ty • • 6 5 (CI) Ooal. WOOd & BaIl8U8 844 465 880 0
II-lIE_VAl • 151 82 66 8 Ii
89 Total 1,000 651 860 41 48 I-AU 1I'tIBII/P",..,. 8114 171 183 27 7 (tI) EJeotriclty • • 299 116 188 20 (CI) Ooal, Wood & Bapsae 96 61 20 '7 '7 II-lIE __ 606 874 177 14 41
muNnruNUN DISTJLIOT-RUBAL DI'I1IIOD
Total 1,000 689 491 81 & 6 8&S I-Ml h./l'o .. ,. 8"6 1"1. 1.88 111 40 1
(a' B1eetr101~ 97 as 66 9 1 (II' LlQllld I'lUl • 80 1'1' 81 8 (e) coal, Wood & Bagasse 199 181 sa 1. 8 :(
D-lIIaDuai 6M 888 a88 19 1 8
DforGroup 20-21 Total 1,000 349 621 80
I-4111l'uNIPOflM 982 343 609 30
(II) B)eotrioltlr 886 84 78 24 (II) LiqWd J!'qel • .' 861 78 277 6 (0) Ooal, Wood &; BagaSse 235 181 54
lI-MaftUll' • • • 18 6 12
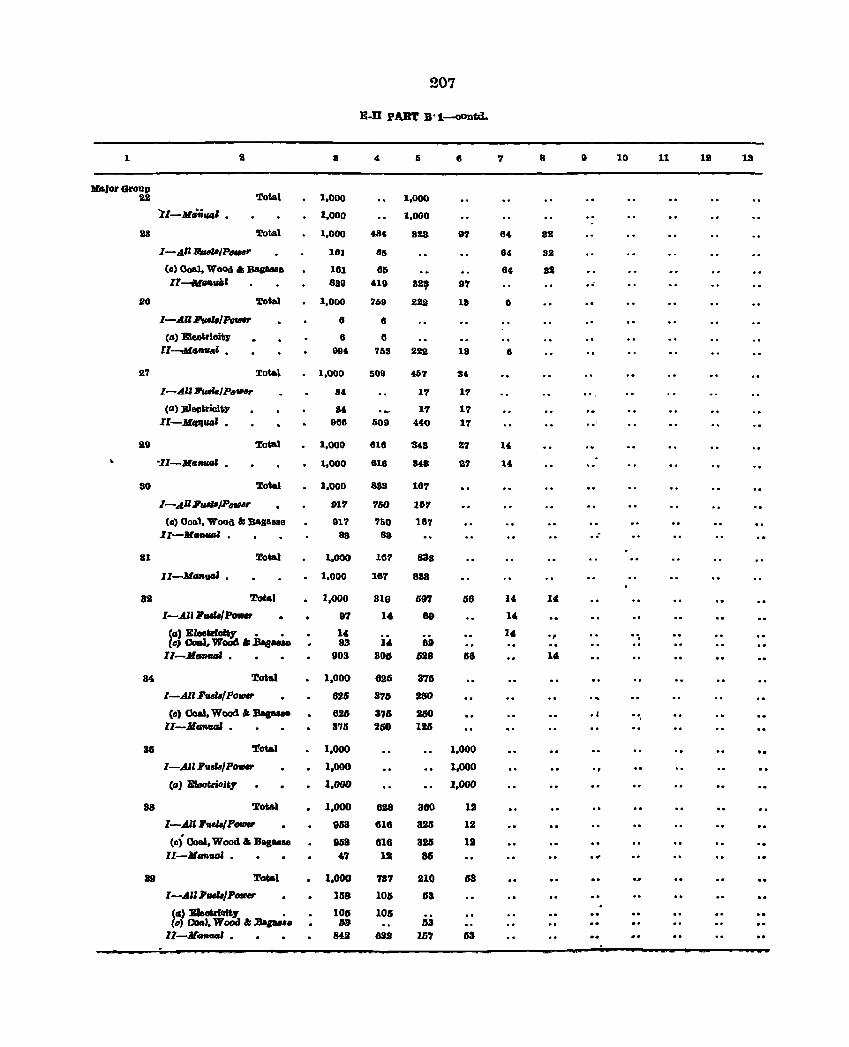
207
E-D PAR'l' B·t.-ooutd.
1 8 5 8 '1 8 9 10 11 12 13
at:.lor Group Total 22 1.000 1,000
71-MI.ft'll4' • 1,000 1,000
2S Total 1,000 481 828 97 84. 82
I-All 11.tu,./P_r 181 85 84 82
Cc) Ooal. WoOd. Bagallll6 181 86 64 82 :ll-U_vb& 8a9 419 8S, 97 ..
28 Total 1,000 769 222 18 0
l-AU'_"/PotDn' 6 6
(II) EleotrioitJ' 6 6 II"""""lIftU/Ji • 994 768 222 18 8
27 Total 1,000 509 457 84
I-All 1I'''''/PtlflHJr 84 17 17
(II) Blectricl», 84 1'1 17 Il-MIPIUIJ' • 9t16 509 440 1'1 .. '
29 Total 1,000 616 -:US 27 14
"Il-M._' 1,000 010 848 27 14
SO ToW 1,000 888 16'1
l-,J,IlIUIII/PoIIH' 917 71)0 167
(0) 0011.1, Wood aG :Bagallll8 917 7&0 187 .ll-M.-l. 88 83 ..
Sl Total 1,000 167 838
ll-Mllftud • 1,000 167 888
311 Total 1.006 319 697 1S6 U 1~
I-AlI'''''''''''_ 97 I" 69 14
fill Eleoki~ • • 14 14 ., , Ii, Coal. Wocicl ... Bas .... 83 )4, 89 11-.""" . 903 808 828 1S8 1"
34 ':rotal 1.000 825 375
I-A" Fful6/P_ 6115 316 21S0
(0) Coal. Wood a: Bag .... 626 378 250 . : ll-MGftua' • 875 250 IllS
31S Total 1.000 1,000
I-AUF,,"'-/P_ 1.000 1.000 ., (a) BllIotrioit.r 1.000 1.000
38 Total 1.000 U8 380 12
I-All Fvd.jP_ 9S3 616 321S 12
(ci Coal. Wood a: Bag .... 953 616 325 III II-MflftgaJ • 47 11 SIS
39 Total 1.000 737 1110 sa I-AU 1'"./P_, 158 108 ISS
III) EleotrfoltJ' • 10& 105 1:0) Co4J. Wood III .Dagu •• 118 a3
ll-Jla-m . 842 832 157 63
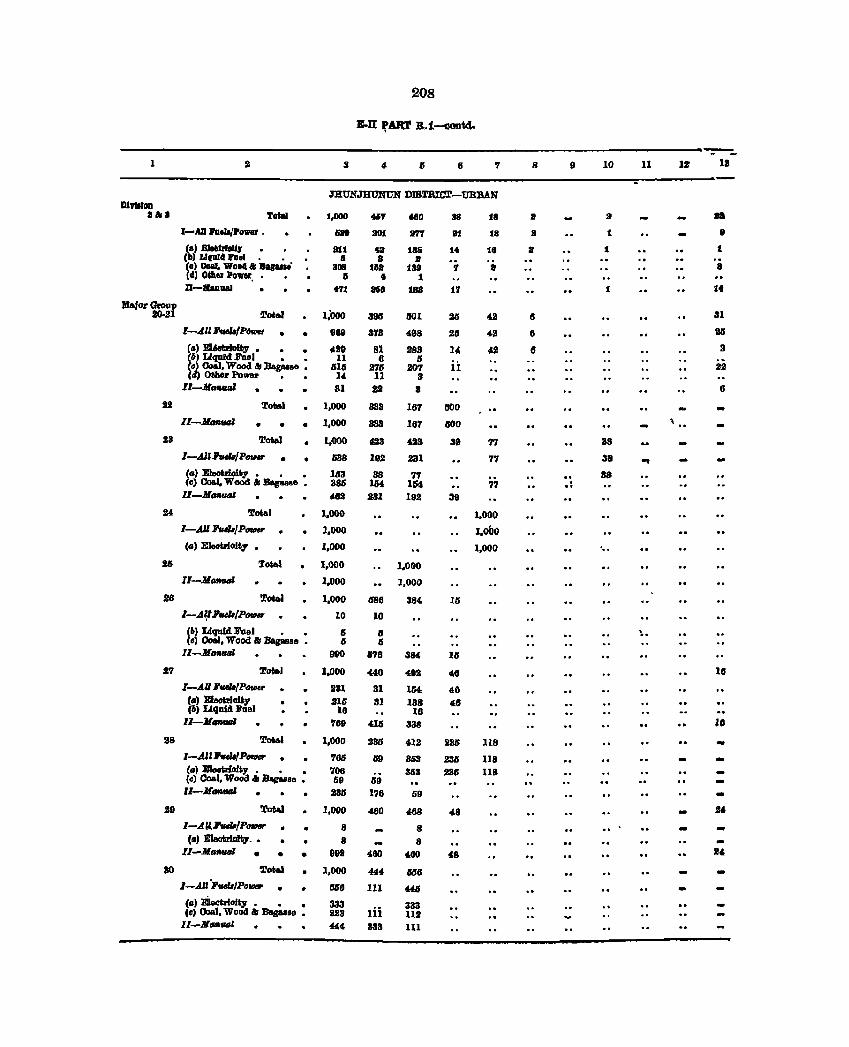
208
------------------------------------------------1 II 6 7
mU.NJHUNUN DlBTRI!1r-UBllAN PJrlaJoa
alia I-AD Paet.jPower •
Ca) mllllldldq.
Total
(II) Llllllld I'ael • Ce) 0aaJ. WaH" B ...... · (d) 001 .. Po .... D-JbIIalll
1,Il00
ll28
811 I
aoa II
f'11
111&101' Grouf lIO·.11 ~otaJ 1,'000
1189
~2D 11
IIIG 14
2.11
S3
l-A.ll I'ueI4/P6wM • rll) EUefIrioity. • • m Liquid .Friel • • (II) Coal, Wood .. :Oa8u8o • (<I) Other Powal'
l'-JlGfIUIII 81
1,000
l'-Mrmlllll • • • 1,000
• •
(0) ElootrioU..". • • (c) 00&1. Wood &I Baguse • II-JItmul
~otal
I-AU h41I/P_
(0) 1IlleotrioJt;y
Total
l'-MGHIII
1,000
1138
IG3 386
48S
28 Total
1,000
1,000
1,000
1,000
1,000
1,000
I-A~lh41lIP_
(IJI Liquld Fuel • • (c) Coal, Wood II BaguBa •
ll-JIMllllll
10
S II
990
2'1 Total 1,000
231 SIG
16
l-AUlueIa/P_,. fll) lIlIeotrJolt;V (6) Liquid Fuol
II-X"'""" 789
28 ~otal 1,000
29
so
l-AU,.d8/P_ 786 (II) BlaoVloI$y'. • • 708 (~) Coal, Wood oil Baguso • G9
ll-X_'" 2311
Total
l-AU,".!P_ (.) EJeotdoity. • •
l'-M_~ • • ToW
•
•
•
• (0) ElectrioitJl'. • • (0) Coal. WoOd I; Baguse •
II-lIfrmual
1,000
8
8 DOl!
1,000
IUSIJ
aa3 1123 «,
41'1
lI01 .. 8
:tlllt
• ali8
896
373
81 8
276 II 2J
333
388
all
182
38 164 .231
ml6
10
15 S
M6
440
31 31
416
2311
IJD
69 176
460
460
444
III
Iii aaa
caD 2'1'1
185 1I
189 :t
188
1101
4,98
283 5
207 3 8
167
1117
423
231
77 1M 192
1,000
1,000
384,
884
4112
164 188
18 338
412
868 3113
119
468
8 8
460
1US8
44S
333 112 III
'I
17
211
26
14
11
1100
1100
39
39
Iii
16
46
46 48
2311
236 236
18
18
16
It
48
41
411
'1'l
77
77
1,000
I,obo 1,000
118
118 lIS
8
II
1I
II
6
6
6
.. . ..
10
8
1
1
1
98
38
38
' ..
11 18
11&
II
t
8
af
31
211
9
22
8
18
18
--
-
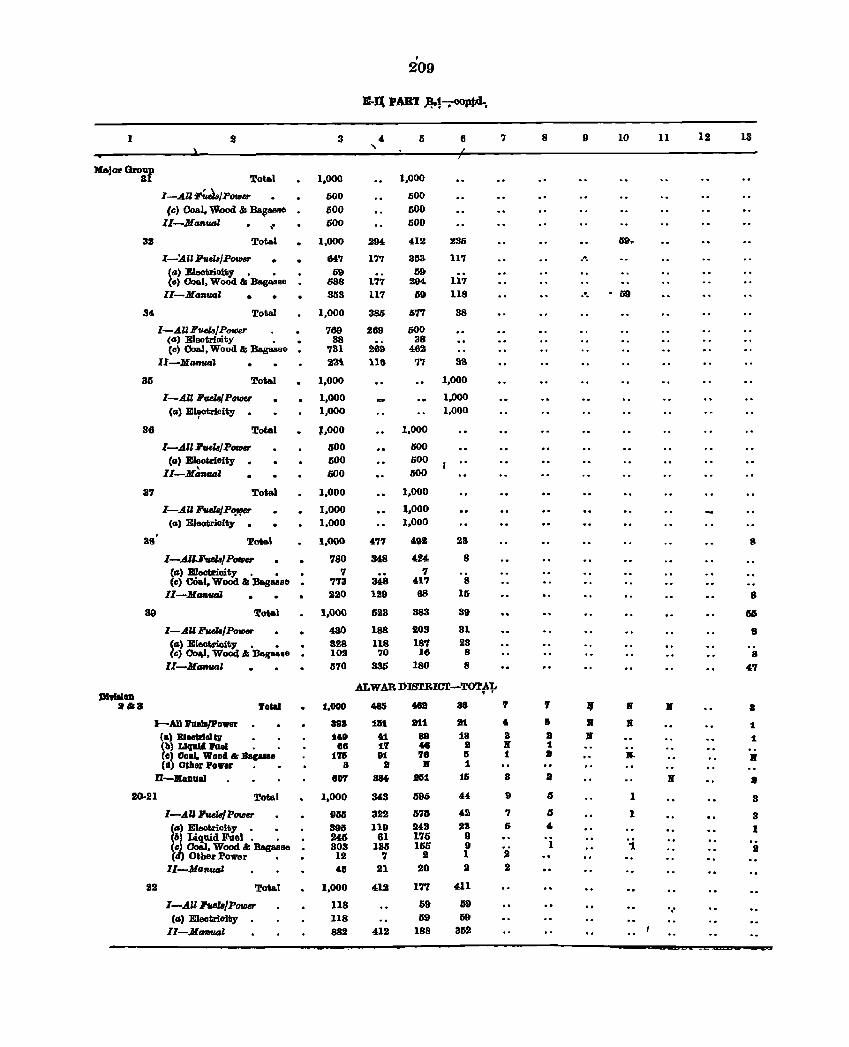
, 209
B-Il PAR'f ~~.copt4·.
! 2 3 4 Ii 8 '7 8 D 10 11 12 13 ,
MaJor Gro:r Toto.l 1,000 1.000
I-AU ¥~~/POIIJIlf' 600 500 (Il) 000.1, w,ood &; Ba~8oIIRe liOO 600
lI-MaRUDI "
500 500
32 Total 1,000 294- 412 235 69.
l-~U Ji'uelBjPowllf' 647 177 35a. 117 .". (a) Eleotrioity" " li9 59 Co) 000.1, WoOd &; Bagasse 688 177 294 117
II-MaR,,",' • 353 117 li9 118 .', 59
34- Total 1.000 385 577 38
I-All Fuels/ P01IIU' 769 269 500 (a) Elootrioity 38 38 (0) 000.1, Wood & Bagasse . '731 289 482
II-MIIR""l 23\ 118 7' 3S
35 Total 1,000 1,000
I-AU Fv.el8fP_ 1.000 1,000 (a) EI~trioity · 1,000 1.000
36 Total J.OOO 1,000
I-All 'GelB/P_ 500 500 (a) EI~Griaity · 500 500 II-M_' 500 500
37 Total 1,000 1.000
I-AU 7GelB/PD!'!Ilf' 1,000 1,000 (a) EJeatrioity · 1,000 1,000
, 38 Tot&l 1,000 4-77 49~ 23 8
l-.A.I'I.J'uelA/ P_ 780 348 424 8 (a) Eleotriaity" • . '7 '7 (e) COal, Wood &; Ba.gllllse '7'13 348 417 8
II-MaIItIf.IJ 220 129 88 16 8
39 '.rotal 1,000 523 383 39 66
I-AU Fuels/P_ 4SO 188 203 31 8
~a) Electricity" • . 328 118 187 23 c) Co .... Woo4 Jr. Ba.gaase 102 70 16 8 8
II-Ma_' 570 335 180 8 4'1
1H9IIlOD ALW AR DISTRIa.r-TO'r!-'f-
B •• ToCa! 1,000 48S 46B 88 '1 7 lJ .. .. 8
I-AD FueJajPower 893 1&1 atl at • .. R .. 1 ta> B1aD&!lal Q 1.9 • 1 88 18 8 :It .. :I. (Ia) L1qut4 I'uaI 88 :I.'l M II .. t (e) Goal, Wood'" Bag .... 17& 91 78 6 1 It lI. .. (d) Other Power 8 a R 1
fi-lIIaDUa! 80'1 886 .151 16 8 II .. :It
20-21 Total 1,000 343 696 44 9 IS I S
I-AU FveU/ Powat' D5IS 322 57& 42 '1 3 1 3 (tI) Eleotricity " 395 119 243 '3 & 4- I (6) Liquid Fael 0 " 246 61 17.0 9 (~ 00aJ. Wood &; Bagasse 303 135 155 9 OJ I '1 2 ( Other Power " 12 7 51 I
II-Manual 4,1i 21 20 2 51
22 Total 1.000 412 17'1 411
l-.A.Jl7uelB/POIDet' 118 69 69 ",'
(a) Eleclirioity 118 59 69
II-MtmUD' 882 4,12 188 362
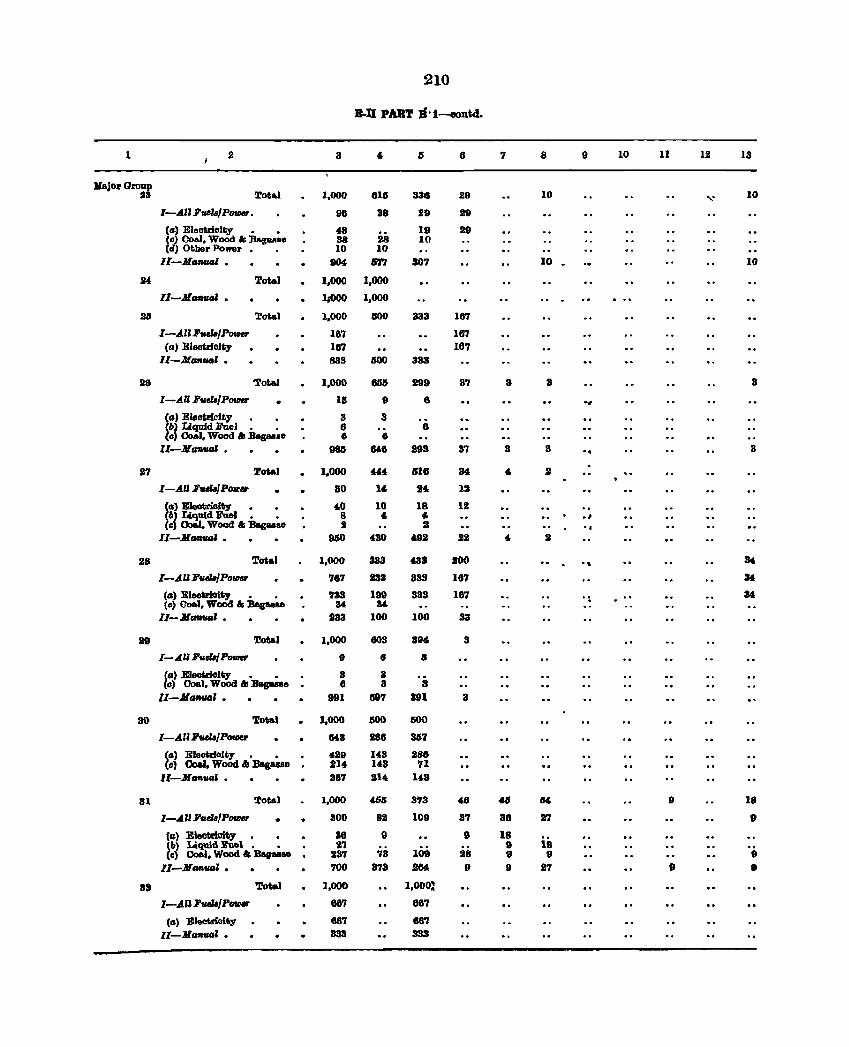
210
B·n PART JI·1-oontd.
1 2 3 6 7 8 9 10 11 12 18
HajorGroup lI3 Total 1,000 816 336 29 10
" 10
I-AU Fuels/P_ • 98 38 29 29
(a) Eleotrioity • • 48 19 29 (ll> Ooal, Wood It Ba.ga.sse 88 28 10 (d) Other Power 10 10
I1-MaAVlll • 004 1Y17 30'7 10 , 10
U Total 1,000 1,000
1'-Mrmw! • I~OOO 1,000
25 Total 1,000 500 333 167
I-AU Fuels/POlDer 187 187 (aJ Electrioity 187 16'7
II-MaRui • 833 100 383
28 'Total 1,000 856 299 3'7 3 3 3
I-AU Fuela/Power • II 9 6 .., (a) Electricity 8 8 (6) Liquid FUeJ. • 6 6 Co) Coal, Wood" Bagall8e 6 6
II-M.nw • 98fj &8 29B 87 3 3 .. 3
27 Total 1,000 444 616 34 4 2
I-AU Fuels/POlZer &0 1& 24 12
(CI) Eleotrioft,. • ~ 10 18 III (6) Liquid hel. • 8 4 4 " (c) Oo6l, Wood" Bagaaae 2 2 ., ll-M_' . 930 430 '92 22 4 2
28 rotal 1,000 333 433 100 ., 34
I-AU' __ /Po_ 767 139 833 167 34
(a) EleotriOity • • 133 199 393 167 3& (c) Coal, Wood It BIl£lUlIUl 34 34, .
II- MGnu' • 133 100 100 33
29 rotal 1,000 603 8N 3
I-AU I'ufllli P_ I 6 8
III) Eleotr.loit.,. • • 3 3 0) Coal, Wood " Bagasse 6 3 8
II-Manua' • 991 197 991 3
30 'fotal 1,000 1500 ISOO
I-All' __ /PovIer M3 286 367
<") Eleotriolty. • . f29 148 286 (c) Coal, Wood" Bagasse 214 143 71
II-Manual. 387 !IoI" 14,3
81 Total 1,000 465 873 48 41 54 II 18
I-All Fuela/P_ • 300 82 109 87 38 27 It
Ca) Eleatrioity. • 88 {I 9 18 .. (b) Liquid lI'tI&1. • 21 9 18 (D) Coal, Wood" Bap ... ae 237 73 109 !loS 9 9 8
I1-M_ual, 700 373 284 9 9 27 It 9
89 Tota) 1,000 I,OOOl
I-All Fflela/P_ 667 68'1
(a) Eleetricit.y 687 68'1 II-Manwl • 333 333
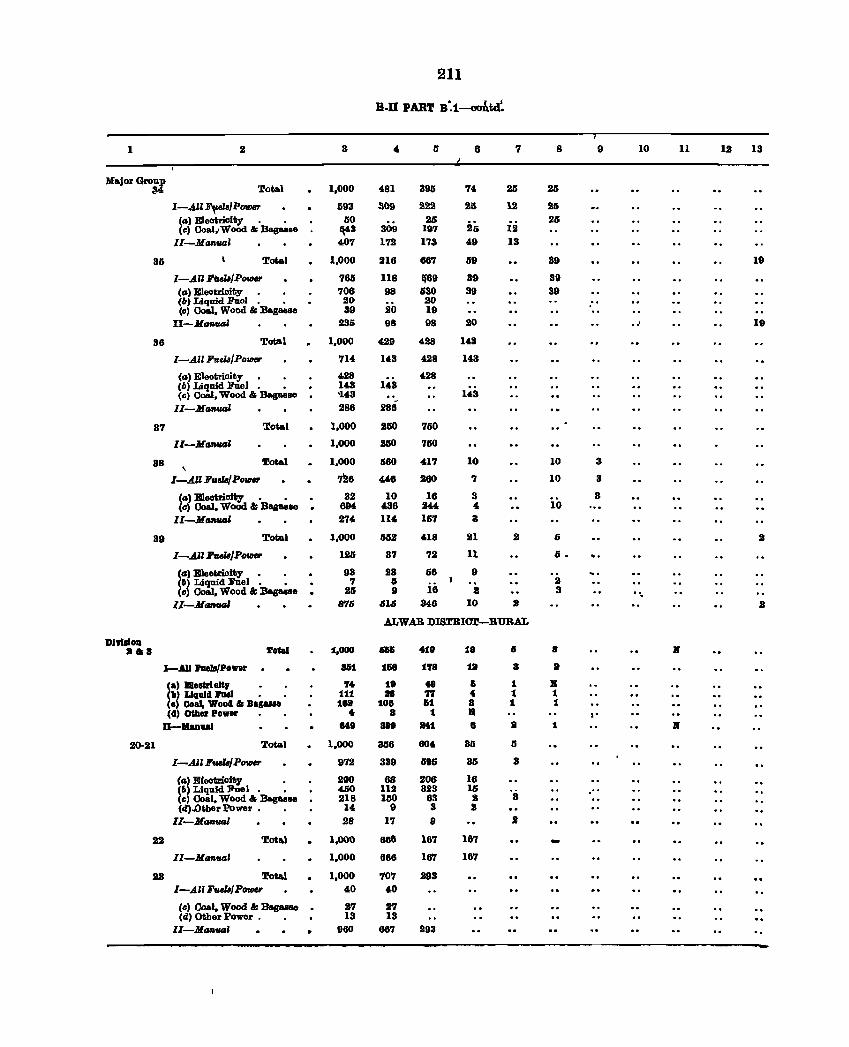
211
B-D PART B:1-oo!td!
1 2 3 6 7 8 9 10 11 12 13
Ma.jor Group 84 "rotal 1,000 481 395 74 25 25
I-AU ""ela/P_ 593 309 222 21S 12 25 (G) Electrioity. • 50 26 25 25 (e) Coal,-Wood &; Bag .... se ~3 309 197 12
II-Ma.rwoJ 407 172 173 49 13
36 "rota.1 1,000 216 667 59 39 19
I-All 1!fJela/P_ 7M 118 1$69 39 39 (G) Electrioity 706 98 630 39 39 (h) Liquid Fuol. • 20 20 (0) (Joa.I, Wood &; Ba.g .... so 39 20 19
II-MG,.lud 235 98 98 20 .. ' 18
36 Tota.l 1,000 4211 428 143
I-All Fuela/Power 714 143 428 143
(G) Eleotricity 428 428 (b) Liquid Fuel. • 143 143 (0) Coal, Wood '" Ba.g .... ao '143 14,3
II-MaBUGI 286 286
37 Total 1.000 250 750
II-Ma_1 1,000 250 760
88 Total 1,000 560 417 10 10 3 , I-AU 1'u,", Power 726 446 260 7 10 3
(G) Electrioity. • 32 10 16 3 8 (0) (Joa.I, WoOd &; Bag .... se 684 436 244 4 10
II-MaaUGI 274 114 167 :&
39 Total 1,000 662 418 21 2 6 2
I-All :ruela/P_ 125 37 72 11 6 •
(G) Eleotrioity 113 28 66 8 <II) Liquid FUel. • 7 5 iii
2 (c) Coal, Wood &; Ba.ga.aIO . 26 9 2 3 .
Zl-MrmuaI 876 .sl.s .346 10 2 2
ALWAR DISrRICl".r-RURAL
DI9IlIolI .&. ToCai 1,000 Ali "19 18 5 8 If
I-AU her./Power 861 1&8 178 13 8 It
(a' Bl.otrl e1&, 7. 18 6. II 1 11 (11) Liquid 1'ae1 • 111 118 '17 .. 1 1 (e) Goal, Wood II Bag_ lea 10e 111 8 1 1 (d) Other Power .. 8 1 11 :.
II-llanw MI Bn ItH 8 III 1 R
20-21 Total 1,000 356 604 35 I)
I-A.n Fuela/P_ 972 338 596 36 3
(1&) Efeotrioity 200 68 206 16 (II) Liquid FUel. • 450 112 323 16 ·s .. (c) Coal, Wood '" Baguao 218 160 63 2 (d)-Othel' Power • 14 9 3 2
II-Maflual 28 17 9 2
22 Tot .. l 1,000 686 187 187
ll-MaR'UGI 1,000 886 187 187
28 Total 1,000 '107 293 I-An FuelB/Po_ 40 40
(e) Coal, Wood '" Ba.ga.ase . 27 27 (d) Other Power. 13 13
II-MI&_I 980 887 1193
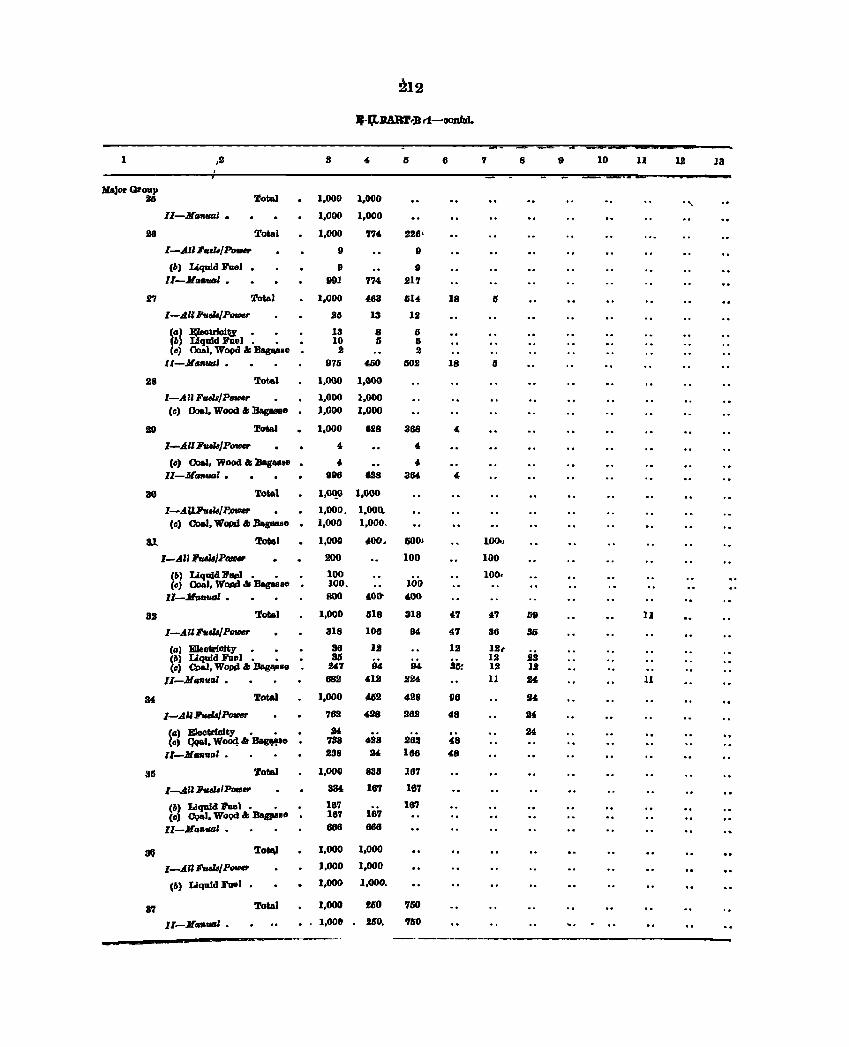
212
Jp-J,tltAll'l'rB t1~oonId.
1 ,2 3 I) 6 7 8 9 10 11 III 13
lIalor~oup Total lIG 1,000 l,DOO
".
II-Nllfw.al • 1,000 1,000
28 Total 1,000 7'14- 228'
I-All FtUlI/Po_ " " (b) Liquid Fuel • " 9 Il-JlllfI_l • 991 774- 217
27 Total 1,000 4,63 &1, 18 IS
I-All FurM/P_ 26 13 12
ill) ~otrioiu • • · 13 8 & II} Liquid FlIel. • 10 Ii 6
(e) Coal, W09d &: llagovIae 2 2 II-NllfI'UtJl • 976 ~O 1102 18 15
28 Total 1,000 1,000
I-All FtHls/P_r 1,000 1,000 (c) Coal, Wood" BagUle 1,000 1,000
28 Total 1,000 8118 888 " I-AU FtHls/P_ , , (0) 00aJ, Wood" Baguse · , ,
II-MIIMlIl • 898 GlI8 384, " 30 Total 1.0C!0 1,000
I-A1J.hellJP.owr 1,000. 1,000. (c) 00eJ. Wopd II BagU80 · 1,000 1,000.
3J. ToMl 1,000 400. liDO, 100"
I-AU ~"dlJPQlMr 200 100 100
(1'1) Liquid 11'.".1. • · 100 100
100. (c) Coal, WQPd .I; Baguse 100.
1l-.lftJntUJI • 800 400- 4LOO
32 Total 1,000 1518 318 47 ''1 69 ]I
I-All Fudl/P_ 318 lOG 94 47 36 35
(II) EJeotrillity , • 36 12 12 121 (b) Liquid FOel. • 36 III 1I3 (c) Cpal, Wopll III; Bagl\ll.e 1l4'7 94 94. 35: 12 12
I1-NllflurJl • 68J 412 224 11 24 11
34 Total 1,000 4IS2 428 98 114
I-All FtHls/PouM 70 428 262 48 24
(II) EleetrJoity • • · U 24 (c) Qqal. Woocl " Bagt'!,e 738 '.118 262 48
I1-M •• ulIl. 238 M 166 48
311 Total 1,000 833 16'1
l-AU FtUlI/Pou;ar 334 167 167
(b) LIquid Fuel. • 16'1 167 (oJ CQ.I, WOQd .. Bagju8e 167 167
ll-Jlofl,_' • 666 8fJ6
8Q Tota) 1,000 1,000
I-AJlFtHls/P- 1,000 1,000
<b) Liquid Fu.1 1,000 1,000.
37 Total 1,000 MO 750
ll-JlrrnfIIJI • I,DOt MO. 750
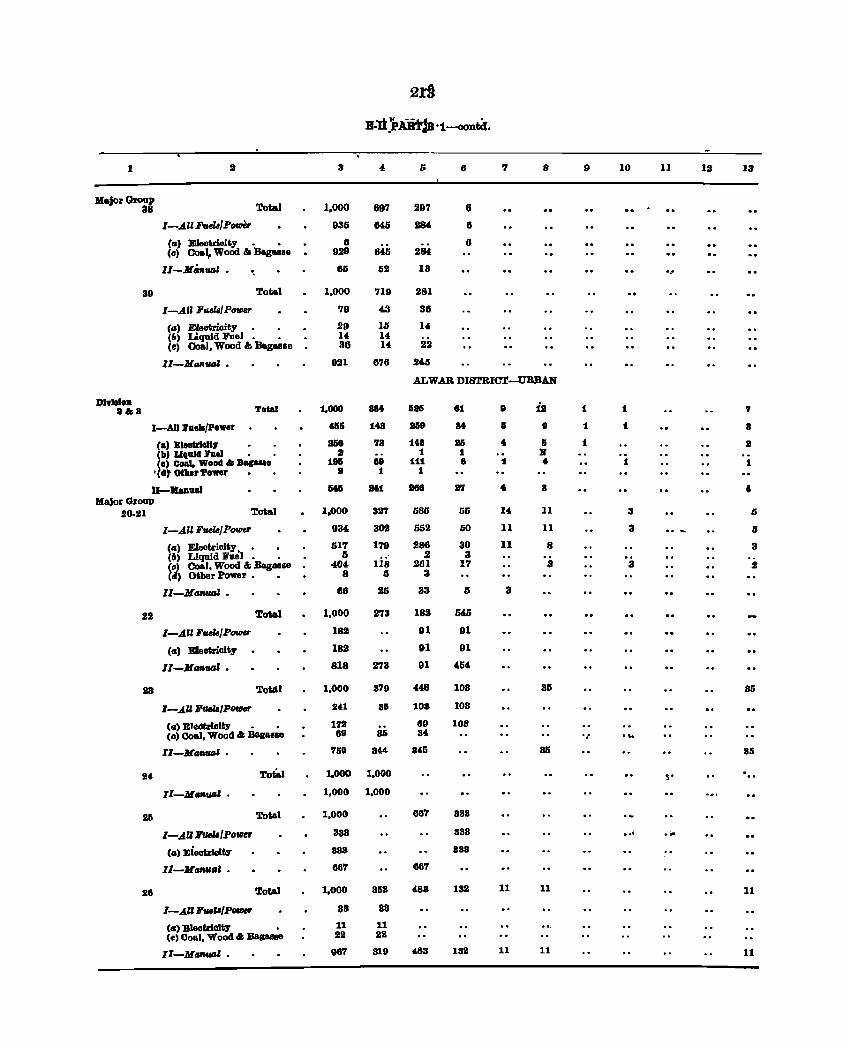
2ri
B.'Ii: )Aiir:a ·1-oontd.
1 S 3 4 6 6 ., 8 9 10 11 12 13
HajorGroup 38 Total 1,000 697 297 8
1-~UFtuW/P-er 935 645 284 6
Cm) Eleotrioity. • . 6 6 (c) Coal, WoOd &I Bagaalo 929 645 284
II-MGftfllJ' • 65 52 13 .~
30 Total 1,000 710 281
I-A .II FuelllPOVIu 79 43 36
(m) Electrioity. • 29 10 14 (b) Uquid Foel. • . 14 14 (c) Coal, Wood &. :Bagaslle 36 14 22
ll-Ma.nUGI • 021 676 24.5
ALWAB DISTRICT-URBAN
DI"lsIon 811a Total 1,000 884 &.86 81 8 is 1 :I ,
I-AU Fullla/Power G& 148 S&O 84 & 8 1 :t. a
Ca) BleeUlell, 2&8 78 UB 8& 4 & 1 8 (b) U,aJd l'1lel 8 1 :t. B' (.) Coal. Wood II ....... 18& B8 11:1 8 1 4- 1 :t.
'Cdt othar7oWlr 8 1 1
D-llaDual aG S41 seB 87 4 8 .. MaJor Group
20.~n Total 1,000 327 685 56 14- 11 3 Ai
I-~ll FuelI/P_ 934 302 552 50 11 11 3 6
(c) Eleotrieity. • 617 179 286 30 11 8 3 (b) Liquid hi. . I) 2 3 (0) Coal, Wood &I Bagasse 404 118 261 17 3 3 2 (d) Other Powur • 8 6 3
II-Mil,"",' • 86 26 83 is 8
22 Total 1,000 273 182 545
I-~U FuelI/POVIu 182 91 91
(a) Eleotrieity 182 91 91
II-MGR'II.IJI • 818 273 91 4&4
23 Totar 1,000 379 448 103 8& 8&
I-AU FfUlI/P_ 241 8& 108 103
(c) ElMtrlclty • • 172 8C1 lOB (0) Coal, Wood" Bagasse 811 8& 84 .; .•. :r:t-M-' • 769 844 845 86 86
24 Total 1,000 1,000 ,. . .. II-MtIfIUG' • 1,000 1,000
26 ~I 1,000 867 388
I-~U FfUlI/POfll" 338 888 .. I .io
(II) EieutrklltJ'" 888 383
II-MGflUII' • 887 887
28 Total 1,000 862 488 132 11 11 11
I-AUF'UII'./P __ 88 88
Ca) Bleotriaity • 11 11 (c) Ooal, Wood" BapBllo 22 22
lI-MtIfIUIJI • 987 819 483 182 11 11 11
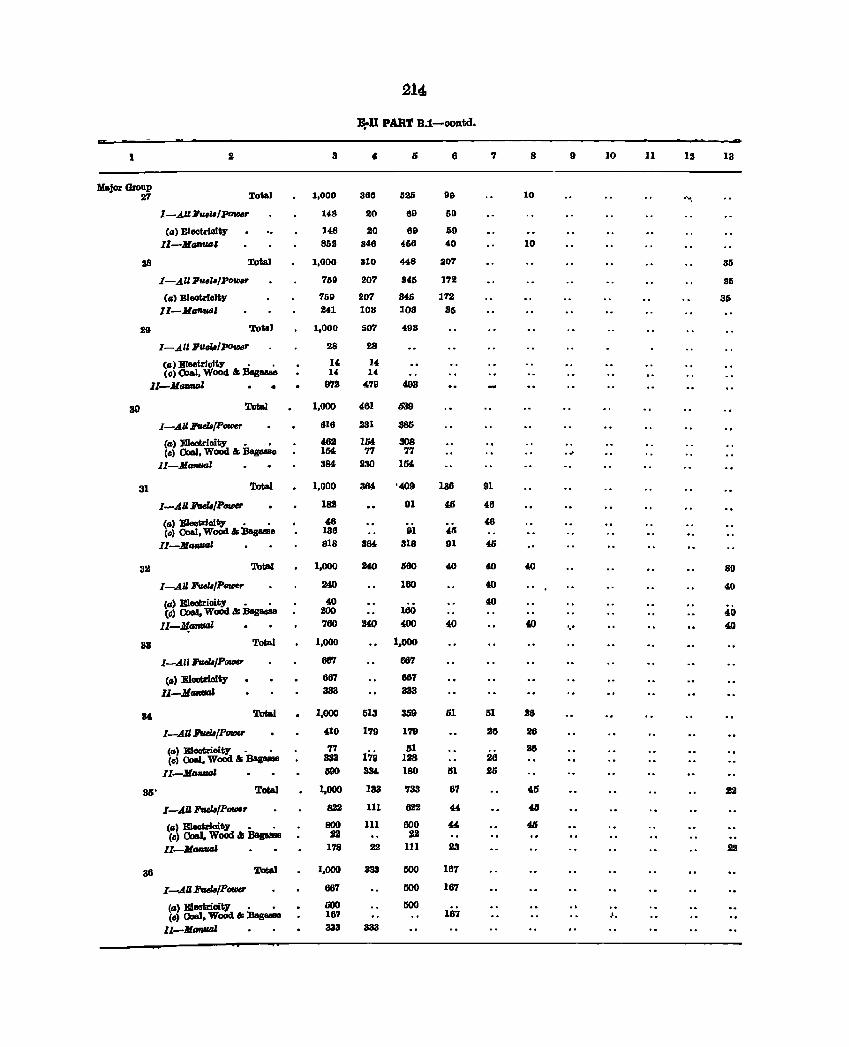
214
~n PART B.1-ooll.td.
1 2 3 4 5 6 7 8 9 10 11 IS 13
Major Group 'l'otal 21 1,000 386 526 99 10 '''.
I-AU Fud8IPmlJer 148 20 69 59
(II) Electrlclty 148 20 69 59
II-MllfltuI' 852 346 456 40 10
lIS Total 1,000 310 44S 201 35
l-AllllueZ.,PofIJer 769 207 345 172 35
(a) Eleotrlolt, 759 201 345 112 35 11-MaflutAl 241 108 108 85
29 Total 1,000 507 493
I-Allll"'PDf/Jer 28 28
Ca) Electriolt,. • • 14, 14 (0) Coal, Wood'" Bag- u 14
II-MllrwtJl 1m 4.79 m
30 TotaJ 1,000 461 639
I-AU FwlB/P_ 618 231 385
Ca) Eleotrioity • • 462 1M 308 (0) Ooal, Wood '" Bagaa!aD 1M 77 77
II-Ma_Z 3M 230 1M
31 Total 1,000 3M '409 136 91
I-.4.U lI'wlB/P_ 182 91 45 48
(a) E100t;rioity • • 4.6 46 (c) (Joal, Wood '" Bag8llllD 138 91 40
II-H._val S18 384 31S 91 45
32 Total 1,000 240 560 4.0 40 40 80
I-.4.1J~/P_r 240 160 40 40
(a) E1eotrioity • • 4.0 40 (01 QIaJ, Wood '" Bag ... 1IB 200 100 40
I1-M_a'1lfllJl 760 HO 400 40 40 ',' 40
33 Total 1,000 1,000
I-All i'ucU/P_ 687 667
Ca) E1eotrioity 687 687
Il-JlIJfIIfItJI 333 333
3& Total 1,000 513 3S9 51 51 28
1-.4." FurJlII'wJer 4.10 179 179 26 26
(a) Eleotrioity, , 77 179 51 26 (0) OoaI., Wood '" :sag._ 333 128 26
Il-MGfIVGJ 590 3lN. 180 In 25
81)' Total 1,000 133 733 87 415 ti
I-.4.U FwM/P_r 822 111 622 44 4lI
(a ~ E1eotrloity , , 800 111 600 " 4S (0 (bal, Wood.t ]Jaguse :l2 S2
II-M_' 178 22 111 23 22
38 Total 1,000 333 500 187
I-AU l!wlsIP_ 687 500 167
(tI) Eluotrioity • , 000 500 (0) 00aI., Wood .tJ Bas- 167 167 J,
Il_MafltltJl 333 333
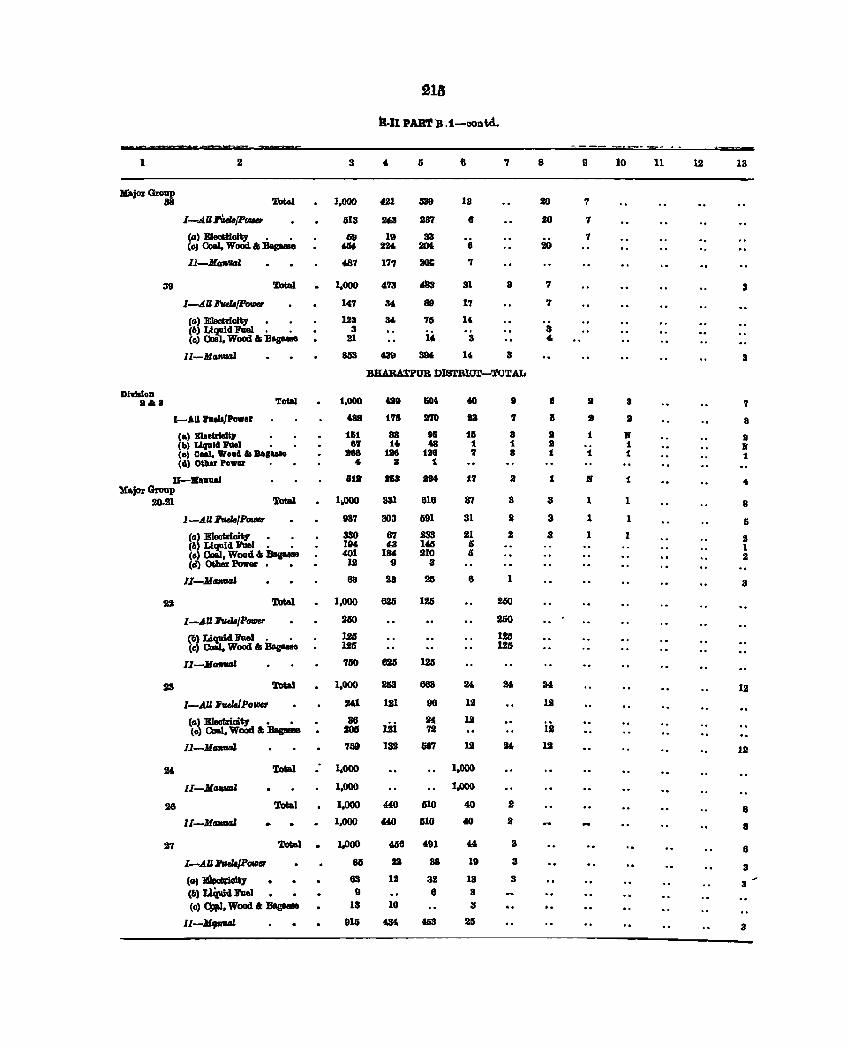
213
B-Il pAJrf B, 1-oont.d_
-- -mr,. -bY'" Z'p=m:- ... = .. _-- =r" J==;= _
1 2 3 4 5 , 7 8 II 10 11 12 13
!l(aj~ Group 38 '.l'otal 1,000 4.91 43~ 13 20 7
I-.II.UrVtkIP_ GI3 US 237 6 20 7
(a) EIeottioity _ _ 69 19 33 7 Cc) Ooal, WoOd &I BapIBe 4IU 224 2CM. 8 20
II-Ma",1Ia1 487 177 sos; 7
39 Total 1.000 473 48a 31 3 7 3
1-411 Fv.U/PouJer 147 M 89 17 7
(a) Eleotrioity • • 123 34 75 14 (6) Li~d Faal, • 3
if. 3
(e) Ooi • Wood &I 'B..- 21 3 " ll-Ma_1 853 439 3M 14 3 3
BlIABATl'UB DlSTBlC1r-TOTAL
Dlv.lllloD .418 Total 1,000 aa &04 40 a 8 II 3 .,
I-AllrulljPower 488 1'1l1 MD 18 'I 6 II II a (a) mlcb1cUl' 1111 33 9& 16 8 II 1 • 8 (b) LlIIIII.:I'UtIl 87 t40 U t t II 1 11 (0) Coal, Woo ... Ba ..... B88 116 138 7 a t 1 1 t (d) Other 'OWN .. a 1:
U-II.nua! al_ H3 _ ...
17 MaforGNup
• f if 1 " 20-21 Total 1,000 331 616 87 3 3 I 1 8
1-4UhdelP_ 137 303 691 31 2 3 1 1 5
(a) EIeotrioity - 330 67 233 21 2 a 1 II (b) Liquid Jl'DeI - • 194, !is 145 Ii (e) Coal, Wood &I Bas- 401 184 210 I;
1
(cI) 0theE Pvwer. • 12 II 3 2
11-.111111"111 ~ 28 211 6 1 3
22 'fot&l 1,000 620 125 260
I-All Ji'udBIP_ 260 260
(6) ~li'ueI. • 126 125 (c) , Wood &I Bagaeae 125 125
II-MaflVIII 750 628 1JG
23 '1'otaJ 1.000 2IS3 663 24 2& 24 12
I-AU PudJPOIllf" 241 111 U6 12 12
(0) E1eotriaity • • 86 cii H 11 iii lc) Coal, WOOd I; BBK- - 72
Il-MtJfI1UIl 759 132 687 III 2& III 12
H '1'otaJ 1.000 1.000
II-Ma",,,,,' 1.000 1.000
26 Total 1,000 «0 510 40 2 8 II-Mil_' 1,000 440 510 40 I 8
21 '1'otaJ :a.ooo 406 491 '" 8 6
I-AU J'rIeJI/POlD" 86 lJ2 38 19 3 3
(G'~ 63 13 32 13 3
(ll) Ll~n'lIel II 8 3 3
(c) Q;Ip.I, Wood .. Baga.Ma 13 10 3
ll-M'_' 91G 434 403 211 3
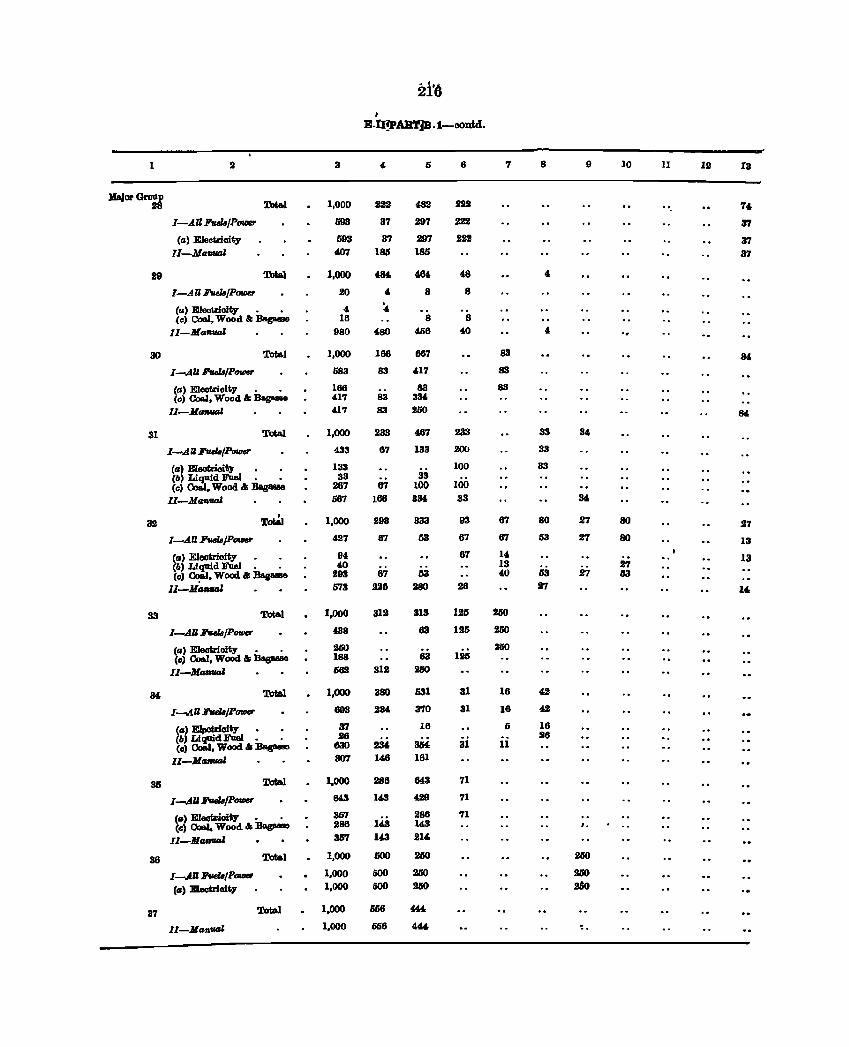
2i't\ t
E.n!pAB'l'jB .1-00ntd.
1 S 3 4 5 6 7 8 9 10 11 IS 13
Kajar Group ~ 28 1,000 :122 482 222 ., 74.
I-AU F'ueU/P_ 5D3 37 297 222 37
(a) Eleotrioit.y 593 37 297 lI22 37 lI-Ma_1 4.07 18tl 185 37
29 ToW 1,000 'IK 46t, 48 4-
I-All Ftula/P_ 20 4 8 8
(a) Elootrioity • , 4 4 (e) Coal. Wood &:Bagaaae 16 8 8
II-MaflUal 980 4S0 456 40 4
30 Total 1,000 166 667 83 84
I-AlI.I!'vJa/P_ 583 83 417 83
(a) Eleotriolty . • 166 88 63 ee) CoaJ, Wood & Bagaaee 417 83 334
ll-Jtoraual 417 83 !SO 84
31 Total 1,000 233 467 233 33 34
I-All]f'fUl./P_ 433 67 133 20<1 33
(a) EJeotrioity , . 133 100 33 (II) ftJ.i.id Fuel, • 33 33 (c) • Wood" Bagaue 267 67 100 100
II-Mo.val 567 166 334, 33 34
32 ToW 1.000 293 333 93 67 80 27 80 27
I-AU Ftuls/P_ 427 67 53 67 67 63 27 80 13
(a) Eleotrioity • • H 67 14- 13 (6) Liquid Fuel. . 40 13 27 (0) ~. Wood ":Ba.ga8IIe 293 67 53 40 53 27 53
II-MaAfItIl 673 226 280 26 lI7 l' 33 Total 1.000 312 313 126 260
I-.AU Ftuls/P_ 438 EI3 lSo 200
(a) EIeotr.ioity • . 26U 126
250 (0) CoaJ. Wood " BagIWIIIO 188 63
II-MtmVGI 662 312 250
34, TotAl 1,000 380 531 31 16 42
I-All FwM/P_ 693 234 370 31 16 42
(.) Elpotrioity 37 16 6 16 (6) Liq1lid Fuel. . 26 26 (0) Coil. Wood " Bag- 630 234 3M 31 11
II-M_' 307 146 161
3I!i Total 1,000 286 M3 71
I--.All :J'wJ&/P- 643 143 429 71
(.) Eleotdoity • , 367 286 71 (0) Coal. Wood & Bagasae 286 14.3 14.3 I.
II-Man-I 3B1 143 21'
36 Total 1,000 600 260 250
I--.AU :J'wJ&/P- 1.000 500 250 250
(.) Electricity 1.000 500 250 260
37 Total 1,000 5Ii6 '" II-MG~-' 1.000 056 '" ..
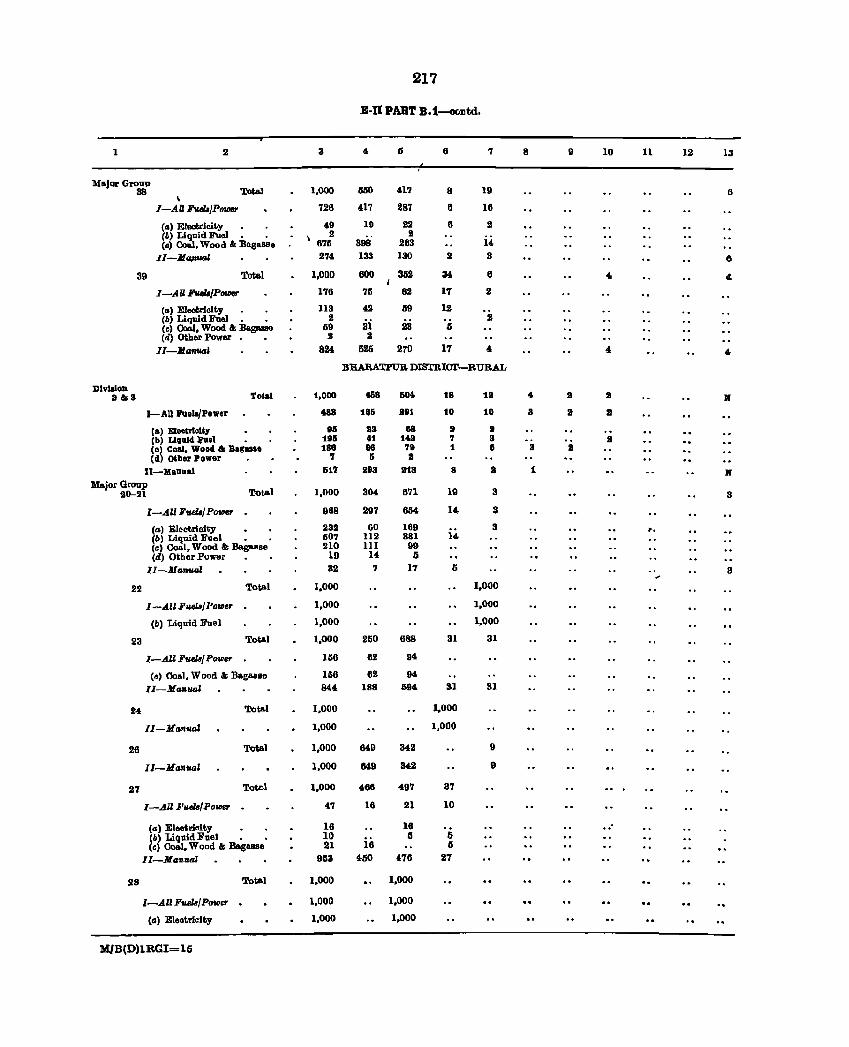
217
E·n PART B. t-OOlltd.
1 2 3 4 15 6 7 8 9 10 11 12 13
Major GroUl) 38 TotaJ 1,000 050 417 8 19 0
I
I-AU Fuels/P_ 726 417 287 6 16
(a) Eleokicity 49 19 22 6 2 (Ii) Liquid Fuel. . 2 2 (c) Coal, Wood & BagaSBe 675 398 283 14
Il-M<qIV4/, 27' 133 ISO 2 3 6
39 TotaJ 1,000 600 352 M 8 4 4
1-.4 U. Fuels/PI1llWl' 176 75 82 17 2
(a) Eleotricity • 113 42 li9 12 Cb) Liquid Fuel. • 2 si 2 Cc) Coal, Wood & Bag0.B88 59 23 Ii (d) Other Powor 2 2
II-MCIflUlIi 824 525 270 17 4 4 4
BHARATP1JR DISTRICT-RURAL
DIvision 11&8 Total 1,000 458 50t. t8 18 4 II III N
I-AU Fuell/Power 488 186 11191 to 10 3 II III
Clio) Blecb'lclt)' 85 113 68 :I II (b) Liquid l'ul1 19& 41 148 '1 8 S (D) Coal, Wood'" Bagasse 186 98 '19 1 Ii 8 II (d) Other Power '1 Ii II
II-MaDual 617 283 11118 8 a 1 N Major Gl'01lp
20-21 Total 1,000 304 671 19 3 3
I-lUI FtuZ./ POlDer 968 297 654 14 3
(a) Electrloity 232 60 169 3 ... (b) Liquid Fuel • 507 112 381 14 (c) Coal, Wood &; &gaB"" 210 III 99 (d) Other Power 19 14 jj
lI-Ma'llV4l 32 7 17 5 3
22 Total 1,000 1,000
I -AU Fuels/ POlDer 1,000 1,000
(b) Liquid Fuel 1,000 1,000
23 Total 1,000 260 688 31 31
I-AU Fuel8/ POVJ8f' 1110 82 94
(e) Coal, Wood &: Bagasle 166 82 94 II-Manual 844 188 594 31 31
24 Tota.l 1,000 1,000
II-Manuol 1,000 1,000
26 Total 1,000 649 342 9
II-HtJlIuol 1,000 649 342 9
27 Tot&l 1,000 466 497 37
I-All ]/uel8/PolDer 47 18 21 10
(,,) Eleotrioity 16 18 .. ,II> Liquid Fuel • • 10 Ii Ii (e) Coal, Wood &; Bagasse 21 18 5
II-Ma'RUIJI 953 4-50 478 27
28 Total 1,000 1,000
I-All Fu.e.Z8/POID8f' 1,000 1,000
(0) Eleotrieity 1,000 1,000
MlB(D)lRGI= 15
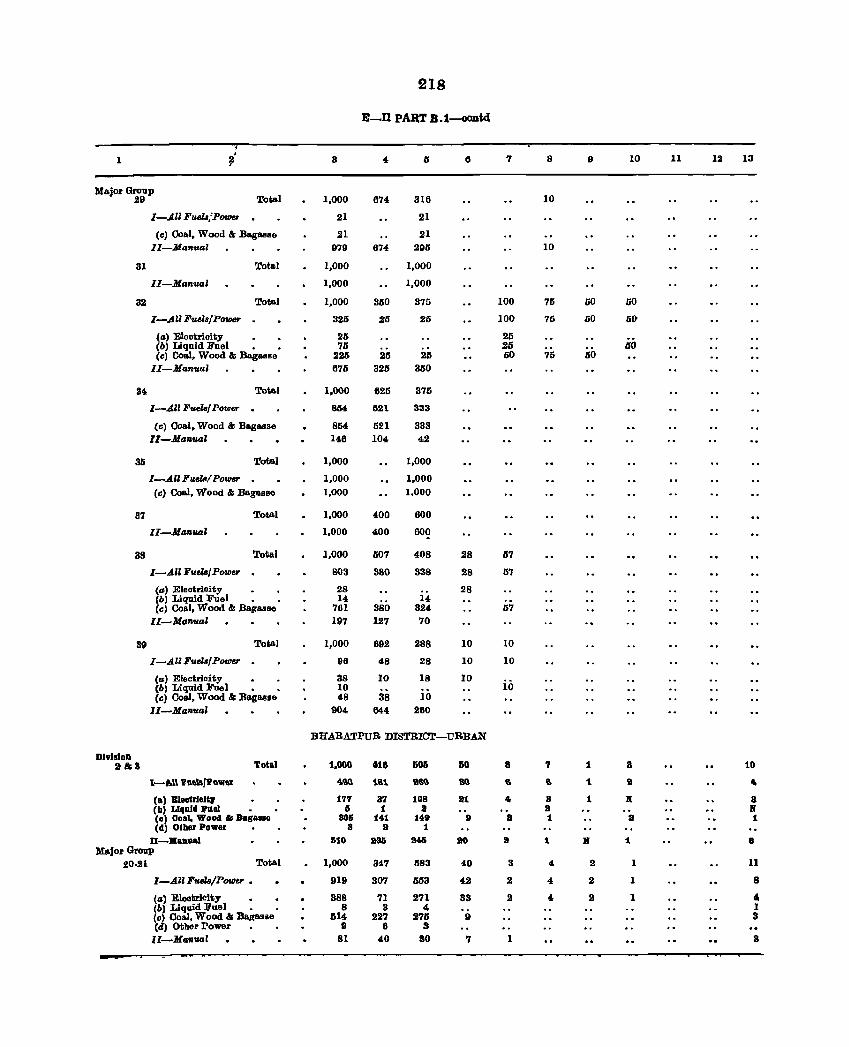
218
E_D PAIlT B.1-contd
I
1 ~' 3 4 6 7 8 9 10 11 12 13
UajorGroup 29 Total 1,000 674 316 10
I-~ll FutJa,'POfJ1e' 21 21
(c) Coal, Wood &; Bagasse 21 21 II-Man'U41 979 674 295 10
31 Total 1,000 1,000
II-Manual 1,000 1,000
32 Total 1,000 350 375 100 75 50 60
I-All Fuua/PolDer 325 25 26 100 75 50 50
(a) Eleotrioity • • 25 25 (6) Liquid Fuel • • 71i 25 1i0 (c) Coal, Wood &; Bagasse 225 25 25 50 75 50
II-Manual 675 325 360
34 Total 1,000 625 375
I-AU Ii'ue't./ Power . 854 621 333
(c) Coal, Wood &; Bagasse 854 521 333 II-MtJnwl 146 104 42
35 Total 1,000 1,000
I-All FuelRl Power 1,000 1,000 (c) Co&l, Wood &; Bagasse 1,000 1,000
37 Total 1,000 400 600
II-MtJnmd 1,000 400 600
38 Total 1,000 507 408 28 57
I-AU Ii'utJajPower 803 380 338 28 57
(tJ) Eleotrioity 28 28 (b) Liquid Fuel • • 14 14 (c) Coal, Wood &; Bagasse 761 380 324 67
II-MtJnual 197 127 70
39 Total 1,000 692 288 10 10
I-All FutJa/Power . 96 48 28 10 10
(tJ) Electrioity 38 10 18 10 (6) Liquid Fuel • • 10 10 (c) Coal, Wood &; Bagasse 48 38 10
II-Man'lltJl 904 844 260
BHARATPUR DISTRICT-URBAN
Division 3&3 Total 1,000 418 605 50 8 ., 1 3 10
l-t.l\ 1111..,.'0'11"1 -wa 1.81. 'H6 ~ .. .. 1. Z ~
(al E)eoCrieltJ' 177 37 108 31 4 8 1 l( a (b) Liquid Puel • 6 1 8 8 II (0) 001101, Wood & Bagasae 806 141 149 9 8 1 :II 1 (d) OCher Power 8 :II 1
D-JIla:ll.'Ilal 510 985 945 :ao 8 1 II 1 8 Major Group
20·21 Total 1,000 347 583 40 3 " 2 1 11
I-All FutJa/Power • 919 307 563 "2 2 " 2 1 8
(tJ) Eleotricity 388 71 271 33 2 4 2 1 4& <") Liqdid Fuel • 8 3 " 1 <c) Coal, Wood &; Bagasse 51" 227 275 9 3 Cd) Other Power • 9 6 3 Il-Mfltluol 81 "0 SO ., 1 3
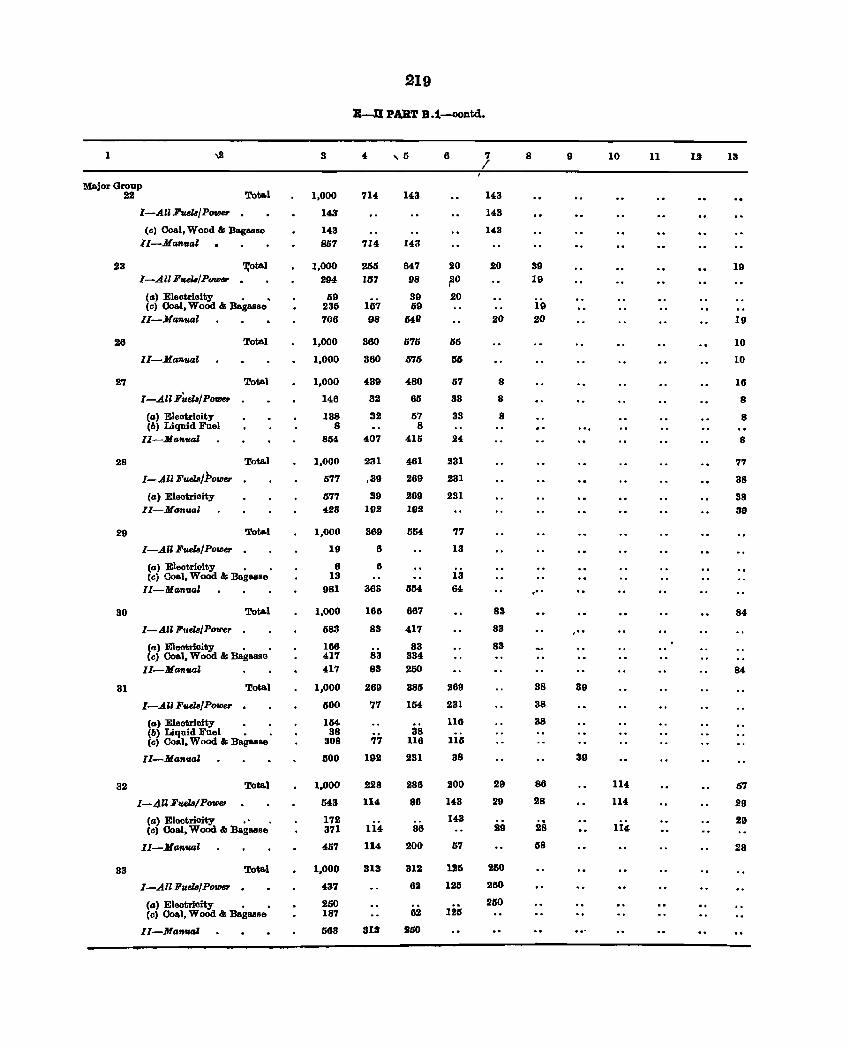
219
B-U PART B.1--«1ODtd..
1 3 4 , 5 6 7 /
8 9 10 11 1.Z 13
M&jorGroup Total 22 1,000 714 143 143
I-All F'II.elB/Power . 14:t 143
(e) Coal, Wood & Bagasse 143 143 II-Manval 867 714 143
23 ~otal 1,000 255 647 20 20 39 19 I-AllF.aa/P_ . 294 167 98 flO 19
(a) Eleotrioity • • 69 16;
39 20 (c) Ooal, Wood & BagllBse 236 59 19
II-Manual 706 98 649 20 20 19
26 Total 1,000 380 575 55 10
II-Manual 1,000 360 675 ISIS 10
27 Total 1,000 439 480 57 8 16
I-AU F'uelB/Power 146 32 65 33 8 8
(a) Eleotrioity 138 32 57 33 8 8 (b) Liquid Fuel 8 8
II-Manual 854 407 415 24 8
28 Total 1,000 231 461 231 77
I-All FuelB/Poll18t' 677 ,39 269 231 38
(a) Electrioity 577 39 269 231 38 II-Manual 423 192 192 39
29 Total 1,000 369 554 17
I-AU Fuels/Poll18t' 19 6 13
(a) Eleotricity • • 6 6 Ccj Coal, Wood & BagllBse 13 13
II-Manual 981 363 OM 64 ,"
30 Total 1,000 166 667 83 84
I-All FuelBlPolI'er 583 83 417 83 ,"
~") Eleotrioity • . 166 83 83 cl Ooal, Wood & Bagasse 417 83 334
II-Ma'flfVJl 417 83 250 84
31 Total 1,000 269 385 269 38 39
I-All FuelB/PowU' . 500 77 154 231 38
(a) Eleotrioity 154 116 38 fb) Liquid Fuel • 38 ., 38 CIl) Ooal, Wood & Bagasse 308 17 116 115
II-Ma1lual 500 192 231 38 39
32 Total 1,000 228 288 200 29 86 114 57
I-4Zl Fuels/Powe. 543 114 86 143 29 28 114 29
(a) Eleotrioity • 172 143 .. 29 (c) Ooal, Wood & Bagasse 371 114 86 29 28 114
II-Manual 457 114 200 57 58 28
33 Total 1,000 313 312 126 2ISO
I-All FIIel8/Po_ 437 62 1211 2110
(a) Electrioity , 250 250 (c) 00 .. 1, Wood & BagBIIse 187 62 125
II-ManUtJI 563 813 250
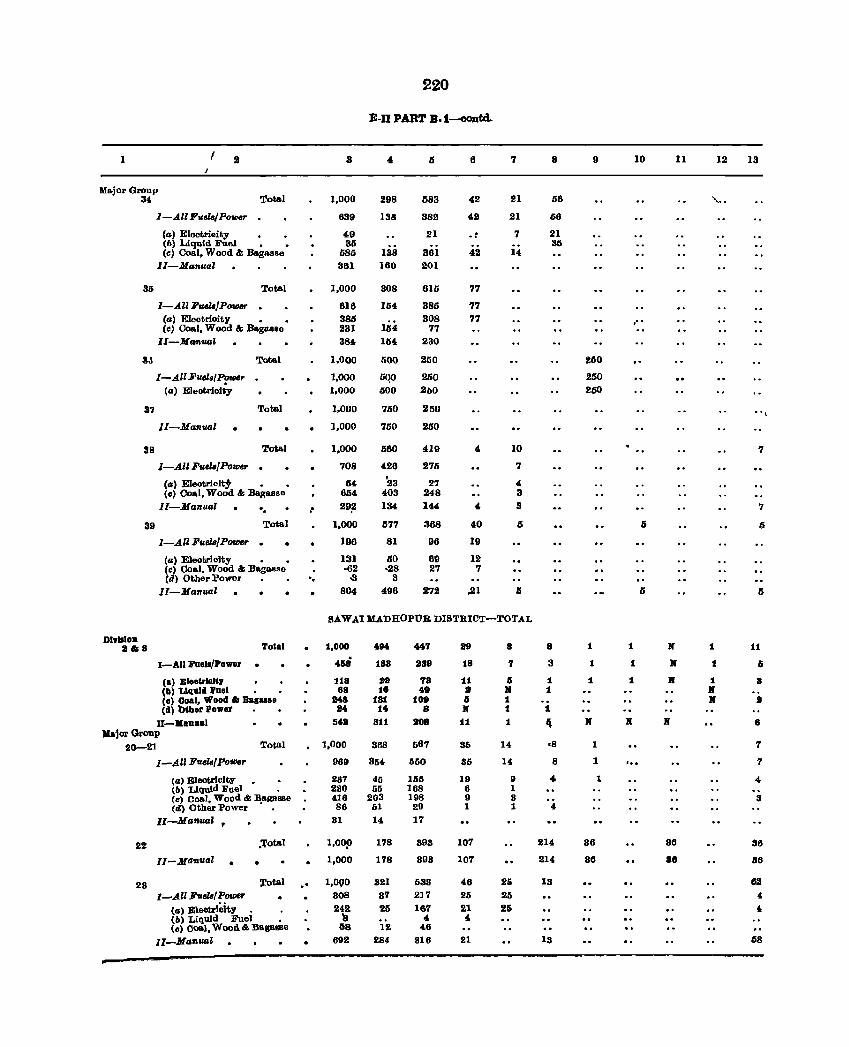
1 I
Ma.jor Grou!' 34 Total
I-All Fuelaj Power
(a) Eleotrl"it,y Cn> Liquid Fuel • • (e) Coal, Wood & Bagasse
ll-Manual
35 Total
33
37
38
39
I-A.ll Fu&lJ/PotD. • (a) Eleotrioity • • Cc) Coal, Wood & Bagasse
II-Ma7l1UJi
I-All F~fPf!'"~ (IJ) Eleotrioity
II-Ma1uml
Total
Total
Total
I-All Fuw/PotDer •
(a) Electricity • • (c) Coal, Wood & :Bagasse
II-Manual ..• Total
I-A.ll Fuw/POIDer •
(a) Eleotrioity • • (c) Ooal, WoOd & Bagasse (d) Other Power
Il-Mrulual '.
3
1,000
639
49 35
585 381
1,000
616 385 231 3S11
1.000
1,000 1,000
1,000
1,000
1,000
708
64 8JJ4
29i!
1,000
196
131 ·62
<3 804
220
E-JJ PAR'!' B.1--oontd.
" 298
138
138 180
308
154
154
164
500
5QO liOO
750
750
560
426
23 403
134
577
81
60 .28
3 496
583
382
21
361 201
615
385 308
77 230
250
260 2bO
250
250
419
275
27 248
144
368
96
89 27
272
6
42
42
. , 42
77
77 77
4
4
40
19
12 7
,21
7
21
21
7
14
10
7
4 3
3
5
IS
SAW AI MADHOPUR DISTRICT-TOTAL
DlvlJloD 1&8
I-All Fueb/Power
(a) EI_Dklo)',
Total
(II) 'LIquid 'ue. , (e) Coal, Wood & Baga •• e (d) biher Power • ,
II-KanDal
1,000
458
118 88
IM8 840
5 .... Kajar Group
20-21 Total 1,000
969
237 230 4]6
22
I-A.lI Fvels/potHt'
(a) Eleotriclty <b> Liquid Fuel • (c) Cosl, Wood & ~agaSile <d> Other Power •
II-Manual ,
.'.fotal
Il-MIJ'1Iual •
86
31
I,OO~
1,000
23 :rotal ,. 1,01,l0
I-A.ll FveIB/ POIHr 308 (a) Eleotriclty . 2'2 (b) Liquid Fuel, II (6) Cosl, Wood &; :Bagasse 68
II_ManuaJ 692
494
188
lIS l'
131 140
811
368
354
45 55
203 61
14
178
178
321 31 25
12 284
4" 289
78 e.g
10e S
lOS
667
550
165 168 198 29 17
39S
S93
683 2]7
167
" 46
316
211
18
11 II 6 If 11
35
85
19 6 9 1
107
107
46 25 21
4.
111
8
7
Ii If 1 1
1
14
14
9 1 3 1
2i
26
25
8
56
66
21 36
S
3
1 1
1
~
8
" 4
214
214
IS
IS
9
250
250 260
1
1
1
If
1
1
1
86
86
10
,"
1
1
1
x
5
11
If
If
If
•
86
811
12
'-.
1
1
1 If If
13
",
7
7
6
6
11
6
8
8
7
7
" S
36
86
68
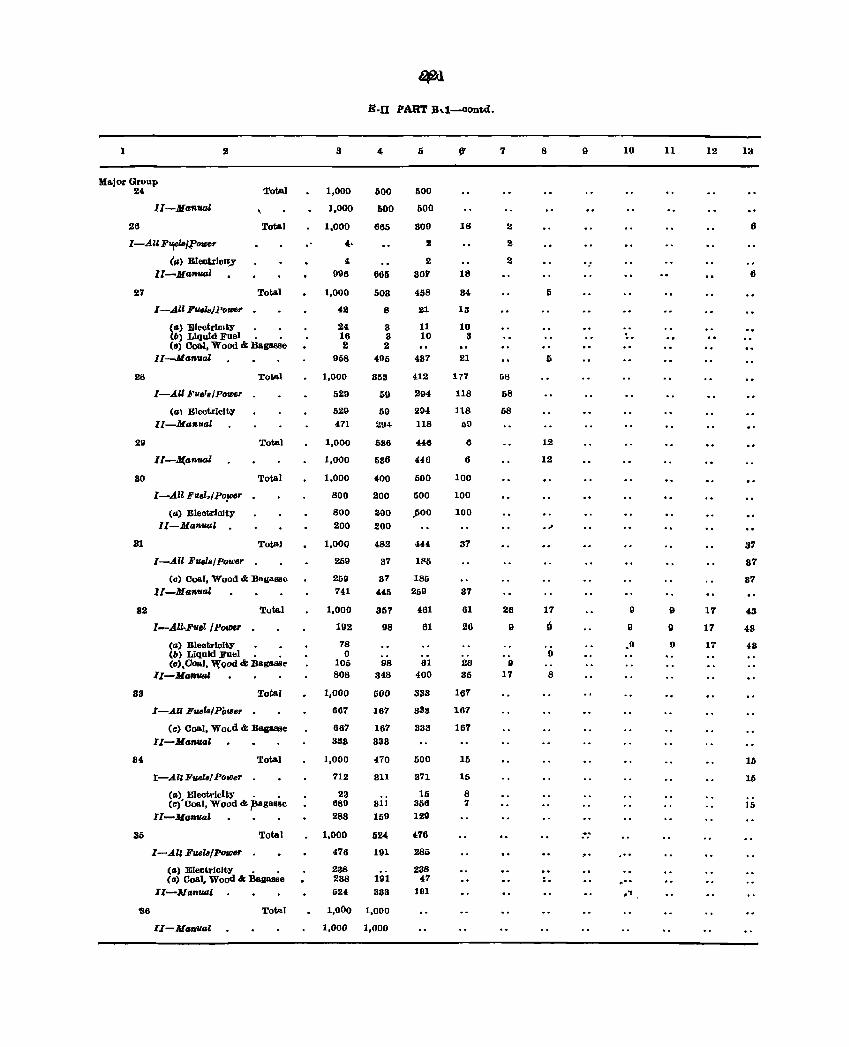
~
E·II PART B~1-OODtd.
1 2 3 Ii 7 8 9 10 11 12 13
Majol' Group 24 Total 1,000 500 500
II-Manual 1,000 600 liOO
26 Total 1,000 665 800 18 2 6
I-AUF~lBW_ 4· 2 2
(II) Eleotzllll~ '" 2 2 -ll-Manual 906 666 30r 18 6
27 Total 1,000 603 458 34 5
I-All F1J4L,JPOW6" . 42 8 21 13
(a) Eleetrilll ty 24 3 11 10 (6) Liquid Fuel, , 16 3 10 3 .. (C) 00&1, Wood & Bagll8se 2 2
lI-Manual 958 496 437 21 5
28 Total 1,000 353 4.12 177 68
I-AU FuelS/POW6' 529 59 294 118 68
(al Electrillity 529 59 294 118 68 II-Manual 471 294 118 1)0
29 Total 1,000 536 446 6 12
1I-.J{anual 1,000 536 446 6 12
30 Total 1,000 400 600 100
I-All Flle',IP0!f'5' 800 200 500 100
(a) Electricity 800 200 flOO 100 II-Manual 200 200 ...
31 TotaJ I,OOQ 482 "44 37 87
I-All Fuels/ pOUler 269 37 11'5 37
(0) Coal, "Wood & BagaSOle 269 37 186 37 II-Manual 741 446 269 37
82 Total 1,000 357 461 61 26 17 9 9 17 43
I-.• {ll,Fll,! 'POIDU 192 98 61 26 9 9 9 9 17 48
Ca) Ellectrlclty 78 ,9 9 17 48 (6) Liquid Fuel 9 9 (c) ,Coal, "!'Qod & Bagassl.' 105 98 61 26 II
II-Manual 808 348 400 85 17 8
83 Total 1,000 500 88B 167
I-AU Fusls/PoUlef' 667 167 B33 167
(c) Coal, Wm,d & Bagasse 667 167 333 167
II-Manual 333 333
84 Total 1,000 470 500 15 15
t -Allllvsl8/ POUl6~ 712 311 871 15 15
(a) Eleetrlcity , • 23 16 8 (c)"Coal, Wood & ;Bagasse 689 311 356 7 15
Il-Ma1&fsal 288 159 129
35 Total 1,000 524 476 .. I-All Fuels!Po.""e~ 476 191 286 _.. ,"
Cal Elelltrlclty • • 238 238 Cc) Coal, Wood <I; Bagasse 238 191 47 . .' .
II-Manual 524 333 191 "
'86 Tot!l.l 1,000 1,000
II-Manllal 1,000 1,000
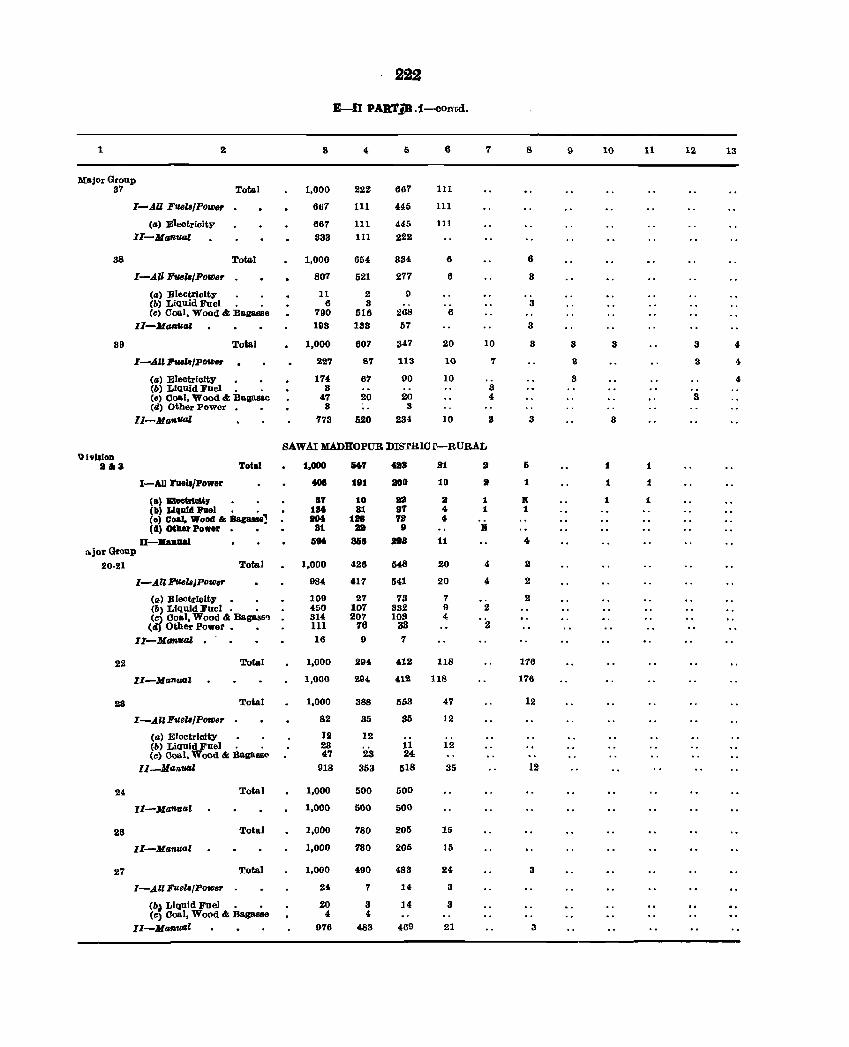
222
E-n PARTlB.f-con'tid.
1 8 4 5 6 7 8 9 10 11 12 13
Major Group 87 Total 1,000 222 667 111
I-AU F1I61'IPolllef' 661 111 445 111
(a> Electricity 667 111 445 111
II-ManUal 333 111 222
38 Total 1,000 654 334 6 6
I-All Fuell/Polllef' 807 521 211 6 3
(CI) Electricity 11 .2 9 (b) Liquid Fuel 6 3 3 (c) Coal. Wood & Bagasse 190 516 268 6
II-Mtmual 193 133 51 3
39 Total 1.000 601 341 20 10 3 3 3 3 4
I-An PueIe/POIIIep 221 81 113 10 7 S 3 4
(CI) Electricity 114 61 90 10 3 4 (b) LiqUid Fuel 3 3 (e) Coal, Wood & Bagasae 47 20 20 4 3 (d) Other Power 3 3
1I-Mantl41 773 520 23-1 10 3 3 3
SAWAI MADHOPUR DISl'RIC.r-RURAL IJ 11'IIIoD
a&3 Total 1,000 M'1 483 a1 a & 1 1
I-All FlIell/Power 408 181 800 10 a 1 1 1
(.) Eleeklel', . aT 10 sa a 1 I( 1 1 (II) UqDld:truel • • 1M 81 87 4 1 1 (0) Coal. Wood .. Bagaue1 804 1. 79 4 (d) other Power 81 sa 8 •
II-ManllAl. &M 868 at8 11 4 ",jor Group
20·21 Total 1,000 426 548 20 4 .2
I-All FuelllJpoUler 984 411 541 20 4 2
<a> Electricity 109 27 78 7 2 (1'1) Liquid Fuel. • 450 107 332 9 2 (Cl Coal, Wood" B&gaas'l 314 207 108 4 ·8 (d Other Power • • 111 76 33
II-Mrmtl41 16 9 7
22 Total 1.000 294 412 118 116
II-Manual 1,000 29, 412 118 176
28 Total 1,000 388 553 47 12
I-..tll Ftle1A/Powe,. 82 35 35 12
<a> Electricity 12 12 (1'1) Liquid Fuel. . 23 11 12 (e) Coal. Wood" BagallBO 47 23 24
II_Manut" 918 353 518 35 12
24 Total 1.000 500 500
II-Manual 1,000 500 500
28 Total 1,000 780 205 15
II-Manual 1,000 780 205 15
27 Total 1,000 490 483 24 3
I-All Fuel./PoUlep 24 7 14 3
(b;l Liquid Fnel. • 20 3 14 3 (e) Coal, Wood .. Bagasse 4 4
II-Manual 976 483 469 21 3
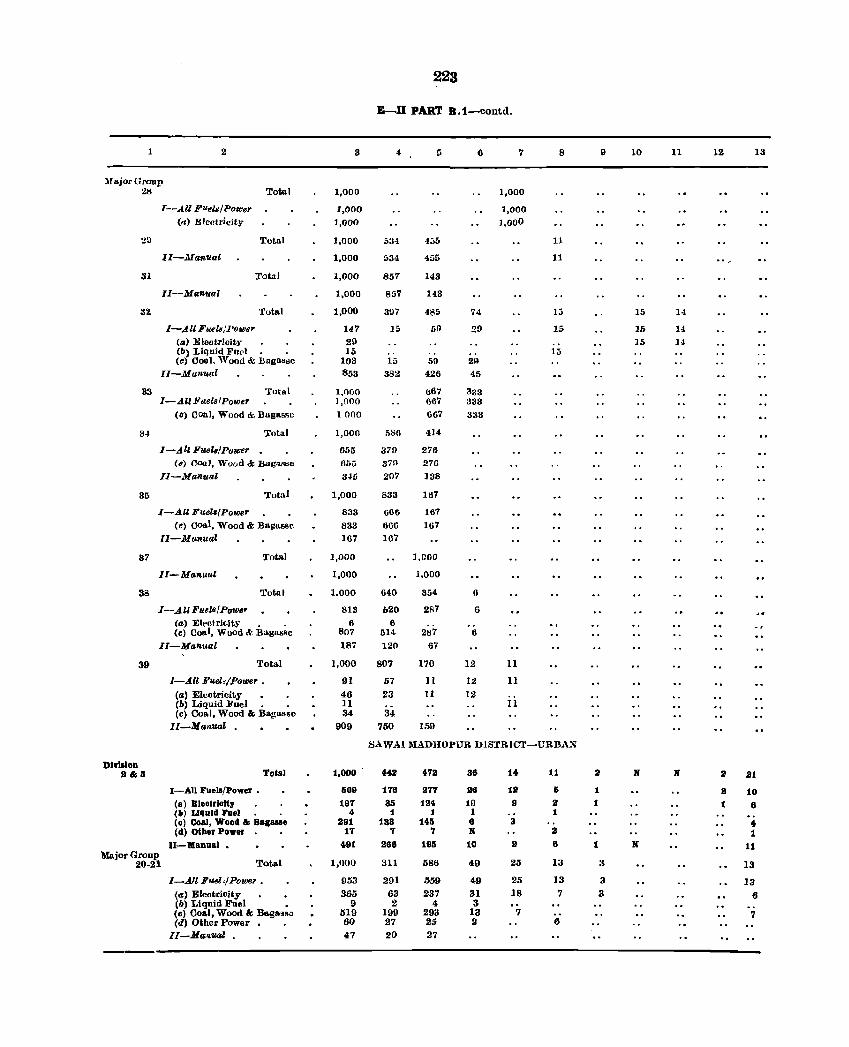
223
E-D PART B.1-contd.
1 2 3 4 5 6 7 8 9 10 11 12 13
lIajorGroup 2;1 Total 1,000 1,000
I--All F"ellJ/PoIIJer 1,000 1,000 (,t) Electricity 1,000 1,000
20 Total 1,000 534 4;:'5 11
II-Manual 1,000 534 455 11
81 Total 1,000 857 143
II--Manual 1,000 857 14.3
32 Total 1,000 3!l7 485 74 IS 15 14
I-All Fuela/l'ollJcr 147 15 59 29 15 15 14 (a) Elootrlcit)· 20 15 14 (6) Liquid Fll~l. . 15 IS (c) Coal. 'Vood &: nllgasse 103 15 50 29
II-Mamutl 853 382 426 45
33 Total l,nOO 667 333 1-Alll<'ael. f Power 1,000 667 333
(0) Coal, Wood &: Bagasse 1000 667 333
3-1 Total 1,000 51:H; 414
I-All FUeh/puwer 655 3in 276 (c) Coal, \Vood & nagllRSe 65Ct 371) 276
II-Manual 315 207 138
35 'rob,] 1,000 833 167
I-All FuelS/Power 833 666 167 (C) coal, Wood & BU!lILss{' 833 606 167
ll-Munual 167 167
87 Total 1,000 1,000
II-Manu,,' 1,000 1,000
38 Total 1.000 040 354 6
I--AU FuelJl/Powep 813 620 2S7 6
(a) Elrctri(·I1;.}' . . 6 6 (c) Coal, Wuod '" Baga,,~c 807 5l4, 287 6
II-Manual 187 120 67
39 Total 1,000 807 170 12 11
I-Alll!'ud,IPower . 91 57 II 12 11 (a) Eleotricity 46 23 11 12 (b) Liquid }<'ue). . 11 11 (c) Coal, Wood & Bagasse 34 34
II-Manual 909 750 159
;':lAWAI MADIIOPUR DlSTRIC'l'-URBAX
DIvision 2&3 Total 1,000 44-2 47a 36 14- 11 2 If If a 21
I-All Fuels/Power. 509 176 277 116 12 6 1 II 10 (a) Electricity 197 85 124 19 9 a 1 1 6 (b) LJIJ Rid FRel 4- 1 1 1 1 (c) Coal, Wood & Baga.le a91 133 145 6 3 4 (d) other Power 17 'I 'I 11 a 1
II-Manual. 491 288 195 10 II 8 t If 11 Major Group
20·21 Total 1,000 311 586 49 25 I:J 3 13
I-All Fuel-iPoWB7 • 953 291 .559 49 25 13 3 13 (a) Elcotrioity 365 63 237 31 18 7 3 6 (b) Liquid Fl1el • 9 2 4 3 (c) Coal, Wood & Ba.g ... ~" 519 1911 293 13 7 'I Cd) Other Power 60 27 25 2 6
II-Ma •• ual • 47 20 27
---
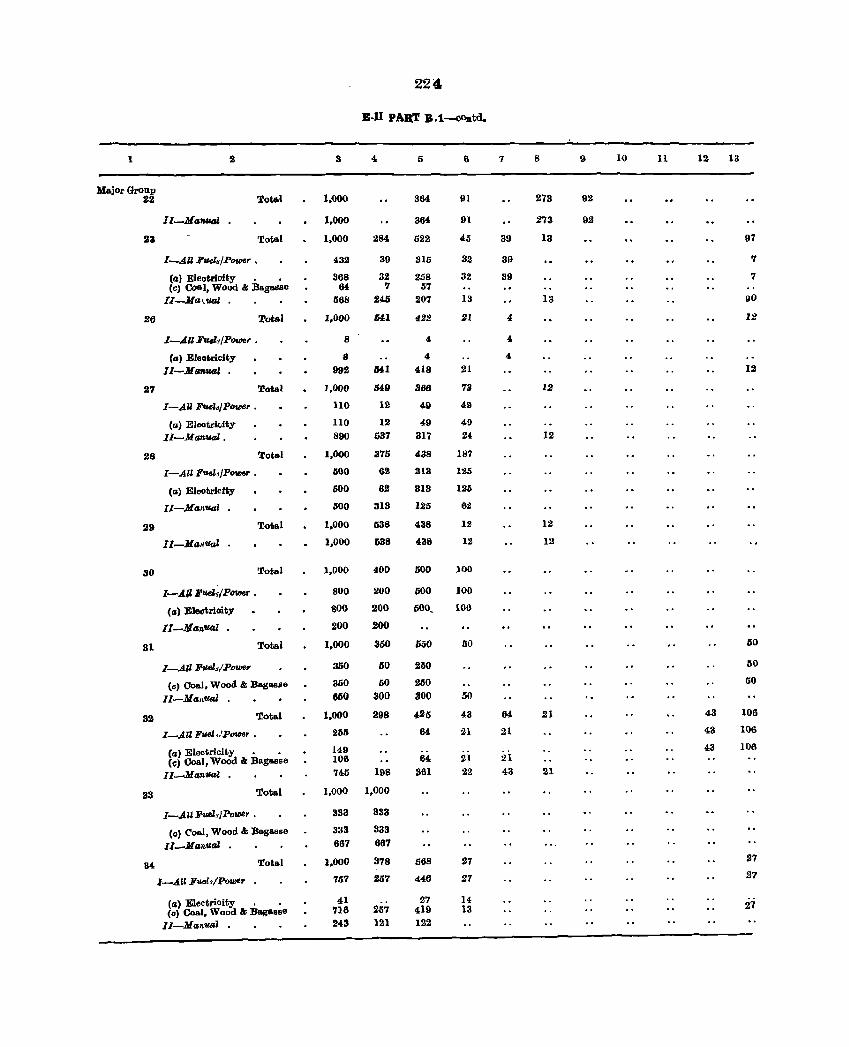
224
B-ll PAB,T B.1-oontd.
1 2 3 4 5 6 7 8 9 10 11 12 13
Major Group 22 Tot.l 1,000 864 III 273 92
ll-Ha"ual 1,000 364 91 273 112
23 Total 1,000 284 522 45 39 13 97
I-~U Fvel./Power • 432 39 315 32 39 7
(a) Eleotrioity . • 368 32 258 32 39 7 (c) Coal, Wood & Bagasse 64 7 57
II-Ma·.'II4i. . 568 245 207 13 13 90
26 Total 1,000 641 422 21 4 12
I-~ll Fuals/PowU' . 8 4 4.
Cal Eleotricity 8 4 4
II-Ma"va' . 992 5401 418 21 12
27 Total 1,000 549 366 73 12
I-AU J1'v.eZo/P_r • 110 12 49 49
(a) Electricity 110 12 49 49
II-Malllual . 890 537 317 24 12
28 Total 1,000 375 438 187
I-All Pv.eJ.,jPOVIU' • 500 62 313 125
Cal Eleotricity 600 62 313 126
II-Ma,;,uai . 500 313 125 62
29 Total 1.000 538 438 12 12
Il-Ma/!ua,J 1,000 538 438 12 12
30 Total 1.000 400 500 100
I-All Fu.d~/P_ • 800 200 500 100
(a) Eleotrioity 800 200 500, 100
lI-MGn'll4l • 200 200
31 Total 1,000 350 560 110 50
I-..411 pnel./Powu 350 50 250 50
(0) 00&1, Wood & Bagasse 350 50 250 50
Il-Ma"ual 660 300 300 50
32 Total 1,000 298 ~5 43 64 21 43 106
I-All puei,,'power • 205 64 21 21 43 106
(a) Elootrioity • - 149 43 106
(e) Coal, Wood & BagBIIse 106 64 21 21
II-Manila! . 745 198 361 22 43 21
33 Total 1,000 1,000
I-All puel~IPower . 333 333
Ccl <:'oal, Wood & Bagasse 333 333
ll.....JlantJaJ . 667 667
34. Tota.l 1,000 378 568 27 27
I-Ali FueC./Power 757 257 446 27 27
(II) Electrioity . • 41 27 14 21 (0) Coal, Wood & Bagasse '116 257 419 13
II-Man'llal 243 121 122
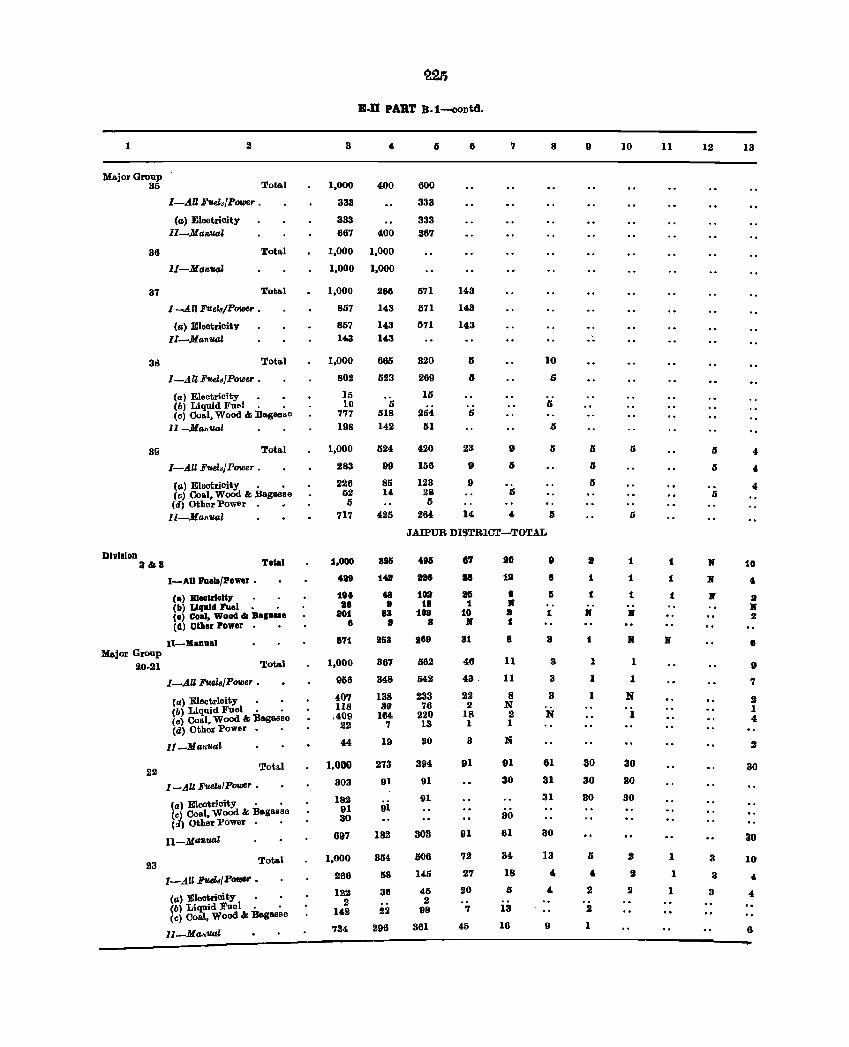
1 2
Major Group 35 Total
36
37
I-An FUel./Power •
(a) Eleotrioity ll-Man.'UG1
lI-ManVai
l-An Fuels/Power.
(a) Electricity ll-ManuGl
Total
Total
311 Total
I-All Fuel./Power •
Ca) Eloctricity (b) Liquid Fuel. • (c) Co.I, Wood &; Bag.a8o
ll-Ma/,'UG1
31i Total
Dlvilion 8&8
Major Group f.l0-21
22
23
I-AU Fv.e14Power •
(a) Eleotrioity • • (c) Co.I. WoOd &; Bagasse (d) Other Power
ll-Mallual
I-All lIuallJPoller •
(.) Elaatrielt,
Total
(b) LiquId lI1l81 (e) Coal, Wood & B.g .... (d) Other Power
Il-lIl.nu.1
Total
I_AII~/Power •
(a) Electricity (b) Liquid Fuel. . (c) Coal, Wood &; Bagassc (d) Other power. .
IT_Ma1tual
Tota.l
I-All Fuel8/power •
(al Electricity • • (c) Coal. Wood &; Ba.gasse (<1) Other power
II-Ma"ual
Tot.l
I-All Fuelsl power.
(a) Electrioity (b) Liquid Fuel. • (c) Coal, Wood &; Bagusc
II_Mal,uGl
E-D PART B_1-oontd.
3
1,000
333
333 667
400
400
1,000 1,000
1,000 1,000
1,000
857
857 143
1,000
802
15 10
777 198
1,000
283
226 32 5
717
1,000
4311
194 88
801 8
671
1,000
956
407 118
.409 22
44
1,000
303
182 91 30
697
1,000
266
122 2
142
734
286
143
143 143
665
523
5 518 142
524
99
81i 14
425
895
141
48 9
88 I
a&3
367
348
13S 39
164 7
19
273
91
iii
182
354
58
3S
22
296
5
600
333
333 267
571
571
571
320
269
15
254 51
420
156
123 261 5
6
143
143
143
5
5
23
9
9
7
9
5
5
8
10
5
5
264 14 4 5
JAIPUR DISTRICT-TOTAL
18&
D8
101 18
10a 8
1169
1562
542
233 76
220 13
20
394
91
91
303
506
I41i
45 2
9S
361
87
88
15 1
10 JI'
31
46
43.
22 2
18 1
3
91
91
72
27
20
7
45
10
18
8 JI' S :I
8
11
11
8 N 2 1
N
91
30
30
61
34
18
is
13
16
8
8
5
1
8
3
3
3
N
61
31
31
30
13 , 4.
9
9
5
5
5
lJ
1
1
JI'
1
1
1
I
30
30
30
o , 2
:&
1
10
5
1
1
1
JI'
II
I
1
N
1
30
30
30
2
2
2
11
1
1
1
II
1
I
1
12
o 5
II
JI'
JI'
3
3
3
13
4
4
4
10
" lJ JI' 2
8
9
7
2 I 4
2
30
30
10
" " 6
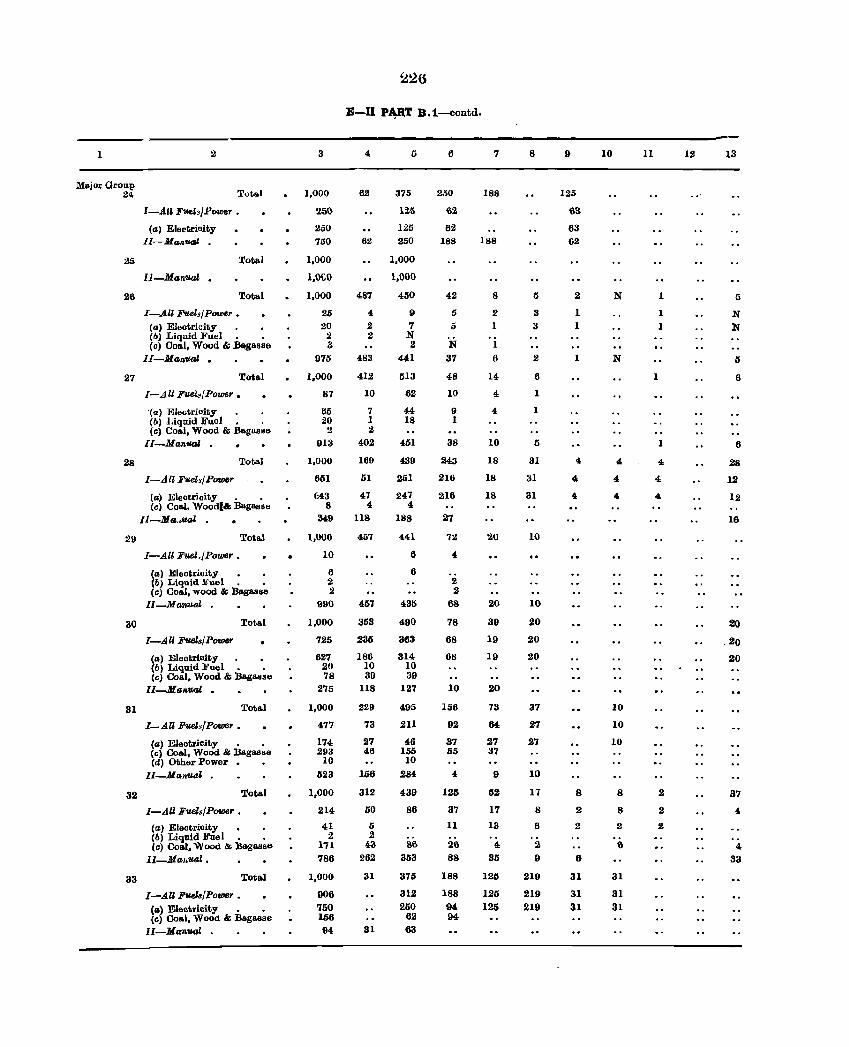
1
Majoz Group 24
26
26
27
28
29
2
Total
I-All Fl£e].,JPI>W8T •
Ca) Electrioity ll-Man'lJ4l, •
Total
Il-Man'll.al •
Total
I -All Fuels! Pouler •
Ca) Eillotricity • • (a) Liquid Fuel. • Cc) 0011.1, Wood &; Bagasso
II-Man~aJ •
Total
I-All Fuel.jPower •
'(a) FJlo<;trioity Cb} 1.iquid Fuol. . (c) Coal, Wood &; Bagu.ss6
[I-Manual •
Total
I-All F~ely/Puwer
(a) Electrioity . • Ce} Coal, Wood(& Bagasse
II-Ma,.uQl
Tota.l
I-All Fue.l>/Power •
(a) Eleotzicity (b) Liquid Fuel. • Cc) 001101, wood &; Bagasse
II-Manual •
30 Total
31
I-AU F9J.et</Power
Ca) Electricity Cb) Liquid ]j'uel. • Cc) Coal, Wood &; Bagasse
lI-Ma",uQl •
Total
I-AU FtJ,eJ,/Power •
Ca) Eleotricity • • Cc) Coal, Wood &; Bagasse Cd) Other Powor •
Il-Man'U(Jl •
32 Total
33
I-All Fuels/Power.
(a) Eleotricity Cb) Liquid Fuel. • Cc) Coal. Wood &; Bagasse
II-Ma,,_t.
Total
I-All Fu.ek/Power •
(fJ) Electricity • • Cel Coal, Wood. &; Baga.sse
II-MfJnuQl •
3
1,000
2D\)
230
760
1,000
I,OC.O
1,000
25 20
2 a
975
1,000
87
65 20
2
913
1,000
651
643 8
M9
1,000
10
6 2 2
990
1,000
725
627 20 78
275
1,000
477
174 293
10 623
1,000
214
41 2
171 786
1,000
906 '750 156 94
E-II P~T B.t-contd.
4
62
62
487
4
2 2
483
412
10
7 1 2
402
169
51
47 4
lIS
457
457
353
235
186 10 39
U8
229
73
27 46
156
312
50
5 2
"3 262
31
31
376
125
125 250
1,000
1,000
450
9 7 N 2
441
513
62
44 18
461
439
251
247 4
188
441
6
6
435
490
363
314 10 39
127
495
211
46 155 10
284
439
86
86 363
375
312 250
62
63
6
200
62
62
188
42
5
5
N 37
48
10
9 1
3S
243
216
216
27
72
4
2 2'
68
78
68
68
10
156
92
37 55
4
125
37
11
26
88
188
188 94 94
7
188
188
8
2
1
1
6
14
4
4
10
18
18
18
20
20
39
19
19
20
73
64
27 37
9
52
17
13
" 35
125
125 125
8
5
3
3
2
6
1
1
5
31
81
31
10
10
20
20
20
37
27
27
10
17
8
6
2
9
219
219 219
9
125
63
63
62
2
1
1
1
4
4
4
8
2
2
6
31
31 31
10
N
N
4
4,
4
10
10
10
8
8
2
&
31
31
31
11
1
1
1
1
1
4
4
4
2
2
2
12 13
5
N N
5
6
6
28
12
12
16
2()
,20
20
37
4
4 33
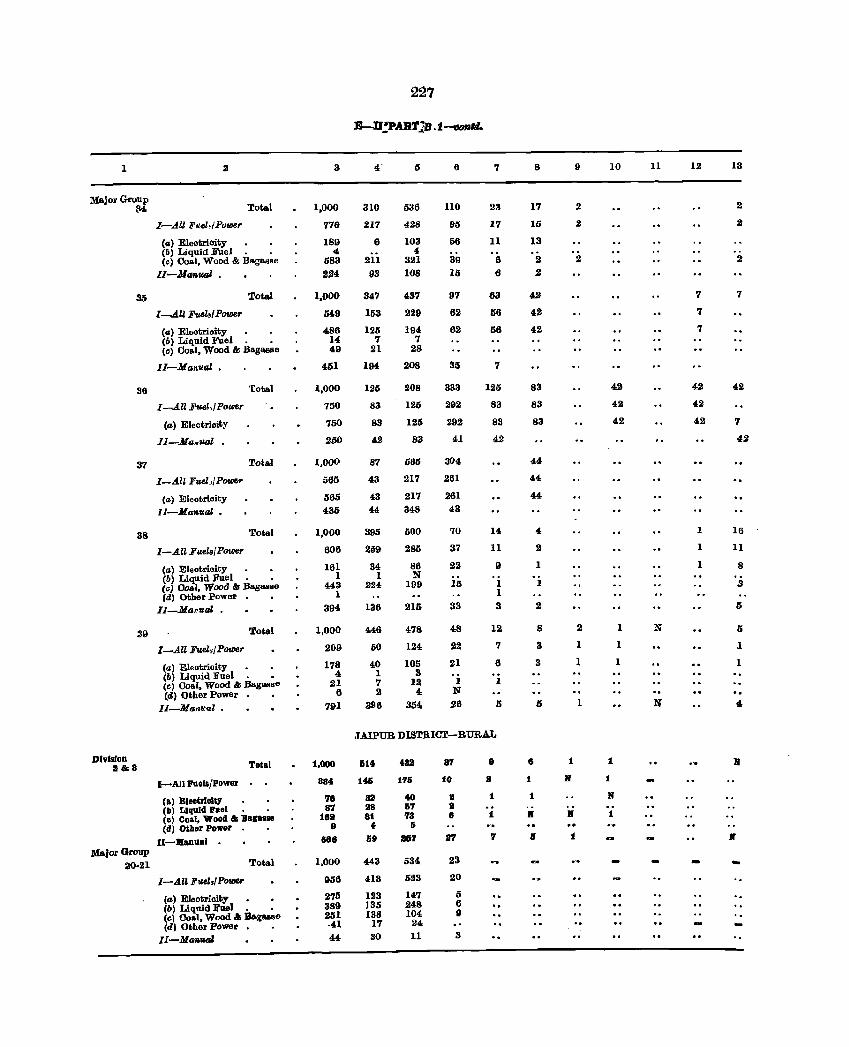
1
Major Group 84
35
36
37
2
Total
I-AU l'ueJ4Power
(II) Eleotrioity (6) Liquid Euel. . (e) Coal, Wood &; Bagasse
II-Mam.ual .
Total
1--.411 Fue!"IPower
(II) Eleotrioity (6) Liquid Fuel. • (c) Coal, Wood & Ba.gasse
Il-MII1/,ual •
I-All Fuel,/PoUJer
(a) Electrioity
Il-.M&k'UQ]. •
I-All FueUPoUJef'
(a) Electrioity ll-Manual •
Total
Total
38 Total
I-AU Fuels! Power
(a) Eleotricity (o) Liquid Fuel. • (e) Coal, Wood &; Bag .... se fd) Other power
II-Ma1'ual .
39 Total
Dlvllllon 11&3
Major Group 20·21
I-All Fuel,/ Power
(a) Eleotrioity (6) Liquid Fuel. • (c) Coal, Wood &; BagllBse (d) Other power
Il_Manllal.
Toial
I-All Fuela{power
(a) BlecUloltJ' (b I Liquid Fllel. • (0) Coal, Wood & Ba, .. se (d) Other Power
U-.anual •
Total
I-AU Fuel./PolIJU
(a) Electricity (b) Li quid 1!'1le1. • <el Coal, Wood &; Bagasse (d) Other Power
II-Manual
3
1,000
776
189 4
583 2.24
1,000
549
486 14 49
451
1,000
750
750
2J.)0
1,000
565
565 435
1,000
606
161 1
443 1
394
1,000
2119
178 4
21 6
791
1,000
8801
'18 87
188 9
888
1,000
956
275 389 251 ·41 44
310
217
6
211 93
347
153
125 '1
21
194
125
83
83
42
87
43
43 44
395
259
34 1
224
136
446
50
40 1 7 2
396
227
5
536
428
103 4
321 108
437
229
194 7
28
208
208
125
125
83
585
217
217
348
500
285
86 N
199
215
478
124
105 3
l.2 4
354
6
110
96
56
39
13
97
62
62
333
292
292
41
304
261
261 43
70
37
22
15
33
48
22
21
1 N 26
7
23
17
11
6
6
63
56
56
'1
125
83
83
42
14
11
9
1 1 3
12
7
6
1
15
JAlPUR DISTRICT-RURAL
&14
146
aa 28 81
4
69
443
413
123 J35 138
17
30
4aa 1'16
40 1>7 '13
Ii .7 534
623
147 248 104
24 11
87
10
a III 8
.'1
23
20
6 6 9
3
9
1
1
7
8
17
15
13
2 2
42
42
42
83
83
83
44
44
44
6
1
K
4
2
1
1
2
8
3
3
5
9
1
]If
K
1
2
2
2
2
1
1
1
10
42
42
42
1
1
K
1
1
I
I
11
N
12
7
7
7
42
42
42
1
1
1
13
2
.2
2
7
42
7
42
16
II
8
3
If
5
5
1
1
4,
-
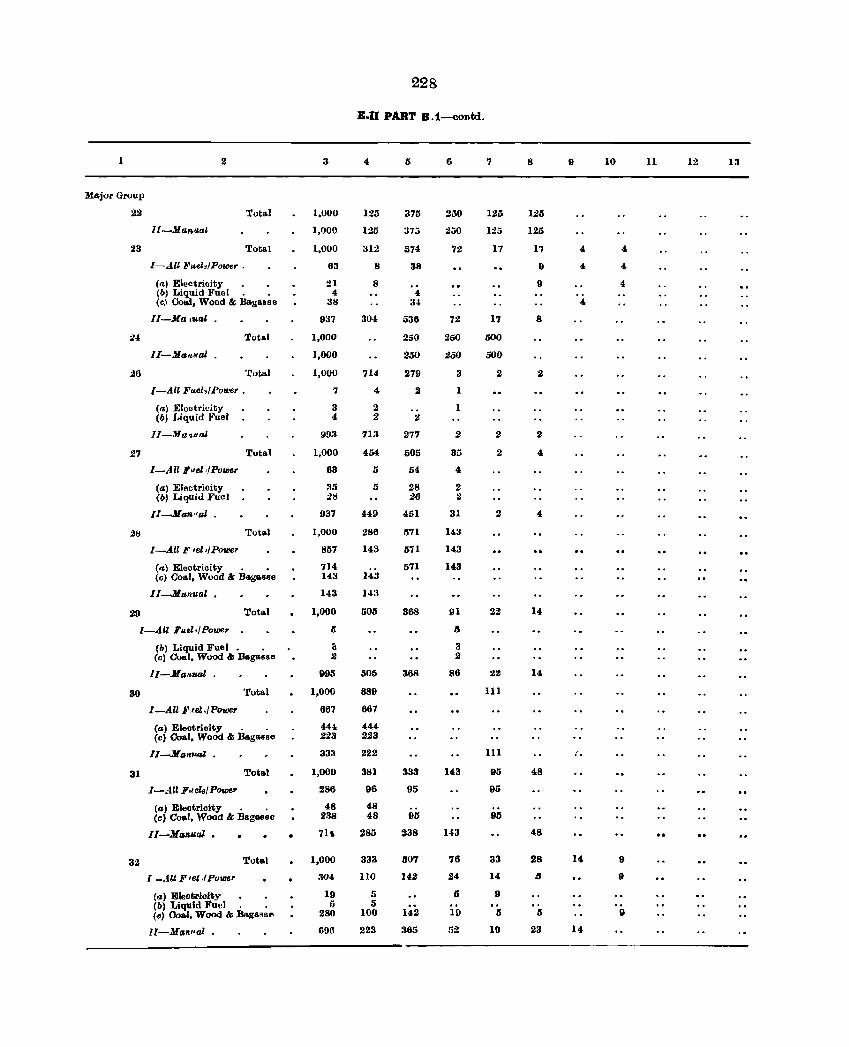
228
E.II PART B.i-contd.
2 3 4 5 6 7 8 9 10 11 12 13
Major Group
22 Total 1.000 125 375 250 125 125
ll-Ma.n.ual 1,000 125 375 :!iiO 125 125
23 Total 1,000 312 574 72 17 17 4 4
I-All Fuel,/Power . 63 8 38 9 4 4
( .. ) Electricity 21 8 9 4 eb) Liquid It'uel. • 4 4 {c.l Coal. Wood & Bagasse 38 34 4
II-Ma,ual . 937 304 1)36 72 17 8
24 Total 1,000 250 250 500
II-Ma.,."al . 1,000 2.50 250 500
26 Total 1,000 714 279 3 2 :2
I-AU Fuels/Power. 7 4 2 1
(a) Eloutricity 3 2 1 (6) J.iquid -,"'uel 4 2 2
II-Ma.~JJal 993 713 277 2 2 2
27 Total 1,000 454 505 35 2 4
I-All Fuel JPolDer 63 5 5<1 4
(a) Elllctrillity :l5 5 28 2 (61 Liquid li'uel 28 26 2
Il-Ma'li"al . 937 449 451 31 2 4
28 'rutal 1,000 286 571 143
I-All F 'el4PoUJer 837 143 571 143
(a} Elolltrillity • • 714 571 143 (cl Coal, Wood & Bagaue 143 143
II-Manual. 143 143
29 Total 1,000 505 368 91 22 14
I-All Fuel,/Power 5 5
(b) Liquid Fuel. • :i 3 Ccl COlli. Wood & Bagasse .2 2
ll-Ma"ual . 995 505 368 86 :.12 14
30 'fota.l 1,000 889 111
I-All F,let,/Power 667 667
Ca) Eleotricity . . 444. 444 (cl 00801. Wood & Bagasse 223 223
1I-Nan1l4l • 333 222 111 "
31 Tota.l 1,000 381 333 143 95 48
I-.-tll F,'e~/Power 286 96 05 95
(a) Eleotrioity . . 48 48 (cl Coa.l. Wood & Bagasse 2:l8 48 95 95
Il-J(fPI,u,aJ • 7h 285 238 143 48
32 Total 1,000 333 507 76 33 28 14 9
I-.-ttl Fist ;fPower 304 110 142 24 14 Ii 9
(a) Eleotrioity 19 5 5 9 (b) Liquid Fuel. • I) 5 (e) 00&1, Wood & Ba.gllo~s" 280 100 142 19 5 5 9
II-Manual. 696 223 365 52 19 23 14
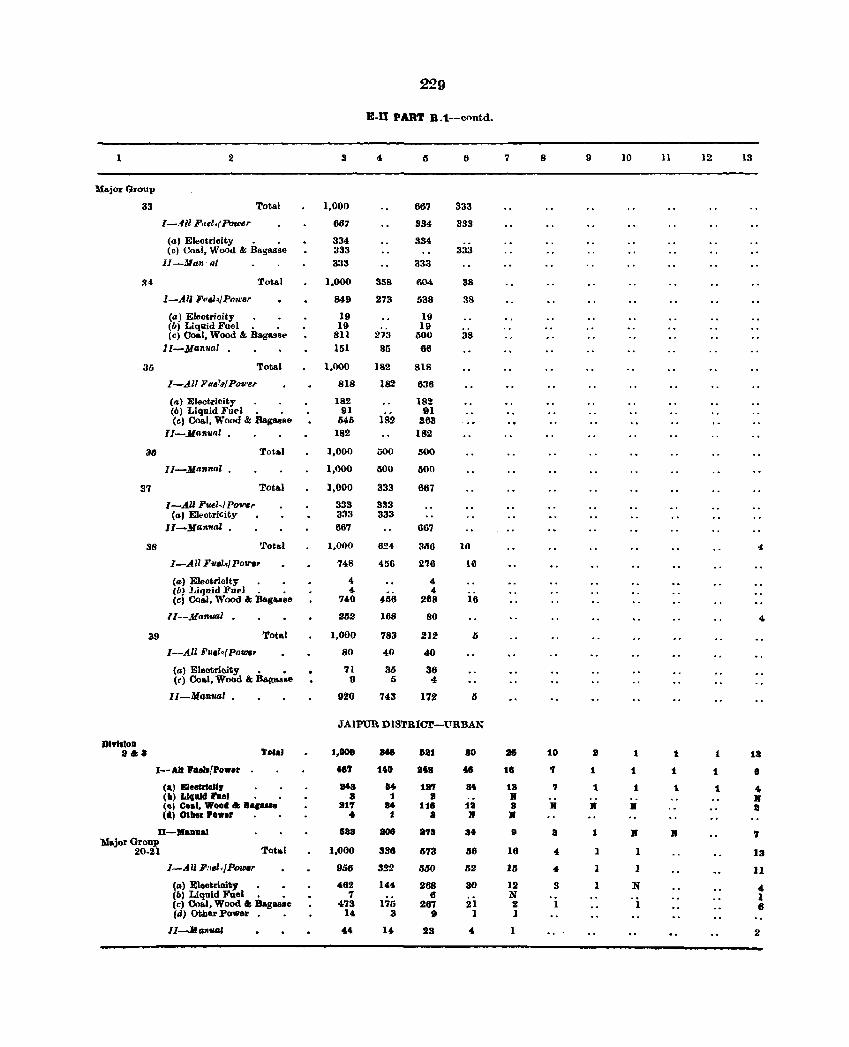
229
B-II PART B. t-cnntd.
1 2 3 5 6 7 8 9 10 11 12 13
M&jorGroup
33 Total 1,000 667 333
1-. .,ll F"el./Power 667 334 333
(a) Electrioity _ _ 334 334 (c) Coal, Wood It Bagasse 333 333
II-Man'lIl 333 333
:u Total 1,000 358 604 38
I-All F"w,';Ptm.'er 849 273 538 3S
(a) Eleotrioity 19 19 (Ill Liquid Fuel. _ 19 19 (e) Coal, Wood It Bagass .. 811 273 O()O 38
11-.JlfJlIllul 151 85 66
35 Total 1,000 J82 S18
1-A.ll Flle1", Pou~r 818 182 636
Ca, Eleotricity . . 182 182 (6) Liquid Fuel _ • 91
182-91
(cl Co&l, Wood It Bagasse M5 3.83 II-Mantial . 182 182
3t1 Tota.l 1,000 500 500
ll-.JlII'1l7tal . 1,000 600 500
37 Total 1,000 333 667
I-All FUEl.j PoWr 333 333 (a) EI<'ctriGity 333 333
ll-Mamud . 687 687
38 Total 1,000 624 308 1(1 " 1--AII Fue!..1 POtre7 748 456 278 16
(a, Eleotrioit:r • • 4 4 (Il) Liquid Fu .. l. _ 4- 4 (cl CoaJ, Wood It )Jag.sse 740 456 268 16
ll-MaftUtlI 252 168 80 4
39 Total 1,000 783 212 5
I --All FIl'~'( POtDC7 80 40 40
(a) Eleotricity • • 71 35 36 <r) Co.I, Wood It Baga.ase 9 5 4
II-Mallual • 920 743 172 /}
JAIPUR DISTRICT-'lTRBAN
DI9I110D ..... 'btlJ :I,GOO atl 521 80 2S 10 2 t t 1 1a
1-- All 'a.II!Pow.r 4" 140 .4. " 1a 7 1 1 t t 8
(&J Ble8U'lcJt, IIU M 1.1I7 8t 18 ., t 1 1 1 " (II) L1llald l'1Iel II :l I X II (eJ Coal, Wo04 .. Bapase Itl'1 IJ4. 118 1111 • II • • 8 (tJ O1l1er Power " 1 a 11 N
O-.aDlIal 11&8 208 878 a4 9 a 1 N • ., 'Major Group
Tot~1 1,000 336 20-21 673 56 16 4 I 1 13
1-.411 F"w,,/P_r 956 322 550 52 J5 4 1 11 (a) Eleotrioit.y 462 144 268 30 12 3 1 N 4 (b) Liquid FUel. _ 7 6 N 1 (c) Coal, Wood. Bagasse 473 175 267 21 2 I 1 6 (a) OthOl' Power 14 3 9 1 1
lJ-JlG7l'IUII. U 14 23 4 1 2
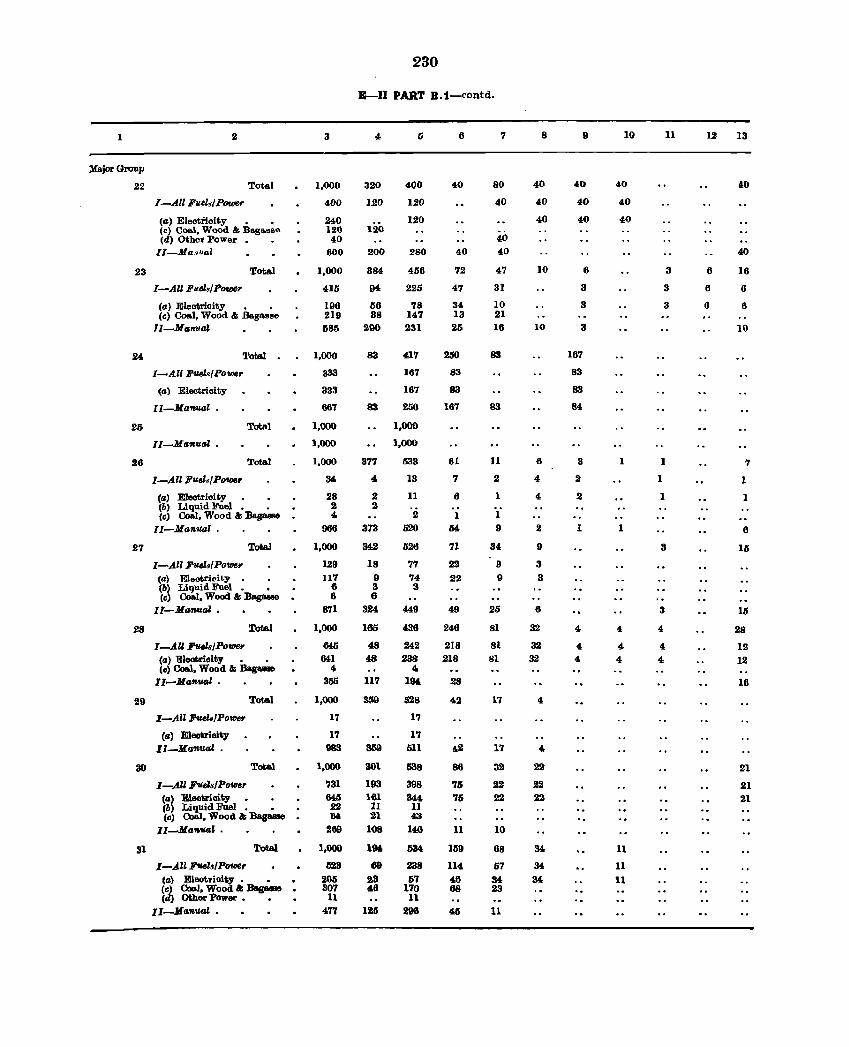
1
Major Group
22
23
25
26
27
28
29
30
2
Total
I-All Fuel./p_
(a) Electrioity • • (c) Coal, Wood &; Bagasse (d) Other Power
II-Ma:.ual
Total
I-All Fuel./PotDsr
(a) Eleotrioity • • (c) Coal. Wood &; Ba.gasse
II-Manual
'I'Dtal
I-All Fusz../Power
(a) Electrioity
II-Manual.
II-Manual.
Totsl
Total
I-All Fuels/Power
(tI) Electrioity (b) Liquid Fuel. • (c) Coal, Wood &; Bagasse
ll-Manual .
I-All Fuels/Power (a) E1 .. otri"i ty. • (b) Liquid Fuel. • (c) Coal. Wood &; Ba.gasae
II-Manual.
Total
I-All Fuels/Power (a) Electricity • • (c) Coal, Wood &; Ba.gaaae
II-Man"",,, .
~-An Fuels/Pomer
(tI) Electricity Il-Manual .
Total
Total
I-AU Fuels/Power (a) Electricity • (b) Liquid Fuel. • Cc) Coal, Wood &; Beg_
II-Ma"-' .
~ ~
~-AZl F1Ul.9fPower (a) Electricity. • • (c) 0001, Wood &; Begaaae (d) Other Power •
Il-Mantial •
3
1,000
400
240 120 40
600
1,000
415
196 219 685
1,000
333
333
667
1,000
1,000
1,000
34
28 2 4
966
1,000
129 117
6 6
871
1,000
645 641
4 355
1,000
17
17 983
1,000
731 645 22 54
269
1,000
623 205 307
11 477
230
E-II PART B.1-t'ontd.
320
120
120
200
384
94
56 38
290
83
83
377
4.
2 2
373
342
18 9 3 6
324
165
48 48
117
3{'9
359
301
193 161 II :n
108
19&
69 23 46
125
li
400
120
120
280
456
225
78 147 231
417
167
167
250
1,000
1,000
533
13
11
2 520
326
77 74 3
449
436
242 238
4 19&
528
17
17 511
538
398
344 11 43
140
634
238 57
170 11
296
6
40
40
72
47
34 13 25
250
83
83
167
61
7
6
1 54
71
22
22
49
246
218 218
28
42
86
73 76
11
lIi9
114
46 68
7
80
40
40 40
47
31
10 21 16
83
83
11
2
1
1 9
34
9
9
25
81
81 81
17
17
~
22 22
10
68
57 34 23
11
8
40
40
40
10
10
6
4
4.
2
9
3
3
6
32
32 32
4
4
22
22 22
34
34 34
9
40
40
40
6
3
3
3
167
83
83
84
3
2
2
1
4
4 4
10
40
40
40
1
1
4
4. 4
11
11
11
11
3
3
3
1
1
1
3
3
4.
4 4.
12
6
6
6
13
40
40
16
6
6
10
7
1
1
6
15
15
28
12
12
16
21
21 21
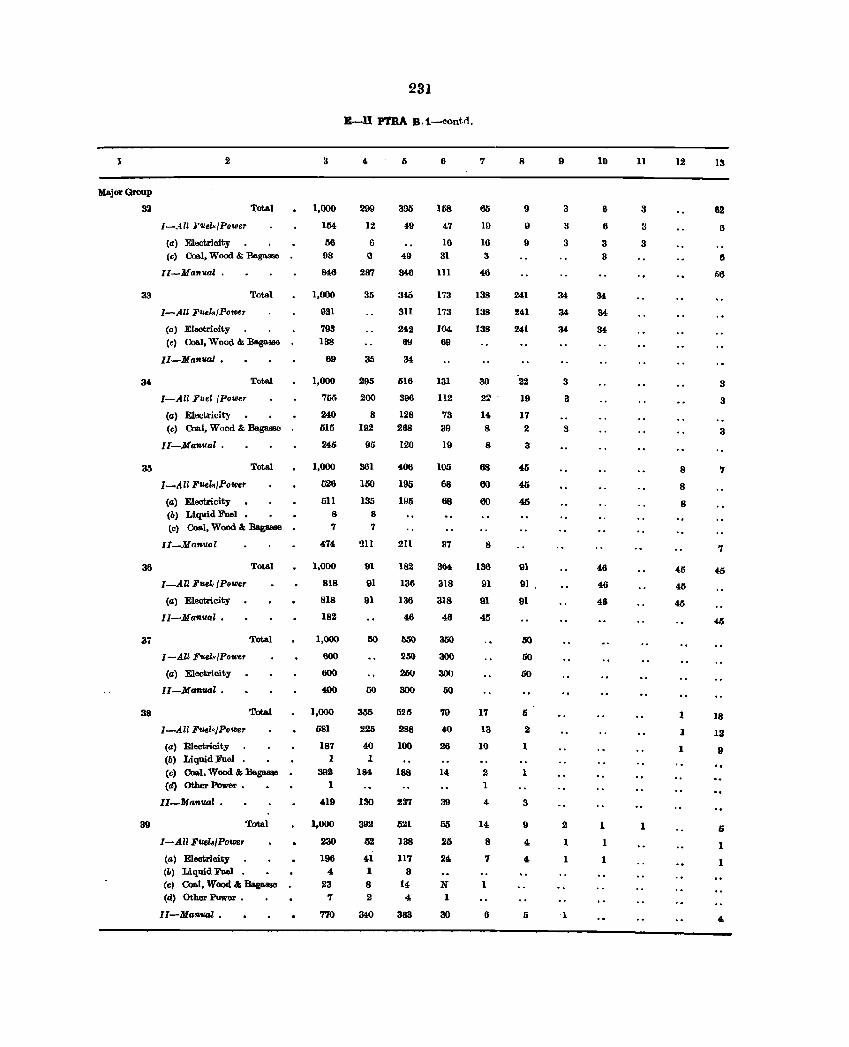
1
MajorOroup
32
33
34
35
36
37
38
39
2
I-All Ftiel.</Power
(a) Electricity
Total
(c) Cool, Wood & BaglloSlle
Il-M""ual .
I-All Fuel.jPowe,
(a) Elootricity
Total
(c) Coal, Wood & Bagasse
Il-Mantia/ •
I-All F'uei /Powe,
(a) Electricity
Total
(c) Coal, Wood & Bagasse
II-Manllal.
I-All F'UeI"JPowe,
(a) Electricity (0) Liquid Fuel •
Total
(e) Coal. Wood & :Bagaase
ll-Mm .. ",1
I-AU F'UeI,,/PolJler
(a) Electricity
Il-Manllal.
I-AU Fuel./Powe,
(a) Electricity
II-Manval •
I-All FIlel,'JPotlJe'
(a) Electricity (6) Liquid Fuol •
Total
Total
Total
(c) Cool, Wood & Bagasae (d) Other Power •
lI_Mantial .
I-All Ftlez"JPotDer
(a) Electricity (b) Liquid Fuel •
Total
Cc) Coal, Wood &; Bag&SSe
(d) Other Powor •
II-Mantial •
1,000
154
66
98
846
1,000
931
793
138
69
1,000
755
240 1i15
246
1,000
626
511
8
7
474
1,000
818
818
182
1,000
000
600
400
1,000
681
187 1
392 1
419
1,000
230
196 4
23 7
770
231
E-ll PTRA B.1-contn.
299
12
6 Q
287
35
295
200
8 192
95
361
150
135 8
7
211
91
91
91
50
GO
355
225
40
1 184
130
392
62
41 1
8 2
340
395
49
49
340
311
516
396
128 268
120
406
195
195
211
182
136
136
46
G25
288
100
188
237
1i21
138
117 3
14 4
383
6
158
47
16
31
111
173
]73
104
69
131
112
73 39
19
105
68
68
37
364
318
318
46
350
300
300
50
79
40
26
39
65
25
24
N 1
30
7
65
19
10
3
40
138
138
138
30
22
14 8
8
68
60
60
8
136
91
91
45
17
13
10
2 1
4
14
8
7
1
6
8
9
o 9
24t
241
241
22
19
17 2
3
45
45
45
91
91 .
91
50
50
00
5
2
1
1
3
9
4
4
6
9
3
" 3
3
3
"
2
1
1
'I
10
I}
6
3 3
46
46
48
L
1
11
3
3
3
1
12
8
8
8
45
45
45
1
I
1
13
62
6
6
1i6
3
3
3
7
7
45
18
12
9
Ii
1
1
4
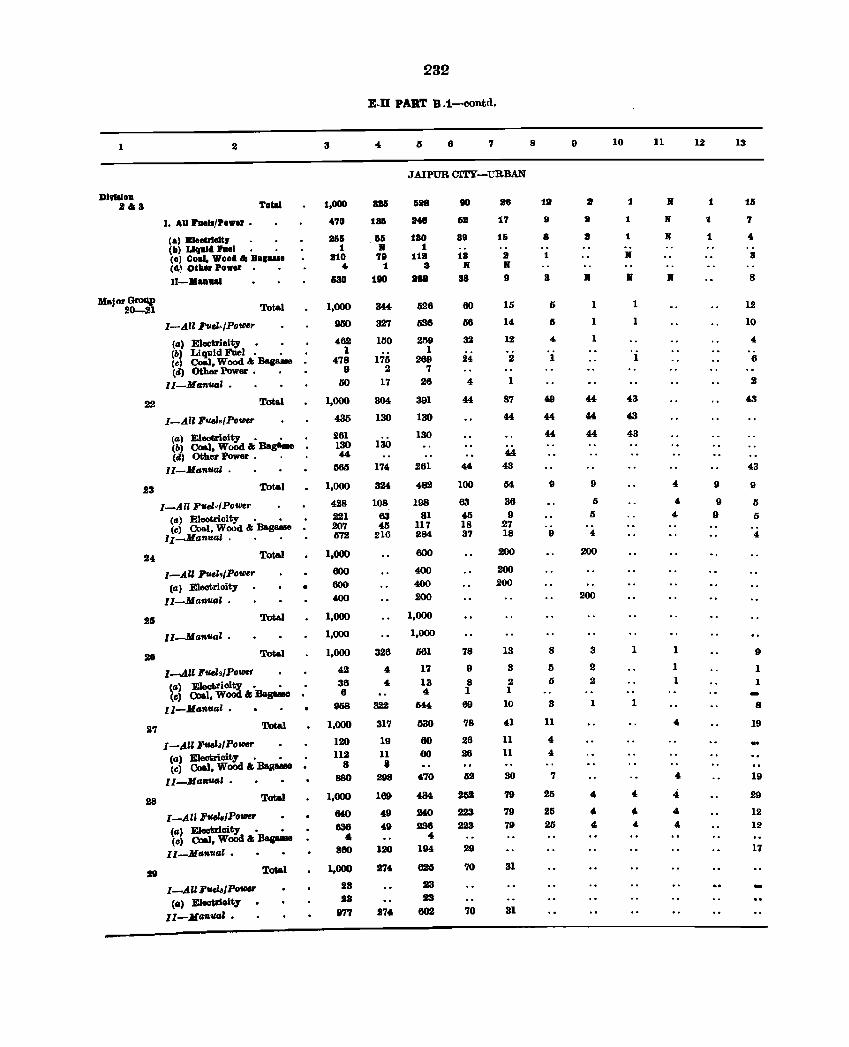
1
DIYhlolI aotos
2
I. AU I'liell/Power •
(I) BleoUioltJ'
Totll
(II) L1qnld 1'D81. • (e) Coal, Wood til BI' .... (4) otla'r Power
II-MIIIUIi
3
1,000
470
21>1i 1
210 4-
680
Major Grolli' 20-21 Total 1,000
9lIO
462 1
478 9
I-All Fue'J.JPo-r
(a) Electrioity (b) Liquid Fuel. • (e) Coal, Wood &::&a(d) Other Power •
II-Manual .
22 Total
I-All Fuel.JPo_r
(a) Electrioity. • (b) Coal. Wood &: BaglMe (d) Other Power •
II-Manual .
23 Total
I-All Fuel,/Powr (a) Electricity. • (c) Coal, Wood &: Baga8l8 II~anual .
DO
1,000
435
261 130 44
561i
1,000
428 221 207 672
24 Total 1.000
I-All FUel./Po_r 600 (a) Elect.rioity • 600
II_Manual . 400
25
II_Manual.
2. Total
1,000
1.000
1,000
I-All :8ueZs/Po-(a) E1ectricitl' • (e) (loll, Wood 6; BaguIe
II-Manual.
27
I-AU Fuels/Po-" (a) Electricity. • (c) Coal. WoOd .. BagIlll8
II-MaR-' .
28 Total
I-All Fuel./Potftr (a) Electricity. • (e) 00aI. WoOd 6; Baa-
II_Manual.
29 Total
I-A"Fuels/PotIIU (a) Eleo~olt1'
11-Mllntlll' •
4Z
36 6
90S
1,000
120 112
8 880
1,000
640 636
4 880
1,000
28 113
877
232
E.D PART B.1-contd.
811>
1.
.1111 II 'I'
1
1110
344
327
150
175 2
17
304
130
130
174
324
108 63 ~
216
326
4
" 822
31'1
19 11 II
2118
169
49 49
120
274
6 7
JAIPUR CITY-'('RBAN
112a
2415
180 1
112 a
21B
326
IiS6
239 1
269 7
26
391
130
130
261
482
198 81
117 284
600
400 400
200
1,000
1,000
561
17 13
" M4
1!30
60 60
470
~
240 286
" 194
62li
23 23
602
80
118
89
18 II
88
80
M
33
24
4
44
44
100
63 45 18 37
78
9 8 1
69
78
26 26
62
2U
223 223
29
70
70
28
:17
1&
2 II
9
15
14
12
2
1
87
44
44 43
54
36 9
27 18
200
200 200
13
8
2 1
10
41
11 11
30
79
79 79
31
31
8
12
9
a o. 1
a
5
Ii
4
1
49
44
44
9
9
8
Ii 5
3
11
4 4
7
25
25 25
9
2
2
lJ
1
1
1
9
5
5
4
200
200
3
II 2
1
4
4 4.
10
1
1
1
II
J(
1
1
1
43
43
43
1
1
4
4 4
11
If
If
Ii
4
4 4
1
1 1
4
4
" 4
"
12
1
1
1
9
9
9
13
15 ., 4-
S
8
12
10
4
6
2
43
43
9
Ii
5
4
9
1 1
8
19
19
29
12 12
17
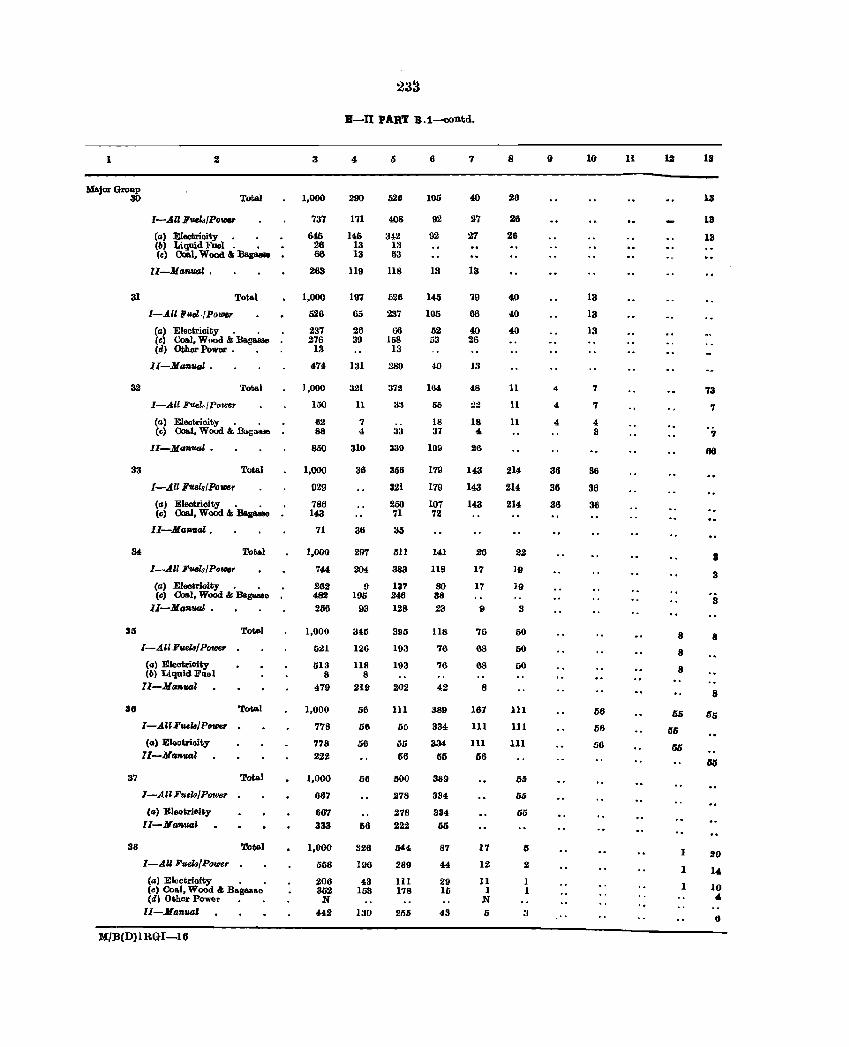
1 2
Major Group 30 Total
I-AU Fuela(PolIW
Ca) Electrioity. . (b) Liquid Fuel. • (e) 00&1, Woad &:Bag_
II-MaRual .
31 Totaol
32
I-All FUel,/Power
(a) Electricity. . Cc) Coal, W'IOd & Bag888l> (d) Other Power .
II-M_VtJl .
Total
I-AI! l!uez,,/Power
Cal Electrioity. . Cc) Coa.I, Wood & lla,g ... ..,
II-Ma .. v.aI. •
33 Total
33
36
37
38
I-All F'II.8~(PollJ8r
(a) Electricity. • (cl Coa.I, Wood & Bag888l>
II-Man.ual .
Total
I-All FUlllsI Po.".,
Ca) Electrioity. . (cl Coa.I, Wood & Bag&86e
II-Manual •
I-Alllfue18/ POllJOr
(G) Eleotrioi'y Cb) Liquid File I
II-M aRU'
I-AUlfuel8JP_u
(G) Eleotrioity II-MaR.al
I-All Fue18/Power
(G) EleotriOUy II-MaRUaZ
I-A.U Fuel8/PoU16r
Total
Total
Total
Total
(G) Electrioity • • (cl Coa.l, Wood & B .. g8llse (d") Ot.her Power
II-Ma"tu.d
M/B(D)lRGI-16
3
1,000
737
ot5 26 66
263
1,000
526
237 216
13
474
1,000
100
62 88
850
1,000
929
786 143
71
1,000
744
262 482 200
1,000
5~1
513 8
479
1,000
778
778 222
1,000
667
667
333
1,000
558
206 352
N 442
233
E-n PART B.1-oontd.
4
290
171
Ii6 13 13
119
197
65
26 39
131
321
11
7 4
310
36
36
297
204
9 195
93
345
126
118 8
219
56
56
56
56
56
326
196
43 153
130
408
34-2 13 53
U8
526
237
00 158
13
372
:~:I
33
339
356
321
250 71
35
611
883
137 246
128
395
193
193
202
111
6b
55 56
300
.278
.278 222
644
289
III 178
256
6
100
92
92
13
145
105
52 53
40
164
65
18 37
109
179
179
107 72
141
118
80 38
:23
U8
76
76
4:2
389
334
334
65
389
334
334
65
87
44
29 Iii
43
'1
40
27
27
13
79
66
40 26
13
48
22
18 4
26
143
143
143
.26
17
17
9
76
68
68
8
167
111
III 56
17
12
11 1
N Ii
8
26
28
26
40
40
40
11
11
11
214
214
214
22
19
19
3
50
50
50
111
111
111
55
56
65
6
2
1 1
:1
9
4
4
4
36
36
36
10
13
13
13
7
7
4 3
36
36
36
56
56
56
II
8
8
8
liD
66
liD
1
1
1
13
13
13
13
73
'1
7
flO
3
3
3
8
8
SO
14
10 .. II
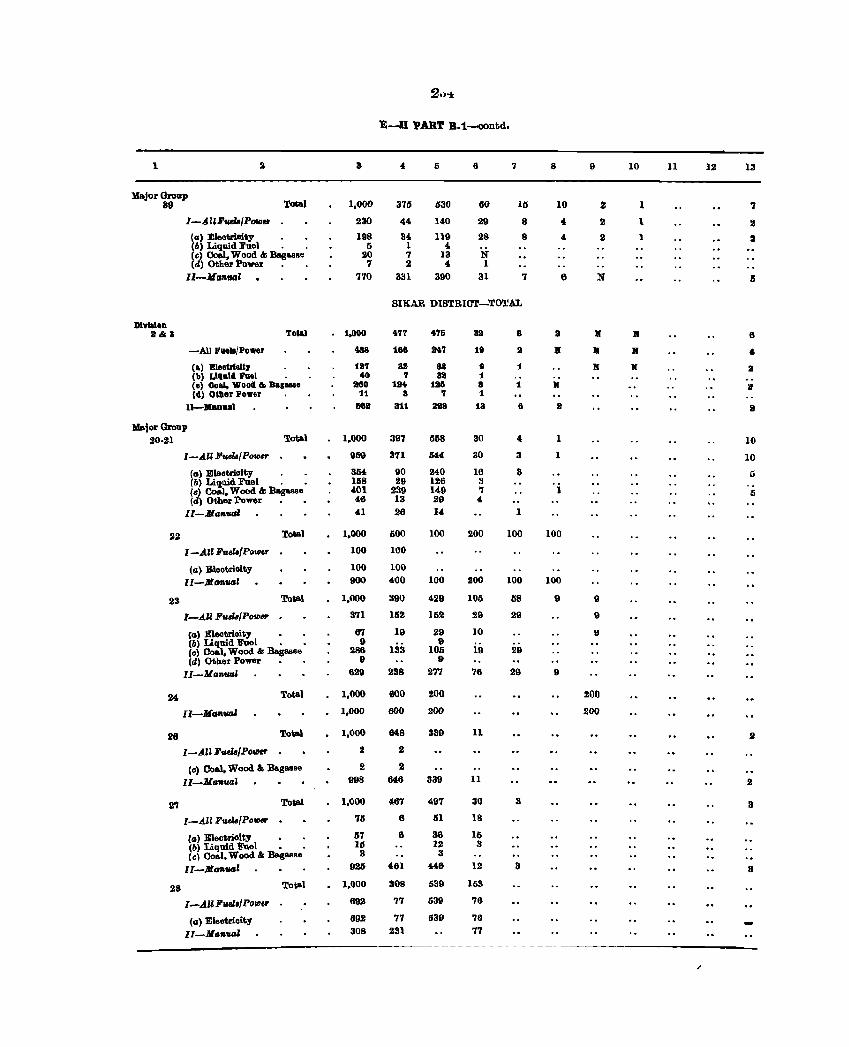
2.),*
'E-B PART B.1-contd,
1 4 II 6 7 8 9 10 11 12 13
Major Group 39 Total 1,000 375 630 60 111 10 2 1 7
l-An'tiels/POfD~ 230 44 140 29 8 4 2 1 .2 (II) Eleotrioity 198 34 1111 28 8 4 .2 1 II (") Liquid Fuel • • 5 1 4 (~ Coal. Wood&; Bag&8se 20 7 13 N ( ) Other Power • • 7 2 4 1
ll-MfJ7IAI 770 331 390 31 7 6 N II
SIKAR DISTRICT-TOTAL
mvlalQn a.a ToW 1,000 .77 .75 aa 8 a If 11 .,
-Alll'lIelajPower 438 168 847 18 II 11 If If " (a) BleoUleU, la'f S3 88 9 1 JI( JI( a (b) L1qllla Fuel 40 '7 8lI 1 (e) CD'" Wool'I '" Bagane 860 184 136 8 1 JI(
.. (1'1) Other Power 11 3 7 1
a
ll-MaDllal HI 8U 2118 18 8 2 a Major Group
20·21 Total 1,000 397 558 30 4 1 10
I-AU',",,/PoVler 959 371 lI44 30 3 1 10
(a) Elootrioity . • 854 90 MO 16 3 jj (6) Liquid Fuel . • 1118 29 126 3 (e) Coal, Wood & :Bagasse 401 239 149 '7 1 :; (d) Other Power • • 46 13 29 4
II-Ma._ 41 .26 14 1
22 To.l 1,000 600 100 200 100 100
I-An Ftlet.(PoWHr 100 100
(a) EleotriClity 100 100
11-Mll'AtICIl 900 400 100 200 100 100
23 To~l 1,000 390 429 105 68 9 9
I-AU FtUU/Po_ 3'11 1lI2 152 29 29 9
(a) Eleotriohy 67 19 29 10 II (6) Liquid Fuel • 9 9 (c) Coal, Wood. .t Bagasse 286 133 105 19 29 (d) Other Power • • 9 9
ll-Ma'AtlGl 629 238 277 '76 29 9
24 Total 1,000 600 200 200
II-M'G7ItICIl 1,000 600 200 200
28 Total 1,000 648 339 11 2
I-All FuelB[POVJer .2 2
(e) Coal, Wood. &; Bagasse .2 .2
II-M Cl7ltICIl 998 646 1139 11 2
2'7 Total 1,000 467 497 30 3 3
I-AU Fuels/Po_ '75 8 51 18
(a) Electrioity 67 8 36 16 (6) Liquid Fuel • Iii 12 3 (c) Ooal, Wood & Bagas.e 3 3
II-Ma"lUSl 926 461 446 12 3 3
28 To~l 1,000 308 539 153
I-An Fuel,/PolOer 692 '7'7 539 76
(a) Eleotricity 692 77 539 '16
1'-Ma.tIIII 308 231 77
,

235
B-U PABT B.1-contd.
1 2 3 6 7 8 9 10 11 12 IS
Major Group '.rot&1 211 1.000 663 325 6 6
I-AU FutlI/PotDer II II
(IJ) El&otrioity 8 6
Il-MIJ"',",' 994 663 3111 8 II
30 Total 1,000 451 JSlO 39
I-,411P"Il8{PII_ 628 2(14 294
(IJ) Eleotrioity • 296 69 196 (0) ao.l, Wood & Bagllllse 333 236 98
II-Mlln_l 372 157 216 39
31 Total 1,000 419 516 65
I-All Fuef8/Po'Wer 129 32 64 33
(e) 0081, Wood & Bagasse 129 32 64 33 II-Man'IUI.l 871 387 452 32
32 Total 1,000 428 441 76 41 7 7
I-AlfFutlI/P_r 250 IIO llO 28 1
(II) Eleotrioity • 14 7 7 (c) Coal, Wood & Bagasse 234 103 103 28 (d) Other Power 7 7
ll-MG",wd 745 318 331 48 41 7
33 Total 1,000 1,000
I-AU Fuet./PoUler 1,000 1,000 (0) Coalr·Wood &I Bagasse 1,000 1,000
34 Total 1,000 281 626 94-
I-All 1'".) POtIJ8r 734 166 000 78
(a) Eleotrioity • 156 16 HIli 16 (c) Coal, WOO<i &I lJagaaae 578 141 375 62
II-MllllutU 266 126 126 16
3a Total 1,000 231 615 1M
I-All Yuh/F_ 638 884 164
(a) Eleotrioity 638 384 164·
Il-Ma'Awl 482 231 231
36 Total 1,000 000 000
I-All F'IIek/ Powu . 500 125 375
(IJ) Eleotrioity 500 126 375 I1-a __ 500 375 125
37 To""l 1,000 334 333 333
II-MGtlUtJ' 1,000 334 333 333
38 Total 1,000 408 558 26 6 .2
I-AClFueJ./Po_ . 630 249 858 17 -l 2
(a) EIe4ltrioity 9 4 .2 1 2 (6) Li~uid Fuel . • .2 .2 (e) f'.oa., Wood & BagRssc 619 245 31S6 14 .2 .2
II-MaliA' 370 159 200 9 2
39 To6&1 1,000 568 396 16 4 18
1-..4.11 1I'1.Id8{PolHr 284 116 152 12 " (a) Eleotricity 196 72 108 12 4 (b) liquid Fuel • 8 8 Ce) Coal. Wood &I Bagasse 76 40 36 (d) Other Power 4 4
ll-.Mo.'A'lUl.I 716 452 244 " 16
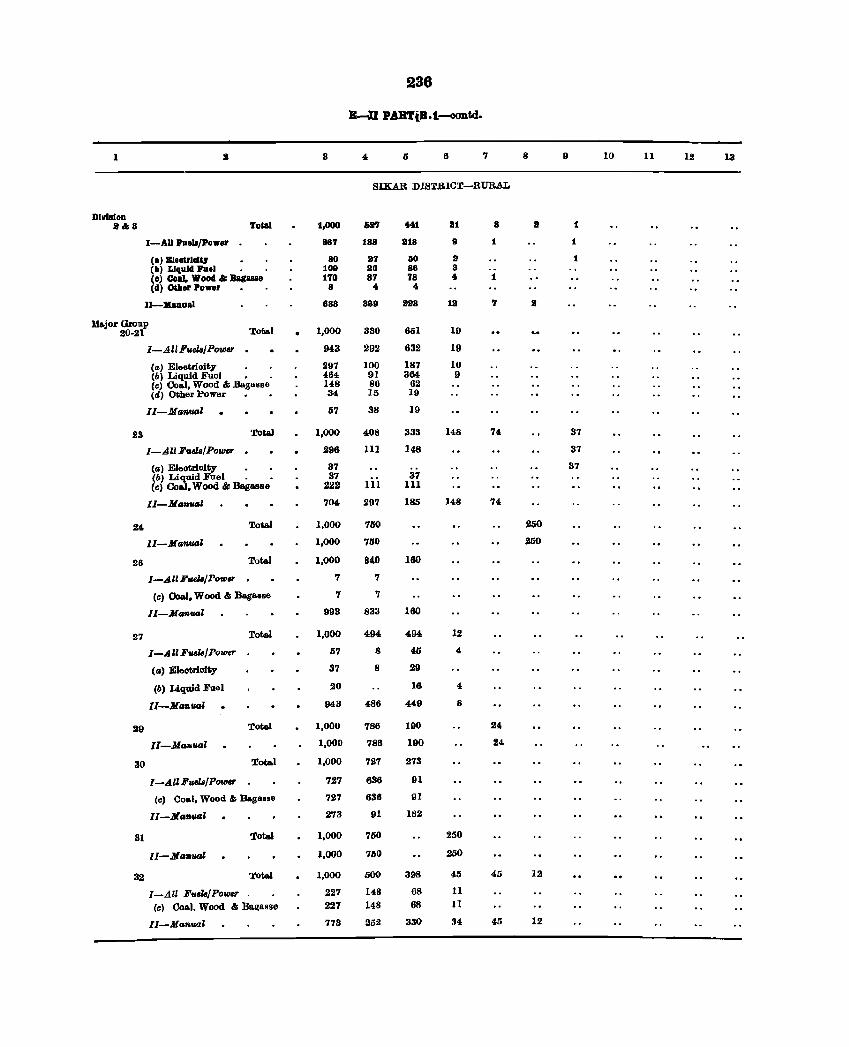
236
B-II PABTiB.l-oontd.
1 3 4 5 6 7 8 9 10 11 12 13
SIKAB DISTRICT-RURAL
DIV'lsJoD lIA8 Toi&l 1,000 687 411 81 8 8 1
I-AD JlDeJa/PaW8F 887 188 lI18 9 1 1
(a) me.trill', 80 37 50 3 1 (II) Liquid Puel 109 30 88 8 (e) Coal, Wood " Bag_ 170 87 78 • 1 (d) Odl.r Power 8 .. 4.
II-KanDal 833 889 833 13 7 3
Major Group 20-21 Total 1,000 330 601 10
I-AIIPuel8/PoUier 943 292 632 19
(a) Eleotrioity 297 100 187 10 (b) Liquid Fuel • 464 91 364 9 (c) Coal, Wood" BagaHBo 148 86 62 (d) O&her Power 34 15 19
ll-Mrm"'" 57 38 19
23 Total 1,000 408 333 148 74 37
I-All Fuel8/Power . 296 III 148 37
(a) Eleotrioity 37 37 (6) Liquid Fuel . 37 37 (el Ooal, Wood & Bagasse 222 111 111
II-MG""'" 704 297 185 148 74
2' Total 1,000 750 250
II-MG"'''''' 1,000 750 250
28 Total 1,000 840 180
I-All FuelB/Powv 7 7
(e) Ooal. Wood &; Bagasse 7 '1
II-MG"'_' 993 833 180
27 Total 1,000 494 494 12
I-~IlFuelBIPQwer 57 8 '5 4
(G) Eleotrioity 37 8 29
(b) Liquid FIlel 20 16 4
II-Yawl 943 486 449 8
29 Total 1,000 786 190 24
II-MGnlUJ' 1,000 788 190 24
30 Total 1,000 727 273
I-All Fud8/Po_ 727 636 91
Cc) 00801, Wood II Bagasse 727 636 91
I1-XG"'''''' 273 91 182
31 Total 1,000 750 250
ll-MGflwl 1,000 760 250
32 Total 1,000 500 398 '5 45 12
I-All Fuel8/Power 227 148 68 11
Cr.) Coa.I, Wood &; Bagasse 227 148 68 11
II-MGnual 773 25:1 330 34 45 12
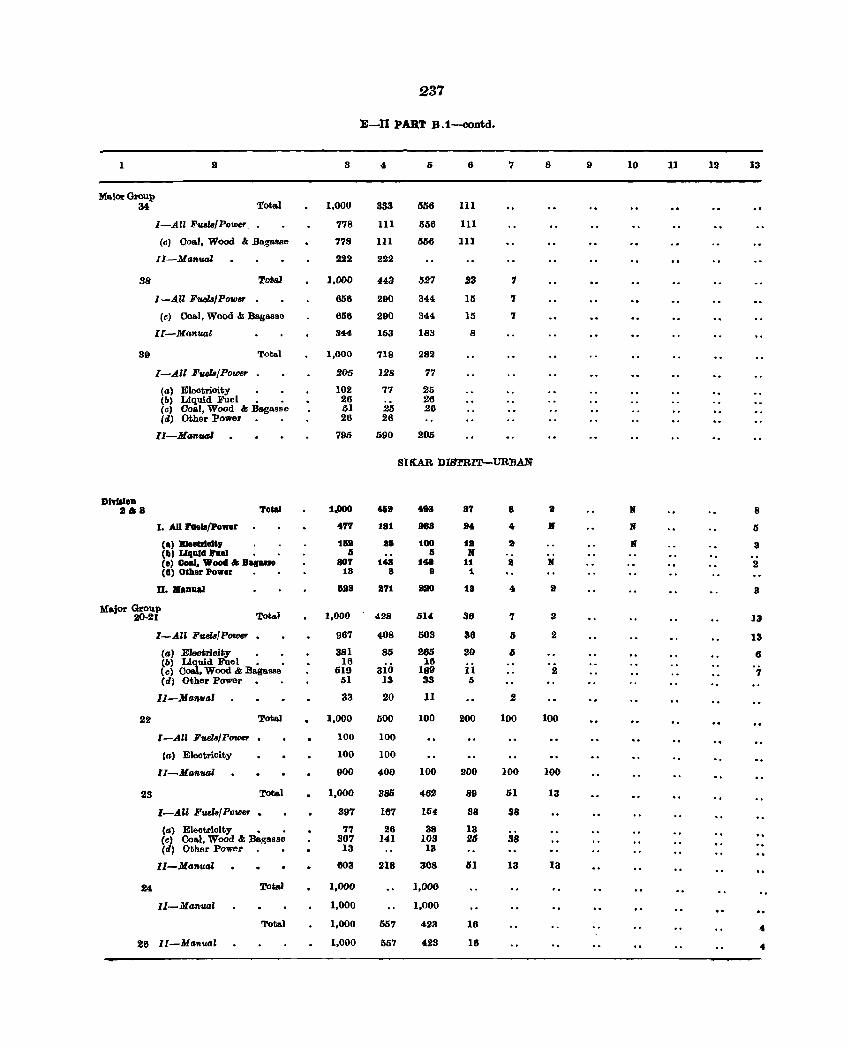
237
E-D PART B.1-CODtd.
1 2 3 4 6 6 '1 8 9 10 11 It 13
Maior Group 34 Total 1,000 333 1i56 111
I-All Fuel8/Powu. 778 111 556 III
(e) Coal, Wood &; Bagasse 778 111 556 III
II-M~ft'll41 222 222
88 Total 1.000 443 527 23 7
I-All FuelB/PowfI 658 290 344 15 7
(e) Coal. Wood &; Bagass" 858 290 344 15 7
II-Manual 344 163 183 8
39 Total 1,000 718 282
I-All Fue/a/Po'llJer 205 128 77
(a) Eleotrioity 102 77 25 (b) Liquid Fuel • • 26 26 (e) Coal, Wood &; Bagasse 61 25 26 (d) Other Power 20 26
II-Manu' 795 590 205
SIKAR DISTRIT-VRBAN
DI'rfIIDD S&8 Total 1.000 4Ga 498 8T 8 3 II 8
I. AD I'II.II/power 4'17 181 se8 M 4- If II IS
(a) B1.Dtllelt, 11111 all 100 la It II 3 (II) Llqllld .... 1 Ii Ii If (e) Coal, Wood &I Bag .... 807 148 1411 11 3 II 2 (a) Other Power 18 8 9 1
Il •• aDlIai U8 371 no 18 4. It 3
Major Group Total 1,000 514 36 20-21 428 7 2 13
I-AU F"eZ./PatfI8r 967 408 503 38 IS 2 13
(a) EJeotrioity • • 381 85 265 20 Ii 6 (b) Liauid Fuel • • 16
3in 18
ii (c) Coa, Wood &; Baga98e 619 189 2 7 Cd) Other Powor 51 13 33 6
Il-MQ·'fI,'IIal 33 20 11 2
22 Total 1,000 500 100 200 100 100
I-All Fuels/Power 100 100
(a) Electricity 100 100
II-Manual 900 400 100 200 100 100
23 Total 1,000 385 462 89 51 13
I-AU FuelB/PotIJer • 397 167 154 88 88
(a) Eleatrioity • • 77 26 38 13 (c) Coal, Wood &; Bagasse 307 141 103 26 38 Cd) Other Power 13 13
Il-Marlttal 603 218 308 tH 13 13
24 Total 1,000 1,000
II-ManuaZ 1,000 1,000
Tot .. l 1,000 557 428 16 4
26 II-MaflIUlZ 1,000 557 423 16 4
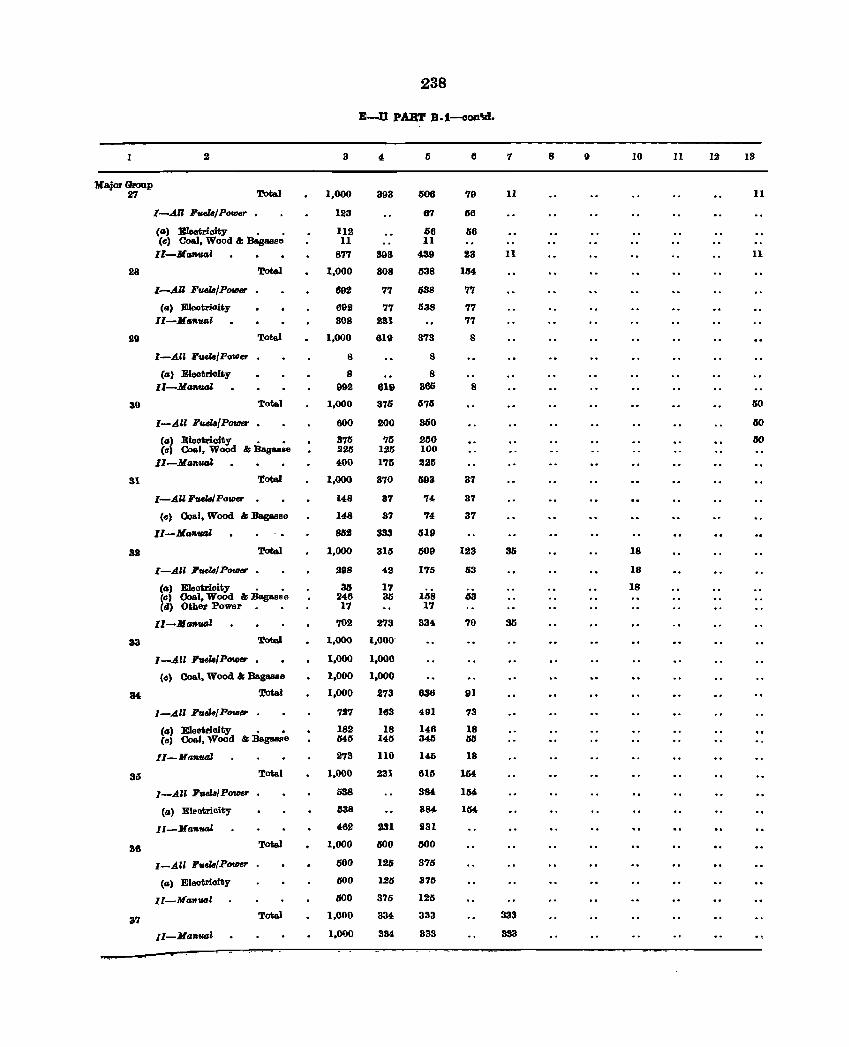
1 .2
MajorGzoup 27 Total
I-All F.u./P_
(CI) llIleotrioity • • ee) Coal, Wood &; Bagasse
II-MatnllJuJ
28 Total
29
30
31
32
33
[-.All Pue18/Power
(CI) Eleotrioity II-MlinUGl
I-All F.u./Potller
(CI) Eleotrioity II-Mil""""
Total
Total
I-All Fuela{Por.oer
(II) Eleotrioity (0) Coal, Wood &; Bagasse
II-Mil""""
Total
I-All F.u./ Pa_
Co) Coal, Wood &; Bagasse
lI-MIIPlwl
Total
I-All Fuel&/POtIIet'
(CI) Eleotrioity • • Ce) Ooal, Wood &; Bagasse Cd) Other Power
II-Jllln .. l
Total
1-.A1l F'IUlaIP_
(0) CoIroI, Wood &; Bagasse
34 Total
35
37
I-All F.eh/P,,_
(CI) Eleotrioity (0) Coal, Wood &; Ba.gUl'e
II-MaftUGl
J-.AU F.el8/Po_
(a) Eleotrioity
II-Manual
I-.All Fuu./POtIIel'
Ca) Eleotrioity
Il-MClflwll
Il-MII'lJUGl
Total
Total
238
E-n PAllT B.1-cOD~ •
8
1,000
123
112 11
877
1,000
692
692 308
1,000
8
8 992
1,000
600
375 2!5 400
1,000
148
148
815.2
1,000
298
30 246 17
702
4
393
393
308
77
77 231
619
81&
375
200
75 125 175
370
37
37
333
315
42
17 35
273
1,000 1,000-
1,000 1,000
1,000 1,000
1,000 273
727
182 545
273
1,000
538
538
462
1,000
600
llOO
500
1,000
1,000
163
18 145
110
231
231
500
126
125
375
334
334
6
506
87
.06 11
D9
538
638
538
373
8
8 365
675
360
250 100
225
593
74,
74
1519
509
175
IDS 17
334
636
491
l4,6 345
145
615
334
384
231
500
375
875
125
333
333
6
79
56
56
23
154
77
77 77
8
8
37
37
37
123
53
53
70
91
73
18 65
18
154
154
164
7
u
11
35
333
333
8 I) 10
18
18
18
11 12 18
11
11
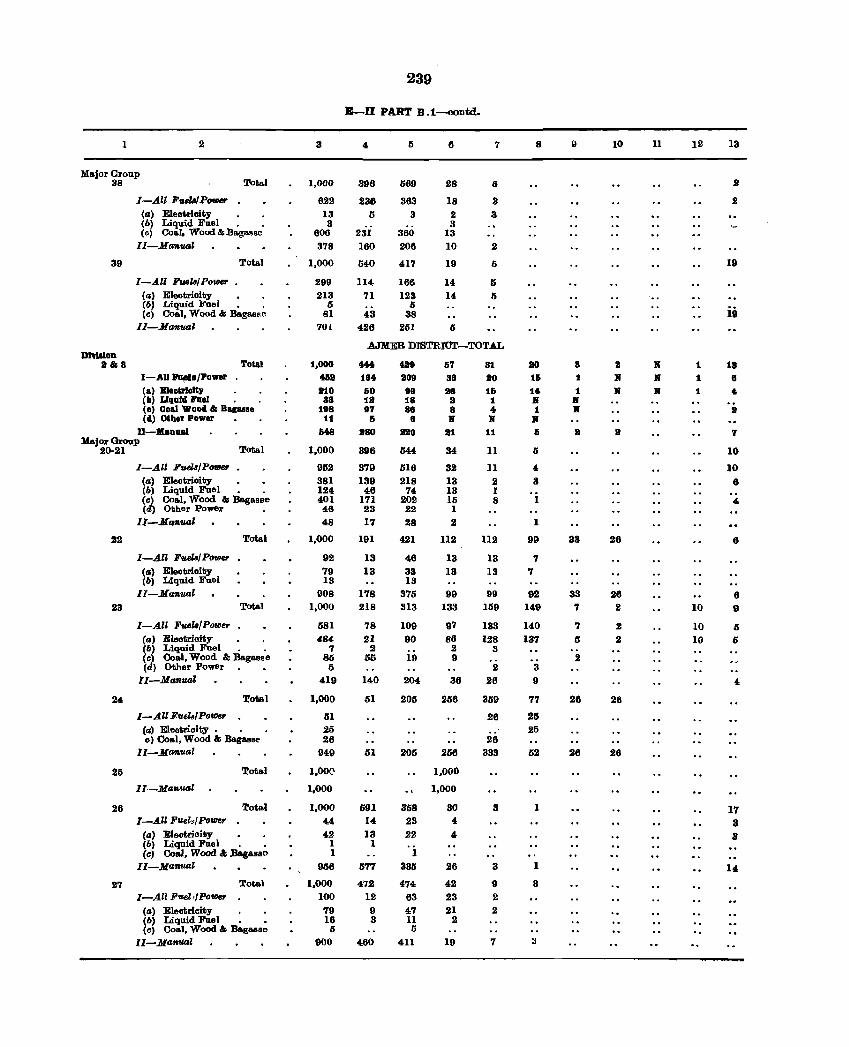
1 2
Major Group 38 Total
39
Dlvllion 8&8
I-AU FueklP_ (a) Eleot~ioity • . (h) Liquid Foel . . (c) Coal, Wood&13aga.sse Il-Ma'l&ua~
Total
I-All Fvela/Po_ (a) Eleotrioity • . (b) Liquid Filel • . (e) Coal, Wood &: Bagasse
II-Manual
I-AU ~l./power
(a) Elaotrlole" (II) Liquid hal •
Total
(0) Coal Wood & Baga •• e (d) Oaber Power
D-Mallual M.ajor Group
20·21 Total
22
I-AlZ Fuels/P_ (a) Eleotricity • • (b) Liquid Fuel • . (0) Coal, Wood & Bagasse (d) Other Power
II-Manual
I-All Fuels/Power (a) Eleotrioity (b) Liquid Fuel
II-Manual
Total
23 Total
I-All Fue18/Power (a) Eleotrioity • . (b) Liquid Fuel . . (0) 001101, Wood &: Bagasse (d) Other Power
II-Manual
24 Total
I-All F.iter.s/ PotDer (a) Eleetrioity . . 0) 001101, Wood &: Bagasse
II-Manual
25 Total
II-Maft.ttal
26 Total I-All Fuel./PofDer
(a) Electrioity (6) Liquid Foel . • (e) Ooal, Wood ... Bagasse
II-Maftfud
27 Total I-All Fuel'IPotDer
(al Electricity (6) Liquid Fuel . • (e) Coal, Wood &: Bag .... se
lI-Maft.uaZ
3
1,000
622 13 3
606 378
1,000
299 213
5 81
701
1,000 468
810 88
198 11
648
1,000
952 381 124-401 46 48
1,000
92 79 13
908 1,000
581 484
7 85
5
419
1,000
51 25 26
949
l,OO~
1,000
1,000 44 42
1 1
956
1,000 100 79 16
5
900
239
E-n PART B.1-oontd.
4
396
238 5
231 180
040
114 71
43 426
5
569
363 3
360 206
41'7
166 123
6 38
251
6
28
18
2 3
13 10
19
14 14
5
'7
Ii
3 3
2
5
5 5
AJMEB D1STRIOT-TOTAL
444
184
60 18 97 Ii
880
396
379 139 46
171 23 17
191
13 13
178 218
78 21
2 65
140
51
51
591 14 13
I
577
472 12 9 3
460
D9 809 99 18 88
8 no 544
516 218
74 202 22 28
421
46 33 13
375 313
109 90
19
204
205
205
358 23 22
1 335
474
63 47 11
5
411
57 38 88 8 8 JJ
Itt
34
32 13 13 15 1
2
112
13 13
99 133
97 86
2 9
36
256
256
1,000
1,000
30 4 ,
26
42 23 21
2
19
31 ao 16
:1 4 JJ
11
11
11 2 1 8
112
13 13
99 159
133 128
3
2
26
359
26
26 333
3
3
9
2
2
7
8
ao 16 14 JJ 1
JJ 5
5
4
3
1
1
99
7 7
92 149
140 137
3
9
77
25 25
52
1
1
3
9
8 1
1 JJ JJ
a
33
33 7
7 5
2
28
26
10
a JJ JJ
26
26 2
2 2
26
26
11
K
JJ JJ
12
1
1 1
10
10 10
13
19
iii
11 8 4
a
7
10
10
6
4,
8
6 9
5 I)
4
17 3 3
14,
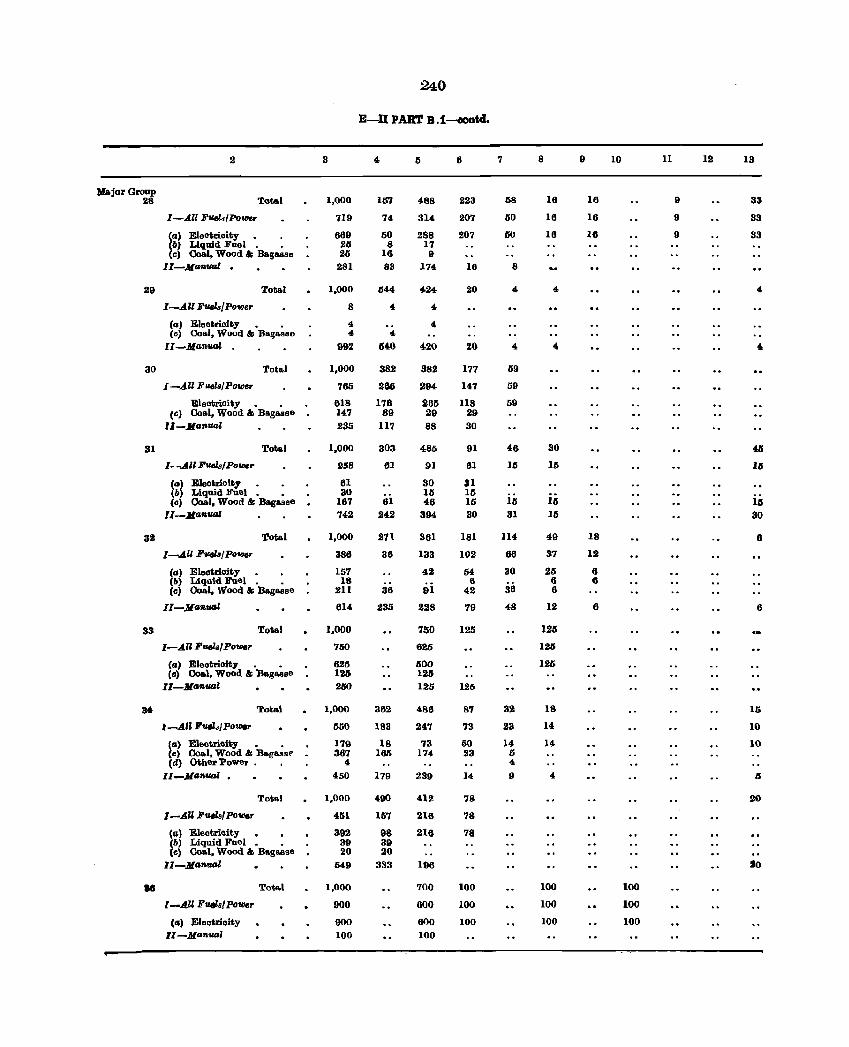
240
E-U PART B .1--OODtd.
2 3 4 5 6 7 8 9 10 11 12 13
](ajor Group 28 Total 1,000 167 488 223 68 16 16 9 33
I-All Fuel..(Power 719 74 314 207 50 16 16 9 33
(1.1) E1elltrioity. . 669 50 288 207 50 16 16 9 33 (6) Liquid Fuel. . 25 8 17 (0) Coal, Wood &; Bagasse 25 16 9
II-Manual . 281 83 174 16 8
29 Total 1.000 544 424 20 4 4 4
I-All Fueh/Po'IDcr 8 4 4
(1.1) Eleotrioity • . 4 4 Ccl Coal, Wood & Bagasso 4 4
II-Manual 992 5~ 4,20 20 4 4 4,
30 Tota.l 1,000 382 382 177 59
I-All Fuels/Po08r 765 266 294 147 59
Eleotrioity. . 618 176 265 118 59 (c) Ooal, Wood & Bagasse 147 89 29 29
ll-Manual 235 117 88 30
31 Total 1,000 303 485 91 46 30 48
1- -.All F'uelaIPollJer 258 61 91 61 15 15 15
(a) Eleotrio ity • • 61 30 31 (b) Liquid Fuel. • 30 15 15 (c) 00801, Wood & Bagasse 167 61 46 15 15 15 15
II-Manual 742 242 394 30 31 16 30
32 Total 1,000 271 361 181 114 49 18 6
I-.All FttelB/Po_ 386 36 133 102 66 37 12
(a) Eleotrioity • • 157 42 54 30 25 6 (fJ) Liquid Fuel. • 18 6 36 6 6 (c) Ooal, Wood &; Bagasse 211 36 91 42 6
Il-JlaRUtJI 614 a35 228 79 48 12 6 6
33 'lotal 1,000 750 125 125
I-AU F'uela/Power 750 625 125
(1.1) Eleotriolty • • 625 500 125 (0) Coal, Wood &; Bagasse 125 125
II-JlaRUtJI 230 125 125
" Total 1,000 362 488 87 32 18 15
I-All F'UfIl./PoUl8r 560 183 247 73 23 14 10
(II) Eleotrioity • • 179 18 13 50 14 14- 10 (,,) Coal, Wood & Bagassl' 367 165 174 23 I) (d) Other Power . 4- 4-
II_JlaRua.l , 450 179 239 14 9 4 5
Total 1,000 490 412 78 20
I-AU Fuels' P01DU 41n 157 216 78
(a) Eleotrioity. , 392 98 216 78 <6> Liquid Fuel. • 39 39 Ccl 0011.1, Wood & Baguse 20 20
lI-JianUtJl 549 333 196 10
H Tota.l 1,000 700 100 100 100
I-An FlI4IIslPDwer 900 600 100 100 100
(1.1) ElectriQity 900 61)0 100 100 100 II-Jlanual 100 100
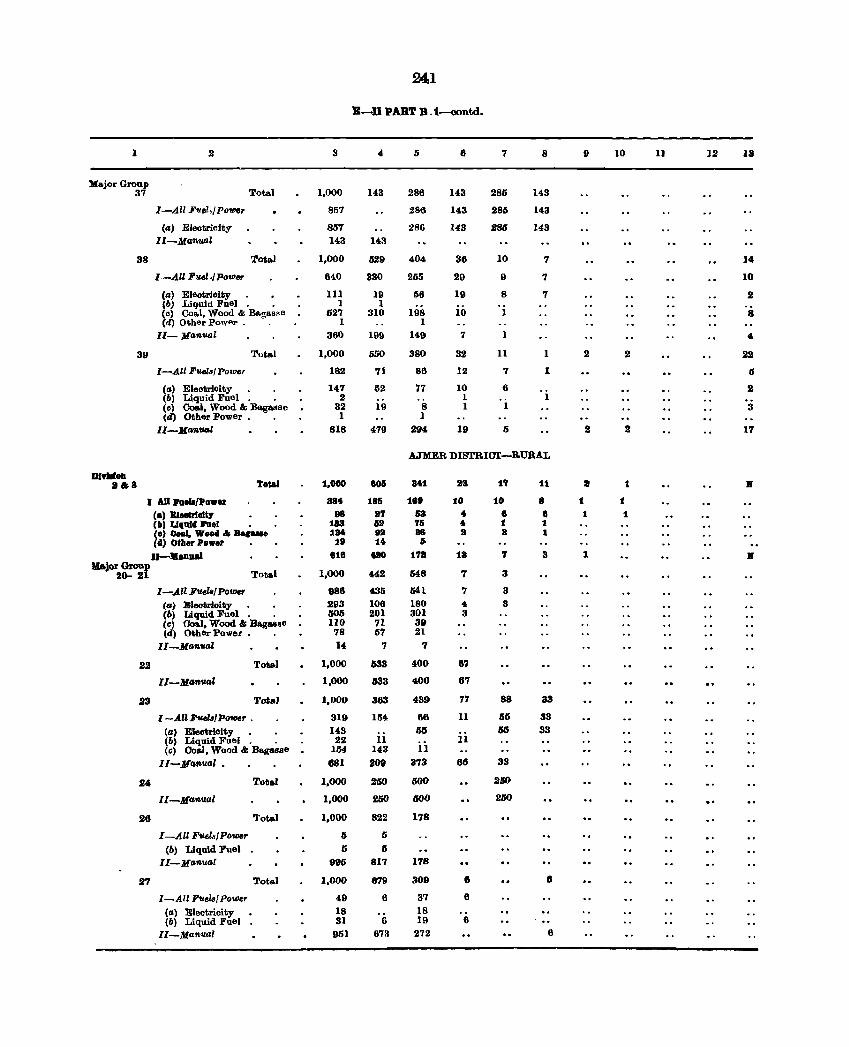
241
B-D PART B .1-«>ntd.
1 2 3 4. I) 6 7 8 9 10 11 12 13
M .. jorGronp 37 Total 1,000 143 286 143 285 143
I-All Fuel,jPowe, 857 :286 143 285 143
(a) Eleotricity 857 286 143 286 143 Il-MafiUlll 143 143
38 Tot .. 1 1,000 529 404 36 10 7 J4
I-All Puel</Po'IDer 840 330 255 29 9 7 10
Ca) Eleotrioity 111 19 56 19 8 7 2 (b) Liquid Fuel. • 1 1 (0) Coal, Wood & BlIogas"o 527 310 198 10 1 8 Cd) O~her power . 1 1
Il- Manual 360 199 149 7 4.
39 Total 1,000 550 380 32 11 1 2 2 D
I-All Fuelsl Power 182 71 88 12 7 1 IS
(a) Electrioity . 14.7 52 77 10 6 2 (b) LiqUid Fuel. • 2 1 1 (c) Coal, Wood & Bagasse 32 19 8 1 1 3 (d) Other power. . 1 1
Il-Man?l41 818 4.79 294. 19 5 2 2 17
AJMER DISTRIO'I-RURAL
orvllloD .&8 To31 1,000 8011 841 28 17 11 It 1 I(
I AU :raell/.OW., 384 186 188 10 10 8 1 1
(.) BIH&rlot1, 88 17 68 4 8 8 1 1 (II) Ullllld 1'1181 183 61 76 4. 1 1 (0) Coal" Wood .. Bag_ 1M DB B6 l!I 8 :1 (4) Other Po"er 18 tt. .. 11-.aDDa! 818 4l!IO 172 18 7 3 1 I(
MaiorGroup 20- 21 Tot .. 1 1,000 442 548 7 3
I-,All FUela!PolDer 886 4.35 641 7 3 (0) Electrioity 293 106 180 4 3 (b) Liquid Fuel. . 505 201 301 3 (c) Co .. I, Wood &; Bagasse lIO 71 39 (d) Other Power • . 78 57 2t
II_Manual 14 7 7
22 Total 1,000 633 400 67
II-Manual 1,000 333 400 67
23 Total 1,000 363 439 77 88 33
I-AUFuels/PofIMr . 319 154 66 11 65 33
(a) Eleotrioity. . 143 65 M 33 (b) LiqUid Fuel. . 22 11 11 (c) 00801, Wood & Bagasse 154 143 11
II-Manual. 681 209 373 66 33
24 Total 1,000 260 ISOO 2110
II-Manual 1,000 260 1100 250
26 Total 1,000 822 1'78
I-All Fuels/POlDer Ii 5
(b) Liquid Fuel 6 6
II-Manual 995 817 178
27 Total 1,000 879 309 8 «I
I-All Fuels/Power 49 6 37 6
(a) Electricity 18 18 (b) Liquid Fuel 31 6 19 6
II-Manual 951 673 272 6
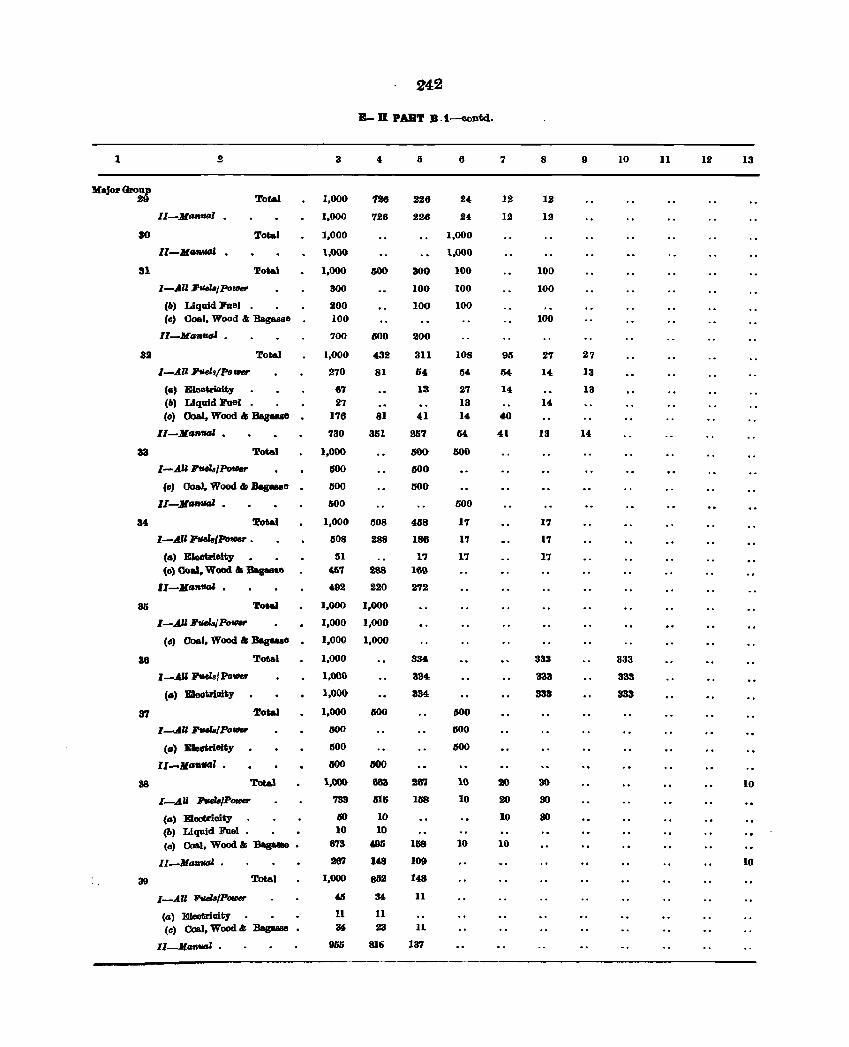
242
B- n PART B. t-ilOntd.
1 ! 3 4 6 7 8 9 10 11 12 13
Major Group 29 Total 1,000 '716 226 24 12 12
II-Man_l 1,000 726 226 24 12 12
80 Total 1,000 1,000
II-lIGm1Gl 1,000 1,000
31 'Iotal 1,000 500 300 100 100
I-All Jl'Uel8,Po_ 300 100 100 100
(6) Liquid Fuel 200 100 100 (c) Coal, Wood .I: Bagasse 100 100
II-Manua' . 700 500 200
32 Total 1,000 432 311 108 95 27 27
I-All Jl'ueh/PDVler 270 81 54 114 54 14 13
(a) Eleotrioity G7 13 27 14 13 (6) Liquid Fuel 27 13 14 (0) OoaI, Wood &I Bag ... e 176 81 41 14 40
11-1Ianual • 730 351 257 54 41 13 14
33 Total 1,000 tIOO 500
I-AU Jl'uelaIPoUllJr IlOO 600
(c) Coal, Wood & Bag_e . 1100 600
11-1IaftUGl • 500 500
34 Total 1,000 508 458 17 17
l-AlIF"IIels/Po_ • 608 288 188 1'7 1'7
(a) Eleetrielt,. 51 17 17 17 (0) Ooal. Wood &I Bagaaee "'7 288 169
I1-1Ia,,-' • 492 220 2'72
35 TotaJ 1,000 1,000
I-AU FtHlajPo_ 1,000 1,000
(0) Coal, Wood &I Bag ... e 1,000 1,000
38 Total 1,000 334 333 333
,-AU FtMl./ PoVler 1,000 334 333 333
(II) Eleolirioity 1,000 334 333 333
37 Total 1,000 IWO 500
l-AU JI'wlaIPo- 300 tIOO
(a) EleoWlolty 1100 600
II - 1I1IIItlal • 1100 600
38 Total 1,000- 863 267 10 20 30 10
I-AU Fuels/Power 733 a15 1118 10 20 SO
(a) Eleotrioity lID 10 10 80 (b) Liquid Fuel • 10 10
(0) Ooal, Wood &; Bagaaae 8'73 &95 168 10 10
11-Ma'IIfMJJ • 267 143 109 10
39 'l'otal 1,000 862 148
I-All Fuels/~ 46 34 11
(a 1 Electricity 11 11
(c) Coal, Wood & :Bagaaae 34 23 11
ll-lItanVtJl • 955 81S 137
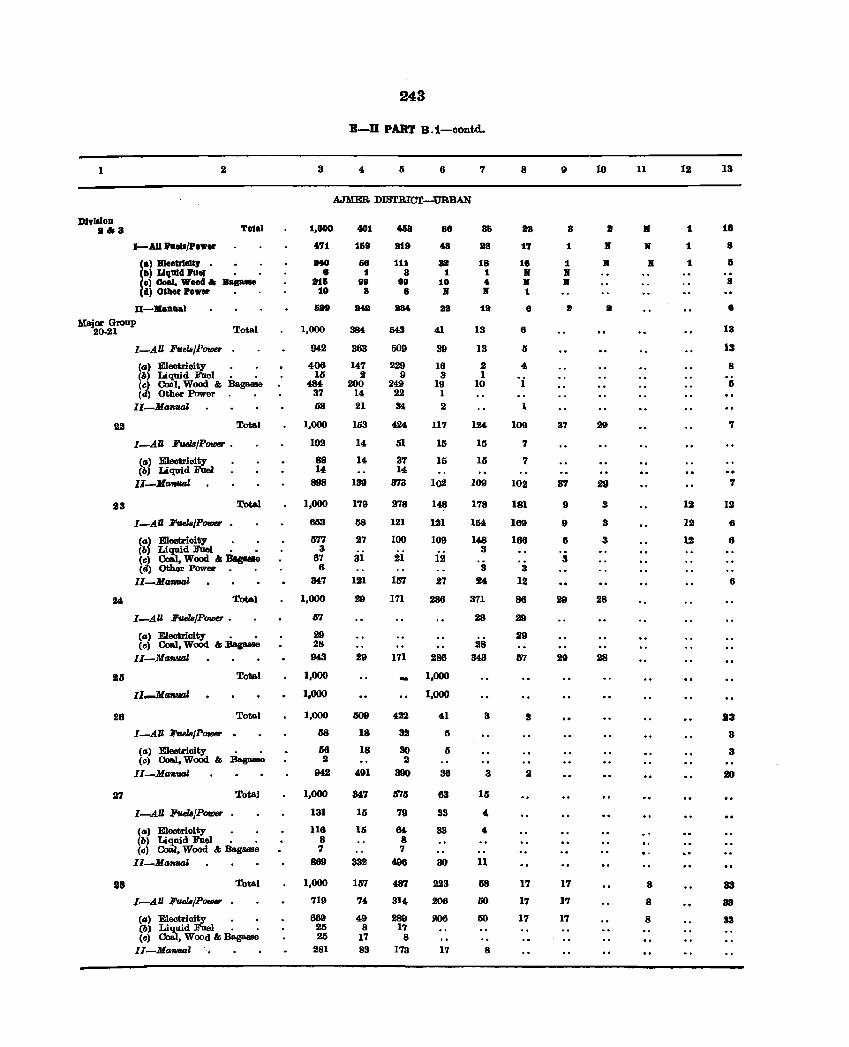
1 2
DlvlsloD 8'" 3 Total
I-All raela/power
(a) B1eetrleltr 0
(II) LIqUId raal (0) Ooal, Wood", Bapss. (d) Other Power
D-MaDual
Major Group 20·21 Total
U
13
24
!illS
26
27
18
I-AU F'fjelBJPower
(a) Electrioity (b) Liquid Fuel • 0
(c) CosI, Wood & Bagaase (tl) Other Power
Il_Mafllll4l
I-AU Fv.elB/P_.
(a) Eleotricity (b) Liquid Fuel
II-MaftVtll
I-AU Fv.elB/P_
Total
Total
(a) Electricity 0
(b) Liquid Fuel • • (c) Coal, Wood &I:oasa(tl) Other Power. 0
Il-Ma_1
Total
I-AU Fv.elB/P_ 0
(a) Electricity • • (c) Coal, Wood & Baga.ase
Il-MtDllll4l
Total
Tota.l
I_AU Fv.elB/P_ •
(a) Eleotrieity (c) Coal, Wood & Bag .......
II-Maftval
Total
I-AU Fv.elBJP
(la) Electrioity (b) Liquid Fuel 0 0
Cc) Coal, Wood & Ba.g&lllle
II-Ma16val
Total
I-AU Fue1a/P_
(a) Electrioity 0 0
(b) Liquid Fuel 0 0
(c) Coal, Wood & Ba.gaase II-Maft'll4l
3
...,1 IMO
8 Bill
10
6211
1,000
942
406 16
484 37 68
102
88 14
898
1,000
683
577 3
67 6
347
1,000
67
29 28
943
1,000
1,000
1,000
58
86 2
942
1,000
131
116 8 7
869
1,000
719
669 25 25
281
243
B-D PART Bo1-oontd.
4 6 7
AJMER DISTRICT-URBAN
401
1119
68 1
99 8
468
819
111 8
99 8
384 543
363
147 2
200 14 21
153
14
14
139
179
58
27
31
121
29
29
Ii09
18
18
491
847
15
16
332
lIi7
74
49 8
17 83
509
229 9
249 U
34
424
51
37 14
373
278
121
100
21
157
171
171
-422
32
so 2
390
576
79
64 8 7
496
48'7
314
289 17
8 173
88
48
aa 1
10 X
28
41
39
16 3
19 1
2
117
15
15
102
148
121
109
iii
27
286
286
1,000
1,000
41
IS
IS
36
63
33
33
30
U3
.206
?06
17
85
88
1a 1 .. X
18
13
13
2 I
10
124-
15
15
109
178
154
148 3
3
!4
371
28
28 343
3
3
lli
4
4
11
68
50
50
8
8
88
17
18 N K 1
8
6
5
'" °i
1
109
7
7
102
181
169
186
3 12
86
29
29
1)7
2
2
17
17
17
9
8
1
1 K ..
37
37
9
9
6
3
29
29
17
17
17
10
a .. ..
29
29
3
3
3
28
28
11
II
X ..
8
8
8
12
1
1
1
12
12
12
13
1e 8
Ii
8
a
13
13
8
5
7
7
12
6
6
6
13
3
3
33
33
33
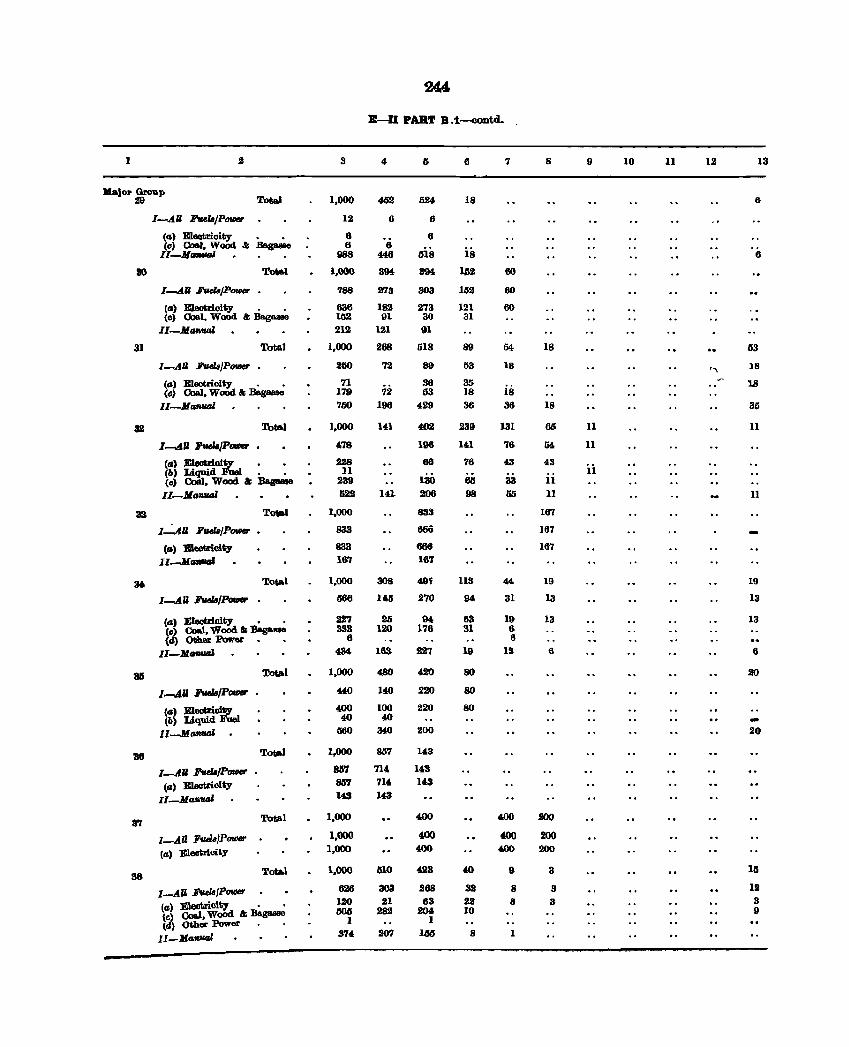
244
E-U PART B .i-oontci..
1 3 " I) 6 7 8 9 10 11 12 13
lIaJor Group aD Total 1,000 4D2 Ii24 18 6
I-AU PU18/POIftf' 12 6 6
(tI) E1eatrioity • • 6 6 (e) Coal, Wood .t Baguae 6 6
6is is 11-11 __ • • • 988 446 6
80 Tot&l 1.000 394 8M 1$2 60
I-.AU FtIel8/P_ 788 273 303 152 60
(0) Electricity . • 836 182 273 121 60 (e) Coal. WoOd &; Baga.sse 152 91 30 31
II-Morlual 212 121 91
31 Total 1,000 268 1i18 89 54 18 53
I-AU FtIel8/P_ 2110 72 89 53 18 " 18
(a) Eleotrioity • • 71 72
36 35 is 18 (e) Ooal, Wood &; Bagaase 179 53 18
II-Marlual 700 196 429 36 36 18 36
32 Total 1,000 141 402 239 131 66 11 11
I-.AII 7uelB/P- 478 196 In 76 54 11
(a) ElectrloiL . . 228 66 76 43 43 (Ii) LiCJ!lid ., 11 11 (e) CoiIJ, Wood &; B..- 239 130 6Ii 33 11
II_Ma'IIIItJI 629 141 206 98 50 11 II
33 Total 1,000 833 167
1~U FfIBlII/P_ • 833 tl66 167
(0) Electricity 833 666 167
Il......Mnuai 161 167
3& Total 1,000 308 4tn 113 " 19 19
I-AU FvelI/l'aUIer 666 U,II 270 94 31 13 13
(a) Electricity • • 22'l 2li 94. 63 19 13 13 (e) Coal, WoOd & ~- 3S3 120 178 31 6 {I!} Other Powel: • 6 6
II_MorlUGI 4S4 163 227 19 13 6 6
3Ii TotIIol 1,000 480 420 80 20
1-4" FfIBliI/P- 440 140 220 80
(0) meotrioi~ 400 100 220 80 .. (Ii) Liquid 1 40 40
II-MII-' 560 340 200 20
36 Total 1,000 857 143
1-AU JJ'uelIIP- 867 714, 143
(II) Eleetrioity 857 714 143
II_Ma.ual 143 143
87 Total 1,000 400 400 200
I-All Ftuh/P- 1,000 400 400 200
(a) Electricity 1,000 400 400 200
88 Total 1,000 tUO 428 40 9 3 15
I-All EGelBJP- 626 803 268 32 8 3 12
la) Eleotrioity • • 120 21 63 22 8 3 3
(e) CoaJ.. Wood &; BagaM8 60iI 282 204 10 " <Ii) OI;her Power 1 1
II_Ma.ual 374 207 1.55 8
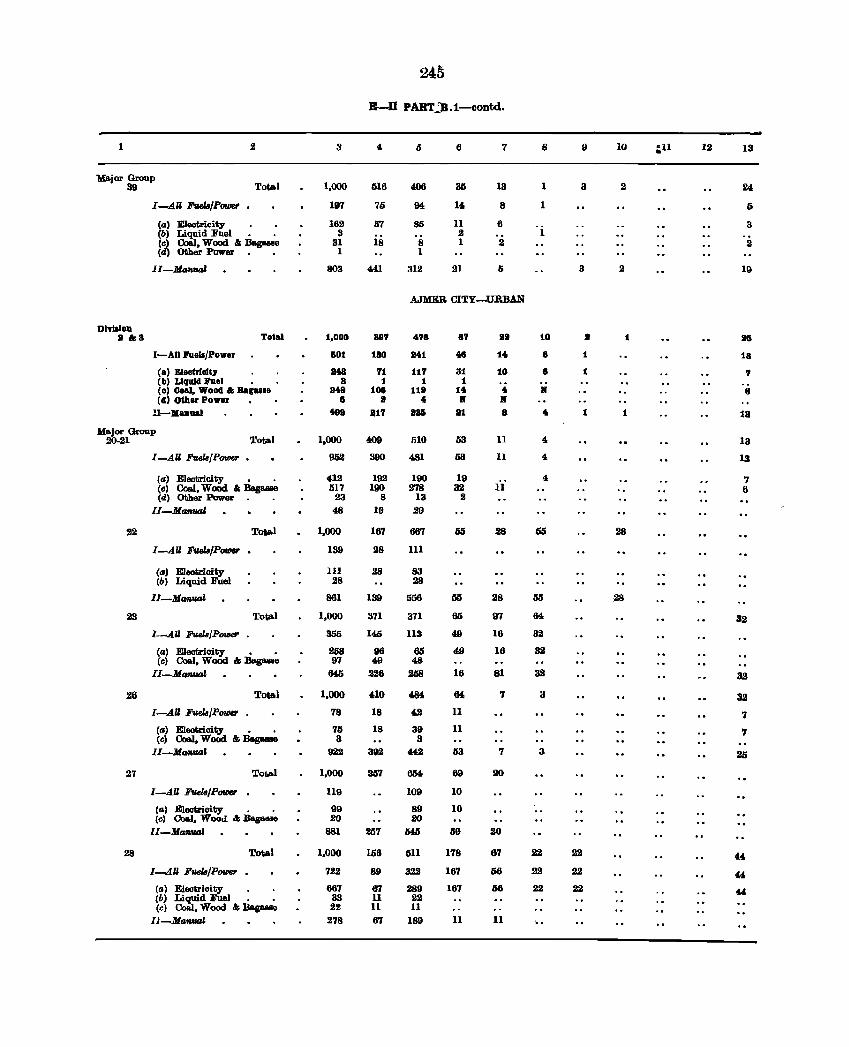
24:~
B-D PART..:_'"B.1-contd.
1 2 3 6 7 8 9 10 :.ll 12 13
'Major Group 39 Total 1,000 616 406 36 13 1 3 2 24
1--.4" FveJa/P_ 197 70 94 14 8 1 5
(a) Electricity . . 162 57 85 11 6 3 (b) Liquid Fuel • . 3 2 1 (c) Coal, Wood & Baguae 31 18 8 1 2 2 (d) Other Power 1 1
II-Ma-.l 803 441 312 21 5 3 2 19
AJMER CITY-URBAN
DlylJlon II &3 Total 1,000 8117 476 67 1111 10 II 1 115
I-All .,n .... /Power 501 180 841 46 14 6 1 13
(a) BI.eUlor&lI 1148 11 111 31 10 8 1 7 (b) L1qaJd :ruel 8 1 1 1 (c) Coal, Wood & Baru •• 1149 108 119 14 4 II 41 (d) OOl.r Power 8 II 4 II ..
ll-llilanual 499 1117 885 111 a 4 1 1 1a
Major Group 20·21 Total 1.000 409 510 53 11 4 13
I -All Fuel8fP- 952 390 481 53 11 4. 13
(a) Electricity • . 412 192 190 19 ii
4. 7 (c) Coal, Wood & Bag- 017 100 278 32 6 (d) Other Power 23 8 13 2
II-Mtm'IIM 48 19 29
22 Total 1.000 167 667 55 28 55 28
I-All FveJa/P_ 139 28 111
(a) EJootrioity 1I1 28 83 (b) Liquid Fuel 28 28
lJ-Ma~ 861 139 556 50 28 55 :28
23 Total 1,000 371 371 65 97 64 32
I---tU Fuel8/P_ 355 145 113 49 16 32
(a) Electricity • • 258 96 65 49 16 32 (c) Coal, Wood & Bagaaae 97 49 48
II-Mtm'IIM MD 226 258 16 81 32 32
26 Total 1.000 410 484 64. 7 3 32
I-AU Fuel8/P_ 78 18 42 11 7 (a) Electrioity • • 75 18 39 11 7 (c) Coal, Wood & Bagaaae 3 3
Il-Maf4ual 922 392 442 63 7 3 25
27 Total 1,000 257 654 69 20
l-AU Fv.el8/P_ 119 109 10
(a) Electrioity . . 99 89 10 (c) Coad, Wood & Bagaaae 20 20
II-MaRual 881 257 545 59 20
28 Total 1,000 156 511 178 67 22 22 4.40
l-AU FueIa/P_ 722 89 322 167 56 22 22 44 (a) Electrioity . . 667 67 289 167 116 22 22 44 (b) Liquid FueJ . • 33 11 22 (cl CoM, Wood. & Bag_ 22 11 11
ll-MaRual 278 67 189 11 11
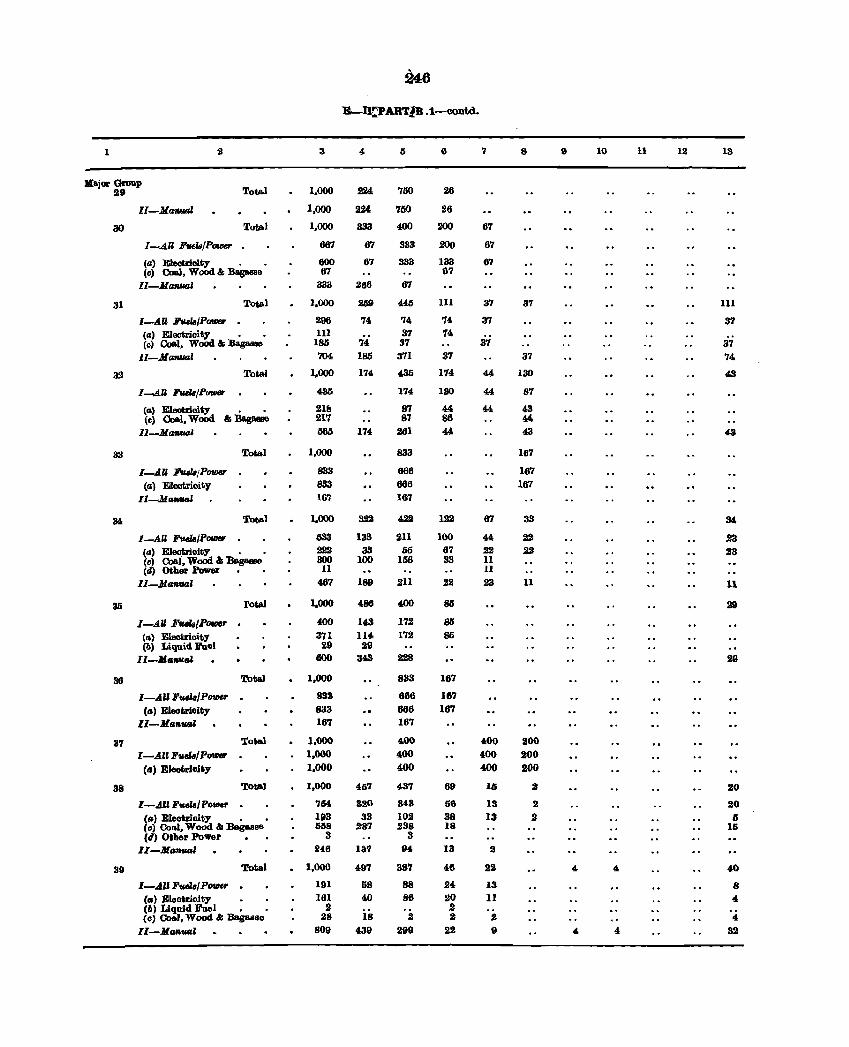
246
B-n~PARTlB .1-contd.
1 3 4- Ii 6 7 8 I} 10 11 12 13
•• jar GrouP 29 Tot&ol 1,000 22d, 750 26
lI-Ma1&'IIfJl 1,000 2U 750 26
30 Total 1,000 333 400 200 67
I-AU Fuels/Power 667 67 333 200 67
(a) Electrioity . • 600 67 333 133 67 (e) CoaJ, Wood & Bap!8e 67 67
II-Ma1&uaJ 333 266 67
31 Tot;al 1,000 2aD 446 111 37 37 111
I-AU FtleUjP_ 296 74 74 74 37 37 (a) Electricity • • 111 37 74 (a) Coal, Wood & Bagasse 186 74 37 37 37
ll-Ma_1 704 186 371 37 37 74
32 Tot&ol 1,000 174 43D 174 44 130 43
I--AU Fvd8/P_ 43li 174 130 44 87
(II) Eleotrioity 21& 87 44 44 43 (c) 00&1, Wood & Ba.gaaae 217 87 86 44
ll-lJla_' Il6D 174 261 44 43 43
33 Total 1,000 833 167
I-.AU FveJs/p_ 833 666 167 (a) Eleotrioity 833 666 167
Il-.MllRUIJl 16'1 167
M Tot;al 1,000 322 422 122 67 33 34
I-AU Fvela/P- 033 133 211 100 44 22 23 (a) EleotrioillY • • 222 33 65 67 22 22 23 (~ Coat, Wood & lIagaase 300 100 156 33 11 ( ) Other Power ' , 11 11
lI-Ma_I 467 189 211 22 23 11 11
35 fotal 1,000 486 400 85 29
I-All FwlBlPov;er . (()() 143 172 85 (a) Electricity 371 114 172 86 (b) Liquid Fuel 29 29
lI-Manuai 600 34S 228 29
38 Total 1,000 833 167
I-AU Fvd8/PtJ?Ur . 833 866 187 (a) Eleotrioity 833 666 167
II-Mallval 167 167
37 'Io.,.l 1,000 400 400 200
l-AUF"eH/P~er 1,000 400 400 200 (a) Eleotrioity 1,000 400 400 100
38 Total 1,000 41i7 437 69 Iii :I 20
I-All Fuela/P_ 7M 320 3'3 56 13 2 20 (a) Eleotrioity • • 193 33 102 38 13 2 IS (e) Co .. l, Wood II Bagasse 658 287 lI38 18 16 (d) Other Power 3 3
II-Ma_a' lI46 137 94 13 :I
39 Total 1,000 497 387 46 22 4. 4. 40
I-AIIF"UII/P_r . 191 58 88 24 13 8 (0) Eleotrioity 161 40 86 20 11 4 (6) Liquid Fuel , 2 2 (e) Coal, Wood ... Bagasse 28 18 2 :I .2 4
II-Ma,,_1 809 439 299 22 9 4. 4 32
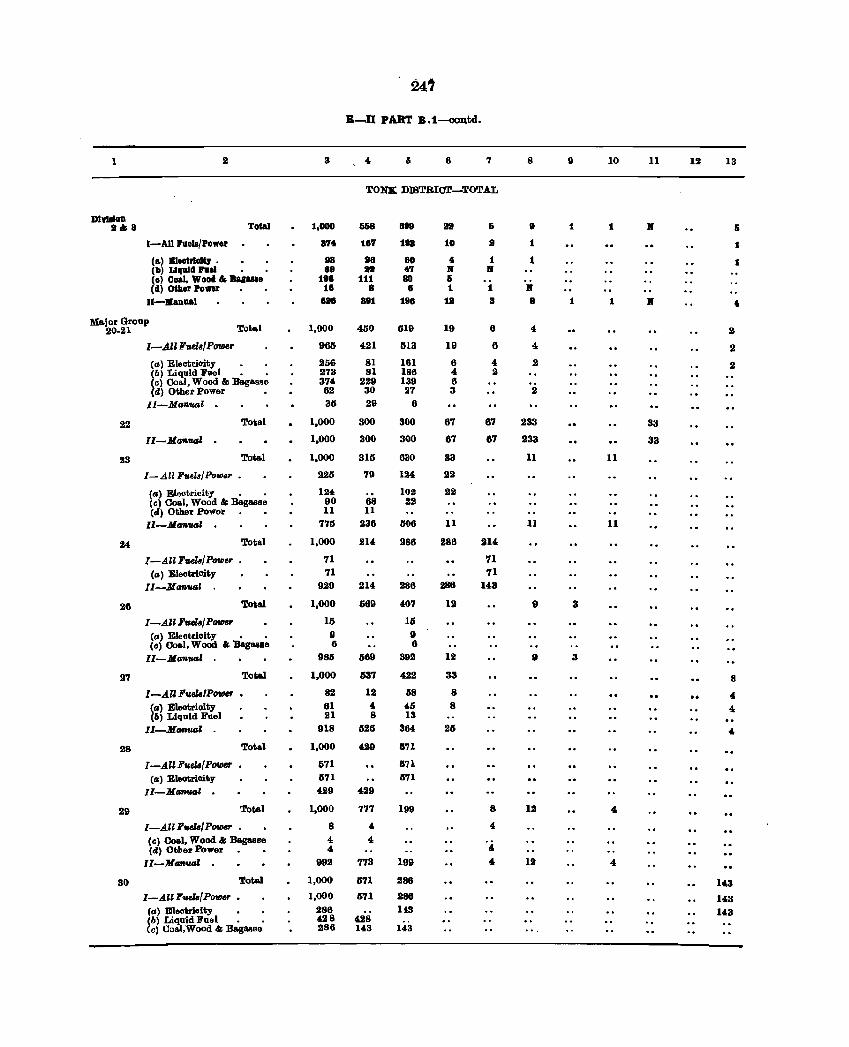
24'
E-II PART B.1-o0Qtd.
1 2 3 4 5 6 7 8 9 10 11 12 13
TONK DISTRIOT-TOTAL
Dhillon •• 8 Total 1,000 558 889 n Ii 9 1 1 II Ii
I-AU ruels/pow8l" 874 187 188 10 a 1 1
(a) BleotrlolQ . 98 .8 eo 4 1 1 1 (II) LlIIWIL he! 88 lIB 47 111 111 (0) Coal. Wood &5 Bag .... 198 111 80 5 (d) Oib,er Power 18 8 8 1 1 II
I1-lIanual 8118 881 188 1. 8 8 1 1 111 40
Ma.jor Group Toal 1,000 450 G19 19 6 4 20-21 :&
I-All Fuel8! POlDer 965 421 513 19 6 4 2
(a) Electricity 256 81 181 6 4 2 2 (b) Liquid F .... I • • 273 81 186 4 2 (c) Co8oI, Wood & Bagasse 374 2211 139 6 Cd) Other Power 62 30 27 3 2
Il-Ma'NUa.' . 35 29 6
22 Total 1,000 300 300 67 67 233 33
II-MCJ1&ua' - 1,000 300 300 67 67 233 33
23 Total 1,000 315 630 33 11 11
I-AI! Fuels/Pollle,. • 225 79 124 22
(a) Eleotricity . • 124 102 22 (c) Ooal, Wood & Bagasse 90 68 22 (d) Other Power 11 11
I1-Mo"ua' 775 236 506 11 II 11
24 Total 1,000 214 286 286 214
I-AI! Fude/ PotIJer 71 71 (a) Eleotrioity 71 71
II-Jlo_1 929 214 286 286 143
26 ~al 1,000 569 407 IS 9 3
I-All Fude/P_ 15 Ui (a) Eleotrioity • • II 9 (c) Coal, Wood '" BagasBe 6 6
II-Ma."_' 985 569 392 12 9 3
27 ToW 1,000 537 422 33 8
I-All FutlBIP_ 82 12 18 8 4 (II) Eleotrioity 61 , 45 8 4 (b) Liquid Fuel 21 8 13
I1-JL __ 1 918 525 36' 2a 4
28 Toal 1,000 429 1S'11
I-AU Fuw!P_ 571 IS'll
(II) Eleotrioity 5'11 1S71 II-Mo_1 429 429
29 Total 1,000 777 199 8 12 4
I-All Fude/ POlDer 8 4 4 (c) Coal, Wood & Bagasse 4 4 " (d) Otber Power _ - 4
Il-Ma1&UtJl 992 773 199 4 12 4
30 ToW 1,000 571 286 143 I-AUFuelB!POtIJer _ 1,000 1571 286 143 (0) Eleotrioity • • 286 US 143 (b) Li2.Uid Fue I • . 428 428 (c) Co ,Wood & Baguse 286 143 143
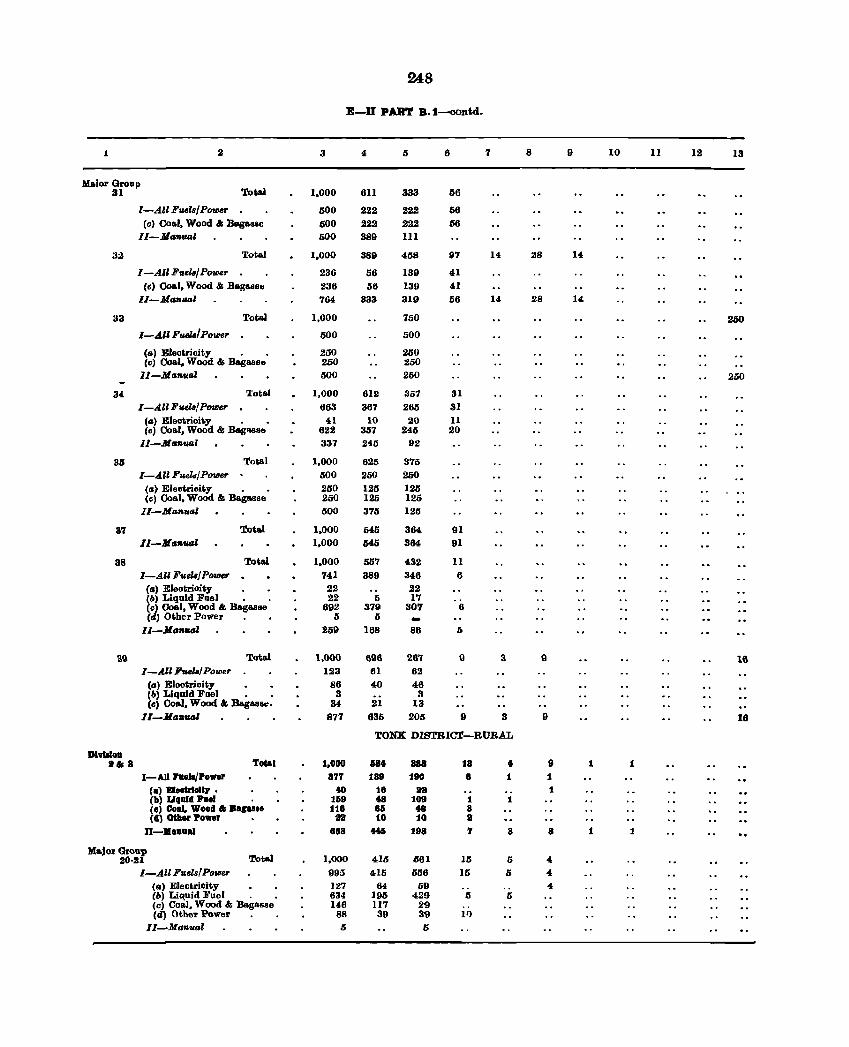
248
E-II PAll'l' B.1-oontd.
l 2 3 4 5 6 7 8 9 10 11 12 13
,MaiorGroap Tot.al 31 1,000 61I 333 56
I-All Fuela/Powef' 500 222 222 56 (c) Coal, Wood"" Bag_e 500 222 222 56
II-Mafl_l 500 389 111
32 Total 1,000 389 41S8 07 14 28 14
I-All Fuela/ Powe,. 236 56 139 41 (c) Coal, Wood .... BaglldJso 236 56 139 41
II-Manual 764 333 319 66 1<& 28 1<&
33 ToW 1,000 750 250
I-All Fuela/Power 500 500
(a) Eleotrioity • • 250 250 (c) Coal, Wood '" BagasS8 250 250
II-Manual 500 250 250
34. Total 1,000 612 357 31 I-All Fuelal Power 663 367 265 31
(a) Electricity . • 41 10 20 11 (c) Ooal, Wood .... Bag"B@8 622 357 2<&5 20
lI-MaflUfJI 337 245 92
35 Total 1,000 625 375 I-All FueldlPOIJJef' 500 250 250
(a) Eleotriaity • • 250 1211 1211 (c) Coal, Wood .... Bagasse 250 125 125
II-Manual 500 375 125
37 Total 1.000 545 364 91 II-M a",1JfJI 1,000 545 364 91
38 Total 1,000 557 432 11 I-All FUelaj Power 741 389 346 6
(a) Eleotrioity 22 22 (b) Liquid Foel • • 22 5 1'7 (c) (loal, Wood"" Bagasse 692 379 307 6 (d) Other Power 5 5
.ll-Jla",uaI 259 168 86 I)
39 Total 1,000 696 267 9 3 " 16 I-All FueIBl Power 123 61 62
(a) Elootrioit.y 86 40 46 (b) Liquid Foel • • 3 3 (c) Ooal, Wood"" Bagass". 34 21 13
II-Man1JfJl 877 635 205 9 3 9 18
TONK DISTIUC't-RURAL
DI9IIloil .& 8 To"l 1,000 118. 888 18 • 9 1 1
I-AU Paell/Power 877 189 190 8 1 1
(a) BlaetrloUy • to 18 118 1 (b) Llqald II'IIaJ • 159 4a 109 1 1 (0) Coal, Wooll 01; Bagu.e 118 85 t8 8 (II) OIlier Po".r 118 10 10 8
n-Manual 888 4t5 188 7 8 8 1 1
Ma.jorGroup 20·21 Total 1,000 415 561 15 5 4
I-All FueIB{Power 995 <&15 556 15 5 4 (a) ElectriCity 127 64 59 4 (b) Liquid Fuel . . 634 195 429 5 5 (c) Coal, Wood & Bagas80 1<&6 117 29 (d) Othe-r Power 88 39 39 11)
II-Manual 5 I)
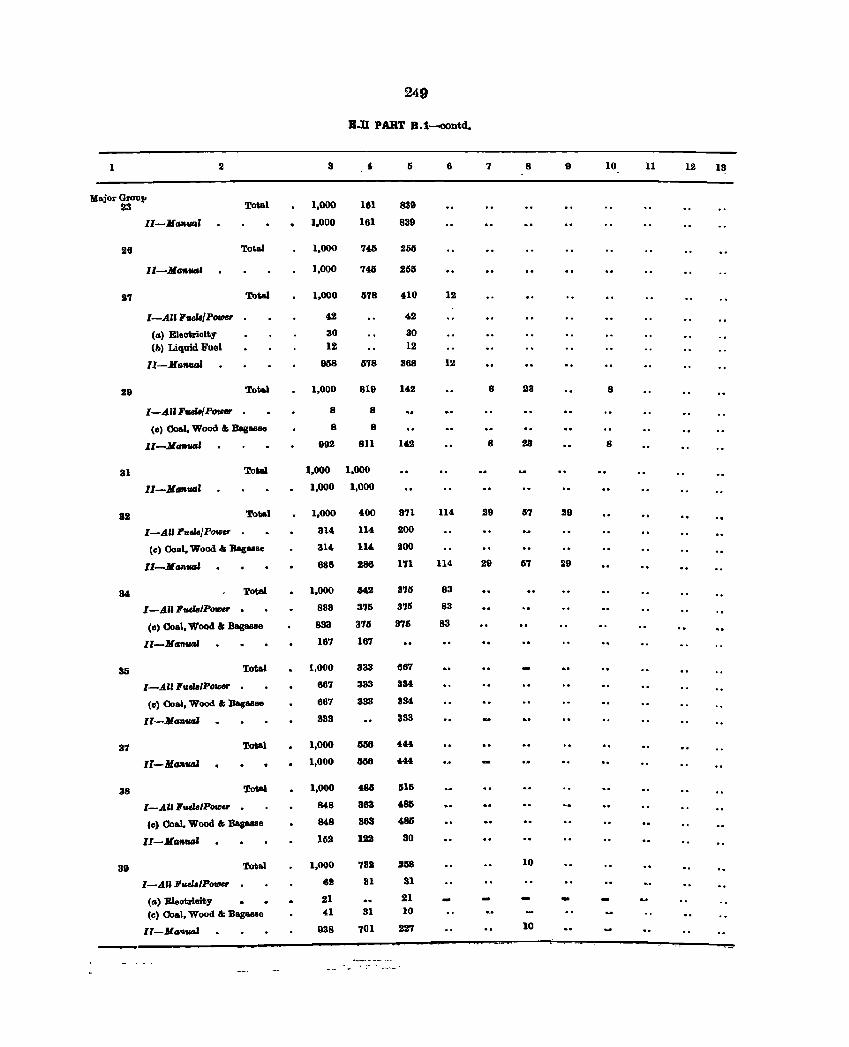
249
B.n PART B.1--oontd.
1 2 3 4 5 6 7 8 9 10 11 12 13
Major GroUI' 23 Total 1,000 181 839
Il-MII",,"d 1,000 161 839
28 Tot.l 1,000 746 265
ll-Ma"",,' 1,000 745 2155
17 Total 1,000 1578 410 12
I-All FuelB!POtHr 42 42
(II) Eleotriolty 30 30 (b) Liquid Fuel 12 12
II-Ma""'" 058 578 368 12
29 Total 1,000 8UI 142 8 23 8
I-AIIF&d8(P_ 8 8
(0) Coal, Wood &; BagUBO 8 8
II-M""",,1I 992 811 142 8 23 8
31 To'al 1,000 1,000
1,-j[(JfI.U4Z 1,000 1,000
81 Total 1,000 400 371 114. 29 57 29
I-AU F"daJP(IUlt;F 314 114 200
(c) Coal, Wood 4: Baguse 314 114 200
1'-MII'I&"'" 688 288 171 114. 29 67 29
34 Total 1,000 M2 3711 83
I-AU FvdaIP(IUlt;F 833 376 375 83
(0) 00.1, Wood &; .Ba.ga.slo 833 3711 376 83
II-Mil""'" 167 167
35 Total 1,000 333 667
I-All Fuels/Po_ 667 383 334.
(c) Coal, Wood 4: ~UBe 667 333 334
II-Mil"""" 833 333
37 'lot&l 1,000 658 444
IC- j[ 1I'It"'" 1,000 15116 444
38 Tot&l 1,000 483 1516
I-All FveIB/P(IUl&r . 848 363 486
(c) Coal, Wood &; Bag&8ao 848 363 486
II-M II'ItUtJI lIS2 122 30
39 ro.al 1,000 732 1118 10
I-AU Pv&I,IPower 62 31 31
(II) Eleotrloity 21 21 -(c) Ooal, Wood & Baguao 4.1 31 10
II-MII"""I 938 701 227 10
~
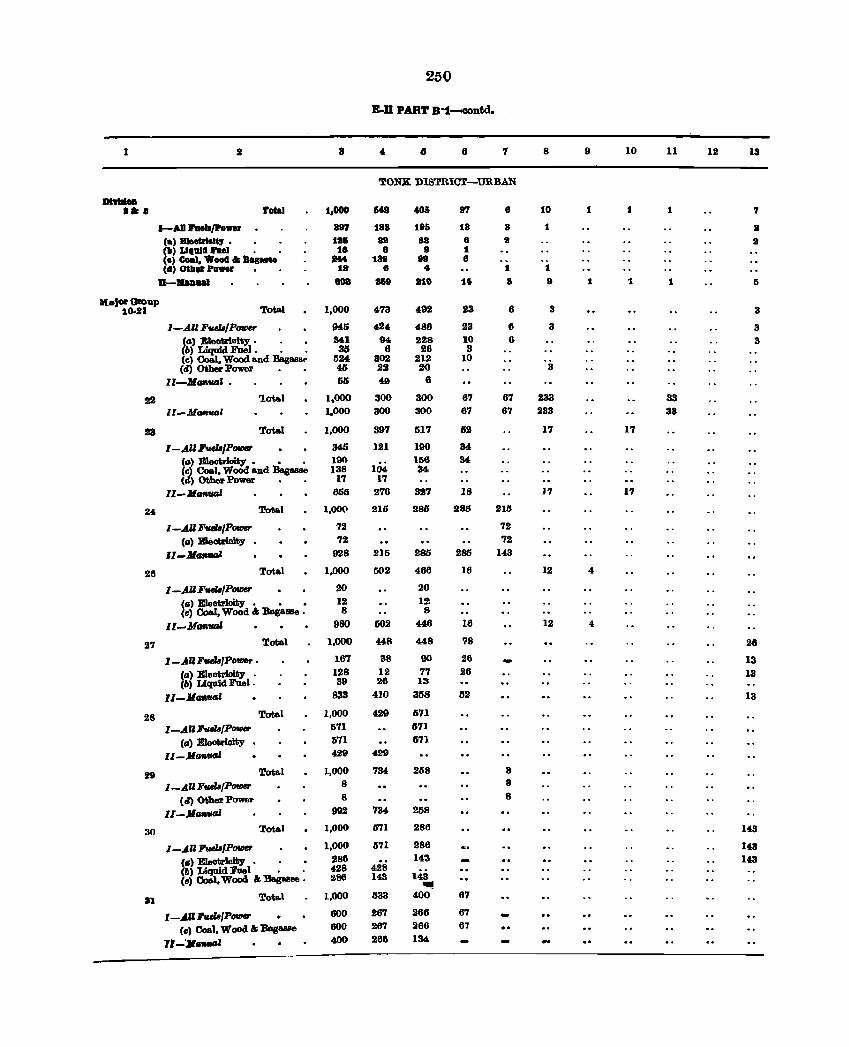
250
E-D PART B"t-contd.
1 a ~ 4 8 7 8 9 10 11 12 13
'rONX. DISTRICT-URBAN
DttIIloa •• 1 Total 1,000 11M 405 I'T 8 10 1 1 1 7
1-A11 raelJ/power 897 188 1&& 18 8 1 II
(.)~. tll5 lIB 8a a II II (.) Llllllllll'ael • 1. • 9 1 (a) Coal, "0011 " IaIuae 1M t88 89 8 (d) 001. Power 18 a 4 1 1
U-lbDaI 808 S&t MO tl 8 t 1 1 1 5
JI[.j~ QIoup 2.(MII Total 1,000 473 492 23 6 3 3
I-A.U Fud81P_ 945 424 486 23 6 3 3 (a) Eleotriclty • . • 84,1 94 228 10 8 3 (6) Liquid Foel • • • 30 6 26 3 (cl Coal, Wood and Bagasse 524 302 212 10 (d) Other Power 40 22 20 3
II-M_I. 55 49 6
22 l.otal 1,000 300 300 67 67 233 33 ll-M __ I 1,000 300 300 67 67 233 33
23 Total 1,000 397 517 62 17 17
I-A.U Fud8JP- 345 121 190 34
(a) Eleotrioity • • • 100 11)4
156 34 (cl Coal, WoOd and Bagasse 138 34 (d) Other Power • • 1'7 17
11-ltl __ ' aM 276 327 18 J1 17
24 Total 1,()()() 2IG 286 283 215
I-AU Fud81P_ 72 72
(a) EIeotrioity 72 72
ll-MGIItIGl 928 215 285 285 143
26 Total 1,000 502 466 16 12 4
I-AU Fud81P_ 20 20 (a) Eleotrioity. • • 12 1:2 (c) Coal, Wood &; BagallSe . 8 8
1,-M_uaJ 980 502 446 16 12 4
27 Total 1,000 448 448 78 26
l-AIIFud81PotDI, • 167 38 00 26 13 (a) Eleotrioity . 128 12 77 26 13 (6) Liquid FUel . 39 26 13
ll_ltl_wl 833 410 358 52 13
28 Total 1,000 429 671
I-All Fud&fPotDer 671 571
(a) E1eotrioity 671 671
II-ltllJ'fltMJl 429 429
H Total 1,000 734 258 8
l-A.IlFurlafP- 8 8
Cd) Other Power 8 8
Il-Jl-' 992 734 258
:10 Total 1,000 571 286 If3
l-~n FudillPotDIr 1,000 571 286 1&3
(a) ElecJt;ricity • 288 143 1&3 (ll) Liquid 1!'ae1 • . 428 428 (e) Coal, Wood ... »ague . 286 143 143
III! :n Total 1,000 533 ~O 67
l-AII7urla/P_'" 600 267 266 67
Ccl Coal, Wood I; BagBllPe 600 267 266 67
"lI-lIl1tH1G' 400 266 134
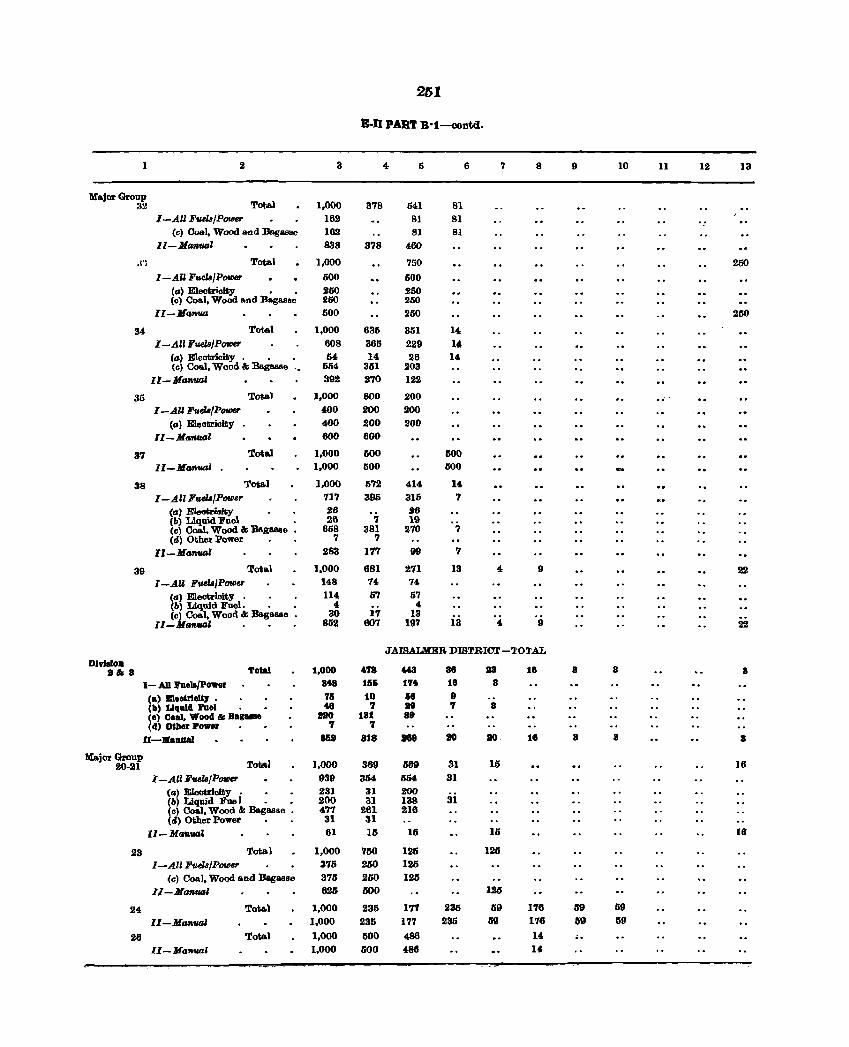
261
E-D PART B·1-contd.
1 2 3 4 5 6 8 9 10 11 12 13
Major Group Total 32 1,000 378 541 81
I-AU Fu.el8/P(1UJ6r 162 81 81 (c) Coal, Wood and Bagasse 162 81 81
11-Alan_' 838 3'18 460
I" .. Total 1,000 750 250 I-An Fu.el8JP(1UJef' 500 500
(a) Electrioity " 250 250 (c) Coal, Wood and Baga.s.e 250 250
Il-Man'UIJ 500 250 250
34 Total 1,000 635 351 14 I-All FudBJP(1UJef' 608 365 229 14
(a) Electricity. • 54 14 26 14 (c) Coal, Wood & Bag .... e 554 351 203
11-Ma7l'UlJZ 392 2'10 122 .. 35 Total 1,000 800 .200 ..
I-All FuelslPOfI}(!I 400 200 200 .. (a) Eleotricity 400 200 200
II-M_l 600 600
3'1 T~a1 1,000 GOO 500 II-Ma7l'UlJl 1,000 500 500
38 Tota-l 1,000 572 414 14 I-All FuelaJP(1UJer 717 395 315 7 (a)~ •• 26 26 (b) Liquid Foel • 26 '1 19 (cl Coal, Wood & :&g ... ae • 658 381 270 7 (d) Other Power '1 '1
ll-MIJ7I'UlJ1 283 177 99 '1
39 Total 1,000 681 271 13 4 9 22
I-AU Fu.el8/P(1UJeF 148 74 74 (a) Electricity . 114 57 57 (b) Liquid Fuel. • • 4 4 (~ Coal, Wood & :&ga.sse . 30 17 13
11- all_' . • • 852 607 197 13 4 9 22
JAISALMER DIBTRI(1.l'-'l'OTAL DlvlsloD
9a. 8 Total 1,000 478 448 86 88 18 8 8 8
1- All hell/Power 848 15& 174 18 8
Co.) Bleetrlelt,. . 715 10 158 9 (b) Llqulll hel 48 '1 ltII '1 8 (e) Coal, Woolla. SaPIA no 18t 89 (cl) Olller Po_ 7 '1
II-.aaaal 8D 818 "8 DO DO 18 8 8 8
Major Group Total 1,000 369 569 31 16 20·21 16
I -All Fuels/P(1UJeF 939 354 554 31 (a) Electricity • 231 31 200 (b) Liquid Fuel • • 200 31 138 31 (c) Coal, Wood & Bag .... e . 477 261 216 (d) Other Power • . 31 31
Il-Mcm'UlJI 61 15 15 15 16
23 Total 1,000 750 125 125 I -All FfMIlalPOfI}8r 376 250 126
(c) CollI, Wood and Bagasse 375 250 125 ll-M_l 625 500 1.25
24 Total 1,000 235 177 235 59 176 119 59
II - Ma7l'UlJZ 1,000 235 177 235 69 176 GO 69
26 Total 1,000 500 486 14 .. II - Ma7ltllJ1 1,000 500 486 14
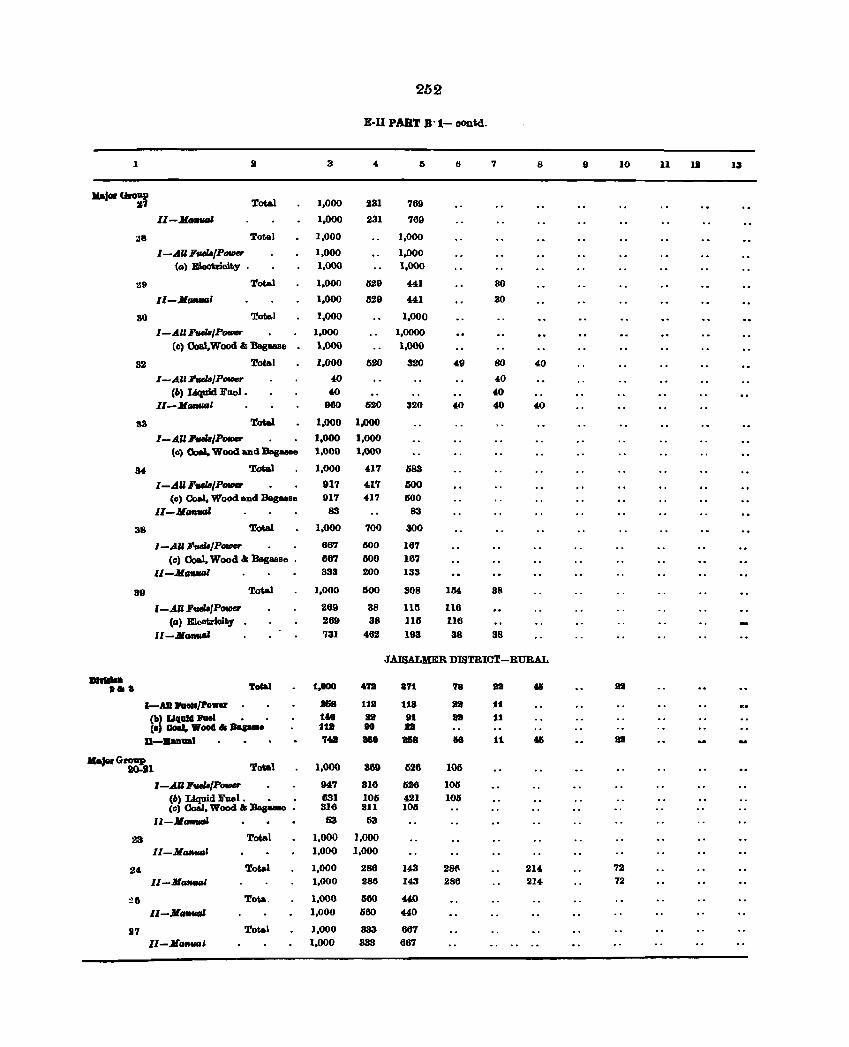
252
E·n PART B'l- oontd.
1 II 3 6 II 7 8 10 11 11 13
Jl.r.jor (boUp 11 Total 1,000 231 769
"-.Jl __ 1,000 231 769
;s8 Total 1,000 1,000
I-AU FtHIB/P_ 1,000 1,000 (0) Eleotrioity 1,000 1,000
::19 Total 1,000 529 441 30 11-.Jl __ 1 1,000 529 441 30
SO Total 1,000 1,000
I-All FtHIB/P_ 1,000 1,0000
(c) Coal,Wood" &.g888e 1,000 1,000
32 Total 1,000 520 S20 49 SO 40
I-All Fuela/P_r 40 40 (6) Liqaid Fuel • 40 40
11-.Jl_' 980 620 320 40 40 40
!13 Total 1,000 1.000
l-All""/P_ 1,000 1,000
(0) Coal, Wood and :Bas888e 1,000 1,000
34 Total 1,000 417 683
I-AUF..z./P_ 917 417 GOO (0) Coal, Wood and Bag_Be 917 417 GOO
ll-JtCGfIUIIl 83 83
38 Total 1,000 700 300
l-AUF.z.JP- 667 600 167
(0) Coal, Wood" Bag_se . 867 600 187
1I-.IIas_ 333 200 133
311 Total 1,000 1100 308 1M 38
I-AU Fuela/P_ 269 38 1111 116
(a) BIcotrloili1 269 38 116 116
ll-.Jl--' 731 462 193 38 38
JATSALMER DISTRICT-RURAL
m ...... ToeaJ 1,000 ...,. 871 ••• 78 9It • 9It
I-AD .... /Po- 3&8 1111 118 III 11
(Ill U,ldd ... 1 • . 1141 l1li 81 l1li 11 (I Onl. Wood '" Bap ... 11S 80 aa
D-.aIl1lll1 .,. .., 8&8 116 11 411 81
IIaJGr Group 20-11 Total 1,000 389 626 106
l-AU,..'PatDer 947 316 G26 lOG (6) Liquid Fuel • • 631 1011 421 1011 (0) Oo8J, Wood. & Das- 316 211 1011
ll-JrGIHIIII 63 53
23 Total 1,000 1,000 ll-.Jla __ 1 1,000 1,000
24 Tolial 1,000 286 143 28f1 214 72
II-Mo_' 1,000 280 143 286 214 72
:!CI Tota. 1,000 660 440 11-.JlGftVGl 1,000 560 440
lI7 Total 1,000 333 667
11-1Ia_1 1,000 333 667
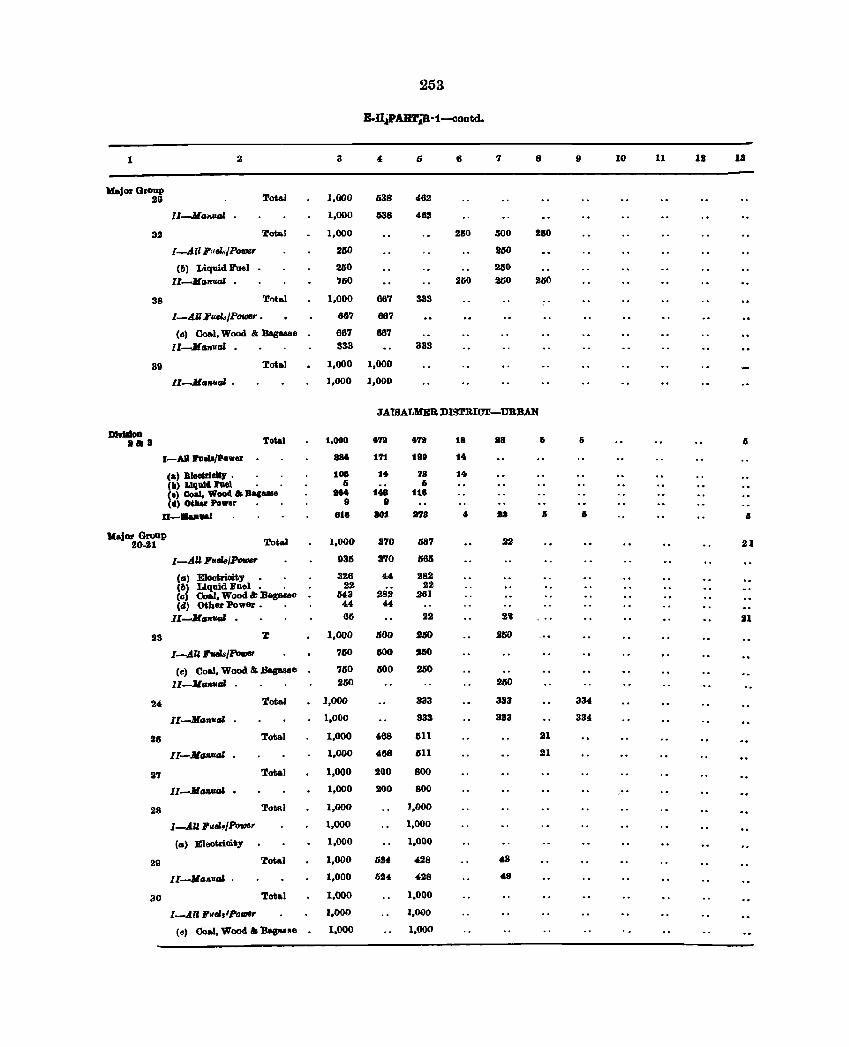
253
B.n~pAB'l';a·i-OODtd.
1 2 3 6 6 7 8 9 10 II 1.8 13
Kajor Group to Total 1,000 638 462
[l-Manual. . 1,000 638 462
32 Tota.l 1,000 2110 500 150
I-All PtltkiPorDer 250 2110
(6) Liquid Fuel 2150 150
Il-MrnuaJ • 150 250 150 2110
38 Tota.l 1,000 681 333
I-AU PII.d4PorDer • 687 687
(c) Ooa.I, Wood & Ba.ga.ase 667 887
[I-Manua! • 333 333
39 Total 1,000 1,000
II-Me ..... al . 1,000 1,000
JAISALMER DISTRICT-URBAN
DI .... OD Telal •• 3 1,000 .7111 .7111 18 lII. Ii II II
I-All FaeJa/power 881 1'71 laa 14.
(a) BleotriellJ . loe 1. 7. 1. (11) Llqall rael II II (0) Coal, Wood. '" BacUiB HI 148 ttl (d) Other Power 9 9
D-JlaDuJ 81' 801 973 .. .. II II .. Ma.JM Group
20-21 Total 1,000 370 687 22 21
I-AU 1!'UeN/P_ 936 3'70 565
(a) Elootrioity 328 44 282 (6) Liquid Fuol. . 22 22 Co) CoaJ, Wood & Bagasse 643 !l8S S81 Ccl) Othw Power - 44 !l4
II-M1J1I'UGI 815 22 2'1 11
23 T 1,000 500 240 250
I-A"'_/~ 7GO GOO 2110
Cc) 00&1, Wood &. JJaga.sso 760 500 25()
ll-Ji1J1I'U •. 260 2GO
24 Total 1,000 333 333 334
II-MantA. 1,000 333 333 33!l
26 Total 1,000 468 1111 21
II-.JlflflVIJI • 1,000 488 GIl 21
27 Tota.l 1,000 200 800
II-MIJ1JvaJ. • 1,000 200 800
28 TotAl 1,000 1,000
l-.AZl1!'ueJ4Power 1,000 1,000
(a) Eleotrioity 1,000 1,000
29 Tota.l 1,000 624 428 48
Il-Mtl.lIvaJ . 1,000 514 428 48
30 Total 1,000 1,000
I-All rlld.'PofJl8r 1,000 1,000
(e) 00 .. 1, Wood & Baguso 1,000 1,000
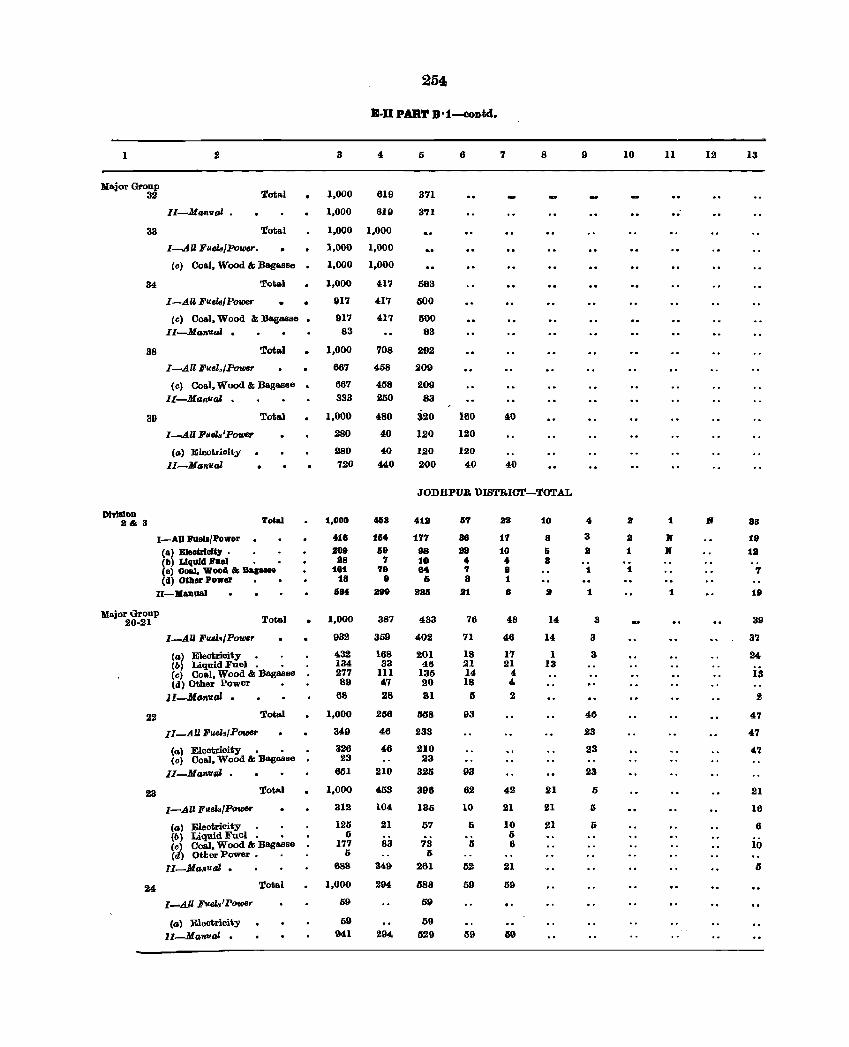
254
B·n PAR'!' S·1-CODtd.
1 2 3 4 5 6 7 8 9 10 11 12 13
Major Group 32 Total 1,000 619 371
II-Manva.! • 1,000 619 371 .. 33 Total 1,000 1,000
I-AU Fuel8/Power. 1,000 1,000
(I) Coal, Wood &; Bagasse 1,000 1,000
34 Total 1,000 417 083
I -AU Fuels/ Power 917 417 500
(c) Coal, Wood &; Bagasse. 917 417 500 II-Manual . 83 83
38 Total 1,000 708 292
I-All Fuel~/Power 667 458 209
(c) Coal, Wood &; Bagasse . 667 458 209 II-Manual 333 250 83
3D Total 1,000 480 320 160 40
I-All Fuels/Power 280 40 1.20 120
(a) Eleotrioity 280 40 120 120 II-Manual 720 440 200 40 40
JODHPUR UISTRIC'l'-TOTAL
Dlvlalon 2& 8 Total 1,000 45S 412 67 liS 10 4 II 1 B 88
I-AU JIIleb/Power 418 164- 177 88 17 8 3 a N 19 (a) EleoUlcJ&, . 809 69 98 lIB 10 6 a 1 N 18 (II) Liquid Fuel • a8 7 10 4 4 8 (0) Goal. Wood&; BaS- 161 79 64 7 8 1 1 7 (d) Other Power 18 9 .& 8 1
II-)[annsl 684 899 a36 lit • a 1 1 19
Major Group Total 1,000 387 433 76 48 14 3 20-21 • 39
I-AU Fu.els/Power 932 359 402 71 46 14 3 3'7
(a) Eleotrioity 432 168 201 18 17 1 3 24 (6) Liquid Fuel. • 134 33 46 21 21 13 (I) Coal, Wood &; Bagasse 277 III 135 14 4 13 (d) Other Power 89 47 20 18 4
lI-MlJn'llal • 68 28 31 Ii 2 2
22 Total 1,000 2116 558 93 46 47
II-All Fuels/Power 349 46 233 23 47
Ca) Electrioity. • 3.26 46 210 .23 4'7 (I) Coal, Wood &; Bagasse .23 23
II-Man'llGl • 651 210 3.25 93 23
23 TotAl 1,000 453 396 6.2 42 .21 5 21
I-An Fllela/P_ 312 104 135 10 21 In 5 16
(a) Eleotricity 125 21 57 5 10 21 5 6 {b} Liquid Fuel. • 6 4)
(c) Coal, Wood &; Bagasse 177 83 73 5 6 10 (d) Otter Power . I> 5
II_MlJnuaJ • 688 349 261 52 21 5
24 Total 1,000 294 588 59 59
I-All Fuela'Pou;er 59 59
(0) Electricity 59 59 ll_Mo"RuaJ. . 941 294 529 59 59
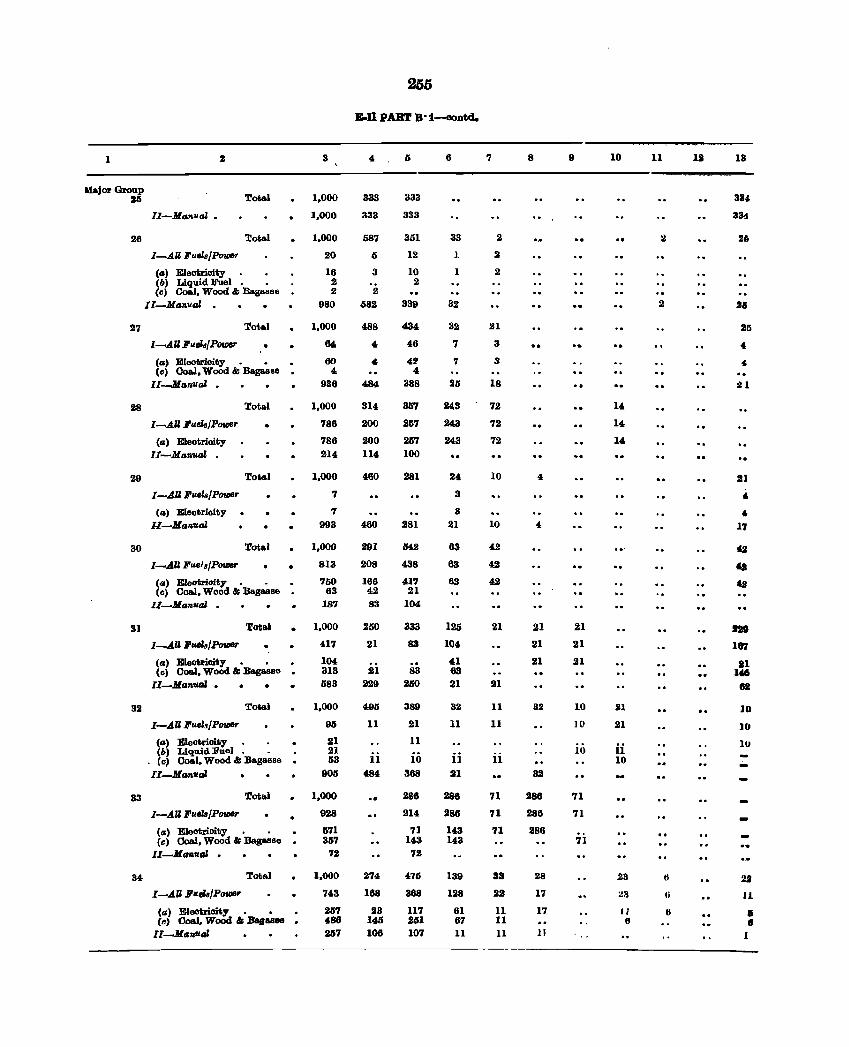
1
HlrojorGroup 211
26
27
Total
II-Manual •
Total
I-AU Fu.el8jPower
(a) Eleotrioity (b) Liquid Fuel. _ (c) Coal, Wood & Bag .... se
II-Manual
Total
l-AII FueJ4Power
(a) Eleotrioity. - _ (c) OoaJ, Wood & Bagasse
II-Manval _
28 Total
29
I-AU Fuels/Power
(a) Eleotrioity II-Ma7w.al _
I-AU Fuels/Power
(a) Electricity U-Manva1.
Total
30 Total
31
32
33
34
l-AU Fuel8JPower
(a) Eleetrioity. . -(c) CoaJ, Wood & Bagasse
II--Ma7lual _
Total
l-AU 1!'u.eltJ/Power
(a) Eleotrioity - • _ (c) CoaJ, Wood & Bagasse
ll-Manval •
Total
I-AU lI'uelJjPower
(a) Eleotrioity (b) Liquid Fuel. . • (c) Coal, Wood & Bagasse
ll-Manual
Total
I-AU FueZ8/Power
(a) Electrioity. • • (c) CoaJ, Wood & Bagasse
II--ManuaJ •
Total
l-AU lI'ueJa/POfl16r
(a) Eleotrioity. • (c) Ooal, Wood " Bagasse
lI--Ma7l:uaJ
3
1,000
1,000
1,000
20
16 2 2
980
1,000
64
60 4
936
1,000
786
786 214
1,000
7
7
993
1,000
813
750 63
187
1,000
417
104 313 583
1,000
95
21 21 53
905
1,000
928
571 357
72
1,000
743
257 486 257
205
E-n PART B-1-OODtd.
4
333
333
587
6
3
2
682
488
4
'" 484
314
200
200 114
460
460
291
208
186 42 83
250
21
21 229
495
11
11 484
274
168
23 145 106
333
333
351
12
10 2
339
434
46
42 4
388
357
257
267 100
281
281
IH2
438
417 21
104
333
83
-. 83
200
389
21
II
10 368
288
214
71 143 72
475
368
117 251 107
6
33
J.
1
32
32
7
7
25
243
243
243 .. 24
3
3
21
63
63
83
125
104
41 63 21
32
11
11 21
288
286
143 143
139
128
61 67 II
7
2
2
2
21
3
3
18
72
72
72
10
10
21
21
II
11
11
71
71
71
33
22
11 11 11
8
4
4
21
21
21
32
32
286
286
286
28
17
17
11
9
21
21
21
10
10
10
71
71
71
10
14
14
14
21
21
ii 10
23
:!3
II 6
11 12
2
tI
6
18
334
3k
26
25
21
._.
21
" 4,
17
110
187
11 Ita 82
)0
10
10
2' II
5 • 1
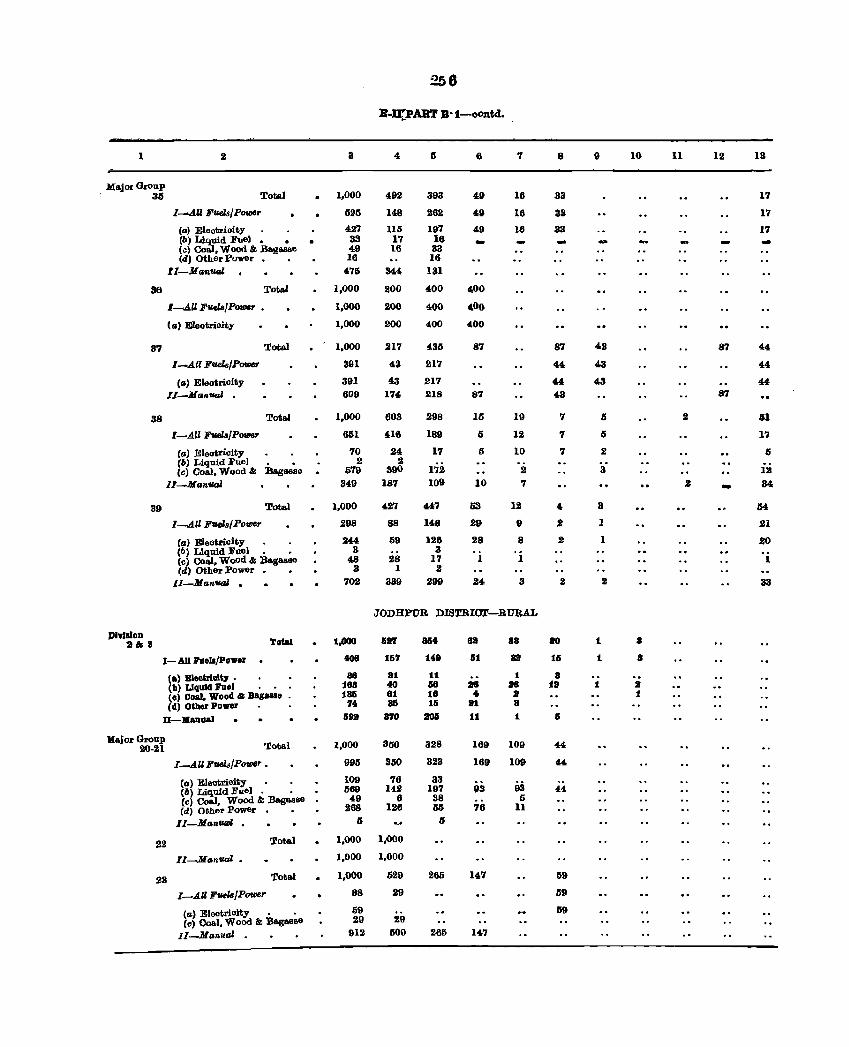
256
:s..O::PAB'l' B·1-00ntd.
1 z 8 4 I) 6 7 8 9 10 11 12 13
MajorOroup 35 Total 1,000 492 393 49 16 33 17
I~AU FlldslPower 5115 148 262 49 16 83 17
(a) Eleotrioity 427 115 197 4.9 16 33 17 (b) Liquid Fuel. • 33 17 18 -(c) Coal, Wood &: Bagllllse 49 16 33 (d) Other Power • 16 16
lI-Manual. 475 344 131
36 Total 1,000 200 400 400
l-AU Fuels/Power • 1,000 200 400 400
(II) Eleotrioity 1,000 200 400 400
37 Total 1,000 217 485 87 87 48 87 44
I-AU Fuds/Power 391 43 217 44 43 44
(a) Eleotrioity 391 43 217 44 43 44
II-MlIlIuaj 609 174 lU8 87 43 87
38 Total 1,000 603 298 15 10 7 I) 2 61
I-AU F'IUla/Powef' 661 n6 189 5 12 7 5 17
(a) Eleotrioity 70 24 17 I) 10 7 2 I)
(6) Liquid Fuel .2 .2 (e) Coal, Wood & Bagasso 579 390 172 2 3 12
II-MlIlIual. 349 187 109 10 7 .2 - 34
39 Total 1,000 427 447 53 12 4- 3 M
l-AU Fuels/Power 298 88 148 29 9 J 1 21
Ca) E1eotrio i ty 244 59 126 28 8 2 1 20 (b) Liquid Fuel. • 3 3 (c) Coal, WoOd &; Bagasse 48 28 17 1 I 1 (d) Other Power. • 3 1 2
II-Manua}, . 702 339 299 24 3 .2 2 33
JODHPUR DISTRICT-RURAL
DlvldoD Total 1.000 52'1 at lIa 88 ao 1 8 2&8
I-All PUo'q/power 408 1117 149 61 88 16 1 8
(a) Bleekl.el~~ • aa a1 11 1 8 (b) Uquld Fuel 1118 40 58 28 116 fa 1 a (0) Coal, Wood &; 8a,8IIIo 185 81 111 t a 1 (d) Other Power 74 85 16 a1 a
D-.anual 5113 870 lI05 11 1 5
Kalar Group Total 1,000 350 328 169 109 44 20·21
l-AU Fvd.!IPowe~ • 995 350 323 169 100 44
(a) Electrieity 109 76 33 93 (6) Liquid Fuel. • 569 142 197 93 44
(c) Coal, Wood &: Bagasse 49 6 38 5 Cd) Other Power. • 268 126 65 76 11
II-Mantl41ll • 6 I)
22 Total 1,000 1,000
I1-Mlln'lJ.lll • 1.000 1,000
23 Total 1,000 529 265 147 59
I-AU FvelB/Power 88 29 59
(II) Eleotrioity • • 59 59 (c) Coal, Wood & Bagasse 29 29
I1-Manual . 912 500 265 147
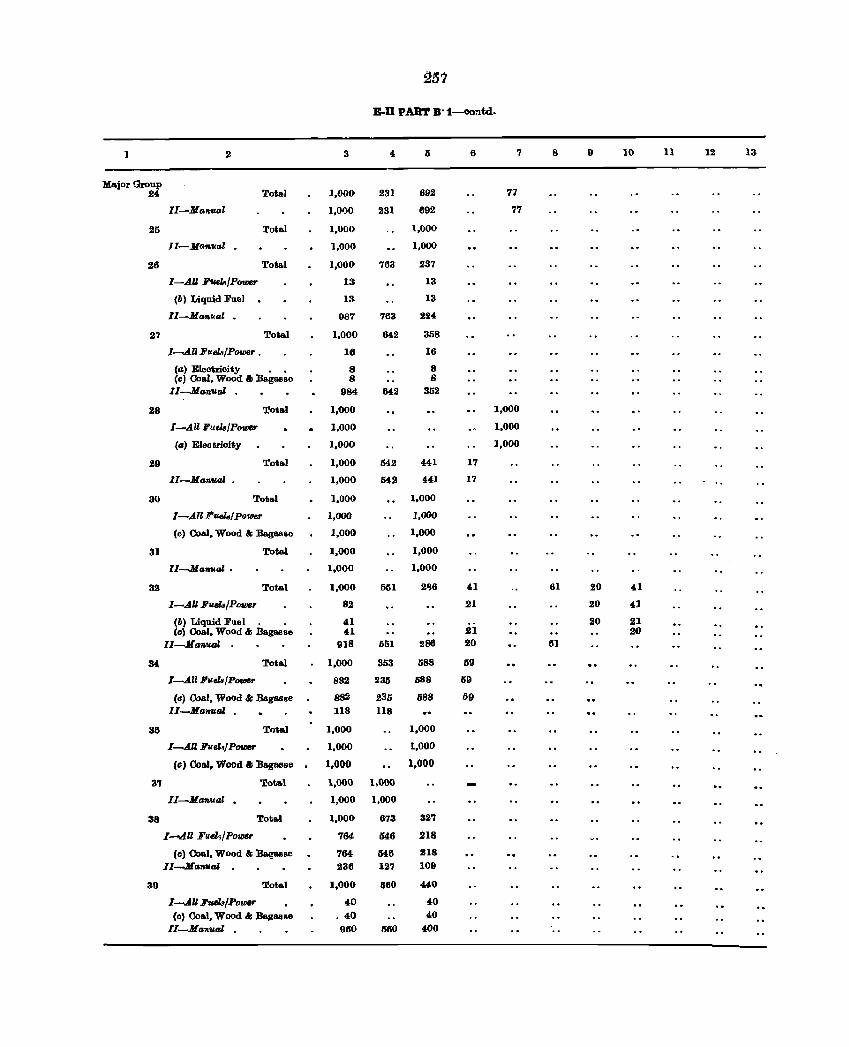
257
E.D PART B·1-ClOntd.
1 2 3 4 5 6 7 8 9 10 11 12 13
Major Group 24 Total 1,000 231 692 77
II-Maltva! 1,01)0 231 692 77
25 Total 1,000 \,000
II-Maflual • 1,000 1,000
26 Total 1,000 763 237
I-A.U Fuels/Power 13 13
(b) Liquid Fuel 13 13
II---JLanual • 987 763 224
27 Total 1,000 642 358
I-A.U Fuel8!Power • 16 16
(a) Electricity •• 8 8 (c) Coal, Wood " Bagasse 8 8
II-Manual 984 642 352
28 Total 1,000 1,000
I-A.U FuelB/Power 1.000 1,000
(a) Eleotrioity 1,000 1,000
29 Total 1,000 542 441 17
II-Manual . 1,000 542 441 17
30 Total 1,000 1,000
I-A.1I J!'UelaI power 1,000 1,000
(c) Coal, Wood" Bagasse 1,000 1,000
31 Total 1,000 1,000
ll-Ma .... al • 1,000 1,000
32 Total 1,000 551 2~6 41 61 20 41
I-A.U FIlMa/Power 82 21 20 41
(b) "Liquid Foel. . 41 20 21 (c) Ooal, Wood" Bagasse 41 21 20
IJ-Mafluol 918 551 286 20 61
34 Total 1,000 353 588 59
I-A.11 FuelalPower 882 235 588 59
(e) Coal, Wood" Bagasse 8~ 236 888 159 II---JLanual • 118 118
35 Total 1,000 1,000
I-A.ll Fuel.! POII18f' 1,000 1,000
(c) Coal, Wood" Bag&8SC 1.000 1.000
31 Total 1,000 1,000
II-Manual • 1,000 1,000
38 Tota.l 1,000 673 327
1-.4.11 Fllel9!Powc,. 764 646 218
(c) Coal, Wood" Bagasse 764 548 218
II-Manval 236 127 109
39 Tota.l 1,000 560 "0
l-A.U :FueZa/Powe,. 40 40
(c) Coal, Wood" Bagasse . 40 40 II-Manual 960 560 400
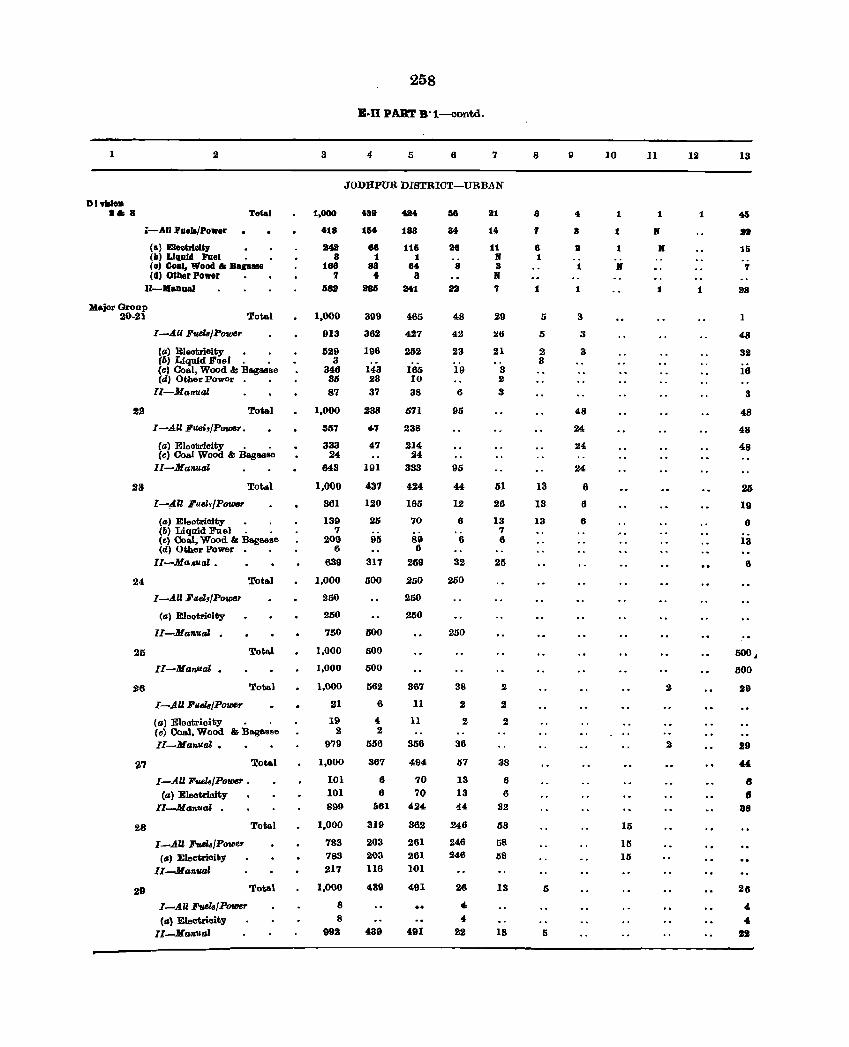
1
D I 'tIIIOD ... a
2
Total
i-All ~ueJ./Power
(a) Eleetrlelt, (II) L1qllfd Fuel . (e) Coal. Wood &; Baga ••• (d) O&ber Power
U-.auuaI
Major Gronp 20-21
22
23
24
25
26
2'1
28
29
'l!otal
I-AU Fuels/Power
(a) EI"otrioity (6) Liquid Foe'. • Cc) 00&1, Wood &; B&gaase Cd) Other power. •
II-MaRual
'l!otal
I-AU F_J/PutD8T.
Ca) Eleotrieity • . Cc) Ooal Wood & Bagasse
II-Man/val
Totllo)
I-All Fuel,/Power
Ca) Eleotrioity • . (b) Liquid Fuel. • (e) ColiI, Wood &; ~1WI8e (d) Other Power
II-Ma.9ual.
I-AU Fuel,IPoWf'r
(a) EJeotricity
II-Manual •
II-Manual.
I-All Fuels/Power
(a) Eleotrioity
'l!otal
Tota.l
Total
(e) Coal, Wood &; BaglloS~e
II-Manual •
I-All FfI£l8jP0W6r •
Cal Electrioity II-Ma1l.'lLal •
I-AU Fue'taIPowef' (a) Electrioity
II-Manuq,Z
Tota.l
Total
Total
I-AU Fue'ta/P01IJ6r (IS) EleCtrioity
II-Man'Ual
3
1,000
418
34B 8
188 7
6sa
1,000
913
629 3
346 36
87
1,000
SIS7
333 24
643
1,000
361
139 7
209 6
639
1,000
250
250
750
1,000
1,000
1,000
!.n 19
2 979
1,000
101 101
899
1,000
783 783 217
1,000
8 8
992
258
E·n PUT B·t-oontd.
4 5 6 7
JODHPUR DISTRICT-URBAN
489
164
88 1
sa 4
286
399
362
196
143 23
37
238
4-7
47
191
437
120
26
95
317
600
500
000
500
562
6
4-2
556
367
6 6
&61
319
203
203 116
439
.l39
484
188
116 1
84 a
a41
465
427
252
165 10
38
li7l
238
214 24
333
424
166
70
89 6
269
250
250
250
367
11
11
356
494
70 70
424
362
261
261 101
491
491
58
34
aa 8
1IlI
48
42
23
19
6
95
95
44
12
6
6
32
250
250
38
2
2
36
57
13 13
44
246
2.l6 246
26
" 4 22
a1
14
11 If a If '1
29
26
21
3 2
3
51
26
13 7 6
25
2
2
2
38
6
6
32
58
58
58
13
13
8
8
7
6 1
1
5
5
2 3
13
13
13
5
5
9
4
a II
1
1
3
3
3
48
24
24
24
6
6
6
10
1
1
1
If
15
15 15
II
1
If
H
1
2
2
12
1
1
13
45 .. 16
7
23
1
48
32
16
3
48
48
48
25
19
6
13
6
500 J
1100
29
29
" 8 8
88
26 , " 12
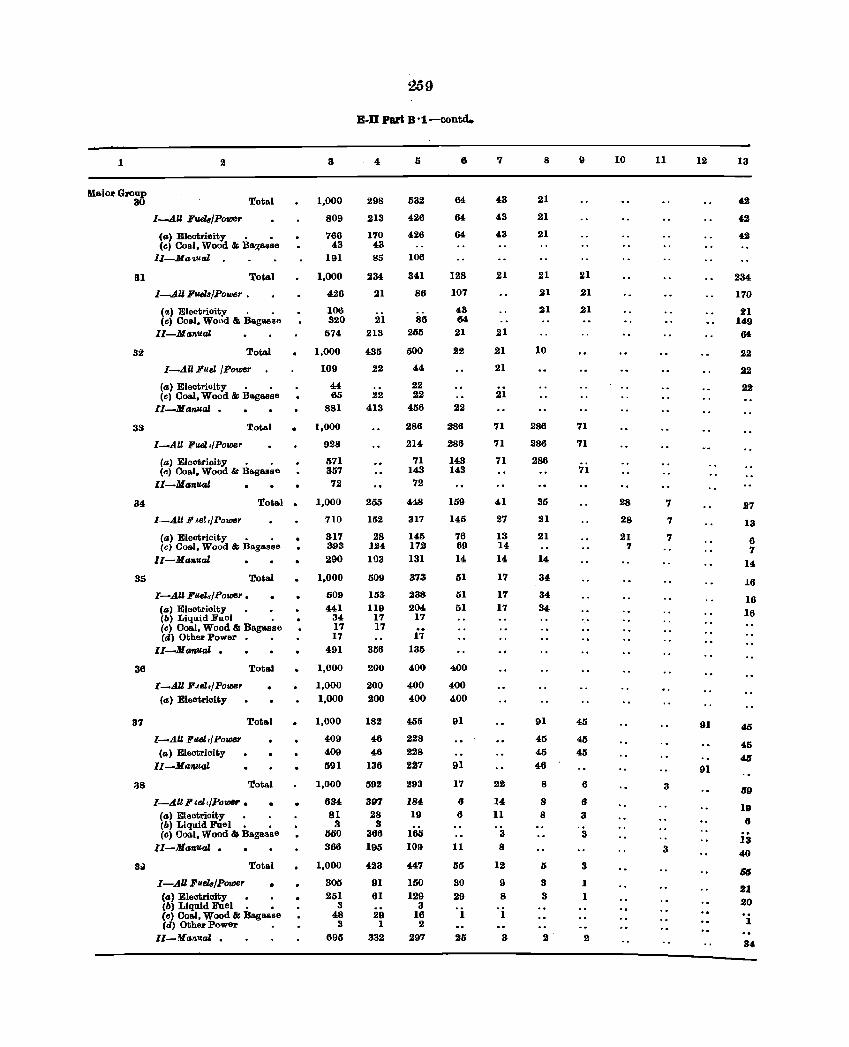
1 2
Ma.ior Group 30 Total
31
32
33
34
35
36
37
!l8
3d
I-AU Fuels/Power
(a) Eleotricity . • (c) Coa.l. Wood & BaglLSse
l1-Ma .. ual
Total
I-AU Fuels/Power.
("', Electrioity . • (c) Co ...... Wond & Bagasae
II-Manual
Total
I-All Fus! /Power
(a) Electrioity • • (~) Coal. Wood & Bagasse
lI-Manual •
Total
I_tilt FuelljPower
(a) Elootricity • • (c) Coal. Wood & Ba,gasse
II-Manulll
Total •
I_AUF.te!,/Power
(a) Electricity • • (c) Coal. Wood & Bagasse
II-Manual
I-AU Fuel./Power • (a) Eleotrioity
Total
(6) Liquid Fllel • (6) 001101. Wood & Bagasse (d) Other Power
II-MfMlulll •
I_AU ]i'Jel4Power
(a) Eleotrioity
I-AU li'uel,/Po'lD8r (a) Eleotrioity
II-Manual
',rotal
Total
Total
I-All Ii' .el>jPo_ • (a) El eotrioity • • (6) Liquid FIlel. • (6) Cool. Wood &I Ba.gasse
II-Manual •
Total
I-AU Fuels/Power • (a) Electricity (6) Liquid Fuel. • (c) Coal. Wood & Bagasse (d) Other power
II-V .. nuaZ •
3
1.000
809
766 43
191
1.000
426
106 320
574
1.000
109
44 65
881
1.000
928
571 357 72
1,000
710
317 393 290
1.000
509
441 34 17 17
491
1.000
1,000 1.000
1.000
409
409 691
1.000
634 81
3 550
366
1.000
305 251
3 48
3
695
259
E·D Pari B ·1-contd.
4
298
213
170 43 85
234
21
21 213
435
22
22 413
255
152
28 124 103
509
153 119
17 17
356
200
200 200
182
46
46 136
592
397 28
3 366 195
423
91 61
29 I
332
I)
532
426
426
106
341
86
86 255
600
44
22 22
456
286
214
71 143 72
448
317
145 172 131
373
238 204
17 .. 17
135
400
400 400
455
228 228
227
293
184 19
165 109
44'7
150 129
3 16 2
297
6
64
64
64
128
107
43 64 21
22
22
286
286
143 143
159
145
76 69 14
51
51 51
400
400
400
91
91
17
6 6
11
55
30 29
I
26
7
43
43
43
21
21
21
21
21
71
71
71
41
27
13 14 14
17
17 17
22
14 11
3
8
12
9
8
1
3
8
21
21
21
21
21
21
10
286
286
286
35
21
21
14
34
34 34
91
45
45 46
8
8 8
5
3
3
2
9
21
21
21
71
71
71
46
45 46
6
6
3
3
3
I I
2
10
28
28
21 7
11
7
7
7
3
3
12
91
91
13
42
42
42
234
170
21 149 64
22
22
22
27
13
6 7
14
16
16 16
46
45 45
69
19
6
ii 40
65
21 20
I
34
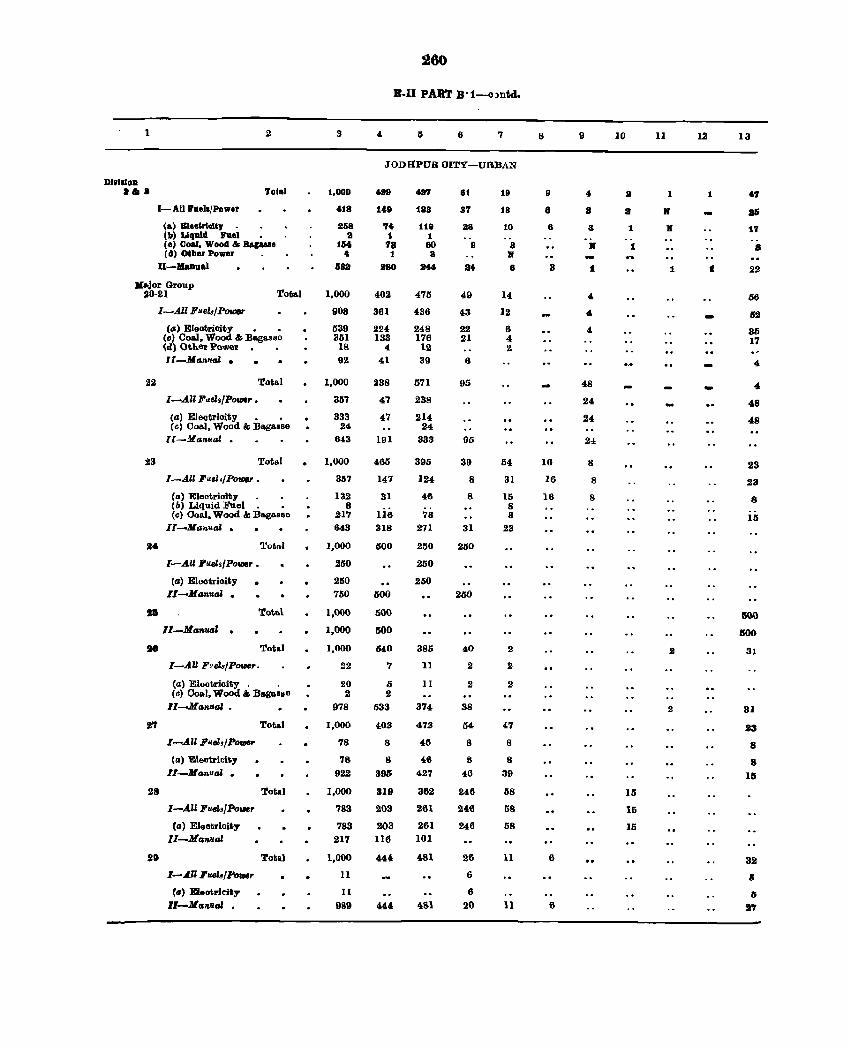
1
DI,llIIoD
••• I-All Pllels/Power
(a) BleeWlolt,. (II) Uquld Fuel
2
Tolal
(0) Coal, Wood'" Bagau. (d) Other Power
U-llaDual
J[ .. jor Group 10-21 Total
I-All Fue'4Pov;er
22
9.
28
(a) Eleotrioity • • (c) Coal, Wood & Bagasse <d) Oth~ Powell lI-Ji{a.nllal •
Total
I-An Paeh/Poll1t.r •
Ca) Electrioity • • (c) Coal, Wood II; Bagasse
II-Manual •
Total
I-All PuelJ/POIDt.r •
Co) Electrioity . (6) Liquid Fuel. • Cc) Ooal, Wood II; Bagasse
II-Manual •
I-AU Puel,{PoVllr •
Ca) EI"otrioity II-Manual •
Tot .. l
Tote.l
II-Man1UJ' •
Total
I-AU FI!ela/Pouer.
(a) Eloctrioity. . (0) Coal, Wood'" Bagasse
II-Manual •
I-All Fuel./Power
(a) Eleotricil;y
II-Man1Jal •
I-All puel../Pow,
(a) Eleotrioity
II-Manllal
l-~U ruel&/Powr
(a) Eleotrlcity
ll-ManllGJ •
Total
Total
Total
3
1,000
418
258 a
1114 , 5sa
1,000
908
539 351 18
92
1,000
3117
333 24
643
1,000
357
132 8
217 643
1,000
250
250 750
1,000
1,000
1.000
22
20 2
978
1,000
78
'78
922
1,000
783
783 217
1,000
II
II
989
260
E-I1 PART B·1-o)ntd.
6 7
JODE{PUR OITY-URBAN
4lt9
149
T4 1 78
1
280
402
361
224 133
4
41
238
47
47
191
465
147
31
U6
318
500
500
500
500
640
7
Ij
2 533
403
8
8
396
319
203
203 116
4440
427
188
119 1 eo II
244
475
436
248 176
12 39
571
238
214 24
333
395
124
48
78 271
250
250
250
385
11
11
374
473
46
4.6
427
362
261
261 101
481
4S1
61
87
28
9
24
49
43
22 21
6
95
95
39
8
8
31
250
250
40
2
2
38
54
8
8
46
246
246
246
26
6
6
20
19
18
10
3 If
6
14
12
6 4 2
54
31
15 8 8
23
2
2
2
47
8
8
39
58
68
58
11
11
8
9
8
8
3
16
16
16
6
6
9
4
a 3
If
t
48
24
24
8
8
8
10
2
2
1
1
15
15
15
11
If
II'
1
2
2
12
1
-
13
47
a6
17
8
22
56
52
35 17
4-
4-
48
48
23
23
8
US
ISOO
500
31
31
23
8
8 111
32
Ii
IJ
"
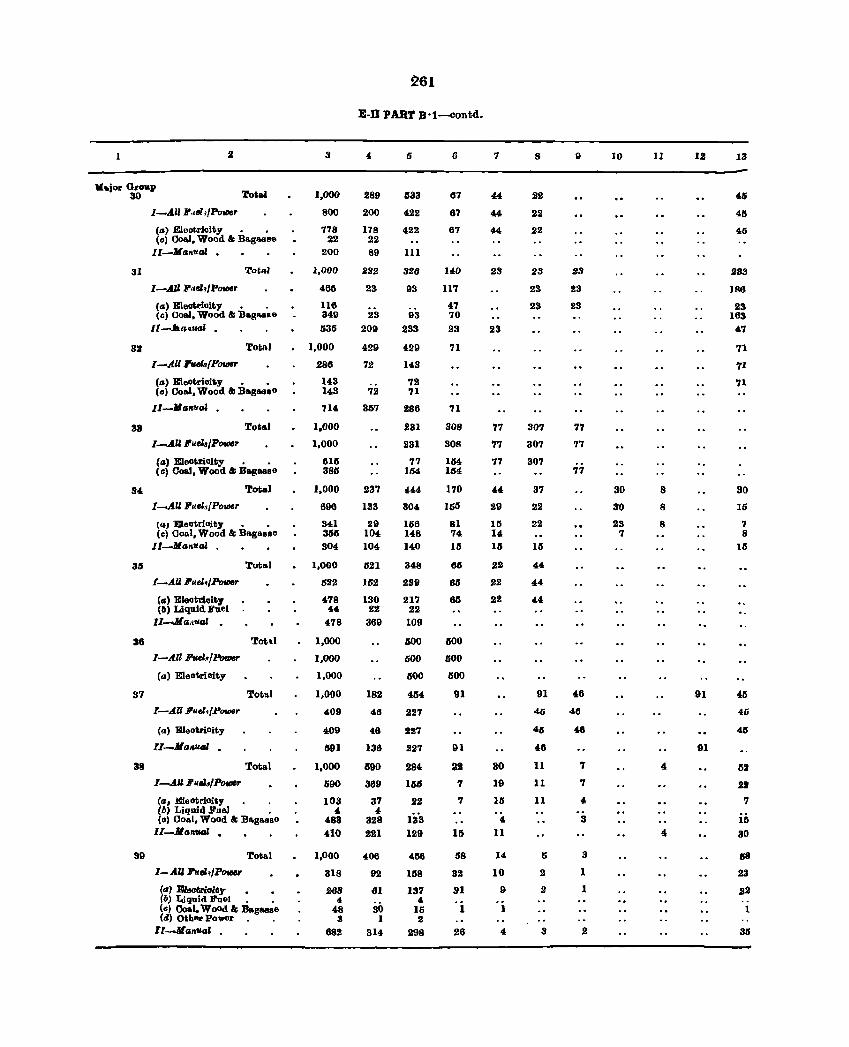
1
31
31
l_AIIlJ',.el./PoVJer
(a) EleotrJoity • • (c) Coal, Wood &: Bllogllosse
II-Mmnual •
'I'o~al
I-AU lJ'lieh/PouIer
(a) BleDtrioity • . (c) Ooal, Wood &: Bagasse
I1-At",,,-' .
Total
I-A.U Yuds{POfIJIIr
(a) BleOtrioity • • (c) Ooal, Wood &: Baga8.e
11-)/111",01 •
33 Total
I_A.U I'uels/P_r
(a) BleoRioit,. • • (c) OoaI, Wood &: Bag .... e
34 Total
35
38
l--.A.U Puel,,/Po1l/Cr
{(II Eleotrioity • • (c) Ooal, Wood &: Baga8Be
II-Manual .
I-A.U lI'uel./Pomer
(IJ) Bleatlioit,. (6) LiquJdFuel
Il-JIII;luGf •
I-All hel~fPoulsr
(IJ) Eleatrialty
Total
Totd
37 'lobI
I-AU lI'u.eli{P""",r
(a) E1eotriOity
ll-MQIIIlGl •
38 Total
I-AU lI'ufIL/Po_,.
(II, .I!l!eotrioity • . l b) Liqmd .Fuel • (c) Coal, Wood &: Bllogall8e
lI-llllntllll •
39 Total
I-AU lJ'uel./P_
M 'Blootriolty fb) I.iquid Fuel. • (c) Coal, WoOd &: Bagasse (tI) Other po_r. .
1l--MantLQr •
3
1,000
800
778 22
200
1,000
465
116 349
535
1,000
286
14,3 143
714
1,000
1,000
616 3811
1,000
696
341 31111 304
1,000
522
478 44
478
1,000
1,000
1,000
1,000
409
409
1191
1,000
390
103 4
483 410
1,000
318
268 4
48 3
682
261
E-ll P.AJlT B-l-contd.
4
289
200
178 22 89
232
23
23
209
429
72
72
31S7
237
133
29 104 104
521
152
130 22
369
182
46
46
138
G90
389
37 4-
328 221
'08
92
81
30 1
314
fj
1133
422
422
111
326
93
93
233
429
143
72 71
286
231
231
77 154
444
304
156 148 140
348
239
217 22
109
MO
liOO
ISOO
454
227
227
227
284
11515
22
133 129
4116
1118
187 4
lIS 2
298
6
67
67
67
140
117
47 70 23
71
71
308
808
1M 134
170
155
81 7~
15
65
65
61S
MO
1500
ISOO
91
91
22 7
7
58
32
31
1
26
7
44
44
44
28
23
77
77
77
~~
29
15 14. 15
22
22
22
30
19
13 , 11
14
10
9
1
8
22
22
22
28
23
23
307
307
307
37
22
22
15
44
44
44
91
45
45
48
11
11
11
5
2
:1
8
9
28
23
23
77
77
77
46
46
" 7
7
4
3
3
1
1
10
30
30
23 7
u
8
8
8
4
1.2
91
91
13
46
4G
45
233
J86
23 163
47
71
71
71
SO 15
7 8
15
45
411
45
1S2
21
'1
i6 30
as 23
22
1
311
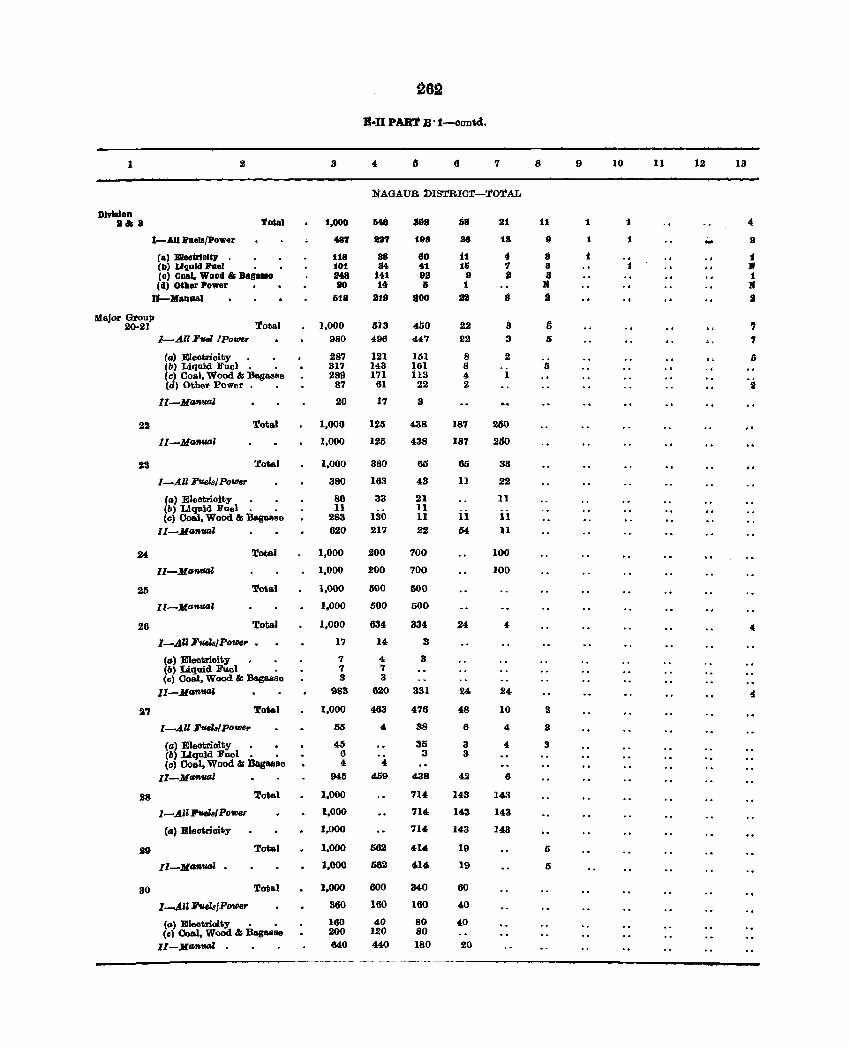
~82
£·11 PUT B ·1-OOlltd.
1 3 4 fj 6 7 8 9 10 11 12 13
NAGAUR DISTRICT-TOTAL
DlvldoD II It; a 'l'otal 1,000 &M lI98 611 21 11 1 1 4
I-All :ru.IB/Pow.~ 48'1 II2'l 198 38 13 II 1 1 .. II
(a) BledrieUlf U8 88 60 i1 • 3 i .. i (II) L1'luld l'1Ial . lot 84 41 1& ., a 1 If (II) Coal. Wood" Bagaoll 248 141 93 9 a a :1 (d) oth_Powe~ SO 14 I) i If If
"-Manual 611 S19 '00 III II li Ii
Major Group 20-21 Total 1,000 5is 450 22 3 (; '1
1-AII Fuel /Po_,. 980 496 447 22 3 I) 1
(a) Eleotrioity 287 121 151 8 2 (j (b) Liquid Filel, , 311 143 161 8 0 (0) Coal, Wood &; Bagasse 289 171 i13 4 I (d) Other Power. . 87 61 22 2 '2
II-Manual 20 17 3
22 Total 1,000 126 438 187 250
ll-Manual 1,000 126 438 187 2iJO
23 Total 1,000 380 65 65 33
I-All Fuels/Powe,. 380 163 43 11 22
(II) Eleotrioity 86 33 21 11 (6) Liquid Fuel, , 11 11
ii (c) Coal, Wood &; Bagasse 283 130 11 11 ll-Manual 620 217 22 54 11
24 Total 1,000 200 700 100
ll-ManuaJ 1,000 200 700 100
25 Total 1,000 600 500
ll-M(J-' 1,000 500 600
26 Total 1,000 634 334 24 4 4
I-AU F~/Powe,. • 17 14 3
(a) EleotriGity 7 " 3 (b) Liquid FUel , 7 7 (c) Coal, Wood &; BagMB. 3 3
II-Manua, 983 620 331 24 24 4
27 Total 1,000 463 476 48 10 3
I-AU FfUlalpo~ 65 4 38 6 4 3
(II) EleCtrioity 45 35 3 4 3 (1'.1) Liquid Fuel, , 6 3 3 (c) Coal, Wood &; Bagasse 4 4
Il-MII_1 946 459 438 42 6
28 Total 1,000 714 143 143
l-AUli'uela/Po_r 1,000 714 143 143
(a) Eleotrioit;y 1,000 714 143 143
SO Total 1,000 .562 414 19 6
Il-llfafMlfSl , 1,000 662 414 19 6
80 Total 1,000 600 340 60
I-All FtlelaJPower 860 160 160 40
(II) EI .... trioit;y , , 160 40 80 40 (el (JoaI, Wood &; Bagasse 200 120 80
ll-J(_ual , 640 440 180 20
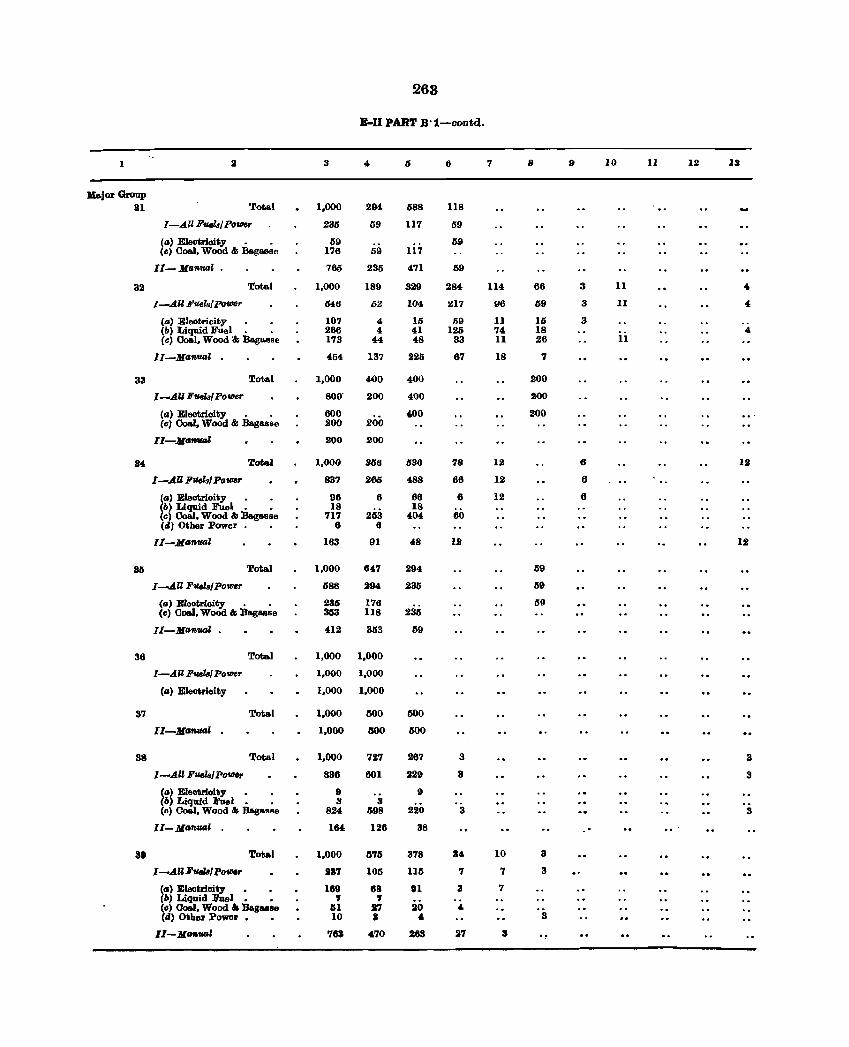
263
E-I1 PART B'1-oontd.
1 :I 3 4 6 7 8 " 10 11 III 13
K.jor Group 31 'fotal 1,000 294 588 118
I-All FuttlaJ Power 235 59 117 59
(IJ) Eleotrioity • . 59 59 (e) Coal, Wood & Bagasse 176 59 117
II-ManUld , 765 235 471 69
32 Tota.l 1,000 189 329 284 114 66 3 11 .. I -A.1I FUeIsI pofl16r 546 62 104 217 96 59 3 11 4
(a) Eleotrioity 107 4 16 59 11 15 3 (/I) Liquid Fuel, , 266 4 41 125 74 18 4 (c) Coal, Wood '& BaglloBse 173 44 48 33 11 26 11
II-Maflual 454 137 225 67 18 7
33 Total 1,000 4,00 400 200
I -All FUelsI Power 800- 200 400 200
(a) Eleetrioity , , 600 400 200 (e) Coal, Wood & Bagasse 200 200
lI-MafIVtM 200 aoo
34 To_I 1,000 356 536 78 12 6 12
I-A.U F'IIila/ power 837 265 488 66 12 6
(a) Eleotrioity 96 6 66 6 12 6 (/I) Liquid Fuel. • 18 18 60 (c) Coal, Wood '& Bagasse 717 253 404 (d) Other Power . 6 6
II-MaflUQl 163 91 48 HI 12
35 Total 1,000 647 294 59
[-An FuelslPO'Wer 588 294 235 59
(IJ) Eleotrioity , . 236 176 59 (c) Coal, Wood & Bagasse 353 118 235
lI-MlJfluaZ , 412 353 59
36 Total 1,000 1,000
I-AU Fuelal power 1,000 1,000
(a) Eleotrieity 1,000 1,000
37 Total 1,000 500 500
II-JlanUQZ 1,000 ISOO 500
38 Total 1,000 727 267 3 3
I -All Fuelsl PO'Wer 836 601 229 3 3
(a) Eleotriolty 9 " (/I) Liquid FUel. , 3 3 (e) Ooal, Wood & Bagasse 824 598 220 3 3
II-Manual 164 126 38 .. 8. Total 1,000 1S75 378 I' 10 3
I-All Fuelsl Po_ lilT 105 115 7 7 3
(II) Eleotrioity • UI9 88 01 3 7 (/I) Liquid ll'uel. • , 7 (c) OoaI, Wood" Ba.g ... s., lSI 17 20 4, (eI) <»heJ' Powe .. 10 I 4, 3
II-Ma_1 761 470 263 27 S
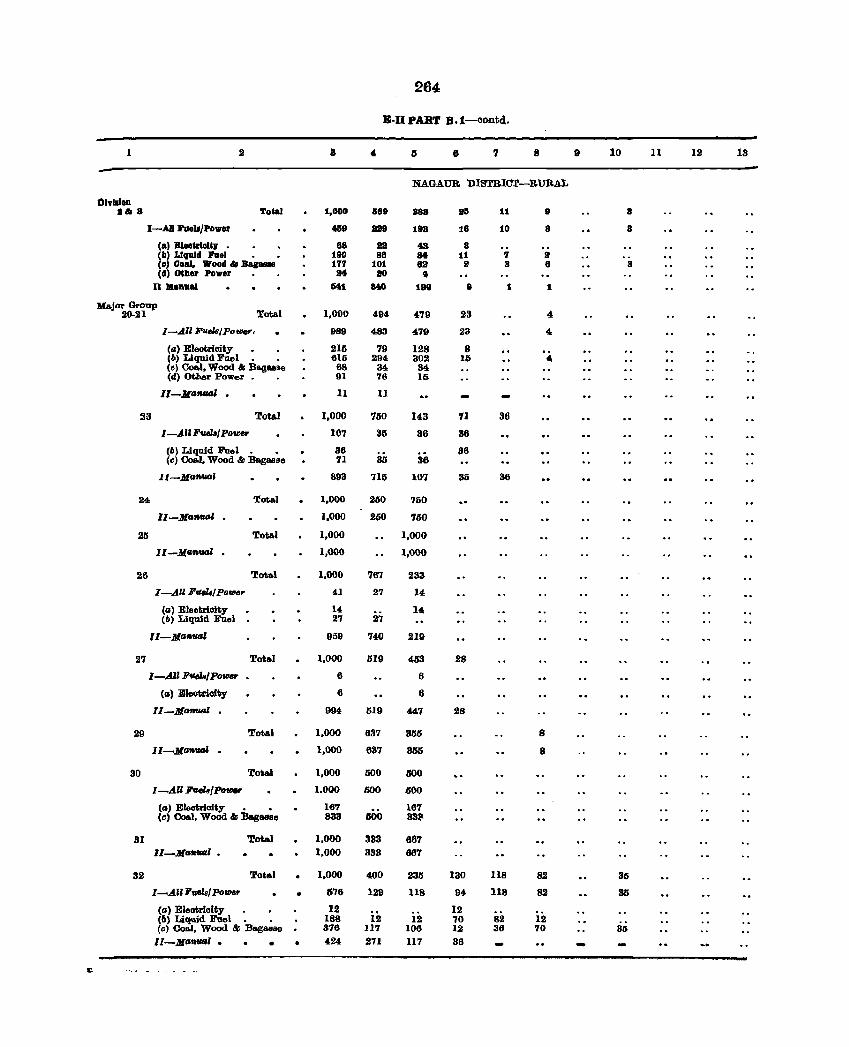
264
E·1I PART B.1-contd.
1 2 4 6 8 7 8 9 10 11 12 13
NAGAUR DISTRIC'l'-RURAL
1)Ivlllon 11& 8 Total 1,000 589 888 95 11 9 8
I-AD hell/Power 459 as9 198 18 10 8 8
Cal Blee&rloU, • 88 Ill! 48 8 (II) LlqnJd :rae. • 190 88 84 11 7 8 (0) Coal. Wood 8J Bag_ 177 10t 88 8 8 8 8 Cd) Other Power 84 80 t
II lIaDnal 541 B40 190 9 1 1
Major Group 20-21 Total 1,000 494 479 23 4,
I-.All Folel8/Po_. 989 483 479 23 4
(al Eleotrioity 215 79 128 8 (b) Liquid Fuel. • 616 294 302 16 4 (e) Co.I, Wood & Ba.gll6Be 68 34 34 Cd) Other Power 91 76 15
II-Manual • 11 11
23 Total 1,000 750 143 71 38
I-AU Fuels/ POtller 107 35 36 38
(6) Liquid Fuel. • 86 86 (c) CoeJ, Wood & Baga.sse 71 311 38
II-Manual 893 715 107 35 36
24 Total 1,000 250 750
1I-.MafItUJ' • 1,000 250 750
211 Total 1,000 1,000
II-M--' 1,000 1,000
26 Total 1,000 787 233
I-AU FfIel8/Po'IH" 41 27 14
(a) Eleotrioity 14 14 (b) Liquid Fuel 27 27
lI-MafItUJ' 959 740 219
27 Total 1,000 519 453 28
I-All FueL/Po_ 8 6
(15) Eleotrioity 8 6
ll-.MQ'/Iflal • 994 519 447 28
29 Total 1,000 637 355 8
Il-Ma'IWtJI . 1,000 837 355 8
30 Total 1,000 500 600
I-AU FuehfPa_ 1.000 500 600
(II) Electrioity • • 167 167 (c) Coal, Wood & Bagasse 833 500 33l.'
31 Total 1,000 333 867 II-.J[a_l • 1,000 333 667
32 Total 1,000 400 235 130 118 82 35
I-AU Fuel8/ Pawe,. • 576 129 118 94 118 82 35
(a) Eleolirioity 12 12 (6) Liquid Fuel. • 188 12 12 70 82 12 (c) Coal, Wood & Bagasse 376 117 106 12 36 70 86
lI-.MaflfMJl • • 424 271 117 86
"
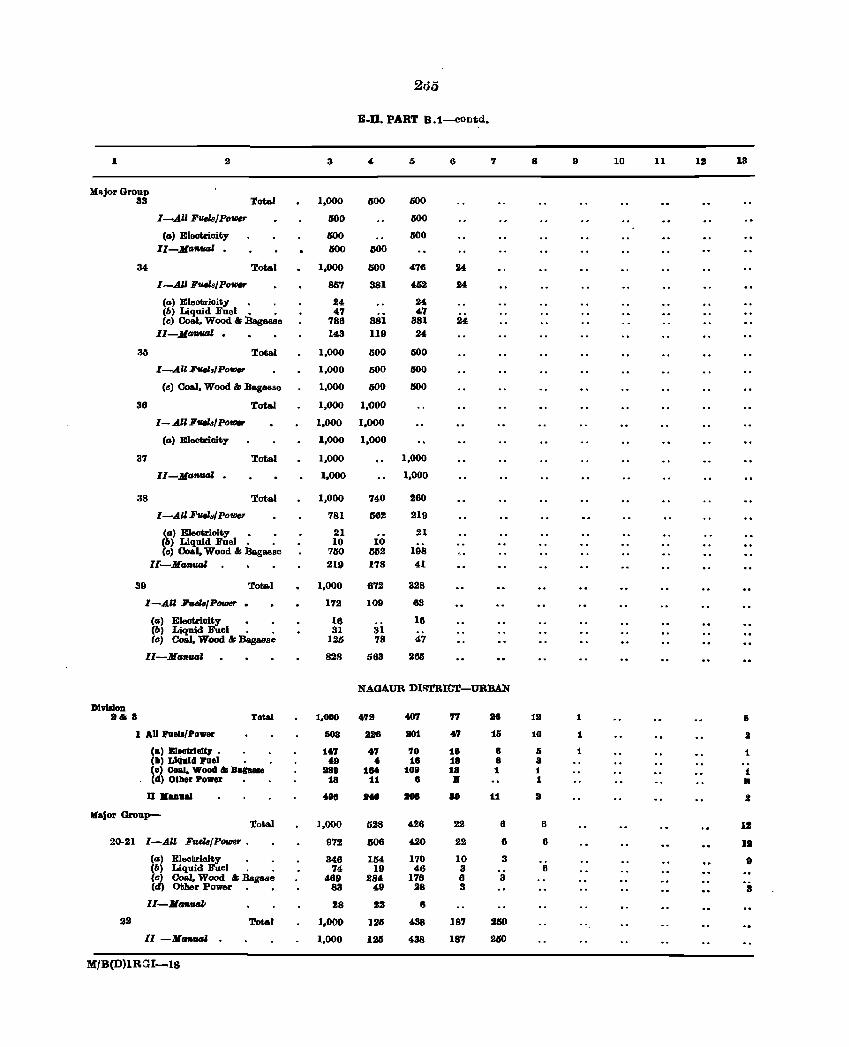
200
B-D. PART B. t-contd.
I 3 6 7 8 9 10 11 US 13
MoajorGroup 33 Tot .. l 1,000 500 600
l.......fll Fuels/Po_ 600 600
(tJ,) Eleotrioity 500 500 lJ-MtJ,_1 • 500 600
34 Total 1.000 500 476 24
I.......fU Fuels/Power 857 381 452 24
(tJ,) Eleotrioity 24 24 (6) Liquid Fuel. • 47 47 (c) Ooa.l. Wood & Baeasse 786 381 381 24
Il-MtJ,'MIBl • 143 119 24
35 Total 1,000 500 600
I-All Fua.fPo_ 1,000 000 500
(e) Coal, Wood & BaglNlse 1,000 000 500
36 Total 1,000 1,000
1- AU Fueh/ Po_ 1,000 1,000
(tJ,) Electricity 1,000 1,000
37 Total 1,000 1,000
lI-MtJ,muU . 1.000 1.000
38 Total 1,000 740 260
I-AU Fuel.! pOVJer 781 562 219
~) Eleotrioity • 21 21 ( ) Liquid Fuel. , 10 10 (c) Ooa.I, Wood & :Bagasse 750 552 198
II-MtJ,lIutJ1 219 178 41
39 Total 1,000 672 328
I-AU J!'u.{ p_ • 172 109 63
(t.I) Eleotrioity • • 16 16 (b) Liquid Fuel • , 31 31 (e) Ooa.I, Wood & B&gasse 1.26 78 47
lI-Mt.I_1 8211 563 265
NAGAUR DI~IOT-URBAN
D191aloD a& 8 Total 1,000 4'U1 407 77 as 12 1 6
I AU Faell'Power 503 aas 801 47 15 10 1 I
Ca) B1ee1r1eU, , 147 47 70 18 8 5 1 1 (II) LiquId I'llel 48 • 18 18 8 a (e) Coal, Wood & B&ftIIe 288 1M 108 1a 1 1 t (d) Other Power 18 11 8 • 1 •
D .anual 4118 .111 208 ao 11 a .2
Wafer Group-Total 1,000 528 426 22 6 6 11
20-21 I-All FueZs{POrDIlr • 972 006 420 22 6 6 11
(G) Eleotricity 346 154 170 10 3 8 (6) Liquid Fuel , , 74 19 46 3 6 (e) 00a.I. Wood & Bagase 469 284 176 6 3 (d) Other Power. • 83 49 28 3 3
11-11 __ ' 18 12 6
22 Total ],000 125 438 187 !ISO " II -M __ I 1,000 1211 438 187 250
M/B(D)IR3I-18
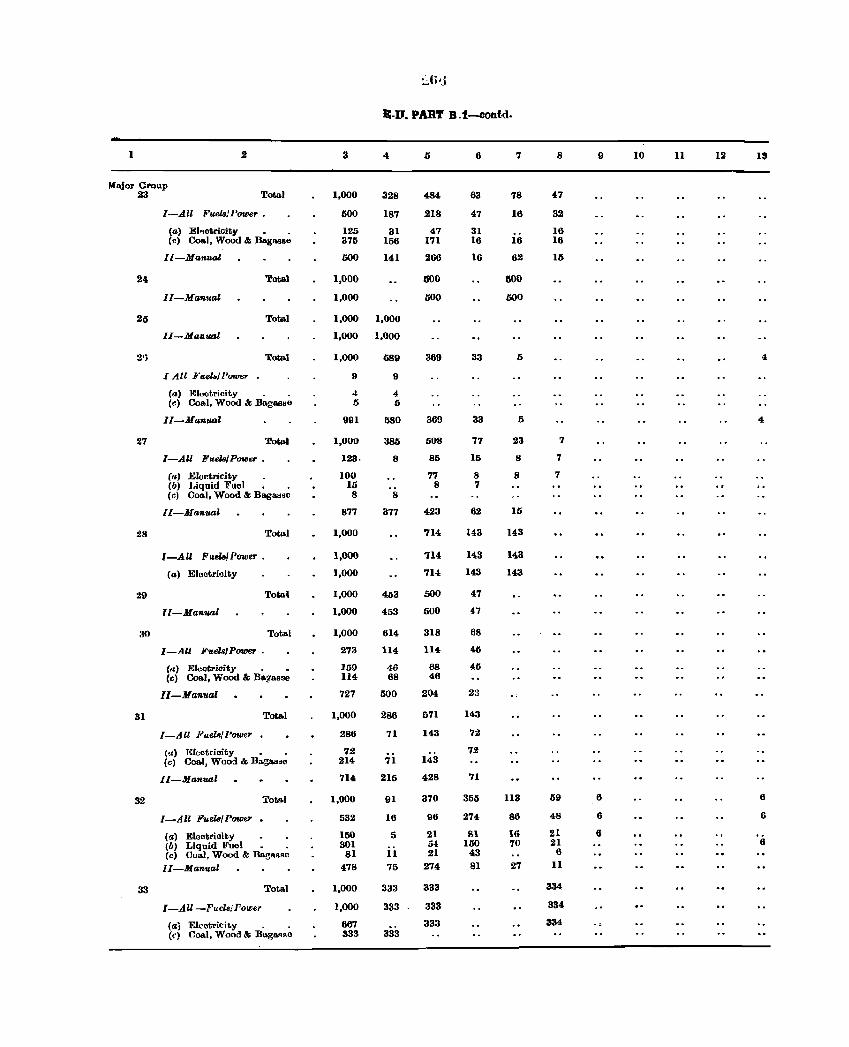
::'(j'J
I:-IJ. PABT B .1-conM.
I 2 3 6 7 8 9 10 11 12 18
M .. for GtOllp 23 Total 1,000 328 484 63 78 47
I--All F'uel8/ Power • l)(}0 187 218 47 16 32
Ca) EII'lotricity • . 125 31 47 31 16 Cc) Coal, Wood & Bagll8S6 375 156 171 16 16 16
II-Manual 500 141 266 \6 62 16
24 'fotal 1,000 500 500
II-Mar",a: 1,000 500 500
25 Total 1,000 1,000
II-Manual 1,000 1,000
2'; Total 1,000 589 369 33 6 ~
I All }?uftl"il'ower 9 9
Cal Eluotrioity 4 4 C,;) Coal, Wood &I BagB888 5 5
II-Manual 991 580 369 33 5 4
27 Total 1,000 385 508 77 23 7
I-AU Ji'uel8IPower • 123. 8 85 15 8 7
(,,) Eloctrici ty 100 77 8 8 7 Cb) J.iq uid Fuel IIi 8 7 Cc) Coal, Wood &I Bagall"e 8 8
If-Manual 877 377 423 62 15
28 Total 1,000 714 143 143
I-All Fue18!Powet' • 1,000 114 143 143
Ca) Electri'Jity 1,000 714 143 143
29 Total 1,000 463 500 47
ll-Man_l 1,000 453 500 47
30 Total 1,000 614 318 68
1-.411 Fuels/ POlDer • 273 114 114 45
Ca) Ek-otricay • _ 159 46 68 45 Ccl Coal, Wood & Bagasse II4 68 46
II-Manual 727 500 204 2" .,
31 Total 1,000 286 571 143
I-AU j"aelJt/l'ower 286 71 143 72
(<I) ]<;Icctricity • • 72 72 C,,) Coal, Wood & Bagasse 214 71 143
II-Ma7Uull 714 215 428 71
32 Total 1,000 91 370 355 113 59 6 6
I-All Fuel8/Power 532 16 96 274 86 48 6 6
(a) Eloetrioity 150 5 21 81 16 21 6 Cb) Liquid Fuel • . 301 5t 150 70 21 6 Cc) Cual, Wood & Ba.gasse 81 11 21 43 6
II-Manual 478 75 274 81 27 11
33 Total 1,000 333 333 334
l-All-FucllJiTower 1,000 333 333 334
(a; Eleotricity . • 667 333 334 (cl (1oal, Wood & Bag"",~e 333 333
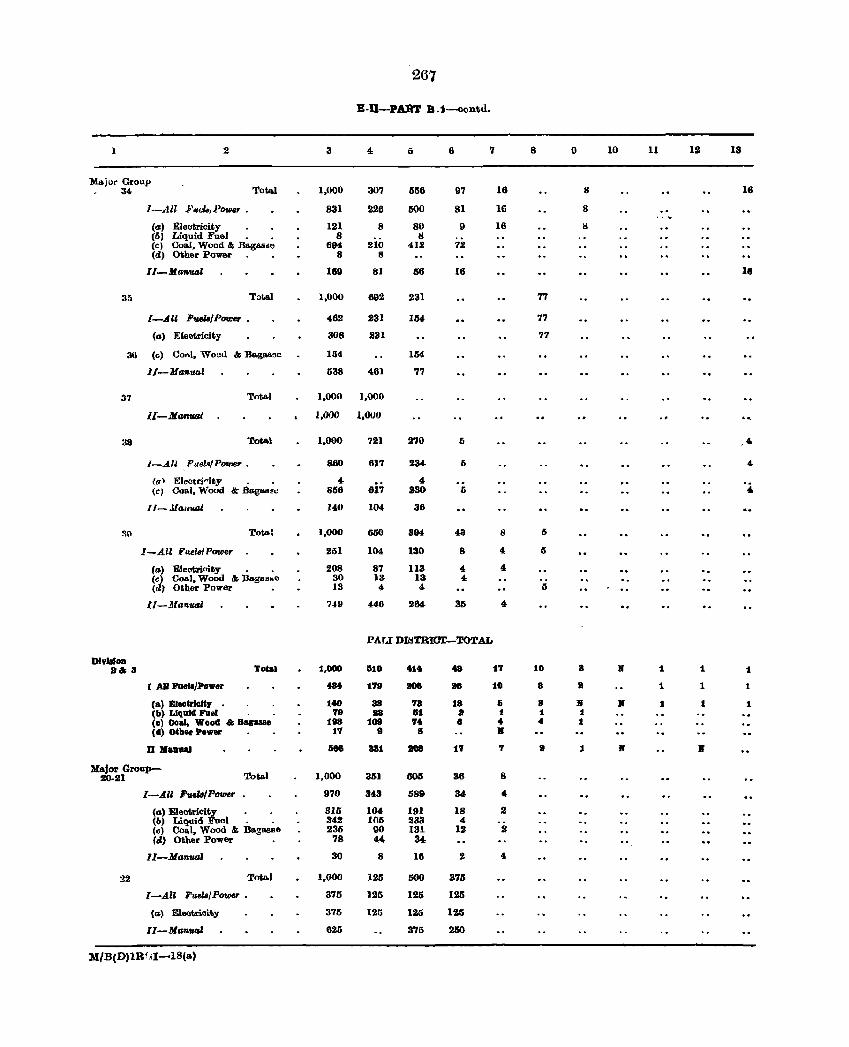
267
E-D-PABT B .1-ocDtll.
1 2 3 4 5 6 '1 8 I} 10 11 12 18
Major Group 34- 'ro~1 1,000 307 556 97 16 8 I.
l--All .b' "d.., P0W6~ • 831 226 500 81 16 8
(at EloCltricity 121 8 80 9 16 !I (6) Liquid Fuel 8 II Ccl Coal, Wood &; Ba.gas~e 694- 210 4-12 12 (d) Other Power 8 8
II-M"nuo.1 189 81 56 16 16
35 TaW 1,000 692 231 77
[-.,Ill Fva.fP_ . 4-62 231 154- 77
(al Electricity 308 231 77
36 Ce) Co"l, 'Vo",} .!GB .. g .... "e 1M 154
lJ-MaflUGl 538 461 77
37 Total 1,000 1,000
II-Manual 1,000 1,000
38 Total 1,000 721 270 I) • I-All P"el .. !P_ . 860 617 234 6 4-
(11\ Electri"ity 4- 4-(~, 001'1, Wood .!I: .Bag .... Stl 856 617 230 ,. •
fl-Jlal6'luu 140 104- 36
31\ Tot.al 1,000 650 394 43 8 5
I-AU Fu.e~/POtl1er 251 104- 130 8 4- 5
Ca) Eleotri"ity • . 208 87 113 4 4-(e) Coal, Wood .!G &gasH" 30 13 13 4 Cd) Other Power 13 4- 4,- 5
ll-:Uall:u.al ;49 446 264 35 4-
PAr.I DRlTRIOT-TOTAL
Dh· ... OD a& 8 Total 1,000 510 U. ... n 10 • B 1 1 1
I AU FD.III/Power f34 179 206 26 10 8 I 1 1 1
(a) ElectrfeJtr 140 88 73 18 Ij 8 II If 1 1 1 (b) Liquid Fuel ,. 88 lit 2 t 1 1 (a) Coal, Wood & Bagasse 198 109 74 8 4 .. 1 Cd) Other Power 17 9 8 If
D :Manual 588 881 108 17 '1 :a 1 If I(
Major Group-Total 1,000 351 605 38 8 20-21
I-All FueZsfP- 970 343 589 34- 4-
(al E1ectriciJ,. . . 315 104 191 18 2 (b) Liquid el . . 342 105 233 4 (e) Coal, Wood & Bagasse 235 90 131 12 2 (d) Other Power 78 ,,4 34
II-Man_' 30 8 16 2 " 22 Total 1,000 125 500 375
l-AU FruI8} POtDer • 375 125 125 125
(G) E\ootrlci.ty 375 125 125 125
I1-MGnUIJI 625 375 2150
M/B(D)lBi.ll-18(a)
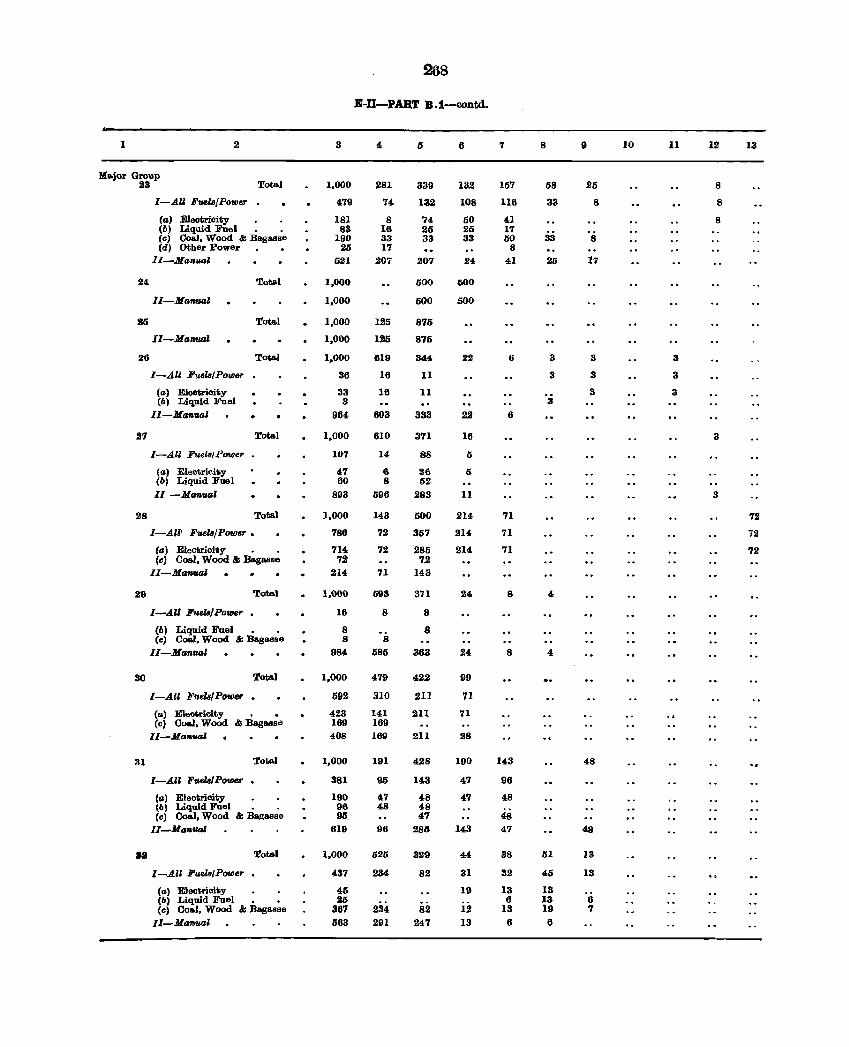
288
B-D-PART B.1-contd .
1 .2 3 4 6 6 7 8 9 10 11 12 13
M8ojor Group Total 23 1,000 281 339 132 157 58 26 8
I-AU Fw-t./Power 479 74 132 108 116 33 8 8
(CI) Eleotricity 181 8 74 50 41 8 (b) Liquid Fuel • . 83 16 25 25 17 Ccl Ooal, Wood &; Bagasse 190 33 33 33 50 33 8 Cd) Other power 26 17 8
II-MClIIU4' 521 207 207 24 41 25 17
24 Total 1,000 500 6()0
II-Maflual 1,000 500 500
25 Tot&l 1,000 125 875
II-Manual 1,000 125 875
26 Tota.l 1,000 619 344 22 6 3 3 3
I-All Fue18IPower 36 16 11 3 3 3
(CI) Electrioity 33 16 11 3 3 (6) Liquid Fuel 3 3
IJ-MCIflllal 964 603 333 22 6
27 Tot&l 1.000 610 371 16 3
I-All Fuel8/Power 107 14 88 5
(a) Electricity 47 6 36 5 (b) Liquid Fuel 60 8 52 II -MaflllClI 893 596 283 11 3
28 Toml 1,000 143 500 214 71 72
I-All' FuelB/Power • 786 72 357 214 71 72
(a) Electrioity • . 714 72 285 214 71 72 (e) Coal, Wood & Bagasse 72 72
II-Ma_l 214 71 143
29 Total 1,000 693 371 2;1, 8 ;I,
I-AU FIlet.IPoVJef' 16 8 8
(b) Liquid Fael • • 8 8 Ce) Coal, Wood 81; Bagasse 8 8
lI-MGflual 984 585 363 24 8 4
30 Tota.l 1,000 479 422 99
I-All FllelB/ Power • 592 310 2Il 71
(a) Electricity 423 141 211 71 (c) Coal, Wood &; Baga.sse 169 169
ll-MCl7Iual 408 169 211 28
31 Total 1,000 191 428 190 143 48
I-An FuelB/ Power • 381 95 143 47 96
lIZ) Eleotrioity • . 190 47 48 47 48 (6) Liquid Fuel • . 96 48 48 (c) Coal, Wood 81; Bagasse 95 47 48
II-MCl7Iual 619 96 285 143 47 48
n Toml 1,000 525 329 44 38 51 13
I-All Fuel8IPOtDer 437 234 82 31 32 45 13
(IZ) EJeotrioity 45 19 13 13 (6) Liquid Fuel 25
82 6 13 6
(c) Co8ol, Wood &; Bag80sse 367 234 12 13 19 7
II-MIZflual 563 291 247 13 6 6
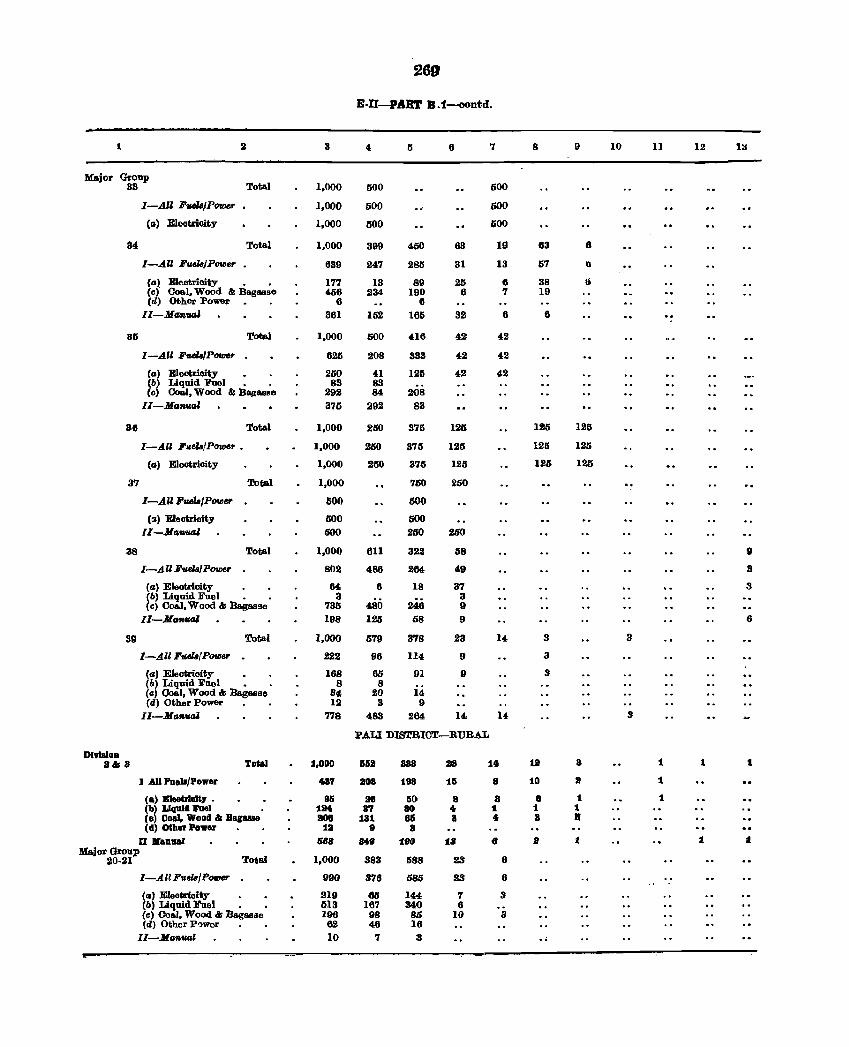
269
E-U-PAR'l' B :f-oontd.
1 2 3 4 5 6 7 8 9 10 11 12 13
Major Group 33 Total 1,000 500 500
I-AU Ji'uel8/Power 1,000 500 500
(a) Eleotrioity 1,000 500 600
34 Total 1,000 399 450 63 19 63 8
I-AU Ji'uel8jPOWef' 639 247 285 31 13 57 (I
(a) Eleotrioity • • 177 13 89 25 6 38 Ij
(c)' Coal, Wood & Bagaase 456 234 190 6 7 19 (d) Other Power. . 6 6 "
II-MG7iual 361 152 166 32 6 6 00
81S Total 1,000 600 416 42 42
I-All Ji'uel8/Powe,. 625 208 333 42 42
(a) Eleotrioity 250 41 126 42 42 (6) Liquid Fuel • . 83 83 (c) Coal, Wood & BlIojI:lIIlRe 292 84 208
II-Manual 375 292 83
36 Total 1,000 260 376 126 126 125
I-AU Fu,elafPowe,. • 1,000 260 373 125 125 125
(a) Eleotrioity 1,000 250 376 125 126 126
3'7 Total 1,000 760 250
I-AU FaeZ.JPOfIJtfO 500 500
(a) Eleotrioity 500 600 II-Manual 600 2GO 250
38 Total 1.000 6ll 322 68 8
I-AU Fuel8/Power 802 486 264 49 3
(a) Eleotrloity • 0 64 6 18 37 3 (6) Liquid Fuel • . 3 3 (c) Coal, Wood It Bag88ge 735 480 246 9
II-Manual 198 126 68 9 6
39 Total 1,000 579 378 23 14 3 3
I-All Fuel8{POfDer . 222 96 114 9 3
Ca) Electrioity • . 168 65 91 9 3 (b) Liquid Foel • • 8 8 (c) Ooal, Wood &; Bagasse 34 20 14 (rl) Other Power 12 3 9
II-Manual 778 483 264 14 14 3
PALl DISTRICT-RURAL
DlvIBloD =U,8 l'otal :1,000 6611 888 38 :II 111 a 1 1 I
J All PDeb/Powar U7 lIoa 198 16 8 10 I 1
(.) B1eeU1ult7 • 96 as 60 8 a 8 1 1 (b) Liquid :ruel 111 87 80 4r :I 1 1 (a) Coal, Wood &; Baglll8ll 808 181 8& 8 t a K (d) other Power 18 9 8
U .aD: ... 668 849 1110 18 6 B :I 1 i Major Group
20-21 Totai 1,000 383 588 23 6
I-All Fuee.fP_ 990 376 585 23 6
(II) EleokioUy . 219 M 144 '7 3 (b) Liquid Fuel • • 613 167 340 6 (c) Ooal, Wood &; Bagasse 196 98 85 10 3 (d) Other P'lwer 62 46 16
II-MG1Iual 10 '1 3 .,
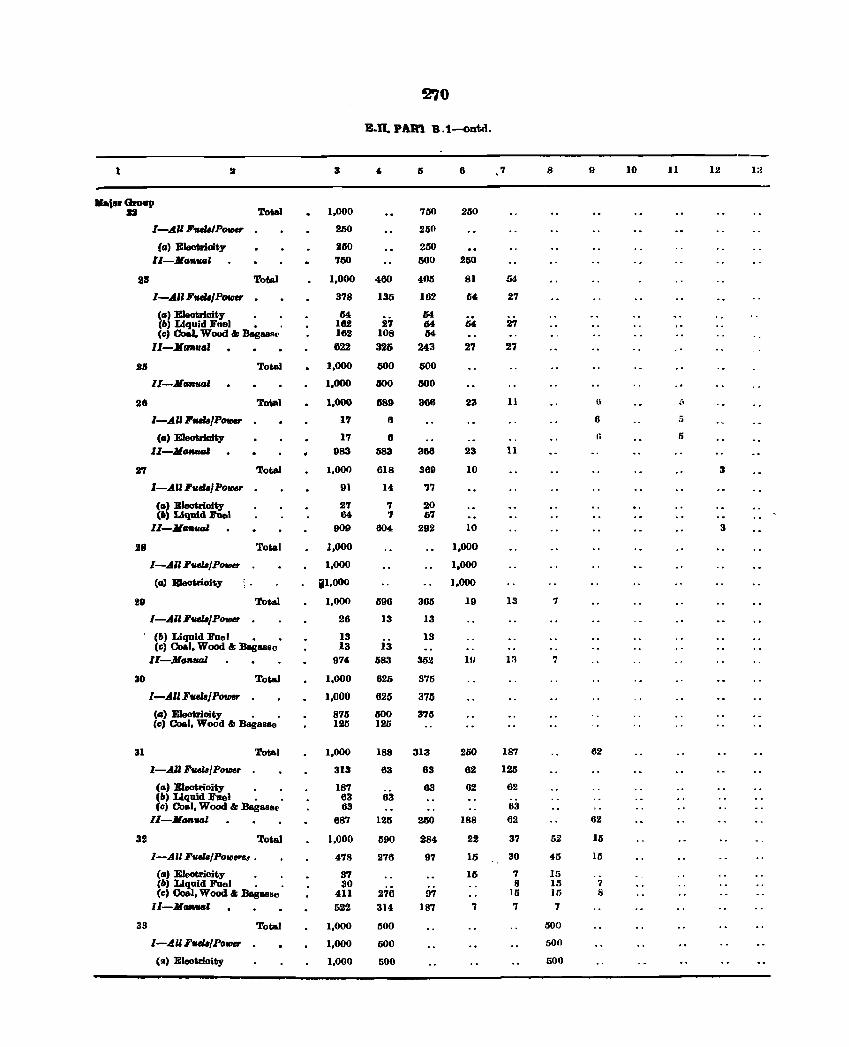
270
E.D. PAR'l ~.1~Dtrl.
1 3 4 5 6 7 8 I} 10 11 12 I;{
"1_ame, Total JI 1,000 750 250
I-AU , ... /P_ 250 250
(a) Eleotrioity 260 250 II-MaR,"d 750 500 250
28 Total 1,000 460 405 81 54
I-All ,,,,Powe,. . 3'18 135 162 64 27
(a) Eleotrioity M 27 54
(6) Liquid Fllel • . 162 1M 54 27 (c) Coal, Wood I; BagasA£' 162 108 1M
II-MaRual 822 326 243 27 27
2:5 Total 1,000 500 600
Il-M_ual 1,000 500 1i00
28 Total 1,000 689 366 23 11 II " I-All , ... ,P_ 17 II 6 5
(a) EleotrJafty 17 8 Ii 5
ll-Jl_ual 983 683 368 23 11
2'1 Total 1,000 618 369 10 3
I-All :r •• /po_ 01 14 '17
(a) Eleotrioity 27 7 2:0 (') Liquid hel 64 7 57
ll-JL_val 909 604 292 10 3
2S Total 1,000 1,000
I-All :rvd6jP_r 1,000 1.000
(a) EIootrioity iil I ,000 1,000
29 Total 1,000 596 365 19 13 7
I-All Fvd6/P_ 26 13 13
(6) Liquid Fuel • • 13 13 (e) Coal, Wood & Bagasse 13 13
I1-Ma,._1 974 583 352 IU 13 7
30 Total 1,000 625 375
I-All FueliI/POUJef' 1,000 625 375
(a) EIeotrioity • • 875 500 375 (e) Coal, Wood I; Bagasse 126 126
31 Total 1,000 188 313 250 187 62
I-AU hdB/P_r 313 63 63 62 125
(IA) EIeotrioity . . 187 63 62 62 (6) Liquid Fuel • . 63 63 (e) Coal, Wood I; Bagasse 63 63
ll-Maflval 687 126 260 188 62 62
3.2 Total 1,000 590 284 22 37 52 15
I-All h""PoVl~ . 478 276 97 15 30 45 15
(IA) Eleotrioity 37 15 7 15 (6) Liquid Fuel . 30 8 15 7 ee) Coal, Wood & Bagasse 411 276 97 15 15 Ii
II-M_' 522 314 187 7 7 7
33 Total 1,000 500 600
[-.All Fvd6/Po_ 1,000 500 500
(~) Eleotrioity 1,000 500 600
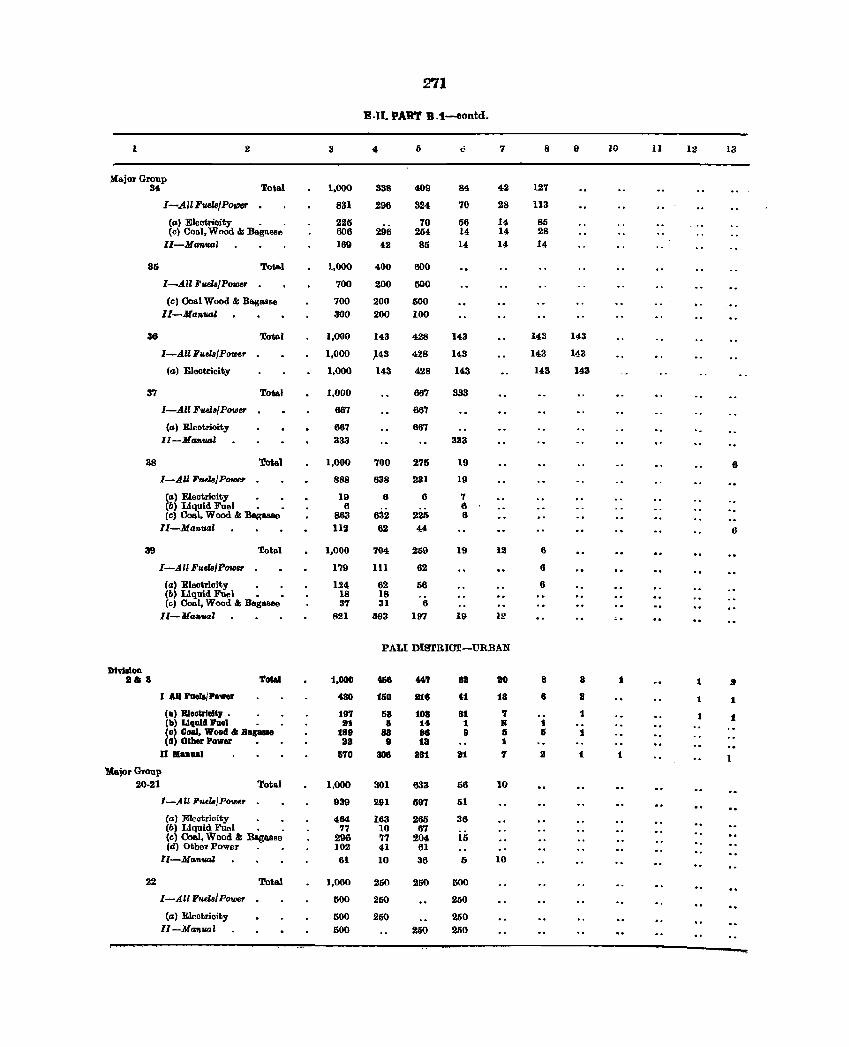
271
E-ll. PART B_t_ontd.
1 .2 3 4 li .; 7 8 9 10 11 12 13
Major Group 34 To,al 1,000 338 409 84 42 127
I-All FveI8/PolJ)flr 831 298 324 70 28 113
(al Electrioity _ 225 296
70 56 14 85 (c) Coal, Wood & BagasBe 606 254 14 14 28
II-Manual 169 42 85 14 14 14
35 To~l 1,000 400 600
I-All FvelB/POfDer 700 200 500
(cl Coal Wood & BagMse 700 200 500 II-HamUli 300 200 100
36 Total 1,000 143 428 143 143 143
I-AU Futl8/PrHUr 1,000 ~43 428 143 143 143
(a) Electricity 1,000 U3 428 143 143 143
37 Total 1,000 667 333
I-All FuelB/Power 667 667
Cal Electricity 667 867 II-MtI .. ""l 333 333
38 Total 1,000 700 275 19 6
I-All FvelB/POfIlfJr 888 638 231 19
(a) Electricity 19 6 6 7 (b) Liquid Fuel • 6 6 (c) Coal, Wood & Bagaeee 863 832 225 6
II-Manual 112 62 44 6
39 Total 1,000 704 259 19 12 6
I-All Fuels/Powsr 179 HI 62 6
(a) Electrioity • 124 62 58 6 (b) Liquid Fuel • • 18 18 (c) Coal, Wood & BagGSRO 87 31 6
II-Ma ... u..z 821 593 197 19 12
PALl DISTRIC'f-URBAN
DIY18lon 111& 8 Total 1,000 468 WI 81 110 8 8 1 1 II
J AU hela/PDwer 480 160 1118 41 18 8 a 1 1
(.) B)eetrlal', • 191 68 108 81 7 1 1 (b) LIquid Pilei lit 15 14 1 II 1 (u) Goal, Wood & Bag_ 189 88 88 9 & & :1 (d) Other Power 13 8 18 1
n 1II1U11111 5'10 808 IlS1 al '1 II t 1
'Major Group 20-21 Total 1,000 301 633 56 10
I-All Fuels/POVJer 939 291 597 61
(a) Eleotricity 464 163 265 36 (b> Liquid Fuel • _ 77 10 67
iii (e) Coal, Wood" Bag8.BSB 296 77 204 (d) Other Power _ • 102 41 61
II-Man",JI 61 10 36 (; lO
22 Total 1,000 250 250 500
I-All Fuels/Power 1100 250 260
(a) Electrioity 500 250 260 ll-Ma .. ual 600 200 260
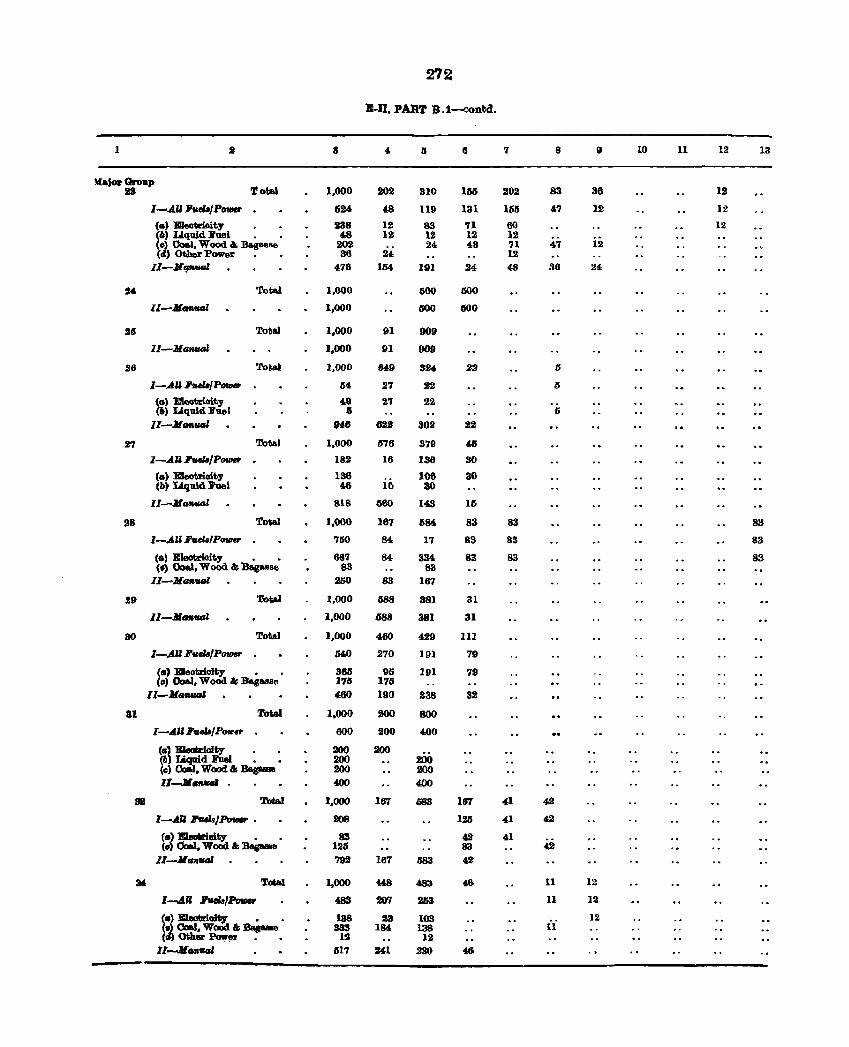
272
B-D. PART B.1-contd.
1 S 4 II 6 7 8 10 11 12 13
MajorOroup IS Total 1,000 202 310 lisa 202 83 38 19
I-AU F.eIa/P_ 624 48 119 131 165 47 12 12
CD) Elecf;rloity 238 12 83 '11 60 12 (6) Liquid li'nel • • 48 12 12 12 12 (c) 00&1, Wood a. BagIl<lBe 202 24 48 71 47 12 (d) Other Power 36 24 12
11-11",._1 476 164 191 24 48 36 24
U Total 1,000 fiOO 600
II-MGAUGl 1,000 500 600
26 Total 1,000 91 909
II-Mall,"" 1,000 91 009
26 Total 1,000 M9 324 22 I}
l-.AII FtuJZ./P_ 54 27 22 5
(D) EIeotri.Gity 49 27 22 (6) Liquid Fuel II I)
II-Man_' 948 mll 302 22
2'1 Total 1,000 1176 379 43
l-.AII FueI8/P_ . 182 16 136 30
(D) Eleotrioity 136 i& 100 30 (b) Liq'llid Fuel 48 30
II-Jl_l 818 560 143 15
28 Toal 1,000 167 684- 83 83 83
1-.AUFudBIPo_ 760 84 17 83 83 83
(a) Eleotriait.y • • 667 84 334 83 83 83 (s) Coal, Wood & Bagueo 83 83
l1-Jl_,"" 250 83 167
29 To ... 1,000 588 381 31 11-11 __ ' 1,000 4588 381 31
80 Tobl 1,000 460 429 III
l-.AII F.w/P_ 640 270 191 79
CD' E1eotriaity • 365 95 191 79 Co) 00&1, Wood & B.,use 175 175
11-11--' 460 190 238 32
31 Total 1,000 200 800
I-A" F1IelalPOV'u 600 200 400
(CI) Eleatzioity 200 200 (II) Liquid Fuel • 200 200 (c) Coal, Wood" Bag8IIIe 200 200 Il......JIanfICIJ 400 400
3B Total 1,000 167 683 167 41 42
l-.All :rw.hJ~ . 208 125 41 42
(.) 1!:Ienrioit)' • 83 4,2' 41 (,,) Coal, WociI,l &:&sa- 126 83 42
II-MDn_' 792 167 683 42
K ToIial 1,000 t48 483 4& 11 12
l-AU Iveh/PotNr 483 20'1 253 11 12
~.) liIIeotri.oity: • • 188 23 103 12 .) Ca&I. WoOd & Bagasse 333 184 138 11
(cI) ()thmo ~ • • III 12 I1-Man,"" 617 241 2SO 46
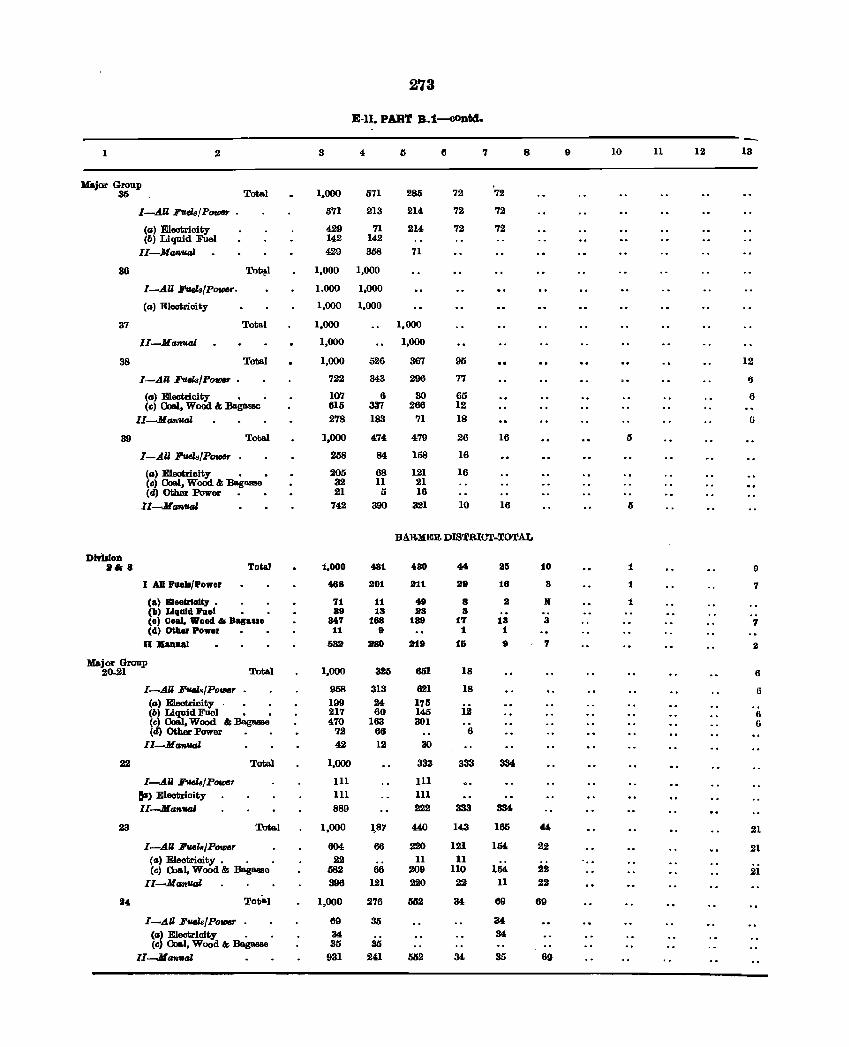
273
E-ll. PART B.1-cODtd.
1 2 3 4. Ii 6 7 8 9 10 11 12 13
lofajar Group 35 Total 1,000 571 285 72 72
I-AU Fqla/PolIM' 1I71 213 214 72 72
(CI) Electricity 4,2g 71 214 72 72 (b) Liquid Fuel 142 142
II-Ma.nual 429 358 71
36 To~l 1,000 1,000
I-AU Fut!ls/PolDBr. 1.000 1,000
(a) Electricity 1,000 1,000
37 Total 1,000 1,000
II-Monual 1,000 1,000
38 Total 1,000 526 367 95 12
I-All Fqla/PotDBr • 722 343 296 77 t}
(a) Electricity • 107 6 30 65 6 (c) Coal, Wood &; Bagasse 615 337 266 12
II-Manual 278 183 71 18 Ii
39 Total 1,000 474 479 26 16 5
I-All Fuels/POIDBr 2158 84 158 16
(a) Electrioity • 205 68 121 16 (c) Coal, Wood &; Bag8oll8e 32 11 21 (tI) Other Power 21 5 16
Il-Mantt.tJl 742 390 321 10 16 5
BAB.MEH. DIBTRIC1r-TOTAL
DtrWOD .68 Toi.1 1,000 481 430 44 25 10 1 9
I All heb/Power 468 201 211 29 16 3 1 7
(&) Blee&rloli:r • 71 11 49 8 2 .N 1 (b) LIquid lI'a&1 89 13 23 3 (e) Coal, Wood '" Bagasse 347 168 139 17 13 3 7 (d) O&her Power 11 9 t 1
o 11[&1111&1 532 380 219 15 9 7 2
Maj or Gl'OIlp 20-21 Total 1,000 325 651 18 6
I-AU Ft*B/Po_r 958 313 621 18 6 (0) Electricity - 199 24 175 (b) Liquid Fuel • • 217 60 145 12 6 (c) Coal, Wood &; Bag_ 470 163 301 6 (tl) Other Power 72 66 6
II-Mon_ 42 12 30
22 Total 1,000 333 333 334
I-AU FUels! POIDBf' III III ~) Electricity 111 III II-Man_ 889 222 333 3M
23 Total 1,000 1,87 440 143 165 44 21
I-AU lJ'wIB/Polll8r 604 66 220 121 154 22 21 (IS) Electricity • . 22 11 11 (c) Coal, Wood &; Bagaaso 582 66 209 110 154 22 21
II-Manual 396 121 220 22 11 22
24. Total 1,000 276 552 34 69 69
I-AU FuaZs/Po_ 119 35 34. (0) Electricity . 34 34 (c) Coal, Wood &; Bag_o 35 35
II-Jlan.al 931 241 1102 34 35 69
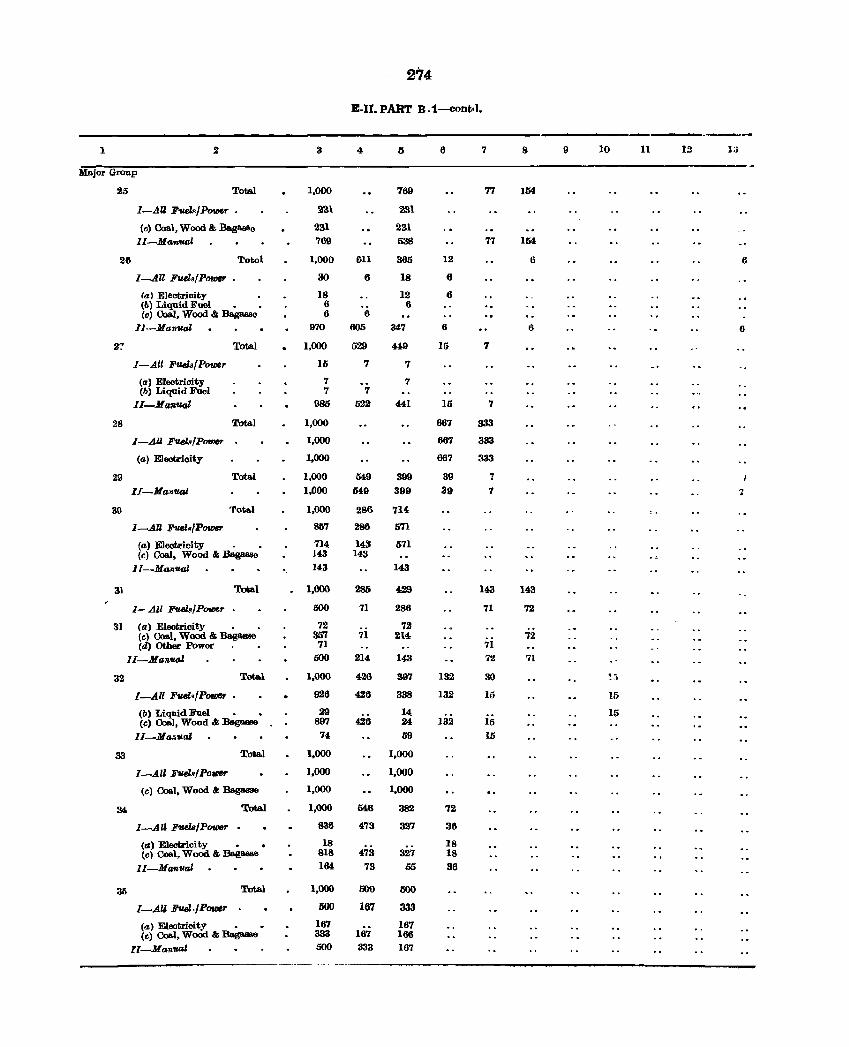
274
E-II. PART B .1-cont,J.
.--1 2 3 4 5 6 7 8 9 10 11 12 .. , .. ,
Major Group
25 Total 1,000 769 77 1M
I-All E'1UJ./P_r , 231 231
(c) Coal, Wood & :&gllalle 231 231 II-Mwn1J.lJl 769 538 77 1M
26 Totol 1,000 611 365 12 6 6
I-All F'lUl~/PorDIf' . 30 6 18 6
la) Electricity 18 12 6 (b) Liquid Fuel _ 6 6 Ccl Cool, Wood & Bag_a 6 6
ll-Ma7l1J.lJl 970 605 347 6 6 6
27 Total 1,000 529 4!9 15 7
I-All FuelafPower 15 7 7
(a) Electrioity 7 7 (b) Liquid Foel 7 7
II-ManVGZ 985 522 441 15 7
28 Total 1,000 667 333
I-AU Fuekl/Power 1,000 667 333
(a) Electricity 1,000 667 333
29 Total 1,000 M9 399 39 '1
lI-Ma1lval 1,000 549 399 39 7 -;
30 'rotal 1,000 286 714
I-All FWRIPower 857 286 571
(a) Electricity . 714 143 571 (c) Coal, Wood & Bag_ J43 143
II-MGnval 143 143
31 Total 1,000 285 429 143 143
1- All l!'1Ul4Power IlOO 71 286 71 72
31 (a) Elootricity 72 72 (r.) CoaJ., Wood & B&!!- 357 71 214 ;2 (d) Other Power 71 71
II-Manual 500 214 143 72 71
32 Tota.1 1,000 426 397 132 30 >-._.)
I-All Fal.fPower 926 426 338 132 10 15
(b) LiquidFueI • • 29 14 15 (c) Coal, Wood & Bag- 897 426 24 132 15
lI-Ma .... uaZ 74 59 15
33 Total 1,000 1,000
I-All Fuel./Power 1,000 1,000
(c) Coal, Wood & Bagasse 1,000 1,000
34 Total 1,000 M6 S82 72
I-All FUdsIPower 836 473 327 36
(a) Electricity • • 18 18 lc) Coal, Wood & Bag- 818 473 327 18
II-Manual 164 73 55 36
35 Total 1,000 500 500
I-AU FueJ,.jPower 500 167 333
(a) Electricity • • 167 167 (c) Ooa.l, Wood & Bagasse 333 167 166
11-Man_' 500 333 167
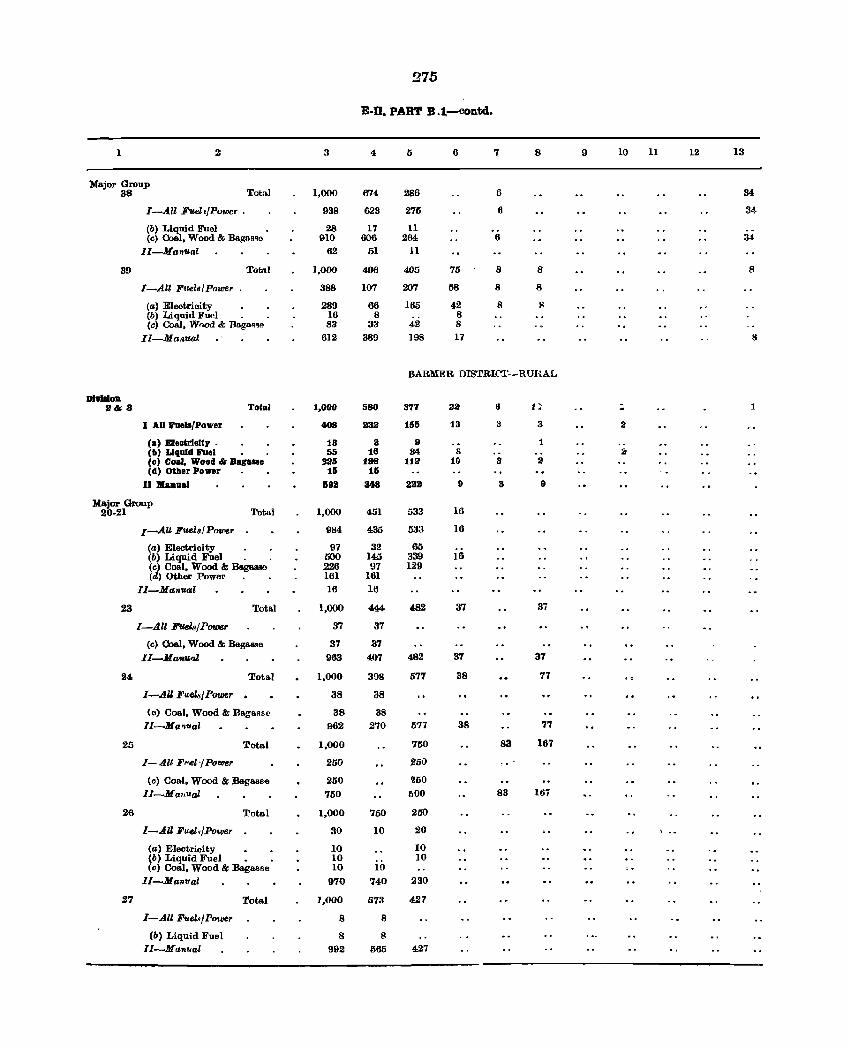
275
E-II. PART B .t-contd.
1 2 :I 4 5 6 7 8 9 10 11 12 13
Major Group 38 Tot"l 1,000 674 286 6 M
I-All F'IIRl,/Powcr . 938 623 275 6 34
(b) Liquid Fuel 28 17 11 (e) Coal, Wood & Ba~ILR"O 910 606 264 6 3i
II-Manual 62 51 11
39 Total ],000 496 405 75 8 8 8
I-All Fuels I Pou"llr 388 107 207 58 8 8
(a) Electricity • 289 66 165 42 8 ~ (b) Liquid Fuol . 16 8 8 (c) Coal, Wood &; B"ga •. ~" 83 33 42 S
II-Manual 612 389 198 17 !I
HARMER DISTRI(!'J.~-aUJ{AL
DllIIIIoD a& 8 Total 1,000 580 377 23 8 1; ~ 1
I AU Fuels/Power .08 au 155 13 a 3 2
(a) Eleotrlolt, . 13 3 9 1 (b) Uquld Fuel 55 18 84 s :; (e) Coal, Wood .. Bagalle 325 198 112 10 3 :I (d) Other Power 15 15
D lIIaDual 59a 848 alia 9 3 9
Major Group 20-21 Total 1,000 451 533 10
I-AU F'IUllafPou>e7 984 435 533 16
(a) Electrioity . 97 32 65 (b) Liquid Fuel . 500 145 339 16 (c) Coal, Wood & Bo.gnaac 226 97 129 (d) Other Power 161 161
II-Man_l 16 16
23 Total 1,000 444 482 37 3;
I-All li'uels/Power 37 37
(e) Coal, Wood & Bagasse 37 37 II-Man'-"tl 963 407 482 37 37
24 Total 1,000 308 577 38 77
1~.4U Fu.eLs/Power . 38 38
(0) Coal, Wood & Daga"sc 38 38 II-Ma~·1Jal 962 270 577 38 77
25 Total 1,000 750 83 167
I-All Fl'el'/ Power 250 250
(cl Coal, Wood & Bagasse 250 'a50 II-Maltual 750 lIOO 83 167
26 Total 1,000 760 250
I-AU Fuel,/Power 30 10 20
(a) Eleotricity 10 10 (b) Liquid Fuel • • 10 10 (0) Coal, Wood & Bagas6e 10 10
II-Mantfal 970 740 230
27 Total 1,000 073 427
I-All Fucl./Power S 8
(b) Liquid Fuel 8 8
II-Manual 992 565 427
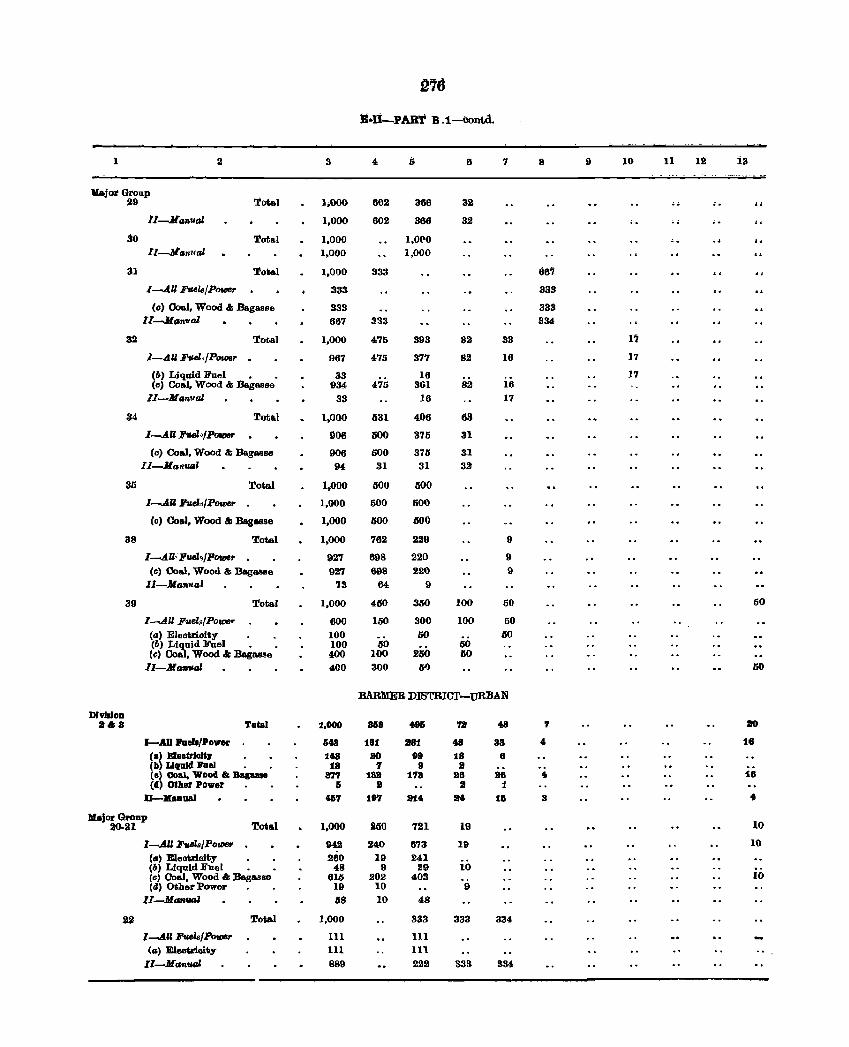
~76
EOoU_PART B .i-comd.
1 2 3 4 i; 8 7 8 9 10 11 12 i3 . -.... ~ .. - ..
Uajor Group 29 ':total 1;000 802 386 32 .. "
l1-J1anuQJ 1,000 602 386 32 .. .. ;. .: . ao ':total 1;000 1,0('0 .. " II-Jlanual 1,000 1,000
al ':total 1,000 333 667
I--.jll Fue18/PotDe,. 333 333
(c) OoaJ, Wood &: Bagasse 333 333 ll-M.nval 667 333 334
32 Total 1,000 475 393 82 33 11
I-.AU Fuel,/P_r 967 475 377 82 16 17
(b) Liquid Fuel • 33 16 17 (c) Coal, Wood &: Bagasse 934 475 361 82 16
II-Manual 33 16 17
34 Total 1,000 531 (06 63
l-AU Puel4PovJer 908 500 375 31
(c) Coal, Wood &: Bagasse 906 500 375 31 II-Man_l 94 31 31 32
35 Total 1,000 500 500
I-AU held/P_" 1,000 500 500
(c) eoal. Wood &: Bagasse 1,000 500 500
38 Total 1,000 762 229 9
I-AU·-Pal./POVle,. 927 898 220 9 (c) Coal, Wood &: Bagasse 927 698 220 9
II-Manual 73 64 9
39 Total 1,000 450 350 100 50 50
I-AU F'uez../POrD8" 600 150 300 100 50 (a) Eleotrioity . . 100 50 50 (b) Liquid Fuel • 100 60
250 50
(e) Coal. Wood.& Bagasse 400 100 50 1I-1Iaflual 400 300 5l) 50
BARMER DISTRICT-URBAN
DlvlaloD 2.a Total 1.000 858 .. 115 '1lJ 48 , JtO
I-AD Paeb/Power 1)018 181 281 48 38 .. 18
(.) B1ea#JoJ'" 1ta SO 99 18 8 (b) LIquid li'uBl 18 7 9 a .. (e) CoaJ. Wood" aapoe 877 182 1'78 28 28 .. 18 (d) OCher Power I) I a 1
U-lIIIaDUAI "' 197 214 a .. iii S 4
Major GrollP 20·1I1 Total 1,000 250 721 19 10
I-AU F"",/PorD8r 942 240 873 19 10 (a) Eleotrioity 260 19 241 (b) Liquid Fuel • 48 9 29 10 (c) Coal, Wood .& Bagasse 616 202 403 10 (d) Other Power 19 10 9
11-11_"," 68 10 48
22 Total 1,000 333 333 334
I-AU Fuds/P_r 111 111 (a) Eleot.rloity 111 III
lI-ManUGl 889 222 333 334
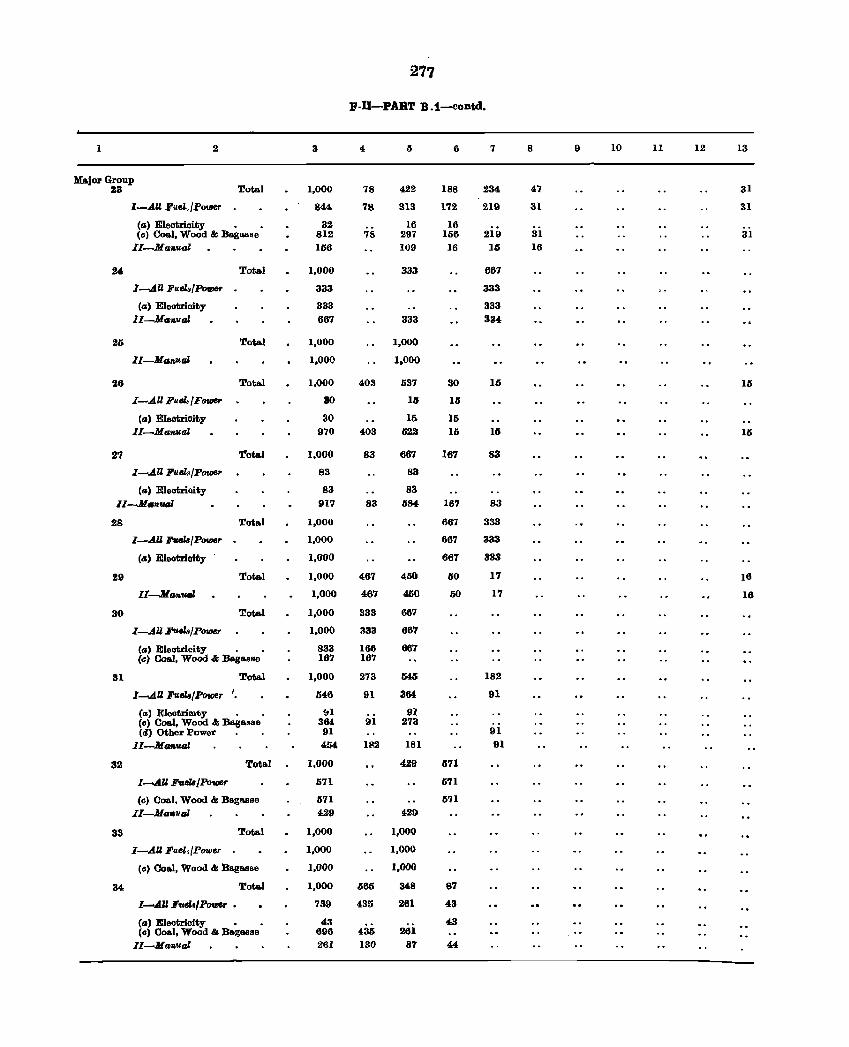
277
p.D-PART B.1-contd.
1 2 3 4 5 6 7 8 9 10 11 12 13
Ma.jor Group :&3 Total 1,000 78 422 188 234 47 31
I-AU Fud._/Power 844 78 313 172 219 al 31
(G) Eleotrioity • a2 16 16 (c) Coal, Wood & Bag .... se 812 78 297 156 219 31 31
II-M a'll/u,al 156 109 16 16 16
24 Total 1,000 333 667
I-AU Fuel./Power 333 333
(a) Eleotricity 333 333 lI-MsnlJal 667 333 334
26 Total 1,000 1,000
II-ManUal 1,000 1,000
26 Tota.l 1.000 403 637 30 15 16
I-AU Fuel.,fFOfII6,. ao 16 15
(s) Eleotrioity 30 15 16 II-Msnual 970 403 622 15 15 16
27 Tot&.l 1,000 83 667 167 83
I-AU FtAelsfPotD6r 83 83
(II) Electrioity 83 83
ll-M."fIal 917 83 684 167 83
28 Total 1,000 667 333
I-AU Fuel8/Poll18r 1,000 667 333
(G) Electricity 1,000 667 333
29 Total 1,000 467 450 50 17 16
Il-MautMJI 1,000 467 460 50 17 16
30 Tota.l 1,000 333 667
I-All FtleZ8/Poll18r 1,000 333 66'7
(a) Eleotricity • 833 166 687 (c) 0011.1, Wood & Bagasse 167 167
31 Tota.l 1,000 273 545 182
I-AU PuelalPrnoer '. 546 91 364 91
(a' EleotriOlty • 1fl 91 (c) 0011.1, Wood & Bagasse 364 91 273 Cd) Other Power 91 ~1
II-MtmfLGl 454 IS2 181 91
32 Total 1,000 429 571
I ........ U FuelsJPotlJf,r 571 5'71
(c) Coal, Wood & Bagasse 571 6'1 II-Ma'lwal 429 i29
33 Total 1,000 1,000
I-AU FUel,/PoweF 1,000 1,000
(c) Coal, Wood & Bagasse 1,000 1,000
34 Total 1,000 565 348 87
[-AU F~/PotDlr • 739 435 281 43
(s' 1Illeotrioity • 43 43 (0) Coal, Wood & Bagasse 696 435 261 ..
II-Manual 261 130 87 44
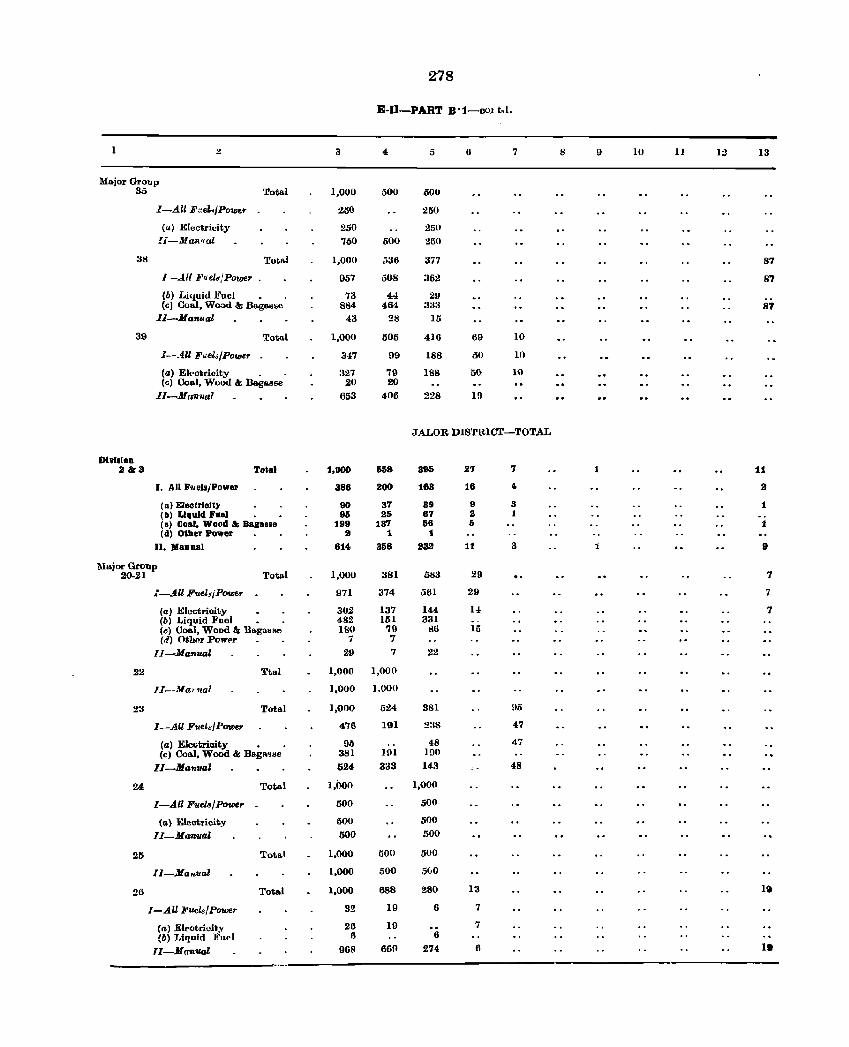
278
E-Il-PART B':1-COI t.l.
1 -, 3 4 ;3 6 7 8 10 II 12 13
Major Group 3a Total 1,000 500 000
I-All F"e1,jPo'Wer 250 :.!50
«(~) Electricity 250 250 Ii-Man'lUl 7aO 500 250
31l TotRoI 1,000 ,.36 377 87
i--AU l!'Ueld/POwe, 957 508 362 8'7
(b) Liquid J!'uel 73 44 211 (cJ Coal, Wood &; Baga..o;o 884 464 333 87
Ii-Manual 43 21l 15
39 Total 1,000 505 416 69 10
1--.411 Fuel;/Power 3-17 99 188 all 10
(aJ EI('otricity _ 327 79 188 50 10 (c) Coal, Wood &: Bagasse 20 20
II-Ma1l1la' 653 4()6 228 19
JALOR DISTRICT-TOTAL
Division 2&3 Total :1,000 558 395 27 7 :11
I. All F·lIel./Power 386 200 163 16 " a (a) Electricity 90 37 39 9 3 1 (b) Liquid Fnltl 95 26 67 Z 1 (c) Coal, Wood &; Bagasse 199 137 56 5 1 (d) Otber Power l!I 1. t
II. Manual 814 358 232 11 3 9
l\lajor Group 20-21 Total 1,000 381 aH3 29 7
I-AU Fuel~iPOtJJe,. 971 374 561 29 7
(a) Electricity 302 137 144 14 7 (b) Liquid Foel 482 151 331 (cj Coal, Wood &: BagaM"e ISO 79 ill! 15 (d) Othllr Powt"r 7 7
II-Manual 29 7 22
22 Tt.sl 1,000 1,000
II--Ma' .. al 1,000 l.OOO
Z3 Total 1,0110 524 381 !l5
I-AU F",el,;/Pott>er 476 191 zas 47
(a) Electricity • 01) 48 47 (c) Coal. Wood &: B&ga~ .. e 381 J.9I 190
II-ManfJGl 524 333 143 48
24 Total 1,000 1,000
I-AU FuelB/POtDer 500 5{)0
(a) Electricit.y 500 500
II-Ma'llfJaZ 500 1)00
25 Tote,l 1,000 500 500
II-Ma .. ual 1,000 500 5(,0
26 Total 1,000 688 280 13 1~
I-AU :b'uel,,/Power 32 19 6 7
(a) Eleotridt.y 26 19 7 (6) Liquid FU('1 6 6
Il-MCl7tval 96~ 660 274 6 1.
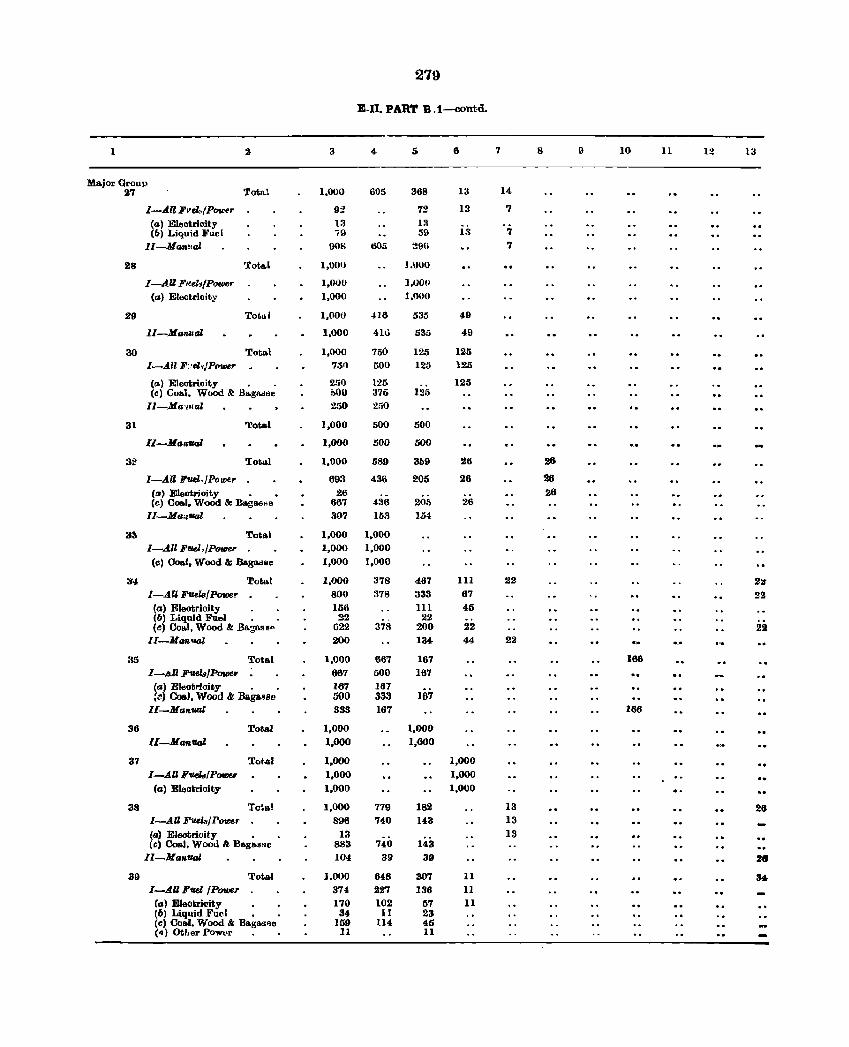
279
E.D. PART B ,1-contd.
1 2 3 4 5 6 7 8 9 10 11 12 1:1
Ma.jor Group 27 Totn.! 1,000 605 368 13 14
I-All Fvel..,IPower 92 72 13 7
(a) Eleotricity 13 III (6) Liquid }'uel i9 59 13 7
II-Ma1waJ 90S 605 2911 7
28 Toto.; 1,000 ],1)00
I-All Fltel./Powe,. 1,000 ],0011
(a) Eleotrioity 1,000 1,000
29 Total 1,000 416 535 49
II-Ma",uaJ 1,000 411i 535 49
30 Total 1,000 750 125 125
I-All F"el.JPr>t»e" 731} 600 125 125
(a) Eleotricity 250 125 125 (e) Coal. Wood & B .. gft.>l~e i>OO 375 125
ll-Ma"7lal 260 250
31 Total 1,000 500 500
II-.Jla/l,fIal 1,000 500 500
32 'Ioto.l 1,000 589 3(19 26 26
I-AU Fue/"jPowe,. 693 436 205 26 26
(!J<) Electrioity 26 26 (e) Coal, Wood &: BagasHe 667 436 205 26
II-Ma;zflal 307 153 154
3:\ Tota.l 1,000 1,000 I-All FPI>d,./powe,. 1,000 1,000 (c) Coal, Wood &: Ba.g8ol!BC 1,000 1,000
lJ4- Tot.t.l 1,000 378 467 III 22 2lf I-AU Fuel8fPowe .. . 800 378 333 67 22
(a) Eleotrioity 156 III 45 (11) Liquid Fuel . 22 22 (e) Coal, Wood &: Bn.~l\s@" 622 378 200 22 22 Il-Man_~ 200 134- 44 22
35 Tota.l 1,000 667 167 166
I-I1U Fuels/Power 667 500 167 Ca) Eleotrioity . 167 167 :t!) CoaJ, Wood &: Bagasse 500 333 167
Il-Ma ... val 333 167 166
36 Total 1,000 1,000 II-ManUal 1,000 I,QOO
37 Tot.al 1,000 ],000 I-AU FueJalPower 1,000 1,000 (a) Eleotrioity 1,000 1,000
38 Tota.l 1,000 779 182 13 28 I-All FuelaJPower 896 74,0 143 13
(a) Eleotrioit.y , 13 13 (e) Coal, Wood It Bagas!le 883 740 143
II-Manflal 104- 39 39 28
39 Total 1,000 648 307 11 :u I-A.U FUel IPower 374 227 136 11
Cal Electricity 170 102 57 Il (11) Liquid Fuel 34 II 23 Cc) Coal. Wood &. Ba.gas~e 159 114 45 ('I) Other Pow .. r 11 11
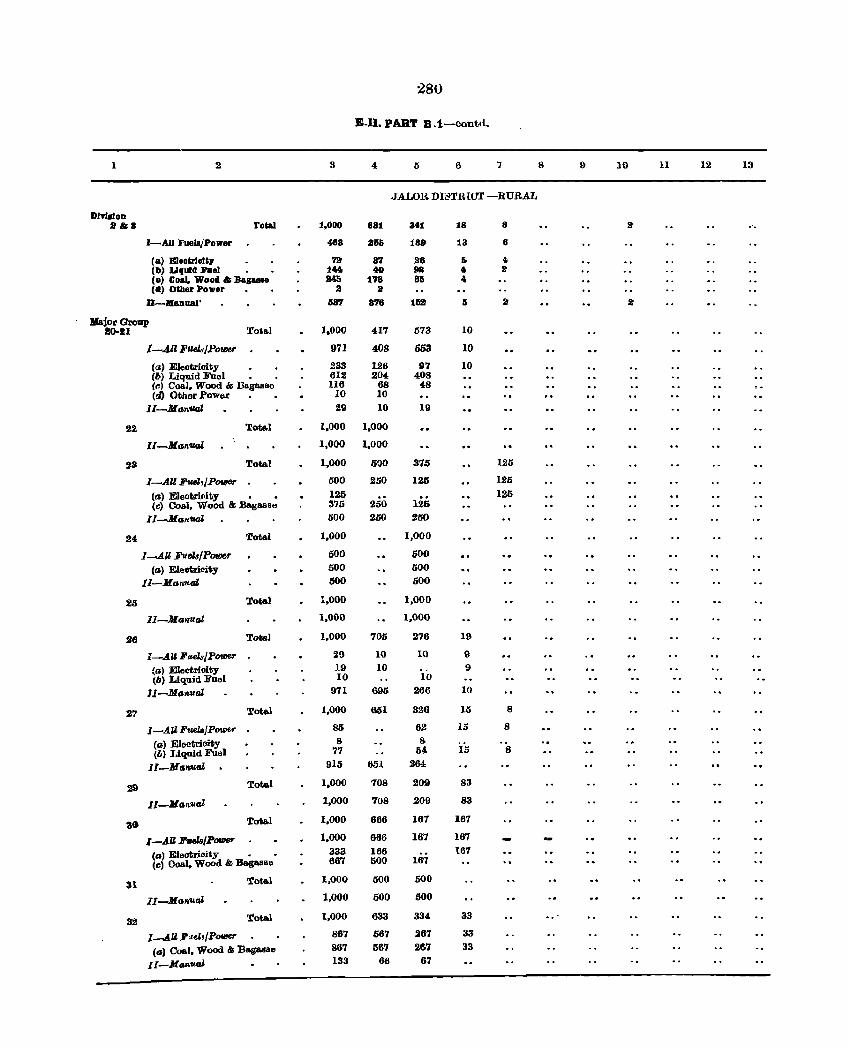
280
Eon. PART B.i-contd.
1 2 3 4 5 6 7 8 9 10 11 12 13
.JALOlt DI8TRIG'T -RURAL
Dlv.laloD 2&;1 Total 1,000 681 341 18 8 a
I-All hell/Power 463 255 189 13 6
(a) E1eeUloUy 7a 37 2S D " (II) LIQuid Fuel 114 40 98 .. a (0) Coal, Wood'" :HagUlle 245 178 65 '" (d) Other Power a a
U-MaDuai' 537 87S 163 5 a a
I!Iajor Group SO-II Total J.OOO 417 573 10
l-All]i'lUl../P()tDer 971 408 653 10
(a) Electricity !l33 126 97 10 (6) Liquid Fuel • 612 204 408 ("J Coal, Wood &; Dagasse 116 68 48 (rl) Other POWf,IX 10 10
II-.JIanual 29 10 19
22 1:ote.l 1,000 1,000
ll-.JIGnua.l 1,000 1.000
,~ Total 1,000 500 375 125
I-A.U FtUl,/Pou;er 500 250 125 125
(a) Electril'i ty • • 125 125 (c) 00,.1, Wood & BagaBBe 375 250 126
II-Manual 500 250 250
24 Total 1.000 1,000
l-All lJ'uelsl POfIJer 600 600
(0) Electricity 500 500
II-Manu. 500 500
25 Total 1,000 I,OnO
II-Ma"utU I,OnO 1,000
26 Totsl 1,000 705 276 19
I-A.U Fads/Power 29 10 10 9
(aJ Electricity 19 10 9 (6) Liquid Fuel 10 10
l1-McsnutU 971 695 266 10
27 Total 1,000 651 326 15 8
I-AU Fuela/Power 85 62 15 8
(a) Electricity 8 8 (hi Uquid Fuel 77 54, 15 8
II-MCln.1ltU 915 651 264
29 Total 1.000 708 209 83
II-MClnuGI 1,000 708 209 83
36 Total 1,000 666 167 167
I-All J!'u.elsIPOIDSr 1,000 666 167 167
(a) Eleotricity • • 333 166 167 (e) Coal, WoOd & Bagasse 667 500 167
31 Total 1,000 500 500
II-Manual 1,000 500 500
32 'total 1,000 633 334 33
I-AU F<.Id./P_r 867 567 267 33
(0) Coal, Wood & Bagasse 867 567 267 33
II-M.nllo.l 133 66 67
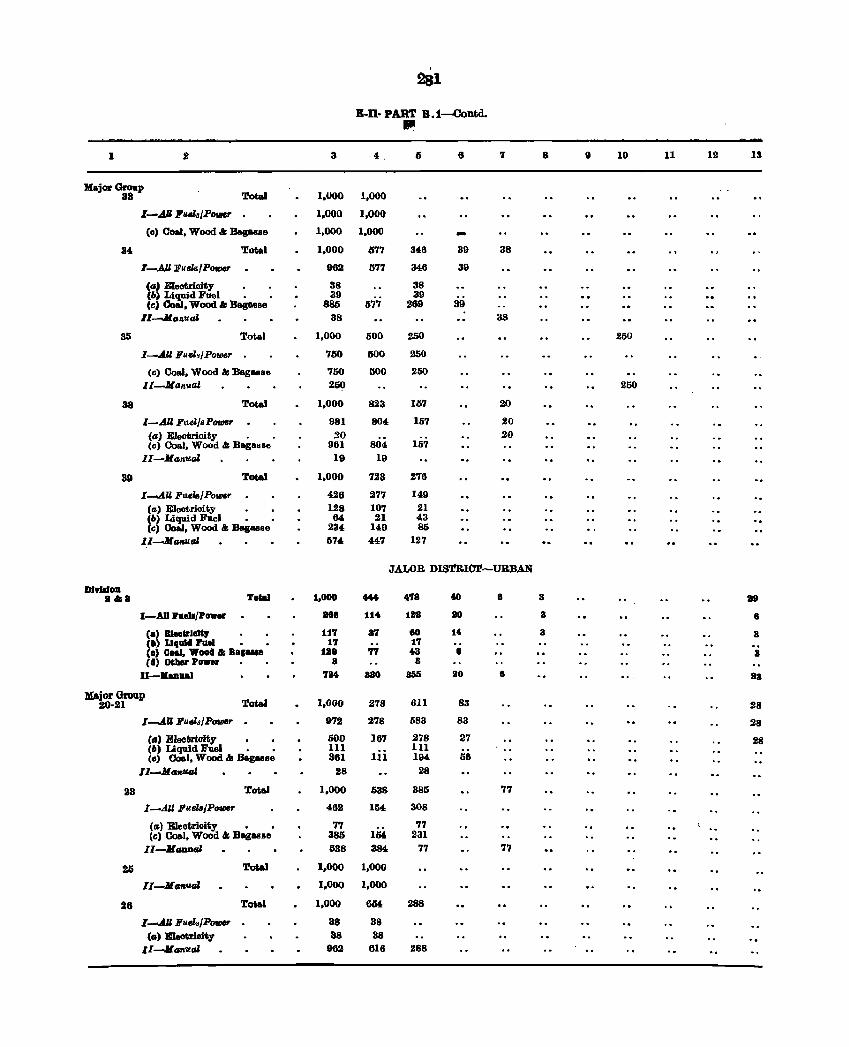
281
E-II· PART B.1--Contd. III
I 2 3 4. ,; 6 7 8 9 10 11 12 13
MajorGroap 33 Total 1,000 1,000
I-AU ,uakJ/P_ 1,000 1,000
(0) Coal, Wood a: BagBBse 1,000 1,000
34. Total 1,000 577 346 39 38
I-AJJ FuslslP_ 962 577 348 39
(a) Eleotrioity 38 38 (6) Liquid Fuel • 39 39 (c) Coal, Wood a: BagBBse 885 577 269 39
II--MalluaJ 38 38
35 Total 1,000 500 250 250
I-AU FueZs/Power 750 600 250
(0) Coal, Wood &1 BagaBle 750 500 250 II-Mallual 250 250
38 Total 1,000 823 167 20
I-AZI Fuel/s POI/J6,. 981 804 157 20 (tI) Electrioity . 20 20 (c) Coal, Wood &1 Bagasse 961 804 157
II-ManuaZ 19 19
39 Tot&l 1,000 723 276
I-.AU Fuels/Pow,. 426 277 149 (a) Electrioity • 128 107 21 (6) Liquid Fuel • • 64 21 43 (c) 008.1, Wood &1 Bagasse 234 149 85
II-MalluaZ 574 447 127
JALOR DISTRIO'l!-URBAN
0I ..... 0D .... Total 1,000 tM 4'18 to 8 3 89
I-AU I'aell/Power 888 114 183 80 3 8
(a) B1eo&rlcl&7 117 37 80 14 3 8 (II) Uqultll'uel 17 17 (e) GoaJ. Wood .. Bagaue UI8 '1'1 48 8 a (d) O*her Power a a
n-llallual 784 380 855 20 8 8a
lbjOl'Group Total 1,000 278 611 83 20·21 28
l-.AII Fucl8/POI/J6" 972 278 583 83 28
(II) Elecf;rioity 000 167 278 27 28 (6) Liquid Fuel • • III
1ii III
(0) Coal, Wood a: Bag_Be 381 194 56 II-Ma",uaJ 28 28
23 Total 1,000 538 385 77
I-AU FudBjPOI/J6" 462 154 308
(II) Eleotrioity • • 77 77 (c) Ooal, Wood &1 Bag8llBe 385 164 231
II-JL annal 538 384 77 77
25 Total 1,000 1,000
Il-JL IIIIUGl 1,000 1,000
28 Total 1,000 6M 288
I-AU Fuels/P_ 38 38 (0) Eleotrioity 38 38
II-JLtlnuaZ 982 616 288
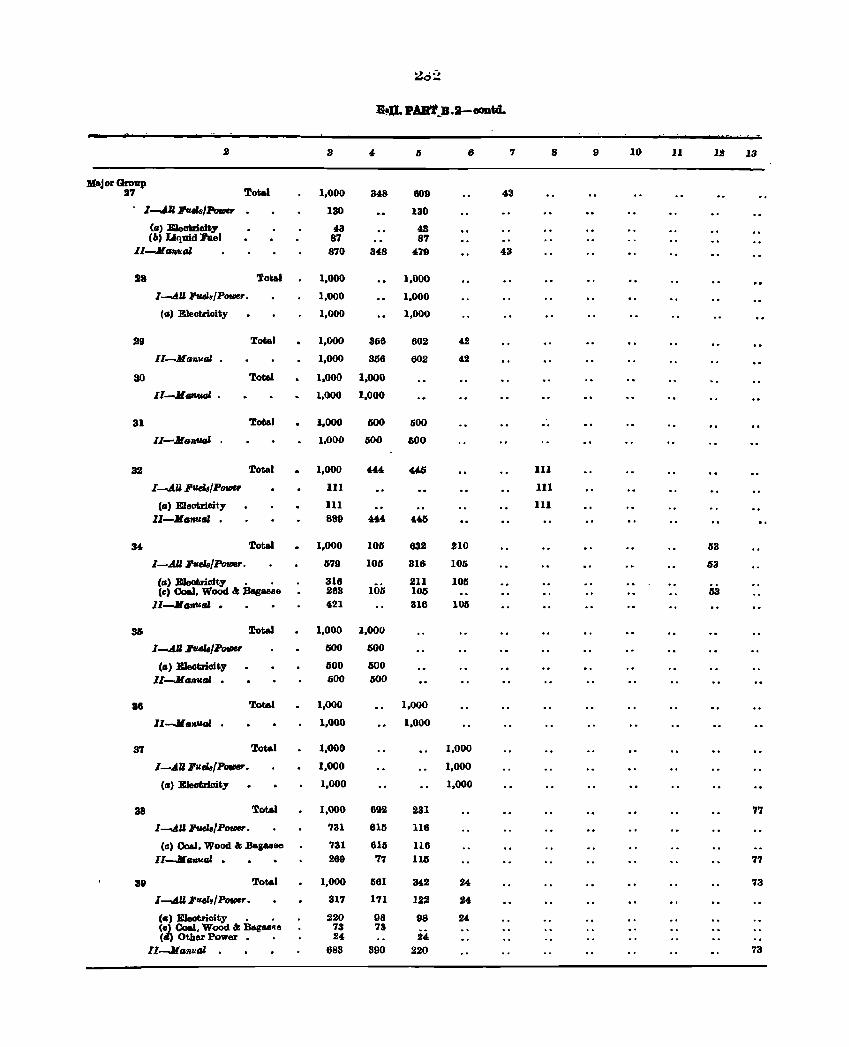
~d::!
E~II. PAB'l.B.S-aontcl.
J 3 4 6 7 8 9 10 11 12 13
MaJor Group 27 Total 1,000 348 BOD 43
I-J.ll ~/PouIer 130 130
Ca) lUeotriaity 43 43 (6) Liquid lI'uel 87 87
LI-MGnfl.tIl 870 348 479 43
28 Total 1,000 1,000
I-.AU F'vela/P_r. 1,000 1.000
(.) Eleotrioity 1,000 1,000
29 Total 1.000 366 602 42
ll-Manutll . 1.000 356 602 42
30 Totel 1.000 1.000
II--M tToAV.Gl • 1.000 1,000
31 Total 1.000 600 1i00
ll-JlGnvtll 1,000 1i00 600
32 Total 1,000 444 4411 III
[-.AU lfUds/POIIM 111 111
(a) Eleotriaity 111 111 ll-JlGnUGI • 889 4&4 445
34 Total 1.000 106 632 210 53
I-AU F-uel&/PoIDer. 579 105 316 106 53
(0) Eleotrioity • • 316 211 105 (c) Coal, Wood a: Bagasse 263 105 lOts 53
II-JlG1Iutll • 421 316 105
as Total 1,000 1,000
[-.AU J'uIa/POllM 500 500
(II) EIeotrioi ty 500 500 II-MGnutll . 500 500
86 Total 1.000 1.000
Il-Jlonulil 1,000 1.000
37 Total 1.000 1,000
l-.All ,lI.eI&f P(1IIJer. 1,000 1,000
(.) Eleotriaity 1,000 1.000
38 Total 1,000 692 231 17
I.......AU Fv.eI&/P_. 731 815 116
(c) Coa.I, Wood a: .Bagasse 731 8US 118 Il-Ma'Jl.1J.Gl . 289 '17 115 71
89 Total 1,000 561 342 24 73
l.......AUPuels!Power • 317 171 122 24
(.) EIeotricity • • 220 98 98 24 (c) Coa.i, Wood a: Bagas~e 73 73 (4) Othez Power 24 24
[I-Manual . 683 390 220 73
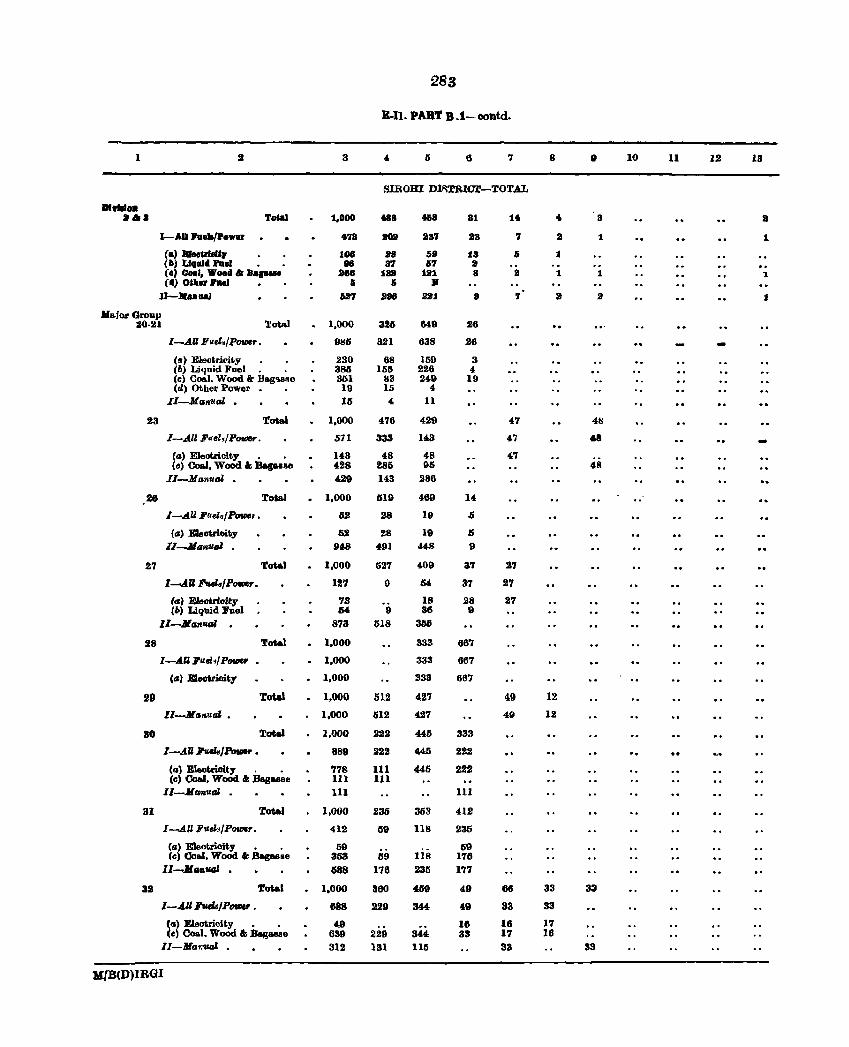
283
E-n. PART B .1-oontd.
1 3 4 6 6 7 8 9 10 11 12 13
RIBORI DI~'l'RIC'l'-TOTAL
DI .... o. 3411 Total 1,000 688 458 81 140 40 8 a
I-AD hell/Power 4078 aoa 237 28 7 a 1 1
(.) .... UWt, 1H lIB 59 18 5 :f (II) LIquid Fae! 88 87 67 3 Ce) Coal, W0a4 Ir B.' .... 288 182 121 8 a 1 1 "1 Cd} O*llH Fae! " 6 If .
lI-.uuaJ &37 388 U.1 8 7 2 .2 .1
lIa.jor Group 20·21 TOMI 1,000 326 649 26
l-AU IJ'lJel./POfIIflr. 986 321 638 26
(If) Eleotri .. ity 230 68 169 3 (6) Lj'lu;d Fllel. . 386 156 226 4 (e) Coal. Wood & Bag'>880 351 83 249 19 (d) Other Power 19 15 " Il-Mgnug/, 0 15 4 11
2.1 'lotal 1,000 476 429 47 41:1
I-All F«els/Power. 571 333 143 47 &8
CG) Eleotricity . • 143 48 48 47 (c) Co..!, Wood &; Bag.eae 428 286 96 48
II-Manual • 429 143 286
28 Total 1,000 lSID 469 14
I-AU puel4PafDtl' • lUI 28 19 0
(a) EJeotriClity 52 28 19 5 Z.I-Manual • 9118 491 448 I)
27 Total 1,000 527 409 37 27
1........t1l :Jf'uL./P_ro 127 !) 54 37 27
(tI) Eleotrioity 73 18 28 27 (6) Liquid Fuel 54 9 36 9
II-Man~ 873 IU8 305
28 Total 1,000 333 667
I-AU pueJ./P_ 1,000 333 667
(a) Electricity 1,000 333 667
29 Total 1,000 512 427 49 12
ll--Manual • 1,000 512 427 49 12
30 Total 1,000 222 445 333
I-AU Puek/Power 0 889 222 445 222
(a) Bleotrioity . • '178 III 445 222 (c) Coal. Wood. &: Bagaese 111 HI
ll-Manual • 111 111
31 Total 1,000 230 363 412
l--.AU Fuel./Power. 412 59 118 235
(a) Elecm,oity • . 69 ti9 Ccl Co..!, Wood &: .Bagaeae 353 59 118 176
II-Manual 0 688 118 235 177
32 Total 1.000 360 459 49 66 33 33
I-.All F_IPOfI/U' . 688 229 344 49 33 33
(a) EleotrioUy • • 49 18 16 17 (e) CClal. Wood &I Bagaese 639 229 344 33 17 16
lI-Mar._ 312 131 1I5 33 33
MlB(D)lRGI
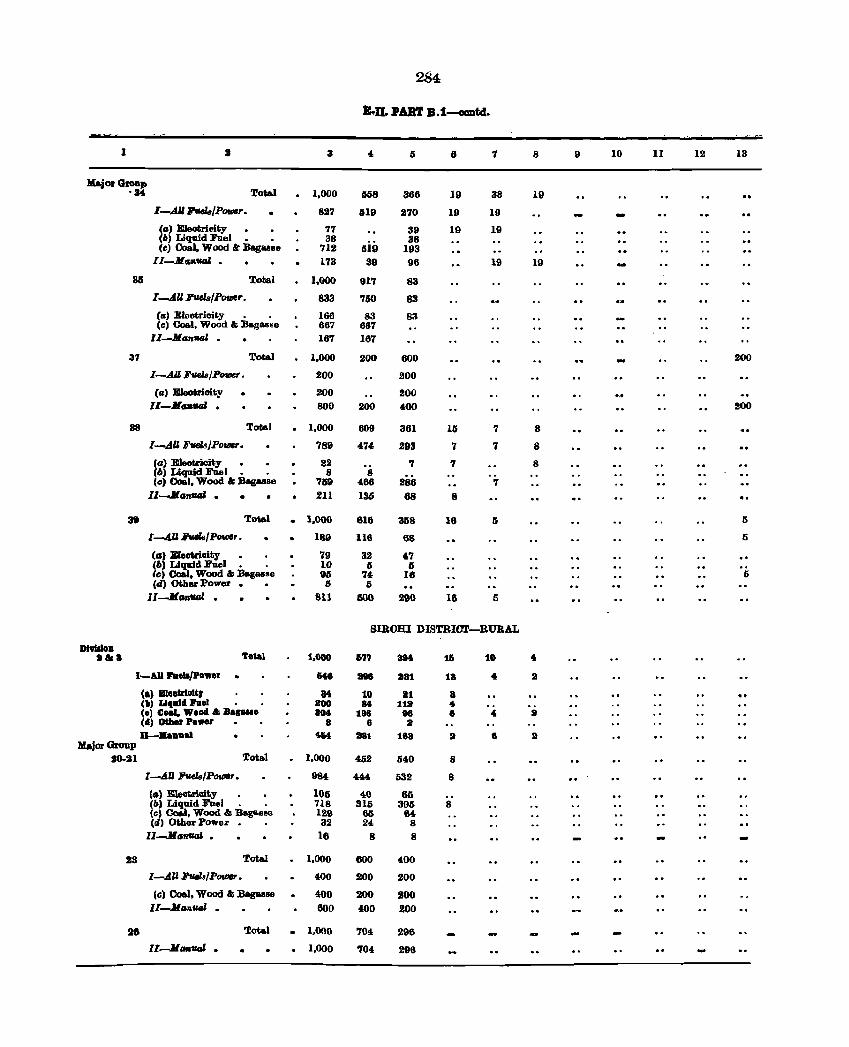
284
JI: .. u. PABT B.l--cxmtd.
I 3 5 8 7 8 9 10 11 12 13
M&jor Groap '34 Total . 1,000 558 366 19 38 19
I-AU :I'tIeJB/P0VJ4r. 827 519 270 19 19
(G) Eieotri.oity • 77 39 19 19 (6) Liquid Foel. • 38 38 ell) Coal, Wood.t BagUBB 712 519 193
II-JL'.J.'rI:" • 173 39 96 19 19
33 Total 1,000 917 83
I-AU Ji'Uels/P0VJ4r. 833 750 83
(II) Electricity • . 166 83 83 (c) Coal. Wood & Bagasse 667 667
II-MGnUGl • 167 167
37 Total 1,000 200 600 200
I-AU F1Ida/Power. 200 200
(G) E1eotrioity 200 200 II-M __ •
800 200 400 200
38 Total . 1,000 609 361 15 7 8
I-.4U FveI8/Powr. 789 474 293 7 7 8
CG} Eleotricity • 22 ., 7 8 (6) Liq1lid Fael. • 8 8 (c) Coal, Wood & Bagasse 7159 466 286 7
lI-JlG"'_ • • 211 llili 68 8
39 Total · 1,000 616 358 16 5 5
[-AU JI'VtIa!P_r. 189 116 68 5
(a) BIeotrioity 79 32 47 (6) Liquid FUel. . 10 5 I) (c) Coal. Wood " Bagasse 95 74 16 5 (d) Other Power. • IS 5
II--Jil1J7l1lGl . 811 500 290 16 5
SmOHI DISTRICl-BURAL
D1v111oll 2111. Toal 1.000 &71 aM 11i 10 40
I-AU hell/Power 64.8 21118 2181 18 4 :II
{a) Ble_1II1, • H 10 a1 • (II) Llqlllll Filal • 200 1M 1121 .. (a) Coal, Wood. & Bac_a 8040 198 86 8 4 :I (Ill) O&har Power 8 6 a 1I-••• lIa1 4M 281 188 3 8 3
Major Group 20-21 Total · 1.000 452 540 8
I-AU Fuas/Power. 984 444 532 8
(s) Eleofirioity 105 40 65 (II) Liquid FUel. . 718 315 395 8 (c) ~, Wood " Baga.sse 129 66 64 (el) Other POwer. • 32 24 8
lI-Jlr¥411GJ • 18 8 8
23 Tota.l · 1,000 600 400
I-A.U :Futls!P_. 400 200 200
(Il) Coal, Wood " Bagasse 4DO 200 200 II-JtlG,.ual • 600 '00 200
28 Total · 1,000 '704 296
II-M""tI4l • · 1,000 '704 296
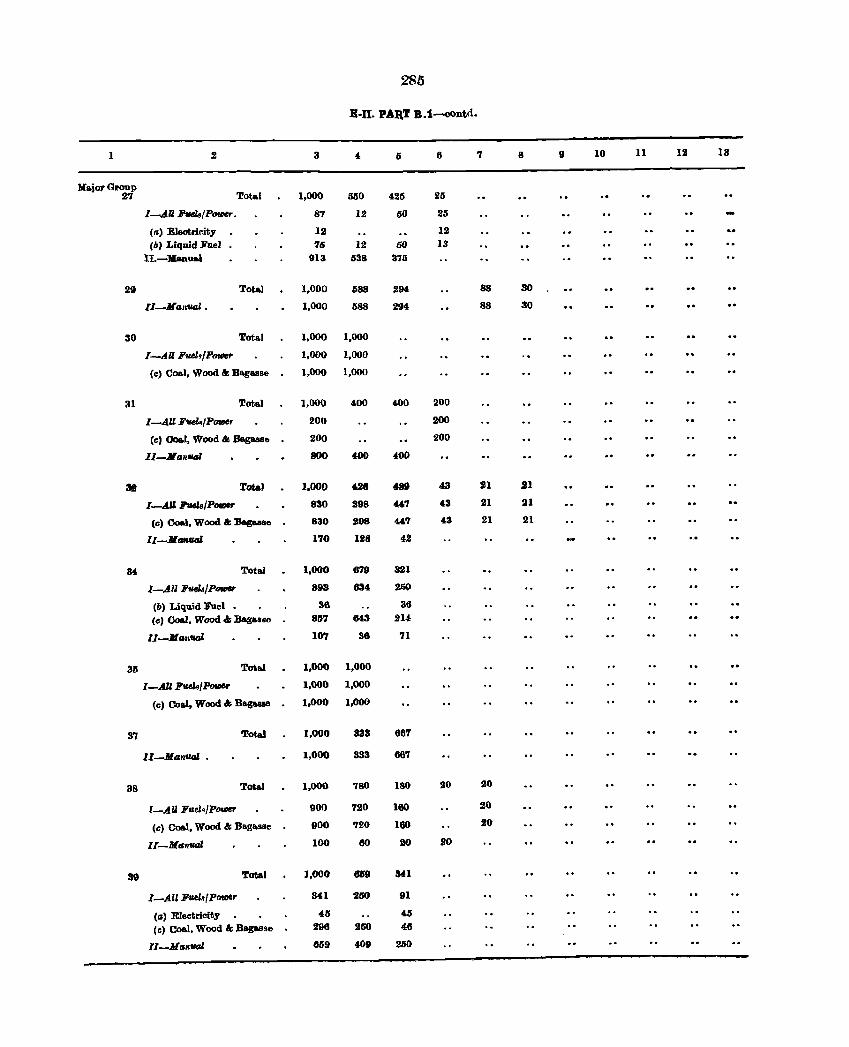
285
B·n. PAB,T B.1-contd.
1 2 3 5 6 7 8 9 10 11 12 13
VajorGroup 27 Total 1,000 550 425 25
I-A.U Fuds/P_. 87 12 50 25
(a) Eleotrirjty 12 12 (b) LiqlJid FueJ 76 12 60 13
1I.-lIa.nual 913 538 375
29 Total 1,000 588 294 88 30
ll-Ma.uual . 1,000 588 294 88 30
SO Total 1,000 1,000
I-AU Fu.el./P_,. 1,000 1,000
(e) Coal, Wood &: Bagasse 1,000 1,000
31 Tot,a) 1,000 400 400 200
I-AU Fvelo/PotDer 200 200
(c) 0061. Wood & Bagasse 200 200
II-Manual 800 100 400
31 Total 1,000 428 Dt 43 21 21
I-AU FtHlsjPOfII8r 830 298 447 43 21 21
(c) Coa.l, Wood &: Begaale 830 298 447 43 21 21
lI-NGtlvaJ 170 Ul8 42
34 Total 1,000 679 321
I-All ~/PofI1er 893 634 2JIO
(II> Liquid Fuel • 36 36 (c) Coal, Wood & Bagasse 857 643 214
ll-JlanvaJ 10'7 38 71
35 Total 1.000 1,000
I-AU lJ'ud.'J/POfII8r 1,000 1,000
(c) Coal. Wood & Ba.ga.ase 1,000 1,000
37 Total 1,000 333 66'7
lI-Manual 1,000 333 88'7
38 Total 1,000 780 180 20 20
1-AU FuehlPower 900 720 160 20
(c) Coal, Wood &: Baga.sse 900 720 160 20
II-Manual 100 80 20 20
39 Total 1,000 8IJ9 lUI
I-All Fuels/power 341 250 91
(a) Electricity 45 45
(c) Coal, Wood &: Bagasse 296 250 46
II-ManflQl 659 409 250
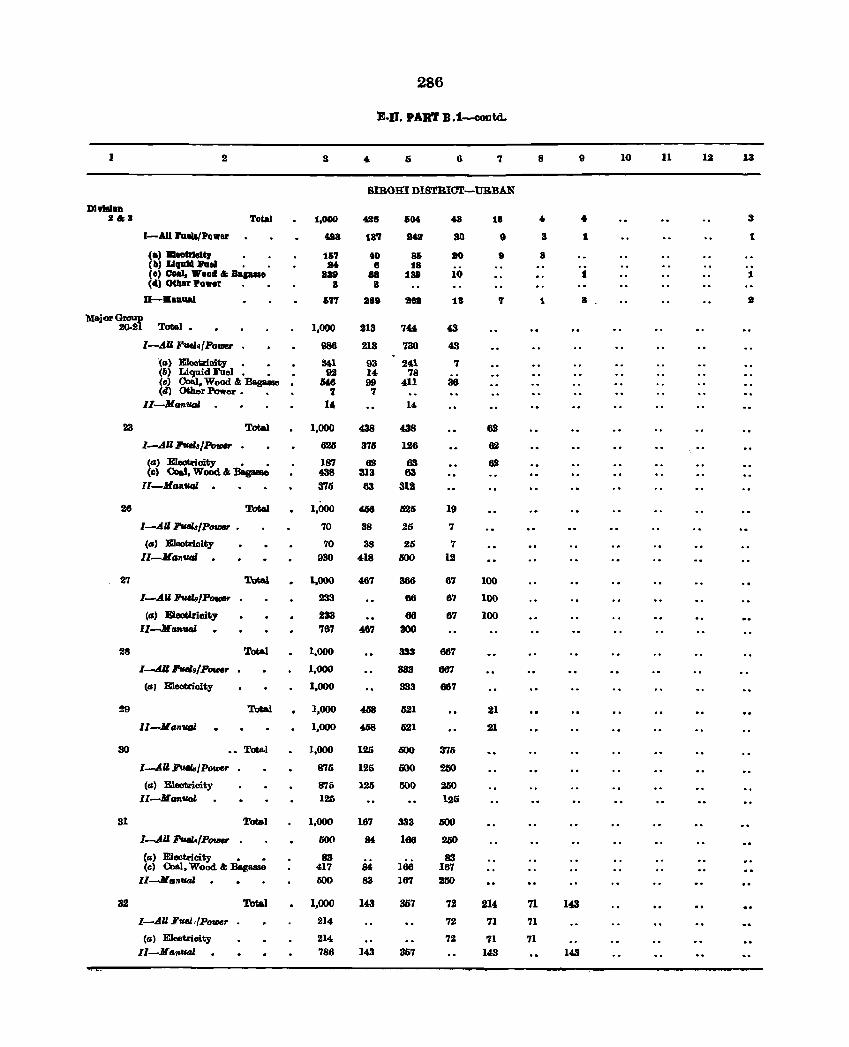
286
E.P. PART B.1-coPtd.
1 2 3 4- 5 6 7 8 9 10 11 12 13
BlOORI DISTRI(7l!-URBAN
D19b1DD 2&8 Total 1,000 as 604 +8 18 • • 3
I-AU 1'a.elaIPowar Da la, 848 80 e 8 1 1
(a) BIeetrIeHJ 1li7 10 8Ii 80 9 a (.) Llllldd hal 8. 8 la (I) Coal. Wooel & aa,_. sa. 88 188 10 1 1 (4) Other Power 8 IS
D-Banual 677 liS. :lisa 18 7 1 II 8
'Majar Group 20-21 Total • 1,000 213 7(4 43
I-AU "_~IPoVIU 986 213 730 43
(II) Eleotrioity Ml 93 241 '1 (b) Liquid Fuel. • 92 14 78 (c) Coal. Wood & ~ N6 99 411 36 (tl) Other Power • • , 7
II-Man'llGl 1, 14
23 Total 1,000 438 438 82
I-.dU FWh/P_ 626 376 126 62
(0) Eleotrioity • • 187 62 63 62 (c) Ooal, Wood & l3agaaie 438 313 63
II-MaJlfMJl . 375 63 312
26 Total 1,000 ~ li2li 19
I-All FvelaIP_r • 70 38 25 7
<a> Eleotrioity 70 38 25 7 1I-Ma"UQl 930 418 IJOO 12
27 Total 1,000 467 366 67 100
I-AU FwLIP_r 233 86 87 lOll
(a) Eleotirioity 233 66 67 100 lI-MlI~ual 787 467 300
28 TotaJ 1,000 333 867
1-.dIlIl'wl.jP_r 1,000 333 667
(tS' Eleotrioity 1,000 333 867
29 TQ&al 1,000 458 621 21
11-11 tl7I'II4l 1,000 458 621 21
30 " Tota.I 1,000 120 500 375
[-AU Ji'uel",JP_r 875 126 500 250
(tS) Electricity 875 125 500 250 II-M_uoZ 125 126
31 Total 1,000 167 333 mo 1-All F..z../P_r 500 8& 166 200
(II) Electricity • • 83 as (c) <ll&l, Wood & Bagasse 417 8& 166 167
ll-llanual liOO 83 167 230
as Total 1,000 143 367 72 214 71 143
I-A.U Fuel ,IPo_r 214 72 71 71
(0) E1ect.rioity 214 72 71 71 II-Monual 786 143 357 143 143
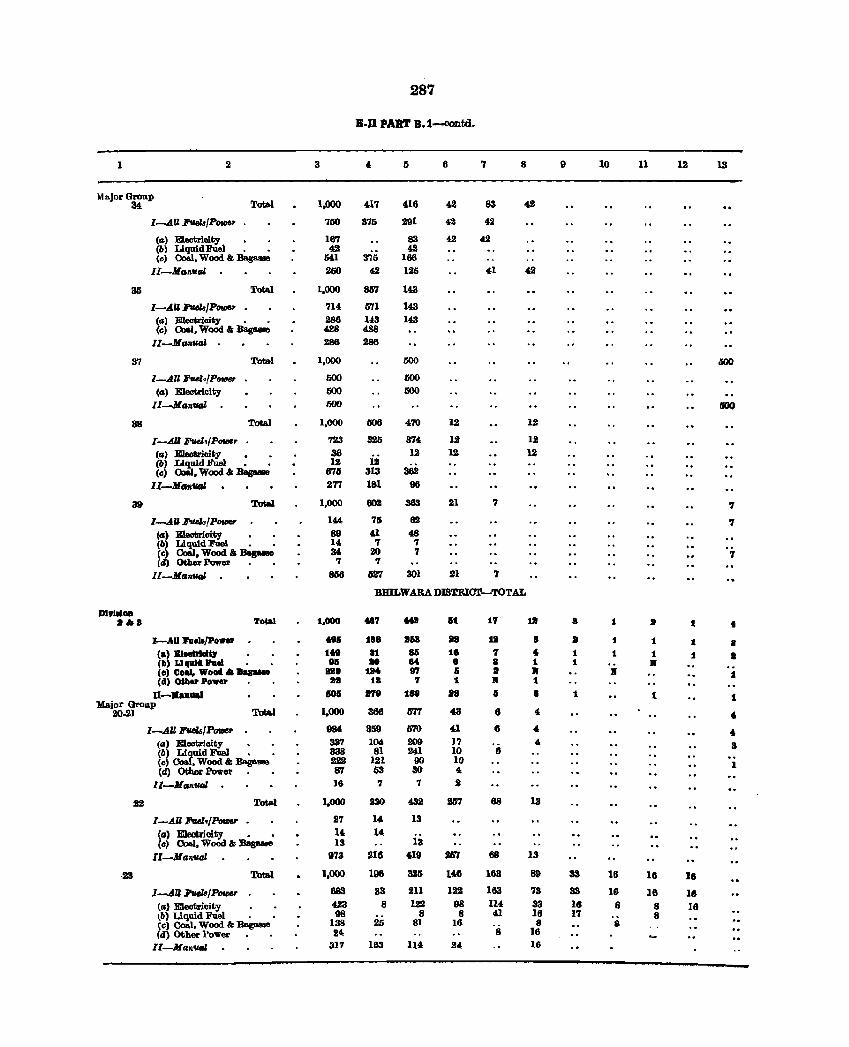
287
E.D PART B.1-contd.
1 2 3 5 6 8 9 10 11 12 13
"'"jor Gronp 34. Total 1,000 417 416 42 83 42
I--tll Pvels/P_r '150 3'15 291 42 42
(os) Eleotrioity 167 83 42 42 (b) Liquid Fuel 0 • 42 42 Ie) Coal, Wood & Ba.pue 541 376 186
II-JlGnalll 250 42 125 41 42
36 Total 1,000 85'1 143
I-AU FueI&/POU1&r 714 571 143 (os) Electricity 0 0' 288 143 143 (el 0.1, Wood" Bagaaae 428 428
II-MputU 286 286
37 Total 1,000 500 IiOO
I.-fll Ftul./PotDet 500 500 (a) Electrieity 500 500
Il-JIGn_ 500 500
38 Total 1,000 tI06 4'10 12 12
I-.A.Il Ii'wl./P_r 723 325 374 12 12 (II) EIeotrioity • 0 36 12 12 12 (b) ~lIidFUel • 0
12 12 (0) , Wood & Bas- 673 313 362
1I-.JI1IB_ 2'17 181 96
39 Total 1,000 602 363 21 7 7
I--tll FtuL/P_ 144 76 82 7 (G) BIeotrioity • 0 89 41 48 (b) Liquid Fuel 0 0 14 7 7 (c) Olal. Wood" Bas- 34 20 '1 7 (II) Other 'Power 7 7
II-JlGn_ 858 627 301 21 7
BHILWARA DISTBIC'r-TOTAL
Dlvlldoa ."'. Tolal 1,000 4087 MIl 111 17 18 8 1 • l t
I-AUhU!Po_ 0& 18' .&8 Sl8 18 I 3 1 1 l I (a) Bleetrleltr I" It &Ii II '1 4 1 1 1 1 I (b) Llqalll he! • H 10 I' 8 8 1 1 • (0) Coal. WOM ,. Bal_ UB 18. B'1 & • K • 1 (d) Oilier PDwer :n IS T t • 1
U-lIuaal &06 8ft 188 18 6 • 1 1 1 'Major Group
20·2) Tut&l 1,000 366 577 43 6 4 , I-AU 1!tId.s/P_r 984 359 570 oil 6 4 ,
( .. ) Electricity • • 337 104 209 17 4. 3 (b) J!?uid Fuel 0 0
338 81 241 10 6 (c) , Wood & Ba.ga_ 222 121 90 10 1 Cd) Other Power 0 • ffI 63 30 4.
ll-H .. n'lllll 1& 7 7 2
22 Total 1,000 l!3O 4.32 257 88 13
I-AU Fvd./P_ 27 14 13
(0) Electricity • • 14. 14 (c) Coal, Wood & Baga.e 13 13
II-JIGnual 973 2111 419 257 fl8 13
,23 Total 1,000 198 3.25 U.6 183 89 33 18 111 18
l--All Fa.lB/P_ fl83 33 211 122 163 73 33 18 18 18 (a) E1ectrioity 0
423 8 IllS 98 114 33 16 8 8 16 \b) Liquid Fuel 0
98 8 8 41 16 17 8 t c) Coal, Wood & 'Ba.gaI!ae 138 25 81 16 8 $ (eI) Other Power 24 8 16
II-Man'IUII 317 183 114 24 16
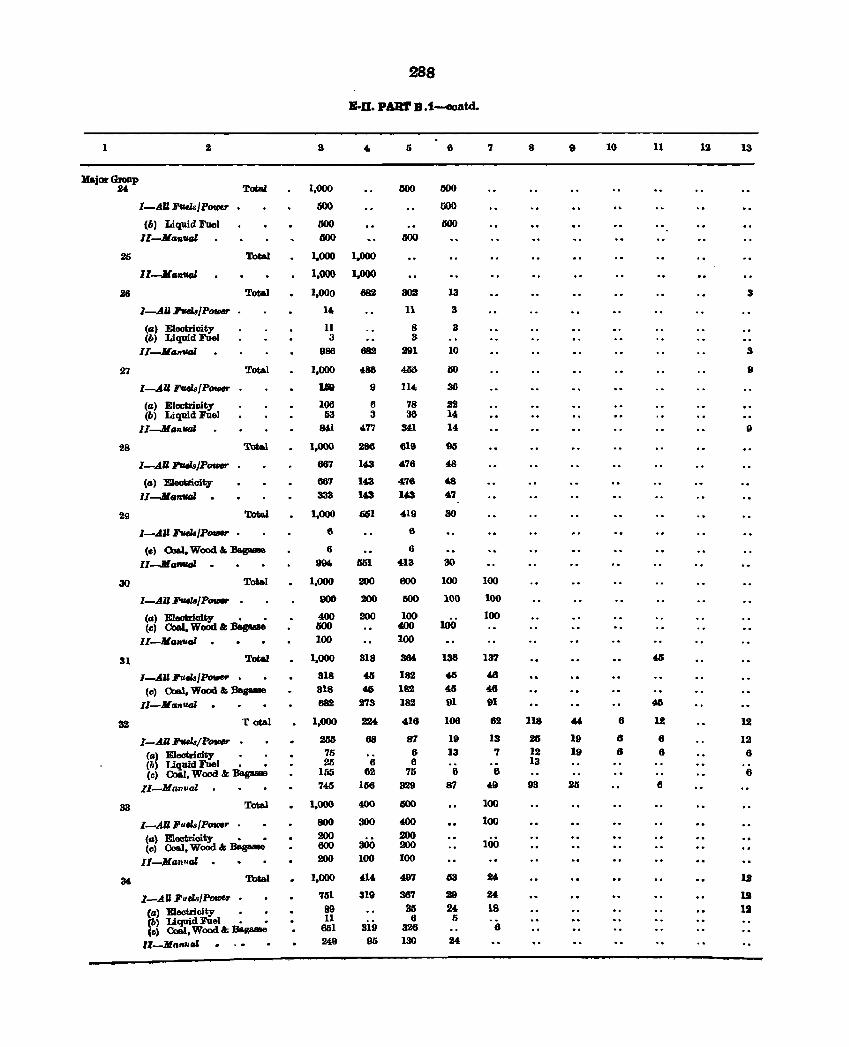
288
B·D. PA1l'I' B.1--ooatd.
1 2 3 5 «I ., 8 9 10 11 12 13
Major Group 24 Total 1,000 600 500
I-AU FtAdsJPOV1U' 500 IiOO
(6) Liquid Fuel 600 IlOO II-ManUGl 600 500
26 Total 1.000 1,000
ll-JI afl'lfGl 1,000 1,000
26 Total 1.000 68lI 302 13 3
1-AU 1!'tId.s/PotDe,. 14. 11 3
(a' Electricity 11 8 3 (6) Liquid FUel 3 3
II-MantAGl 986 682 291 10 S
27 Total 1,000 486 450 50 9
1-AU~{P_ U8 9 114 36
(a) Electrioity 106 6 78 22 (1I) Liquid FUel 53 3 36 14
lI-ManllGl &1 477 341 14 9
28 Total 1,000 286 619 95
I-AU PwcIsJP- 687 143 476 48
(a) Electricity 68'7 143 4'76 48
1I--.M"1ItMJl. 333 143 143 4.7
29 Total 1.000 661 419 30
I-All PwcIs/P_ 6 6
(l) 00&1. Wood &; :aa.g._ 6 6 11-.M. __ 994 551 413 30
30 Total 1.000 200 eoo 100 100
I-AU :F'tI4l8/P_ 900 200 IiOO 100 100
(a) E1eotricit,. • • 400 200 100 100
100 (e) Coa.I. WoOd " Basuse IlOO 400
lI-Manual . 100 100
31 Total 1.000 318 364 136 137 4IS
I-AU FlJ.w/~ 318 4IS 182 4IS 48
(e) Coal. Wood &;:nas- 318 46 182 4IS ~
II-Manual 682 2'73 182 91 91 46
32 Total 1,000 224 416 106 62 118 *' 6 12 12
I-AU JiItHlajP_ 2M 68 87 19 13 26 19 6 6 12
(tI) Electricity • 75 6 13 '1 12 19 8 6 6 (b) liquid FUel • • 25 6 6 13 (c) Coa.I, Wood &; Bagasse 155 62 75 8 6 6
.lI-1t/aTlutll 745 156 329 87 49 93 2IS 6
33 TotaJ 1,000 400 IlOO 100
I-AU F uw/l'otI1e,. 800 300 400 100
{a) Electricity • • 200 200 100 (cl Coal, Wood &; BagaMe 600 300 200
II-Man1lal 200 100 100
34 Total 1.000 414 497 G3 24 IS
I-All Fuds{PotDer '151 319 367 29 24 12
(tI) Electricity 89 35 24 18 12 (b) LiquidFuel • • 11
3ii! 6 5
te) Coal, Wood &; BagaaIe 661 326 6
II_ManngJ 249 96 130 24
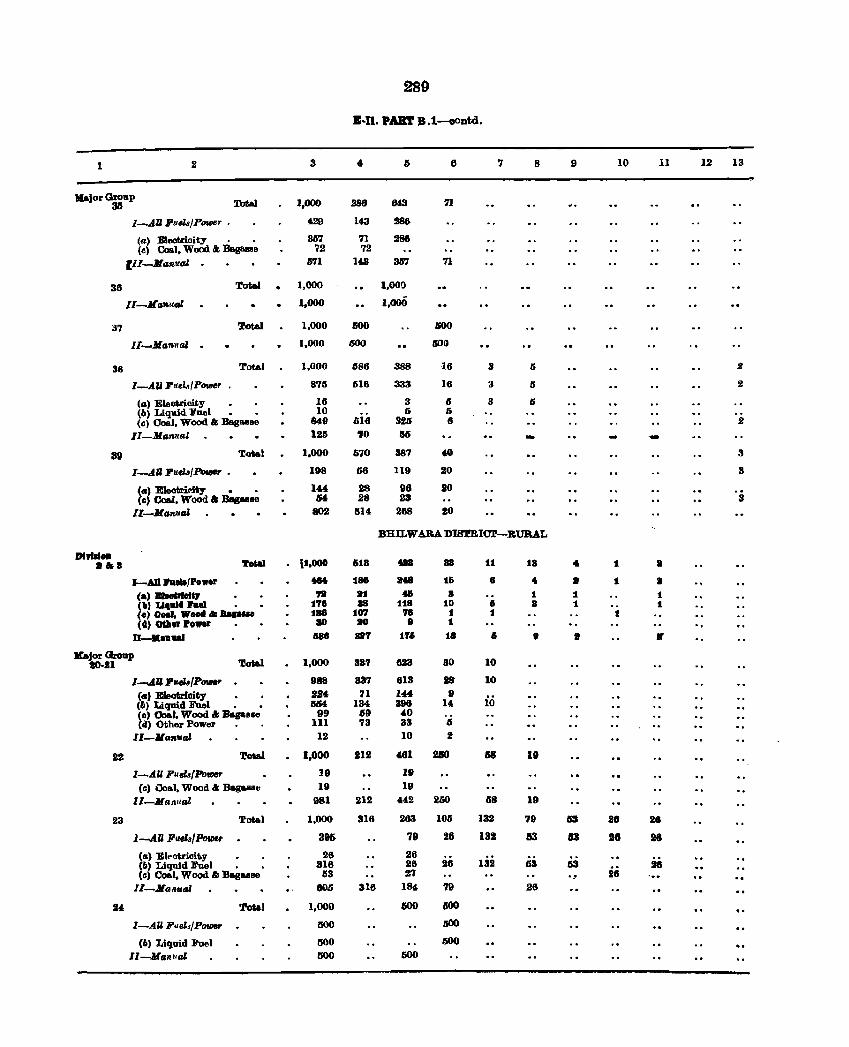
289
B-U. PART B.1-contd.
1 3 6 '7 8 9 10 11 1.2 13
Kajor GrollP 3tI Tot.&J I,OOf) 286 643 71
I-A.ll Fu"_~/Power • 429 143 286
(a) Electrioi ty • • 3D7 71 286 (c) Coal, Wood &; Ba.gtlIIIIe 72 72
III-Ma'RuaJ . 671 Ita 35'1 71
38 Total 1,000 1,000
II-JCaf&u"z 1,000 1,000
a7 Total 1,000 IlOO jJ()()
II_Ma1lilal . 1,000 600 600
38 'rot .. 1 1,000 1186 388 16 3 5 2
I-A~i ruel../power 875 516 333 16 3 5 2
(a) Eleot.ri.oity 16 3 IS 3 IS (6) Liquid Fuel • 10 6 15 (c) CoaJ, Wood &; BaglWlae 849 SI6 31lS ., 2
II-Manual 125 to 155 .-39 'lota.l 1,000 570 387 .0 3
I-A.ll rud.t / PouIsr • 198 66 119 20 3
(4) Eleotriclty • • 144 28 96 20 (c) CoeJ, Wood" Bapele lH 28 23 3
Il-Jla1waJ 802 1514 288 20
BHILW ABA DISTRICT-RURAL
DJJIII ..
••• 'l'otaI it.,OOO 61a ... a II 11 t.a .. 1 • I-AD htIJ/Power ... 188 •• 16 8 .. • 1 I
<a) BIeePteIq 7B 2:1 406 a 1 1 t (') Uqlll« I'1IeI • t'18 as liB 10 Ii a 1 1 (0) Goal, Woed • BapNe 188 107 7. 1 1 ! (t) 001" .OWlf 3D 20 8 1
U-"aua' aae 81'7 17'6 1B 6 • • • KajorGroup
to·Jl 'rota.] 1,000 337 623 ao 10
]...._tll :ruchfP_r 988 337 813 18 10
(4) Eleof;rlaity as4 71 144 9 io (6) Liquid FUel • • I5lH 134 396 14 (0) Coa.I, Wood" Baga1lSe 99 &9 40 (d) Other Power III 73 33 IS
II-Manuai 12 10 :I
22 Tota.! 1,000 212 461 2SO 118 It I-AU FuelslPo_ 19 19
(c) lJo .. I, Wood" Hagus., 19 19
II-Man.ual 981 212 442 200 tl8 19
23 Total 1,000 318 263 105 132 79 153 26 2.
l-AU ]luels/Pow, 396 79 26 132 153 153 21 28
(a) El ... ctrioit.y 26 28 (6) Liquid Fuel • • 318 28 26 132 63 tIS 26 (0) Coa.l, Wood &: Baguae tl3 21 ._. 26
II-MtMfl.ai 80S 316 184 79 26
24 'l"otI.1 1,000 IiOO 6(lO
I-AU Fue1,4POID8r MO 300
(6) Liquid Fuel MO 600
II-Manllai 600 600
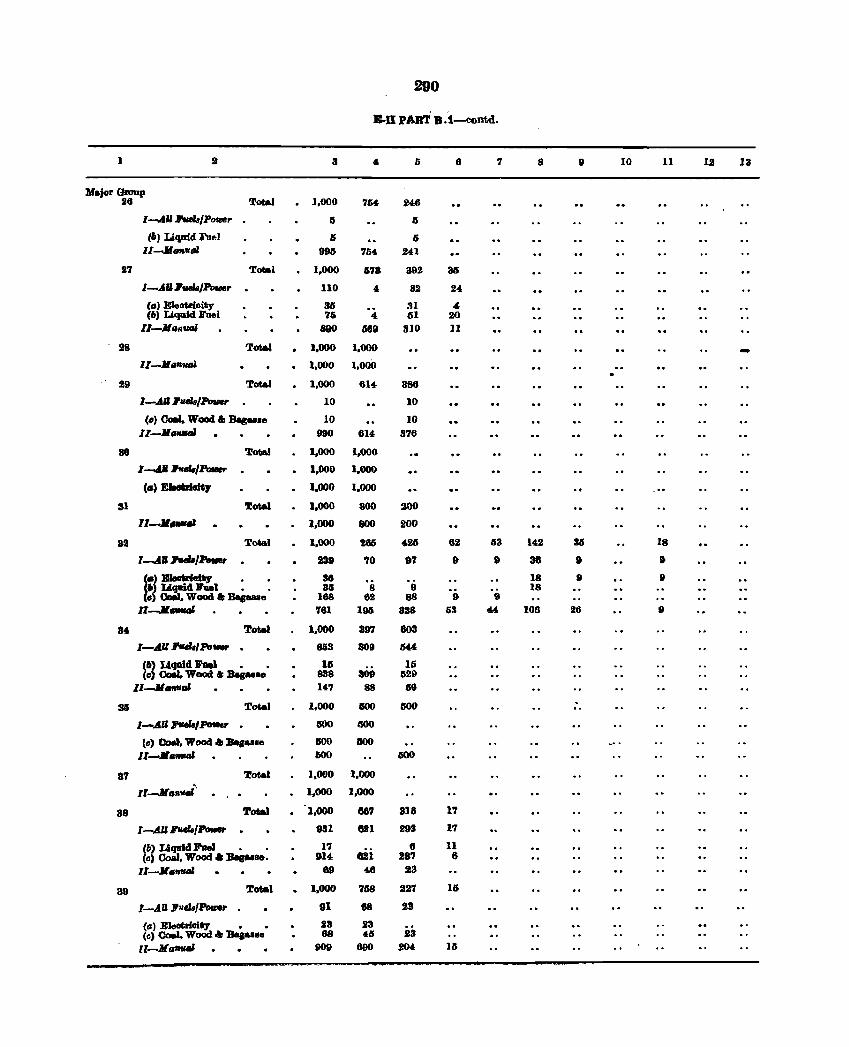
290
B·II PART B.1-contd.
1 3 Ii 6 7 8 9 10 11 12 13
Major Group 26 Total . 1,000 7M 246
I-AIlIWeIa/P_,. Ii 5
(II Liquid Fu&t Ii Ii lI-.J1tmvtJJ 995 '154 241
27 Total 1,000 178 392 35
I-.AII , .. ,Power lIO " 82 24
(Cll EJeotrioity 33 31 " (I) Liquid Fuel 76 4 til 20 11-11.11_ a90 669 310 11
S8 Total 1,000 1,000 -IJ-lIC1fttUlJ · 1,000 1,000
29 Total · 1,000 614- 386
I-.AII '_/Power 10 10
(c) eo.I. Wood " Bag ... " 10 10 lZ-lIGfIfIIiJ 990 614 376
3G Tot&) 1,000 1,000
1-'11 "'''',PrMer 1,000 1,000
(IJ) BIe*IaItJ 1.000 1.000
31 Total 1.000 800 200
11-11 .... 1,000 800 200
32 Total 1,000 286 425 62 53 142 16 18
1-'" 1atb1Pe.r 239 70 97 9 9 38 9 9
I.) ..... elty • • 36 '0 18 9 9 ") Ugaid Jl'ul • , 34 8 18
(0) ea.I. Wood" Bapa8e 188 62 88 9 9
II-lL ... 781 195 328 53 '" 108 26 9
34 Total 1,000 30'1 803
I-AU J'tIfh/Puvw , 853 309 IJ44
(fI, Llqaid Fue. , • 16 Iii (0) 00aI, Wood I: Bagasse 838 309 S29
II-JI".,..,,. 147 88 159
34 Total 1,000 GOO SOD . .. I-AU ""',PtMu 500 GOO
(c) Coat, Wood .. Bagas.e liDO IlOO II ...... ,_",. IlOO 1500
87 Total 1,000 1,000
II-JlCl1&uai' 1,000 1,000
38 Total 1,000 667 8J8 1'1
I-AUI_Ir- . 931 821 293 17
(b) Liquid Jl'aeJ • • 1'7 6 11 (c) Coal. Wood .. Baplae. 914 821 287 8
11-1lI11&atJJ 89 46 23
39 Total · 1.000 768 227 16
I-.AU ,vels/Pouter 91 8e 28
(0) EJeotrieity • • 23 23 (c) Coal, Wood .. Bac ... e 68 45 23
l'-M "fItIfII 909 690 J04 15
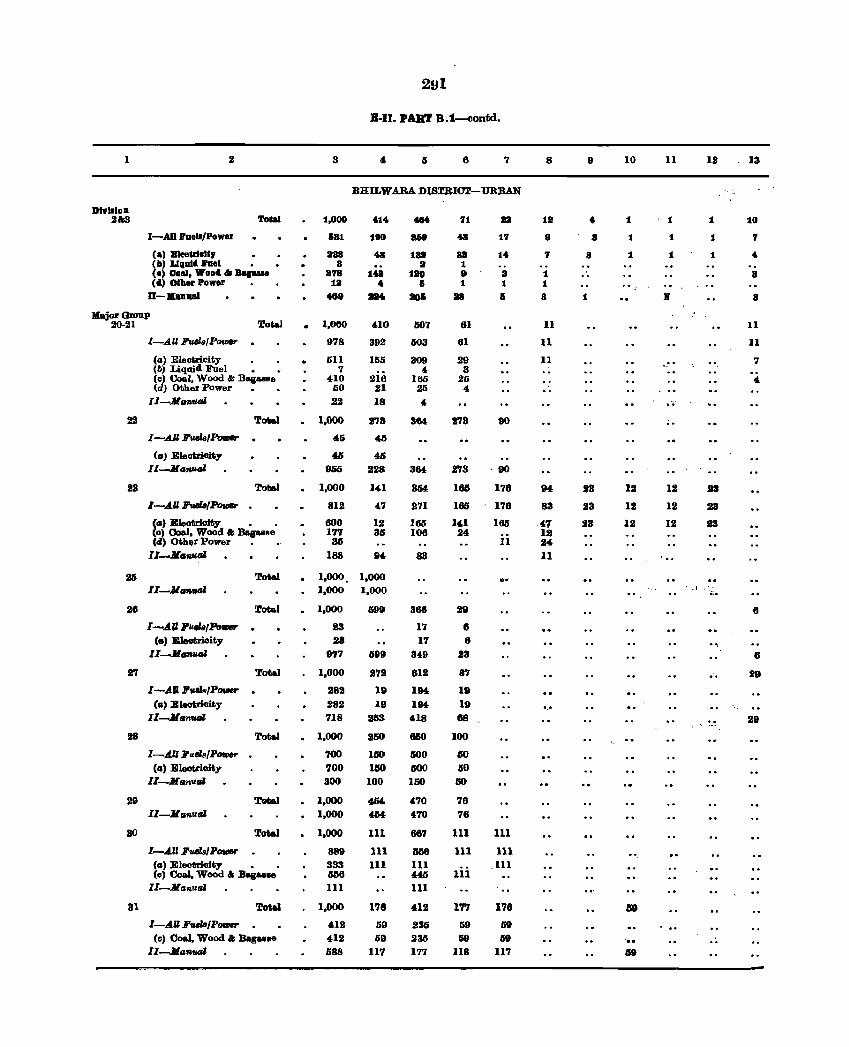
1
DlvlsloD 2&3
2
Tog)
I-AU :ruBis/Power
(a) B1ee&rlellr • (b) Uqlllll. hal • (I) Ooal, Wooll. II; Baa(4) '"her Power
1I-lIImual
Major GlO1IP 20-21 Total
1I3
I-All P,""",PfJfHr
(1.1) Eleotrieity (b) Liquid. Fuel • (c) Coal, Wood .. Bagulle (d) Other POwer
I1-..IIlmlUll
I-AU J'utih/PDII1&r
(II' Eleotrioity Il-Memval
Total
I-AU F'vMB/~
(G) Eleotrioity • • (0) Coal, Wood" Baguee (d) Other Power
Il-Jehual
II-ManutJI
26 Total
27
28
30
31
I-All ,_/Po_ (.) IIlleotrioity
II-M.,.u'"
I-AIFv.tL/P_ • (a) EIeotrloity
II-MGn_
Total
Tot.l
I-All ,"els/POttJer (a) lilleotrioity
II-..IIGn"''''
II-JIGnu'"
I-AU Fuels/P_ (a) Eleotrioity •
Total
(c) Coal, Wood &; Bag .... e II-Manual
I-AU FwJs/P_ (c) Coal. Wood &; Bagasse
lI-Jlafl1J4l
B-II. PAll'I' B.t-contd.
3 6 7
BHILWARA DISTRICT-URBAN
1,000
681
888 8
878 18
4118
1,000
978
511 7
410 50
22
1,000
45
41)
9li5
1,000
812
600 177
35
188
414
1911
43
148 4 ...
410
392
1115
216 21 18
273
45
45 228
141
47
12 35
1,000 . 1,000 1,000 1,000
1,000
23 28
977
1,000
282 282 718
1,000
700 700 300
1,000 1,000
1,000
888 333 556 111
1,000
412 412 588
1)99
.99
172
19
19 2IS3
260
150 150
100
454 4M
III
III III
178
59 59
117
.. 868
188 8
180 6
206
G07
503
309 4
165 25
4
364
364
3M
271
165 106
83
368
17 17
348
812
184
184 418
810
500 600 150
4'70
"'70
687
658 III 4411 111
4111
235 235 177
71
48
sa 1 9 1
38
61
61
29 3
26 4
t'73
173
1M
166
141 24
29
8 6
23
8'7
19
19 88
100
50
50 50
76 '16
III
111
III
17'1
59 59
118
sa 17
14
8 1
I
90
-90
178
176
1M
Il
....
111
111 111
- .. 178
lit 119
117
8
18
8
7
1 1
a
11
11
11
94
83
47 12 24 11
._.
9
4
3
a
1
23
23
13
10
t
1
1
12
12
III
-..
11
t
1
1
•
• e'
12
12
12
. .1
12
1
'1
1
Jl3
23
:113
...
13
10
7
.. 3
3
11
11
7
"
6
6
29
1I9
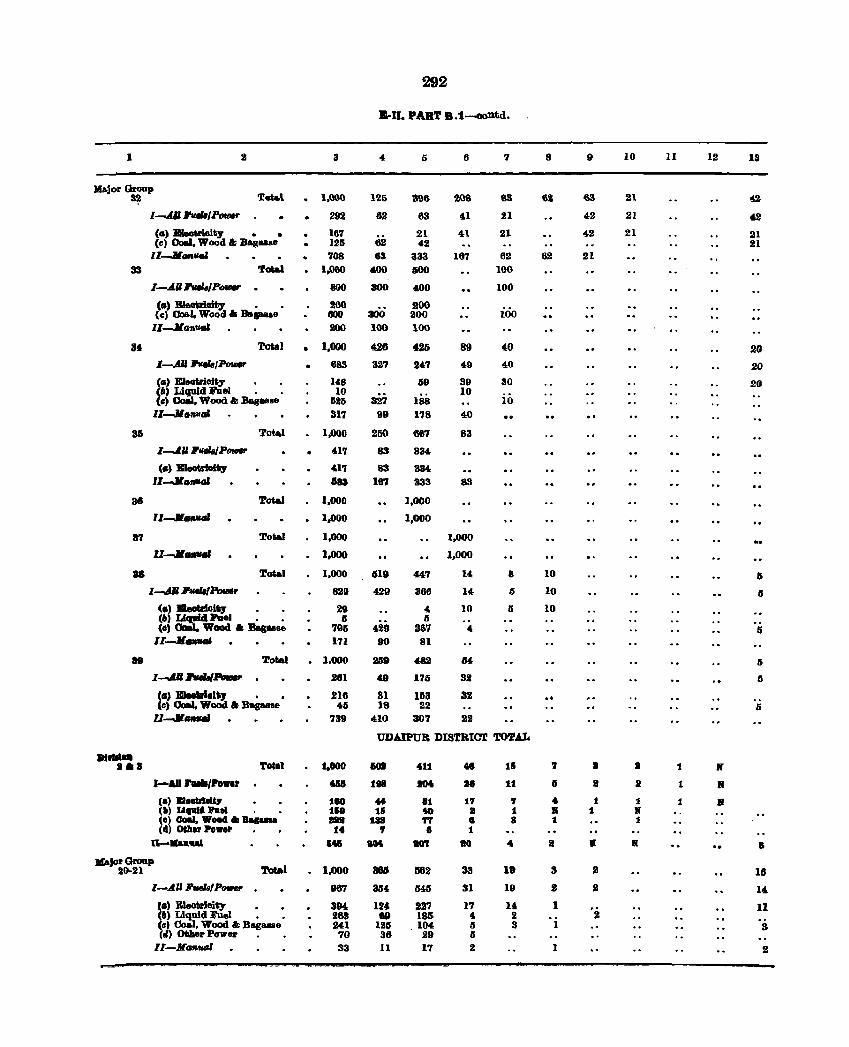
292
B-II. PART B.t~td.
1 3 5 6 7 8 9 10 11 12 13
Kajor Group 32 'f.a\ 1,(100 121) 396 2QS 83 6i 63 21 42
I-Ml ,."./P_". 292 6.2 63 41 21 42 21 4.2
CG) EIeoVioity • • 167 62
21 41 21 42 21 21 (e) Coal. Wood I; Bagasse 125 42 21
II--Jl • .., 708 63 333 167 62 62 21 33 'foal 1.000 ~ 600 100
I-All '-hIPowar . 800 300 400 100
Ca) BI6otriai~ • • 200 200 (c) 00&J. Wood Iii Depaae aoo 300 200 100 I1-Jlan,"" 200 100 100
8' Total • 1,000 426 426 89 40 .20 I-All J!qb/P __ • 683 327 247 49 40 20 Cal BIeoWioity 148 69 89 80 20 (6) Liquid Fliel • 10 10 (,,) eo.l, Wood &: Daguse 625 327 188 10 ll-JI"7¥IIal 317 99 1'18 40
35 Tota.l 1,000 250 66'1 83
I-AU 'IHlsJPonr '17 83 834
(Il) BIeotriolt;y 417 83 8M ll-JItMlflfll 188 1M 333 83
36 Total 1.000 1,000
lI-JI.,. ... . 1.000 1,000
17 Total 1,000 1.000
II-JIfIfIfIfIJ 1.000 1,000
II Total 1,000 519 447 14 II 10 5 l........4.li,..,PovM 829 429 366 14 5 10 5
(I) BIeoIir1o~ • • 29 4 10 5 10 (b) ~Pael • • 6 5 (0) • Wood Iii Baguae 795 429 367 4 6 II-JI.,... 171 90 81
89 Total . 1,000 215' 482 54 fj
1-.4.11 "".,Powr 281 '9 175 32 fj
(.) lIlJeddo1t;1 • • 216 31 1I~3 31 ., (e) Coal, WoOd I; Bag ... e 45 18 22 5 II-JI __ 739 410 307 22
UDAIPUR DISTRIar TOTAL ....... •• 8 Tolll :1.Il00 101 41:1 .. :Iii 7 I I 1 If
I-AI raJa/Po ... U6 :III JlO4o H 11 I lJ a 1 II
CI) B1.,lbleltp 180 oM 81 17 7 4 1 1 1 If (') Lt, .... he! . 158 15 40 II t II 1 If (e) Ooal. ......... _ ... 188 'IT • a t 1 C d) CHile Po • .,. • , 14 , • 1
n-.... ut 1145 aM aOT 80 4 a It It • "JOI' Gl'OIIp
Total 1,000 au Ge2 33 18 3 2 16 20·21 . I-AII'uels/Power t67 354. 545 31 19 .2 II 14
'I) Bleotrioity 394 124. 227 17 U 1 '2. II (lI) Liquid Fuel • • 281 ag 185 , 2 (Il) Coal. Wood I; Bag •• e 241 125 104 5 3 1 8 (tI) OtJaer Power , 70 36 29 5
II-MG"_' 33 11 17 2 1 2
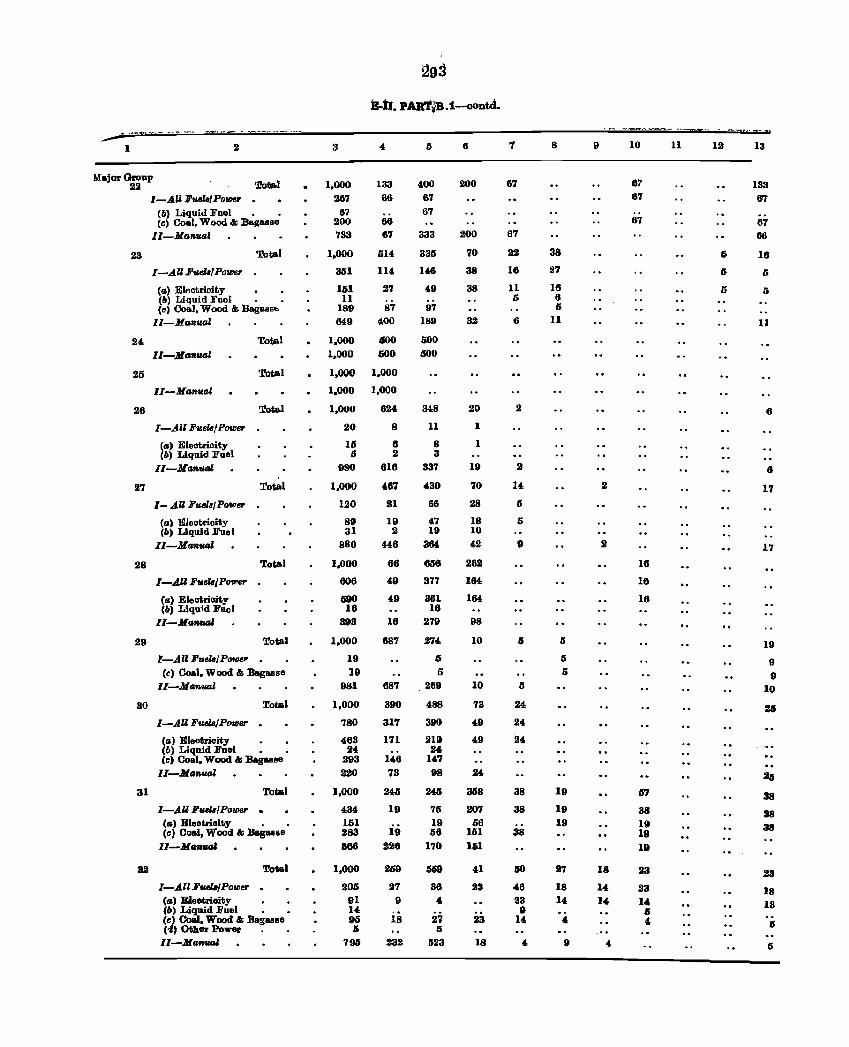
.,. ·~ ... m,.-- - ~.% - ...... -I 2
Major Group 22
23
24
25
I-AU Fu.eJB/POlD6r • (6) Liquid Fuel • • (c) Coal, Wood & BBo!I:alse
II-Manual
Total
I-AU Fuelll/Po'll18J'
(a) Electrioity • • (r.) Liquid Fuel . • (e) Coal, Wood & BagaHBb
II-Manual
Total
II-MG_"""l
Total
II-Manual
26 Total
27
28
29
30
31
32
I-A" FuelBlPower
(a) Eleotricity (6) Liquid Fuel
II-Manual
Total
1- AU FuelB/PolDer
(a) Eleotrioity (II) Liquid Fuel
II-Ma'llulJl
Total
I-AU FuelslP01I'er
Ca) Eleotrioity (6) Liquid Fuel
Il-Maf&ual
I-All FuelsJ P_er
Total
Cc) Coal, Wood &; Bagasse II-Manual
I-AU Fuels/POlDer •
(a) Eleotricity (6) Liquid ]l'uel •
Total
(c) Coal, Wood &; Bagasse
II-Manual
Total
I-AU Fllw/PolOer • (a) Eleotrioity • (c) Coal. Wood &; Bagasse
ll-Maftual
Total
I-All Fu.eJB/PoIDer • (a) Eleotrioity • (6) Liquid Fuel • (c) Coal, Wood &; Bagasse (i) Other Power II-Manual
B-tI. PAllT~B.1-aoDtd •
3
1,000 267
67 200 733
1.000
351
151 11
189 649
1,000 1,000
4
133 66
66 67
514
114
27
87
400
100 500
1,000 1.000
1,000 1,000
1,000
20
15 II
980
1,000
120
89 31
880
1,000
606
590 16
393
1,000
19 19
981
1,000
780
463 24
293 220
1,000
434 151 283
G66
1,000
205 91 14 95 Ii
795
624
8
6 2
618
467
21
19 2
446
66
49
49
16
68'1
68'1
390
317
171
146 73
24-3
19
19 226
259
27 9
18
232
5
400 67 67
333
335
146
49
97 189
500 500
348
11
8 3
337
430
66
47 19
364
656
377
361 16
279
274
5 5
269
488
390
219 24
147 98
245
75 19 56
170
5G9
36 4
27 5
523
6
200
200
70
38
38
32
20
I
I
19
70
28
18 10 42
2U
164
164
98
10
10
73
49
49
2f.
368
207 56
161 151
41
23
23
18
7
67
67
22
16
11 II
6
2
2
14
I)
I)
9
5
24
24
24
38
38
38
110
46 23 ~
14
8
38
21
18 8 II
11
5
5 o
19
19 19
27
18 If.
4
9
9
2
18
14
14
10
67 67
67
16
16
16
57
38 19 19 19
23
23 14 Ii ,
11 12
II
6
5
13
133 6"f
67 66
16
5
5
11
6
6
17
17
19
9 ., 10
25
25
38
38 311
23
18 13
5
5
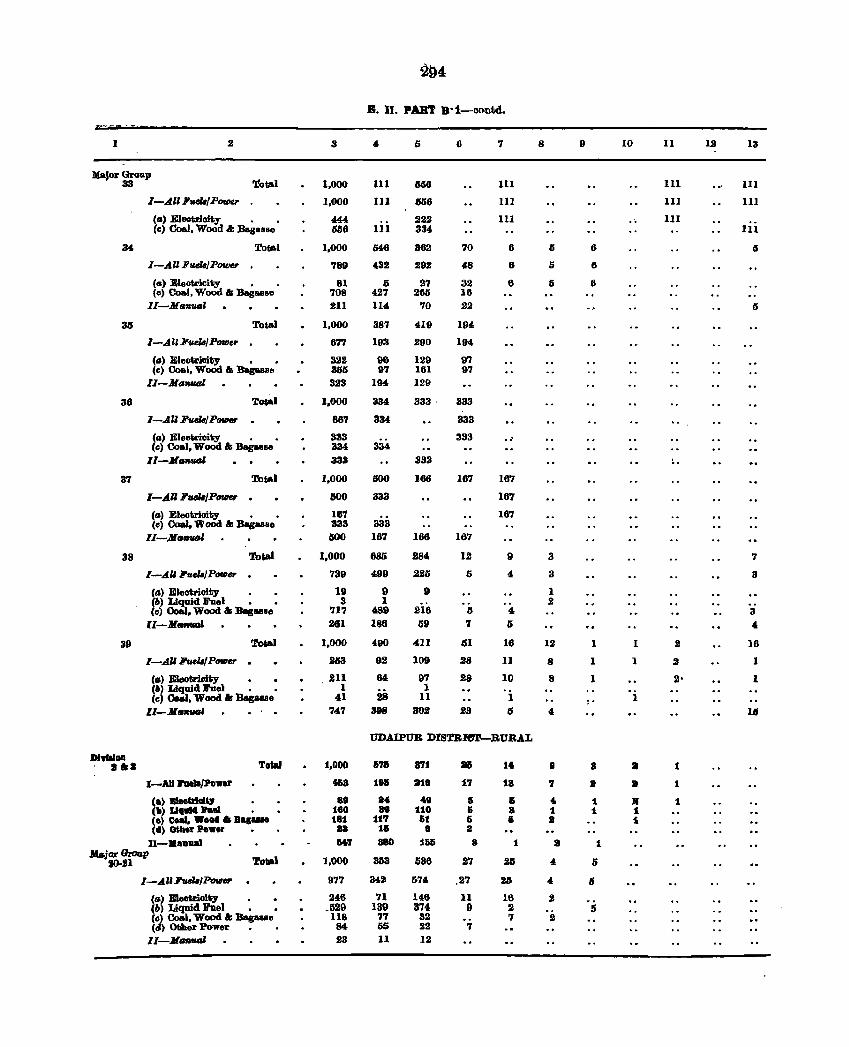
21:)4
B. II. PART B·t-contd.
1 2 3 " 5 6 7 8 9 10 11 12 13
MajO!" Group 33 'to~l 1,000 111 806 111 111 111
l-~IlF"'P_ 1,000 111 606 HI 111 111
(ta) Electrioity • 444 222 111 ., 111 (c) Coal, Wood .I: Bagasse IUI6 III 334 III
34 Tot&1 1,000 546 362 '10 6 I) 6 5
I-AU Fuel8/Power 789 432 292 48 6 I) 6
(a> Electricity • 81 5 2'1 32 6 I) 6 (c) Coal, Wood & Baga,8IIe 708 427 265 16
II-M ta"'lUJ1 21I 114 70 22 5
315 Total 1,000 38'1 419 194
I-All Fuel8/ POfDsr 677 193 290 194
(a) Eleotricity • • 322 96 129 97 (e) Coal, Wood & BagasSE! 355 97 161 97
Il-Mt.I"'IUJI 323 194 129
38 'ro$al 1,000 334 333· 333
I-All Fuel8/ P_ 667 334 333
(II) Eleotrioiliy • • 333 333 (c) Coal, WoOd &; Bagasse 334 334
ll-M.,,'IUJI 333 333 .. 37 Tot&) 1,000 600 166 167 167
I-A.l' Fuel6jPow. · 500 333 167
(ta) Eleotrioity • • 167 167 (e) Coal. Wood &; Bagasse 333 333
1l-,M_uoI 500 167 166 167
38 Total 1,000 680 284 12 9 3 7
I-AU Fuel8/P_sr · 739 499 225 5 4 3 3
(a) Eleotricity 19 9 9 1 (b) Liquid Fuel • 3 1 2 (0) Coal, Wood &; BaguBe 717 '89 216 I) 4, 3
lI-JfClMGl 281 188 59 'l Ii , 39 To ... ) 1,000 490 411 lSI 16 12 1 1 2 16
I-A" FfHU/P_ · 2153 92 109 28 11 8 I 1 2 1
CA) Bleotrioity • • 211 84 97 28 10 8 1 2' 1 (Il Liquid J'ae) • • 1 2i
1 (e ONl, Wood II Bagaa.8 41 11 1 1
ll-M_'lUJ' 747 398 30.1 23 IS 4 11
UDAIPUR DISTBIe'r-BURAL
DlwIIID.II To'" 1.000 I'll 871 815 1. ••• 8 8 8 1
I-AU Faela/hwer 1&8 191 218 17 18 7 It 8 1
(a) _bIIII~ .8 M 49 Ii & 4r 1 R 1 (.) U.1IIIl J'Ml • 160 89 110 IS 8 1 1 1 (0) coal, •• 011 • _ ...... 181 11'1 61 Ii 15 I 1 (III) oth.r P .... r • aa 16 8 a 1l-••• 1W 1i.7 880 1&5 8 1 :It 1
Major Group to·~n Total 1,000 353 586 27 25 4 6
1-.t!JlFvslB/Power 977 34' 574 ,27 23 4 II
(a) Eleatrioity 246 71 146 11 16 2 (b) Liquid Fuel • _529 139 374 9 2 5 (c) Coal, Wood • BagaaBe 118 77 32 '1 2 (d) Other Power • 84 55 22 '1
II-M __ 23 11 12
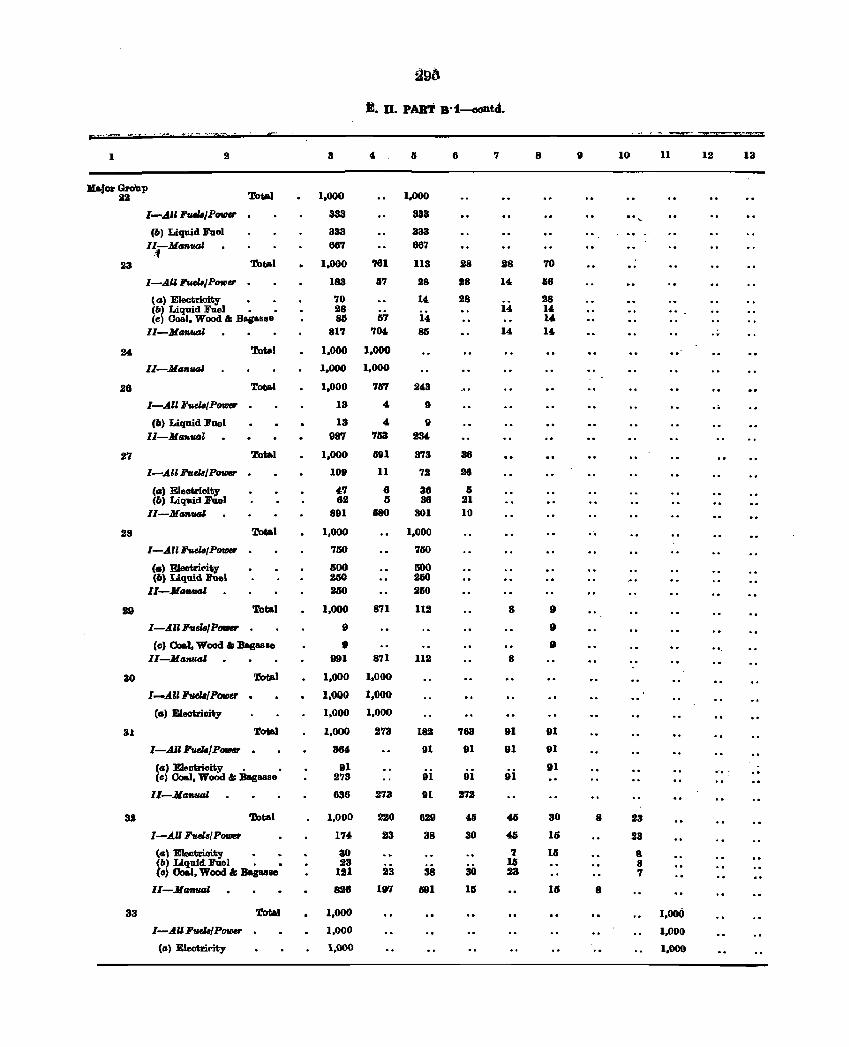
296
It 0, PART B'1--oontd,
="'··rr ........... -....... t -,--, 'F r -.. :===- :=rzv:=Ti:::::;r;=s
1 2 3 6 7 8 9 10 11 12 13
Ha.Jor Group Total 1,000 1,000 22
I-A" Fu.,P_r 333 383
(6) Liquid Fuel 333 333
II"ManutU 667 667
23 Totlll 1,000 761 113 28 28 70
I-All "".jPotII .. , 183 57 28 18 14 118
(al Electrioity 70 14 28 28 (6) Liquid Fuel , 28 14 14 (e) Coal, Wood & Bagasse 86 fj7 14 14
II-Ma",tAGZ 817 '10' 85 14 14
24 Total 1,000 1,000
II-Ala1lt«M 1,006 1,000
26 Total 1,000 757 243
I-All Faela/P_ , 13 4 9 "
(II) Liquid Fuel 13 ... 9 II-Ma",tAGZ 987 753 234
27 To.I 1,000 591 373 36
I-A"h./P_ 109 11 72 28
Ca) Eleotrioity " 6 38 I (II) Liquid.Fue1 82 5 38 21
II-Al __ 891 180 301 10
28 Total 1,000 1,000 ,",
I-AU Faela/P_ , 756 750
(CI) Eleotrit"i,y 500 1500 (6) Liquid Fuel 200 200
II-M __ 250 260
29 Total 1,000 871 112 8 9
I-AIU'uels/P_ 9 9
(e) Coa.l, Wood " Bagllo8le 9 8 "
II-Malitia' 991 871 112 8
30 Total 1.000 1,000
I-..4.nFurld'Pf1IIJr 1,000 1.000
Ca) EIeotrioity 1.000 1,000
31 T@i 1,000 273 182 763 91 91
I-..4.U1!urM/P_ 384 91 91 91 91
(al EI ... lltrioity , 91 Iii
91 (c) Coal, Wood & Baguse 273 91 91
II-Jla",utU 636 273 91 272
32 Total 1,000 220 629 411 46 30 8 23
I-All FuelsfP_ 174 23 38 30 46 16 23
(a\ Elel\1rlaity SO 'I US 8 (6) Liquid Fuel • 23 11 8 (e) CoIi.I, Wood a: Bagulle 121 23 38 30 23 7
II-Jla'llual 82e 197 591 111 1& 8
33 Total 1,000 1,000
I-AU FveI&/P_ 1,000 1,000
(a) Eleotririty 1,000 1,000
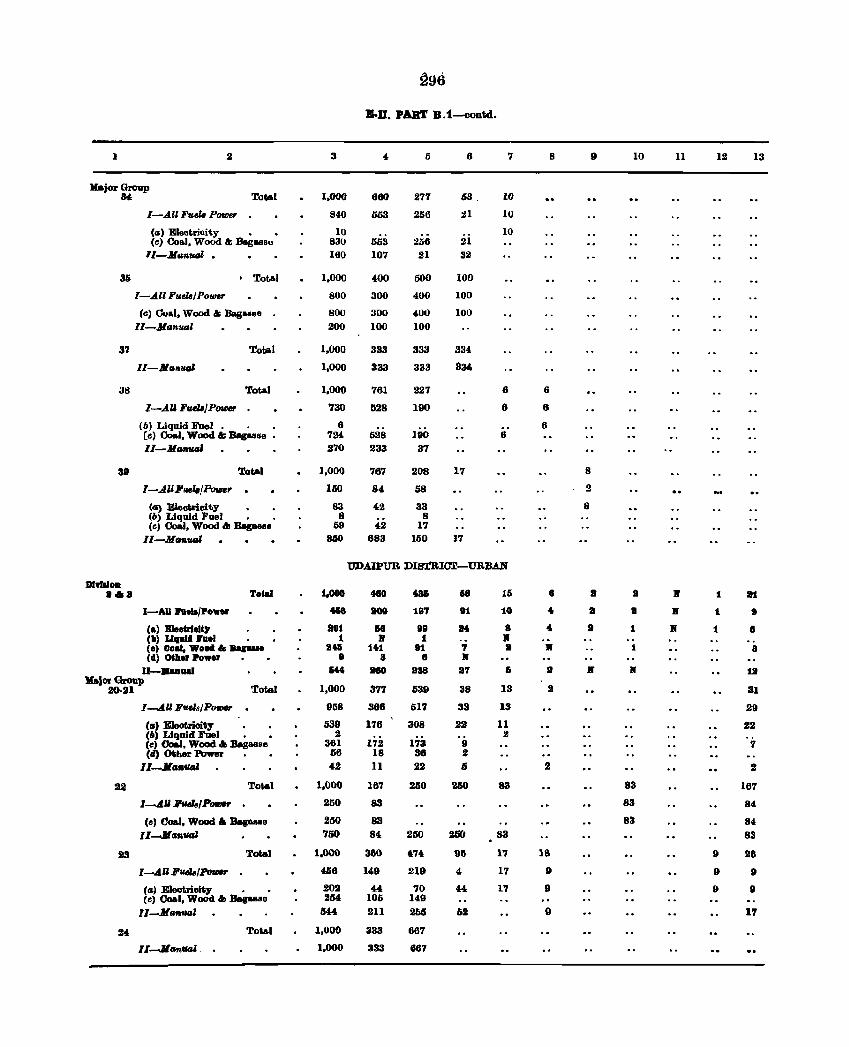
296
B.D. PART B.1-oontd.
1 2 3 5 6 7 8 9 10 11 12 13
)(ajor Gl'OUp 84, Total 1,000 600 277 63 10
I-.All Fuel. PQf/Jel' 840 603 256 :U 10
(a) Eleotrioit.y • 10 2i
10 (c) Coal, Wood &; Bagass" 830 553 25a
ll-Ma,,:ual • 160 107 21 32
35 I Total 1,000 400 500 100
I-All Fud&/Powe,. 800 300 400 100
(c) Coal. Wood &; Bagasse 800 300 400 100 ll-Manval 200 100 100
37 Total 1,000 333 333 334
ll-Mallual 1,000 333 333 3M
311 Total 1,000 761 227 6 6
I-AU FfUU/Power 730 528 190 6 6
(6) Liquid Fuel. . 6 6 [e) Coal, Wood '" Bagasse 724 528 190 6 II-Manual 270 233 37
39 Total 1,000 767 208 17 8
I-AllFue"/P_" . 150 84 58 2
(a) E1eoWicit.y 83 42 33 8 (6) Liquid Fuel • 8 8 (c) Coal, Wood "" BagaBB. 59 42 17
II-Manual 8IiO 683 150 17
UDAIPUR DIsTRIC1r-URBAN
DlwllloD 1&8 ToiaJ 1.000 480 486 &8 1& 8 8 a If 1 21
1-.Alll'llela/Pe_ 4&8 100 197 91 10 4 a • K 1 9
Ca) BleDirlol*, 801 18 911 .4 8 4 • 1 If 1 8 (') 1.1 ..... I'ael 1 If 1 If Ce) Coal, WD" II .ac- 24& 14.1 91 7 • II 1 8 (d) CHII.r PDwer 9 a 8 111
11-...... 144 180 888 8'1 1 :a II' 111 18 Major Group
Total 1,000 20·21 377 539 38 13 2 31
I-All Fuels/P_r . 958 366 517 33 13 29
(II) Eleotrioity • 539 176 308 22 11 22 (6) Liquid Fuel • • 2 2 (el 00aI. Wood '" Bagas8e 361 172 173 9 7 (4) (»her Power 56 18 36 2
Il-.JIlMltItJl 42 11 22 6 2 2
22 To~l 1,000 187 250 250 83 83 16'1
I-All JJ'ueI8/P_ 250 83 83 84
(c, Coal, Wood .. Bagasle 250 83 83 84 Il-.JIIMIVGJ 700 84 250 200 83 83
23 Total 1,000 380 4'14 98 1'1 18 9 28
I-All F~/PouM 456 149 219 4 17 D 9 D
(a) E1eotricn.,. • • 202 " 70 44 1'7 9 9 9 (e) Coal, Wood" Bagasse 254 105 149
II-MMlual 544 211 2M 62 9 17
2' Total 1,000 333 667
"-Manual , 1,000 333 667
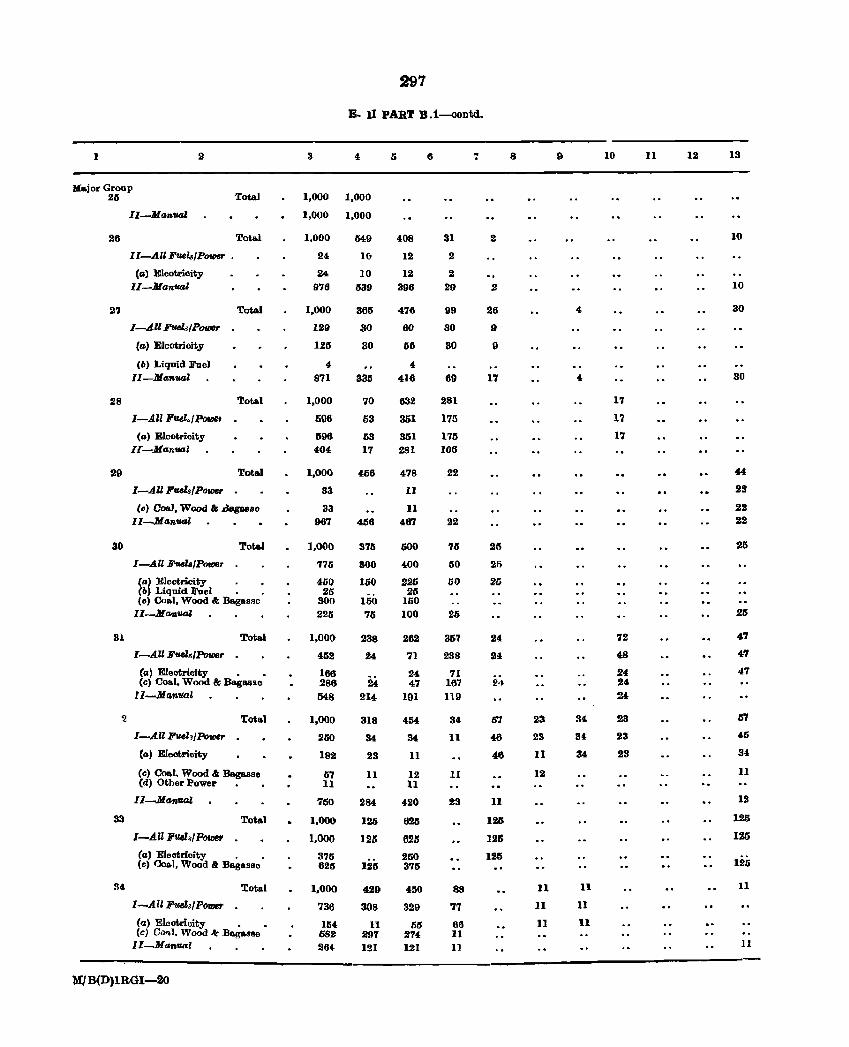
297
E. 11 PART B .1-contd.
I 2 3 4 5 6 .. 8 9 10 11 12 13 . Major Group
Total 25 1,000 1,000
II-Mantlal 1,000 1,000
26 Total 1,000 M9 408 31 2 10
II-AU Fuel&/Power • 24 1& 12 2
(a) Eleotricity 24 10 12 2 II-Manual 976 539 396 29 2 10
27 Total 1,000 365 476 99 26 4 30
[-All Fuela(POflJ6r 129 30 60 30 9
(a) Eleotrioity 125 30 58 30 9
(b) J.iquid Fuel 4 4 II-Man_Z 871 335 416 69 17 4 30
28 Total 1,000 70 632 281 17
I-Alllfuel.,{POfDSf 696 63 351 17G 17
(a) Eleotricity 596 63 351 n5 17 IE-Mantlal 404 17 281 106
29 Total 1,000 456 478 22 44
I-AU Fv.els/PolDflr 33 II 22
(tl) Coal, Wood & .dag88S0 33 11 22 II-M an'_" 967 456 467 22 22
30 Toal 1,000 3711 500 76 25 25
I-All Ftce'lsIPCMer 776 SOO 400 50 21)
(a) Electricity 400 150 226 5j) 26 (6) Liquid Fuel 25 25 (c) CoBol, Wood" Ba.gBsse 300 150 160
II-MantuzZ 225 75 100 25 25
31 Total 1,000 238 262 357 24 72 47
I-AU Fuels/Power 452 24 71 238 24 48 47
Ca) Eleotricity • 166 24 71 24 '17 (c) CO&I. Wood & Bagasse 286 24 47 167 24 24
lI-Man'll4Z 548 214 191 119 24
~ 'Iotal 1,000 318 454 34 57 23 34 23 57
I-A.U Fuel,IPower 250 34 34 11 46 23 34 23 45
(CI) Eleotricity 182 23 11 46 11 34 :23 34
(e) Coa.l. Wood" Baguse 57 11 12 11 12 11 Cd) Other Power • • 11 11
II-Mantlal 750 284 420 23 11 12
33 Total 1,000 125 625 126 125
I-All J!'uel~/P(JfJJ8' 1,000 125 625 126 125
(a' Eleotrioity . . 375 250 125 125 (e) Coal, Wood .t. Bagasse 625 125 375
34 Total 1,000 429 450 88 11 11 11
I-A 111!'ue!d POUJer 736 308 329 '17 11 11
Ca) Elcotricity • • 15-1 11 55 tI6 II II (t:) ei)'ll. Wood ~ Bagasse 682 297 !74 11
II-Man_l 264- 121 121 11 11
MJB(D)lRGI-20
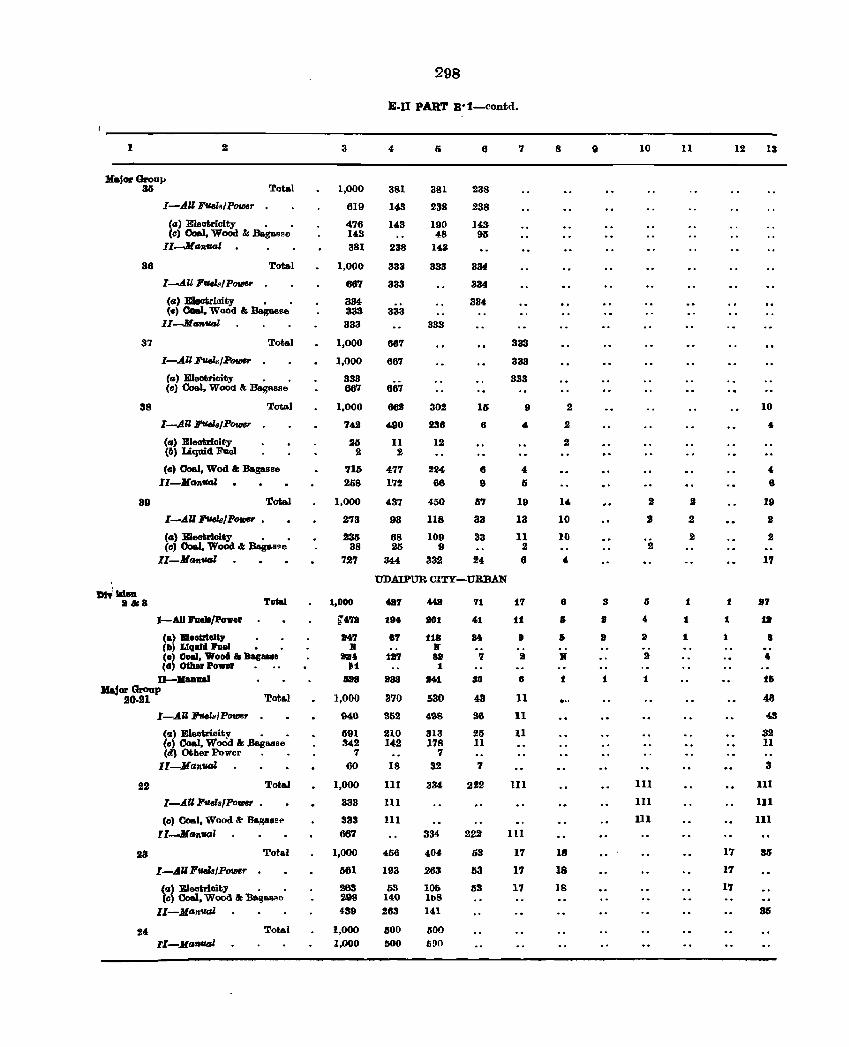
1 2
MajOl' GroUl' 85 Total
I-A.U Fuels/~r
(a) Electricity . . (e) Coal, Wood &: Bagasse
II-MGnfUd
88 Total
37
38
I-.AU Fuel.!POlllU
(a) ElecWioity • • (c) Oael, Wood &. Bagasse
II-AI _ _"
Totol
I-A.ll ~/Power
(a) Electrioity • • (e) Coal. Wood &. BagaS6e
l-.AIIlJ'v.la/PouJe,.
(a) Eleatrloif.y (6) Liquid Fuel
Total
(0) Coal, Woo &: Bagasse II-MGn"cd
89 Total
l-.AU :I'fIel8J'Power •
(.) Eleotricity • • (e) 00aI, Wood.&: Ba.gaB~e
II-MantMil
I-AIl hIla/Power
(.) .leUlelty (II) LfI,lDld he] •
Toial
(e) Ooal, WoDi 61 Bag .... (d) Other Po_
D-Kanllal Major (houp
20.21 Tota.l
22
I-AU ~JP0tD6,.
(!I) Eleotrioity • • (e) Coal, Wood .&: Bagasse (d) Other Power
II-J{anvoJ.
TotaJ
I-AU lJ''IJelslPowr
(0) Coal, Wood It BagassE' II-Jlfhlval
28 Total
I-AU Fueh/Power
(!I) -E1eotricity . • (c) Coal. Wood Ie 'B6!!&8~e
II-J{an'IIGl
Total
3
1,000
619
476 143 381
1,000
68'1
334 333 333
1,000
1,000
333 667
1,000
'142
21S 2
715 258
1,000
273
23S 38
72'1
:1,000
M'1 11 -, U
&s8
1,000
940
691 342
7 60
1,000
333
333 66'1
1,000
1S61
263 298 439
1,000 1,000
298
E-II PART B·1-contd.
" 381
143
143
238
333
333
333
667
667
667
862
490
11 2
477 172
437
93
68 25
344
381
238
190 48
143
333
333
302
238
12
224 66
4-50
118
109 9
332
6
238
238
143 95
334
334
334
15
6
6 9
57
33
33
24
UDAIl'UR CITY-URBAN
427
:194
87
137
283
3'70
352
210 142
18
111
111
111
456
193
53 140 263
500 500
4G
10:1
118 Jr U :I
14:1
530
498
313 178
7 32
334
334-
4-04-
263
10& loB 141
500 li!)O
7:1
41
84
'1
30
43
36
25 11
7
222
222
63
1i3
53
7
333
333
333
9
4
4
5
19
13
11 2 6
17
11
9
2
8
11
11
11
111
III
17
17
17
8
2
2
2
14
10
10
4
6
15
15 ..
18
18
18
9
3
I
2
1
10
2 ,
5
4
2
1
III
111
III
11
2
2
2
:I
:I
1
:I
1
1
17
17
17
12 13
10
4
4 6
19
II
2
17
17
1lt
8
4
111
48
ol3
32 11
3
111
111
III
35
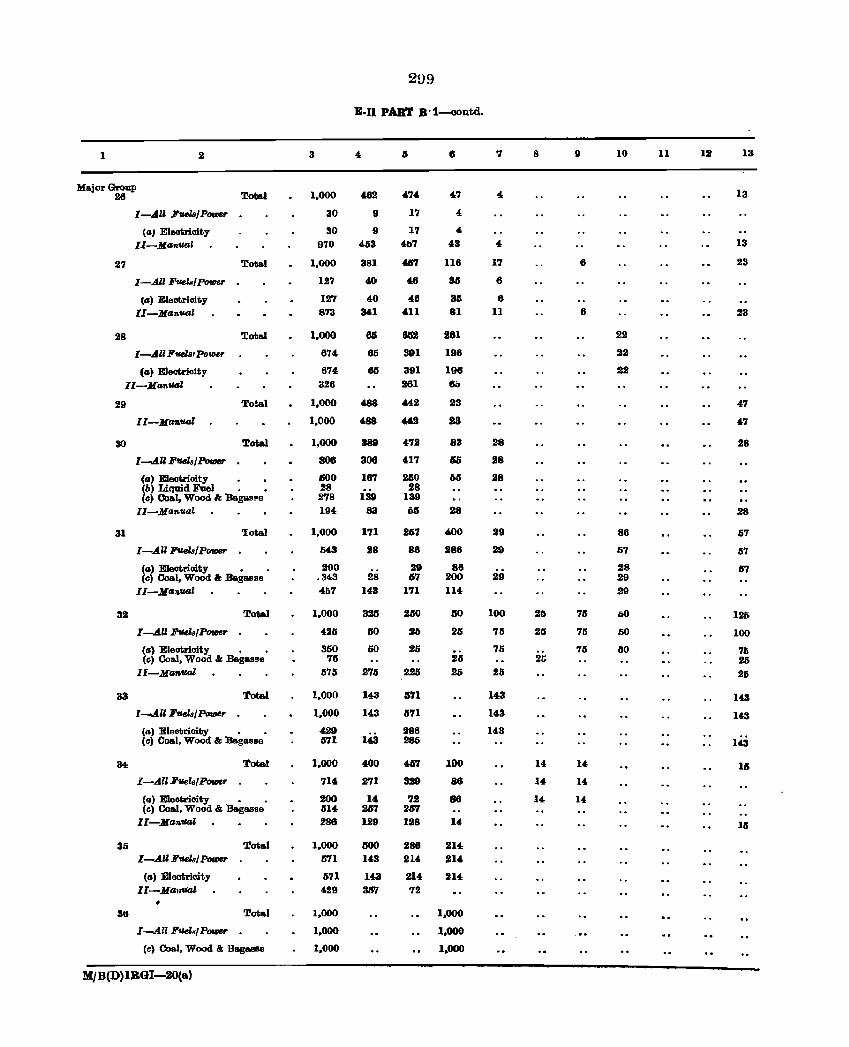
1 2
Major Group 28 Total
27
28
I-All FtJ,elB/POUItlr
(II] Eleom.oity II-Mllnual
I-All Fuels/Power
(II) Electriolty 11-]J{lJn_1
Total
Total
I-All FvelBl PO Iller
(II) Electriolty
II-Mlln'll6l.
29 To~l
ll-MlJfltuU
30 Total
I-AU l!'uda/ Power
(IJ) Electrioity (b) Liquid Fuel • (c) Coal, Wood &; Bag1is~e
II-]J{anual
31 'Iotal
32
33
34
I-AU Fuela/P_
(IJ) Electricity • • (c) Coal, WoOd I: Bagasse
II-]J{IJ"!I.ual
Total
I-AU FueZaIPOUJer
(II) Electricity • • (c) Coa.l, Wood &; Bagasse
Il-]J{lIflual
Total
I-All Fuel8/PatDar
Ca) Electricity • • (c) Coal, Wood &: Bagasse
Total
I-All FtlelBlPOUJer
(II) Eleotricity • . (c) Coal, Wood &; Bagasse
Il-]J{anUGl
35 Total
36
I-AU Fuda/POUItlr
(IJ) Electricity II-Malitlal
I-All Ftlels/POUItlr
Total
(c) Coal, Wood & Bagasse
MJB(D)IBGI-20(a}
3
1,000
30
30
970
1,000
127
127 873
1,000
874
674
326
1,000
1,000
1,000
806
600 28 278 194
1,000
543
200 .343 41)7
1.000
426
360 715
575
1,000
1,000
429 571
1,000
714
200 514 286
1.000 1571
671 429
1.000
1,000
1,000
2U9
E-Il PART B °1--oontd.
462
9
9 453
381
40
40 341
66
65
65
488
488
389
306
16'1
139 83
171
28
28 143
325
ISO
60
276
143
143
143
400
271
14 267 129
500 143
143 367
474
1'7
17 4b'7
46'1
46
48 411
882
391
391 261
442
442
4'72
417
260 28
139 M
247
88
29 "7
1'71
250
25
25
225
S71
671
286 285
467
329
'12 2m 128
288 214
214 72
6
4'7
4
4 43
116
35
36 81
281
196
196 60
23
28
83
55
66
28
400
286
88 200 114
GO
26
26 25
100
88
86
14
214 214
Sl4
1,000
1,000
1.000
'1
4
17
6
6 11
28
28
28
29
29
29
100
75
75
25
143
143
143
8
25
25
2&
14
14
14
9
6
6
715
75
76
14
14
14
10
22
22
22
86
57
28 29 29
0()
50
.&0
11 12 13
13
13
23
23
47
47
28
28
67
57
67
125
100
76 25 26
143
143
143
115
liS
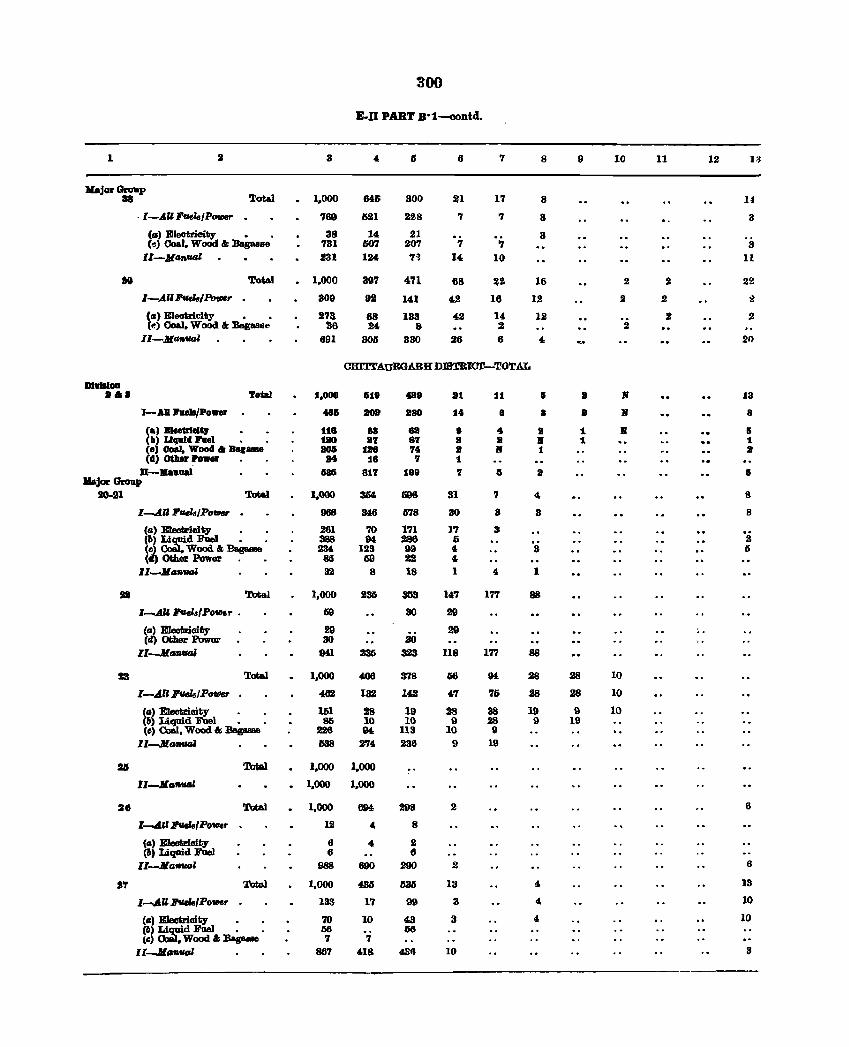
300
E-D PART B·1-oontd.
1 J 3 4 IS 6 7 8 9 10 11 12 U
Jlaj~Groap 'Iota! 1,000 18 645 300 21 17 8 11
·1-.AUFuela/"_, . '160 ISSI 228 ., '7 3 3
(et' Electricity • • 38 14 21 .. 3 (.,) Coal, WoOd &: Bagasse 731 50'1 207 '7 "I 3
ll-Man.ual J31 IS4 'n 14 1(1 11
19 Total 1.000 397 4!U 68 ~2 16 2 S 22
I-.AllFUehIPovlH 309 911 141 42 16 12 2 2 2
(a) Eleatricity • • 27& 88 133 42 14 12 2 2 Cr.) Coal, Wood I: BagaaBe 38 24 8 2 2
II-MGflUGI 691 306 330 26 6 4 21)
CHlTl'AUBGARH DlBTRlC"r-TOTAL
m ..... 86. Tot&! 1,000 618 4118 81 11 5 II B J3
l-AD heIa/Po_ 486 20It 880 14 8 a 8 B 8
Cal B1nUlelQ 118 sa 68 8 4 II 1 R 6 (II) L1qald. hel 180 87 87 8 :I R 1 1 (e, OoaJ. Wooll 6 _ ..... e 805 188 '14 8 111 1 II' (d) otller Power 84 18 7 1
D-.. aual 585 817 198 "I IS 8 5 llaJorGroup
20-21 Total 1,000 354 598 31 7 4 8
l-..AII Fuels/Po_ . 968 :M6 678 30 3 3 8
(a) Electricity . . 281 70 171 1"1 3 (II) ~d FUel • • 388 94 286 Ai .. 3 (c) , Wood &: Bagasa& 234 123 99 4 3 6 (d) 0UI.er Power 85 69 22 4,
II-..JIII,""" 32 8 18 1 " 1
lUI Total 1.000 235 3113 14'7 177 88
I-AU FvclsfPo_, . 59 30 29
(a) EIeotrioity 211 29 00
(d) Other Power 30 30 II-Jl __ 941 235 323 118 177 88
Z3 Tota.l 1,000 400 378 66 94 28 28 10
I-.A" .FfIeh/POfIJer 4Wl 132 142 47 76 28 28 10
(a) Eleotrioity 161 28 19 28 38 19 9 10 (b) Liquid FUel • 85 10 10 9 28 9 19 (e) Oca.l, Wood 6; Bagasse 226 Q4, 113 10 9
1l-.JlllfIUfU 1138 ~4 236 9 19
!&II Total 1,000 1,000
ll--Jla'lWAl 1,000 1,000
28 Total 1,000 694 298 2 6
l-All :av.l8/POtl1f.r 12 4 8
(a) EIeotrioity 6 4 2 (lI, Liquid Foel 6 6
Il-..JIG-__ l 988 600 290 2 6
IT Total 1,000 436 635 13 4 13
I.......4.U .11UeIa/P_ 133 17 99 3 4 16
(a) EIeotrioiliy • • 70 10 43 3 4, 10 (lI~~dFUel • 0
66 56 (III • Wood &: BagaMe 7 7
II--MlJfWGl 867 4.18 4SfJ 10 3
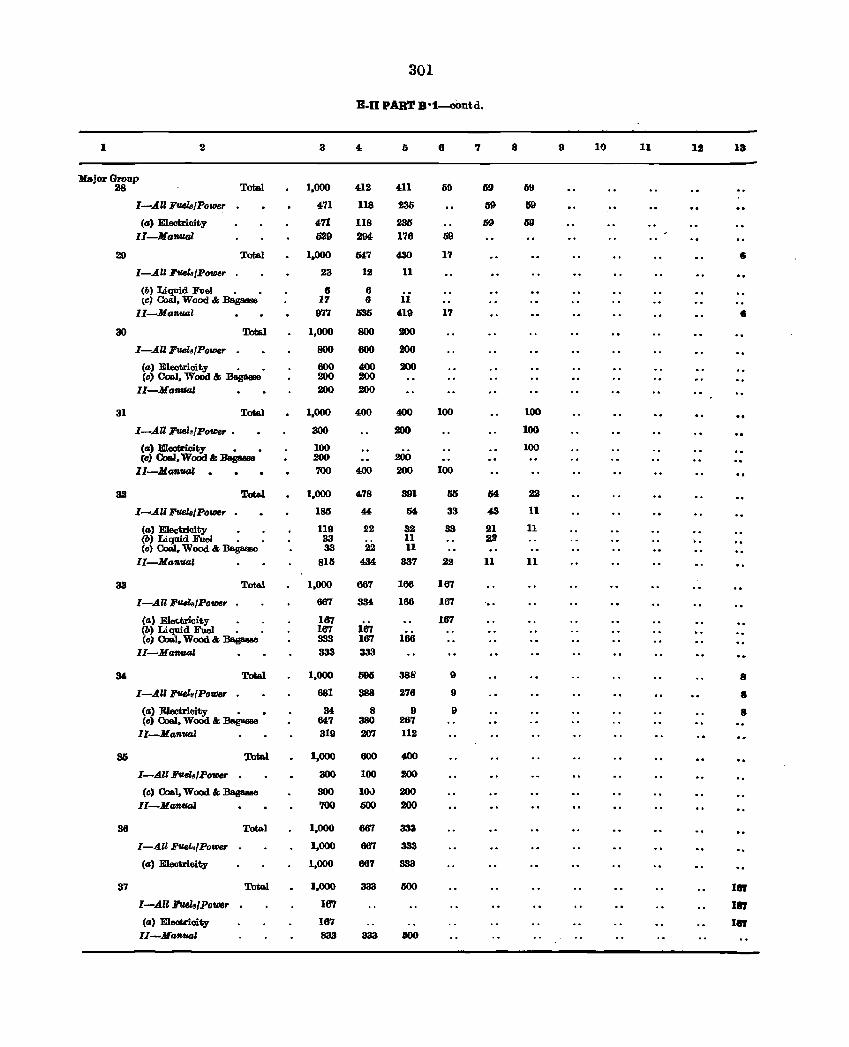
301
Eon PART Bo1-oOntd.
1 3 6 7 8 9 10 11 111 13
Major Group 28 Tota.l 1,000 412 411 69 fi9 00
I-.AlI Ff.lt.18/Powe,. 471 118 235 59 If9
(a) Electrioity 471 118 235 69 69 II-Mafl,v.o.l 029 294- 176 511
29 Tota.I 1.000 M7 430 17 , I-AU FtJek/Power 23 12 11
(b)~d Fuel • • 8 6 (e) , Wood & Bagasse 17 8 11
II-MafWlJZ 977 536 419 17 • 30 'l"oIU 1,000 800 200
I-AU Ftlt.Za/Power 800 600 200
(a) Electrioity • 600 400 200 (e) Coal, Wood & Bagaese 200 200
II-Mafl,"cd 200 200
31 Total 1,000 400 400 100 100
I-All Ftlt.Za/Power • 300 200 100
(a) El.eotricity • • 100 100 {D} Coal, Wood I; BapIae 200 200
lI-Mafl,UIJl . 700 400 200 100
32 TotaJ. 1,000 478 391 M M 22
I-All Fuels/Power 185 44 M 33 43 11
(a) Electricity • 119 22 32 33 21 11 (b) Liquid Fuel . 33 11 23 -.. (e) Coal, Wood & Bagasse 33 22 11
II-Mafl,ual 811S 434- 337 22 11 11
33 TotaJ. 1.000 867 166 167
I-All FfI4Zs/Power 667 334 166 167
(a) Elef.tricity 167 187 (b) Liquid Fuel • 167 167 (c) Coal. Wood & Bagaeae 333 167 166
lI-Ma_cd S33 333
3& Total 1,000 593 38(1 9 8
I-An FUelafPower 681 388 276 9 I
(a) E1ectriCJity • 0 34- 8 9 9 8 (c) Coal, Wood & Bagasse 647 380 267
II-Manual 319 207 112
35 TotaJ. 1,000 600 400
I-All Fuels/Power 300 100 200
(c) Coal, Wood & Bagaaae 300 1(1) 200 II-Manual 700 600 200
36 Total 1,000 667 333
I-AU Fuel.,fPower 1,000 667 333
(a) EIeotrioity 1,000 667 S33
37 Total 1,000 333 500 I. I-All Fuels/Powr 167 1" (a) Electricity 167 117
lI-Mafl,ruU 833 333 500
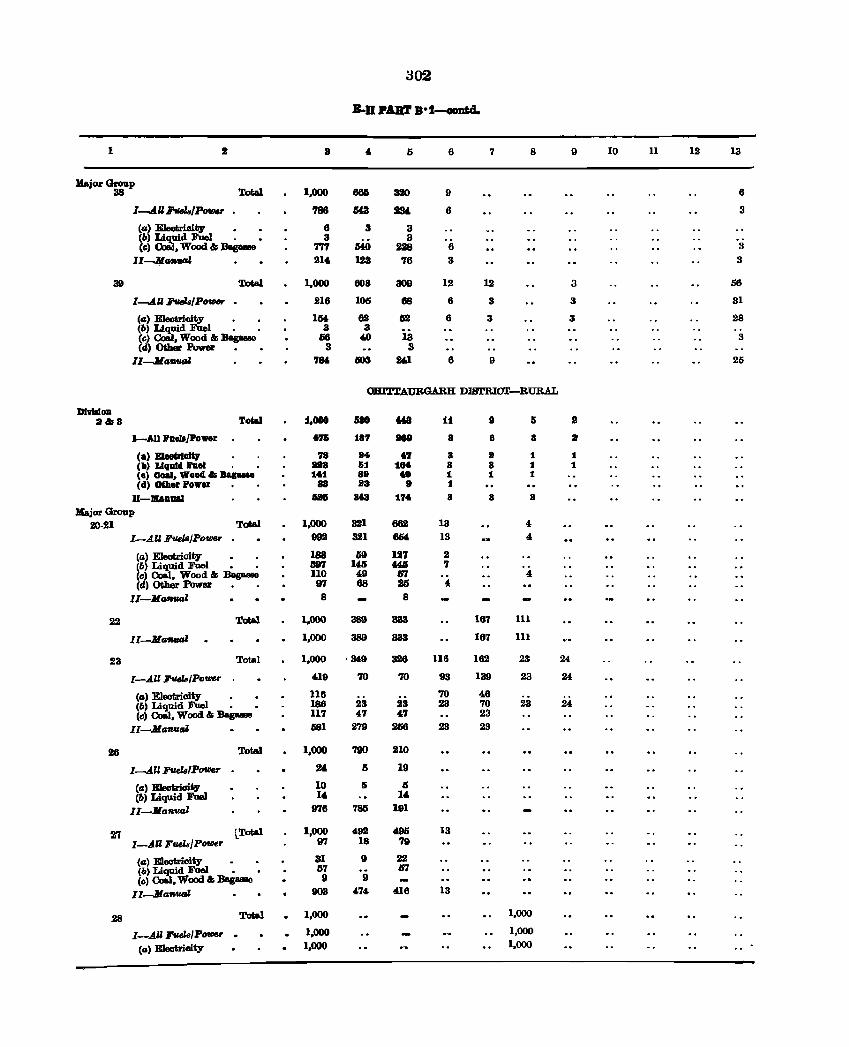
~02
B·D PAllT Bot ocmt4.
1 8 5 6 7 8 9 10 11 12 13
Major Group 38 Total 1,000 66a 320 9 6
I.....4U ItulaIPOVIU' 788 OD 1M 6 3
(a) EIeutri.oity 6 3 3 (b) Liquid FUel • 3 3 (c) Oaa.1, Wood " BapBse Tn HO 2!8 6 3
lI-.ilCHWGI 214 lB2 16 S 3
39 ToW 1,000 608 309 12 12 3 56
l-.AU Fueh/Po_ 216 105 68 6 S 3 31
(II) E1eotricity • • 154 62 IS2 6 3 3 28 (b) ~uid Fuel • • 3 3 is (c) , Wood" Bapsse 66 40 3 (Il) Other Power 3 3
lI-M"fIfItII 711' 1503 W 6 9 25
CBITl'AUBGARH DI8TRICT-RURAL
DI ..... oo 3&8 Total 1,_ 580 MIl 11 9 II D
I-AU JloeJajPower fil 18'1 818 8 8 8 :8
(.) E1eoir101tJ 78 84 fi 8 8 1 1 (11) Ullnld hel .a 61 18. a 8 1 1 ('II) CoeI, Wood & Bag_ 1.1 88 .. 1 1 1 (d) OIlIer 1'0 ... er 88 8a e 1
U-lboaal &H at3 17. 8 3 a HajorGroup
20·21 Total 1,000 321 662 13 4 I-AU FUebI/Po_ 992 321 11M 13 4
(a) Eleotricity • . 188 69 127 2 (b) Liquid Fuel • • 597 1~ «5 7 (c) 00aJ, Wood" Bagaaae 110 49 m 4 (d) Other Power 97 68 25 4
lI-M"flfltd 8 8
22 Total 1,000 S89 333 167 111
II-M,,-' 1,000 389 333 167 III
23 Total 1,000 ·349 326 116 162 23 24
I-AU~/Po_r 419 70 10 93 139 23 24
(a) Eleotrioity 116 '10 46 (b) Liquid Fuel • 186 23 23 23 70 23 24 (c) 00&1, Wood " Bapaae 117 47 47 23
II-JiaftouGl 681 279 2G6 23 23
28 Total 1,000 780 210
I-.An FueIs/Po_ 2& Ii 19
(GI) BIeotrioity 10 Ii IS (&) Liquid FUel 14 14
II-Jl"fI'UaZ 978 785 191
21 lTotaI 1,000 492 4115 13 I-AU FueldjPOIDer 97 18 79
(a) Electricity • • 31 9 22 (b)~dFuei • • 57 17 (c) , Wood" Bag- 9 9
ll-M"fto_ 1103 474 416 13
28 Total 1,000 1.000
I--.AU .J'v,eLsfPo- . 1,000 1,000
(II) Electricity 1,000 1,000
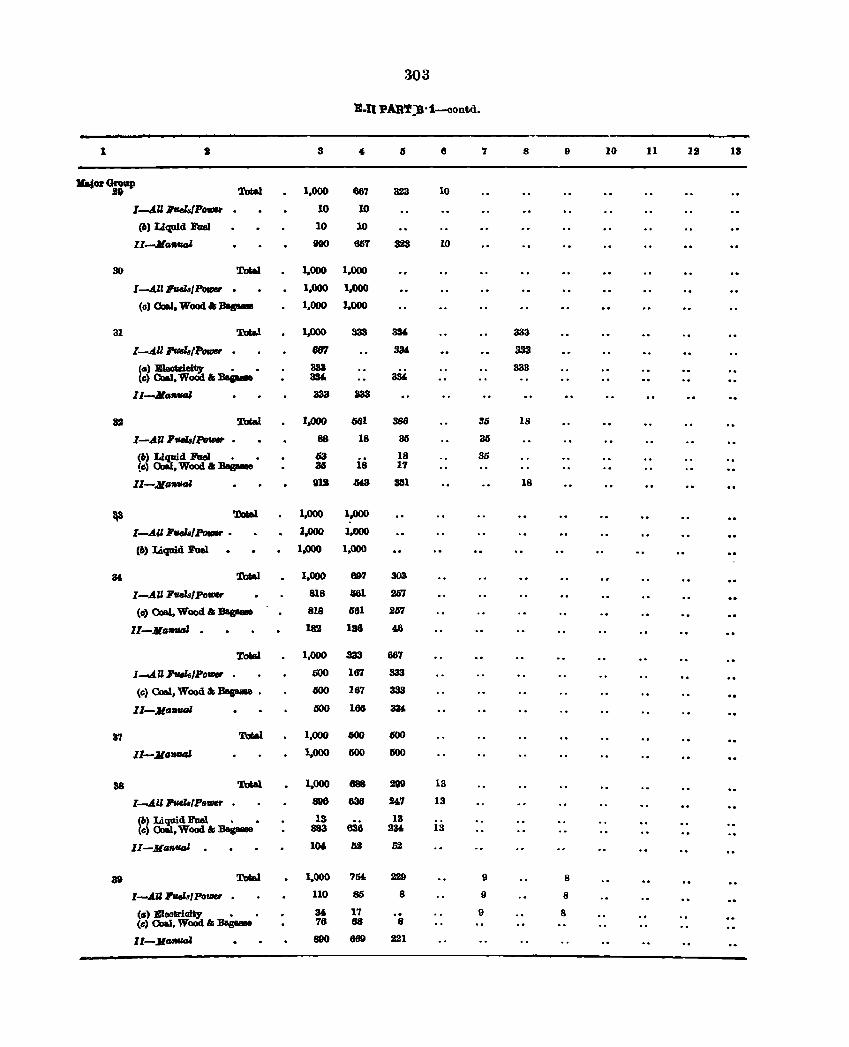
303
B·D PAR'f:S·~ontd.
1 31 8 6 7 8 9 10 11 IS 18
"jcwGroup B& Total 1,000 667 323 10
1-AU lffl4l&fPOtDD 10 10
(&) Liquid Fuel 10 10
II-Jl~ 900 667 328 10
30 ToIa.1 1,000 1,000
I-AU:ruelBtP_ . 1,000 1,000
(e) CluaJ, Wood ... :sa.- 1,000 1.000
31 Total 1,.000 333 3Sf, 333
I-All :r-la,,,- . 887 3lU 333
(a) Eleotriol~ • • 333 333 (e) CluaJ, Wood " :sap.. 3M. 334,
Il-Mafllllll 333 lI33
32 Total 1,000 li61 386 36 18
I-AU lfflels/Po_ • 88 18 35 35
(6) ~aid FaeI • • 63 is 18 86 !c} , Wood" Baguee 35 17
Il-MtlftUfJI BIZ 3A8 3151 18
l\3 TaW 1,000 1.000
[-AU Ftutls/PotIIIr • 1,000 1.000
(b) Liquid Fuel 1,.000 1,000
M Total 1,000 89'7 303
I-AU FveZs/po_ 818 iill 257
(e) Ooa.l, Wood" Bagaese 818 G61 267
ll-Jia.fIfIlJJ . 182 136 46
ToW 1,000 333 667
I-AU :IWls/POVlU' 600 167 333
(e) Coa.l, Wood" Bapase • GOO 167 333
11-Altlflfllll 600 166 384
87 Total 1,000 600 600
ll-Altl31141 1,000 600 600
88 Total 1,000 688 299 13
I-AU J!'UelaIPO'IDSr • 896 636 247 13
(b) ~dFuel • • 13 13 (e) , Wood .... Bas- 883 636 234, 13
Il-Jitl"fItIl . 104 lS2 52
at Tot&1 1,000 754 229 9 8
I-AU 7ue1s/ Po'IDSr 110 85 8 9 8
(tI) Eleotrioity' • • M 17 9 8 (0) Ooa.l. WoOd .... :sag_. 76 68 8
11-.JlIJIIVCII 890 669 221
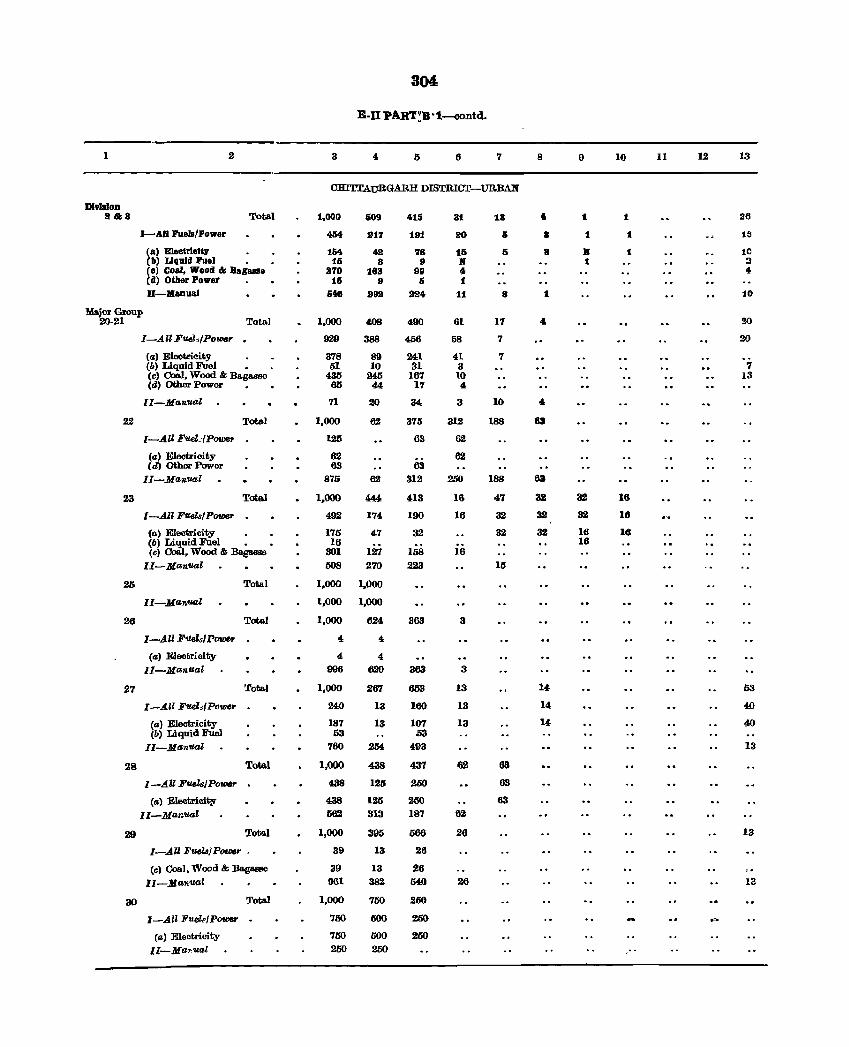
304
E-II PART~B·1-contd.
1 2 3 4 /) 6 7 8 9 10 11 12 13
CHITl'AURGARH DISTRICT-URB.A.N
DI,IaIOD 8&8 Total 1.000 &09 415 31 18 • 1. 1. 26
I-All Fuels/Power 454 917 191 ao Ii • 1 1 1f!
(a) Bleetrlote:v 1&4 42 78 15 5 • R 1. 1C (II) Liquid Fuel 1& 8 9 R 1 3 (c) (loal, Wood & Bagillse 270 183 99 4 4 (ell Other Power 1& 9 II 1 U-IIaDuaJ 6. Dill! 924- 11 8 1 10
Major Group 20-21 Total 1,000 408 490 61 17 .& 20
I-All Fuel"fPowe,. 929 388 456 58 7 20
(a) Electricity 378 89 241 41 7 (b) Liquid Fual • 51 10 31 3 7 (e) Coal. Wood & Ba.gasse 435 245 167 10 13 (d) Other Power • ali 44 17 4
lI-Man'Ual 71 20 34 3 10 4
22 Total 1,000 62 375 312 188 83
I-AU Fuel_·fPower 125 63 62
(a) Jruectricity 62 62 (d) Other Power 63 63
II-Manual 870 62 312 250 188 63
23 Total 1,000 444 413 16 47 32 32 16
I-A.ll FuelsfPower 492 174 190 16 32 32 32 16
(a) Elootri(}ity • • 175 47 32 32 32 16 16 (b) LiquidFael • • 16
127 16
(c) Coal, Wood & Bago.sse 301 158 16 II-Mall'Ual 508 270 223 15
25 Total 1,000 1,000
II-Manual 1,000 1,000
26 Total 1,000 624 363 3
I-AU F'Ilels/P_ 4 4,
(a) Electrioity 4 4 II-Manual 996 620 363 3
27 Total 1,000 267 6li3 13 U 63
I-All F-ue.l,/ PotDGr 240 13 160 13 14 40
(a) Electricity 187 13 107 13 14 40 (b) Liquid Fuel 53 .53
II-Manual 760 254 493 13
28 Total 1,000 438 437 62 63
I-All FuelBl Power 438 125 200 63
(f.l) Electricity 438 125 250 63 Il-Mf.lr.'Ua1 562 313 187 62
29 Total 1,000 395 566 26 13
I-All FutJaJPOWfJr . 39 13 26
(e) Coal, Wood & Ba.gasse 39 13 26 II-Manual 961 382 MO 26 III
30 Total 1,000 750 250
I-All F'IleldPower 750 500 250
(CI) Electricity 750 500 250 II-Ma?,ual 250 250
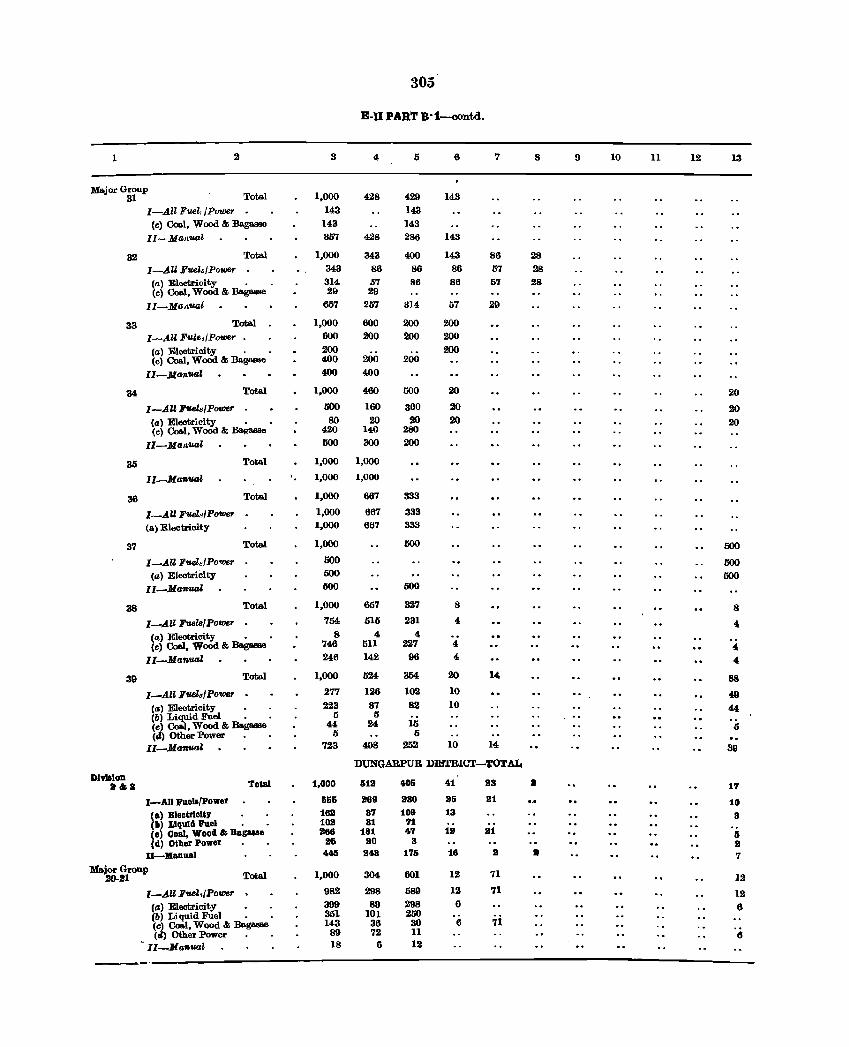
305
B-I1 PART B-i-contd.
1 2 3 4 5 6 7 8 9 10 11 12 13
:MAjor Group 31 Total 1,000 428 429 143
I-All Fuel, /Powe,. 143 143 (c) Coal, Wood & Ba.ga.sae 143 143
II-Ma",.aZ 857 428 286 143
32 Total 1,000 343 400 143 86 28
I-All Fttel./P"wer 343 86 86 86 57 28
(a) Electricity . 314 57 86 86 57 28 (c) Coal, Wood & Bagasse 29 29
II-Mo,/,uaZ 657 257 al4 57 29
33 Total 1,000 600 200 200
I-All FuZes/Power . 600 200 200 200
(a) Electricity . 200 200 (c) Coal, Wood & Bagasse 400 200 200
II-Manual 400 400
34 Total 1,000 400 000 20 2()
I-All ,8'UeZs/Powe,. 500 160 300 20 20 (a) Eleetrieity • 80 20 to 20 20 (c) Coal, Wood & ~ 420 140 280
Il-Ma"ual 000 300 200
35 Total 1,000 1,000
lI-Manual 1,000 1,000
36 Total 1,000 667 333
I-All FUel..!power 1,000 667 333
(a) EleCtricity 1,000 667 333
37 Total 1,000 500 500
I-All Fuel~/Po'Wer 000 500 (a) ElectriCity 500 500
II-Manual 500 500
38 Total 1,000 657 327 8 8
I-All FuelB/Powe7 754 515 231 4 4. (a) Electricity • 8 4 4 (c) Coal, Wood & Bas- 746 511 227 4 4
II-Manual 246 142 96 4 4
39 Total 1,000 524 354 20 14 88
I-All Fuels/Power 277 126 102 10 4Q
(a) Electrioity 223 87 82 10 44 (b) Liquid Fuel • 5 5 (c) Coal, Wood & Baga.ase 44 24 15 5 (II) Other Power 5 5
II_Manual 723 408 252 10 14 39
DUNGARPUR DIBTRICT-'fOTAJ4
DivisIon 2&a Total 1,000 612 106 41 23 I 17
I-All puels/Power 566 289 230 25 111 10 (a) Blectrlolt, 182 37 109 13 (II) Llquld Puel . 102 81 71
8
(e) Cloal, Wood & Baguse 268 181 47 12 21 6 (d) Other Power 26 20 3 It
II-Manual 4411 248 1'76 16 It • 7
YajorGroup 20-21 Total 1,000 304 601 12 71 12
1-All Fuel;fpower 982 298 589 12 71 12 (a) Electricity 399 89 298 6 6 (b) Liquid Fuel • 351 101 250 (c) Coal, Wood & Ba.ga.sse 143 36 30 6 7i (ci) Other Power 89 72 11 «I
II_Manual 18 6 12
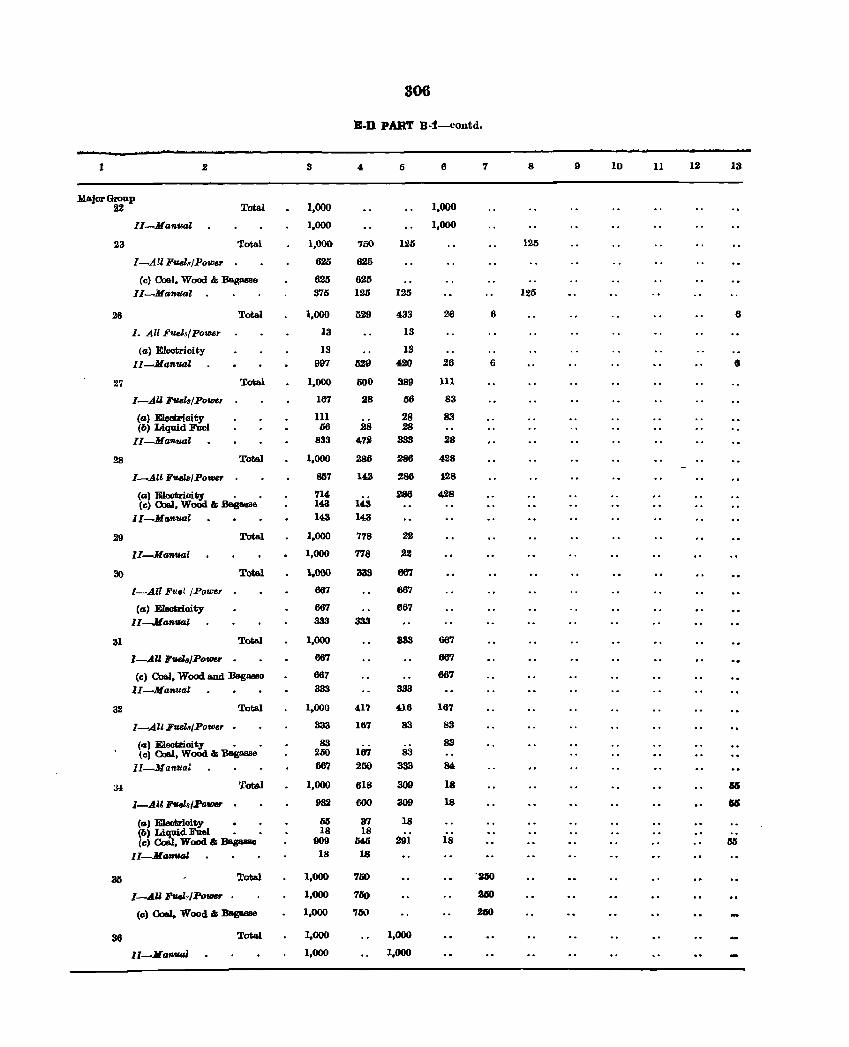
306
B-D PART B·1-contd.
1 2 3 5 6 7 8 9 10 11 12 13
Major GlOllp 22 Total 1.000 1,000
II-Manual 1.000 1,000
23 Total 1,000 750 125 125
I-A!l Fuel../Power 625 625
(c) Coal. Wood & Bagasse 625 625 II -M an'lJal 375 120 125 125
26 Total 1,000 529 433 26 6 6
1. All Fuels/Power 13 13
(a) Electrioity 13 IS II-Ma'Aual 997 529 420 26 6 6
27 Total 1.000 500 389 111
I-AU FtHls/PoWflI 167 28 66 83
(a) Electricity III 28 83 (6) Liquid Fuel 66 28 28
II-Ma_l 833 4-72 333 28
28 Total 1,000 286 286 428
I-All FuelBlPower 857 1&8 286 i28
(s) Electricity . 714-14,3
286 428 (c) CoaJ. WoOd 6; Bas- 143
II-Mafl/uol 1&8 143
29 Total 1.000 778 22
II-Ma_al 1,000 778 22
30 Total 1.000 333 667
I-All Fuel jPoweT 667 667
(s) Electricity 667 667 lI--4ianual 333 333
31 ToI;al 1,000 833 667
I-AU FtHla/Po_r 667 667
(c) Coal, Wood a.nd lJagasse 667 667
II-Manual 333 333
32 Total 1.000 4l'l 416 167
I--...!Ill Fuels/Power 333 1&7 83 83
('I) Electricity • 83 83 (c) Coal, Wood & Bagasse 250 167 83
lI_ManfJal 667 250 333 84
34 Total 1,000 618 309 18 ISIS
I-Allli"UelaIPo'IDU 982 600 309 18 ISIS
(s) E1ectrioity • • li5 37 18 (6, ~dFueI • • 18 18 (c) • Wood 6; :oag._ 009 li4li 291 18 50
II--Ma'llutU 18 18
SIS Total 1.000 '750 "260
I-AU FveldPo_r 1,000 750 UO
(c) CoaJ. Wood" Bagasae 1,000 751.1 .260
36 Total 1,000 1,000
II-Jla'IIutU 1.000 1,000
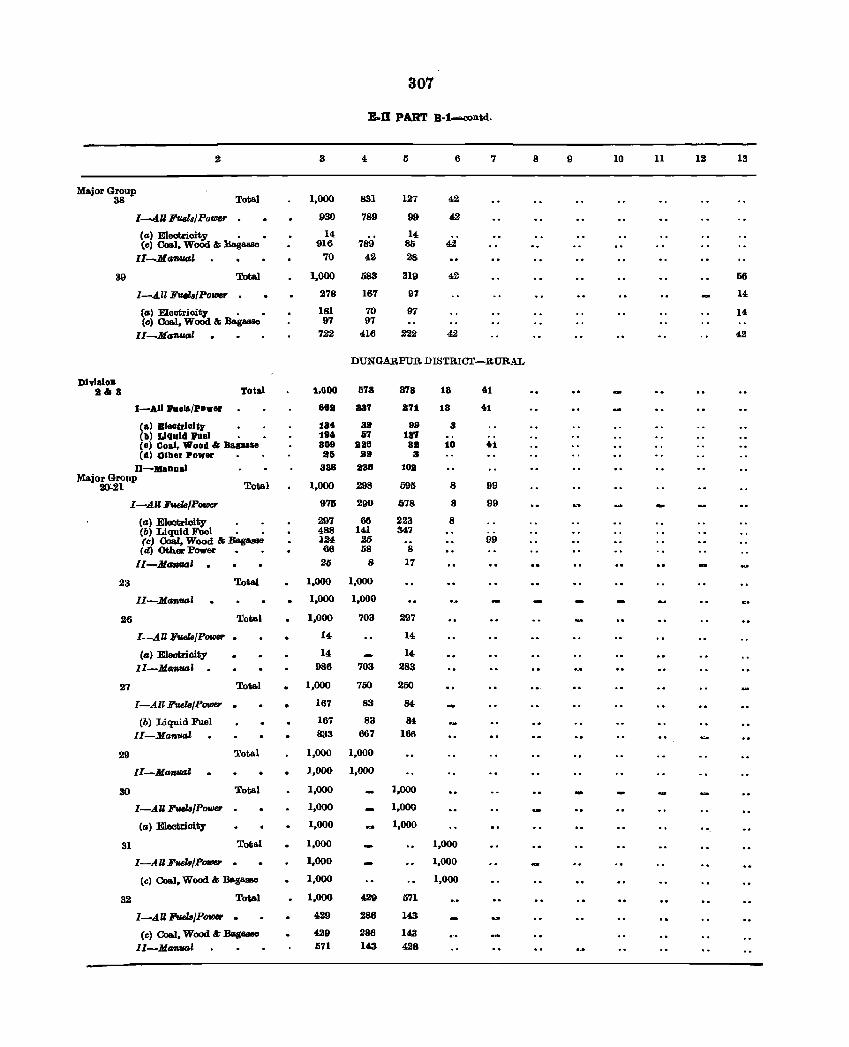
301
LD PART B-t-ooatd.
2 3 4 5 6 7 8 9 10 11 12 13
Ma.jorGroup 38 Total 1,000 831 127 42
J-A.U1i'rlclal Po_ 930 789 99 42
(Il) Electrioity . _ 14 14 (c) Coa.l, WoOd & Bagaase 916 789 80 42
I1~Ma_' 70 42 28
39 Total 1,000 583 319 42 56
I-All FueZsIPO'll1er 278 167 91 14
(a) Electricity • _ 181 70 97 14 (0) Coa.l, Wood & Bagaase 97 97
II-Ma'Atial 722 416 222 42 42
DUNGARPUR DISTRICT-RURAL
DlvllloD 1& a Total 1,000 573 87a 18 41
I-All l'IIel&/Pow. 868 Ba7 au 18 41
(a) BI_KleUy 184 38 99 3 (b) LIquid ,uel • 194 57 187 (II) Ooal, Wood & Balluse 809 886 88 10 41 (d) 01ller Power 86 liB 3
D-JlaDDal 838 888 108 Major Group
2O~21 Total 1,000 298 595 8 99
I-AU Fuels/Power 975 290 678 8 99
(II) Eleatrioity 297 66 223 8 (b) Liquid FUel • • 488 141 347 (oj Coal, Wood & Bagasse 124 26 99 (d) Other Fower 66 58 8
lI-M_' 2li 8 17
23 Total 1,000 1,000
II-M_tlGl 1,000 1,000
26 Total 1,000 703 297
I-AU FuelB/Power • 14- 14
(4) Eleotricity 14- 14
II-MIl'AtlGl 986 703 283
27 Total 1,000 750 250
I-AU Fuels/Power · 167 83 84
(b) Liquid Fuel 167 83 84
II-Man'll4Z 833 667 166
29 Total 1,000 1,000
II-Manual 1,000 1,000
30 Total 1,000 1,000
I-AU Fuels/Power · 1,000 1,000
(a) Elootricity 1,000 1,000 .. 31 Tota.l 1,000 1,000
I-All Puels/P_ · 1,000 1,000
(e) Coa.l, Wood & Bag- 1,000 1,000
32 Total 1,000 429 571
l-AU~/p()fller · 429 286 143
(c) CoaJ, Wood &- :&gasse 429 286 1~
lI-MantIGl 571 143 428
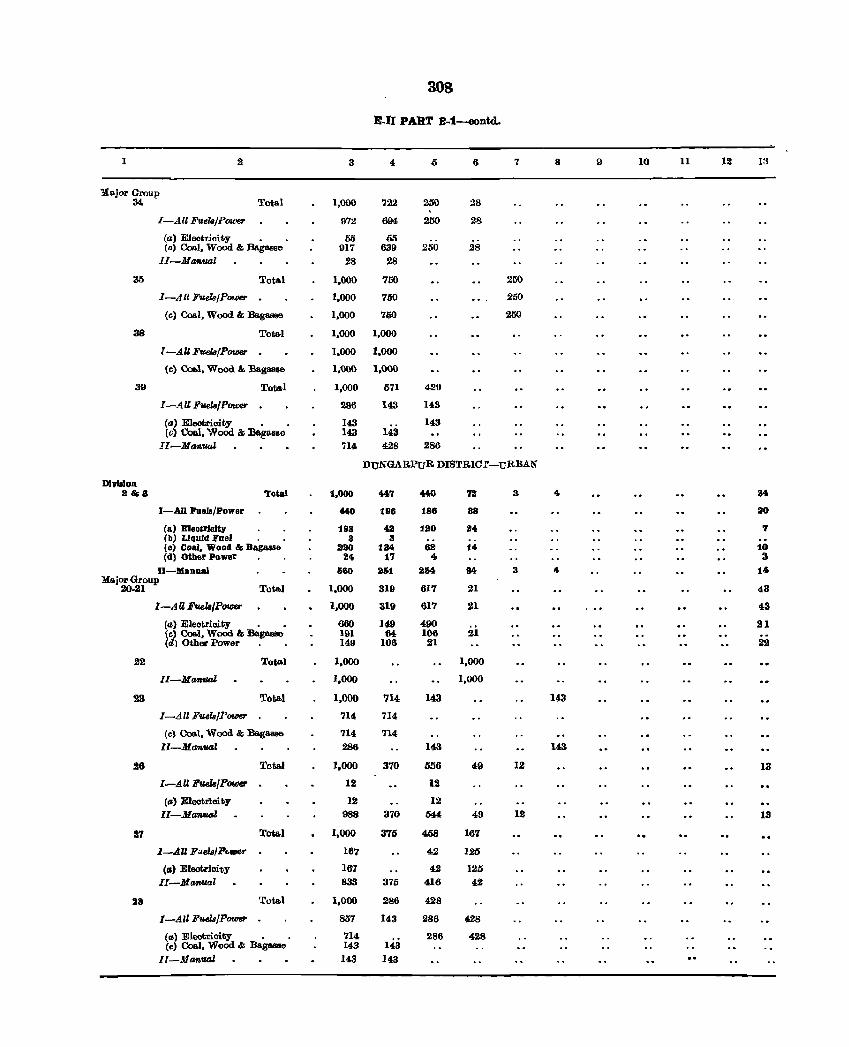
308
E-II PART B-1--oontd.
I 2 3 4 6 7 8 9 10 11 12 1:3
:lfajor Group 34 Total 1,000 722 250 28
I-All Fue18jPower 972 694 250 28
(a) Electricity 55 55 (c) Coal, Wood & Bagasse 917 639 250 28
II-Manual 28 28
35 Tota.l 1,000 750 250
I-All Fuels/Power 1,000 760 250
(c) Coal, Wood & Bag_ 1,000 700 250
38 Tot&l 1,000 1,000
I-AU Fue18rPOUJef' 1,000 1,000
(c) Co&l, Wood &:Ba.g_ 1,000 1,000
39 Total 1,000 571 429
I-AU FvelaIP_ 286 143 143
(a) Electricity . 143 143 143
(c) Co&l, Wood & :Bag&B86 143 II-Manual 714 428 286
DUNGARPUR DISTRICl'-uRBAN
D1vtaJOD 2&8 Total 1,000 44.7 440 '12 S 4 " I-AIll'uals/Power 440 186 188 88 20
(a) Eleo'rloity 198 42 120 24 7 (b) Liquid Fuel 8 8 (e) Coal, Wood & Bagasae 220 134 62 14 10 Cd) Other Power 24 17 4 3
II-Manual 660 251 254 M S 4 14 Mtojor Group
20-21 Tota.l 1.000 319 617 21 43
I-AU FuelB/P_ 1.000 319 617 21 43
(a) Electrioity • • 660 149 490 21 (c) Coal, Wood & Eag_ 191 64 106 21 (dl Other Power 149 106 21 22
22 Total 1,000 1,000
Il-ManvaJ 1,000 1,000
23 'l'otAl 1,000 114 143 143
I-AU Fue18/Power 714 714
(c) Coal, Wood & Bagasse 714 714 Il-Man'IIAd 286 143 143
28 Total 1,000 370 656 49 12 13
I-AU Fv.el8/Pawe:r 12 12
(a) Electricity 12 12 II-Manual 988 370 M4 49 12 13
27 Toal 1,000 375 408 167
I-All Fuel8fP,,_,. 167 42 125
(a) Eleotziohy 167 42 126 II-Manual 833 375 416 42
28 Tota.l 1,000 286 428
I-All FueZajPotDef' 857 143 286 428
(II) Electricity . 714 286 428 Cc) Coal, Wood & Bagasse 143 143
Il-Man'll41 143 143
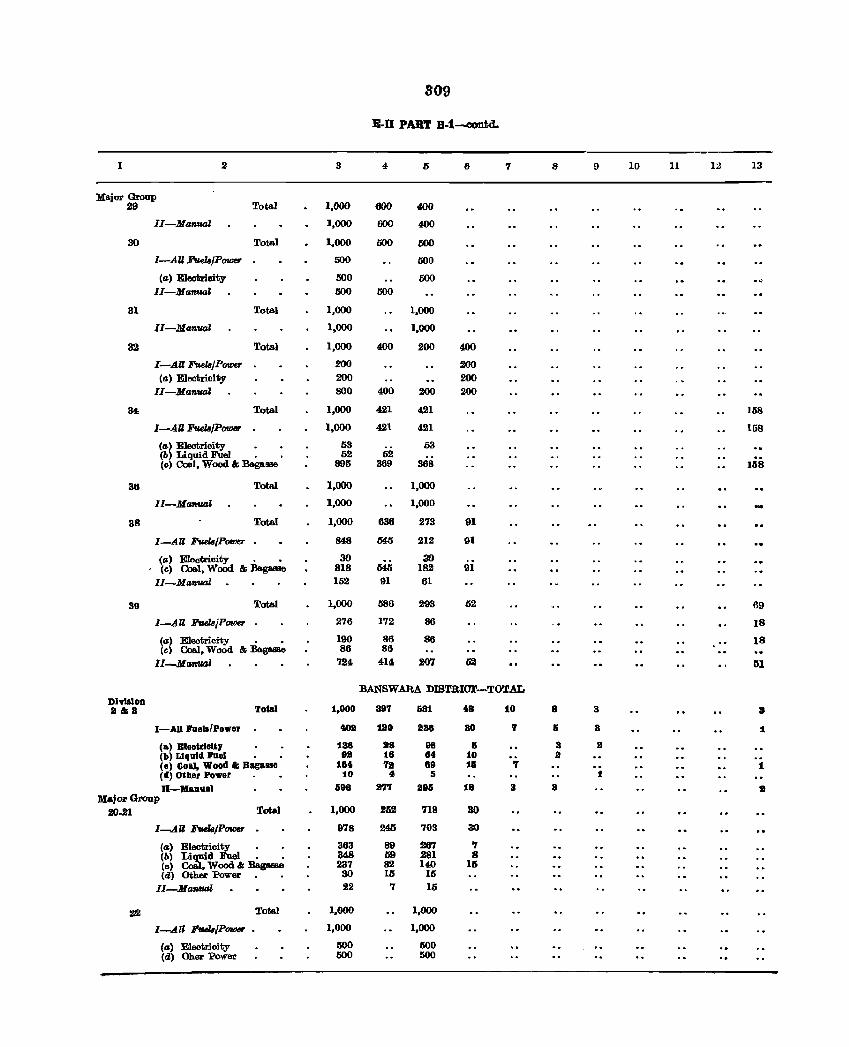
809
B·D PART B·t-contd.
I 2 3 4, 6 '1 8 9 10 11 12 13
:Major Group 29 Total 1,000 600 400
II-ManVDl ],000 600 400
30 Total 1,000 500 500
1-AU Fuel8jPOfIJ«' 500 500
(e) Electrioity 500 500 II-Manual 000 500
31 Tota.l 1,000 1,000
II-Manual 1,000 1,000
32 Total 1,000 400 200 400
I-All Fuel8JP- 200 200 (a) Electricity 200 200
II-Manual 800 400 200 200
34 Tota.l 1,000 421 421 158
I-AU FudslPOfIJ«' 1,000 421 421 IGS
(a) Electricity 53 53 (b) Liquid Fuel . 52 52 (c) Coal, Wood & BagallSe 895 369 368 158
36 Total 1,000 1,000
Il-Maftv,al 1,000 1,000
38 Tota.l 1,000 636 273 91
I-All Fuel6/Pomer 848 M5 212 91
(a) Eleotricity • • 30 30 , (c) Coal, Wood & :BagBlllle 818 54.'; 182 91 II-ManVDl 152 91 61
39 Tote.l 1,000 586 293 52 69
I-AU FtulBiPm.oer 276 172 86 18
(a) Electricity . • 190 86 86 18 (c) Coal, Wood & Bag_e 86 86
II-MaftfMl' 724 414 2Q'7 Ii2 61
BANSWARA DISTRIGr··-TOTAL DlvtlloD 111&8 Total 1,000 39'1 lia1 .8 10 8 a 8
I-All Fual.lfPowar 408 180 1138 30 'I Ii 3 1
(&) Bleetrlultr 188 88 98 I; 3 8 (b) Liquid l'1Iel • 98 16 84 10 iii (a) (011), Wood & Bagalle 16. '18 89 16 '1 1 (d) Other Power 10 • 5 1
n-Manual 1i98 3'1'1 BBIi 18 8 3 a Major Group
20.21 Totill 1,000 2152 718 30
I--.A It FtulBIPotDeJ" 978 245 '103 30
(G) Electricity • . 363 89 267 '1 (b) ~d Fuel. . 348 59 281 8 (c) , Wood & :Bag- 237 82 140 15 (d) Other Power 30 15 15
II-MantuJl. 22 7 15
~ Total 1,000 1,000
I-All 1I'tul8/P_ 1,000 1,000
(G) Eleutrioity 500 1500 (d) Ohar Power 500 500
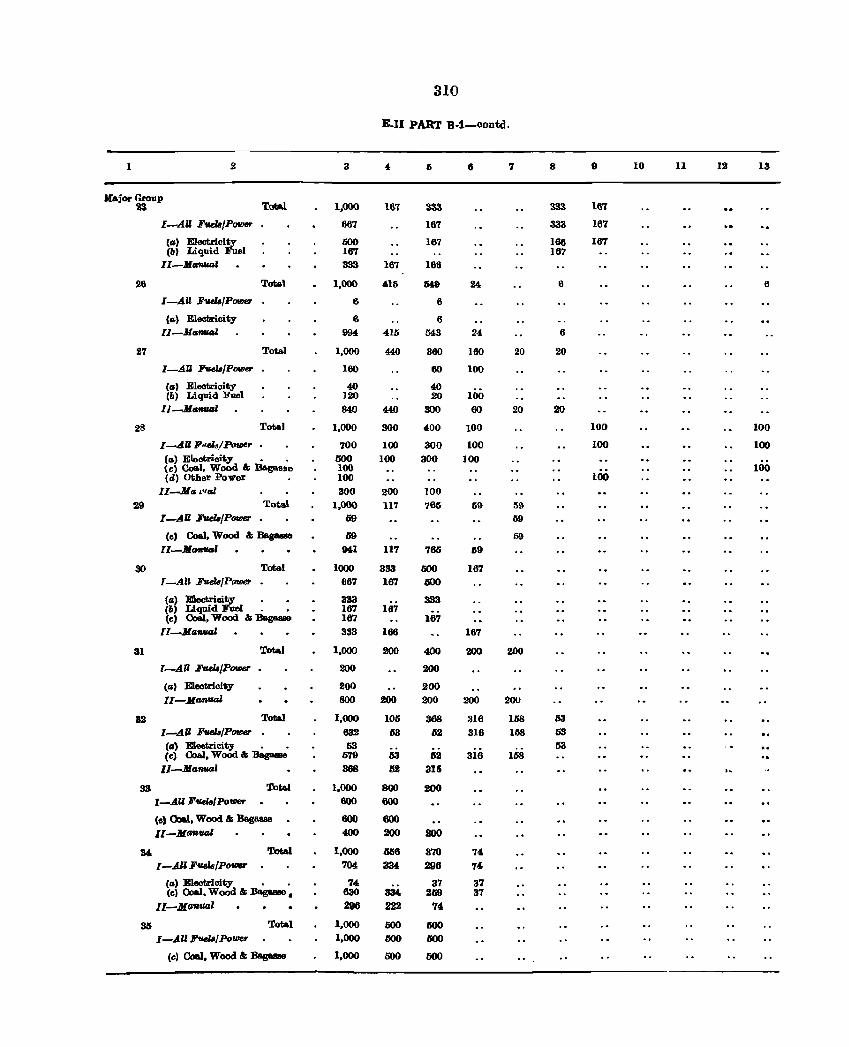
310
E_I1 PART B-t-contd.
1 2 3 4 7 8 9 10 11 12 13
)(ajor Group 23 TotAl I,QO() 161 S33 333 167
I-AU Fue14fPorDer 667 161 333 167
(0) Electricity 000 167 166 167 (b) Liquid Fuel 167 167
II-Manval 333 167 188
28 Total 1,000 415 549 24 6 6
I-AU FueI3IP_ 6 6
(a) Electricity 6 6 Il-Ma'lrUGl 994 415 543 24 6
27 Total 1,000 440 360 160 20 20
I-AU FuelaIPoww 160 60 100
(a) Electrioity 40 40 100 (b) Liquid Fuel 120 20
lJ -Matl1UJl 840 440 300 60 20 20
28 Total 1,000 300 400 100 100 100
I-AU F"el$/PuriJer 700 100 300 100 100 100 (a) Eleotrioity • • 500 100 300 100 (c) Coal, Wood &; Baga88e 100 100 (d) Other Power 100 100
II-ltIa ",G[ 300 200 100 29 Total 1,000 117 765 59 59
I-AU FwlB/P_ 59 59
(c) Coal, Wood & B&&- 59 59
II-Mtmu' 941 117 765 59
30 Total 1000 333 500 167 I-An Fuel8JP- 667 167 500
(a) E1ectrioi~ • • 333 333 (b) Liquid .• 167 167 (c) Coal, Wood & Bagaue 187 167
II-Mllnu' 333 166 167
31 Total 1,000 200 400 200 200
1--AU Fuel8JPOU1U' 200 200
(a) Electricity 200 200 lI-Non-1 800 200 200 200 200
82 Total 1,000 105 368 316 168 53
I-AU FuelB/Puu;er 632 53 62 316 158 53 (0) Electricity . • 53 53 (c) Coal, Wood&;:oag- 579 53 62 316 158
II-Ma.nval 368 52 3l1i
33 Tot&! 1,000 800 200 I-AU Fum/Po_r 600 600
(c) Oa&l. Wood & Be.g8888 600 600
II-MaRu' 400 200 200
34 Total 1,000 M6 370 74 I-AU Fuez../poUJU 704 334 296 74
(a) Electrioity • 74 37 37 (c) Coal. Wood & Bagaase. 630 334 259 37
II-MfJRIUII 296 222 '14
33 Total 1,000 500 500 I-All FuelBl Power 1,000 000 500
(c) Coal, Wood & Bapaae 1.000 000 500
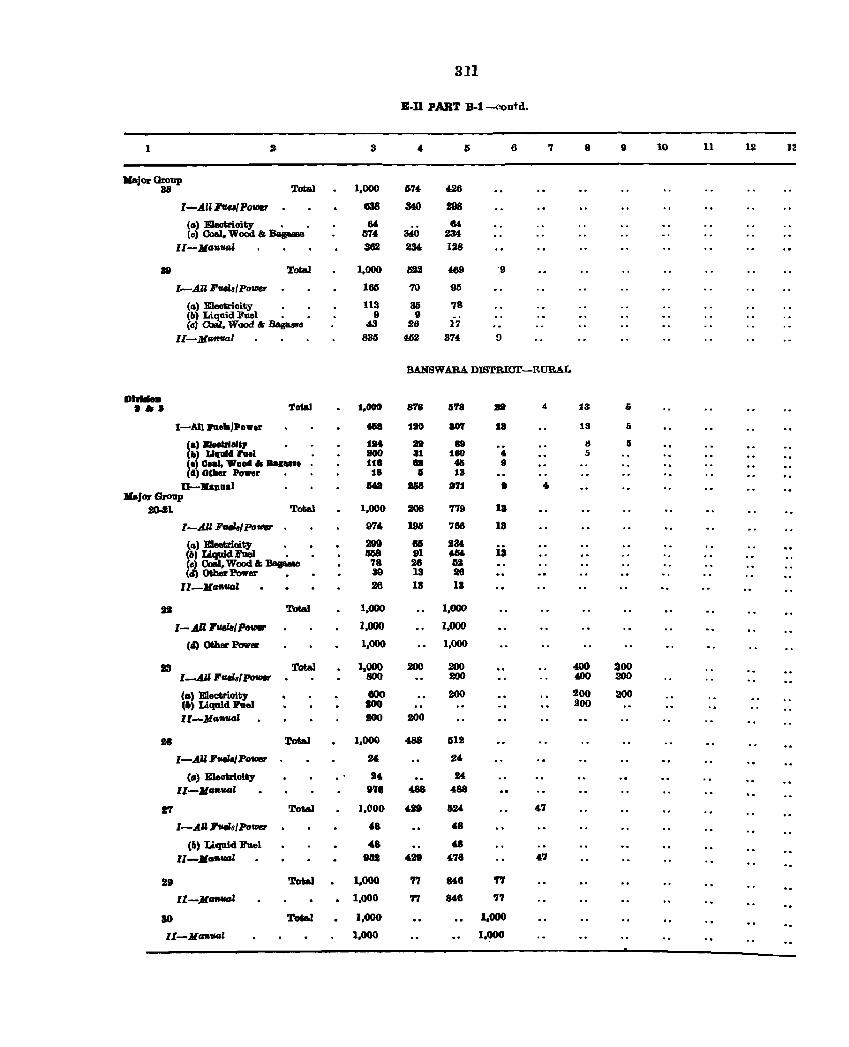
311
B.D PART B·t -coDtd.
1 3 6 7 8 9 10 11 12 U
Kajar Group 88 Total 1,000 674, 426
I-All """I PoVJeT 638 340 Z98
(G) Eleotrioity • M 84 Ie) Coal, Wood &: :&p.e 514 340 234,
II-MA.-I 362 234 128
81 Total 1,000 m 469 '9
I .... AZI F..uIPO'lller 165 70 95
(G) E1eotrioity 113 35 78 (II) Liquid Fuel • 9 9 (at a.z, Wood &- Bagasse 43 26 17
II-MAn-l 836 tD2 374, 9
BANBWARA DISTRICT-RURAL
DI ...... all. Total 1.000 878 11'18 BIt 4 13 5
I-Alll'lleIaJPo ... r tIIB 1ao 807 18 18 Ii
(a) BIeo&rleJlJ' 1" 38 B8 8 Ii (b) Ullalcl hel BOO 81 t80 .. 5 Ie) Ooal, "004 II 8qu.e ttB e 411 9 Ccl) Oiller Power 1. S 13
U-•• nllil i40I 258 .71 • .. MaJor Groap
JO.Jl Total 1,000 :aos 779 13
I-.doll ~I PoUf8r 97£ 195 786 13
(G) BIeotr.Ioity • 299 86 234 ii (6) ~dFuel • - 91 '" Ce) , Wood &; :Bapaae 78 28 52 (4) Other Power 39 13 26
l1-JlGtwtd 26 13 13
IS Total 1,000 1,000
I-AU 1'_IPover 1,000 1,000
(4) Other Power 1,000 1,000
13 Total 1.000 JOO JOO 400 200 I-AUF~'Po_ 800 200 4.00 200
(.) Electrioity 100 200 200 200 (') Liquid Poel 100 200
II-JlG.,ud too 2(10
lIS 'rota) 1,000 488 512
I-AU I'..:III/Polller " 24
(G) Eleokioit;y 51& 24
II-JlG.fUJl 9'" "'8 488
2'1 Total J,OOO 4.21 U4 47
I-AU :ra.lsIPo_ 48 48
(II) Liquid Fuel 48 d
II-JlG"'val - "29 "'8 ", 19 Total 1,000 77 "'8 'f'I
II-MG",,.,d 1,000 77 "'8 7"
30 Total 1,000 1.000
II-MG.,",I 1,000 1,000
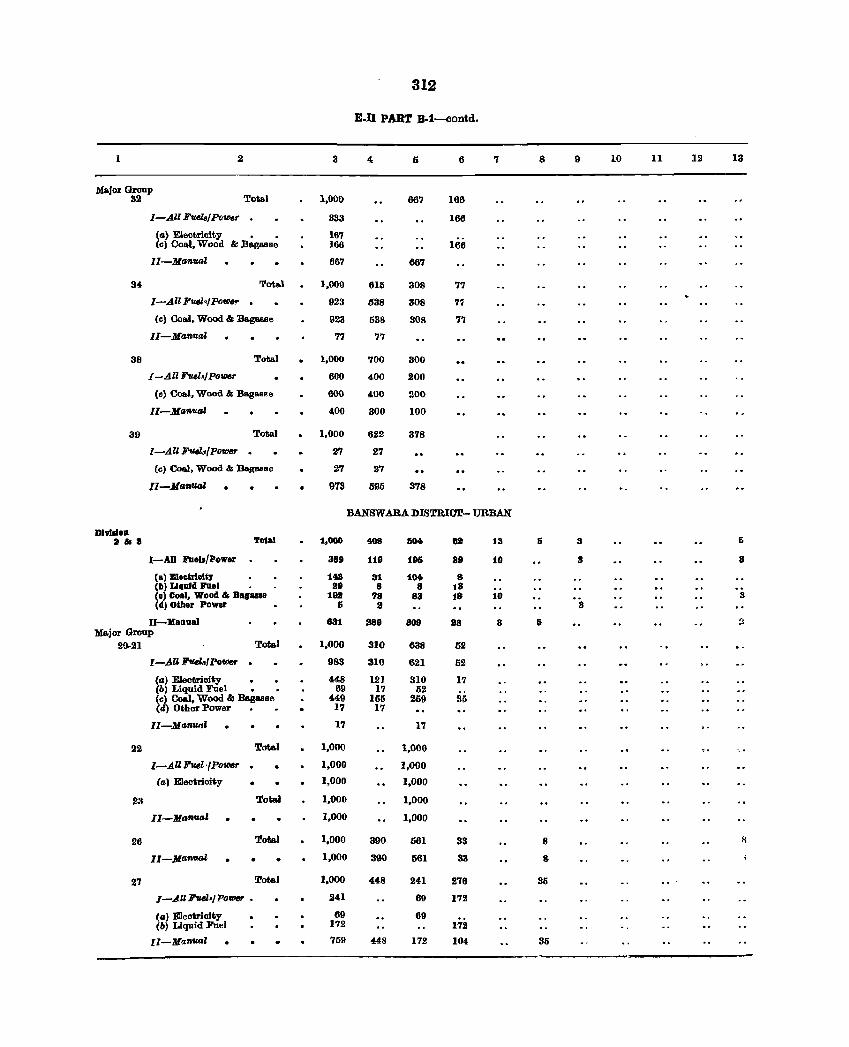
312
E-n PART S-1-oontd.
1 2 3 4 5 6 7 8 9 10 11 12 13
Major Group a2 Total 1,000 667 166
I-All Fuels/PoVJe,. 333 166
(a) Eleotricity • • 167 (c) Coal, Wood & Bagasse 166 166
ll-Manval 667 667
34 Total 1,000 6Ui 308 77
I-All FueNPoVJe'!' . 923 538 308 7'i
(c) Ooa.I, Wood & Ba.gasse 923 538 308 77
ll-Manual 77 77
38 Total 1,000 700 300
[-All FusNPoVJer 600 400 200
(c) Coa.l. Wood 8£ Bag .. sse 600 400 200
ll-Manual 400 300 100
39 Total 1,000 622 378
[-iW FutlhlfPOVJe1' . 27 27
(c) Coa.l, Wood 8£ Bag&llse 27 27
II-Manual 973 595 378
BANSWARA DISTRICT- URBAN
Dhillon It &I II Toial 1,000 408 1i04 U 13 Ii 3 II
I-AU Faels/Power 389 119 196 89 10 3 8
(a) BleeUloli7 148 31 104 8 (Ill Liquid FIlel 89 8 8 18 (a) Co.l, Wood & B.,&81111 1911 78 83 18 10 3 (d) Oiher Power Ii 8 8
II-Manual 881 889 809 88 8 Ii !3 Major Group
20.21 Total 1,000 310 638 52
I-An FtI.elafPoVJe,. - 983 310 621 52
(a) Electrioity • 448 121 310 17 (bl Liquid Fuel • • 61l 17 52 (c) Coal, Wood & Ba.guso 449 155 259 Sf) (d) Other Power 17 17
II-ManVIl' 17 17
22 Tot .. l 1,000 1,000
I-All Fuel ,{PoWdr . 1,000 1,000
(a) Electrioity • 1,000 1,000
2:4 Total 1,000 1,000
II-Manual 1,000 1,000
26 Total 1,000 390 561 33 8 k
II-MtJ"'ua' 1,000 390 561 33 8
27 Total 1.000 448 241 276 31i
I-All Fvel.j POVJe1' • 241 69 172
(a) Electricity 69 69 (b) Liquid Fuel 172 172
II-Manual 759 448 172 104 35
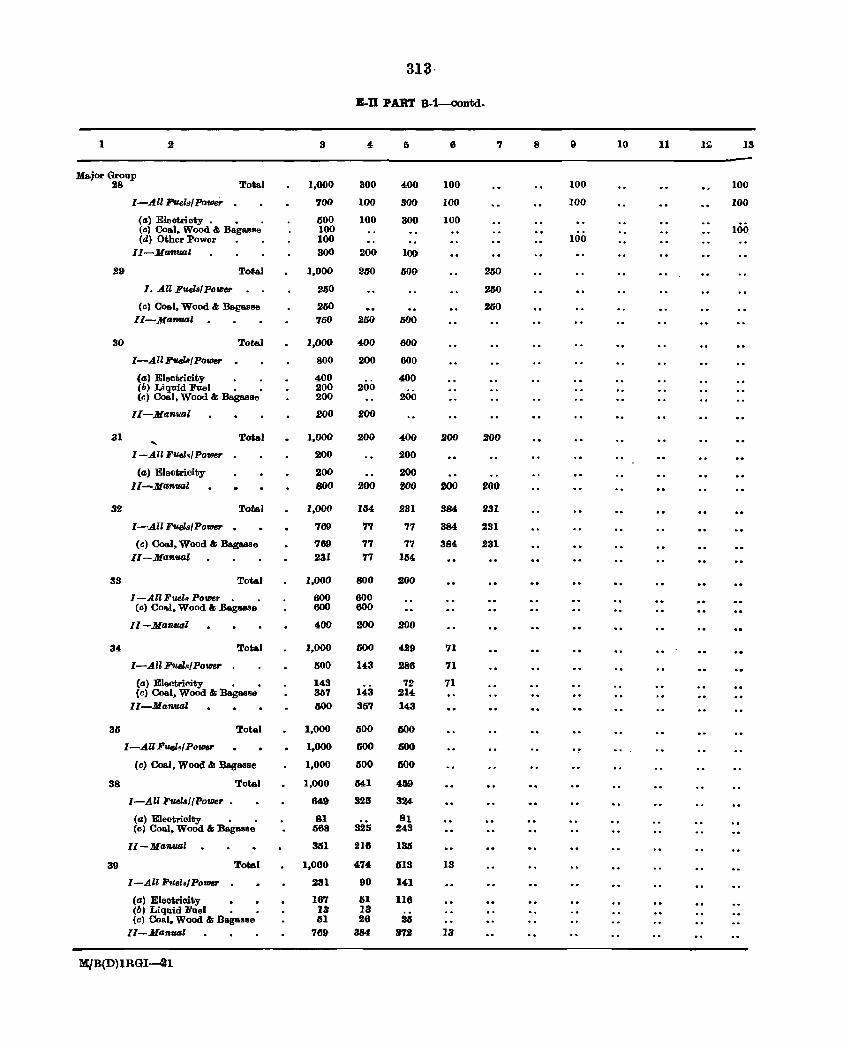
31a·
E-D PART 8-t-CODtd_
1 3 5 6 '1 8 9 10 11 l~ 13
Ma.jor Group 28 Tota.l 1,000 300 4,00 100 100 100
I-All FuelsfPower 700 100 300 100 100 100
(a) Eleotricty . • 500 100 300 100 (c) Coal. Wood & Bagasse 100 100 (d) Other Power 100 100
Il-MaD'Ual 300 200 100
29 Tot.a.l 1,000 250 000 2M
I. All Fue18!Power 250 250
(c) Coa.l, Wood &; Ba.guse 250 250 II-Mtz'I'VUQl 750 250 500
30 Total 1,000 400 800
I-All FVI/JB! Power . 800 200 600
(a) Electricity 400 400 (b) Liquid Fuel • 200 200
200 (el Coal, Wood &; BagaBBe 200
II-Manuol 200 200
31 Total 1,000 200 4,00 200 200
I-All Fuel·.f PO'lDef' 200 200
(a) Elect.ricity 200 200 II-Manual 800 200 200 200 .200
32 Total 1,000 154 231 384 231
I-·All ~/Power 769 77 '17 384 231
(c) Coal, Wood &; BagaBse 769 77 77 384 231 II -Manual 231 77 154
33 Total 1,000 800 sao I -All Fuel~ PO'lDe~ 600 600
(c) Coa.l, Wood &; Bagasse 600 600
Il-Morwal 400 200 200
34 Total 1,000 600 429 71
I-Ail F'Ua1.s/Powe,. 500 143 286 71
(0) Electricity • • 14,3 72 71 (c) Coal, Wood &; Bagasse 3M 143 214
II-MaDual 500 357 143
35 Total 1,000 500 500
I-AU Fuel./ POlD8r 1,000 500 liOO
(c) Coal, Wood &; llagaese 1,000 500 liOO
38 Total 1,000 041 419
I-All Fuel8lfPolD8r 649 325 324
(a) Ele(}trioity • . 81 81 (c) Coal, Wood &; Bagasse 568 325 243
II-Man.ual 351 216 135
39 Total 1,000 474 1S13 13
I-All F!1B1.} Power 231 90 141
(a) Electricity 16'1 61 116 (b) Liquid Fuel • 13 13 (c) Coal, Wood &; BagaBse 51 26 25
II-Man_l 769 384 372 13
MJB(D)lRGI...-21
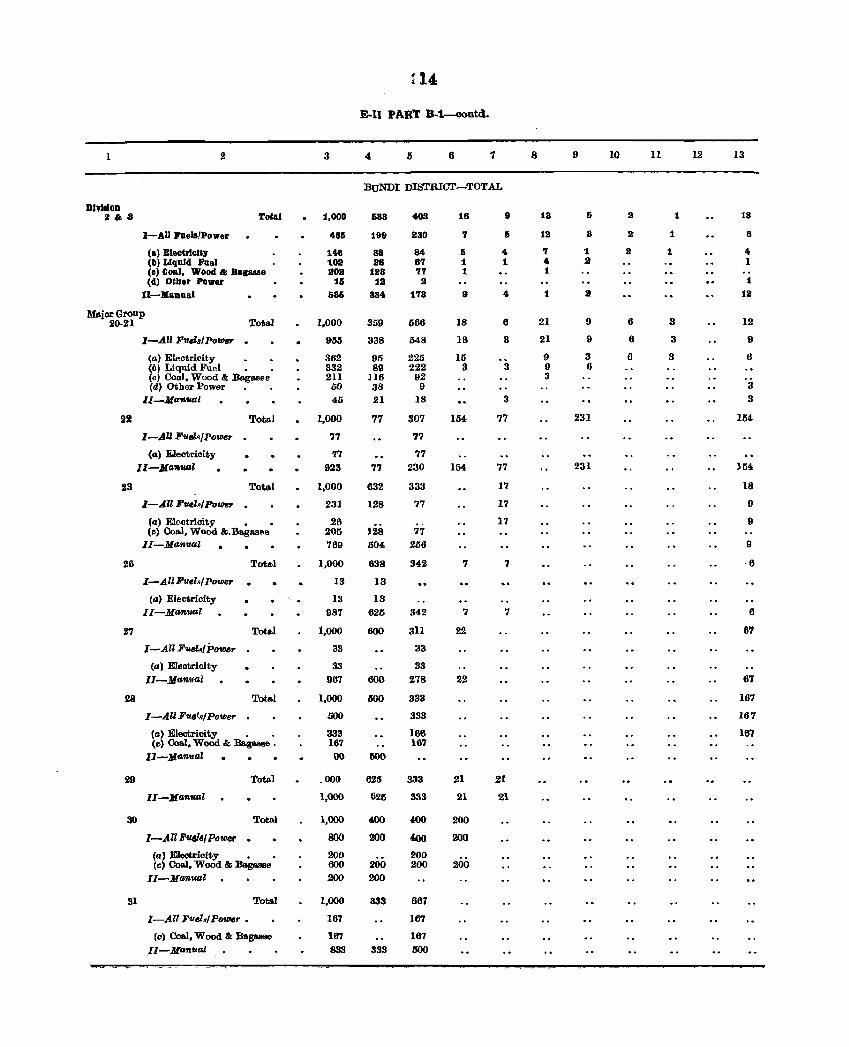
r14
E-U PART B-l-ClODtd.
1 2 3 4 5 6 7 8 9 10 11 12 13
:BUNDI DISTRICT-TOTAL
Dh:llloD a&B Total 1,000 633 408 18 8 13 6 II 1 18
I-AU Jl'Uels/Power 486 199 230 '1 Ii 12 8 2' 1 6
(a) EleatrleU, 146 38 84 6 " '1 1 II t " (II) LIquid Fuel 109 98 8'1 1 1 4 II 1 (c) Coal, Wood & BalllWe 8011 128 '1'1 1 1 (d) Other Power 16 18 II 1
II-Manual 585 334 1'18 It 4 1 II 12
MaLjor Group 20·21 Total 1,000 359 666 18 6 21 9 6 3 12
I-All F'Il.Ia} P6wer . 955 338 548 IS 3 21 I} 6 3 9
(a) Electricity 362 95 225 15 9 3 6 3 6 (6) Liquid Fud • • 332 89 222 :I 3 9 6 (e) Coal, Wood & Bagasse 211 116 92 3 (d) Other Power . . 50 38 9 3
Il-Mafltutl 45 21 18 3 3
22 Total 1,000 77 :107 154 77 231 154
I-All P'llel~/Power 71 71
<II) E.lectricity '1'1 77 ll-MIJ'IItIfIl 923 '77 230 104 77 231 104
23 Total 1,000 632 333 17 18
I-All Fucl.o/Power . 231 128 77 17 9
(a) Electricitv • • 26 17 9 (c) Coal, WoOd &.Bagasse 200 128 77
II-Man'IUJl 769 604 206 9
26 Total 1,000 638 342 7 '7 -6
I-All Fuel.,/ Power 13 13
(a) Electricity .. 13 13 II-Man_l 987 625 342 7 7 6
27 Total 1,000 600 311 22 6'1
I-All Fuel../ POttier 33 33
(al Eleotricity 33 33 II-Manvlll 967 600 278 22 67
28 Total 1,000 600 333 167
I-All Fuels! POWer 500 333 167
(a) Electricity • • 333 166 167 (e) Coal, Wood & :Ba.gasae • 167 167
II-Manual 00 500
29 Total .000 625 333 21 21
1I-Man1ud 1,000 625 333 21 21
30 Total 1,000 400 400 200
I-All "vaTsl POW4r . 800 200 400 200
(a) Electricity • 200 200 (e) Coal, Wood & Bagasse 600 200 200 200
II-Manual 200 200
31 Total 1,000 333 667
I-All F'll.I8/Pow«r • 167 167
(c) Coal, Wood & Bagasse 167 167
II-Manual 833 333 500
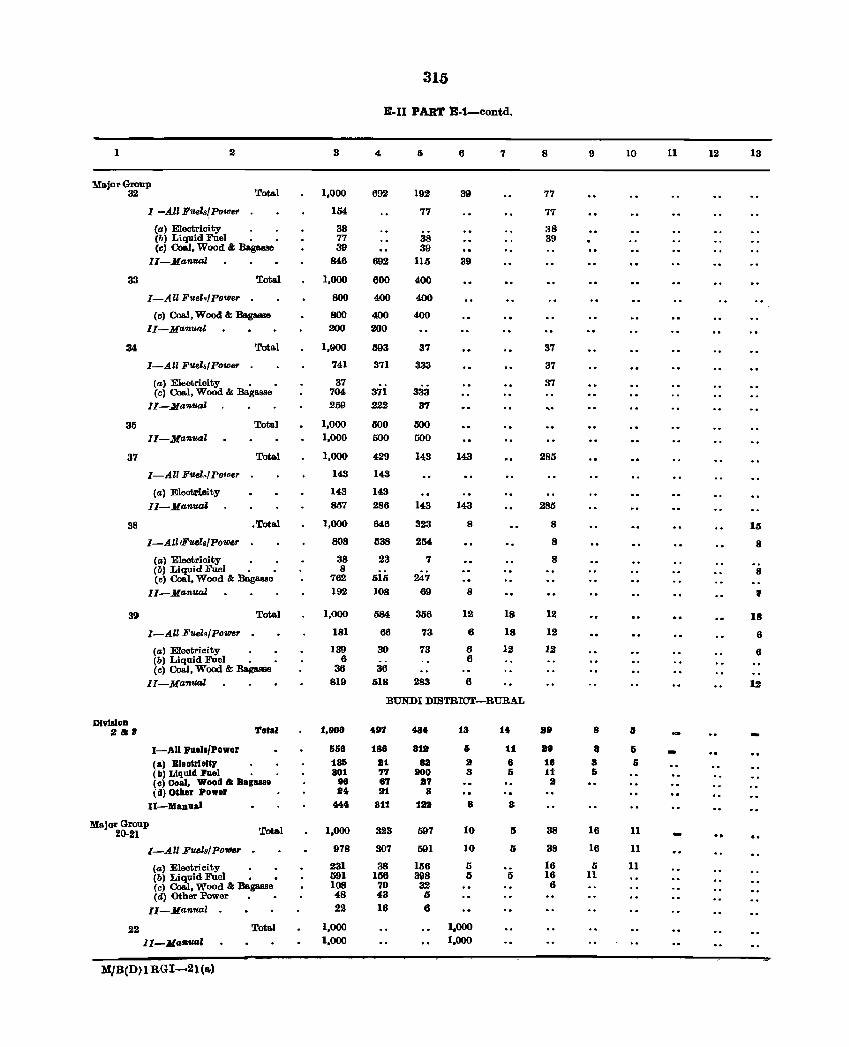
315
E-II PART E·1-contd.
1 II 3 4 6 7 8 9 10 11 12 13
Major Group 32 Tota.l 1,000 692 192 39 77
I -AlZ Fuels! Power 154 77 77
(a) Electrioity 38 38 (b) Liquid Fuel • 77 38 39 (c) Coal, Wood & Bagasse 39 39
II-Man'll4Z 846 692 lU 39
33 Tota.l 1,000 600 400
I-All FueZ.!Power 800 400 400
(c) Coal, Wood & Ba.ga.ase 800 400 400 II-Manual 200 200
3' Tota.l 1,000 003 37 37
I-All FueZ.s! PO'llJ.&r 741 371 333 37
(a) Electrioity • 37 37 Cc) ColLI, Wood & Baga.sse 704 371 333
II-Man'1J4Z 2$ 222 37
35 Total 1,000 600 500 II-Ma?lual 1,000 500 500
37 Total 1,000 429 143 143 285
I-All Fusl.,!Po1oer 143 143
(a) Electrloity 143 143 lI-Manud 857 286 143 143 285
38 • Total 1,000 646 323 8 8 15
I-AllIFmIR/powr 808 538 254 8 8
(a) Electricity 38 23 7 8 (b) Liquid Fuel • • 8 8 (c) ColLI, Wood & Bagasse 762 515 247
II-ManuaZ 192 108 69 8 I
39 Tota.I 1,000 584 356 12 18 12 18
I-All FueZ./PofDer 181 66 73 6 18 12 6
(a) Electricity 139 30 73 6 12 12 6 (b) Liquid Fuel • 6 6 (0) CoaJ, Wood & Bagasse 36 36
II-Manual 819 518 283 6 12
BUNDI DISTRICT-RURAL
DlvMoD a&B 'J'otaJ 1,000 497 434 18 14 89 8 Ii
I-All I'llels/Power 658 188 318 I> 11 89 .. 6
(II) Bleekiolt:r 185 21 sa 2 8 18 3 5 (b) Liquid Fuel . 801 77 200 3 6 11 5 (0) Coal, Wood & allguse 98 67 27 a (d) Other Power 24 21 3
U-III1DUa.1 444 311 1ft 8 8
Major Group 20·21 Total 1,000 323 597 10 5 38 16 11
I-AU Fue1a/Po_ . 978 307 591 10 0 38 16 11
(a) Electri oi ty 231 38 156 5 16 Ii 11 (b) Liquid Fuel • 691 166 398 5 5 16 11 (c) ColLI, Wood & Bagasse 108 70 32 6 (d) Other Power 48 43 IS
II-Manual 22 16 6
22 Total 1,000 1,000
II-MasuaZ 1,000 1.000
M,lB(D} I RGI-2 1 (a)
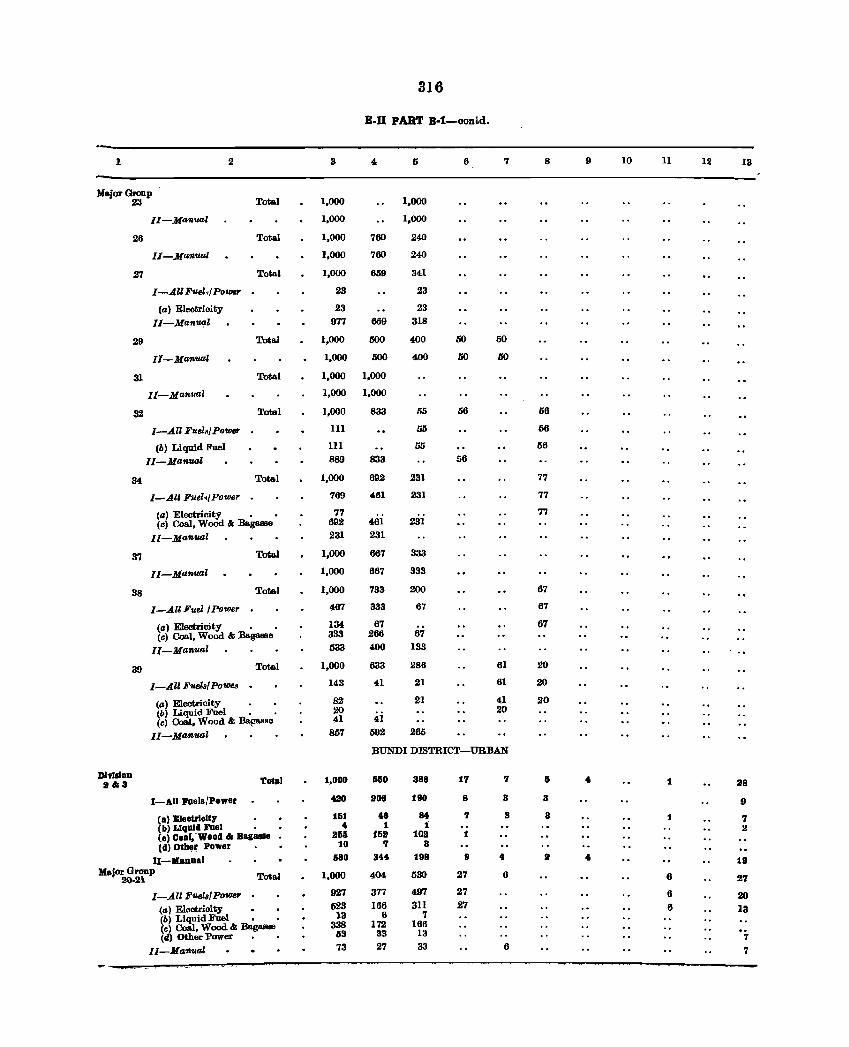
316
E.D PART 8-t-oontd.
1 2 3 4 5 6 7 8 9 10 11 12 13
Major Group 23 Total 1,000 1,000
II-Manual 1,000 1,000
26 Total 1,000 760 240
II-Manual 1,000 760 240
27 Total 1,000 659 341
I-AIIFuel</ Power 23 23
(a) Electricity 23 23
lI-Man'Uf'.ll 977 659 318
29 Tota.l 1,000 500 400 50 60
lI-Manual 1,000 500 400 50 60
31 Total 1,000 1,000
II-Manilal 1,000 1,000
32 Total 1,000 833 56 66 56
I-All FuelR/Power 111 56 56
(b) Liquid Fuel III 66 56
II-Man'UfJl 889 833 56
34 Total 1,000 692 231 77
I-All Fuel./powe,r 769 461 231 77
(a) Electricity • 77 77 (e) Coal, WOOd & :Ba.gasse 692 461 231
II-Manual 231 231
37 TotaJ 1,000 667 333
II_Manual 1,000 667 333
38 Tota.l 1,000 733 200 67
I-All Fuel/Power 467 333 67 67
(a) Electricity • 134 67 67 (e) Coal, Wood & :Ba.g&Il8e 333 266 67
II_Manual 533 400 133
39 Tota.l 1,000 633 286 61 20
I-All Fuslafpowes 143 41 21 61 20
(a) Electricity 82 21 41 20 (b) Liquid Fuel • 20 20 (e) Coa..I, Wood & :Ba.f!lWIge 41 41
Il-Manual IID7 692 265
BUNnI DISTRICT-URBAN
Division a&3 Total 1,000 550 388 17 'I IS , 1 28
I-All Fuela/Power taO 208 190 8 3 3 9
(a> EIeetrlolty 151 48 840 7 8 8 1 (b) LIqUId Fuel • 4 1 1:
7
(0) Coal.-Wood & Bagass. 2M t&a 10a 1 2
(d) Otb,r Power . 10 7 3
U-lI[aBual &80 344 198 9 4 a , 18
Major Group 20-21 Tota.l 1,000 404 630 27 6 6 27
I-All Fuels! POWSf' 927 377 497 27 6 20
(a) Electricity 523 166 311 27 6 (b) Liquid Fuel • 13 6 '7
13
(e) Coal, Wood & Bagasse 338 172 166 (i) Other Power • • 53 33 13 7
II-Ma1lUal 73 27 33 6 7
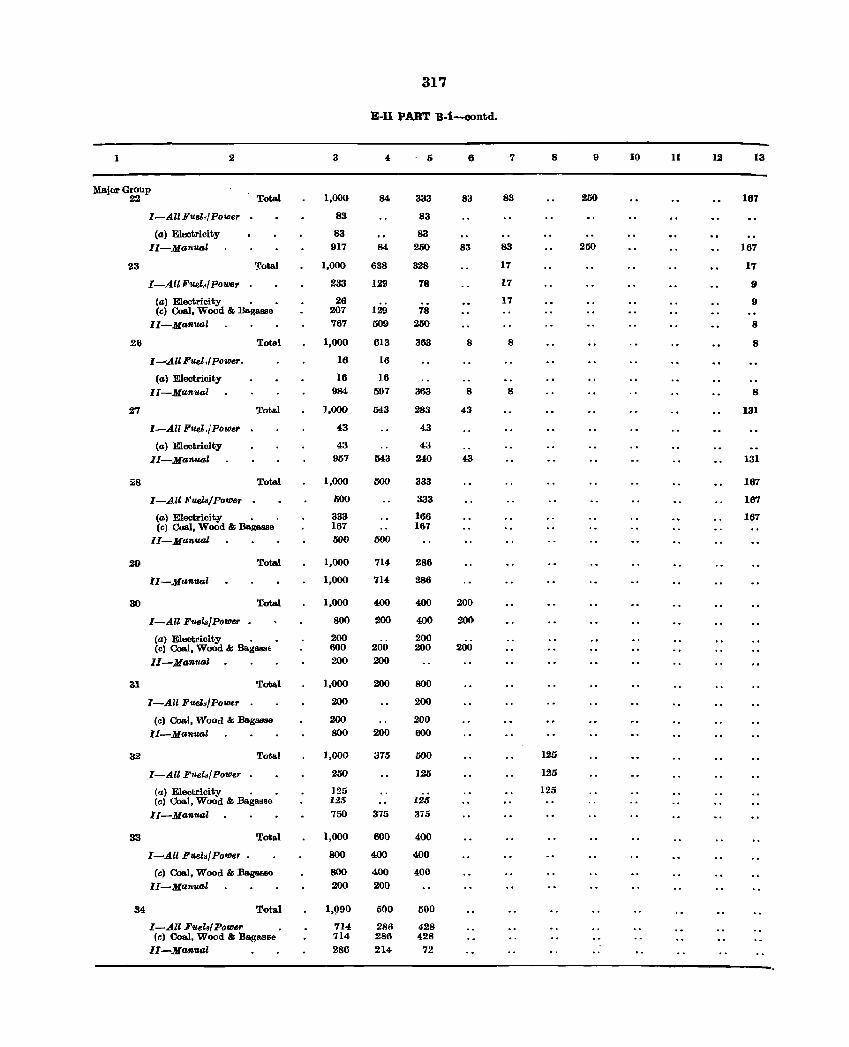
317
E-Il PART B-1--oontd.
1 2 3 6 7 8 9 10 11 12 13
:Major Group 22 Total 1,000 84 333 83 83 250 167
I-All Fuel,(Power 83 83
(a; i Eleotricity 83 83 II-Manual 917 84 250 83 83 250 167
23 'I'ota! 1,000 638 328 17 17
I-All Fuel,,( powsr 233 129 78 11 9
(a) Electricity . 26 17 9 (c) Coal, Wood & Bagall8e 207 129 78
II-Manual 767 509 250 8
26 Total 1,000 613 363 8 8 8
'~AllFuel;IPow6r. 16 16
(a) Electricity 16 16 II-Manual 984 597 363 8 8 8
27 Total 1,000 543 283 43 131
I-All FUeI,/Power 43 43
(a) Electricity 43 43 II-Manual 957 543 240 43 131
:'8 Total 1,000 500 333 167
I-All F'ue18/Power 500 333 167
(a) Electrici~ . 333 166 167 (c) Coal, Wood & Bap;aase 167 167
II-Manual 500 500
29 Total 1,000 714 286
II-Manual 1,000 714 286
30 Total 1,000 400 400 200
I-All Fuela/Power 800 200 400 200
(a) Electricity . 200 200 (c) Coo,l, Wood & BagassE 600 200 200 200
lI-ManuaZ 200 200
31 Total 1,000 200 800
I-All Fuel,,/Power 200 200
(c) Coal, Wood & Bagasse 200 200
II-Manual 800 200 600
32 Total 1,000 375 500 125
I-Ate Fuel8/Powe, 250 125 125
(a) Electricity . 125 125 (c) Coal, Wood & Bagasse 125 125
II-Manual 750 375 375
33 Tota.l 1,000 600 400
I-All Fuel./Power • 800 400 400
(c) Coal. Wood & Bagasse 800 400 400 II-Manual 200 200
34 Tota.l 1,990 500 500
I-All Fuel'" Power 714 28B 428 Cr.) Coal, Wood & Bagasse 714 286 428
II-Manual 286 214- 72
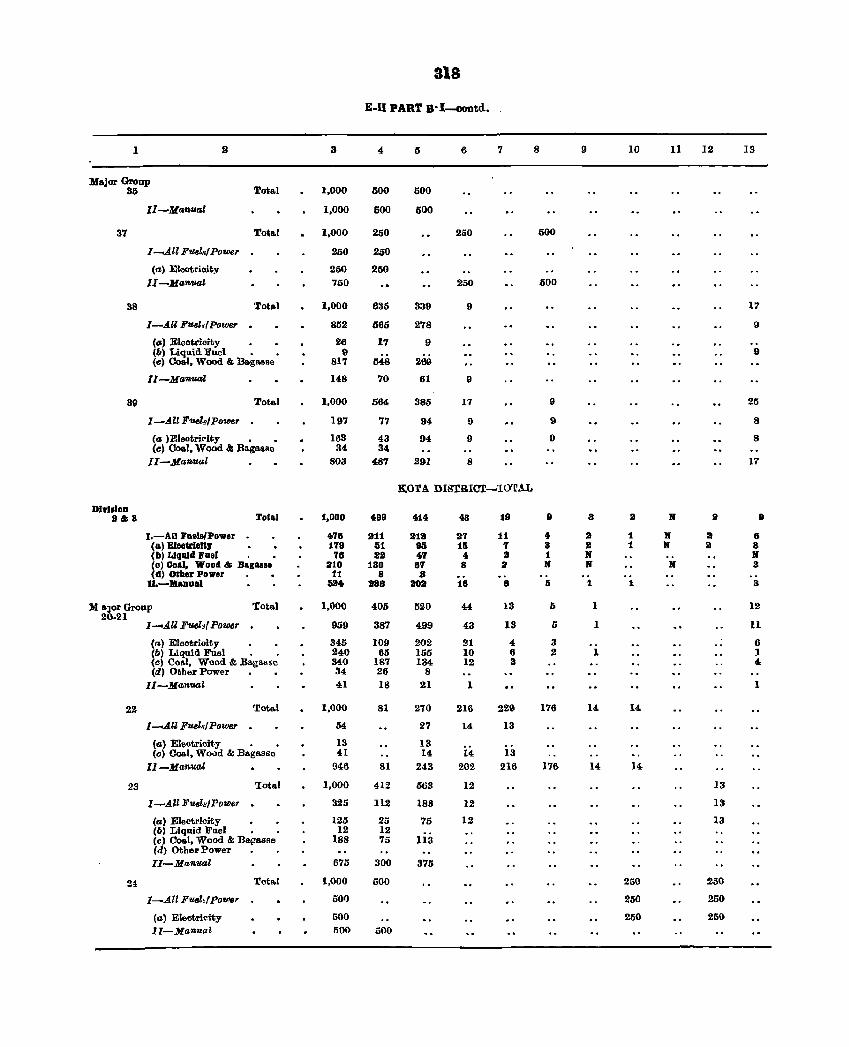
318
E-U PART B·I---GODtd.
1 3 4 5 6 7 8 9 10 11 12 13
Major Group Tota.l 35 1,000 500 500
II-Manual 1,000 600 600
37 Tota.l 1,000 250 21i0 500
1-..4.11 Fuels! Power 250 250
(a) Eleot.rioity 200 250 II-Manual 750 250 600
38 Total 1,000 635 339 9 17
I-All Fu.el.(Powe,. 852 565 278 9
(a) Eleotrioity 26 17 9 (b) Liquid Fuel • 9 9 Cc) 00&1, Wood &: Ba.gl\Sso 817 548 200
ll-Manual 148 70 61 9
39 Total 1,000 564 385 17 9 25
I -All Fuel.1 Power 197 77 94 9 9 8
(a )Eleotril'ity • • 163 43 94 9 0 8 (e} Coa.t. Wood &: Ba.gasse 34 34
II-Man.ual 803 487 291 8 17
KOTA DISTRICI-I0'rAL
DIvision 2&8 Total 1,000 499 414 48 19 9 3 2 R 2 •
I.-AU Pllola/Power 4178 211 lUll 27 11 41 It 1 If 2 8 (a) Electricll, 179 51 iii 15 7 8 a 1 II' a 8 (b) IdqllJd Fuel 76 aa 47 4 II t R R (0) Coal. Wood &; Baguse 210 180 8T 8 2 If R R 8 (d) Other Power 11 8 3
D.-IIIanual 524 288 aDa 18 8 5 1 1 3
M aJar Group Tota.l 1,000 405 520 44 13 I) 1 12 20.21
I --All Fuels' Power 959 387 499 43 13 /) 1 11
(tI) E1eotrioity 345 109 202 21 4 3 6 (b) Liquid Fuel 240 65 155 10 6 2 1 1 (e) Coa.t, Wood &: Ba.ga.Hse 340 187 134 12 3 4 (d) Other Power • • 34 26 8
Il-Man'llal 41 18 21 I 1
22 Tot!!.1 1,000 81 270 216 229 176 14 14
I-All Fuel8/ Powe,. 54 27 14 13
(a) Eltll)tricity • 13 13 (e) Coal, Wood & Ba.ga.sse 41 l4 14 13
II-Manual 946 81 243 202 216 176 14 14
23 'Iotal 1,000 412 563 12 13
1-A~1 Fuels/ Power . 325 112 188 12 13
(a) Electrioity 125 25 75 12 13 (6) Liquid Fael • • 12 12
lis (c) Coal, Wood & BajZ&sRe 188 75 (d) Other Power II-Manual 675 300 375
24 Tot!!.1 1,000 500 250 250
I-..4.11 P uel,fpo'lll8' 500 250 250
(a) Electricity 500 250 250 II-Man .. aZ 500 500
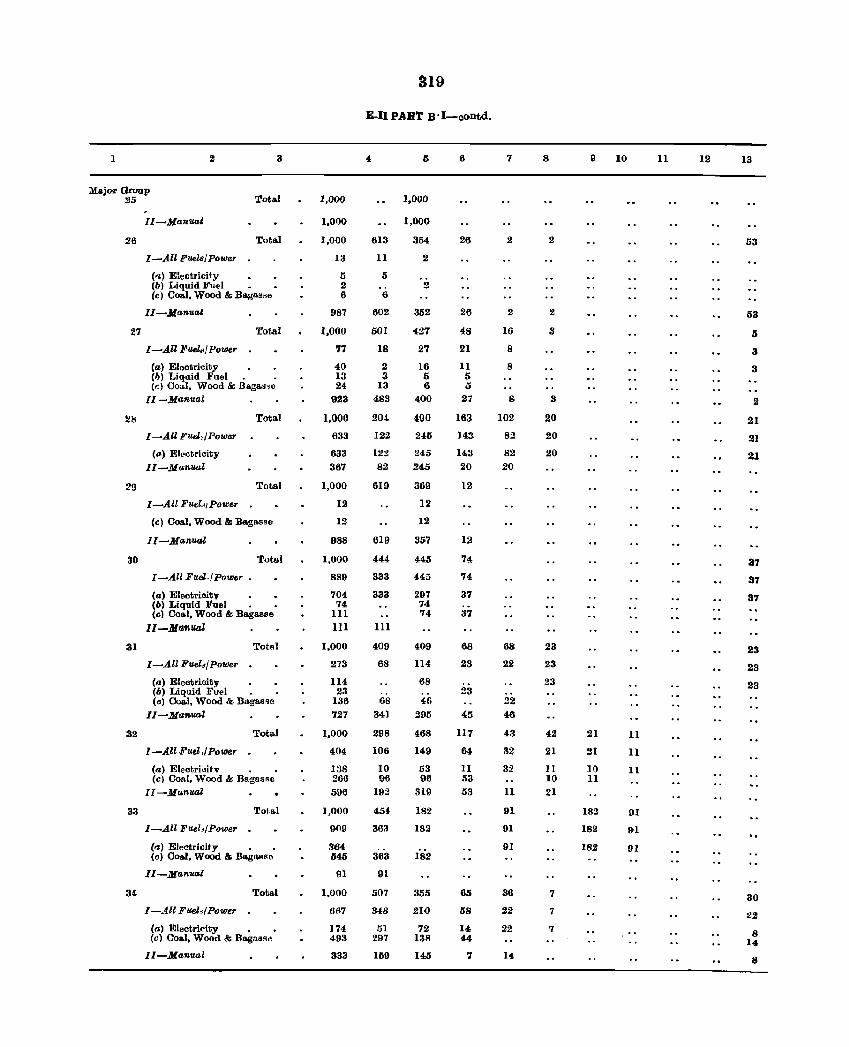
1 2 3
Major Group 25 Total
26
27
29
30
31
II-Manual
I-All Fue18/ Power
(,,) Electricit,y (b) Liquid }'u .. 1 •
Tota.l
(c) Coal, Wood & Bagasse
II-Manual
I-All FUeI~/Po!tJer
Cal Electrioity
Total
ChI Liqdid :Fuel. . Cc) Coal, Woad & Bago.",o
II-Manual
I-AU }'uel,/ Power
(a) Ell'etrioity
II-14an_1
I-AU Fuel.'1 power
Tota.l
Total
(c) Coal, Wood & Bagasse
II-Man,ual
Total
I-All Fuel·/Power •
(a) Electrioitv • (b) Liquid Fuel • • (c) Coal, Wood & Bagasse
II -MtJfluaJ
I-All Fuel-!Power
(II) Eleotricity (b) Liquid Fuel .
Total
(c) COIloI, Wood & Bagasse
II-Ma""uo,l
32 Total
33
34
l-AII,Fuel,/Power
(a) Elect,ricitv • (c) Coal, Wood & Bagasse
II-Manual
Tot.al
I-All Fuels/Power
(~) Electricity • . (c) Coal, Wood & Bo.gasse
II-Manual
Total
I-AU FUels/Pow(!r
(a) Electricity • Ccl Coal, Wood & Bagll9M
II-Manual
1,000
1,000
1,000
13
5 2 6
987
l,O()O
77
40 13 24
923
1,000
633
633
367
1,000
12
12
988
1,000
889
704 74
111
III
1,000
273
11·:1, 23
136 727
1,000
404
I:3S 266 596
1,000
1}09
364 545
91
1.000
6(17
]74 493
333
rU9
E-II PART B ·I-oontd.
4
613
11
5
6
602
501
18
2 3
13 483
20i
122
122 82
619
619
444
333
333
HI
409
68
68 341
298
106
10 96
192
454-
363
363
91
507
348
51 297
159
5
1,000
1,000
354
2
2
352
427
27
16 5 6
400
490
2"5
245
245
369
12
12
357
445
445
297 74 74
409
114
68
46 295
468
149
53 96
319
182
182
182
355
210
72 138
145
6
26
26
48
21
11 5
27
163
143
143 20
12
12
74
74
37
37
68
23
23
45
117
64
11 53 53
65
58
14 44
7
7
2
2
16
8
8
S
102
82
82 20
68
22
22 46
43
32
32
11
91
91
91
36
22
22
14
8
2
2
3
3
20
20
20
23
23
23
42
21
II 10
21
7
7
7
9
21
21
10 11
182
182
182
10
11
11
11
91
91
91
II 12 13
53
53
.5
3
3
2
21
21
21
37
37
37
23
23
23
30
:;!2
8 14
8
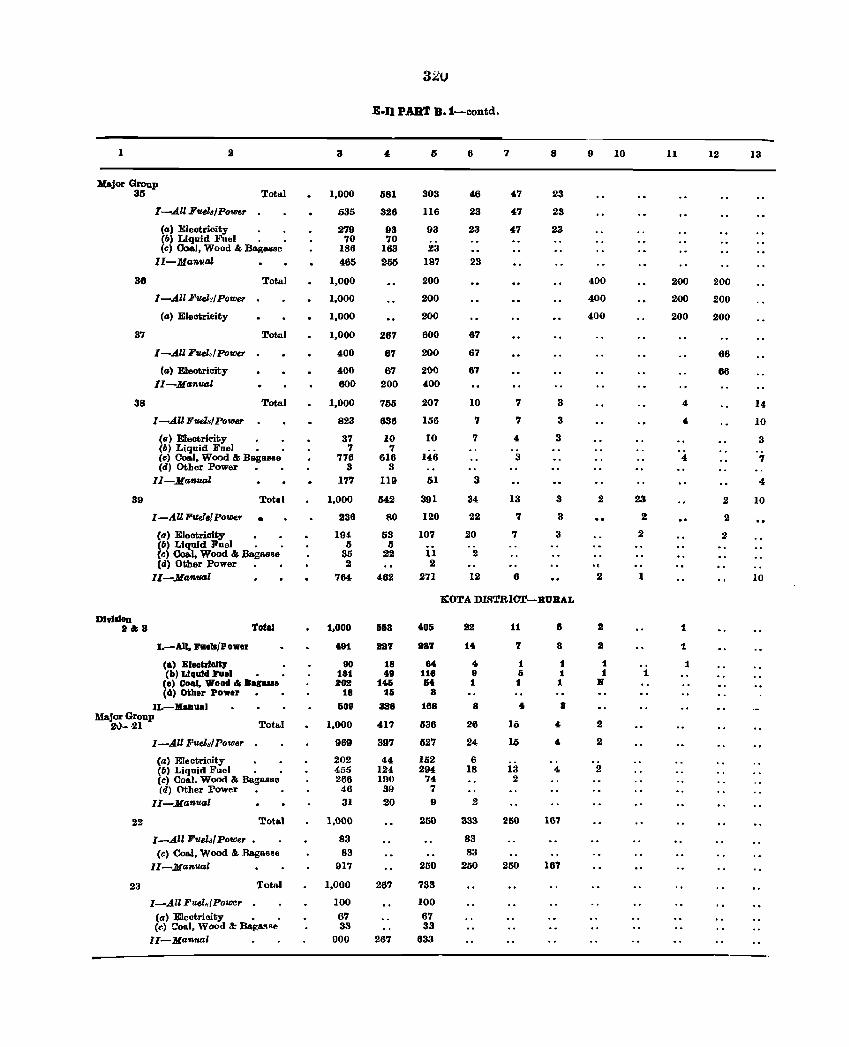
320
E·n PART B.1-contd.
1 2 3 5 6 7 8 9 10 11 12 13
Major Group 35 ']'ottLl 1,000 581 303 46 47 23
I-All Fuels/Power 535 326 116 23 47 23
(a) Eleotricity 279 93 93 23 47 23 (6) Liquid }'lIel . 70 70 (c) Coal, Wood & Bagasse 186 163 23
II-ManutJJ 465 255 187 23
38 Total 1,000 200 400 200 200
I-All Fuels! Power 1,000 200 400 200 200
(a) Electricity 1,000 200 400 200 200
37 Total 1,000 267 600 67
I-All Fuel.! Power 400 67 200 67 66
(a) E1eotricity 400 67 2nO 67 66 II-Man'UlJl 600 200 400
38 Total 1,000 755 207 10 7 3 4 14
I-All Fuels/Po,"r 823 638 156 7 7 3 4 10
(0) Electricit.y • 37 10 10 7 4 3 3 (6) Liquid Foel • • 7 7 (c) Coal, Wood & Bagasso 776 616 146 3 4 7 (d) Otber Power 3 3
II-Manual 177 119 61 3 4
39 Total 1,000 542 391 34 13 3 2 23 2 10
I-All FUel,I Po,"r • 236 80 120 22 ., 3 2 2
(0) Eleotricity • • 194 53 107 20 7 3 2 2 (6) Liquid Fllel . . 5 5 (r.) Coal, Wood & BaglWl~e 35 22 11 2 (d) Other Power 2 2 .,
II-Man'll41 764 462 271 12 6 2 1 10
KOTA DISTRICT-BUBAL
DlvllIlID 11&8 Total 1,000 &63 405 112 11 8 2 1
1.-All. Fa.lllfP ower 481 1Ia'l 1ST 14 7 8 2 1
(a) EleetrloJly 90 18 84 .. 1 1 1 1 (II) Liquid Fuel 181 49 118 8 & 1 1 1
(0) Coal, Wood" Bacaue 203 145 &4 1 1 1 If (d) Other Power 18 16 8
U.-J(anual &09 338 188 8 4. 8 Major Group
21)- ·21 Totu.1 1,000 417 536 26 10 .. 2
I -Alll!'ueM Power 969 397 527 24 16 4 2
(a) Eleatrioity 202 44 Ui2 6 (6) Liquid Fuel • 455 124 294 18 13 4 2 (c) Coal. Wood & Bagasse 266 190 74 2 (d) Other Power 46 39 7
II-Manual 31 20 9 2
22 Tota.l 1,000 250 333 260 167
I-All FUelsl Power 83 83 (c) Co&l, Wood & .Raga.sse 83 83
II-Manual 917 250 250 250 167
23 Total 1,000 267 733
I-All Fuel.IPowe, 100 100
Ca) Electricity • • 67 67 (e) Coal, Wood & Baga!lAe 33 33
II-Manual 000 267 633
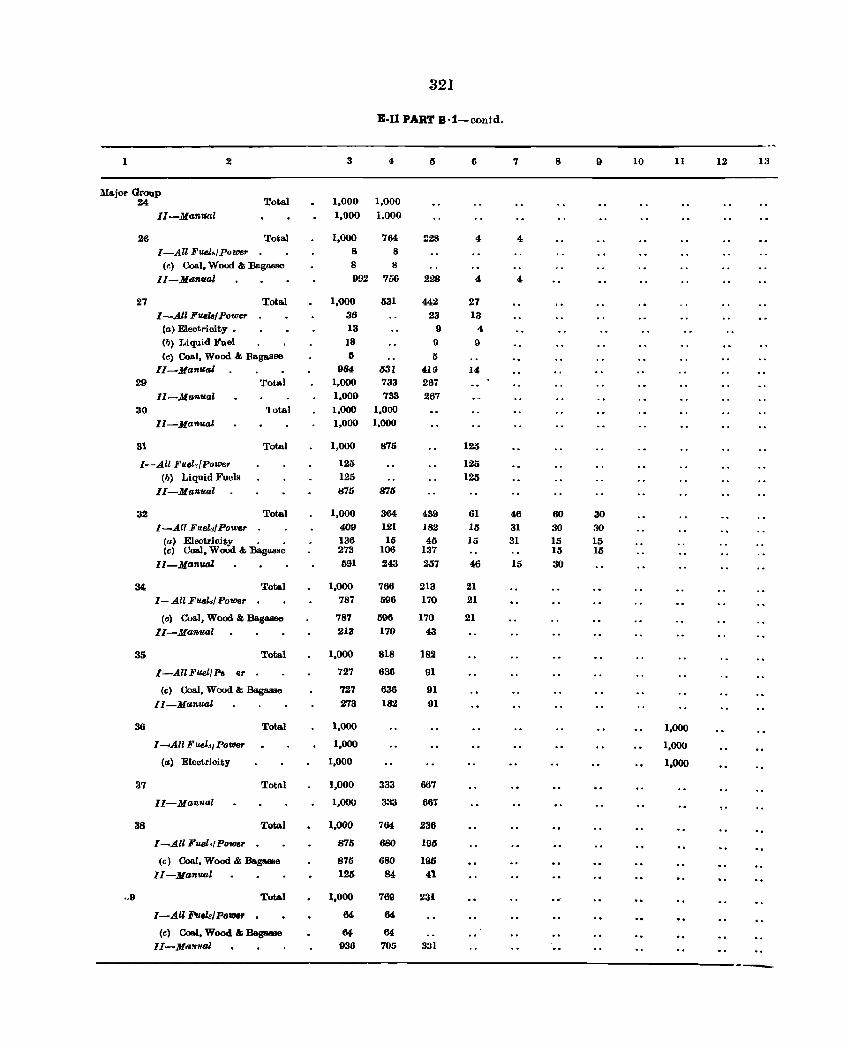
321
E-Il PART B·1·_·contd.
1 2 3 5 6 7 8 9 10 11 12 13
Major Group Total 24 1,000 1,000
II-Manual 1,000 1.000
28 Total 1,000 764 :)28 4, 4 I-All Fuel,/Powe~ 8 8
(c) Coal, Wood &; Bagasse 8 8
II-Manual 992 756 228 4, 4
27 Total 1,000 531 442 27 I -All Fue18/ Powe1" 36 23 18
(a) Electricity • 13 9 4 (~) Liquid Fuel 18 0 9 (c> Coal, Wood & Ba.gasse 5 5
II-Manu-al 964 631 419 14 29 '.rotal 1,000 733 267
II-Manual 1,000 733 267 30 'lotal 1,000 1,000
Il-Ma1llll.al 1,000 1,000
31 Total 1,000 875 125
I-Alll!'uel,{Power 125 125 (b) Liquid Fuels 125 125
II-Manual 875 876
32 Total 1,000 364 439 61 46 60 30 I-AU Fuel./Pou'er 409 121 182 15 31 30 30
(a) Electricity • • 136 15 45 15 31 15 15 (c) eoal, WoOd &; :Bagasse 273 106 137 15 15
II-Manual 691 243 257 46 15 30
34 Total 1,000 766 213 21 1- All Fuel,,/ Power 787 596 170 21
(e) Coal, Wood &; Bagasee 787 596 170 21
II-Manual 213 170 43
35 Total 1,000 818 182
I -All ]<'ueJ,/ Ps er 727 636 91
(e) Coal, Wood &; Baga.sse 727 636 91 II-Manual 273 182 91
36 Total 1,000 1,000
I ....... All F uels{ Power 1,000 1,000
(a) Electrioity 1,000 1,000
37 Total 1,000 333 667
II-Mantlal 1,000 333 66'i
38 Total 1,000 764 236
I-All Fuel" Power 875 680 196
(c) Coal, Wood &; Bagasse 875 680 195 II-Manual 125 84 41
.. 9 Total 1,000 769 231
I-All F'Uel.!/ Po"", 64 M
(c) Coal, Wood &; Bag&ll8e ~ 64 II-Ma,!!'/Iol 938 705 3:11 -_.
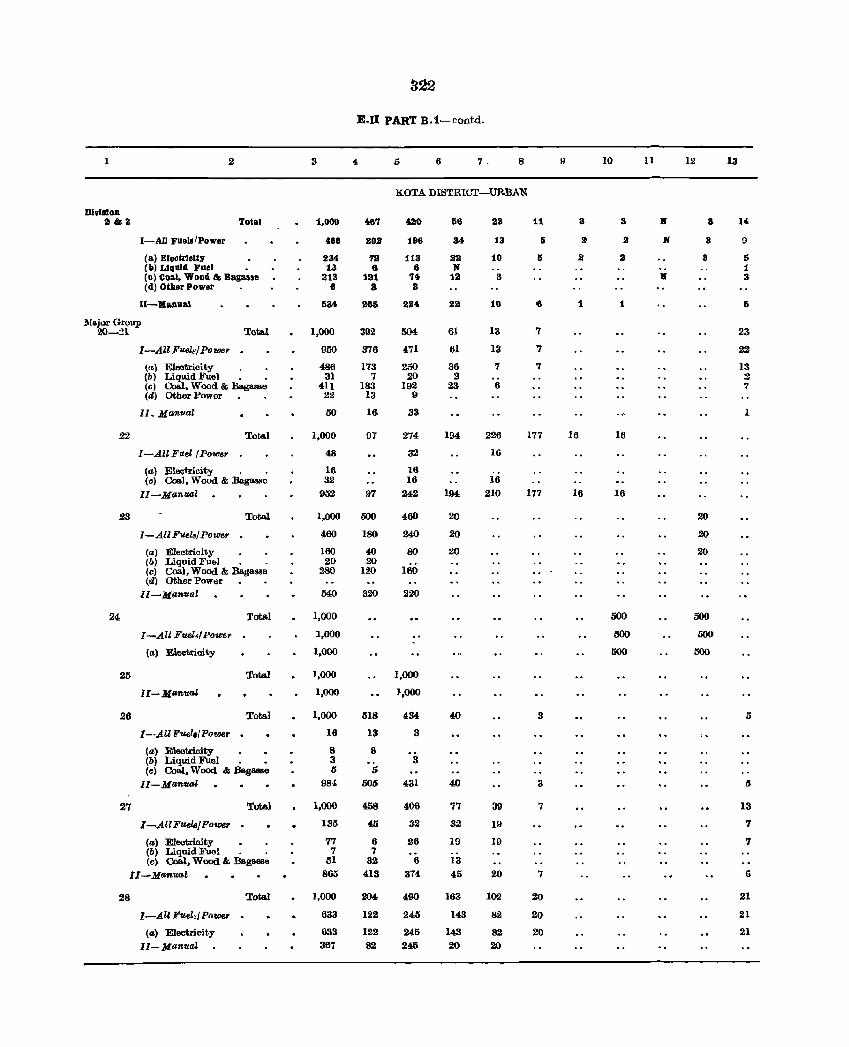
322
E.n PART B.1-contd.
1 2 3 4 i) 6 7 - 8 9 10 II 12 13
KOTA DlllTRIGT-UR.BAN
DlvllI10n 2 &3 Toial 1,000 467 420 56 23 11 3 S K 8 14
I-AU Foell/Power ta8 20Z 198 34 13 & a 2 N 8 !)
(a) Eleotrlcity 234 7S 118 Z2 10 5 2: II 3 5 (b) Liquid Fuel 13 6 8 N 1 (e) Coal, Wood & Ballaaae 213 121 74 12 S K 3 (d) Other Power 8 a 8
II-Manual 5" 265 224 22 10 6 1 1 5
?>Ia.jor Group 2Q-:!1 Tota.l 1,000 302 504 61 13 7 23
I-All Fuel,IPower 950 376 471 61 13 7 22
Ire) Electricity 486 173 250 36 7 7 13 (b) Liquid Fuel • . 31 7 20 2 2 (c) Coal, Wood & Bagasse 411 183 192 23 6 7 (d) Other Power 22 13 9
II. Manual 50 16 33 1
22 Total 1,000 07 274 194 226 177 16 16
I-AleFuel/Power 48 32 16
(a) Electricity . . 16 16 (0) Cool, Woud & Bagasse 32 16 16
II-Manual 952 97 242 194 210 177 16 16
23 Total 1,000 500 460 20 20
I-All Fuels/Power 460 ISO 240 20 20
(a) Electricity 160 40 80 20 20 (lJ) Liquid Fuel . . 20 -20 (c) Coal, Wood & Bagal!S8 280 120 160 (dl Other Power
II-Man'Ual 540 320 2:20
24 Totsl 1,000 000 500
I-All }t'uel.,' Po 'UJe r 1,000 500 500
(II) Electrioity 1,000 500 500
25 Total 1,000 1,000
II-Manual 1,000 1,000
26 Total 1,000 518 434 40 3 5
I--All Fuel.1 Power . 16 13 3
(a) Electricity 8 8 (II) Liquid Fuel 3 3 (c) Coal, Wood & Bagasse 5 ,;
II-Man'Ual 984 505 431 40 3 5
27 Totsl 1,000 458 406 77 39 7 13
I -All Fuelal Power 135 45 32 32 19 7
(~) Electricity 77 6 26 19 19 7 (II) Liquid Fuel . . 7 7 (c) Coa.l, Wood & Ba.gllAe 51 32 6 13
II-Man .... l 865 413 374 45 20 7 6
28 Total 1,000 204 490 163 102 20 21
I-All Fuel,1 Power . 633 122 245 143 82 20 21
(II) Electricity 633 122 245 143 82 20 21 Il- Matl'Ual 367 82 245 20 20
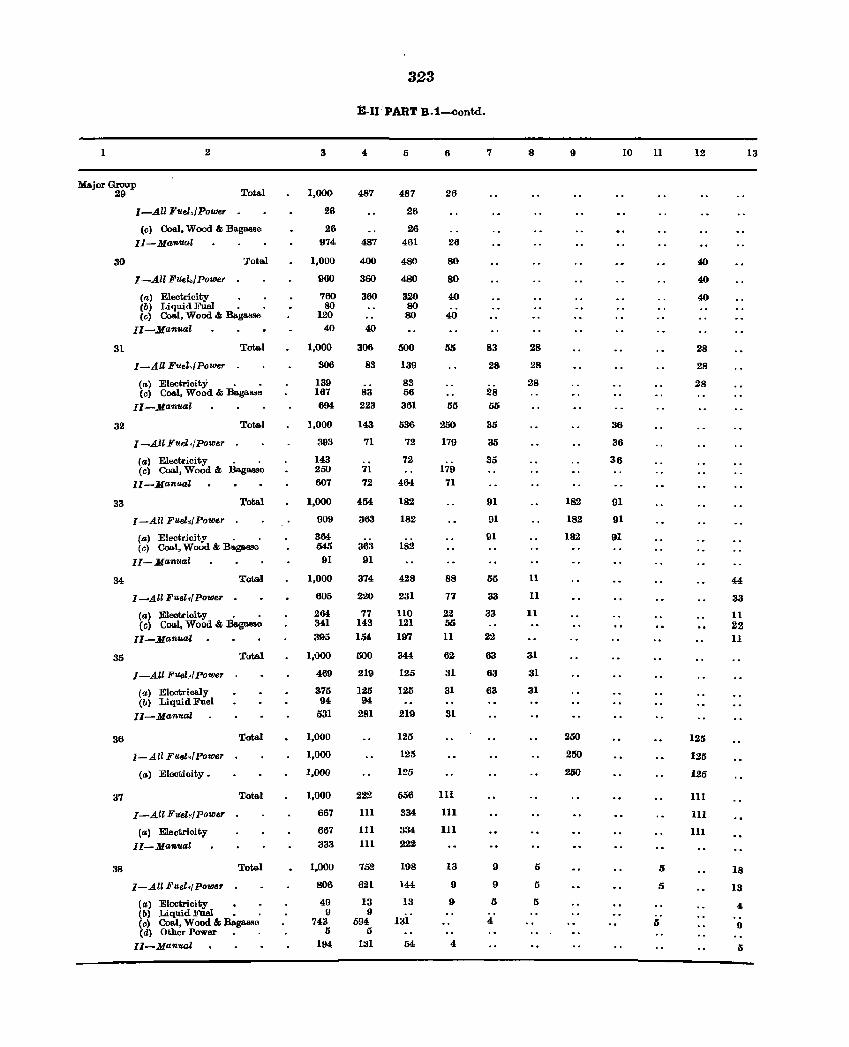
1 2
Major Group 29 Total
30
31
32
33
34
35
I-Alll'ue1,/Power
(c) Coal, Wood &; Bagasse II-Manual
'.rota.!
I -All FIle!./ power
Ca) Electricity . (b) Liquid Fuel • Cc) Coal, Wood &; BagasSE>
II-Manual
Tota.l
I-All Fuel,/Power
(a) Electricity . • Cc) Coa.l, Wood &; Bags!!>!1'1
II-Manual
Total
I -All Fup.l </ Power
(a) Electricity (c) Coal, Wood & Bagasso
II-Manual
Total
I -All Fuel,/ Power
(a) Electricit.v . (c) Coal, Wood & B"'g_l>
II-Manual
Total
I ~AII Fuel,/ power
(a) Electrioity . . (0) Coa.l, Wood &; Ba.gM$~
II-Manual
I -All FUel.<! power
(a) Electricaly (b) Liquid Fuel
II-Manual
Total
36 Total
I-All Fuel,/Power
(a) Elccticity.
::17 Total
38
I-All Fu,el,IPower
(a) Electrioity
II-Manual
I -All Fuel" power
Total
(a) Electricity • (b) Liquid Fuel • . Cc) ColLI, Wood &; Bago.sse Cd) Other Power
II-Manual
3
1,000
26
26 974
1,000
960
760 80
120 40
1,000
306
139 167 694
1,000
393
143 250 607
1,000
909
364 545
91
1,000
605
264 341 395
1,000
469
375 94
531
1,000
1,000
1,000
1,000
667
667
333
1,000
806
49 (J
743 5
194
3.23
B.I1 PART B.1-eontd.
487
487
400
360
360
40
306
83
83 223
143
71
71
72
454
363
363 91
374
2:.10
77 143 154
500
219
125 94
281
222
111
111 111
752
621
13 9
594 1)
1:11
5
487
26
26 461
480
480
320 80 80
500
139
83 56 361
536
72
72
4&.1,
182
182
428
231
110 121 197
344
125
125
219
125
125
125
556
334
334
222
198
144
13
lsi'
54
6
26
26
80
80
40
40
55
55
250
179
179 71
88
77
22 65
11
62
31
31
31
111
111
111
13
9
9
4
7
83
28
28 55
35
35
35
91
91
91
55
33
33
22
63
63
63
9
II
5
4
8
28
28
28
11
11
11
31
31
31
5
5
5
9
182
182
182
250
250
21iO
10
36
36
36
91
91
91
11
5
5
5
12
40
40
40
28
28
28
125
125
125
111
III
III
44
33
11 22 II
18
13
4
II
5
13
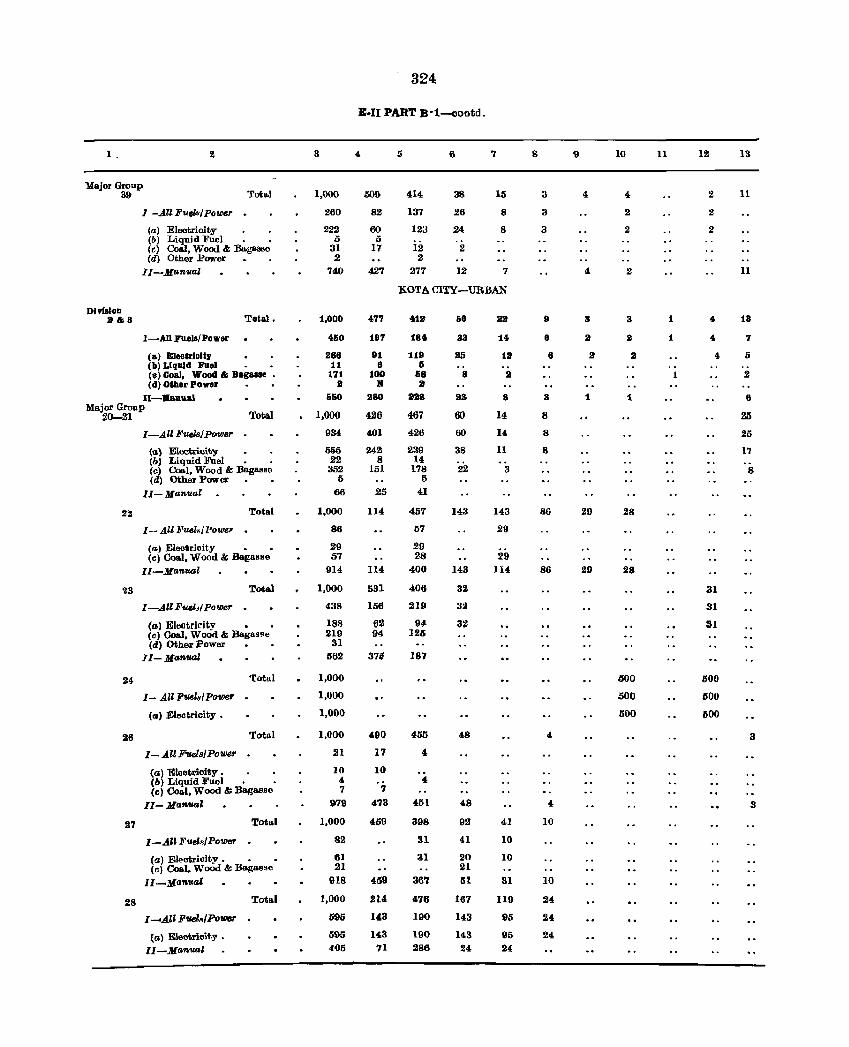
1 . 2
Major Group 39 Total
Dlyilion II &; 3
1 -All Full5i PO'Ul6r •
(a) Eleotricity • . (b) Liquid ]uel . . (c) Coal, Wood & :&.gBlI8e (d) Other Power
lI-Man'Ual
I-All FueJa/Power
(a) EleculoUr (b) Llqllld Fuel
Total.
(e) Coal, Wood"" Bagasse • (d) O&her Power
lI-lIIlImual Major Group
20-21 Total
24
I-All FuelB/PowBr
(G} Elootrieity • • (b) Liquid Fuel • • (c) Cool, Wood &: Bag ..... c (d) Other Power
II-Manual
Total
1- AlllJ'uel./ Powe,. •
(a) Electrioity • (c) Coa.1, Wood &; .Bagasse
II-Manual
Total
I-AJlFfI£l;/power •
(tI) Eleotrit"ity • (c) Coal, Wood &; Bagane (d) Other Power
II-A1anual
I-All Fttel,y, power
(II) Electricity.
'rota I
26 Total
27
28
1- AUF'uelsfPowe,.
(a) 'Eleotrioity. (b) Liquid Fuel • (cl Coal, Wood &; Bagasse
II-Manual
Total
I-All FUel..tPO'WM
(a) Electrioity • • • (c) Coal, Wood &: Bagasse
II_ya",ual
I ...... A" Fva~1 Po'll1fSr
(a) Eleotrieit,y • II-Manual
Total
3
1,000
260
222 .5
31 2
740
1,000
450
268 11
171 2
650
1,000
934
OM 22 352
I)
66
1,000
86
29 57
914
1,000
438
ISS 219
31 562
1,000
1,000
1,000
1,000
21
10 4 7
979
1,000
82
61 21
918
1,000
595
595 405
324
E·n PART B ·1-oootd.
4
500
82
60 5
17
427
47'1
197
91 8
100 If
280
426
401
242 8
151
25
114
114
531
156
62 94
376
490
17
10
7
473
459
459
214
143
143 '71
5
414
137
12:J
12 2
277
6
38
26
24
2
12
7
15
8
8
7
KOTA CITY-URBAN
412'
184
119 6
68 II
1II2S
467
426
239 14
178 5
41
457
57
29 28
400
406
219
9# 125
187
455
451
398
31
31
367
476
190
190 286
68
33
25
8
3S
60
60
38
22
143
143
32
3~
32
48
48
92
41
20 21 51
167
143
143 24
22
14
13
a
8
14
14
11
3
143
29
29 II4
41
10
10
31
I19
95
95
24
8
3
3
3
9
8
8
3
8
8
8
86
86
4
4
10
10
24
2!l
24
9
4
4
3
2
3
1
20
20
10
4
2
2
2
3
3
2
1
28
28
000
500
500
11
1
1
12
2
2
2
4
4
31
31
31
500
500
500
13
11
11
13
7
5
2
8
25
25
17
8
3
3
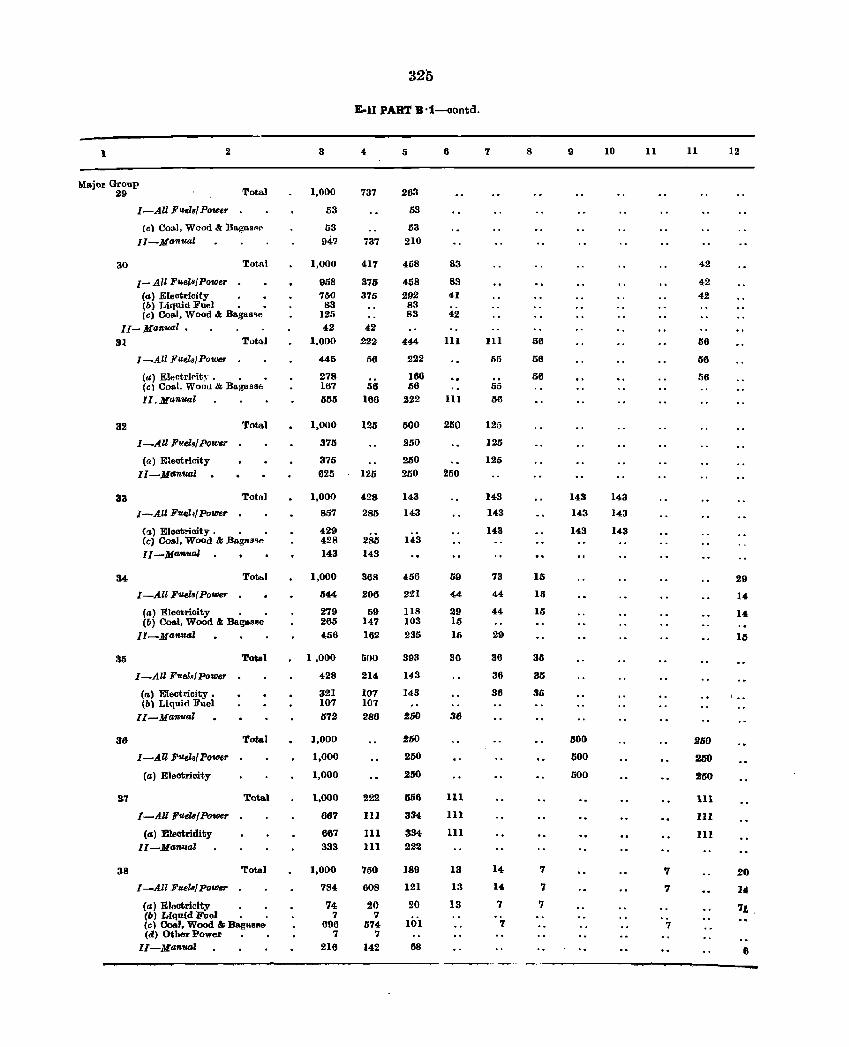
325
E-1I PART B·1-oontd.
1 2 3 4 Ii 6 7 8 9 10 11 11 12
Major Group Total 1,000 737 263 29
I-All Fuels/Power 53 53
(c) Co ... I, Wood I!l Baga..~ .. 53 53 II-Manual 947 737 210
30 Total 1,000 417 458 83 42
I-All Fue!8/Power 958 375 458 83 42 (a) Electricity 750 375 292 41 42 (b) Liquid Fuel • 83 8:l (v) Coal, Wood I!l Ba.g8.8~e 125 83 42
II-Manual. 42 42
31 T(}t~] 1,000 222 444 III 111 56 56
I-All Fuels/Power 445 56 222 55 56 56
(a) Elp,ctririt~· . • • 278 160 56 56 (c) Coa.l. WOOLI &: BagoS86 167 56 56 55 II. Manual 555 186 222 III 56
32 Total 1,000 125 500 250 125
I _All Fuel./ PQ_r 375 250 125
(rt) Eleotricity 375 250 125 ll~JlGnual 625 125 250 2110
33 Tot!\] 1,000 428 143 143 143 143
I-All Fuel,/Power 857 285 143 143 143 143
(~) Eleot.-ioity • • 429 143 143 143 (e) Coal, Wood 8& Ragas .• " 428 285 143 II -Manual 143 143
34 Tot .. 1 1,000 368 456 59 73 15 29
I -An Fuels' Power 1i44 206 221 44 44 lIS 14
(a) Eleotrioity . • 279 59 ll8 29 44 15 l4 (b) Coal, Wood &: Bagasse 265 147 103 15 Il~Manual 456 162 235 15 29 15
35 Totel 1,000 500 393 36 36 35
I _All Fuel., power 428 214 143 36 35
(a) Eleotricity • 321 to7 143 36 35 , .. (b) Liquid Fuel 107 107
II_Ma.nual 572 286 250 36
3(1 Total 1,000 260 500 260
I -AU F'1Lehf Power 1,000 250 500 250
Ca.) Eleatrioity 1,000 250 500 250
37 Tota.l 1,000 222 556 III 111
I~All FUels/Power 667 111 334 III III
(a) Ell!'ctridity 667 III 334 111 III II-MfJnuaZ 333 111 222
38 Total 1,000 750 189 13 14 7 '1 20
I -All Fue'" power 784 608 121 13 14 '1 7 14
(a.) Electricity 74 20 20 13 7 7 71. . (b) Lfqnid Fuel . 7 '1 Ccl Coal. Wood &: Baglls~e 696 574 101 7 7 (d) Other Power '1 '1
II -MfJftuaZ 216 142 68 8
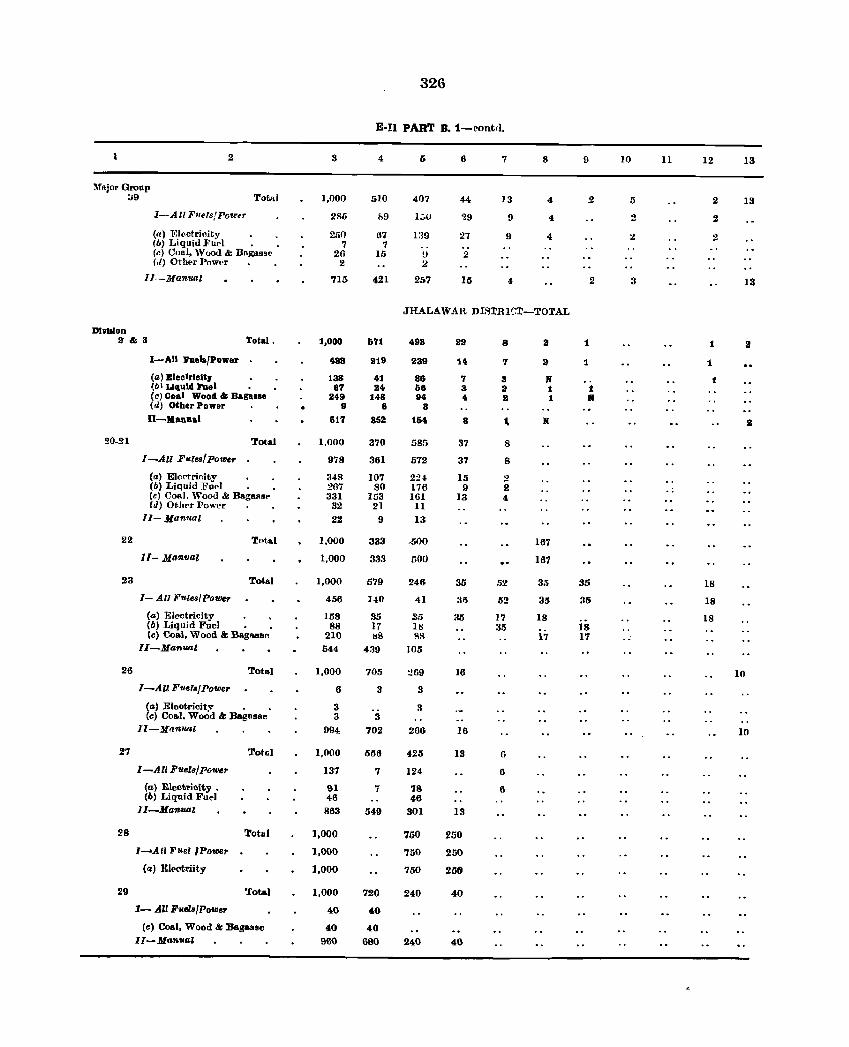
326
E·n PART B. 1-contcl,
2 3 4 I) 6 7 8 9 10 II 12 13
"fajor Group :.19 'l"otltl 1,000 510 407 44 13 " 2 5 2 13
l-All FlI(!lsfPo"'CT 2S .. 1>9 I.-:.U ~9 9 " 2 2
(ft) Y'11(!ctrioitv 250 til 1:l9 27 9 4 2 2 (b) Liquid Fucol 7 7 Cr.) Coal, Wood&: DllgllsSI' 2(1 16 U 2 (d) Oth"r ]>ow,or 2 2
ll--]Jfanual 715 421 257 15 .. 2 3 13
JHALAWAR DISTRICT-TOTAL
DlvIJIOD :r & 3 Total 0 1,000 571 493 22' 8 2' 1 1 II
I-AIJ Fuela/Power 488 2'19 2'39 14 7 :it 1 1
(a) Electrlclt, 138 41 86 7 3 N 1 (/)1 Liquid Fuel 87 24 68 3 2' 1 1 (C) Coal Wood & Baga.se 249 148 94 4 :I 1 II (d) Otber Power 9 B 3 II-Manllal 517 852 154 8 t N 2
20-21 Total 1,000 370 5811 37 8
I-All FUlea!Power 978 361 572 37 8
(a) Eh,C'trioity 348 107 22-1- 15 2 (b) Liquid Fu,,1 207 SO 176 9 2' -. (c) Coal, Wooe] &: Bagauf' a:n 153 161 13 4 (rl) Ot.hl'r Povl'l'r 32 21 II
II-Hom'Dl 22 9 13
22 Total 1,000 333 -500 167
11- Ma'll'Ual 1,000 333 liOO 167
23 Total 1,000 579 246 35 62 3 .. 35 18
1- All F'tlea/Power 456 UO 41 :J5 52 35 35 18 (a) Electricity 158 35 35 36 17 18 18 (b) Liquid Fuel • 88 17 1M 3.~ 18 (c) Coal, Wood &: Bag .... Bp. 210 !SS !'Ii{ 17 17 ..
II-Manual 544 439 105
26 Total 1,000 705 269 16 10 I-All F'Uels/Power 6 3 3
(a) Eleotricity • 3 3 (e) Coo.l, Wood & Bagnssll 3 3
Il-Mnn1f.al 994 702 206 16 10
27 Tot.GI 1,000 556 425 13 ()
I-All Fuel8/Power 137 7 124 G
(a.) Electrieity • 91 7 78 6 (6) Liquid Fuel 46 46
Il-Man1Ull 863 549 301 13
28 Total 1,000 750 250
I--All Fuel IPottler 1,000 750 250
(<I) El4.'ctriity 1,000 750 25"
29 'Iotal 1,000 720 240 40
1- All Fuels/Power 40 40
(e) Coal, Wood &: Bagasse 40 40 II-,ManllG' 900 680 240 40
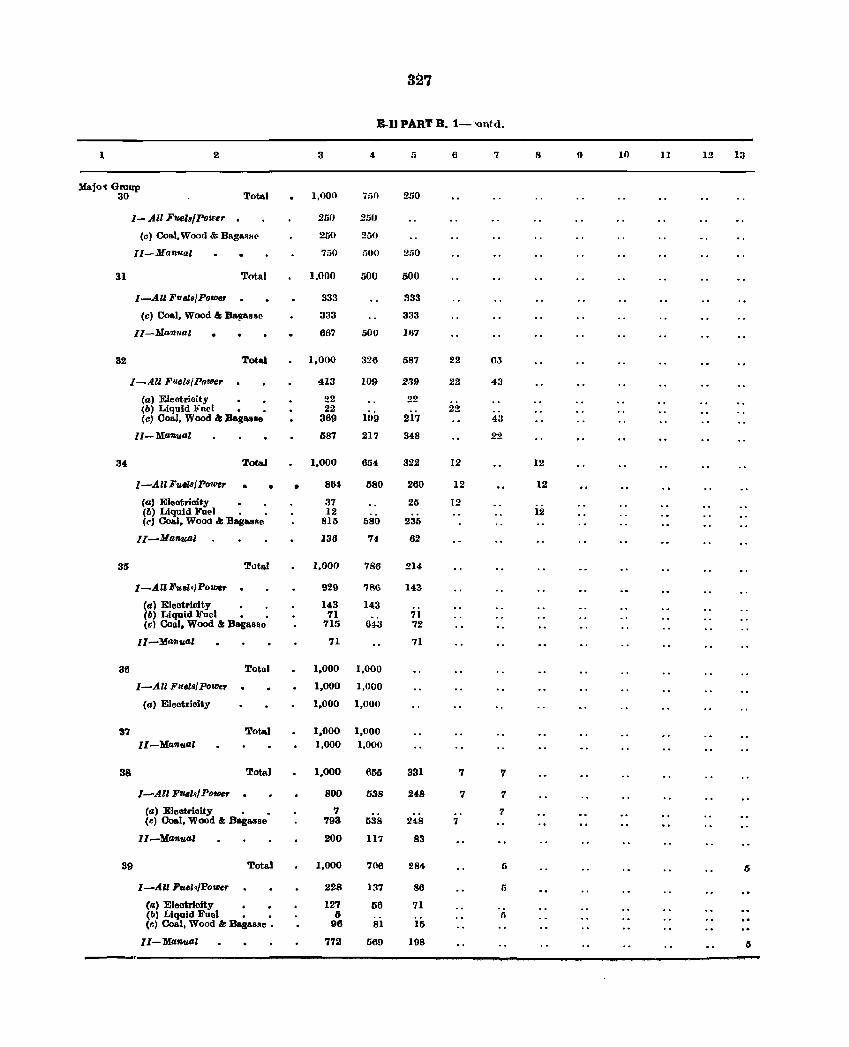
327
E-11 PART B. 1-'ontd.
1 2 3 .. [» 6 7 !) 10 11 12 13
}Iajo~ Group Total 30 I,o'lon 7r,o 250
/- All Fuela/Pou·tT . 2[;0 2im
(c) Coal,Wood &: BagasHI.' 200 20()
II-Man .. al 750 Ul)O 250
31 Total 1.000 500 500
I-All FUels/Power 333 333
(c) Coal, Wood &: Be.tlass" 333 333
II-Manllal 667 500 11}7
32 Total 1.000 326 587 22 (I.)
I-All FuellJ/Powe,. 413 109 2."19 22 43
(a) Electricity • • 22 22 (b) Liquid Flld • _ 22 22 (e) Coal, Wood &: Bag8.9S8 369 109 217 4:1
II-Manual 687 217 348 22
34 Total 1,000 654 322 12 12
I-All Fuels/ Power • • • 864 580 260 12 12
(a) Electrioity • • 37 25 12 (b) Liquid Fuel • . 12 12 (e) Coal, Wood &: Bagasse 815 580 235
II-Manual 136 74 62
35 Total 1,000 786 214
I-All Fuel., Power 929 7R6 143
(a) Electricity 143 143 (b) Liquid Fuel • . 7I 71 (cl Coal, Wood &: Bagasse 715 54a 72
II-Ma'llual 71 71
36 Total 1,000 1,000
I-All Fuels/Power 1,000 1,000
(a) Electricity 1,000 1,000
37 Total 1,000 1,000 Il-Mtlnual 1,000 1,000
38 Total 1,000 655 331 '1 '1
I-All FuelR/ Powe,. 800 538 248 7 '1
(a) Electrioity • _ 7 7 (r.) Coal, Wood at Bagasse 793 538 248 7
II -'Manual 200 117 83
39 Tota.l 1,000 706 284- 6 6
I-All FueZ,/Power 228 137 86 6
(a) Electrioity • • 127 66 71 (b) Liquid Fuel • • 5 6 (r.) Coal, Wood at Bagasse. 96 81 16
II-Manual 772 56!! 198 5 --,
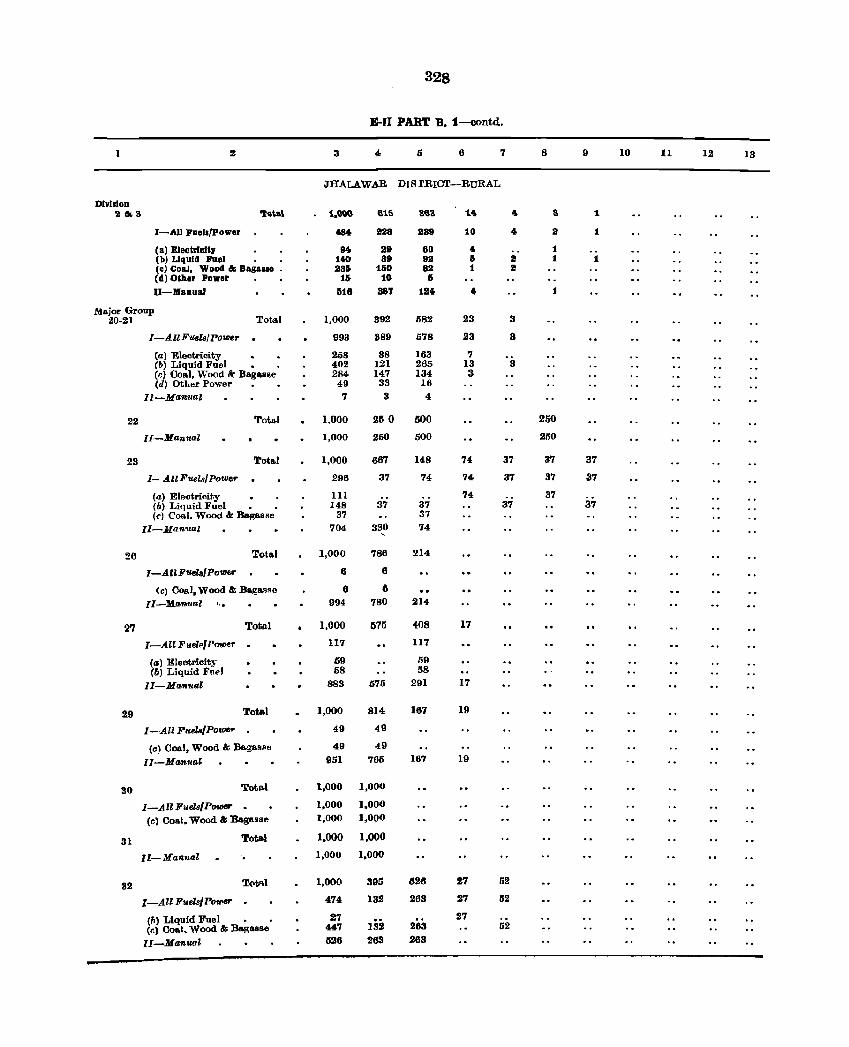
328
E-II PART B. 1-oontd.
1 2 3 4, 5 6 7 8 9 10 11 12 13
JHALAWAR DIS rRICT-RuRAL
Division 2&S '101.&1 1,000 615. "S 1.4 4. 8 1
I-All Fuels/Power 184 928 939 10 4 2 1
(a) E1elltrllllt, 94- 29 60 40 1 (b) LIquid Fuel Ito 39 112 6 9 1 1 (0) Coal, Wood & Bagall88 :2350 160 82 1 Z Cd) Other Power 1& 10 6 II-Manual 618 887 134 40
Major Group 20-21 Tot .. 1 1,000 392 582 23 3
I-A II Fuela/power 993 389 678 23 3
(a) "Eleotricity 268 88 163 7 (b) Liquid Fuel 402 121 265 13 3 (c) Coal, Wood It Bagasse 2114 147 134 3 (d) Otter Power 49 33 16
ll-Manual 7 3 4
22 Total 1,000 260 500 250
II-Manual 1,000 250 500 21i0
23 Tot ... 1 1,000 667 148 74 37 37 37
1- AllFuel8/Power 296 37 74 74 37 37 37
(a) Eleotricity 111 74 37 (b) Liquid Fuel • 148 37 37 37 37 (;-) Coal. Wood &: Bagasse 37 37
II-Man.tal 704 330 74
26 Total 1,000 786 214
I-AUFlle!s/Power 6 6
(C) Coal, Wood & Bagasse G G
Il-Ma'illual ". 994 780 214
27 Total 1,000 575 408 17
I-AU FuelplPow<er . 11'7 117
(a) Electricity 69 59 (6) Liquid Em·l 58 58
II-Haftfla' 883 575 291 17
29 Total 1,000 814 167 19
I·_·All F"elB/POwe" 49 49
(c) Coal, Wood &; Bo.ga9Po 49 49
II-Manuo,' 951 765 167 19
30 Tot.al t,OOO 1,000
I-All Fuel8/P_ . 1,000 1,000
(c) Coo.l. Wood &; Bagasse 1,000 1,000
31 Total 1,000 1,000
II-Mo,nuo,l 1,000 1,000
32 T{lt;f\l 1,000 39S 626 27 52
I-All Fuels/P&Wet" . 474 132 263 27 52
(h) Liquid Fuel • • 27 13S
27 (c) Coal, Wood &; Bagasse 447 263 52
lI-Man7toZ 526 263 263
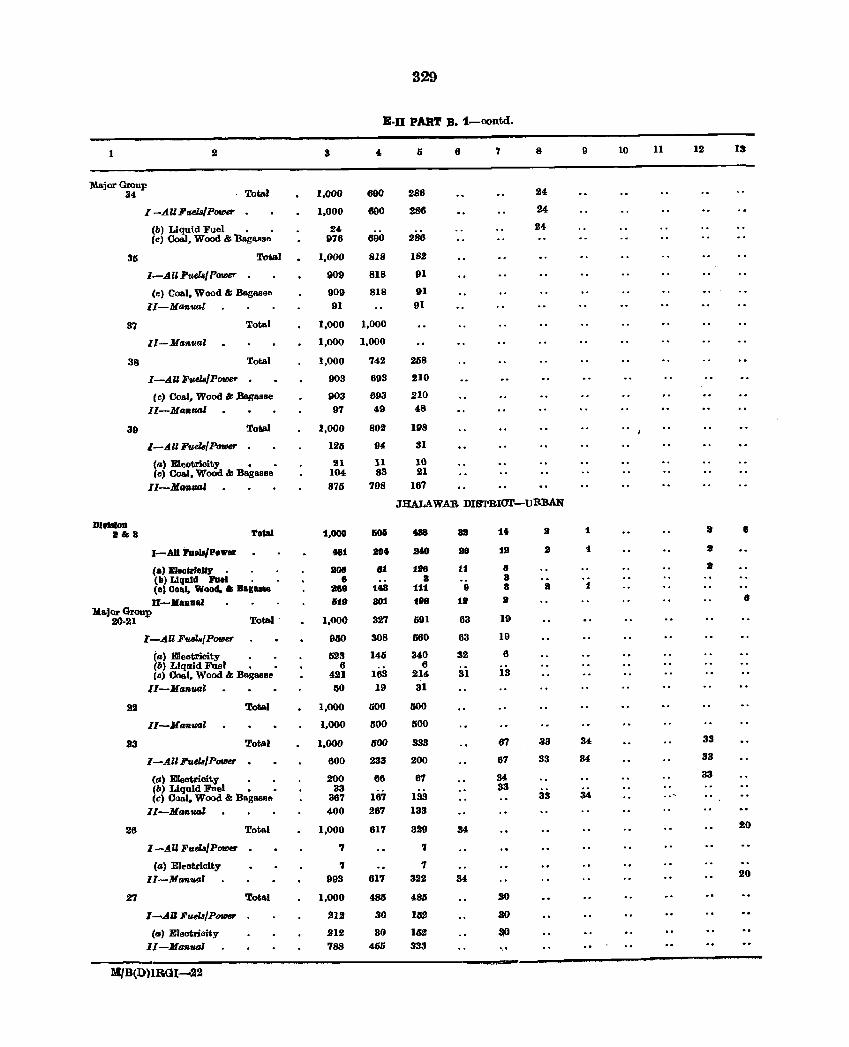
329
E·o PAR'! B. 1-contd.
1 2 3 4 5 6 7 8 9 10 11 12 13
Major Group Total 24 34 1,000 690 286
I -All Fu,els/POUler 1,000 690 286 24
(6) Liquid Fuel • 24 24-(c) Coal, Wood & B&g8JIse 976 690 286
35 Total 1,000 818 IB2
I-lIli Fael8/POUler . 909 818 III
Ce) Coal, Wood & Bagasse 909 818 91 II-Manual 91 91
37 Total 1,000 1,000
II-Ma'l&flal 1,000 1,000
38 Total 1,000 742 258
I-An Fuela/POUJef' 903 693 210
(c) Coal, Wood Be Bagasse 903 693 210 II-Ma'l&fud 97 49 48
39 Total 1,000 802 IP8
I-All FuelB/PmNr 125 94 31
(a) Electricity • • 21 11 10 (c) Coal. Wood k Bagasse 104 83 21
II-MaBIKII 875 708 187
JRALAWAR DISTRICT-URBAN
DI .... OD 8&8 Total 1,000 1106 488 88 it 8 1 8 B
I-AD Fuels/Power 481 801 210 aD 1a 2 1 2
(a) BleGtrlelty 2011 81 1" tt 8 8
(') LIquid hel 8 a 8 (a) (loal, Wood, II Bagulle 289 148 111 8 8 II 1
1I-lIaDual &19 801 188 11 a 8 l'rlajorGroup
20-21 Total - 1,000 327 &91 63 19
I-All Fuels/POUler 950 308 660 63 19
(a) Eleotricity 523 145 340 32 6 (b) Liqllid Fuel • 6 6 (r.) Coal, Wood & Bagasse 421 163 214 31 13
II-Manual 50 19 31
22 Total 1,000 500 000
II-Ma'l&_l 1,000 500 500
a3 Total 1,000 500 333 67 33 34 33
I-All Fuela/Power 600 233 200 67 33 34 33
(a) Electricity • 200 66 67 34 33 (6) Liquid Fnel • - 33
133 33 33 (c) Coal. Wood & Bagasa" 367 167 34
II-M_'Iud 400 267 133
26 Total 1,000 617 329 34 20
I-AU Fuels/Power 7 ., (a) Eleotrioity ., 7
II-Ma'l&ual 993 617 322 34 20
27 To~al 1,000 485 4S1S 30
I-lIU FIUl8/Power 212 30 152 ao (a) Eleotrioity 212 30 1152 8,0
II-Manual 788 455 333
H/B(D)lBGI-22
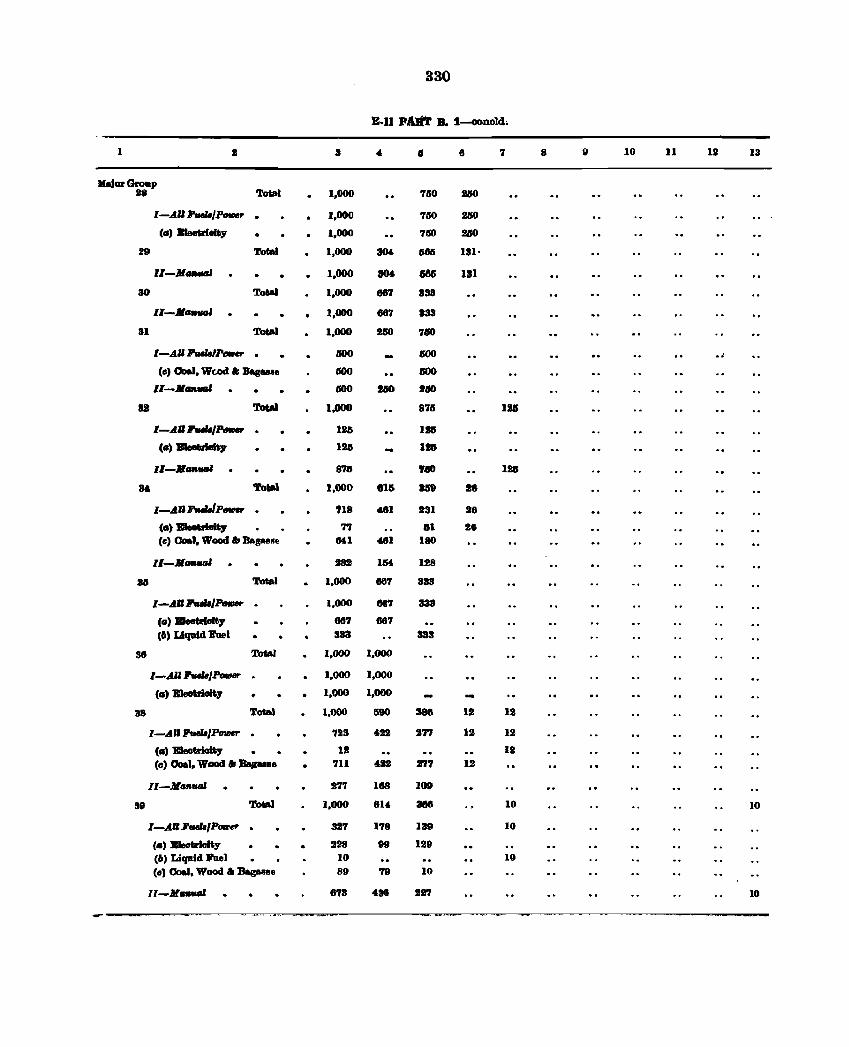
330
Eoll PAltI' B. 1-oono1d.
1 I 4 I 8 '7 8 10 11 12 13
~orGroap 2. Total 1,000 750 !50
l-AU"'/P_ · 1,000 750 250
(II' J£Iacrkioity 1.000 750 250
29 Total 1.000 304 58fi 131·
II-AI__' 1,000 304 186 181
30 Total 1,000 887 833 11-. __ 1.000 887 833
31 Total 1,000 210 710
I-AU ,..,1'tJItJep · 100 100 -, (c) 0DeI. Wc.od .I; Basu8e 100 100
11-. __ 100 110 '110
U Total 1.000 875 IB
I-AU""/~ · 118 115
(II) lIIeetrIalty 118 1M 11-11 __
8'13 '10 lZili .. Total 1.000 816 159 II
l-AIiFtul.!P_ - 718 ,,81 131 26
(a) :BIenIhity TJ &1 26 (e) Coal. Wood '" Bagu~e 8\11 461 180
11-.-- 282 1M 128
85 Total 1,000 887 333
I-AU""'/Po.er - 1.000 887 333
(a) Bleetrlaity 887 867 (6) Liquid 1fue1 333 383
38 Total 1,000 1,000
I-AU JI'welIJ~er 1,000 1.000
(II) BIeotriGIty • 1,000 1,000
38 Total 1,000 590 388 12 12
l-AUhef&/~ · '723 422 2'7'7 12 12
(II) JIIlecmiolty II! 12
(e) Coal. Wood '" '_".e 711 02 ft7 12
II-M",,_ 277 188 100
39 Total 1.000 814 388 10 10
I-AU FuelsIP_er · 327 178 139 10
(II) BIedrIaIty 228 99 120 (6) Liquid J'ael 10 10
(0) Coal. Wood " Bagasse 89 79 10
ll-M .... 8.,3 U8 227 10
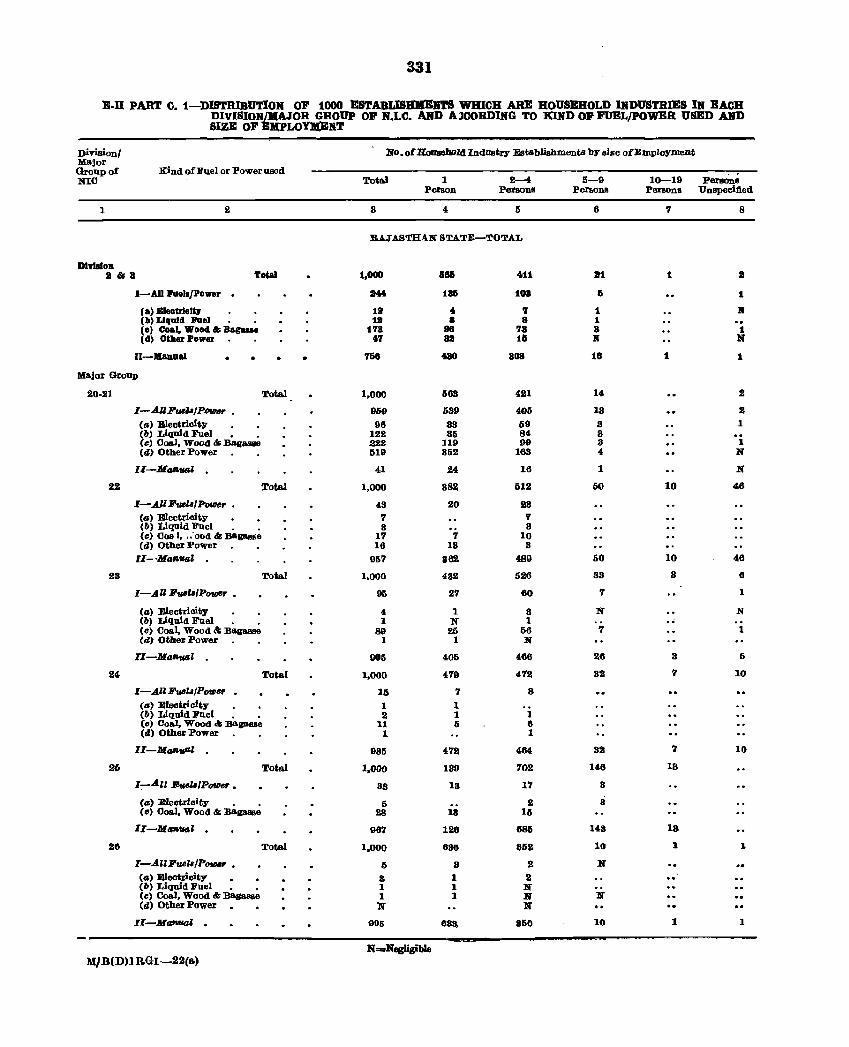
331
E-n PART C. i-DISTRIBUTION OF 1000 ESTABLlSBIl'Blft'S WHICH .ARE HOUSEHOLD INDUSTRIES IN EACH D1VISION/MAJOR GROuP OJ!' N.I.C. AND A,)OORDlNG TO KIND OF FUEL/POWER USED AND SIZE OF El!(PLOntEliT
Division/ Major Group of mo
1
Kind of Fuel or Power used
2
Division 1&8 To&ai
I-All hellJPower •
(.) ElacUlc",. (b) Uq1llol Paal (c) Coal. Wood & Baguae (d) Olher Powar
II-lbDuai
Major GroUp
20-21
22
23
24
26
26
I-AllFuehIPOtHr • (II) Eleotricity (II) Liquid Fuel • • (e) Ooal. Wood & Bagasse (tl) Other Power
U-MtJf&tI4'
Total
Total
I-.A.UFtMlu/PWJer • (II) Electricit.y (II) l.iquid Fuel . • (Il) Coa I, ,;ood & BaPB6e (d) Other Power
II-·MIIRUtU
I-AU FfIIIl'/POVJflr _
(II) Electricity (II) Liquid Fuel Co) Coal. Wood & Bagasse (Il) Other Power
II-MIlf&Ua1
I-All FfIIIZ,/POIIIBr • (II) Electricity
Total
Total
(II) Liquid Fuel • . (0) Coal. Wood & BagallBe (d) Other Power
II-Mil""""
I-:-AZZ Buel'/POIIIBr •
(II) Electrioity . . (0) Ooal. Wood & Bagasse
lI-MtJf&VtJI •
I-AIIFu8uIPo_ • (II) Electricity (II) Liquid Fuel (Il) Oval. Wood & Baga.l'Se (d) Other Power
1I-1JftJf&VtJI •
Total
Total
M./ B(D)l RGI -22(&)
No. of HooaehoJd Industry Establishments by size ofEmplvymeDt
Total
3
1 PersOD
4
2-4 Persons
RAJASTHAN STATE-TOTAL
1,000
144
11 11
178 tT
758
1,000
959
96 122 222 619
41
1,000
43 7 3
17 16
967
1.000
95
4 1
89 1
905
1.000
16
1 2
11 1
985
1,000
3S
6 28
967
1,000
I)
8 1 1 N
906
686
135
.. 8
98 31
taO
&68
589
88 8&
119 8&2
24
882
20
7 18
862
432
27
1 N
2& 1
406
479
7 1 1 5
472
139
18
18
126
636
3 1 1 1
638,
.. 11
108
7 8
7a 11i
808
421
405 69 84 99
163
16
512
28 , 8
10 3
489
526
60
8 1
66 N
4&6
472
8
]
6 1
464
702
17
S 16
686
8lit
2 2
N N N
860
5-9 Persons
6
11'1
Ii
1 1 8 II
18
14
13
8 8 3
" 1
50
50
83
7
N
7
26
32
82
146
8
8
143
10
N
N
10
10-19 Persona
7
1
1
10
10
3
.. 8
'1
7
IS
18
1
1
PersOnB Unspecified
8
a 1
II
1 N
1
2
2 1
1 N
N
46
46
6
1
N
1
6
10
10
1
1
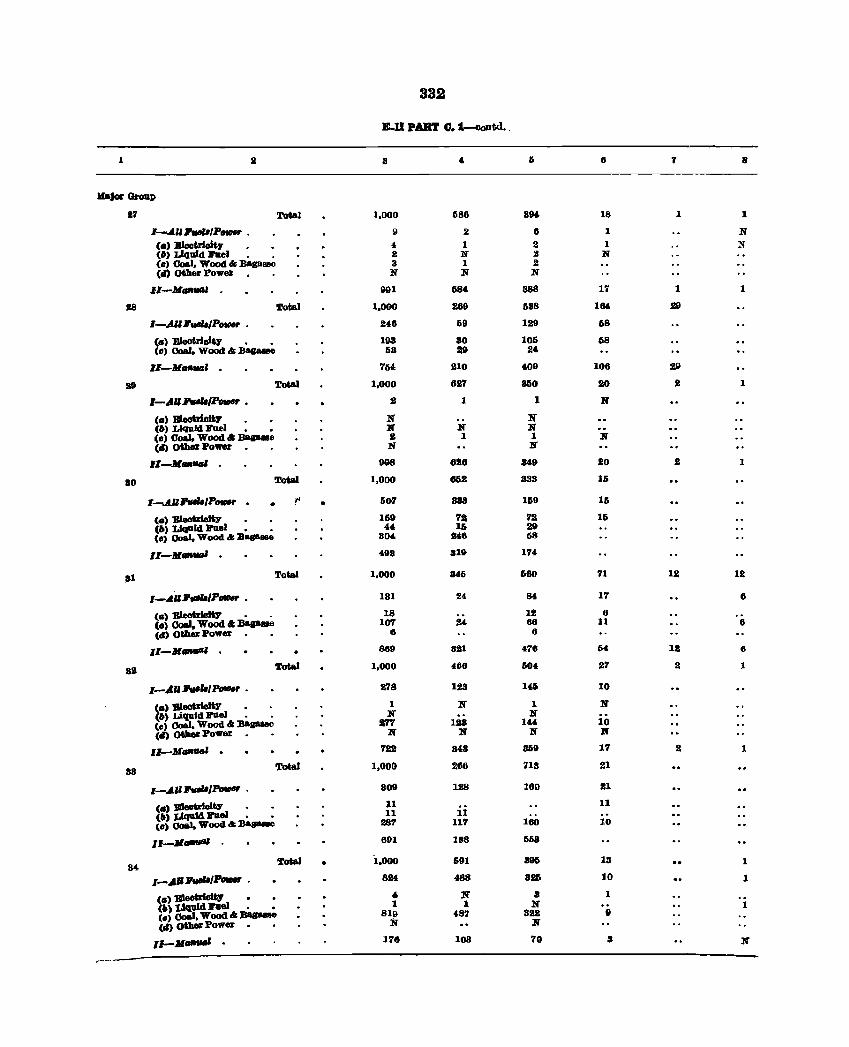
332
.-II PART O.1-coutd ..
1 II a , 6 a 7 8
HaJOI' Ckoup
17 Total 1,000 686 aN 18 1 1
I-Jl.U,.,.,P"'_' . II 2 6 1 N
ell) BlectricitF " 1 2 1 N (6) Liquid hel • • Z N 2: N (c) Ooal. Wood & Bagasse 3 1 2 (II) Other Power N N N
11-111",."'" 11111 68' 888 17 1 1
18 Total 1.000 2611 688 184 !II
l-AII'",/P_ . 246 69 1211 68
(II) Electricity • • 1113 80 106 68 (II) Coal. Wood & Bagasse 68 • 24
11-111 ..... ' · 764 SUO 4011 106 29
S9 Total 1,000 627 8&0 20 2 1
l-AU"""/P"'_' • 2 1 1 N
(II) BleetrieJty N N (6) Liquid hel N N N (II) Ooal. Wood & Ball&aBe 2 1 1 N (d) Other 1'0_ N N
1:1-111 .. _ 9118 8S6 849 SO liI 1
80 Tota.I 1,000 862 833 16
l-AU""POfI/H . • r' • 607 888 169 16
(II) Blaotdalt7 169 72 7li1 16 (r.) Llqald he! • • 44 16 29 (II) 00&1. Wood & BagaNe aD, 846 68
II-M.- · 498 819 174
.31 Total 1,000 846 660 71 12 12
l-Jl.'''-'/PtIfIW • 181 24 84 17 6
(II) :B1eeUIcity • • 18 12 6 (II) Coal. WoodliBapase 107 24 66 11 6 (II) Other Power 6 6
II-M ... ' · • 869 821 476 64 IS 6
8S Total 1,000 466 604 27 2 1
I-AU,.. .. /PtItHr • 278 128 1" 10
(II> Blectlfclt7 1 N 1 N (6) Liquid FUel • • N N (e) 00&1, Wood Ii Bagll88ll 277 128 144 10 (d) OUler Power. • N l'l N l'l
II-M",.fIGl · 122 848 869 17 2 1
sa Total 1,000 266 718 21
,_ .. ",..,.,~ . 809 128 160 21
(II) ]I1eII\TIoI.t,. 11 11 C.) Llqald lI'uel • • 11 11 (II) 00&1, Wood & Bapae 28'7 117 160 10
11-_"'" 691 188 668
8. Total • 1,000 691 8116 13 1
1-.. '11,....',..., . 824 488 816 10 1
<II> :BleotdcltY , N 8 1
") JJ.cluld:hel • • 1 1 N 1 (0) Ooal.Wood & Bag- 819 487 3D II (d) 0Uler PoweJ:. • :ill N 11-_-- . 176 103 70 S N
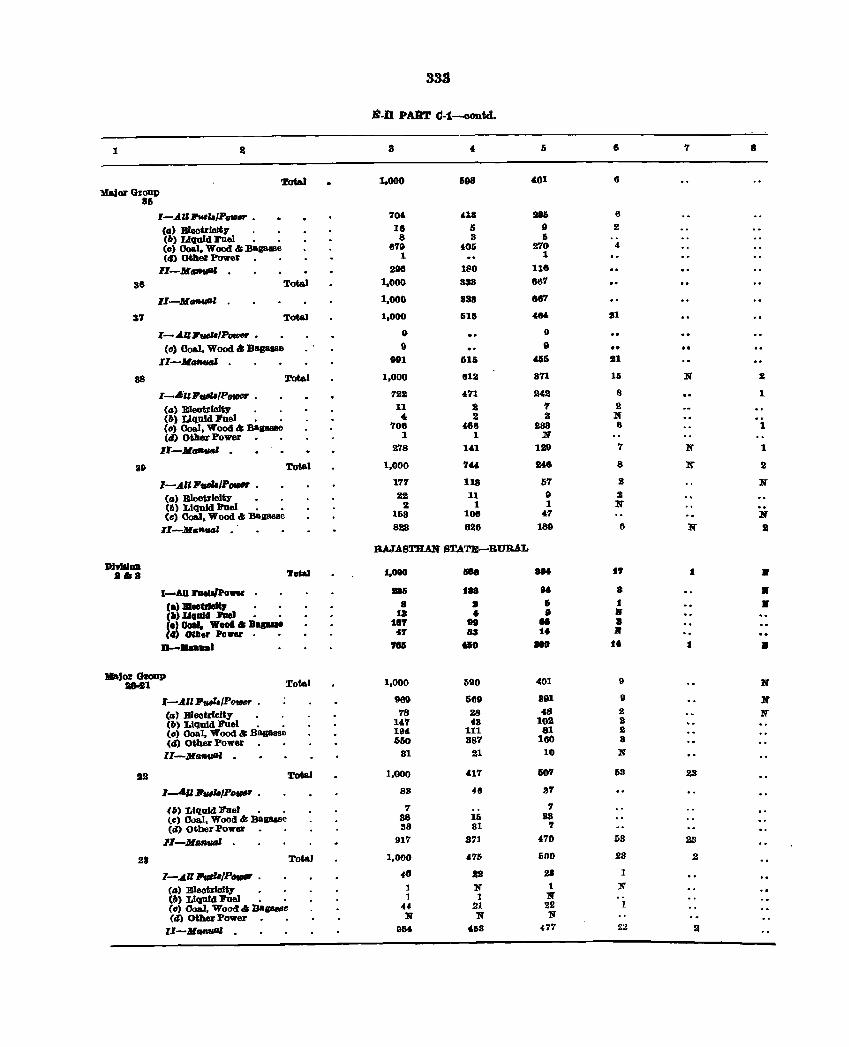
1
rotrJ )(a,jor Group
ali
36
37
88
a9
DJvt.lDD .6.
S2
28
l-AU"",,/P_tIr . ell) B1ectrloJty (6) LIquid lI'1lel (c) 00aI. Wood .. :Baplllle (4) other Power
Zl-M""'" Total
Total
I-Aru' .... /po_ • (c) Coal, Wood " Bagasse
II-MGtlUGI
rotal
:c-.Ai":r~/POfl1M • (1.1) Eieotrlofty (6) Llqutd l!'uel (c) OoaI, Wood" Bapalle (lI) Oths Power
n-MI.I1ItII.Il •
Total
l-Allll_IPOfIM . (1.1) B1ectrlofty (6) Liquid he] (c) Coal. Wood .. BaPlllle
ZI-MI.IAtUIZ •
1-0 ..... ...,.0_ (a) BilOtti"., • • (II) Uaall1l.l'ael • • (a) 0 ..... WOCMl 01; B ..... (Ill) OfJI.r Ponr. .
D-..... I
Total
l-AllPUff,fPo_ . (1.1) Electricity (6) Liquid Fuel • . (e) 0011], Wood .. Bllgasse (4) OthQ Power
Il-MMMJIII •
rotal
r-Au ,,-,,POfllll' . (") Llqufd l!'ueJ lco) Co&l, Wood" Bagasse (d) Other POlVes
:1I-MtmfIIII •
I-AU '_"/POfII/Ir . (II) EleetrIolty (6) Liquid Fuel (c) Ooa), Wood & BaPlllc (4) Othes Power
II-MIJfWf4
TOMI
333
E-D pART C-1-oontci.
8
1,000
70&
18 8
6'19 1
21M1
1.000
1.000
1.000
II
9 091
1,000
'122 11
4, 706
1
278
1,000
1'1'1 22
2 158 8118
4
ISO
888
888
616
615
612
471
2 2
488 1
141
744
118 11
1 106 826
RAJASTHAN STA'l'E-RURAL
1,000
II8Ii
8 13
18'1 4"
'IU
1.000
969 78
147 19' 650
31
1,000
83 ., 88 88
917
1,000
48 1 ]
44 li
96'
l18a
188 It
• .. sa
tlO
690
589 28 U
111 387
21
Ci7
411
16 81
S71
475
as N 1
21 'N
'us
6
401
286 II 5
270 1
118
86'1
887
4114
9
9 455
871
242 7 2
238 If I.
248
67 9 1
'7 189
401
891 48
102 81
180 10
507
3f ., sa
'1 470
61)0
2. t
'N 22 If
4-77
6
6
:2
"
11
,. 11
16
8 2
:N 6
7
8
lil
2 N
6
1'1
a t • I • l'
9
9
2 2 2 8
N
58
D8
23
1
N
1
2.2
7
N
If
:l
23
.2
8
2
1
1
1
:2
N
• • •
• ]!I'
If N
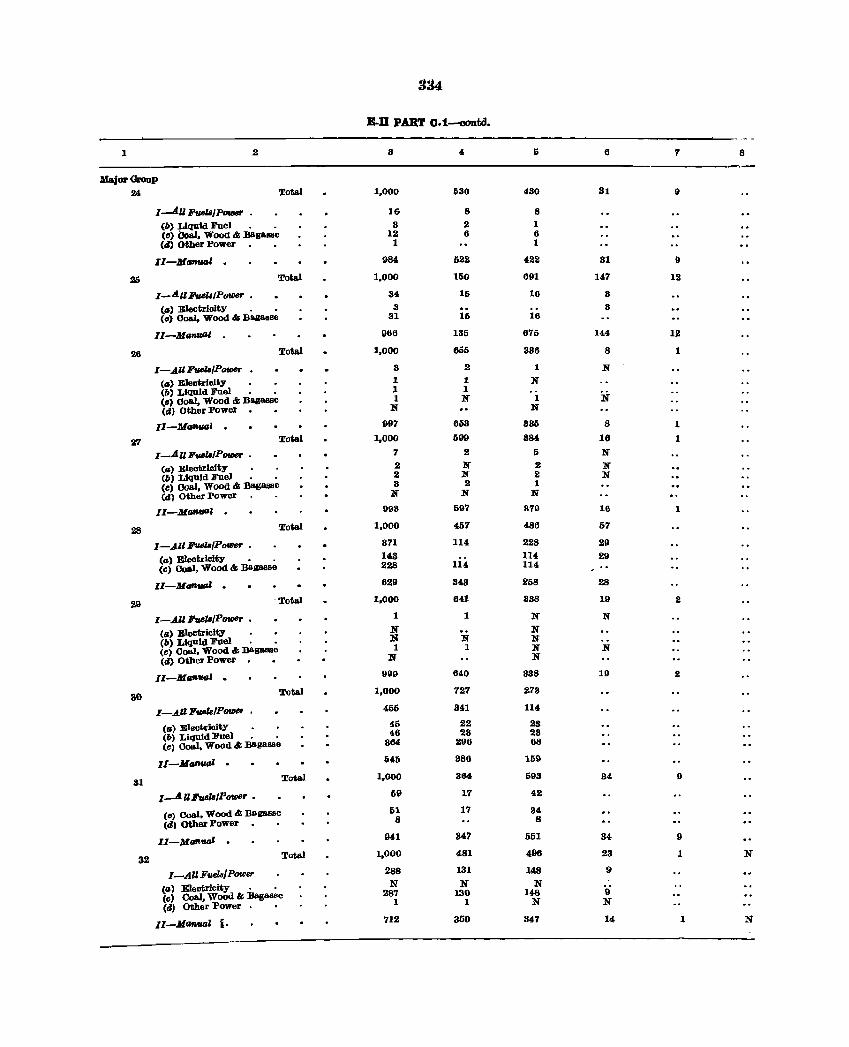
334
E-D PUT C.1-oontd.
1 8 4 5 6 7 8
Major (kogp
24. Total 1,000 530 4.30 31 9
I-A.U Ii'uelB/PoriJBf' ]6 8 8
(b) Liquid Fuel . • 3 2 1 (0) Coal, Wood &; :DagaMa 12 6 6 (II) Other l'ower 1 1
II-MtmtMU · 984 622 422 31 II
25 Total 1,000 150 691 147 12
I_AU Ii'fI.BlI/POW8f' • 34 15 16 3
(a) Blectrioity . • 3 3 (c) Ooal, Wood &; Bagasse 31 16 16
II-Manual 966 135 676 144 12
26 Total 1,000 655 336 8 1
I-AUJ!u,e,,/PQfIJ6r • 3 2: 1 N
(a) Blecwiclty 1 1 N (b) Liquid Fuel 1 1 (II) Ooal, Wood &; Bag_a 1 N 1 N-(d) Other l'owet N N
U-MaflUtJl · 997 653 335 8 1
117 Total 1,000 599 384 16 1
I_AUIi'uelB/P"_" • 7 2 5 N
(al B1actriclty 2 N 2 N (b) Liquid Fuel 2 N 2 N (c) coal, Wood &; Bllg_e 3 2: 1 (d) Othel'l'ower N N N
II-MIJIIIVlAI · 993 597 379 16 1
28 Total 1,000 457 486 57
I-AU I'rUU/P_r • 371 114 228 29
(a) Electricity • . 143 114 29 (Il) Ooal, Wood&; Bag&Bse 228 114 114
II-M(JfIUtJI . 629 343 258 28
29 "Total 1,000 641 338 19 2
I-AZlIi'v.eZ,/P- • 1 1 N N
(a) B1eetrioity • • N N (b) Liquid Fuel . • N N N (C) Ooal, Wood &; Bagasse 1 1 N N (d) Other l'ower " N N
II-MaBual · 999 640 338 19 2
ao Total 1,000 727 278
I-AU Ii'u.elBIP- 456 341 114
(a) Electdcity 46 22 23
(b) Liquid Fue) . 46 28 23 (C) Ooal, Wood 41; :Bagasse 364 296 68
II-Maraw) - 545 386 159
31 Total 1,000 364 693 34 9
l-AZIFuelB/PottJcr • 59 17 42
(Il) Coal, Wood &; lIagasse 61 17 34
(d) Other l'ower 8 8
1.1-MGftual . 94-1 847 551 84 " 32 Total 1,000 481 496 23 1 N
I-A" FtHlB/Powet' 288 131 148 9
(a) Electricity • • N N N ii (0) Coal, Wood & Bagasse 287 130 148
(oil Other Power 1 1 N N
II-MSBwZ i· 712 350 347 14 1 N
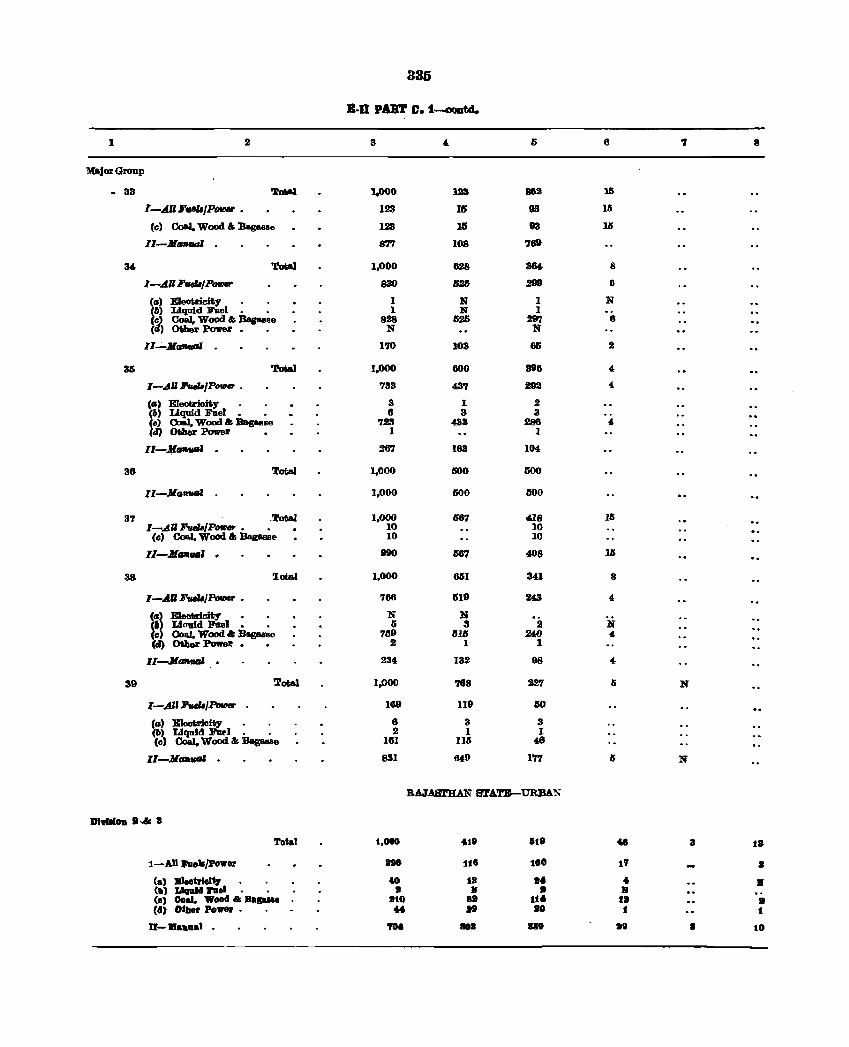
336
B-D PABT C.1--aootd.
1 2 3 4 5 6 ., 8
Major Group
_ 33 'htial 1.000 123 892 :us 1-~U Ff&IIIlPOtMI • 123 15 93 lti
(c) Coal. Wood " Bagasse 123 US 93 :us lI-JitIrHIGl 1n7 lOB ,89
34. Total 1.000 628 3M 8
I-~ll FwII/ P6rtJer 830 623 !!DO 6
(a) Electricity . . 1 N 1 N (6) Liquid Fuel. • 1 N 1 (~ Coal. Wood" Bagasse 828 1525 29'1 ., ( ) Other Power. • N N
II "':"'.11,.,..,., · 170 103 66 2
36 Total 1.000 600 398 4
1-4UPtW../P_ . '733 437 292 4
,a) Eleotrioif;y • . 3 1 2 (6) Liquid Fuel. • 8 3 3 .. iO) 00aJ. Wood .. BagBllBe 723 438 288 4 (I) Other Powe .. 1 1
11-,,_1 267 163 104
38 Tolial 1.000 1500 GOO
1'-.IIa,,_ 1.000 600 600
37 .TotaI 1,000 667 418 III 1-4UFwlB/P_ • 10 10
(c) Co&l, Wood 6; Bagasse- 10 10
II-JIM'" · 990 IUS? 408 III
38 'Iota] 1.000 6151 341 8
I-~II Ftuia/Povler • '766 ')19 243 4
(a~ Eleotricity • N N N \6 Lfoaid l!'ael. • IS 3 2
c) Ooal. Wood.t Ba.g&llBc 7119 11M 240 4 (I) Other Power • 2 1 1
lI-Jl __ · 234 132 98 4
39 Total 1.000 788 227 II N
I-~II FwlBlPottHlr 169 119 110
(a) :B1eotricity • • 6 3 3 (&, Liquid Farl. . 2 1 1 (0) Co&J. Wood .. Bagasse 161 illS 46
Il-JlGhGI · 831 649 177 1$ N
RAJA8'l'B.AN S'l'ATllI-URBA"S
DlwIiIODII-.6Ia
Total 1,000 4t9 &t9 48 3 ta
I-AD -.a_/po"or 19& l1e teo 1'1 a (a) Bleetrtol17 40 til' It. .. • (II) Uta_II rael. • It B ,. B (e) ClCIal, Wool. 8a ..... IttO Bit tl. 11 I (II) OJ ..... Po"'.. . .. ., ItO f 1
U-M.Il_1 . .,.,. 108 IIg 1111 • tD
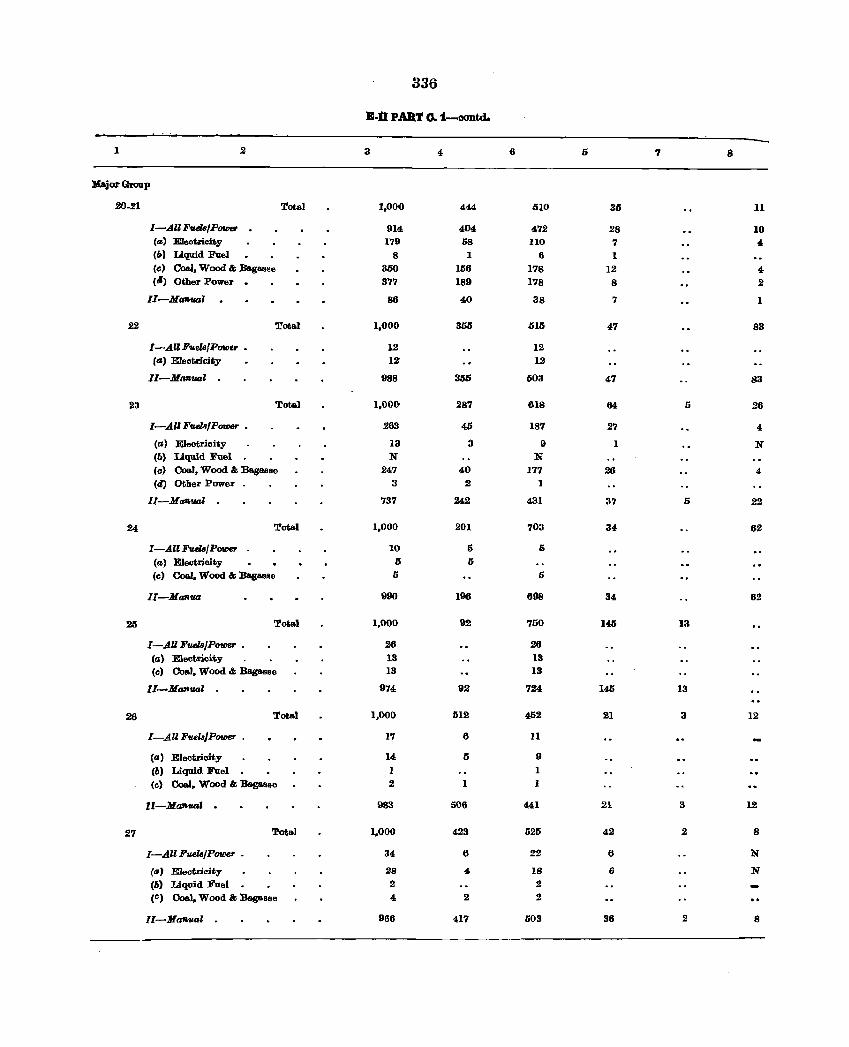
336
Eon PAB,T o.1--oontd.
1 2 3 4 6 5 7 8
l'4ajor GI'OIlP
20-21 Total 1,000 444 510 35 11
I-All F1Ul8/Power 914 404 472 28 10 (a) Electricity 179 58 lIO 7 4,
(lJ) Liquid Fuel 8 1 6 1 (c) Coal, Wood & Bagas.e 350 156 178 12 4,
(I> Other Power 0 377 189 178 8 .2
II-Ma'IlUaZ 86 40 38 7 1
22 Total 1,000 355 015 47 83
I-AUFueJsIPower _ 12 12 (a) Electricity 12' 12
II-Mnn'IIDZ 988 355 503 47 83
23 TotaJ 1,000 287 618 64 5 26
I-All FueltI/PQVJer _ 263 45 187 27 4,
(a) Electricity 13 3 9 1 N (lJ) Liquid Fuel N N (c) Coal, Wood & BagaBse 247 40 177 26 4 (d) Other Power 3 2 1
II-M tJ1lUaI · 737 242 431 37 5 22
24 Total 1,000 201 703 34 62
I-AU FuelalPower 10 5 5 (a) Electrici ty 5 5 (c) Coal, Wood & Bagasse 5 5
ll-MOifI'IID 990 196 698 34 62
25 Total 1,000 92 750 145 13
I-All Fuel8/PotOB,. . 26 26
(a) Electricity 13 13 (c) Coa1, Wood & Bagasse 13 13
II-Ma'll'IID1 · 974 92 724 145 13
26 Total 1,000 512 452 21 3 12
I-All Fuela/Power . 17 6 11
Ca) Electricity 14 5 9 (6) Liquid Fuel 1 1
(c) Coal, Wood & Bagasse 2 1 1
ll-MaftfUJl · 983 506 441 21 3 12
27 Tota1 1,000 423 525 42 2 8
I-All Fuels/Power . 34 6 22 6 N
(IS) Electricity 28 4 18 6 N (6) Liquid Fael .2 2 (C) Coal. Wood & Bagasse 4 .2 .2
II-MaftfM:.l - 966 417 503 36 2 8
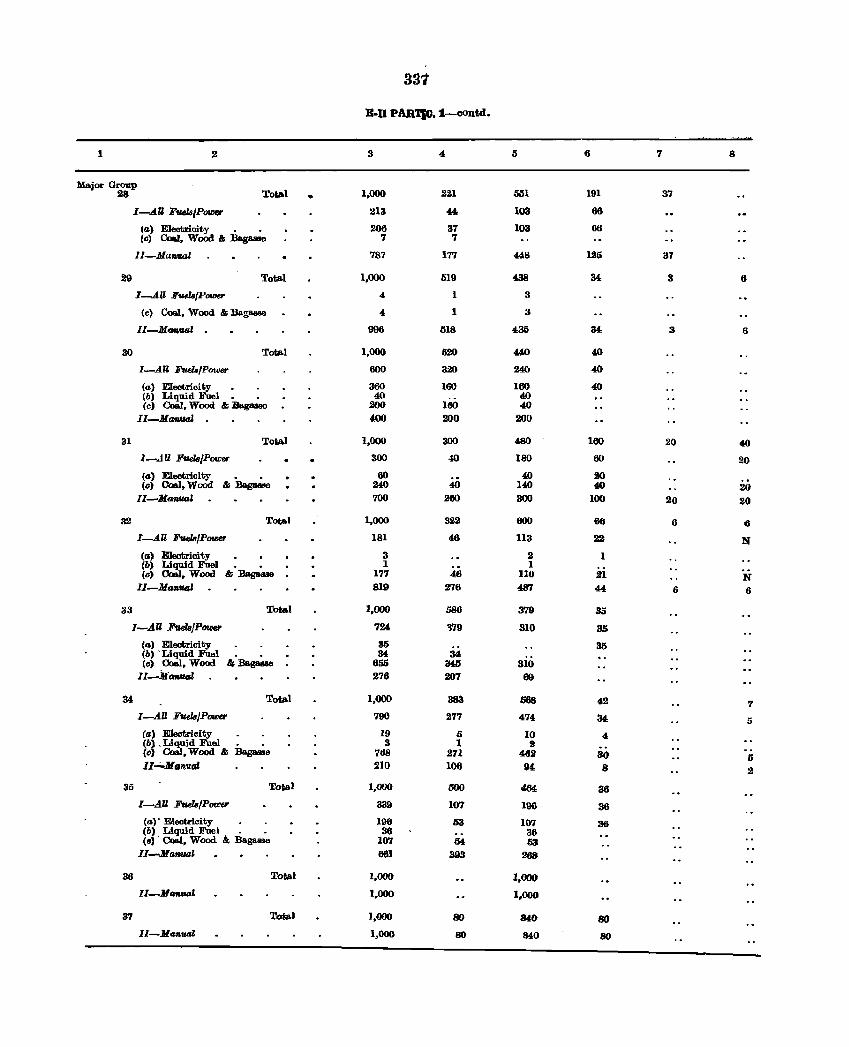
331
B-D PAR'l'IC. 1--eontd.
1 2 3 4 5 6 7 8
Major Group Total 1,000 221 551 191 28 • 37
I-AU 'Fuela/p0WfIf' 213 44- 103 66
(a) Electricity " " 206 37 103 66 Cc> Coal, Wood & Ba.gaBse 7 7
II-Mu7lval 787 177 4411 125 37
29 Total 1,000 519 438 M 3 6
I--tU FuelaIPower " 1 3
(e) Coal, Wood & Ba.gasse 4 1 3
Il-M_ual 996 518 435 34 3 6
30 Total 1,000 520 440 40
I_AU Fwh!Power 600 320 240 4()
(a) Electricity • 360 160 160 40 (b) Liquid Fuel" • 40 40 (c) CoaiI, Wood & Bagasse 200 160 40
II-Mafltlal 400 200 200
31 Total 1,000 300 480 160 20 40
1-..111 F'UekJIPowsr 300 40 ISO 60 20
(G) Electricity 60 40 20 (0) Coal. WOOd & Bag- 240 40 140 40 20
Il-M_val 700 260 300 100 20 20
:12 TotAl 1,000 322 600 66 6 6
I-AU FuelslPOIIJe' 181 46 113 22 N (a) Electricity 3 2 1 (b) Liquid Fuel 1 1 (0) CIcal, Wood & :Bagasse 177 46 110 21 N
II-MGftfIGJ 819 276 487 44- 6 6
33 Total 1,000 58& 379 35
I-AU FuelalPOUJef' 724, 179 310 35
(a) Electricity S5 35 (b) . Liquid Fuel 34 34 (c) Coal, Wood & :Bagaaae 655 S45 310
II-AfaRual 276 207 69
34 Total 1,000 383 068 42 7 I-AU FuelsJP- 790 277 474 34 5
(a) Electricity 19 D 10 4 (b) . Liquid Fuel " . 3 1 2 (c) Coal, Wood & Bagaaae 7lJ8 271 462 30 5 1I..;..MG1Ival 210 106 94 8 2
35 Total 1,(}()() 500 4M 36
I-AU Fuels/Power 339 107 106 36
(a)' Electricity . . 196 53 107 36 (b) Liquid FueJ . " 36 36 (e) , CoaJ, Wood. &; Bagasse 107 D4 53 II-M_l 661 393 268
36 Total 1,000 1,000 II-Mrmual 1,000 1,000
37 ".rota' J,OOO 80 840 80 II-Manual 1,000 80 840 80
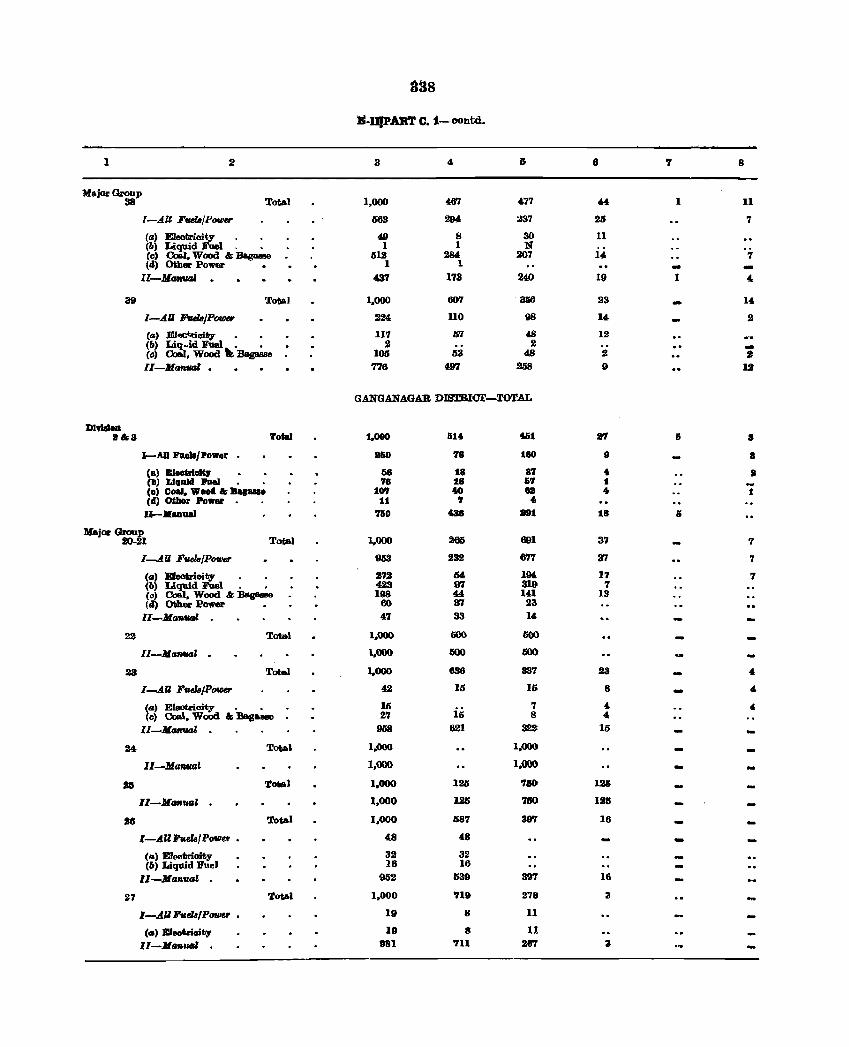
a3S
lIl-IJlPAll'l' C. 1-contd_
1 2 3 8 7 8
MAjOl' Group 38 Total 1,000 467 .77 44 1 11
I-A.U FfII'ltJlPowu 563 294 237 25 7
(a) Eleotrioity 49 8 30 11 (lJ) Liquid Fuel. . 1 1 N (c) CoIi.I. Wood &; Bagasse 512 2M 207 U 7 (ti) Other Power • 1 1 -II-Alafl1UJl 437 173 240 19 1 4-
39 Total 1,000 607 366 23 14
I-AU lJ'wl8/Power 224 110 98 14 2
(a) EJ"lC'>tioity • • I17 57 48 12 (Ii) Liq~id Fuel \: • • 2 2 -(c) Coa.I, Wood Baga.sBe 100 53 48 2 J II-MamlGl • 776 497 258 9 III
GANGANAGAB DIBTRIcr-TOTAL
DlvllloD 8&3 Total 1.000 614 461 87 6 •
I-AU Fa.eII/Po",.r a&o 78 180 9 a (a) m.etrleltJ 56 la a7 4 8 (II) Lillald Fuel 78 18 57 :I (0) Coal, Wood & Bapueo 107 to 8lt 4 :I (d) O&her Power 11 7 4
U-KllI1ual 71i0 488 2IIt 18 &
MajOl' Group SO-21 Total 1,000 265 691 37 7
I-All FvelB/Power 953 232 677 :n 7
(a) Eleatrioity • • :272 M 194. 17 7 (b) Liquid Fuel . • 423 97 319 7 (c) CoIil. Wood &;:oes- 198 44 141 l:t (eI) Other Power 60 WI 23
II-MGtWGl . 4-7 33 14
22 Total 1,000 600 500
II-Ma"'lltd l,OOO 600 GOO
23 Total 1.000 836 337 23 4,
I-All If'fIeI8/P_ 42 15 16 8 4-
(a) Eleotrioity . • 15 iii
7 4- 4,
(c> Coal. Wood &; Baga_ 27 8 4-
II-MMt'IItd 958 621 322 15
24 Total 1.000 1,000
II-Manual 1.000 1,000 -lI5 Total 1,000 125 710 12&
I1-AltlftfIG' 1,000 1215 710 1211
18 Total 1,000 687 397 16
I-.AIZI'.elafPower • 48 48
Ca) Eleotrioity 32 32 (&) Liqrud Fuel 16 16
II-Jlanual 952 539 397 16
27 Total 1.000 '119 278 3
I-.AJI F.tk/Pawer 19 8 11
C.) Electricit,. 19 8 II
11-1tI_ .. I 181 '111 28'7 3
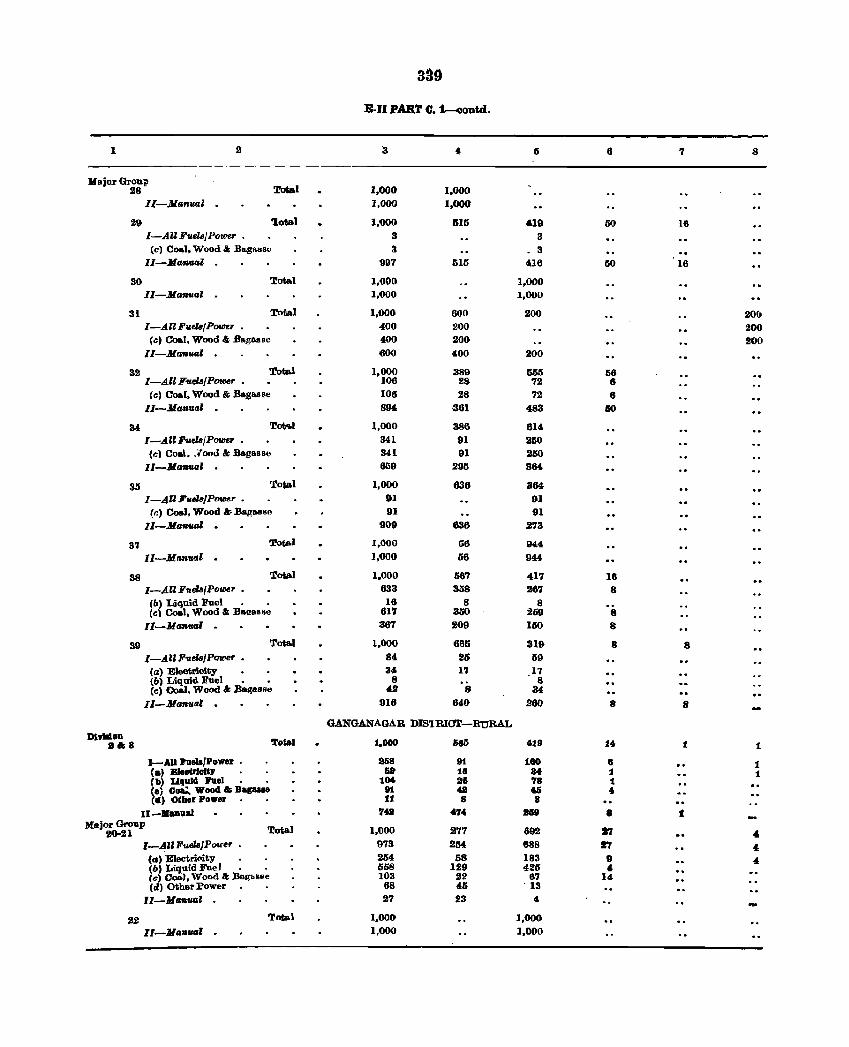
3a9
E.JI PDT C. 1--o0Dtd.
1 2 "3 5 6 7 8
Major Group 28 Total 1.000 1,000
II-Manual 1,000 1,000
21} 'Iota) 1,000 1515 419 50 16 I-AUFueZll/Powe.r • 3 3 (c) Coal. Wood" Ba.gRSsc 3 _ 3
II-Ma"val 997 515 416 50 16
30 Tota) 1,00(1 1,000 II-M_fusZ · 1,000 1,000
31 Total 1,000 600 200 20(1 I-AlIFuelB{POtDer • 400 200 200
Cc) Coa.I, Wood &; Bagasse 400 200 200 II-Ma"tuJ' · 000 400 200
32 Totp,l 1,000 389 M5 56 I-AJIFu.'PotfIer • 106 28 72 6
(co) Coal, Wood & .Bag88~e 108 28 72 6
II-Ma"u<z' · 894 -381 483 110
34 Tot .. l 1,000 386 614 I-AClFuelB/POtIJer • 341 91 250 (c) Coal •. 70od &; Bagasse 341 91 250
II-Ma1luar · 859 295 3M
35 Total 1,000 636 364 1-4UFue18/Power • 91 91
(r.' Coal, Wood If Bagaas" 91 91 Il-Ma.uaI · 909 636 273
31 'J!ota.1 1.000 56 944
II-MflJlval · 1,000 56 944
38 Total 1,000 567 417 18 I-AEE F'Il./Power • 633 358 261 8 (IJ, Liquid Fuel • • 16 8 8 (co) Coal, Wood &: B8oI!8SSe 617 350 259 8
II-MaflUal · 387 209 150 8
39 Tot&l 1,000 686 319 8 8 l-AUFuelB/Power • 84 25 69 (a) Electricity 34 11 11 (b, Liquid Fuel • • 8 8 Cc) Coal. Wood &; BaIfBIIRe 42 8 34
II-Maflutrl · 916 640 200 8 8
GANGANAGAB DIS'lRICT-RURAL Dl ...... OD
Total :1.000 585 419 14 8&S t 1
I-AU Pael8/Power • a68 91 180 8 :I (.) Bleaut" •• !, 5Jt 18 84 1 1 'II) Uquld Pael 104 86 78 1 (ej CoL. Wood & Bagaue 91 48 46 • (d) CHher Power U 8 8
II-Banual '148 474 969 8 f Major Group
Total 1,000 217 &92 17 2()o21 , I-AU FuelBJP&.nr . 973 254 888 17 4 (II' Electn<"ity 254 58 183 .. 4 (6) Liquid Foel . . 568 129 426 4 (e) CoiiJ, Wood &: Bngl>s8e 103 22 87 14 (d) OtherI'ower 68 46 ·13
II-Ma.""vaE 27 23 4
22 Total 1,000 ],000
II-Mall_' · 1,000 1,000
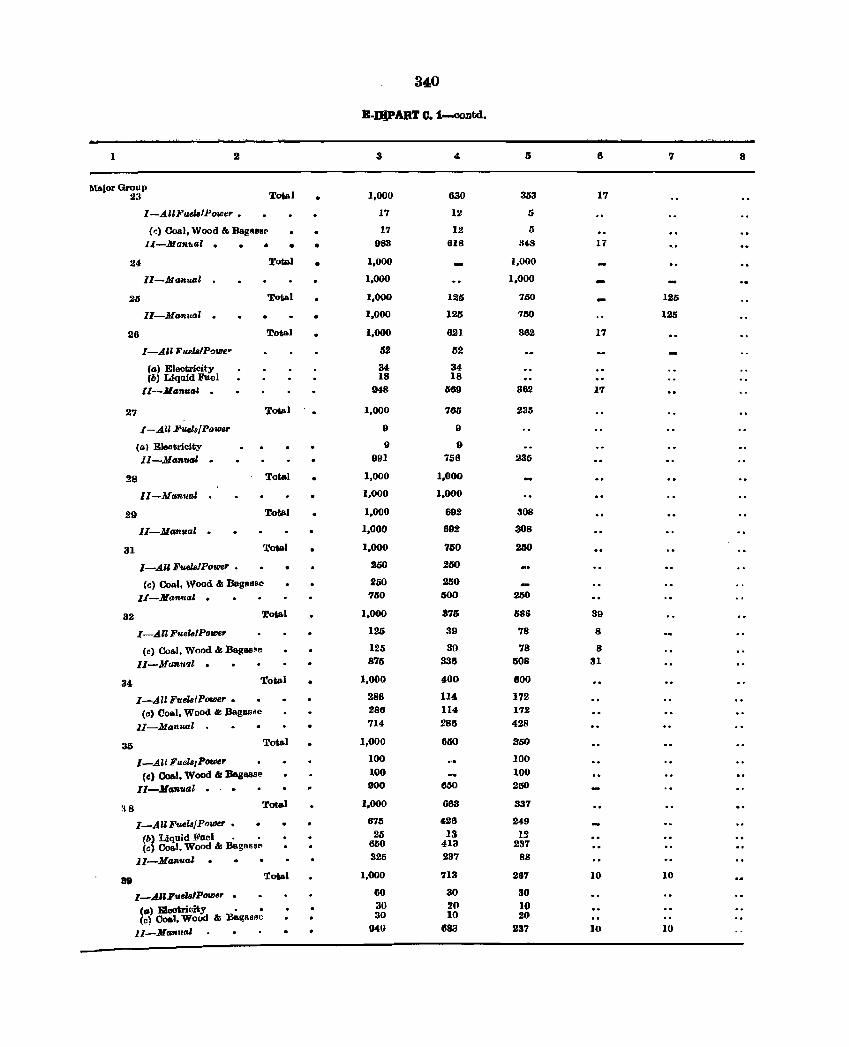
1
Major Group 2:1 Total
I-AU/<'udaIPower •
(~) Ooal, Wood &; Bagllll ...
24
25
26
27
II-Ma1u,al •
II-Manual
II-Ma1lual •
I-All FuelsIP'!J'U1IP. p
(a) Elootricity (6) Liqoid Fuel
lI--Manuat _
I-Al~ :D''1I.t!ls/PO'U1Br
(a) Elootricity II-Manllal _
28
1l-.Va1l14a1
29
II-MG1nuzl •
• • Total
Total
Total
Total
Total
Total
31 Total
32
34
I-All Fuel8JPO'U1Br
(c) Coal. Wood &; Bagll8RC
II-Ma1l,,01 •
Total
I-An FuelslPo_r
(.) Coal. Wood &; BagaB~e
II-Ma1l"-z1 •
To~1
I-All F'lJ.dalPotCer • (c) Coal, Wood &: BagasBC
II-Ma1lual
3D Total
39
I-AU Fuel8IPower
(c) Coal. Wood &; BasaliS'" II-MaRual •
I-All Fuels! POlAe" • (6) Liquid }I'nel • • (~) Ooal, Wood &; BagassfI
II-Manual
I-All Fu.'PtnDer •
(G) Eleotricity • • (c) Coal, Woad &: :B~RS~C
11-Ma .. ,,"'
Total
• •
•
340
B-JQ.PART O. 1-contd.
3
1,000
17
17 983
1,000
1.000
1,000
1,000
1,000
1,000
I}
I}
9111
1,000
1,000
1,000
1,000
1,000
250
260 '150
1,000
125
125 875
1,000
286 286 714
1,000
100 100 900
1,000
675 25
600 325
1,000
60
30 30
tMl)
4
630
12
12 618
125
125
621
tl2
34 18
589
765
I}
9 756
1,000
1,000
692
692
750
21SO
250 500
375
39
30 338
400
114 114 286
61S0
6.50
663
428
13 413
237
713
30 20 10
883
353
1,000
1.000
750
750
362
382
235
235
308
308
2M
250
686
78
78 1508
800
172 172
428
350
100 100 21S0
337
249 12
237 88
287
30 10 20
237
8
17
17
17
17
39
8
8 31
10
10
7
125
125
10
II)
8
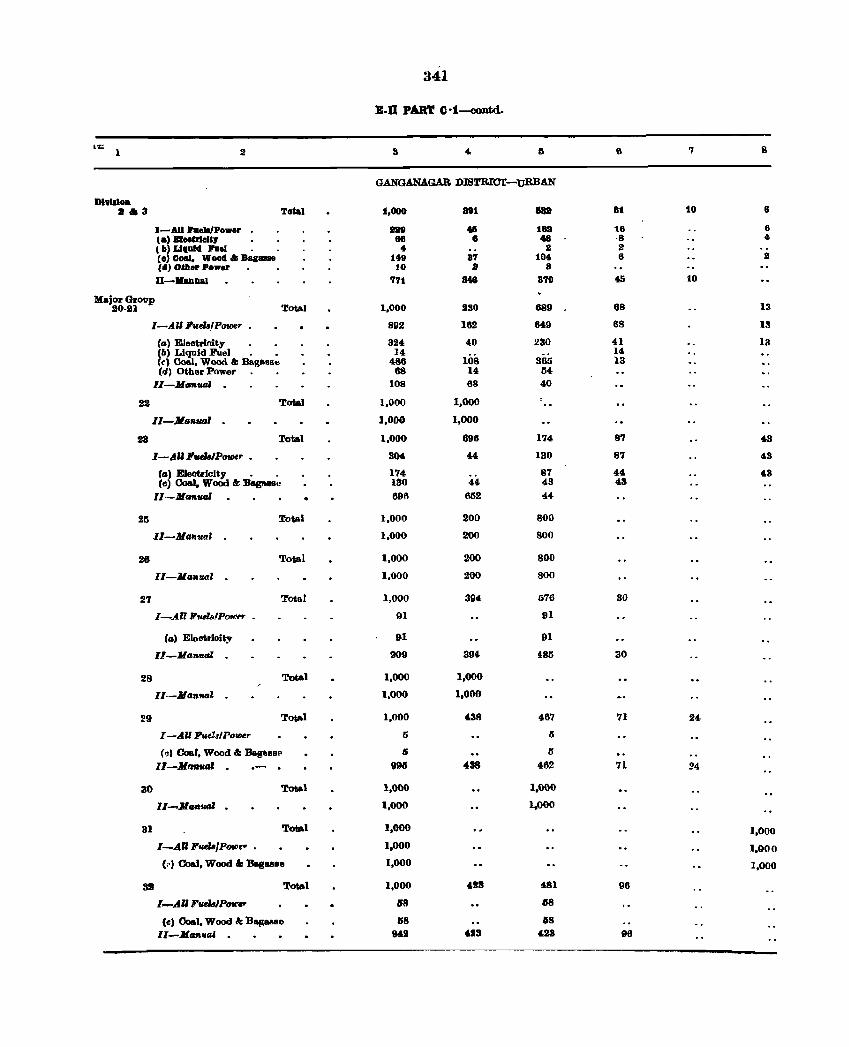
341
B-II PART Q ·1--oontd.
"'.Ci:, 8 1 2 :II 4- IS 7
GANGANAGAB. DlBTRICT-URBAN
Dl"IIlOll. 11",3 Total 1,000 a81 &8! 81 10 8
I-AU l'uela!Power :an • UIII 18 8 ta) BleoUleltJ 88 8 48 ·8 4 ( II) Ullllf~ FUel 4 II 2 Co) Coal. Wood" Bagasse 14D 87 104 8 2 (d) OtJlltl' Power UI II B
n-lIaIluaJ 771 348 870 45 10
MBjorGroDp JlO-21 Total 1,000 230 889 68 13
I-All ,,,ela!Power 892 182 M9 68 13
(~) Eleotrinity 324 40 230 41 13 Cb) Liquid Fuel . • 14 108
14 Ccl Coaol, Wood & :Bagltosse 486 385 13 (d) Other Power. • 88 14 64
II-:Jia",ud 108 68 40
22 Total 1,000 1,000
11-Jla,u_' 1,000 1,000
93 Total 1,000 696 174 87 43
I-AU FwJelP01IHr • S04 44 130 87 43
(a) Eleotricity • . 174 87 44 43 (e) Coal. Wood &: Bagllollse 130 44 43 43
II-Ma".1Il 696 6112 44
21S Total 1,000 200 800
.I1-Mtlflu'll 1,000 200 800
26 Total 1,000 200 800
lI-lII~Jlual 1,000 200 800
27 Total 1,000 394 676 30
I-Alll1,ulsIPm", .. 91 91
Ca) Eleetrioity 91 91
II-JLa .. _l 909 394 485 30
28 Total 1,000 1,000
II·-Ma"fUJl 1,000 1,000
29 Total 1,000 438 467 71 24
I -All P",eZJIPo_r 6 6
(." Coal, Wood" BagflBII" Ii 5
II-Mrn,,,aI . .- . 993 438 462 71 24
30 Total 1,000 1.000
II_,M.,uml 1,000 1.000
31 Total 1.000 1.000
I-AU ,tula/PolIJep 1.000 1.000
(,.) Coal, Wood'" BasBBBe 1.000 1,000
39 Total 1,000 428 481 96
1-dU Fwd8IP_ 1'8 MI
(c) Coal. Wood 4: B~MBe 68 18 II-At_ulll . 114,2 "13 &23 96
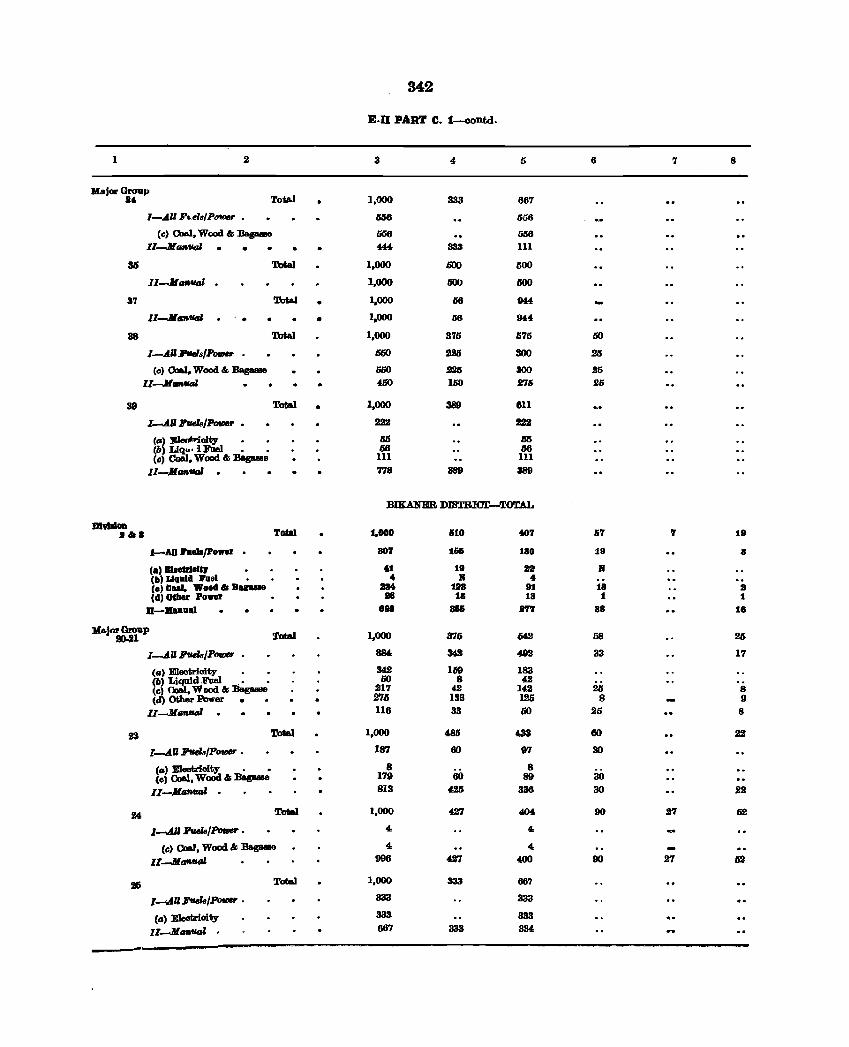
342
E·n PAR'l' C. 1-oontd.
1 2 3 4 /) 6 7 8
Major Group 8& Total 1,000 333 667
I-AU Fuls/Po_ . M6 656
(c) Coal, Wood &; Baga.o 566 IiI56 ll-J1_tNil • 444. 333 III
30 Total 1.000 600 500
ll-ll_tIGZ . 1,000 liOCJ 600
87 Total • 1.000 Ii6 M4
Il-1l_uaJ • • 1.000 116 IM&
38 Total 1.000 376 675 50
I-AUJlMsIP_ • 660 225 800 25
(c) Ooa.I, Wood &; Bas-e 660 .225 300 25 lI-JI_tIGl 460 100 275 26
39 Total • 1,000 389 811
I-AU FtIeIs/PoriMr • 22"~ 222
(G) E1enf:>ioit,y li5 li5 (h) Llqu, i FoeI • • 66 66 (c) Coal, Wood &; :Bagasse 111 III
Il-ll_tIGZ 778 389 389
BIKANER DlBTBICl'-TOTAL
DlwblOD !'otaI 1,000 ••• 1110 107 &7 7 18
I-AD ralla/po_ 807 16& 180 18 8
(a, BIedrIeIQ 41 18 aa If (II) Llqldll raol • 4 11 4 Ce'., ..... Woo". Bu_ 2M 188 81 18 a (II) O&Iler Power 38 18 18 1 1
U-BaDuaJ 888 8&& 377 88 18
Majm Group 2o.Jl Total 1,000 376 6!&2 68 26
I-.AU FtIeIsIPotIJCr 884 342 492 33 17
(G) Eleatrioity 342 169 183 (h) Liquid.F1ie1 . • • 50 8 42 (c) floal, W DOd &; :oag- 217 4.2 142 25 8 (eI) Other Power • • 27li 133 125 8 9
II-MtJAuoJ 1I6 33 60 25 8
23 Total 1,000 485 m 80 22
[-.AU 1l'tIelB/Powr • 187 60 97 30
(II) meotrioity • • 8 8 (c) Coal, Wood &; BagaMe 179 60 89 30
II-JI_' . 813 425 336 30 22
U Total 1,000 427 404, 90 27 62
l-.AU 1J'vds/Power. 4 4
(0) Coal, Wood &; :oap.e 4 4
lI-JltIII-' 998 427 400 90 27 52
26 Total 1,000 333 66?
I-.AU FveJsIPorDer • 333 333
(G) Eleof;rioit,y 333 333
lI-JI_-' 667 333 334
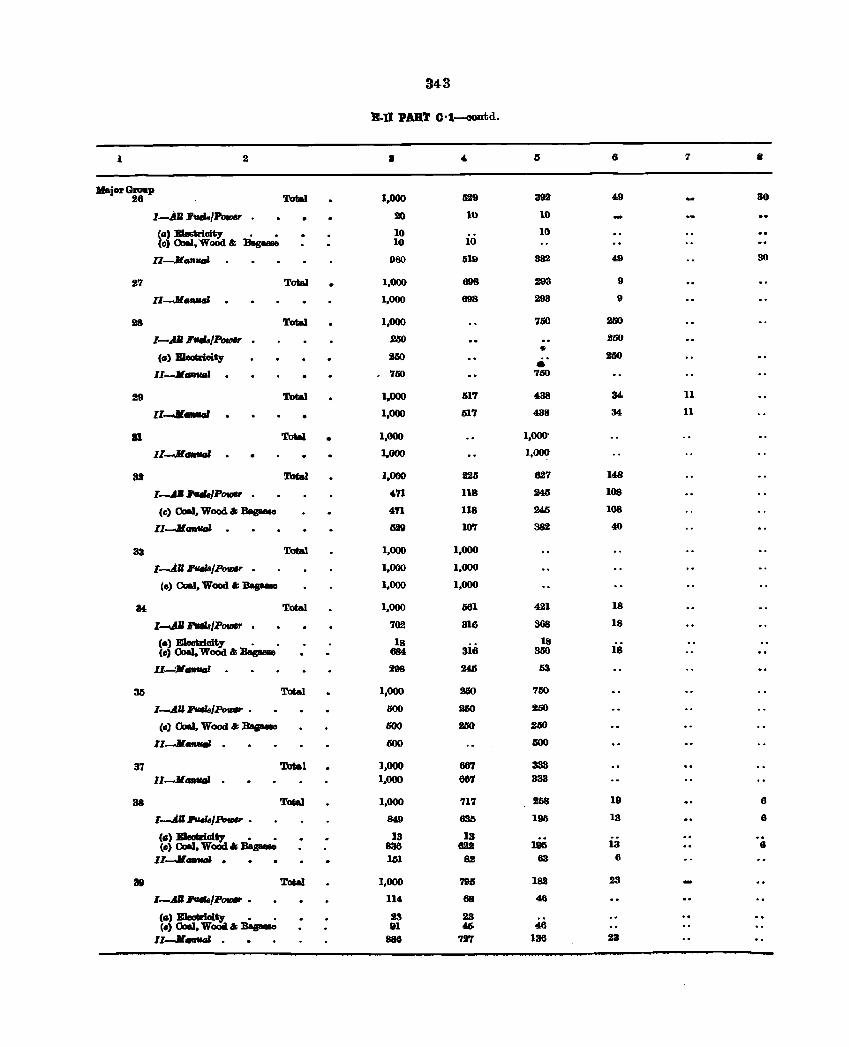
343
11:-11 PART C·l-oontd.
1 2 I 6 7 I
1hjor Gro1Ip 28 Total 1,000 U9 392 49 30
l-AII hMB/Poroer 20 10 10
(II) 1ilIer;trioity • • 10 10 (0) ea.I, Wood &; Baguae 10 10
II-Mo""" PSO 519 382 49 30
27 Total 1,000 698 293 9 II-M __
1,000 898 293 9
28 Total 1,000 750 260
I-All '-L/PoriJIr . .260 250 ., (II) BIealzioity 250
_. 200
lI-JI_1 700 71lO
29 Total 1,000 517 438 34 11 11-11 __
• 1,000 517 438 34 11
81 ToW 1,000 1,000-Il-M __
1,000 l,~
3! Total 1,000 12li 627 148
l-AU ,../POfIIM' . 471 118 24IS 108
(c) ea.I, Wood &; :e.ca- 471 118 245 108 11-M __ . B29 107 382 40
33 Total 1,000 1,000
I-AU :rv.l8/PotDar • 1,000 1,000
(0) Coal, Wood &; BagaMe 1,000 1,000
34 Total 1,000 661 421 18
l-AI :IWls/PovIrt 702 316 868 18
(.) EIeotriait,. • • 18 3i6
18 (c) Coal, Wood &; :Bagaaae 884 350 18
II-fJl..."z 298 246 63
35 Total 1,000 200 750
l-AU Ft*B/Pov# • llOO 200 250
Co) (baI, Wood &; BapMe 600 200 200
11--1l.'_'" · llOO 500
37 Total 1,000 667 333 11-11 __ 1,000 68'J 333
38 Total 1,000 717 258 10 6
1-4IlI'tuls/Power • 849 63t; 191) 13 6
(IJ) EIeoIirioi~ • • 13 13 .. (o) (baI, Wood ... ~ 836 622 195 13 6
lI-M __ · 161 82 83 6
89 Total 1,000 793 182 23
I-All I'UI8/PcItI# • 114 68 46
(.) BleaI;rioi~ • • 23 23 (0) OoaI, Wocia &; :sas-e 01 46 46
lI-1ItlfluaJ · 881 7ft 136 23
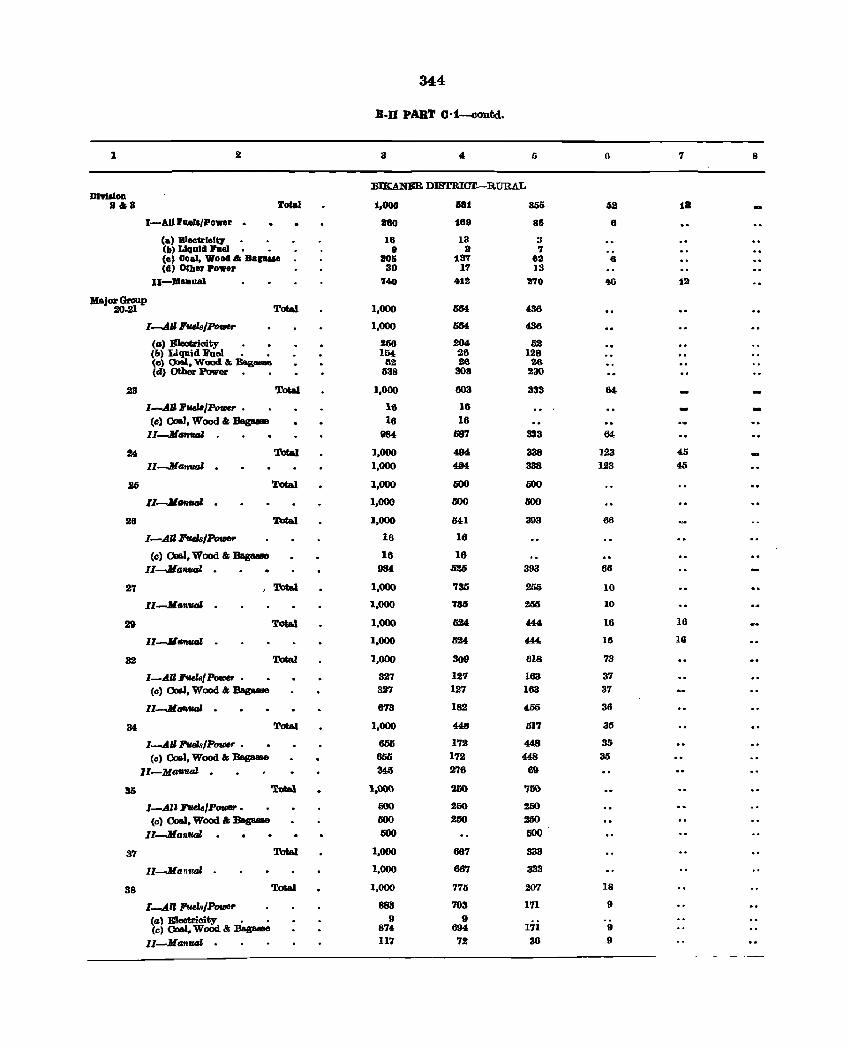
344
B-ll PART C·1-contd.
1 2 3 " Ii (l '1 8
BIXANER DISTlUar-RURAL Dl9IalOD
Iff' To&al 1,000 1581 856 62 1. 1-Alll'lUIls/Power . 880 189 85 6
(a) B1ectrlel*:r 16 13 3 <II) LlgDI .. he) . . 9 :a 7 .. (o} Coal. Wood ifs Bal_ a05 13'1' 62 6 (d) ~her Power 30 11 13
II-JrInual 140 .12 1r10 -to 13
Major Group JO-21 Total 1,000 664 436
I--tll F..zs/Po_ 1,000 lI64 436
(III) BIeotrioity 200 204 52 (b> Liquid Fuel • • 154 26 128 (G} Oaal, Wood &; "Bas- 62 26 26 {d> Other Power. • 538 308 230
23 ToW 1,000 603 333 64
I--tll E'tIeJBJP()1ft,. • 16 16
(c) OoaI, Wood &; BagaMe 16 16 II -M tJfI'fIGI 984 687 333 M
M Total 1,000 494 338 123 45
II-Man_' · 1,000 4114 338 123 45
26 Total 1,000 liOO 500
II-JltJfI_ · 1,000 liOO 1500
28 Total 1,000 641 003 66
I-AU Fuds/Po_ 16 16
(c) 0Ja1, Wood &; BagaMe 16 16 II-Ma1lfltaE · IHH S26 898 68
27 , Total 1,000 735 255 10
Il-MMtUJI · 1,000 735 Mli to
• ToW 1.000 624 444 16 16
II-MMtUIZ · 1,000 lI24 444. 16 18
32 Total 1.000 309 618 73
I-AU J'udsfP_ • 327 127 163 37 (c) 0l6I, Wood &; Bagame 327 127 168 37
IJ-MtIIltUIZ · 673 182 455 36
34 Tota.J 1,000 448 517 35
I-.AII FudsIPo_r • 655 172 448 35
(c) Coal, Wood &; BagaEe 655 172 448 35
Il-Ma"tud . 345 276 69
35 Total 1,006 200 700
I-.AU FulsIPOID8r' • 000 250 250 (c) Coal. Wood &; :BagIIIIII8 500 250 250
II-Manual lSOO 500
37 Total 1,000 667 333
II-Manttal 1,000 667 333
38 Totial 1,000 775 207 18
I-.AIl1'uelsIPotIJIlr 883 703 171 9
(a) Bleotrillity • • 9 9 (c) Coal. Wood &:Bag&Me 874 694 171 9
ll-Man_' · 117 72 36 9
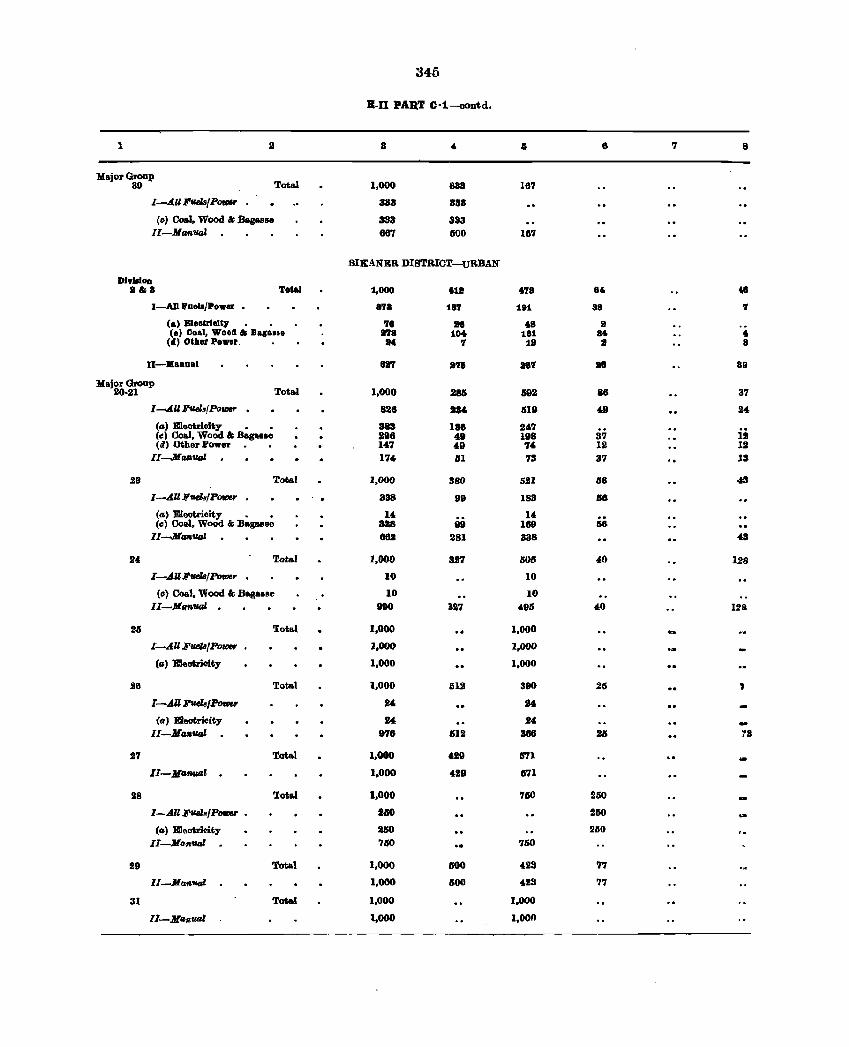
345
B-JI PART C-i--oontd.
1 8 6 7 8
Major Group 39 Total 1,000 883 167
I--.4.11 Furls/Po,.,. 383 311
(0) Coal, Wood &; .Dagus. 333 333 II-Manual 667 600 187
BIEANER DISTRICT-URBAN
DI .... loD 1&8 Total 1,000 4011 4078 840 H
I-AIlI'Do"/Power 87a 187 181 88 7
Ca) BleolrJeI&l' 78 H .8 S Ce) 001.1, Woad & Baga.le 178 1040 181 M 40
(d) Other Power. 1M '1 11 I 8
1I-lIaDual 81'1 1711 1117 Btl 80
Major Group Total 1,000 692 86 37 20-21 286
I --.4.U Ji'Vel.( Po,.,. . 828 IS~ 1S19 ~9 24
(G) EleotrlCl;ty • • 983 188 2'.'1 ii (cl Coal, Wood &; Daguse 2116 49 198 37 (d) mher l'o.er 147 411 " 12 12
lI-JlAI&ual 174 II 73 S7 13
28 Total 1,000 380 6.21 158 41
1--.4." Fuels! POID8r 338 99 IS3 lI6
(G) Eleotrioity • • 14 14 (c) Ooal, Wood &; Bagasse 328 99 1119 IS6
lI.......Manual GO 281 338 43
24 Total 1,000 3.27 601I 40 Us
I-AU1!'uilslPotDer 10 10
(c) Coal, 'Wood '" BagaBse 10 10 II-Mu..nual . 990 a27 495 40 1211
25 'Iotal 1,000 .. 1,000
I-A.U Fuils/PoI/JfJ,. 1,000 1,000
(G) Eleetrioity 1,000 1,000
26 Total 1,000 1112 390 .lIS ., I-AU FUdsIPovJer 24 U
(0) E1eotricity 14 24 -II-MAnual 1178 1S12 386 lIS 71
27 Total 1,000 '29 1S'l1
11-MA_I . 1,000 429 117l
28 Total 1,000 '760 250
I-All Fuels/P_ lIO 260
(G) Eleetrimty 260 260 II-Manual 760 760
29 Total 1,000 ISOO 428 77
lI-Manual 1,000 1100 '29 77
31 Total 1,000 1,000
lI-J[Gn_1 t,OOO I,oon
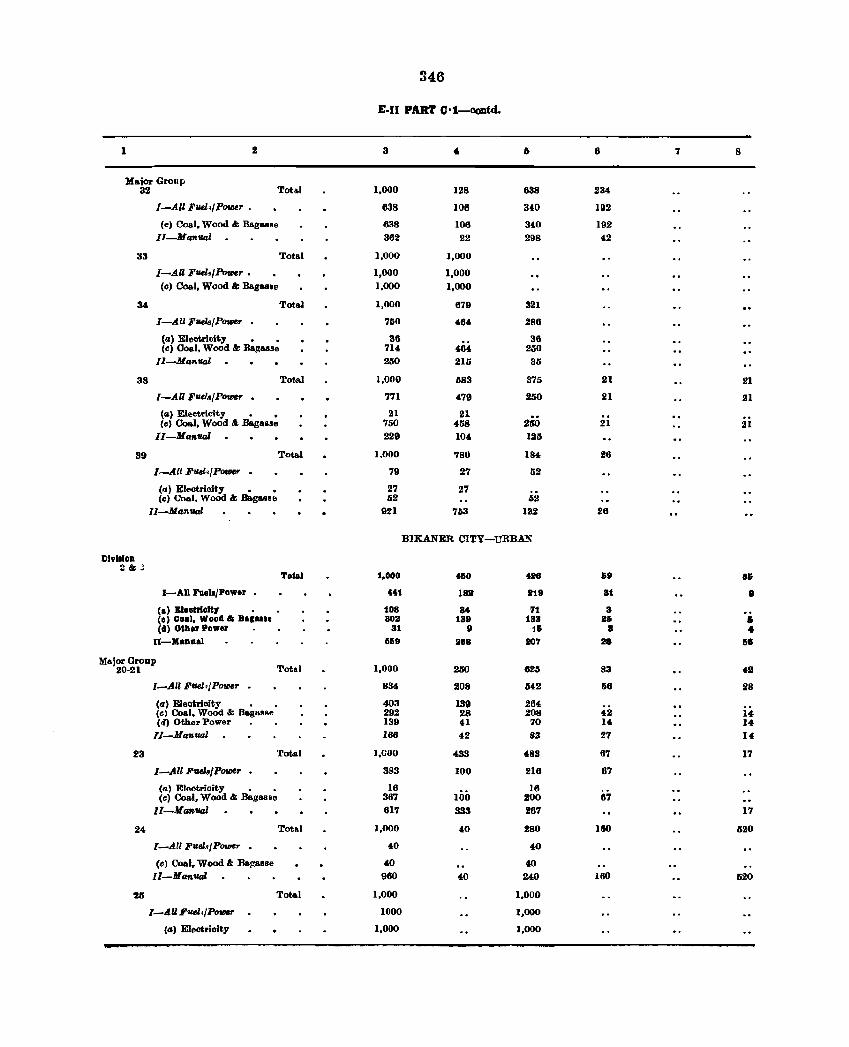
346
E.I[ PART C·1-coutd.
I 2 3 Ii 6 7 8
:Major Group 32 Tota.l 1,000 128 638 234
I-All Fuel4PotUr • 638 106 340 192
(el Coal, Wood & Bag ..... e 638 106 340 192 Il-ManlUll 362 22 298 42
33 Total 1,000 1,000
I-AU Fuel./PotHr • 1,000 1,000 (cl Ooal, Wood Ie Baga.le 1.000 1,000
34 Total 1,000 879 321
I-All Fuds/P_" 0 750 464 286
(IJ) Electricit.y 0 • 36 36 (cl Coal. Wood &: Bap;asse 714 464 250
II-Manllal 250 215 35
38 Total 1,000 1183 375 21 21
I-AU Fuels/P_ o 771 479 250 21 21
(a) Electricity 0 • 21 21 250 (c) Coal, Wood & Baga.se 750 4-58 21 21
ll-Man'll4l 229 104 125
39 Total 1.000 780 184 26
I-All Fuel.{Power . 79 27 52
(II) EI .. ctrioity • • 27 27 (c) Coal. Wood &: Bagasse 62 52
lI-Manual 921 763 132 26
B1KANER ClTY-URBAN
Dlvl.lon ~&J
Total :1,000 f50 U8 &9 8&
I-All Fuels/Power • 441 182 1118 81 8
(a) EleeUlcltJ • tD8 84 71 3 (e) Coal, Wood. Blgule 303 138 133 116 Ii (d) Otbr Pow. 31 8 1& 8 4
II-Jla.ual 659 288 20'1 38 58
Major Groap 20·21 Total 1,000 250 62& 83 42
I-All FtUl'IPolU" 834 208 542 1i6 28
(a) Eleotrioity • • 403 139 284 (c) Coal, Wood &: BagllsRe 292 28 208 42 14 (,fl Other Power 139 41 70 14 14
ll-Manual 166 42 83 27 14
23 Total I.GOO 433 483 87 17
I-All FuelslPotDer • 3S3 100 216 67
(al Electrioity • • 16 16 (c) Coal, Wood &: BagaB8e 367 100 200 87
II-Man'll4l 617 333 287 17
24 Tot ... 1,000 40 280 180 520
I-All Fuee .• /P_r 0 40 40
(c) Coal, Wood &: Ba~aB8e 40 40 II-Manual 960 40 240 180 520
211 Total 1,000 1.000
I-AU F .. ee"PovIer 1000 1,000
(a) Eleotriolty 1,000 1,000
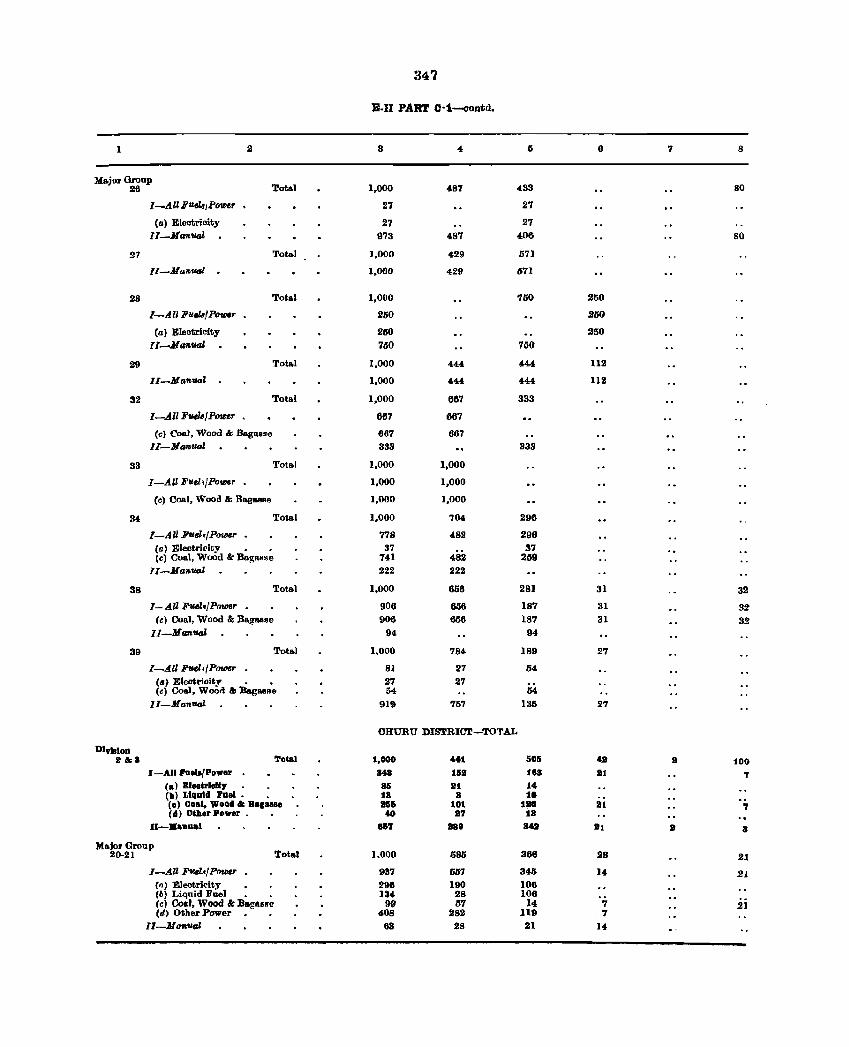
347
D.I1 PART C·i-coatd.
1 2 3 4 6 7 8
MajM Group 26 Tota.l 1,000 487 433 80
I-AU Euel.8,Power • 27 27
(a) Electrioity 27 27 II-Manval 973 487 406 80
27 Total 1,000 429 571
[l-Ma"'UGl . 1,000 429 671
28 Total 1,000 750 250
I-All F'IleJa/PO'IIJ81' 250 250
(a) Eleotricity 250 250 II-Manval 750 750
29 Tote.l 1,000 444 444. 112
II-Maft'lJaZ 1,000 444 444 112
32 Total 1,000 667 333
I-All FUIh/P_ • 667 667
Ccl (.'081, Wood &: S .. gas5e 667 667 II-Man"'" 333 333
33 Total 1,000 1,000
I-AU Fush/Power • 1,000 1,000
(el Coal, Wood &: BagasRe 1,000 1,000
34 Total 1,000 704 296
I-All Puel./PO_l' • 778 482 298 (a) Electril'ity • • 37 37 (c) Coal, Wood &: Bag ... se 741 482 259
lI-Man_1 222 222
38 Tot.al 1,000 656 281 31 32
I-AU FueZ./Power 906 1156 187 31 32 Cc) Coal, Wood &: Bage.sse 906 656 187 31 32
lI-Manval 94 94
39 Total 1,000 784 189 27
I-AU FUel,/Power 81 27 54 (ot) Electrioity • • 27 27 (c) Coal, Woo" &: Be.gasAe 54 54
ll-Manval 91D 757 135 27
CHURU DISTRICYr-TOl'AL
DI91110D 11&8 Total 1,000 441 505 49 9 100
I-All hats/Power 848 11111 168 91 7 C .. ) Bla.trloltr • 85 21 14 (II) Liquid I'ual • • 18 B 10 (a) Coal. Wooil & Ba,alse 2115 101 19 81 7 (11) Otllar Power _ 10 1II7 tS
II-.anual 867 889 8411 Jh 8 3
Major Group Total 20-21 1.000 585 366 28 2J
I-AlIF~/P_ 937 557 345 14 21 ell) Electricity 296 190 106 (b) Liqllid Foel • . 134. 28 106 (c) Coal, Wood &: Bagaue 99 57 14 7 21 (d) Other PoweJ'. • 4.08 282 119 7
II-MaftvaZ 63 28 21 14
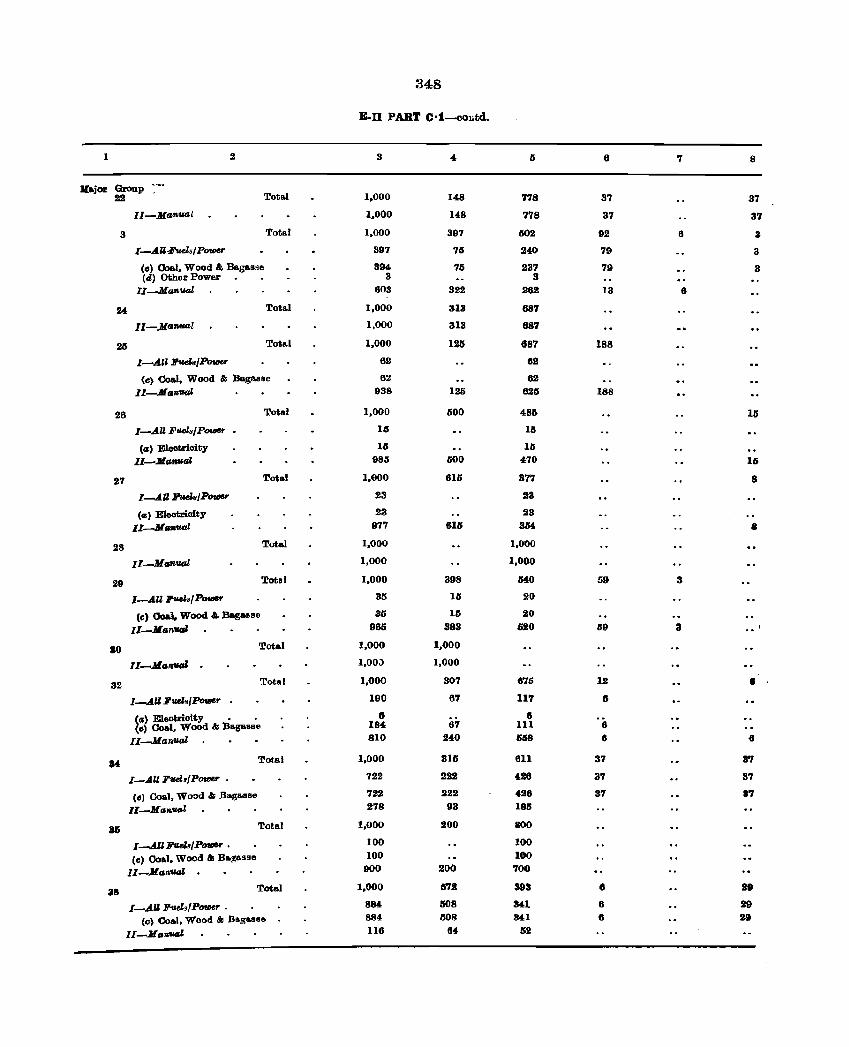
:l48
E-II PART O·1-col.i.td.
1 2 3 4 5 6 7 8
Ilajor Gran ,-_.
p -22 Total 1,000 148 778 37 37
II-MGfI/lml 1,000 148 778 37 37
3 Total 1,000 397 1502 92 6 3
I-AUEv,el,/POU16r 397 75 240 79 3
Cc) Ooal, Wood &. Bagall~e 394 75 237 79 3 (d) ()f;her Power 3 3
11-Mf.l!n...u 603 322 262 13 6
24 Total 1,000 313 687
II-Mafl,v.al 1,000 313 687
25 Total 1,000 1.26 887 188
I-AU .1I'ueIs/P_r 62 82
(c) Coal. Wood &; Bagasse 62 82 II-Manual 938 125 625 188
26 Total 1,000 500 486 15
I-AU Fu.els/P_ Ui 1&
(a) Eleotrioity 16 1& Il-M_",aJ. 985 600 470 iii
27 Total 1,000 615 377 8
l-AlI7uels}Power 23 23
(<l) Electricity 23 23
II-M_uol 977 815 3M II
28 Tot.l 1,000 1,000
Il-Mf.l!n...u 1,000 1,000
29 Total 1,000 398 MO 59 3
I-AIZ .1I'ueIs1 P- 35 15 20
(e) Ooal, Wood &. Bagasse 35 15 20
Il-MGntl4l 965 383 520 59 3
80 Total 1,000 1,000
II-Mall_ 0 1,00;) 1,000
32 Total 1,000 307 675 12 • l--AUFtUI./PovJer 0
190 67 117 6
~a) Eleotricity 0 • 6 II
e) Coal, Wood &; Bagasse 184 67 111 6
Il-Man...u 810 240 658 8 8
14 Total 1,000 315 611 37 37
I-AU Fucl.(pottJer 0 722 222 426 37 37
(e) Coal, WO:Jd &; Ba.gasse 722 S22 426 37 8' II-Ma,....u 278 93 185
35 Total 1,000 200 1100
l-AnFUaJa(P- • 100 100
eel Coal, Wood &; Ba~a9ge 100 100
II-Manv.al 0 900 200 700
all Total 1,000 572 398 II 29
I-.AU Fuel.(P(1IIJer . 884 508 341 6 29
(c) Co.l, Wood &; Bagus" 884 508 341 6 lila II-M,._, 116 64 52
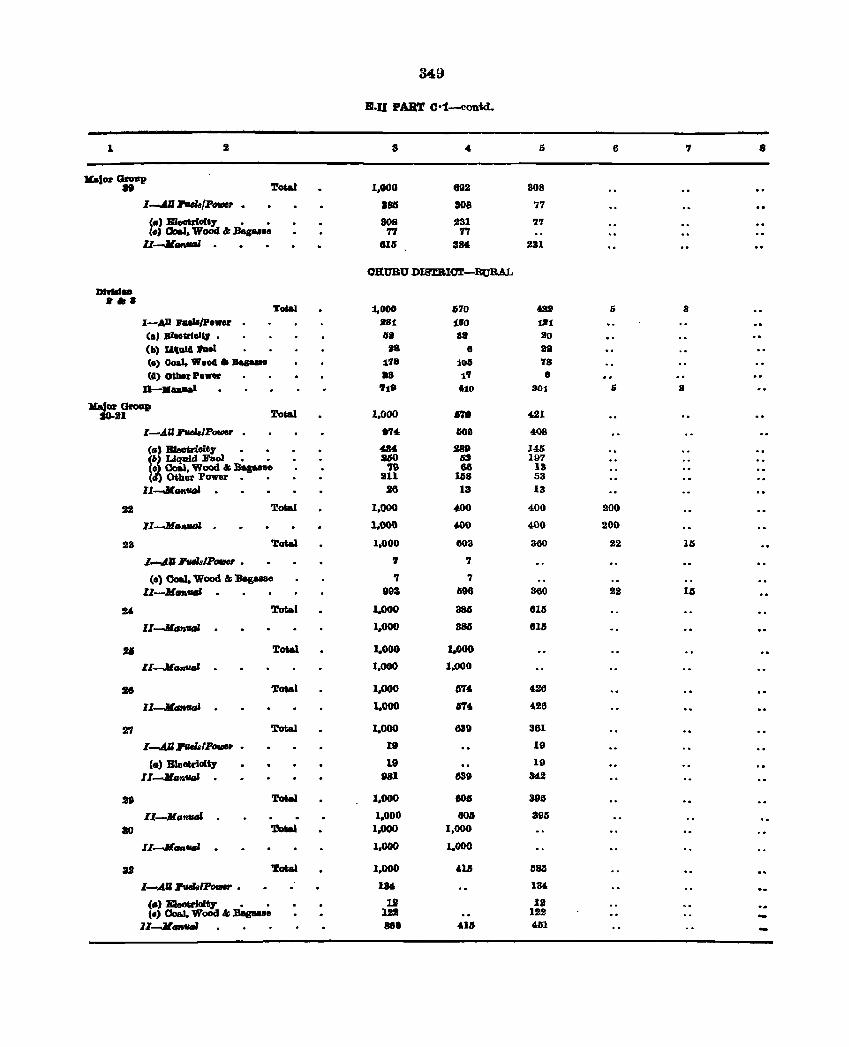
349
E·D PAilT (J·1-contd.
1 2 8 6 7 8
)(alOl' Group It 1!otaI 1,000 4192 308
1~ 7wh/Pove,. • 185 108 77
Ca) :BJeGbial*7 • • 808 231 7'7 (.) 00&1. WoOd 1& Bag .... '17 7'1
II-lI..-l . 016 384 231
ORUBU DISTBIcr.r-Bu'RAL
Dldd .. • ar. Tolal 1,000 570 02 .6 a
I-AD h"'/poWV aS1 180 ta1 (al .Bieovlel~ • 06. 81 aD (II) Llt1d4 hel .8 8 aa (e) Oeal. "004 II Bapue 178 101 78 (a)~.o.u •• l' 8
n-._aal '1t8 ti~ 301 5 8
llaJOI' Group SO-Il Total 1,000 1ft odl
.l-..tD ,..,/P_ .., .. 666 408
ell) Eleofrioity 4N S8It 145 (b) Liquid Fae! • • uo 53 197 (~ Coal, Wood II Bagaase '19 68 13 ( ) Other :Power. • llli 158 53 11 ____
26 13 13
22 Total 1,000 400 400 200
l1-11a._ . 1,000 ~ 400 200
23 ~ 1,000 603 360 22 16
I~.1I1IeLIP_ • , , (0) Ooal. Wood & 'Bag ... e ., 7
II-M .. _ 993 698 360 22 U
24 '.fatal 1,.000 Bali 1115
11 __ a;n'IIfI1 1.000 88IS lila
21 ToW 1,000 1.000
.l1-JL_-' 1,000 1,000
28 T«*. 1.000 M' 428
I1-M1Ift'fIGl 1,000 M' 428
27 Total 1,000 639 381
I.....AU R'wlsIPartM • 19 19
,.) Eleotriolt,. 19 19 11-11 __
t81 639 34-2
Jt ToW 1,000 IOlS 3t6
Il-JLGfl:IMIJ . 1.000 80a 396
ao ToUl 1.000 1,000 1I ....... __
1,000 1.000
IS 'rota} 1,000 na lisa
I-All :J'ViIs'''_ • 1M 134
(a) BleGtrioity • • Iii U (.) Coa.I. WoOd '" BagaPe lD 122
U-II",._ 888 ·ua 4111
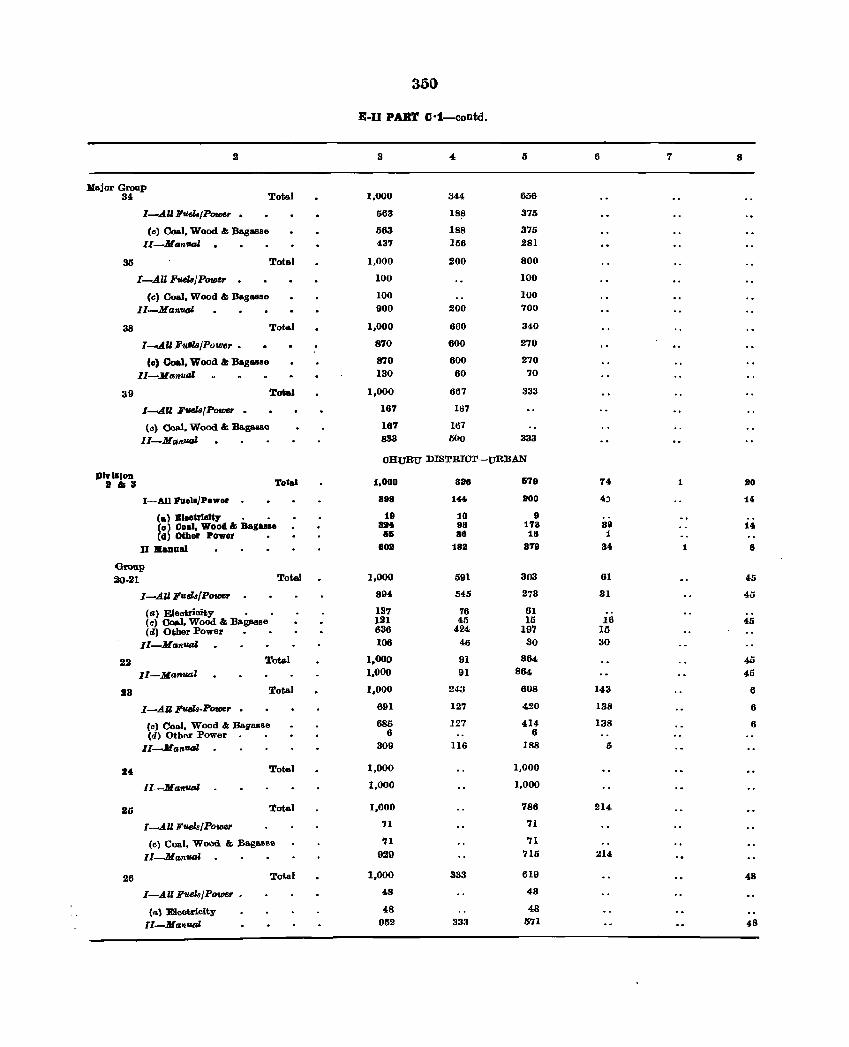
350
£·11 PART C·1-contd.
2 3 4 5 6 7 8
Major Group 34, Total 1,000 344 656
I-All FuUs/Power • 563 188 375
(e) Coal. Wood &: Bagasse 563 188 375
II-MantlGl 437 156 281
35 Total 1.000 200 800
[-.All FfltlB/PolDsr . 100 100
(c) Coal. Wood &: Bagasse 100 100
I1-Man'Ufll 900 200 700
38 Total 1,000 660 340
I-All Fulls/Power • 870 600 270
(e) Coal. Wood &: Bagasse 870 600 270
II-Manual 130 60 70
39 Total 1,000 667 333
I-AU FGtlufP01DtJr • 167 167
(e) Coal. Wood &: Ba.gasse 187 167
II-Man_ 833 5(10 333
OHURU DISTRWT-UR;BAN
PlvlaloD It "" 3
To'al 1.000 sao 579 74 1 ao I-AU I'uell/Power 898 144 aoo 4) 14
(a) Ble.hlel&:r • • 18 10 8 (0) Coal. Wood &: Baga.s. 824 98 178 89 14 (d) 001er Power 55 S8 18 1
II iliaD_a) 802 182 879 84 1 8
Group 20·21 Total 1.000 591 303 61 45
I-All FueZsfPo_r 894 545 273 31 45
(a) Eleotrioity . 137 76 61 (c) eoa.l. Wood &: IIagasse 121 45 15 16 45 (d) Other Power 636 424 197 15
II-Manual 106 46 30 30
22 Total 1,000 91 864 45
II-Manual 1,000 91 864 45
13 Total 1,000 243 608 143 6
I-AU F'U6la·Po_r • 691 127 420 138 6
(0) Coal, Wood &: Baga •• e 685 127 4,}4 138 6 Cd) Other Power 6 6
II-Manual 309 116 188 5
24 Total 1.000 1,000
J I-M all.tlISl 1.000 1,000
16 Tota.l 1.000 786 214
I-All Fuel./Po_r 71 71
(c) Coal, Wood. &: Baga.sse 'II 71
Il-lJlanUGl, 929 711i 214
26 Tot.al 1,000 333 619 48
I-All Fuel8JPoWtlr • 48 48
(II \ Eleetricity 48 48
lI-Ma.,.UGl, 952 333 571 48
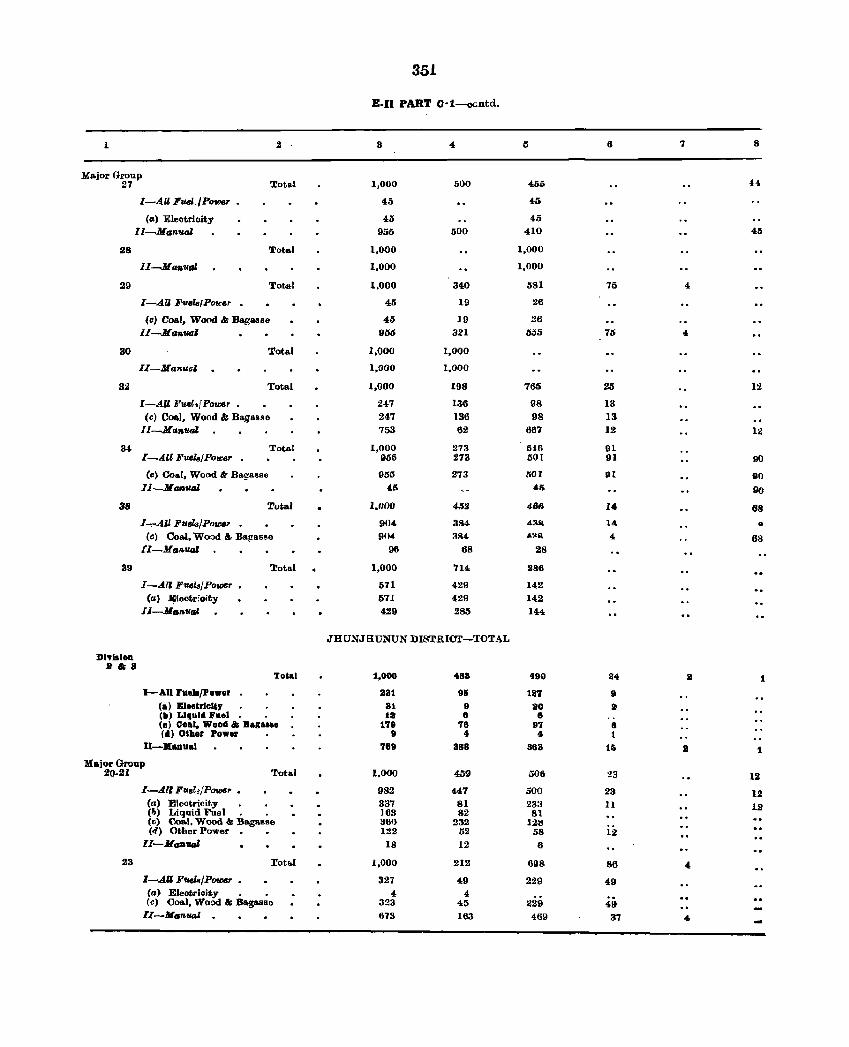
351
E·II PART C·1-ocntd.
1 2 3 5 6 7 8
Major Group 27 Tot .. 1 1,000 500 455 .. 4
I-AU Fuel_IPotDtl' 45 45
(GI) Electricity 45 45
II-Manual 955 500 410 45
28 Tot .. 1 1,000 1,000
II-Ma1l.u", 1,000 1,000
29 Total 1,000 340 581 75 4
I-An FUfJlB,PO'l£fJ, 45 19 26
{e) Coal, Wood IJt; Bagas8e 45 19 26
IL -11£1171/1/,0:1 905 321 ijij5 75 4
30 Total 1,000 1,000
II-Manual 1,000 1,000
32 Total 1,000 198 765 25 12
1-.1." Fusl.iPou:e, • 247 136 98 13
(e) Coal, Wood & Bagasse 247 136 98 13 Il-Ma1l.ual 753 62 667 12 12
3-t Total 1,000 273 5i6 91 I-All FuelalPower 955 273 501 91 90
(c) Co .. I, Wood 8c Bagasse 955 273 fiO 1 III 110 JI-MMlUIU 4.5 .,. 90
38 Tutal 1.000 ~')2 41M 14 68
I-,.AU Fuels/Powv 904 384 49.51 U. D
(c) Coal, Wood'" Ba!!BSSe P04 aR4- £lIQ, 4 68 II-MGAual 96 68 28
39 Total 1,000 714 286
I-All Fuel8/Powe, 571 429 142
Cal illoctr:oity 571 429 142
II-M"nvgI, 429 285 144
JHUNJHUNUN DISTRIC'.r-'IOTAL
DIvIsIon .&8
To&al 1,000 483 490 24 S 1
I-AlIlueb/Po._r 231 95 187 9 Clio) Bl.eirl.",. 31 9 20 2 (It) Liquid I'uel 18 8 8 (a) Coat. Wood &; Bagasa_ 179 78 97 8 (II) Other Pow_s: 9 4 4 1
II-Xanual 789 388 383 lli II 1
Major Group 20·21 Total 1.000 459 506 :!3 12
I-A.I' FUe?,/Power • 982 447 500 23 12 (a) Eleotrioity 337 81 233 11 12 Cb) J.iquid Fue I. . 183 82 81 (e) (,,,,,,,I. Wood & :Bag",""e 36Q 232 12!! {d) Otller Power. • 122 52 58 12
II-MfJ'II'IIal 18 12 6
23 rot!>1 1,000 212 898 86 4,
I-AU Fuels/P_ • 327 49 229 49 (a) Eleotrioity • • 4 4
49 (e) Coal, Wood & Bagasse 323 45 229 II-Ma ... _l . 613 163 469 37 4
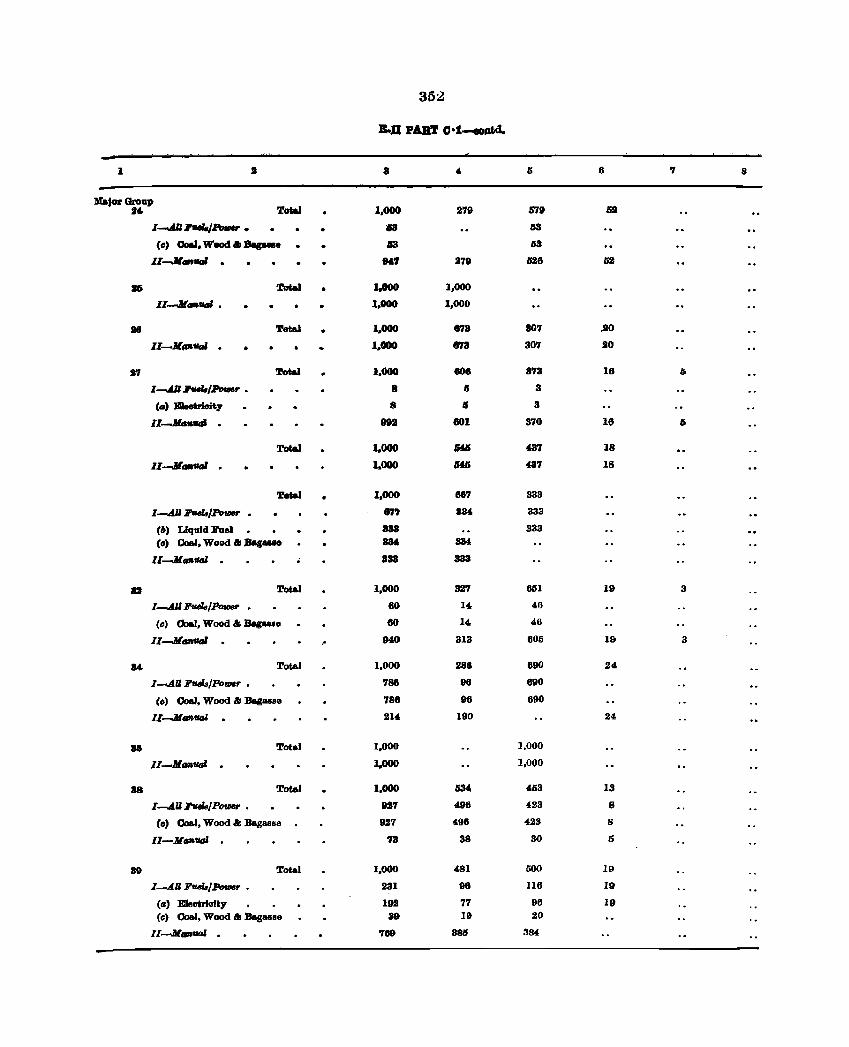
35~
B.D PART O·t-oootd.
1 S a 5 6 7 8
Major Group 114- Total 1,000 279 57D 62
I-&l' ... /Power • ., 1I3
(c) Coal, W.oo '" :s.guaB U liS
11-11 .... · 1N7 27. 1128 62
lI6 Total • 1.000 1,000
11-11,.,._ • 1,000 1,000
28 Total 1.000 67. S07 ,so
Il-M_"'" · • 1,000 873 307 20
17 Total 1,000 808 873 18 I;
I-..4.U 1'tUls/.Pov!M' • 8 II 3
(a) EIeotrioit:y 8 II 3
1I-1tl .. tItIJ · 99S 801 370 16 IS
Total 1.000 .HG 437 18
II-M_fIfJI · 1.000 4J4jj 437 IS
Total 1.000 8&7 333
I-..4.ll J!'rula/Po_ • 8" 834 333
(6) Liquid lI'ae) 388 333
{oJ Coal, Wood '" Bag- 834. 834
II-M_ual · aaa 333
U Total 1,000 327 861 19 3
I-..4.U Jl'uiltJ/Powr • 80 14 46
(c) Coal, Wood &I Bag..,ae 80 14 46 II-M __
· .' 940 313 805 19 3
14. Tot&] 1,000 288 890 24
I-AILl'--"jPo'UlC" • 788 96 690
(0) Coal, Wood &I Bag..,se 788 96 690
II--M_ual · 214 190 24
III Total 1,000 1.000
II--14_tlQl · 1,000 1,000
18 Total 1,000 634 453 13
I-..4.U FveL/Po_ • 927 496 423 8
(c) Coal, Wood &I Bagasse 927 496 423 8
Il-M_'ual 73 38 30 IS
39 Total 1,000 481 500 19
I-All FtUla/Pove,. • 231 98 116 19
(a) Eleotriofty 192 77 96 19 (CI) Coal, Wood & Bag .... e 89 19 20
11--14",,_ . 'I. 3811 384
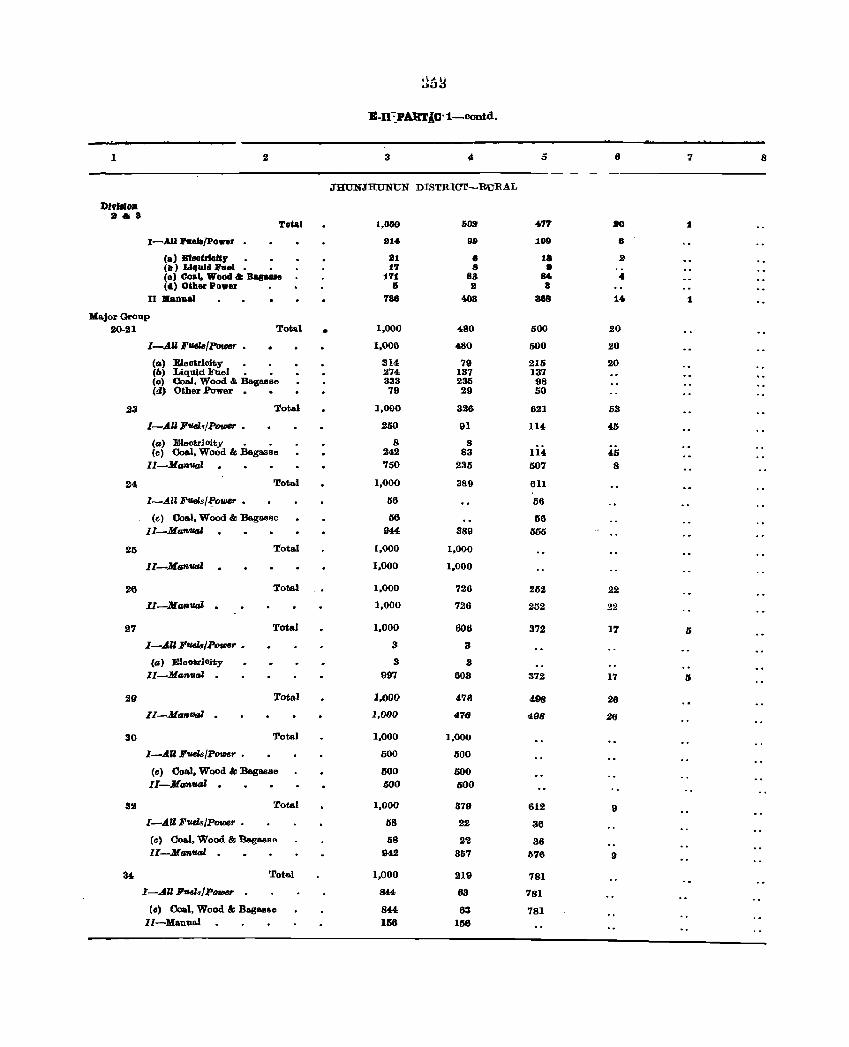
~tJ~
B-Il:PARTIC·1-contd.
1 2 3 4, 5 It 8
JHUNJRUNUN DISTRICT-RURAL
DJ.,llIIo. :It oil 8
To'al 1,000 50a 4.77 ao 1
I-AU .... e .. /Po_r 9t4. 99 109 8
(al BleoUieJ&y 21 8 1a a (b) LI'IllId hel • t7 8 e (0) Coal. Wood .. Bag ... e 171 83 840 4,
(4) Other Power 5 II a II Jilallual 786 4003 388 14 1
Major Group 20-21 Total • 1,000 480 500 20
I-AU Fuel8{Powar 1,006 480 500 20
(a) Eleotricity 314 79 215 20 (6) J.iquid Fuel. • 274 137 137 (c) Coal, Wood & Bagasse 333 235 98 (4) Other .Power. • 79 29 50
23 Total 1,000 326 621 53
I-AU FtItIlsjPt>tIM • .250 91 114 £5
(a) Electrioity . • 8 8 (e) Coa.I, Wood & .Bagasse 242 83 1I4 45
II-Manual 750 235 507 8
24 Total 1,000 3S9 611
I-All F'llds/~o_r • 56 56
(e) Coal, Wood & Bagasse 56 56 II-Manual 944 389 555
25 Total 1,000 1,000
II-MGft'"'' 1,000 1.000
26 Total 1,000 726 252 22
ll-Manual · 1,000 726 252 22
27 Total 1,000 606 372 17 5
I-AU Jl'uelaJPOfl}8" • 3 3
(0) EleotriOity 3 3 II-Manual · 997 603 372 17 Ii
29 Total 1.000 478 498 26 II-M_fItIl · 1,000 476 498 26
30 Total 1,000 1,000
I-AU Fuels/Power • 500 500
(e) Coal, Wood & Bagasse 500 500 II-Manual . 500 500
32 Total 1,000 379 612 9
I-AU Fuels/PotDe,. • 5S 22 36
(e) Coal, Wood & 'Ba.ga.sso 5S 2'Z 36 II-Manual . 942 367 576 9
34 Total 1,000 219 781
I-AU H'~../P_ . 844 63 781
(II) Coal, Wood & BagaBse 844 63 781 II-Manual 166 ISO
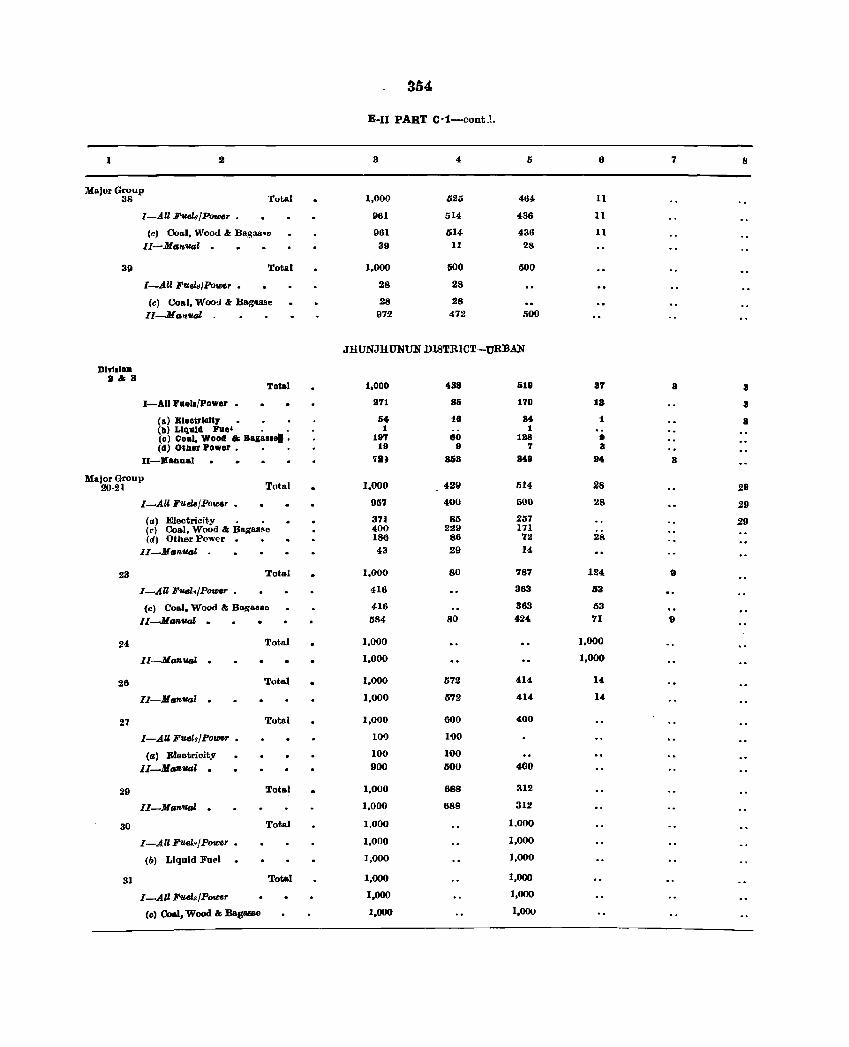
354
E-I1 PART C·t-contI.
I 2 3 4 5 6 7 8
Major Group 38 Total 1,000 620 464 II
I-All Fuela/PotDer 961 514 436 11
(e) Coal. Wood'" Baga •• c 961 614- 436 11
II-Manual . 39 11 28
39 Total 1,000 500 500
I_All Fuel./Power • 28 28
(c) Coal, Wo0111r Bagasse 28 28 II--MGIt'IJGl 972 472 500
JHUNJHUNUN DISTRICT-URBAN
DIYllloD 2&8
TDtal 1,000 438 518 87 8 8
I-AU Fuels/Power • 371 85 170 18 S
(a) EleeUlala,. 54 18 84 1 8 (b l Liquid I'ue' . • 1 1 (e) Coal, Wood II; Bagaslea • 187 80 188 9 (d) Otber PDwer • 19 9 7 a
I1-lIIauual 'fl} 868 848 24 8
Major Group 20.21 Tutal 1,000 4-29 514- 28 28
I-AU Fuels / Pow.r • 967 400 500 28 29
(a) Eleotricit.y • • 371 83 257 29 (~) Coal, Wood &: BIIogasRe 400 229 171 (d) Other Power 186 86 72 28
II--MGn.uGl 43 29 14
23 Tot .. 1 1,000 80 787 124 9
I-AU F1I4Zs/Power • 416 363 53
(r.) Coal. Wood &: Bagasse 416 363 63
II-MG'IIVGl - 5114 80 424 71 9
24 Tot.al 1.000 1,000
II-MG'IIVGl . 1,000 1.000
26 Total 1,000 672 414 14
11-Ma'llual - 1.000 5'12 414 14
27 Total 1,000 600 400
I-AU Fual./Power • 109 100
(a) Eleotrioity 100 100
II-MG'IIual . 900 500 400
29 Total 1,000 688 312
Il-lJIu.'II'4Il - 1.000 688 312
30 Total 1,000 1,000
I-AllF1I4ZsjPo_r 1.000 1.000
(b) Liquid Foel 1,000 1,000
31 Total 1.000 1,000
I-All Fud .• /P0f£8r 1,000 1,000
(c) Coal. Wood &: Bagll&le 1,000 1,000
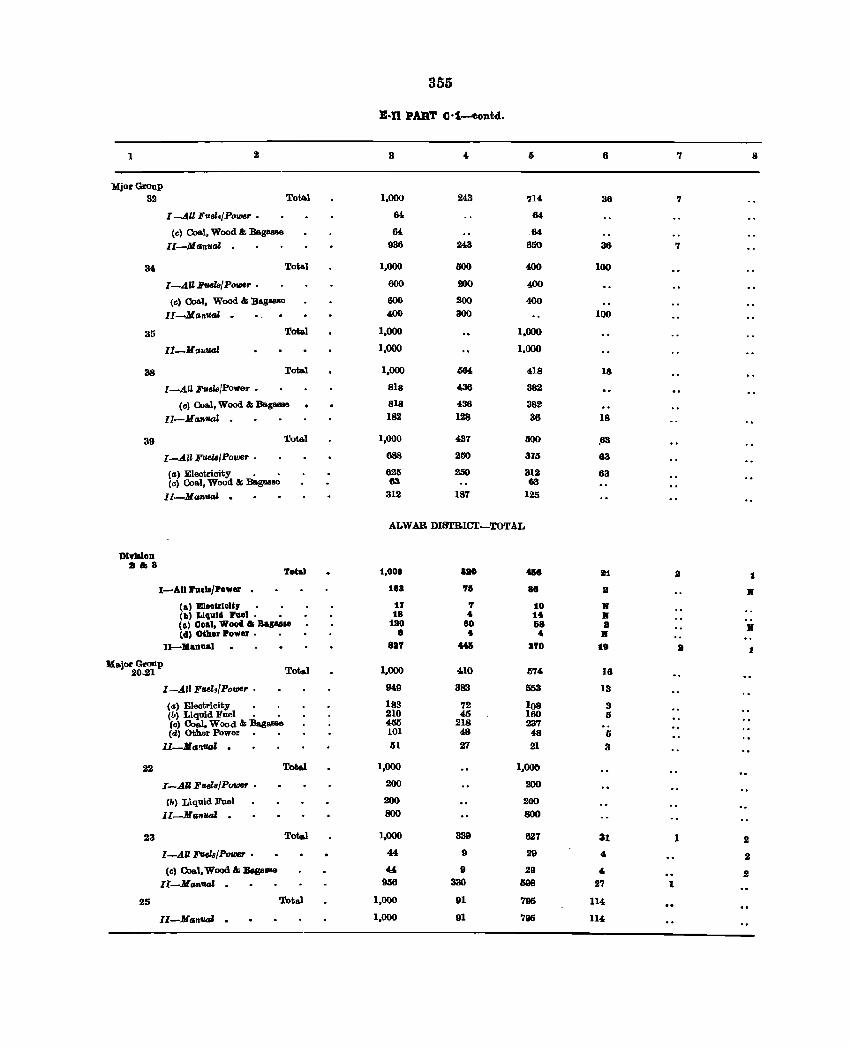
355
Boll POT Cl'i-contd.
1 2 3 Ii 8 7 8
MjorGroup 32 TofAl 1,000 243 714 36 7
I--All Fueli/Power • 64 84
(e) Coal, Wood & Ba.gaR88 64 .64.
II-Manual 936 243 650 36 7
34 Total 1,000 500 400 100
I-AU BvelB/ POVI6r • 600 200 400
<c) Coal, Wood & Baguoe 600 200 400
II-Manv,aJ 0 400 300 100
35 Tota.l 1,000 1,000
11-1l!J"ua1 1,000 1,000
38 Total 1,000 564 418 18
I-AU Fue18/Pow8r • 818 436 382
(c) Coal, Wood & Bag .... a 818 436 382
II-Manual . 182 128 36 18
39 Total 1,000 437 MO ,63
I-A!! FueLB/POlJ)6r • 688 250 371S 83
(a) Electrioity • • 625 250 312 63 Ic) Coal, Wood & Eagasoe 63 63
II-J4anv,aJ 0 312 187 125
ALWAB DISTRICT-TOTAL
Dl'fillo1l a.8
Total 1,000 &10 ... a1 a 1
I-All Fuels/power lea 'IS .. a R
(a) Blloirl,U, • 17 'I 10 R (b) Liquid Fuel • 18 " 14 R (0) Coal, Wooll" Bal_ 1110 60 68 I 11 (II) Other Power • 8 " 4 R
II-Ma1lual 8a7 44& 8'10 t. II 1
Major Group 20.21 Total 1,000 410 574 16
I-All FIUl./POtlJ/!r • 949 383 Ii53 13
(a) Electricity 183 72 108 3 (b) Liquid Fuel . • 210 45 160 6 (e) Coal, Wood & Bagasl8 4S5 218 237 (til Othor Power. • 101 48 48 5
II-Ma'lual . 61 27 21 3
22 ToWJ. 1,000 1,000
I-AU FueZ8/P0fD8r • 200 200
Cb) Liquid Fuel 200 200 II_Manual . 800 800
23 Total 1,000 339 627 31 1 2 I-AI! Ftiel8/Power • 44 9 29 " 2 (c) Coal, Wood 6; Baplllllil 44 9 29 4 2
II-Manv,aJ 0 956 330 698 27 1
25 Total 1,000 91 795 114
II-Manual 0 1,000 91 795 114
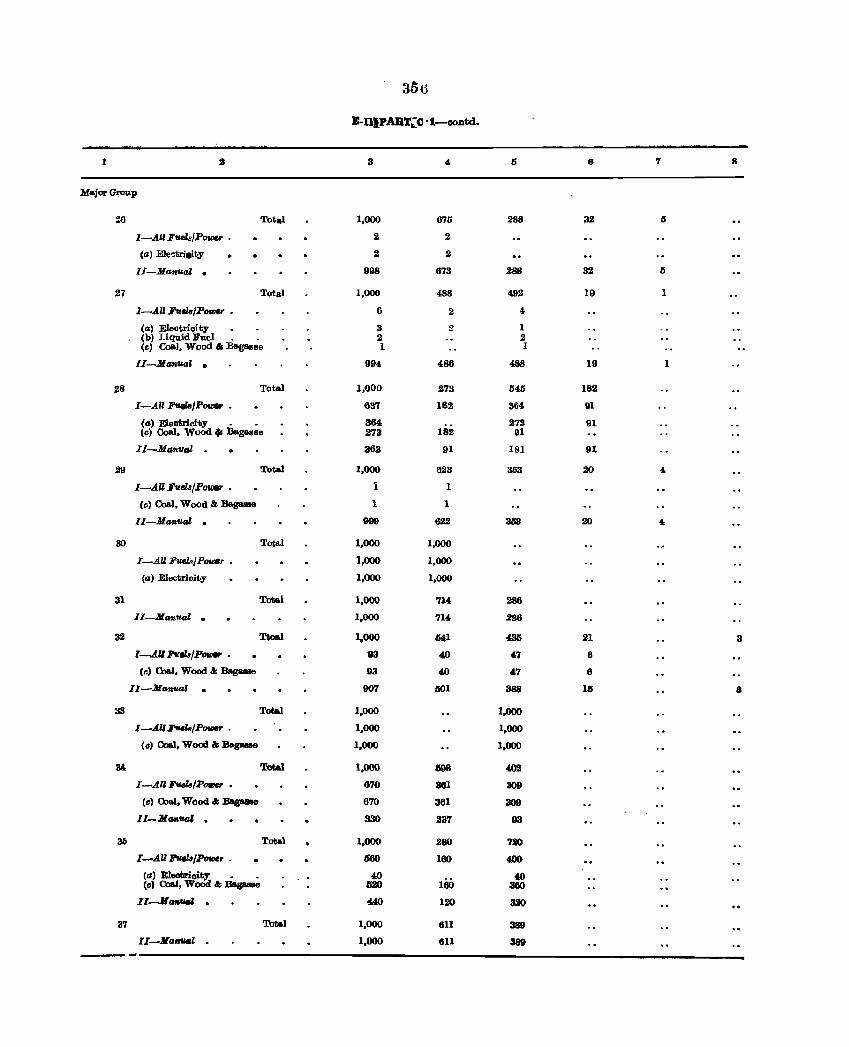
30u
B-nIPART~(l'1-oontd-
1 II 3 4. 5 6 7 8
Major Group
26 Total 1,000 675 288 ;J2 5
I-All FUeh/Power . 2 2
(a) Eleetrieity 2 2
II-M_uaJ · 998 673 288 32 5
27 Total 1,000 488 492 19 1
I-All FvIlB/P_ • 6 2 4-
(tI) Eleotrici ty 3 2 1 (b) Liquid Fuel . • 2 2 (t) Coal, Wood'" B&gasse 1 I
II-Man'UGl • 994 486 488 19 1
28 Total 1,000 273 545 182
I-All F'qIaIPOVJ8r • 637 182 364 91
{til E1eotricity • • 364 273 91 (e) Coal. Wood", Bagasse 273 182 91
II-Manval · 363 91 181 91
ll9 Total 1,000 623 353 20 4.
I-AU Fuels/Po,*, . 1 1
(e) Coal, Wood & Bas-e 1 1
II-ManuaJ · 999 622 353 20 4
30 To&&l 1,000 1,000
I_AU Fuel.olPodr • 1,000 1,000
(a) Electrioity 1,000 1.000
31 Total 1,000 714 286
II--Man'UGl . 1,000 714. 286
32 Tto&l 1.000 641 430 21 3
l-.A1I Fuels/PolDer • 93 40 47 6
(e) Coal, Wood & Bagaase 93 40 47 6
II-Manual 907 1101 388 III 3
33 Total 1.000 1,000
I -A.ll FUelB/POlDM' . 1,000 1.000
{e) Coal. Wood &:Bagasse 1.000 1,000
3& Total 1,000 61}8 402
I-AIIFusltJ/P_ • 670 861 309
(e) Ooal, Wood & BapIIee 670 361 309
II-Manual · 330 237 93
30 Total 1,000 280 720
I -A.U l'tIc18/l'ouJe~ . G60 160 400
(a) Eleotr.ioity • • 40 100 40
(e) Coal, Wood & Bagasse 520 360
Il-Mtmual · 4AO 120 320
37 Total 1,000 611 389
II-JlG",..' 1,000 61l 389
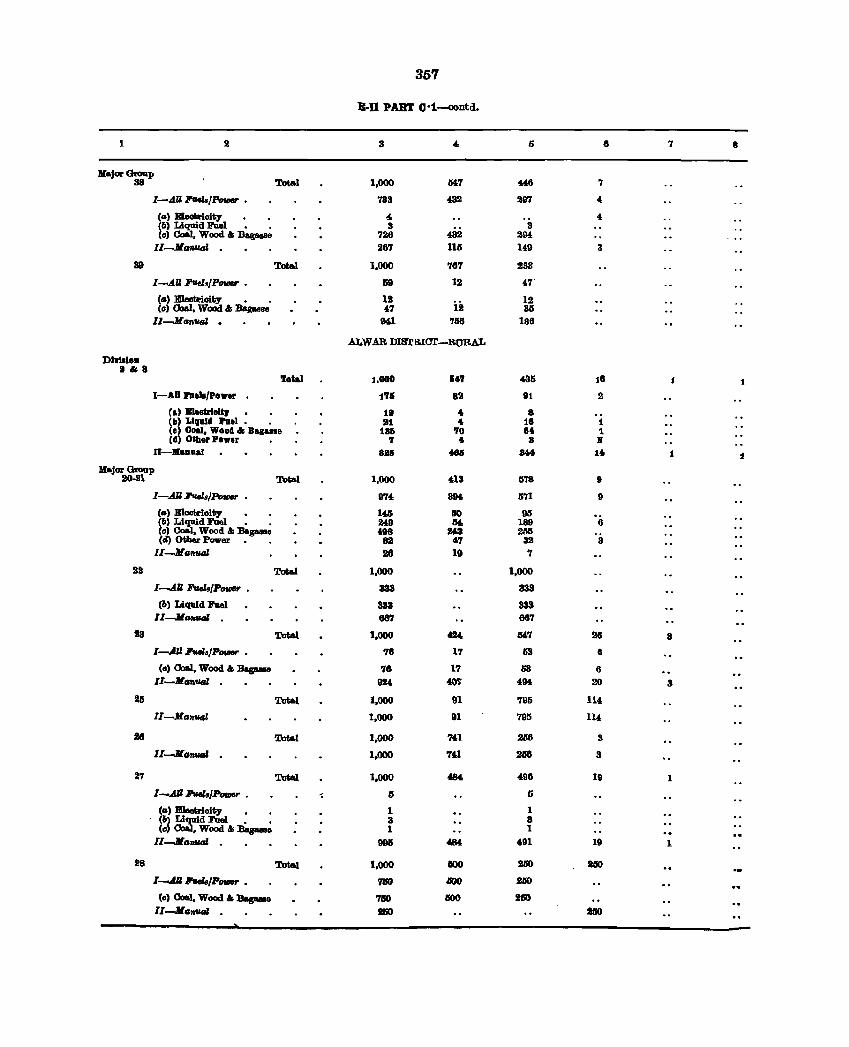
357
B-D PART O·1--contd.
1 2 3 4- 5 II 7 8
Major GlOllp 38 Total 1,000 lJ47 ~ 7
I-AD FtIcI&/Power • 733 432 297 4
(II) Eleobrioit)- 4 4 (1'1) Liquid Ptiel • , 3 3 (0) Coal, Wood '" B~ 726 432 294
II-MaAIIGI . 267 115 149 3
39 Total 1,000 767 283
I-.4D J'Uel./PovJer , 69 12 '7-
(a> Eleatrioit)- , , 11 12 (c) OcIal, Wood " Bagasse 4.7 12 3Ii
Il-J{anllGl . 94.1 '7116 186
ALWAR DISTRIO'r-BURAL
DI_I8I •• . ". Total 1.000 147 436 18 t 1
I-AD I'IItl8/Power 171 82 91 2
(a) B1letrlelt, 1a 4 8 (b) LI,1dd hel , 21 4 18 1 (e) Cloel, Wood" B,,&II. 186 70 II 1 (d) OUl.r Power 7 4 8 ..
II-lI[u.al 8al 48a 844 U. 1 1
UajorGmnp 00-21 Total 1,000 4-13 1178 9
I-AU Jl'..aa!P_ 9'7' 394 571 9
(a' Bleotrioit)- • , UIi 80 96 (1'1) Li 'd Fuel , , 24.9 64. 189 6 (0) a::s: Wood'" BagM88 '98 24.3 2lIG (4) Othw Power 81 '7 32 3
lI-ManllGl H 19 7
22 Total 1,000 1,000
I-AU FueIs/P_ , 333 ass (1'1) Liquid Fuel ass ass
lI-ManvaZ 68'1 687
t3 Total 1,000 424. 6&7 2e 3
I-.AU 1!'uJs/Power • 78 17 113 II
(II> Ooa.l, Wood '" BaguH 78 17 53 6 II-MfIM'IIGl 924 ~ 'IK 20 3
215 Total 1,000 91 795 11' ll-Ma'llual 1,000 91 795 114
i8 Tota.l 1,000 7£1 2118 3
II-JIan_ , 1,000 "I 2118 3
27 Total 1,000 4.M '98 19 1
l-.AU Hwhj"- , II IS
(a) Eleotrioity , , 1 1 - (b~ ~d FUel , • 3 3
(0 • Wood '" BapuB 1 1 Il-Man_ , 995 M4. 491 19 1
28 Total 1,000 GOO 2110 UO
1--'.11 I'rIels/P_ , 71fO lJOO 2110
(0) Coal, Wood '" Baga.e '71SO GOO 2150 II-JlanvaZ IIiO 2150
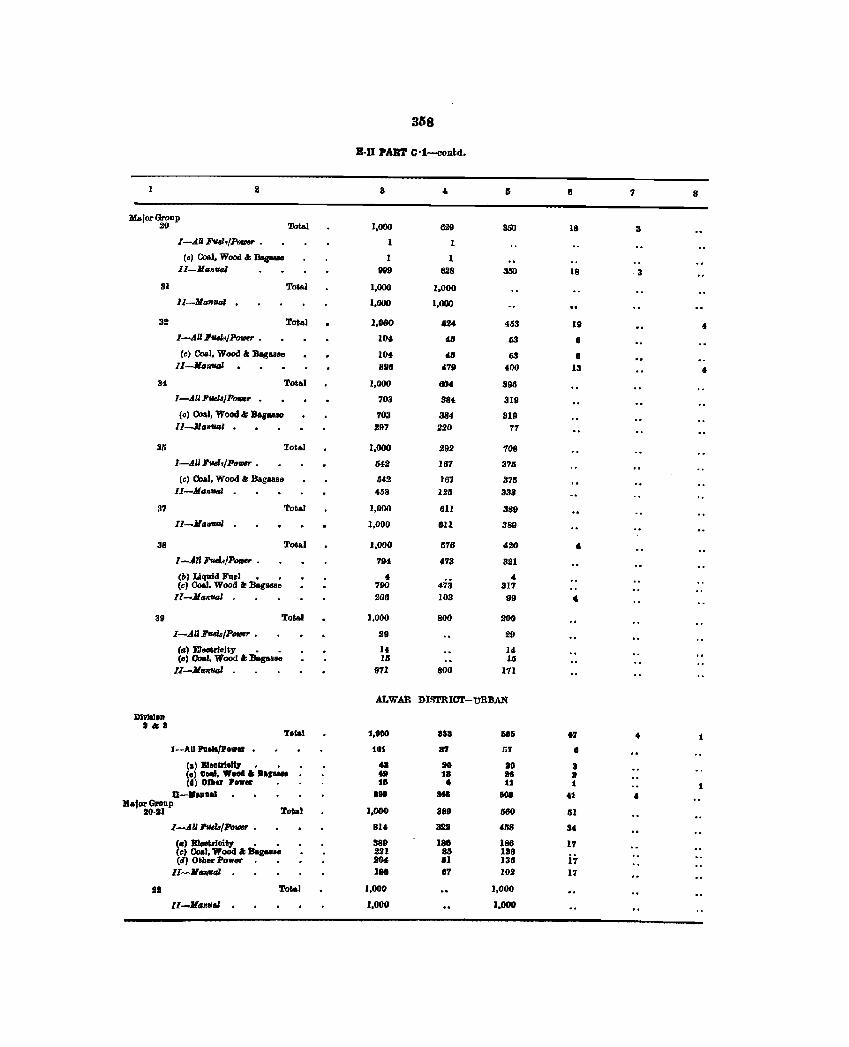
358
B-II PART C'f-COllM,
2 3 ... 6 8 7 8
Maior~ap Total 1,000 629 350 18 3
I-All F~ft1'rntJer _ 1 1
(.) Coal, Wood a: Bac-. 1 1 II-Af"nval (199 828 3IiO 18 -3
3) Total 1,000 1,000
lJ-AfaPJual 1,000 1,000
32 Total 1,000 IU 453 1(1 4 I-AUI'IId.jPawr _ 104 46 83 6
Cc) Coal, Wood " Bag ... e 104 46 83 6 lI-Af."fIIIl 896 4711 400 13 4
34 Total 1,000 604 396 I-AU J'vdI/1'rntJer _ 703 384 319
(c) Co .. I. Wooel & Bagllie 703 384 3111 II-JIsRfIIIl 297 220 77
36 Total 1,000 292 708
I-AU FIIel,/P"wr _ 642 167 376
(0) Coal, Wood'" Bagll80e 6012 167 376 II-Af."Bal 4118 126 333
97 Total 1,000 611 389 lI-Afs,. .. 1 1,000 811 389
38 Total 1,000 576 420 " I-All FwJ./P_, _ 794 0173 391
(b) Liquid Fael , • 4 473 4
(c) Coal, Wood" Bag_e 790 317 11-lI."val 206 103 99 "
39 Total 1,000 800 200
I-AU FudalP_r • 29 29
Cs) EI"otrieity - - 14 14 (c) Coal, Wood a: lJag"".e 15 16
Il-lienUtSl 971 800 171
ALW.Alt DISTRICT-uRBAN
:DIvllIOD ''''1 To'-1 1,000 183 IiII .7 • 1
I--AII Paill/p .. u tilt 37 57 • Cal BleeUlelIJ • • 4. 110 80 I (.) Coal, W ..... 8., ... e e 1. 118 » (') Oilier Powu t8 • 11 1 1.
I1-..... a1 8" III &08 41 .. MaforGroap
Total 1,000 389 680 iii . 20·111
I-AU lJ'fIIlslPo_ • 814 3211 4118 34
Cc) El.otrioity • • 389 lee J86 17 (c) Coal, Wood I: Bag .... 221 8lJ 138
H-(<I) Otber Power 204 III 138 11-Jl ... ."" 1 .. 67 102 17
sa Tot,,1 1,000 1,000
Il-J[,,,,,.sJ 1,000 1,000
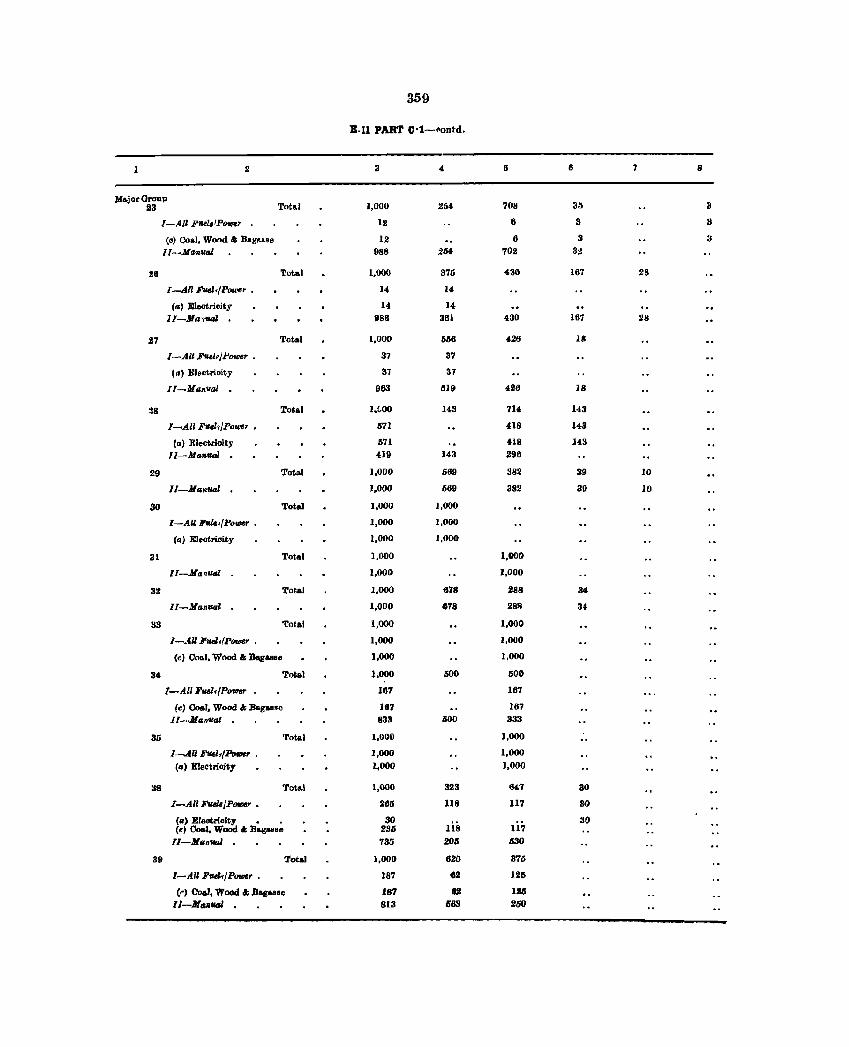
359
B-ll PART C·1-~ontd.
2 3 II 6 7 8
lIIajorGroup 23 Tot&! 1,000 21)4 708 311 3
I-All FueI8'P_r 12 6 3 3
(0) Coal, Wood" Bas" .. e 12 6 3 3
II-Ma"'IlfJl 988 2M 702 3~
26 Total 1,000 376 430 167 2S
I-A.II FutJ,{Pou~r • 14 14
(a) Elootrioity 14 14 II-MtnVG' 988 381 430 167 28
27 Total 1,000 568 426 18
I-All FUtJ,.jP_, • 37 37
(a) Electrioity 37 37
II_Manval 963 519 426 18
28 Total l"t.OO 149 714 143
I-A.lI F"el./Pou~r • 571 418 143
Ca) Electrioity 571 US 143
TJ-Ma"flal 419 14:J 296
29 Tota.l 1,000 569 382 39 10
ll-MaHtkll 1,000 569 382 31l 10
30 Total 1,000 1,000
I-AU Fttle,{PollJilr • 1,000 1,000
(a) Eleotricity 1,000 1,000
31 Total 1,000 1,000
ll-Manual 1,000 1,000
32 Total 1,000 678 288 34
Il-Manrsal 1,000 678 28~ 3~
33 Total 1,000 1,000
1-.'" FUtl.{P_r . 1,000 1,000
(c) Coa.I, Wood & Bag ...... 1,000 1,000
30& Tobl 1.000 500 500
l-Alll'veZ,/Po_ 167 167
(c) Coal, Wood 1& Bag ... e 187 167 Il-Man'llat 833 liOO 333
35 Total 1,000 1,000
I-All FlUI.fPolMr . 1,000 1,000
(a. Electrioity 1,000 1,000
38 Tot .. 1 1,000 323 647 SO
I-A.II Fv6UjP_r • 265 118 117 SO
(a) Electricity • . 30 lis
30 (e) Coal. Woad II; Bag ....... 2311 117
II-ManVGl . 735 201> 1130
39 Total 1,000 626 376
I-AU Fvel./POIMr • 187 62 126
ee) eo.J, Wood" Baga8le 187 112 126 ll-MsRWtIl . 813 663 260
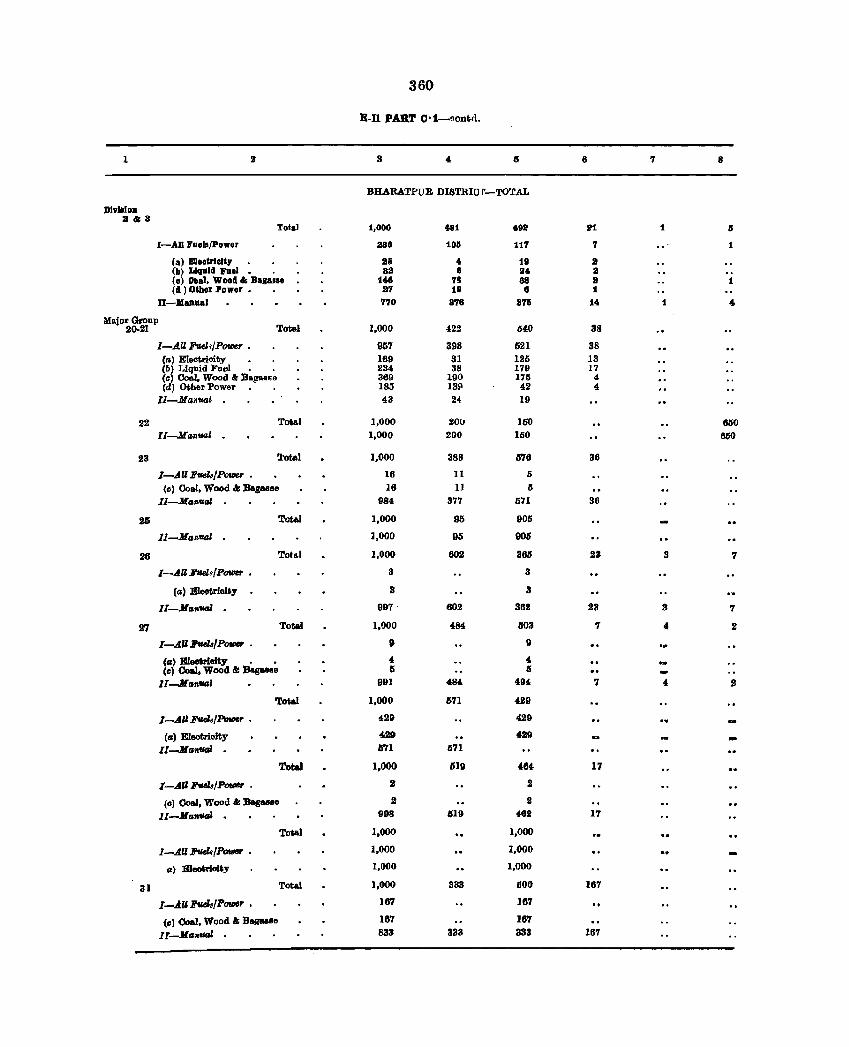
360
B-Il PART O·1-OJontd.
1 3 4- II 8 7 8
BHARATPUR DISTRla r-TOTAL
Dlvl.loD 3&8
Total 1,000 481 4911 :11 1 II
I-All FUBII/power 2180 105 117 7 .. 1
(a) Bleeb1aJty 86 4 18 II (b) Liquid Fael _ . as 8 S .. s (0) Ooal. Wood 81: Bagall8 141 7!! 88 2 t (11) Other Power. 21 18 8 1
11-IiBRaal 7'10 8'18 316 1 .. 1 4
Major Group 20-21 Total 1,000 422 640 38
I-All Fudi/POIDt.,. • 957 398 521 38 (a) Electrioity • • 169 31 126 13 (b) J,iquid Foel • . 234 38 179 17 (c) Coal, Wood'" B"l!"8se 369 190 175 4 Cd) Other Power 185 13P 42 4
II-Manllal 43 24 19
22 Total 1,000 200 160 MO II-Manual - 1,000 200 150 660
23 'J:otal 1,000 388 576 36
I-..dUFuel8/Pmoer . 16 II 5 (c) Coal, Wood .... BagASse 16 11 /)
II-.Man .. al 984 377 671 36
211 Total 1,000 95 905
Il-Jlanual ],000 95 905
26 Tohl.l 1,000 602 3M 23 3 7
I-AU J!uels{POIIIIlf' • 3 3
(II) EleotrioUy 3 3
II-Man'll4l - 997 602 362 23 3 '1
27 Total 1,000 484 1103 '1 .. 2
I-AU1ItIds!PolfM . 9 9
(CI) Hleetrielty • • 4 4 (c) Coal, Wood a: Bagule Ii IS
II -1L an'll4l 991 484 494 7 4 2
Total 1,000 1S71 429
I-AUPueJs/Pw!er . 429 429
(CI) Eleotrioity 429 4219 -I[-Manual - 1I7l 671
Total 1,000 .'H9 464- 17
I-All Ptuls/POUt&r • 2 2
(0) Coal, Wood 81: Baga.Be 2 2
11-Ma"vaI . 998 1119 482 17
Total 1,000 1,000
I-AUFueZa/P- • 1,000 1,000
a) E1eo'rioity 1,000 1,000
31 Total 1,000 333 600 167
I-AU :FtuJs/PC1U1B' • 167 167
(c) Coal, Wood a: Dagu8B 167 187
Il-MCI.vaI 833 333 333 167
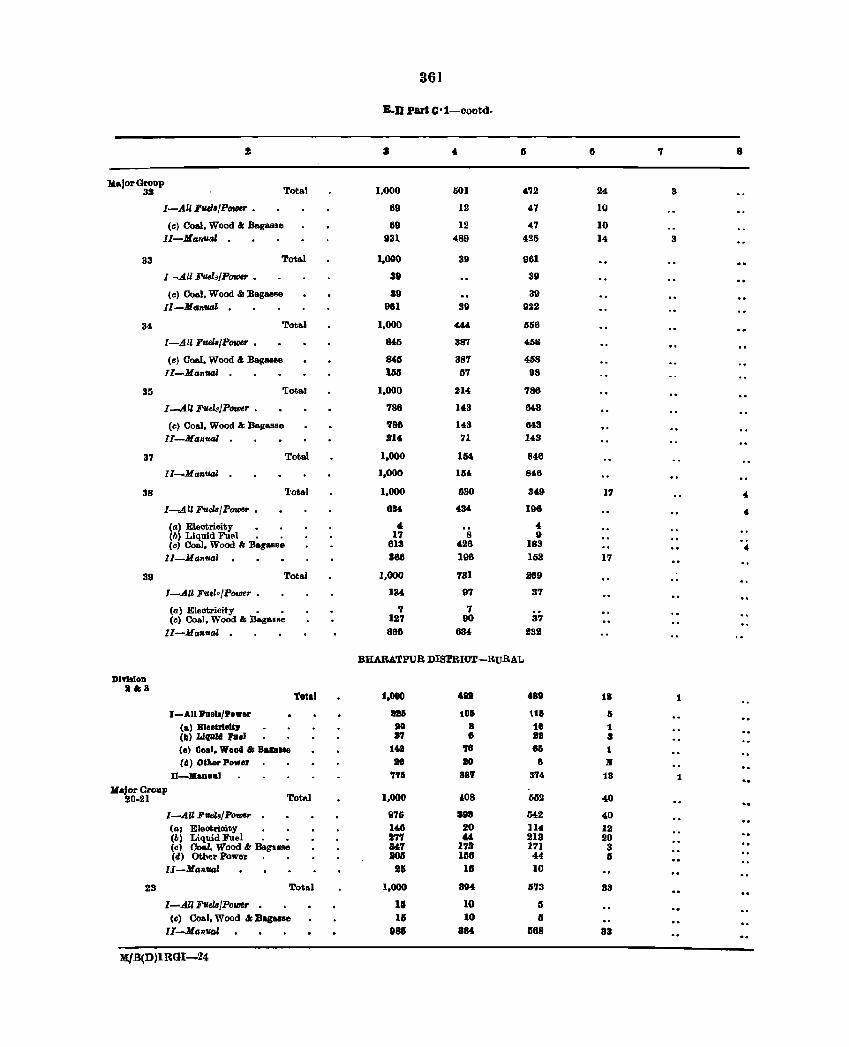
361
E·D PariO':1-00Dtc! •
• 6 '1 8
:MAjor Group 32 Total 1,000 601 ~'i2 24 3
I-All FfUl,/P_r • 89 III 47 10
(c) Coal, Wood &: Bagasse 89 12 47 10 lI-ManurJi 931 489 425 14 3
33 Total 1,000 39 961
I-All Fuei .• /POIDU • 39 39
(e) Coal, Wood &: Bagasse 39 39 II-}4Gnual 961 39 922
34 Total 1,000 «, 556
I-All Fuels/Power • 845 387 4511
(e) Coal, Wood .t Bagasse 845 387 468 II-ManUAl 1M 57 98
35 'rota! 1,000 214 786
[-All Fuels/Power. 786 143 643
(c) Coal, Wood &: Bagasse '186 143 643 II-Man1«Jl 214 71 143
37 Total 1,000 154 848
II-ManUAl 1,000 154 846
38 'I'etal 1,000 630 349 17 4
I--.dll Fuels/Power • 834 434 196 4-
(a) Eleotrioity 4 " (b) Liquid Fuel • • 17 8 9 Ccl Coal, Wood Ie :Bagasse 813 426 183 4-
II-Ma7luai 386 198 153 17
39 Total 1,000 731 269
l-AU Fuel,/Power • 1M 97 37
(a) Eleotricity • • ., 7 (cl Co .. l, Wood & Baga.Bse 127 00 37
II-Manual . 886 834 232
BHABATPUR DIS'lRICT-RuRAL
DI"llloD 1&8
Total 1.000 4.81 489 18 1
I-Alll'uall/Po ... r 1II11 1011 111 Ii
(a) Elee&rleltJ BCI a 111 1 (II) L1QIIIlI Puel 87 8 88 8 (e) Coal, Wood & Bala ... 1a ft 85 1 (d) Oaller Power ltII 10 B 11
II-Maoual '1711 887 874 18 1
Kajor GIoup Totl\l 1,000 &08 552 20.21 40
I-AU Fuel./Potoer 976 893 M2 40 (al Eleotricity Id 20 114 12 (b) Liquid Ftlel , • 27'1 « 213 20 (cl (',oal, Wood It BagasBe M7 173 171 3 (d) Otber Power 103 158 44 I
lI-ManuaZ 16 lIS 10
23 Tota.l 1,000 3H 173 33
I-All Fuel.8/Power . 11 10 6 (e) Coal, Wood It Baguee 16 10 II
lI-JlanuaZ 081 8840 1168 83
M/B(D)lRGI-24
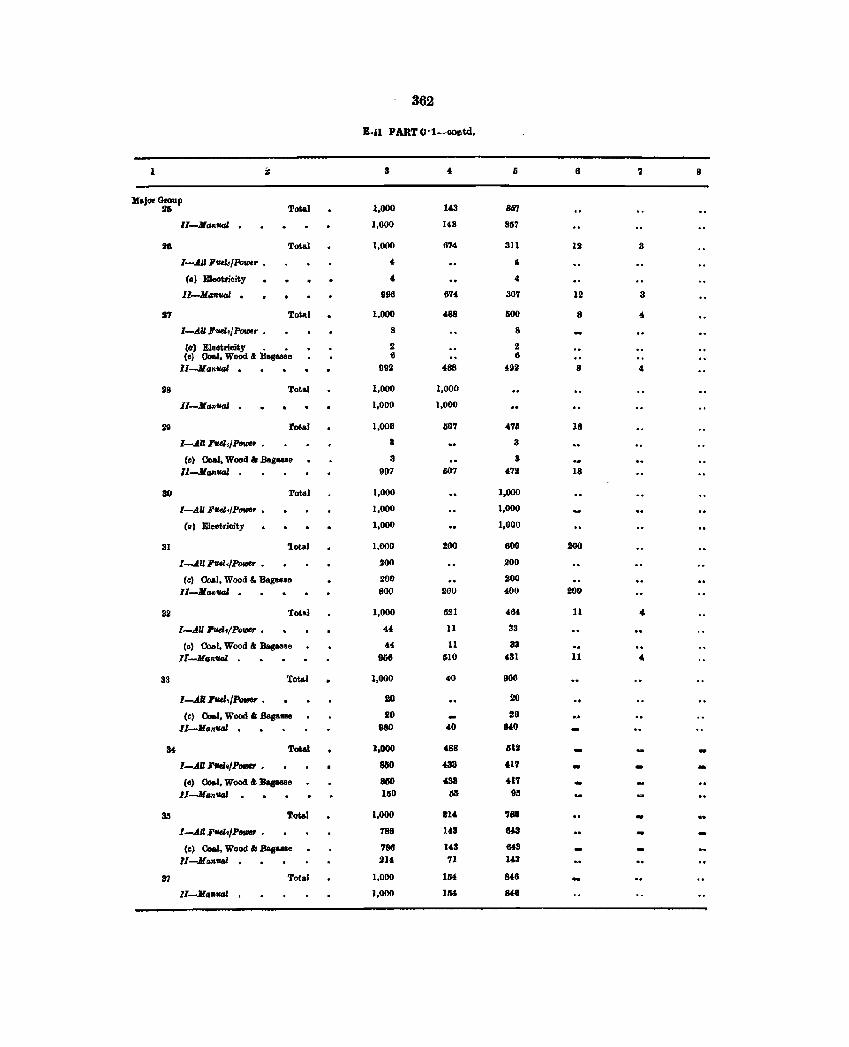
362
E." PART (l·1-OOIl.td.
! iii 8 " 6 7 1I
Major Group 26 Total 1,000 143 81i7
ll-J(Clnual . 1,000 148 857
M Total 1,000 674 311 12 II
l-.All FtUk/Powr • 4 , fa) EIeotriaity " 4
l1-M~V4l . 996 674 807 12 3
117 Total 1.000 4.88 IiOO 8 " I-AU F'lld4POVlO' • 8 8
(CI) E1eGtricity • • II II (c) 00.1, Wood &, Bagasse 6 6
lI-JlCI"tial . 992 488 !lO2 8 4
18 Total 1,000 1,000
Il-MClnfICIJ 1,000 1,000
29 rot, .. 1 1,000 607 418 18
I-All FwZ;j~ • 8 3
(e) 00aI. Wood I: BagauEl 3 3
ll-JIClnual 997 667 472 18
30 Total 1,000 1,000
I-AU Ffld4~r • 1,000 1,000
(Il) Eleotrioity 1,000 1,000
31 1.otal 1,000 200 600 200
I-AUPtUl4pot«, • 200 201)
(c) Coal, Wood &. Hagus" 200 200
ll-JIa.UtJ' . 800 200 400 1100
32 Total 1,000 521 484 11 4
I-AU ~./PouIer • 44 11 33
(c) Coal. Wood" Bat!: .... e '4 11 33
ll-Mallual 906 610 431 11 " 3S Tota.l 1,000 40 960
I--.tR F*l./"- , 10 20
Cc) Coa.I. Wood '" Bagasse 20 110
II-JlaoV4l 1180 .0 1140
Sol Total 1.000 488 612 -I-AU Fwl./1'rIr1er • 830 433 '17
(c) Coa.I. Wood &; :Bagasse lIIIO 433 417 II-Manual 1110 OIl 911
311 Total 1,000 IU' '181 -I-AR FtUl./P_ • 786 143 643
(c) Co.l, Wood I: Bagaate 786 143 648
II-Mo ... 214 71 U3
81 Total 1.000 1M 648
Il-M.1IUtJl 1,000 15' IW8
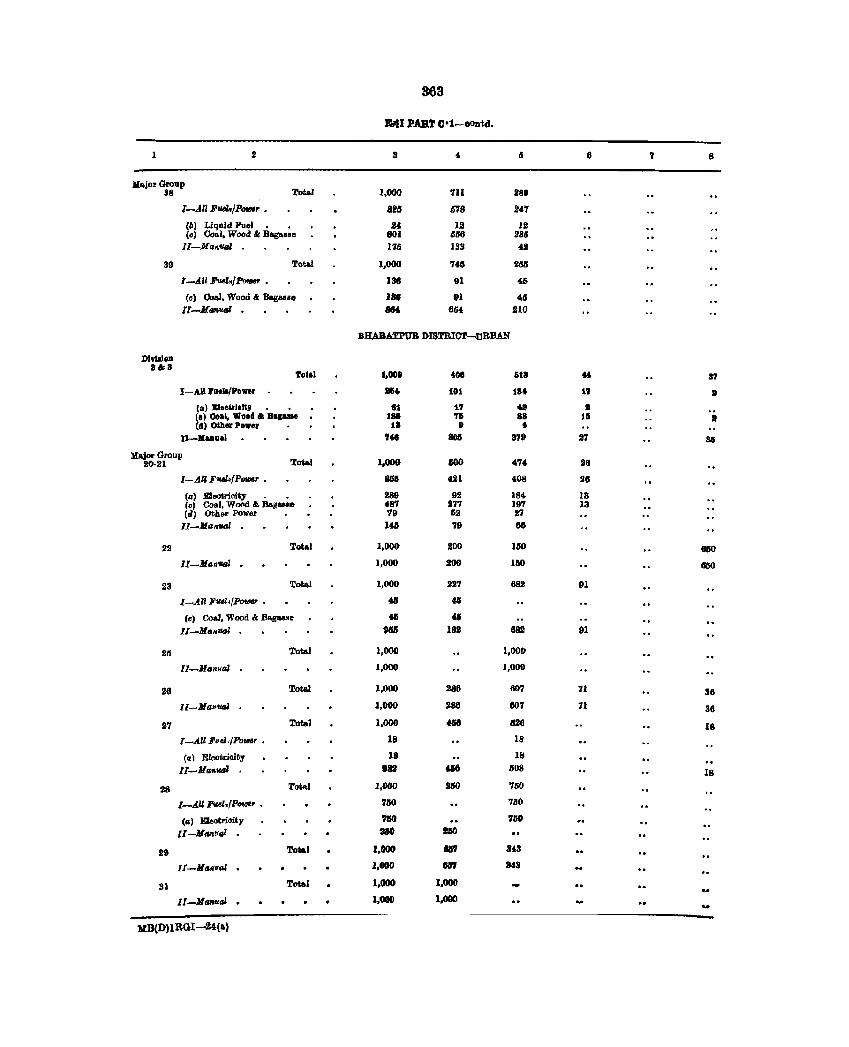
363
B!l1J PAllT C·1-oontd.
1 8 4 Ii II 'l 8
H&jorGroop 38 Total 1,000 '111 Jl89
1-,t11 PudsIP_, • 8211 M8 24'1
(6) Liquld Fuel. • Jl4 12 IJ1 (el Co .. I, Wood &I B ••• e 801 1l1l11 2aG
II-Man'll(Jl 1'15 133 4!1
39 Total 1,000 '1415 265
l-All J!'ud.f"_ • lY 91 45
(0) Coal. Wood &: BagM.e lao 91 45 11-J[anutll 8M 6114 lII0
BllABAfPUR DISTRICT-tlRBAN
J)lwJalOll 20118
TGI_1 1,000 toe lit8 .. 87
I-All luel.{'Dwer n. 101 181 1'1 8
tal EloeirleSt, . • 81 17 401 II (e) OlIal, Wood III Ba.a .. 180 .,..
88 111 8 (d) OUter PGwer la t I
I1-.... ul '1M lIOII 879 2'1 811
Major Group Total 1,000 100 "4 26 20·21
I-All Fual.{P_r • 866 t21 408 lUI
ta) Eleotrioity . • 289 92 184 13 Ic) Coal, Wood &: Ba,!!lIIIle 48'1 277 19'1 13 (oil Other PoWM '19 112 2'1
II-Ma.IIva1 141> 79 08
22 Total 1,000 200 160 8110
ll-Manfl4l . 1,000 200 1110 8150
23 Total 1,000 2111' 682 91
I-AU FtU)'IPow, • 48 4Ii
(c) Coal, Wood &: Bagllllse 48 48
ll-Ma.nrJtJl hi 182 682 91
211 Total 1,000 1,000
l1-Ma1!u~ 1,000 1,000
26 Total 1,000 286 607 71 36
l1-Ma"~ 1,000 '86 607 71 36
27 Total 1,000 4811 12e 18
I_All FuoJ4Powr • 18 18
(IZ) Eleotrioity 18 18
II-Mrmll4l 982 4811 608 18
28 Tobl 1,000 JSO '1ll(}
I-AU l'tIa,{Powe, • 7SO 'IJD
<al EIeotrioity 7&0 760 I1-M"~!lGl · 2110 1110
29 Total 1,000 l1li7 343
II-lisoval · 1,000 H'l 843
31 TGta.1 1,000 1,000
I1-Man'llal · 1,000 1.000 --llB(D)lRGI--24(a)
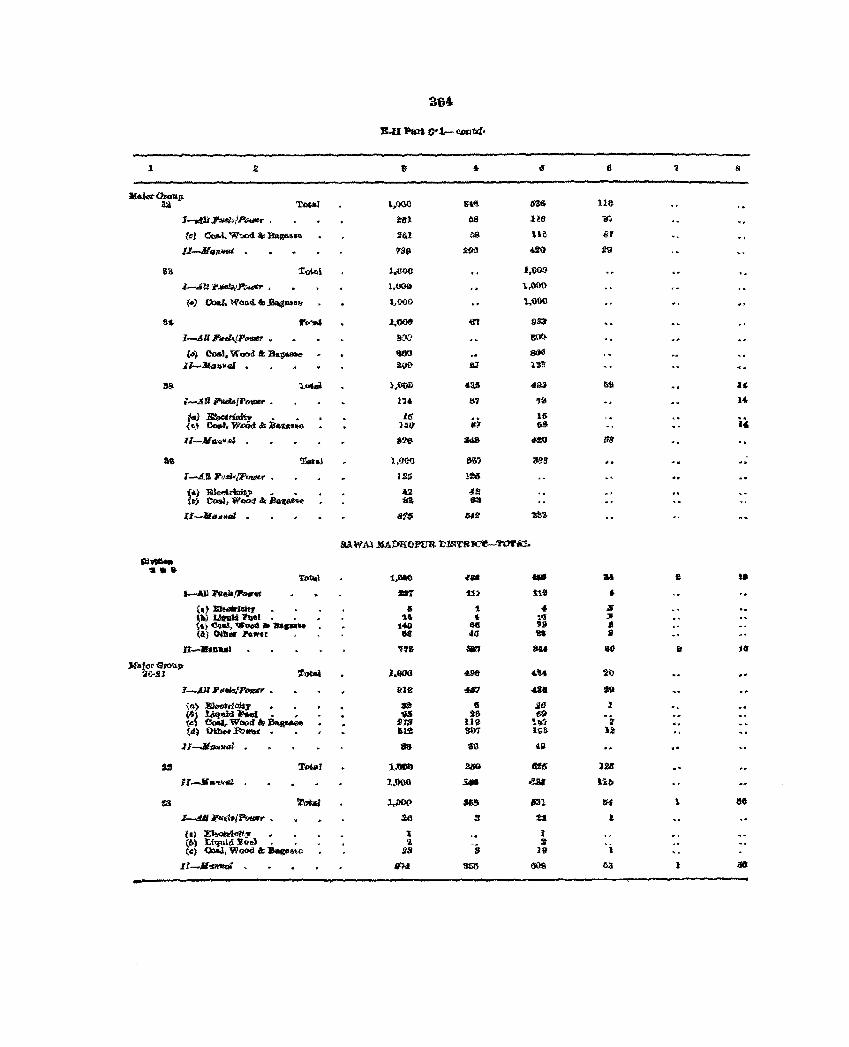
tJ6'
B.I1 ~ O·l-~·
.1 .2 11 i- t'! e 'i
~aida-p. 52 Total l~OOO SU Mit 11&
1-.dliP~JP_ . iill tIS 118 ;r.
{cJ 00M. Wood '" ~ ..... ~.u as ue ;n 11-41 __
· 739 200 4S0 f9
B1I :l:~i J,.(IOO 1,000
z ........ :: l'~p-....". • 1,000 ~,0(j{)
f"i CoIU'. WOG<l61 ~lIlIs" 1,000 1.1lOO
at- "'" . ..., 1.0Q(I 'Il'l 9&'1
J-.611ht!AjP_ • S-X1 S(fu
(010) 00&1, Wood .t: B&g68Oe llOO M6 .lI-M(J~waI · 2W 81 l~r;
38 'l.. .... 1,00» 435 4l}3 fA! ,,(
I-Jut """fP-~ . 1':'4 81 "3 14.-
t<sJ ~~ ~ • liS 11> if. ,.) c-J. W4)Qd '" l!&us.e 1411' 1t1 tJ~
U-MGiJ> ... /1i f2tl $,ill ft(I 171]
Il\\ T •• h, 1,QOO &1;, 0011
t-AII "~B'l~r • us !:!ii
(.:; Eleet.rinifo> • • ti 4.2 (~j QOSII. W«>d 4 Ba'(Il£~" fi3; S3
II--MIi.,.ql · 816 US ~?
IlAWAl XAPEO!'L'1t. D1."lTBK"l'--'I"OI'A>
Cl ..... ,. .. 7"0'-1 1.,CMO ~U: -- 1M a 18
I-All l'Itab. .,..._. .. , :!!ItT jj:) 1.~' .. (.} :zJ..-tI!dt, . IS t 4 ]I (~) tdll1i1li .,_., 1.4- • 111 JI. ~.} Cl9&!, WPOO .......... .t4G .$IS '9 11 ("1 OjJItIF Powu 68 fa 'K '*
n-.uul '1"'1$ ., 1111 811 it .0 J,f.lor GtoI1Jt
2IJ-.lI1 ~ 1.000 491J .. ~ tt>
l-AU '''''!tlPt1elr • @12 go .... j\l
<; n> lIlhwtriD#J" • • # Ii :all 1 (6 ~lNeS. , 'f5 "' 69 (,,{ e.,e" wo(u! 1& B>.~ 1113 U0 'it.'j ';-{<J) O\heor'p,o_. • au 807 l".a U
l! -Jia.olltll 83 81} 411
as ToUt! 1))Db 20'10 UIr U!
1"f_Jl ..... ...a 1.000 $.til ear lib
118 'Z'ot.V l,.tJ(l(I :169 131 IU 1 l!6
L-4Jl ~d~i,_.. , .206 3 :u 1
f.) ~.y • • 1 1 <I» Li'flll.d y,.,,). . 'i. so (0:) <loe.I. Wood k ~ne is 3 1& 1
.ll-llSl'lftOl < 11M 35!5 fl(I9 63 I -
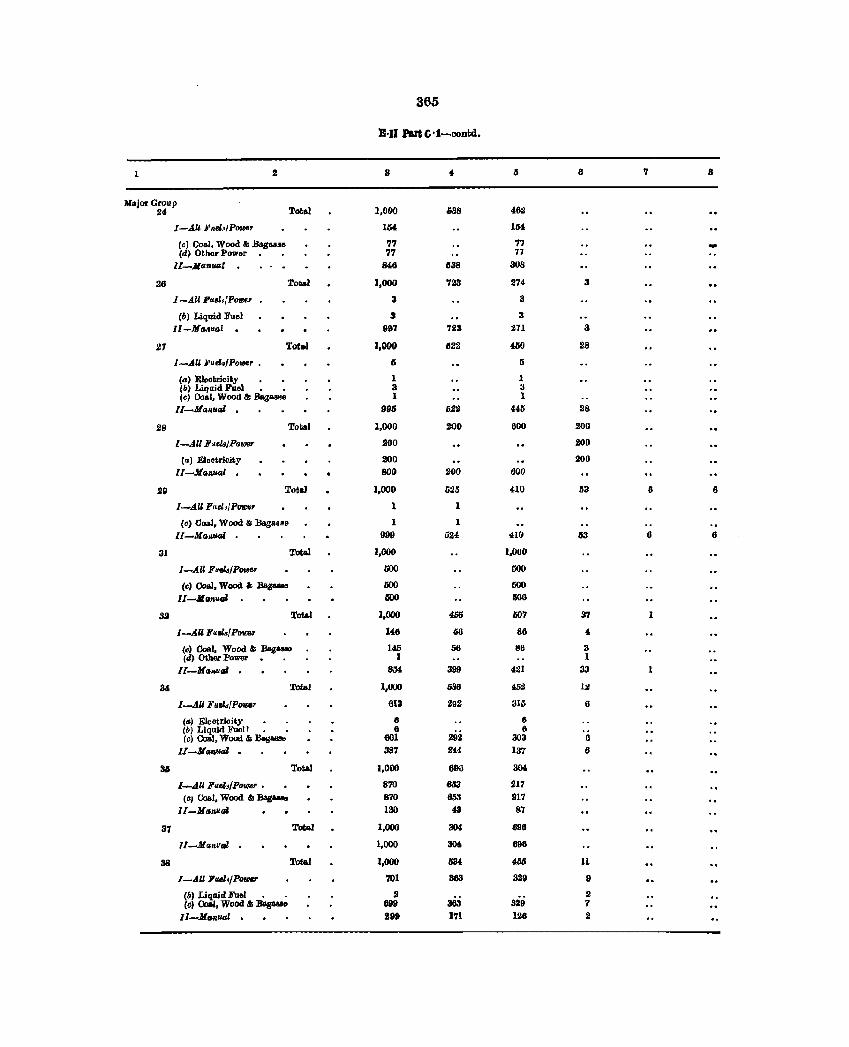
365
B·II'ar&Ci·:I-coDtd.
1 2 3 8 '1 8
Major Group 24 Tot",1 1,000 SS8 46;1
I-AU Fnu.'fP_' 1M 1M
(c) Coal, Wood & .Bagll8le '17 77 -(d) Other Power. • 77 77
ll-Ata,.usl 848 638 308
28 TObl 1,000 '123 274 3
I -A.U l'uu,fPOIM.' • 3 3
(b) Liquid Fuel 3 3
Il-.lI(rJ1IU41 . 997 723 271 3
27 Toea.! 1,000 622 4110 28
I-AU Fuel.fPowe, • Ii Ii
(a) EleohrioUy 1 1 (0) Liqllid Fuel • • 3 3 (e) Ooal, Wood & .Bag ... e 1 1
11-.11",,,,,,,. 998 52;1 445 28
28 Total 1,000 200 600 200
I-.tll Fuel&/PoW8l' 200 200
(0) Electricity 200 200
ll-M a,lIM",1 . 800 200 600
29 To6a] 1,000 SlI5 no 53 6 6
I-AU I'flel,/P_, 1 1
(0) Coal, Wood &; Bagssae 1 1
ll-Ma, . ..uu.l 999 524 410 63 8 8
31 To6al 1,000 1,000
I-AU Fuel.IPower GOO 500
(c) Coal, Wood I; Bagasse GOO GOO
II-At",,.,,u.l 600 000
as Total 1,000 4S5 1S07 37
I-AU l'uelafPD'I£8' 148 66 88 " (c) Coal, Wood I; Bag_ 145 56 86 3 (d) Other Power. . I 1
ll-Mrr",I1."" 854 399 4;11 33
34 To6aI 1,000 636 4.5:! 12
I_4U Fuel..fPOWlr 813 292 :H5 6
(4) Eleatrioity 6 6 (6) Liquid Fuflll • 6
292 8
(c) Coal, Wood &; :&s- 601 303 6
II-M_"" . 387 2« 137 8
3a Total 1,000 696 304
I-AU Fuel,/P_, • 870 &3 217 (ci Coal, Wood & Bag ...... 870 853 217
ll-.lI(rJllIl.u.l 130 43 87
37 To6a! 1,000 304 898
[/_.lI("'Ru.1 1,000 304 696
38 Total 1,000 534 45S 11
I-All Fud'IPol/IC, 701 383 329 II
(0) Liquid Fuel . • 2 2 Ccl Coal, Wood &; Bagaul' 099 363 3.29 7
Il-ManUGl . liDO 171 1.26 2
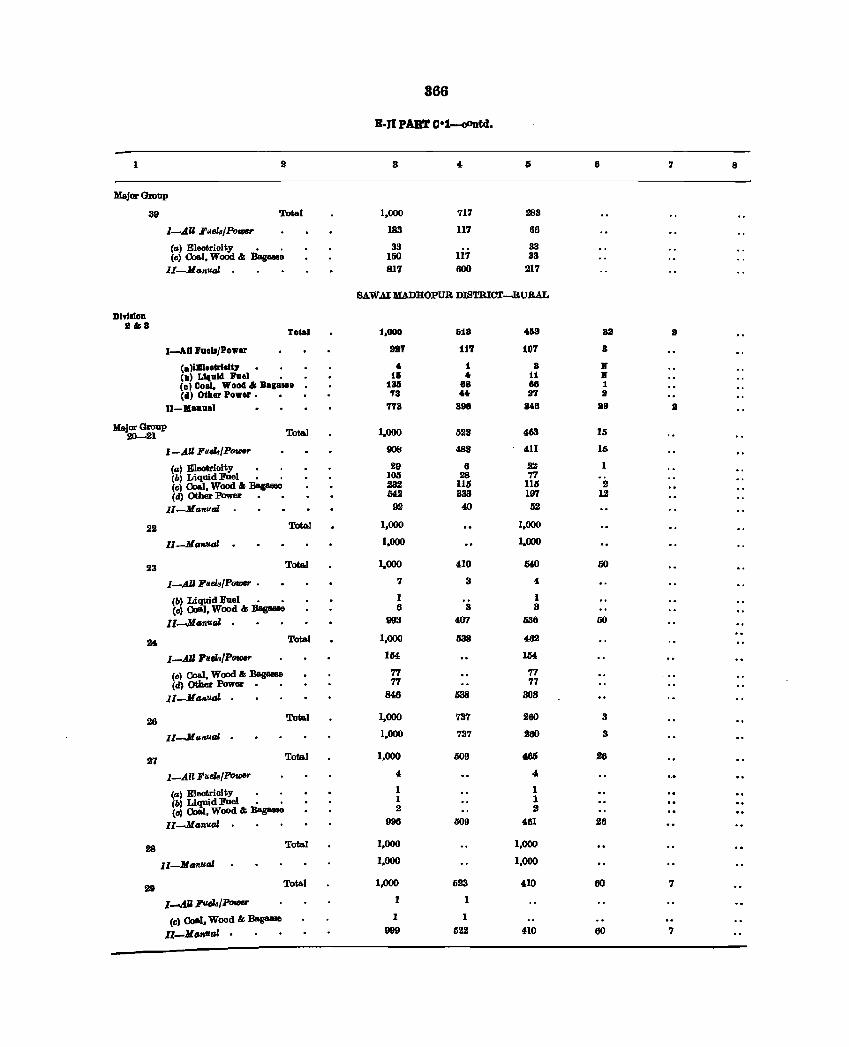
366
E·n PART O·1-cOJltd.
1 2 8 6 7 8
M&jorGroup
39 Total 1,000 717 283
I-AU Fuela/PoVJ8f' 183 117 66
(a) Eleok-ioity • • 33 33 (c) 00&1, Wood. &; &g_ 100 117 33
II-Manual 817 600 217
SAW..u MADROPUR DISTRICT-RURAL
01'1'111011 1&8
Tolal :1,000 618 468 8a a
I-Ad laall/Power 917 117 107 3
(a }iBleetrialiJ' .. 1 8 .. (b) LIquid. PUll • 16 4r 11 II' (e) Coal, Wood & B.' .... 136 88 86 1 (d.) Oth.r Power • 78 4. 2'1 II
1I-lII£anu.l 773 388 818 IIIJ 1
Major Group 20-21 Total 1,000 522 463 15
I-AU Fu.z./P0VJ8r 908 482 4.11 16
(a) Eleotrioity 29 6 22 1 (b) Liquid Fuel • • 105 28 77 (0) (Joal, Wood. & :BagaiJBe 232 115 Ill, 2 (d) Other Power • • M2 333 197 12
II-Manual 92 40 52
22 Total 1,000 1,000
II-Manual 1,000 1.000
23 TotaJ 1,000 4.10 OW 50
I-AU Fuela/P_ • 7 3 4
(b) Liquid Fuel • • 1 1 (0) (loal, Wood & BagaMe 6 3 3
Il-JIGnliI/J 993 407 li38 50
lWo Total 1,000 538 482
I-All FuelalPotDer 154 154
(c) Coa.l, Wood &;:sag- 77 77 (d) Other Power. • 77 77
II_M"'liutJZ . 846 538 308
26 Total 1,000 737 260 3
lI--MaliuaJ 1,000 737 260 3
27 Total 1,000 509 4M 26
I-All Fuels/PoVJ8r 4 4:
(al EJeotrioity 1 1 (b) Liquid Fuel • • 1 1 (c) (Joal, Wood & ~ 2 2
lI-ManuaJ 996 508 461 26
28 Total 1,000 1,000
II-Manual 1,000 1,000
29 Total 1,000 li23 4.10 60 7
l-AI Futk/Pouler 1 1
(c) (Joal, Wood & BagaMB 1 1
l'-JC ClRual . 999 liS2 410 60 '1
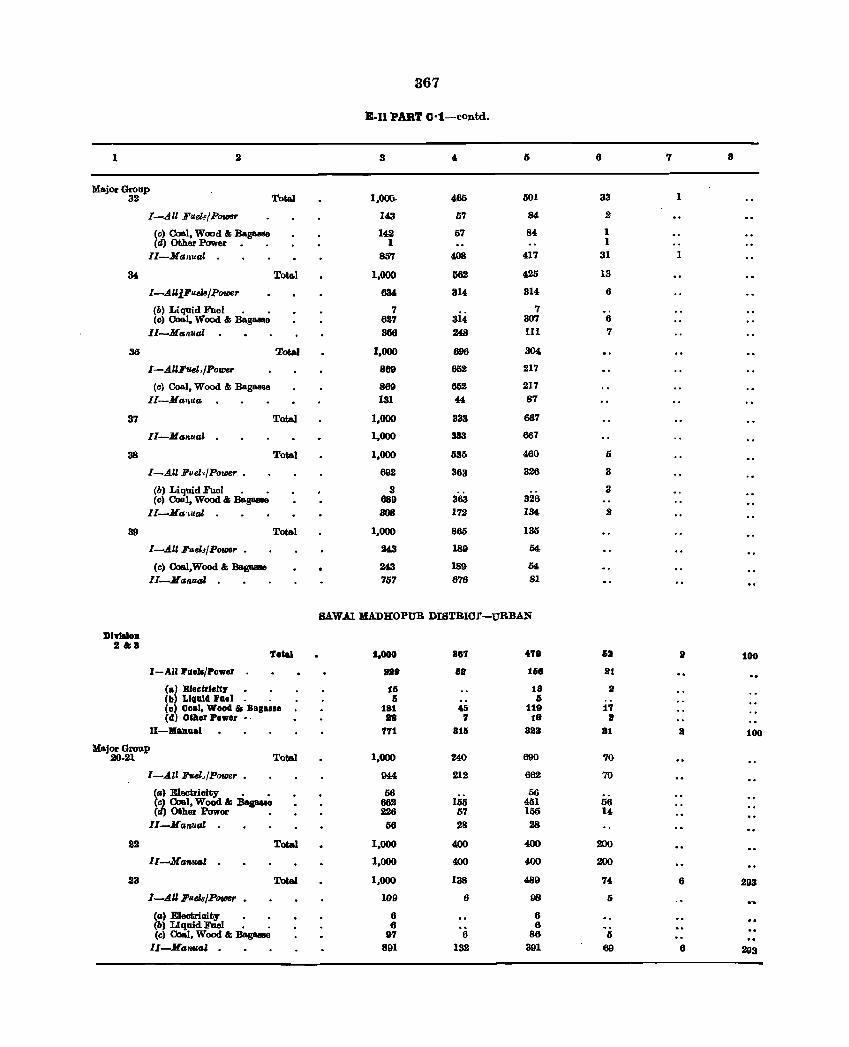
367
B-Il POT C·1-contd.
1 2 3 6 7 8
Major Group 32 Total 1,000- 405 501 33 1
l-.All FusZ./Potoer 143 57 84 .2
(c) Coal, Wood & Bagasaa 142 67 84 1 (d) Other Power. . 1 1
II-M"nual 857 WI 417 31 1
34. Total 1,000 G62 420 13
I-AUi Fuels/P01JI6,. 634 314 314 6
(b) Liquid Fuel • • 7 7 (c) Coal, Wood & Bagaaae 627 314 307 6
II-Mu.Ttual 366 248 111 7
33 Total 1,000 696 304,
I-AUFueJ;/Power 869 602 217
(c) Coal, Wood & Bag_ 869 652 217 II-Ma'luq, 131 44 87
37 Total 1,000 333 667
Il-Mu.1I.ual 1,000 333 667
38 Total 1,000 635 460 5
I-AU FusZ./Power . 692 363 326 3
(b) Liquid Fuel • • 3 3 (c) Coal, Wood & Ba.g_ 689 363 326
II-Ma.·wal 308 172 134 .2
39 Total 1,000 860 135
I-AU Fuel./Power • 243 189 54
(c) Coal,Wood & Bag_ 243 189 54
lI-M,,"ual 757 676 81
BAWAI MADHOPUR DIBTBICf-URBAN
DI.laloD .2 &8
Total 1,000 887 478 &8 a 100
I-AU "'De~/Po."er He liB 1&8 lit
(a) Eleetrfelt:r 1& 18 a (b) Liquid I'uel I) Ii (c) Coal, Wood 85 Bagule 181 45 119 17 (d) Other Power •. as 7 18 a
II-Manual 771 815 883 81 It 100
Major Group 20·21 Total 1,000 240 690 70
I-All FuelJ,POfDer 944 212 662 70
(II) Electrioity • • 66 155
56 (~ Coal, WoOd & Bagaeae 662 4111 66 ( Other Power • 2.26 57 155 14
Il-Mallual 66 28 28
22 Total 1.000 400 400 200
lI-MII1I1UI1 1,000 400 400 200
23 Total 1,000 138 489 7. 6 293
I-A.U FlleI8/P01JI6r • 109 6 98 6
(II) Eleotrioity 6 6 (b) LIquid Fuel • • 6 6 (c) Coal, Wood & Bagaaae D'7 6 86 5
lI-M"Il_l . 891 132 391 69 6 293
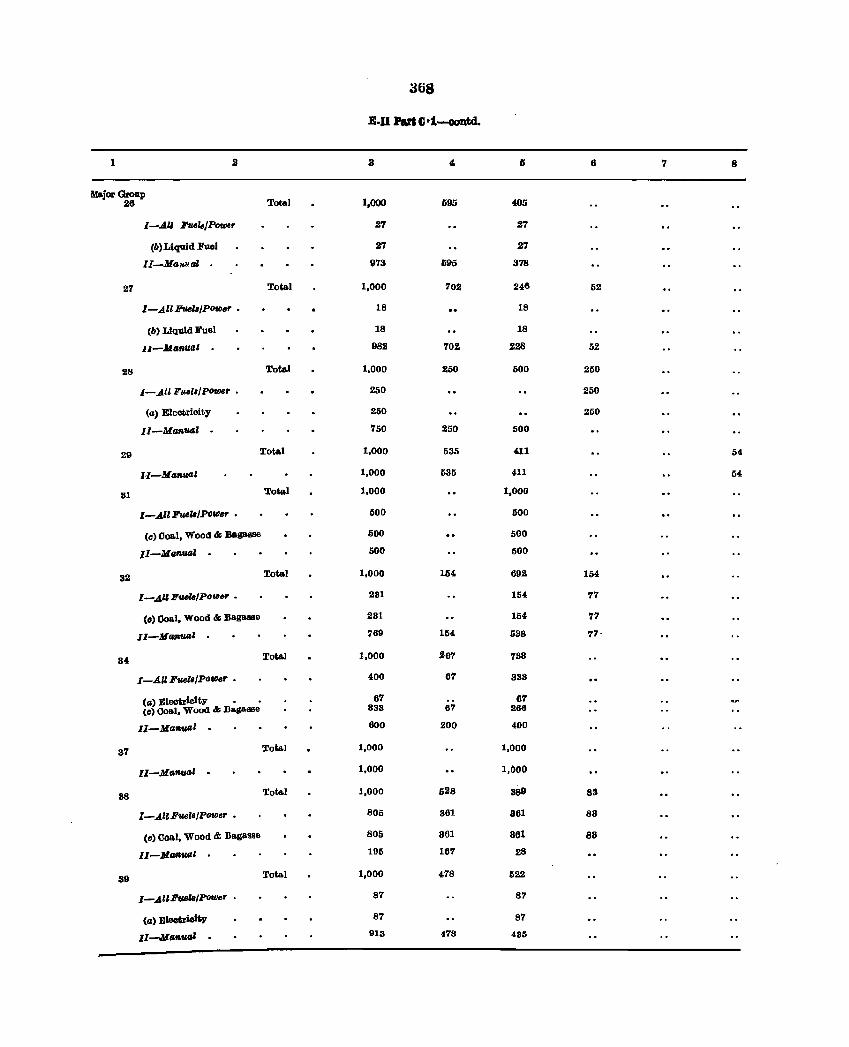
368
E·II Pan O·1--c1OQtd.
1 2 3 4 6 6 7 8
Major Groap 26 Total 1,000 595 405
I-AU Fvel8/ POfI)er 27 27
(b) Liquid Fuel 27 27
I[-Manual 973 595 378
27 Total 1,000 702 246 52
I-All 1J'UelI/pofll6r • 18 18
(6) LIquid Fuel 18 18
u-Manual 982 702 228 52
28 Tota.l 1,000 250 500 250
I-All Fu61./polIJsr • 250 250
(a) Eleotrioity 2liO 250
Il-MaRV41 . 7liO 250 500
29 Total 1,000 535 411 54.
H-Manual 1,000 535 411 54
Ul Total 1,000 1,000
I-AIlFUtlZI/Pofllsr • 500 500
(0) Coal, Wood & Bagasse 500 500
II-MGflual · 500 500
32 Total 1,000 154 602 154
l_AllFueZ./POIIJBr • 281 154 77
(e) 00801, Wood & Bagasse 281 154 77
II-14_ua' 769 154 538 77-
34 Total 1,000 267 738
I-AU FUtIZI/poUJer • 400 67 888
(a) Blectriclty • • 67 67 (c) 00801, Wood & Bapsse 383 67 266
II-Man"",l · 600 200 400
37 Total 1,000 1,000
II-MaR""" · 1,000 1,000
88 Total 1,000 528 389 83
l-AIlFue •• /poUJer • 805 861 861 83
(0) Ooal, Wood & Bagasse 805 861 361 88
II-MtJfW.IJl 195 167 28
39 Total 1,000 478 522
I-AUFUtIZI/E'OWer 87 87
(a) Bleotriolty 87 87
Il-MaRwII 013 478 435
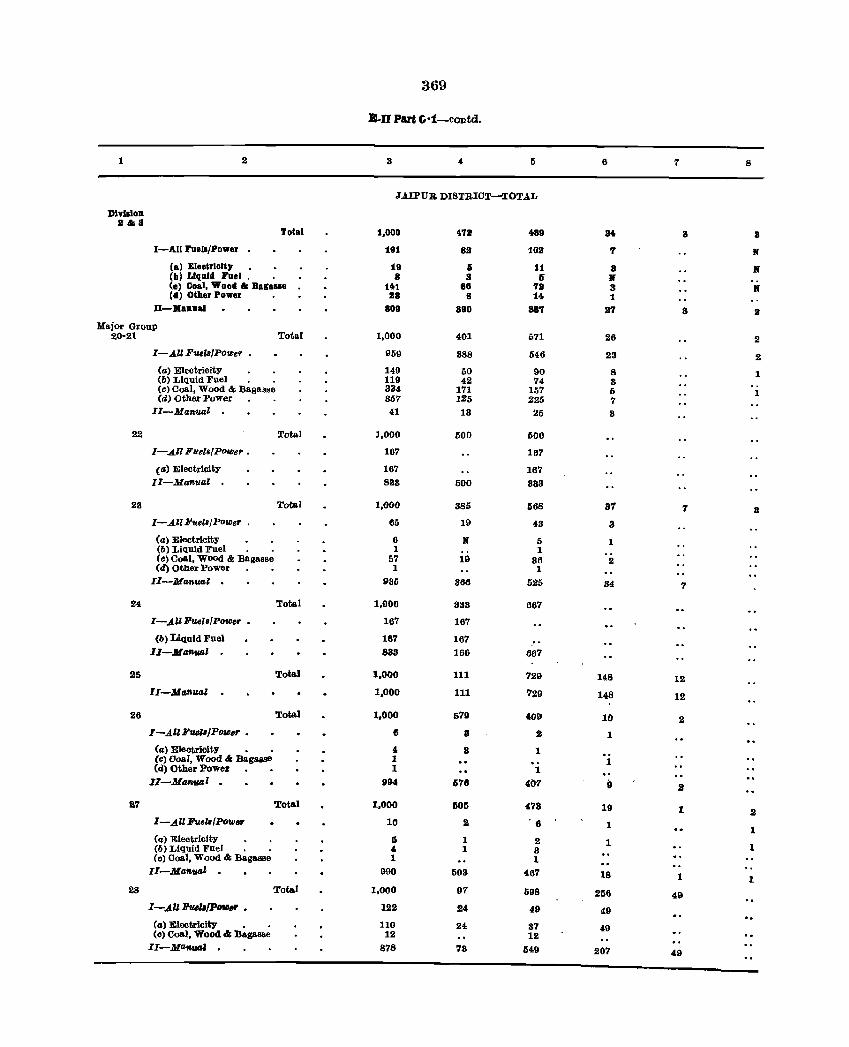
369
B-II Pan C·1-COJltd.
1 2 3 4 5 6 7 8
JAlPUR DISTRICT-TOTAL
Dlvl.ioD. 2&3
Total 1,000 4'13 489 84 a 8
I-All Fuell/Power 191 S3 103 'I N
(a) Eleotrlclt,. 19 5 11 3 If (b) LIQuid Fuel . 8 3 6" If (a) Coal, Wood & Bagal.a 141 66 '12 3 N (d) Other Power 118 S 14 1
II-llanual S09 890 88'1 11'1 8 II
Major Group 20-21 Total 1,000 401 671 26 2
I-AU FuelBf Power • 959 388 546 23 2 Cal Electricity 149 60 90 8 1 (b) Liquid Fuel 119 42 74 3 (c) Coal, Wood & Bagnsse 334 171 157 5 1 Cd) Other Power 857 125 225 7
II-Mo'llU,01 41 13 25 8
22 Total 1,000 500 500
I-All Fuel,/powe" . 167 187
(a) Electricity 167 167 II-Manual 833 500 333
23 Total 1,000 385 568 37 7 8 I-AllFuelB/Power . 65 19 48 3
(a) Electricity 6 If 5 1 (b) Liquid Fuel 1 1 (c) Coal, Wood & :Bagasse 57 19 86 2 (d) Other Power 1 1
II-Manual 936 366 525 84 7
24 Total 1,000 333 667
I-.AlZFuel.fPowllr • 167 167
(b) Liquid Fuel 167 167 .. II-Mafl.t.llJ.l · 833 166 667
25 Total 1,000 111 729 148 12
lI-ManwJl 1,000 111 729 148 12
26 Total 1,000 579 409 10 2 I-AllFueu/PowlW • 6 8 .2 1
(a) Electricity • • 4 8 1 (C) Ooal, Wood &: Baga.1ID 1 o. 1 (d) Other Power 1 1
II-Manual · 994 576 407 " .2
27 Total 1,000 605 473 19 1 .2 I-All FuclB/PowlW 10 2 ·6 1 1 (a) Electricity 5 1 2 1 (I) Liquid Fuel 4 1 3 1 (c) Coal, Wood & :Bagasse 1 1
II-Manual · 990 503 467 18 1 1 28 Total 1,000 97 598 256 49
I-.AU FuellIPOfI)" • 122 24 49 49
(a) Electricity 110 24 37 49 (c) Coal, Wood &: Bagasse 12 12
lI-Mafl.t.llJ.l · 878 78 54.9 207 49
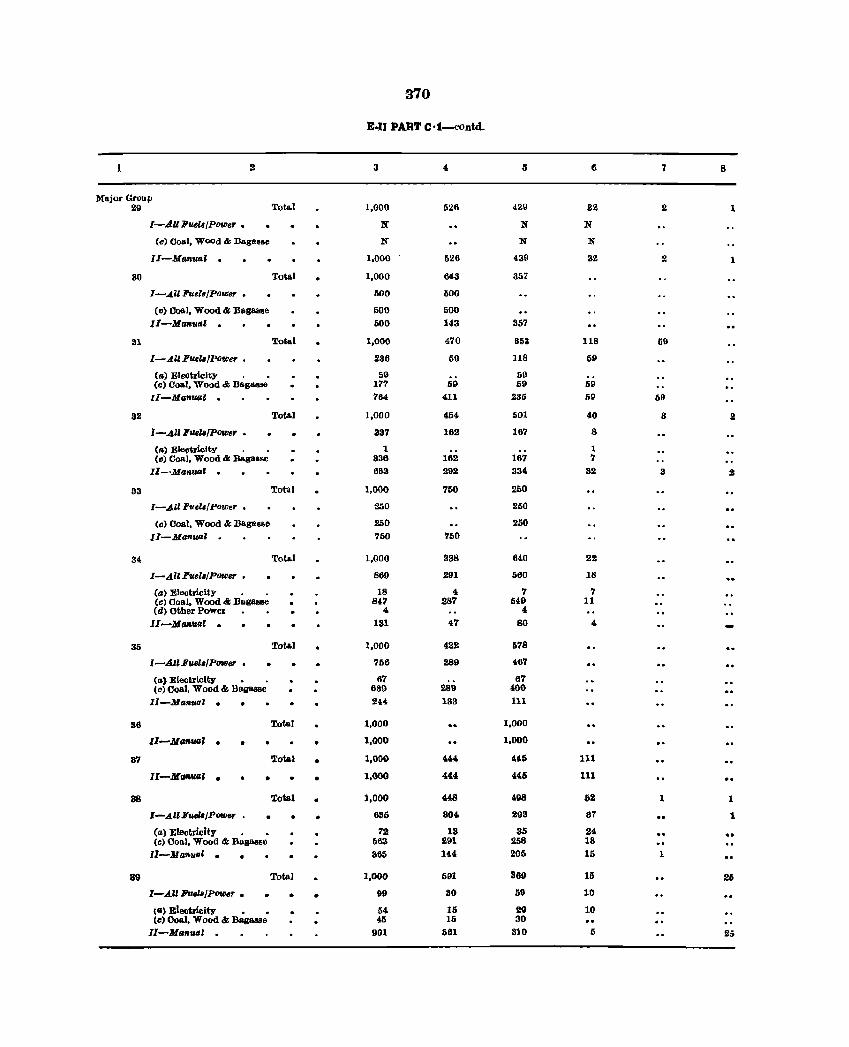
370
E.n PART C·1.-{'ontd.
2 3 , 5 6 7 8
Major Group 29 Total 1,000 526 4&1l 82 2 1
I-AUPu6l4/Power. ]!I" N N
(e) Coal, Wood & Bagasse N N N
II-Manurd · 1,000 526 439 32 2 1
80 Tota.l 1,000 648 857
I-.All Fuels/Power • 500 500
Cc> Coal, Wood & Bagasse 500 500 II-Maraud · 600 143 357
31 Total 1,000 470 863 118 59
I-.AllFue16/POwer • 236 69 ll8 59
Ca) Eleetriclty 59 59 (c) Coal, Wood &. Bagaase 177 59 59 59
II-Manual · 764 411 235 59 59
32 Total 1,000 454 501 40 3 II
I-.AlI Fue161Power • 337 162 167 8
(a) El<l1ltriGlty 1 1 (c) Ooal, Wood & Bagasse 338 162 167 7
II-Manual · 6113 292 334 82 8 S
83 Total 1,000 750 200
I-All FlJel6!POwer • 250 250
Cc) Coal, Wood &. Bagasse 250 250 II-Manual · 750 750
34 Tota.l 1,000 988 64,0 22
I-All Fuels/Power , 869 291 560 18
(a) Electricity 18 4 7 7 (c) Coal. Wood & Bagal!&e 847 287 549 11 (d) other PoweE " 4
II-MQAw' · lSI 47 80 " 35 Tota.l 1,000 422 578
I -All FlJ8Is{Power • 756 289 467
(II) Electricity • • 67 67 te) Coal, Wood & Bagasse 689 289 400
II-Manual · • 2U 133 111
96 Total 1,000 1,000
II-.II(lInIMlI · 1,000 l,ODO
87 Total 1,000 444 445 III
II-MGtUUI' • • • 1,000 '(4 445 111
88 Total • 1,000 448 498 &2 1 1
l-AIIFv.ele/POIIJ8r • • 686 904 293 87 1
(al Electricity 72 13 35 24 (c) Coal, Wood & Bagassl) 1)63 291 258 18
II-M",.ulll · 365 14,4 205 15 1
39 Tota.J 1,000 591 369 15 25
I-.AU FueIB/PowtJ' • • • 99 30 59 10
I") Electricity 54 15 29 10 to) Ooal, Wood & Bagasse 45 15 30
I1-Matl1PJl · 901 561 310 5 25
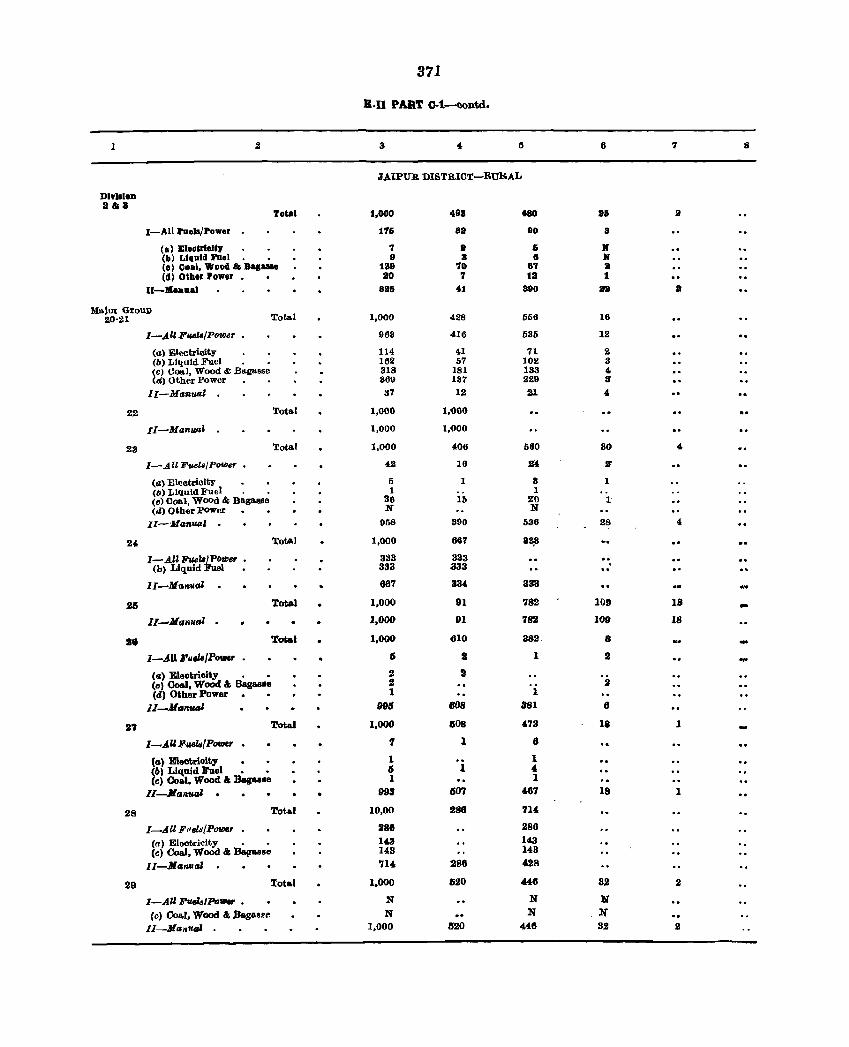
871
B.I1 PART C-1-contd.
1 3 " /j 6 7 8
.J,AIPUR DISTRICT-RURAL
DlvllloD alia
Total 1,000 493 t80 .& • I-AU !'Ilell/Power 17& s. 80 8
(a) Eleotrleltr 7 • & II (Ill Liquid I'uel 9 3 8 II (0) Coal, Wood & Ba.a .. e 139 70 67 a (d) 01her Power 80 7 18 1
II-MlDllal S8& 41 890 all 8
Major Group Total 20'21 1,000 428 566 16
I-A'l Fu.elB/POW8T 963 416 535 12
(a) EI~ctricity 114 41 71 2 (6) Liquid Fuel 162 67 102 3 (c) Coal, Wood IS; Ba.gasse 318 181 133 4 (a) Other Power 369 187 229 II'
II-Manual 37 12 2J. 4
22 Total 1,000 1,000 .. II-Manual 1,000 1,000
23 Total 1,000 406 580 30 4
I-Jill Fuels/Power. 42 16 2"4 lr
(a) Electricity 5 1 3 1 (6) Liquid Fuel . • 1 1 (c) Ooal, Woad & Bagasso 36 1& 2tl 1-(d) Other POWlll N N
II-Manual . 958 390 536 28 4
24- Total 1,000 667 33.8
I-AU FuelBfPorber • 333 333 (b) Liquid Fuel 333 333 ..
lI-MGIlual 667 334 333
26 Total 1,000 91 782 109 18
II-HGnum . 1,000 91 782 109 18
28 Total 1,000 010 38la- 8
I-All FuflajP_ • Ii 2 1 :2
(a) Eleotrioity • • 2 2 (0) eoal. Woc:id.\ Bagasse 2 :.I (d) Other Power 1 1
II-M.nuaI 99$ 808 381 8
27 Total 1,000 608 473 18 1
I-AU Fuel8{Powu . 7 1 8
(A) Eleotrioit.y 1 1 (6) Liqujd Fuel • • 5 1 4 (c) Coal. Wood.\ Bagasse 1 1
II-MAlIl.I.al 993 1S07 487 18 1
28 Total 10,00 ~88 714
I-All Fl/e!a/Powc, • 286 288
Cal Elootricity • • 143 143 (c) Coal. Wood .\ BaIlBBse 143 143
II-MAn"a' '114- 288 402R
29 7:otal 1,000 620 448 32 2
I-AU FueZsIPo_ • N N N
Ccl Coal, Wood.\ .JJagas!f! N N If II-Manual 1,000 1520 446 32 2
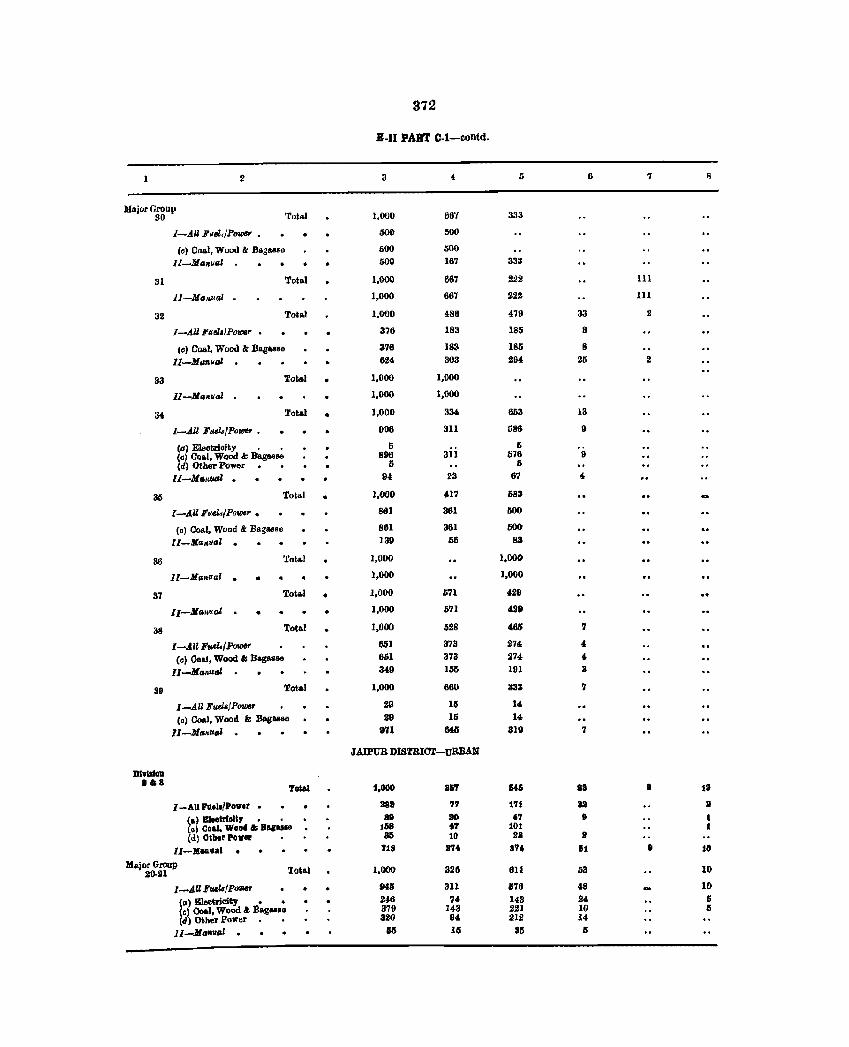
372
£-11 PART C-l-contd.
2 3 6 7
Major Group 30 Tot"" 1,000 SO·t 333
1-4U Fuel.,!Power IiOO 500
(e) C.,al, Wood & Bag .... " 600 500
ll-Manual · 500 167 333
31 Total 1,000 687 2:12 111
Il-Mal."al 1,000 667 222 HI
32 Total 1,000 488 479 33 :I
I-All Fait,/Power • 378 183 185 8
(c) Coal, Wood &: Bagasse 316 183- 185 8
II-Manual 624 303 264 25 :I
S3 Total 1,000 1,000
lJ-Manual 1,000 1,000
34 Total • 1,000 334 6D3 13
I-All FlUls/Powsr • D06 311 586 9
(0) Eleotrioity . • 5 I;
(0) Co.l, Wood &. Bagasse 896 311 576 9 (d) Other Power 5 5
ll-MtJ/tual · 9~ 23 67 4-
35 Total 1,000 117 583
I-All Fuel., l'awer • 861 361 1100
(cJ Coal, Wood /I: Bagasse 861 361 500
ll-Marillal · 139 56 83
36 Total 1,000 1,000
ll-Marlual · • 1,000 1,000
37 Total • 1,000 671 !&29
II-Ma"ual · • • 1,000 571 429
38 Tota.l 1,000 528 465 7
I-Aii Fue!'{1'ouI4r 651 373 274 " (0) 00&1, Wood &: Bagasse 661 373 274 4-
lI-Jla"ual 349 155 101 II
39 Total 1,000 660 333 7
I-AU BueLI/PolDllr 29 111 14
(c) 00801, Wood It BasaaBB 119 15 14
II-Mallual · 911 64G 319 7
JAIPUR DISTBIO'l'-URBA.N
DI,IIII1D •• 8
'filial i,OOO 367 MS 8. I 11
1-All ra.elaf'ow.f • _II '17 I'll III II
(al BII,trlall, • • 89 10 17 9 I (c) Co&l, Wood II; .,,,lIle lIi8 t7 101 • (dl Ollle~ powef 35 10 la l)
ll-J!lIIlual 718 27. 3'1, 11 II 10
Major Group 110·21 'Iotal 1,000 328 011 53 10
I-AU Ful&fP- 9411 311 678 48 10
(IJ) Blectricity • • 248 74 1411 24 Ii (cl Ooal, Wood .t Bagasse 379 143 221 10 15 (d) Ot·bef p"wer 320 94 212 14
ll-ltttJ.llal 65 111 85 Ii
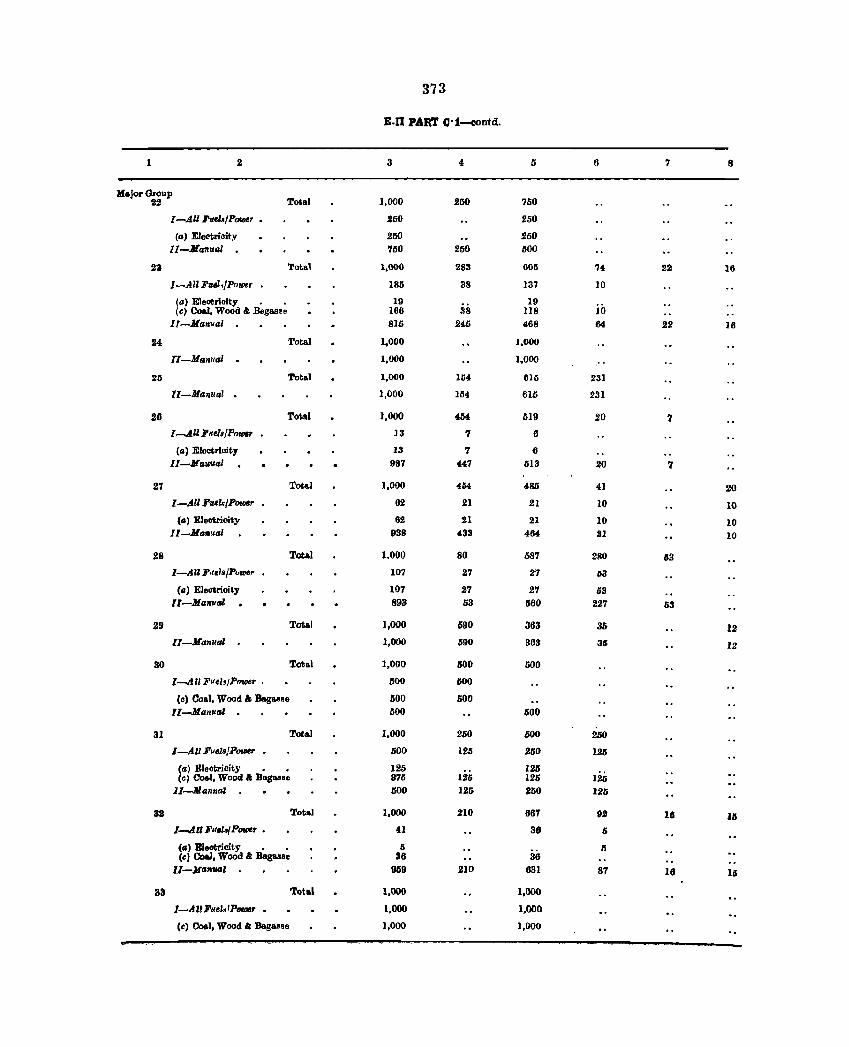
373
E.I1 PART C·1-rontd.
1 2 3 5 6 7 8
Major Group 112 Total 1,000 250 750
I-A.ll Fueh/P0UJ6, 250 250
(tJ) Ele~tricity 2110 250 ll-Jlallual 7110 250 1100
21 Tot .. , 1,000 283 (l()1l '74 22 16
I-All FIUl.f1'ower • 185 38 137 10
(a) Eleotrioity • . 19 19 (c) Coal, Wood &. Begasee 166 lI8 U8 10
1I-MtJ7Iual 8111 2411 468 64 22 16
24 Total 1,000 1,000
ll-MtJ7IIIal 1,000 1,000 o.
21l Total 1,000 164 615 231
ll-Mantlal . 1,000 154 6111 231
26 Total 1,000 454 519 20 '7
I-All Fllel8/P()f/J8' 13 '7 6
(a) Electrloity 13 7 6 II-Malltlal 987 U7 613 20 7
21 Total 1,000 404 485 41 20
I-All Fuels/PClfIlCr 82 21 21 10 10 (a) Eleotrioity 62 21 21 10 10
Il-Mrmual 938 433 484 31 10
28 Total 1.000 80 587 280 63
I-AU FuelB/P"uer 107 27 27 53
(II) Electrioity 107 27 27 63 II-Manual 893 53 560 227 63
29 Total 1,000 690 383 35 12
II-Manua' . 1,000 690 363 36 12
30 Tota.l 1,000 560 500
l-All F ud./PolO8r • 500 560
Cc) Ooal, Wood" BagallSe 500 500 II-JlanlJ.tJ' 1100 500
31 Total 1,000 260 600 260
I-AU Fue/8/POUJe' • 600 125 Jl60 125
(a) Eleotricity • • 125 126 125 Ccl Coal, Wood" Bagasse 375 126 126
II-Alanna' lIDO 121> 21i0 125
82 Total 1,000 210 667 92 16 U5 l-AlIFlle!o/PQVJe, • U 36 6
(a) Eleotricity • • 6 Ii (cl Coal, Wood .I: Bag&l!le 38 36
l/-Manual 959 2)0 631 87 16 16
33 Total 1,000 1,000
I-AZlFlleMIP_r • 1,000 1,000
(c) Coal, Wood " Bagas~e 1,000 1,000
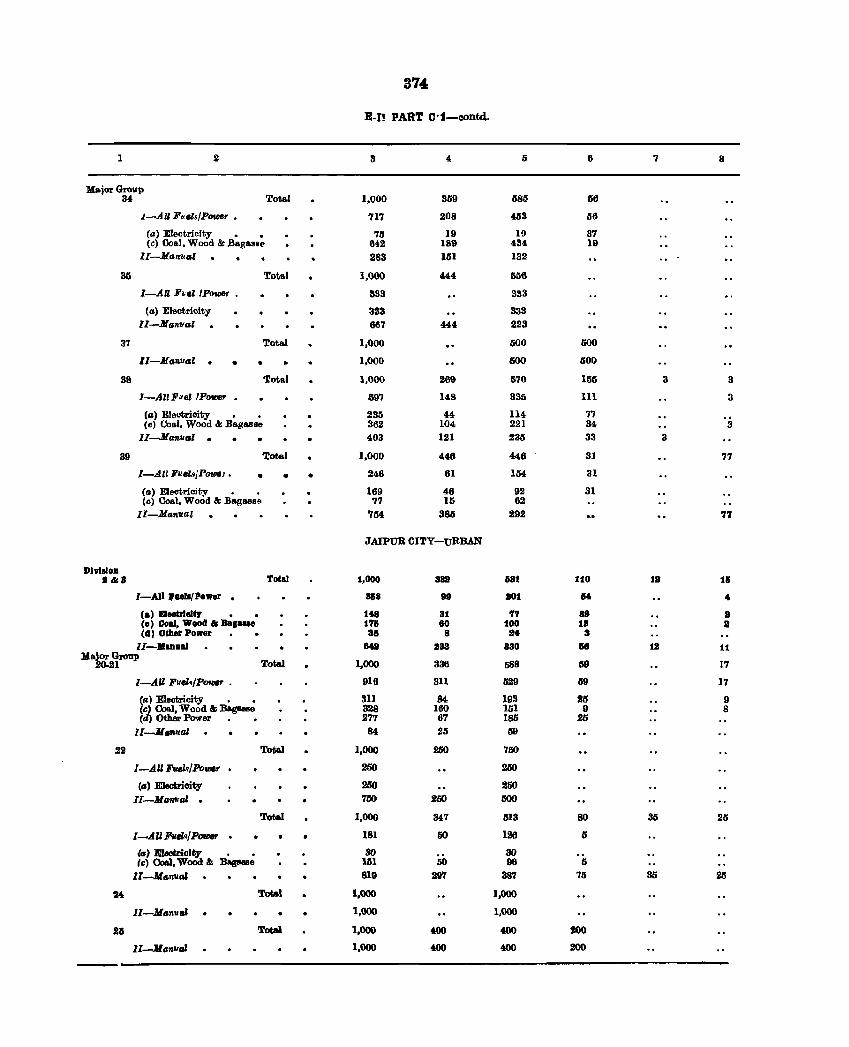
374
E-!! PART C·:I-oontd.
1 2 3 4 5 6 7 8
Major Group 34 Total 1,000 359 5811 66
1-AU Ji'uM.,fPOIIICr _ 717 208 463 li6
(a) Electricity • • 75 19 19 37 (c) Coal, Wood & .Bagasse M2 189 434 19
II-Man"al 283 UI1 132
35 Tot.al 1,000 444 556
I-AU FuellPotDflr • 333 333
(a) Electrioity 333 333 II-Manual 667 444 223
37 Total 1,000 500 000
II-Manual . • • 1,000 GOO 600
38 Total 1,000 269 570 155 3 3
I-AllFllel !Ponr _ 597 148 335 111 3
(a) Electricity , • 235 44 114 77 (e) Coal, Wood & Bagasae 362 104 221 34 3
II-Manual . 403 121 235 33 3
39 Total 1,000 446 446 31 77
I-All FUel8/POIIICJ • • • • 246 61 154 31
(a) Electricity • • 169 46 92 31 (e) Coal. Wood &; Baga88t'1 77 15 62
II-Manual 754 385 292 71
JAIPUR CITY-URBAN
Dhillon 2A. Total 1,000 asa la1 110 111 1&
I-All ,aeb/Power · 368 99 301 51 ... (a) B1eatr1eJty · . 148 31 '17 38 a (0) Coal, Wood A Bag ... 17& 60 100 1. a (d) Other Power as 8 III a
I1-Manaal 64a 383 830 &8 12 11 Mat<,:Gronp
21 Total 1,000 336 &88 59 17
I-AU FueZ./POWIt' • 916 811 529 59 17
(a) Electricity , • all 84 198 25 9 (c) Ooal. Wood & Bagaase 328 160 151 9 8 (d) Other Power 277 67 185 25
ll-M"",,,aI 84 115 59
22 Total 1,000 2IlO 750
I-AU FU..Z"fPO_ • 250 2IlO
(/I) Electricity 250 250 II-Mallval . 750 250 500
Total 1,000 347 513 80 85 25
I-All Fuel./Po_ · 181 50 126 5
(a) Eleotrioity • _ 30 30 Ie) Coal, Wood & Bagaase 151 50 96 5
ll-MGnuaZ 819 2Q'7 387 75 85 25
:M. Total 1.000 1.000
lI-MDlItlal 1,000 1,000
215 Total 1,000 ~ 400 200
II-MG'II"'" 1,000 400 400 200
-
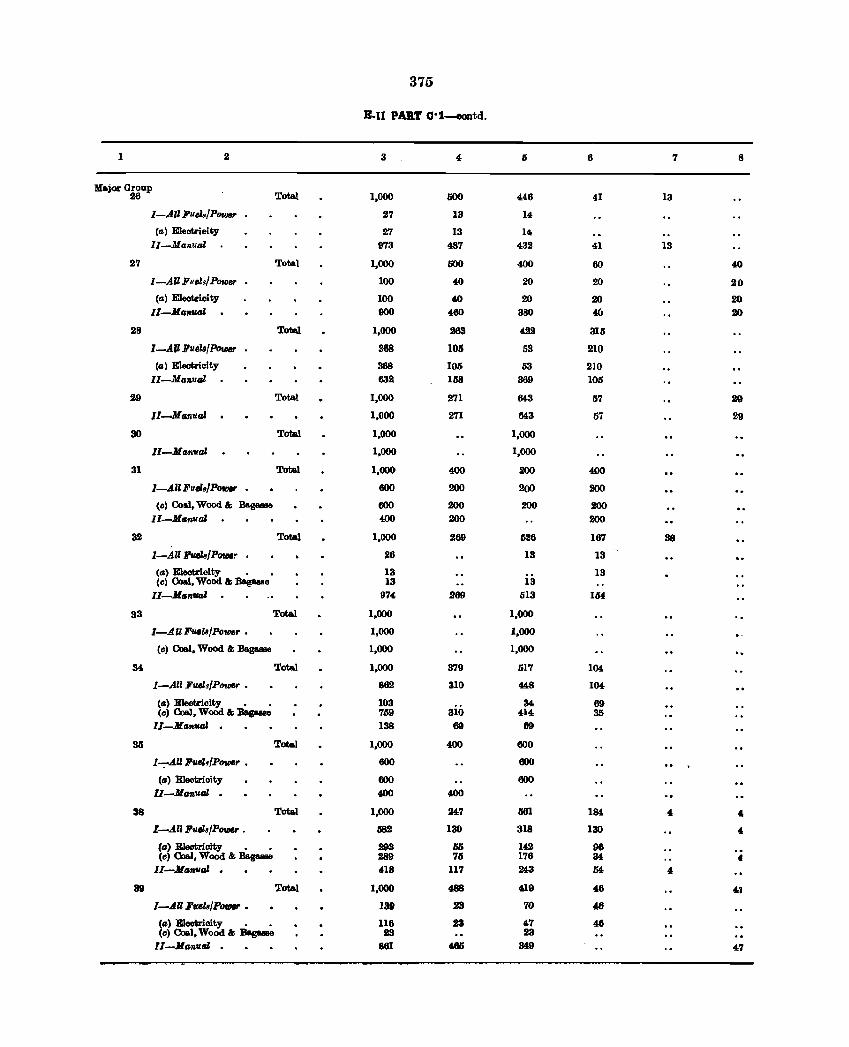
375
Boll PAtl'f Oo1-oontd.
1 2 3 4 6 7 8
Major Group 26 Total 1,000 500 44,6 41 13
I-All Fue)s/Powar 27 13 14
(a) Electricity 27 13 If. ll-Manual 973 487 432 41 13
27 Total 1,000 500 400 60 40
I-All Fllel4 POflJIr 100 40 20 20 20 (a) Electricity 100 40 20 20 20
II-Al(lnual 900 460 380 4CJ 20
28 Total 1,000 263 422 315
I-All Fuela!PotH' 988 105 59 210 (a) Electricity 368 105 63 210
II-Manual 632 158 369 105
29 Total 1,000 271 M3 57 29
II-Manual 1,000 271 M3 57 29
30 Total 1,000 1,000
II-JlMlvaZ 1,000 1,000
31 Total 1,000 400 l!OO 400
I-All Fuels/PotDer • 600 l!OO 200 l!OO
(e) OlaJ, Wood & Bagasse 600 200 200 200 II-JIanual 400 200 l!OO
32 Total 1,000 269 526 167 38
I-All Fvel8IPow~ 26 13 13
(a) Electricity • 13 is 13 (e) OlaJ, Wood & Baga.ue 13
II-Alan_ 974 269 li13 164
33 Total 1,000 1,000
I-A.U Fql&!P_, • 1,000 1,000
(e) Coal, Wood & Bagaase 1,000 1,000
34 Total 1,000 379 517 104
I-All Fvel./Power • 862 310 44,8 104
(a) Electricity • . 103 34 69 (c) Coal, Wood & Bagasse '769 310 414 35
II-AlrJnual · 138 69 69
3B Total 1,000 400 600
I-:-AU FueZ.!P_, • 600 600
(a) Electrioity 600 600 II-MMllI.al · 400 400
38 Total 1,000 247 561 1M , , I-All Fuels/Pow, . 582 130 318 130 , (a) Electricity • • 293 M 142 98 (c) Cclal, Wood & Bagasse 289 71i 176 M ..
II-Manual · 418 117 243 54 , 39 Total 1,000 488 419 46 4.1
I-A.ll Fucls/PauItr • 139 23 70 48
(a) EJeotricity • • 116 23 47 46 (c) Coal, Wood & Bagasse 23 23
lI-Manval 861 465 349 47
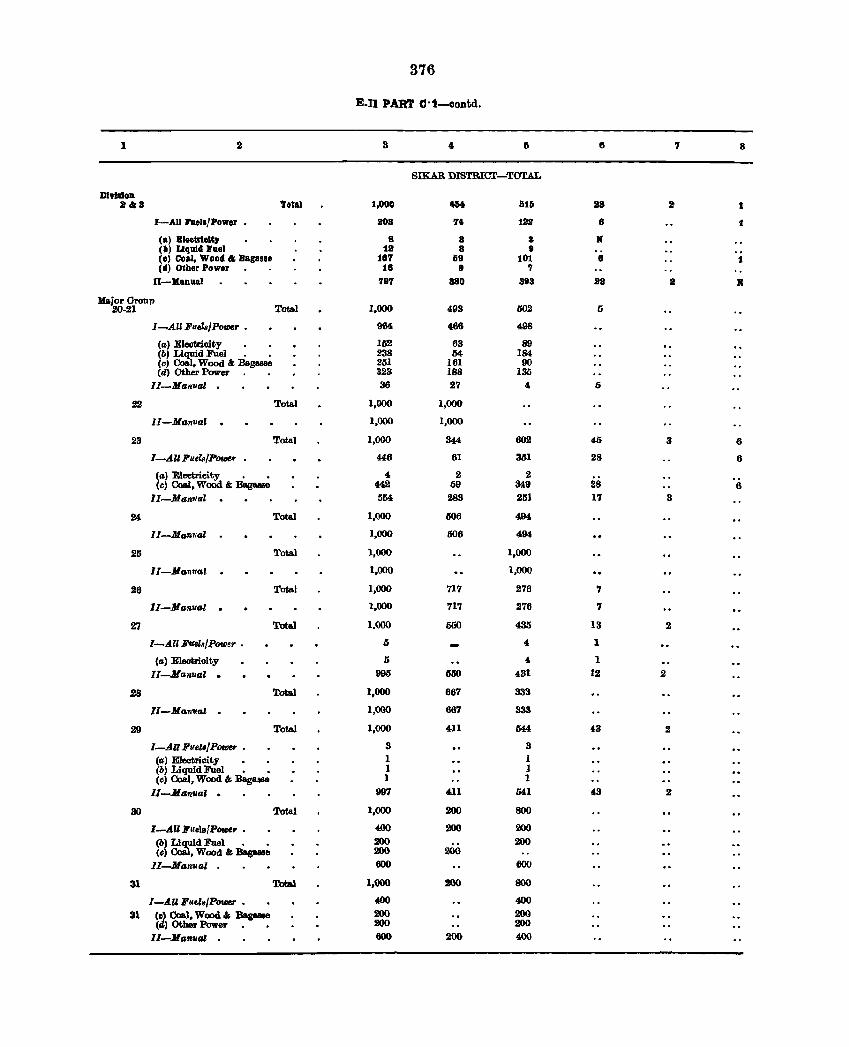
376
E.D PART C·t-oontd.
1 3 4 r; '7 8
SIKAR DISTRICl'-TOTAL
m'flllon a&8 Total 1,000 4&4 516 28 It t
I-AIl heJI/Power • 203 74 1211' e :I
(a) Bleetrlelt, 8 3 a II (II) Liquid FueJ 12 3 II (e) Coal, Wood II; Dagas .. 187 119 101 6 :I (d) Other Power 16 9 'I
fi-"nuaJ 797 880 883 aa 1iI II
Major Group 20·21 Total 1,000 493 602 5
I-AU j'uwlPOtDer • 964 466 498
(a) Electricity . . 152 63 89 (b) Liquid Fuel . • 238 54 184 Cc) Coal, Wood & Ba.gaeee 251 161 90 (d) Other Power 323 188 135
ll-Manual 36 27 4 5
22 Total 1,000 1,000
I1-Man"al 1,000 1,000
23 Total 1,000 344 602 45 3 6
I-All Fueh/POI.De" . 446 61 351 28 6
(a) Eleetri.eity • • 4 2 2 (c) Coal, WoOd & Bage.ue 442 59 349 28 6
II-Man'lal 554 283 251 17 3
24 Total 1,000 606 494
II-Manllal 1,000 506 494
25 Total 1,000 1,000
II-Mantlal 1,000 1,000
26 Total 1,000 717 276 7
II-Manual · 1,000 717 276 '7
27 Total 1.000 Ii50 435 13 2
I-All FUels/Power • 5 4 1
(a) Electricity 5 4 1
lI-Manual · 995 550 431 12 2
28 Total 1,000 667 333
II-Manual · 1,000 667 333
29 Total 1,000 411 544 43 2
I-AU Fue18/Porcer • 3 3
(a) Electricity 1 1 (b) Liquid Fuel • • 1 1 (c) Coal, Wood & Baga_ I 1
II-ManfAal · 997 411 541 43 2
30 Total 1,000 200 800
I-AU FuelafPOtDer • 400 200 200
(b) ~id Fuel • • 200 200 (c) • Wood &:&gaMe 200 200
II-Man'IJal 600 600
31 Total 1,000 200 800
I-AU FlI.e18/Pow.r • 400 400
31 '2, Coal, Wood & BagaMe 200 200 ( ) Other Power. • 200 200
II-Manual · 600 200 400
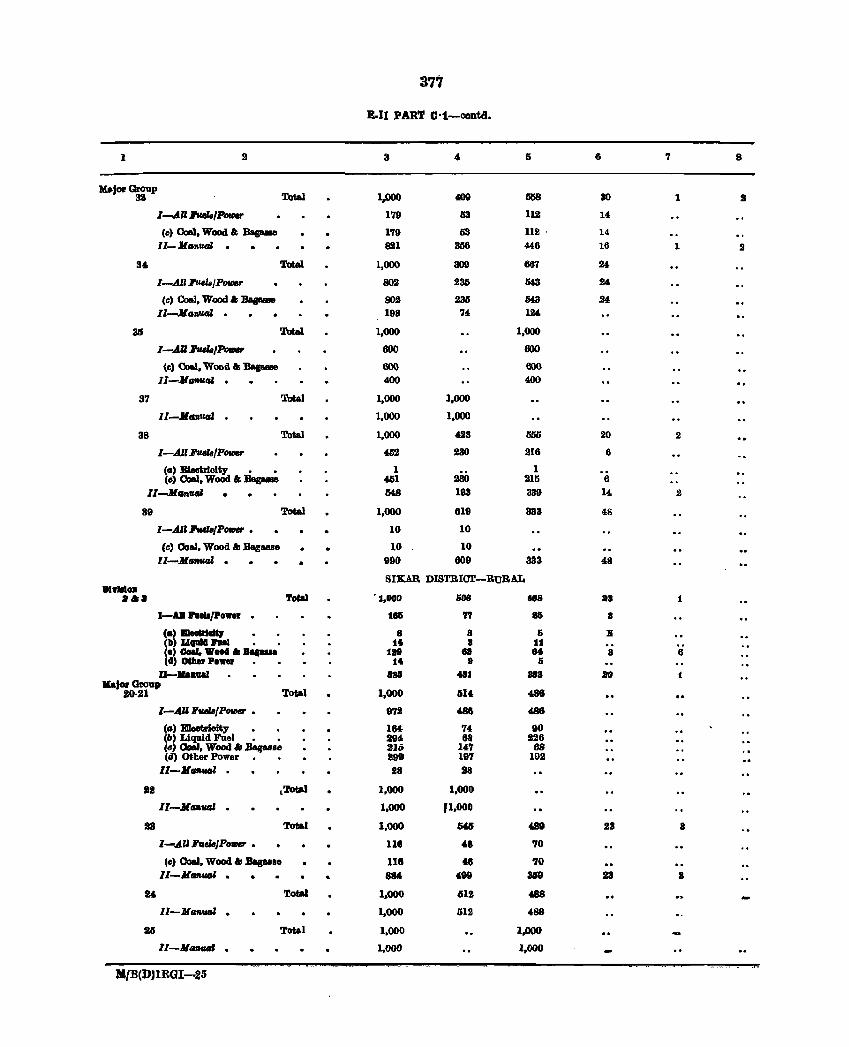
377
E·II PART C·1-cont4.
1 2 3 6 '7 8
Jle.jor Group 33 Total 1,.(100 409 5IS8 30 1 S
I-AU """,'PottIer 1'79 113 112 14
(0) 00&\, Wood" :&ga.e 1'79 53 112 . 14
11- .Item". · 821 356 446 16 1 2
34 Total 1,000 309 66'7 S4,
I-All :ru.asIPovler 802 235 0&3 24
(c) Coal, Wood " :Bagasae 802 235 M3 24
II-JlG"u. · 198 '74 124
311 Total 1,000 1,000
I-AU :I'u4L/PtJtiIu 600 600
(c) Coal, Wood & Bapue 600 600 Il-Jl_1II · 400 400
37 Total 1,000 1,000
ll-JIGllual · 1,000 1,000
38 Total 1,000 423 65li 20 .2
I-All 11l.rs/PollMf' 452 230 216 6
(.) E1eotrioity • • 1 1 (c) Coal, WoOd " :Bagu&e "1 230 215 6
II-Jlflnual 548 193 339 14 .2
39 Total 1,000 619 333 48
I-All ,../P_ • 10 10
(c) Ooal, Wood'" Bagasse 10 10 II-M-.I · 990 609 333 48
SIKAR DISTBIC1r-RUBAL 0I911l0.
.. II. Total ·1,000 &08 tea .13 1
I-AD ....... /.0". . 115 '" 81 3
(a) BleIIRI_ . . 8 3 II It f') Lltall I'aeJ • • 1" 8 11 .)GoaI.W ........... 1111 ea H 3 6 I) 0111 ••• _ • • 1 .. • I
D-Bna&l 88& a1 883 aD 1 KaIOl" Group
20·n Total 1,000 1114, 4.86
I-AU FtulI/P_ • 9'72 486 486
(.) E1eetrioity • • 164 '7' 90 (b) Liquid Fuel • • 294 68 126 (e) OoaJ, Wood " BagIBe 210 14'7 68 (d) Other Power 299 197 102
II-M,..val · 28 28
12 ,Total 1,000 1,000
II-JlII"val · 1,000 (1,000
23 Total 1,000 MS ~9 23 3
l-A111'f4dB/Po_ • lUI 4' 70
(c) Coal, Wood & Bagule 118 " 70 1l-.Jl",,1l4I • 884 499 319 23 8
24 Total 1.000 G12 488
II-MllfIval · 1,000 512 488
25 Total 1.000 1.000 II-AI"'" · 1,000 1,000
MIB(D)lRGI-25
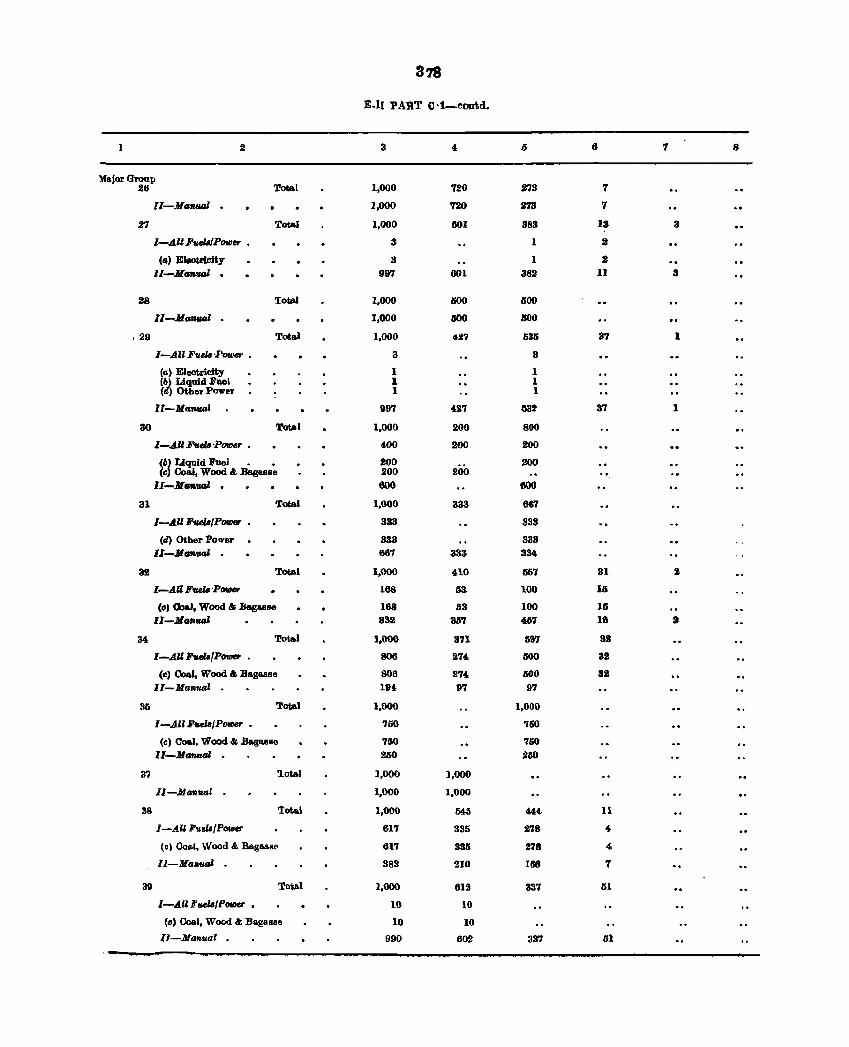
378
E.1I PART C·1-contd.
2 3 4 6 6 7 8
Major Group 26 Total 1,000 720 273 7
II-Ma1l.UiJI 1,000 720 273 7
27 Total 1,000 601 383 13 3
I-AIlFuel8IPOtD~ • 3 1 2
(a) Eleotricity II 1 2 II-M_UGl . 997 601 382 II 3
28 1:otaI 1,000 1500 600
Il-Man'UlJl 1,000 600 300
,29 Total 1,000 427 535 37 1
I-All Fue18 ·Power • 3 3
(a) Electricity 1 1 (6) Liquid FIleI I 1 (d) Otber Power 1 1
ll-ManuaZ 997 427 532 3'7 1
30 Total 1,000 200 800
I-All Fu.e18 ·P0fD8r • 400 200 200
(6) Liquid Fuel • • 200 200 (II) CoaJ, Wood & Bagasse 200 200
II-M_uol . 600 600
31 Total 1,000 333 667
I-All FtI6l8/Power • 333 333
(d) Other Power 333 333 Il-M~ 667 333 334
as Total 1,000 410 557 31 2
I-A"F.a.·P_ 168 1i3 100 Iii
(0) 00&1. Wood & Bagasse 168 53 100 16 II-Manu.aI 832 357 457 18 I
34 Total 1,000 3'll 59'7 32
I-A" FurlaIP_ 806 274 600 32
(c) Coal, Wood & Baguse 806 274 600 32
II-Manf .. ' 194 97 97
35 Total 1,000 1,000
I-AU Fuel8lPOIDtir 750 750
(c) Coal, Wood &. &gaase 750 750 II-M_fUIl 250 250
37 'latal 1,000 1,000
ll-M aruusl 1,000 1,000
38 Total 1,000 545 4U 11
I-AU Fuel8lPOIDfII" 617 335 2'18 .. (c) Coal, Wood &. BBogMIlE' 617 335 278 4
ll-MallruU 383 210 166 7
31} Total 1,000 IJIlI 337 lSI
I-All FIUJ8IP_ • 10 10
(II) Coal, Wood &; Bagasse 10 10
ll-Manual 990 60l! 337 51
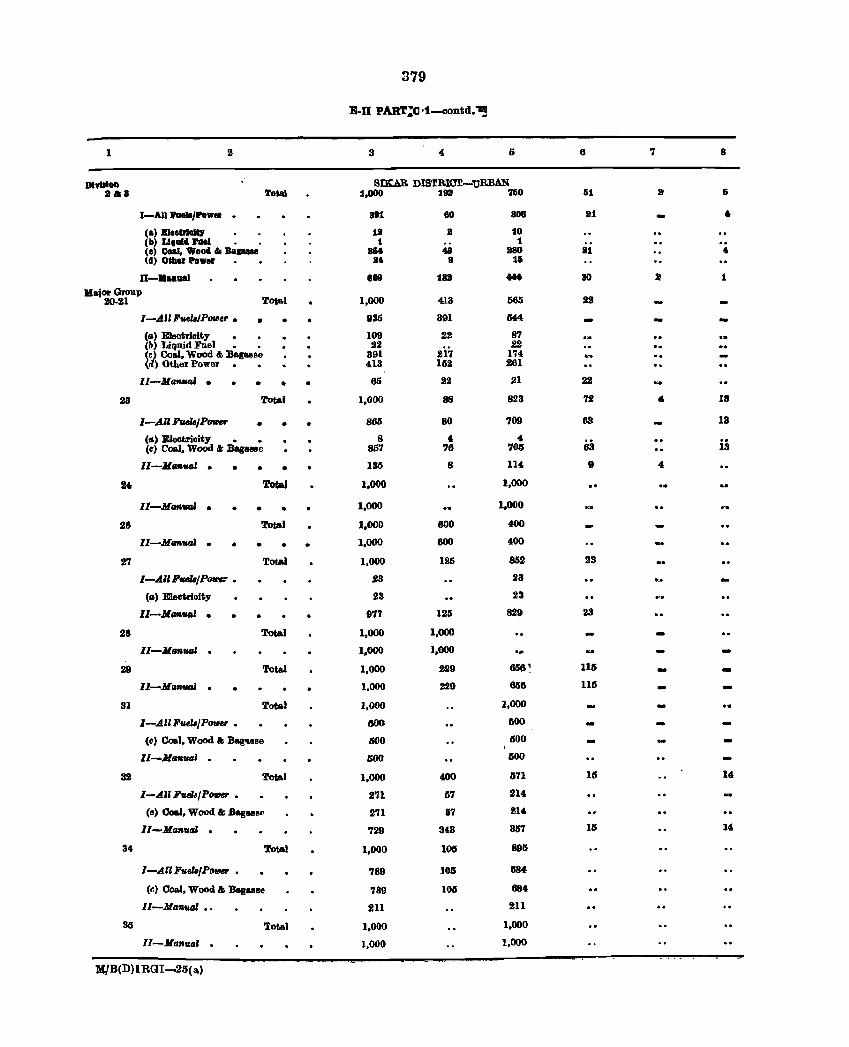
379
B·D PART~C,t-oontd.~
1 2 3 4 5 6 8
DlvllloD SlKAR DISTRICJ:r-uREAN alia Total 1,000 1f1l1 760 61 It 6
I-All ra ... IPowat · a81 80 aOG a1 • (a) m •• DlDlU 11 11 10 (b) LIQuid I'llal 1 1 (8) Coal, Wood ....... 16' III 180 21 , (II) O*ber Power I' B 15
II-B&IIuJ 809 181 4K 80 1I 1
Kajor Group 20·21 Total 1,000 413 565 22
I-AU Fuu,/POfIJer • II • 935 391 644 -(II) Electrioity 109 22 8'1 (/J) Liquid Fuel • • 22 22 (c) 00&1, Wood & ]3a.gaese 391 217 174 (/I) Other Power 413 162 261
II-Ma,._' • • • • 66 22 21 22
23 Total 1,000 88 823 '12 ~ 13
I-All FudI/POfIJef' • • 865 80 709 63 13
(II) Eleotricity 0 0 8 4 4 i3 (~) CoaJ, Wood & :Bag_e 857 76 700 63
ll-M_I · • • 135 8 114 9 4
24 Total 1,000 1,000
II-M-' • • • 1,000 1,000
28 Total 1,000 600 400
II-Jl_' · • • 1,000 600 400
27 Total 1,000 125 852 23
l-AllFudti/Powr 0 23 23
(ra) Eleotricllty 23 23
I1-M_1 · • 977 125 829 113
28 Total 1,000 1,000
II-M"""'" 0 1,000 1,000 0 ..
29 Tota.l 1,000 229 658 ~ 11& - -II-M"1IfM1l 0 1,000 229 658 IUS - -
31 Total 1,000 1,000
I-All Fuell/P_ 0 500 600
(to) 001101, Wood II Ba@:'lBBe &00 500
II-M",,_l · 600 llOO
32 Total 1,000 400 571 15 14
I-All Fuel8/P_ • 2'11 57 214
(e) Ooal, Wood II BagaBBI' 271 67 214
II-Mc",,,,,,' · 729 343 357 15 14
34 Total 1,000 105 895
I-All F",elI/Polllef' • 789 lOIS 884
(r.) Ooal, Wood II Dagus. 789 105 884
ll-M,,"ual ., 211 211
35 Total 1,000 1,000
ll-Ma1l",a' 0 1,000 1,000
l'4/B(D) 1 RGI-25( 11,)
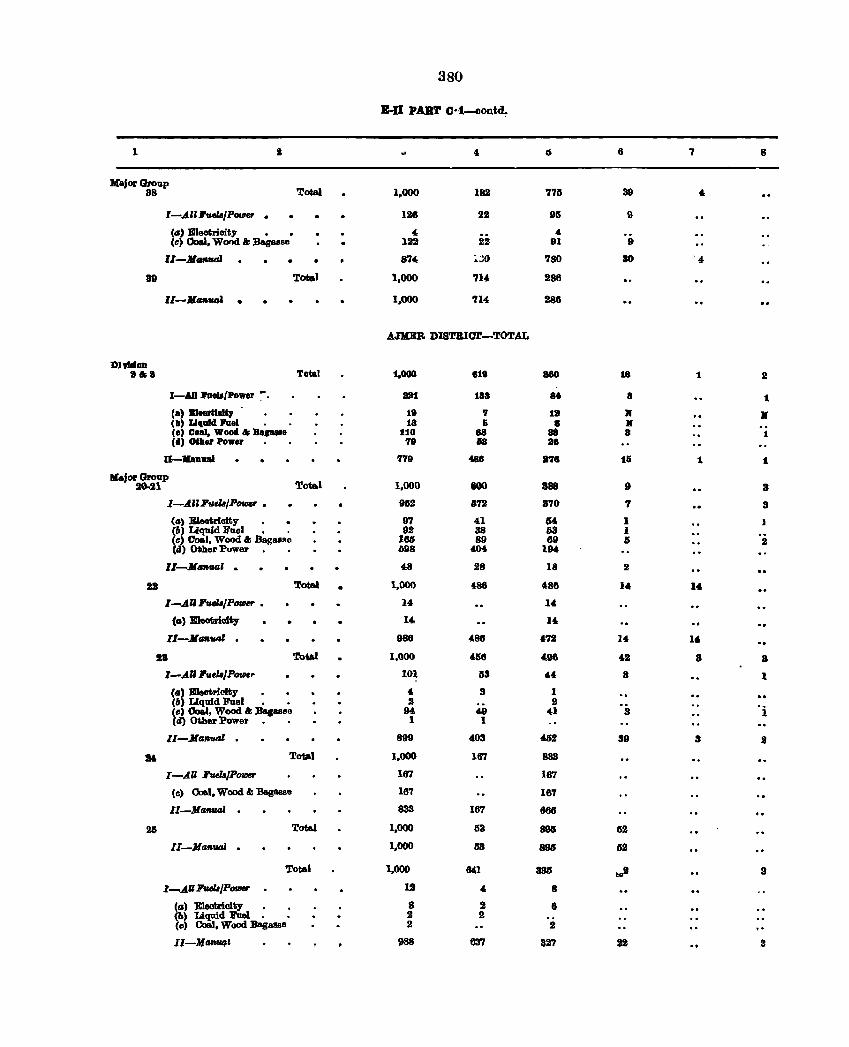
380
B-II PART C·t_ontd~
1 6 6 7 8
Major Group 38 Total 1,000 182 '17l; 3D 4-
1-.AnF".z./p_ . 128 22 95 9
(II) Eleotrioit,y • • 4, 4, (0) Ooal, WOtJd & Bagasse 122 22 91 9
lI-M_aaJ • 874, ::..~O 780 SO '4
89 Total 1,000 714 288
II-M_,"" • 1.000 '114 286
A.nmR DIS'l!B.IOl'-TOTAL
DI'I'IIIoD all:. Total 1,000 618 360 '8 1. 2
I-AU Jl'am/Power ~ 0 lIM 188 lit • 1
(a) Bled_ 18 7 12 B • (b) Liquid hel 0 18 6 8 )( Co) Coal, Wood <I; B.g .... 110 68 all 3 1 (d) Other Power 78 18 38
U-"Dual '1'19 488 .7. 11 1 1
Major Group Totel 1,000 100 888 20.21 9 3
l-A"1I'"elB/P_ • 912 1172 370 ., 3
(II) EIeotrioity 97 41 54 1 (1.1) Liquid Fael 0 • 92 38 63 1 (e) Coal, Wood & Bagasse 166 89 69 IS 2 (d) ()t;her Puwer 698 404 194
ll-MII-I . 4,8 28 18 2
22 Total • 1,000 488 488 14 l' I-AU l'uelB/P_ 0 l4, 14
(II) Eleotriolty 14, l4,
II-MaVAI , 988 486 &72 14 14
28 Total 1,000 418 496 42 3 8
I-AU J'u~18IP_r 101 83 44 3 1
(II) Bleotridty 4 3 1 (1.1) Liquid Fuel • 0 2 2 (e) 008.1, Wood & Bagasse 94 49 41 3 1 (tI) Other Power 0 • 1 1
II-Man_ 0 899 403 482 39 3 D
24 Total 1,000 187 833
I-A U J'velaIPOUNlf' 167 167
(e) Coal, Wood & Ba@- 167 167
II-M_fJ4l , 833 167 886
28 Tot&l 1,000 83 896 12
ll-Ma.vtJJ , 1,000 68 898 82
Total 1,000 841 33IS to" 2
l_AIl1!'tWsJP_ , 12 4 8
(II) E1eotrioity 0 • 8 2 8 <") Liquid Fuel. • 2 It (c) Coal, Wood Baga!lSe 2 2
11-14-114' 988 837 327 22 2'
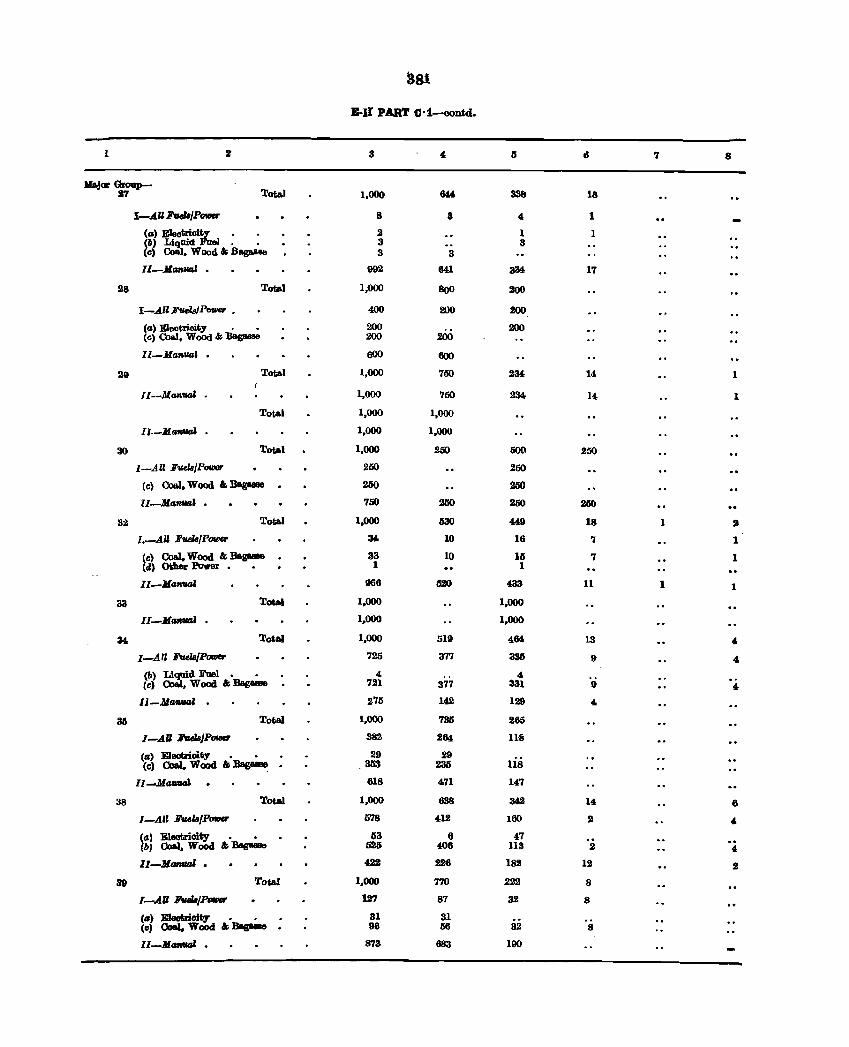
~81
B-II PART cH-contd.
1 2 3 4 IS 7 8
)(ajar Group-Total 21 1,000 644 338 18
I-AUF_/P_ 8 a 4 1
(II) EIeotrioity • • 2 1 1 (lI) ~uid Fuel. • 3 3 (c) , Wood" Bagaaae 3 3
II-Mtmtl4l • 992 641 334 17
28 Total 1,000 8()0 200
I-All JlveZ8/P_ • 400 200 200 .. (a) Eleotrioity • • 200 200 (c) OoaJ, Wood " BagIII!Re 200 200
II-Manual • 600 600
29 Total 1,000 750 234 14 1
II--Mantl4l • 1,000 750 234 14 1
Total 1,000 1,000
f1.-M ClfIfICII • 1,000 1,000
30 Total 1,000 2IiO 500 250
[ .. -AU FveI.B/P_ 250 250
(e) Coal. Wood "Bagasee 260 250
lI-MaftUIII • 750 250 250 200
32 Total 1,000 lS30 4411 18 1 2
I.-AU FveI.B/Pawer M 10 16 7 1
(c) Coal, Wood "BagaM& · 33 10 15 7 1 (d) Other Power. • · 1 1
II-ManUIII 966 520 433 11 1 1
33 Total 1,000 1,000
II-M_UIII • 1,000 1,000
34 Total 1,000 519 464 13 4
I-All :ruez./P_ 725 377 333 I) 4
(lI) Li 'd Fuel. • 4 4 (c) ~Wood" BagIlBlle . 721 377 331 9 4
Il-M_I . 2'75 142 129 4
36 Total 1,000 735 265
I-AU 1f'wl8JP- 382 264, lUI
(II) E1eotrioit;y • • 29 29 lis (c) Coal. Wood" BegaIBo 353 235
Il-MaflUal. 618 471 147
38 Total 1,000 638 M2 14 6
I-AU l1v.e.1a/P_ 578 412 160 2 , (a) Eleotrioity • • 53 6 47 (lI) Coal, Wood ,,~ 525 408 113 2 4
11-M-' • 422 226 182 12 2
3D TotAl 1,000 770 .222 8
I-AU lI'tItM/~ 1.27 87 32 8
(tI) EIeotrioity • • · 31 31 (c) Coal. Wood "Bag.., 96 56 32 8
II-MGfIfIIlJ • 873 883 190
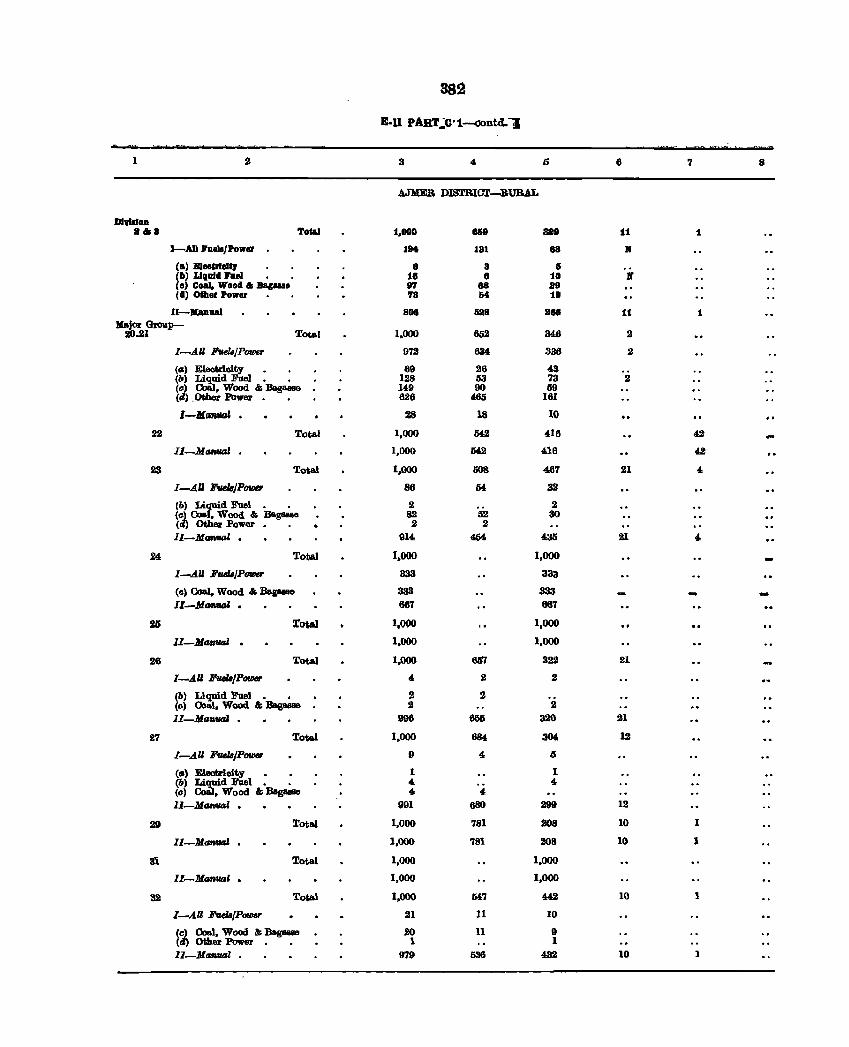
382
E-ll PART':C·1--contd.~
I s 3 4 6 6 7 8
AJMEB DISTRI<Yr-BUlUL
DI ..... OD a lila Toal 1.000 858 888 11 1
I-AD Pum/POWel 1M 181 88 If
(a) lUeeUleJar 8 3 i (II) Llqllld Fuel 16 6 10 If (e) Coal, Wood & Bag .... 97 88 a9 (4) O&hel Power '13 &4 19
lI-lIIaDaal 806 &as aea 11 1 Major Gtoup-
20..21 TotIIol 1,000 652 348 2
I-AU J!uela/Power 972 ElM .336 2
(1&) Eleotrloity • • 69 26 43 (0) Liquid Fuel. • 128 53 73 2 (G) 00&], Wood & Bag&88e 149 90 69 (d) ,Other Power. • 626 465 161
I-MIImIG& • 28 18 10
22 Total 1,000 li42 416 42
Il-MrmtICIJ • 1,000 M2 416 42
23 Total 1.000 008 467 21 4
I-All Fwls/POfDfJl' 86 04 32
(b) Li~d Fuel. . 2 2 (c) Goa, Wood & B&gaaee 82 52 30 (d) Other Power 2 2
ll-M-' • 914 404 435 21 4
24 Toflal 1,000 1,000
I-AU FuBlB/POII/tI 333 333
(G) Coal, Wood & Ba.gaaBe 333 333 Il-MtIfIIIII1J • 667 667
2G 'Iota! 1,000 1,000
II-Mr.mual . 1,000 1,000
26 Total 1,000 657 322 21
I-All :B'uelB/P_ 4 2 2
(b) Liquid Fuel. • 2 2 (0) Ooal, Wood & Bag_ 2 2 II-MI&r&tICIJ • 996 655 320 21
27 Total 1,000 684 304 12
I-All FuBlB/P_ 9 4 6
(1&) Eleotrioity • • 1 1 (0) Li 'd FUel. • 4. 4 (0) ~ Wood & Bas- 4 4 Il-MI&r&ual • 991 680 299 12
29 Total 1,000 781 208 10 I
II-Mar&vaJ • 1,000 781 208 10 1
31 Total 1,000 1,000
II-M_ual • 1,000 1,000
32 T$I 1,000 5£7 442 10 1
I-All :B'uelBfP- 21 11 10
(c) Coal, Wood & Bagasae 20 11 9 (d) Other Power. • 1 I II-MaRuaZ 979 536 432 10 1
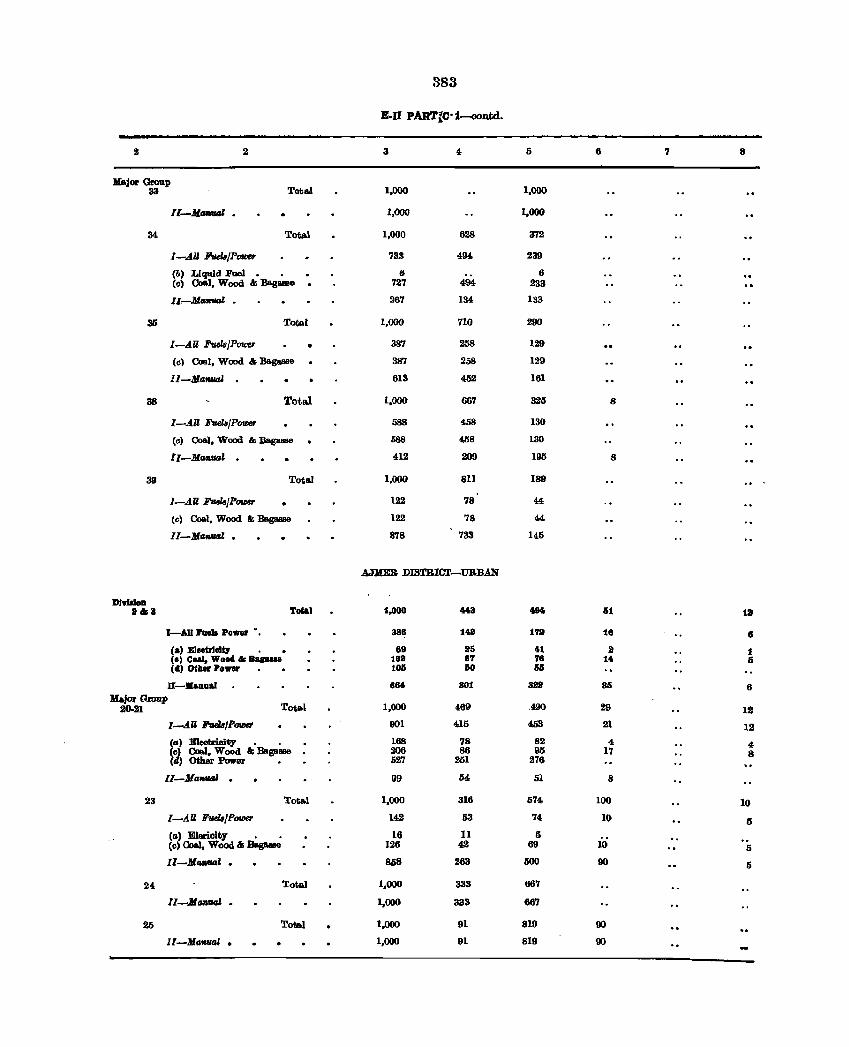
383
E-I1 PARTlC·1-oontd.
2 2 3 4 5 6 7 8
Major Group Total 1,000 1,000 33
Il-M-' • 1,000 1,000
34 Total 1,000 628 372
1-.4.11 FveJB/P_ 733 4M 239
(bJ Liquid Fuel. . . 6 6 (c) Coal, Wood & ]3a.gllllile 727 494 233
ll~ManVGl • 267 134 133
36 Total 1,000 no 290
I-AU Ftul8/Power • 387 258 129
(cl Cool, Wood & :Bag_e 387 258 129
!I-Manual 613 452 161
38 Total 1,000 667 325 8
1-.tll FuelJI/P_ 588 41i8 130
(6) Coal, Wood &:Baga""" 588 458 130
II-Manual . 412 209 195 8
39 Total 1,000 811 189
I-AU Fuela/Pou;er 122 78 44
(c) Coal, Wood & 1J&gaase 122 78 44
II-ManwZ , 878 733 145
A.JHER DISTRIO'.l'-URBAN
DI ..... alia TNt 1,000 44r3 4940 51 18
I-AU Faell Power -. 88& 149 173 18 " (a) B1eoir1a1q • 89 25 41 II 1 (e) Coal, Wood II BBpue 1811 87 78 14 6 (d) other Po_ t06 60 66
R-:KaD.ua1 •• 4 801 saa 85 6 Major Group
Total 1,000 i69 20.21 .490 29 12
I-AU I'uelBIP_ 901 415 453 21 12 (a) Eleotrioity • • 168 78 82 4 4 (~ Ooal, Wood & Baga88e 206 86 96 17 8 ( ) Other Power • 627 251 276
Il-Marwal . 99 64 61 8
23 Total 1,000 316 674 100 10 I-AU F_/P_ 142 53 74 10 5
(a) Elarioity • • 16 11 6 (c) Coal, Wood & BagaaBe 126 42 69 10 5 II-M_l. 8GB 263 600 90 5
24 Total 1,000 333 667
II-Manual • 1,000 333 667
26 Total 1,000 91 B19 90
II-Manwl • 1,000 91 B19 90
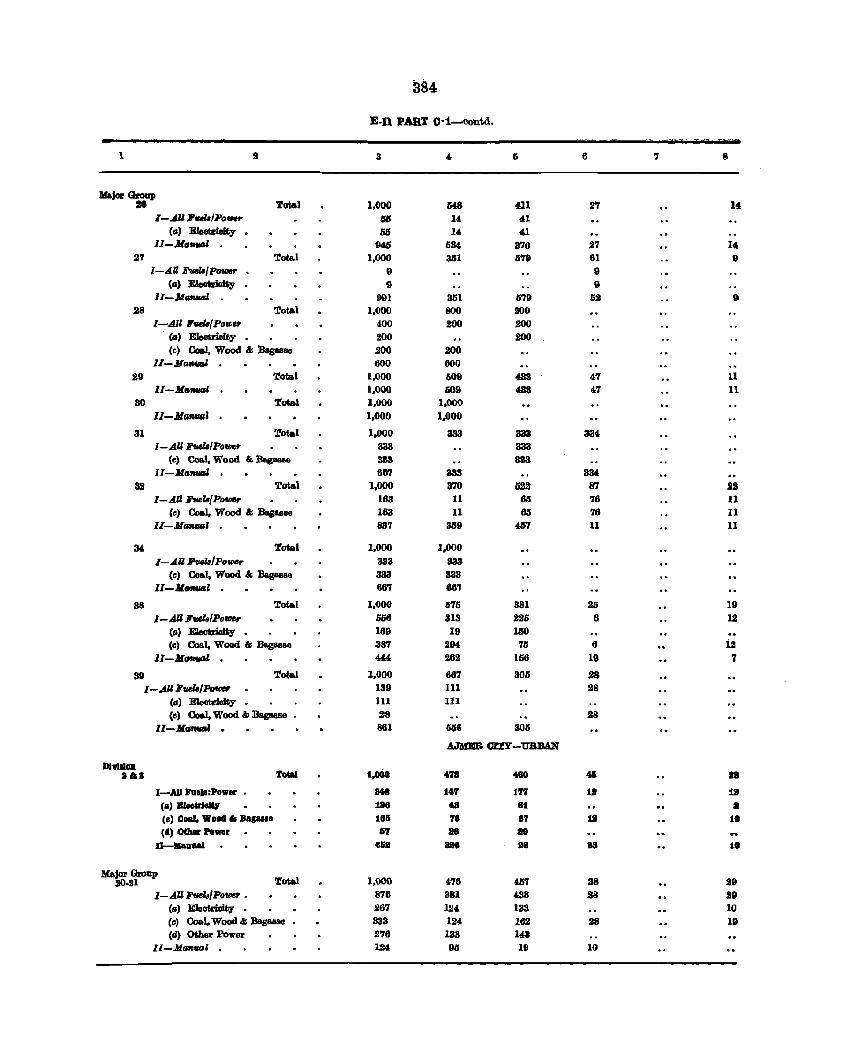
384
E-ll PART C·1-contd.
1 3 4. 6 6 7 8
Major Group 28 '.rotal 1,000 IH8 411 2'7 14
I-All FaZ.IPofllU' ISIl 14 41 (a) Eleotriaity • lUI 14 41
II-MaRui 945 534 370 27 14 27 ~ota.l 1,000 351 579 61 9
I-All FaZ.{Po_ • 9 9 (II) Eleetrieity 9 D
Il-M_I 001 351 679 52 9 28 ~ota.l 1,000 800 900
I-All ""'{Power 400 200 200 (II) Eleotrioity 1100 200 (c) CcJal, Wood & Bagasse 1100 200
II-MafWlll 600 600 29 Total 1,000 509 433 47 11
II-M_1IM l,()()() 509 433 47 11 30 'rotal 1,000 1,000
lI-Ma_J 1,000 1,000
31 ~otal 1,000 333 333 334 I-AU FwZ8/PofDfIr 333 333
(e) Coal, Wood & :Bag_a 333 333 lI-MaRVlJI 66'7 333 334
3l! Total 1,000 370 522 III 2S I-AU J'ue18{Pof/J8r 163 11 65 76 11
(c) Coal, Wood '" Basasse 163 11 65 76 11 II-M_1 . 887 359 467 11 11
34 'rotal 1,000 1,000 I-.411 /i'tJel8Jpo_ 333 333
(c) Co&l, Wood '" Bagaaae 333 333 11-.11_' 667 667
38 ~otal 1,000 675 381 205 19 I-AU FuelslPofD8r 558 313 226 6 12
(a) E1eotrioity • 169 19 160 (c) Coal, Wood '" BagIlllBU 387 294 76 6 i2
11-MfJRtIIIl 444 262 156 19 '7
39 ~otal 1,000 667 306 28 [-.4UFwZ8/Po_ 139 111 28
(0) EIeot&-ioity - III 111
(c) Coal, Wood '" Bagaaae - 28 28 II-MGfWGI . 861 556 306
A.JMEB OlTY-UBBAN
D1Yl1lIJD 1,000 aIG. Total 478 taO 41 •
I-AD l'uell:PDwer • 1148 :14'1 177 111 111
(B) Bleo&rJGlQ 126 48 81 II
(c) Coal. Woael II BB,III8 :185 78 87 111 10 (eI) OCher Power 1i7 lIS 18
B-lIhllul 6&8 888 88 sa 10
Major Group 20-21 Total 1,()()() 476 4li7 38 lI9
I-All J'ueI,,{Power - 878 381 438 28 29 (a) Eleotrioity 267 124 133 10 Ccl Coal. Wood '" Bagaa88 333 124 162 28 19 (d) Other Power 276 133 143
II-MaflVlJl 124 95 19 10
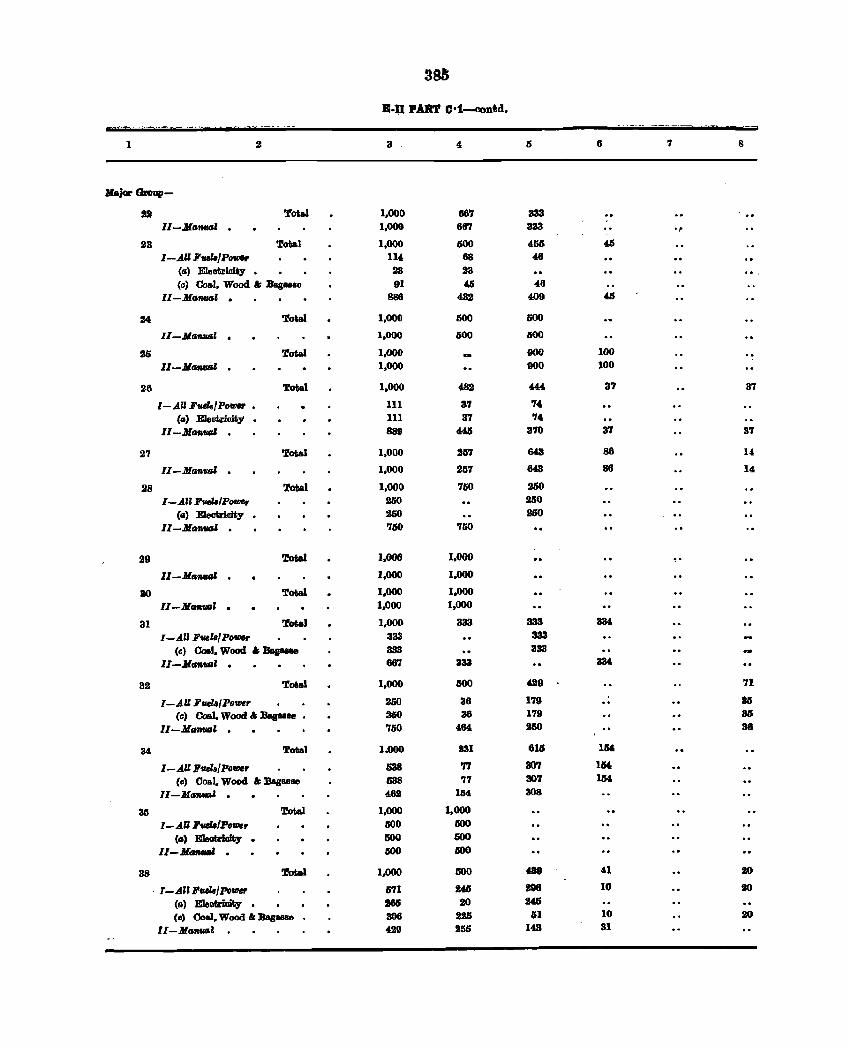
3811
B·n PAR'l' C·t_ontd. ... . ...... -- ~--~ -- .- --
I 2 3 4 5 8 7 8
KajorGnup-
D i'otaJ 1,000 867 333
II-JltmtraI 1,000 687 333 Of
23 'lotal 1,000 600 455 45
I-AU FuJ./Power 114. 88 46
(a) Electricity • 23 23 (c) Coal, Wood &; Bagasse 91 46 48
II-JlGmud · 886 432 409 45
24 'lotal 1,000 600 600
ll-JIltmva' · 1,000 600 500
26 i'otal 1,000 900 100 ll-JIlMlfJid · 1,000 900 100
28 'lotal 1,000 482 "' 37 37
I-AU F_IPower III 37 74
(a) E1e.iclity • III 37 74
II-Jla"uaI 881) ~ 370 37 37
27 'lotal 1,000 957 64.3 86 14
II-JlaRuaI · 1,000 257 643 86 14
28 Total 1,000 750 200
I-All F_IPower 260 250 Ca} Electricity • 260 250
II-Jla_' · 760 750
29 'lotal 1.000 1,000 • 0
Il-Ata_' 1.000 1,000
ao 'lotal 1.000 1,000
II-At"""",' · 1,000 1.000
31 'lolal 1,000 333 333 334
I-AU FuelBlPoVJer 333 333
Ce) Coal, Wood .. Bagasae 333 333
lI-Jla_' · 887 333 3M
32 Total 1,000 500 411:9 71
I-AU FuehIPo'Wff' 250 38 179 315
(c) CoaJ. Wood '" lIapsse 0 2ISO 36 179 35
II-At"""",' , '160 404 250 36
34 Total 1.000 931 611S 1114.
I-AU Fuelsl Po.",r 538 77 307 1M
Cc) Coal. Wood &;]3agaaae 538 '17 307 154
Il-JIla_l · 462 164 308
35 'lotal 1,000 1.000 I-AU FuJ.!Pofl1ef' 500 500
<II) ElsatI'IoIty . 1500 500
II - Jla"" · 500 500
38 'rotal 1.000 1500 489 4.1 20
. 1-AU J'w I PDfI1ef' 671 2415 218 10 110
(0) E1eotriaity . 166 20 245
(e) Coal, Wood &; Bag- 308 226 61 10 110
lI-JloRvaZ 429 255 143 31
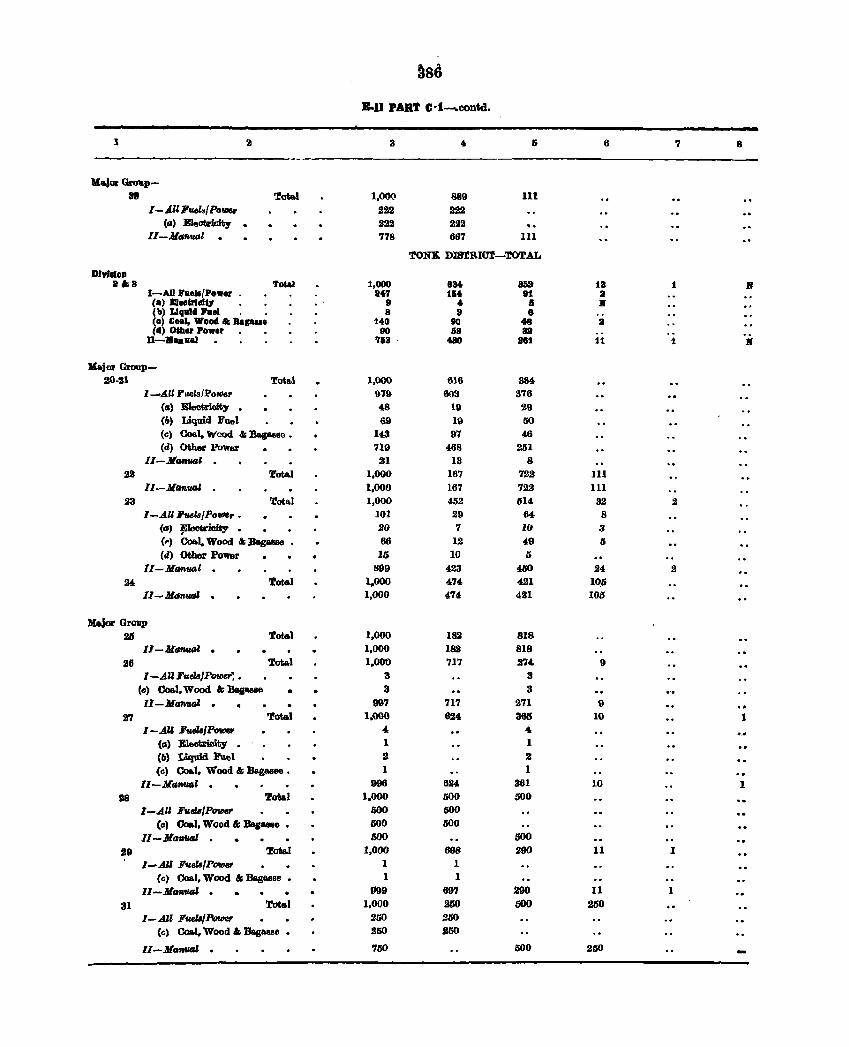
~86
B .. U PART (l·1_CODtd.
1 2 3 4 5 B 7 8
Major Grftp-39 Total 1,000 889 111
1-A.II Fuek{ POID8r 222 222 (a) E1eotricit:r .. 222 2112
11-JitJtl1I41 778 667 111
TONK DIS'lRIOT-TOTAL
Dlyflloll 8.8 Tota! 1,000 8840 au 18 1 • I-All Paoll/Pe.or " 817 11i4 91 Ii
Ca) B1 .. trfoJi7 9 4 a x (b) LIquid Pue! 8 8 8 "" (0) Coal, Wood &; ........ 140 90 48 a (d) Otber Power 90 58 aa
11-.,,88) '168 480 881 11 1 If
Major Group-20-21 '.I!otal 1,000 616 364
I-AU FuelB/POlll6r 979 603 376 (a) Electrioity . 48 19 29 (II) Liquid FUel 69 19 50 (c) Coal. Wood & Bag&llse • 143 97 46 (d) Other Power 719 468 251
11 -MatlllGl . 21 13 8 22 'rota! 1,000 167 722 111
lI-MGtiUGI 1,000 167 722 111 23 Total 1,000 452 614 32 2
l-A.III'U8l8/PotDer • 101 29 64 8 (a) ¥leotrioity • 2Q 7 10 8 (,,) Coal. Wood .I; Dagus. • 66 12 49 5 (d) Other Po'lhlr 15 10 fj
11-MGtI'IIQ,Z 899 423 400 24 2 24 Total 1.000 474 421 1~5
Il-MGnUDI · 1,000 474 421 105
M6jor Group 28 '.I!otal 1,000 182 818
Il-M_Z · 1,000 182 818
26 Total 1.000 717 274 9 I-.AU Fudll/Power: • 3 3
(c) Coal. Wood & "Bag&llBe • 3 3 Il-Mo_Z · 997 717 271 9
27 Total 1.000 624 360 10 1 I-AU FudillPOtDer 4 4-
(0) Eleotricity . 1 1 (lI) Liqldd Fuel S 2 (c) Coa.t. Wood & Bagaase • 1 1
II-MfJ_Z · 996 624 361 10 1
sa 'rota! 1.000 500 500 l-A.U Fudll/P_ &00 500
(c) Coa.!, Wood" Bas-e • &00 500 II-ManfUl' · 500 500
29 TotaJ 1,000 698 000 11 1 I-AU FudllfPow,r 1 1
Ccl Coal, Wood & Begus •• 1 1 II-AlfJ1I1I4Z · 999 697 200 11 1
31 1'ot.1 1.000 250 500 250 I-A.ll Fu.elIfPower 250 250
(c) Coal, Wood &: Bagasse • 250 J50
Il-Ma_Z · 750 500 200
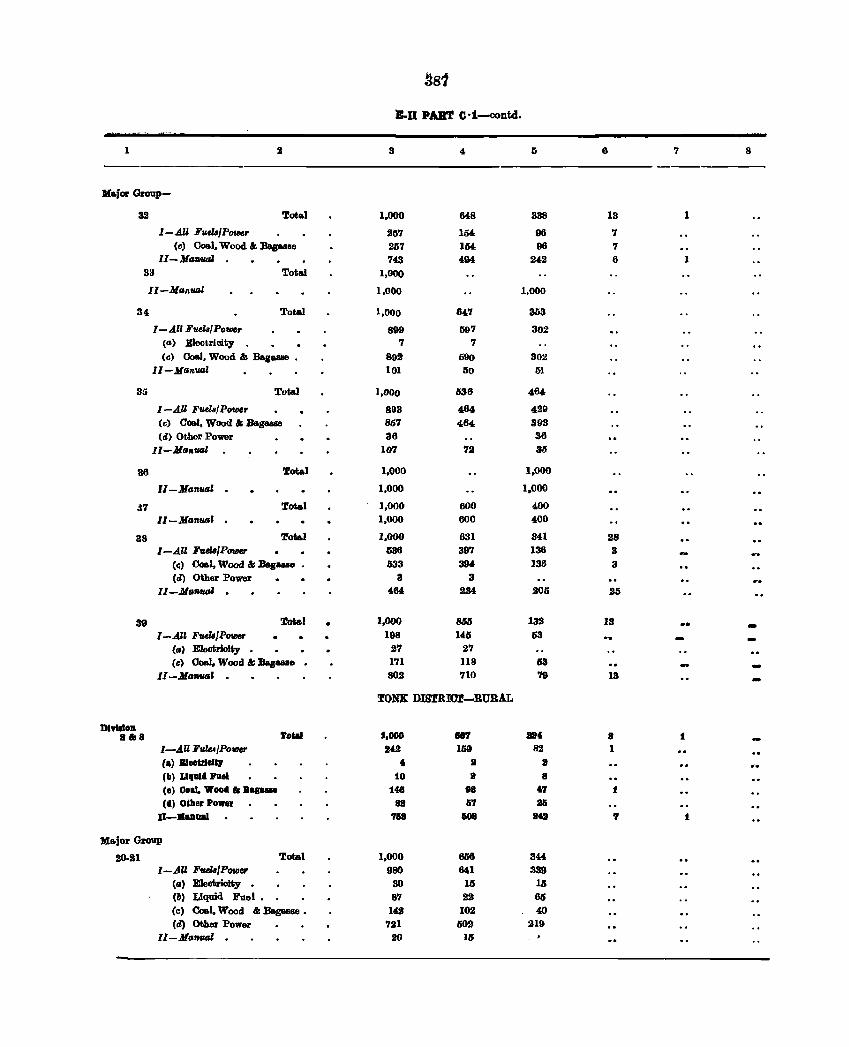
~81
B-O PART C·1-contd.
1 2 3 " I) 6 7 8
Ka.jOl' Group-
32 Total 1,000 648 338 13 1
I -.AU Fud8/POfIJ6r 257 1M 96 7 (c) Coal. Wood &; Bapsae 257 1M 96 7
II-Ma7W4l 743 494 242 6 1 33 Total 1,000
II-Manual 1,000 1,000
34 Total 1,000 647 353
I-All FvelafPoV16r 899 597 302 (a) Eleotricity . 7 7 (0) Coal, Wood &; BagllollllO • 892 590 302
II-ManllBl 101 50 51
35 Total 1,000 536 4f14.
I-AU Fvel8fPolAJ6r 893 484 429 (c) Goal, Wood &; Bagasse 807 464 393 (d) Other Power 36 36
II-ManvaJ 107 72 3li
36 Total 1.000 1,000
II-MeI"'!u"" 1,000 1.000
&7 Total 1,000 600 400 II-Manual 1,000 600 400
38 ~ota.1 1,000' 631 341 28 I-All Fuel8/P_ 536 397 136 3
(q) Coal, Wood &; BapsIlO • 633 394 136 3 (d) Other Power 3 3
II-JJlanual · 464 234 205 25
39 Total 1,000 8S5 132 13 .. I-An Fvd8/P_ 198 145 53
(a) Eleotrioity . 27 27 (c) CoaJ, Wood &; :Bagasse . 171 U8 113
II-JJlamud · 802 710 79 13
'l!ONK DIS'l!RIOl-RURAL
D1Y1110D lUll 8 Total 1,000 887 U, 8 1
I-AU F~/PoIII8J' 242 159 82 I Ca) B1HUlell7 , 8 8 .'. (II) L1llutl hel 10 8 8 (e) Coal. Wool ••• g .... 148 98 47 1 (d.) O&her Power U &7 85
II-Man1lal 7118 &08 8. 7 1
Ma.jor Group
20.21 Tot&l 1,000 658 344 I-All Fud8/POrDer 980 641 339
(eI' Eleobrioity . 30 15 15 (b) Liquid Fuel. 87 22 65 (0) Coa.l, Wood "Bagasse. 142 102 40 (d) Other Power 721 502 219
II - MafIfIGI · 20 15
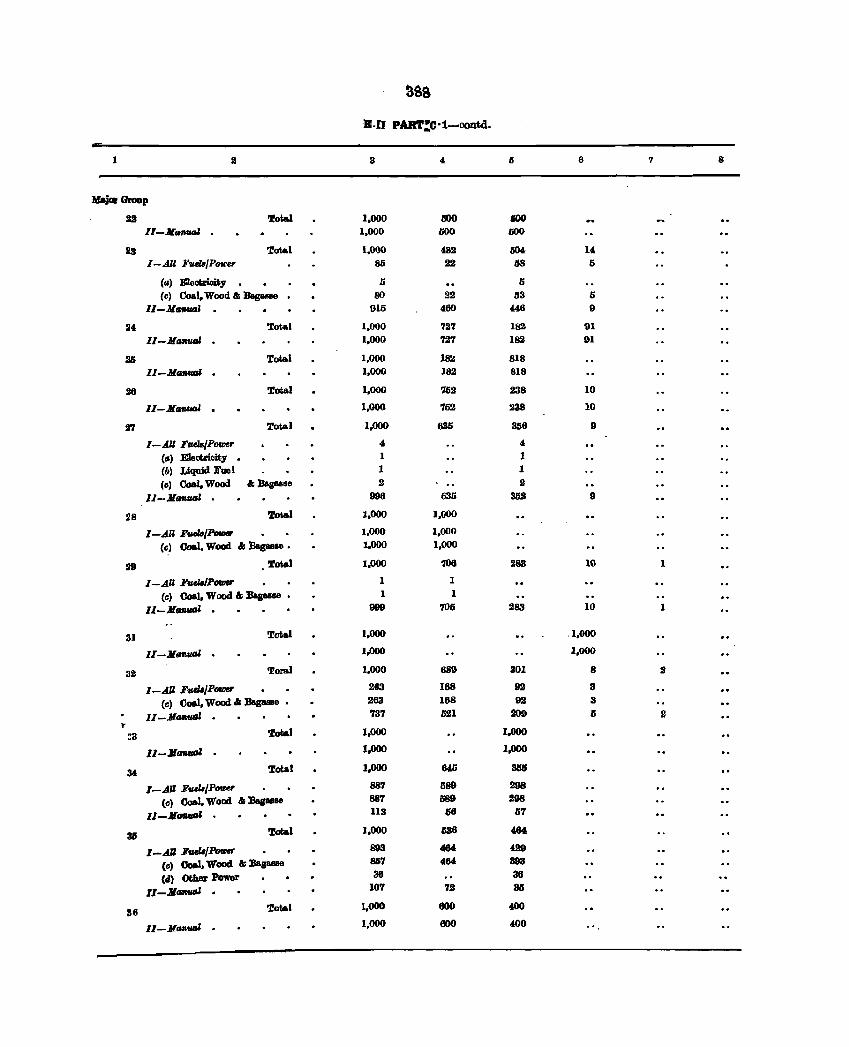
ass
B·II PAIl'l'!O·1-00ntd.
I 3 4, 6 6 7 8
Jlajaao GIOap
St '&tal 1.000 t!OO iOO
Il-MMtUGI 1,000 000 000
23 Total 1,000 482 504 14
I-All Futla/PowU' 85 22 68 5
Ca) E1eol;rioit.y . 5 5
Cel Coal. Wood 6; Bagasse 80 22 53 5 Il-Mg'MUJJ 915 460 446 9
24 Total 1,000 727 182 91
Il-MgJ6Utll 1,000 '12'1 182 91
25 Total 1,000 18:1 818
ll-MaJ6Utll · 1,000 182 818
28 Total 1.000 '152 238 10
II-Mrr.fI.fIDl · 1,000 '752 238 10
l!'1 Total 1.000 635 358 9
I-All Fuels/Power 4 4,
(g) E1eotricity . 1 1
(6l Uqoid Fuel 1 1
(cl Coal. Wood 6; ]la.gssse 2 2
II-14grwal · 998 635 352 9
28 Total 1.000 1.000
I-.AU EtH16/~ 1,000 1.000
(cl Coal, Wood 6;:Bac-e. 1,000 1,000
S9 Total 1.000 '108 283 10 1
I-AU EutlalP_ 1 1
(cl Coal. Wood 6; Bas-se • 1 I
ll-14nual 999 705 283 10 1
31 Total 1.000 .1,000
"-14g",_ 1.000 1,000
32 'loral 1.000 689 301 8 .I
I-.AU EuelB/P- 263 168 92 3
(c) Coal. Wood" Bagasse. 263 168 92 3
ll-JlGfiUGl 737 IISI 209 5 :I r ~3 'lolial 1.000 I.OOO
lI-MGfiUGl 1.000 1.000
34 Total 1.000 640 3M
I-.AU FtUlB/P- 887 1189 298
(c) Coal. Wood 6; :BasllBe 887 1189 298
l1-.IInflll' 113 sa 67
311 Tolial 1.000 538 464
I-.AU FuelB/P- 893 484 429
(c) Coal. Wood &; :Bag_ 857 4" 89a
(Ii) ~ Power 36 36
II-MfJfIfIIU · 107 7.1 311
36 Total 1,000 600 400
II-MnuGl · 1,000 600 400
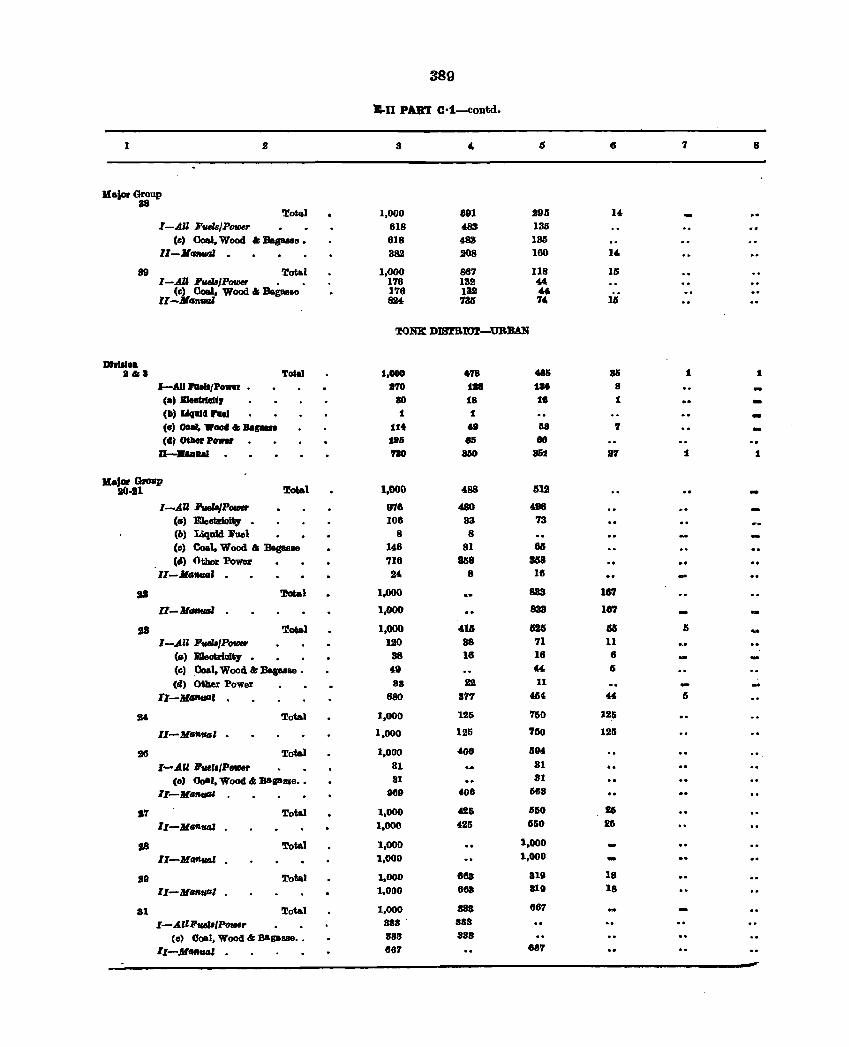
389
B-II PART C·1-contd.
1 2 3 , 6 6 7 8
lIaJor Group 118
Tot.l 1,000 691 295 U I-AU FudB/P_ 618 483 135
(Il) eo.!. Wood & Bagasse. 818 483 135 II-X-' - 382 J08 180 l'
39 Total 1,000 867 118 15 I-AU I'ud8/P_ • 176 132 44.
(0) Coal, Wood & Bagasse 176 132 44-l,-Jflln_ 824. 735 7' III
'lONK DIS'.fRIOJ!-UBBAN
01'l1li0. 2&8 Total 1,000 678 48& 8& 1 t
I-AU ...... 'PoWir 8'10 118 lit 8 -(a) Blee&rleUr 80 la l' 1 -(II' LlqalC 1'1111 1 t -(Il) ooar. Wood '" Bapue ut .. 118 '1 -(II} otJaer Po_ 18& as 80
II-... UI '180 a&o 8&1 27 1 1
lIa,m GIoap 'lotal 1,000 488 1512 10-111 -
I-AU~P_ 97' 4BO '" (II) Eleotrioity . 106 33 73 (b) Liquid Ji'oel 8 8
(0) Coal, Wood I; Bagaaae 148 81 81 (II) Other Powat 716 858 858
II-MllflUtli II' B 18
SJ 'l!otal 1,000 883 167
II-Jl_1 1,000 833 187
IS 'l!otal 1,000 4U 1511 M I)
I-AU Fuels/P_ 120 88 71 11
(II) lIDeotriaity • 38 16 18 6
(e) Coal, Wood I; Bagaaae • '9 " 15
(tI) Other Power 88 S2 11
CI-M/IftUII1 880 811 4114 44 6
S, Total 1,000 12& 160 126
1'-MII'flU/d . 1,000 125 760 125
28 Total 1,000 406 694 .. I-All 'w,./PfIIHf' 81 81
(0) Ooal, Wood 01; BIIP"e •• 81 31 II-M __ ' 989 408 1163
87 Total 1,000 426 6110 16
1.l-MtJftUQI 1,000 425 1560 26
lIS Total 1,000 1,000
lI-Mf&ftual 1,000 1,000
S9 Tota! 1,000 8ea alit 18
II-M4,..",1 1,000 888 a19 18
81 'lota! 1,000 888 861
I-AIIPuelI/P_r 883 - 888
(e) 00&1, Wood .I: B8.gaue •• 888 888
II-MtJflUlJl . 86'1 88'1
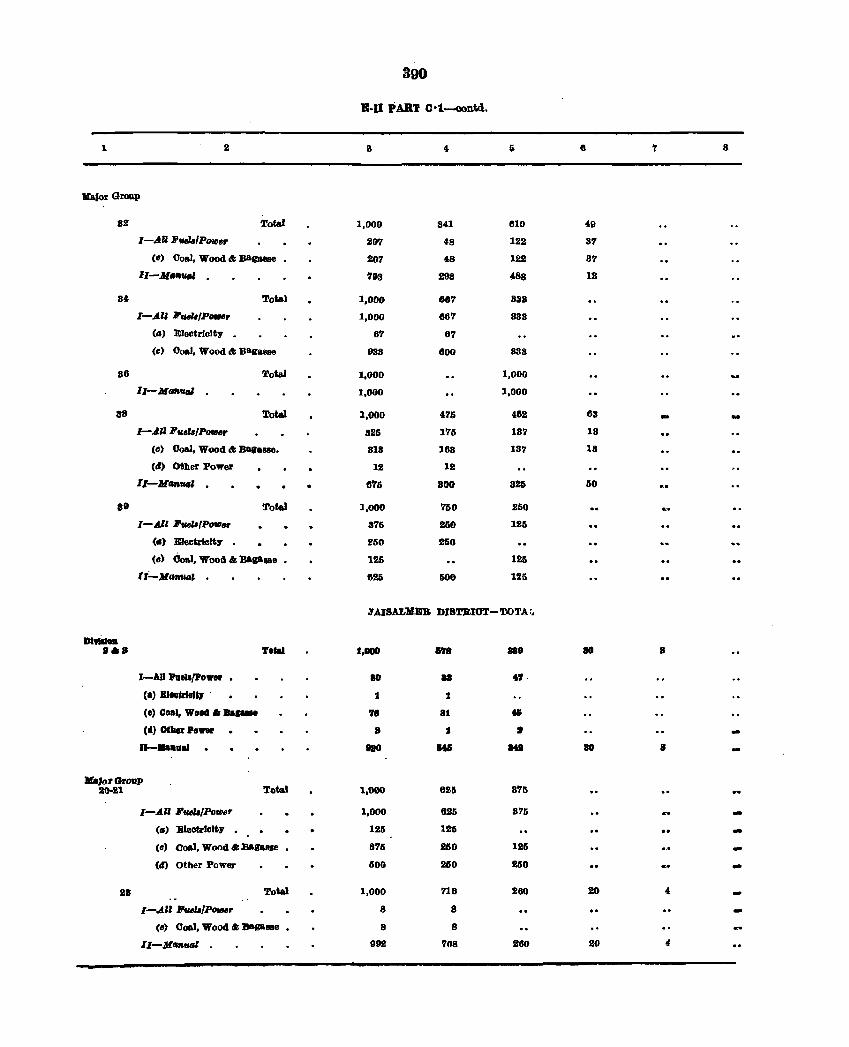
390
B·II PART C·l--contd.
1 2 8 6 T 8
KaJor Groa.p
8S Total 1,000 341 610 49
I-AU FaelBlPOU/er 207 48 122 37
(e) Coal, Wood &; B&PlI8e 207 48 122 87
I1-M.",,' . '198 293 488 12
34 Tou) 1,000 667 838
I-All 'ruhlP9IIItlr 1,000 667 988
(II) Electricity . 67 07
(0) Ooal, Wood &; :Bagasse 988 600 988
80 Total 1,000 1,000
11-Mllflulll 1,000 1,000
88 Total 1,000 475 462 63 -I-All F,,"'/PoIDer 825 175 187 19
(Il) Ooal, Wood &; Bagasse. S19 108 187 18
(II) Other Power 12 12
II-Mil"'" . 0'15 800 825 50
89 Total 1,000 '150 260
I-All 1!uel'fPolllflf' 876 260 125
<II) Electrfelty 260 a60
(0) Ooal, Wood &; naP88e 1260 121>
l,:.._ JlfIlm6ll' 625 500 126
J"A.ISALMEB DIBTltIOT-T.OTA;.
019111_ •• 8 To'" :1._ 178 888 80 8
I-All h.lIlPo .... ' • 80 88 40' . (.) B1 .. M"1J . :I :I
(0) Coal, Wood ....... 71 8t t.5
'd) 0'1Iar Power 8 :I • 11-...... - 141 HI 80 8
.'01' GrOll]) 20021 Totel 1.000 626 8'115
I-All F",IIIPoID,r 1,000 6116 876 -(II) Eleotriclty . 126 126 -(0) coal, Wood lit lIalalule 875 . 260 126 -(II) Other Power 500 250 260 -
28 Total 1,000 716 260 20 4,
1-.An I!'uelI/P_r 8 8
(0) Ooal. Wood cI; Basa88e 8 8
11-M"""'" 90S '108 1160 20 "
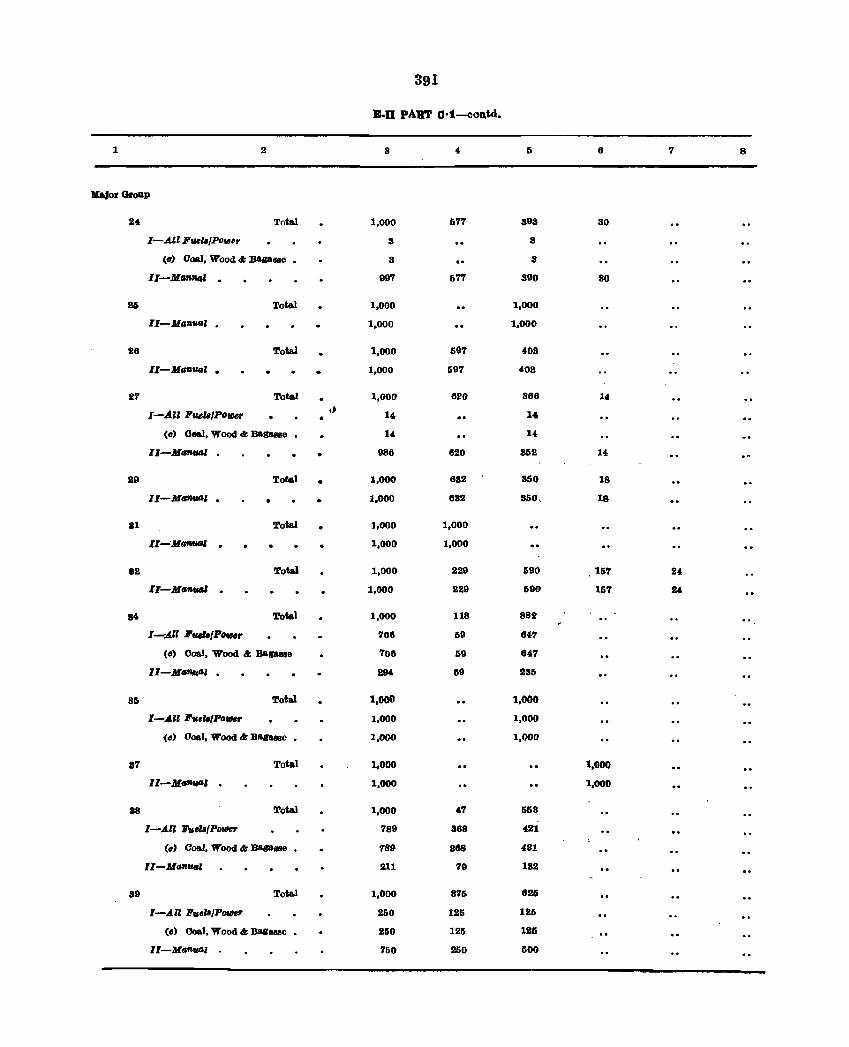
391
B-II PART C·t--colI,td.
1 2 3 4 I) 8 7 8
Ka,JorQroup
24 Total 1,000 677 893 30
I-AU J1'u.eU/Pol/Jer 3 3
(If) Ooal, Wood &: Bagasse 3 3
II-lIlafl"'" · 997 677 890 30
26 rotal 1,000 1,000
II-lIlaflVG' • 1,000 1,000
28 Total 1,000 ti97 408
11-MGflfllJZ • 1,000 697 40S
a7 Total 1,000 8.20 368 14
I-AU PueIBIPoUler "' 14 14 • (c) Oeal, Wood &: Bagasse 14 14
II-MGfItIIJ' 988 820 852 14
29 !rotal 1,000 632 350 18
II-MIlflUGI • 1,000 832 S50, 18
81 Total 1,000 1,000
II.......;Ma-' · 1,000 1,000
82 Total 1,000 229 590 167 24
lI-MafIUIIl · 1,000 229 590 157 24
84 Total 1,000 118 882 .. I-All 'fItIIa{Potller 706 69 647
(e) (loal, Wood &: BaIl8B8e 708 59 647
11-MGtlWJI . 294 69 285
31i1 Total 1,000 1,000
I-A" P".u/Potller 1,000 1,000
(e) Ooal. Wood &: lIapsse • 1,000 1,000
87 Total 1,000 1,000
II-Ma'llfllli · 1,000 1,000
18 Total 1,000 47 653
I-AU Fv.el,{PorMr 789 868 421
ell) Ooal, Wood &: Ba.Blle 789 388 421
II-lIlGnfllJZ 211 79 1S2
89 Total 1,000 876 625
I-All F"eI'/PDUler 250 125 126
(c) Ooal, Wood &: lIag.Me • 260 125 125
II-Manual 750 250 500
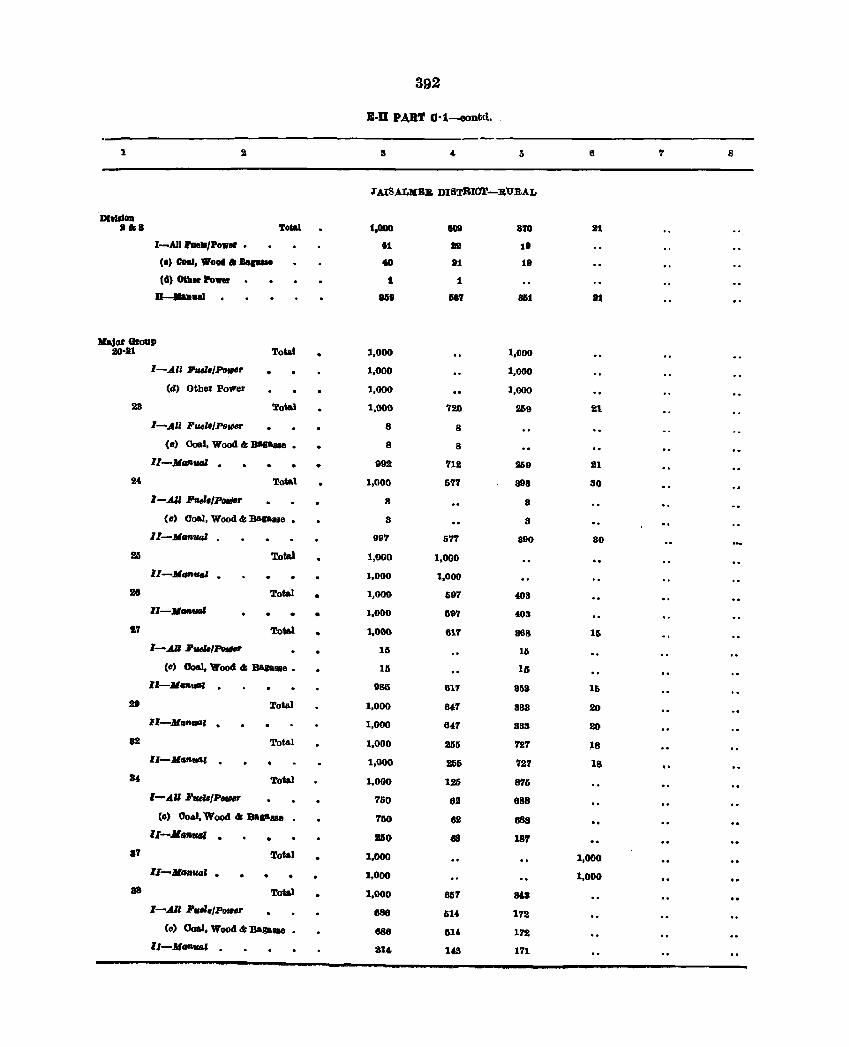
392
BoU PART O·1--oontd.
1 IS 4- 5 6 '1 8
J" AISALKBB. DIBTBIO'l'-B,URAL
Davilla I.a To&al 1.000 8CJ8 870 21
I-All ~eIl/Po.. • '1 8B 18
(e) COal, WeH ,. ...... 60 11 18
(I) other Power 1 1
O-... aaI 86' I" 1IS1 It
lllaJor GrouP 2Mll Total 1,000 1,000
I-.All rwz,/PotISr 1,000 1,000
(d) otbe:r Po1Ve:r 1,000 1,000
23 To.l 1,000 '120 269 21
I-.All lI'u.ell/Po_er 8 8
(III) Coal, Wood & BA....., 0 8 8
11-111""_ · • 992 '112 269 21
1M Total 1,000 5'17 898 so 1-.AIl ~./PotMr 8 8
(III) 00&], Wood & BaP88e • 8 8
1'-1IIGntlld • 997 677 890 80
2li Total 1,000 1,000
ll-M_fIIIl 0 1,000 1,000
20 Total • 1,000 697 403
I1-M ....... • 1,000 1197 408
27 Total 1,000 617 868 16
I-.AU , .... ,PatMr 15 II>
(III) 001II1, Wood & DAgaMa. 111 us IJ-Kart4fGI · 981S 61'1' 858 16
211 ToW 1,000 64'1 888 20 11-.111_, · 1,000 64'1 888 20
82 Total 1,000 255 727 ;18
U-MllftUII' · 1,000 256 727 18 84 ToW 1,000 125 876
I-.AU lI'uelI/Pornr 750 02 688
(0) Oul, Wood & B.,,_ '150 68 688
11-"""_ · 1110 88 187 87 Total 1,000 1,000
II-Jlllllu(d • • 1,000 1,000
88 Total 1,000 611'7 H3
1-.A1I J!'u,Z./P_r 686 6U 1'12
(0) Ooal, Wood & Daga_ 686 111& 172
II-M"''',II · 314- 148 171
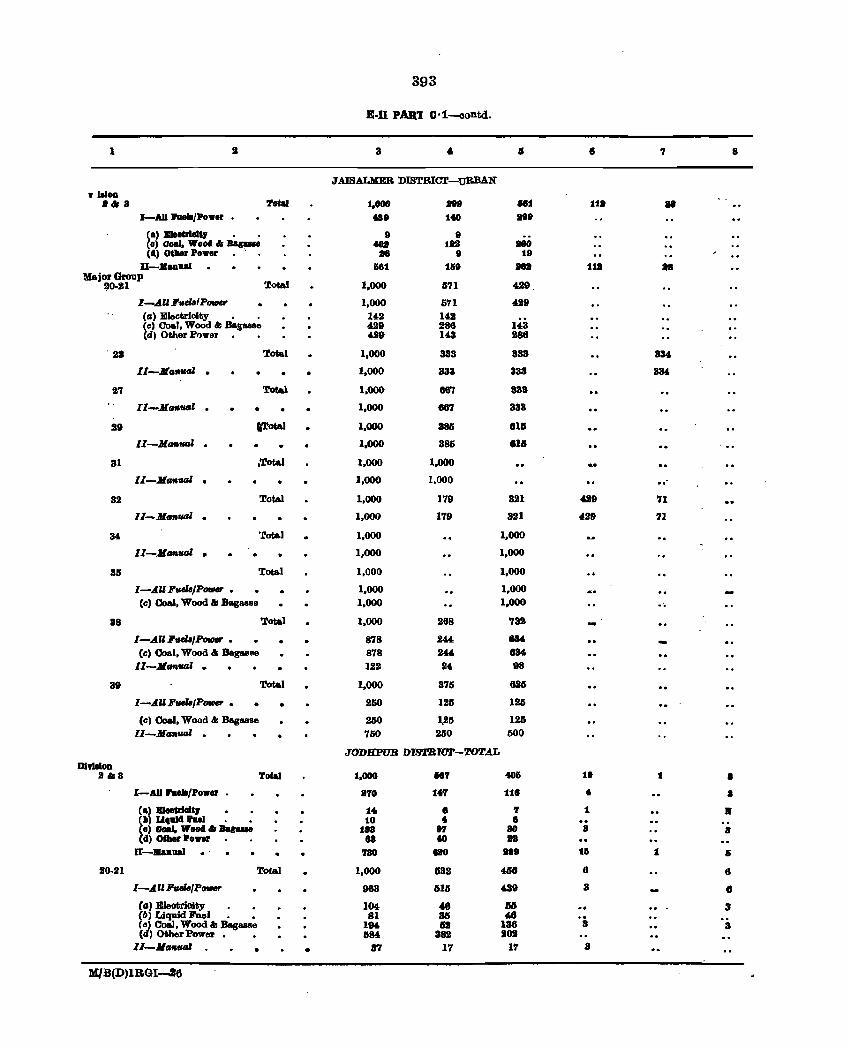
393
Bon PAR'I O·1--oontd.
1 3 4 • e 7 8
JAISALMER DIBT.BI<1r-tJ'RBAN 'f Won
•• a Total 1.00D ue 581 11 • II 1-A11I'DeIi/Power • 688 140 :aBe
(a) BIeeUllIu • • 8 8 Ce) 00lIl, Wood.. Bac-e to. 182 180 (tl) CHher Power . as 8 18
U-.anDai 1S81 11S8 au 118 18 Ma.jorGroup
;0-21 Total 1,000 571 429
l-A,,'.,.elBIP_ 1,000 571 429 (0) Electrioity • . 142 142 Cc) Co&l, Wood &-. .Ba.gasso 429 288 143 (tI) Other Pl)wor 429 143 288
. 23 Total 1,000 333 333 334
II-MaflUGl · 1,000 333 333 334
27 Total 1,000 867 333
II-MGfffllll · 1,000 687 333
29 ITotal 1,000 385 811S
II-M_ul · 1,000 385 11.6
31 ,Total 1,000 1,000
II-MGffaGI · 1,000 1,000 .. 32 Total 1,000 ]79 321 <09 71
II-M __ · 1,000 179 321 429 71
34 'rotal 1,000 1,000
II-Mofluol • • 1,000 1,000
35 Tot&l 1,000 1,000 .. I-A",uelBIP_ • 1,000 1,000
(c) Coal, Wood &-. Blllasso 1,000 1,000 .. 38 Total 1,000 288 732
I-A" FuelB/P_ • 878 244 884
(0) Coal, Wood " Bagasso 878 244 834 II-MMlul · 122 24 98
39 Total 1,000 371S 825
I-A"FuelB/P_ • • 250 125 125
(c) Coal, Wood &-. Bagasse 250 ).25 125 II-MoJlUGl · 750 250 500
JODHPUB DIS'mIC'F-TOTAL Division
1"18 Total 1,000 1587 401S 1. 1 • 1-A11 Pull/Power • 870 14'l' 118 • a (.) BleetrllIU 1. • ., 1 • (II) LlIJDltl rail 10 • • (el 001II, Wootllr .._ 1.a 87 80 8 a (a) other Power U 40 aa
II-Manual .. 780 GO .. 8 16 1 &
20-21 Total 1,000 532 466 6 6
l-.AnFuW/P_r 963 615 439 3 1
(a) :BIeotrioity 104 48 M 3 (6) Liquid FUel • • 81 35 46 (~ CoaJ, Wood &-. Bagasso 194 II! 136 11 3 ( ) Other Power. • 684 382 202
lI-MGfffIGI • • B7 17 17 :I
M/B(D)1 BGI---26
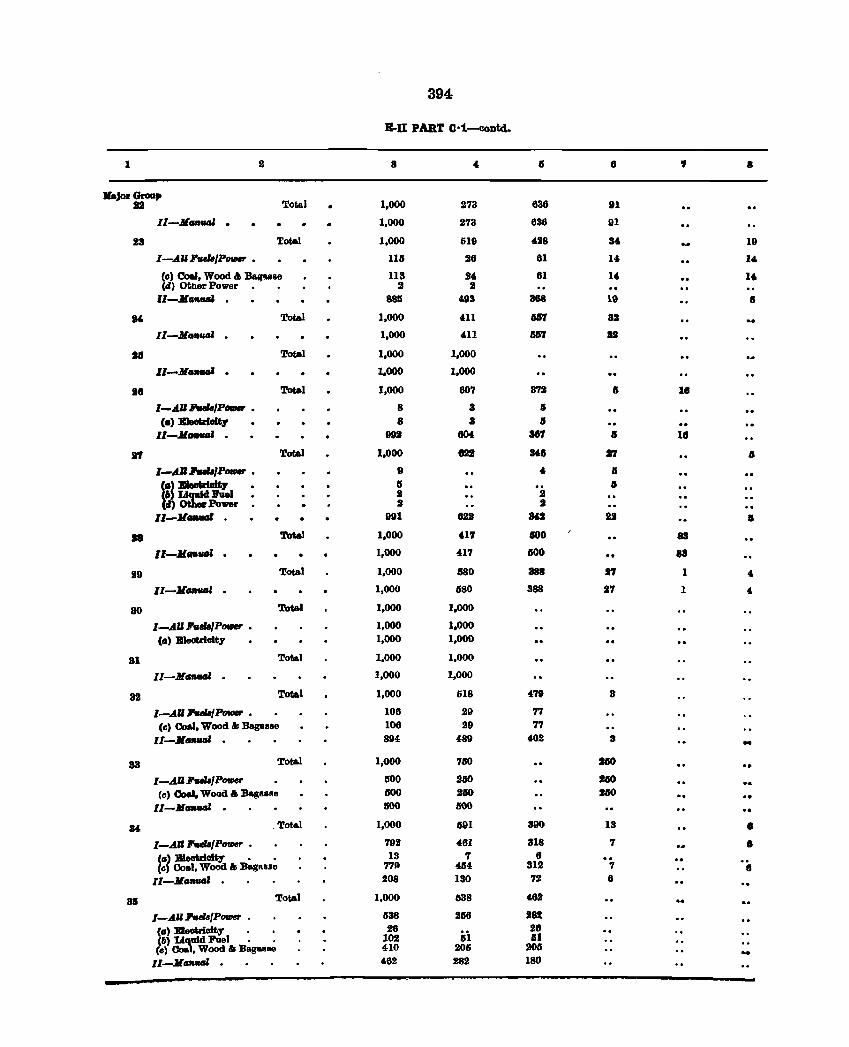
394
B·Il PART (l·1-contd.
1 2 8 4 a: 6 , 8
"JMOroa" II Total 1,000 273 636 11
11-MGfI'IIIJ' · 1,000 273 636 91
23 Total 1,000 519 4118 34 19
l-An"",,-/p_ • 115 26 81 1" 14
(c) eo.I, Wood" BalJ&818 113 24 81 14 16 (d) Otber Power 2 2
11-..1( __ · 885 4,93 3G8 19 8
!40 Total 1,000 4,11 IilS'I 32
11-..I(GfI'IIIJI · 1,000 4,11 887 U
II Total 1,000 1.000
1'-M""" · 1.000 1,000
Ie Total 1,000 807 372 8 18
I-AU"',PorNr • 8 3 II (.) BleoIdc:lty 8 a •
11-..1(-' · 092 804 38'1 a 18
17 Total 1,000 622 M8 27 a I-AU"'/P- • 0 " II
\:J~I 0 8 OJ a
J If) Power 2 2
I1-M""" 001 022 ad II • 18 Total 1,000 4,l7 1100 83
Il-Jl .. "", 0 1,000 417 1100 81
29 Total 1,000 880 888 27 1 4
l1-Jl..."z · 1,000 580 388 27 1 4
80 Total 1,000 1.000
I-AU ",_/P",.. . 1,000 1,000 (.) BIeotricity 1,000 1.000
31 Total 1,000 1,000
11-M""'" · 1,000 1,000
32 Total 1,000 618 '" 3
I-AII"../P- . 106 29 77 (c) Coal. Wood'" ]Jag1811e 106 29 77
11-11_"'" · 804, 4,89 4-02 3
33 Total 1,000 710 2IJO
I-AII"../P- 800 250 J80 (c) eo.l. Wood" BagRIRe 800 280 280
11-1IGflUZ 0 800 soo
34, . Total 1,000 891 390 13 • I-All "../P- . 792 461 318 7 • (8) Bleotrialty • • 13 7 8 .. (c) 00.1, Wood'" B.gl\8se 779 4114, 312 7 8
11-1Io.tUJl · 208 130 72 8
38 Total 1,000 638 482
I-All heR/P_ . 538 216 2S! (0) EleoWialty • • 26
isi 28
(1I) L13u1d Fuel • • 102 11 (c) eo. , Wood'" B.guR8 410 205 20$ ..
II-118ft"'" · 4,62 282 ISO
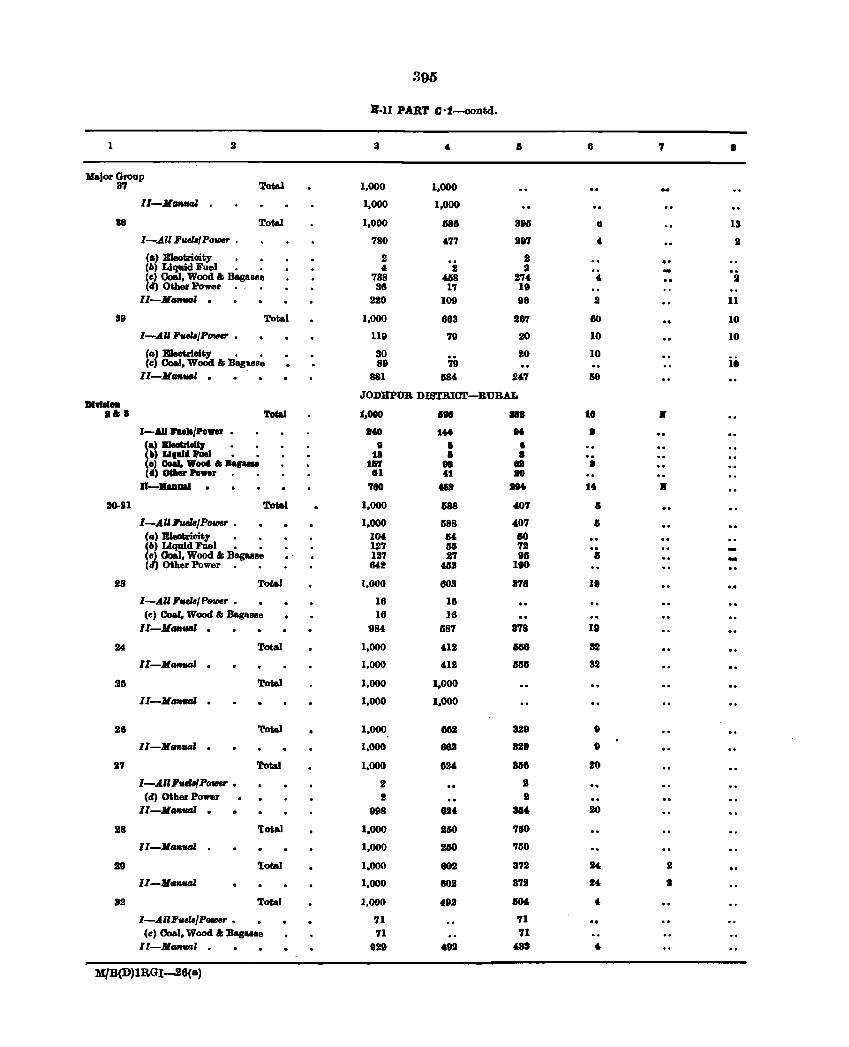
395
B-ll PART CH-oontd.
1 2 8 40 I 6 7 • Kajor Group
Tot&l 37 1,000 1.000 II-JltlfltUJl 1,000 1,000
as Total 1,000 686 395 tI 13
I-AllF •• ,Po_ • 780 477 287 4 2
(.) RIeotrioity 2 2 .. (6) Liquid Fuel • • 4 2 2
'i (c) 00aI. Wood & Baga.sQ 738 4G8 274 , (d) Other Power •. • 36 17 19
II-JlI&ftUtJl · 220 109 98 2 11
39 Total 1,000 883 267 80 10
I-AU :r •• /POWf' • 1111 79 20 10 10
(II) BJeatrioity • • 30 .. 20 10 i. Cc) Coal. Wood & Bagasse 89 79 II-Jl.atUJl · 881 1M 247 150
JODHPUR DISTRICT-RURAL DlwIII ..
1&8 Total '.000 I. 188 tI • I-All .... ~/Power • . .., 1 ... M • (.) BIee&rfel9 • • 8 I • ~b) ... , .. d :rael • • 18 I , ..
e) eo.I, Wood oil ....... 117 88 n • (d) otIIH Power 81 401 10
D-... ua1 'leo 4U ... 1 .. • IO-IJl Total 1.000 688 407 G
l-AUl'uiU/Powr • 1.000 1588 407 I;
(G) Eleotrimty 104 I' 150 (6) Liquid Fuel • • 127 II 72 .. Cc) Ooal, Wood & Bagasse . 127 27 91 a -(cl) Other Power. • 642 412 190
23 Total 1,000 603 878 19
I-AUFaela/P_r. 16 16 (e) Coal. Wood & BagasBe 16 16
1I-1t(tlfltUJl · 984 1587 378 19
24 Total 1,000 412 1158 82
II-JltJrIWIl · 1,000 4U 15158 32
gl Total 1,000 1.000
II-JltIfWal · 1,000 1.000
28 'l'otal 1,000 882 329 .. II-Jluul · 1,000 882 829 0
117 Total 1,000 624 8116 10
I-A"' •• /Po_ • 1 I " (If) Other Power 2 2
II-Jl_tml · 998 824 3114 20
28 '[atal 1,000 150 7110
II-JltI"'IMd · 1,000 210 750
29 'lotal 1,000 602 37. 14. 2
II-JlG"_l 1,000 60. 87. 24 t
32 Total 1,000 49J IJO& 4-
I-All:r •• /P_r • 71 71 (c) Coal, Wood & Baguse 71 71
I1-JlGJltm' · 929 492 4SS " MfB(D)lRGI......26( .. )
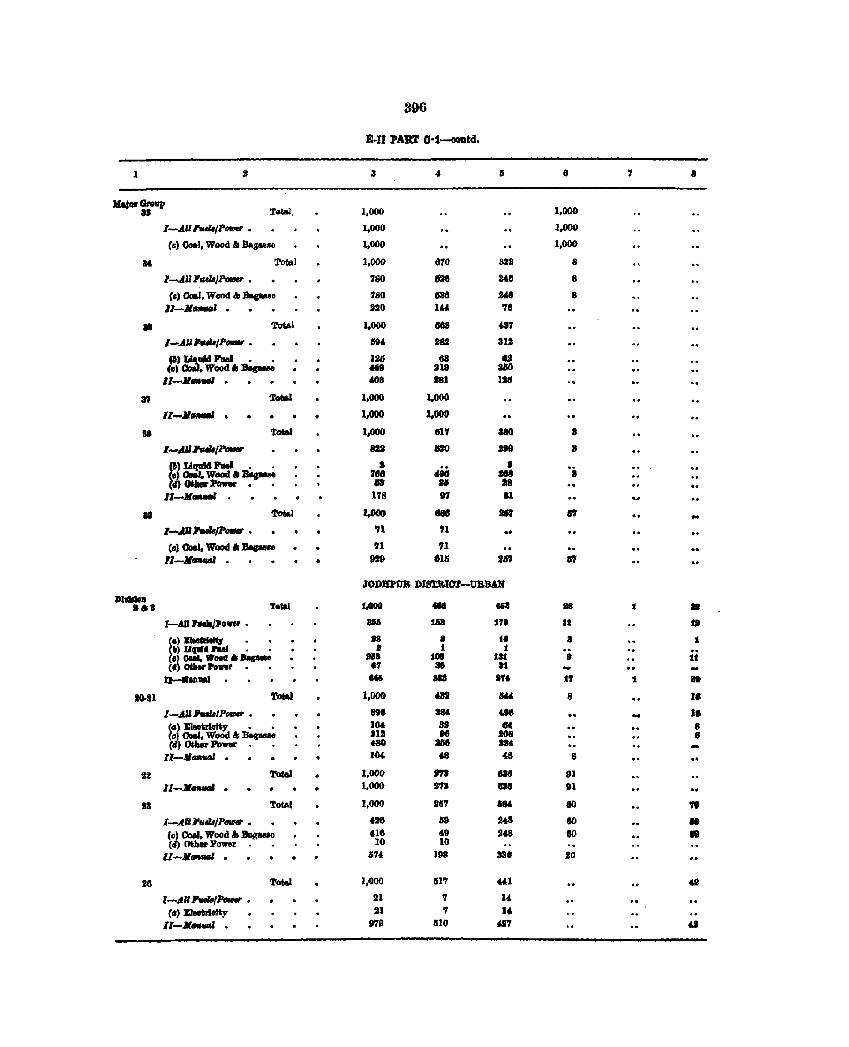
396
E.I1 PAll! a·l-ooDtd.
1 3 4 IS " 7 8
ar.jCIIGtoap 31 T .. taI, 1,000 1,000
l-AlIFruJ./P_ • 1,000 1,000
Cc) eo.l, Wood II Bagllllse 1,000 1,000
If, Total 1,000 670 322 8
l-AllllrulllJP_ • 780 no 248 8
,.) 00&1, Wood ., Bagas.e 780 IJ36 WJ 8
11-11 .... ' · 220 1" '18
• 'lotIo1 1,000 GGS 4.37
I-AU,..,P_,. • 1184 282 312
tt) ::'aid JI'aaI • • ISO 63 eJ (., , Wood oil Deg..11 .. , 218 i4IO
11-11 ..... · &08 lSI l~
3'1 Tote.l 1,000 1.000
Il-JI.,.., · 1,000 1,000
38 Total 1,000 817 380 8
l-A""'JP- m IJlIO - 8
§) Uq1d4 Jl'ael " • 8 48i • "i I Coal. Wood ...... 11 788 -II) ~;J;>cnrer. • 118 16 .8
11-."'" 178 117 81
It '.l'GtAI 1,(100 ... U1 1J'1
l-AU""/P_ • n 71 ... (a) 00eJ. WCIOiI " :s.p..e '11 '11
11-11"""'" · 9!9 018 257 ff1
JODHPUR DIS'X:&IO't-VltBAN DI ..... t., '.ea1 f_ ... ti' 18 t •
I-AII ... /Pa_ • au 1" 1'1' 11 .. (a) IltICIIeKr • • J8 8 ,. a t f") UqafC I'IIAI • • It 1 1 .. .. II om. .,004 ........ lliB 108 131 • tf
(II) other Panr 8' .. 81 -U-.uuJ 1M 818 I't fT 1 10
10·21 TotA1 1.000 G2 IIU 8 I.
l-AllIwIIIP_ • 898 38& 496 I. (4) BIeatrfaf$J' • • 104 81 6C 8 Ccl 00IJ. WoOd .t B6gaese SIll 98 !OS 8 (tI) Otbez Power 480 lIM 1M
l'-JltJM8l · 104, " 48 8
liZ 1'01&1 1,000 J'13 836 81 ll-Jl __ • 1,000 ''7' 838 91
II TotArol 1,000 114'1 liN SO .,. l-Allh,z,/PtlllMt' • .28 li9 248 eo •
(Gl Coal. Wood &I BagU'1I '16 '9 '48 80 118 (tI) 0Ui .. Power " . " 10 10
Il-Jl __ · 57. 1118 338 10
18 '!'oW 1,000 1117 «1 48
I-All ,..,"- • II '1 14 (II) m.mkdty 21 ., 14
l1-Jl __ · 979 1110 417 .,
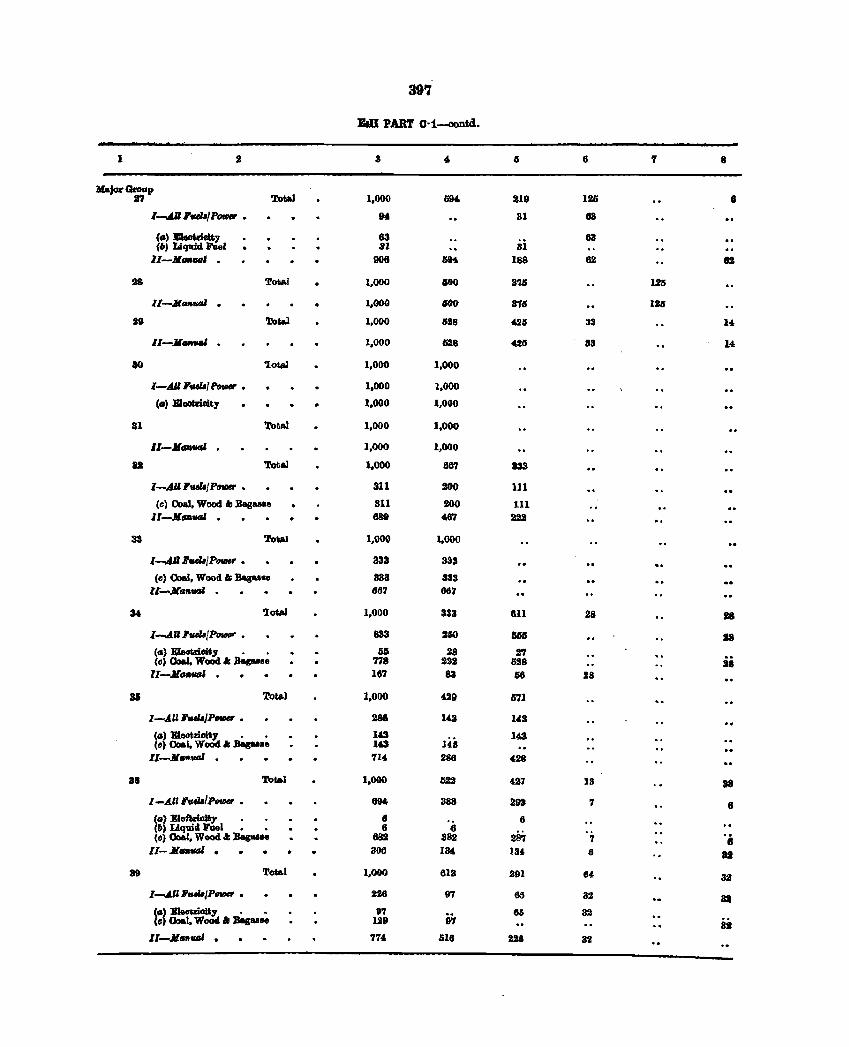
39'7
lWI PAR! O'·1--oontd.
1 It 3 4. 6 , 8
HaJorGmap 17 'lotal 1,000 694. 219 lItO •
1~lIr""IP_ • N 31 83
(G) Deotrillity 63 63 (6) Liquid FUel 81 31
11-J1_fIQJ · 908 684 188 62 U
28 '.I!ofoal 1,000 600 376 125
lI-Jl_fItII · 1,000 GOO 814 ISjJ
It Total 1,000 lI28 4JlI 33 U
11-.__' · 1,000 528 42lI 8a 14
ao 'Iota! 1,000 1,000
I-All FfUlaf f'orMr • 1,000 1,000
(G> EllIDtrioit3' 1,000 1,000
31 Total 1,000 1,000
11-11-' 1,000 1,000
U Total 1,000 86'1 833
l-AU''""fP_ • 311 200 111 Ccl OoaJ, Wood II Bagasse 811 200 111
I1-J1_WII · 689 487 222
33 Total 1,000 1,000
l-AJl8tull/P_,. • 333 333
(e) Coal, Wood I; B&gaaae 383 333 IE-X.a_ · 667 667
3& 'lotal 1,000 333 811 28 18
l-AII 1'fUl8/P_ • 833 260 11M 18 (.) EIeot.riOit,. • • 56 28 27 (c) Ooal. Wood.t .Daguee 778 222 628 28
I1-MtJ1H181 · 167 83 66 28
35 Total 1,000 429 117l
I-AU FtulajP_ • 288 143 143
(.) Eleotrioity • • 143 143 143
(c) Coal, Woocl a: ,Bagu.e lilI l1-Jl __ · 714 286 428
38 Total 1,000 622 427 13 88
l-AUFudll/P_ • ON 388 293 7 6 (.) Eleftrioity 6 6 (6) Liquid FUel • • 6 6
28; (c) 00&1, Wood.t Bag .... e 882 382 7 '8 II-M .. fMIl · 306 134 134 6 8J
3& '.I!ota.l 1,000 613 291 " 32
l-AU""/P- • 2lJ6 97 65 32 31 (.) Eleotriaity • • 97
in 60 3.2 (c) 00&1, WoOd '" Bag"'e 129 ii
II-Mn_ · 774 516 226 311
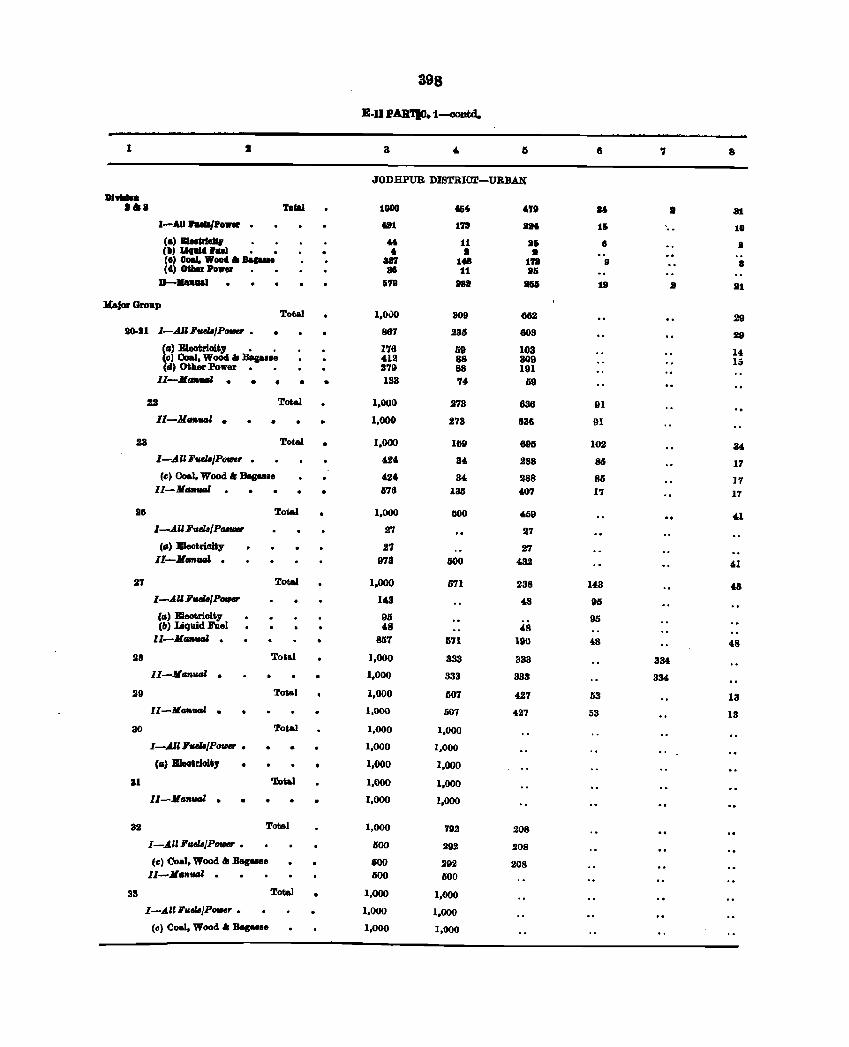
398
B·n PAR'l'IO. 1--oontd.
1 I 3 4- 6 8 8
JODHPUR DISTRICT-URBAN
DI'tIII .. .a. 'otal lOGO ... ". .. J 81
I-All J'uJa/Po- . .1 1ft 8H 15 00 10 (a) BJooRII1Q '" 11 85 II 8 (III) LllJllld.1II1 • • • • II (0) Goal, Wood a ....... aM 1. lU 9 8 (d) 0&IaH PD_ 811 11 81i
D-...... 679 811 - 19 II III
Kajar Group Total 1,00)0 809 6112 29
20-11 l-A.III"eItI/P_ • 867 236 803 29 \0) EIeotri.oif;, • 0 176 69 103 U, III Coal, WoOd .. Bag .. 118 412 88 309 15 II) Other Power. • 9'79 88 191
ll-JLIJ'IIWIJ • • • • • 133 74, 59
22 Total 1,000 273 636 91
II-MofIfMJJ • • 1,000 273 83S 91
23 Toto] • 1,000 168 6915 102 34 I-.4"'ueItIJPOtIICr • "4 34, 288 86 17 (e) Coal, Wood .. Bagasse 4,2& 34 288 86 17 11-ll __ 1576 135 &07 17 17
16 Toto] 1,000 1500 ~9 4.1 l-AliluelB/P_ 27 27
(II) B1eotrioBy 27 27 II-MIIA_ · 97S 400 432 41
27 Total 1.000 571 238 143 48 l-AU'uelI/P_ 143 48 95 (II) EleoUioity 95 95 (PI) Liquid lI'uel 48 48
II-MG __ · 857 571 UIO 48 48 lI8 Tot&l 1,000 333 333 334
II-Mtm'Hl • 1,000 333 333 334
29 Tot&1 1,000 507 42'1 53 13 ll-Jr_UGl · 1,000 60'1 427 53 13
30 'lota! 1,000 1,000
1-.... " 'uelI/P_ • 1,000 1,000
(G) BIeoIrioH1 • 1,000 1.000
81 'Ioal 1,000 1,000
11-110"_ · • 1,000 1,000
32 Total 1,000 792 208
1-.4U.I'"elIJ/P_ • 500 292 208
tel <loaa, Wood" Bagu.e 100 292 208 11-11.,.-, · 500 600
38 Toto] 1,000 1,000
1-.4n 8'uellJ/P_r • 1,000 1,000
(CI) 0081, Wood" Bag .... 1,000 1,000
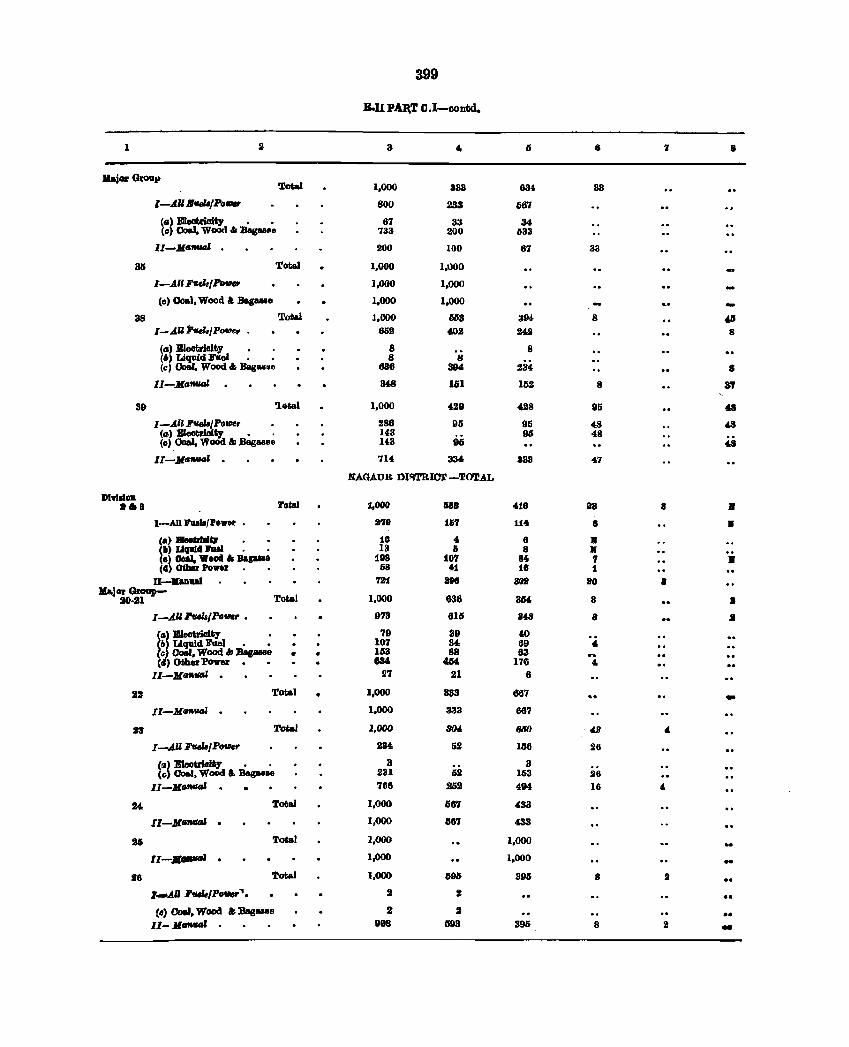
399
B.U PAl\T O.l-contd.
I 2 3 6 'I 8
1hj0l' Group Total 1,000 383 634 33
l-.AU .... /Po." 800 233 66'1
(II) Eleotrioity • • 67 33 34 (c) Coal, Wood '" Bag .. ~e 733 200 633
II-MliftUIJI . 200 100 67 33
36 Total 1,000 1,\)00
1-.AlIF'IIels/Po_ 1,000 1,000
(c) Ooal, Wood I: .Beg ... e 1,000 1,000
38 Total 1,000 IilS3 394- 8 ~ l-.AlI 1l..zs/ PO'lllep . 852 «02 M2 8
(II) Bleotrioity 8 8 (6) Liquid Ji'aeJ • • 8 8 (0) Coal, Wood '" Bagasse 636 394 234 8
11-.)(aftUIJI 348 1151 152 8 Sf
39 'lotal 1,000 429 jl!8 85 a 1-AIlFUel8/Pov;er • 286 95 95 48 48
(II) Electrioity • . 143 95
96 48 (c) OoIIIl, Wood &; Bagasse 143 d
1[-.)(11_1 . 714 334 333 47
NAGAUR mqTRIor -TOTAL
Dhillon •• a Total .,000 liIl 416 II' a •
I-All .",. ... ,Po • .r 878 16'1 114 8 • (a) BIeaUIfIII~ 10 4 8 • (II) Ullllld bel . • 13 6 8 K (e) OUJ. Wood" BaIUlI 1118 107 84 7 • (11) 0dIIr Po_. • 68 011 18 1
D-Ianaal '121 8t8 ao& ao I Maj ... Group-
20-21 Total 1,000 636 3M 8 I
[-AUhUa/Po_ • 9711 615 348 8 J
(a) Bleotrlaity 79 39 40 (II) Liquid FUel • • 107 34 69 4-(~ Coal, Wood '" »as- • • IllS 88 63 .~
( ) Other Power. • 634 484 176 " II-J{d- · 27 21 8
23 Total 1,000 883 867 -II-JetMWGl · 1,000 333 687
23 Tot.&.! 1,000 304 tJIj() ·42 4
I-AU FudI/P_r 234 52 156 26
(1.1) EIeotricdtl • • 3 3 (0) Coal, Wood a. BagM.e 231 52 153 26
lI-JeGMGI · 768 252 494 16 4
24 Total 1,000 tiM 433
II-JeGMGI · 1,000 1567 433
2.1 Total 1,000 1,000
11-..... , 1,000 1,000 •• 26 Total 1,000 69IJ 395 8 II
Z.-All :rtIcJ8/Po .. i'. 2 2
!c) ColI, Wood &;Ba8 .... e :I 2 •• 11-JefI'MIGI 998 tit3 395 8 2 -
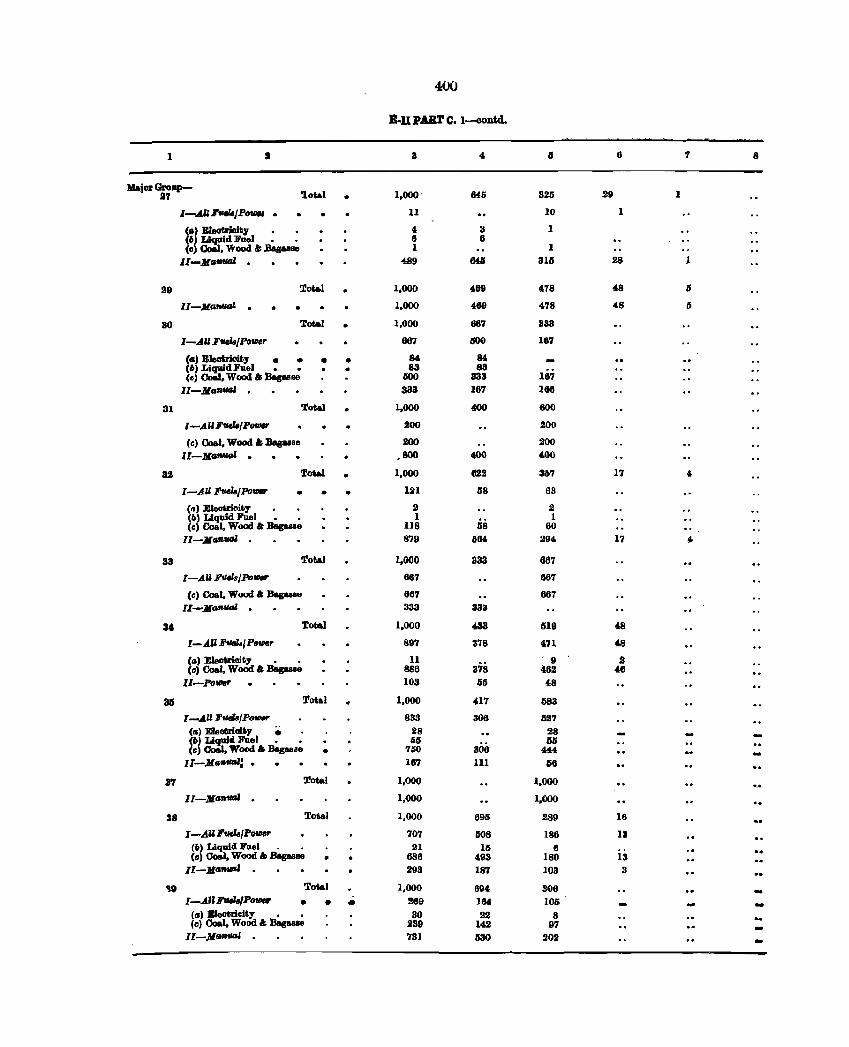
400
B·n PAR'!' C. l-OOntd..
1 I 3 4 6 '1 8
Major Group-17 'lotal 1,000' 646 325 29 1
I-AU'_/Po.... • 11 10 1
Co) BJeatrioity , 3 1 (6) Liquid Puel • • 6 6 (c) Coal, Wood I: Bagasse 1 1
II-.JIafMIaJ · 489 &a 315 28 1
29 :rota) 1,000 469 478 48 IS
lI-.JIaltflGZ · 1.000 469 478 48 IS
30 Total • 1,000 667 333
I-All F_IPolH' 667 500 167
(a) BIeoIrioity • • • • 84 Sf, (6) Liquid :Fuel • • 83 83 (e) CoAl, Wood" Daguae 600 333 167
II-MaR"'" · 333 167 166
31 'total 1,000 400 600
I-A" Fva.IP_ 200 200
(c) Coal, Wood "Bagasse 200 200 ll-MGftUGI · ,800 400 400
as Total • 1,000 622 367 17 4,
I-All F'-/1'o_ • • • 121 58 63
(II) EIeotriaity a 2 (6) Liquid Foel • • 1 1 (c) Coal, Wood I: Bagasse 118 58 80 ..
11-Mafl.1IIIl 879 664 294 17 , 33 Total 1,000 333 667
I-All FtJelsj1'o,..r 667 667
(c) Coal, Wood I: Daguae 667 667 11-Maff,1I41, · 333 333
3' Total 1,000 433 519 48
I-.AU Fvelal P_r 897 378 471 48
(a) Eleotrioity • • 11 378
. 9 2 (c) Coal, Wood I: Bagasle 886 462 46
ll-Poll18r 103 55 48
35 Total • 1,000 417 583
I-AllF'-IP- 833 306 527 (a) Eleollricli.ty -- 28 28 • (6) Liquid hel • • 55 55 (c) Coal, Wood" Bag ... ,. • 760 306 444
1I-MatMllll,l • 167 111 56
37 Total 1,000 1,000
lI-M."'II4J · 1,000 1,000
38 Total 1,000 695 289 16
I-AU FwelaIP_ 707 1i08 186 13 (6) Liquid Fuel . . 21 15 6 (c) 00&1, Wood " Saps .. • 686 493 180 13
11-MMltIAI · 293 187 103 3
'0 Total 1,000 69' 306 I-All ,_'POIDff' • • • 269 16' 105
(a) BJeotrieity • • 30 22 8 (c) Coal, Wood .t Bag .... e 239 1'2 97
II-.JI.-l · 731 630 202 -
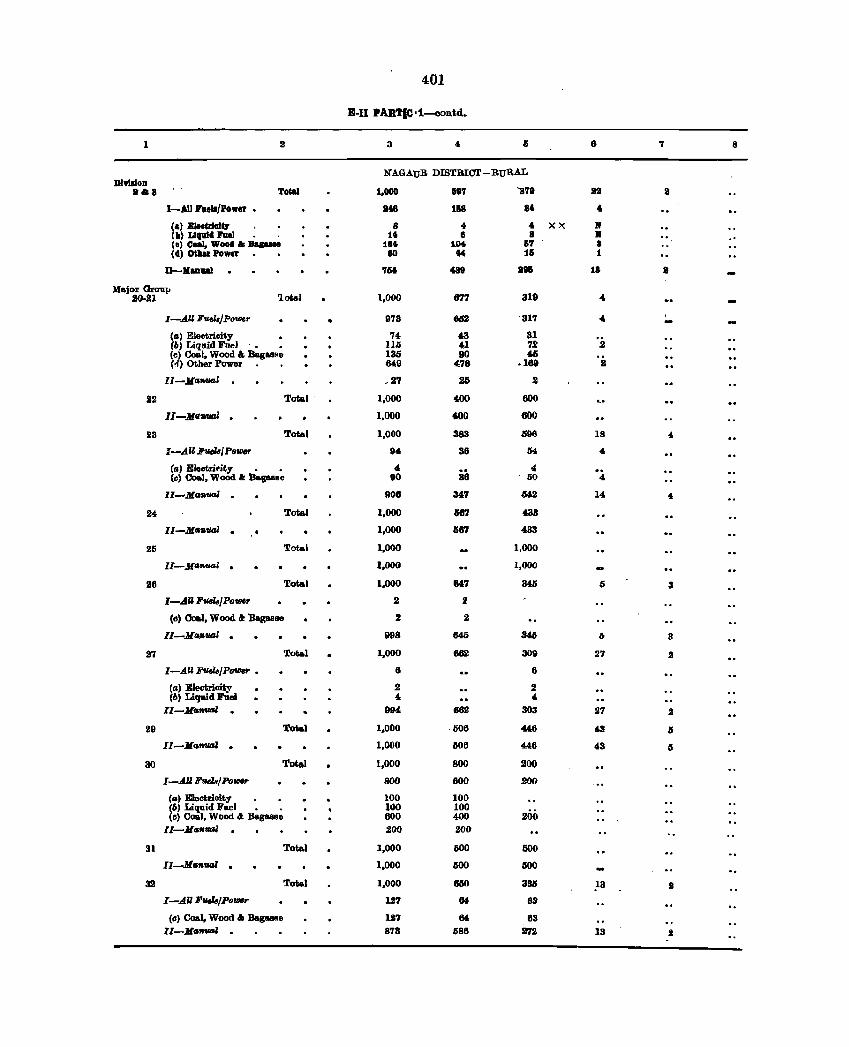
401
B-I1 PARTI<l'i---oontd.
1 II 3 4 I) 8 '1 8
NAGAUB DISTRICT--BURAL DI91ldon ."8 Total 1.000 158'1 11'18 sa II
I-AllPa,"'Pcnnr • 8. 1118 8. • <&, B1MUIeI" 8 .. .. XX 1f (b) Ll(llli 1'Il.1 • 11 II 8 1f <e, Coal, WooII ....... 181 lCHo 1i7 8 (I) 00Ier Power 80 4t4 1& 1
U-Manaal 761 488 8. 18 8
Major Orou., SOon latal 1.000 877 319 4
I-AU FueZ,J POUJer • 973 642 '317 " (a) Electricity 74 43 31 (6) Liquid Thel • • Ill) 41 72 .2 (c) Coal. Wood & Bagasse 135 90 4& ('!i') Other Power Mil 478 .. 188 II
ll-,Ma-I .. 27 25 2
22 Total' 1,000 400 600
lI-JlQnoJ · 1.000 600 600
23 Total 1,000 383 596 18 4
I-AU FuelBl Power 94 38 114 " (a) El.otri('ity • • " 90 " .. (e) Ooal, Wood If Ba(!aaee DO 50 4
II-Ma .. -Z · 908 347 042 14 4
24 Total 1,000 am 433
ll-Ma"tJal · 1,000 '87 433
25 Total 1,000 1,000
Il-Ma""-'Gl · 1,000 1,000
26 Total 1.000 817 346 I) 3
I-AU FtUl8/PotlJU' 2 2
(c) Coal, Wood. "" Bagasse 2 2
II-Ma",vtU · 998 645 3" 6 3
27 Total 1.000 682 309 27 2
I-AU FtUl8/Po_ • 8 6
(a) Electrioity 2 2 (6) Liquid Fuel 4 4
II-Mof&UfJl · 994 682 303 27 2
29 Total 1.000 ·506 446 43 II
Il-Mof&tJal · 1,000 506 446 43 II
30 Total 1,000 800 200
I-A.lI FsdNIPo_ 800 800 200
(G) E1ectrioity • • 100 100 (6) Liquid Fuel • . 100 100 (c) Coal, Wood 4 Baga.se 600 400 200
Il-ltlaf&fIal . 200 200
31 Total 1,000 500 500
lI-M",,,UfJl · 1,000 500 500
32 Total 1,000 850 385 13 2 I-Allll'sdN1Po_ 127 81 83
(c) Coal, Wood" Bag_ae 127 M 63 II-MG""'" · 873 588 272 13 2
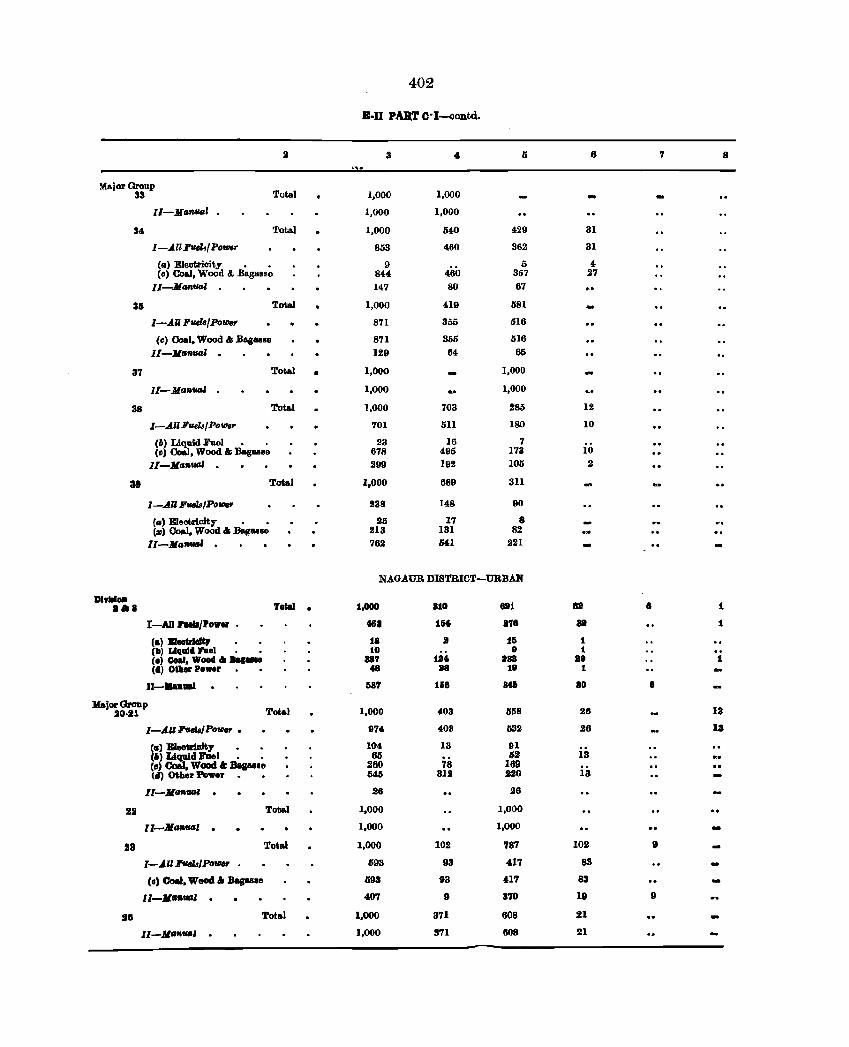
402
B·D PAIlT C·I-oontd.
3 5 6 7 8
Major Gronp 33 Total 1,000 1,000
II-Man"," 1,000 1,000
3' 1'otal 1,000 540 '29 31
I -All FUIl./ POIIJ8I' 853 460 362 31
(tI> E1eotrioity • • 9 ;; 4 (c) Coal, Wood /I. Bagssse 84' 460 367 27
II-Mtlntlal 147 80 67
35 Total 1,000 419 581
I-AU Fuels/Power 871 356 516
Cc) Coal, Wood '" Bagasse 871 365 516
11-JlfJfIfIal . 129 64 65
37 Total • 1,000 1,000
ll-MaafIIU 1,000 1,000
3a Total 1,000 703 285 12
I-All Fuel8/ POlIJ8r 701 511 180 10
(6) Liq1lid Fuel • , 23 16 7 (Il) Coal, Wood '" Bagasse 678 495 173 10
ll-JlfJ"'tMU · 299 192 105 2
31 Total 1,000 689 311
I-All Fv.Ja/PQ_ 238 148 90
( .. , Eleotricit;y • • 25 17 8 (~) Coal, Wood'" Ba,asse 213 131 82
11-Jl"",,,,11 · 762 5'1 221
NAGAUR DISTRICT-URBAN
DJ'IlIId .a. 'J'o&al . 1,000 810 621 88 8 l
I-AD hIII/poWII • till 1M 878 as 1
Ca) :II ...... d&, 1a • 15 1 (II) LlllullI rae1 • • 10 8 t
CD) Coal, Wood '" ... -- 887 12. 288 B8 .. (II) OUaIl Power f8 118 18 1
11-1In_ 587 158 IMI 80 8
Major Group 20·21 Tot.1 1,000 403 558 26 13
I-AU FveI8/ POlIJ8r • 974 403 IiSli 26 18
(.) Bleotr1Dit;y 104 13 III (11 Liquid hel • • 65 78
62 13 (c) CoIiJ, Wood .t Begasle 260 169 (II) Other Power • 546 312 220 13
11-11--1 · 26 28
22 Total 1,000 1,000
1,-M_I · 1,000 1,000
13 Total 1,000 102 787 102 9
l-.AII rueI&/ Polller • 693 93 417 83 -(c) CoeI, Weed • Bagasse 593 93 41'7 83
11-11--' . 407 9 370 19 9
!l8 Tot.l 1.000 371 808 21
lI-Jl""'ua, . 1,000 371 608 21
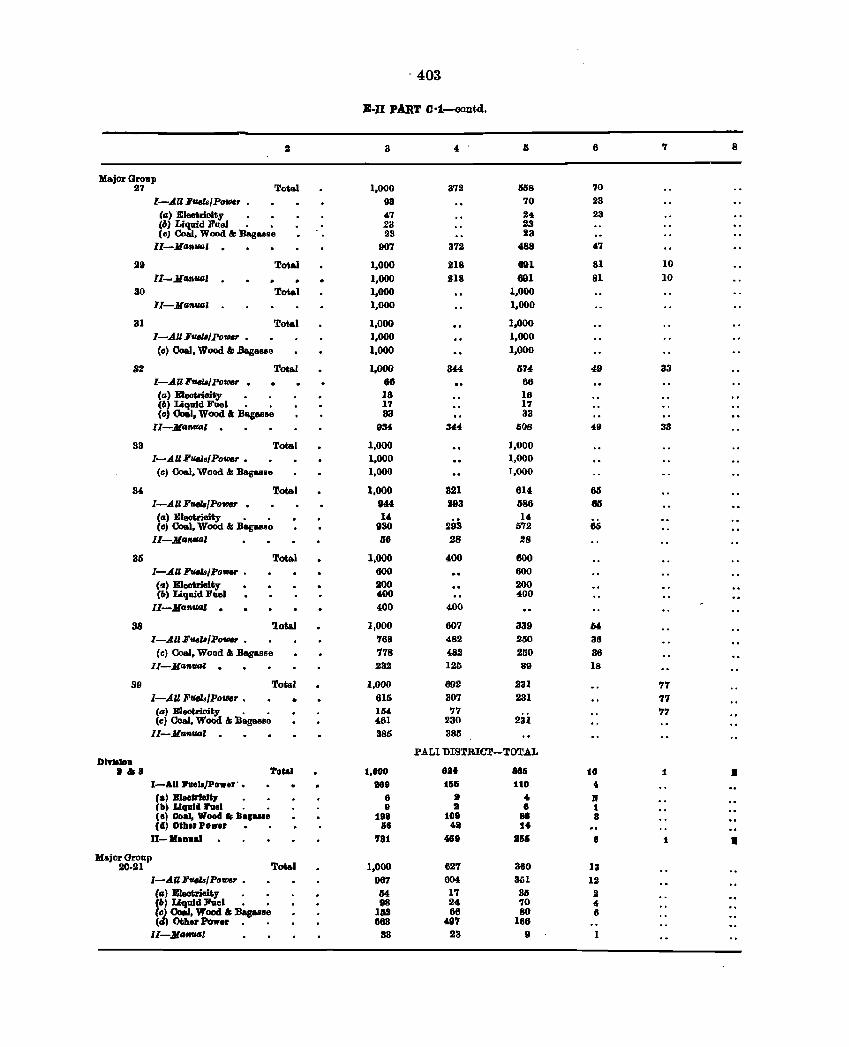
, 403
B·n PART O·1-contd.
3 4 6 7 8
Major Group 27 Total 1,000 372 558 70
I-AUFUSlsIPowe, • 93 70 23 (d:) Eleotrioity 47 24 23 (6) Liquid Fael • • 28 23 (II) Coal, Wood &: Bagasse 23 23
II-Md:nuo, · 907 372 488 47
29 To1al 1,000 218 891 81 10
II-ManlUJ' · 1,000 218 891 81 10 30 Total 1,000 1,000
II-Ma7l_, 1,000 1,000
31 Total 1,000 1.000 I-All Fq/8/Pouw • 1,000 1,000 (c) Coal, Wood &; Bagasse 1,000 1,000
32 Total 1,000 344 674 49 33 I-AUFVCZ8/Potcef' • 86 66
Ca> EleoWioity 18 16 (6) Liq1lid Fuel • • 17 17 Cc) 00&1. WOQd a B-.g&Bse 33 33
ll-Mc-l · 934 344 608 49 33
33 Total 1,000 1,000 I-AUFUCJ8IPouw • 1,000 1,000
(c) Coal. Wood &: Baguse 1,000 1,000
34 Total 1,000 321 614 60 I-AllFVCZ8/Po'llllr • 844 293 586 811
(1.1) Eleotrioity • • 14 293
14 (c) Coal, Wood &; Bagasse 930 572 65
lI-MGrltlal 56 28 28
35 Total 1,000 400 600 I-An FVCZ8/Po'llllr • 600 600
(1.1) BleoViBity 200 200 (6) Liq1lid Fuel 400 400
II-Marlflal · 400 400
38 lotal 1,000 607 339 51 l-AllFtIa.,./Po_r • 768 482 250 38
(c) Coal, Wood &; Bagaso .. 778 482 250 36 ll-M'u,IUJ' · 232 125 89 18
39 Total 1,000 1192 231 77 I-All Fua./pow, • • 615 307 231 77 (a) EJaotrioUy • • 154 77
2ai 77 (c) Coal, Wocid &I Bagasse 461 230
II-Marltlal · 385 385
PALl DISTRICT-TOTAL DlvlllDD
1&8 TDta. 1,000 eat 88& 10 1 • I-All Puela/Power'. 189 165 110 ... (a) BJ •• trleJt, 8 a 4 If (11) Liquid l'u81 9 :It e 1 (8) C.al, WoOll " Bag_e 198 108 86 8 (d) Other Po ... r 58 48 14
II-BaD1IaI 781 4611 III 8 1 • Major Grollp
20·21 Total 1,000 (127 3(10 13 l-AUFqIoIPo_r • 067 604 301 12 (a) EleoWieity 54 17 36 2: (6) UquldJiUel • • 98 24 70 4 (IIJ 0:*1, Wood &; :s.,ule 132 68 80 II (Ill) Other Power. . 668 497 166
II-Ma_l 83 23 9
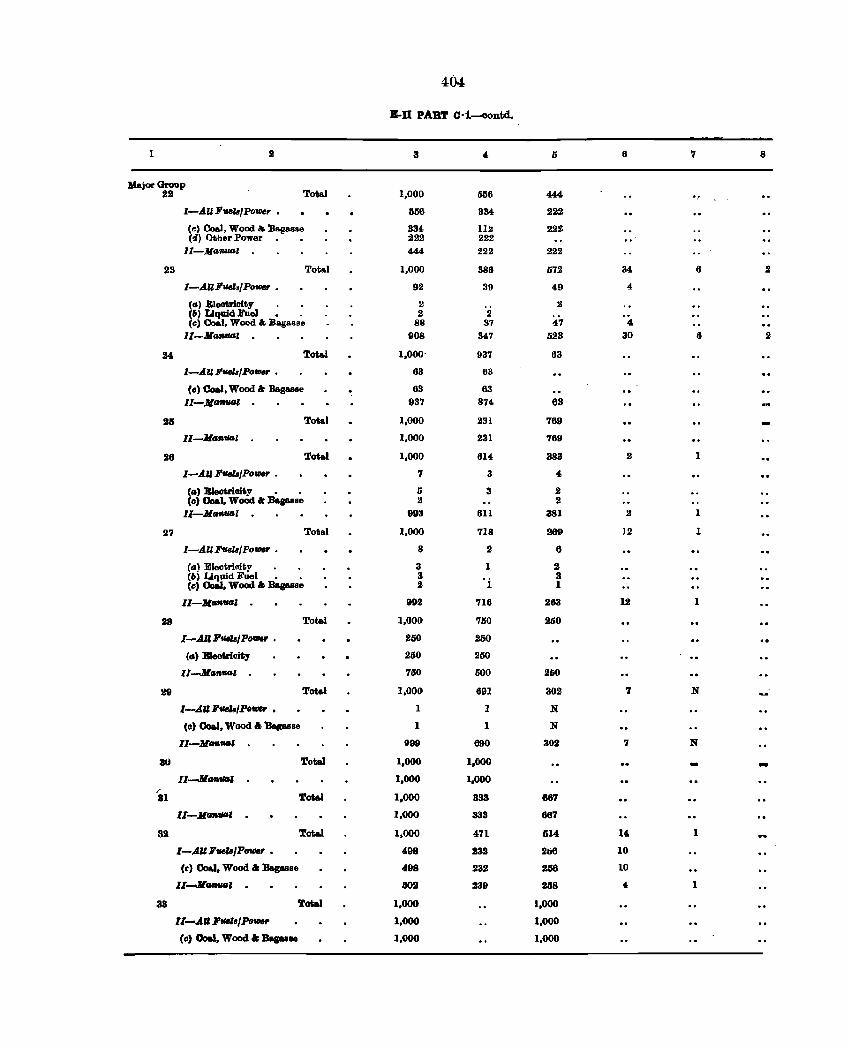
404
E-D PART 0-1-oontd.
1 3 4- 5 6 7 8
JLaj01' Group 22 Total 1,000 056 44-4-
I-AUFualBfPoVJer • 556 334 222
Ce) Coal, Wood .- B"fl&Sae 334 Ill! 22~ (!II Otber Power :222 222 ..
II-Mt:J1IUGl 444- 222 222
23 Total 1,000 386 572 34 6 2
I-AIIF'lldsfPoVJer • 92 39 49 4
(al Eleotrioity 2 :2 (61 LiquidFuel _ . 2 2 (c) Coal, Wood " Baga.sae 88 37 47 4.
II -Jlaft""'l . 908 347 523 30 6 2
lU Total 1,000- 937 63
I-A"Fve18/Po_ • 63 63
(e) Coal, Wood & Bagllllse 63 63 II-JlCI1HUIl 937 874 63
:115 Total 1,000 231 769
II-Jlafl,fllJZ 1,000 231 7611
26 Total 1,000 614 383 2 1
I-AU Fuez./Po_ • 7 3 4.
(a) EJeotrioity • • 5 3 2 (e) 00&1, Wood & :Bagasse 2 2
Il-MaftfllJl . 993 611 381 2 1
27 Total 1,000 718 269 12 1
I-A"Fueu/Po_ • 8 2 6
(a) Eleotrinity • • 3 1 2 (6) Li'lwd Fuel • . 3 °i 3 (c) Oo8l, Wood " Bagasse :II 1
Il-M-' 9D2 716 263 12 1
28 'l'otal 1,000 750 260
[-ARFflda/P_r 0 250 260
(0) Eleetrieity 250 250
1I-M_fUl' 0 750 500 260
liD Total 1,000 601 302 7 N
I-AU FueI3/Po_ , 1 1 N
Cc) Coal, Wood " Bapsse 1 1 N
II-MG'IIfIIJ' 999 690 302 7 N
30 Total 1,000 1,000 -[1-JIG'll_' 1,000 1,000
/
31 Total 1,000 333 867
II-A{IDItIa' . 1,000 333 667
32 Total 1,000 471 51"- 14- 1
I-All FtlCr./Po_ • 498 232 206 10
(e) Coal, Wood" BagasBe 498 232 286 10
II-.Jl_, . BOll 239 2li8 4 1
33 Total 1,000 1,000
Il-.AU FfICl,/PoVJer 1,000 1,000
(e) OoaJ, Wood" BIiplIB 1,000 1,000
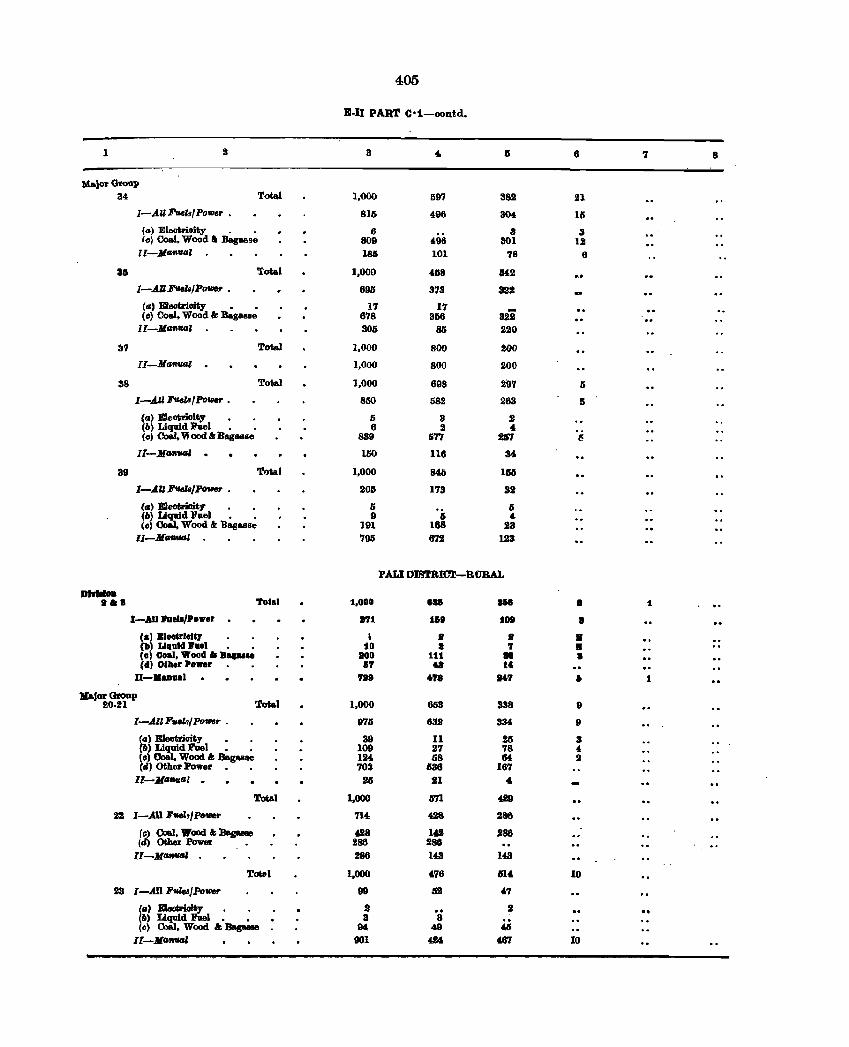
405
E-II PART C·1-oontd.
1 2 3 " 8 7 8
bbjorGrouP 34 TeMl 1,000 597 382 21
I-AU Pveb/Poll18r • 815 496 304 15
(a) Eleotrioity . • 6 3 3 Ie) Coal, Wood' Bagasse 809 4,96 301 12 ll-Jl--' 185 101 78 6
311 Total 1,000 '118 142
I-All~/P- • 89fj 378 322
(II) Eleotrioity • • 17 17 32i (e) Coal, Wood &I Bagasse 678 368
II-JIll""'" 301i 85 220
~7 Total 1,000 800 200
II-M afIIIII/. . 1,000 800 200
38 Total 1,000 698 297 IS
I-AUFUW/Poll18r. 850 582 263 IS
(II) Electrioity II 3 2 (b) Liquid Fuel • • 6 2 4 (c) Coal, Vi ood" Bagasse 839 577 2tr1 I!
II-Mil""'" . UlO 116 34
39 Total 1,000 846 1511
I-AU Fusla/Po_r . 205 173 32
(tI) Electricity 5 IS {II} Liquid Fllel • . 9 15 4 (II) Coal, Wood k "Bagasse 191 188 23
ll-Af_' 795 672 123
PALl DIS'lRIC'l-RORAL
DI ...... .6:. Total 1.000 .8& 8H • 1
J-AlIlIDeb/Power 8'11 16. 108 I
(al BleelrltltJ" • • • • • • (,II) UqullIl'ull • • to 8 'I • (D) Coal, Woo« 6: _ ...... .00 111 • 8 (Ill OUler Power ., ., t4
II-... aal 7l1. 47' .., & 1
II&jor(koup 20-21 Total 1,000 653 338 9
I-AllF'u.z./PoUNJr" . 975 632 334 9
(tJ) Electricity 39 11 25 3 (II) Liquid Fuel • . 109 27 78 4, (c) Coal. Wood &I Baguae 124 1i8 M 2 (dl Other Power _ • 703 538 167
ll-.M.fllllIl . 26 11 4
Total 1.000 671 429
22 I-AU F-.eZ,/l'OVIef" 714 428 286
fa) CoaJ, Wood I: l3agaMe 428 142 286 (II) Other Power .' 286 286
Il-Jl"""'" 286 143 143
Total 1.000 4,76 614, 10
23 I-All FvleIJPo_ 99 52 47
(a):JilIeoI;rW~ • • 2 ·s 2 (II) Liquid I. • 3 .. (c) Coil. Wood. &; Bas- 94 49 46 II-ll_' 001 424 467 10
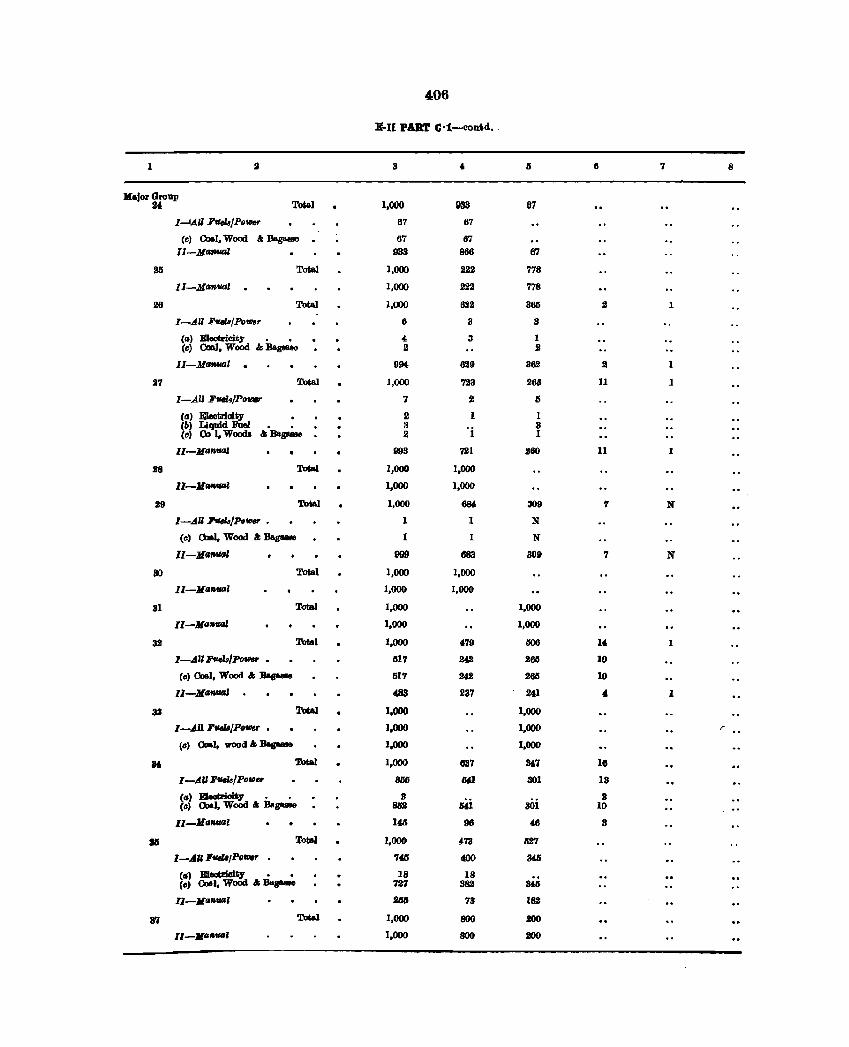
4:06
B-Il PART C·1-contd ..
1 II 3 II '1 8
1laj01' Group U Total 1,000 1133 67
I~U FUelaIPotl1er 67 117
(cl 0».1, Wood &; Bag&11118 . 67 67
Il-Ma'lHllll 933 866 67
25 Total 1,000 222 778
II-MantItJl 1,000 222 778
26 Total 1,000 632 366 :.1 1
I-AU FqlalPoll1Br 6 3 3
(a) Weotricity • • 4, 3 1 (c) Coal, Wood &; BagllB8e 2 :.1
II-M-l 994. 629 362 2
27 Total 1,000 723 265 II 1
I-All Fua./PrI_ 7 2 I)
(a) EIectrloity 2 1 1 (lI) Uquid Fuel 3 'i 3 Cc) (b I, Woods &;B&ga_ . 2 1
Il-Maft.uaJ 993 721 2110 11 1
28 Total 1,000 1,000
ll-Jl~ 1,000 1,000
29 Total 1,000 684 309 7 N
I-..4.U ~/Po_ . 1 1 N
(c) (btl, Wood &; BagaMe 1 1 N
lI-HMItIlII 999 6113 308 7 N
90 Total 1,000 1,000
II-HaMIll' 1,000 1,000
31 Total 1,000 1,000
II-MalfWll 1,000 1,000
32 Total 1,000 479 IlOO 14 I
1-..4.11 Paela/Pover • 517 24! 2M 10
(c) CoaJ, Wood &; "'8 517 242 2M 10
II-Haft.III.I' 483 237 241 4 1
33 TotAl 1.000 1,000
I-.A.ll FtJdI/PoVJer • 1,000 1,000
(e) o-I, wood"""" 1,000 1,000
IHo Total 1,000 637 84,'1 10
I-AU FWds/PoIIJ. 8llIl 641 301 13
(a) EIeotrioity • • 3 04i 3
(0) Coal, WoOd .. Bega_ W 301 10
11-j{aMlll' 14.5 96 (8 3
115 TotaJ 1,000 4,73 fJ27
l-.AII 'ItItII/Po""" 746 400 34li
(a) Weotriclty • • 18 IS (e) Coa-I, WoOd "Baga.e 727 382 34tl
II-j{IJ-r 2M 73 182
3'1 Total 1,000 800 iOO
1'-Ma",",' 1,000 800 iOO
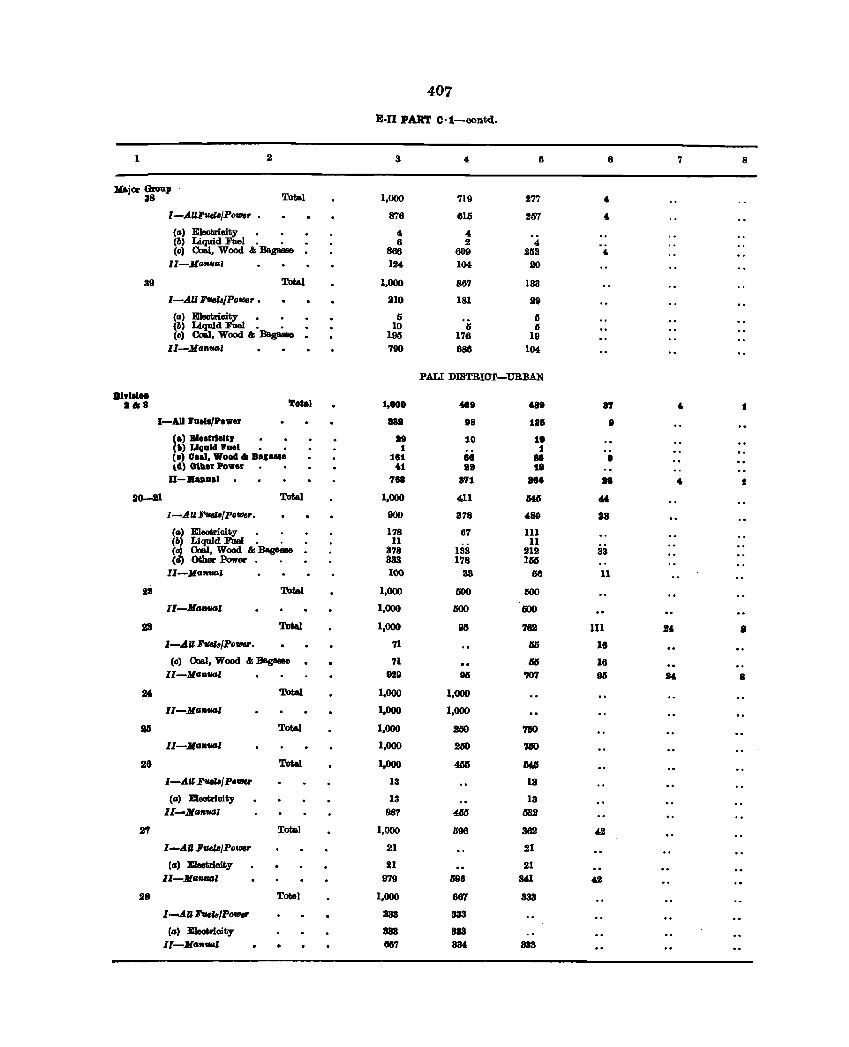
407
E.I1 PART C' 1-oontcl.
1 2 3 4, Ii 8 '1 8
MaiOI' Group Total 1,000 '119 27'1 , 38
I-AUl'tICl8/PoVllr 8'18 615 2117 , (a) EJeotrioity • • 4 4, (b) Liquid Fuel. . 8 2 4 (0) 00&1, Wood & BagaEe 886 609 253 4
ll-Jltu."al 124 104 00
39 Tota1 1,000 86'1 133
I-AU FtIel8/Po'lller • 210 181 29
(a) Eleotrioity • • 5 II (b) Liquid Fuel. • . 10 Ii 15 (0) CoIiJ, Wood 6: BagaEe 196 176 19
II-J{a.val '100 686 104
PALl DISTRICT-URBAN
81,1110. 'l'otal 1,000 4811 181 a7 •• a 4- t
I-AD I'lI.II/Po •• r au 18 111i • (I) BI.aRleli, .1 10 tl ,II) LIQaId. 1Iael • • 1 1 C.) 0011, Wood .... g .... 181 88 • II lil O'lle, Po .. e, • 1 118 t •
II-Bua.1 788 871 •• I. • t JO...-,tl Total 1,000 411 MIl " I-AU FtICl8/poVllr. 900 378 '89 33
(0) Eleotrioity 178 6'1 III (11) Liquid FiIeI. • 11
133 II
(0) 00&1, Wood 6: Ba.g&_ 378 212 33 (Ii) Other Power 333 1'18 llilJ
11-)(0"-, 100 33 M 11
22 Total 1,000 llOO 600
11-M_, 1,000 llOO IiOO
221 Total 1,000 !Ill 7112 III 2' • J-AU FtI4J./po_. 71 IJll 16
(c) Ooa.l, Wood 6: Bagasae '11 IRS 16 1I-)(0"_1 929 iii 'lO7 til M 8
24 Total 1,000 1,000
ll-Jlo_, 1,000 1,000
15 Tota.1 1,000 2110 '1110
II-Jla .. ",,' 1,000 250 71SO
26 Total 1,000 4lllI MIS
I-A" FUIIB/PotD8r 13 13
(a' EJeotrioity 13 13 II-JlfaflI!l41 987 4M mI.2
27 Total 1,000 ll96 362 4,2
l-Alll'tUlB/Power 21 21
Ca, EIeotzioity 21 21 Il-Jla_, 979 .598 lUI <&2
28 Tote) 1,000 68'1 333
I-AU Fve"'/POVllr 333 333
Ca) EJeotrioity 333 383 II-J{ofl'fllli 867 au 333
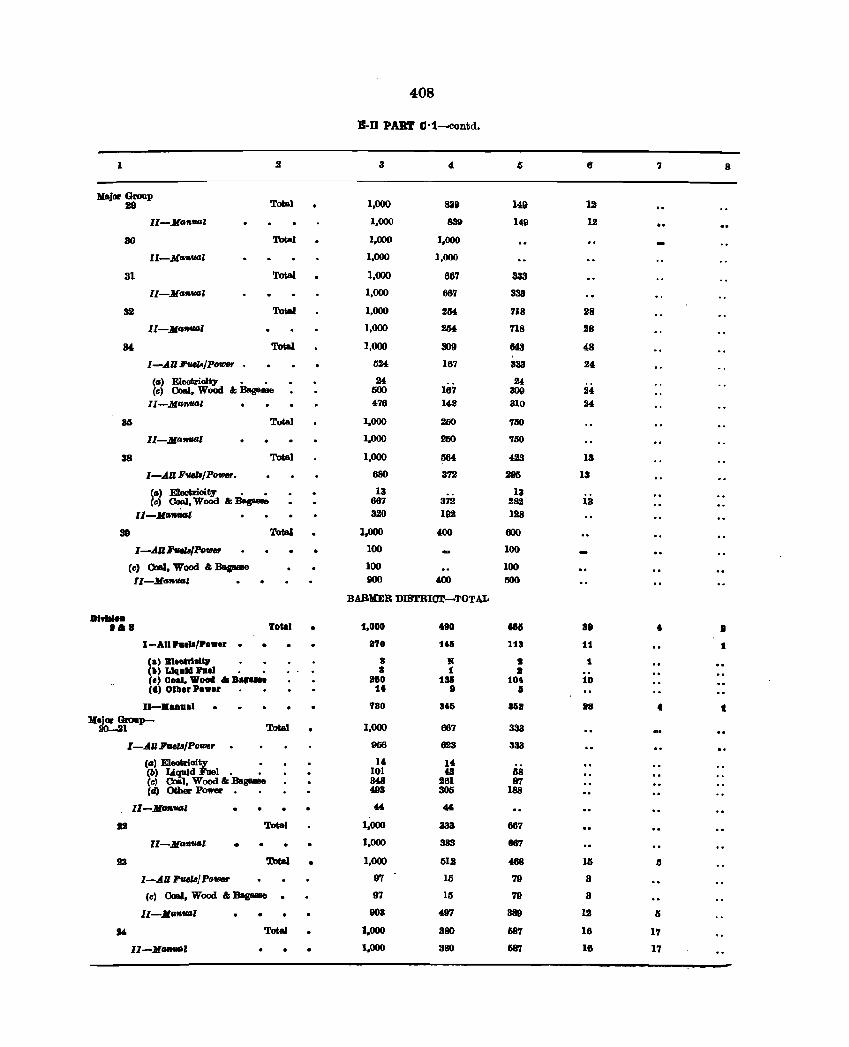
408
B-D PART Cl-i-contd.
I 8 4. 6 7 8
Major Gl'OIlP 19 Total 1,000 839 149 12
ll-.ltan-Z 1,000 839 14.9 12
80 Total 1,000 1,000
II-Ma"tuJl 1,000 1,000
31 Total 1,000 667 333
11-.lta"flGZ 1,000 667 333
32 Total 1,000 2M 718 28
ll-Ma"fIG, 1,000 ll54 718 28
34 Total 1,000 309 M3 48
I-AUF~/P_ . 524. 167 333 24
(a) Eleoliriolty • • 24,
167 24.
Ccl Coal. Wood &; Baga8ae 500 309 24 Il-M-l 476 142 310 24
ali Total 1,000 250 7110
lI-Mafl.,.' 1.000 260 7110
38 Total 1,000 564 423 13
I-AU Fuez./Po_. 680 372 295 13
(Ill E1eotrioity • • 13 13 Ccl Coa.J, Wood &; Bas- 667 372 282 13
11-11","",' 320 192 128
31 Tot&I 1,000 400 600
I-A"I'vel6/Po_ 100 100
(cl Coal. Wood &; BagasBe 100 100
lI-Jl-' 000 400 500
BARBR DISTRlcr.r-TOTAL
DIYIIIo. ••• Tolli • 1.000 490 til 81 t • 1-&lIh,,,/Po •• r: . • 170 1I1i 118 11 •
Ca) Bl .. trial" II II t 1 (II) Llqllid 1'1181 a 1 :It Ce) 00 .... Wood II Ba' .... 110 131i lOt to (t) Otla,r Po •• r it 9 II
11-...... 1 780 Btli 81i1 IB t t Major Group-
20-21 Total 1,000 667 333
I-AU Fuer.,Power 956 623 333
(a) EIeotrioi~ • U 14 (b) Liquid • • 101 43 lI8 Cc) Coal, Wood .... BagB1118 348 261 87 Cd) Other Power 493 305 188
ll-MMIIIltII 44 44
az Totel 1.000 333 667
ll-.JI-u , 1.000 333 667
23 Totel • 1,000 512 ~ II. a I-AU lJ'uel8j PllflJer 97 15 79 3
Cc) 00aI. Wood &; Dag&eee 97 15 79 3
11-Ma_' 903 497 389 12 II
24. Total 1.000 380 1587 16 17
I1-Ma,.",U 1,000 380 G8'l 16 1'7
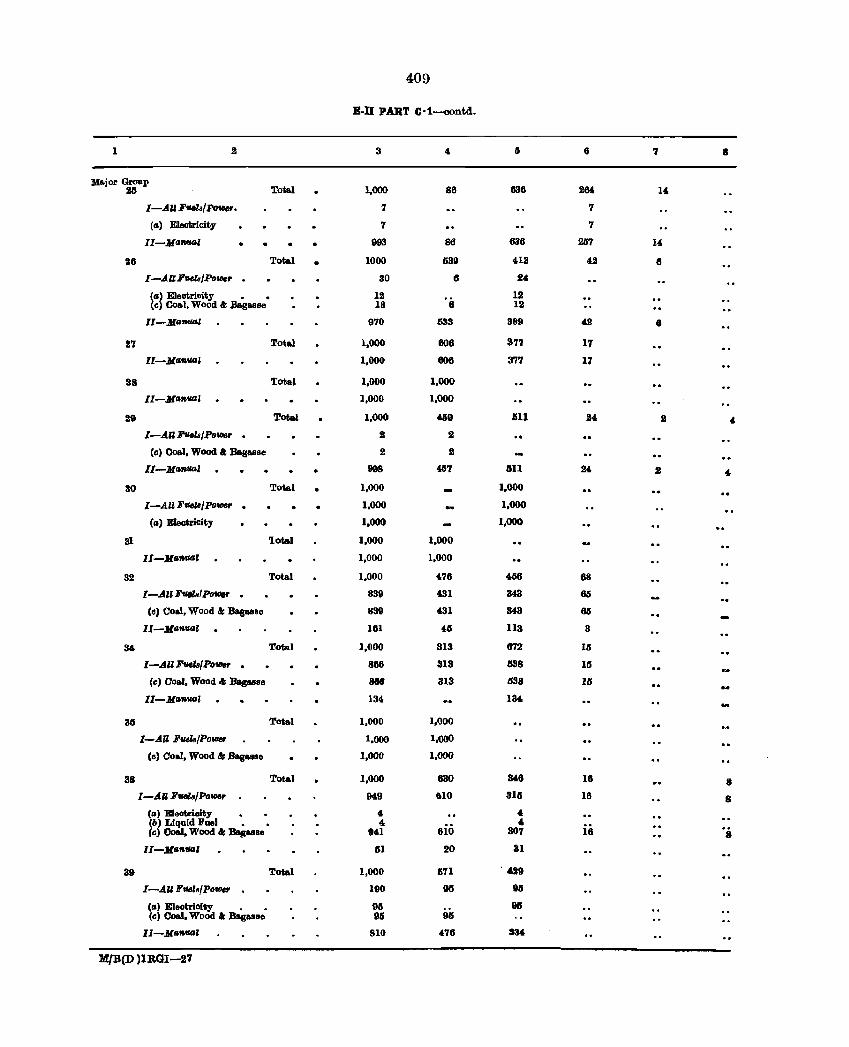
409
E-D PART C·1-oontd.
1 2 3 6 7 8
Major Group 25 TotaJ. 1,000 86 636 2M 14
1-..4U Fuels/Po'll1er. 7 7
(II) Eleatricity 7 7
II-MllfllUGl 993 86 636 257 14
118 Total • 1000 6311 413 42 II
[-..4UFtido/PotllCr · 30 6 24
(II) Electricity • • 12 '8 12 (c) Coal, Wood &: .Bagulle 18 12
11-,MIIRUll.I 970 633 389 42 8
27 Total 1.000 806 377 17
II-M""'"" 1,000 806 377 17
28 'fotal 1,000 1,000
II-M""1ICI1 1,000 1.000
29 Total 1,000 469 1111 24. 2 " 1-..4n F1IelalPo'll1er · 2 2
(c) Ooal. Wood .. BaguBe 2 2
II-M""-' 998 457 lill 24 2 4
30 Total 1,000 1,000
I-AUF-.z,IPo_ · 1,000 1,000
(,,) Electricity 1.000 1,000
31 'lotal 1,000 1,000
II-MII-l 1,000 1,000
32 Total 1.000 4.78 4.56 68
1-..411 F".,.' POlller · 839 431 343 65
(c) CoaJ., Wood &: Bagasse 839 431 343 86
II-MGtI-1 181 41i 113 3
34 TotAl 1,000 313 872 15
1-..4U~fPo'll1er · 866 313 1iS8 15
(c) Coal, Wood ... Bagasse 868 813 1i38 lIS
II-M""1ICI1 134 134,
31i Total 1,000 1,000
1-..411 F_IPower 1.000 1,000
(c) Coal, Wood " Bagasse 1,000 1,000
88 Total 1,000 630 346 18 8
1-..411 Fuel.fPo_ 94.9 &10 316 16 8
C") E1eatrioity 4 4 (6) Liquid FIleI • • 4. 4. (c) Coal, Wood &: ~&IIse 841 610 307 16 's
11-MllfllUIl 61 20 31
89 Total 1,000 1171 . 429
1-..4n FflelsfPo'll1er · 190 !HI 95
(II) Eisotrioity • • 95 IllS (c) Ooal, Wood ar Bagallse 96 96
II-MlltltlGl 810 476 834
MfB(D )lRGI-27
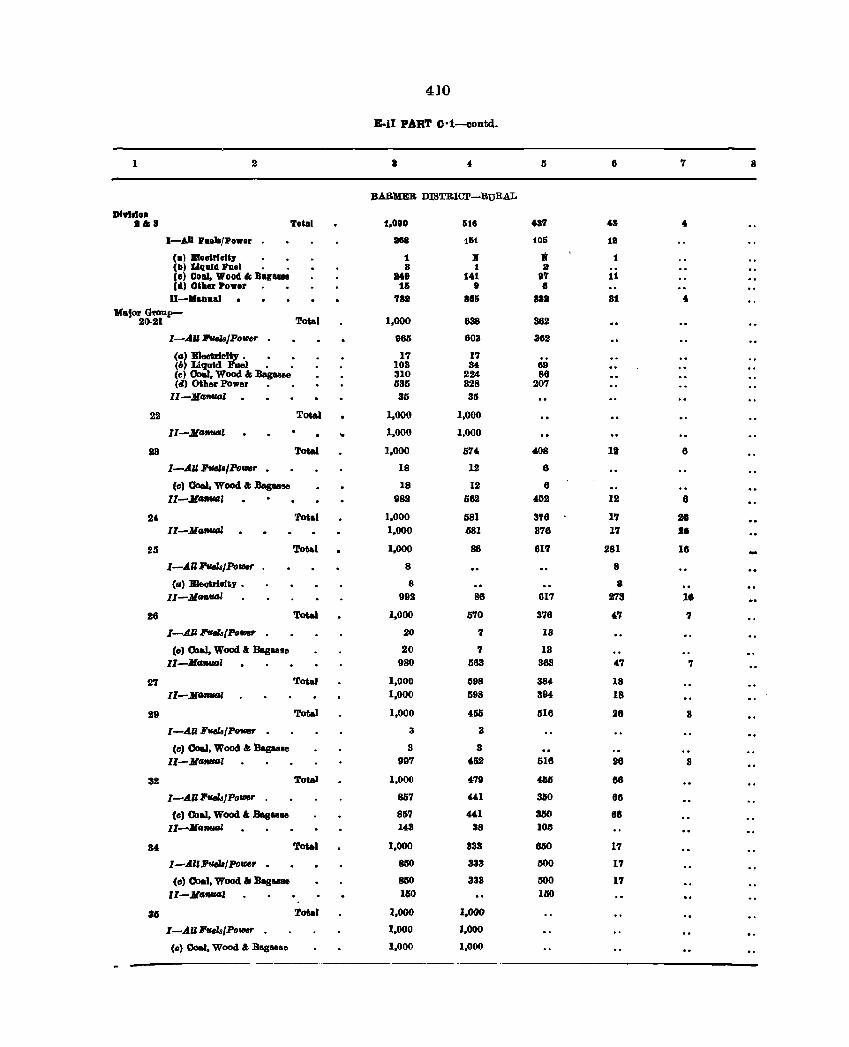
4]0
E·lI PART C·1-ilontd .
I 2 • 4 5 6 7 8
BARMER DISTRlOl'-BURAL
01",.10. I". Total 1,000 516 437 41 4
I-AU I'lIalafPower 1188 161 105 18
Ca) BleetrleltJ' 1 ]( .. 1 (b) Uqllill ruel 8 1 a (II) 0011, Wood" Bag .... 848 141 87 11 (II) Other Power 11 It 8
U-.a8ual 789 885 831 81 .. 'Major Group-
20·21 Total 1,000 638 362
I-AU l'tIUs/POW,. . 966 603 362
(a) meatrieity . 17 1'1 (b) Liquid Fiael • . 103 34 119 (0) Coal, Wood" Bagasse 310 224 86 (d) Other Power 635 328 207
11-Jlrmfl41 35 35
22 Total 1,000 1,000
II-Jl-' 10 1.000 1,000
23 Total 1,000 574 408 12 6
I-AU Fuel./Po_,. • 18 12 6
(0) Coal, Wood " Bague. 18 12 6 II-Jl-l 982 1i62 402 12 6
24 Total 1.000 1181 3'6 17 21 II-Jl"M4l 1,000 681 376 17 ••
25 Total 1,000 86 617 281 111
1-"" :r..lsJPo- 8 8
(a) Blecrmoitl' • 8 8 II-MrmlUJi 992 88 617 273 18
26 Total 1,000 570 376 41 'I
I-AU FflehfPo-,. 20 7 18
(0) eoal, Wood " Bag ... e 20 7 13 II-JlG_1 980 1163 363 47 7
27 Total 1,000 598 384 18 11-JCCIIIUGl 1,000 1198 394 18
29 Total 1,000 465 ISHI 26 3
1-.tf.UFv5a/PO_ 3 3
(0) Coal, Wood" Bagasse 3 3 II-JlGflIUJI 997 452 518 28 3
32 Total 1,000 478 4611 88
I-AU FveL/Po_r 857 441 3110 68
(e) Coal, Wood" Bagas •• 857 441 3lIO 68 II-Ma'MJIJI 143 38 1011
M Total 1,000 833 8110 17
I-An FueZ./Po_r . 8110 333 1100 17
(0) Coal. Wood II Bagas.e 8110 333 500 17 ll-.IlaftVcll 1150 1110
III Total 1,000 1,000
I-A." ,tIeL/Po_ 1,000 1,000
(0) Ooal. Wood" Bag".11 1,000 1,000
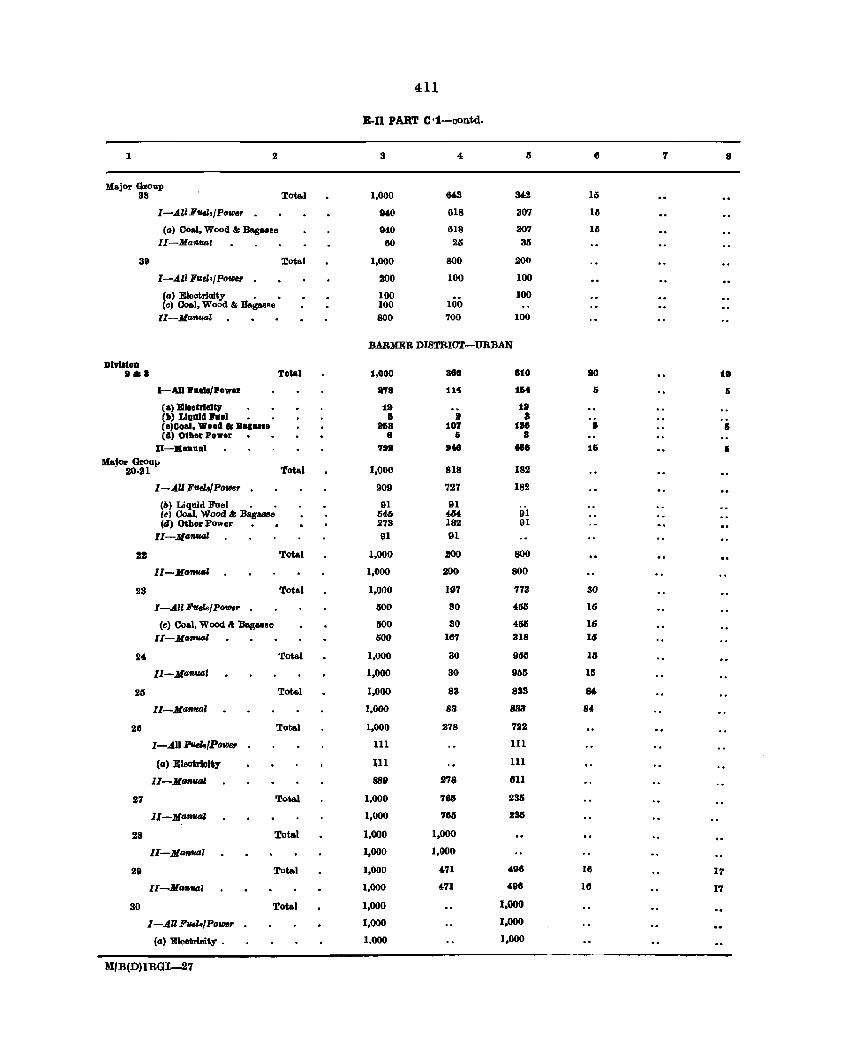
411
E-II PART C ·1-oontd.
1 2 3 4 5 7 8
Major Group 38 Tota.l 1,000 M3 342 15
I-.AliF~./P()wer 84(1 618 307 16
(a) Coal, Wood &: BagM!B 940 618 307 11;
II-Malltlal 60 25 35
39 Tota.l 1,000 800 200
I-.All Fue1,,/Power 200 100 100
(a) E1oot.riaity • • 100 100 Cc) Coal, Wood &; Bag ... ~e 100 100
II-Manual 860 700 100
BAR:MJlJR DISTRIOT-UR:BAN
DlvllloD lIa. Tolal 1,000 880 810 110 10
I-AU 1'1I1l1'Power • .,8 114 lli4 & .. C a) EI.eUleU, i. til (II) LlQ'D11i 'ulll . & l! 8 (.)CoIIJ, WoolllI _ ...... 21i8 107 t88 5 Ii (d) Otber PO'lt'tr 8 .. 8
II-Manual 'JII ,te 4 •• 1& I
Major Groul' 20·21 Tot.l 1,000 818 182
I-AU Fuels/Power 909 727 182
(b) Liquid Fuel . • 91 91 Ie) Coal. Wood'" Baga&!Jo 546 4M 91 (II) OthBr Fower 273 182 91
II-Manual 91 91
21 Total 1,000 ZOO 800
II-Mallu' 1,000 200 800
23 Total 1,000 197 773 30
I-.AII F~fPOtDe' 300 3D 466 IIi
(c) Coal, Wood" Bag •• 8B 000 30 4lHl 16 ll-MafJ.ul 600 161 318 15
24 Tota.l 1,000 30 955 16
I1-Ma"",,1 1,000 30 965 15
25 Tota.l 1,000 83 833 84
II-Manual 1,000 83 833 84
26 Total 1,000 278 722
l-.AII ~/PotDer 111 III
(II) Eleotrioity 111 111
II-M"fIfI4l SSt 278 811
27 Total 1,000 766 235
ll-MIJlIUI 1,000 7115 235
28 Total 1,000 1,000
11-lIl"fllIIll 1,000 1,000
29 Total 1,000 4.71 4,96 16 1'i"
II-Manval 1,000 4,71 496 16 17
30 Total 1,000 1.000
[-.AU F'~' Power 1,000 1,000
(a) Eleotrioity • 1.000 1,000
"/B(D)l RGI-27
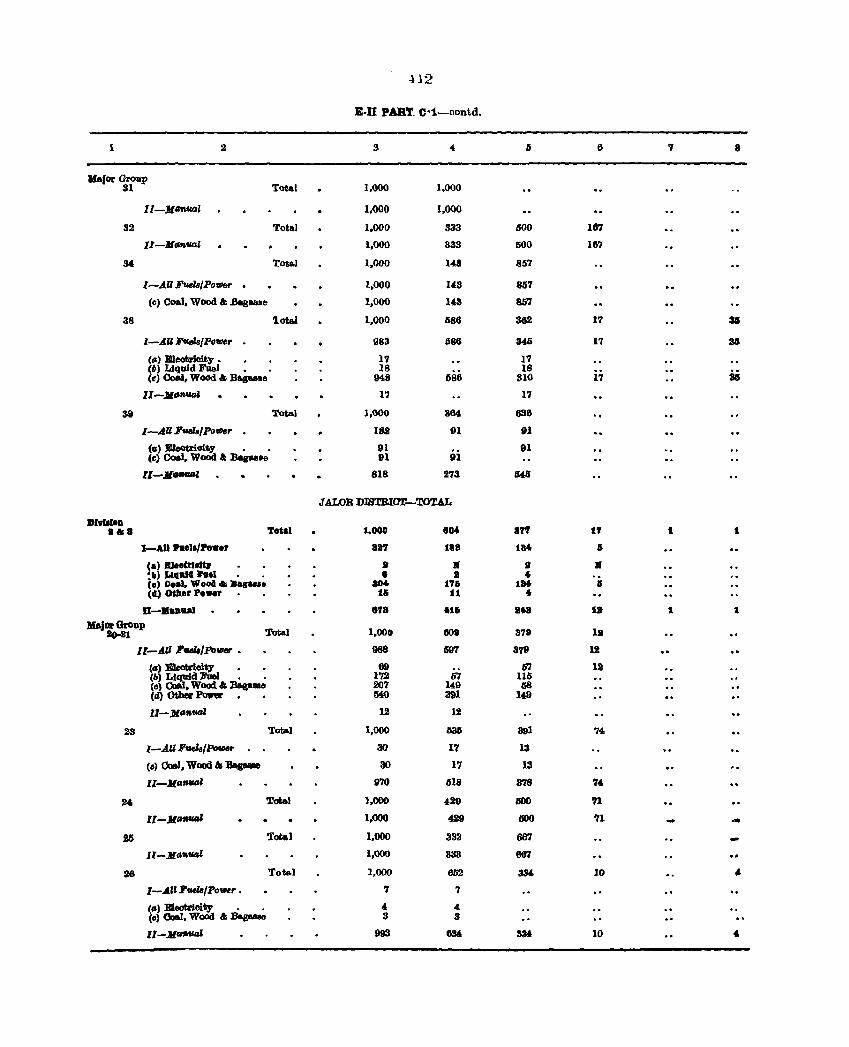
-1J2
E·II PART. C·1-contd.
1 2 3 4, 6 6 '1 8
Vafor Group 31 Total 1,000 1,000
1l-.M~1 1,000 1,000
32 Total 1,000 333 600 167
Il-MtmuaL 1,000 333 500 167
U Tot&l 1,000 143 857
I-A.U FV4lsIPo'llle~ . 1.000 143 857
(e) Coal. Wood I: .8agaase 1,000 143 857
38 'lotal 1,000 li86 362 17 31
I-A.U FttchIPo"lller 983 586 Uli 17 311
(a) Electricity • l'1 17 (6) Liquid Fllel • 18 18
35 (e) Ooal, Wood '" Be.gulle 948 686 310 17
II-Jl."uol 1'7 1'7
39 Total 1,000 364 636
I-AU FuelalPotiler 182 91 91
(II) Electricity • • 91 9i
91 (Il) Ooel, WoOd a: BaglWlse 91
11-.""" 818 273 U5
JALOR DIBTRIOl'-TOTAL
DlvllloD .~. Total 1.000 804 a'l'l t7 t t
1-AU ... l./P .... r a27 18. ta .. a (.) BI.ltrillt. 2 l( • • ~II) LltiulC .... 1 • • • II .. 'e) Ooal. Wo04 ~ Bag .... a04 1'1& 184 a (d) Odler Po.er . • 1& 11 ..
0-••• "" • '1' 11& 8 .. 1. 1 1
Jllajo.r aroDP 20-21 Total 1.000 008 378 12
II-A.U I'tUls/Po_ • 988 6117 379 12
(a) Eleotrioit,y 69 tI1 12 (b) Liquid l"Uel • • 172 67 lUi (c) OoIJ, Wood ... Baga_ 207 149 68 (Il) Other Ponr. • MO 391 149
ll-ll""ql 12 12
23 Total 1,000 636 391 74
I-.AU FueJa/Poeu . 30 17 13
(c) 00aJ. Wood 6\ Baa- 30 17 13
II-Maflw' 970 618 378 74
24 'J.'otaJ 1.000 429 llOO '71
ll-MII"- 1.000 4J9 500 'l1 .. 26 Total 1,000 333 667
Il-M'"'''''' 1,000 S33 667
26 Tota.l 1,000 6D2 334 10 .. I-An Pvels/Power • 7 7
(II) Eleotrioity • . 4 4 (c) eo.I. Wood ... BagaaIe 3 3
11-JlafIIIIJI 993 aM 334 10 4.
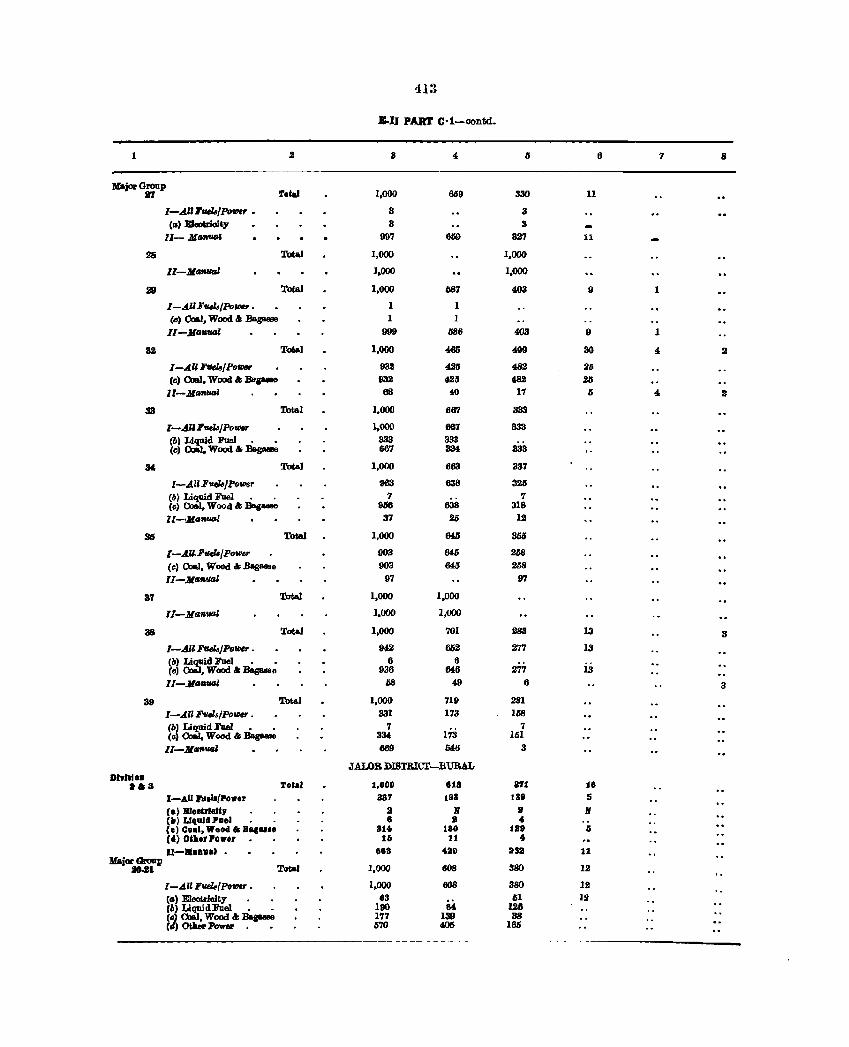
413
B.II PART C·1-oontd .
1 .2 3 " 5 6 7 8
x.j~Gronp 117 '1'oeal 1,000 689 330 11
I-.AUFvtla!Poflltr • 3 3 (a) Elaolidoity 3 3
11- MIIIl'IIQI 997 659 327 11
26 Total 1,000 1.000
II-MIIAual 1,000 1,000
211 Total 1,000 587 403 9 1
I-.AUF~/Po'_' • 1 1
(e) CloaI. Wood " Bagasse 1 1
II-Maflual 999 686 403 I) 1
32 Tolial 1,000 465 499 30 " 2
l-AUF'fIcl8/PofDt, 932 4.25 &8.2 36
(c) 01&1. Wood " BIIs- 93.2 4.26 ru U II-MilaNO! 68 40 17 0 " .2
33 Total 1.000 667 333
I-All Fv.el8jPotDer 1,000 667 333 (b) Liquid Fuel . • 333 333 (cl CcaJ, Wood &; Bas- 667 334 333
34 Total 1,000 663 337
I-Ali Eve1<J/ Poll1er 963 638 326
(~) Liquid Fuel . . 7 7 (cl Coal, Wood &; Bag- 906 638 318 1I ->.JfIlAtI81 37 25 12
35 Total 1,000 Mli 365
l-AU,E1f4l,/P_u 903 M6 l!6B
(c) a.J, Wood &; Bag ..... 903 M6 l!6B
II-MIIAual 97 97
37 'lcMl 1,000 1,000
11-MrJAUtU 1.000 1,000
38 Total 1,000 701 283 13 3
I-All EU4l.!jPolIJU' • 942 602 277 13 (Il) ~dFueJ . • 8 6 Col , Wood &; Dagus. 936 648 277 13
II-MilANO! liS 49 8 3
39 Total 1,000 719 281
I-AU EtJtlslPoIIJU' • 331 173 168
(hl Liquid Fuel • • 7 173
7 (c Coa.l, Wood .. BagNse 31M 161
ll-lilllAual 669 M6 3
JALOR DISTRICI-RURAL DIYllrlo.
•• a '1'0'.1 1,000 813 "1 18
I-All Fuel.fPower 337 193 188 5
Ca) BI.eolell;, II If II If Cb) LI1I.1I11Il'.el 8 J 4 .. Cel C.al, Waoel. BaIU •• 314 180 128 0 C.) Other POwer 16 11 4
D-.a.1I&1 • 8118 .. ao ItSIl 11 Major Group
10 ... 1 Total 1,000 608 380 12
I-A"F~(Poflltr • 1,000 608 380 12 (Ill Eleotrioity • • 63 lil 12 (Ill LiquidFuel • • 190 tI4 128 (c) ChIlI, Wood" Basa- 177 139 38 (d) 0tIaer Power • 670 406 168
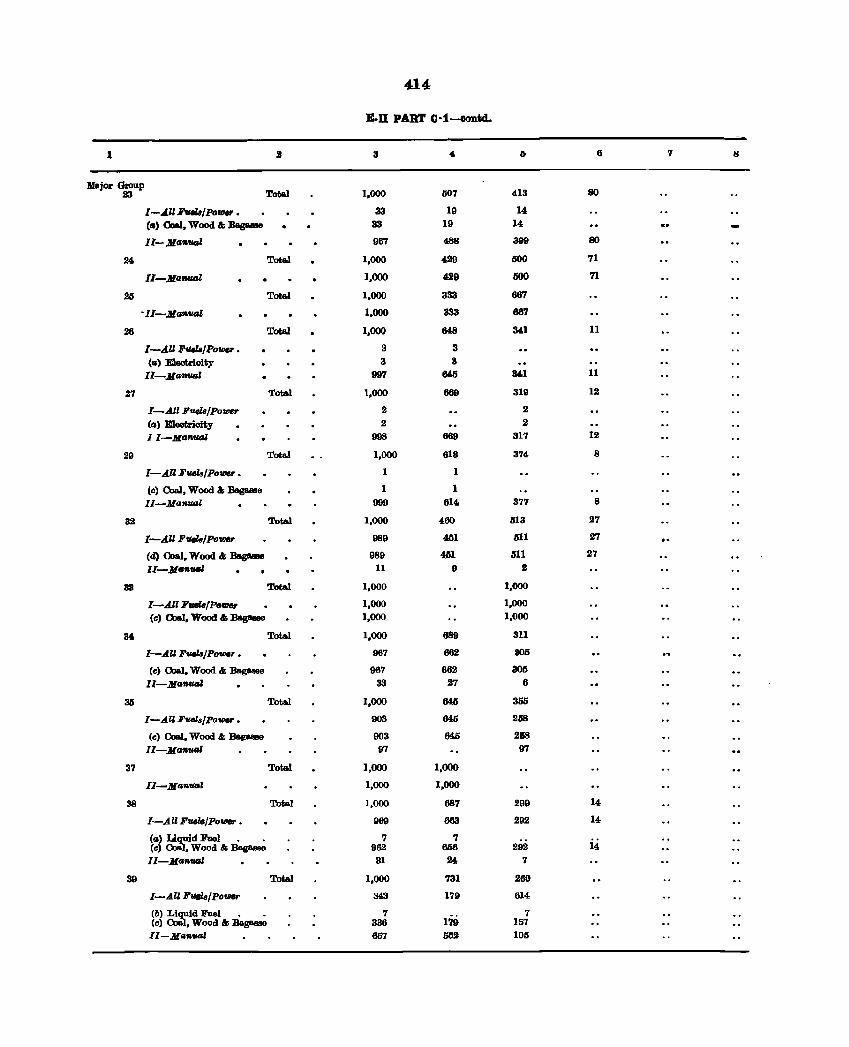
414
B.n PART C ·1-eontd.
1 2 3 4 I) 6 7 8
lrflIjor Group 23 Total 1,000 507 413 80
I-AU Fv.l8/Po_ • 33 19 14
Ca) Co&l, Wood & :oas- 33 19 14
11- MatIUGZ 967 488 399 80
24 Total 1,000 429 500 71
II-Ma_" 1,000 429 500 71
25 Total 1,000 333 667
"Il-Maf&fUI.Z 1,000 333 667
26 Total 1,000 64:8 341 11
I-All Fu.lB/Po_ • 3 3 (II) Electrioity 3 3 II-Mil_' 997 645 341 11
27 Total 1,000 669 319 12
I-All Ft4ils/Powe,. 2 2
(a) Eleetrioity 2 2 lI·-]JlllfW.Gl 998 669 317 12
29 Total 1,000 618 374 8
I-A" Fvels/PoV/U • 1 1
(e) CoaJ, Wood & Bagaosae 1 1 II-Ma_1 999 614 377 8
32 Total 1,000 460 513 27
I-AU FUels/Po_,. 989 451 III 27
(d) (b&I, Wood & Bag8aIe 989 4M 511 27 II-Man_1 11 9 Z
33 Total 1,000 1,000
I-All FtIIIZs/Po,"" 1,000 1,000 (e) Co&l, Wood & :oa.ga- 1,000 1,000
34 Total 1,000 689 311
I-All FU#IJ6/Po_r • 967 662 805
(c) Ooal, Wood & :Bagasse 967 662 305 ll-]Jlamud 33 27 6
35 Tot&! 1,000 645 355
I-AU Fuela/POV1U • 903 645 208
(cl CoaJ., Wood & Baga.e 903 645 218 II-.lJla_' 97 97
37 Tota.l 1,000 1,000
ll-.lJllln_1 1,000 1,000
38 Total 1,000 687 299 14
I-All Ftt.el.jPoV1U • 969 663 292 14
(a' ~id Fuel " " 7 7 (e) , Wood & Bajpsee 962 656 292 14
11-.lJlllflUG! 31 24 7
39 Total 1,000 731 269
I-AZl1!'~/Po_ 343 179 614
(b) Liquid Fuel " " 7 17&
7 (e) Coad, Wood & Baga.aae 336 157 11-.lJlen,,.,, 657 5lIS 105
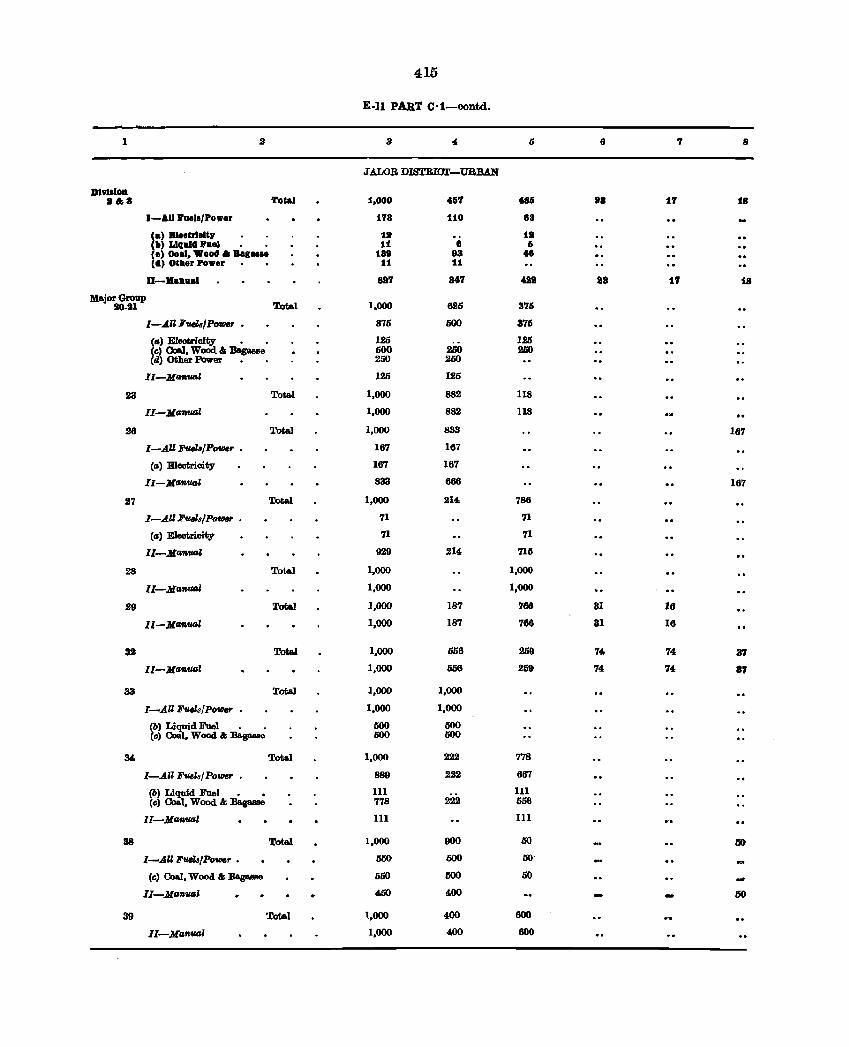
415
E·n PAIlT C·1-contd.
1 3 " 6 7 8
JALOB DISTRICl'-UBBAN
DI9III0Il •• 8 Total 1,000 46'1 486 •• 17 18
I-AIII'II.II/Power 178 110 83
'a) BIe.Malt,. 11t 11t , .. ) Liquid I'll" 11 6 6 Ce) O.al. Woo •• Ba' .... t88 93 48 (d) Otll.r Power 11 11
O-.anllal 887 847 418 88 11 18
Major G!011p 20-21 Total 1.000 625 376
I-AU FtI4la/Po'IHr • 875 500 376
'eI) E1eotrioity • _ 125 1215 (c) Coal, Wood &; Bagasse 500 2liO 2liO (a) Other Power 250 250
II-Mela_Z 125 125
23 TotaJ. 1,000 882 118
II-Melflf/D.l 1,000 882 118
28 Total 1,000 833 187
I-AU li'uel8/P_r • 187 187
(eI) Electrioity 167 167
II - MfMI,'Uf/J 833 666 167
117 Total 1,000 214 786
I-AU li'UBls/Po_ . 71 71
(eI' E1ectrioity 71 71
II-Maflf/D.l 929 1114 715
28 Tot.al 1,000 1,000
II-MtlfIf/D.l 1,000 1,000
29 Total 1,000 187 768 81 16
II-MllrwtU 1,000 187 766 31 16
32 Total 1,000 666 2Ii9 74 74 37
II-MafWGl 1,000 556 259 74 74 87
33 Total 1,000 1,000
I-AlZli''I.t8ldPo_ . 1.000 1,000
(b) Liquid Fuel . . 500 500 (c) Coal, Wood & :Bagasse 500 500
34. TotaJ. 1,000 222 778
I-All Fuelsj PO'IHr • 889 222 667
(bl Liquid Fuel • • 111 111 (cl CoW, Wood & l3&gaaae 778 222 556
II - MfMI,tJaZ 111 III
38 Total 1,000 900 60 50
I-All Fuel.~/Po_r • 650 500 50-
(cl Coa.I, Wood & Bapaae 650 500 50
l1-1IIIn_1 450 400 50
39 Total \,000 400 600
lI-Mtlnf/D.l 1,000 400 800
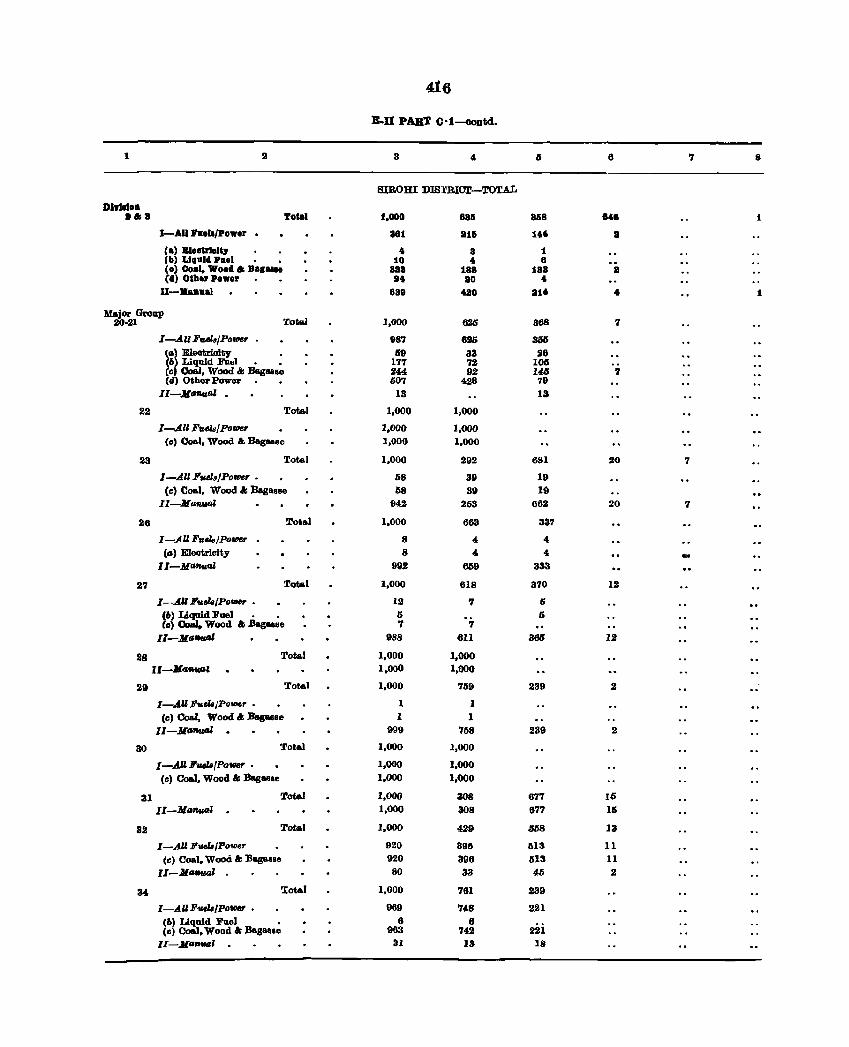
416
B-U PAilT 0 "1--oontd.
1 2 3 " 6 6 7 8
SIROm DISrRICT-TOTAL
DI,ldoD ."'. TORI 1.000 8811 81i8 8'8 1
I-All 1'1I.II/pow.r • 881 81& 11' 8
Ca) B1 •• VleJtJ' 4 8 1 Cb) I.Iq1ll. Pael 10 , 8 (e) Co.l. Woo." B.g .... 888 188 18B 8 Ccl) Other Pow,r 14 80 ,
I1-BaD1I.] 8311 680 81' , 1
M.jor Gro1lP 20·21 Total 1.000 626 368 7
I-AU FuelB/Po_r 987 626 365 lll) Eleotrioity 69 33 26 (6) Liquid Fu .. l " " 177 72 106 (c) Coal, Wood &; Baguse 244 92 146 '1 (d) Other Power 607 428 79
II-MIS".,.al • 13 13
22 Tota.l 1,000 1,000
I-All Fvels/Power 1.000 1,000 (c) 00 .. 1, Wood '" Bag .... s .. 1,000 1.000
23 Total 1,000 292 681 20 7
I-A.U FuelBlPower • 58 39 19 (c) Coa.l, Wood I: Bagasse 58 39 19
II-Manv.al 942 253 662 20 7
26 Tot .. 1 1.000 663 337
I-AU Fuds/PoUJer 8 4 4
Ct.I) Eleotriclty 8 " " Il-M~al 992 659 333
27 Total 1.000 618 370 12
I-A.U Fuels/Po_ • 12 7 6 (6) Liqaid Fuel • • Ii Ii (0) o-t. Wood ".e.gaele 7 7
II-Mrs""" 988 811 366 12
28 Total 1,000 1,000 ll-M'atWIIl 1,000 1,000
29 Tot .. 1 1,000 769 239 2
I-AUFusla,Po_r. 1 1 Cc) Coal, Wood" Bagaese I 1
II-MGItWII 999 768 239 2
30 Total 1,000 1,000
I-AU'ueZ8(Power • 1,000 1,000 Cc) Coal. Wood'" Bagasse 1,000 1,000
31 Total 1,000 308 677 15 II-M~aJ 1,000 308 677 1&
32 Total 1,000 429 658 13
I-AU Fud8/Power 920 396 613 11
(c) Coal. Wood &I Ba.gMse 920 396 613 11
Il-Jlt.l1ttUD 80 38 41) 2
34 'Iotal 1,000 761 239
I-AllF1I.eh/powr • 969 748 221 (6) Liquid Fuel • 6 6
22i (c) Coal, Wood I: Bagallse 963 742 II-MG_l . 31 13 18
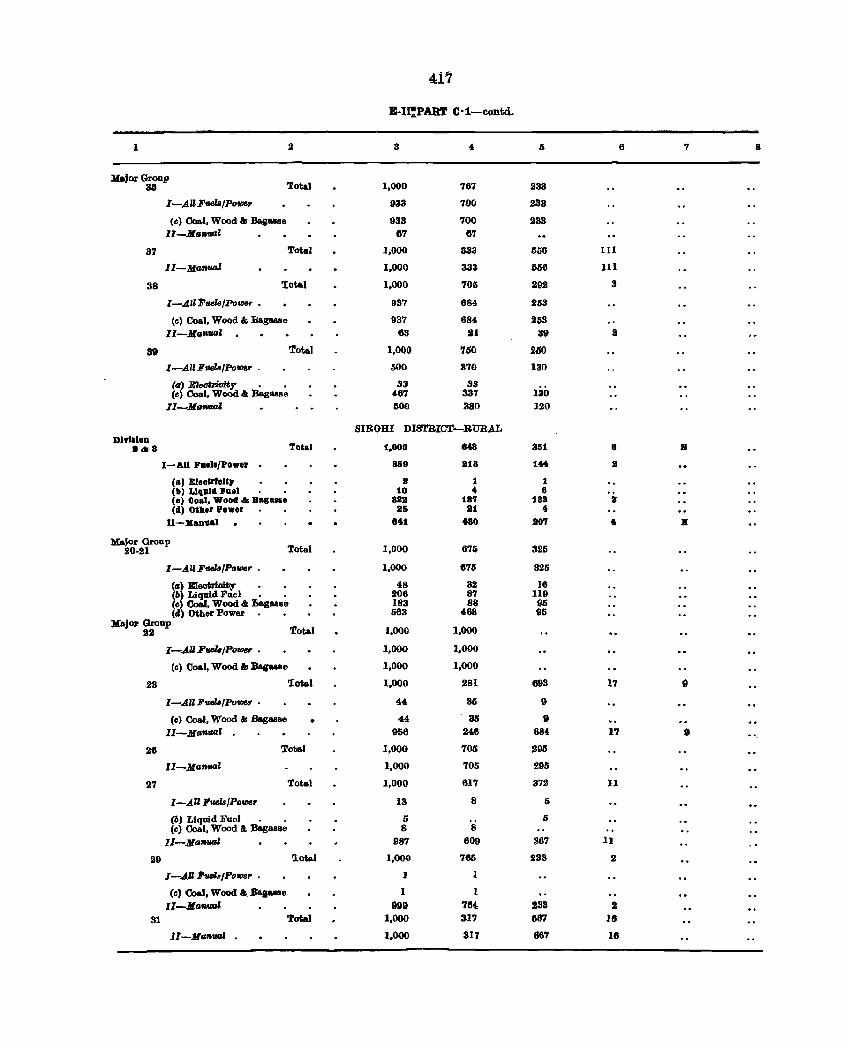
417
E-I1!PABT C-1-contd.
1 3 4 6 6 7 8
lIrflIjor Group Total 36 1,000 767 233
I-AU FfUlB/po,,*" 933 700 .233
(e) Co&I, Wood &I BagasBe 933 700 233 11-Ma_l 87 67
37 Total 1,000 333 656 III
Il-Ma_l 1,000 333 656 III
38 'Iotal 1,000 706 292 3
l-.4.IZPuels/PotDer • 937 884 253
(e) Co&I. Wood & Iia.g&SBe 937 684 253 11-Ma_l 63 21 39 8
39 Tota.l 1,000 '160 200
l-AUFiIeZB/Pouer . 500 370 130
(a) Eleotrioiiy • • 33 33 (e) Coal, Wood'" Bagasse 467 337 130
II-MaftVDJ 500 380 120
SIROHI DISTRICT-RURAL Dlmlon
8.8 '1'otal 1,000 843 851 8 R
I-All 1I'alll{,ower 1169 818 144 8
(II) £Ielllrlol', 8 1 :l (II) Liquid 1I'ael 10 .. 8 (e) Cloal, Wood .. Bagals. 888 187 188 8 (4) Other 'ewer 25 81 4
I1-X.n ... 1 11401 480 lt07 ... 11
Major Group 20-21 Total 1,000 676 325
1-.4.UFuelsIPo_r • 1,000 676 326
(a) EIeotrioity 48 32 16 (6) Liquid Fliel • • 208 87 119 (0) Coal, Wood &: :&gaele 183 88 95 (d) Other Power 563 468 95
Major Group 22 Total 1,000 1,000
I-.tU Fvel8IPotller • 1,000 1,000
(c) Coal. Wood II Bagas_e 1,000 1,000
23 'Iotal 1,000 281 693 17 9
1-.4.11 F1IAilaIPower . 44 35 9
(c) Coal, Wood &I .&gasee 44 35 9 Il-Maftlllli 956 248 684 1'1 9
26 Total 1,000 705 295
lI-Ma_Z 1,000 705 2911
27 Total 1,000 617 372 11
I-All PfUlB/Powe,. 13 8 5
(II) Liquid Fuel • . I) I)
(e) Coal, Wood" Bagasse 8 8
ll-A!a_l 987 609 367 11
29 l.ota.l 1,000 766 233 .2
I-.tU F_./Pow., . 1 1
(0) Coal, Wood I.. Bagasse I 1
Il-MtJfWIJI 999 '164 233 .2 :41 Tote) 1,000 31'1 687 18
I1-Ma'MJ4J 1,000 31'1 667 16
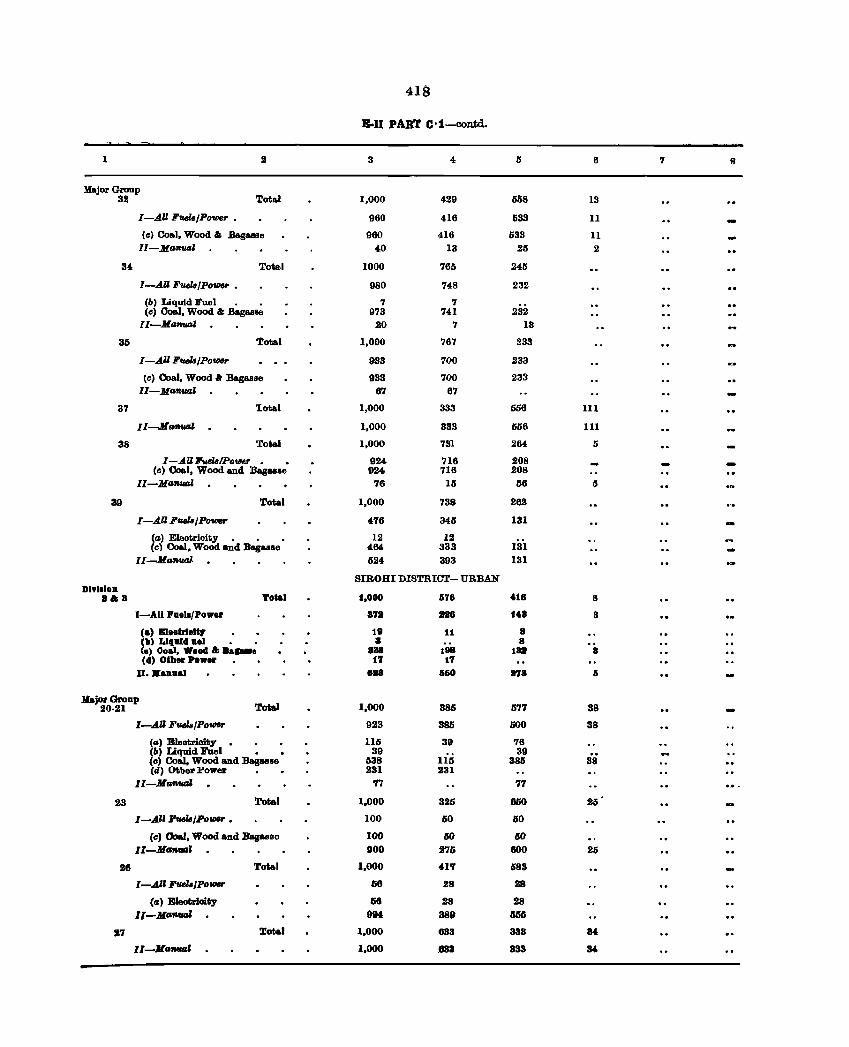
41S
:8.11 PART C·1-contd.
1 2 3 4 5 6 7 8
Major Gronp 32 Total 1,000 429 508 13
I-AU FuelalPower • 960 416 533 11
(e) Coa.l, Wood 1& .Bagasse 960 416 533 11 II-Ma_' 40 13 25 2
34 Total 1000 765 245
I-AU FuelajPower • 980 748 232
(6) Liquid Fuel . • 7 7 Cc) Coal, Wood &: .BagasBe 973 741 232
II-MafOUQI 20 7 13
35 Total 1,000 767 233
I-All FwJa/Powr 933 700 233
(c) Coal, Wood II Bagasse 933 700 233 lI-Ma'l&U41 67 67
37 'Iotal 1,000 333 556 111
II-Ma_' 1,000 333 556 111
38 Total 1,000 731 264 5
I-AU 1!'v.el8JPOllJU 924 716 208 (c) Coal, Wood and Bagasse 024 716 208
II-MO._' 76 15 56 5
39 Total 1,000 738 262
I-AU FvelBlPower 476 345 131
(a) Eleotrioity. • • 12 12 (c) Coal, Wood and Bagasse 464 333 131
II-Ma'1Vl.lQ/. 524 393 131
SIROHI DISTRICT- URBAN Dlyilion
.11;8 Total :1,000 576 4:18 8
I-All Paell/Po ... er 871 IS8 f4. a (a) BleeM.flr . 18 11 8 ~)) Llllalll a.1 • • 8 8 .) Ooal, Wooll .. Ba .... 888 198 181 8 (II) Olb.r Po .... r 17 1'1
II ••• uaal .88 560 87. 5
lla.jor Group 20·21 Total 1,000 385 577 38
I-AU FvelsjPower 923 385 500 38
(ta) Eleotrioity • lUi 30 76 (6) Liquid Fuel • • 39 39 (0) Coal, Wood and Bagasse 538 115 385 38 Cd) Otber Power 231 231
II-Mo._' 77 77
23 Total 1,000 325 860 25
I-All FueJ./Po_ • 100 50 50
(c) OoaJ, Wood and Bagasse 100 50 50 Il-M_I 900 275 800 25
26 Total 1,000 417 583
I-All FueJ./po_ 00 28 28
(II) Eleotrioity 58 28 28 II-MGfMItIJ 984 388 555
27 ~otal 1,000 633 333 34
II-MGfMItIJ 1,000 833 333 34
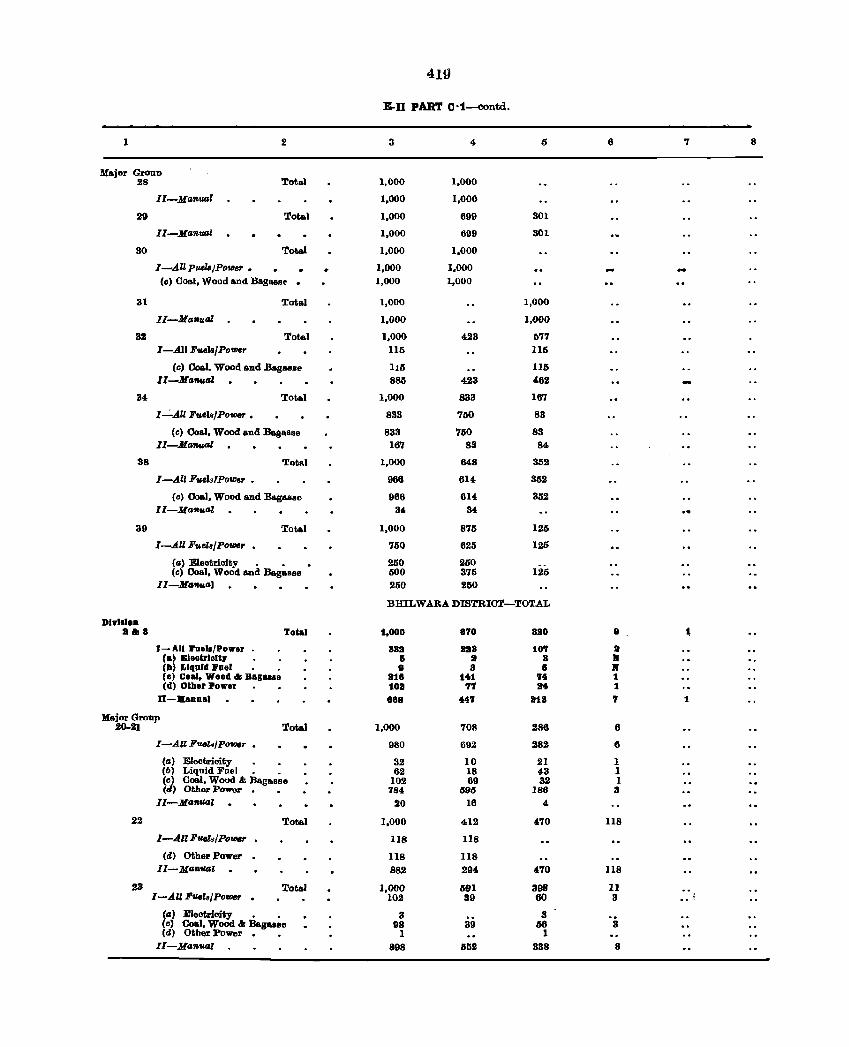
419
E-II PART C·1-contd.
1 2 3 4 I> 6 7 8
Major Groul) Total 28 1,000 1,000
II-Ma'llual 1,000 1,000
29 Total 1,000 699 301
II-Ma'llual 1,000 699 301
30 Tot.al 1,000 1.000
I-AUpu.elIJ/power. 1,000 1,000 (c) Coal, Wood and BagasSE' . 1,000 1,000
31 Total 1,000 1,000
II-Manual 1,000 1,000
32 Total 1,00() 423 677 I-All FueJa/Power 115 116
Cc) Coal. Wood and Bagasse 115 115 II-Manual 885 423 4,62
B4, Total 1,000 833 167
I"":"AZI FushlPower • 833 750 83
(c) Coal, Wood and Bagaslle 833 750 83 II-MIM/4Ql 167 83 84,
38 Total 1,000 84.8 352
I-All FueI.1Power • 966 6l4, 352
(c) 00aI. Wood and Bagasse 966 614, 352 II-Manual 34 34
39 Total 1,000 875 125
I-AU FuslB/Power • 750 625 125
(a) Eleotrioity • • • 250 250 (c) Coal, Wood and Ba.gasse 500 375 125
II-M_al 250 21S0
BHILWARA DISTRICT-TOTAL
Dlvlslo& a&a Total 1,000 870 no 8 •
J - All I'noll/Power • aaa saa 107 a (a) BI80tri0lt, I) It 8 11 (II) Liquid FU81 9 8 8 11 (0) Coal, Wood & Bagu.e a18 141 71 1 (d) Other Powe, toa '17 a4 1
II-Manual 888 447 lila 'I 1
Major Gronp 20-21 Total 1,000 708 286 6
I-AU Fueh/Power • 980 692 282 6
(a) Eleotricity 32 10 21 1 (b) Liquid Foel. . 62 18 43 1 (c) Coal, Wood & Bagasse 102 69 32 1 (d) Other Power. • 784 595 186 3
Il-Mafl'lJal 20 16 4,
22 Total 1,000 412 4,70 118
I-.A.llFfIelsjPo_ • 118 118
(d) Othor Power 118 118 II-Manual 882 294 470 118
23 Total 1,000 591 398 11 :: l I-AU Filers/Power . 102 39 60 3
(a) Eleotrfoity • • 3 3 (c) Coal, Wood & Bagasse 98 39 68 3 (d) Other Power. • 1 1
II-Manual 898 51S2 338 8
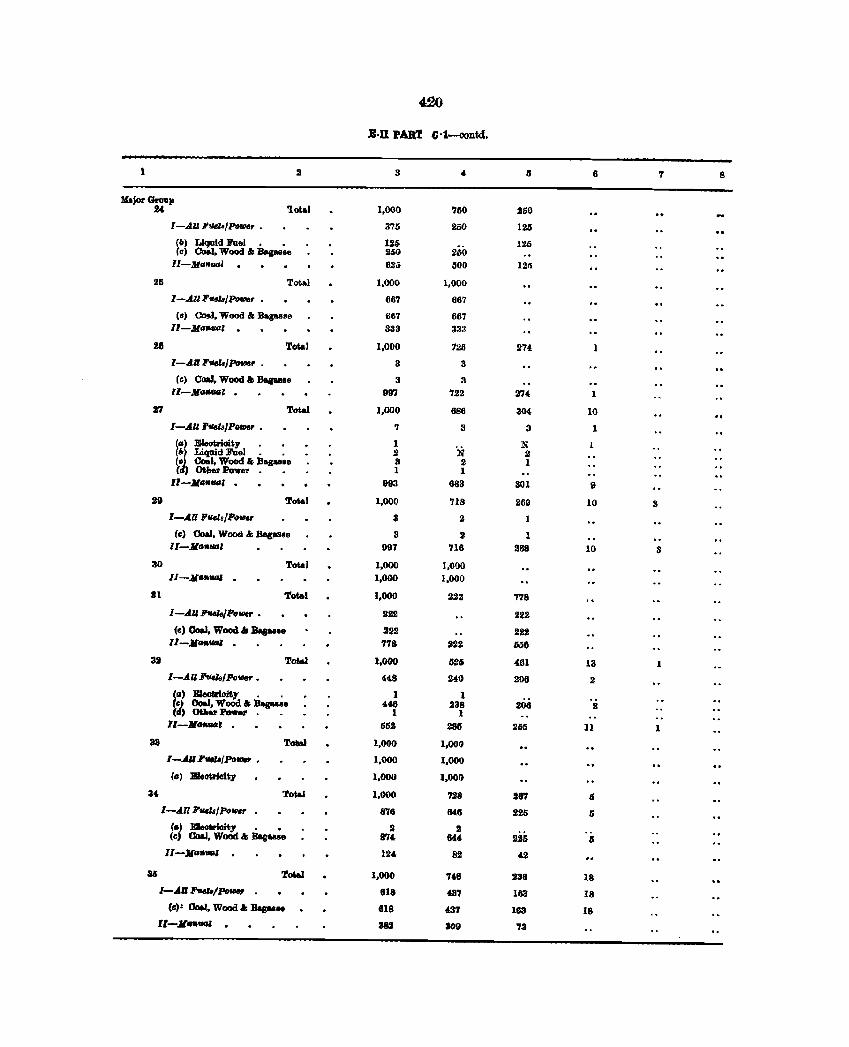
420
Eon PAB'l G·1-COlltd.
1 J 3 4. IS 8 1 8
MIojor Gnlup lU 'Iotal 1,000 75O 250
I-AU FIJel./hll1&r . 375 250 125
ell) Liquid hel 0 0 126 125 Cc) Coal, Wood&: Bag ..... 260 250
II-Ma"flGl 625 500 121';
25 Total 1,000 1,000
I-AIIFIl4l8/hwr 0 687 667
Ce) Ca!rJ, Wood &: B&psae 667 667 1'-Ma_Z 0 833 33:~
2& Total 1,000 726 27t
I-All Fuel8/~r . 3 :I
(c) Coal, Wood I: Dague. 3 :I 11-Ma_Z 0 997 722 274
27 ToW 1,000 886 304 10
I-AU I'vel8/PolD8r • 7 3 3 I
(a) Eleotrioity 0 • 1 N
N (") Liquid Fuel. • 2 2 (~ Coil, Woocl I: Bag.le 3 2 1 ( ) Other l'owo:r 0 0 1 1
"-Ba • .,., · 993 683 SOl 9
29 Total 1,000 '118 269 10 3 I-AU FtICl./po_ 3 2 1
(c) Coal, Wood .I: Bacasae 3 , 1 ll-.J(a.IltJJ 997 718 288 10 3
30 TaUl 1,000 1,000 II-Jl,.,.",., 1,000 1,000
31 Total 1,000 222 118
I-All FtI4h/Po_ 0 222 222
(e) Coal, Wood AI Bag ... e 222 222 ll-Jl_1III1 · 7'18 222 6li&
3' ToW 1,000 625 461 13
I-AU F'tIcL/PoVJer 0 «8 240 208 2
(m) Eleatrioity • . I I (c) OoaJ, WoOd 81 Bag ... e U6 238 208 2 (If, ou,er Power 1 I ll-Jl_' 0 652 281f 265 11 1
33 Total 1,000 1,000
l-AUF."./PolD8r • 1,000 1,000
(0) Bleatrieity 1,000 1,000
34- Total 1,000 728 287 5 I-All Fuel8/Poll1Cr 876 846 225 5
(0) EIeoVioity • 0 2 2 (c) 00&1, Wood" Bagasse 87" "' 225 5
ll-Jl""1III1 · 12' 82 42
3S ToW 1,000 146 238 18 I-AD heIB/PoIHr 618 437 183 18
(II)' lJoAl. Wood & Bagas.e 818 '31 163 18 ll-.II_' au 309 '13
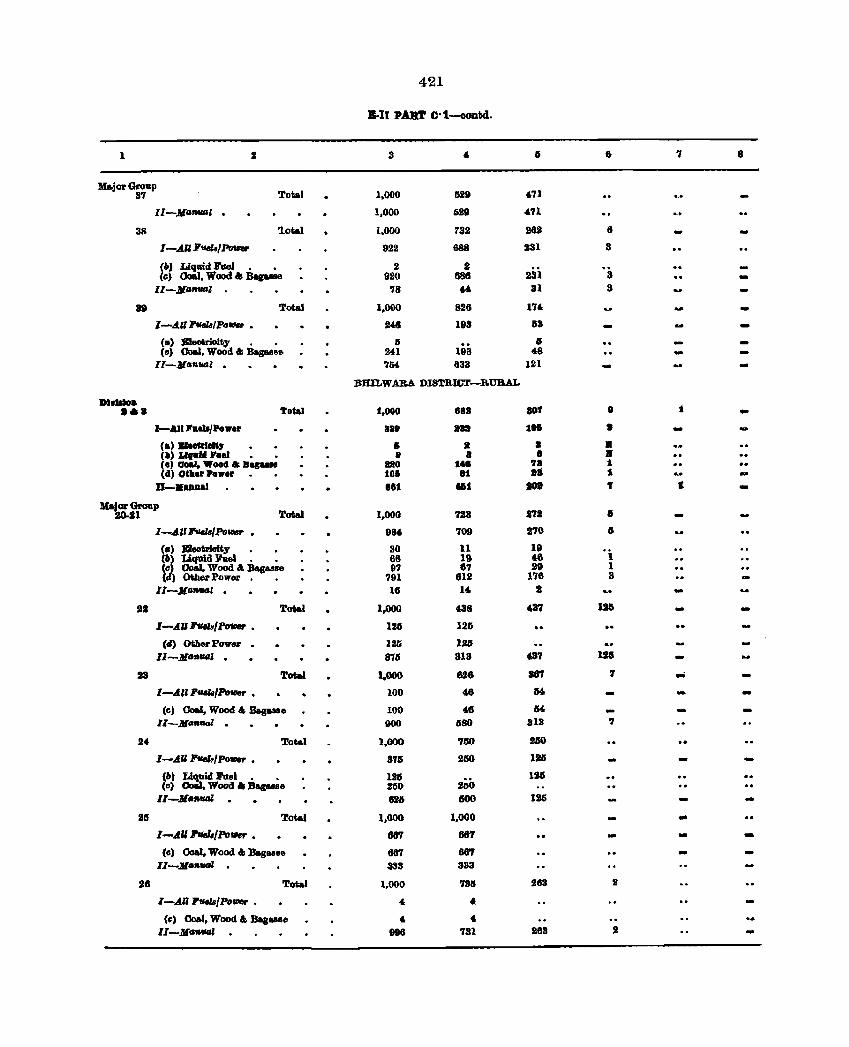
421
B·II PAR'l' C·1-oontd.
1 2 3 Ii 6 7 8
Ma.jOl' Group 37 Total 1,000 529 671
Il-Ma-l 1,000 629 471
38 'lotal 1,000 732 2fIJ a -I-AU Fuela/Power 922 688 231 3
(6) Liqllid J'ueJ. • 2 2 (G) (JoaI, Wood 41 Baguse 920 686 231 3 -II-J{antlal 78 " 31 3
n Total 1,000 826 174-
I-AU Fvel8/PG_ • 248 193 153 -(II) 1IlleoUioity • • Ii G (0) Coal, Wood a: Dague& 241 193 48
II-MaRlllAl · 704 633 121
:BHn.WARA DISTRICT-RURAL
DltJaJoa
••• Toeal 1.000 888 807 8 1 -I-All Fag/Po".r 888 In 1011 •
Ca) BIeeUIeI&J' Ii It • • (II) 1.1, ........ . 8 a • • Co, ao ... Wood. Bae.1I no lie 'fa 1 (I) oeller Po".r 105 81 .i t -D-•• aaal III HI 101 ., , -
Kajar Group Total 272 • 20-11 1,000 723 -
I-A",..,./PollltSr • 981 709 270 IS
(II) Bleotricdty 30 11 19 'i (6) Liquid Fuel. • 66 19 '" (o) 00aI. Wood a. Bagllllie 97 67 29 1 (eI) ~er Power. • 791 612 178 3
[[-J{G_l · 16 14 II
21 Total 1.000 4.38 137 121
I-AUJ'tIIIa!Power • 116 126
(cI) Otber POWCtI' . 1115 126 II-J{4flvaZ · 815 813 437 111
23 Total 1.000 fIJI S61 'I .- -I-All """'1'0_ . 100 46 M
(ej Coal, Wood" Bag_& 100 46 M II-JlGflfIGl · 900 1580 313 7
24 Total 1,000 7150 2150
I-AU Fuel~/PovIer • 376 260 125
(II) Liquid hel. • 1211 2ilo I. (c) 00IiI. Wood" Bagllll88 250
II-MllfI_' 8J1S 1500 115 -1111 Total 1,000 1.000 ..
I-AU '-h/Powr • 1167 66'1 - -(c) Coal. Wood" BagIlllBe 68'7 667 -lI-.J(afllllll · 333 333
116 Total 1,000 735 283 II
I-An FfIClsjPo_ • " " (c) Coal. Wood a. Bagule " " lI-JCGfIV4l 1196 731 283 i
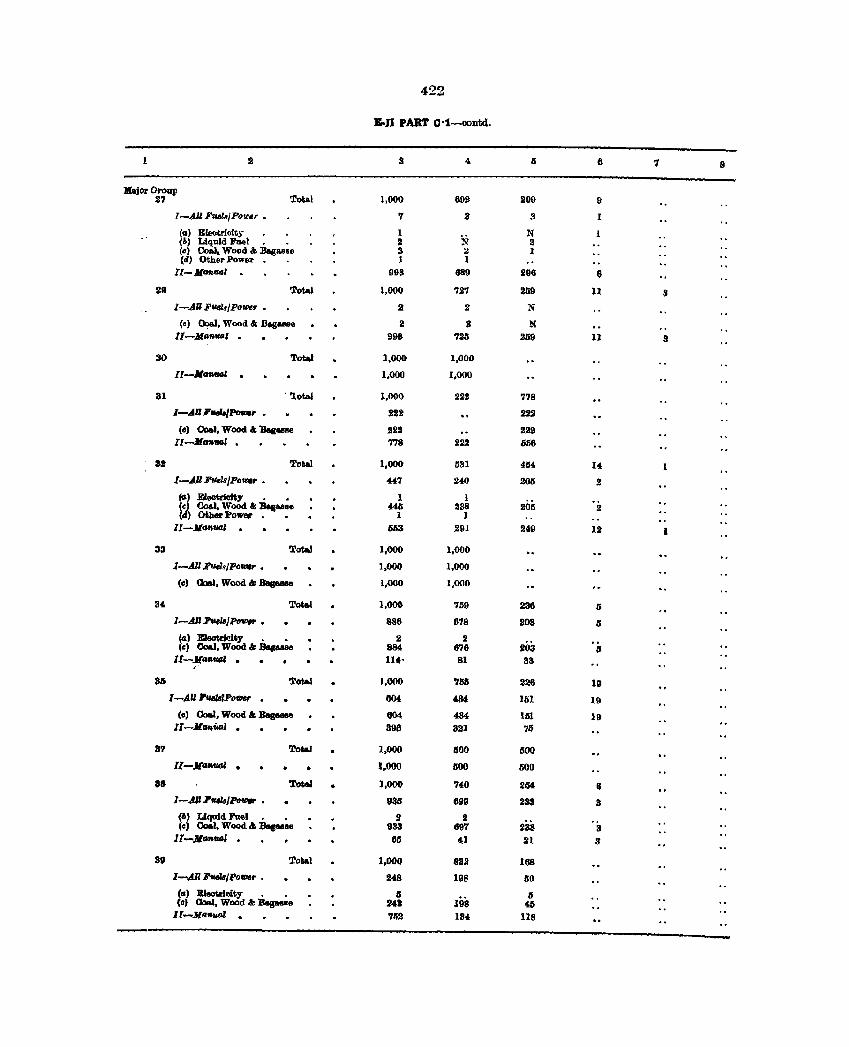
422
B.1I PART C·1-oontd.
3 .... 6 '7 8
Kajor Group :.l7 Total 1,000 692 299 9
I-AU Fuelsl Pow, • '7 3 3 1
(0) Bleotri<>ity 1 N
N (6) Liquid Fuel. • 2 2 (c) eoal. Wood" :Bag&l!61l 3 :I 1 (tI) Other Power 1 1
Il-Manfllll · 993 689 296 e 29 Total 1,000 72'1 259 11 3
I-AUFVBl8Jpo~r • 2 : N
Ce) Coal, Wood &: BlIIgas ... 2 3 N II-M,.ft,",' · 998 '7211 2B9 11 3
30 Total 1,000 1,000
II-It""'fIlIl · 1,000 1,000
31 . 'lota.1 1.00Q 222 '778
/-.AU ,-,PDq,. . 222 22.2
(D) Ooal, Wood I: 'Bai:asae 2211 222 II-Jla",ul • 778 222 056
3J Total 1,000 581 ,II,. 14
l-.A.UFttel8JPov:.r • 447 240 205 .2
(a) Electrillity • • 1 1 (cl Co.l, Wood" lJasuse 44& 1138 205 2 (d) OilIer Power. • 1 1
II-Mo",val · 663 2111 249 12 I
33 Tot.! 1,000 1,000
I-AU Fu.hIPD_ • 1,000 1,000
(e) 00&1, Wood "= Bag_ 1.000 1,000
34 To_I 1.000 759 236 Ij
I-All Ft&el8/Po_ • 888 618 208 II
(a) EIeotrki$y • • 2 2 (e) Coal, WoOd. Batrasae 884 676 103 II
Il-MII.fW4ol · U4' 81 33
Sb TotA' 1.000 7611 226 19
I-AU J'~'POfl1lf' . 604 484 151 19
(0) Coal, Wood .. Bas- 604 434 151 19 JI-Jl"",ul · 396 321 711
37 To$&] 1,000 1100 500
ll-M'alMlGl • 1,000 IlOO 500
88 Tot6l 1,000 740 254 8
1-.fJl Jl'VBla/Poflltr • 935 699 233 3
(6) Liquid Fuel. • 9 2 llsa (c) Coal, Wood" IJasuae 933 697 3 Il-Jldftul · 65 41 21 3
3' Total 1,000 831 168
1-.fJl F1A4lB/Pofl1er • 248 198 50
(a) EIeotrioity • • II 198 IS
(c) aw, Wood .. Bagu.e ,.8 4lI ll-NtlftUDl · '1112 111" 118
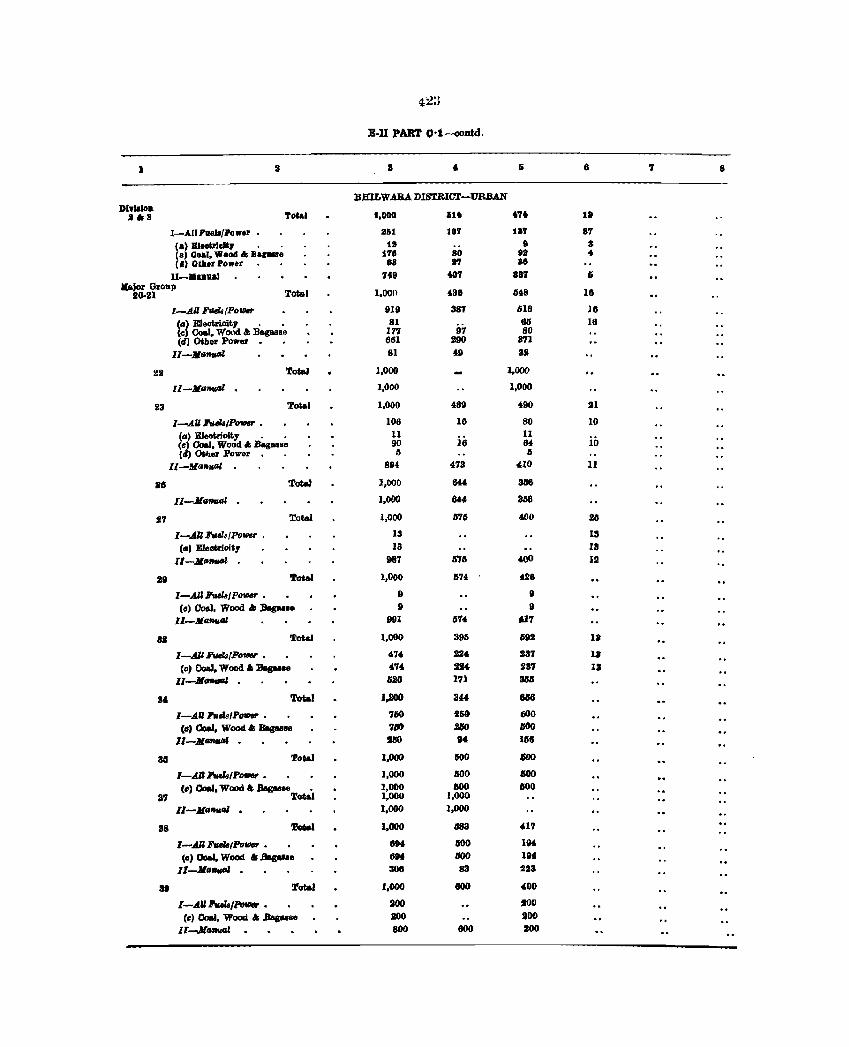
4i~
E·D PART C·1-GODtd.
1 It 8 , 5 6 7 8
Bf£ILW.ARADISTRIO'.r-URBAN DI.llloD.
.&8 Tota. .,000 Iil1 I" 1.
I-AIlFaeJIfPawlr • 11&1 107 137 8'1 ,a) BJ.otlIeD, lit 9 S (a) CDal. WD04 & Bagule 178 80 9. .. (II) OlJler Power 88 • 7 38
U-•• D'A&I 749 to'1 817 6 llajor O-.p
S0-21 Total l,oon la6 618 16
l-All FUflsIPowr 9111 38'1 616 J6
\") E1eotrioity . • 81 65 16 0) Coal, Wo<ld '" Bagasse 177 111 80 til Other Power. • 661 290 371
Il-:at_1II 81 I" 3S
211 ToW 1,000 1,000
ll-:ata'IHIM . 1,000 1,000
23 Totel 1,000 489 190 21
I-AU h,zsIPo'lller • 106 10 80 10 (.) Rleot;rioity • • 11 11
iii (0) eo.J, Wood" Bag8llBII 90 16 IU (tI) Otller Power II II
11-lIlaavlll 894, 173 4.10 11
16 ToW 1,000 6U 8116
II-.JIa~ · 1,000 au 368
27 Total 1,000 IYlIi 4()() to
I-AU Fvel8/Polller . 13 18
ell' Elecmoity 13 13
II-M."" 987 575 'I)() III
211 Total 1,000 574 418
I-AU.I'uek/PO_ • " " (co) Coal, Wood .. :ae,a.Be II II ll-Jlll.nulil 991 314 '17
8. Total 1,000 395 Ii92 13
I-AJll'uela/Powr • .,4. 221 137 13
(0) Coal. Wood .. Bas" •• '71 lIM 137 11 ll-.JI-Z 1118 171 11M
3' ToQil I.,BOO 3" 1186
I-.AU Ftlds/P_ • 760 250 (iOO
(0) CIoaI. Wood .. Baguae 7. JlIO 1100
ll-:at_' · SIlO '" 1118
31 Total 1,000 1100 600
I-All li'tuhIPo_ • 1,000 MO 100
(e) 00eJ. Wood" .8agu1. • 1,000 MD GOO 37 Total 1,000 1,000
11-.JIflnulll · 1,000 1,000
88 'loIia1 1,000 683 '11
I-A" FulsIPo'llleF • 8N 600 IIH (e) 00aI. Wood li:.8BgaMe 6lJf 600 11111
II-JI"..., 308 83 1113
ae Total 1,000 800 4.00
I-AlIl'uIa,PtIv. • JOO 100
(~) 00eJ. Wood .. Baguse JOO lIOO II-.JIo_' 800 600 1100
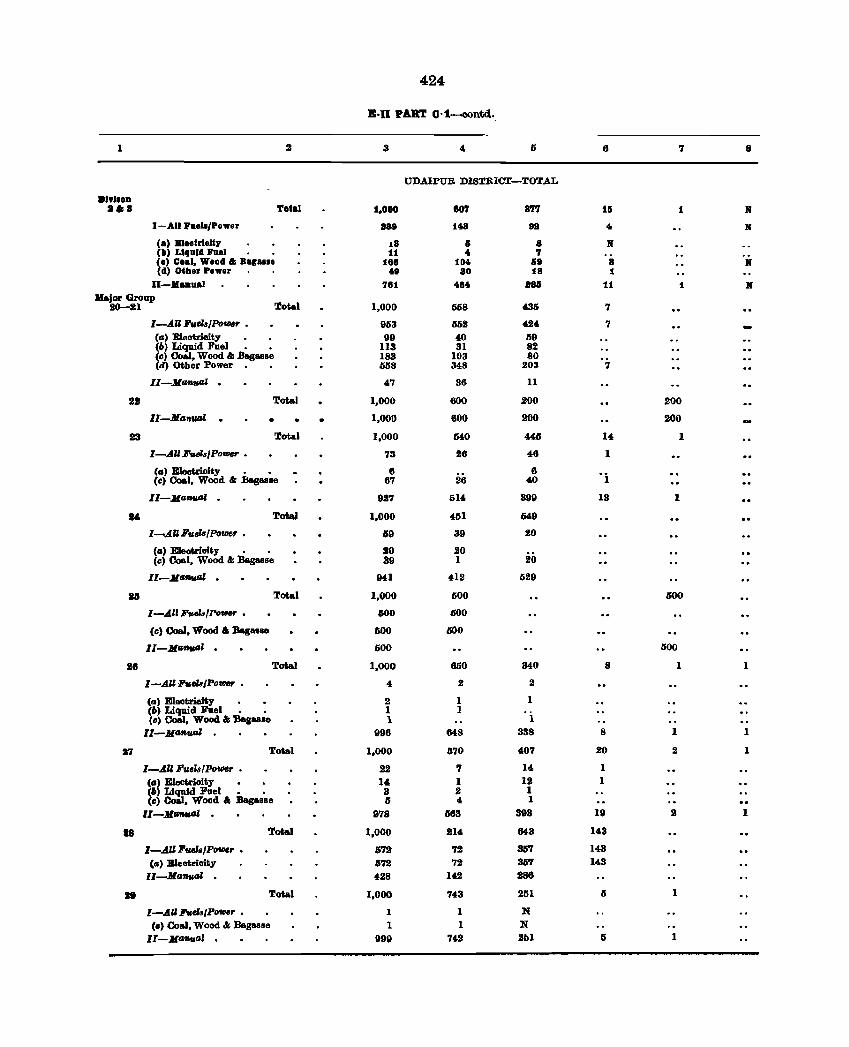
424
B·lI PART O·1-oontd.
1 2 3 4 II 6 7 8
ODAIPUR DISTRICT-TOTAL
.I"IIOB ••• Total 1,000 807 877 15 1 X
I-AlIl'a ... ,Power aa8 14a 8a 4 N
(a) BI.otrloH:r .&a 6 8 N (II) LIQald l'ao1 11 4 7 (I) C.al, Weod & Bagassl 188 104 68 a N (d) Oiber Power 48 ao 18 1
1I-.III[a.aal 781 484 au 11 1 N Major Groap
20-:n Total 1,000 568 436 7
I-AU Fuus/Po_r • 953 562 424 7 (a) Eleotrioity 99 40 59 (6) Liquid Fuel • • 113 31 82 (0) Coal, Wood &; Bagasse 183 103 80 Cd) Other Power. • 058 348 203 7
II-M_GZ · 47 36 11
2J Total 1,000 600 200 200
lI-.JlanVJJI · • • 1,000 800 200 100
23 Totel 1,000 640 446 14 1
I-AllFuelB/Po_ • 78 26 48 1
Ca) E1eotrioity • • 6 26 6 'i (c) Coal, Wood &; lSag .... e 67 40
II-Ma_' · 927 514 399 13 1
t4 Total 1,000 451 649
I-All F"alB1Po_r • 69 39 20
(,.) E1eotrioity • • 10 20 (c:) Coal, Wood &; Bagasse 89 1 20
II-M"RWJl · 941 412 529
III Total 1,000 500 600
I-All FuelB/Po_r • 500 600
(c) Coal, Wood'" BaguBe 600 000
II-Ma,.al · 600 500
26 Total 1,000 660 340 8 1 1
I-An hela/Po_ • 4 2 2
(a I E1aotricity 2 1 1 (6) Liquid hel • • 1 1 (0) Coal, Wood" Bag ... e 1 1
II-Mtmv,al 996 648 338 8 I I
:1117 Total 1,000 470 '07 20 2 1
I-AU F".lalPo_r • 22 7 14 I (II) E1ectrioity 14 I 12 1 (6) Liquid Fuel • • 3 2 I (0) CoBJ, Wood " BagasBo 5 " 1
'I-M_al 978 583 393 19 2 I
18 Total 1,000 214 643 143
I-All FuelalPolDer • 572 72 3117 143
(,.) E1e8trioity 572 72 357 143
II-Ma_' · 428 142 286
• Total 1,000 743 251 II 1
I-AUFuelBIPotIJer • 1 1 N (0) Coal, Wood" BagasHe 1 1 N
II-MtJ",",d 999 742 2bl 5 1
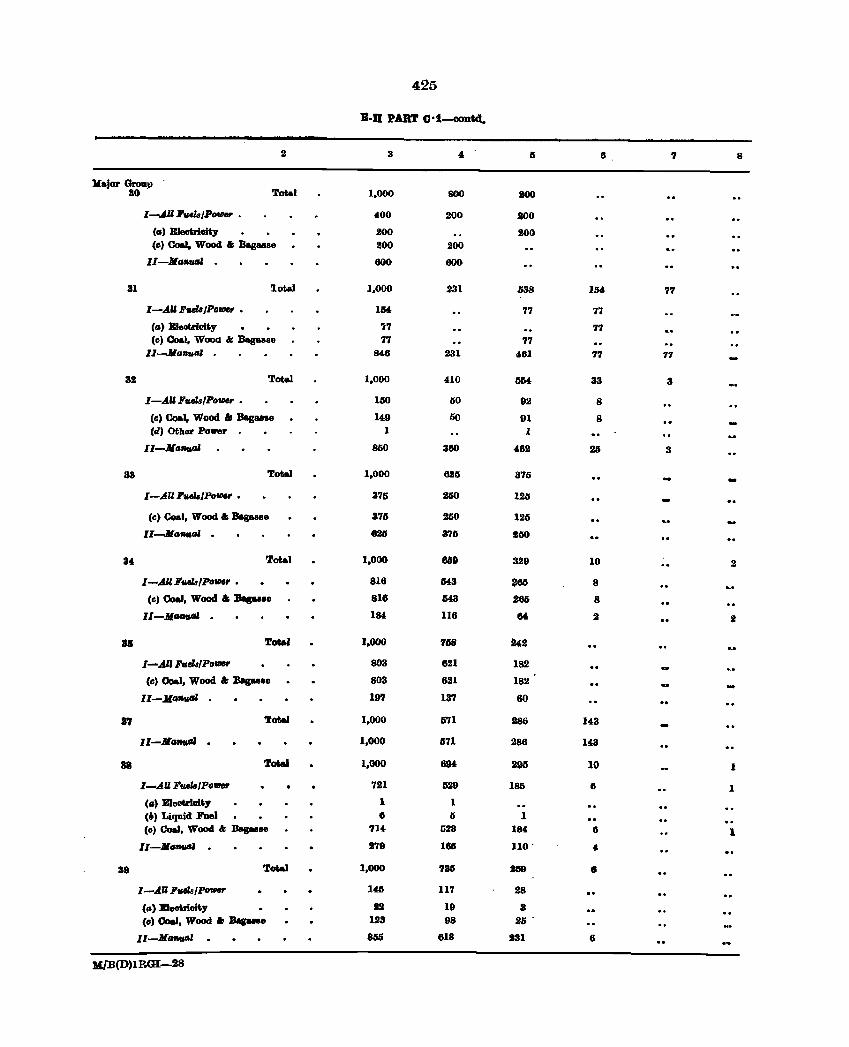
425
B·O PAIlT C·t--00nt4.
2 3 4 8 7 8
Vajor Group 30 Total 1,000 SOO aoo
I-AU Fwel8/PolDef' • 400 200 200
CCI) BIeotrioity 200 200 (.:) Coal. Wood " Bagall8e 200 200
II-JIG_' . 800 600
31 l:otaJ 1,000 231 538 1M 77
I-AU FtWB/PollJer • 1M 77 'l7
(II) Eleotriclt.y " 77 (c) Coal, WOOd" Bagasse 77 77
l1-.11a .. '" 848 231 481 77 77
32 Total 1,000 410 OM 33 3
I-AU FIIA'Ia/PolDef' • 100 60 92 8
(Il) Coal, Wood " Bagalllle 149 60 91 8 Cd) Other Power 1 1
II-JlII~ 850 3SO 482 26 3
33 Total 1,000 826 375
I-.AU Fv.ehIPOllJer • 375 250 12a
(Il) Coal, Wood" Bagasse 375 250 125
ll-.llll,,'" . 625 375 1;50
34 Tat.1 1,000 8IID 329 10 2
I-AUFv.eh/PollJer • 816 543 385 8
(c) Coal, Wood &\ ...... e 816 543 266 8
II-JlIJfItlAII . 184 116 M 2 2
81 Total 1,000 758 942
I-AU Fv.eIs/Po- 803 621 182
(c) Coal. Wood & Beg .... e 803 621 182
Il-j(Gflv.fIl 197 137 60
1'1 Total 1,000 571 286 143
Il-JlGIttI.GJ . 1,000 571 288 143
88 Total 1,000 694 295 10 1
I-AU Fv.eltJ/PollJer 721 529 185 8 1
(G) EleotriGit.y 1 1 (6) Liquid Foel ., 5 1 (c) Coal, Wood " Bag ... e 714 523 184 8 1
II-JlG_1 . .79 165 110· " 39 ToW 1,000 785 259 ..
I-AU FueI8/PollJer 145 117 28
(II) Bleemioity n 19 8 {II} Coal. Wood & Bag_. US 98 as-
Il-JlGftW.Il 855 818 231 6
K/B(D)lRGI-28
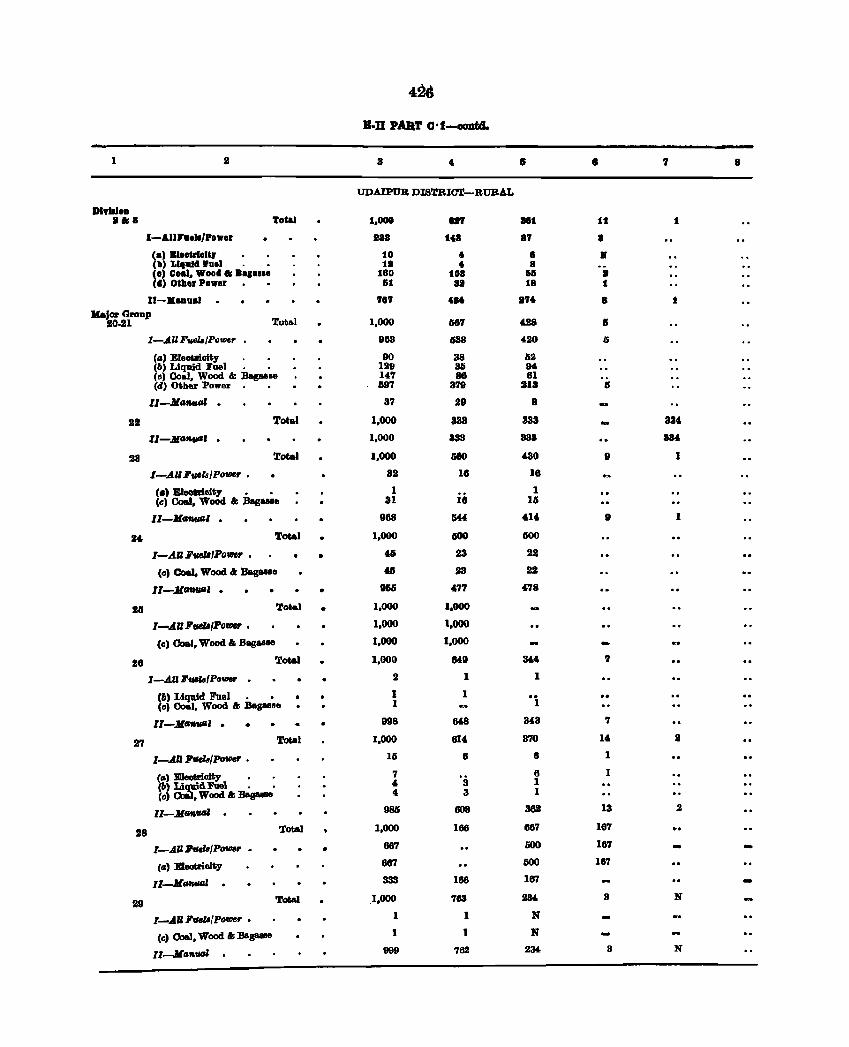
426
B·D PART C·1-00ntd.
1 3 4 15 • 7 8
UDAIPUR DISTRIC'l-RUBAL
DIYllJOD ••• ToCa. 1.000 U7 881 11 f
.-AUF.ala/Pow.r 188 U.8 .7 8
(a) Bl.atrl.li, 10 .. I • (11) Lit". l1u81 . 1. .. a (a) Coal. Woo •• B.' •••• 110 108 && • f.) OCh.r Pow.r 61 88 la t
11-."1111 787 ..... 17. 8 t Major Oroup
10·21 Total 1,000 1167 ~8 IS
I-AU Fv.u./PoIHr 983 GS8 420 4>
(II) EleotftDity 90 38 1i2 (6) Liquid File) • • 129 35 94 (c) Coal, Wood &: Bag ... e 14'1 86 81 (d) Other Power 597 379 218 II
II-Jl"",,'" . 37 28 8
21 Tot.1 1,000 883 333 33'
ll-.JC1I7I_" . 1,000 333 338 8N
23 Total 1,000 Ii80 430 9 • l-AIU'_l8IPo'IIIU • 32 US 18
(II) EIeotIioity • • 1 ii
1 (c) Coal. WoOd " Bag .. SII 31 115
Il-.JCGfWt1,1 • 888 M4 ,U g 1
2' Total 1,000 &00 1100
I-AU Fu~'PoVIU • • • 46 23 22
(c) Coal, Wood I: Bag_a U 23 22
II-.JC~' • • 9IJlj ''17 478
21 Total • 1,000 1,000
I-AlU'fIIlBIPoVIU • 1,000 1,000
(c) Coal, Wood" Bag .... 1,000 1,000
28 Total 1,000 848 M4 7
I-AU FtlllafPo_ . 2 1 1
(6) Liquid Fuel • • 1 1 .. (c) Coal, Wood &: Bagasfle 1 1
11-11-_' . • 998 648 343 7
27 Total 1,000 814 370 14 2
I-.All1!'tlel8/Po- • 15 8 8 • C.) EJaoUicity • • 7 ·s 6 1 (b) Li 'd Piie1 • • 4 1 (c) ~Wood &:Bas- 4 3 1
11-11 .. -986 1108 362 13 2
28 Total 1,000 168 867 187
I-AU1!'1IelB/Po- • • 687 500 187 -(.) Eleotrioity 607 500 187
II-.JCllmMIl 333 168 167 -29 Total 1,000 '183 234. 3 N
I-All FdelB/PoVJer • 1 1 N
(c) Coal, Wood " Bagallll& 1 I N
II-M.",- 999 762 2M 3 N
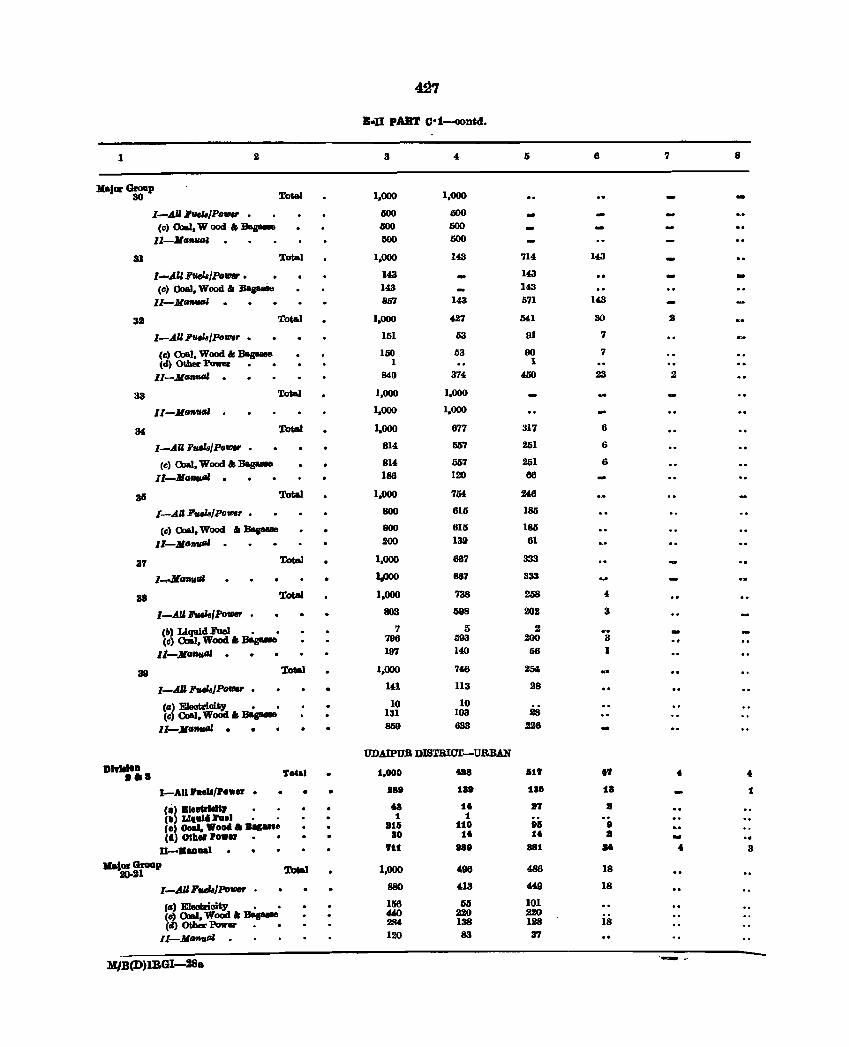
~7
B.U pART O·1-«)D&4.
1 2 3 4 6 7 8
J[ajw GlO1I.p 30 Total 1,000 1,000
I-All J'fId8/PotlJlr • I!OO tiOO -(Cl) Coal, W ood &I Baa-e 000 &00 -II-JllllltlGJ 500 500
31 Total 1,000 143 714 143
I-.tf.ll~/Po'lllfl' • 143 - 143
CCl) 008), Wood II Bagaaie 143 143
II-AlGft'" 867 143 571 143
32 Totaol 1,000 427 MI 30 :)
1-.AllJ'fI4~/Po'll1er • 151 53 91 7
(c) Q)al, Wood II Baa-e 150 53 90 7 (d) Other Powv • • 1 1
II-Al-- · 849 374 450 23 2
33 Total 1,000 1.000
II-JlGfttIG' · 1,000 1,000
34 Total 1,000 677 317 6
I-.AU Fueh/Po_ • 814 55'l 251 6
(e) Ooal, Wood,. ~ S14 557 251 6
II-JlIIIIfIIJI · 186 120 116
35 Total 1,000 704 246
I-.AU FuJslPoV1lr • 800 615 185
C~) OoIol, Wood &I Bagaaae 800 815 185
II-Jlo .. utJJ · 200 139 61
37 Total 1,000 867 333
I-Jt"""aI 1J)OO 867 333
38 Total 1,000 738 258 4
1-.tiU FtMIe/Po- • 803 6118 202 3
(b) Liquid Fuel • • 7 5 2 ... -(c) 00&1, Wood &I Ba&- 796 mI3 200 3
It-Jl· ..... . 197 140 Ii6 1
38 Total 1,000 748 2M
I-All F_IPOfIIIr • 14,1 113 28
,.) Eleotrioity • • 10 10 is (c) 00&1, WoOd &I :Bas- 131 103
II-Jl""'" . 859 833 226
UDAIPUR DlSTBIC1r-U.BBAN
DI .... ••• To' •• 1,000 ... 8 511 t7 .. .. I-AIII' .... /power • • Jl89 tae ta. 18 1
,.) BI.llJleltJ 48 11 87 8 CIl, LI'........ . 1 t Co) OeaJ, •• od ,. ."Utl 816 110 86 8 (d) 0111.. Pow" ao 1t 1t a - ..
11-..... • Itt 188 88t at .. 3
llal_Grollp 20-21 '.l'cMl 1.000 4116 486 18
l_.tf.llF_/Power 880 4.l3 449 18
C.) E1eotrioity • • 100 56 101 CC) 00&1, WoOd ... :Bas- 440 220 220 (Ii) 0Iihar Power 284 138 128 18
Il-JlGflVfJi 120 83 37
M/B(D)lRGI-J8. ..._. _.
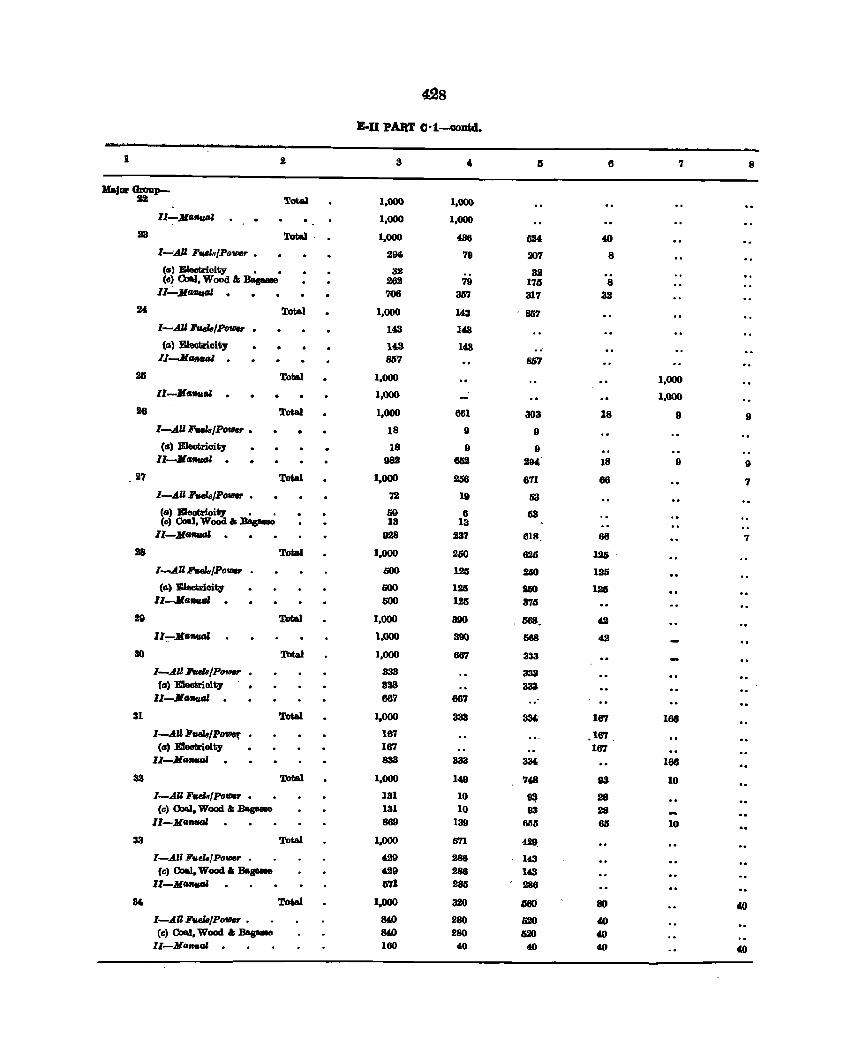
428
E-II PARr c·t-oontd.
I 2 3 , 6 7 8
lfajor Group--22 '.rota.} 1.000 1.000
11-._",,", 1.000 1.000 28 Tota.l . . 1.000 ""' liM 40
I......;All FatIla/Pofl18r • 21J4, 78 2O'l 8 (os) EIeotricity • • 32 32 (e) Coal. Wood & Bas- 262 78 175 8
11..:.....tl.fl.utJl · 706 367 317 32 ~ TotaJ 1,000 143 857
l-AUFuclsIPowu • 143 143
(II) Elootricity U3 143 .. I/-JI __ 1 · 867 867
IllS TotaJ 1,000 1,000 II-Jf&""", · 1,000 1.000
28 Total 1,000 661 303 18 II 9 I-AU FuehlPolJICr • 18 II 9
(os) Eleomoity 18 8 9 11-Jl W/IIfUJl · 982 662 29' 18 9 9
27 Total 1,000 256 671 66 7 I-AU heh/Powu • 72 18 03
(a) Bleotrioity • • 59 6 63 (e) 00II1, Wood & :Bas- 13 13
1'-MCIRUtJI · 928 237 618 66 7 28 Total 1,000 200 62Ii 125
I-.AUFseL/Po_ • 500 126 JiO 125 (A) Electrioity 600 126 2IiO 125
ll-.JIaflUGl 500 125 370
29 Total 1.000 390 , 568. 42
Il-:-JfG1MlGl 1.000 300 668 42
30 Total 1,000 667 333 l-Alll'wl8/Po_ • 338 333 (a' E1eotrioity 333 333
ll-JlaflUGl · 667 667
31 TotaJ 1,000 333 ax 167 168 I-AU FveJa/PoVJer; • 167 167
(a) E1eotrioity 167 167 lI-M-.al 833 333 ax 166
33 Total 1,000 1'9 748 93 10 I-AU FueJB/Po'IIIfJr • 131 10 ~ 28 (c) o.J, Wood .. :Bac- 131 10 93 28
11-MlliAaol 869 139 605 65 10
33 Total 1,000 5'11 429.
I-An F"els/Po_r • 429 286 143 (c) o.J, Wood &I Basa- 429 288 143
lI-MGfIG'" 571 285 288
H Total 1,000 320 4i6O 80 4.0 I-.. W Fw.$/PoVICr • 84D 280 il!O 40 (c) ODal, Wood .. Bag_ 84D 280 il!O 'Cl
II-Ha_aI · 160 40 40 40 40
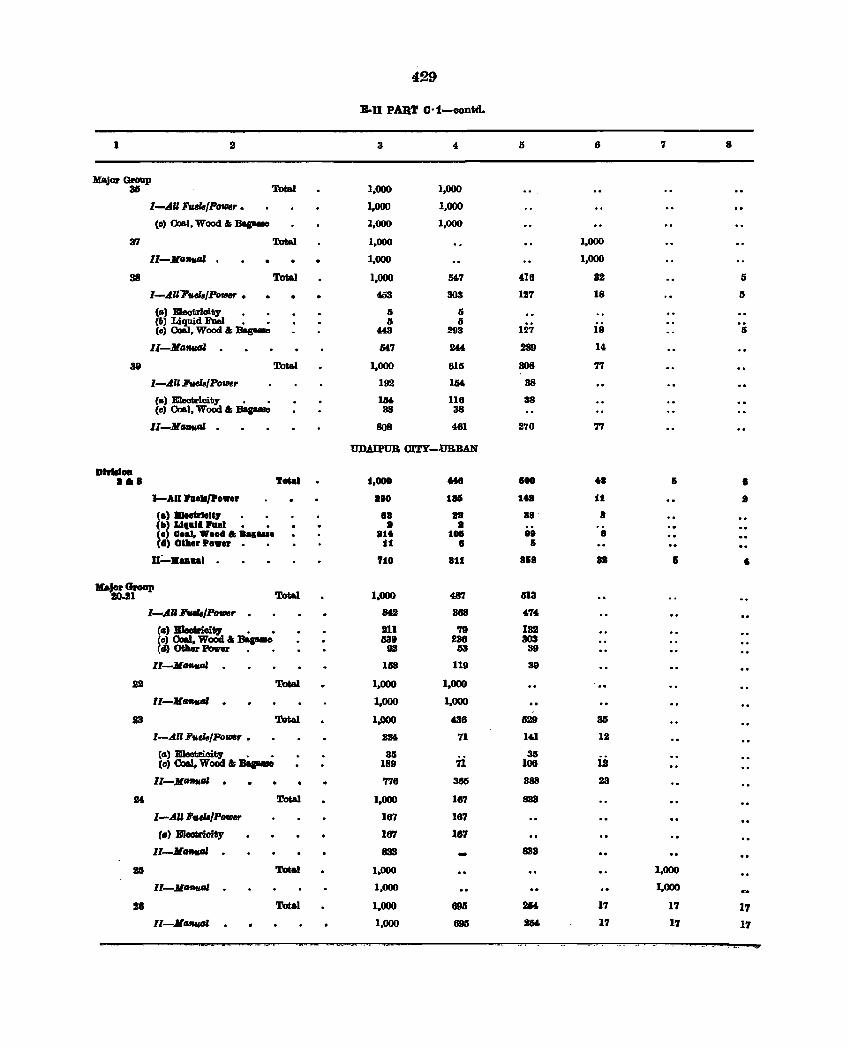
429
Boll PART O·t-contd.
1 3 4 5 6 7 8
Maojor Group 35 Total 1,000 1,000
I-AU FrulBfPlJwer • 1,000 1,000
(0) Coal, Wood I; :oas-e 1,000 1,000
37 Total 1,000 1,000
II-.JeG .... 1,000 1,000
38 Total 1,000 547 416 32 5
I-AU 7i'v.ehIPolller • 453 303 127 18 5
(G) Eleotriaity • • 5 5 (lI) ~dFDel • • 5 5
Ill; is (c) , Wood I; Bagaaaa "3 293 IS
II-JfGfhjG' 047 244 289 14
38 Total 1,000 615 308 77
I-An Fv.els/Polller 192 1M 38
(.) Electricity • • 1M 116 38 (c) Coal, Wood I; Bag&aae 38 38
II-JlGJlUtJI . 808 461 270 77
UDAIPUB ClTY-URBAN
DIYIII_ .111' Total 1,000 til 1500 .. I Ii • I-AU hell/Power • 10 1 • I. if • (.) meetrlelq. 8B n 88 . 8 (II) LI,all hel a a lO) Ooal, Wool .. Bag .. e 114 1011 .1 a 4) Ooaer Power. • :It 8 &
II.:_ ..... I 710 B11 8118 81 I , Kajor Group
20..21 Total 1,000 48'1 513
I-AU Fvfl./Polller 842 368 474
(G) BJealirioity • • 211 '79 131 ~c) OaaI, WoOd I; :oaa-e 539 236 303 II) Other PowR • • 92 153 39
Il-JI1JfhjtJl 158 119 39
P Total 1.000 1,000
1I-JfIl,",'" 1.000 1,000
23 Total 1,000 436 1529 35
I-All Fv.eh/Polller • 22& 71 141 12
(a) Eleotri.oity • • 35 7i
35 ij (c) Oaa.l. WoOd I;:s...- 189 106
11-JllJJIUtJI 776 3611 388 23
14 Total 1.000 187 833
I-All Fv../Polller 167 167
(.) Electricity 167 187
ll-Jl~ 833 833
8& Total 1.000 1.000
lI-JlIJfhjfIl 1,000 1,000
26 Total 1,000 6915 2M 17 17 17
II-JIG""'" 1,000 6915 2114 17 17 17
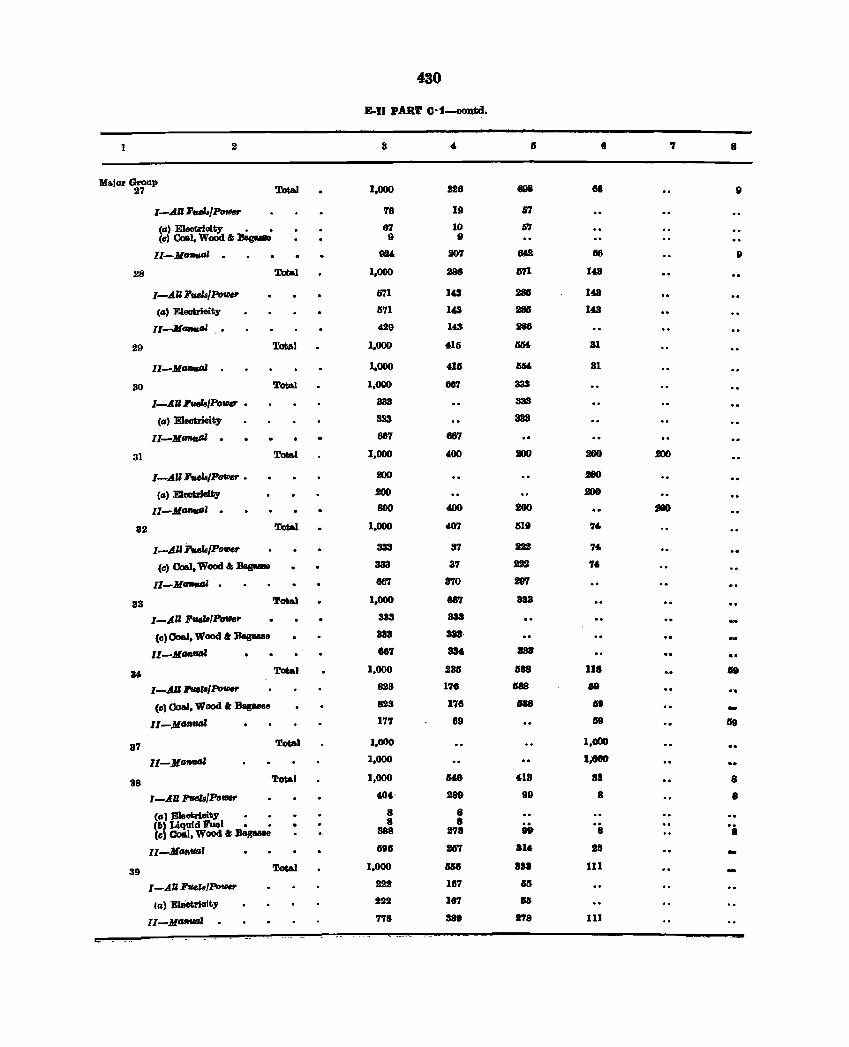
430
E-II PART C·f--contd.
I 2 8 4. 8 7 8
Major Group 27 Total 1.000 226 19& 61 0
I-AU Ji'_/Poll1er 78 19 ", (a) EIeotrioity • • 6'1 10 57 (Il) (loal. Wood &; ~ 0 9
ll-Na,..,u 0 924 207 US ft8 0
28 Total 1.000 286 G71 10&3
I-AU F'ueL/Poll1er 671 lea - 143
(a) E1eotrioity tl7l lea 285 143
Il-M_Gl 0 429 143 288
29 Total 1.000 4,15 ISM 31
ll-MtJDuGl 1.000 415 tI54 81
30 Total 1.000 867 333
I-AD FuelBIPo_ 0 333 333
(a) Electricity 933 38S
II-MGfIN,GZ 0 687 66'1
31 Total 1.000 400 200 200 !OO
1-..I.UheL/P_r 0 200 200
(a) Eleotriaity 200 208
II-Na"..' 0 800 400 100 JIll)
82 ToW 1,000 407 till 74-
I-AII F.eL/Poll1er 333 87 m 74-
(Il) Ooal. Wood &; Bas- 333 37 - 74
lI-NtJfIII&al . 887 870 211'7
33 Total 1.000 887 333
I-All F..,.,Powr 333 833
(0) Coal. Wood .t ]Ja.guse 3a3 33a-
II-H-- 887 3N 33a
34 Total 1,000 2315 tl88 118 18
I-AU :rve.,./Powr S23 17. AS 19
(0) Coal, Wood " Bagua8 U3 176 088 1S8 -Il-Maft- 1'77 89 118 118
37 ToIi&l 1,000 1,000 .. ll-M-' 1,000 1;G80 ..
8S ToIia.l 1,000 114,8 413 38 8
I-AU Fv&lsIPo- 404- 289 89 8 8
(a) :Eleotrioity 8 8 (b) Liquid Fuel • • 8 8 .. Oil (Il) Coal, Wood I: :Pagaale 888 278 Oil
II-MGflwZ 1598 2157 814 115
39 Total 1,000 tII58 831 111
I-AU Ptle18!Po- 222 187 55
(a) EleOUioity 222 187 P
lI-Maftual 778 88. 278 III .-.. -- _. -. -_
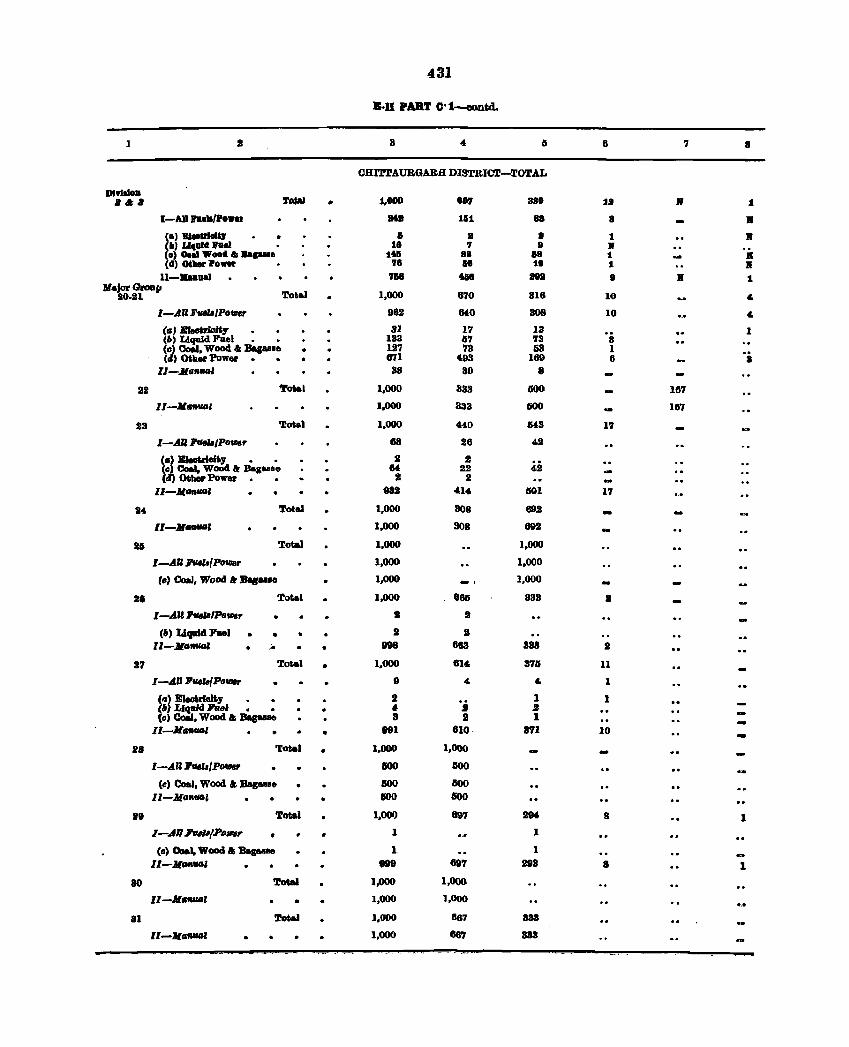
431
B·n PART O·1--oontd.
1 8 4 Ii 6 7 8
OHI'l"1'AUBGABH llISTRIal-TOTAL
DltIIIoD 6"'11 7$.1 • :1,000 807 380 2B If 1
I-AlII'1lIIi/' ••• r ... 1111 88 a • (I) BIaII&IIeI*J • • II 8' • 1 .. f"} Ideal.:rall • 18 ., II Jf 0) O.a1w ...... p ... 1.11 88 118 t ..
(4) CHller Po .. .,e III 18 1 .. l1-"'.al 7118 W 28lI • .. 1
lfaJor Group Tot ... 1,000 670 20.11 316 10 4
I-AUF ... /Powu 962 840 308 10 4
(a) EIeotriaitI' 81 17 13 I (6) Liquid Fuel • • 133 67 73 a (0) Coal. Wood .. BagUII 127 73 53 1 (4) Othal' PaWai'. • 871 493 169 6 OJ
Il-.J[flflIUJ' 38 30 8
22 Total 1,000 833 600 167
11-.11-' 1,000 833 600 187
23 Tota] 1,000 «0 613 17
I-All FtIeI.,POWf' 88 26 42
ill' BJ.otrIoity • ° 2 2 42 0) Coal, WoOd a: Pag ... a. 84 22 (i) Otbel' Powv I 2
II-Jl_' fWI 414 1501 17
a. Tot .... 1,000 808 892
11-.11-' 1.000 808 692
21 Total 1,000 1,000
I-AU J'tIChfPoIilar 1,000 1,000
(II) eo.J, Wood !' _Me 1,000 1,000
2. Total 1,000 861> 333 • I-AU J'tIel4IPowf' I I
(b) Uqaid Fuel • II II ll-JlII1WGJ • ... • IJ98 883 838 2
27 ToRI • 1,000 814 375 11
I-A1l7v.1afPo.".,. • 4 4 I
(Ill E1eoIirlofty 2 'j I I (t) Liquid he' • • • jI
(0) Coil, Wood " BaguSI 8 51 I [I-.II_' • • 191 810· 871 10 -
I. 'total 1.000 1.000
I-AU7..u/PotDef' &00 100
(e) Coal, Wood " Bagu •• 100 100
1'-JlII-' 100 IJOO
t. Total 1,(01) 897 294 8 1 I-AII~/PIJ_ • 1 1
(c) Coa]. Wood" Bagu.8 I, I
II-JIM,",' 999 897 2113 8 1
ao ToW 1,000 1,000
11-.1111_' • 1,000 1,000
81 ~ J.OOO 867 383
1l-.1111_' 1,000 867 383
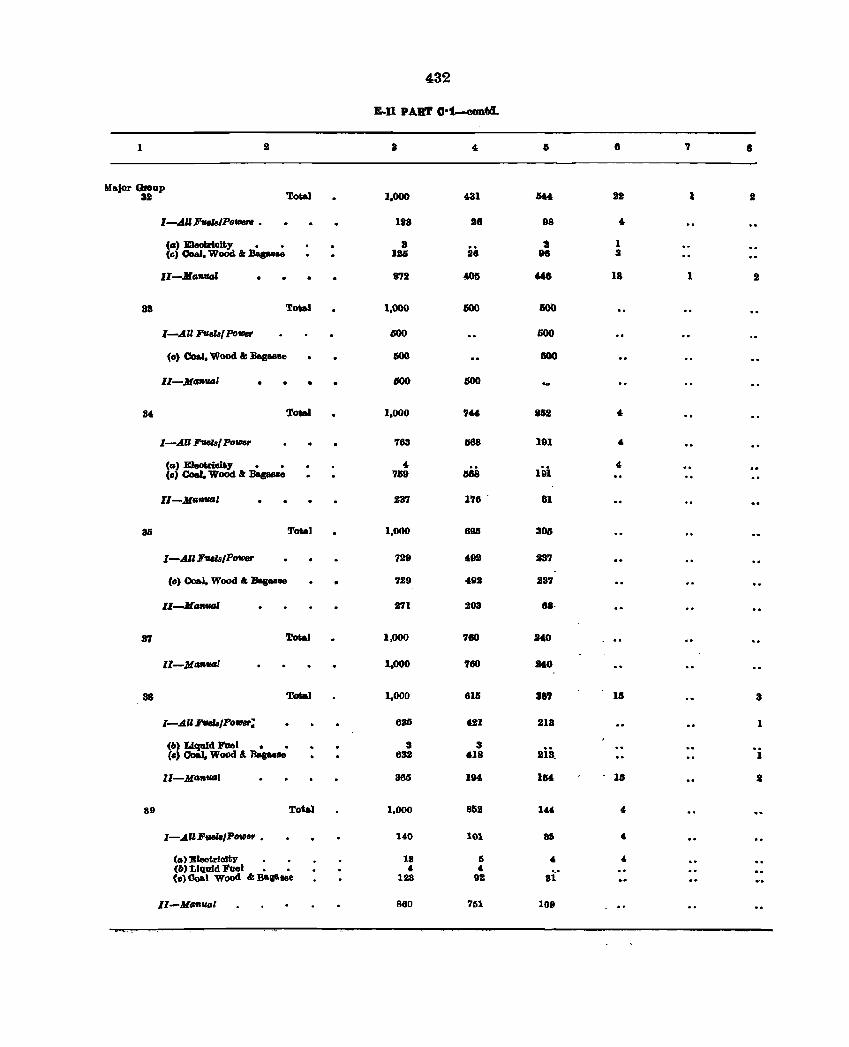
432
E-U PAB.'f C·1-contd.
1 3 " 8 7 I
Major GIoap 32 Total 1.000 431 M4 2J I 2
I-ARFueIBJPOttJer8 • 1118 28 98 4
(tI) l1Deotrioity • • 8 iis
2 1 (c) Coal. WoOd & .Bapa.e IDS 88 3
II--.Me.vaI 872 4015 Me 18 1 II
83 Total 1.000 IiOO 600
I-All FUelsl poVJer 500 600
(0) Coa.l. Wood &: JIag ... e 600 100
I1-M_l • '00 600
34 Total 1.000 744 JI2 4
I-AU FUelsI PoIDW 763 G68 191 4
(a) Eleokioity • • 4 ai8 19i
4 (c) Coal. Wood &: :Bagaaall 719
ll-MtlfI'IItIl 237 176 . 81
35 ToM1 1,000 6DS 305
I-All FuelBIPOVJer 729 492 237
(0) Coal, Wood'" BasuBe 729 492 237
ll-AI,...., 271 203 "8·
31 Total 1,000 780 140
Il-M_l 1,000 760 140
38 Total 1,000 611 187 lIS 3
I-AU FwJtJ/Po_; 635 421 113 I
(6) Liqald Fuel • • 3 3 lis. (c) Coil. Wood &. BagM.e 632 418 1
II-M_fUll 3M 194 1M 11 I
89 Total 1,000 8112 144 4
I-AIl;P-'/P_e, • 140 101 86 4
("') Eleot.rlelty 18 II " " (6) LIquid Fuel • • 4 4 8i:' (e) 000.1 wood &; Baga.ase 128 92
Il-MtJflVlJl 860 7lil 1011
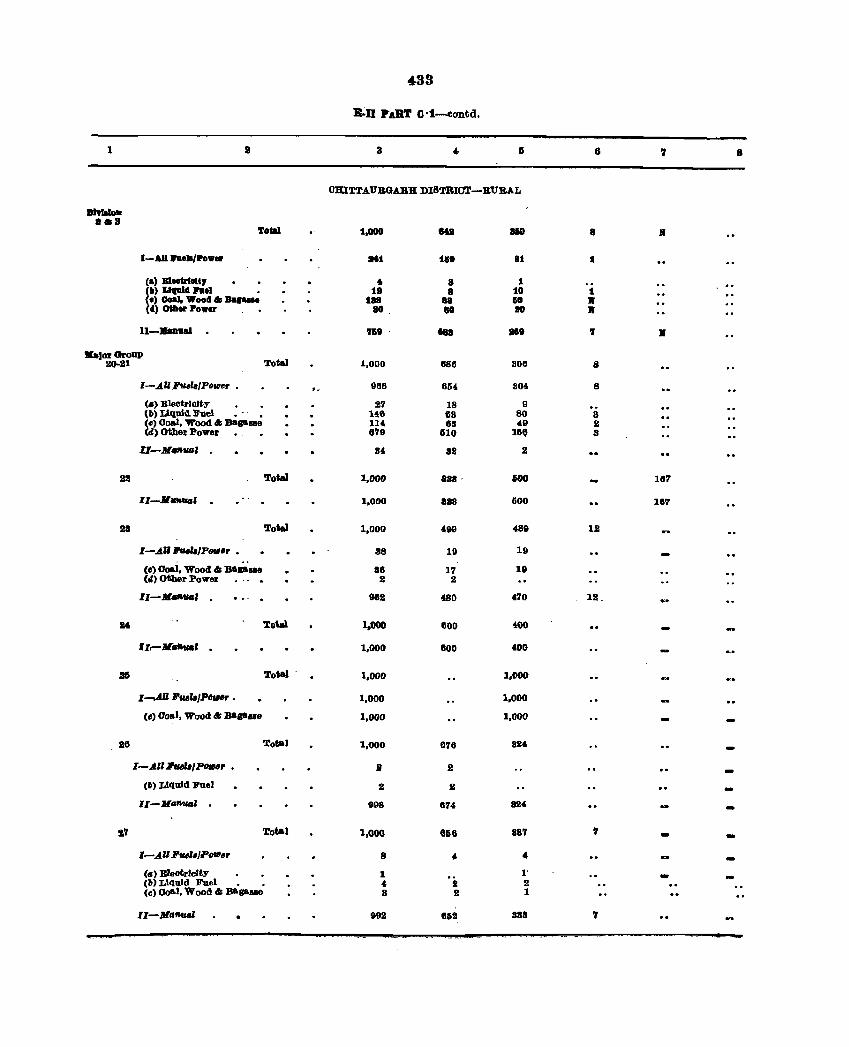
4,33
B~n PART C·t--contd.
1 2 3 .. 15 8 7 8
OKITTAUBGABH DISTRICT-RURAL
• .w_ •• 3
Total 1,000 812 810' B R
I-AIlI'Dell/Pow. IMt tl5e 8t I
(II) BleetrlolQ to 8 I (11) LI1IUld :ra.1 . t8 8 10 t te) GolI]" Wood" ........ 188 88 liD • (4) other Power .• 80 80 SO •
11-..... 1 768 .. 8Ie , • Ka,orGroup
20-21 Total 1,000 686 B06 S
I-AZl.Pu.Z./Poflltlr 966 654 304 8
(.) BlectrlcJty • • 27 18 9 (1I) Liquid Ji'uel • -. • 1.46 63 80 S (e) Ooal, Wood & Bap_ 114 68 4e 2 (d) otller Power 879 G10 180 3
U-M __ I 84 as 2
lI2 Total 1,000 888 ' 600 167
U-.JIDflGl 1,000 888 600 167
28 Total 1,000 499 489 ll!
I-AU ru.h/POIII'r • 88 19 19
(e) Ooal, Wood & Ba.lI ... 88 17 18 (d) Otber Power 2 2
ll-Jl4RUGI ... . 982 480 470 12.
24 Total 1.000 600 400
II.-MII",",' . 1,000 800 400
• To.1 1,000 1,000
1---.,A1l1J'""Z,/POtnr • 1,000 1,000
(CI) 00111, Wood & Bllaaue 1,000 1,000
28 Total 1,000 076 824
I-All """1/PtlfHr • Jr 2 -(1I) Liquid Foel 2 2
II-MGntItIl 998 1174 824
'!I.7 Total 1,000 eG6 887 7 - -I-All 11"",11'_., 8 , ,
<II) Electrlcfty • • 1 I' <lI) Liquid Fuel • • " 2 l! (e) 00111, Wood & Bagaallll 8 2 1
II-MatlU8l 992 8&2 888 ,
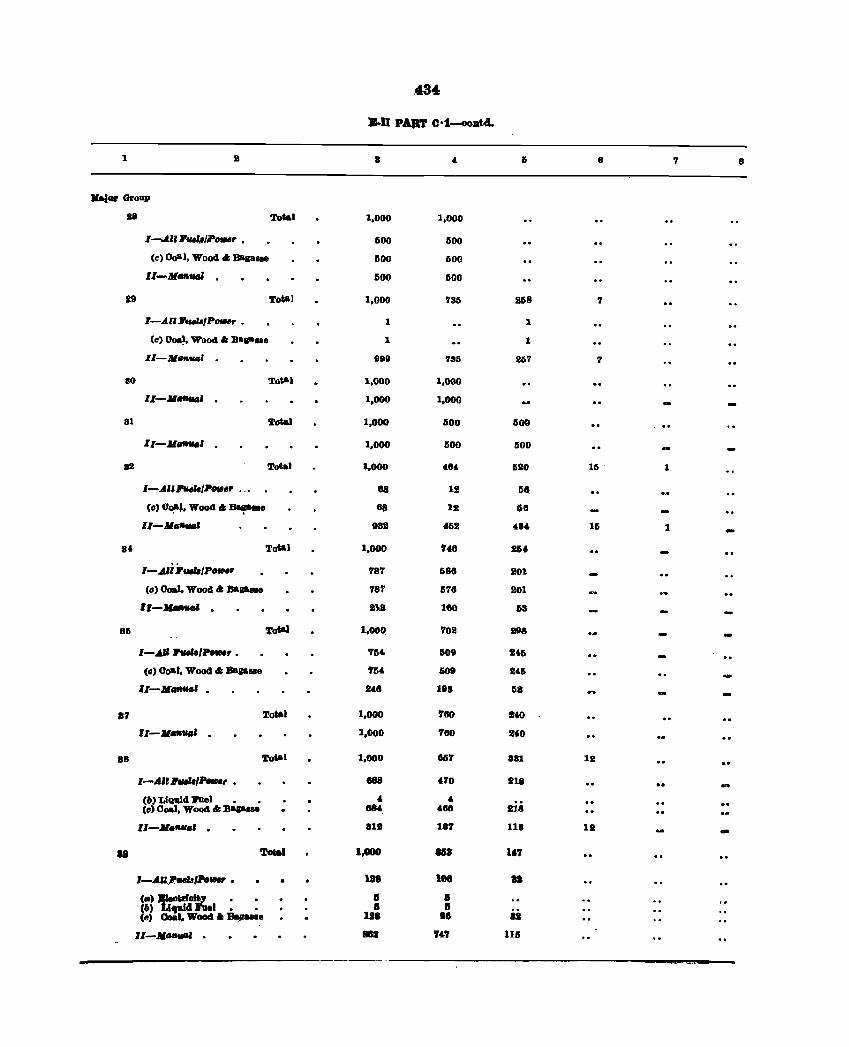
434:
.. n PAIIT C·1_ODtd.
1 a • 5 II 7 8
Kaj_ Group
U Total 1.000 1,000
1-;,I.1I~/PtJ,..r • 500 500
(c) 001'1, Wood .. BlIp •• 1i00 1i00
I1-MHuaI · 1i00 1i00
S9 Total 1,000 735 258 7
:t-A""""'P_r. 1 1
(e) O~. Wood .. :0 ...... 1 1
11-111_1 · IISD 736 267 7
80 Total 1,000 1,000
11-111...,.. · 1,000 1,000
81 Total 1,000 600 1i00
II-Jl ..... ' · 1,000 500 500
all Total 1,000 411. 1i20 15 . 1
1-.4U:ru."/PotI,r . _. 68 12 58
(0) 00&., Wood" BII!p'Ue 118 12 611
I:I-M ...... 982 462 464 15 1
8' Tatal 1,000 746 164
1-.4,i' ... /pofll.r '187 586 201
(c) Ooal, Wood" :B&aa.e '187 576 201
ll-........ . 218 160 63
8G Total 1.~ '102 2D8
1-..... ....,,' ..... ,. . '154 509 241>
(0) Ooal, Wood cI: B ..... e 754 609 2'1>
11-111"'" • 248 ID3 158
87 Total 1,000 7110 240
11-JlII1"', .. . 1,000 '160 240
18 Total 1,000 tG7 881 12
I-A" ,.".,,._, • 888 470 211
(6) Llquld J'Ue1 • • 4 4 (0) Ooal, Wood .. :0 ...... 684 486 S18
11-•• ..,.' . 812 187 118 11 -19 'loal 1,000 1113 147
l-AII.;J'ueJ8/Po_ • 188 loe n (II) tt:oit~ . . I I (6) ,uId .1. • I IJ (e) 00II1, WCICId • Byu •• III 18 lUI
11-.11"'" . IIU '''7 115
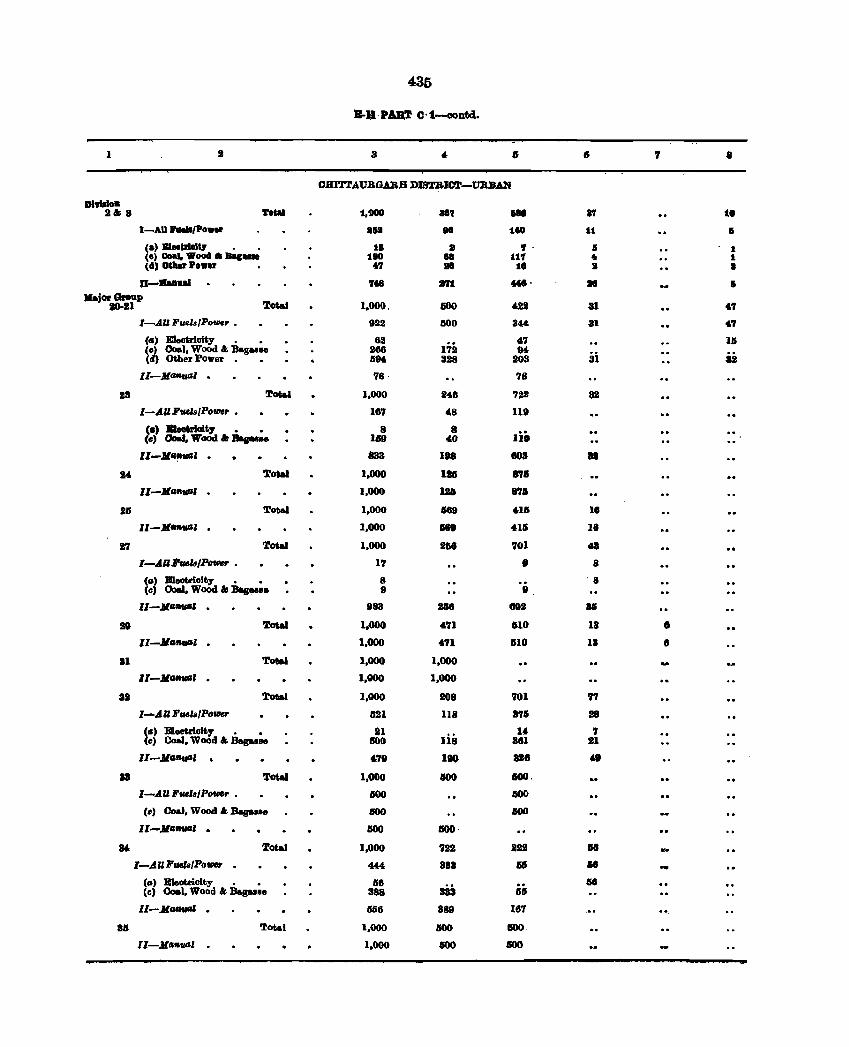
435
B-H·PART C·t--contd.
1 3 4- IS 7 8
OBIT'.l'AUBGABB DISTRIC'l'-UBBAN
Dltlllo. 21; • To ... 1,900 BI'l III I'l to
I-AU ...... 'Po .. r In .. 160 11 Ii
(&) BlHldIll7 • • 11 It 7· I 1 (0) gold. 1111'004 It .&C- 180 88 WI .. 1 (11) O.1".o .. ,r fi 18 1. I I
D-...... 7. 871 ttl· • I "jorGreup
1JO-21 Total 1,000, GOO 4,22 81 '7 I-AU Fuels/Power. 922 1500 3« 81 "7
(II) E1aotrioity • • 62 172
47 16 (0) Ooal, Wood I; Bag .. ao 266 94-
ii U (eI) Other POwer 694- 328 203
ll-JlaflUGl · 78· 78
28 ~ot.l 1,000 1"6 722 82
I-AUFWIa/Power • 167 4,8 119
(.) BIeakioitJ' • • 8 8 Ii. (0) OoM, Wood a: ...... I. oW
II-lIlfl~' · 833 Ita - II
1M ':roMl 1,000 IIG 871l
11-lIlflflUCl' · 1,000 Ilia 8'7.
215 ~otal 1,000 1189 .. I. I.
l1-lIlGflUGl · 1,000 II8IJ 411 II 17 ~ot.I 1,000 268 701 ,.
I-AUI'wIa/Powf' • 17 • 8
(a) Bleotriojt;y • • 8 '8 (c) Ooal, Wood &: Bas~a. 9 8
11-.Jell,"",' · 883 21. 892 81
2tI ~ot.I 1.000 ''11 610 18 I
ll-JIII,""" 1,000 '71 110 13 8
81 Total 1,000 1,000
ll-JlllfIUG' · 1,000 1,000
81 ':rotel 1,000 208 701 '17
I-AU F .. lB/PO'lllef' 621 118 871 28
l.) B1ectrioltJ' • • 11 Iii
14 7 0) Coal, Wood & Bag.I.O 1500 881 21
II-JlllflUCI' • '78 190 318 48
88 'l'otaI 1,000 100 100.
I-AU F .. ,s/Po...,. • 600 GOO
(0) Coal, Wood & Bas .... 100 GOO
ll-JIG'""" · GOO 100·
14 Total 1,000 '122 2U 18
I-AU FuaIB/PO_ '" 888 III 18 -(.) B1eatrioity • • 158 sis is It (e) ao.l, Wood " Bagua. 388
ll-AlGfIUfII · 1568 889 187 .. •• Tatal 1,000 100 100
Il-MtJ_' · 1,000 IWO 100
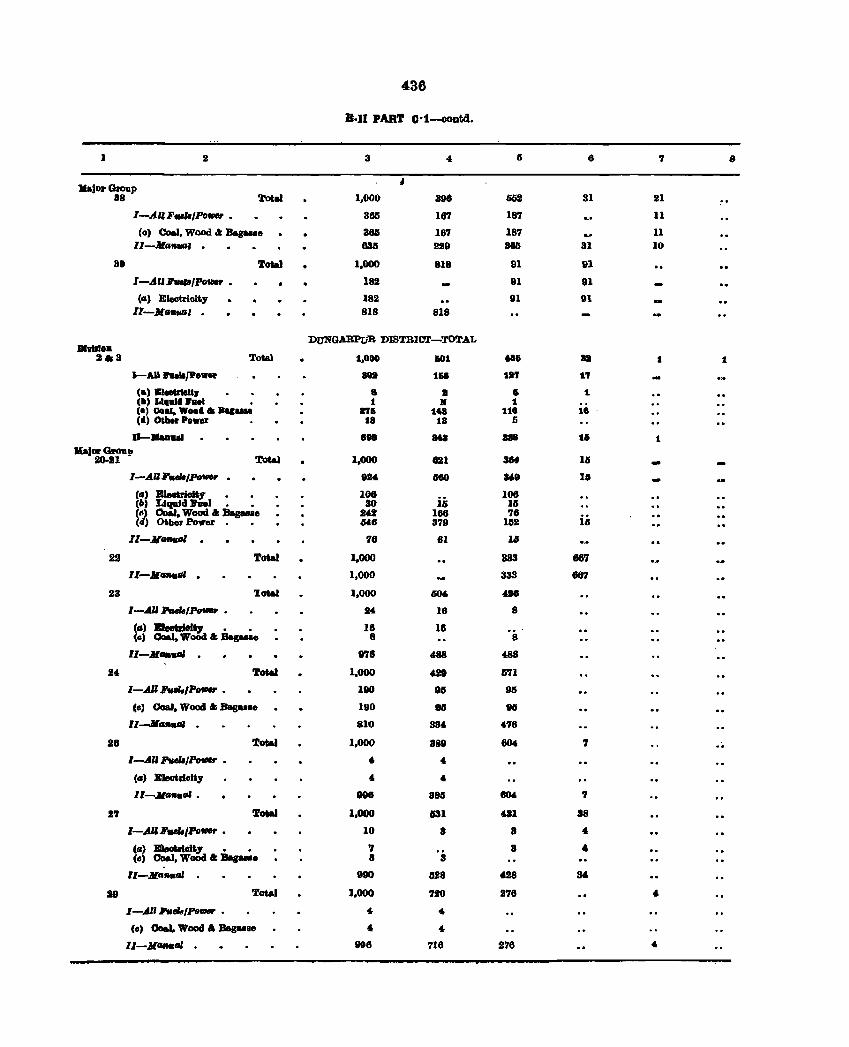
436
B·lI PART Q·1-contd.
1 2 3 4 6 6 7 8
"jol' Group ,
38 Total 1,000 398 li02 31 21
1-.dllF..,./Powr • 365 167 187 11
(a) OorJ, Wood .t Bagule 365 167 187 11 II-.lfA_' · 83a 229 11M 31 10
3. To&al 1,000 818 91 91
I-.dn, ... ,,.,,._ . 182 91 91
(A) Eleotrioity 182 91 91 Il-JCAllUAI · 818 818
DUNGABPtiR DlSTBIC'l'-TOTAL DIIIII ••
lI.3 Total 1,000 101 Ai n 1 1
I-AU heII/P ••• an 1&8 11'1 11
(a) BlIolrleltJ 8 a 15 1. (II) Ll,alill' •• 1 • 1 • 1 (I) (lou. ••• 4. _ ..... lIT. 1.41 1.18 18 (d) OUllr P •• er 18 18 5
0-...... 8. 8t8 888 Iii 1 J(aJDI' Groll!>
'1'otal 20-11 1.000 alii 3M 15 -I-A1I,../Po_ • 924 660 U9 11
(A) Eloatriolty 106 is 108 (6) U .... d hel. • 30 15 (II) Coal. Wood .. Bagu •• 242 186 78
i'; (4) Other.Power. • M6 379 152
11-.11-.01 · 78 81 1.
2S Total 1.000 833 867
II-JC ... ", . 1,000 333 867
23 1:otaI 1,000 604 410
I-AU 1!'ule/Po_ • 24 16 8
(1I):BIea&rieft, • • 16 18 ... (0) 00&1. WoOd .. Bapu. 8 8
Il-M~ . 878 488 488
24 ToW 1,000 4J9 571
I-AU "",,,POWI' • 180 98 9IS
(c) Coal. Wood .. Bag .... 190 911 80
II ....... ..", . 810 884 476
28 ToW 1,000 388 604 7
1-.A1I1'KeZ./Potl/er • " 4
(.) Bleatrloit1 " 4
II-Ma_GI • 998 885 604 7
27 ToW 1,000 331 431 88
I-AU ,..,,/PoWf' • 10 8 8 4
Ca) ....,.Gi'.1 • • 7 3 " (c) Coal, WoOd a.,.. .. 8 8
ll-JCa_GI 980 B28 428 34
J9 Total 1,000 720 278 , I-A" "'sIs/Po_ • 4 4
(0) OoaI, Wood " Bag .... 4. 4
II-M ... tIl . 898 718 278 4.
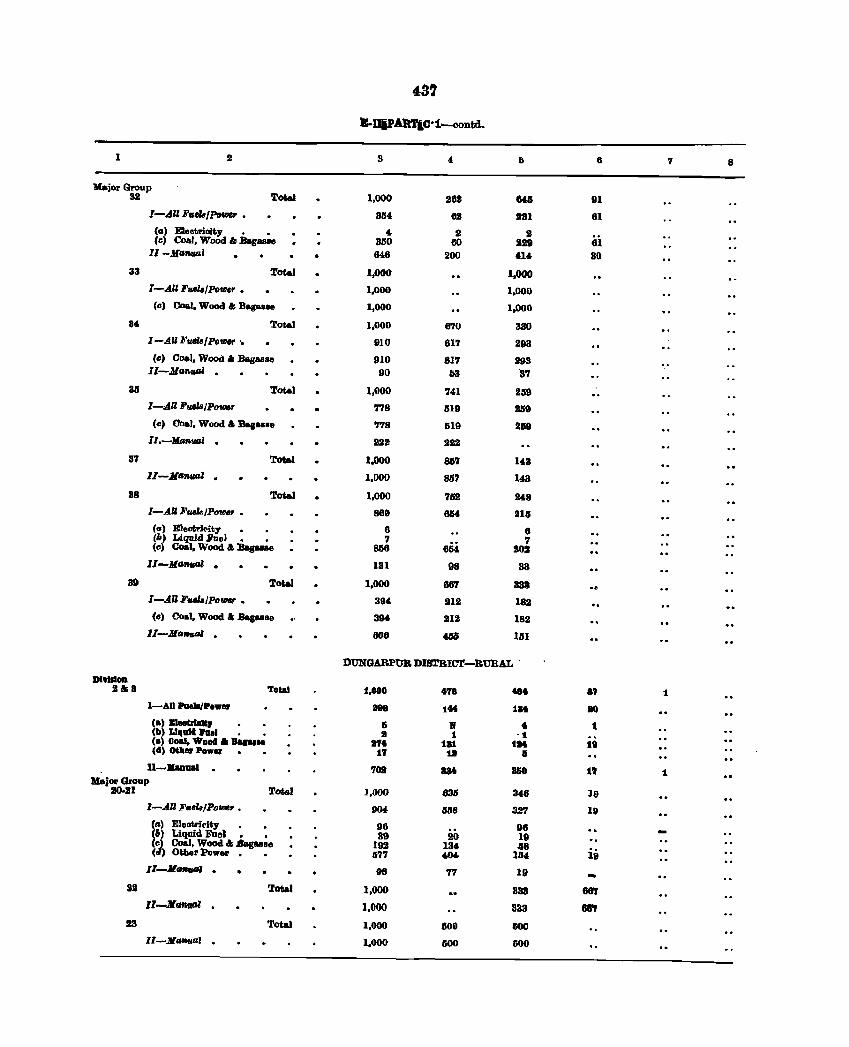
49'
1!:-1IlPAllTiC·1-oontd.
1 2 3 4 6 6 7 8
Major Group 32 Total 1,000 262 N6 91
I-..tn Fv.elB/PDtDer • 3114. 62 231 81 (II) Eloctrioity • • 4 2 2 fe) Coal, Wood at Bag_e 350 60 .229 81
II-MII_I 646 200 414 30
33 Total 1,000 1,000 I-.AU Fuel8/PolIJt,r • 1.000 1.000
(0) Coal. Wood at Bag .... 1,000 1,000
34. Total 1,000 870 330 1-..t1l FueIB/Po_ .. 910 617 293
(c) 00&1, Wood eli: :&gas .. 910 817 293 II-MII'AUIII - 90 63 87
35 Total 1,000 741 259 I-A.1l FuMs/Po_ 778 1I1D 259
(e) OoaJ, Wood" :Bag .... '7'18 519 2&9 II.-MimIAGl · 222 222
31 Total 1.000 867 143 II-Manual · 1.000 8S7 143
38 Total 1,000 762 24.8 I-AU FuMiJtPolIJt,r • 869 OM 2US
C<Jt) Electri .. ity 6 8 (6) Liquid Fuel. • 7 1 (c) Coil, Wood" Bag .. se 838 654 202
ll-lJIa'lltl.lII · 131 98 33
39 Total 1,000 887 333
I-All Fuela/PolIJt,r • 394. 212 182 (e) Coal. Wood I; ...... 0 394 212 182
ll-Jla1lfl.Ql · 808 4M 131
DUNGARPUB DIBTBICT-BUltAL .
DlwldoD 21;1 Total 1.000 ftl 48t a, 1
I-AU heJatP ••• 18a itt 1M 10 Ca) Bl"&TIeHr I • • t CII) Llllalll'ael II 1 -t Co) 00&1, Wooll II ....... Ht tal 1M tt Cd) CKIa. Pow. 17 11 I
11-:'''111&1 · '101 - 8&0 1'1 1 MajOl' Group
10-21 Total 1,000 836 348 19 I-A.U F.uJIB/Powr • 9(U lUiS 327 19 (a) Eleotri~ity • • 96 98 (6) Liqllid Fuel. , 39 20 19 (~ Coal, Wood " Bag ... e 192 134 38
iii ( ) Other Power Ii77 4,CM. 184. 11-6 • ..., · 98 17 19 ..
22 Total 1,000 333 687 11-llrmalll · 1,000 333 8117
23 Total 1,000 800 GOO II-MaRtAIII · 1,000 500 500
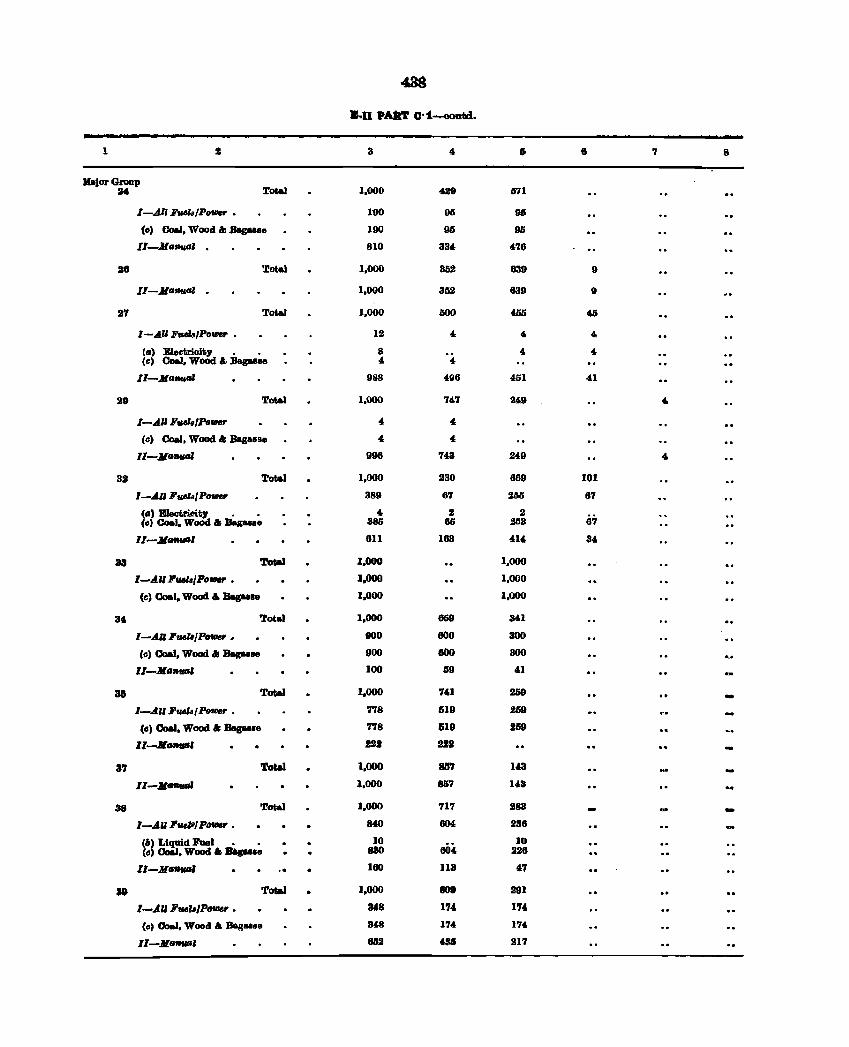
438
"'u PAllT O·t-oould.
1 2 3 4- 6 6 7 8
Jlajor GIODp Tota) :H 1.000 429 1f11
I-AlrFaelB/Po_ • 100 9S 9S
(0) Coal. Wood" .Bag ... e 100 96 9S
II-MGfIWIl . 810 334 476
26 Total 1.000 352 639 9
II-JIG""'" . 1.000 352 839 9
27 Total 1.000 aoo ~ 40
1-,AUF"eJa/Po_ • 12 4- 4- 4-
(II) E1ectrioity • • 8 " 4-(e) Coal. Wood. a. Bag ... e 4 " II-JIG_" 988 'U6 451 41
20 Tota.I 1.000 747 249 " I-All F.w./Po_ 4 4
(e) Coal. Wood " Be,ane 4 4
l1-JltaUGJ 996 743 2" ... 32 Total 1.000 230 869 101
I-AU 1l'.,.z./Po_ 389 67 2M 67
(G' Electricit, • • 4 2 2 87 (c) Colli. WoOd " Bag .... 385 8G JUl3
lJ-JlGf&tIIJ' 611 163 41" 3"
33 Total 1.000 1.000
I-All FIIMa/Po_ • 1.000 1,000
(c) Coal. Wood '" Bapale 1.000 1,000
34 Total 1.000 669 341
I-All1l'ud8/PofllM' • 900 800 300
(c) Coal. Wood " BII« .. 18 900 800 300
ll-JlG'MIfIl 100 B9 41
38 Total 1.000 741 259 -I-All 1l'vd8/PoltJ8r . 778 .519 2159
(c) 00aI. Wood " Bag ... e 778 1519 219 ll-M __ , 22J 2211
37 Total 1.000 857 143
ll-Itl""'" 1.000 857 143
38 Total 1.000 '117 283 -I-AU l'uelBlPofllM' • MO 604. 236
(6) Liquid J'uel • • 10 10 (c) Co6I. Wood • Bagule 880 60" 226
II-Jl""" 160 113 "7
38 Total 1.000 109 281
I-AU l'uel6/PofllM' • 348 174 17"
(c) Coal. Wood .t. Dag .. se 318 174 174
1'-.Jl __ 1 852 4" 217
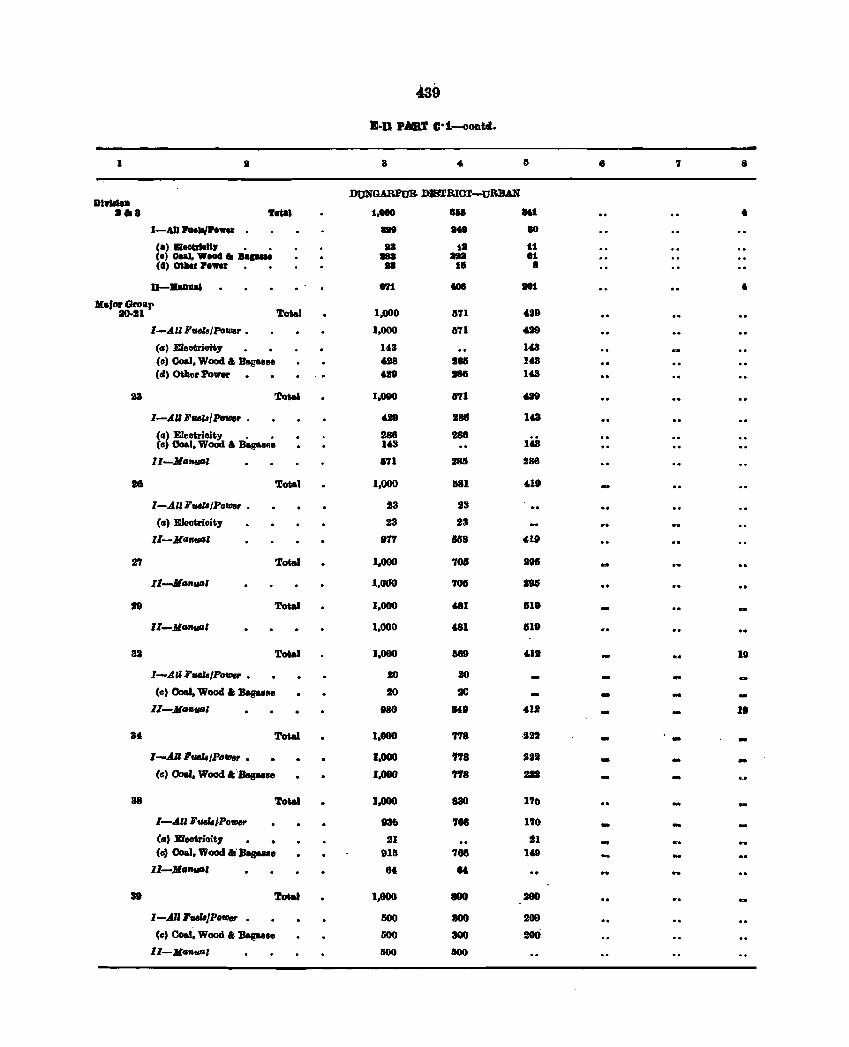
489
JI:·n P.AIBT C·1~ontd.
1 2 3 4. Ii • 'l 8
DO'NGARPuB DISTRIor-uBlUN DI ...... ••• Te~' 1,000 I .. au •
I-AIIl'lleIl/Pew. . .. ... Itt
Ca) ... &rIelil • • 81 1. tt (e) 0 .... Wed II Ba .... •• an Ii (4) OUllr Pew81 •• 11 S
D-IlaD'UI I'l1 toe H1 • lIa.,or Grollp
10·21 Tot&) 1,000 1171 429
I-All FtHhlPower • 1,000 6'71 d9
(8) Eleotrioity 143 143
(0) Coal, Wood " Bag.s8e 128 2111 1&3 CII) Other Power '29 186 143
U TtnaI 1,000 Ii'll 631
I-AU FUI'/Pow •• 4.21 181 1&3
(Ill Eleotrioity • • 288 288 1'3 (0 Coal, Wood I; BaRUH. 1'3
ll-Jla __ l 571 285 288
18 Total 1,000 III 419
I-A."F~/Power • 23 23
(a) Eleotrioity 23 23
II-JlGBWlI 917 5G8 '19
2'7 Tot'" 1,000 701 191
Il __ -I/I.I' 1,000 7015 H6
18 'l'ot;aI 1,000 .. 1 151 •
II-Jl-fllJ' 1.000 181 III
32 'loU, 1,000 189 .11 19
I-A.II '.III,Power • 20 JO
(0) Ooal, Wood " Bag .... 10 III -II-JllI __ l 980 1149 411 1. 3. ToW 1,000 7'78 -292
I-AU FuelBlPoVJer • 1.000 "'8 222 -(0) Coal, Wood .'Bagu •• 1,000 "8 - -
38 Total 1.000 830 170
I-A.Il FudalPo_ 136 7ee 170 -(G) EJeotricity 21 11 (0) Coal, Wood .... Dagull. 9111 7ee 119
ll-JlGfJfIIJ' M M
39 ~ 1,000 100 lIOO
I-All :rueZl/POfIW • &00 300 too
(0) Coal, Wood " Ballu,. 1i00 300 :roO 11-M_I 600 IlOO
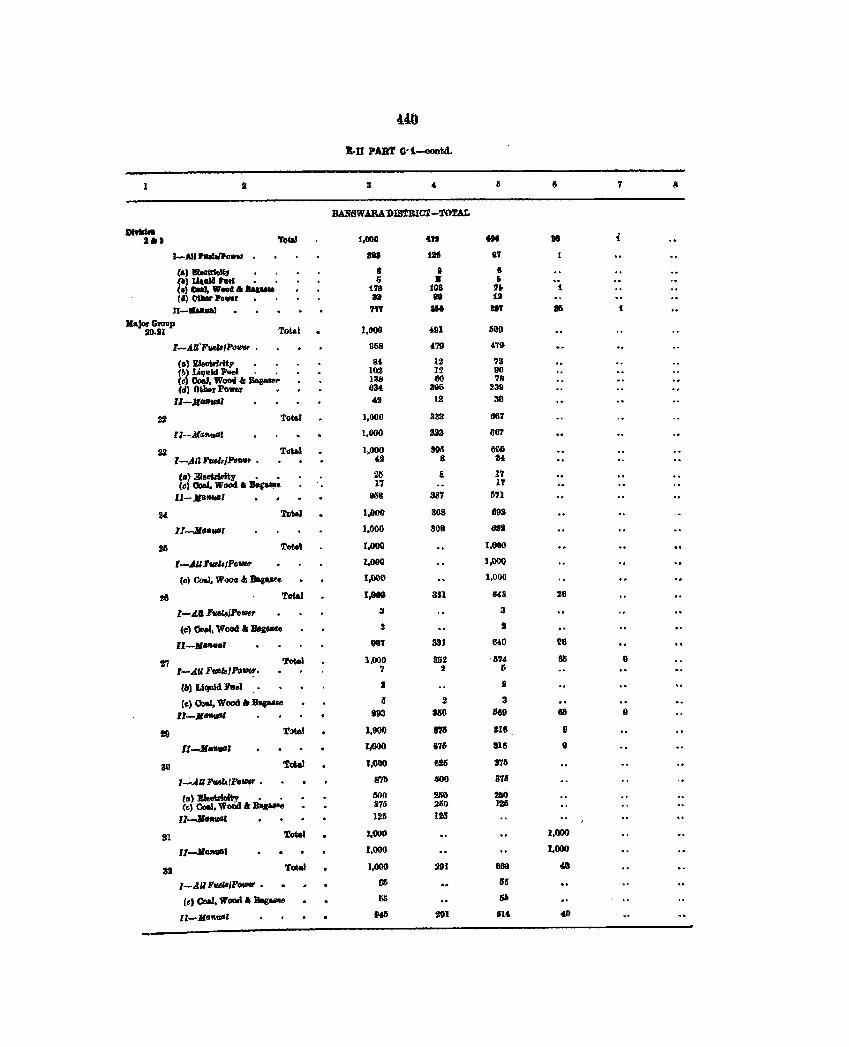
un
z.n PART c·t-.rtd.
1 3 4 Ii II '1 II
:BANSWABA DISTBIC'l-roTAL
IIItfIIOII 2 •• Total 1,OQI) 4ft ... !II 1
I-AlI .... laIh .. ~ - ttli ., Cal ... tIQ 8 II 8 ~) 1ol41l14 rut! • II • II (II) e .... W •• d".AIUM 178 108 flo t (') 00Ier P ... r D eo ill
n-llallllal ,,,., 1M m 15
Ka}orGlOap !lQ.1I1 Toul 1,000 '91 600
I-J.lfFudeIP()_ • ga8 479 '19
(5) Eleotrioit, 8. 12 '1:1 (&<) Liquid FUel • • 102 12 90
(c} CotJ, Wood " Bat!IlUt' 138 eo '18 ttl) OiIa&r l'o1m • 634 395 :39
ll-M_Z " 12 30
2t Tot&1 1,000 33:1 667
l/-J(SftUIII 1,000 S33 687
23 Tot&1 1,(100 II9IS 600 1-411hlklhw, • '2 8 :14
(a) EleetNit,. • • 2tS 8 J'7 (e) Coal. Wood AlJag&ille 17 17
Il-JrS_l 9Il8 387 5'U
M Tot&l 1,000 80S 692
I1-Ma.flll.1 1,000 aM ~.
211 'tot&! 1.000 1.000
r-AUJ'UIll/po- 1,000 1,000
C"l eo.I. Wooa ,. ...... 1,000 1,000
28 Total 1,000 331 64<1 28
I-Jtll'uaafl'efllfr 3 3
(el 001. Wcod II '.Beg&lIai! 1I 3
ll-Jl-"" 911' 331 Mll 26
t'I Total 1,001) 3lit -1i74 6Ii II I-AU l'-lolP0Ille!' '1 2 I)
(II) IJqaid JIDel . 2 l!
(e) ~ Wood At lIaguae 6 a 3 11-.11 __ 993 150 689 811 II
to Taf6! 1,000 8'13 '16 II
II-1I· ... , 1,000 '71) alll II
III ToW 1,000 626 37&
z';'.A1I1'tocl8rPo- • 8'111 liOO 3711
(s) JIee\rioity • • lIOO 2Sl) 250 (G) OoroI, WOOd A: ~_e 1174 2&0 1211
l'-.Il<nIItJf lao 125
31 Tow.! 1,0011 1,000
ll-MG_J 1,000 1,000
3J 'tNt 1.000 291 88a 40
I-AU FIIdIIIPo_ • 116 IS~
(e' Coal, Wood I; Bag_6 65 66
11-.110_& t~ 291 6l4. 411
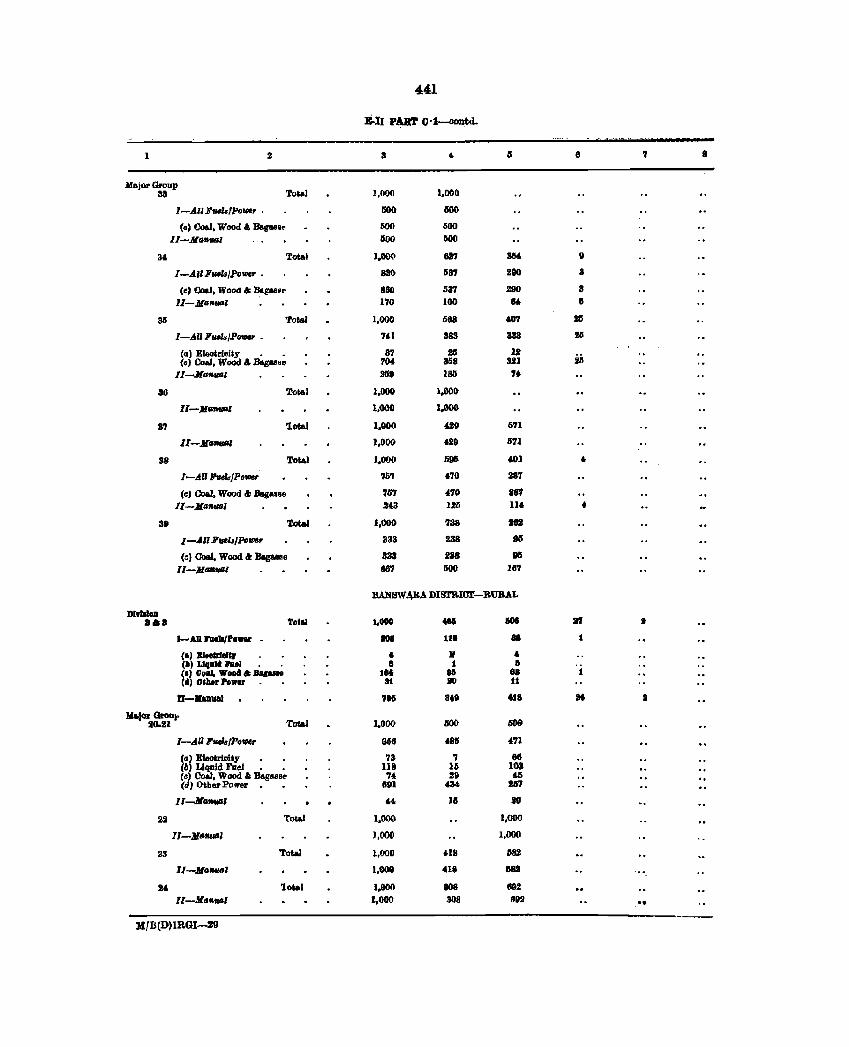
441
B-n PAR!' (l':i~d_
1 2 3 , Ii IS 7 8
Major Group Total aa 1,000 1,000
I-All FulsfPDUI8r . 500 600
(0) CclaI, Wood ... Ba,.s~ 500 1i00
LI-MG_1 IlOO 500
34 Total 1,000 837 3M II
l-AIIFrHIa/PoRr . 830 587 2110 a (e) Coal, WOOd .t; :&gu.e 8110 531. 290 3
ll-MG_l 170 100 81. 8
311 Tot&) 1,000 1i88 407 lIS
1-~11 FruZ./Po_ . "1 383 333 iii
(II) E1eotrioity • • 87 28 l! (c) Coal, Wood ... Bag.so 704 388 321 III
11-.G_I 2118 1811 7f
36 Total 1,000 1,000
1I-M_' 1,000 1,000
8' 'lot&) 1,000 BII 6'1
II-JiG""" 1,000 41lD 1171
38 Total 1,000 5116 401 , 1-~1l PtHkJPOIl1U 75'1 470 287
(cl Coal, Wood 01; Bagasse 7/)7 470 .87 Il-JiG_, 243 1111 114 4.
39 total 1,000 738 •• I-All Fu.u/Po_ 333 238 9G
(c) 00aI, Wood.t Bagaae8 333 238 til ll-J{a_l 887 500 167
BANSW4IU DIB'l'RW.r-BUBAL
DJmloa .111. T.tlll 1,000 tal 501 If I
J-AIll'lllll/Panr • 10. U8 .. t
(a) BIH&rItJtr , • , (II) Llqultll'llill IS 1 Ii ~el 00&1, W.H .. Bill .... 1M 81 8. t II) O&lJer Pe_ . , at lID 11
D-.lIIIlIaI 7" 8'" tt8 " a lU.jOl Orool'
I.MIl Total 1,00() 800 600
1-411 F_fPoRr 1166 485 471
(al Eleotrioity 73 ., 88 (b) IJqaid Fael • . 118 15 103 (e) Coal, Wood & BagSBse '14 :19 4li (d) Otbu Power. • 691 434 217
Il-M_l "- 18 III
22 Tota.l 1,000 1,00<1
lI-MMIUIIl 1,000 1,000
23 Total 1,000 4-18 II~
l1-MG_' 1,008 418 &81 ... I' 'lotal 1.000 808 892
ll-IIlaflVGl 1.000 308 8112 .9
M{B(D)lRGI-29
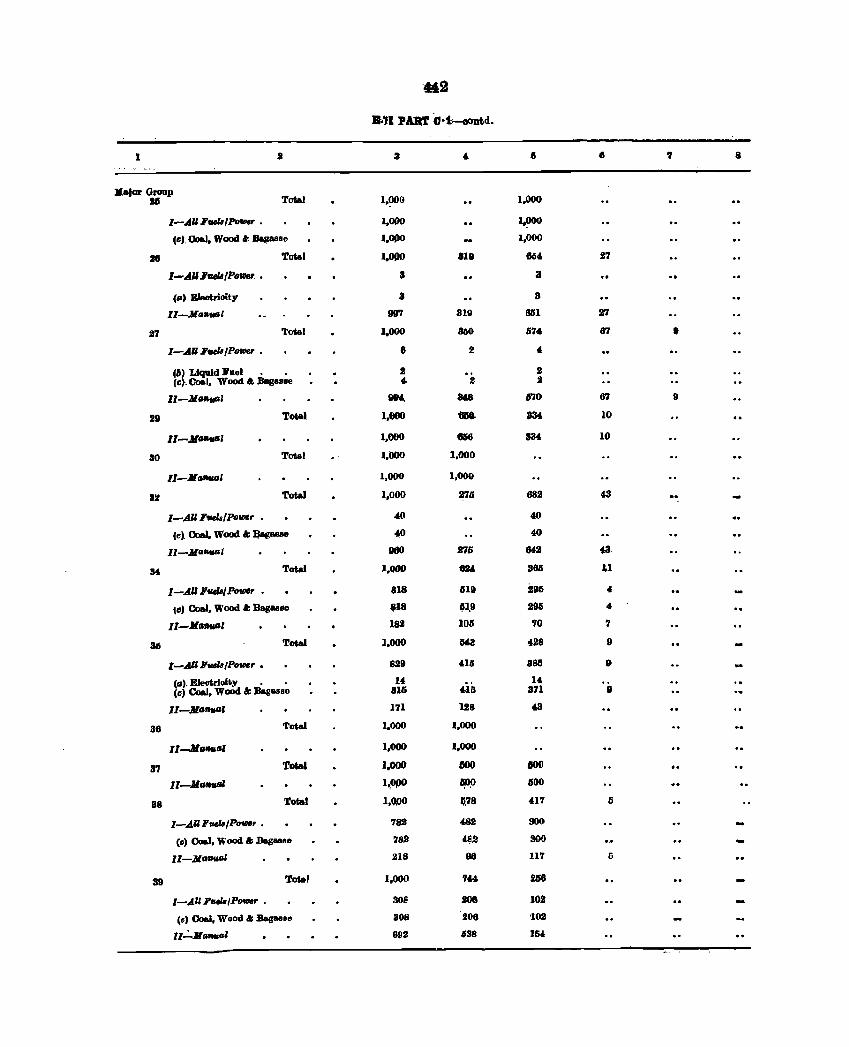
'M2
]f..n PARt' a·1..-.oontd.
I 3 , 8 , 8
•• ,or Gruup Total lUI 1.~O 1.000
I-AU Ful8IPofIJBr • 1.000 1,000
(Il), 00&1. Wood &: Qa[l!as8e 1.0fl0 1.000
18 Total 1.000 811t 8M S7
l-AIIFwlI/PolIJCr • 3 3 .,
(II' EIeotrioity 3 3
ll-.J{a_l 997 319 Ml 27
27 'l'otal 1.000 aoo Ii74 67 a I-AU Fuek/P_ . 6 2 • (6) Liquid lI'u81 • • 2 2 (c:}. Coal. WOOd" Bage.Be ... 2 2
"-Jlaauaj UN. 8&8 670 6'l 9
211 Total l.flOO ... 1134 10
II-.J{""'" 1.000 8H P4 10
aD Total 1.000 1.000
ll-MafItUJj 1,000 1,000
311 Total 1.000 276 682 " I-AU F_IPower • 4(1 40
(e). Cca.I. Wood .. ]Jagasee 40 40
11-.J{afItUJl 1180 27li lUll (3,
34 Total I.ODD a& 3M II
I-AJI FwlIlPovM • 818 819 J9li 4
(II) Coal. Wood ... Bagasse a18 ~I.9 29li 4
11-...... 182 106 '/0 7
36 Total 1.000 Hl! .28 II
l-AJlFul8[Power • 829 416 3aG 0
(0). E1eotrioi~y • • 14 U (c) c-J. Wood ... Bagas8e 81li 4111 371 8
II-No""'" 171 128 43
36 Total 1.000 1.000
lI-Mo_o, 1.000 1.000
3' Total 1.000 IlOO 100
11-."""" I~()fJO ~ 600
88 Total 1.®O 0.78 417 li
I-AUFul8IPo_ r • 789 482 900
(Il). Coal. Wood & .8aBaslO 782 4IJ2 900
II-Mo,,"111 218 Q8 117 6
39 Totel 1.000 744 2156
1-4U FfI4lB/Po_ . 80S !08 102
(~) OoaI, Wood & Bag ... e 308 206 '102
U..:...JIa .... GI 892 "38 1M
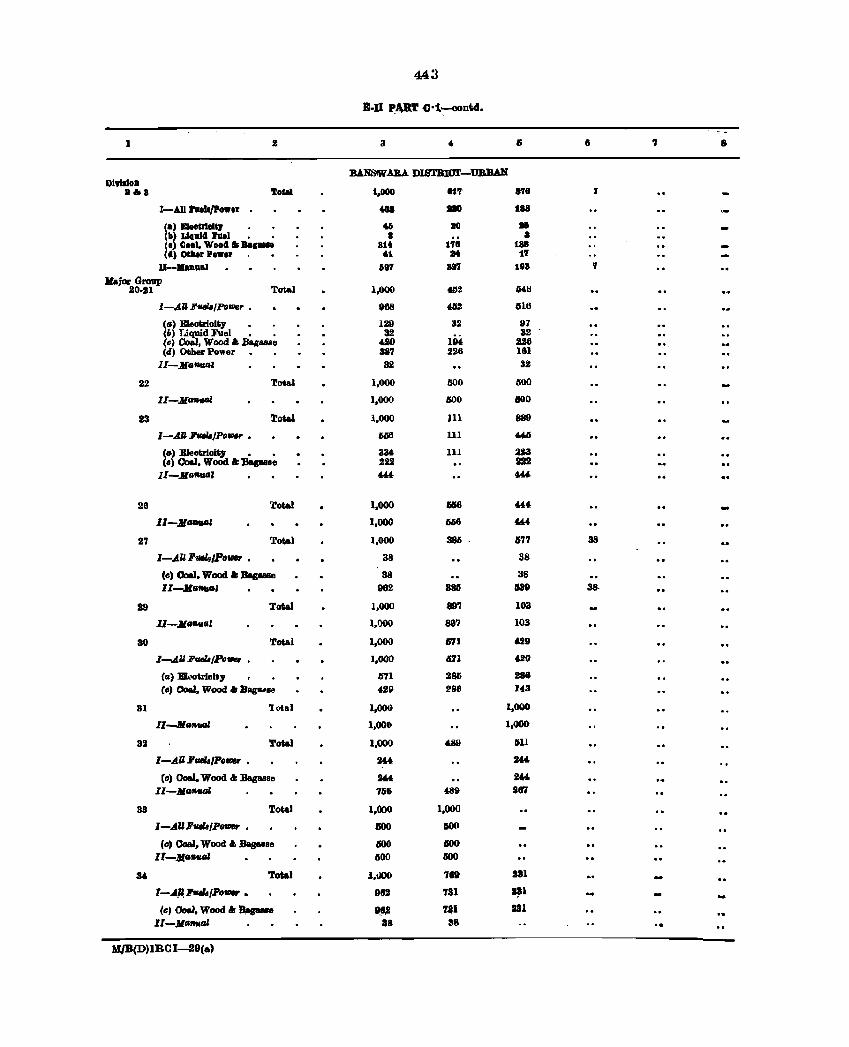
443
B·II I"UT -C·1_ntd.
1 3 , 5 8 ., 8
BANStWARA DIBTBror-UBBAN DI'I'IIlOD
•• 8 To ... 1.000 8..,. 8'18 'I
I-Alll'aellfP_er . 408 - 188
ia) BIee&rlDl~ .a 10 .. II) l4a1d :rae] 8 8 ~.) «lo ... Wood ... , .. 8 Btt t'1l1 1811 d) CHIIer Power • • "1 at 1'1
ll-KlIIlual 587 897 UI8 'I
HajlQ' Gl'OUp SO·11 Tatal 1,000 652 G4,1:l
I-A"F"'IPo'll18~ • 868 65S 116
(G) Eleotrioity 129 32 97 (b) T.iquid Fuel • • 32
IN 32
(e) Coal, Wood a. Bagasse -dO .226 .. , (d) Other Power 387 226 181
II-JlG_'" S2 32
22 Total 1,000 500 500
II-JIG""," 1,000 500 1100
13 Total 1,000 III 889
I-AJl."'*'IPo_ • 606 III 441
(G) B1eotrioitJ • • 33' III 223 (Il) Coal, WoOd & ..... e 222 211
Il-JlG_' "' "' 26 Total 1,000 1116 "' Il-: MtJftIIGl 1,000 656 '" 27 Total 1,000 386 1'17 38
l-.AU Fwls/PoIMA • 38 38
(cl Coal, Wood .. Bag_a 38 38
II-JIG .... ' 982 8116 139 38,
29 Total 1,000 89'1 103
H-JlG""'"' 1,000 897 103
30 Total 1,000 571 '29
l-.AlllueN/E'tJ_ • 1,000 471 '!9
(II) BL,otrioit7 571 2116 286 (e) OoaJ, Wood .. DlIgIWse 429 288 143
31 'lotal 1,000 1,000
II-MG-' 1,000 1,000
32 Total 1,000 6.89 511
l-.Alll'_/Po_ • 2" 2!l4
Cc) Coal, Wood & Daguse 2'-' 2640
Il-JlG~ 766 !l89 187
33 Total 1,000 1,000
1-.4UF_fP_" • 1500 1M)()
Ie) 00aI. Wood" Basaase 500 IlOO Il-JlG_1II 600 500
3' Total I,UOO 7. sal l-.iP:l'UllafPo_ • De2 '181 ~l
<e) 00aJ. Wood & ~ .. ~ 'fBI 181
II - Jla,.".111 38 88
H/B(D)lBGI~9(6)
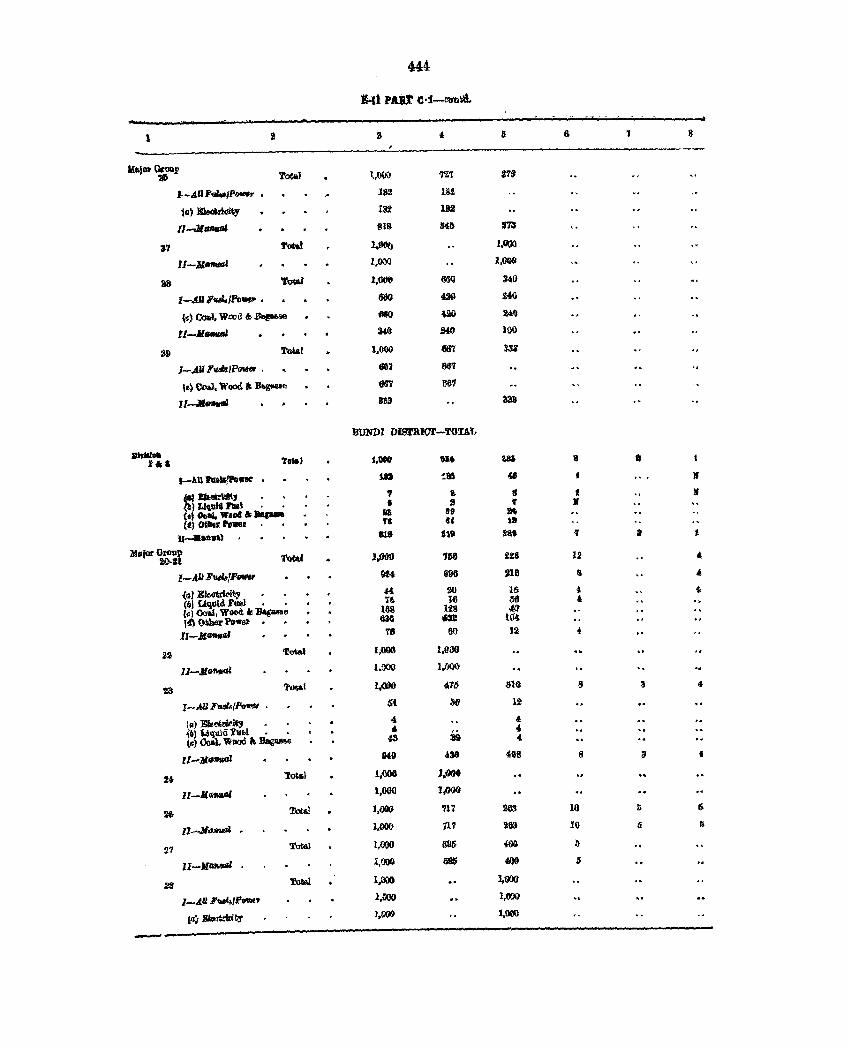
444
g·ll PAllt C·i-conilll.
---1 i 4 II 6 'J S
Krolli&' Groar 'lIfi 7'*1 ~,t'IOO 1\$1 f'lB
J.-.4DJlvlyIP- • 182 lSi
tD)~ 182 132
I1-JlMlfllll 818 HI) ~n
17 !'oWl l,lJtlt) 1.000
11-~ 1,000 1,0(18
38 'touJ J,OOO lJI!(I litO
1-4JU'~fP"'" • 600 oJ,OO iiG
(~) ('.oU. Wood & Sapne fIfKI ~ lW)
11-Jt1lfltlllll :H(l UO 100
:;& 7>_1 1,000 &l1 ~
J-AU htMlPIAHf' , 681 8&7
{.)~. Wood" ~ Ml 00'1
11~ 3$3 -au
lIUNDI DISi'RICl'-'l'OUi,
DiftII01l i ... Tolal 1,000 $It W 8 fI
I-AU htSl/l'ower' • 181 18& 4IJ If
~~, .. '.! • S i If glU_ra., . . • , f If ) Goal. •• 01 .. JIarND as !D D
(i) otIIer .... I n «. tlt
11 __ ..... 11 aa ill.' m 'I' I
Mafol llfoul »S .,... ),6110 7fil1 22& 1.2 4,
I-A» Ff!fl..,!Pl1fIIU 9U 696 216 a .. {G)E~ « 90 16 4 * (61 Liquid )'U8J • • '" UI 56 , {;:l Coal, 'WM a: 1JagaRe l~ 1ft 4!J tl) Otb« 'Powel'. • 630 ili311 104
If-M_.z TO lID 12 +
22 Tot&I 1.000 UIOO
1l-1I~ I.QOO 1.000
t3 'l'$1 l,(lOO 476 lilO lJ " 4
I-AU Ft«l8tPo- . 51 3f 12
Ill} EIe~"*, • . 4 " ~') ~a: ru,,1 . . " 39 " t,,) .WtllJd.ft~ 43 4
11-JI",1ttIGl 840 438 406 8 9 f
U 'IotIiJ 1,000 lJJOO
ll-Jt_Gl 1,000 1,000
~ T«a.l 1,600 '11'1 ll63 10 5 I>
11-.J1ttm#it 1.000 117 263 16 li l)
~7 'rot&.! 1,000 5&6 too Ii
lI-Mu'ftdl 1,1)JQ - 400 Ii
lIB 'l'®iIl. 1,000 1.00<t
l-A.1l Fvl.J~~ 1,000 l,llOO
Ca{ l!ild!iIli~ 1,1)0& 1,000
-
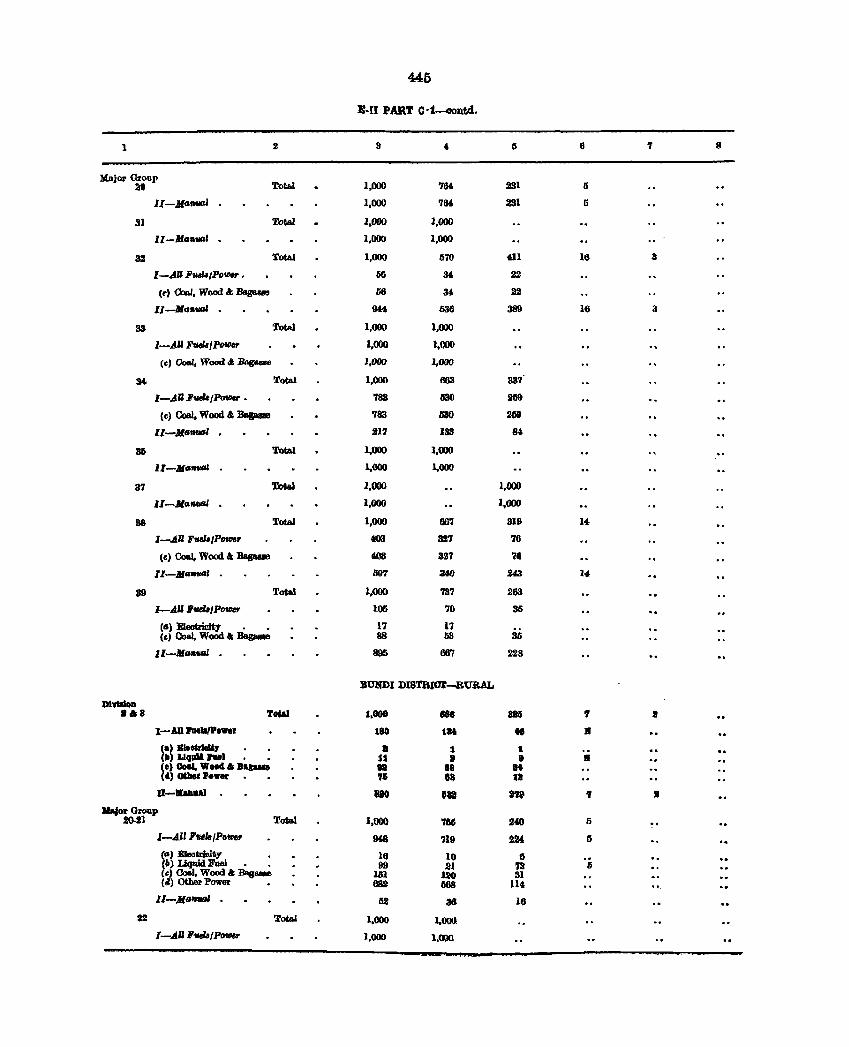
446
IMI PART C ·t-oontcL
1 2 3 t 8 T 8
Major Group 211 Total 1.000 764 231 6
II-JIG,""" 1,000 7M 231 6
31 Total 1.000 1,000
ll-Jlo_1 . 1,000 1,000
32 Total 1,000 670 411 16 3
l-dU FauU/PolIJfr • 6G 34 22
( .. , Coal, Wood &; &sa- 66 34 2l!
II-JlG __ 0 944 536 389 16 3
33 Total 1,000 1,000
l-AUFUfh/PoWer 1,000 1,000
Cel Coal, Wood '" BtIgasee J,ooo 1,000
34. Total 1,000 663 337
I-AU FutkIPo_ • 783 1130 269
(1:) Ooal, Wood &; ~ 783 530 269
lI-jfa_l , 217 133 84
ali Total 1,000 1,000
lI-JlGtWCIl 1,000 1,000
37 Total 1,000 1,000
II-Mall_ o 1,000 ],000
S8 Total 1,000 66'1 319 14
I-All F_/power to3 327 76
(e) CoaJ, Wood &; Bas- 4(13 327 78
ll-Jl,.,""41 . 1197 340 243 14
39 Total 1,000 73'1 263
l-dU ,vel./Po_ 100 70 36
(a) Eleotricity . • 17 17 (e) CoaJ.. Wood" Bagaue 88 63 35
ll-JlaUfll 895 667 228
BUNDIDmTR~-BURAL
D1Y1a1OD ,.8 To ... 1.GOO e 826 7 a I-AU I'IIeIl,lP .. lr 180 11t .. II
(a) BleoMd', • 1 I C') L1tulll'llel U J It II ~.) Go'" '11014. B .... II 18 .. Il) o&IIeJ '0". . . 7' 03 ta
U-IIaII." 8BO I .. "~ , •
Major Group 20-21 Total 1,000 7611 HO 5 ..
I-All F."IPo,- IM8 719 22. 5
(G) JilIeotrfcit,. 16 10 6 (b) UqaWl FUel • • 99 21 73 I> (e) Coal. Wood & Bas- 151 J.20 81 (!I) OtherPower 0 882 668 llt ..
Il-Jl.""" 62 38 16
22 TotAl 1,000 1,000
I-All yutklPOtDer 1,000 1,000
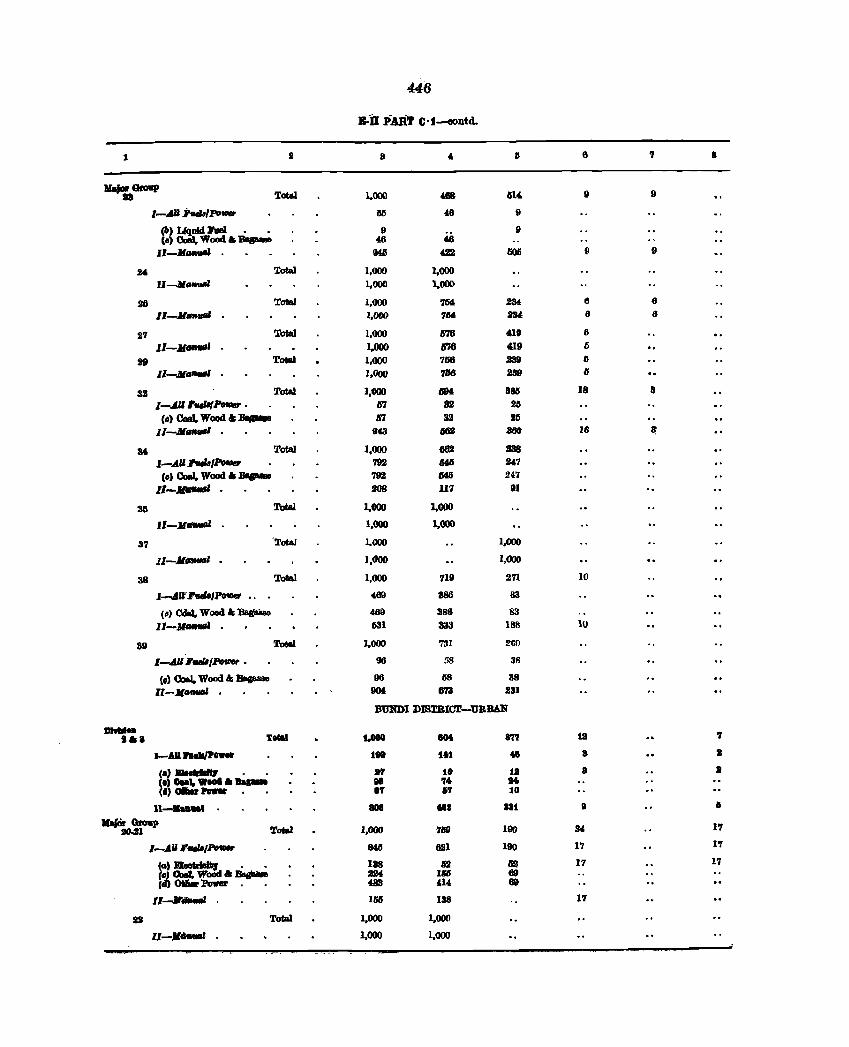
446
B·O pAliT (l·t-oontd.
1 II S fo II 8 ., 8
-..0f0UP .. Tot61 1,000 - 514. II II
'-MI :;"IPD- M ~ II
P) U4a1d I!'ueI • • 9 II (e) Coat. Wood. Ba..- 46 4.8
ll-.Jf __ 945 4.22 (i()jj II II
M ToW 1,000 1,000
II-Jl.""" 1,000 1,000
26 Total 1,000 1M 284 6 6
II-MtJ....M I,OfI() 1M 2114 6 6
27 Total 1,000 1116 4111 II
11-.11--' 1,000 676 (19 Ii
29 Total 1,000 166 2SII II
II-Mil_' 1,000 7M 239 Ii
32 Total 1,000 - 3M 18 8 I-AU ,,_'POrIW • 117 8lI U
(0) Coal. Wood • BIIUIe 117 32 21i
II-M_' 943 - BOO 18 ~
1M Total 1,000 862 838 l-~U :I'Mk/PorIw '1lI2 6411 2fo7
(c) eo.I. Wood .lJaIIIu '192 M5 24,7
11-""" i08 117 91
31i Total 1,000 1,000
II-M._' 1,000 1,000
87 -Total 1.000 1.000
II-JIDfMII • I,()OO 1,000
38 Total 1,000 719 271 10
l-AU" .... 'Po-. .. 469 886 83
(II) Cda1. Wood a; :BagaiIae 489 388 83
lI-Jl-- . 631 333 188 10
39 Total 1.000 731 2(;0
,-AU :rull/Powfo . 96 58 38
(.) 0aa1. Wood " Bagaaae 96 118 lIS
ll-.lf-- IIOfo 6'73 231
BUJD)I D1BTRIOl'-llBBAN
DhIIhII 7 t •• TeCai 1,000 ICK 8'l'l 1111
1-0 IhIII1'ner ttl ttt til a I
(.) ... ....- . . fII 10 1. a I
ll) Goa'" ..... BaI- tS 74 M .}O&U.... . . .7 57 10
ll-lhlUlal 808 ilia 88t I 5
IItojcir Qrou}' lJO.2l TofaI 1,000 71JC1 190 S4 17
1-~Uy ... ,Po .. SUI 621 190 17 17
(II)~ •• 138 §! 112 17 17
(4\ ao.J. WoOcI& ~ ft4 166 69 ( oar.. Power. • 483 fo14 69
ll_''''' 1M 138 17
II Total 1.000 1,000
11-.11"'" 1,000 1,000
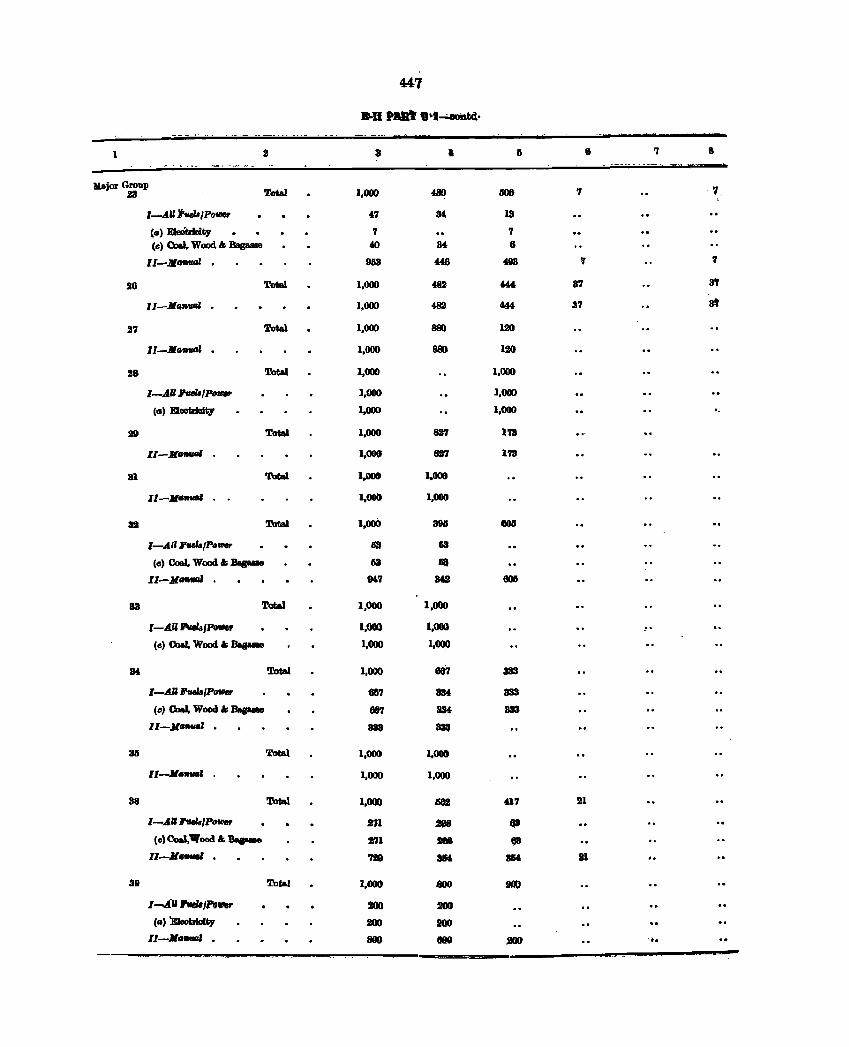
441
JNI • __ .·I-.oDtd· --- - --- ~. -- --. -----. -~---
1 2 3 I ~ 6 'J 8 _, ----- - - ---- .. -
JPjor Group lIS Total 1,000 480 1108 7 - 'I.
l-AUI_/Po_ 47 at 13
(II) EleOtrIo1ty 7 7 (e) 00aI,. Wood.t Bapaae f() 34 6
II-Mil_' IHI3 «6 4S3 , 7
26 Total 1,000 482 "" 87 3' 11-.11",..", · 1.000 482 444 87 3'
27 Total 1,000 8IK) 120
11-.11"""'" · 1,000 880 120
28 Total 1,000 1,000
I-A.IlI'*'/P_ 1,000 1,000
(0) EleetrIalty 1,000 1,000 '-
29 ToW 1,000 U7 173
II - ltC.""" 1,000 • 7 173 .
31 ToW 1_ 1,008
II-""_' I,OGb 1,000
82 Total 1,000 38lI 806
I-All FuM/Po_ 113. 63
(e) Coa.I, Wood " Bapaae Ii3 113.
11-11"" 94.7 sa 6011
33 Total 1,000 1,000
I-AU II"ueI.s/Po"', 1,000 1,000
(e) Coal, Wood &; IJasa- 1,000 1,009
84 Total 1,000 687 338
,-All "va.,,,_ 687 3M 333
(e) 00aI, Wood" __ 88'1 334 333
11-11_' · 813 8311
3Ii Total. 1,000 1,000
ll-JI_' 1,000 1,000
38 Total 1,000 1502 417 21
I-AIl,./Potl/er 2n - 01 (e)eo.t.1rood" :Bapae 271 sea 1)3
II-II__' · '1211 3M 3M 111 ,-.
39 Total 1,000 800 tOO
1 -A1I1'vtM IPo"., 200 200
(II) Eleotrlolty 200 200 .. Il-Jld_' · BOO fI8G 2CIO -t.
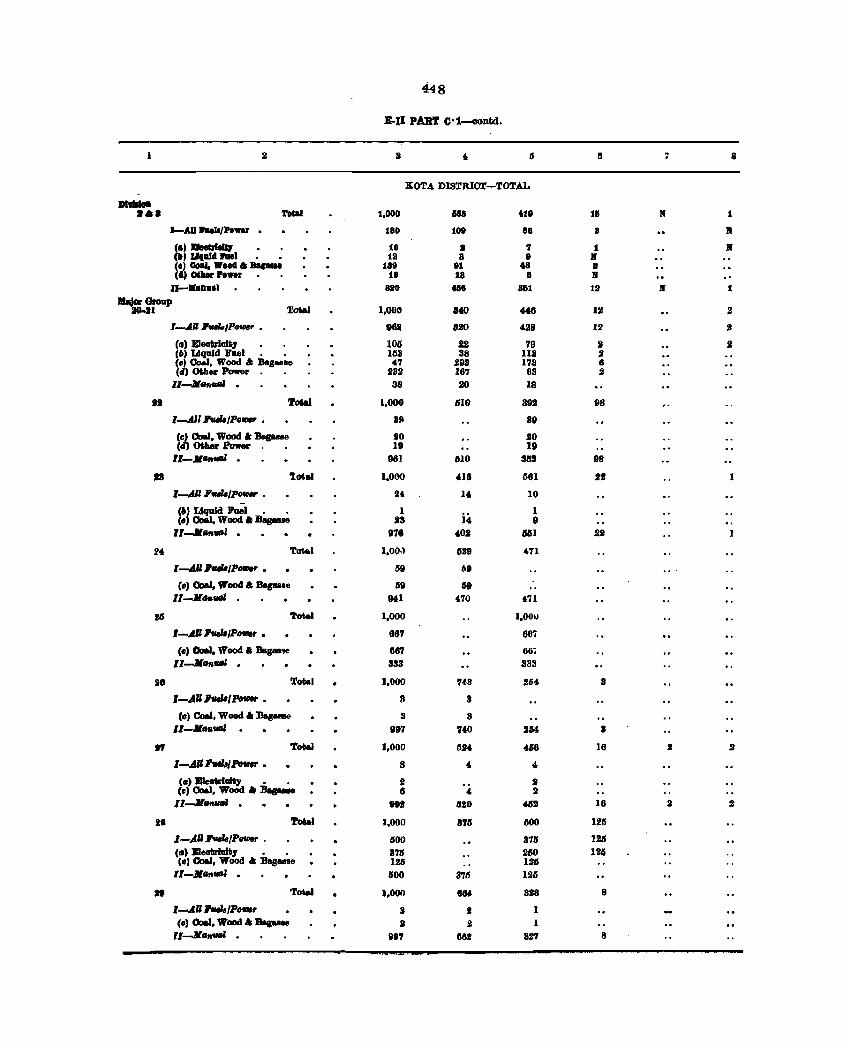
448
B-II PART O·1_Dtd.
1 .2 II , 0 II 7 S
ROTA DISTRICT-TOTAL
DI ......
••• Toial t,OOO 185 U. tl M t
I-AU ..... II/Po ... r . 180 tOt 88 8 1W
(.) JIIIe&rhIf;J 10 II 7 1 N ") 1.1111114 1'1111 111 8 9 N (I' 00aJ. W.od II Bac_ 188 111 .. I (" eN_ P .... r 18 18 8 N
11-..... 1 810 til. H1 111' N 1
~~ Tot.al 1,000 HO ~ 12 2
'--''0. I'wJB,p_ . 9W1 no 428 12 II
(fI' E1eotrioit;1 • • 105 !2 79 II I (6) Liquid File. • • Ilia 38 113 , ~~ eo.J, Wood " BaS".o 47 Jl93 173 6
) Olber PoweJo. . 232 167 63 , ,,-Jla,..., · 88 20 18
12 'l'o&aJ 1.000 610 392 98
l-~l ""/Po_ . 811 89
(~ OoaI, Wood I: Bag_a 10 10 C <>thew .Power. • III It ll-Jl"'. - 961 610 StIli 98
III 1m .. 1,000 '18 1S81 21 1
l-.tll '_/PMW • it l' 10
(61 Ul)1Iid Jl'ael • • 1 1 (. OorJ, Wood II DepalO 23 14 9 ll-.lf .... , · 978 ,02 6111 211 1
24 Total l,OO,) 1S29 471
'--''''''/PoflMr • 59 b9
(III) aa.J. Wood " Bagas.e 59 59 lI-JillafMll 941 4'10 171
l!6 'I'otal 1,000 1,001)
I-.AU ",,/PDWIr • 667 687
(III' 001II, Wood &; Baguse 667 lltii
ll-JitlnllllZ · 3.'13 833
I. Toflal 1,000 '1(S 264 II
'-AU ""'[PoWr • 1I II
(III) Coal. Wood I: :0.,...0 II 3 ll-llRIIIIZ . 997 740 2M 3
1'1 T~ 1,000 ISlit "6 16 II II'
l-AIIJ'_/Potm • 8 4 " (.) BleokIaity • • J II ee, Oo&l, WoOd "Bapa. 6 4- It Il-llhUGI · ", 11%0 fill 16 It 2
ltI 'l'otal 1,000 376 IlOO 125
I-AIJ'_,Power . 1100 371S 126
(II' Bleoflriallly • • 8711 260 1211 (c) eo.l. WDoc! " Bagasso 126 126
ll-Jl ... - . 000 3711 12li
I. Tot.eJ ),000 864. 3118 8
1--''' ,,*,/P_r 3 I (0' ODeI, Wood " Bagule II II 1
ll-JI ... .., . "' 662 82'1 8
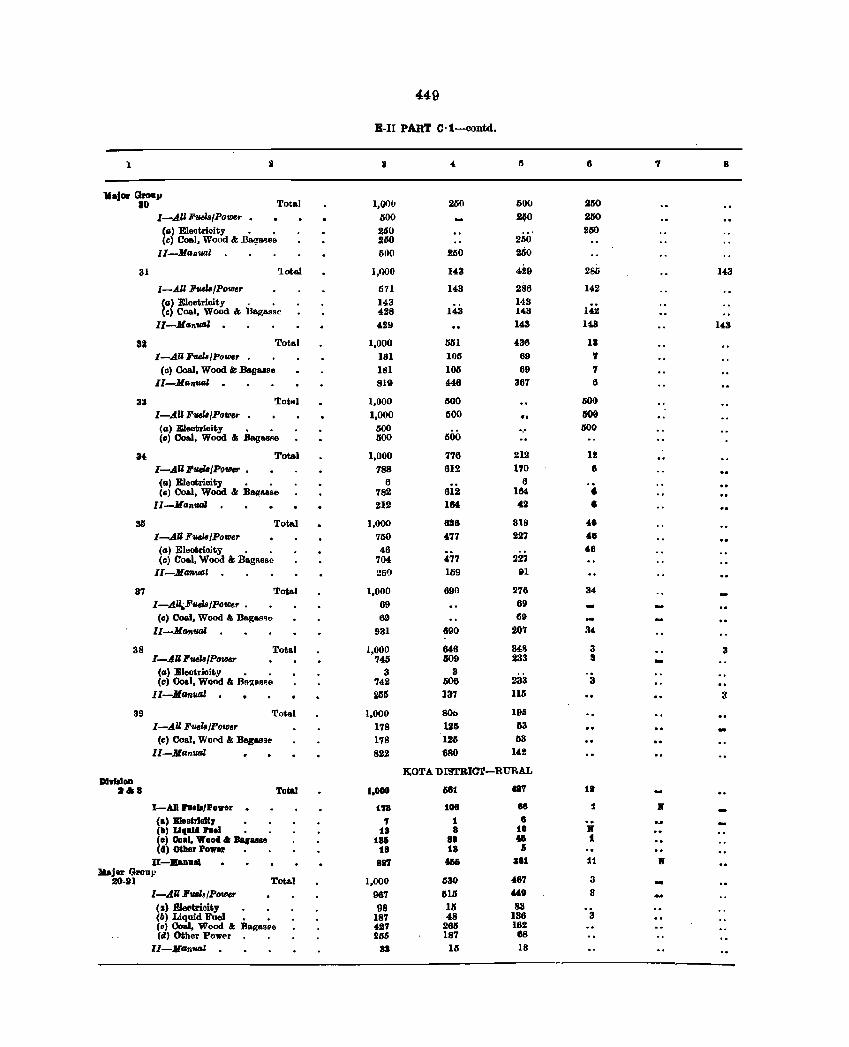
449
E-I1 PART C·1-contd.
1 I • 15 8 ., 8
lIafow Gro.JI 10 Total 1,00(1 200 500 11150
I-AUF'lHls/Power • 600 2~0 2110
Ca) Eleotrioity • . 260 2110 (c) Coal, Wood &; .Ba~a~@e 2110 2110
Il-Ma"wl 500 260 260
31 'lota.) 1,000 l4,3 429 285 143
I-AU Ftul8/Power 571 143 286 142
(a) Electrioity • • 143 143 142 (c) Coal, Wood &; Bag .... se 428 143 143
II-Man_' . 4.29 143 143 143
32 Total 1,000 551 430 11
I-AU Fuel8/Powr 181 105 89 7 (c) Coal, Wood &; Bagasse 1111 105 69 7
II-Man'IUJJ . 819 446 367 6
33 'tot .. 1 1,000 1500 600 I-AU F_IPflVler 1,000 1100 1106 (cz) Electrloity • • 500 ',' 300 (c) Coal, Wood &; BagasRe 600 1500
34 Total 1,000 776 212 1.2 I-AU F_/PIJ_ • 788 612 170 6 (a) Eleotrioity • • 6 6 (c) 008.1, Wood &; Baa:&8se 782 012 184 •
II-JlanllllJ 212 184 42 • 311 Tot .. 1 1,000 636 31B .0
I-AU Fvela/Poliler 750 477 227 46
(a) Eleotrio.ity • • 46 46 (c) Coal, Wood & BagRsse 704 477 227
Il-Maftwl 269 159 In
37 Total 1,000 690 1.!76 34
I-A">.Fvela/power • 69 69
(c) Coal, Wood'" Bagas." 69 69
II-Manual 931 &90 20'1 34
38 Total 1,000 846 3411 3 3 I-AU Fuels/POlDer 745 S09 233 8
(a) Eleotrioity • • 3 3 (c) Coal, Wood &; BRlt8S"6 742 S06 233 3
II-Manval 256 137 116 a 39 Total 1,000 SOb 196
I-AU Fuels/power 178 125 63
(c) Ooal, Wond &; Bagasse 178 126 53
II-Manval 822 6RO 142
lWTA DISTRlcr-RURAL DI ..... . &. Total 1,000 Hi tI'1 1 •
I-All ...... 'Po ... r i'l8 101 18 1 • (.) BIeetrleltJ , 1 I .. (It) UqDlII 1'1181 11 8 to • (e) Ooal, Wood" Bagalse 185 88 .. t (d) mber Po .... r t8 18 I)
JI-llllaDlIl1 81l'l llili .11 11 II Jlajer Gron,,"
2O-lU Tota.l 1,000 1130 487 3
I-AU Fuls/PolDer 961 11111 449 3
(~) Eleotri.oity 98 111 8S (6) Liquid 1I'l1el • • 187 48 186 3 (~) Coal, Wood &; Bag.s ... 427 2611 162 (d) Other Pewl'r 1I1115 18' 88
1I-JlanN41 33 15 18
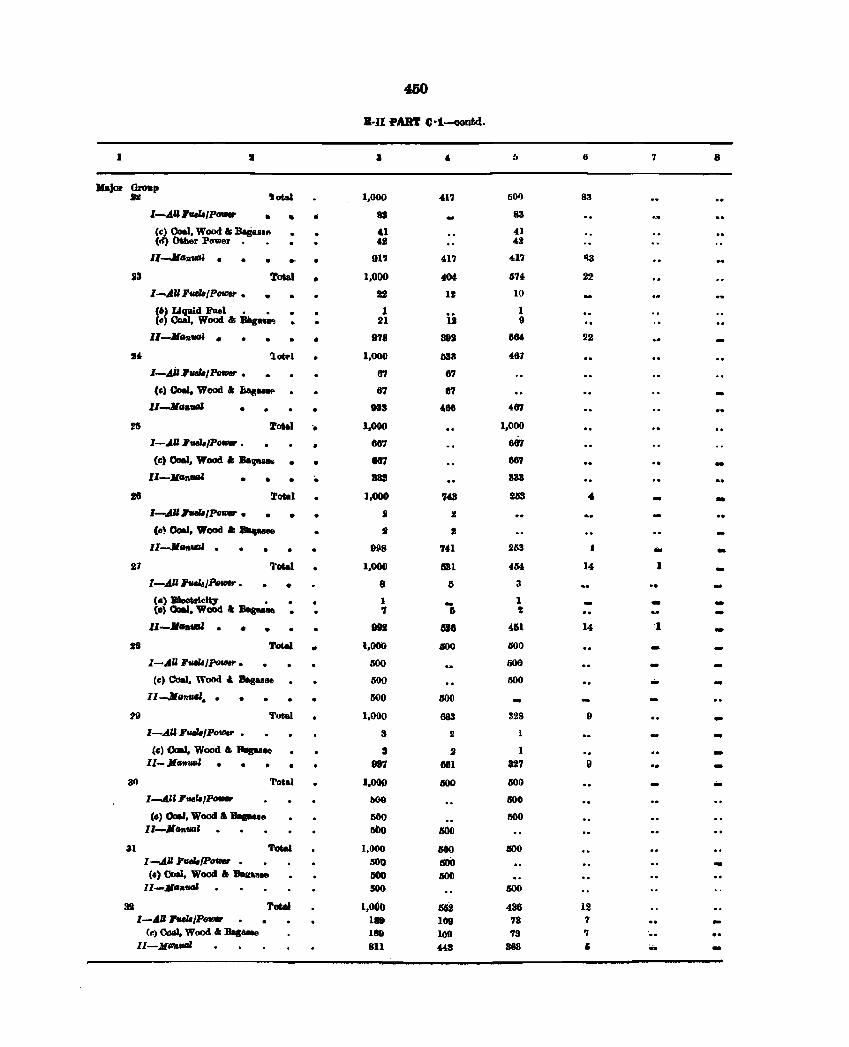
400
B-II .pART C:·1-QOntd.
I 3 , b 6 7 8
](ajor Gzoup 'Iotal 1.000 41'1 500 SS JlI
I-A"'_/~ .. .. " as 83
Cc) Coal. Wood I; Dagaas .. &l 4.1 (d) Other Powew. • 42 42
II-JIa1ttiDI • • • • • 91'1 4.17 417 '13
23 'lota.! • 1,000 401 674 22
l-A"' __ /P_ • • 2J 12 10
(61 Liquid J'ael • • 1 ii
I Co Coal, Wood "" 'BIlges.., 21 9
II-JlG1ttiDI .- • 878 392 11M 22
.4. iottl • 1,000 53lI 487
I-AU,_/l'ov. • G'I 87 (c) Coal, Wood .t .tiatI ..... 87 87 -ll-MfI.vaI • • 933 488 4.87
23 roW :. 1.000 1.000
I-.... U ,veJs/Po_ . • 687 867
(c) Coal, Wood " Bapu .. • 887 867 -II-X"'- • • ;. 333 1133
16 '1'ohl • J,ooo 743 2113 4 -l-""" ... /Po_ • • • • I 2
(0' Coal. Wood ........ ~ II
Il-JlG1tval . • 9t18 7n 2113 ... -27 1'oW 1.000
_I 454 14 1
I-AU ""JPo...,. • • 8 5 3
(a) moot.rlclty • 1 - 1 ... -(e) 0aaI. Wood a: .... lie ., 6 I
11-1I .. vaI • • 891 •• 4.11 14 ·1 -28 ToI.aI • '.000 4iOO 1100
I-AU , __ ,po_. 500 600
(e) eo.J. Wood ol Baguse 500 500 .-II-JCflntlllZ. . • 500 500
?II Total 1,000 683 328 9 -I-All '-IPo- . 3 2 -
(c) 0uaI, Wood" Rlpale 3 2 1 -ll-.Jlllfltlf.ll • • 987 881 827 " 31) Total 1.000 500 1100 ...
I......4n'_r.,~ fIOO 1500
(0) 00aI. Wood ........ 500 500 ll-Jl4r&'lltli IIbo IiOO
31 Total 1,000 600 lIDO I-All F_1Po_ 1100 500
(c) Coal, Wood .. BaRM .. IMlO IiOO I1-Jl8,.ual 500 500
32 Total 1,000 W 4.StI 12 I-.tll ,../Po_ 118 1011 78 7
(e) 00IiI. Wood I; Bac"" ISO 109 73 'I .. II-J(fA&- 811 "3 383 G ..
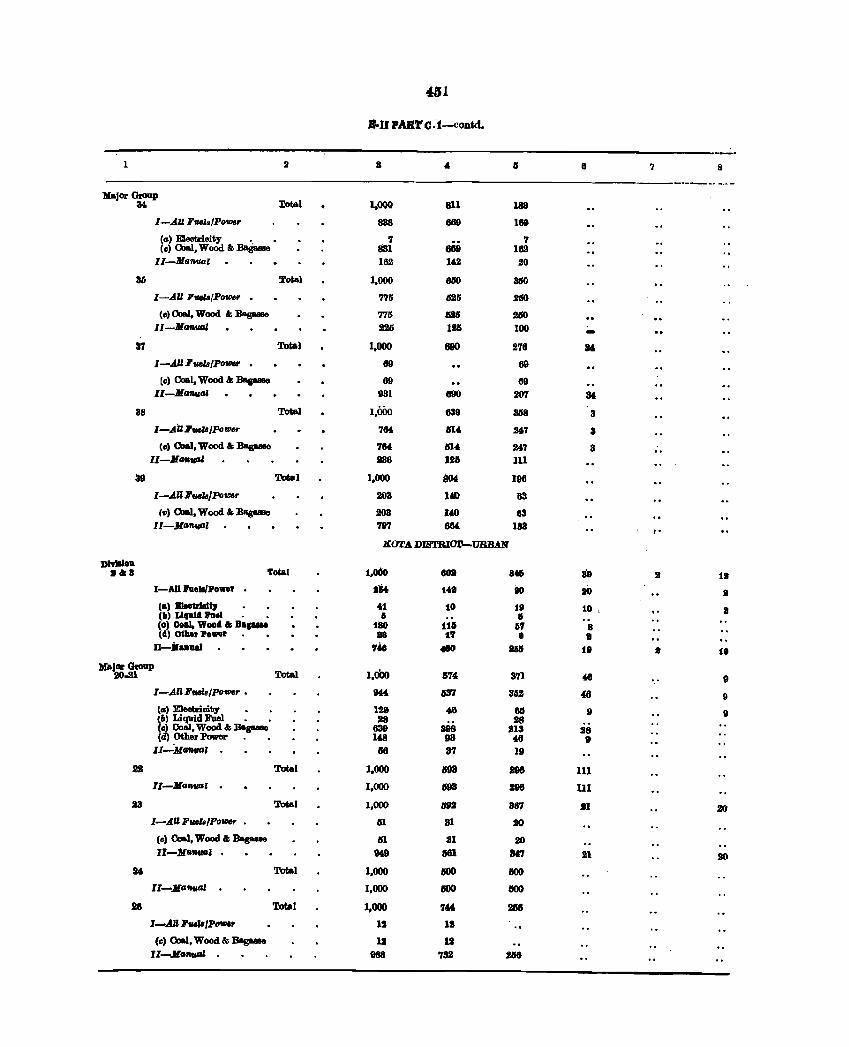
451
B-n PAJiI'C~1-cODtd.
1 2 a 8 7 8
... _--_ ..... -.-'" :Major <koup
M Total 1,000 811 188
I-AU Fuels/Power 888 889 189
(a) Eleotr:lBity " • 7 7 (c) Coal, Wood &; Bagasae 831 889 162
II-Manuaz 162 142 20
3D Total 1,000 811() 3lIO
I-All FtItIIa/Power . 775 G25 2150
(c) Coal, Wood ",:oa.g._ 775 - 2ISO II-MatW.tU 226 1211 100
37 Total 1,000 680 276 IN
I-.AU FuelaIPo_ 89 69
(c) Coal. Wood 4; Bas- 89 89 II-Martual 931 890 207 34-
38 ToW 1,000 839 3If8 3
I-AUJ'w."IPonr 7M 81' 267 3
(0) Coal. Wood 4; Bas-e 7M lSI' 2i7 3 II-MMIUtIl 236 1211 111
39 Total 1,000 804 196
I-AUJ'ucIs/Potoer 203 141) "83
(II) Coal. Wood 4; Bas- 203 140 63 II-Ma~l 797 11M 183 ,.
IOTA DJSTBI(]1'-URBAN
DldllIll 1,060 89 11&8 To&al 8011 8t1 2 11
I-AU hell/Power 1M 141 80 sO I
(a) Bleeirlelb' • 41 10 19 10 , I (II) L11111l4 PIlei • • Ii • (0) Ooal, WooA 4; DIp,,, tllo t11 67 8 (4) (Hiler power 18 17 8 I
II-ilaJluaJ , .. 410 III f. • 10
Major GI:oap 9CMll ToW 1,000 57' 371 48 9
I-AUJ'vM8/po_r • N6 113'1 3112 46 9 ta) Eleotricity 129 46 &6 9 II lll> Liquid Fuel • • 28 liS (c) Coal, Wood '" Bagaaao 839 398 213 28 (d) Other Power . • 148 93 46 9
II-MafWG' 116 37 19
B Total 1.000 1198 J96 111 II-Ma_, . 1,000 1193 296 111
23 Total 1,000 .,. BfI7 II 20 I-AU , .. Ia/Po'lll8r • 111 31 20
(c) Coal, Wood 4; Bagaue lSI al 110 II-JrIHlU8J MD 1181 3&'1 21 1IO
U Total 1,000 IlOO IlOO
II-Mortua' 1,000 IlOO IlOO
28 Total 1.000 744. iII8
I-All J'veIB/P_ III IS (0) Coal, Wood & Bagaaall 11 11
II-Mortual 988 '732 2116
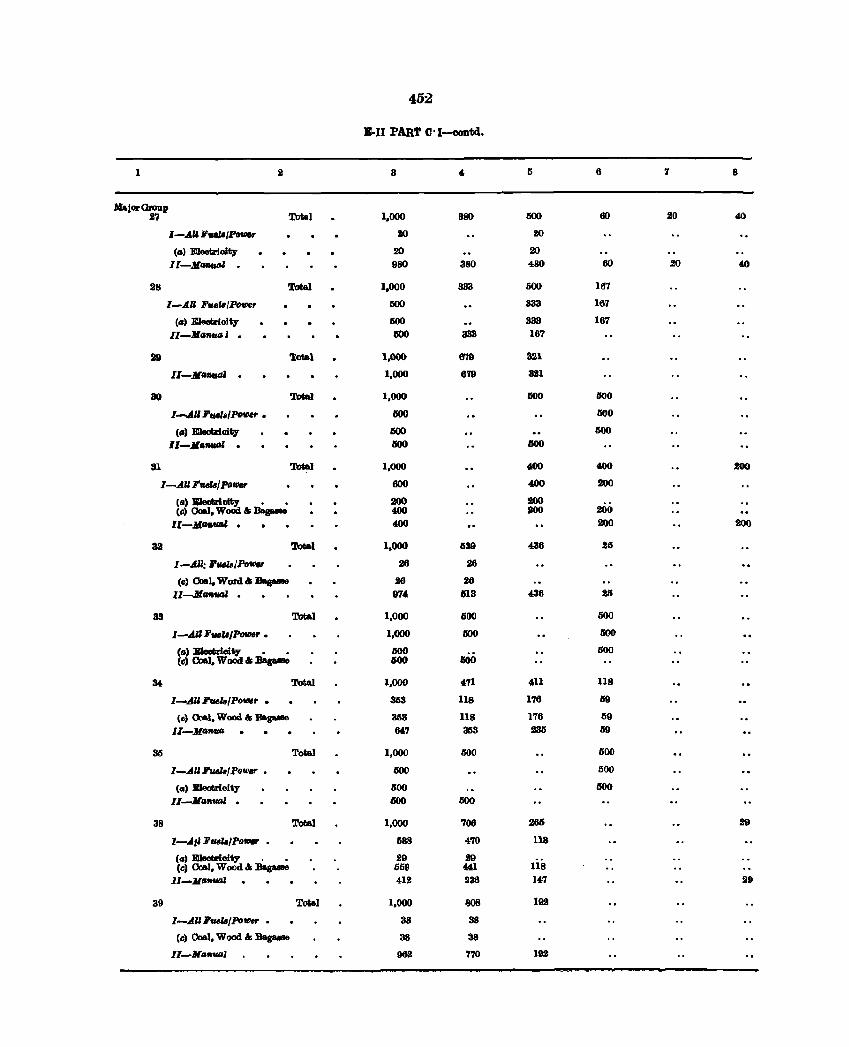
452
B·II PART C'I-ClOIItd.
1 2 3 5 8 7 8
MajOl' GlOlIp 27 Total 1,000 380 500 60 20 40
I-All F",,/PD_ 20 l!O
(al Eleotrioity 20 20 ll-Jl~ · 980 380 480 60 20 40
28 Total 1,000 333 000 167
I-AU FuelB/Po_r 000 333 167
<a' Eleatrioity 500 333 167 II-JIll_I · liOO 333 167
it Total 1,000 879 321
lI-JlIIfltIal · 1,000 679 321
30 Total 1,000 1100 000
l-All FPl8/POIHf' • liOO 1I00
(II) BleotrIoity IlOO 500
ll-JltlfIUIJl · IlOO IJOO
81 Total 1,000 ~ 400 200
I-.dU Fuers/PDIIW 600 400 200
(II) Bletltirlolty • • 200 200 (e) OcIaI, WOOIl '" Bas&- 400 JOO 200
ll-J(fItI,_ • 400 2(10 200
32 Total 1,000 1139 438 211
l-AU~ 'alB/PO .. 28 26
(Il) 0.1, WOl'd '" a..- 26 26 lI-MIIfIVGl · 874 613 436 23
33 Total 1,000 GOO 500
I-AUF,,"IPOIIJer • 1,000 500 500
(tI) Eleatdoity • • IJOO 500 (e) Coal, Wood '" Ba£- 600 I!OO
34 'l.'otaI 1,000 471 411 118
I-.dll Fruls/Poqr • 353 118 176 59
(e) 00&1, Wood "':BagaMe 353 118 176 59
II-Jl- 114,7 353 23li 59
35 Total 1,000 GOO 500
l-AIlFuel8/Po,,*, • 500 500
Ca, E1eatr1oity 500 500
Il-MllfifIDl · IJOO 500
38 Total 1,000 706 265 29
l--.d,J F .. ra/pol/If/r • 1188 470 118
(a) Eleotricity , • 29 29 lis (e) Coal, Wood'" JJa,gaaa!Ie 659 441
ll-MafltllJl 412 238 147 29
39 Total 1,000 808 192
I-AU Fuel8/PD_ • 38 38
(e) Coal, Wood '" Jlagaase 38 38
II-Mafl,"a' 962 770 192
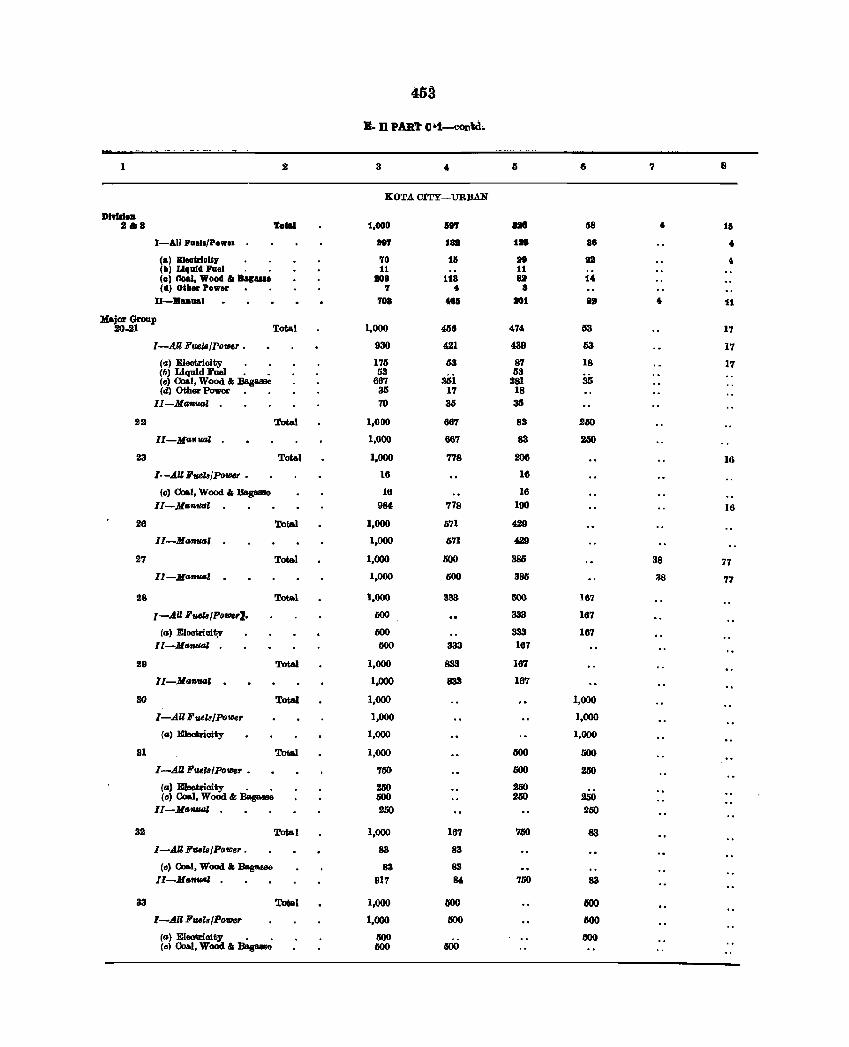
45:1
'8. n PAll'!' o~t-cOJ!td.
1 3 4 6 6 7 8
KOTA. CITY-URBAN
DhllloD 2&8 Tota. 1,000 III'r .. 58 • 15
I-All "R.I./POWll 187 to til .6 • (a) Blle1rlole, 70 15 29 III • (II) LllJuld Fuel 11 11 (0) neal, Wood .. Bagalle 1109 118 U 14 (d) Oaller Power 'J 4r •
U-JllDual 708 .. & 101 a8 • 11
Major Group 20-21 Total 1,000 458 474 ISS 17
I-All i'uel8/Power • 930 421 439 53 17
(!'.J) Eleotrioity 175 63 87 18 17 (fJ) Liquid Fuel • • 53 63 (c) Coal, Wood &; Bagasse 667 331 281 35 (d) Other Power. • 35 17 18
II-Maaual 70 35 3IJ
2lI Total 1,000 007 83 2150
II-MGIlIUIZ 1,000 667 83 2ISO
23 Total 1,000 778 206 16
I· -AU i'uela/Po'lD81' • 16 16
(e) eo.I, Wood & Dag_ 16 16 II-Mantia' 984 778 190 16
26 ToI;&I 1,000 571 429
II-ManfUl I 1,000 671 429
27 ToI;&l 1,000 000 385 38 77 II-ManfUl' . 1,000 600 385 38 77
28 Tot&l 1,000 333 500 167
I-AU Fuala/PlJwerJ" IiOO 333 167
(a) Eleomoittv 500 333 187 ll-M_ual 500 333 167
29 Total 1,000 833 187
II-MafI'IUIl . 1,000 833 167
30 Total 1,000 1,000
I-AU Fue18/Power 1,000 1,000
(a) Electricity 1,000 1,000
31 Total 1,000 500 500
I-An Fula/Power • 750 500 200
(a) EIeotrioity • • 250 250 (c) Coal, Wood":Bagaaae 500 250 250
II-Manual 250 250
32 ToI;&I 1,000 167 7110 83
I-AU Fula/PoIDer . 83 83
(e) 00&1, Wood .. Bagasso 83 83 II-Manual 917 114 750 83
33 Total 1,000 GOO ISOO
I-All FlI818/Power 1,000 tKlO 600
(a) Elootricity • • 600 I!OO (e) CoaJ., WoOd .. BagllllSe IiOO 1500
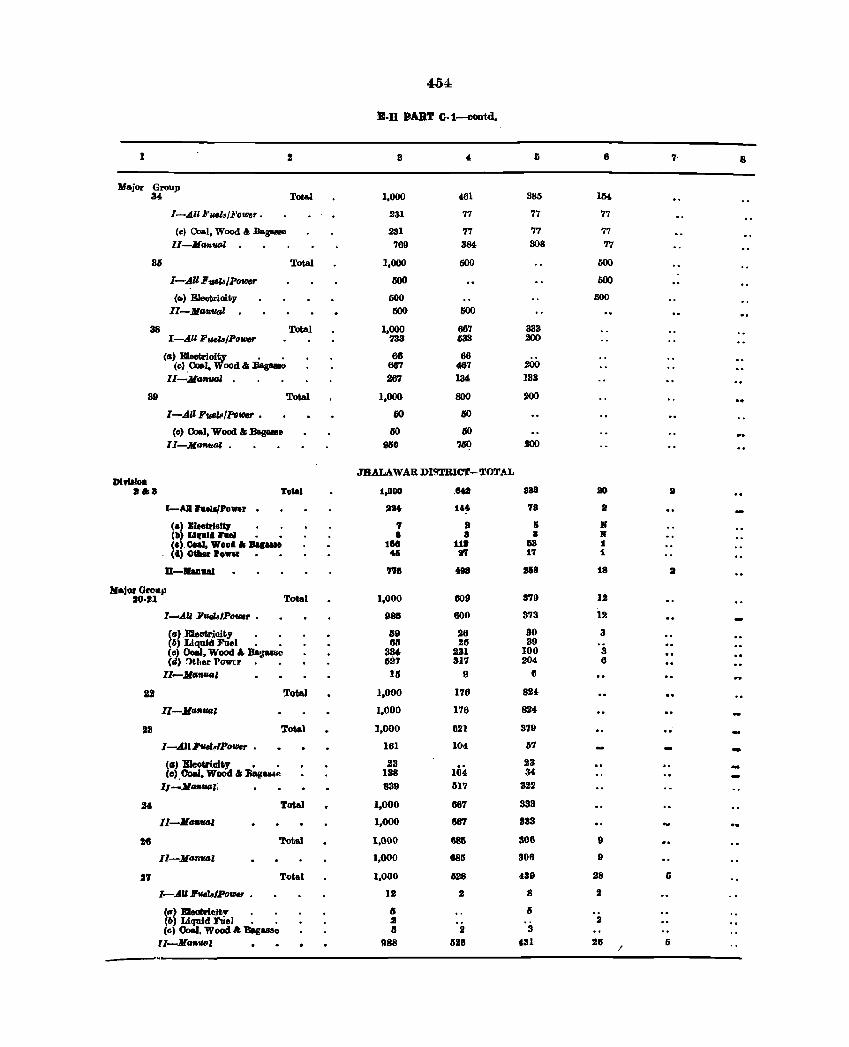
404
B·n BART G.l-cootd.
1 3 I) 8 7· 8
Major Group 3' Total 1,000 461 385 154
I-AU Fuel.li'ower . 231 77 77 77
(c) C<>a.l, Wood ,. Bagasse 231 77 77 77 I1-Man_1 769 384 308 77
36 Total 1,000 500 roo J-:AU Futk/PolDSr lIOO IlOO
( .. ) Eleokioity 500 500
II-lJI.aratJal lIOO 500
38 Total 1,000 667 333 I-AU Ji'ueZa/Po_ 733 633 200
(a) ElacJkoi0Wc . . 88 66 (c).Coal, ood&llagaaao 667 467 200
Il-JtlaflVtd 267 134 133
39 Total. 1,000 800 SOO
l-.All Fw,Wll'ov;er • IiO ISO
(c) OoaI, Wood &; BagaMe 50 IiO II-Ma""""" • 9&0 71f{) SOO
JllALAWA,R DI!'lTBICT-·TOTAL DltI.lIOD
.&a Tvial 1,000 ." .. 881 SO :II
I-All Fu8WPower . n. 144 78 :II
Ca) BleoCrlelq 7 a & • (11) Llllu'" l'1IeJ 8 8 a If (e). Coal, Woo" I; B ...... 188 111 118 1 (&) Ofller '0_ .y ftI 17 1
D-.8.Ilual 778 481 118 18 :II
M.jorGrol1J1 IO.Jl Total 1,000 609 379 12
I-All Fuels/Powr • lIBB 800 3'13 12
(0) Eleotricity 59 26 30 3 (6) Liquid Foel . • 811 28 39 (c) Coal, Wood A. lJaoJuse au 231 100 3 Cd) !)U,or Powcr. • 627 317 204- 6
II--lJI._ual 15 9 6
2J Total 1,000 178 8.2'
II-JlaflVtJI 1,000 176 824-
23 Tot .. l 1,000 621 379 .. I-.dIlF".14Power • 181 104 "7 -(II) Eleotriotty • • 23 104
23 (a). Coal, WoOd I; :RagusP. 188 34
11-Jl-fMil; 839 617 322
U Total 1,000 867 333
II-Jlafl'lMil 1,000 68'7 833
H Total 1,000 685 306 9
I1-MaflfMil 1,000 685 301) It
27 Total 1,000 U8 439 28 I)
I-.dlll!VelsIPo_ . 12 ! 8 2
(II) Eleotrleit\" II l§
(") Liquid FUel . . • " 2 (c) Coal, Wood & BagASse a 2
11-M_I 988 526 &31 28 /
6
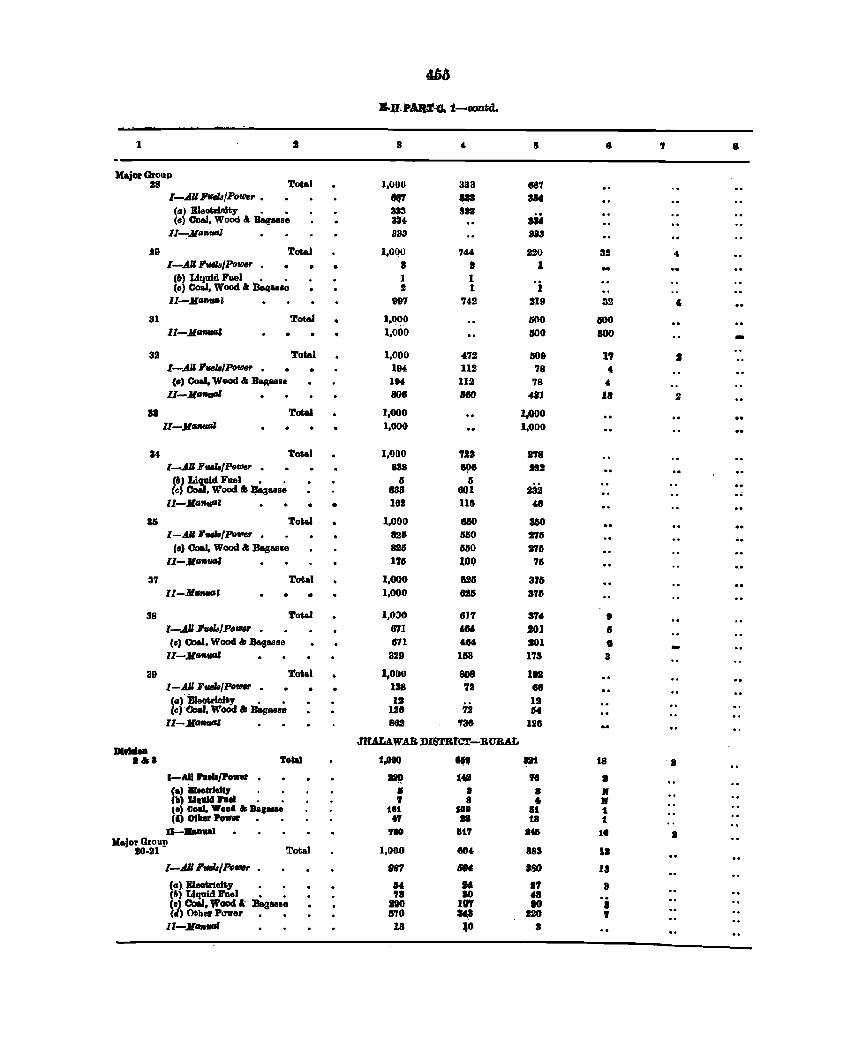
4&3
B.lI,PA.ar.:o. 1-00Dtd.
'I 8 " IS • ., • Major Groap
18 Total l,OO() 333 881 1-.dU I'fIIlaIPofllCr 0 • ~ 3N
(III) E1eotrilllty • 0 33:1 388
'" (c) OoaI, Wood & Bag&lao 334 11-:8111 .... 1 833 3113
J9 TotaJ l,OQO 144 120 32 4 l-.AIIHweIIJ/Porosr • • 8 I J -fl) Liquid Jl'uel 0 0 I 1 OJ (c) Cos.l, Wood a: ~ ... a 2 1 II-MIIBtlIIt 1197 742 SI9 32 ,
31 Total I,~OO 1500 4100 11-JlllfIUIJI 1,000 MO 100 -
32 Total 1,000 471 !J09 17 • l-AlIl'wlIIlPofD6r • 19' 112 78 , (0' Coal. Woad &I B~asle 194 112 78 4-
II-Jltmulll 801 .80 "III 11 2
81 Total 1,000 1,000 I1-Jl~ 1,000 1,000
34 Toul 1,000 !SI 178 l-AJI Fuala/PlJrosr 0 838 8!l8 !at
(6, It:S:d Fllel 0 • 5 I) (G). , Wood &: __ 3use 838 801 232 ..
11-110""'" • • 18. 118 48
3IS To"" 1,000 8IJO 3&0 I-AUHueIIJ/Po_ • 8211 550 276 ..
fo, Coal, Wood &I BagllBle 8211 11110 171l Il-Jl-IIIIJI 1711 101) 711
37 Total 1,000 815 376 11-1I_~ 1,000 Ull 3711
38 Total 1,030 617 374 " l-.AIIIU#JI.,/PDu/u • 671 4M to) 6 (II) Coal, Wood ar &osaus 871 &8, 101 t -11-MGfIIIi/JI 329 1~ 113 3
39 Total I,OUO 808 In I-AU 1_11'0_ • 138 71 18 (II) Eteot.rlo:lty • • 12 UI (c)'OoaI, Wood '" Bagasse 128 72 H
11-Jl-' 86t 738 1118
JRALAWAR DISTBICl'-RURAL D1 ...... ••• lolal 1_ "If 811 18 a
I-AU Paell/Po_ . ~ t_
" • fa, .... ttl,,",. IJ 8 8 I( 11) U,lIkt Pael • • , 8 • I(
(I) Coal, W.o •• Ba ..... 111 108 It 1 (I) OIlIer Power 0 •
.., n 18 1 11-.... no 11' a. 1. a
Major Groll!! Total I,OOD toO" 883 II 10·21
I-8.l'_IPoflltlr 987 iJfN ISO .13
(IJ).JUeokioit.y 114 " ., 3 (ll) 'LIquid Ji'tiel • • '3 SO " 'i (crColJ, Wood" Bagae8e J90 1'" 10 (d) ()t;her P1)W8J' • • 8'70 ~ 120 ,
11-11""'" 13 .0 •
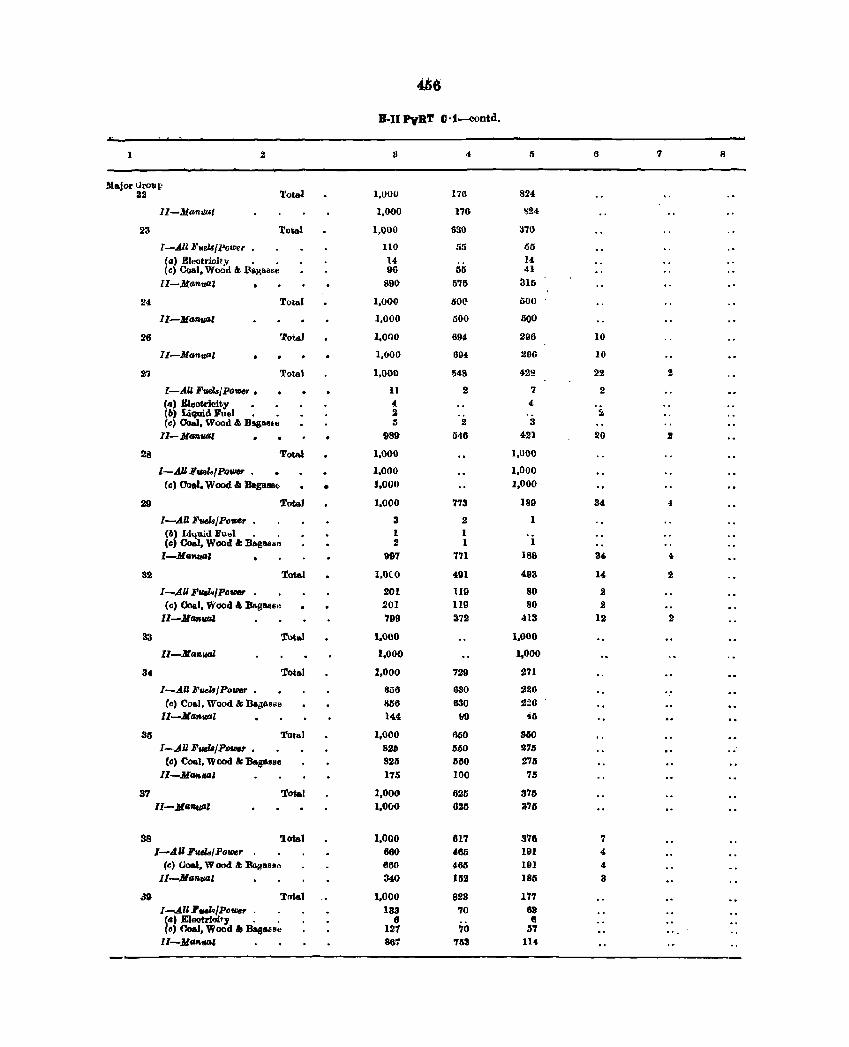
456
B·I1PyRT (l·t~ontd.
2 II .. I> 6 7 R
Major tJroll (-22 l'otal I,UOO 17(l 824
ll-Manll,Ul 1,000 176 ~24
23 Tob,.1 1,OUO 630 310
I-AlIli'ueU/power • no 55 65
(a) Eleotrioit.v • • 14 14 (c) Coal, Wood alE· ~&II,.sse 00 55 41
lI-ManuaZ 890 575 ~15
24 Total 1,000 DOl' 500
II-MfJnuQl 1,000 500 600
28 Tot~J 1,000 694 298 10
lI-MfJnual 1,000 694 296 10
!7 Total 1,000 1)48 429 22 2
I-AU Fuds/power , 11 .2 7 .2 (II) Eleotricity 4 4 (/.I) Liquid ).I'uel • • 2 2 (c) Coal, Wood &. D~IMI'e 5 2 3
Il-Manval 989 546 421 20 :I
2S Total 1,000 1,000
I-AUFuoL,PolJJCr • 1,000 1,000
(c) Ooal, Wood" BagIlBBe • 1,000 1,000
29 Total 1,000 773 189 34 .. I-AIlFuehJPo,,", . 3 2 I
(/.I) Liquid Fuel . . 1 1 Cc) Cosl, Wood I: BagaagA 2 1 I
I-MfI»wU 997 771 188 34 4
32 Total 1.0(0 4.91 493 14 2
I-AU Fuels/Po_ 201 lUi 80 2
(c) Ooal, Wood" Da.g886tl 201 no 80 2 II-MtmvaZ 799 372 ~13 12 .2
33 'totllol 1,000 1,000
lI-Manuol 1,000 1,000
301 'total 1,000 729 ~71
I-All Fue.l6/Po'lller • 1:);;6 630 '26 (c) Coal, Wood &; Da~a8He 856 630 ~:!6
II-Man'UGZ 144 ~9 45
35 TOtal 1,000 1160 3150
I--AU Fuel8/PIJ_ 82b UO ~7lS
(c) Coal, Wood &: EaSMac 825 5150 275
II-MGnIlGI 175 100 75
37 Total 1,000 625 375
II-Manual 1,000 025 lI75
38 'lots] 1,000 817 376 '7 I-All FlAw/Power 660 465 101 4
(~) 0061, \V oDd '" Bat"sese 660 465 191 4 Il-MfJnual 340 1lI2 185 3
JG Tt'lta] 1,000 823 177 l-Arll' __ /Power. . 133 '70 6$ (II) Eleotrioi.y . . 8 II (8) (".oal. Wood" Bagaue 127 70 .57
II-Maft.ual 86': '753 114
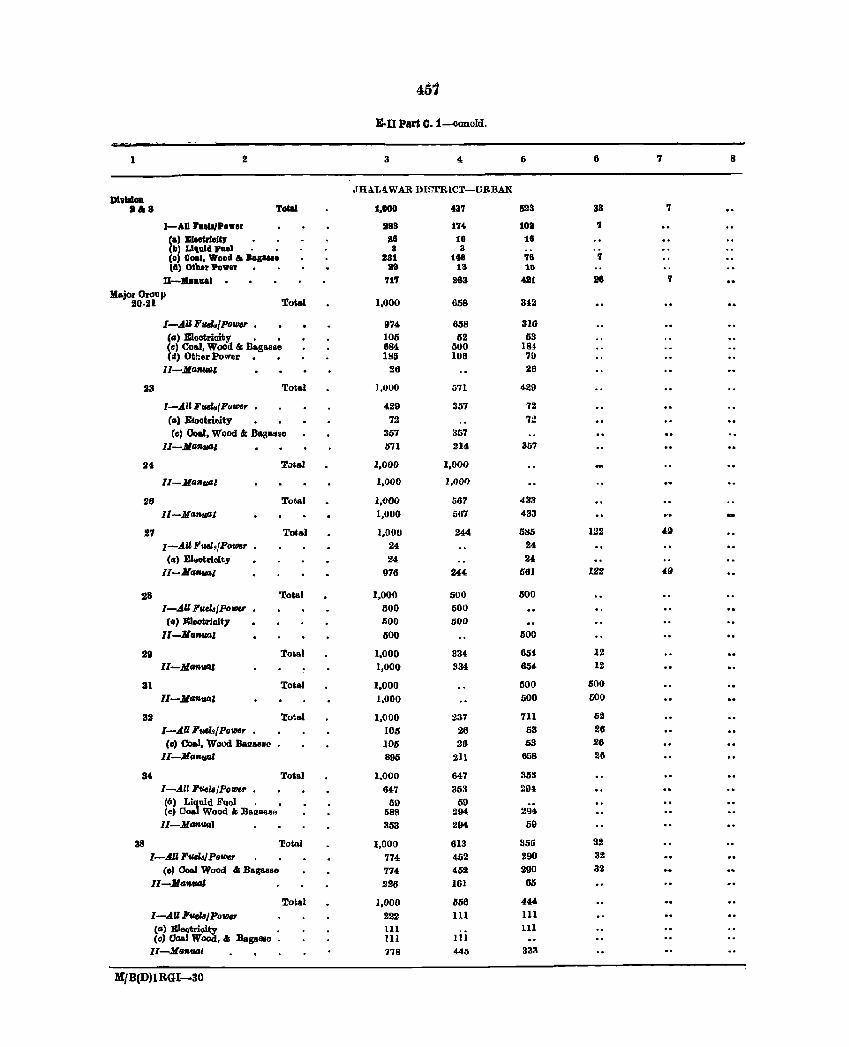
451
E·n Pari C.t-conoId.
1 2 3 4 I) 6 7 8
.rHAL!l W AR IH~;TR1CT-(J.RBAN Dl,III01l
I •• Tolal 1.000 437 &93 38 7
I-AU J'Il ..... 'ow.r 188 174. 1011 'I
Ca) Bleetrla", 88 10 18 (b) Ll'luld I'uel 3 3 (e) Gal., Wood •• I, ... a 231 148 78 7 (6) othu Power 1!8 ta 10
1I-lIIauuII 717 268 4.111 118 'I
MajorOroup 20·21 Total 1.000 658 3-12
l-AUFIMl.r/Pol/IB,. 974- 6.58 316
ell' Elootrioity • • 106 62 53 (c) eoll, Wood & Da.g.ua 884 500 18-1 (.i) Othor Power IS5 106 7()
11-MII_, 26 26
23 Tot ... 1,000 Ii'll 429
I-AZlFudalPower • 429 3m 72 (II) EIBctri~ity 72 7:!
Cc) Coal. Wood &: Bagasso 357 357 11-.J/GffltlJl 571 214- 357
2' T.J~al I,oao 1,000
U-.JLa'llUJ&1 1,000 1,(01)
26 Total l,()OO 567 433 Il-,MII'Ilu.a1 1,000 5117 433
27 Tot.a.1 I,OOU 244 5~5 122 49
I-Ai' FUIl./PolD8r 24 24 (Il) EI"otricity 24 24 II-N_l 976 2'" 661 IZZ 49
28 Total 1,000 500 liOO
I-AU Fuela/PoVIU • 500 500 (ot' JIlIeotrlcit1 500 500
II...Jllln1l61 liOO 500
2D TOLal 1,000 334 65i 12
II-M_' 1,000 ::134 654- U
31 Total 1,000 500 500
II-JlGnuPZ 1.000 500 GOO
32 To~al 1,000 237 711 52
I-.d.lll'tIAls/Po'lftr 105 26 53 26 (c) Coal. Wood Ba2aeae 106 26 53 26
Il-Manu,aZ 890 211 658 2B
34 Total 1,000 647 353
I-Alll'UeIB/Po'lllef' 647 853 ~9i
(6) Liluid Fuel . • 39 59 (e) 00. Wood Ie BalEaoee 588 294 2\14
II-MII,"",I 353 294 59
38 Total 1,000 613 355 82
I-.&U FtUl8/ PI)fJ1Cr 774 452 290 32
(0) Ooal Wood &; Ba.I;&SS8 774 452 290 32
II-MG'IMIGl 226 161 65
Total 1,aOO 1156 444-
I-AU Push, Po IOU' 222 111 III (II) Eleotrioity 111 111 (c) Coal Wood," BagallSe 111 IH
Il-MIIA_I 778 445 333"
H/B(D) lRGI-30
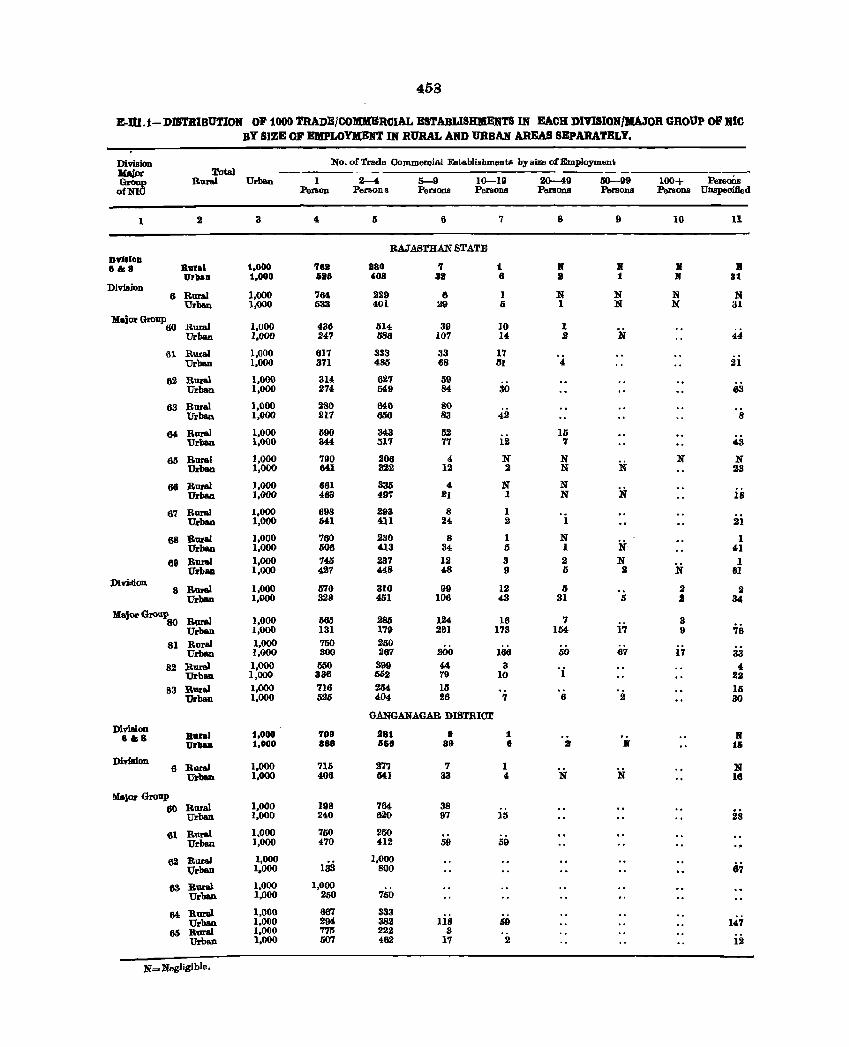
458
E-1tJ .1- DISTRIBUTION OF 1000 TRADE/OOlOlERCIAL ESTABLISHMENTS IN EACH DIVISIOH/MAJOR CROUP oP HIe BY SIZE OF EMPLOYMENT IN RURAL AND URBAN AREAS SEPARATELY.
Division No. of 1'rade Commercial Establishments by size ofEmpJoymen1; IIlAJPr Total GrouS Rural Urban 1 2---4 ~ 10--19 2(J-..49 ~1I9 100+ Penoru.
ofNl PerBOIl Persons Persons Persons Persons Persons Persons Unspeoified
1 2 3 4 5 6 7 8 II 10 11
RAJASTHAN STATE D",.loD 8&8 Bunl 1,000 '1611 1180 'I' t • • • • UrbaD 1.000 &16 408 alii 8 I :I • 81 Dimion
6 Rural 1,000 764 229 6 1 N N N N Urban 1,000 533 401 29 Ii 1 N N 31
'MajOl' Group Rural 1,000 436 614 39 10 1 60 if Urban. 1.000 247 086 107 14 2 44
61 Rural 1,000 617 333 33 17 Urban 1,000 371 485 68 51 4 21
62 Rural 1,000 314 627 59 Urban 1,000 ~!7' 549 84 30 i3
63 Rural 1,000 280 640 80 42 Urban 1,000 217 6IiO 83 8
64 Rural 1,000 690 343 52 15 Urban 1,000 344 .517 77 12 7 4,3
65 Rural 1,000 790 206 4 N N N
N N Urban 1,000 641 322 12 2 N 23
66 Rural 1,000 661 335 4 N N N Urbao 1,000 468 49'1' !1 1 N is
67 Rura.l 1,000 698 293 8 1 Urban 1,000 641 411 24 2 1 21
68 Rura.l 1,000 760 230 8 1 N N 1
Urban 1,000 606 413 34 I) 1 41
88 Rural 1,000 745 237 12 3 2 N N
1 UrblllJ 1,000 427 448 48 II I) 2 61
Dlvi>lion Rura.l 1,000 570 310 98 12 5 2 8 2 Urban. 1,000 328 451 106 43 31 5 I 34
HajorGtoup Rpral 1,000 560 286 124 16 7 3 80 Urban 1,000 131 179 261 173 1M 17 9 76
81 Rural 1.000 750 250 Urban. 1,000 200 267 200 166 00 67 I7 33
82 Rural 1,000 550 3119 44 3 'i 4 Urb8ll 1,000 336 562 79 10 22
83 Rura.l 1,000 716 2ii4 15 15 Urban. 1,000 526 404 26 7 6 2 30
GANGANAGAR DISTRICT Diviiion
Baral 1,000 '109 S81 • 1 • &;. • VrllaD 1,000 88B 1160 a9 6 3 • 16
Di-riaion R-oral 1,000 715 27'1 7 1 N 6 'N N U:rbaa 1,000 408 541 33 4 16
l\{aJOI' Group 00 Rural 1,000 198 764 38
Urban 1,000 240 620 97 15 28 61 Rural 1,000 750 250
Urban 1,000 470 412 59 59 ... 62 Rural 1,000
133 1,000
67 Urban 1.000 800
63 Rural 1,000 1,000 7iso Urban 1,000 250
64 RmaI. 1,000 667 333 Urban 1,000 294 382 118 69 147
M RturaI 1,000 775 222 3 Urban 1,000 507 482 1'1 2 12
N=Negligible.
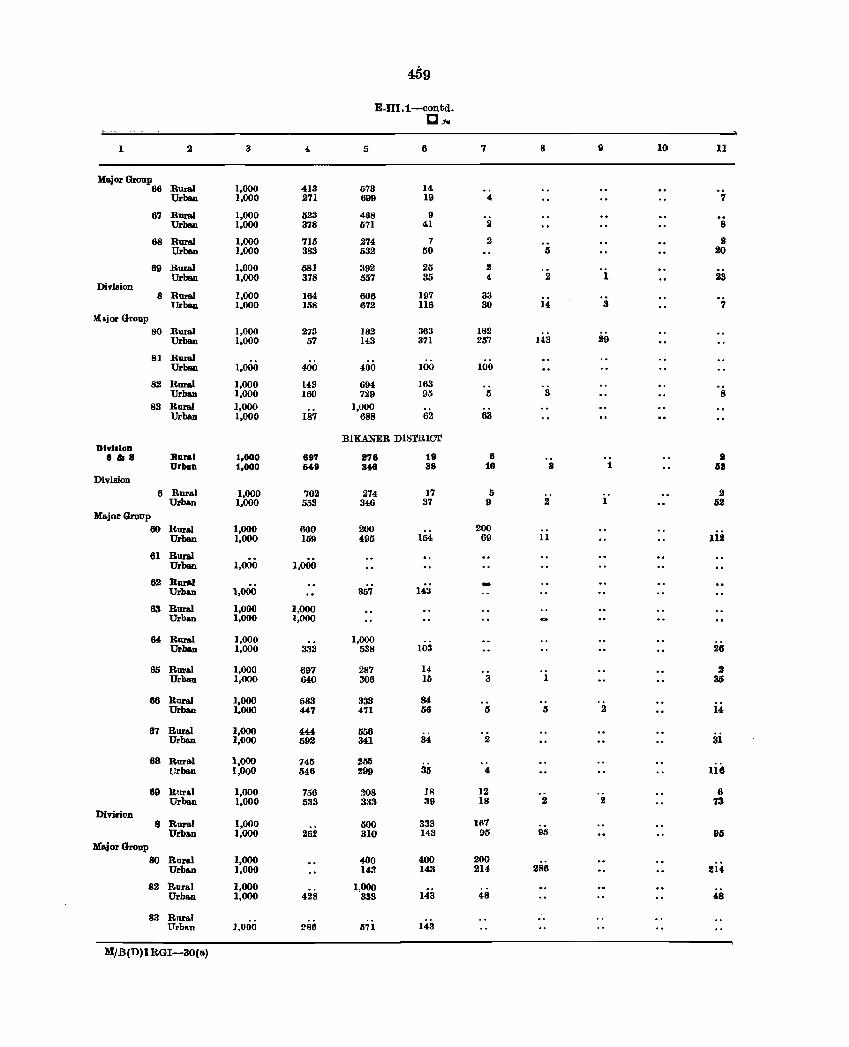
459
E-I11.1-contd_ C.Y.
1 2 3 4 5 6 7 8 9 10 11
Major Group 66 Rural 1,000 413 573 14
Urban 1,000 271 699 19 4 7
67 Rural 1,000 523 468 9 Urban 1,000 378 571 41 2 8
68 Rural 1,000 716 274 7 2 2 Urban 1,000 383 532 50 6 20
69 Rural 1,000 681 392 25 2 Urban 1,000 378 557 35 4 2 1 23
Division 8 Rural 1,000 164 606 197 33
Urban 1,000 158 672 116 30 14 3 7
~biorGroup
80 Rural 1,000 273 182 363 182 Urban 1,000 57 143 371 257 143 29
81 Rural Urban 1,000 400 400 100 100
82 Rural ],000 l43 694 163 Urban 1,000 160 729 95 5 3 8
83 Rural 1,000 1,000 Urban 1,000 187 688 62 63
BIKMo'ER DISTRICT DlvlsloD
84G8 Bural 1,000 897 a78 19 8 a UrllaD 1,000 649 348 88 10 8 1 68
Division
6 Rural 1,000 702 274 17 6 2 Urban 1,000 553 346 37 9 2 1 52
Major Group 60 Rural 1,000 600 200 200
Urban 1,000 169 495 164 69 11 112
61 Ruml Urban 1,000 1,000
62 Rural Urban 1,000 85'7 143
63 R1U'a.l 1,000 1,000 Urba.n 1,000 1,000
64 Rural ],000 1,000 Urban 1,000 333 538 103 26
65 Rur&1 1,000 697 287 14 2 Urban 1,000 640 306 15 3 1 35
66 Rnral 1,000 583 333 84 Urban 1,000 447 471 66 5 5 2 14
67 Rural 1,000 444 056 3i Urban 1,000 592 341 34 2
68 Rural 1,000 745 205 35 Vrban 1,000 546 299 4 liis
69 Rur",1 1,000 756 ~08 lR 12 6 Urban 1,000 533 333 39 18 2 2 73
Division 8 Rura! 1,000 500 333 111'7
Urb&n 1,000 262 310 143 95 95 91J Major Group
80 Rord 1,000 4-00 400 200 Urba.n ],000 143 143 214 286 210&
82 Rural 1,000 1,000 Urban 1,000 428 333 143 48 48
83 R11l'&1 Urbltn 1.000 286 571 ]43
M/B(D)1 RGI-30(&)
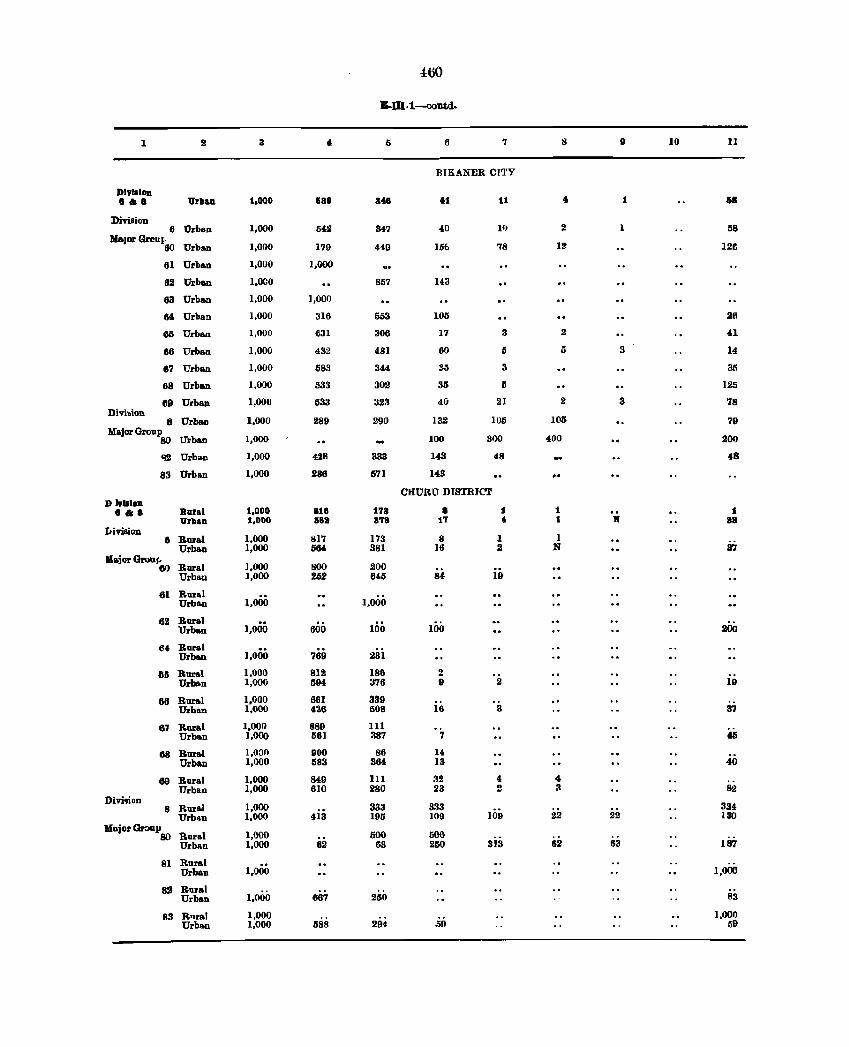
460
E-m·1-oontd.
1 2 3 I) 6 7 8 9 10 II
JlTKANER Cf'l'Y
DI"IIIIIII ••• 11rll&1I. 1,000 1138 34. 4t 11 .. 1 68
Division 6 Urban 1,000 54,lf 347 4,0 11) 2 58
lIrIalor Greu 1. 60 Urban 1,000 179 4:19 Uti 18 12 12&
61 Urball. 1,000 1,000
82 Urban l,oeO 857 143
83 Urban 1,000 1,000
M Urban 1,000 316 !la3 105 26
65 Urban 1,000 1331 306 17 :I 2 41
66 Urban 1,000 432 481 60 5 5 3 14
67 Urban 1,000 583 344 35 3 31l
68 Urban 1,000 533 302 35 5 125
69 Urban 1,000 533 323 40 21 2 3 78 DivibjOIl.
8 Urban 1,000 289 290 132 105 105 79 Major Group
80 Urbao 1,000 100 300 400 200
~ Urban 1,000 428 333 143 48 48
83 Urban 1,000 286 571 143
ORonU DTSTRIC'l' D "1I.on
e •• Bural 1,000 818 173 8 1 1 1 Urbaa 1,000 582 378 17 .. 1 B 38
I1iviaion 8 Rural 1,000 817 173 8 1 1
Urban 1,000 5M 381 16 2 N 3; Major GruUf.
],000 BOO 60 Rural 200 Urban 1,000 252 64,5 84, 19
61 Rural Urban 1,000 1,000
62 Bural 1,000 Urban 600 100 100 200
~4 Rural Urban 1,000 769 231
61S Rural 1,000 812 18& 2 iii Urban l,QOO 594 376 9 2
68 Rural 1,000 661 339 U~bom 1,000 4as 508 16 3 37
61 Rural 1,000 889 111 Urban 1,000 581 387 7 to
68 Bural 1,000 900 86 U Urban 1,000 583 364 13 40
69 Rural 1,000 849 111 32 .. 4 Urban 1,000 610 280 23 :1 ~ 82
Divi.ion 8 Rural 1,000 333 333 334
UrbAn 1,000 413 195 109 109 22 22 130 }{ajorGroap
Ihral 1,000 500 500 80 Urban 1,000 82 63 250 313 62 63 187
81 Rural 1,000 Urban 1,000
82 B'lr.1 Urban 1,000 667 250 83
83 R',ra] 1,000 1,000 Urban 1.,000 588 294 59 59
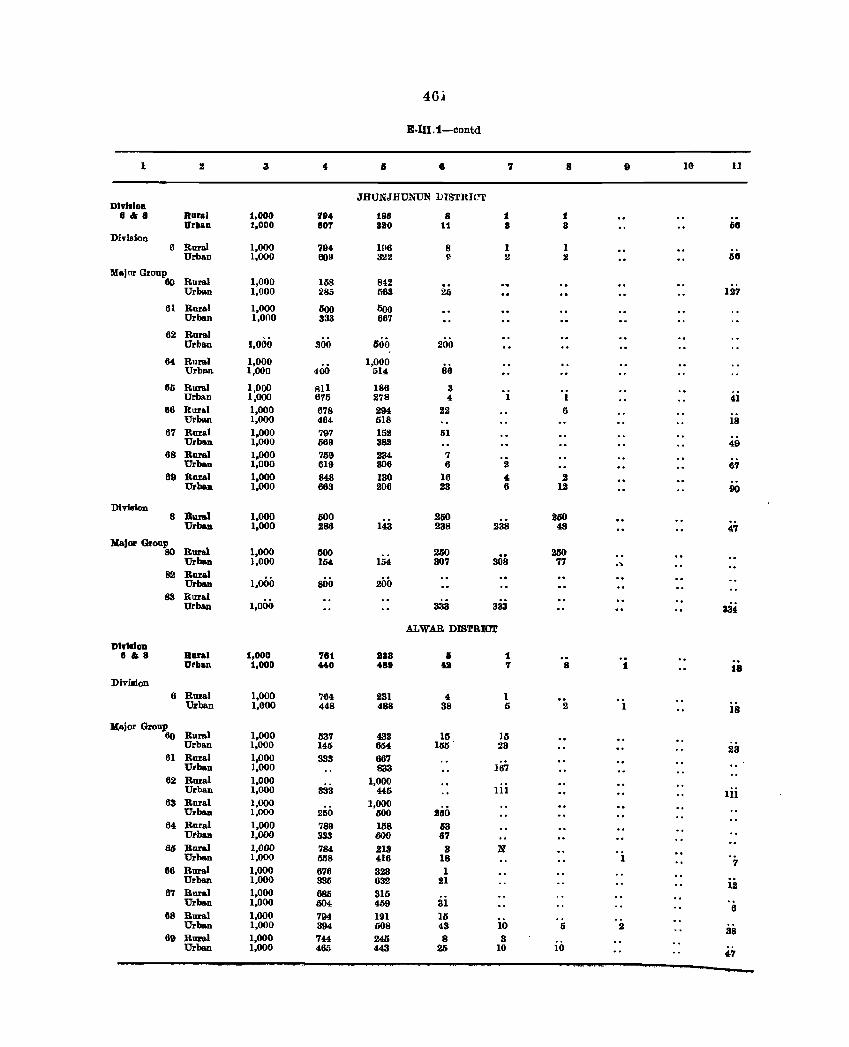
4(j"
E·nl.1-contd
1 2 3 4 15 8 7 8 9 10 11
JHUNJH1Thi'UN DISTRICT Dlyl.loB.
8 .. 8 Raral 1,000 '194 198 8 1 1 Urllan 1,000 80'7 8110 11 3 8 i8
Division 6 RaraJ 1,000 794 l!16 8 1 I 68 Urban 1,000 1lO9 322 II 2 2
Major Gronp 60 Rural 1,000 158 842 ..
Urban 1,000 285 1\63 26 127
61 Rura! 1,000 500 500 Urban 1,000 333 667
62 Rural 500 Urban 1,000 300 200
64 Rural 1,000 1,000 Urban 1,000 400 514 86
65 Rura.l 1,000 fill 186 3 4i Urlmn 1,000 675 278 4 1 1
66 Rural 1,000 678 294 22 6 Urban 1,000 464 518 18
67 Rural 1,000 797 152 61 Urban 1,000 569 382 49
68 Rural 1,000 759 234 7 Urban 1,000 619 306 6 2 67
69 Rural 1,000 848 130 16 4 2 Urban 1,000 663 206 23 6 12 90
Divilion 8 Rural 1,000 500 250 2110
Urban 1,000 286 143 238 238 48 47
Major Group Rum}. 250 250 80 1,000 GOO
008 Urban 1,000 154 154 307 77 ... 82 Rural
sOO Urban 1,000 200 83 Rural
1,000 333 Urban 333 334 ALWAR DIS'lRICT
VI"I'lon 8 '" a Baral 1,000 781 888 Ii 1
Vrllan t,OOO 440 489 411 7 a 1 fa Divwon
6 Rural 1,000 764, 231 4 1 Urban 1,000 448 488 38 5 2 1 18
Major Group Rural 1,000 15 15 60 1537 433 Urban 1,000 145 664 155 23 23
61 Rural 1,000 333 667 Urban 1,000 833 167
62 Rural 1,000 1,000 Urban 1,000 833 445 111 Iii
63 Rural 1,000 1,000 Urban 1,000 250 600 260
64 Raral 1,000 789 158 63 Uthan 1,000 333 600 87
66 Rural 1,000 784 21S S N Urban 1,000 558 416 18 1 7
66 Rural 1,000 676 323 1 Urban 1,000 335 632 21 III
67 Rural 1,000 685 315 Urban 1,000 604 459 31 6
88 Rural 1,000 794 191 16 Urban 1,000 394 508 43 10 5 2 38
69 Rural 1,000 744 245 8 3 Urban 1,000 485 443 25 10 10
4'7
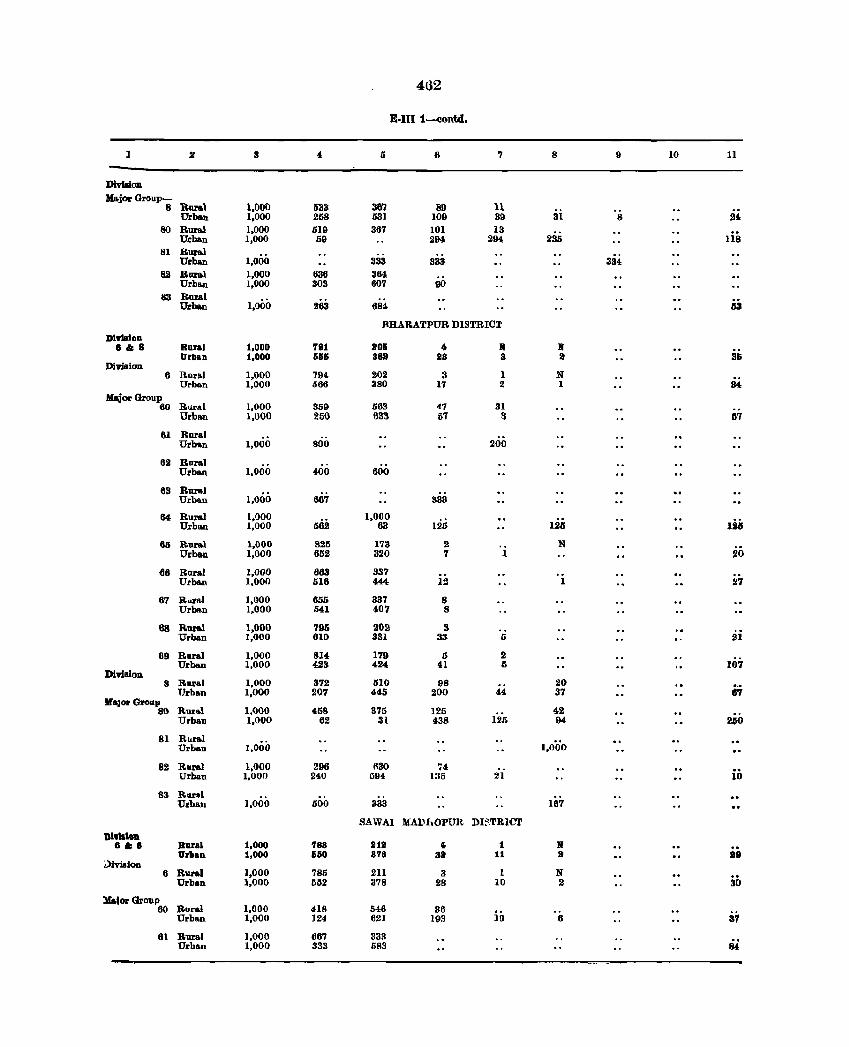
462
E·III 1-contd.
I :I 3 4 5 6 7 8 9 10 11
Divt.ion Major Group-
8 Rural 1,000 1133 36? 89 11 Urban 1,000 258 531 109 39 31 8 2'
80 Ruml 1,000 1i19 367 101 13 Urba.n 1,000 1i9 294 294 235 US
81 Ruml 334 Urba.n 1,000 333 333
82 RlIl'&l 1,000 636 364 Urba.n 1,000 303 607 90
83 Rural Urba.n 1,000 263 68' 53
J\HARATPUR DISTRICT DI .... lon
• III 8 Rural 1,000 '191 206 4 K K Urilin 1,000 556 saa liS a a 36
Dhriaion 8 Rorll.l 1,000 794 202 3 1 N
Urba.n 1,000 566 380 17 2 1 34 Major Group
60 Rlll'ai 1,000 359 56.'l 47 31 Urban 1,000 250 633 67 ~ 57
61 Rural Urblon 1,000 800 200
62 Rural Urban 1,000 400 600
63 RurR,1 Urba.n 1,000 867 333
84 Rural 1,000 1,000 126 Iia Urban 1,000 682 63 12ti
65 Rural 1,000 825 173 2 N Urban 1,000 652 320 7 1 :10
66 Raral 1,000 683 337 Urban 1.000 516 444 12 1 27
67 R"ra.J 1,000 656 337 8 Urba.n 1,000 541 407 8
88 Rural 1,000 795 202 3 Urba.n 1,000 610 331 33 5 21
89 Rllral 1,000 814 179 Ii 2 11)7 Urba.n 1,000 423 424 41 Ii
DlvlBion 8 Rural 1,000 372 510 98 20
67 Urban 1,000 207 445 200 44 37 MaJor GrollP
SO Runl 1,000 468 375 125 42 Urban 1,000 62 31 f38 125 94 2&0
81 Rural 1,000 Urba.n 1,000
82 Rural I,QOO 296 1130 74 io Urban 1,000 240 594 135 21
S3 Rlllal 1,000 Urbatl 1i00 333 187
SAWAI MAl)f,OPUR DI:'>,TRICl'
DI'lIlo1l .11;. Rural 1,000 7S3 212 , 1 If Orllan 1,000 650 878 88 11 a 98
J)ivillion 6 Rural 1,000 785 211 3 1 N
30 Urban 1,000 552 378 28 10 2
Malor Group 60 Rural 1,000 418 546 36 37 Urba.n 1,000 124 fl21 193 19 6
61 Rural 1,000 867 333 Iii Urban 1,000 333 1i83
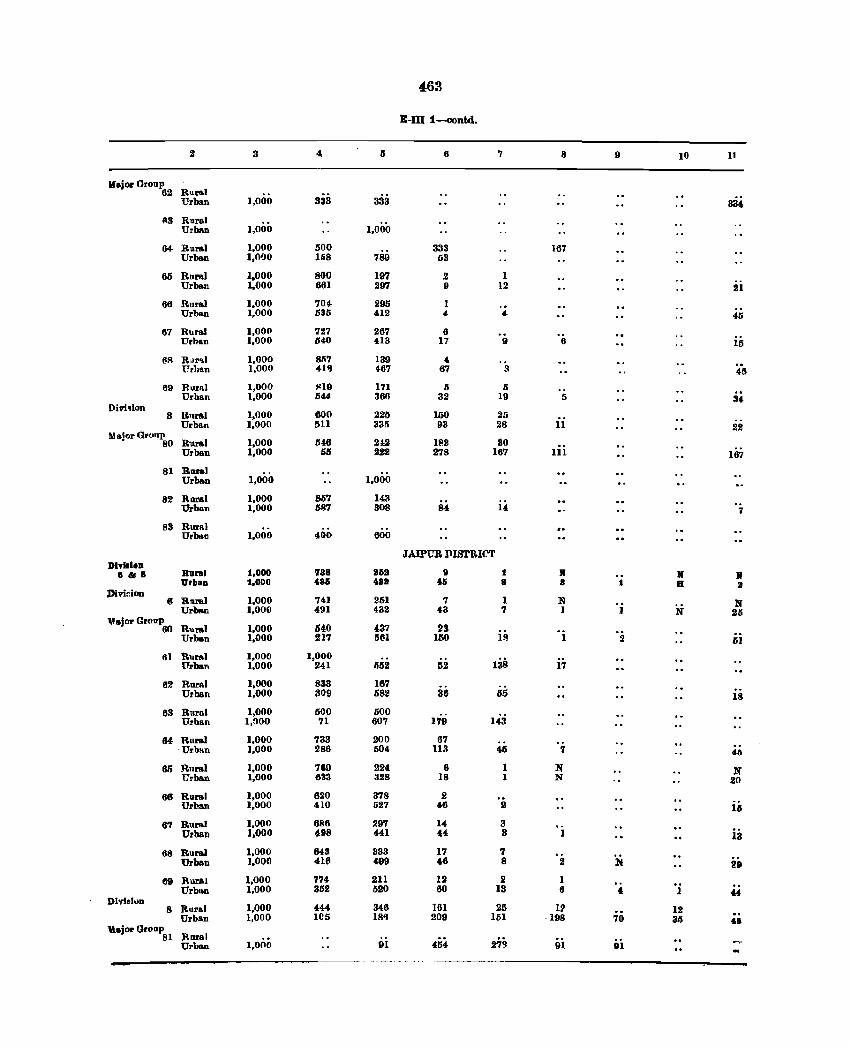
463
E-1I1 1-contd.
2 3 4 Ii 6 7 8 9 10 11
lIajor Oroup R .. ra.1 62
333 333 Urban 1,000 334,
113 Rural UrbAn 1,000 1,000
64- Rural 1,000 500 333 167 Urban 1,01)0 158 789 53
65 Roml 1.000 800 197 .2 1 Urban 1.000 661 297 9 12 111
66 Rl1ral 1,000 704- 295 1 " Urban 1,000 635 4,12 4 4 45
67 Rural 1,000 727 267 6 Urban 1,000 1140 413 17 9 6 15
6R R,'r'!.1 1,000 8(;7 139 " "Prl)9.n 1,000 41~ 467 67 :l 45
69 RUIl) 1,000 ~19 171 5 Ii Urban 1,000 644- 300 32 19 5 34-
Divhion 8 Bnral 1,000 600 226 160 25
Urban 1,000 1nl 335 93 28 11 22 Ma;orGronp
1,000 646 2f,2 11ll.! 30 • 80 Rural Urban 1,000 1)5 222 278 167 III 167
81 RIDBI Urban 1,000 1,000
82 Rmral 1,000 857 14.'J Urban 1,000 587 308 84, 14 7
83 RurR) Urban 1,000 400 600
J.AIPUR llISTRICT DlvllluD
73S 1168 1 8&8 Bural 1,000 9 If N If Urban 1,000 Uli 481 1& 8 8 1 B It
J>ividon Rllml 1,000 741 251 7 1 N 6 N Urban 1,000 491 432 43 7 I 1 N 25
""ajor Group 60 Rural 1,000 54,0 4,37 23
Urban 1,000 217 561 150 IS I 2 51
6] :tt.ural 1,000 1,000 138 tTrban 1,000 241 552 52 17
62 Rural 1,000 833 167 Urban 1,000 809 582 36 55 18
6'"J Rural 1,000 500 500 170 Urban 1,000 71 607 148
64 Rllral 1,000 733 200 67 -Urban 1,000 286 504 lI3 45 7 46
60 Hural 1,000 760 224, 6 1 N N Urban 1,000 633 328 18 1 N 20
68 Rural 1,000 620 378 2 Urban 1,000 410 li27 46 2 iii
67 Rural 1,000 686 297 14 3 Urban 1,000 498 441 44- 3 1 13
68 Rural 1,000 643 333 17 7 Urban 1,000 41(1 499 46 8 2 N 29
69 Rural 1,000 7'" 211 12 2 1 Urban 1,000 352 520 80 13 6 • 1 44-
Dlvldun 1,000 444 348 161 25 l!J 8 Rllral 12
Urban 1,000 lC5 1841 209 151 -198 70 35 46 llajor Orollp
Ruel 81 27~ Urban I,OnO 91 45" 91 In
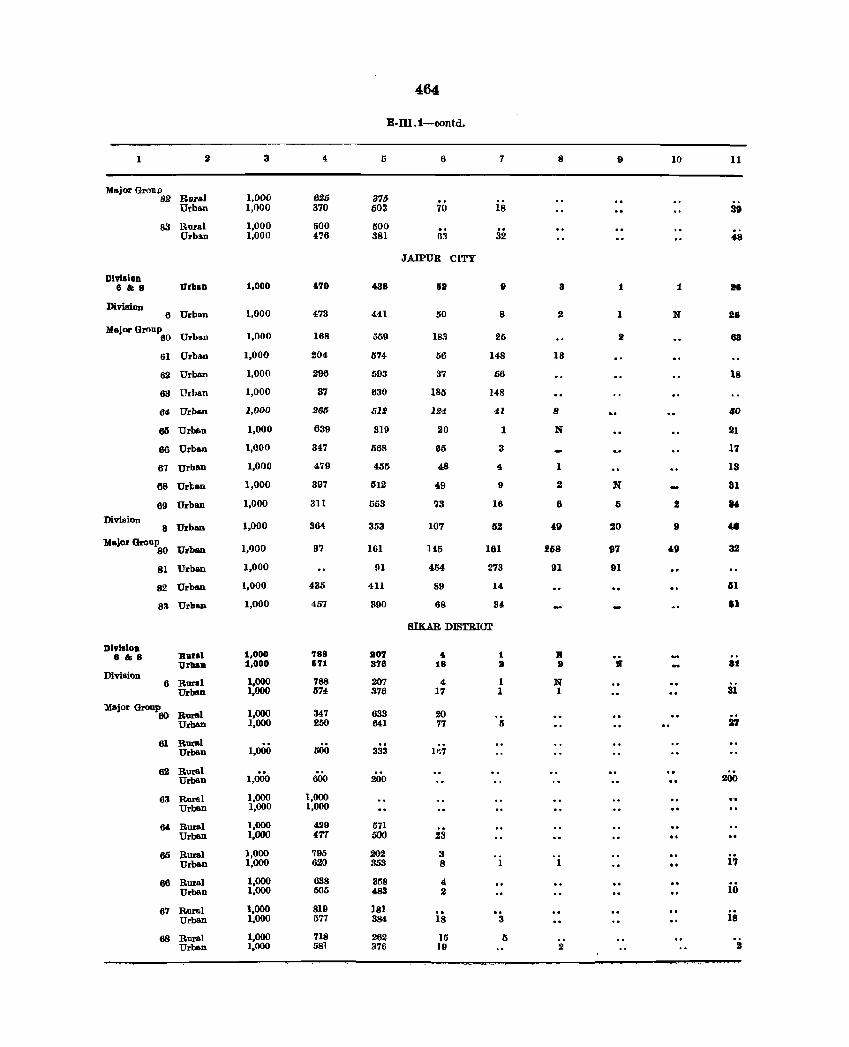
1
'Major Grnnp 82 RuraJ
Urbll.n
Division 8 & 8
Divisi.ln
83 Hurd Urban
Urban
6 U~baD
Major Groop 60 Urb .. n
61 Urban
62 Urban
63 Urban
64 UrbAn
6Ii Urbllon
66 Urban
67 Urban
68 Ur1;.n
69 Urban
S Urban
Major Group 80 Urban
Division 8 .. 8
DiviBioo
81 Urban
82 Urban
SS UrlDan
Bural Urllan
6 R1J1'IIl Urban
Major Group 60 Rural
Urban
61 Rural Urban
82 Rural Urban
63 Rural Urban
M Rural Urban
6Ii Rural Urban
66 Rural Urban
67 Rural Urban
68 Rural Urban
3
1,000 1,000
1,000 1,000
1,000
1,000
1,000
1,000
1,000
1,000
1,000
1,000
1,000
1,000
1,000
1,000
1,000
1,900
1,000
1,000
1,000
1,000 1,000
1,000 1,000
1,000
.. 1,000
1,000 1,000
1,000 1,000
1,000 1,000
1,000 1,000
1,000 1,000
1,000 1,000
620 370
500
"'6
fo'lO
473
168
204-
296
37
265
639
347
479
397
311
364
97
436
457
788 &71
788 574
347 250
500
600
1,000 1,000
429 4'17
795 620
638 506
819 577
718 581
464
E·III .1-oontd.
Ii
375 1i03
500 a81
488
559
574-
51l:!
630
liU
319
568
455
512
553
353
161
!II
411
390
6
70
113
JAIPUR CITY
&2
50
183
56
37
185
124
20
65
48
49
73
107
U5
454
89
68
7
18
32
9
8
25
148
66
148
4l
1
3
" I)
16
1i2
161
273
14
34
SIKAR DISTRI<Jl'
1107 378
207 376
633 641
.. 333
200
571 500
202 353
358 483
181 384-
262 376
4 18
" 17
20 77
Ifl7
23
3 S
4 2
18
15 19
t It
1 1
5
1
o. 3
I)
8
a
18
8
N
1
2
6
258
91
• a
N 1
1
2
9
1
1
2
N
Ii
20
97
91
..
10
1
N
9
49
11
39
48
21
211
63
18
110
21
17
13
31
14
11
II
a1
31
200
i7
io
is
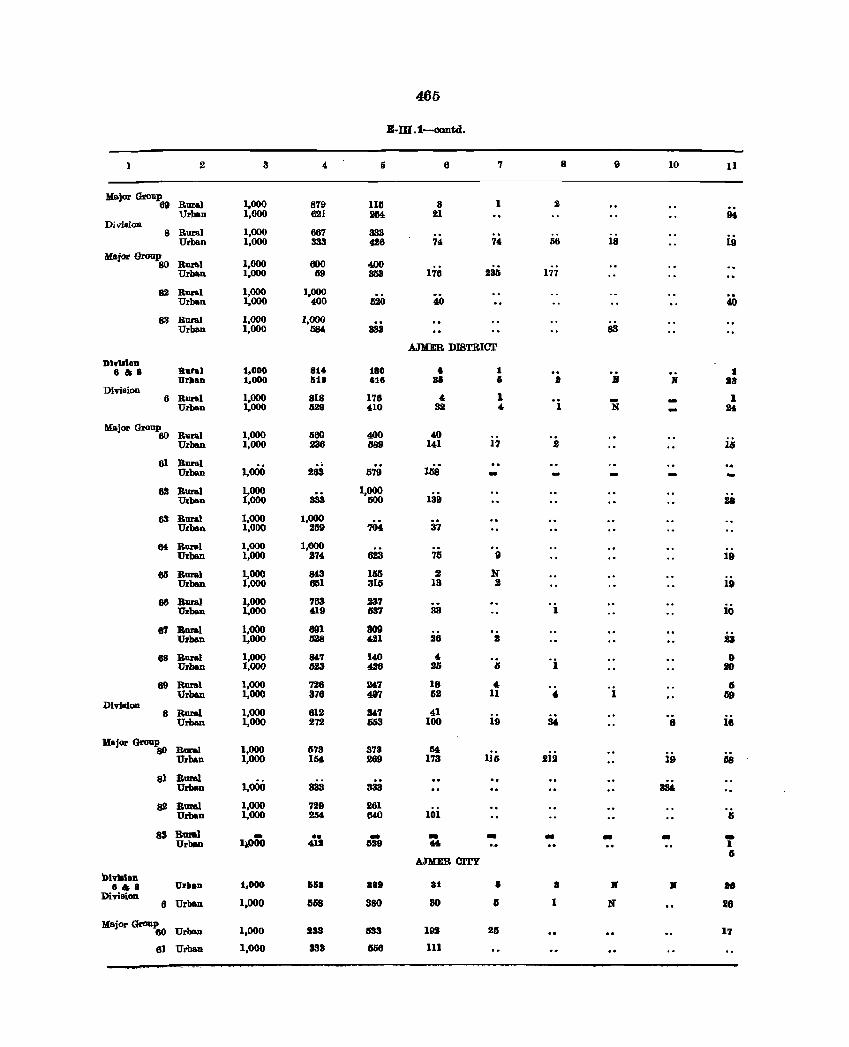
465
B-IU o1-oontd.
2 3 6 6 7 8 9 10 11
Major Group RlJMI 1,000 879 lUI 3 1 .2 69 .. Urban 1,000 621 264 21 94
Division 8 Rural 1,000 667 333
iii Urban 1,000 333 426 74 74 56 18
MajOJ." Group Rural 1,000 600 400 80 Urb&n 1,000 69 353 176 2311 177
82 Rural 1,000 1,000 Ml Urban 1,000 400 520 40
83 Rural 1,000 1,000 Urban 1,000 584 333 83
.AJlIER DISTRICl'
DlwbioD 8.' Rural 1,000 814 180 .. 1 t UrbaD 1,000 518 41e 811i 6 I If If 21a
Division I 6 Rural 1,000 818 176 ,
°i N I Urban 1,000 6211 410 32 " 24
MajOJ." Group Rural 1,000 660 4.00 .w 60
i.i Urban 1,000 .236 6811 141 17 .2
61 Rural o. 1,ss Urban 1,000 263 579 -
62 Rural 1,000 1,000 139 Urban 1,000 333 500 28
63 Rural 1,000 1,000 37 Urban 1,000 2511 704
64 Rural 1,000 1,000 Urban 1,000 274 623 75 8 19
60'> Rural 1,000 8t3 1M 2 N Urban 1,000 6111 3111 13 2 19
66 Rural 1,000 763 237 .. io Urban 1,000 419 537 33 1
67 Rural 1,000 691 309 is Urban 1,000 628 4.21 26 :a
68 Rural 1,000 8&7 140 " OJ D Urban 1,000 623 4.26 SO Ii SO
89 Rural 1,000 726 247 18 , II Urban 1,000 876 m 112 11 4. 1 119
Divillion 1,000 612 41 8 Rural 347 is Urban 1,000 272 603 100 19 34 6
Major Group Rural 1,000 673 373 M 80
Iii; 2ii 68 Urban 1,000 164 269 173 19
81 Rural 1,000 Urban 333 333 334
82 Rural 1,000 729 281 Urban 1,000 2M 640 101 II
83 Elial - •• .. .. .. .. - - -UrbsD I~OOO 412 6211 (4, 1 II
.A.JJmR CITY
DlwllloD. 8 ... Vlllan 1.000 6&8 88S a1 Ii 8 • If ••
Diviaion 6 Urban 1,000 1158 380 80 II 1 N 118
Major Group 60 Urban 1,000 233 533 192 25 17
61 Urban 1,000 338 &56 111
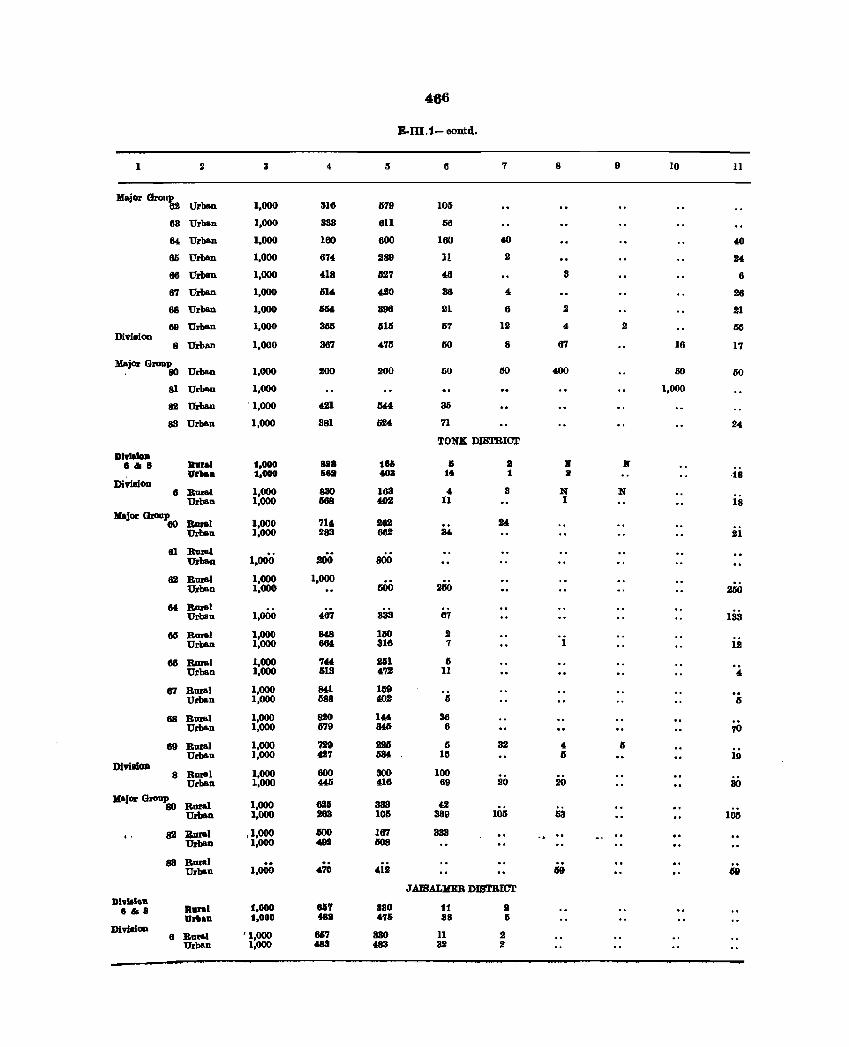
466
E.IlI.1- oontd.
1 2 3 5 (l 7 8 9 10 11
»ajer Group 62 Urban 1,000 316 579 105
68 Urban 1,000 333 811 56
64 Urban 1,000 160 8()() 160 40 40
65 Urban 1,000 674 289 I! 2 24.
66 Urban 1,000 4018 6J7 46 3 6
67 Urban 1,000 614 490 36 4 28
68 Urban 1,000 66& 896 21 6 2 21
IHI Urban 1,000 855 IUS 57 12 4 2 55 Di'riltion
8 Urban 1,000 387 475 60 8 67 16 17
lIIIojO,r GI'01IP . 80 Urban 1,000 200 200 50 50 400 150 60
81 Urban 1,000 1,000
82 Urban . 1,000 421 IS44 35
83 Urban 1,000 881 524 71 24
TONK DI8TRICT
0191110. SII8 8ura. :1,000 U8 lS6 I 8 X X
Vrlla. :1.000 lea 408 :14 :l a ·18 Di'rillion
880 163 8 N N 6 Bmal 1,000 4 Urban 1,000 1188 <lO2 11 1 18
HajO,r GIOUp B1U&l 1,000 71& 282 ~ 60 Urban 1,000 183 682 84, l!l
61 Bmal Urban 1,000 JOO 800
82 Rmal 1,000 1,000 .. Urban 1,000 IiOO 2liO 260
M Rur&l Urban 1,000 487 838 67 133
III Bural 1,000 N8 IliO .2 Urban 1,000 18& 316 7 1 12
e6 Bmal 1,000 744 2&1 & Urban 1,000 &13 0172 11 4
67 RDl'&1 1,000 84,1 169 Urban 1,000 588 (02 Ii 5
68 Bpral 1,000 820 1" 36 Urban 1,000 579 34lt 6 70
69 Rural 1,000 7J9 221 5 32 4 Ii Urba. 1,000 0127 634 Iii II 10
Divi.loa 1,000 600 300 100 8 Bnr&l
Urban 1,000 44li 416 69 20 20 30
.aJO,r Group Bmal 1,000 626 333 42 80 Urban 1,000 263 lOll 389 105 53 1M
82 :Bln'al ,~:= liOO 167 333 Urban 492 1108
83 B_1 1.000
.. Urban 470 412 119 119
JAISALMER DIBTRICT DI91111 ••
1,000 S&, a80 11 B ell8 •• ral Ur .. n :1,000 481 torS 88 Ii
Dividon Rnra.I '1,000 667 330 11 2 6 Urban 1,000 483 483 U .2
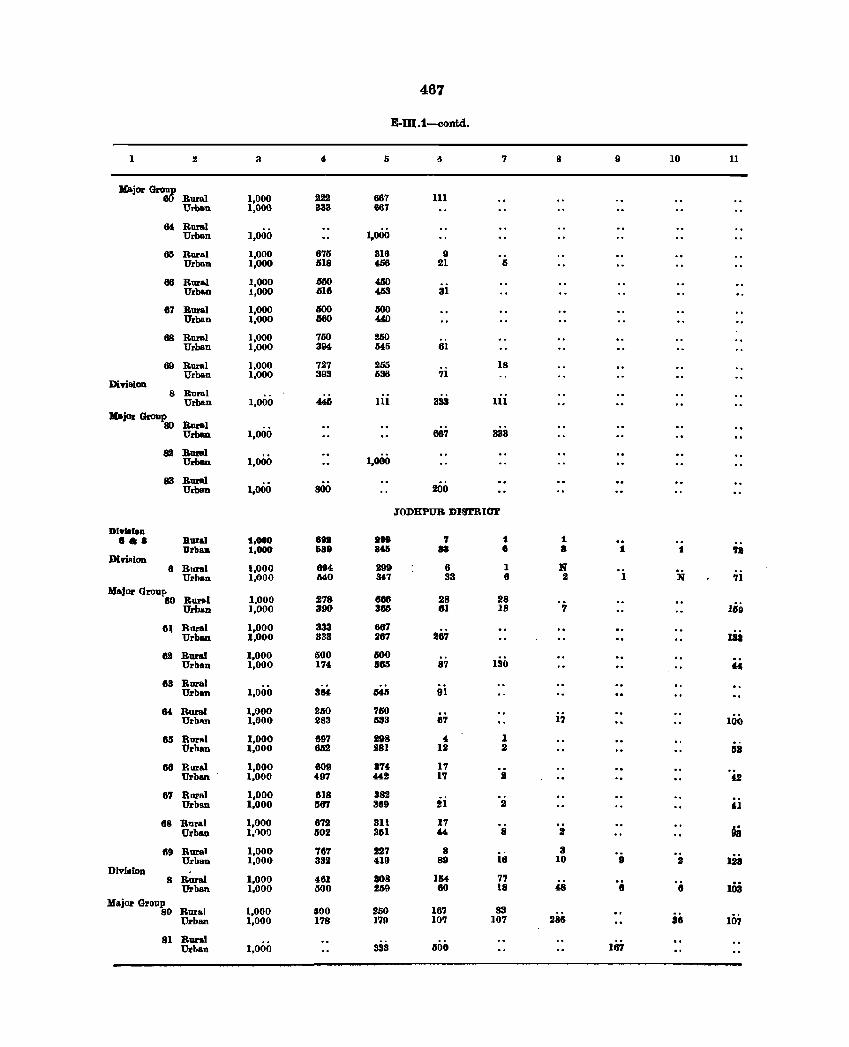
467
E-m .t-contd.
1 2 a 5 S 7 8 9 10 11
)[ajor Group 222 III 60 Rural 1,000 667
Urban 1,000 S3S 667
M Rural 1,000 Urban 1,000
GO Rural 1,000 6711 318 9 Urban 1,000 518 458 21 5
68 Rur&l 1,000 MD 400 Urba.n 1,000 lU6 4IS3 31
67 Rur&l 1,000 IlOO 500 Urban 1,000 060 «0
68 Rur&l 1,000 750 250 Urban 1,000 394 645 61
69 Rural 1,000 727 255 18 Urban 1,000 393 638 71
Di'rillion 8 Rural
Urban 1,000 440 111 333 III
Major Gronp 80 Rur&l
Urban 1,000 667 333
82 Rmel Urban 1,000 1,000
88 Rmel 200 UrbaD 1,000 800
JODHPUR DISTRIO'l'
DI"..loa •• 8 Bua. 1,000 8811 188 7 1 1
UrbaD 1,000 688 845 88 II 8 1 1 7t D1riRion
8 Bllral 1,000 894 299 8 1 N Urban 1,000 640 341 33 8 2 1 N 71
MajOl" GroUI-RUNI 1,000 278 866 28 28 80 '7 Urban 1,000 390 365 81 ]8 169 s_ Rural 1,000 333 4167
267 UrbGD 1,000 333 287 Iii 62 Rural 1,000 500 600
130 Urban 1,000 174 585 87 '4
63 Bural 3M Urban 1,000 Mti 91
M Bural 1,000 250 710 i7 Urban 1,000 283 1183 87 100
85 BurRI 1,000 897 198 4 1 Urban 1,000 852 281 12 II 113
68 Bural 1,000 809 3n 17 Urban 1,000 497 442 1'1 ! 42
67 BorBI 1,000 818 382 ., UrbaD 1,000 1187 389 21 2 fl
68 B!1ral 1,000 872 311 17 Urban 1,000 602 3111 44 8 2 93
69 Bural 1,000 '187 227 8 3 Urban 1,000 332 419 89 16 10 It II liia
DividioD 8 Bural 1,000 481 808 154 71 'Ii Urban 1,000 500 259 80 18 48 8 103
Major Group 1,000 500 250 18'1 83 80 Rural
Urban 1,000 178 179 10'1 107 286 38 107
81 Bural Urt .. n 1,000 333 1100 187
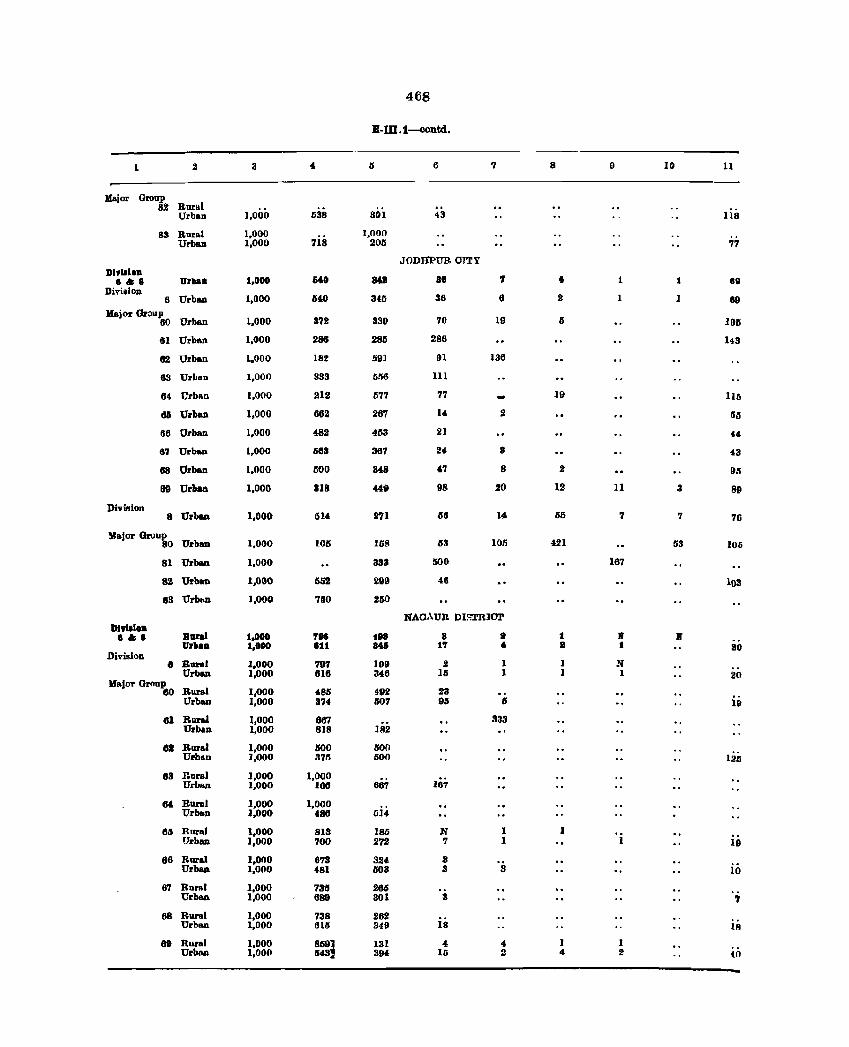
1 2
Major Group 82 Burlll
Urban
DlvlllDD 1&8
Divi~lon
83 Rural Urban
Drll ••
6 Urblldl Ibjor Group
60 Urban
61 Urban
82 Urban
83 Urhon
64 Urban
d6 Urban
116 Urban
61 Urban
68 Urban
89 Urban
8 Urban
Major Group 80 Urbao
DlwIIlolI 8118
Division
81 Urban
82 Urban
83 Urbbn
B1Iftl DrbaD
a B1Ift1 Urban
Majol' Group 60 Bural
Urban
61 BDrM Urban
6111 Bural Urban
83 Rural Urban
" Burlll Urlmn
ISlI Rural Urban
68 Ru ... l Urban
67 Rural Urban
68 Rural Urban
6t Rural Urban
3
1,000
1,000 1,000
1,000
1,000
1,000
1,000
1,000
1,000
1,000
1,000
1,000
1,000
1,000
1,000
1,000
1,000
1,000
1,000
1,000
l,oeo 1,000
1,000 1,000
1,000 1,000
1,000 1,000
1,000 1,000
1,000 1,000
1,000 1,000
1,000 1,000
1,000 1,000
1,000 1,000
1,000 1,000
1,000 1,000
li38
6'0
560
312
286
182
333
212
662
482
litiS
500
318
614
105
552
150
.,. 8U
'191 616
485 374
861 818
1100 375
1,000 100
1,000 488
8UI 700
6'13 481
735 689
738 6111
8591 1143)
468
E-W.l-contd,
301
1,000 205
3611
345
330
285
591
51'l6
577
267
453
367
348
44iJ
2'11
158
383
299
250
188 846
]09 346
492 507
182 500 500
667
1lU,
186 272
324 1103
285 301
262 349
131 394
6
43
JODHPUR CITi'
88
36
70
286
91
HI
7'1
14
21
24
4'1
98
66
53
500
46
'1
'I
6
19
136
2
S
8
20
14
10li
NACAUR DI~JCT
8 1'1
!! 15
23 95
N '1
3 3
18
4 16
II • 1 1
5
333
1 I
3
4, .2
8
• 2
19
2
12
55
42]
1 It
1 1
1
I 4,
9
1
1
11
7
161
• 1
N I
1 2
10
1
I
3
'1
53
..
11
lis
.8
69
195
143
]lli
oli
U
43
95
8t1
76
106
103
110
20
iD
iii
io
7
II!
(0
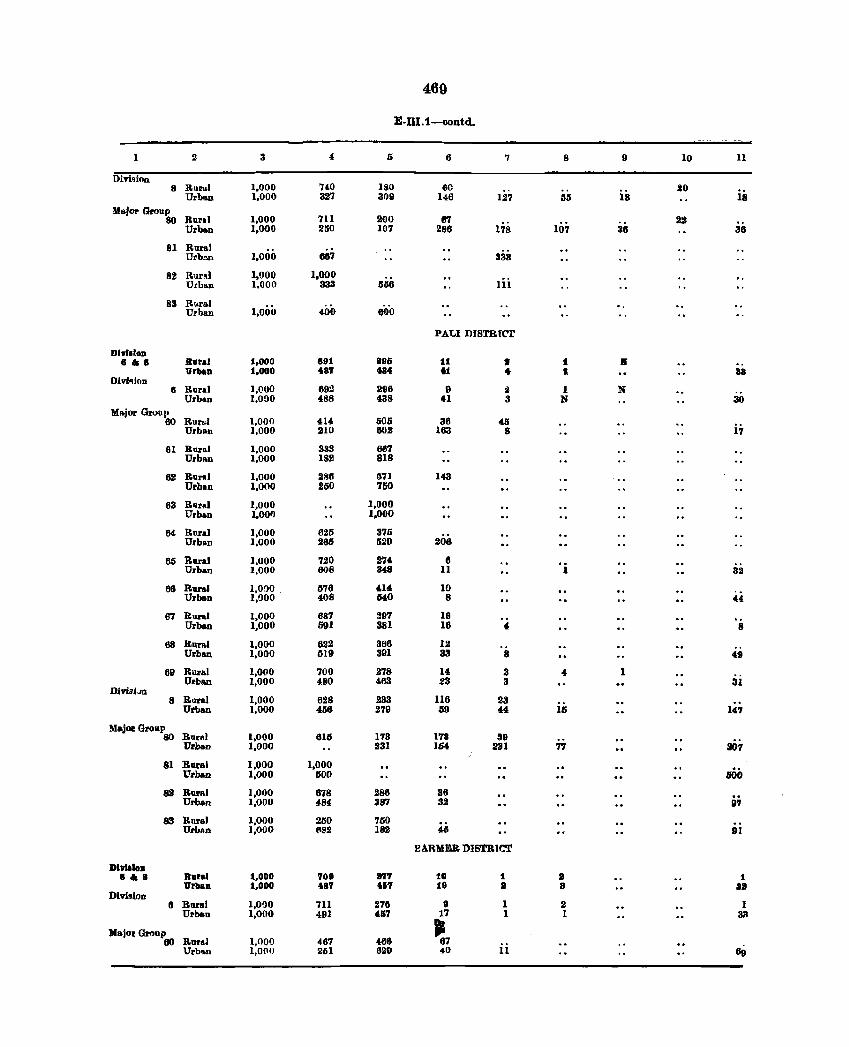
469
E·IlI.1-00Dtd.
2 3 4 5 6 7 8 9 10 11
Divi~ioJl. 8 Ku .... 1 1,000 7"0 180 60
127 is 20 .. Urban 1,000 327 300 146 55 18
Major Group Rural 1,000 711 200 87 80
178 107 22
Urba.n 1,000 250 107 286 36 36
81 Rural 333 Urb:m 1,000 687
82 Rurd 1,000 1,000 Iii Urban 1,000 333 Gli6
83 R1.Il'&1 1,000 400 6;;0 Urban
PALl DISmfCT
Dlwlilon ell8 Rural 1,000 891 811i U I 1 11
Urllan 1,000 487 484 •• • • 83 Di"i~i(ln
6 Rural 1,000 69::! 298 " 2 1 N Urban 1,000 488 438 41 3 N 30
Ma.jor GroUl' 414 505 36 60 Rur .. l 1,000 411 i7 Urban 1,000 210 802 163 8
61 Rural 1,000 333 667 Urba.n 1,000 182 818
62 RUrRl 1,000 2116 571 143 Urban 1,000 260 760
63 Rqrlll 1,000 1,000 Urban 1,001) 1,000
64 RlII'al 1,000 625 375 Urban 1,000 266 520 206
65 Rural 1,000 720 274 6 Urban 1,000 608 3~ 11 1 32
66 Rur&1 1,000 . 576 414 10 Urban 1,000 408 540 8 "'4
67 Rural 1,000 687 297 16 Urban 1,000 591 381 18 4- 8
68 RUTal 1,000 622 366 12 Urb&n 1,000 519 301 33 8 49
69 Rural 1,000 700 278 14 3 4- 1 Urban 1,000 480 463 23 3 31
DiviBi.J1l 8 Rural 1,000 628 233 116 23
iii Urban 1,000 456 279 59 44 I"" Major Graap
RurRI 1,000 6l1S 173 173 80 89 307 Urban 1,000 231 154 281 77
81 Roral 1,000 1,000 .00 Urban 1,000 500
82 RQ1'AI 1,000 678 288 36 Urban 1,000 4-84 387 3J 97
83 Rural 1,000 250 750 UrbAD 1,000 1182 182 46 Dl
HARMER. DISTR1CT
Dlvll.o. a 0\ B Raral 1.000 709 0'1 10 1 III 1
11rll8n 1.000 487 4&7 18 I a all Divi!lion
II Boral 1,01)0 711 278 D 1 2 I Urban 1,000 491 41S7 17 I 1 33
Major Grooi' .-tIO Rura.l I,OOD 461 466 87
Urb .. n 1,000 201 829 40 11 8g
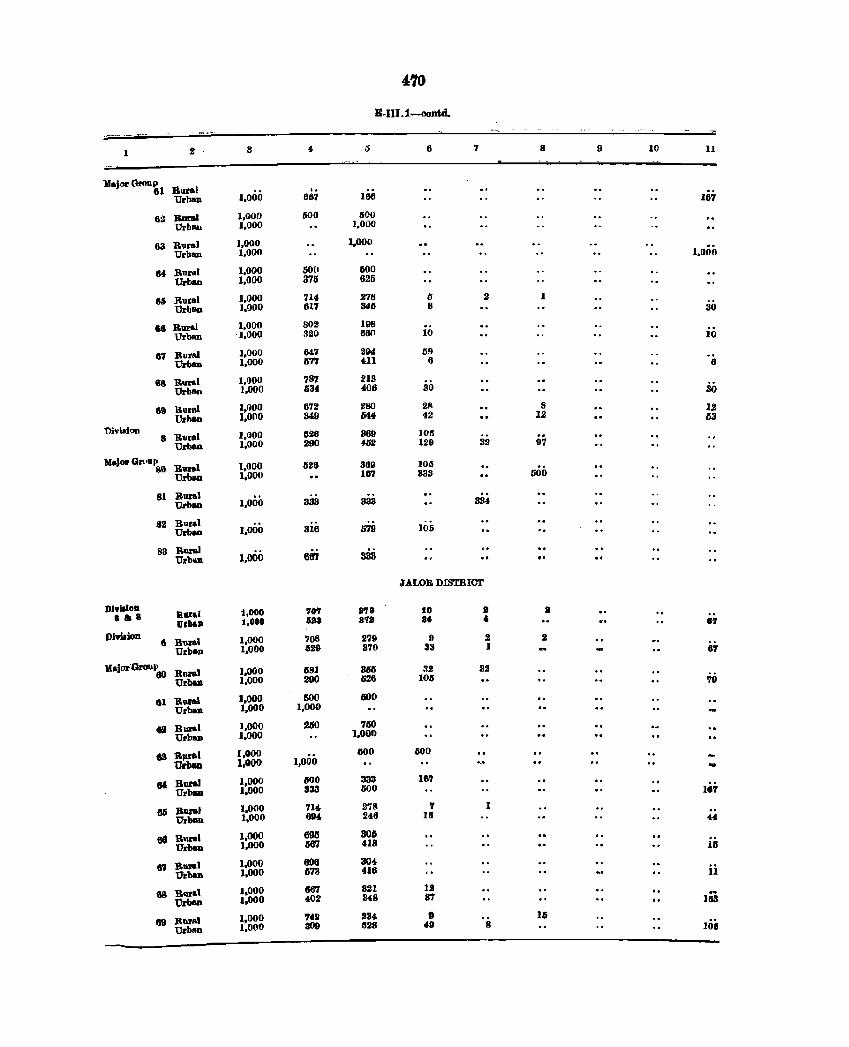
4/10
B-II1.1_ntd.
1 2 3 5 6 7 8 9 10 11
VajorGrnnp &ural 61
1,000 ;.
100 Urhan 667 li7 6:1 Rural 1,000 600 SOO
Urban 1,000 1,000
63 Rual 1,000 1,000 Urban 1,000 1,000
M Rural 1,000 50(1 500 Urban 1,000 376 625
66 Rural 1,000 714 278 6 2 I
Urban 1,000 617 346 8 30
68Booral 1,000 802 198 Urban -1,000 320 660 10 10
67 Rllral 1,000 64.7 204 59 Urban 1,000 6'1'1 4,l1 6 6
6& Bural 1,000 787 213 Urban 1.000 1i3. .06 30 30
69 Rural 1,000 672 280 211 8
UrhaD 1,0nO 349 644 12 12 12 63
niviIoion 8 Bural 1,000 526 369 105
Urblll1 1,000 290 .62 129 32 97
Maj«q Grt·up Bural 1,000 526 SO 369 106
Urblll1 1.000 16'1 333 500
81 B_1 Urban 1.000 333 333 334
82 Rur.l Urban 1.000 316 579 106
83 Rural 1.000 Urb..n 687 333
JALOB DLSTRIOT
DI.,lIIoll 1,000 70'1 1a.8 Rural 8'79 10 II II
IJrh. 1,000 6118 8711 8' f, ., DimioD
Ii Bnm 1,000 '108 279 0 2 2
Urban 1,000 1i29 370 33 1 67
Majm.Group 60 Roral 1.000 681 366 :12 32
Urbllll 1.000 200 626 106 79
01 RUlaI 1.000 500 fi()0
Urban 1,000 1,000
01 Rural 1,000 280 760 UrbaD 1.000 1.000
03 RJlfal 1,000 400 500
Urban 1,000 1,000
8& BUlaI 1,000 111)0 333 167
Urban 1,000 333 500 1.7 6Ii Boval 1.000 714 278 7 1
Urban 1,000 6t14. 246 18 44
oe Rural 1,000 8911 306 Urhllll 1,000 667 418 111
frI B_1 1,000 698 304
Urban 1,000 673 416 ii
88 Bara' 1,000 667 321 12
Urban 1.000 402 348 87 163
89 Rural 1.000 '1411 234 • 16
Urb8D 1.000 309 528 49 8 108
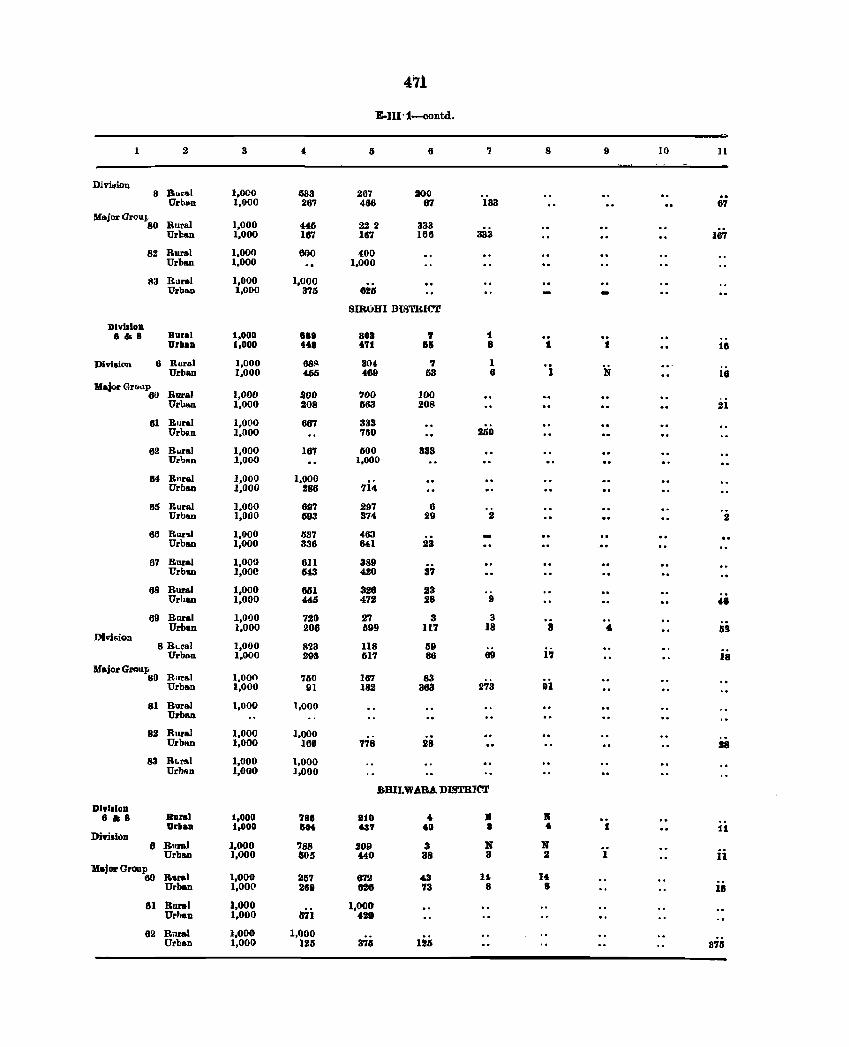
471
E-1I1'1-contdo
2 3 5 6 '1 S 9 10 11
Divi.,iou 8 B",ral I,OCO 633 267 200
°i33 ..
Urbll-D 1,000 267 400 67 67 Major GrcuJ.
Rural 1,000 445 22 2 333 80 333 Urblll1 1,000 187 167 166 167
82 Rura! 1,000 600 (00 Urban 1,000 1,000
83 Rural 1,000 1,000 Urba.u 1,000 375 8211
SlROHI DISTRICT
DlvlslDD 8 & 8 Rural 1,000 888 808 ., :I. ..
UrbaD 1,000 4 .. .71 iii 8 t 1 18
Divisic>n 6 Rural 1,000 68!! 304- 7 I OJ N Urbau 1,000 465 469 63 8 18 Major GrcIL'p
80 Rural 1,000 :100 700 100 UruWl 1,000 208 663 208 21
81 Rural 1,000 687 333 250 Urban 1,000 750
82 Rural 1,000 187 500 333 UrbAn 1,000 1,000
84 Rllral 1,000 1,000 Urban 1,000 288 714
811 Rural 1,000 697 29'1 6 Uruan 1,000 693 374 29 2 2
66 Rlln! 1,000 637 463 Urban 1,000 336 841 23
67 Rural 1,000 611 389 Urbau I,OOe 643 420 37
68 Rural 1,000 661 328 23 °it Urban 1,000 445 472 28 ..
69 Raral 1,000 720 27 3 3 Urban 1,000 208 599 117 18 8 II. 69
Division 8 RLl .. l 1,000 823 118 59
Urban 1,000 293 61'1 86 69 17 18 Major Grc)llP
80 Rllral 1,000 '150 167 83 U.rban 1,000 91 182 363 273 91
81 Rural 1,000 1,000 Urban
82 Rural 1,000 1,000 Urbom 1,000 188 778 28 28
83 Rullo! 1,000 1,000 Urb.m 1,000 1,000
BUII.WAltA. DISTRICT
DlvllloD 8&8 Baral 1,000 788 IUO " • K
UrbaD 1,000 aM 437 40 8 .. 1 11 DivilioD
8 Rnn] 1,000 788 209 3 N N Urb&ll 1,000 605 440 38 3 2 1 ii
HajorGroup 60 Ihm) 1,000 267 672 43 U ]I
Urban 1,00(1 269 828 73 8 8 II
81 RIJl'&I 1,000 67i
1,000 UrllaD 1,000 429
62 R'11'&1 1,000 1,000 Urban 1,000 125 375 115 875
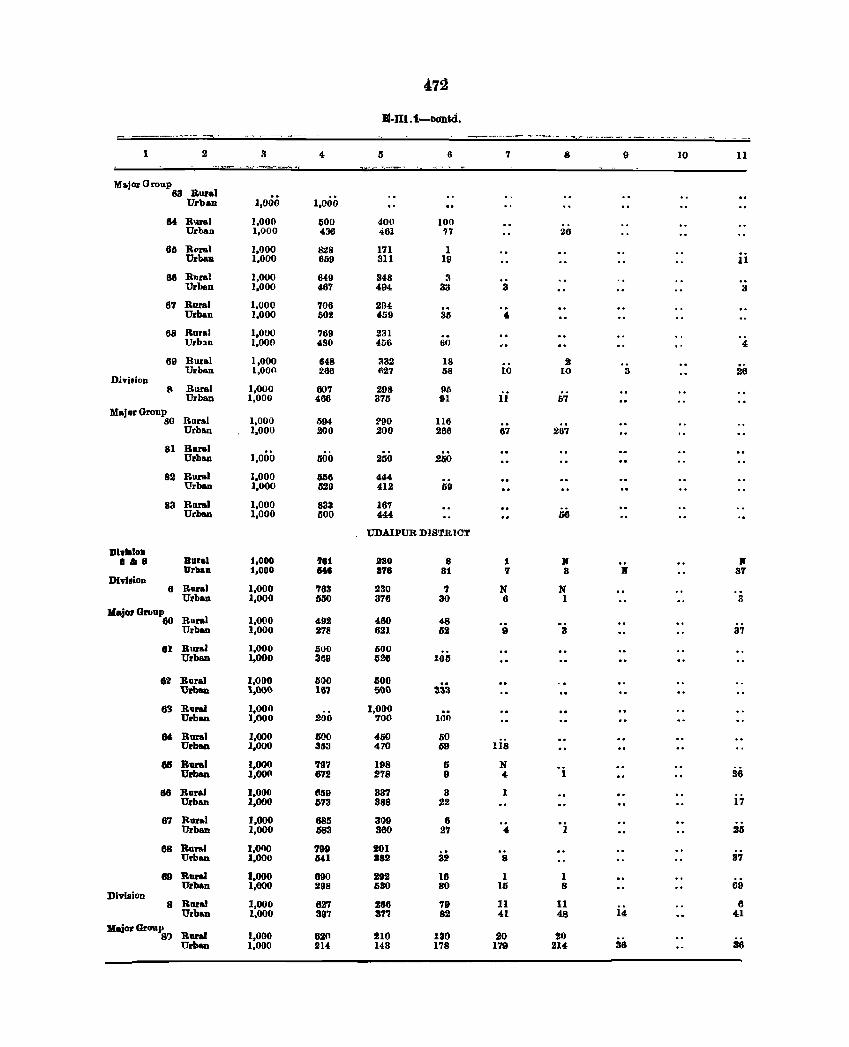
472
iI-Ul.1~oolltd.
1 2 3 4 II 6 7 8 9 10 11 .............. ,- ...........
llbjor Group 63 Rural
Urban 1,000 1,000
M R'ual 1,000 600 400 100 Urban 1,000 436 461 77 26
66 &"ral 1,000 828 171 1 Urban 1,000 669 311 19 11
86 Rnlal 1,000 649 348 :I Urban 1,000 467 494 33 3 3
67 Roral 1,000 708 2114 Urban 1,000 502 459 311 " 68 Rural 1,000 769 231 Urb:ln 1,000 480 456 60 4
69 Rural 1,000 648 332 18 2 Urban 1,000 286 fl27 58 10 10 3 26
Divieion R Rural 1,000 607 298 lip
Urban 1,000 486 375 91 11 67 MaJ8rOroup
80 l1.l1r.l 1,000 li94 ~90 116 Urban 1,000 200 200 266 67 267
81 Bural 1,000 Urban 500 250 250
82 RUl61 1,000 1158 444 Urban 1,000 1120 412 69
83 Roral 1,000 833 167 Urban 1,000 1100 4·14 li6
UDAIPUR DISTRICT
Dl .... lo. 11118 Rural 1,000 781 280 8 1 :N }(
Urban 1,000 Ii .. 876 81 7 8 }( 37 Dhi.ion
8 Rural 1,000 783 230 7 N N Urban 1,000 550 378 30 6 1 a
Major O1'CIup 80 Roral 1,000 492 480 48
Urban 1,000 278 6Zl 52 9 3 37
81 Rural 1,000 500 500 Urban 1,000 3611 528 105
82 Rural 1,000 500 500 333 Urban 1,000 1&'1 000
63 R'IIraI 1,000 1,000 Urban 1,000 200 700 1011
6' Rural 1,000 500 4SO 60 Urb ... 1,000 353 470 59 !I8
61 Rural 1,000 '197 198 5 N 'i 36 Urban I,OOfl 672 278 9 " 86 Rural 1,000 tl!i9 337 3 1
Urban 1,000 573 388 22 17
67 Rural 1,000 685 3011 6 Urban 1,000 383 380 27 " 1 211
68 Rural 1,000 799 201 Ut'ban 1,000 641 382 32 8 37
89 Rural 1,000 890 292 18 1 1 Urb ... 1,000 298 530 80 15 8 69
Division 8 8 Roral 1,000 627 268 79 11 11 ii Urban 1,000 391 3'17 82 41 48 41
MajorOroup Rural 1,000 820 210 130 20 20 8')
36 Urban 1,000 214 143 178 179 214 36
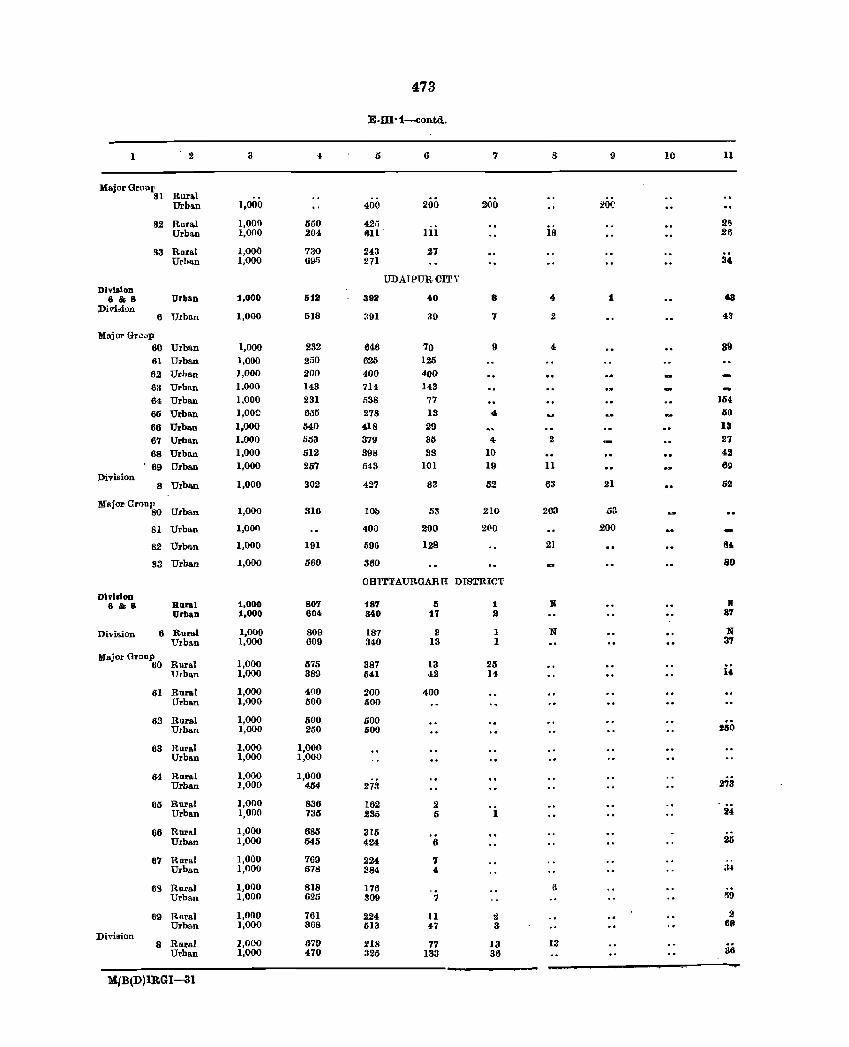
473
E-IU-1-contd.
1 2 :I ·1 5 6 7 S 9 Ie 11
Major Groul' 81 Runl
200 Urban 1,000 400 200 20('
82 Rora.l 1,000 550 42ii 21) Urba.n 1,000 204 IHl· III 18 26
'13 Rora.l 1,000 730 243 27 :i4 Urban 1,000 695 271
UDAIPUR CITY Division
81&8 Urban 1,000 5111 3911 40 8 " 1 48 Divi~i!..1n
Ii Urban 1,000 518 :191 39 7 2 43
Hoj or Grl1~lp
80 Urban 1,000 232 646 70 9 4 39 61 Urba.a 1,000 250 625 125
62 Urhan 1,000 200 400 4fW 63 Urban 1.000 143 711 113
64 Urban 1,000 231 liSS 77 154
66 Urban 1,00~ 655 278 13 4 50
66 Urban 1,000 540 418 29 13
67 Urban 1,000 653 379 35 4 2 27
68 Urban 1,000 512 398 3S 10 42
69 Urban 1,000 257 643 101 19 11 69 Division
8 Urba.n 1,000 302 427 83 52 63 21 52
Major Grl)up 80 Urban 1,000 316 lOb 53 210 263 53
81 Urban 1,000 400 200 200 200
82 Urban 1,000 191 59G 128 21 84
!l3 Urban 1,000 560 360 80
CHITTAUROAR IT DISTRICT
Dhillon 81&8 Rural 1,000 807 1.87 5 1 K If
UrbaD 1,000 604 340 17 2 87
Diviijion 6 Roral 1,000 809 187 :I 1 N N Urb!l.n 1,000 609 340 13 1 37
&Jajor Group Rural 1,000 575 13 25 60 387 i4 Urban 1,000 389 541 42 11
61 Rural 1,000 400 200 400 Urban 1,000 600 500
62 Raral 1,000 500 600 .. Urban 1,000 250 500 !l50
63 Rurl\l 1,000 1,000 Urba.n 1,000 1,000
64 Ru ... 1 1,000 1,000 Urban 1,000 4li4 278 2'78
65 Rural 1,000 836 162 2 Urban 1,000 735 235 5 1 24
66 Rural 1,000 685 315 Urban 1,000 545 424 6 25
67 Rllral 1,000 769 224 7 Urban 1,000 578 384 4 :14
69 Rllral 1,000 818 176 (;
Urban 1,000 625 309 7 !l9
69 Rural 1,000 761 224 II :l 2 Urban 1,000 368 513 47 3 69
Division 8 R!ll:'al 1,000 679 218 77 13 13 ..
Urban 1,000 470 325 133 36 a6
M/B(D)lRGI-31
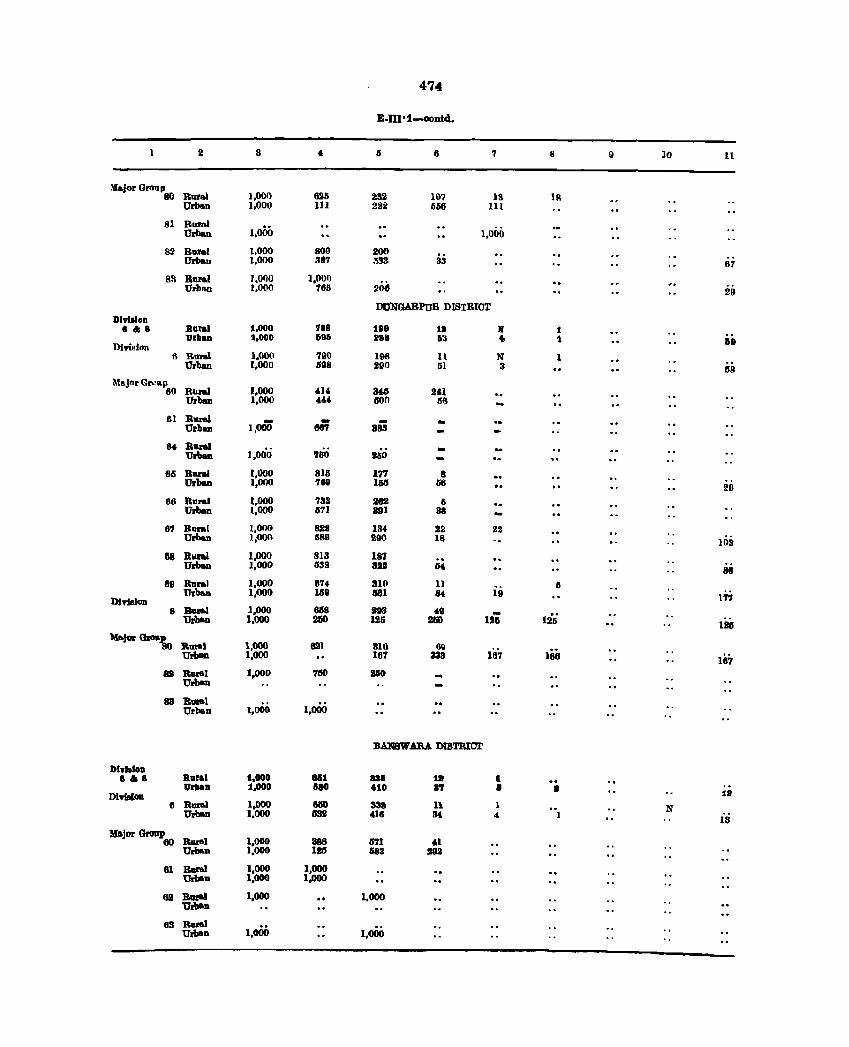
4'14
B·DI'l-oontd,
2 3 5 6 'I 8 9 10 11
:\I&jor Gl'OIl P 80 Rural 1,000 6Sli 232 107 13 lR
Urbllon 1,000 UI 222 556 III
81 Boral 1,000 1,000 Urban
82 Boral 1,000 800 200 33 Urban 1,000 387 ,'33 67
8!l Rtlral ),01)0 1,000 208 UrblloD 1,000 168 29 DUNGABPuB DISTRICT
D11'1I10. 8'" 8 Bllra. 1,000 788 189 11 k 1
VIlla. 1,000 &tll 1118 113 • 1 &9 Diri.lon 6 Rural 1,()OO 190 198 II }It 1
Urban 1,000 698 290 51 3 58 MaJnrG"'l1p
Rural 1,000 4101 3016 60 lit! Urban 1,000 '" 1100 56
61 Rural - - - -UrbllJl 1,000 6fI'1 883
IU Rural 160 -Urban 1,000 '180
66 Rual 1,000 815 177 8 UrbIIJI 1,000 '1119 153 66 20
66 Rural 1,000 733 282 5 Urban 1,000 571 891 38
67 Roral 1,000 !WI 134 22 22 Ut'han 1,000 11811 2110 18 103
68 KuRl 1,000 8]3 1&7 .. Urbao 1,000 639 III 64 88
89 a",.1 1,000 8'14 310 11 iii IS
n,_a 1,001) 14111 1581 84, 177 Divt.lon
8 RtIral 1,000 6118 293 411 IIi 125 Urban 1,000 2110 125 2110 126
~J- (boa\, R_l 1,000 821 :uo 6Q
187 188 Urban 1,000 161 333 16'1
81 R_l 1,000 7150 lII>O Urban
83 Bulal 1,000 Urbaa 1,000
BAlmWAlU DISTBICYr
DI .... Io. , .. Bliral 1.000 1111 888 lit t Vrllall 1,000 1.0 610 .'1 • • ill Div1BlOil
6 RureJ 1,000 6150 338 11 1 N Urban 1,000 G32 4.16 !U 4 1 13 Major GrOIlp
R_l 1,000 388 671 4. eo Urban .,000 115 1183 292
61 Rural 1,000 1,000 thban 1,000 1,,000
6S BluaI U~D
1,000 1,000
63 8_1 1,000 UrbaD 1,000
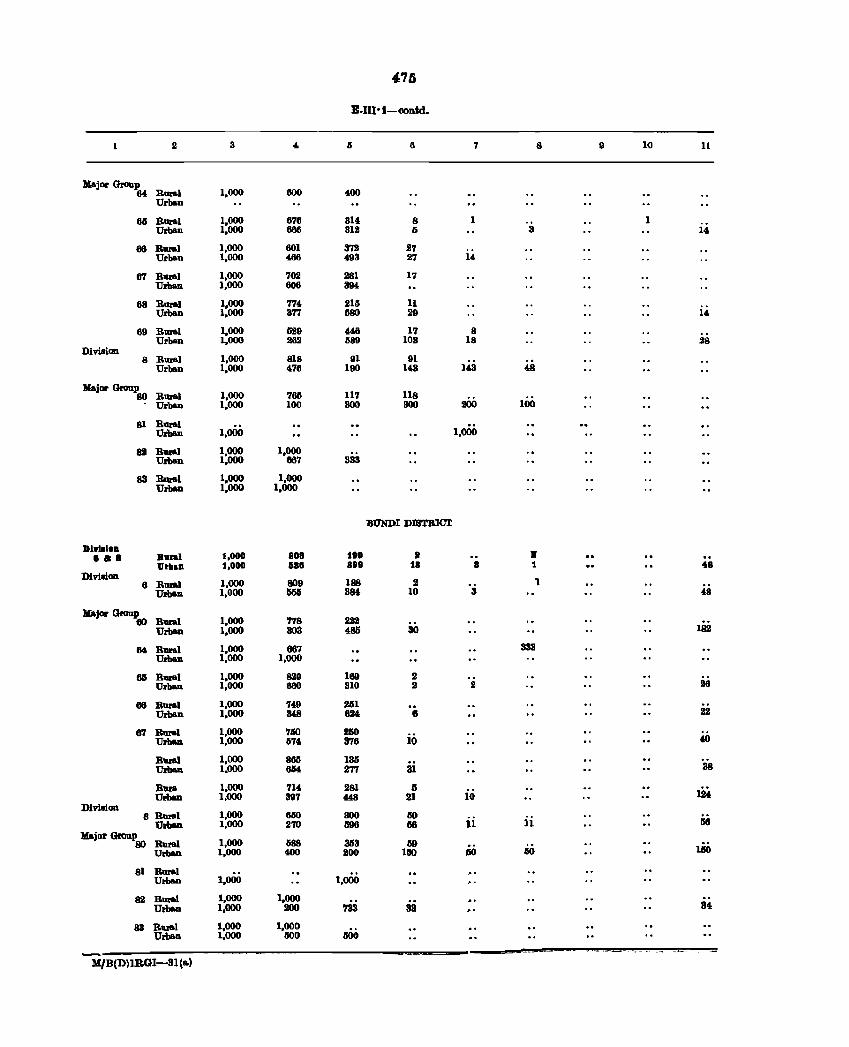
4:76
E.III'S-contd,
1 2 3 I) 6 7 8 9 10 11
Major Group 1,000 M Rural 600 400
Urban
IllS Rural 1.000 676 81& 8 1 1 Urban 1,000 666 812 5 3 14
66 B_1 1,000 601 872 27 Urban 1,000 486 493 27 14
fY1 Rural 1,000 702 281 17 Urban 1,000 606 894.
68 Rural 1.000 774 211) 11 Urban 1,000 377 Ii80 29 14
69 Rural 1.000 529 448 17 8 Urban 1.000 262 li89 103 18 28
Diviaion 8 R_I 1,000 818 91 91
Urban 1,000 476 190 143 143 48
Kajor Group 1,000 117 80 Rural '166 118
Urban 1,000 100 300 SIlO 200 100
81 Rural Urban 1,000 1,000
lIB R1Ir&1 1,000 1.000 Urban 1,000 667 833
83 R1Ir&1 1,000 1,000 Urban 1,000 1,000
BUNDI DmTBI<:rJ:
Dlmlo. ••• Baral 1,000 808 180 I • Urban 1.000 188 a8. 11 8 1 48
DiviBioa 8 Rural 1,000 809 188 2 1
Urban 1,000 GOG 384 10 3 48
.jor Group 1,000 222 eo RUE81 178
182 Urban 1,000 803 485 30
64 Rural 1,000 667 333 Urban 1,000 1,000
60 Rural 1,000 829 169 2 Urban 1,000 660 810 D 2 28
66 R1Ir&1 1,000 749 lIGl Urban 1,000 348 824 (I 22
87 Rural 1,000 '1.110 2110 io Urban 1,000 674 3'76 40
Rural 1,000 88ll 135 Urban 1.000 6IU 277 31 38
RUE8 1,000 714 281 15 ~ Urban 1,000 397 M8 21 10 Diviaioa
8 Rural 1,000 6110 300 110 ji ii Urban 1,000 270 Il98 156 68
Major Group Rural 1,000 688 80 3153 liD
150 Urban 1,000 400 DOO 1110 IiO 110
81 BaraI Urban 1,000 1,000
82 Rul80l 1,000 1.000 Un- 1.000 200 '133 93 94
83 :&111&1 1.000 1.000 1100 Urban 1,000 600
:"_!I!!--
KfB(D)IRGI-91(a)
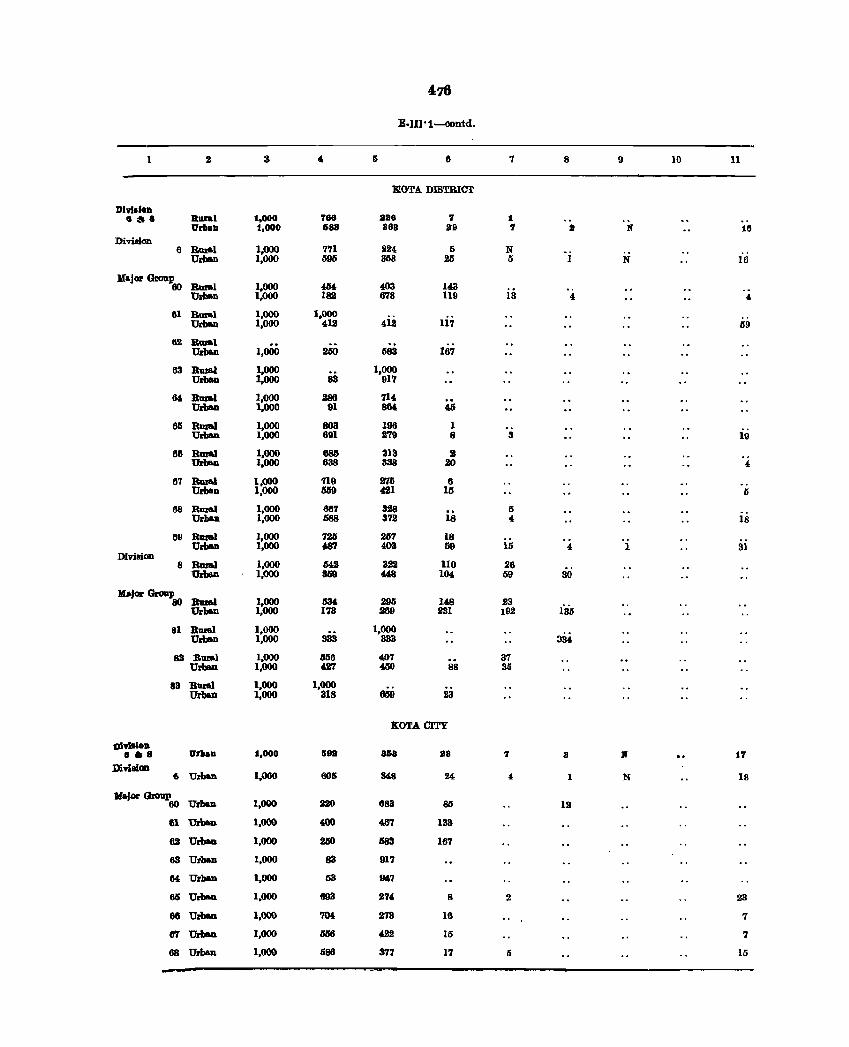
476
E·1Ilo1-oontdo
1 3 Ii 6 '1 8 9 10 11
mOTA DISTRICT
Dbl.'oll 08_ Kllnl 1,000 Tee lIlIO 7 1
Vrllaa 1,000 1588 308 as 'I a If 16 Divi8Jon
6 Ba1&1 1,000 771 224 5 N Urba.n 1,000 596 358 25 5 N 16
Hajor Group 1,000 454. 403 143 60 Rural
Urbron 1,000 182 678 119 13 4 " 61 Bmal 1,000 1,000 4i2 Urba.n 1,000 412 117 59
B2 RIu1toI 167 Urll&n 1,000 2110 1183
63 R1I1'&1 1,000 1,000 Urbaa 1,000 83 917
64 Rural 1,000 286 714 Urban 1,000 91 864 411
611 Rmed 1,000 803 196 1 Urban 1,000 691 279 8 3 19
86 Rural 1,000 685 313 I UrIl&n 1,000 638 838 20 4
61 R1l1IIl 1,000 719 275 6 Urban 1,000 IS59 411 15 Ii
88 RmaJ 1,000 687 US 5 Urban 1,000 688 372 18 4 18
69 Rural 1,000 7211 257 18 Urban 1,000 fBI 403 59 15 4 1 81
Divildon 8 RmaJ 1,000 542 3!2 110 26
UrlMm 1,000 MD 448 104 59 30
lbjor Group Bmal 1,000 634 296 148 23 80
136 UrlMm 1,000 173 269 231 192
81 Bural 1,000 1,000 334 UrbeD 1,000 333 333
82 Bural 1,000 1156 407 37 UrbIm 1,000 427 450 88 30
83 Bual 1,000 1,000 Urban 1,000 318 6511 23
KOTA CITY
"DhillOn II •• Vr ... 1,000 Ifill 8158 as 7 8 If 17
DivllliCBl 6 Urban 1,000 605 US 24 " 1 N IS
Major Group 60 UrlJm 1,000 220 683 85 12
61 Urban 1,000 .wo 467 IS3
62 Urban 1,000 2110 583 167
83 Urban 1,000 83 917
M Ur1Jlm 1,000 tj3 IN7
IUS Urb&n 1,000 693 274 8 2 23
66 Urban 1,000 '70. 273 16 '7
fIT Urban 1,000 6tUJ 4Z2 15 '7
68 Urban 1,000 686 377 17 Ii Ui
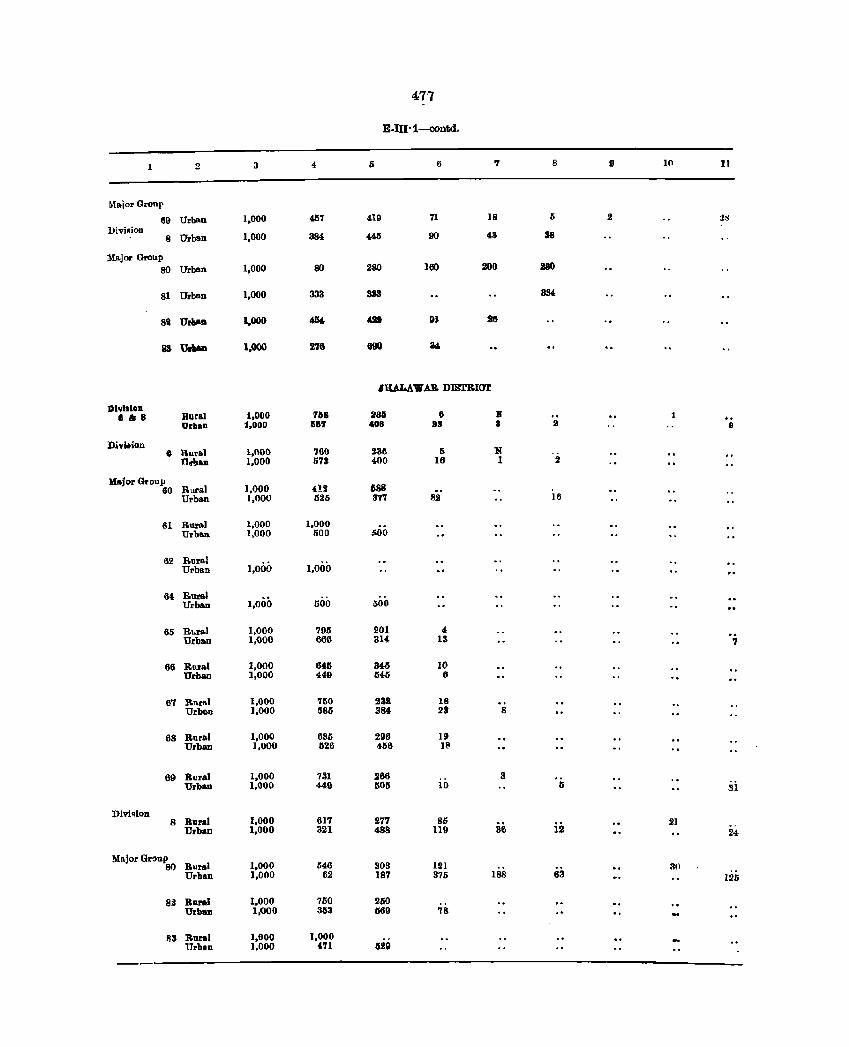
477
E·nJ·1-contd.
1 2 3 4 5 6 7 S I) 10 11
Maior Orottl'
69 Urban 1,000 437 419 71 18 5 2 2S
Division 8 Urban 1,000 384 «6 90 43 38
Ma.jor Group 80 Urban 1,000 80 280 100 20D J8I)
81 Urban 1,000 333 333 334
8i UNaIi 1,000 ~ '" 91 28
as Udl&tl 1,000 176 l19li :w.
,aALA,lJAR DISTRIOT
Division e IJ 8 Rural 1,000 768 aB6 0 If 1
UrlJ&D 1,000 667 'DB liB B II 9
Di¥»ioD • llour .. l 1,(\00 760 236 Ii N tJ~h .. 1,OOD 573 400 18 1 2
Major Group RlIral 1,000 4J! 688 60 Urban 1,000 525 311 112 16
61 Rural 1,000 1,000 Urban 1.000 500 1100
62 Rural 1,000 1,000 Urban
6' Rural Urb ... 1,000 500 500
65 R"1'&1 1,000 795 201 4 Urban 1,000 666 314, IS
00
'1
66 R.ural 1,000 645 345 10 Urban 1,000 449 li4li 8
67 Rur"l 1,000 760 238 18 Urban 1,000 586 384 23 8
68 Rural 1,000 686 298 19 Urban 1,000 526 4-56 18
69 Rural 1,000 731 266 3 UrbBll 1,000 449 1I0rs 10 Ii 31
DiviRioD 8 Rural 1,000 617 277 86
36 ii 21 Urban 1,000 321 488 119 24
Major Grollp Rural 1,000 546 80 303 121 30 Urban 1,000 62 1117 375 188 63 126
82 Ru.ral 1,000 760 2110 Urban 1,000 3Ci3 1169 78
113 Rural 1,600 1,000 Urb.n 1,000 "1 1129
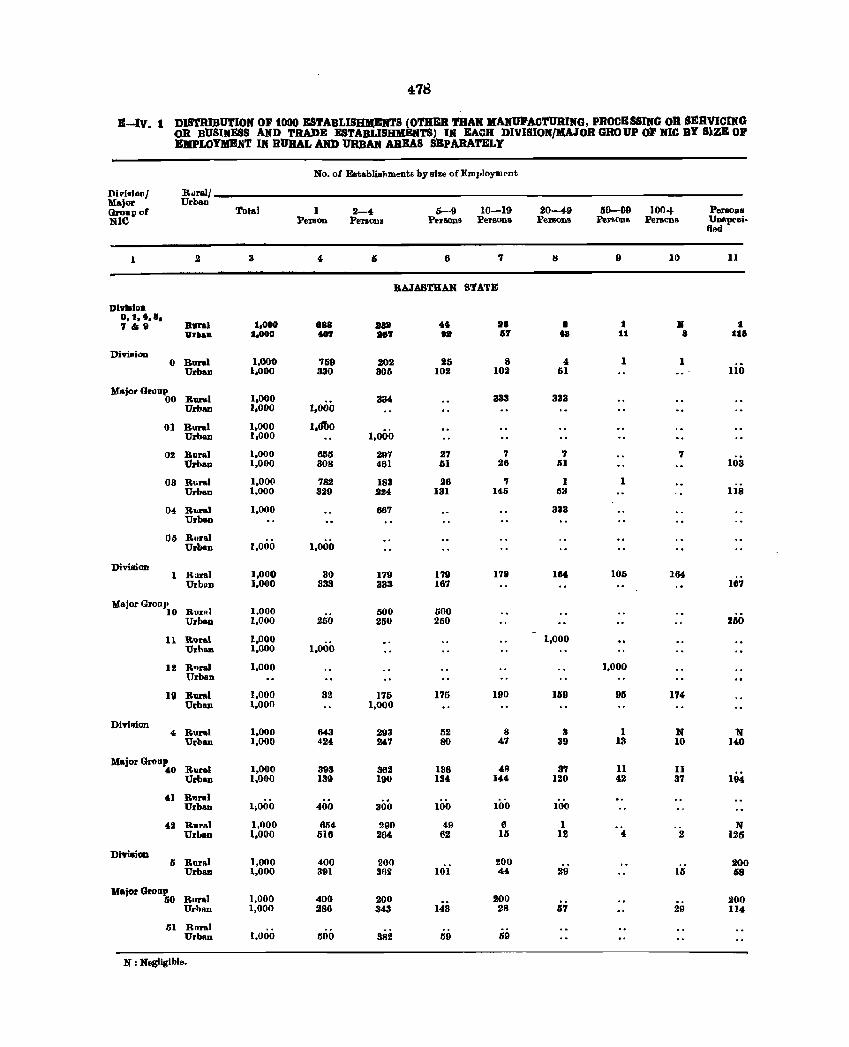
478
B-Iv. 1 DIS'l'RIBDTION or 1000 ESTABLISIDIENTS (OTHER THAN lIIIANUli'AC'l'URING, PROCBSSING OR SERVICIliG OR BUSurESS AND TRADE ESTABLISHMENTS) IN EACH DIVISION/MAlOR GROUP or mc BY SlZB or EMPLOYMENT IN RURAL AND URBAN AREAS SBPARATBLY
No. of Establishment. by size ofEml,loyUJ,·nt
Di.,ialonl BiJrall Major Urban Gro.por Total 1 2-4 6--9 10-19 20-4-9 5~DII )00-1- PersoDa NIe Penon Penon. Per lIOnS Persons Persons l'ersons 1'eracns Unllpeei.
fifld
1 2 3 6 6 '1 8 II 10 11
BAJAS'lHAN STATE
Dlvl.lon 0,1. ',IlI.
1,000 '1".8 Barsl 118 au 44 Ita I :I II :I unan 1,000 40'1 187 .a 67 18 11 • U&
Divillioo 0 Rural 1,000 '159 202 25 8 4 1 1
Urban 1,000 330 306 102 102 61 no
Major Group Rur .. 1 1,000 333 333 00
1.000 334-
Urban 1,000
01 Bural 1,000 l,dtlO 1,000 Urban 1,000
02 Rural 1,000 6G1S 2117 27 7 '1 7 Orban 1,000 308 461 51 26 51 lOa
03 Rbr .. 1 1,00(1 '182 183 26 '1 1 1 Urban 1,000 329 224 131 1U 53 118
04 RtJral 1,000 66'1 333 Urban
05 Rural 1.000 Urban 1,000
Division 1 Raral 1,000 30 179 nil 179 184 106 164
Urban 1,000 333 333 167 167
Major GrouJ' 10 Rurlll 1,000 500 600
Urban 1,000 250 250 250 260
11 Rvr.1 1.000 1,000
1.000 Urhan 1,000
12 R,"", 1,000 ],000 Urban
19 Rur .. 1 1,000 3~ 175 175 190 Ui9 95 174 Urban 1,000 1,000
Dhillion 4 Rura) 1,000 643 .293 52 8 3 1 N 'N
Urban 1,000 424 247 80 4'1 39 13 10 140
Major Grou, Rural 1,000 393 862 138 41'1 37 11 11 40
194 Urban 1,000 139 190 134 144 120 42 37
41 Rural Urban 1,000 400 300 100 100 100
42 Rur .. l 1,000 654 290 49 6 1 ·4 N UrLen 1,000 516 264 62 15 12 2 125
Diyi.iOD 6 Rural 1,000 400 200 200 200
Urban 1,000 391 3fJ2 101 44 29 15 58
Major Group 50 Rllr.1 1,000 400 200 200 200
Urhan 1,000 286 343 143 28 117 29 114
61 Bural Urban 1,000 500 31'12 59 59
N : Negligible.
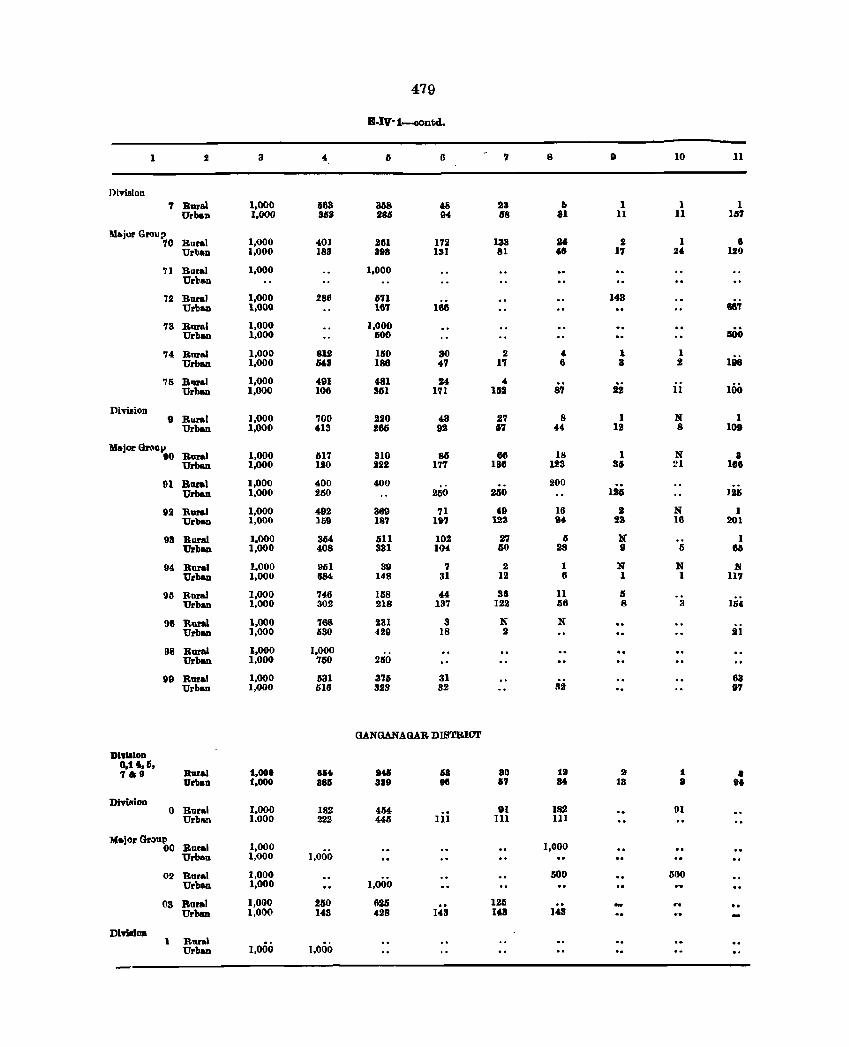
479
E-Iv·1--oontd.
1 2 3 5 6 7 8 10 11
J)lvlsion 7 Bur-.l 1,000 1183 3118 48 23 6 1 1 1
Urban 1,000 363 286 9" 68 81 11 11 157
Majol' Groll!l '70 Rural 1,000 401 261 172 133 24 2 I 8
Urban 1,000 183 398 131 81 4& 17 24 120
71 Rural 1,000 1,000 Urbn
72 Rural 1,000 286 1111 148 ai~ Urba.D 1,000 167 168
'73 Rural 1,000 1,000 IlOO Urban 1,000 1100
74 Rural 1,000 812 1110 30 2 • 1 1 lIiil Urban 1,000 643 188 47 1'7 6 II 2
75 Rval 1,000 491 481 24 t- 22 100 Urban 1,000 106 361 1'71 152 8'7 11
Division 9 Rural 1,000 700 220 43 27 8 1 N 1
Urban 1,000 413 285 92 5'7 '" 12 8 10'
MajorGNop 90 Rural 1,000 1117 3lO 811 66 18 1 N I
Urbaa 1,000 120 222 177 136 123 811 21 188
91 Rural 1,000 400 400 200 Urban 1,000 2110 250 250 126 ]211
92 Rural 1,000 492 389 '7l 49 16 II N 1 Urban 1,000 159 187 197 123 94 23 16 201
98 Roral 1.000 35' 511 102 27 6 N I Urbaa 1,000 408 331 104 60 28 , 5 86
94 Rural 1,000 951 39 'l 2 1 N N :N Urban 1,000 884 148 :n 12 6 1 1 117
95 Roral 1,000 746 lIi8 44 36 11 6 154 Urban 1,000 302 218 137 122 56 8 3
96 Rural 1,000 766 231 3 N N Urbllll 1,000 1130 429 18 .2 21
98 Rural 1,000 1,000 Urban 1,000 '7110 260
99 Rural 1,000 531 375 31 63 Urban 1,000 616 323 32 32 97
GANGANAGAR DIBTBlor
DI.,lIlon o.t t,6,
1,000 7.9 Rural 81i. 9411 58 80 19 9 :f. • Urban 1,000 861i 889 911 1i7 8. 18 a 91
DiYieion 0 Rural 1,000 182 4114- 91 182 91
Urban 1,000 222 446 111 HI III
Major Gr::lutl 00 Rural 1,000 1,000
Urban 1,000 1,000
02 Rural 1,000 500 500 Urbllll 1,000 1,000
03 Rural 1,000 2110 1125 .. 1211 Urbau 1,000 143 428 143 US 143
DIYiIIIOD 1 Rural
1,000 1.0410 Urbau
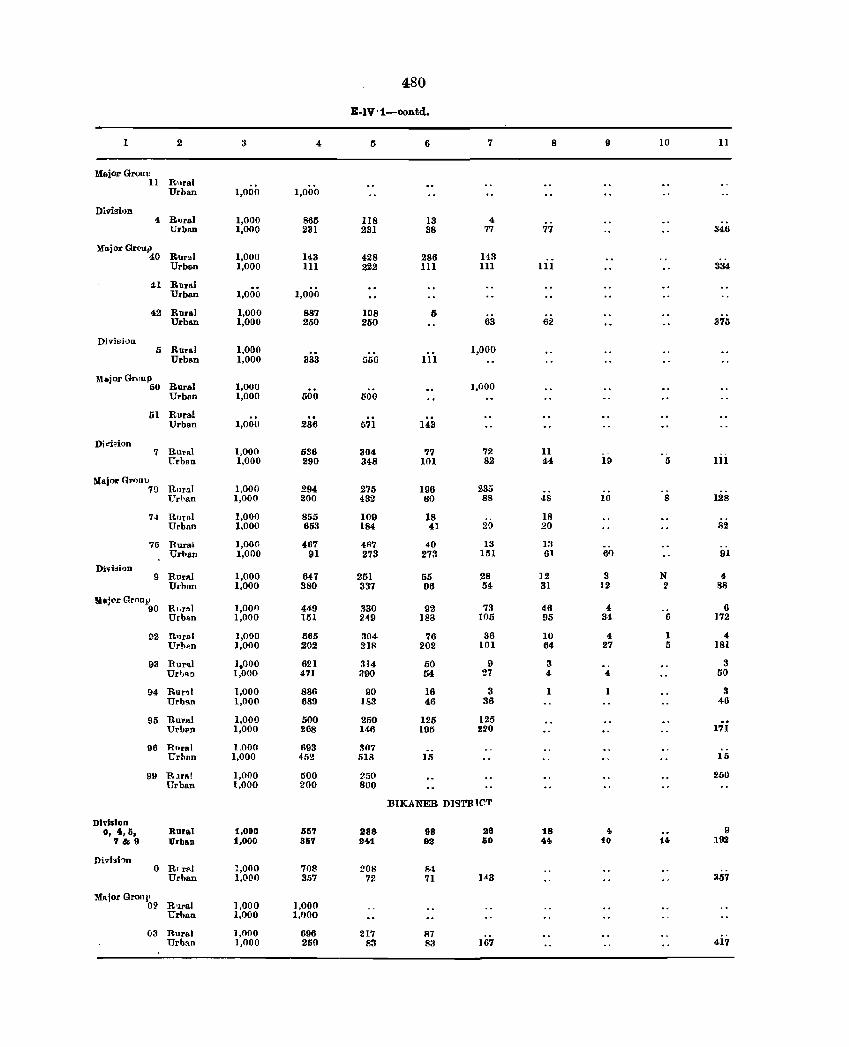
480
E·1V ·1-contd.
1 2 3 4 5 6 7 8 9 10 11
Major GrouT: 11 Rural
Urban 1,000 1,000
Divisi'}n 4 Rural 1,000 865 118 13 4
Urban 1,000 231 231 38 77 77 346
Major Grl'1l.t' 40 Rural 1,000 143 428 286 143
Urba.n 1,000 111 222 111 111 111 334
41 Rural Urban 1,000 1,000
42 Runl 1,000 887 108 5 Urban 1,000 260 250 63 62 375
Divi8ioD 5 Rural 1,000 .. 1,000
Urban 1,000 333 aM III
Ma.jor Gr.lUp Rural 50 1,000 1,000 Urban 1,000 500 500
51 Rural Urban 1,000 286 571 143
Dit'bion 7 RUrll1 1,000 536 304 77 72 11
Urban 1,000 290 348 101 82 44 19 5 111
Major GrnlltJ 70 RIIT"l 1,000 294 275 196 23;)
Ur'-"m 1,000 200 432 80 88 48 16 8 128
H RIllSI 1,000 855 109 18 IS Urban 1,000 653 184 41 20 20 82
75 Rural 1,000 467 4117 40 13 13 Urhan 1,000 91 273 273 lii1 61 61) 91
Djvi~i-)D
9 Rurlll 1,000 647 251 55 28 ]2 3 N 4-Urban 1,000 3BO 337 96 54 31 12 2 88
U..ior Grno.i_) • 90 RHrnl 1,001] 449 330 92 73 46 4 0
Urb .. n 1,000 151 2·19 188 105 95 34 6 ]72
02 R11l&1 1,0')0 565 304- 76 36 10 4 1 4 Ur,!>p.n 1,000 202 21fl 202 101 64 27 5 ]81
93 Bur'!.l 1,000 621 314 60 9 3 3 Ur',qn 1,000 47] 390 54 27 4- 4 50
94- Rur~1 1,000 886 90 16 3 I 3 Urh .. n 1,000 689 ] 8a 46 36 46
95 Uural 1,000 500 250 125 125 .. Urbl'n 1,000 268 146 195 220 17]
96 n"ral LOOO 1193 307 Urbnn 1,000 452 518 ]11 15
99 R.aPl! 1,000 500 250 2M Urban {,OOO 200 800
BIKANER DISTRIC'I'
Division 0, 4,5, Rural 1,000 557 1188 98 116 18 4 9
7&9 UrbaD 1,000 3&7 241 92 60 44 10 14 192
Divlsi'lll 0 R'rp.l 1,000 708 :!O8 Sol,
Urban 1,000 357 72 71 ]·~3 31i7
MItior Grolll; 07 R'nal ],000 ],000
Urban 1,000 1,1)00
03 Rural ],000 696 217 117 Urban 1,000 250 83 83 167 417
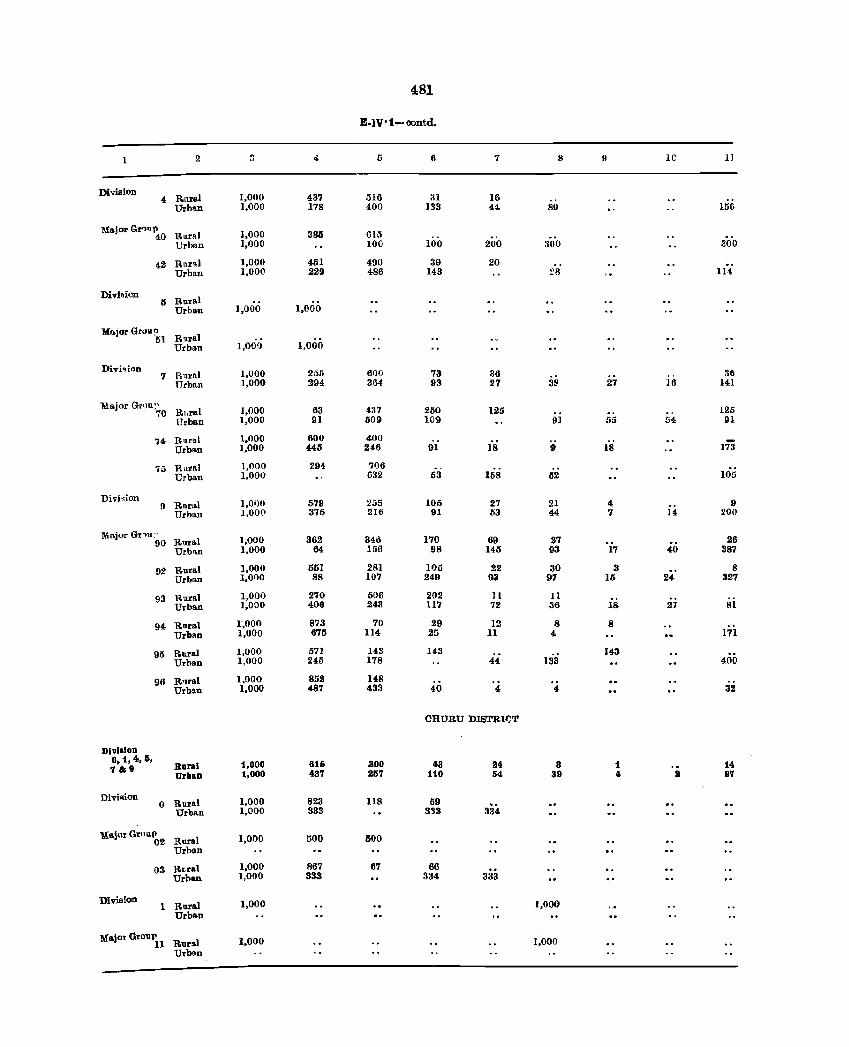
481
E-IV·t-oontd.
1 2 ~
" <i 6 6 7 8 9 Ie 11
Division 4 Rilla! 1,000 437 ;j16 :n 16
Urb,m 1,000 178 400 133 44 89 156
MajorG1"l11P Rllral 1,000 :186 615 40 Urbon 1,1)00 100 100 200 300 :JOO
42 Rllr .. 1 1,000 451 490 39 20 Urban 1,00(1 229 486 143 ~8 114
Divi~i(m Rural 5 Urba-n 1,000 1,000
Major Gr"u!, R'lral 51 Urban 1,000 1,000
Divi.ion l~llral 1,000 25Ii 600 73 36 36 7 TTrbll.ll 1,000 294 364 93 27 311 27 ]6 141
Major GI·'.'U: ' ahral 1,000 63 4:17 260 125 125 70 Urban 1,000 91 509 109 9] 55 54 91
74 naral 1,000 600 400 Urbn.n 1,000 445 246 91 18 9 18 173
75 Rllral 1,000 291 706 IllS Urban 1,000 632 53 52 105
Divi,jon 1,01)0 579 255 105 27 21 !l Rnra.l 4 9
Urban 1,00(1 376 216 91 53 44 7 14 20()
Major Gr,u;' Rllral 1,000 362 340 170 69 27 26 90 Urb"" 1,000 64 156 98 145 93 17 40 387
92 Rural 1,000 551 281 106 22 30 3 8 Urban I,OIlO 88 107 249 93 97 15 24 327
93 RlIral 1,000 270 5()6 202 11 11 Urban 1,000 406 24S 117 72 36 18 27 81
94 RlIr .. 1 1',000 873 70 29 12 8 8 Urban 1,000 675 I14 25 11 4 171
95 Rural 1,000 571 143 143 143 Urban 1,000 245 178 44 133 400
96 R"rllol 1,000 852 148 Urbsn 1,000 487 433 40 4 4 32
CHURU DlBTR1()T
DI1IIslon 0,1,4,5,
BnrBI 1,000 815 300 13 84 8 1 14 '1&11 Urban 1,000 48'1 115'1 110 54 39 I a 117
Divi~ion Rural 1,000 823 lIS 59 0
334-Urba.n 1,000 3SS 333
Mlloior G-rnIlP 02 Rural 1,000 500 500
Urban
03 Reral 1,000 887 67 66 Urhan 1,000 333 334 333
Division 1 Rural 1,000 1,000
UrbBn
Major Group 11 Ruul 1,000 1,000
Urban
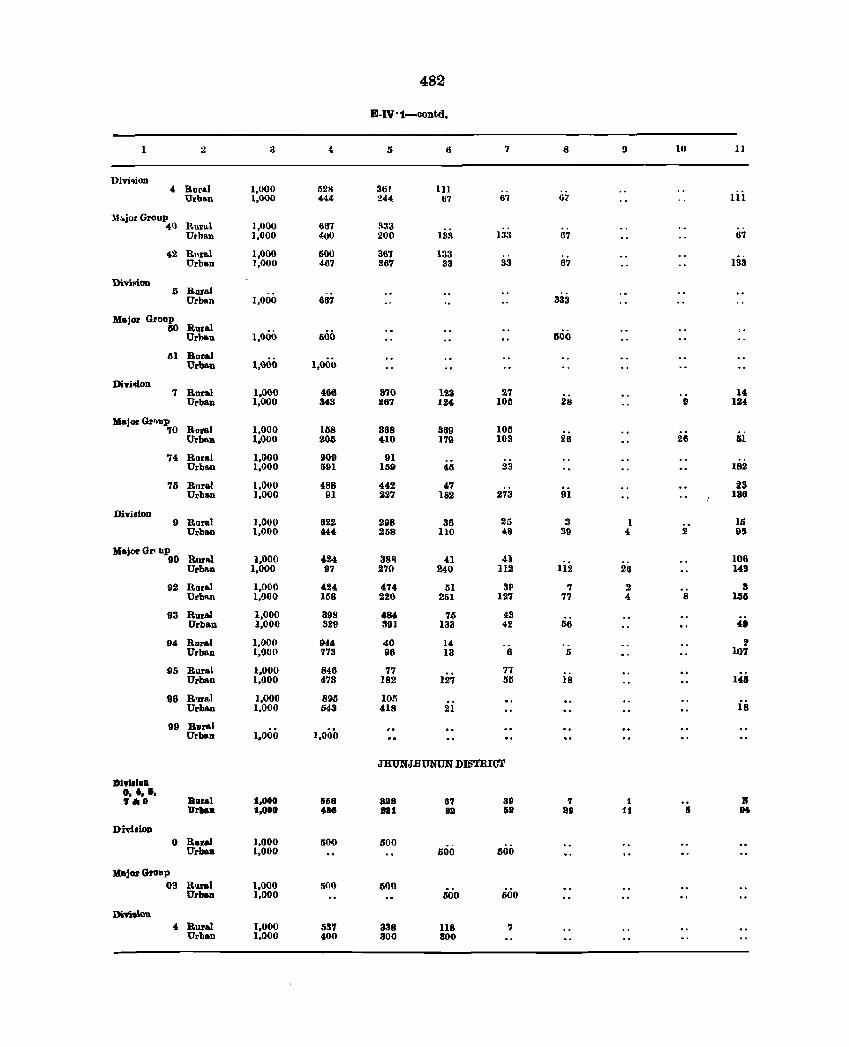
482
E-IV'1-oontd.
1 :l a 5 6 7 8 9 10 11
1>ivi~ioD 4 Rural 1,000 112K 361 HI
Urban 1,000 H4 244 67 67 67 111
:3.llojor Group oil) Rura.l 1,000 667 a33
l:i:~ Urban 1,000 4()0 200 133 67 67
42 RlIra.1 1,000 500 367 1S3 Urban 1,000 467 267 33 33 67 133
Di .. vildon is Boral
333 Urban 1,000 667
Major Grotlp Roral 50
1,000 GOO Urba.n 600
III Boral 1,000 Urba.n 1,000
Di",i,lon 7 Roral 1,000 466 370 123 27 14
Urban 1,000 343 267 124 105 28 II 124
Major Orr,up 70 Roral 1,000 158 368 369 105
Urba.n 1,000 205 410 179 103 26 26 61
74 RIlral 1,000 909 91 Urba.n 1,000 11111 1119 46 23 182
75 Rnra.! 1,000 488 442 47 23 Urban 1,000 91 227 182 273 91 136
Division 9 Rora! 1,000 622 298 36 25 3 1 15
Urban 1,000 M4 258 110 48 39 4 2 95
Major Orr up 90 "R11I,,1 1,000 424 3S11 41 41 106
Urban 1,000 97 270 240 112 112 26 143
92 Roral 1,000 424 474 51 31) '1 2 3 Urbll.I\ 1,I}OO 158 220 251 127 '17 4, 8 151
93 Rural 1,000 39S 484 '15 43 Urban 1,000 320 391 133 42 66 4'
94 R11r.1 l,()OO 944 40 14 ! Urban 1,000 773 96 13 6 5 107
95 Rural 1,000 846 77 77 146 Urban 1,000 473 182 127 55 18
96 R'1l'a! 1,000 8911 1011 is Urban 1,000 543 418 21
99 Bural 1,000 Urban 1,000
JHUNJBUNUN DISTBICT
DIYIIloD 0, .,1, 7118 Blllal 1,000 668 ass 87 38 7 1 l'I'
Dr". 1,000 488 ta1 82 62 28 11 II 1M
Dhisioo 0 Rilla! 1.000 1i00 600
Urban 1,000 500 500
Major Group 03 Rllal 1,000 1i00 GOO
Urban 1,000 600 500
m.ioIl , Rural 1,000 537 338 U8 '1 Urban 1,000 400 300 aoo
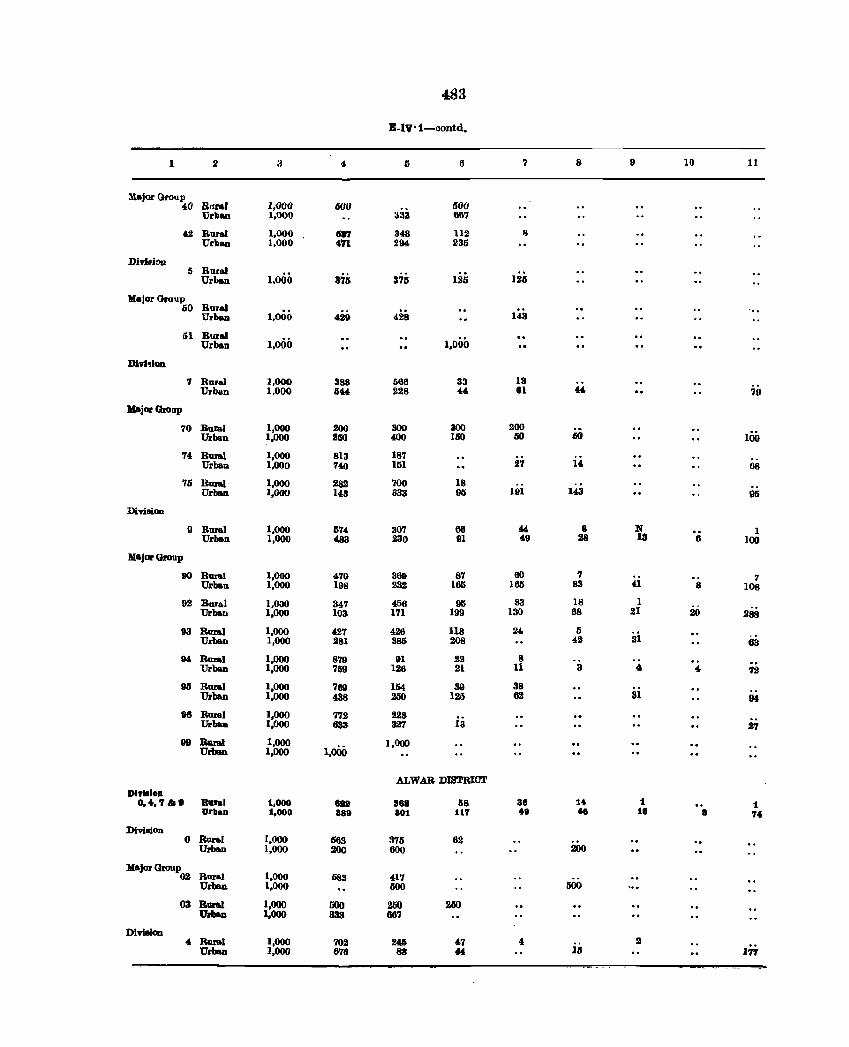
483
B-IV -t-oontd.
1 2 a 4 5 6 '1 8 9 10 11
l1a.jor Group 40 BflRl 1,000 6<1(1 SOO
Urban 1,000 333 667
42 RIll'aI 1,000 687 343 112 II Urban 1,000 471 294 235
Di1\lsiDD 5 Rural
1,000 376 375 Urban 125 125
Ma.jor Group 60 Rural
Urban 1,000 429 428 143
iii Bursl 1,000 1,000 Urban
Dlvhion
7 Rural 1,000 388 666 33 13 Urban 1,000 5'" 228 '4 81 " 79
Major Group
70 Rural 1,000 200 300 300 200 Urban 1,000 250 400 150 50 60 100
74 Bum] 1,000 813 187 ii. Urban 1,000 740 151 27 68
75 BuaI 1,000 282 '100 18 UrlNm 1,000 143 333 9(i 191 143 95
Din.ion
9 Rural 1,000 574 307 66 " 8 N 1 Urban 1,000 483 230 91 49 28 13 6 100
Major Group
90 Rural 1,000 470 369 87 60 7 7 Urban 1,000 198 232 165 165 83 41 8 108
92 Rur .. l 1,000 347 456 90 83 18 1 Urban 1,000 103 171 199 130 68 21 20 288
93 Rual 1,000 427 426 118 24 5 iii Urban 1,000 281 385 208 42 63
94. Rural 1,000 879 91 22 8 Urban 1,000 '159 126 21 11 3 4 4- 72
95 Rural 1,000 '169 154 39 38 iii Urban 1,000 438 250 125 62 94
96 Rural 1,000 '172 228 Urban 1,000 633 327 13 2'1
99 Rural 1,000 1,000
],000 Urban 1,000
ALWAB DlBTRICT DlvlaloD
0,4,7&8 Baral 1,000 lIt 1188 1i8 88 14- 1 1 Urban 1,000 889 a01 117 ... 48 ta 8 7.
Di'riaion 0 Rural [,000 563 375 82
Urban 1,000 200 800 200
Major Group 1,000 02 Rural 583 417
Urban 1,000 500 000
03 Rural 1,000 IiOO 250 2ISO Unan 1.000 333 667
Diviaion 4 Rural 1,000 '102 240 47 4 2
Urban 1,000 678 88 " 15 177 -- -- - -.
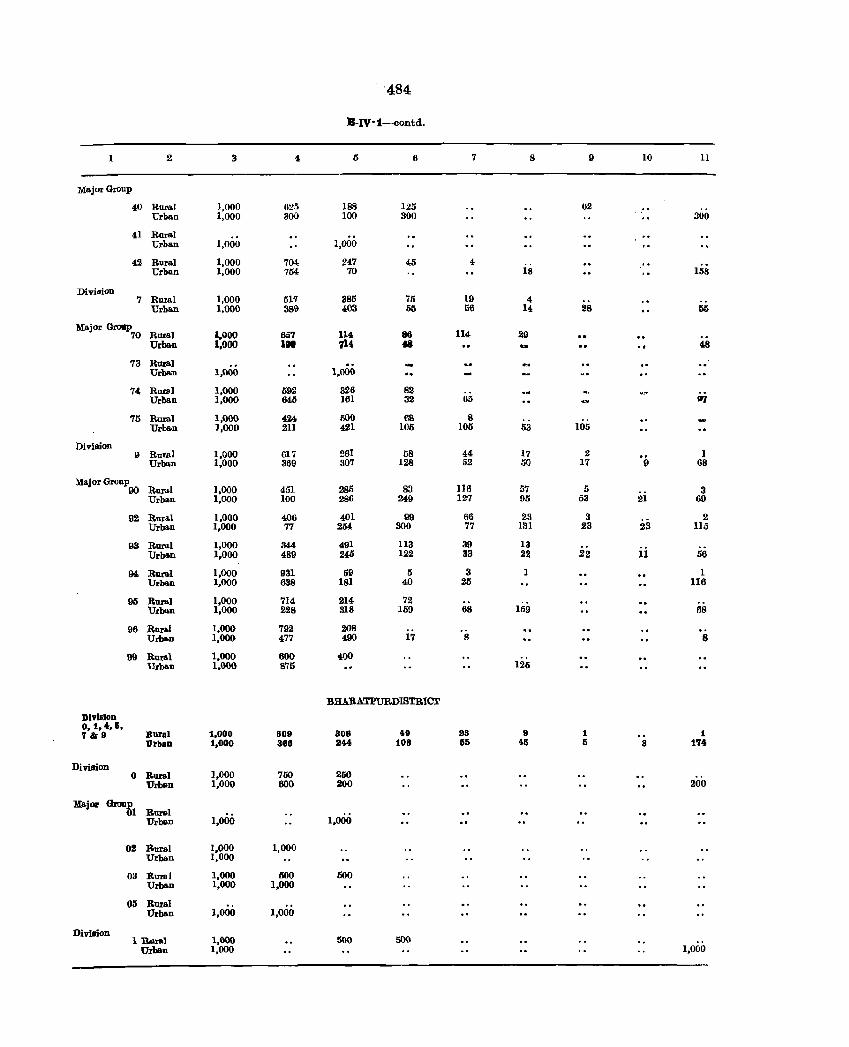
484
E-IV·1-contd.
2 3 5 6 7 8 9 10 11
Major Group
40 Rural 1,000 625 188 125 02 ,. Urban 1,000 300 100 300 300
41 Rural ,. Urban 1,000 1,000
..
42 Rural 1,000 704 247 45 4 is Urban 1,000 7M 70 158
Division 7 Rural 1,000 517 385 75 19 4
Urban 1,000 38\} 403 55 fiG 14 28 65
Major Gl'OIlp Rural 1.000 657 114 86 114 29 70 Urban 1,000 1110 71' .. .. 48
73 Rural Urban 1,000 1,000
74 R0I91 1,000 592 326 82 Urban 1,000 645 161 32 65 '"
75 Rural 1,000 424. 500 68 8 Urba.n 1,000 211 421 105 105 53 105
Division 261 9 Rural 1,000 017 58 44 17 2 ·9 1
Urbom 1,000 369 307 128 52 50 17 68
Major Group Rural 1,000 451 285 83 116 57 5 90 3 Urban 1,000 100 286 249 127 95 53 21 69
92 Rural 1,000 406 401 99 66 23 3 23
2 Urban 1,000 77 254 000 77 131 23 115
93 Rural 1,000 344 491 113 39 13 ii Urban 1,000 489 240 122 33 22 22 56
94 Rural 1,000 931 59 5 3 1 1 Urban 1,000 638 181 40 25 116
95 Rural 1,000 714 214 72 Urban 1,000 228 318 159 68 159 118
96 Rural 1,000 792 208 Urban 1,000 477 490 17 8 8
99 Rural 1,000 600 400 Urbl>ll 1,000 875 126
BRARATPURDISTRICT
Division 0,1,4.&,
1,000 49 23 9 1 '1&9 Bural 809 808 1 'Orban 1,000 368 244 108 55 45 5 8 1'14
Division 0 Ruml 1,000 750 250
Urban 1,000 600 200 200
Major BronS! Rur&l Urban 1,000 1,000
021 Bural 1.000 1,000 Urban 1,000
03 RIll'81 1,000 500 500 Urba.n 1,000 1,000
05 Rur&l Urban 1,000 1,000
DiviaioD 1,000 ISOO 500 1 Rural
Urban 1,000 1,000
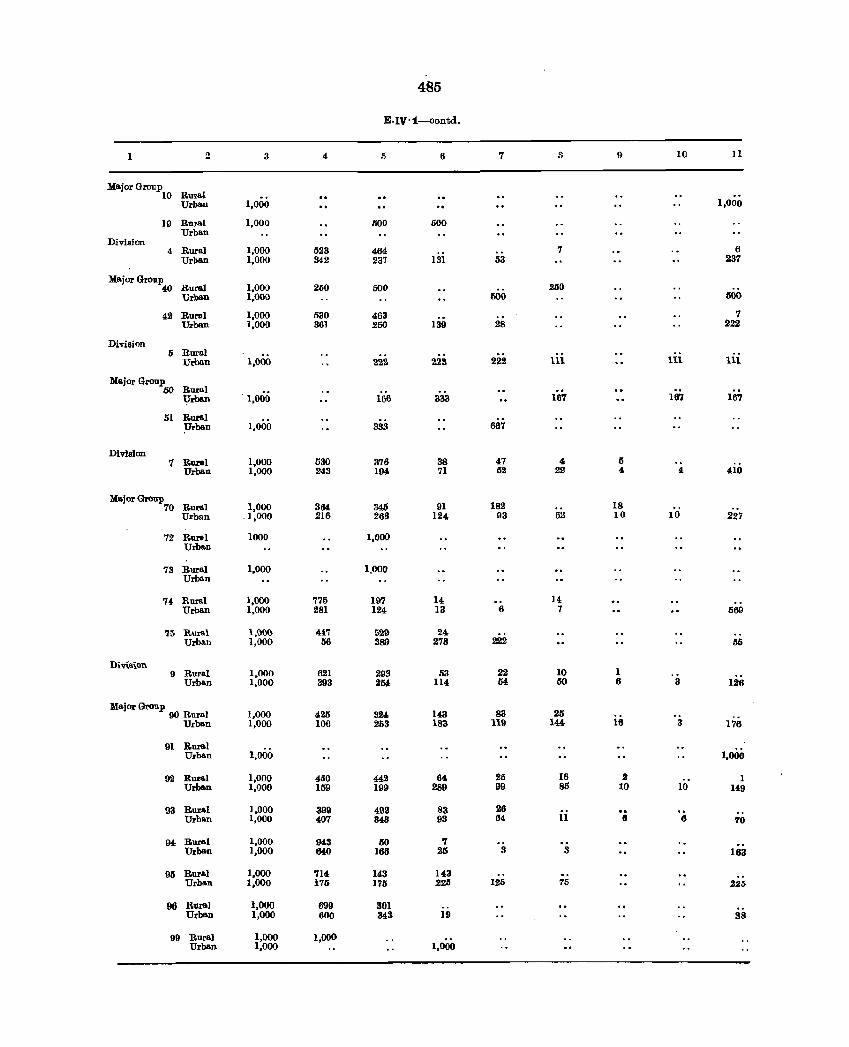
4~5
E,IV·1-oontd.
2 3 4 5 6 7 S 9 10 II
MajorOroup 10 RUTa.l
Urb .. n 1,000 1,000
19 Rnral 1,000 000 600 Urban
Division 4 Rural 1,000 523 464 7 6
Urban 1,000 342 237 131 53 237
Major Group Rural 1,000 200 260 40 500 Urban 1,000 600 500
42 Rural 1,000 530 463 7 Urban 1,000 361 250 139 28 222
Division 5 Rural
Urban 1,000 22'Z 223 222 III III 111
Major Gl'Ollp Rural 50 Urban . 1,000 106 333 167 167 167
51 Rural Urban 1,000 333 667
Division '1 Bural 1,000 530 378 38 47 4 5
Urban 1,000 2<13 194, 71 52 22 4 <I 410
Major Group 1,000 3M 346 91 182 18 70 Rural
Urban .1,000 216 268 124 93 52 10 10 227
72 Burel 1000 1,000 Urba.n
73 Rural 1,000 1,000 Urban
74 Rura.l 1,000 775 197 14 14 Urban 1,000 281 124 13 6 7 569
75 Rural 1,000 4lt7 529 24 Urban 1,000 56 389 278 222 65
Division 9 Rural 1,000 621 298 53 22 10 1
Urban 1,000 393 254 114 54 50 6 :3 126
Major Gl'Ollp 90 Rnral 1,000 425 143 83 25 324 i8 Urban 1,000 106 253 183 119 144 3 176
91 Rural 1,000 1,000 Urban
92 Rural 1,000 450 443 64 25 16 2 1 Urban 1,000 159 199 289 99 85 10 10 U9
93 Rural 1,000 399 492 83 26 Urb .. n 1,000 407 343 93 6<1 11 6 6 70
94 Rural 1,000 943 ISO 7 Urban 1,000 OW 166 25 3 3 163
95 Rural 1,000 714 143 143 Urban 1,000 175 176 225 1.25 75 226
96 Rural 1,000 699 301 Urban 1,000 600 343 19 38
99 Rural 1,000 1,000 Urban 1,000 1,000
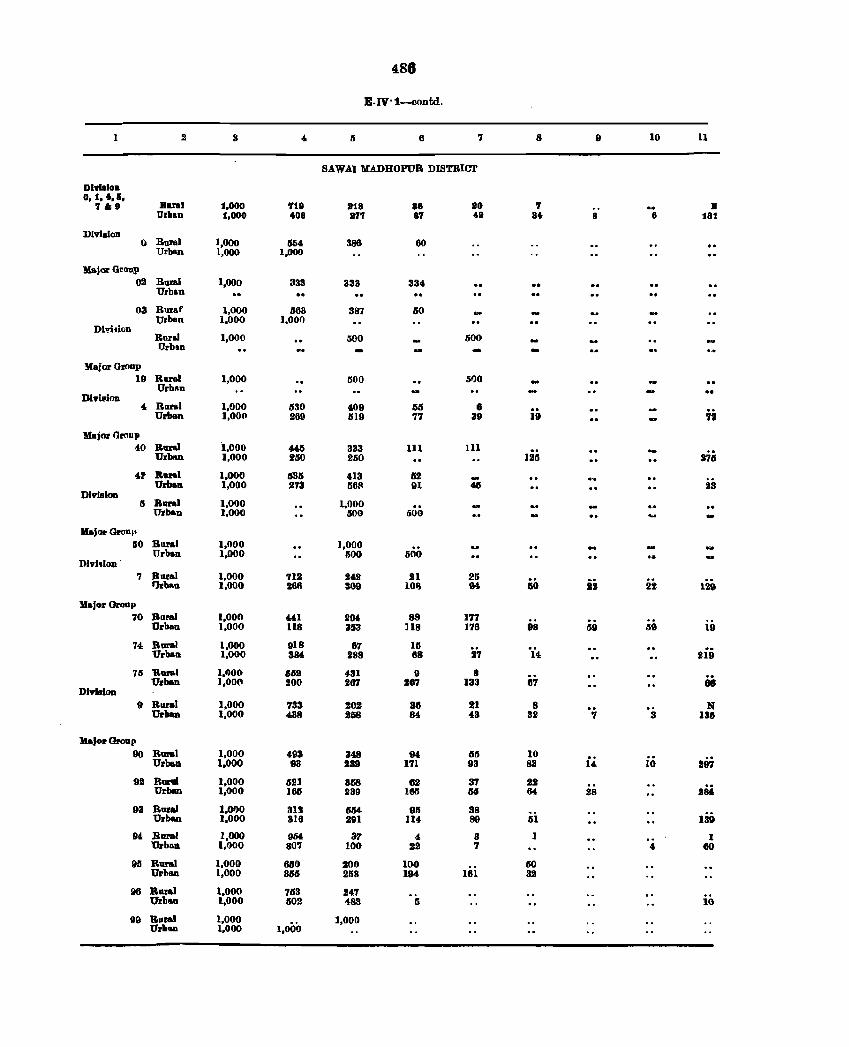
488
E.IV·1-contd.
2 3 " I'J 6 7 8 10 11
SAWAI MADHOPUB DISTRICT
DI'IIIlloa 0,1.4 •• ,
7.9 Raral 1.000 '118 818 88 80 '( .. ... II Urllan 1,000 408 B71 87 f9 84 8 8 181
Division 0 Bural 1,000 354 386 60
Urblm 1,000 1.000
Major Group 02 Rumi
Urban 1,000 333 333 334
03 Rusf 1,000 .563 387 110 Urban 1,000 1,000
Dl~iion Baril Urban
1,000 600 600
Maiar Gl(lup 19 Rural 1,000 500 500
Urb~n .. D1Yil!iOD.
4 BDlal 1,000 tl30 -'09 1It1 8 .. ;; Urban 1,00(1 269 tl19 '17 39 19
Major Group 4,0 R1I1'III 1,000 44t.I 333 111 III
125 a,i UrblUl 1,000 tliO 260
4f Rural 1,000 535 '13 lIlI -Urban 1,000 .!I73 ISOA 91 4lI 23 DlviBion
5 Rural 1,000 1,000 ,. Urban 1,000 1i00 1i00
Majoa- Groul' 110 Roral 1,000 1,000
Urban 1,000 600 600 Dividon
7 Rural 1,000 712 2'2 21 21i i2 12& IJrban 1,000 268 309 109 94 GO 22
'Major Group 70 Rural 1.000 "I 2M 88 177
Urban 1,000 lI8 353 1I8 176 98 59 119 19
74 Bural 1,000 918 67 16 27 'i4 2ii) Urbau 1,000 384 288 88
75 'Rural 1.1)00 1I1i2 f81 9 8 87 iii Urban 1,000 200 !l87 187 133
Dlvlalon 9 Rural 1,000 733 202 88 21 8 ·3 N
Urban 1,000 438 258 84 43 32 '1 135
IlaJor Group 90 Rural 1,000 498 348 9' li5 10 " 297 Urbau 1.000 93 139 171 93 83 14 10
92 BuN 1,000 521 358 82 37 22 2M Urban 1,000 163 239 163 lili 64 28
93 Bural 1,000 31'1 11M 95 38 i5i 139 Urban 1,000 818 291 114· 89
IH. Bora! 1,000 964 37 4 3 1 1 Urba.n 1,000 807 100 22 7 4, 80
95 Rural 1,000 660 200 100 10i
60 Urban 1,000 363 2118 194 32
96 Rural 1.000 7113 247 Urb&tI 1.000 1102 4sa Ii 10
99 Rural 1.000 1.000
1,000 Urb_ 1.000
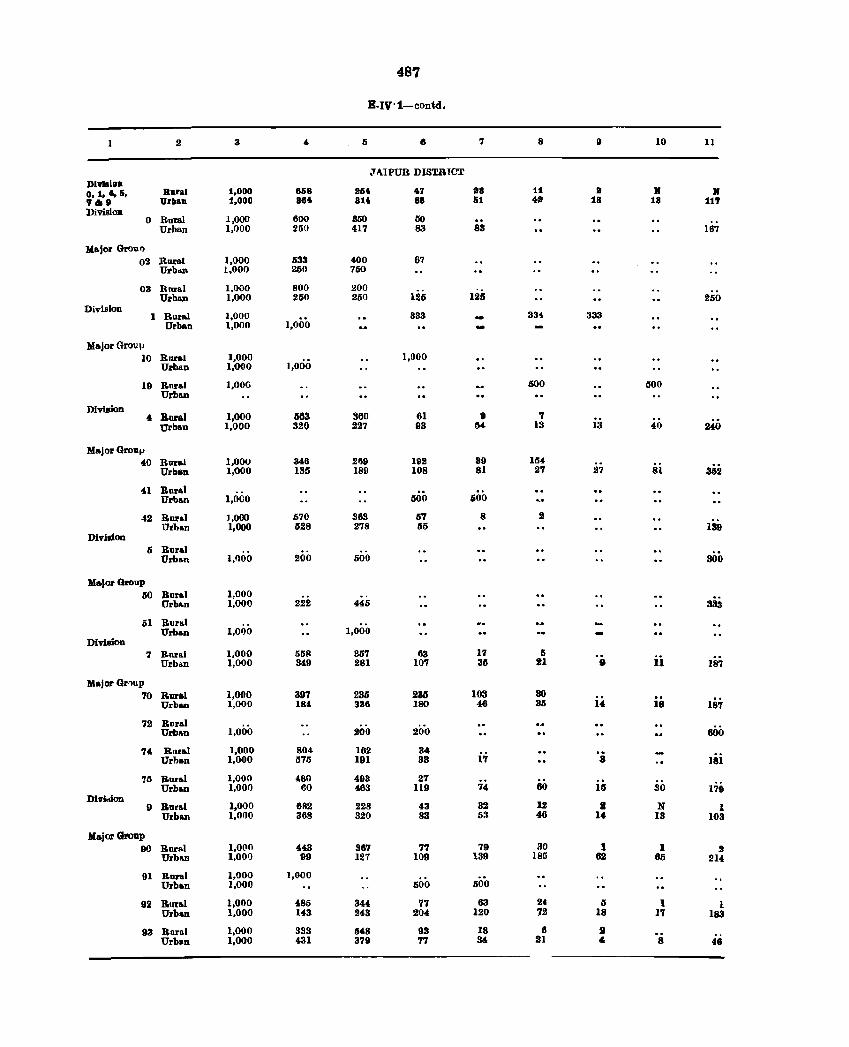
487
E.IV·1-contd.
2 3 II 41 7 8 II 10 11
J .\.IPUR DISTBTCT DI .... lon 0,1 ••• i, Baral 1,000 868 In .7 98 11 9 • • 7ae Urban 1.000 86. 814 88 61 409 18 18 117 Division
0 Rural 1,000 600 3IiO 50 Urban 1,000 250 417 83 83 167
Major Grout) 02 Borol 1,000 533 400 67
Urbtm 1,000 250 750
03 Rn1'al 1,1)00 800 200 125 Urban 1,000 250 250 126 250
Division 1 Rllral J.OOO 333 3U 333
Urban I,OOf) 1,000
MaJor Groul' 10 Rara. 1,000 1,000
Urban 1,000 1,000
19 BIll'&1 I,OOG 500 500 Urban
Divillion 663 4 Rnral 1,000 360 61 9 7
Urban 1.000 320 227 93 M 13 13 40 2.a
Major Gronl' 40 Rara. 1,000 346 269 191 39 154
Urb&n 1,000 135 189 108 81 27 27 81 362
41 Rural Urban 1,000 500 500
·12 Runl ],000 570 383 57 8 :! Urban 1,000 528 278 65 139
DiYitdon 5 Rural
Urb .. n 1,000 200 500 300
MaJor Group 50 Rural 1,000
UrbAn 1,000 222 445 333
61 ]l.ur .. 1 Urban 1,01)0 1,000
Divillion 7 Rural 1,000 O5S 357 83 17 15
Urb.m 1,000 349 281 107 35 21 0 11 187
Major Grl)up 70 Rural 1,060 3117 235 235 103 30 is UrblloD I,ODO 184 336 180 46 35 14 187
72 Rural 600 UrbAn 1,000 200 200
7f- RIIlal 1,000 804 182 34 Urban 1,000 575 191 33 17 8 181
711 Rural 1,000 480 493 27 Urban 1,000 60 463 119 74 80 III 30 179
Division 9 Rural 1.000 6R2 228 43 32 ll!i I N 1
Urban 1,000 368 320 83 53 46 14 13 103
Major Group 90 Rural 1,0(10 443 367 77 79 30 1 1 2
UrbMJ 1,000 99 127 109 139 185 62 85 214,
91 Bani 1,000 1,000 Urban 1,000 500 500
92 RU1:1101 1,0110 485 344, 77 63 24 5 1 1 Urban 1,000 143 243 204 120 72 18 17 183
93 Roral 1,000 333 548 93 18 6 t Urban 1,000 431 379 77 34 21 " 8 48
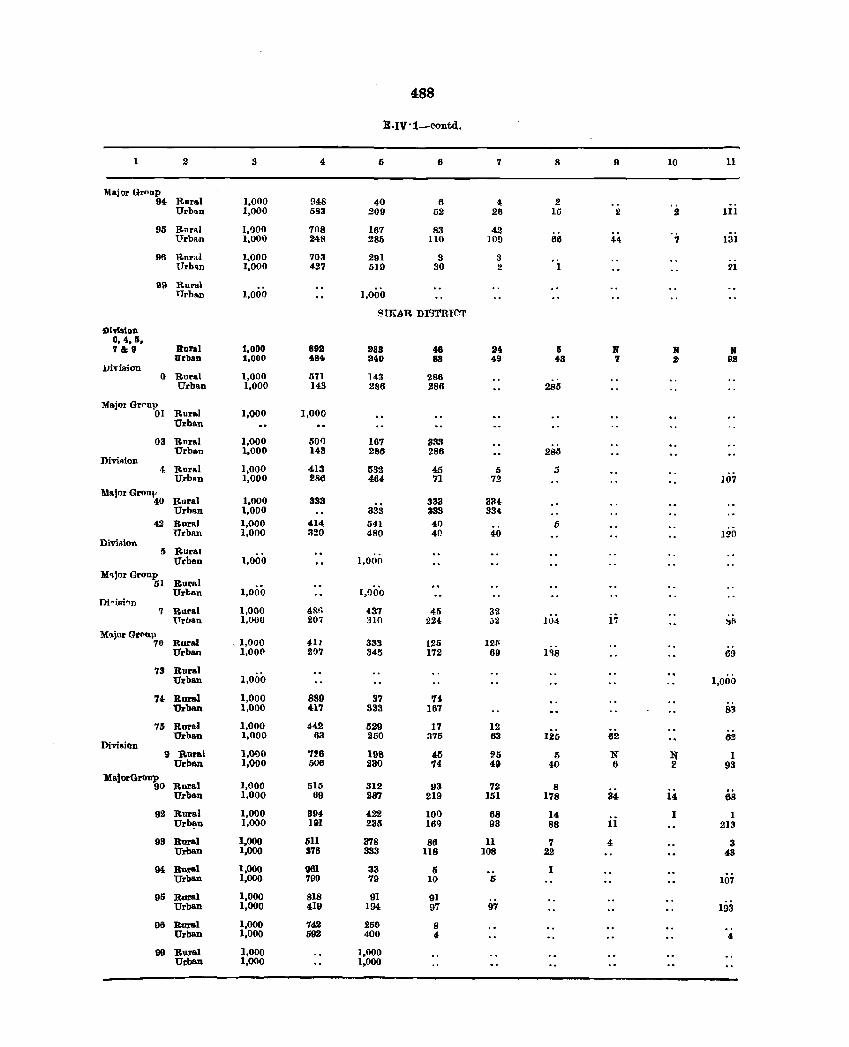
488
E·IV·1-contd.
2 3 4 5 6 7 8 9 10 11
Major Grnup 94 Rural 1,000 948 40 6
'" 2
Urbon 1,000 593 :209 52 26 15 2 2 111
95 Rural 1,'100 708 167 83 42 Urbltn 1,000 248 285 110 ]09 66 44 7 131
96 Rnrltl 1,000 703 291 3 3 Urb~n 1,000 427 519 30 2 I 21
99 RUl"lol TJrhllon 1.,000 1,000
SIKAR DI'3TRI0'l'
Ol'lllloD. 0,4,6, '1&9 Rural 1,000 61111 983 48 24 Ii If If If
UrbaD 1,000 484 840 83 49 43 7 9 92 jJivision
0 Rura.l 1,000 571 143 286 UrbllD 1,000 143 286 286 285
Major Grc-up 01 Rural 1,000 1,000
Urban
03 Rural 1,000 50Q 167 833 Urb .. n 1,000 143 286 286 285
Divi.ion ·1 Rur,,1 1,000 4]3 532 4..'. Ii J
Urban 1,000 286 464- 71 72 ]07 1\tajor Groul'
Rural 1,000 333 333 334-40 333 Urblln 1,000 833 334
42 RUrRI 1,000 414 541 41) 6 Urbnn 1,000 !'I 20 480 40 40 UO
DiviAion 5 Rural
Urhan 1,000 1,000 M"jorGroup
Rural 51 1,000 I,()OO Urban
m'ishn 7 Ru ... l 1,000 4f1·\ 437 4li 32
TTrblln 1,000 207 310 224 ,,2 104 17 ltfi
M'ljorGr(lul' Rura.] _ 1,000 411 333 125 I2i' 70
1~8 UrblUl 1,000 207 345 172 69 69
73 Rural 1,000 1,000 Urban
74 Rural 1,000 889 97 7,. Urban 1,000 417 333 IIl7 83
75 Rural 1,000 4-42 529 17 12 Urban 1,000 63 250 375 63 125 62 62
Divi~iQD 9 Rura.l 1,000 728 198 45 !l5 I) N Ii 1
Urban 1,000 606 230 7!1 49 40 6 2 93 MajorGrollp
90 Rural 1,000 511! 312 93 72 8 Urban 1,000 69 287 219 151 178 34 14 68
92 Rural 1,000 394 422 100 68 14 I 1 Urban 1,000 191 235 169 93 88 11 213
93 Rural 1,000 511 378 86 11 7 4 3 Urban 1,000 376 333 118 108 22 43
94 Rural 1,000 961 33 (; 1 Urban 1,000 799 79 10 I> 107
QIj Rural 1,000 818 91 91 Urban 1,000 419 194 97 97 193
96 Rural 1,000 742 250 8 Urban 1,000 692 400 4 4
99 Rural 1,000 1,000 Urban 1,000 1,000
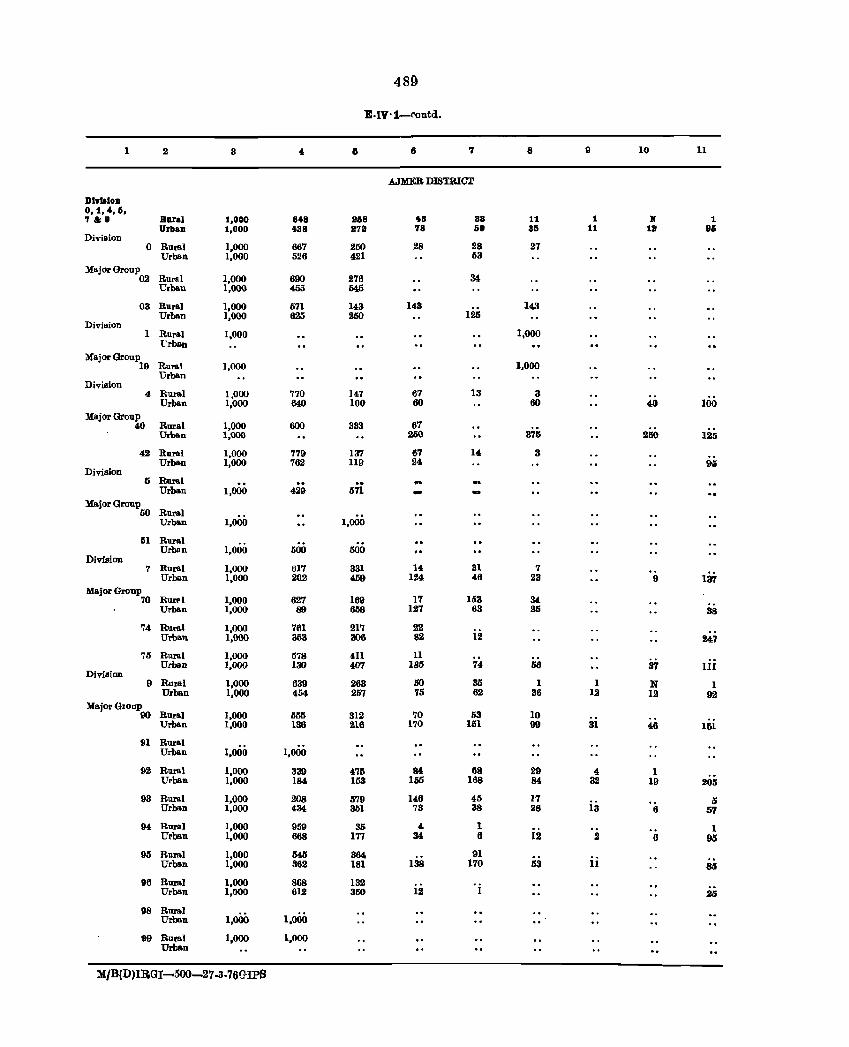
489
E·IV·1-<'Ontd.
1 2 3 ., 6 7 8 9 10 11
AJMER DISTRICT
Division 0,1,4,6, 7&9 Hural 1,000 848 268 48 88 11 1 If 1
Urban 1,000 438 272 78 69 86 11 ill 85 Division
0 Rural 1,000 667 260 28 28 27 Urban 1,000 526 421 53
MajorOroup 02 Rural 1,000 690 278 34
Urba.n 1,000 455 Ii45
03 Rural 1,000 571 143 143 143 Urban 1,000 625 250 125
Division 1 Rural 1,000 1,000
('rban Major Group
19 Rural 1,000 1,000 Urba.n
Division 4 Rural 1,000 770 147 67 13 3
1()O Urban 1,000 640 100 60 80 40
Major Gronp Rural 67 40 1,000 600 333 Urban 1,000 250 875 2150 126
42 Rural 1,000 779 137 67 14 3 Urban 1,000 762 119 24 9i
Division 5 Rural ..
Urban 1,000 429 671 Major Gronp
60 Rural Urban 1,000 1,000
51 Rural 1,000 Urban 1i00 500
Division 7 Rural 1,000 617 331 14 31 7
Urban 1,000 202 469 124 46 23 9 13T Major Group
17 lli3 . 70 R1ll'P1 1,000 627 169 34. Urban 1,000 89 658 1lI7 63 25 38
'14 Rural 1,000 761 217 22 i2 U~ban 1,000 363 306 82 247
75 Rural 1,000 578 411 11 Urban 1,000 130 407 185 74 fi6 37 Iii
Division 9 Rural 1,000 639 263 110 3fi 1 1 N 1
Urban 1,000 454 21i7 75 62 36 12 12 92 MajOl'Gloup
Rural 70 63 10 00 1,000 555 312 Urban 1,000 136 216 170 151 99 31 46 161
91 Rural Urban 1,000 1,000
92 Rural 1,000 339 475 84 68 29 4 1 Urban 1,000 184 153 155 168 84 32 19 205
93 Rural 1,000 208 579 146 45 17 Ii Urban 1,000 434 351 73 38 28 13 6 57
94 Rural 1,000 959 35 4 1 1 Urban 1,000 668 177 34 6 12 2 6 95
95 Rural 1,000 fi40 364 91 Urban 1,000 362 181 138 170 63 11 8li
96 Rural 1,000 868 132 Urban 1,000 612 360 12 I 25
98 Rural 1,000 1,000 U~ban
99 Rural Urban
1,000 1,000
M/B{D)1&<U-500-27-3-76GIPS
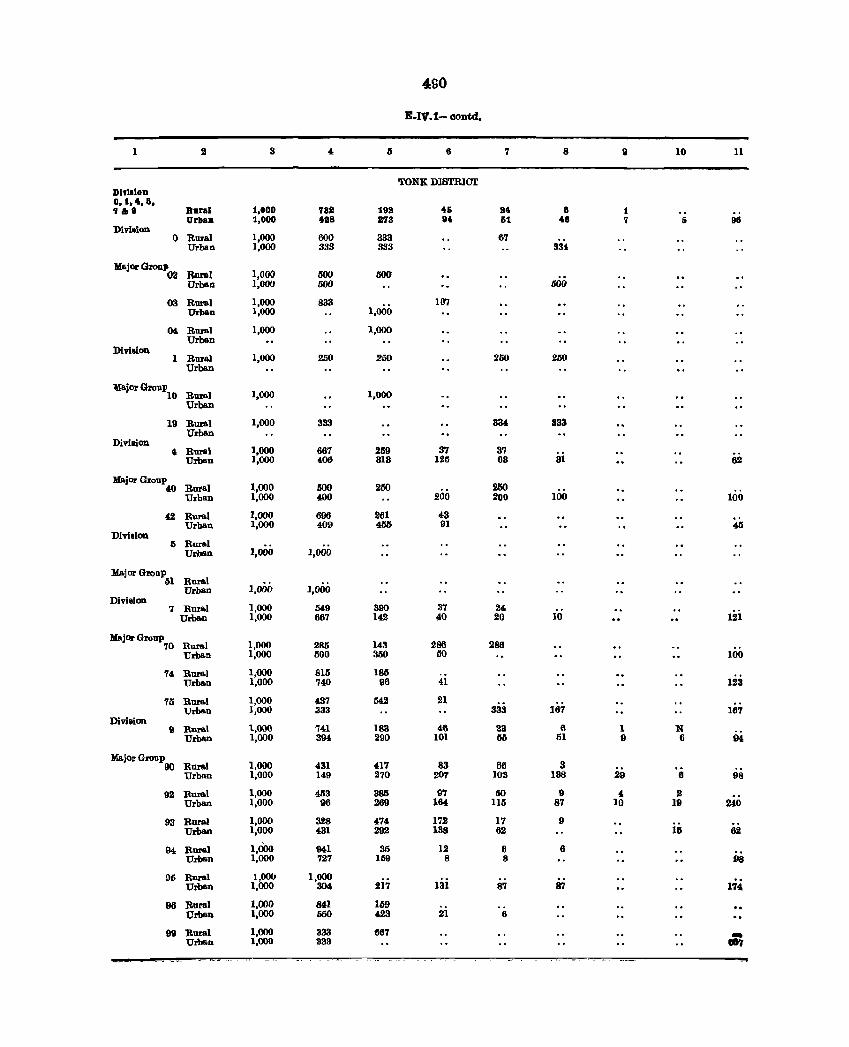
4S0
E-IV.1- oontd.
1 2 3 4 6 6 7 8 9 10 11
TONK DISTRICT DlvllloD 0, t,4, 6, 'lila Bural 1,000 732 1811 46 114 8 t
UrbaD 1,000 4118 878 84 61 48 7 6 98 Divilion
0 Rural 1,000 600 333 67 Urban 1,000 33a aas 3Si
lIIajor Group RIll'III 1,000 500 500 02 Urban 1,000 (j()() 600
03 Rural 1,000 833 1,000
167 Urban 1,000
04 Rural 1,000 1,000 Urban
Diviuon 1 Rura.] 1,000 250 250 250 250
UrbaD
VajorGroup 10 :Rural 1,000 1,000
Urban
19 :Rural 1,000 333 334 333 Urban
Diviaion 1,000 37 4 Rural 667 269 3'7
Urban 1,000 406 313 125 63 31 62
Major Group Rural 1,000 500 260 2110 40 Urban 1,000 400 200 200 100 100
42 Rural 1,000 696 261 43 Urban 1,000 409 4li5 91 45
Divilion 5 Rural
Urban 1,000 1,000
Major GroDP Rura.l 61
1,000 1,000 Urban Division
1,000 37 '7 Rural 049 390 24 12i Urban 1,000 667 142 40 20 10
MajO!' Group Rural 1,000 285 143 286 286 70
100 Urban 1,000 500 360 50
74 Rural 1,000 815 186 Urban 1,000 740 96 41 123
75 Rural 1,000 437 542 21 Urban 1,000 333 333 167 167
Divi,ion .., :Ru1'&1 1,000 741 183 46 23 6 1 N 94. Urban 1,000 394 290 101 55 51 9 6
MajorGronp 00 Rural 1,000 431 417 83 66 3
Urban 1,000 149 270 2()7 103 138 29 6 98
92 :Rural 1,000 453 385 97 00 9 4 2 Urban 1,000 96 269 164 115 87 10 19 240
93 Rural 1,000 328 474 172 17 9 Urban 1,000 431 292 138 62 15 62
94 :Rural 1,000 941 35 12 6 6 Urban 1,000 727 159 8 8 98
95 Rural 1,00lI 1,000 2i7 lsi 174 Urban 1,000 304 8'7 87
96 Rural 1,000 841 1119 Urban 1,000 550 423 21 6
99 :Rural 1,000 333 667 -Urban 1,000 333 .., . -.. - - -~-
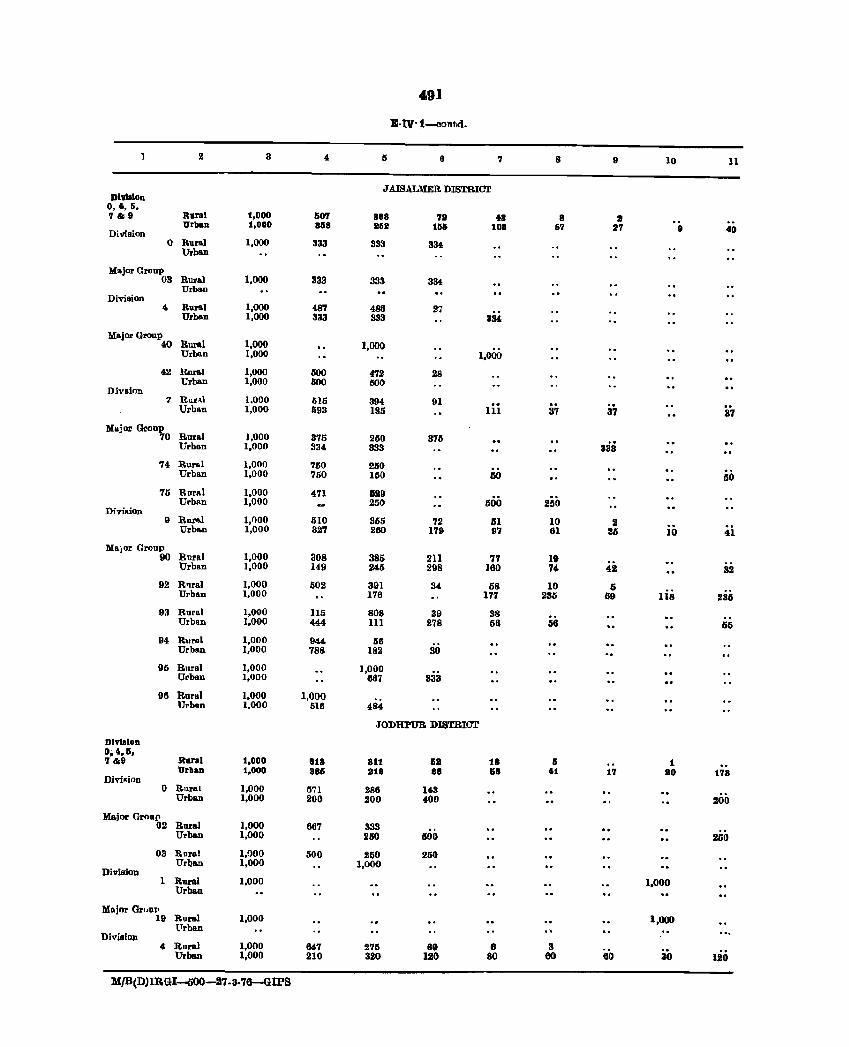
491
E-IV- ~--contd_
1 2 3 15 8 7 8 9 10 11
JAISALMER DISTRIar DlvI.lon
0,.,5, 7&9 Rural 1,000 507 888 711 .8 8 II
Urban 1,000 8158 Blill 1li6 1011 67 117 9 .0 Division 0 Rurlll 1,000 333 333 334
Urban
Major Group 03 Rura.) 1,000 333 333 334
Urban Division
4 Rursl 1,000 487 486 27 Urban 1,000 333 333 334.
Ma.jorGroup Rural 1,000 40 1,000 Urban 1,000 1,000
42 Rursl 1,000 500 472 28 Urba.n 1,000 1i00 MO
Divsion 7 Rur"! 1.000 515 394 91
Iii .. 37 Urban 1,000 1193 185 37 37
Major Group Rural 1,000 375 875 70 2150
333 Urban 1,000 334. 333
7t Rural 1,000 750 2150 Urban 1,000 750 150 50 50
71i RurAl 1,000 471 H9 U1'ba.n 1,000 250 500 250
DiviRion 9 Rur",1 1,000 1i10 355 72 51 10 2
Urbn.n 1,000 327 260 179 97 61 25 10 41
Major Group Rtlrlll 1,000 308 386 211 77 It 90 Urban 1,000 149 245 298 160 74 42 32
92 R'11'al 1,000 502 391 34 58 10 Ii Urban 1,000 176 177 235 59 118 235
93 Rural 1,000 115 808 39 38 Urban 1,000 444- III 278 511 58 65
9" Rural 1,000 944 58 Urbm 1,000 788 182 30
95 R.lral 1,000 1,000 Urban 1,000 667 333
96 Rnrlll 1,000 1,000 UrbAn 1,000 616 484
-JODHPUR DISTRlar
DlvlJloD O. ".6.
1,000 18 6 1 7 &9 Rura. 818 811 1111 nOan 1,000 8B6 IltB BB &8 11 17 80 178
Divi_inD 0 Rural 1,000 1S71 286 14,3
Urban 1,000 200 200 4()0 200
M&jor Group 1,000 02 Rural 667 333
500 Urban 1,000 250 250
03 Rural 1,000 500 250 200 Urb&n 1,000 1,000
Division 1 Rural 1,000 1.000
Urban
Ma.jllr GrhUJ' Rur .. ! 1,000 1,000 19 (Trban ..
Divi8ion 3 4. Rura! 1,000 84'7 275 69 8
60 30 120 UTban 1,000 210 320 120 80 80
M/B(D) IBGI-OOO-.II7. a.76-GIFS
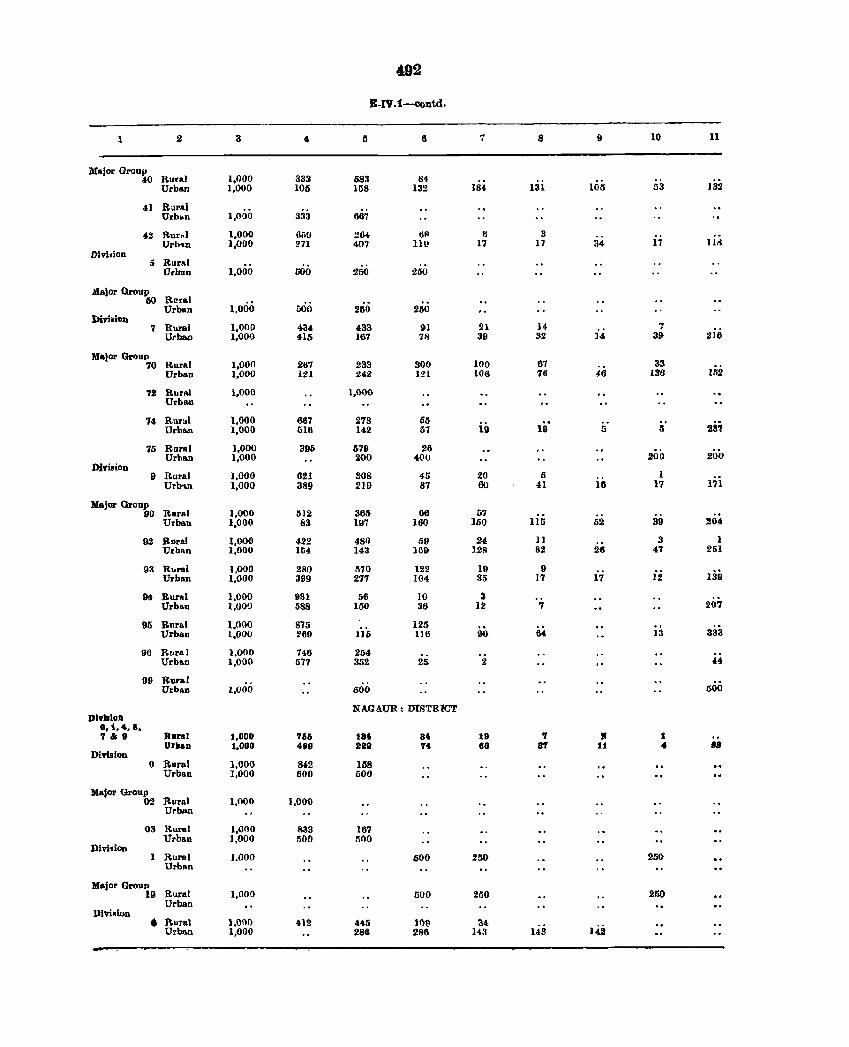
492
E-IV.1_ontd,
2 3 4 ti 6 7 8 9 10 11
Major G1"OUil 1,000 333 40 Runl 683 84 uii; Urban 1,000 105 158 132 IS~ 131 53 )32
41 Rarlli Urban 1,01)0 333 667
42 RurMI 1,000 OMJ !!M 61' II 3 Urb .. n 1,000 ~71 407 III! 17 17 34 11 1l~
Divi.ion 5 Roral
Urban 1,000 500 250 250
Malar Group R!!ral 60 Urblln 1,000 500 251) 250
Diviaion 7 Rural 1,000 434 433 91 21 J4 7
Urbau 1,000 415 167 711 30 32 14 39 :H6
Major Grl)oP 1,000 100 67 33 70 Rural 267 233 300
Urban 1,000 121 242 l:?l 100 76 46 136 152
72 Rurfll 1,000 1,000 Urban
74 Rural 1,000 667 278 55 i9 IiI 23; Urban 1,000 616 142 51 5 Ii
75 Rural J,OOO 395 679 26 Urban 1,000 200 400 200 200
Divieion 9 Rural 1,000 621 30S 45 20 II 1
Urb-t.n 1,000 389 219 87 60 41 18 17 171
Major Group 90 Rural 1,000 512 365 66 57
Urban 1,000 (S3 1117 160 150 115 52 39 204
92 Rural 1,000 422 480 59 24 ]) :I 1 Urban 1,000 154- 143 160 l2!1 82 26 47 251
93 R1or81 1,000 280 570 122 10 9 ii Urban 1,000 399 277 104 35 17 12 130
94 Rural 1,000 931 56 10 3 Urba.n 1,000 588 150 36 12 7 207
95 Rtlra.1 1,0(10 875 125 Urban 1,000 :l1I9 115 116 90 64 13 333
96 Rt.ral 1,000 746 264 Urban 1,000 577 352 25 2 U
99 Rural Urb"n 1,000 500 600
NAGAUR, DISTRICT DI91110D
0,i,4, I, 7&9 Barsl 2,000 75& t8' 8' 29 7 R :l
UrltaD 1,000 4119 8211 74 86 8'1' 11 4 B8 Dirillion
0 Rural 1,000 842 158 Urban 1,000 600 500
Major Group 02 Rural 1,000 1,000
Urban
03 Ru.a'! I,GOO 833 167 Urban 1,000 500 500
Dividon I Rural 1.000 500 250 250
Urban
Major Group 19 Rural 1,000 500 250 21)0
Urban lliviRlun , Rural 1,01)0 412 445 109 34,
142 Urba.n 1,000 286 286 143 US
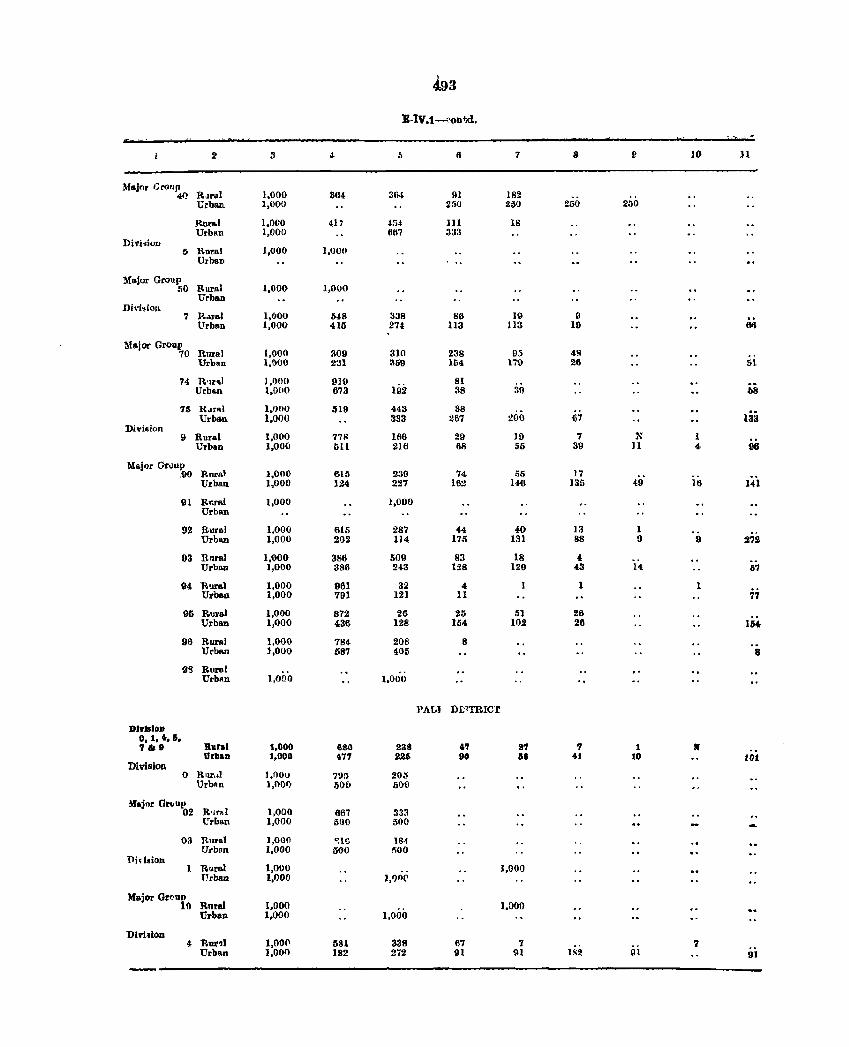
493
E.IV.l-('on t,d,
! [, 6 7 8 10 11
Major j]I")IIP 4P. Roral 1,000 364 3M III 182
Urban 1,000 250 260 250 250
Rural 1,000 417 ~!H III 18 Urblln 1,000 667 333
Divi<iull I) Rural 1,000 1,000
Urban
Major Group Rural 1,000 1,000 50 Urban
Dh-i~ion 7 R,lf"! 1,000 548 338 86 19 0
Urban 1,000 415 274 113 113 19 66
!lla.j or Grollp 70 Enrol 1,000 309 310 238 IJS 4!1
Urb~n 1,1)00 231 :159 164 179 26 51
74 R'Il!!,1 l,r)I)O 919 192
81 Urb .. n 1.000 673 38 311 68
711 R .. r"! 1.QOO :119 443 38 133 Urban 1.000 333 21i7 :100 67
Division 9 Rural 1,000 771l 1E16 29 19 7 N 1
Urban 1,000 511 216 68 55 39 II 4- 96
Maj')r Gruup Rnral I,OnO 230 7. 55 17 .90 615
14i Urban 1,000 124 227 162 146 135 49 111
III &"r61 1,000 1,000 UrbAn
92 Rural 1,000 615 287 44 40 13 1 Urban 1,000 202 114 175 131 88 {I 9 272
93 Rllral 1,000 31lS 509 83 18 4,
Urban 1,000 386 243 128 129 43 14 51
94 Rural 1,000 961 32 4- 1 1 Urban 1,000 791 121 II 77
91> RuraJ 1,000 872 26 25 51 26 Urban 1,000 436 128 154 102 26 154
96 Rural 1,000 784- 208 8 Urban ),000 587 !l05 8
95 Rural 1.000 Urb"n 1,000
1'ALI DI~lTRIC'r
DI.,18108 0,1, •• 6. 7&9 Kllral 1.000 680 238 47 21 7 1 " Urban 1,000 .77 226 90 58 41 10 lOt
Division 0 Rltr,.1 I,nov 795 205
Urb.n 1,flOf) SOO 500
Major Grllut' R'jr.l 02 1,000 667 333 l"rban 1,000 500 500
03 Rllral I,OO!! '!IG 18·( Urb~n 1,000 500 !'i00
Tliddon 1 Rural 1,000 1,000
Urban 1,1)00 1,1)1)(1
Major Gr"1J!t 19 Rural 1,000 1.000
Urban 1,000 1,000
Division 4 Rur~1 1,00(1 581 338 67 7
Iii 7
Urban 1,000 182 272 91 91 IS2 91
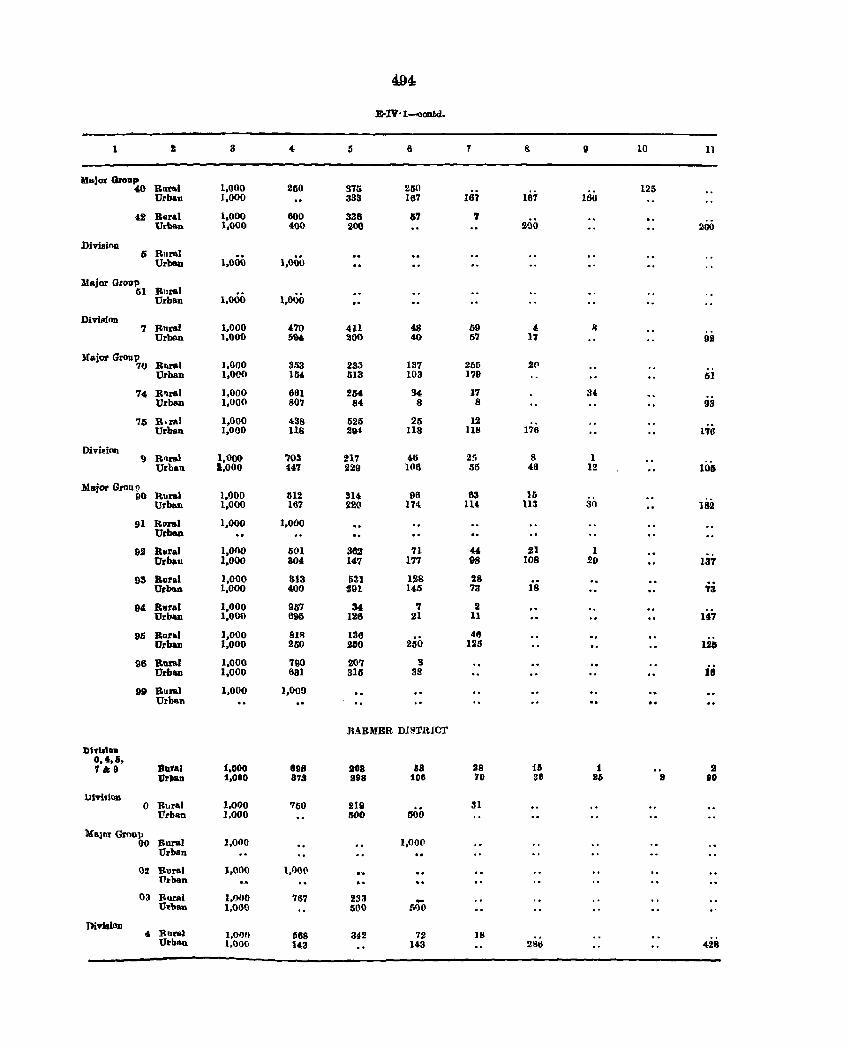
494
E-IV·l~ontd.
1 2 3 IS 6 '! & 9 10 11
M ... )or Groop Rara.l 1,000 250 250 40 375
uii 125
Urba.n 1,000 333 167 167 166
42 Rora.1 1,000 600 336 87 '1 U~ban 1,000 400 200 llQO 200
Division (; Rural 1,000 l,O~O UrbaIJ
Major GtOD'P R1tral 51
1,000 1,01)0 Urban
Divbion 7 Rural 1,000 ,no 411 48 69 4 R
Urban 1,000 594. 200 to 5'1 17 92
Major Group 70 Rural 1,000 353 233 137 266 2('
Urban 1,000 Ui4 513 103 l'i9 lSI
74 R'Iral 1,000 601 254 94 17 3" Urban 1,000 80'1 84 8 8 93
75 R,ral 1,000 "38 525 25 12 Urban 1,000 Us 20.' US 118 176 176
Divieion ') Rflral 1,000 '103 217 46 25 8 I
Urban 1,000 44'1 229 1(16 55 40 12 101
Major Grou(l Rural 1,000 512 Sl4 96 63 ]5 90 Urban 1,000 167 220 174, lU 113 30 182
91 RlJral 1,000 1,000 Urban
92 Rural I,ono 501 SII!! 71 44 21 I Urball 1,000 304 147 177 98 108 20 137
93 Roral 1,000 313 531 U8 28 Urban 1,000 400 S91 145 73 18 18
94 Raral 1,000 91S7 34 '1 2 Urban 1,000 696 126 21 11 1&7
95 Runl 1,000 8IR 138 250
46 Urban 1,000 250 250 U5 Illb
98 Rura,1 1,000 7110 207 3 io Urb&ll 1,000 631 315 3R
99 Rural 1,000 1,000 Urbrt.n
J~ABMER DlSTR.ICT
DlvbloD 0,',5. t,ooo 7&11 Rural 898 208 liB 88 15 1 9
'lJrllaD :1,000 B7S 298 106 70 118 2li 8 80
Ulvi,ion 0 R .. ral 1.000 750 219 .. 31
t'rban 1,000 1Kl0 1100
Malar Grnu}> RIU'SI J,OIlO 1,000 00 Urban
02 Bural 1,000 1.000 Urban
03 Bural 1,000 767 233 500 Urban 1.000 500
Divfsion Rural .. 1.000 1i68 342 72 ]8 Urban 1.000 143 143 2Ktl 428
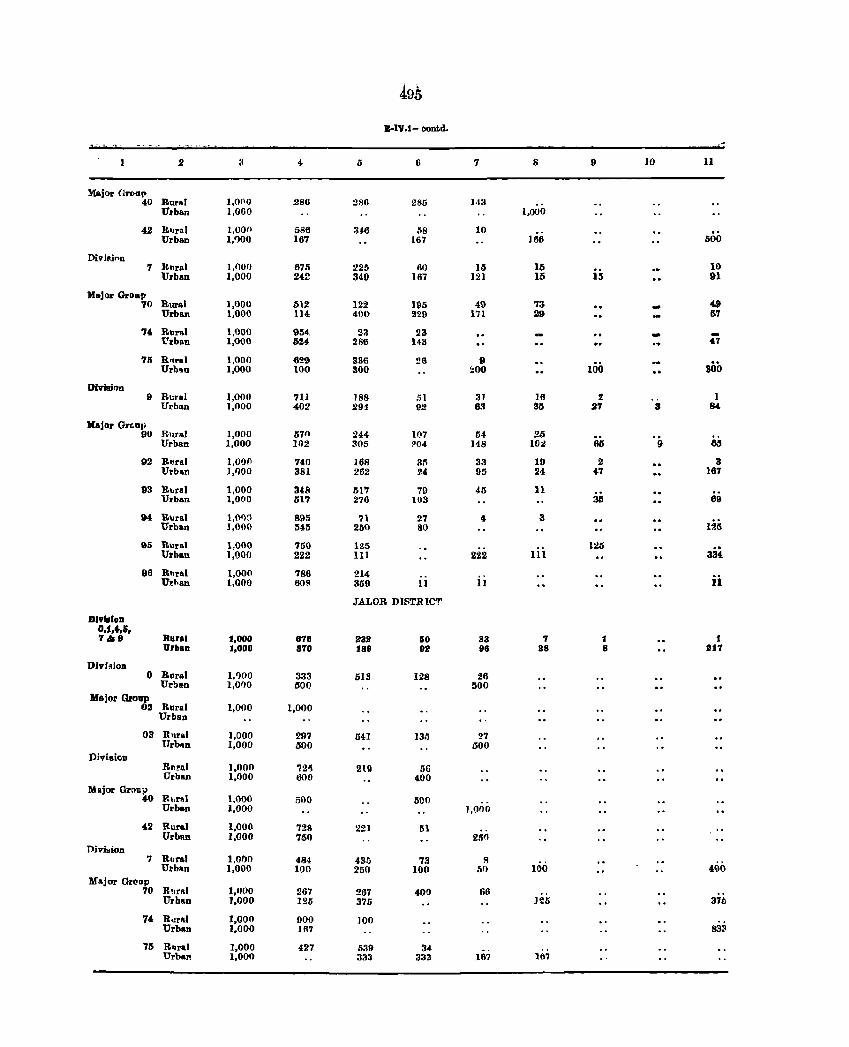
495 Z-IV.1- contd.
.2 :~ 4 5 6 7 8 9 ]0 11
Major Groa" 40 Rural 1,0(10 286 :l86 285 143
Urban 1,000 1,000
42 Rllral l,oon 586 :146 .~8 10 Urban 1,1)00 167 167 166 500
Divillinn '7 Rllral 1,000 675 225 60 15 15 10
Urban 1,000 242 349 1117 121 15 15 91
Major Groll? 70 Rural 1,000 512 122 195 49 73 49
Urban 1,600 114 400 2~9 I'll 29 57
74 Runl 1,000 954. 2:1 23 -"['rban 1,000 524 286 143 '" '75 R'lr'" 1,000 629 336 26 D
l()O 300 Urb'lD 1,000 100 300 ~OO
Division 9 Rural 1,000 711 188 51 :11 ]6 :! I
Urhan 1,000 402 29-1 9:! 83 35 27 3 84
lIajor Grf.lIl' 90 Rural 1,000 570 244 107 M 25 '9 Urban 1,000 102 1105 ?04 148 10:.! 66 65
92 R"ral 1,090 740 168 !Ill 33 19 2 3 Urh"n 1,1)00 381 262 24 95 24 .7 167
93 R"ral 1,000 34.8 517 79 45 11 Urban 1,000 517 276 103 3li 69
94. RlJral l,Of)~ 895 71 27 4 3 lii; Urban ],000 545 250 80
95 Rural 1,000 750 125 125 .. Urban 1,000 222 III 222 III 334
06 RIlral 1,000 786 214 ii Urhan 1,000 60~ 359 11 II
JALOR DISTRIC'r
DlylllDD 0.1 ..... 5. 7 •• Rura. 1.000 816 2311 60 83 7 1 1
U"nan 1.000 810 189 911 96 2S 8 1111
Diyi~ion 0 Rpra) 1,1)00 333 513 128 26
Urban 1,0[10 500 500 Major Group
02 Rural Urban
1,000 1,000
03 R'lra) 1,000 297 541 I3.~ 27 l1rb~n 1,000 500 500
Diviaion Rn~al 1,000 72') 219 56 Urban 1,000 000 400
Major GrClllj) 40 RurAl 1,000 500 500
Urban 1,000 1,000
42 Rural 1,000 728 221 51 .. Urban 1,000 750 21)0
Divi..ion 7 Rllral 1,01)0 484 435 73 II
400 Urb'ln 1,000 100 250 100 50 100 Yajor Group
70 RlIr,,1 1,000 267 267 400 66 Urban 1,000 125 375 125 37ll
74 R"ral 1,000 900 JOO Urban 1,000 187 83'
75 R~ra) 1,000 427 539 34 Urban 1,000 333 333 187 187
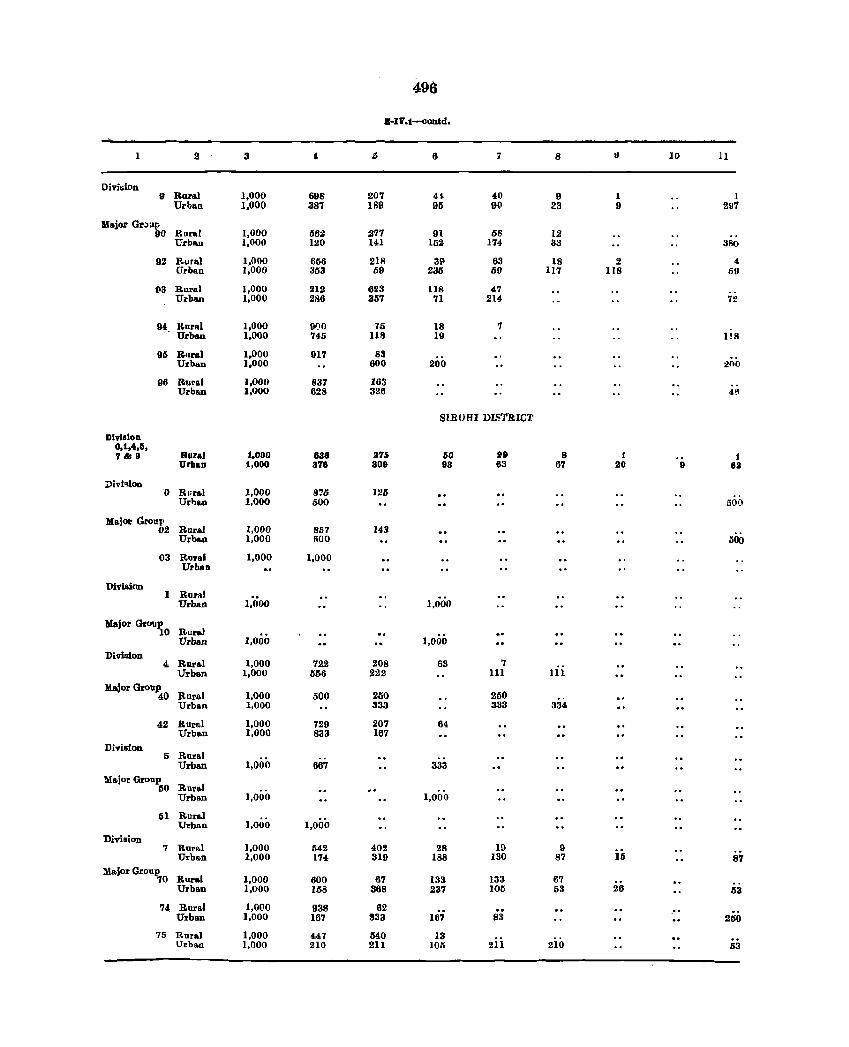
498
B-IV.t-oontd.
1 2 3 I) 6 7 8 10 11
Division 9 Rural 1,000 698 207 H 40 9 1 1
Urban 1,000 387 IfIll 95 90 23 9 297
Major GNap 90 Raral 1,000 562 277 91 5S 12
Urban 1,000 120 141 152 174 33 380
92 Rural 1,000 666 21R 3P 63 18 2 4 Urban 1,000 353 59 235 59 117 liS 59
93 Rural 1,000 212 623 US 47 Urban 1,000 286 357 71 214 72
9~_ Rural 1,000 91)0 75 18 7 Urban 1,000 745 IlF.I 19 lI8
95 Rural 1,000 917 83 Urban 1,000 600 200 21\0
96 Rural 1,000 837 163 Urban 1,000 628 326 4!1
SIROHI DISTRIC'l:
Division 0,1,40,5, 7.t19 Rural 1,000 838 3'75 liO 19 8 1 1
Urban 1,000 376 309 113 83 67 20 II 83
mvi'liOD 0 Rillal 1,000 11'5 )26
Urhau 1,000 500 50(1
Major Grolll' 02 Raral 1,000 8117 143
Urba.u 1,000 500 500
03 R.nal 1,000 1,000 UrbaD
Divillion I Rural
Urban 1,000 1,000
Major Group Rural 10
],000 Urbau 1,000
Division 4 Rural 1,000 722 208 63 7
Urban 1,000 556 222 111 III
:Major Group 40 Rurlll 1,000 500 250 250
Urban 1,000 333 333 334
42 Rural 1,000 729 207 64 Urban 1,000 833 167
Division I) Rural
Urban 1,000 667 333 'Major Group
Rur&l 50 1,000 Urban 1,000
51 Rur&l Urban 1,000 1,000
Division 7 RurAl 1,000 542 402 28 19 9
Urb&n 1,000 174 319 188 130 87 15 87 Major Group
Rural 70 1,000 600 67 133 133 67 Urban 1,000 158 368 237 105 53 26 53
74 Rura.l 1,000 938 62 .. Urban 1,000 167 833 167 83 250
75 Rural 1,000 447 540 13 Urban 1,000 210 211 105 211 210 53
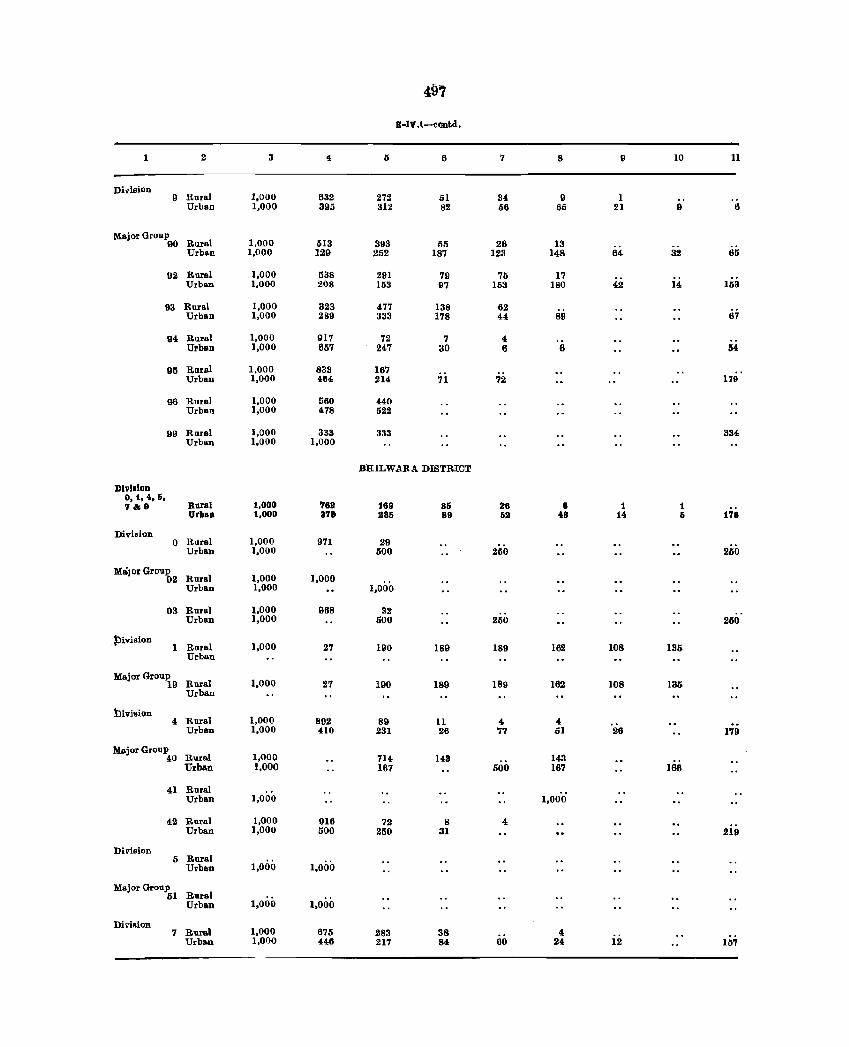
49?
B-IV.(-contd.
1 2 3 4 5 6 7 8 9 10 11
Dbision Rural 9 1,000 632 272 51 34 9 1 Urban 1,000 395 312 82 56 66 21 9 6
Major GrouP90 Rural 1,000 513 393 55 26 13 Urba.n 1,000 129 252 187 123 148 64 32 65
92 Rural 1,000 538 291 79 75 17 Urban 1,000 208 163 97 153 180 42 14 153
93 Rural 1,000 323 477 138 62 Urban 1,000 289 333 178 44 89 67
9' Rur .. ! 1,000 917 72 7 4 Urban 1,000 657 247 30 6 6 54
95 Run! 1,000 833 167 Urb .. n 1,000 464 214 71 72 179
96 Rur .. ! 1.000 560 440 Urbo.n 1,000 478 522
99 Rur .. ! 1,000 333 333 33' Urban 1,000 1,000
BlIlLWABA DISTRICT
DlvllloD 0,1,4,6, 7&9 Rural 1,000 7611 169 86 86 8 1 1
Urban 1,000 87. 1185 89 611 48 14 6 178
Division 0 Rural 1,000 971 29
Urban 1,000 500 250 250
M&lorGroup 02 Rural 1,000 1,000
Urban 1,000 1,000
03 Rural 1,000 968 32 Urban 1,000 500 250 250
, j)ivision 1 Rura! 1,000 27 190 189 189 162 108 135
Urban
M .. jorGroup 19 Rural 1,000 27 190 189 189 182 108 135
Urba.n
Division
" RUIa.1 1,000 892 89 11 4 4 Urba.n 1,000 410 231 26 77 61 26 179
Ma.jorGroup 40 Rnra.l 1,000 71i US 143
Urba.D 1,000 167 500 167 166
41 Rural Urban 1,000 1,000
42 Rural 1,000 016 72 8 4 Urban 1,000 500 250 31 219
Division 5 Rural
Urban 1,000 1,000
M .. jor Group 51 Rural
Urban 1,000 1,000
DiviRion 7 Rural 1,000 675 283 38 4
Urban 1.000 446 217 84 60 24 12 1117
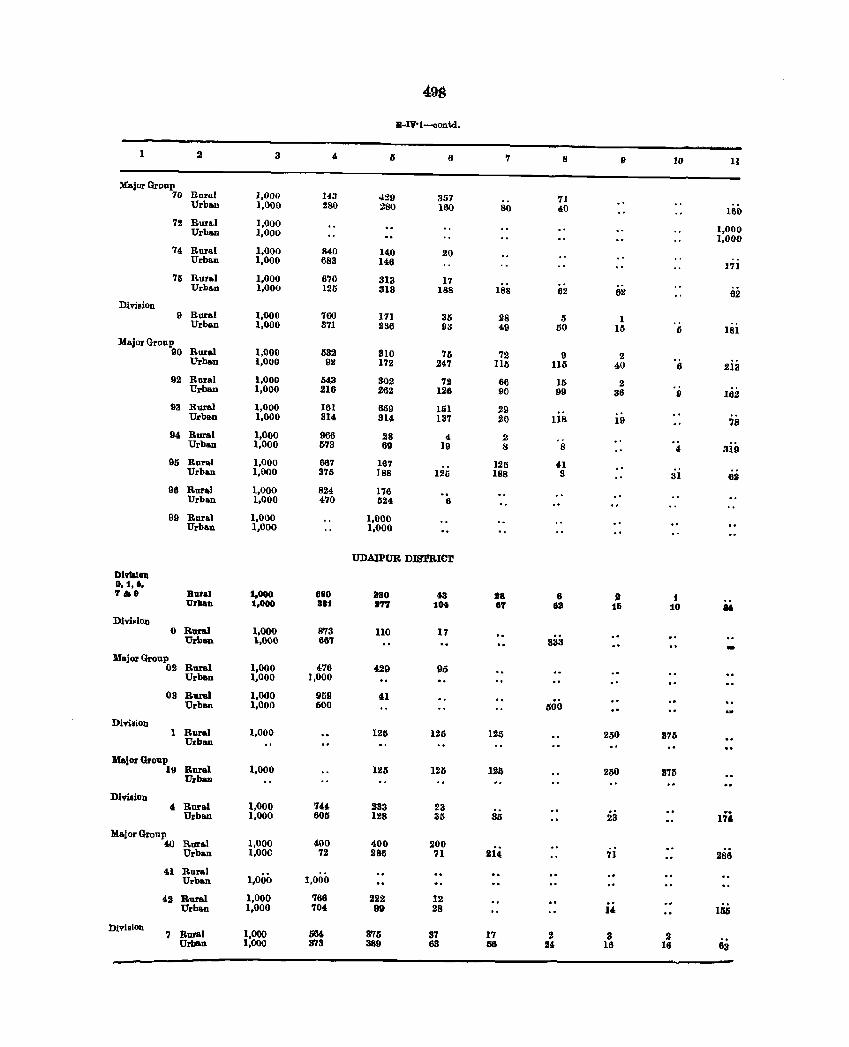
49a
B-IV·l-contd.
2 3 4 5 6 7 8 II 10 11
r.rajorGroup 70 Rural 1,000 143 429 357 71 Urban 1,000 280 280 160 80 40 160 72 RUrlLl 1,000
1,000 Urban 1,000 1,000
74 Rural 1,000 840 l<l0 20 Urban 1,000 683 146 17]
75 Rural 1,000 670 313 17 Urba.n 1,000 125 313 188 188 62 62 62
Division 9 Rural 1,000 760 171 35 28 5 1 Urban 1,000 371 236 93 49 50 15 5 181
Major Group Rural 90 1,000 532 310 71i 72 II 2 Urban 1,000 92 172 247 115 115 40 6 213
92 Rural 1.000 li43 302 72 66 15 2 Urban 1,000 216 262 126 90 99 36 I) 182
93 Rural 1,000 161 609 llil 29 Urban 1,000 314 314 137 20 118 19 78
94 Rural 1,000 966 28 4 2 Urban 1,000 573 69 19 8 8 4 319
95 Roral 1,000 667 167 125 .u Urban 1,000 375 188 125 188 3 3] 62
96 Ror.1 1,000 824 176 Urban 1,000 470 1124 6
99 Rural 1,000 1,000 Urban 1,000 1,000
UDAIPUR DISTRICT
DlY"!OIl 0, t, I, 7159 Baral 1,000 CIao 880 13 28 8 It t Vrllan 1,000 88t 877 1" CIT CllI 11i 10 ... Divi~ion
0 Ruru 1,000 873 110 17 .. Urban 1,000 661 333 -MBjorGroup 02 Rural 1,000 476 429 95
Urban 1,000 1,000
03 Rural 1,000 959 dol Urban 1,000 500 500
Division 1 Rural 1,000 125
Urban 125 125 250 375
Major Group Rural 1,000 125 125 126 250 375 19 Urbau
DivisiOn 4 Rural 1,000 744 233 23
23 In Urban 1,000 605 128 35 35
Major Group 1,000 '00 400 200 40 Rural
2i, 'ii 288 Urban 1,00C 72 286 71
4.1 Rura.l 1,000 Urban 1,000
42 :Rural 1,000 766 222 12 i4 lSi; Urban 1,000 704 99 28
Divl.lon 7 Rural 1,000 5M 375 37 17 2 3 2
Urban 1,000 373 389 63 56 24 16 16 63
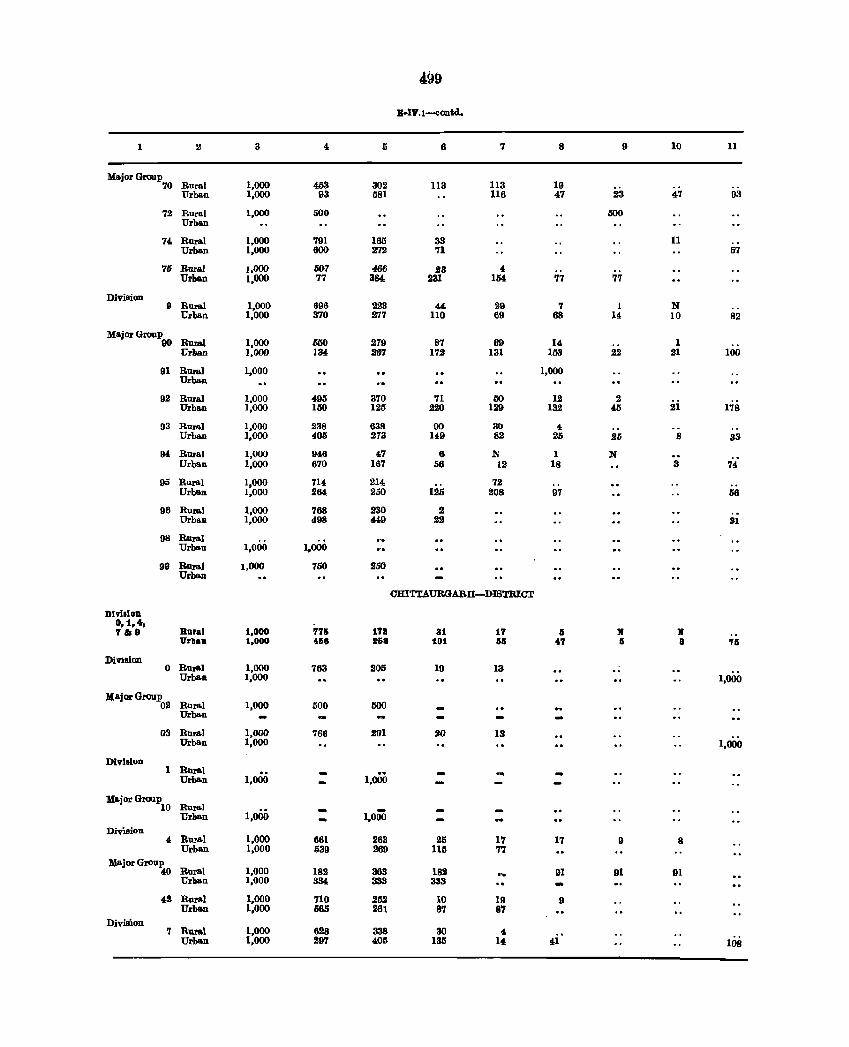
499
B-IV.1-eontd.
1 2 3 4 Ii 6 7 8 9 10 11
Major Group 70 Rural 1,000 4Ii3 302 113 113 19
Urban 1.000 93 581 116 47 23 47 93
72 Rural 1,000 500 1500 Urban
74 Rural 1,000 791 165 33 11 Urban 1,000 600 272 71 57
76 RUl'al 1,000 007 466 .23 4 Urba.n 1,000 77 384 231 1M 77 77
Division 9 Rural 1,000 896 223 44 29 7 1 N
Urban 1,000 370 277 110 69 68 14 10 82
Major Group 90 Rural 1,000 600 279 87 69 14 1
Urban 1,000 134 267 172 131 153 .22 21 100
91 Rural 1.000 1,000 Urban
92 Rural 1,000 495 370 71 50 12 2 178 Urban 1,000 150 1.25 .220 129 132 45 .21
93 Rural 1,000 238 638 90 30 4 Urban 1.000 405 273 149 82 26 26 8 33
94 Rural 1,000 1146 47 6 N 1 N Urban 1,000 670 167 56 12 18 3 74
95 RlI1'&l 1,000 714 214 72 Urban 1,000 264 260 125 208 97 66
96 Rural 1,000 768 230 2 Urban 1,000 498 449 22 31
98 Rnral Urban 1,000 1,000
99 Boral 1,000 750 250 Urban
CHI'lTAURGARH-DISTRICT
DI 9'151 on 0.1 .... '&9 Rural 1.000 775 1711 31 17 Ii If 11
Urba. 1.000 4116 116a 101 66 n Ii 8 '71i
DiV18ion 0 RII1'&I 1,000 763 205 19 13 ..
1,000 Urban 1,000
MajorGroop 02 Rural 1,000 500 500
Urban
03 Rural 1,000 766 201 20 13 Urban 1,000 1,000
Division 1 Rural
1,000 1,000 Urban
MBjorGroop Rural 10
1,000 1,000 Urb&n
Division 4 RUl'a! 1.000 661 263 25 17 17 9 8
Urban 1,000 539 269 115 77 Major Group
40 Rural 1,000 182 363 182 91 91 91 Urban 1,000 334- 333 333
42 Rural 1,000 710 .252 10 19 9 Urb&n 1,000 585 261 87 87
Division 7 Rural 1,000 628 338 30 4
Urban 1,000 297 406 135 14 41 108
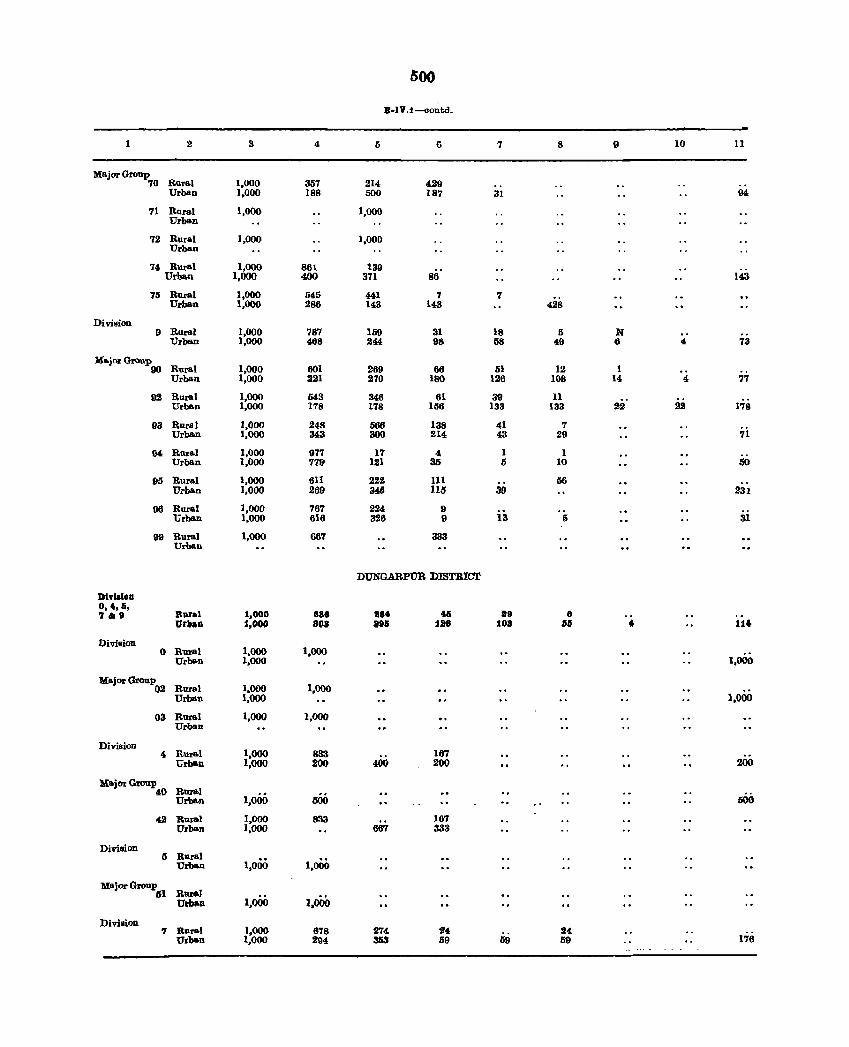
500
B-IV.1-<lontd.
2 3 4 5 6 7 S 9 10 11
Major Group 70 RUral 1,000 357 214 4.29
Urban 1,000 188 500 187 31 94
71 Rural Urban
1,000 1,000
72 Rural Urban
1,000 1,000
74 Rural 1,000 861 139 Urba.n 1,000 400 371 86 143
75 Rural 1,000 545 441 '1 7 Urban 1,000 286 143 143 428
Division 9 Rural 1,000 787 159 31 18 I) N
Urban 1,000 468 244 98 68 49 6 4 73
Ma.jorGroup 90 Rural 1,000 601 269 66 51 12 1
Urban 1,000 221 270 ISO 126 108 14 4 77
92 Rural 1,000 543 346 61 39 11 Urb&n 1,000 178 178 11;6 138 133 22 22 178
93 Rural 1,000 248 566 138 41 7 7i Urban 1,000 343 300 214 43 29
94 Rnra.l 1,000 977 17 4 1 1 Urba.n 1,000 779 121 35 I) 10 50
95 Rural 1,000 61l 222 III 56 Urban 1,000 269 346 115 39 231
96 Rural 1,000 767 224 9 ai Urban 1,000 616 326 9 13 I)
99 Rural 1,000 667 333 Urban
DUNGARPUl't DISTRICT
Dl .... [08 O,.,Ii, 7&8 Rural 1,000 88. 1184 46 11'8 8
Vrlta8 1,000 a08 leli 1le 10' 55 ., 1a
Division 0 Rural 1,000 1,000
Urba.n 1,000 1,000
Ma.jor Group Rural 1,000 1,000 02 Urban 1,000 1,000
03 Rural 1,000 1,000 Urban
Division 1,000 4 Rural 833 167
Urban 1,000 200 400 200 200
MajorG!oup Rural 4.0 1,000 000 000 Urba.n
42 Rural 1,000 833 167 Urban 1,000 667 333
Division I) Rural
1,000 1,000 Urban
Major Group Rural 51 1,000 1.000 Urban
Division 1,000 24 'I Ru .... l 678 274 24
Urban 1,000 294 353 59 59 59 176
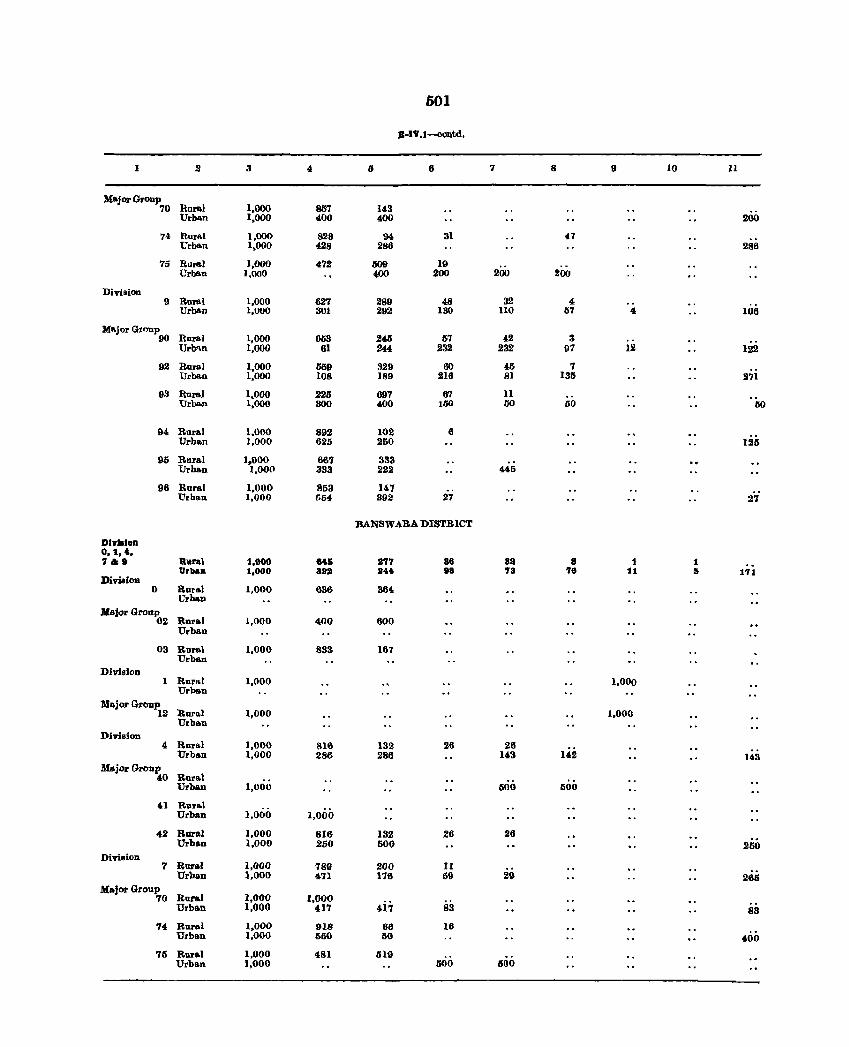
601
B-IV.I-C(llltd.
I 2 4 IJ 6 7 8 9 10 11
Major Group 70 Rura.l 1.000 857 143
Urban 1,000 400 400 200
74 Rural 1,000 828 94 31 47 Urban 1.000 428 286 286
75 Rural 1,000 472 609 19 200 Urban 1,000 00 200 200
Division 9 Rural 1,000 627 289 48 32 4
Urban 1,000 301 292 130 UO 57 4 106
M"'jor G10llp 90 Rural 1,000 653 245 57 42 3
Urb'\n 1,000 61 244 232 232 97 12 122
92 Rural 1,000 030 329 60 45 7 Urban 1,000 108 189 216 81 131S 971
9.1 Rur",] 1.000 225 697 67 II Urban 1,000 300 400 100 GO 60 50
94 Rural 1,000 892 102 6 Urba.n 1,000 625 250 125
95 Rural 1,000 667 333 Urban 1,00(1 333 222 445
96 Rural 1,000 853 147 Urban 1,000 G54 392 27 27
BANSWARA DISTRICT
Dll'liloo 0,1, " 76. Rural 1,000 64.li 277 88 all 8 1 t
Urban 1,000 aal liI44 98 73 76 11 I> 1'11 DivisioD
0 Rural 1,000 636 36i Crbau
AIajor Group 02 Rural 1,000 400 600
Urban
03 Rural 1,000 833 167 Urban
Division 1 Rural 1,000 1,000
Urban MajO}' Group
12 Rural Urban
1,000 1,000
Division 4 Rural 1,000 816 132 26 26
Urban 1.000 286 286 143 142 143 Major Group
40 Rural Urban 1,000 500 500
41 Rural Urban 1,000 1,000
42 Rural 1,000 816 132 26 26 Urban 1,000 250 500 250
Dividon 7 Rural 1,000 789 200 II
Urban 1,000 471 176 59 29 285 Ma}orGroup
Rural 1,000 70 1,000 4i;' Urb!!.n 1,000 417 83 83
74 Rural 1,000 918 86 18 Urban 1,000 550 50 400
75 Rur!!.l 1,000 481 li19 Urban 1,000 500 500
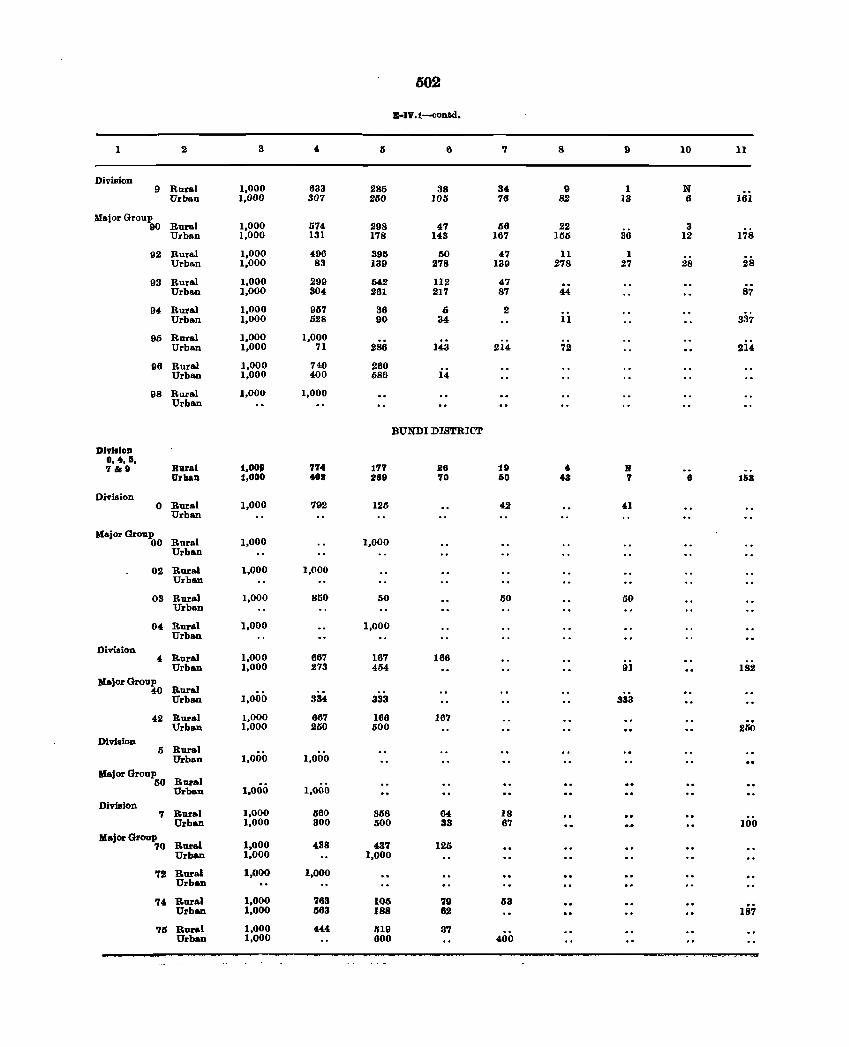
602
B-IV.l-contd.
1 2 3 4 5 6 ., 8 9 10 11
Division 9 Rural 1,000 633 285 38 34 9 1 N
Urba.n 1,000 307 250 105 76 82 13 6 161
Major Group 90 Rural 1,000 574 298 47 66 22 3
Urban 1,000 131 178 143 167 155 36 12 178
92 Rural 1,000 496 395 50 47 11 I 28 Urban 1,000 83 139 278 139 278 27 28
93 Rural 1,000 299 642 112 47 Urban 1,000 304 1I6l 217 87 44 87
94 Rural 1,000 957 36 6 2 33? Urban 1,000 528 90 34 11
95 Rural 1,000 1,000 Urban 1,000 71 286 l4,3 214 72 214
96 Rura.l 1,000 740 260 Urban 1,000 400 686 14
98 Rural 1,000 1,000 Urban
BUNDI DISTRICT
DlvlllDD 0,.,5.
1,OOP 774 177 19 4 If 7&9 Rural 28 l1rbaD 1,000 4011 1189 70 60 43 7 8 163
Division 0 Rural 1,000 792 125 42 41
Urban
Major Group 00 Rural 1,000 1,000
Urban
02 Rural 1,000 1,000 Urban
03 Rural 1,000 850 50 50 50 Urban
04 Rural 1,000 1,000 Urban
Diviaion 4 Rural 1,000 667 167 166
Urban 1,000 273 454 91 182 Major Group
40 Rural Urban 1,000 334 333 333
42 Rural 1,000 667 166 167 Urban 1,000 250 liOO 250
Division 5 Rural
Urban 1,000 1,000
Major Group liO Rural
Urban 1,000 1,000
Division 7 Rural 1,000 660 368 84 18
Urban 1,000 300 600 33 67 100 Major Group
70 Rural 1,000 438 437 125 Urban 1,000 1,000
12 Rural 1,000 1,000 Urban
74 Rural 1,000 763 105 79 53 187 Urban 1,000 563 188 62
711 Rural 1,000 444 519 37 Urban 1,000 600 400
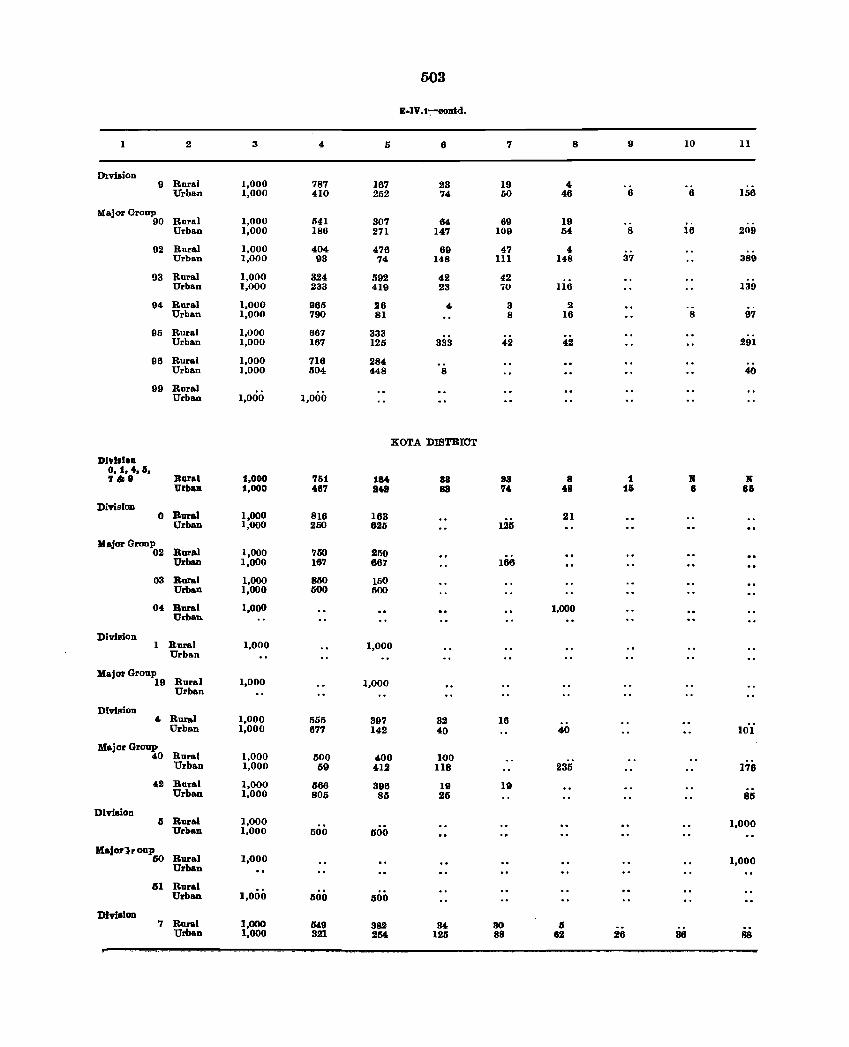
503
B-IV.1-:-oDntd.
2 3 4 5 6 7 8 9 10 II
Dlvision 9 Rural 1,000 787 167 23 19 4
Urban 1,000 410 252 74 50 46 8 6 156
Major Group 90 Rural 1,000 541 307 64 69 19
Urban 1,000 186 271 147 109 54 8 16 209
92 Rural 1,000 404 476 69 47 4 Urban 1,000 93 74 14-8 III 148 37 389
93 Rural 1,000 324 592 42 42 Urban 1,000 233 419 23 70 116 139
94 Rural 1,000 905 26 4 3 2 Urban 1,000 790 81 8 18 8 97
95 Rural 1,000 667 333 Urban 1,000 167 125 333 42 42 291
98 Rural 1,000 716 284 Urban 1,000 504 448 8 40
99 Rural Urban 1,000 1,000
KOTA DISTRICT
D191,loD 0,1, t, 5, 7&8 Bural 1,000 751 1at 88 118 8 1 Ie Ie
Urban 1,000 487 148 83 74 4B 15 8 8&
DivislOD 0 Rural 1,000 816 163 21
Urban 1,000 250 625 125
Major Group Rural 1,000 250 02 750
166 Urban 1,000 167 687
03 Rural 1,000 850 150 Urban 1,000 500 600
04 Rural 1,000 1,000 Urban
DivilioD 1 Rural 1,000 1,000
Urban
Major Group Rural 1,000 19 1,000 Urban
Division 4 Rural 1,000 555 397 32 18
lO'i Urban 1,000 877 142 40 40
Major Group Rural 40 1,000 500 400 100
178 Urban 1,000 59 412 lI8 235
42 Rural 1,000 566 396 19 19 Urban 1,000 805 85 25 85
Division II Rural 1,000 1,000
Urban 1,000 500 500
Major1pouP Rural 50 1,000 1,000 Urban
51 Rural Urban 1,000 500 500
Dlvilion 7 Rural ],000 549 382 34 30 6
Urban 1,000 321 254- 125 8B 6i1 28 38 liB
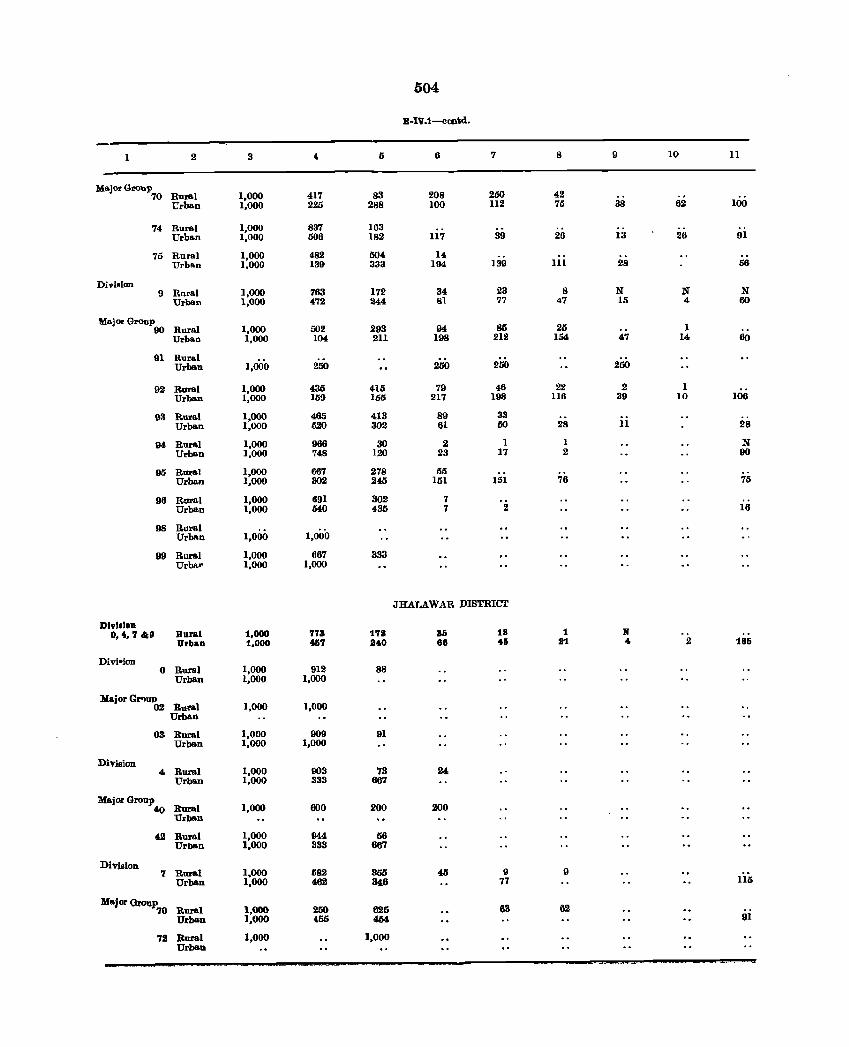
504
E-IV.l--contd.
1 2 3 5 6 7 8 9 10 11
M .. jor QrouJI Rural 1,000 417 83 250 42 70 208 Urba.n 1,000 225 288 100 112 75 38 62 100
74 Rural 1,000 837 163 Urban 1,000 506 182 117 39 2(l 13 26 91
75 Rnr .. l 1,000 482 504 14 Urban 1.000 139 333 194 139 111 28 56
Division 9 Rural 1,000 763 172 34 23 8 N N N
Urban 1,000 472 24.4 81 77 47 15 4 60
'Major Group 1,000 85 90 Rural 502 293 94 25 1
Urban 1,000 104 211 198 212 154 47 14 60
91 Rural Urban 1,000 250 250 250 250
92 Rural 1,000 435 415 79 46 22 2 1 Urban 1,000 159 155 217 198 116 39 10 106
93 Ru.ral 1,000 465 413 89 33 Urba.n 1,000 620 302 61 50 28 11 28
94 Rural 1,000 966 30 2 1 1 N Urban 1,000 748 120 23 17 2 90
95 Rural 1.000 667 278 55 Urba.n 1,000 302 2!5 151 151 76 75
96 Rural 1,000 691 302 7 Urban 1,000 MO 435 7 2 16
98 Rura.l 1,000 Urban 1,000
99 Rura.) 1,000 667 333 Urbar 1.000 1,000
JHALA WAR DISTRICT
Dh'Jllon 0,4,7&9 Rllra.l 1,000 778 178 85 18 1 N
Urban 1.000 457 1140 88 45 lit 4 2 185
Divioion 0 Rural 1,000 912 88
Urban 1,000 1,000
MajorGMUP 02 Rural 1,000 1,000
Urban
03 Rural 1,000 909 91 Urban 1,000 1,000
DiVision 4 Rural 1,000 903 73 24
Urban 1,000 333 867
Ma.jorGroup 40 Rural 1,000 600 200 200
Urban
42 Rural 1,000 944 56 Urban 1,000 333 667
DiVision 7 Rural 1,000 582 355 45 \} \}
liii Urban 1,000 462 346 77
Ma.jor Gl'Oup' Rural 1,000 250 625 83 82 70 Iii Urban 1,000 455 454
72 Rural 1,000 1,000 Urban
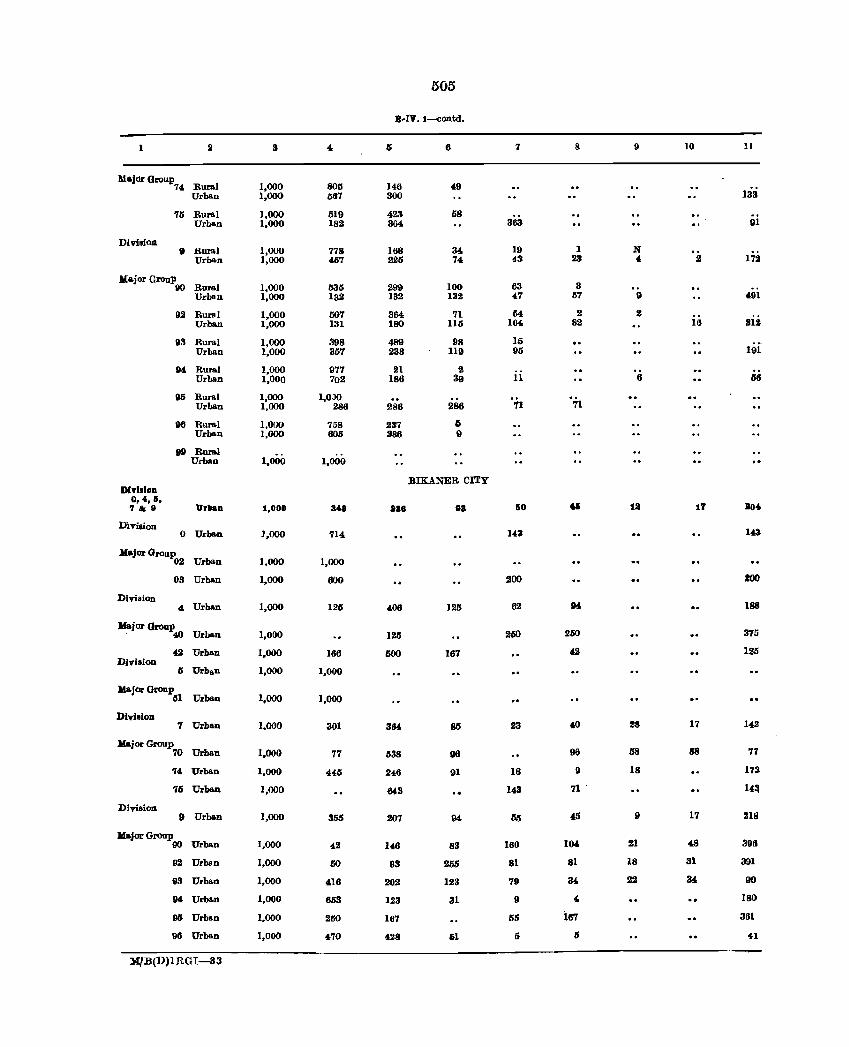
1 2
UajorGroup 74 Rural
Urban
DivisiOI1
'16 Rural Urban
., Rural Urban
M&jorGroup 90 Rural
Urban
DI"I.lon 0,4,5, ,,,,9
Division
92 Rurol Urb&n
93 Rural Urban
94 RU1'&1 Urban
95 Rural Urban
1M! Rural Urban
911 Rural Urban
Urllan
o Urban
Major Group 02 Urban
03 Urban
Divi.ion 4 Urban
HajorOroup . 40 Urban
~ Urban Division
IS Urbsn
Ma.jor Group 151 Urban
Divi8iou 7 Urban
Major Group '10 Urban
Division
74 Urban
76 Urban
., Urban
Kajor Group 90 Urban
92 Urban
93 Urbau
94 Urban
95 Urban
96 Urban
XfB(D)lRGI-33
3
1,000 1,000
1,000 1,000
1,000 1,000
1,000 1,000
1,000 1,000
1,000 1,000
1,000 1,000
1,000 1,000
1,000 1,000
1,000
1,000
J,ooo
1,000
1,000
1,000
1,000
1,000
1,000
1,000
1,000
1,000
1,000
1,000
1,000
1,000
1,000
1,000
1,000
1,000
1,000
SOlS 567
519 182
778 "7
535 132
507 131
398 357
977 702
I,OJO 286
758 606
1,000
348
714
1,000
600
126
166
1,000
1,000
301
77
44.5
355
~
50
416
6S3
2li()
470
505
R-rv.l-contd.
6
146 300
423 364,
168 226
299 132
364 180
489 238
21 186
286
237 386
lIaa
125
500
3M
538
246
843
207
146
93
202
123
1117
n8
6
49
58
34. 74
100 132
71 115
98 119
2 SO
286
6 \I
BlKANER CITY
83
125
167
U6
91
83
255
128
31
61
7
363
19 43
63 47
54 164
15 95
11
11
1i0
14.3
200
62
250
23
18
143
160
81
79
9
lIS
5
8
1 23
3 57
2 82
71
250
96 ., 71 .
45
104.
81
34.
" 187
,.
9
N ,
o 2
6
28
58
18
9
21
18
22
10
17
17
68
17
48
31
34
11
133
91
172
491
Silt
191
104
14.3
188
375
125
142
71
173
14ll
218
398
391
90
ISO
3!11
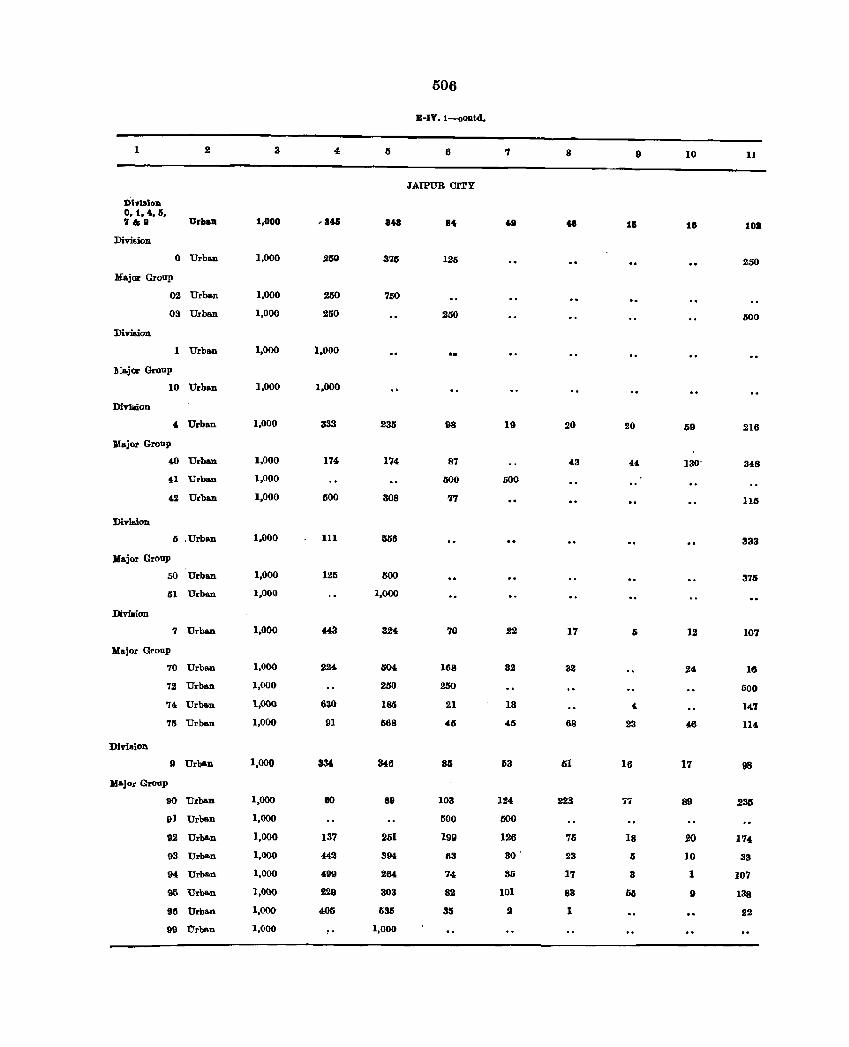
506
B-IV. 1-oontd.
1 2 3 4 5 6 7 8 9 10 11
JAIPUR CITY
DhlsioD 0,1,4,11, 7&9 Urllaa 1,000 ,845 848 84 ... 9 4 • iii 18 10.
Division
0 Urb&D 1,000 250 375 12S 250
:Major Group
02 Urban 1,000 250 750
03 Uxb&D 1,000 260 250 500
Division
1 Urb&D 1,000 1,000
lI:ajor Group
10 Urb&D 1,000 1,000
Diviaion , Urban 1,000 333 235 98 19 20 20 59 216
Major Group
40 Urba.n 1,000 174 174 87 43 44 130- M8
41 Urban 1,000 1100 600
42 Urb&D 1,000 500 308 -77 lIti
Division
5 . Urban 1,000 III 556 333
Major Group
50 Urban 1,000 125 600 375
51 Urb&D 1,000 1,000
Divillion
7 Urb&D 1,000 u!"l 324 70 22 17 Ii 12 107
Major Group
70 Urba.n 1,000 224 504 168 32 32 24 16
72 Urbo.n 1,000 250 250 1i00
74 Urban 1,000 6S0 185 21 13 , 147
'15 Urb&D 1,000 Sll 568 45 45 68 23 46 114
Divillion
II Urban 1,000 834 346 81 1i3 51 16 17 98
:Maj or Group
90 Urban 1,000 eo 8Sl 103 124 223 77 89 233
91 Urban 1,000 1i00 roo 92 Urban 1,000 137 251 199 126 715 18 20 174
93 Urban 1,000 442 894. 63 30 23 II 10 33
94 Urban 1,000 499 264 74 35 17 3 1 107
95 Urb&n 1,000 229 303 82 101 83 50 II 138
86 Urba.n 1,000 405 635 35 2 1 22
99 Orb .. n 1,000 1,000
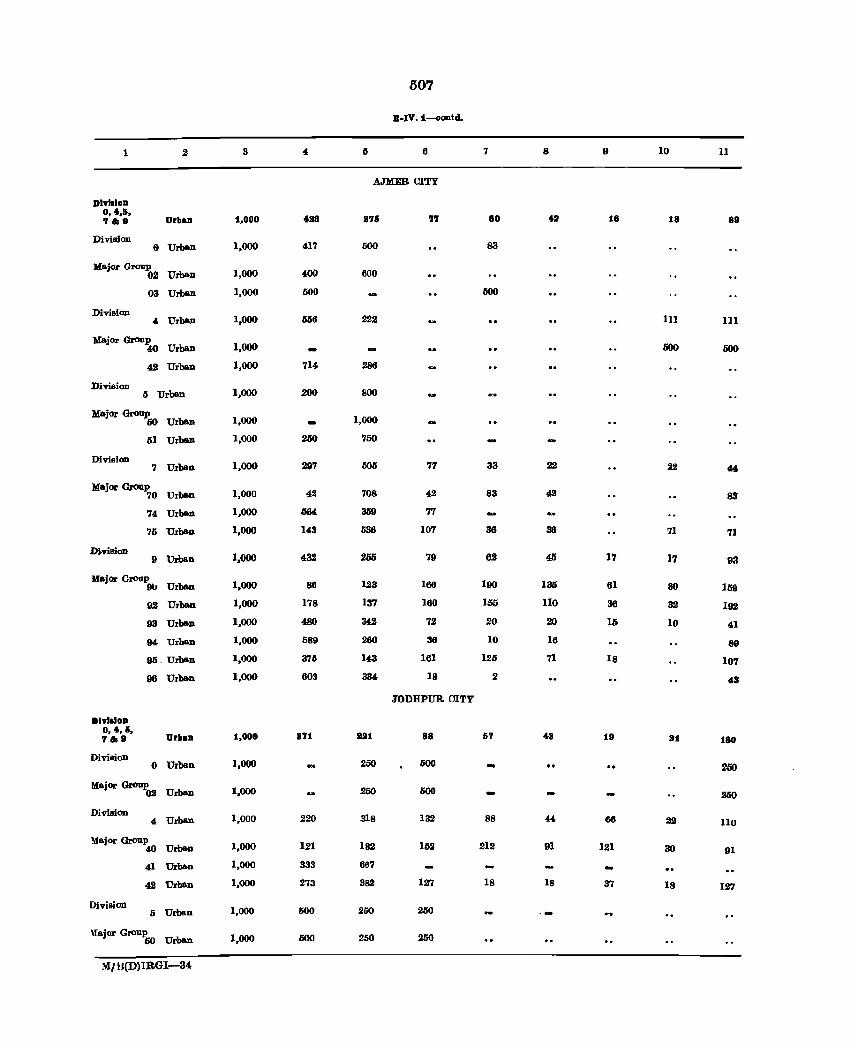
1
Dlvllion 0,4,5, 'I 41111
Diviaion
2
OrIJaD
e Urban
Major Group 02 Urban
03 Urban
Division " Urban
Major Group 40 Urban
42 Urban
DivisioD 5 Urban
Major Group 60 Urban
51 Urban
Division 7 Urban
Major Group 70 Urban
74 Urban
75 Urban
9 Urban
Major Groop !Ill Urban
.lvllloD 0 ... , &~ 'I.'
Division
92 Urban
93 Urban
94 Urban
90. Urban
96 Urban
Orll8D
o Urban
Major Group 02 Urban
Division 4 Urban
yajor Group 40 Urban
Division
41 Urban
42 Urban
5 Urban
Uajor Group 60 Urban
M/ll(D) IBGI-34
3
1.000
1,000
1,000
1,000
1,000
1,000
1,000
1,000
1,000
1,000
1.000
1,000
1,000
1,000
1,000
1,000
1,000
1,000
1,000
1,000
1,000
1.000
1,000
1,000
1,000
1,000
1.000
1,000
1,000
1,000
"
4211
417
400
500
556
714
200
260
297
42
li64
143
432
86
178
480
589
375
603
871
220
121
333
273
600
507
B-IV; t-oontcl.
I) 6
AJlrIEB CITY
276
600
222
286
800
1,000
750
708
359
536
255
123
137
342
200
143
334
1121
250
260
318
182
667
382
260
250
'17
77
42
77
107
79
166
160
72
36
161
18
JODHPUR CITY
88
132
152
127
250
250
7
80
83
600
33
83
36
62
190
155
20
10
125
2
67
88
212
18
8
42
22
36
130
no 20
16
71
48
91
18
9
18
17
61
36
15
18
68
121
37
10
18
III
22
71
17
80
32
10
1t1
30
18
11
88
111
500
83
71
93
159
192
41
89
107
43
180
110
91
1.27
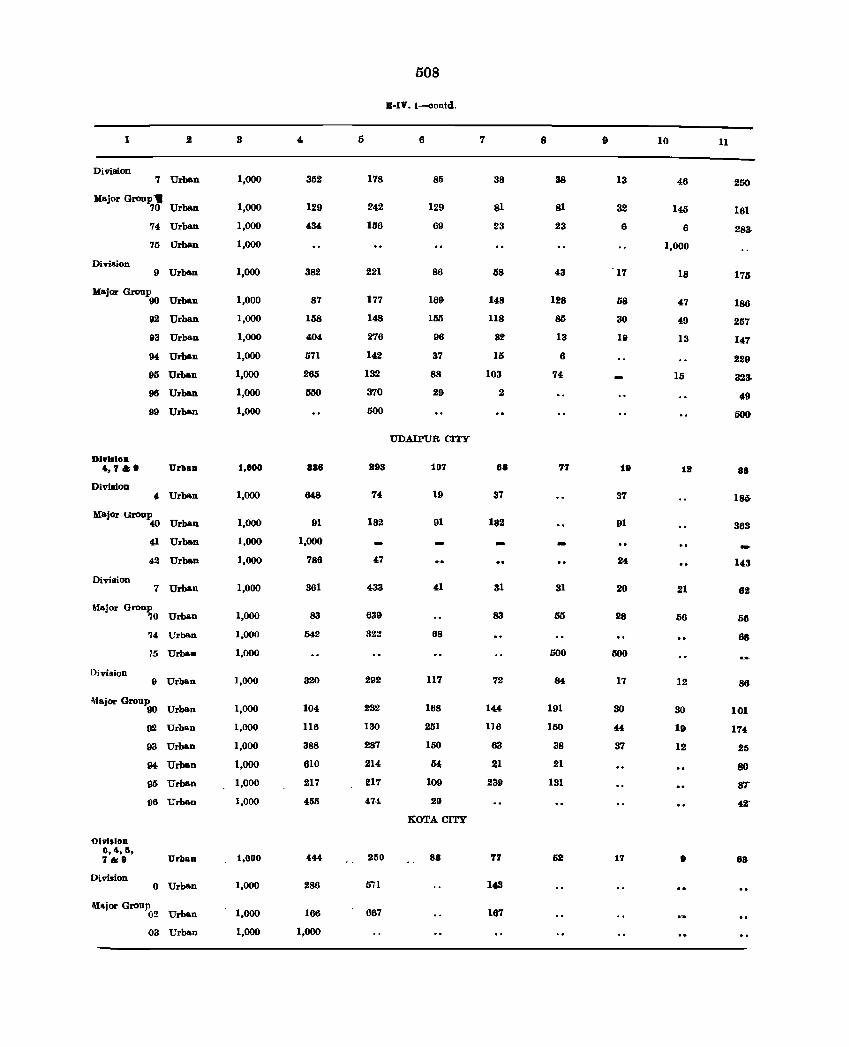
1 2
Diviaion 7 Urban
Major Group'" 70 Urban
Division
74 Urban
75 Urban
9 Urban
Major Group 90 Urban
DI .... loD ',7 II; 9
Divlaion
92 Urban
93 Urban
94 Urban
95 Urban
98 Urban
99 Urban
Urb.D
4 Urban
Major uroup 40 Urban
Divi1lion
41 Urban
42 Urban
7 Urban
Major Group '10 Urban
'14 Urban
15 Urba.
I)ivision 9 Urban
Major Group 90 Urban
Olvl.loD 0,4,6, 7&9
Division
92 Urban
93 Urban
94 Urban
95 Urban
96 Urban
UrbaD
o Urban
~bjor GrouJl 02 Urban
03 erban
3
1,000
1,000
1,000
1,000
1,000
1,000
1,000
1,000
1,000
1,000
1,000
1,000
1,000
1,000
1,000
1,000
1,000
1,000
1,000
1,000
1,000
1,000
1,000
1,000
1,000
1,000
1,000
1,000
1,000
1,000
1,000
1,000
4.
352
129
434
382
87
158
404
671
265
550
a38
91
1,000
786
381
83
542
320
104
116
388
610
217
455
'" 286
166
1,000
5
178
242
156
221
177
148
276
142
132
370
500
893
74
182
47
433
639
322
292
232
130
287
214
217
474
250
571
667
508
B-IY.I-contd.
8
85
129
69
86
169
155
96
37
88
29
UDAIPUR CITY
107
19
91
41
68
117
168
251
150
54
109
29
KOTA CITY
88
7
38
81
23
68
148
118
32
16
103
2
88
37
182
-31
83
72
1« 116
63
21
239
77
143
167
8
38
81
23
43
128
85
13
6
74
77
31
65
500
191
150
38
21
131
52
9
13
32
6
08
30
19
19
37
91
24
20
28
500
17
30
« 37
17
10
46
145
6
1,000
18
47
49
13
16
11
21
56
12
30
19
12
9
11
250
161
283·
176
186·
257
147
229
323-
49
500
88
185
363
62
56
68
86
101
174
25
80
8T
42"
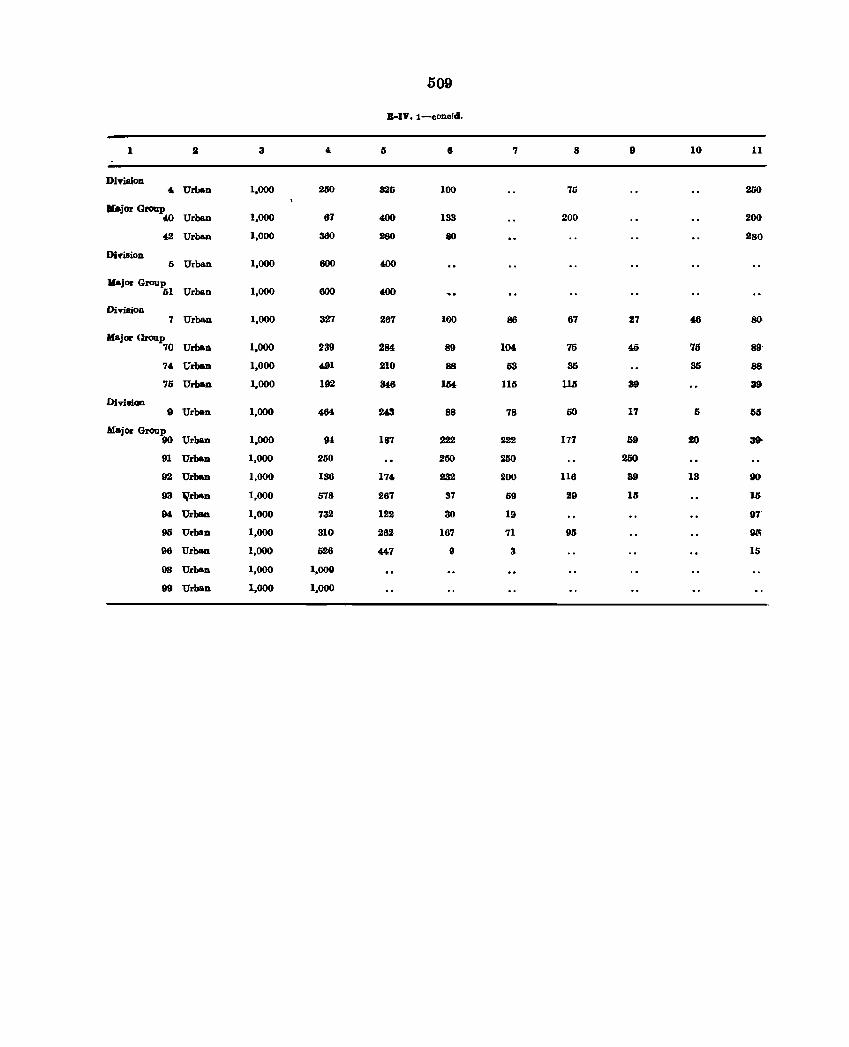
509
B-IV.1-c=o!d.
1 2 3 4 5 ., 7 8 9 10 11
Dinsion 4 Urb&n 1,000 260 325 100 75 260
"jor Group 40 Urba.D 1,000 67 400 133 200 200
42 Urba.D 1,000 360 280 80 280
Dinsion 5 Urban 1,000 600 400
lfajor Group 51 Urb&n 1,000 600 400
DivisioD 7 Urba.D 1,000 327 267 100 86 67 27 46 80,
Major Uroup 70 Urban 1,000 239 284 89 10' 75 45 75 89'
74 Urba.D 1,000 491 210 88 53 35 35 88
75 Urblm 1,000 192 lU6 154. 115 1111 39 39
DiviBiOD 9 Urban 1,000 46f. 243 88 78 50 17 5 55
Major Group 90 Urban 1,000 9i 187 222 222 177 59 20 39-
91 Urban 1,000 250 250 260 250
92 Urban 1,000 136 174 232 200 116 39 13 90
93 Vrban 1,000 578 267 37 59 29 15 15
9f. Urban 1,000 732 122 30 19 97'
95 Urban 1,000 310 262 167 71 95 9,.<;;
96 Urban 1,000 526 44.7 9 3 15
98 Urba.n 1,000 1,000
99 Urban 1,000 1,000
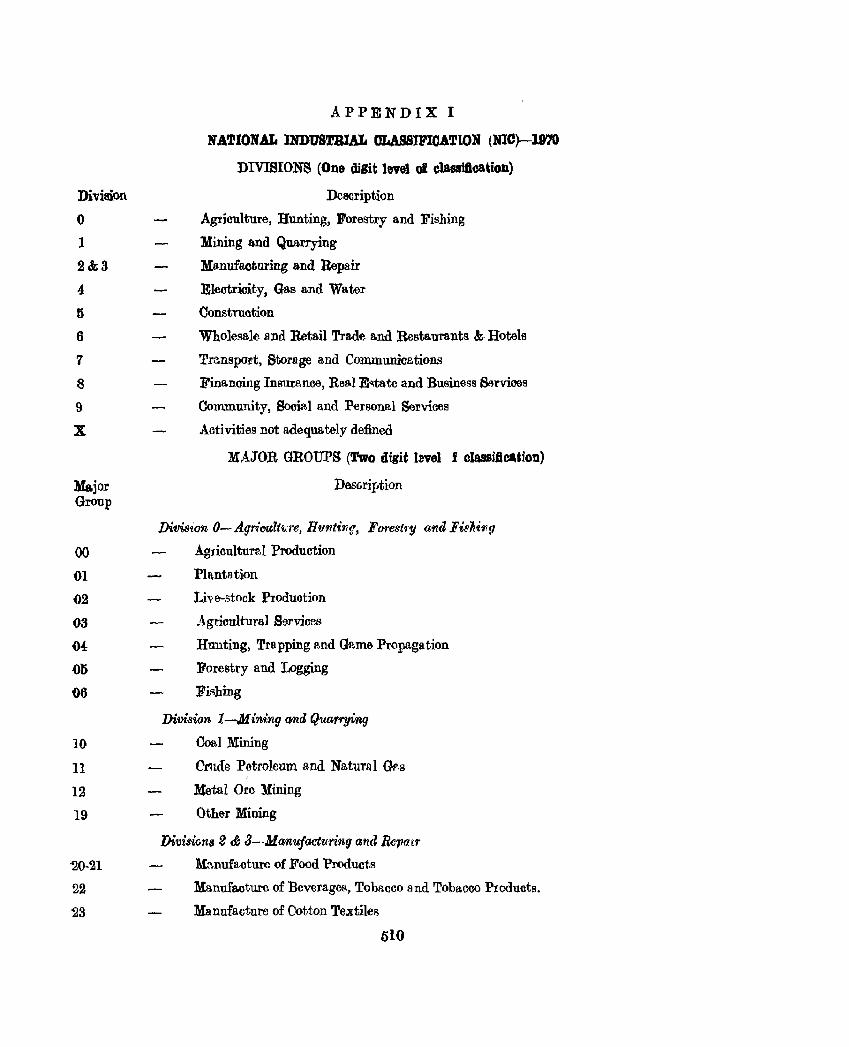
Division
o 1
2&3
4:
6
6
7
8
9
X
Major Group
00
01
02
()3
04
05
()6
10
11
12
19
'20-21
22
23
APPENDIX I
NATIONAL INDUSTRIAL CLASSIFICATION (510)-l97O
DIVISIONS (One wgit level of classUleation)
Description
Agriculture, Hunting, Forestry and Fishing
Mining and Quarrying
Manufacturing and Repair
Electricity, Gas and Water
Construction
Wholesa.le and Retail Trade a.nd Restaura.nts &. Hotels
Tre.nspo~t, Storage and Communice.tions
Fina.noing Insurance, Rea.l E'ltate and Business s.."rvioos
Community, Social and Personal ~rvices
Activities not adequately defined
MAJOR GROUPS (Two digit lavel f classification)
Desc.ription
Division O-AgriC'Ult1.il'e, H'IIt'lti'flg, Forest1'Y and Fi~}Ji'f/(}
Agriculturltl Production
Plantation
l ... iv e-stock Produotion
Agricultural S9fvices
Hunting, Tta pping and Game Propagation
Forestry and Logging
Pishing
Division 1-.Jf in1:ng Qna Quarrying
Coa.l Mining
Crude Petroleum and Natural Gr.g
Metal Ore Mining
Other Mining
Divis·ions 2 &: a-Manufacturing atHl Repair
Mn.nufl1cturc of Food Products
Manufacture of Beverage!'!, Tobacco and Tobaooo Products.
Manufacture of Ootton Textiles
510
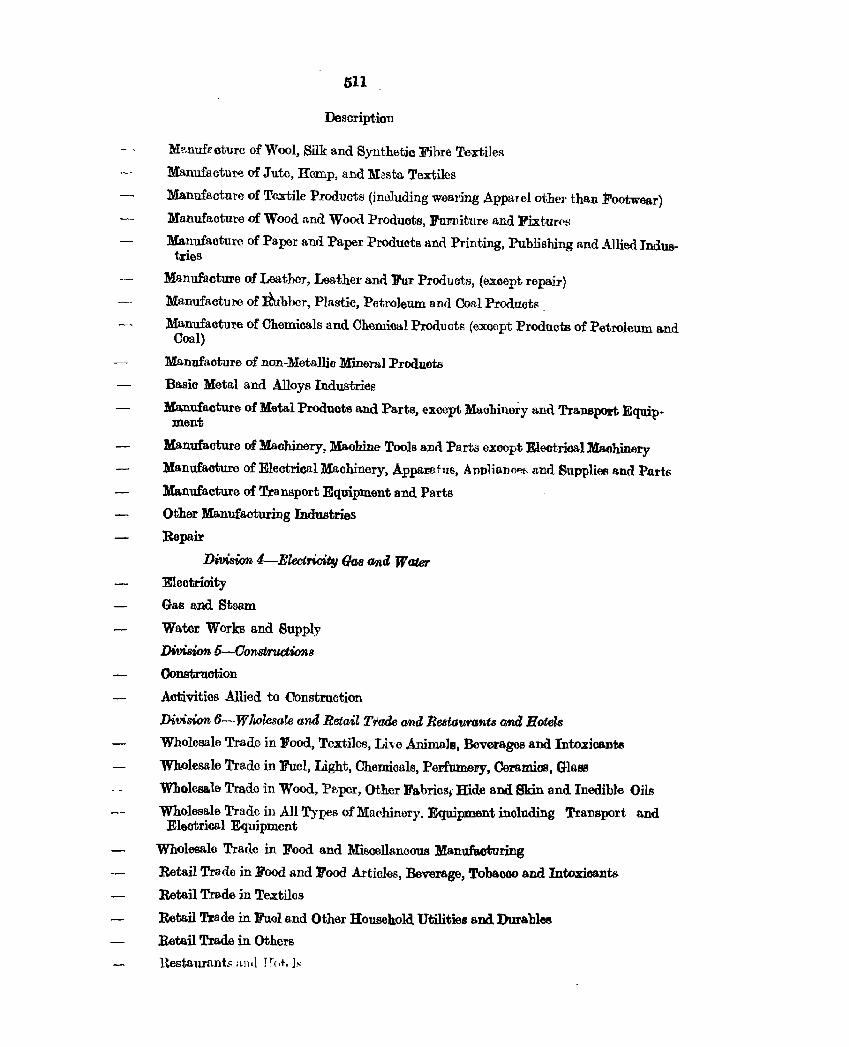
511
Desoription
M"mufroturc of Wool, Silk and Synthetic Fibre TeiXtiles
Manufactur~ of Juto, Hemp, and Mssta Textiles
Manufacture of Textile Products (inoluding wearing AppaIel othe]' tha.n Pootwear)
Manufaoture of Wood nnd Wood Produots, Furniture and Fixt.ur('~
Manufacture of Paper and Paper Products and Printing, Publishing Rnd Allied Indus-tries
Manufacture of Leathor, Leather a.nd Fur Produots, (except repair)
ManufMturo of Rubber, Plastic, Petroleum ann Coal Product" .
Manufaoture of Chemicals and Chemical Produots (except Products of Petroleum a.nd Coal)
Manufaoture of non-Metallic Mineral Produots
Ba.si6 Metal and Alloys Industries
Manufacture of Metal Produots an.d Parts, except Maohinery and Transport Equip. ment
Manufacture of Maohinery, Maohine Tools and Parts exoopt Elootrical Maohin6ry
Manufacture of Electrical Machinery, Appar.atl[s, A nplianflP.f; a.nd SuppliElflllond Parts
Manufacture of Transport Equipment and Parts
Other ManufactuEng Industries
Repair
Divi8ion 4-ElectMt,J Gas and Water
Electrioity
Gas and Steam
Water Works and Supply
DWision 5-0onstructions
Oonstruotion
Activities Allied to Construction
Division 6-Wlwlesllte and Retail Trade and Restaurants attd Hotel.s
Wholesale Trade in Food, Textiles, Li"o Animals, Beverages and Intoxicants
Wholesale Trade in Fuel, Light, Chemicals, Pel'fu.mepY, Oeramics, Glass
Wholesa.le Trade in Wood, PI',per, Other Fabricsf rode and Skin and Inedible Oils
Who16sale Trade ill All Types ofMa('hinery. Equipment inoluding Transport and Eleotriool Equipment
Wholesale Trade in Food and Miscellaneous Manufacturing
Retail Trade in .Food and Pood Articles, Beverage, Tobacoo and Intoxicants
Retail Tra.oo in Textiles
Retail Trade in Fuel and Other Household Utilities and Durables
Retail Trade in Others
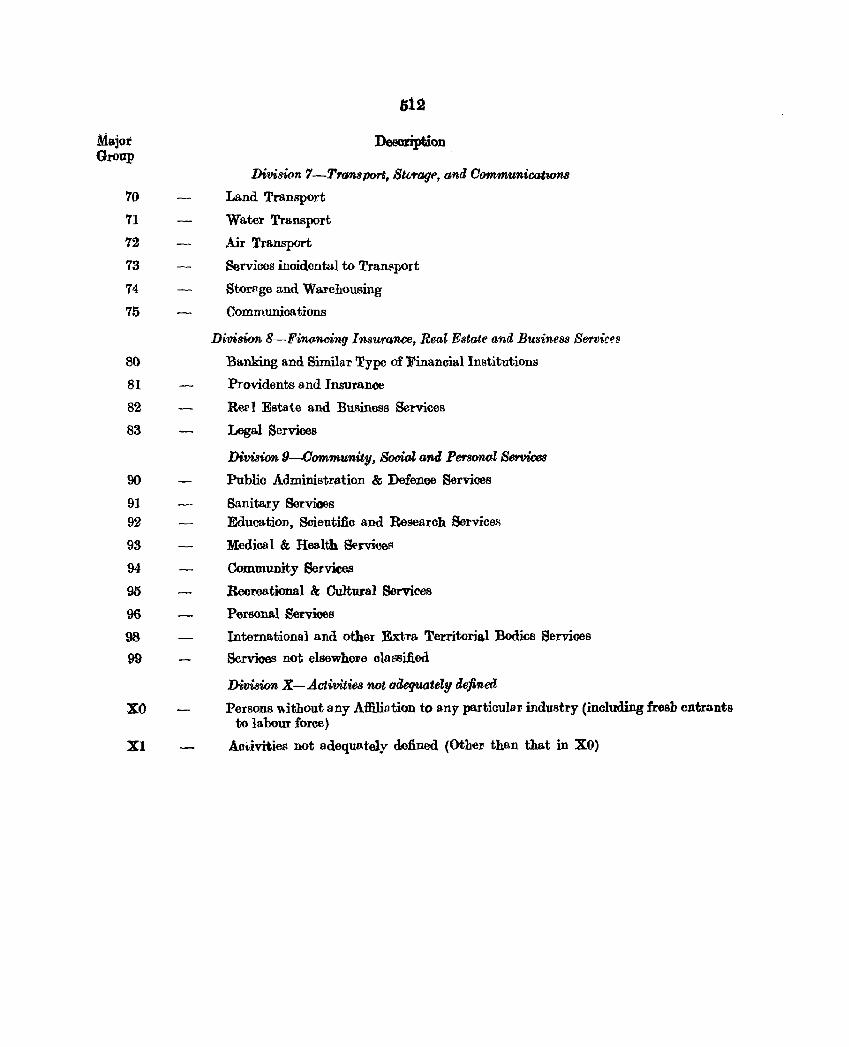
Mlrojor Group
70
71
72
73
74
75
SO
81
82
83
90
91 92
93
94
95
96
98
99
xo
Xl
1;12
Deeoription
Divisi(ln 7-Tra'll,Sporr&, Storagf>, and Oommunicatwns
Land Transport
VVater Transport
Air Transport
Services inoidental to Transport
Storp,gc and Warehousing
Comrrmnioa tions
Dimsi-on 8-F'ino:ncing Insurance, Real Estate and Business Serv':Ci?8
Banking and Similar Typo of Finanoial Institutions
Providents and Insurance
ReP 1 Estate and Businoss Services
Legal Servioes
Division 9-0ommunity, Social and Pe'f'sonol Services
Public Administration & Defence Services
Sanita.ry Services Education, Scientifio and Research Service.,;
Medioal &, HCBlth &>rvioofl
Community Serviees
Recreational &, Cultural Services
Personal Servioos
International and other Extra Territorial Bodies Services
8ervioes not elsewhere classified
Division X-Activiti~ not adequately defined
Persons \\ithout any Affiliation to any partioul81' industry (inoluding fresh entrants to labour force)
Aoi..ivities not adeqUAtely defined (Other- than that in XO)
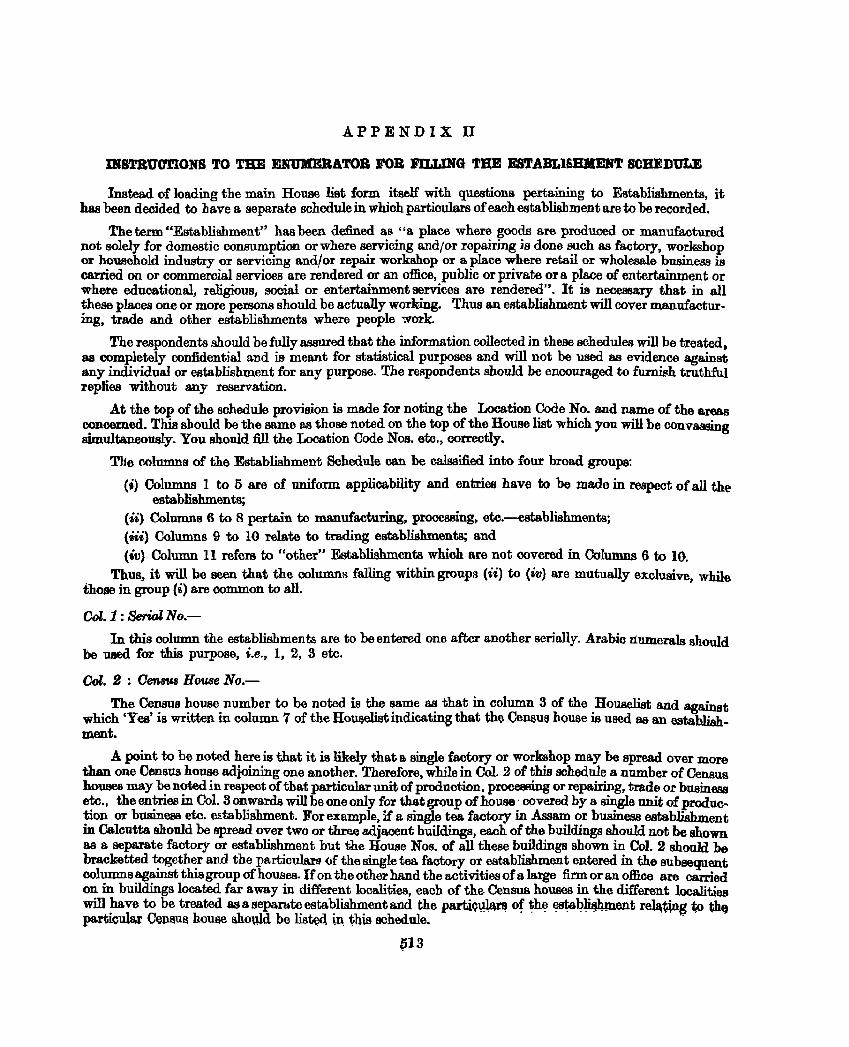
APPENDIX II
IRSTBUCTIONS TO THE ENUMERATOB FOB FlLLIRG THE ESTABLISBIIERT SCHEDULE
Instead of loading the main House list form itself with questions pertaining to Establishments, it has been decided to have a separate schedule in which particulars of each establishment are to be recorded.
The term '"Establishment" has been defined atl "a place where goods are produced or manufactured not solely for domestic consumption orwhere servicing and/or repairing is done such as factory, workshop or household industry or servicing and/or repair workshop or a place where retail or wholesale bu&ness is carried on or commercial services are rendered or an office, public or private or a place of entertainment or where educational, religious, sooial or enterlainmentservices are rendered". It is necessary that in all these places one or more persons should be actually worlcing. Thus an establishment will cover manufacturing, trade and other establishments where people work.
The respondents should be fully assured that the information collected in these schedules will be treated, as completely confidential and is meant for statistical purposes and will not be used as evidence against any individual or establishment for any purpose. The respondents should be enoouraged to furn~h truthful replies without any reservation.
At the top of the schedule provision is made for noting the Location Code No. and name of the areas concerned. This should be the same as those noted on the top of the House list which you will be canvassing simultaneously. You should fill the Location Code Nos. etc., correctly.
The r.()lumns of the Establishment Schedule can be calssifted into four broad groups:
(i) Columns 1 to 0 are of uniform applicability and entries have to be made in respect of aU the establishments;
(ii) Columns 6 to 8 pertain to manufacturing, processing, etc.-establishments; (iii) Columns 9 to 10 relate to trading establishments; and (itJ) Column. 11 refers to "other" Establishments which are not covered in Columns 6 to 10.
Thus, it will be seen that the columns falling within groups (ii) to (w) are mutually exclusive, while ihose in group (i) are common to all.
001. 1 : Serial No.-
In this column the establishments are to be entered one after another serially. Arabic numerals should be used for this purpose, i.e., 1, 2, 3 etc.
001. 2 : Oensus H O'U8e N 0.-
The Census house number to be noted is the same as that in column 3 of the Houselist and against whioh 'Yes' is written in column 7 of the Hou~listindicating that the Cell$us house is used as an establishment.
A point to be noted here is that it is1ikely that a single factory or work.shop ma.y be spread over more than one Census house adjoining one another. Therefore, while in Col. 2 of this schedule a number of Census houses may be noted in respect of that particular unit of product.ion, plOe_ng or repairing, trade or business etc., the entries in Col. 3 onwards will be one only for that group of house' covered by a single unit of production or business etc. eEtablishment. ForexampJe,ll a single tea factory in Assam or business establishment in Calcutta should be spread over two or three a.djacent buildings, each of the buildings should not be shown as a separate factory or establishment but the House Nos. of all these buildings shown in Col. 2 should be brack-etted together and the particular" of the single tea factory or establishment entered in the subsequent columns against this group of houses. If on the other hand the activities of a large firm or an office are carried on in buildings located far a.way in different localities, each of the Census houses in the different localitiea will ha.ve to be treated 88a separute establishment and the partiQ$~ of ~h~ ~stal?~ent re~t1ng ~ thQ particular Cep.$u& house $h.ould be listed, i~ t.his schedule. .
p13
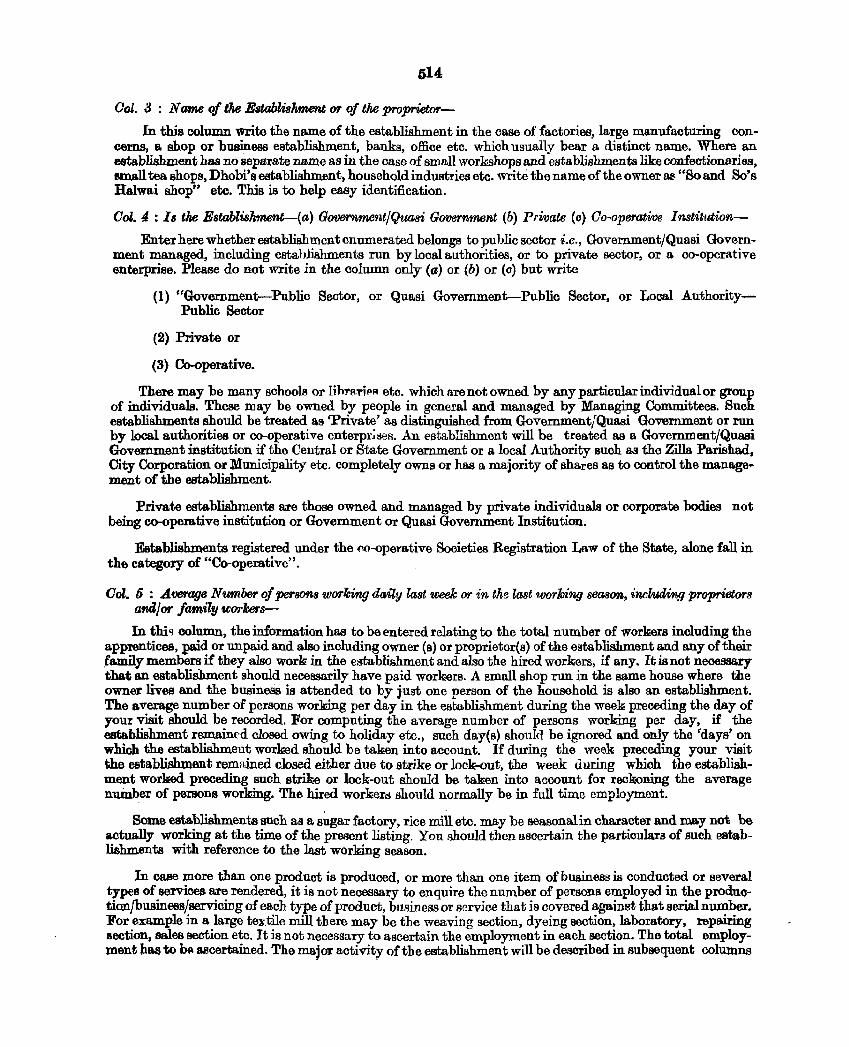
514
Ool. 3 : N arne of the EBtohZi8kment or of tke proprietcYr-
In this column write the name of the establishment in the case of factories, large manufacturing concerns, a shop or business establishment, banks, office etc. which usually bear a distinct name. Where an establishment has no separate name as in the case of small workshops and establishments like confectionarias, IIIlllLll tea shops, Dhobi's establishment, household industries etc. write the name of the owner a~ "So and So's Halwai shop" etc. This is to help easy identHication.
Col. 4 : Is the Establiskment-(a) GOtJe'1'nrY/£nt/Qu,asi Goverrvment (b) Private (c) Co-operative Imtit·,4tion
Enter here whether establishment enumerated belongs to public sector i.e., Government/Quasi Government managed, including estahlishments run by local authorities, or to pl'ivate sector, or a co-operative enterprise. Please do not write in the column only (a) or (b) or (c) but write
(1) "Government-Public Sector, or Quasi Government-Publio Sector, or Local AuthorityPublic Sector
(2) Private or
(3) Co-operative.
There may be many schools or lihrfl:rlf'R etc. which are not owned by any particular individual or group of individuals. These may be owned by people in general and managed by Managing Committees. Such establishments should be treated as 'Private' as distinguished from Government/Quasi Government or run by local authorities or co-operative enterpr~lie8. An establishment will be treated as a Government/Quasi Government institution if the Central or State Government or a local Authority such as the Zilla Parishad, City Corporation or Municipality etc. completely owns or has a majority of shares as to control the management of the establishment.
Private establishments are those owned and managed by private individuals or corporate bodies not being co-operative institution or Government or Quasi Government Institution.
Establishments registered under the (lo-operative Societies Registration Law of the State, alone fall in the category of "Co-operative".
Ool. 5 : Arerage Number of persons working daily last week or in the last 1corking season, including proprietors am/or family WO'l'kers-
In thi'l column, the information has to be entered relating to the total number of workers including the apprentices, paid or unpaid and also including owner (s) or proprietor(a) of the establishment and any of their family members if they also work in the establishment and also the hired workers, if any. It is not necessary that an establishment should necessarily have paid workers. A small shop run in the same house where the owner lives and the busineSs is attended to by just one person of the household is also an establisbment. The average number of persons working per day in the establishment during the week: preceding the day of your visit should be recorded. For computing the average number of persons working per day, if the establishment remaim'd closed owing to holiday etc., such day(s) shonld he ignored and only the 'days' on which the establishment worked should be tak;en into account. If during the week preceding your visit the establishment remained closed either due to strike or lock-out, the week during whioh the establishment worked preceding such strike or lock-out should be taken into account for rec100ning the average number of persons wor]~ing. The hired workerl3 should normally be in full time employment.
Some establishments such as a s-itgar factory, rice mill etc. may be aeasonalin character and may not be a.ctually working at the time of the preRent listing. You ,IDould then ascertain the pa.rticulars of such establishments with reference to the mst working season.
In case more than one product is produced, or more than one item of business is conducted or several types of services are rendered, it is not necessary to enquire the number of persons employed in the produotionfbusinessJservicing of each type of product, business or service that is oovered against that serial number. For example in a large textile mill there may be the weaving section, dyeing section, laboratory, repairing 500tion, sales section etc. It is not necessary to ascertain the employment in eaeh section. The total employ:rnent h&& to btl ascertained. The ma.jor activity of the establishment will be described in subsequent columns
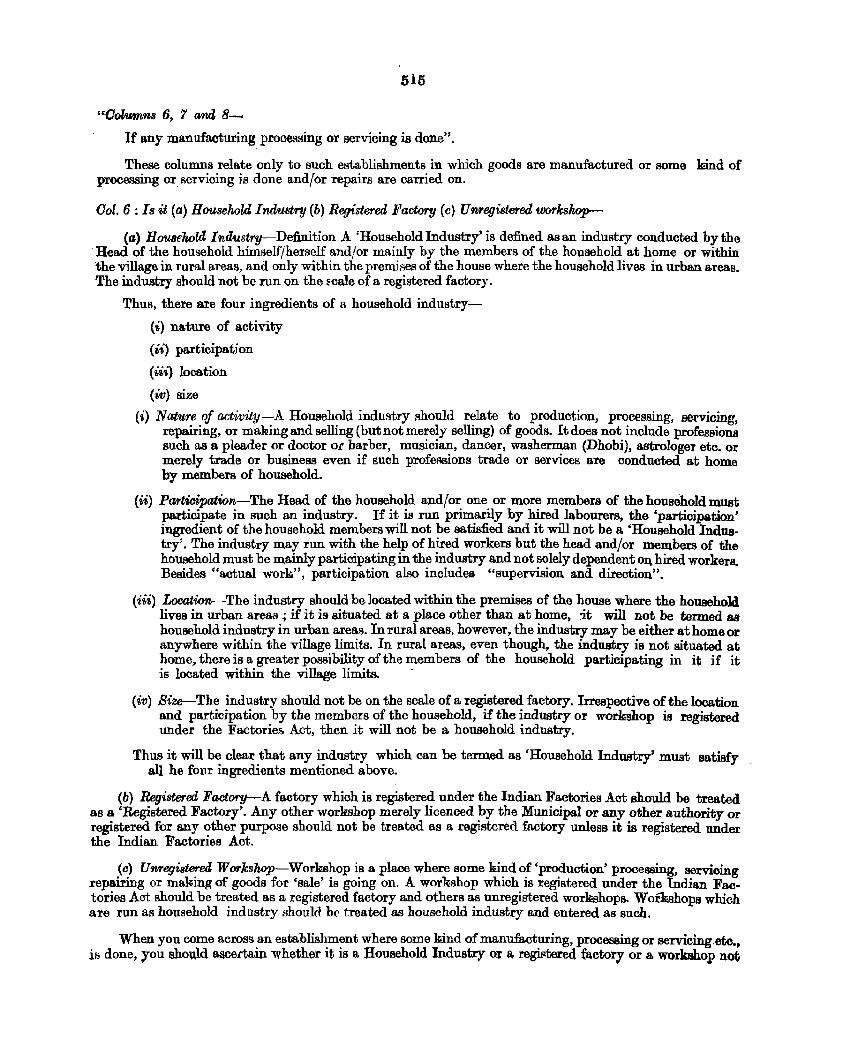
515
"Columns 6, r and 8-
If any manufactming p.rocessing or servicing is done".
These columns relate only to such establishments in which goods are manufactured or some land of processing or. servicing is done and/or repairs are carried on.
001.6: Is it (a) Houselwld Industry (b) Registered Factory (c) Unregistered workshop-
(a) Household Industry-Definition A 'Household Industry' is defined as an industry conducted. by the . Head of the household himself/herself a.nd/or mainly by the members of the household at home or within the village in rural areas, and only within the premises of the house where the household lives in urban areas. The industry should not be run on the ~cale of a registered factory.
Thus, there are four ingredients of a household industry
(i) nature of activity
(ii) participation
(iii) location
(w) size
(i) Nature of activity-A Household industry should relate to production, processing, servicing, repairing, or making and selling (but not merely selling) of goods. It does not include professions such as a pleader or doctor or barber, musician, dancer, washerman (Dhobi), astrologer etc. or merely trade or business even if such profeFlSions trade or service!> are conducted at home by members of household.
(ii) Participation-The Head of the household and/or one or more members of the household must participate in such an industry. If it is run primarily by hired labourers, the 'participation' ingredient of the household members will not be satisfied and it will not be a 'Household Industry'. The industry may run with the help of hired workers but the head and/or members of the household must be mainly participating in the industry and not solely dependent 01\ hired workers. Besides "actual worki", participation also includes "supervision and direction".
(iii) Location-The industry should be located within the premises of the house where the household lives in urban areas; if it is situated at a place other than at home. ~it will not be termed as household industry in urban areas. In rural areas, however, the industry may be either at home or anywhere within the village limits. In rural areas, even though, the industry is not situated at hottle, there is a greater possibility of the members of the household participating in it if it is located within the village limits. .
(iv) Size-The industry should not be on the scale of a registered factory. Irrespective of the location and participation by the members of the household, if the industry or workshop is registered under the Factorie& Act, then it will not be a household industry.
Thus it will be clear that any industry which can be termed as 'Household Industry' must satisfy all he fom ingredients mentioned above.
(b) Registered Factory-A factory which is registered under the Indian Factories Act should be treated as a 'Registered Factory'. Any other workshop merely licenced by the Municipal or any other authority or registered for any other purpose should not be treated as a registered factory unless it is registered under the Indian Factories Act.
(c) Unregistered Workshop-Workshop is a place where some kind of 'production' processing, servioing repa.iring or making of goods for 'sale' is going on. A workshop which is registered under the Indian Factories Act should be treated as a registered factory and others as unregistered work;shops. Woikishops which are run as household industry should be' treated as household industry and entered as such.
When you come across an establishment where some kind of manufacturing, processing or servicing etc., is done, you should aacertain whether it is a Household Industry or a regifltered factory or a work&b.op not
516
registered unde-r the Factories Act and write whatever it actually is in this column. Please note that wotkshops merely licenced or entered in the registers of a local authority are not to be considered as registered factories unless registered under the Indian Factories Act . .All work;shops other than household industries and not registered under the Indian Factories Act should be treated. as unregistered workshops even if they are m,erely licenced as wo.rkshops by the local authorities. Please do not write (a) or (b) or (0) in the column but write "Household Indud.ry", or "Registered Factory" or "Unregistered Workshop", as the case may be.
Oolumn '1 : Description of the products processing or servici1l!J aOfl£-The deE>Cription of the actual work; relatillg to product, processing and servicing which i& done in the
Household Industry, factory or workshop that is being listed is to be reco.rded here, e.g., handloom wea.ving, lace knitting, oil ghani etc., manufacturing of G.I. pipe!!, electroplating, motor or cycle repair~g, iron foundry, paper making or book; binding, printing and dyeing, shoe mak<ing, sweetmeat making ete. If in any establishment more than one article is produced or more than one kind of proceFosing or servicing or repairing is done, indicate only the major kind of products or processing or repairing or servicing etc.
Ool"l.Utnt\ 8 : Type of fuel 0'1' POU;et" used-Enter here t,he description ofth.e power or fuel used for the running of the factory, workshop (or house
hold industry if it is run on power or fuel). The fuels can be kerosene, soft coke, petrol, diesel, gas, coal, wood, etc., Electricity and steam etc. are some of the sources of power. Some units may be run by animal power such as oil ghanL Some may be run by merely human energy such as carpet-makiing, pottery making etc. Enter the de&cription of fuel or power used for the production, processing, servicing etc. that is carried on in the establishment. There may be instances where more than one fuel or power is used, in such cases, only the fuel or power which is used in iunning th.~ primary unit of the industry will be noted in this ooluIW)..
Columns 9 and 10 are to be:6lledin.respect.qftr~ establishments or establishments which render commeroial services only.' ~ .. - .. .
Trading or businessestablishments-aJ:e ~h:osewhereBome trading i.e., transactioll8 involving sale and/or purchase of goods go on.
Establishments rendering commercial services are the banks, money lending firma, pawn shops, etc.
CoZumn 9 : Description of goods bougkt/so1il--
If it is a trading establishment, you should ascertain what Me the goods bought and/or sold and wI'ita the description in this column. If there are more than one typ"" of goods bought/sold by the establishment. you should give description of the main item of goods bought/sold by the establishment.
In the case of establishments rendering commercial services such as in the case of Banlis etc., you should write the description of the services rendered, as in the case of a bank, you should write "banking services".
Oolumn 10 : Whether (a) wholesaJe (W (b) 'l'etaiTr-
For all trading establishments, you should ascertain in respect of the goods mentioned in column 9. whether they are soldfbought in wholesale or in retail and write as the case may be.
You ma.y come across certain establishments wherein both types of trade i.e., wholesale and retail go on. In such cases, you should ascertain in which category (i.e., wholesale or retail) the volume of trade is greater and record the category accordingly.
In the case of establishments rendering commercial services, e.g., bank; etc., please do not write any of the two categories i.e., 'wholesale' or 'retail' but put an 'X' in this column.
CoZ.11 : If used as any other establishment, desoribe e.g., Government O.ffice, School, Hospital, Railway Station Ba'l'OOrs' Saloon, OirumuJ., TII£at.re, Hotel,. Tea Shop, etc.-
Two specific types of establishments have been covered in column.q 6 to 10. Column 11 relates the remaining types of establishments not covered by columna 6 to 10. You have to describe such establishments in this column, e.g., GovemmentOffice, School, Hospital, Railway Station, Ophanage, Rescue Home, Bar~r'a Saloon, Cine:m.a? Theatre, Hotel, Tea. Shop, Lawyer's Office, Doctor's Clinic, Laundry. etc.
517
Generat-It is possible that in a particular establishment more than one activity is being under ..
ta.k:en within the same premises. For example, say in a betel shop, bidi rolling is also being unde1t&ken or in a grocery shop a ftour mill is also located, or in the doctor's clinic medicines are sold. In such cases, the establishment should be identified having regard to the major activity and recorded as such in the relevant columns pertaining to the major activity.
But if different activities are underta.k:en in different Census houses quite cut off from one another though under the Eoame title or ownership, each such census house should be treated as a. separate establishment and recorded as suoh a1ainst that oensus house in this schedule. It may, however, be noted that where processing for the produotion. of an article is ca:uried on, in separate adjoining Gensus house" all the cenSUS houses should be treated all a single esta.blishment and reoorded as such. If on the other hand the activities of a large firm or an office are carried on in buildings located far away in different localities, each of the census houses in the different localities will have to be treated as a sepaJ:ate establishment and the particulars of the es.tablishment relating to that particular census houses should be listed in this schedule.
After you have completed filling up of the E~ta.blishment Schedule for yOUl' block, you will prepare a duplicate copy of the Establishment Sohedule. for which you would be given adequate number of blank forms.
M/:B(D)lBGI-800-29.12.71i-GlPS