establishing permissible erosion rates for various landforms in delhi state, india
TRANSCRIPT
land degradation & development
Land Degrad. Develop. 20: 92–100 (2009)
Published online 28 November 2008 in Wiley InterScience (www.interscience.wiley.com) DOI: 10.1002/ldr.886
ESTABLISHING PERMISSIBLE EROSION RATES FOR VARIOUSLANDFORMS IN DELHI STATE, INDIA
P. JHA1*, H. C. NITANT1 AND D. MANDAL2
1Central Soil and Water Conservation Research and Training Institute, Research Centre-Chhalesar, Agra-282006, India2Central Soil and Water Conservation Research and Training Institute, Kaulagarh Road, Dehradun-248195, India
Received 31 May 2008; Revised 4 October 2008; Accepted 9 October 2008
ABSTRACT
Permissible erosion rate also known as soil loss tolerance (‘T’ value) is defined as maximum erosion that can take place on agiven soil without degrading its long-term productivity. In India, default ‘T’ value of 11�2Mgha�1 y�1 is used for devising landrestoration strategies for different types of soils. However, ability of soil to resist degradation varies with soil type, depth andphysico-chemical characteristics. Therefore, the present investigation was undertaken to determine ‘T’ value of differentlandforms of Delhi State by taking into account the soil saturated hydraulic conductivity (SHC), bulk density (BD), organiccarbon, erodibility and soil pH. Soil state was defined by a quantitative model and scaling functions were used to convert soilparameters to a 0–1 scale. The normalised values were multiplied by appropriate weighting factors based on relative importanceand sensitivity analysis of each indicator. Categorical rankings of I, II or III were assigned to soil groups based on overallaggregate score. ‘T’ value of different landforms of Delhi State was computed using the guideline of USDA-Natural ResourceConservation Services. Majority of landforms of Delhi had ‘T’ value of 12�5Mg ha�1 y�1, except for the soils of hill terrain,dissected hill, pediment and piedmont plain, where ‘T’ value ranged from 5 to 10Mg ha�1 y�1. These ‘T’ values could be usedfor conservation planning and will help the planners in devising suitable land restoration strategies. Copyright # 2008 JohnWiley & Sons, Ltd.
key words: erosion; soil loss tolerance; soil groups; Delhi State; India; conservation planning
INTRODUCTION
Pressure on land has been intensified due to rapidly increasing population; consequently soil degradation has
increased to a great extent (Blum, 1998). Problems of land degradation coupled with loss of soil productivity and
declining soil quality continue to be the subject of concern for environmentalist and gaining widespread attention of
scientific community. Though the loss of any amount of soil by erosion is generally not considered beneficial but
years of field experience as well as scientific research indicate that some loss can be tolerated without affecting the
crop production significantly (Schertz, 1983). This acceptable rate of erosion is known as ‘T’ value (Wischmeier
and Smith, 1978; McCormack et al., 1982) or permissible soil loss (Kok et al., 1995.). Quantifying ‘T’ value
without affecting crop productivity becomes amajor challenge for researchers and conservation planners. If erosion
rate is more than ‘T’ value, they are considered unacceptable and must be reduced for sustainable agriculture. The
aim of any conservation planning is to keep soil erosion to a rate either equal to or less than ‘T’ value to prevent
further degradation of soil.
Land restoration strategies in India aimed at the conservation of depleting natural resources on a sustainable
basis; however they are mostly based on a single ‘T’ value of 11�2Mg ha�1 y�1 (Mannering, 1981; McCormack
et al., 1982). This could be highly misleading as it implies that soil loss less than 11�2Mg ha�1 y�1 does not require
*Correspondence to: P. Jha, Central Soil and Water Conservation Research and Training Institute, Research Centre-Chhalesar, Agra-282006,India.E-mail: [email protected]
Copyright # 2008 John Wiley & Sons, Ltd.
ESTABLISHING PERMISSIBLE EROSION RATES FOR VARIOUS LANDFORMS 93
immediate conservation measures. The major drawback with this single value is that it does not take into account
the onsite inherent soil characteristics on soil erosion. A typical range of ‘T’ values in integer steps ranged from
2�5 to 12�5Mg ha�1 y�1 was earlier proposed by USDA-NRCS (1999). Theoretically, we could only afford to loose
soil at a rate at which it forms. But the rate of soil formation is not equal in different types of soils. It varies with
climate, topography, biotic factors (vegetation and organism) and time. Hence, taking a single value
(11�2Mg ha�1 y�1) will not hold good in different types of soils. On shallow soils (<50 cm) with a ‘T’ value
of 2, erosion at a rate of 11�2Mg ha�1 could lead to relatively rapid loss in productivity. In contrast, on some deep
soils (>1�0m) with a ‘T’ value of 5, erosion at a same rate would not be expected to reduce soil productivity to the
same extent. The biophysical approach, primarily adopted by agronomists, considers 11�2Mg ha�1 y�1 as the
maximum allowable soil loss for protecting soil reserves and the environment (Wischmeier and Smith, 1978; Hall
et al., 1985) as it approximates the maximum rate of horizon development under optimum condition. ‘T’ value
needs to be assessed objectively based on the factors affecting crop productivity. Earlier attempts to quantify ‘T’
value were based on a qualitative judgment without taking into account the sensitive soil indicators. Therefore, an
attempt has been made to compute ‘T’ value which is based on quantitative evaluation rather than qualitative
judgments.
Land use in Delhi State has undergone significant changes during the past 25 years due to burgeoning population,
rapid industrialisation and urbanisation. The data reveals that about 56 per cent area of the state has soil degradation
problem (NBSSLUP, 2000). ‘T’ value which is an essential factor in choosing any conservation programme has not
been computed for the state of Delhi. Therefore, the present study was undertaken to compute ‘T’ value of different
landforms of Delhi State by taking into account the sensitive indicators.
MATERIALS AND METHODS
Study Area
The State of Delhi is located between 28824017
00and 28853
000
00N latitude and 76850
024
00–77820
037
00E longitude. It
comprises an area of about 147 488 ha, of which about 47 000 ha is urban area. The state is surrounded by Uttar
Pradesh in the east and Haryana in the north, west and south. The summers and winters are extreme with mean
maximum and minimum temperatures of 40�5 and 27�68C in summer and 22�2 and 7�58C in winter, respectively.
Total rainfall of the state is approximately 612mm per year. Total cropped area of Delhi State is 36 957 ha
(Anonymous, 2004). The soils of Delhi State have developed mainly on alluvium of the River Yamuna and its
tributaries. Besides alluvium, soils of the Aravalli hill and adjoining area have developed on rocks like quartzite and
mica schist. Delhi State has been divided in six major physiographic units. Soils of active flood plain comprised of
an area of 7758 ha which constitute 5�25 per cent of the state area, confined to eastern and north eastern parts of
state, whereas soils of recent alluvial plain cover an area of 15 784 ha (10�70 per cent). Soils of old alluvial plain arethe most extensive, occupying an area of 56 439 ha which represents 38�27 per cent of the total geographical area ofthe state extending over the northern, central and western part of the state. Soils of the Aravalli hill cover about
6868 ha representing 4�66 per cent of total geographical area of the state. Soils of pediment and piedmont occupy
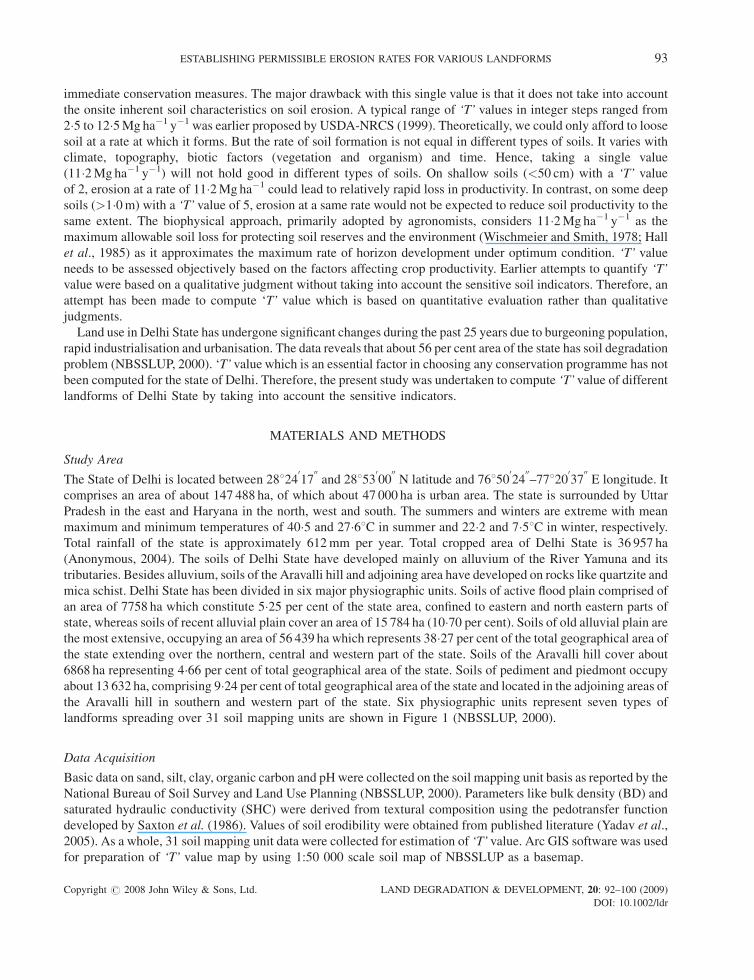
about 13 632 ha, comprising 9�24 per cent of total geographical area of the state and located in the adjoining areas ofthe Aravalli hill in southern and western part of the state. Six physiographic units represent seven types of
landforms spreading over 31 soil mapping units are shown in Figure 1 (NBSSLUP, 2000).
Data Acquisition
Basic data on sand, silt, clay, organic carbon and pH were collected on the soil mapping unit basis as reported by the
National Bureau of Soil Survey and Land Use Planning (NBSSLUP, 2000). Parameters like bulk density (BD) and
saturated hydraulic conductivity (SHC) were derived from textural composition using the pedotransfer function
developed by Saxton et al. (1986). Values of soil erodibility were obtained from published literature (Yadav et al.,
2005). As a whole, 31 soil mapping unit data were collected for estimation of ‘T’ value. Arc GIS software was used
for preparation of ‘T’ value map by using 1:50 000 scale soil map of NBSSLUP as a basemap.
Copyright # 2008 John Wiley & Sons, Ltd. LAND DEGRADATION & DEVELOPMENT, 20: 92–100 (2009)
DOI: 10.1002/ldr
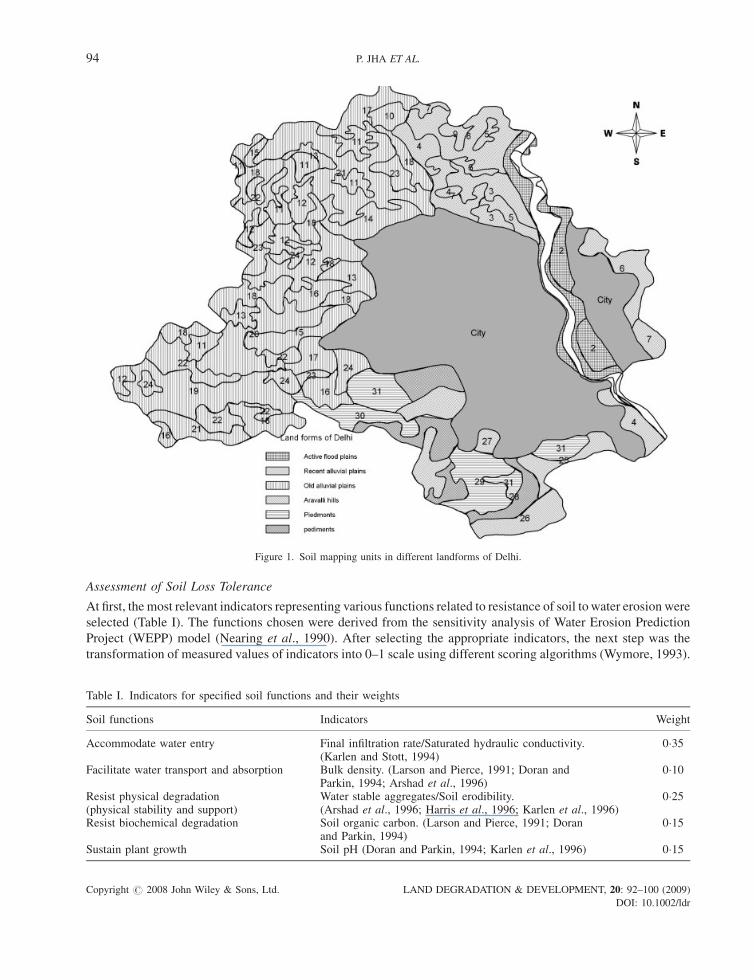
Figure 1. Soil mapping units in different landforms of Delhi.
94 P. JHA ET AL.
Assessment of Soil Loss Tolerance
At first, the most relevant indicators representing various functions related to resistance of soil to water erosion were
selected (Table I). The functions chosen were derived from the sensitivity analysis of Water Erosion Prediction
Project (WEPP) model (Nearing et al., 1990). After selecting the appropriate indicators, the next step was the
transformation of measured values of indicators into 0–1 scale using different scoring algorithms (Wymore, 1993).
Table I. Indicators for specified soil functions and their weights
Soil functions Indicators Weight
Accommodate water entry Final infiltration rate/Saturated hydraulic conductivity.(Karlen and Stott, 1994)
0�35
Facilitate water transport and absorption Bulk density. (Larson and Pierce, 1991; Doran andParkin, 1994; Arshad et al., 1996)
0�10
Resist physical degradation(physical stability and support)
Water stable aggregates/Soil erodibility.(Arshad et al., 1996; Harris et al., 1996; Karlen et al., 1996)
0�25
Resist biochemical degradation Soil organic carbon. (Larson and Pierce, 1991; Doranand Parkin, 1994)
0�15
Sustain plant growth Soil pH (Doran and Parkin, 1994; Karlen et al., 1996) 0�15
Copyright # 2008 John Wiley & Sons, Ltd. LAND DEGRADATION & DEVELOPMENT, 20: 92–100 (2009)
DOI: 10.1002/ldr
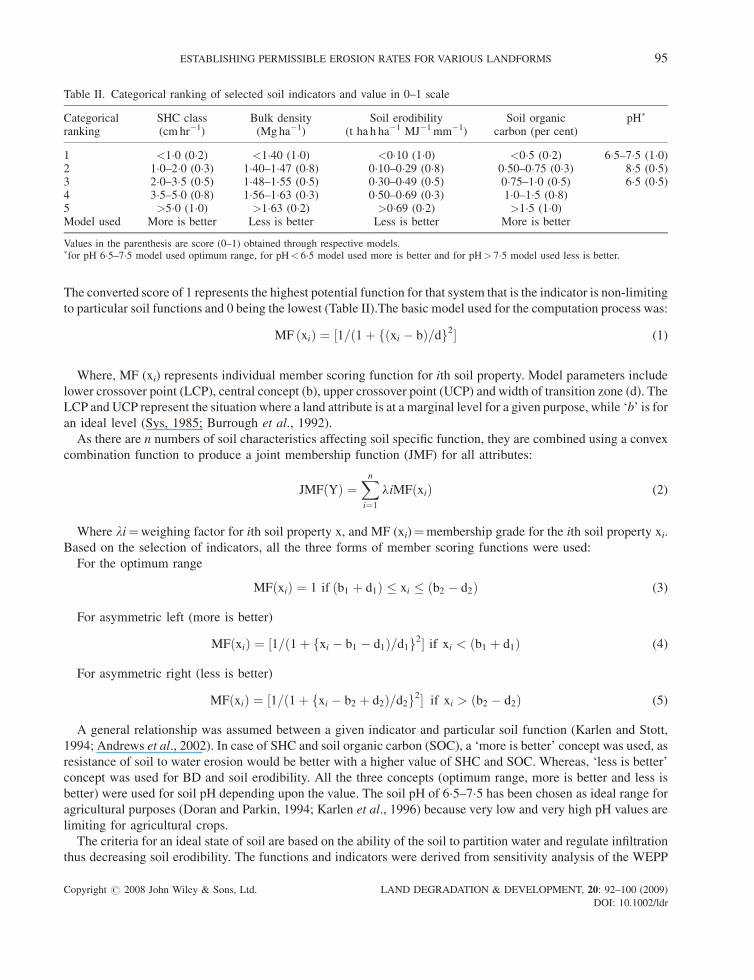
Table II. Categorical ranking of selected soil indicators and value in 0–1 scale
Categoricalranking
SHC class(cm hr�1)
Bulk density(Mg ha�1)
Soil erodibility(t ha h ha�1 MJ�1mm�1)
Soil organiccarbon (per cent)
pH�
1 <1�0 (0�2) <1�40 (1�0) <0�10 (1�0) <0�5 (0�2) 6�5–7�5 (1�0)2 1�0–2�0 (0�3) 1�40–1�47 (0�8) 0�10–0�29 (0�8) 0�50–0�75 (0�3) 8�5 (0�5)3 2�0–3�5 (0�5) 1�48–1�55 (0�5) 0�30–0�49 (0�5) 0�75–1�0 (0�5) 6�5 (0�5)4 3�5–5�0 (0�8) 1�56–1�63 (0�3) 0�50–0�69 (0�3) 1�0–1�5 (0�8)5 >5�0 (1�0) >1�63 (0�2) >0�69 (0�2) >1�5 (1�0)Model used More is better Less is better Less is better More is better
Values in the parenthesis are score (0–1) obtained through respective models.�for pH 6�5–7�5 model used optimum range, for pH< 6�5 model used more is better and for pH> 7�5 model used less is better.
ESTABLISHING PERMISSIBLE EROSION RATES FOR VARIOUS LANDFORMS 95
The converted score of 1 represents the highest potential function for that system that is the indicator is non-limiting
to particular soil functions and 0 being the lowest (Table II).The basic model used for the computation process was:
MF ðxiÞ ¼ ½1=ð1þ fðxi � bÞ=dg2� (1)
Where, MF (xi) represents individual member scoring function for ith soil property. Model parameters include
lower crossover point (LCP), central concept (b), upper crossover point (UCP) and width of transition zone (d). The
LCP and UCP represent the situation where a land attribute is at a marginal level for a given purpose, while ‘b’ is for
an ideal level (Sys, 1985; Burrough et al., 1992).
As there are n numbers of soil characteristics affecting soil specific function, they are combined using a convex
combination function to produce a joint membership function (JMF) for all attributes:
JMFðYÞ ¼Xn
i¼1
liMFðxiÞ (2)
Where li¼weighing factor for ith soil property x, and MF (xi)¼membership grade for the ith soil property xi.
Based on the selection of indicators, all the three forms of member scoring functions were used:
For the optimum range
MFðxiÞ ¼ 1 if ðb1 þ d1Þ � xi � ðb2 � d2Þ (3)
For asymmetric left (more is better)
MFðxiÞ ¼ ½1=ð1þ fxi � b1 � d1Þ=d1g2� if xi < ðb1 þ d1Þ (4)
For asymmetric right (less is better)
MFðxiÞ ¼ ½1=ð1þ fxi � b2 þ d2Þ=d2g2� if xi > ðb2 � d2Þ (5)
A general relationship was assumed between a given indicator and particular soil function (Karlen and Stott,
1994; Andrews et al., 2002). In case of SHC and soil organic carbon (SOC), a ‘more is better’ concept was used, as
resistance of soil to water erosion would be better with a higher value of SHC and SOC. Whereas, ‘less is better’
concept was used for BD and soil erodibility. All the three concepts (optimum range, more is better and less is
better) were used for soil pH depending upon the value. The soil pH of 6�5–7�5 has been chosen as ideal range for
agricultural purposes (Doran and Parkin, 1994; Karlen et al., 1996) because very low and very high pH values are
limiting for agricultural crops.
The criteria for an ideal state of soil are based on the ability of the soil to partition water and regulate infiltration
thus decreasing soil erodibility. The functions and indicators were derived from sensitivity analysis of the WEPP
Copyright # 2008 John Wiley & Sons, Ltd. LAND DEGRADATION & DEVELOPMENT, 20: 92–100 (2009)
DOI: 10.1002/ldr
96 P. JHA ET AL.
model (Nearing et al., 1990), which includes infiltration rate, BD, organic carbon, water stable aggregates and
fertility parameters. Potential indicators were assigned weights that reflected their relative importance. It has been
suggested that the primary function of the soil with high quality, relative to water erodibility, is to accommodate
entry of water into the soil matrix in terms of infiltration rate/SHC (Karlen and Stott, 1994). Based on this
assumption, highest weight of 0�35 was assigned to this function. Water transport and retention was assumed to be
complementing the primary function and was assigned a weight of 0�10. The next most critical function, which is
resisting physical degradation, has been assigned a weight of 0�25. The remaining 0�30 is assigned to the functionsof resisting biochemical degradation at the soil surface (0�15), and functions that can interact with sustaining plantgrowth (0�15) (Table I). In this model, the ability of soil to sustain plant growth was assumed to be less important
than the process contributing towater entry and transport or to aggregate formation and stability. Each indicators for
particular soil function after converting to 0–1 scale were multiplied by the weights assigned to them and aggregate
score (Q) indicating state of soil condition was determined using the additive model.
Q ¼ qwewwe þ qwtwwt þ qrpdwrpd þ qrbdwrbd þ qspgwspg (6)
Where Q is the soil state or condition (well being), qwe is the rating for accommodating water entry (SHC), qwt is
the rating for water transport and absorption BD, qrpd is the rating for resisting physical degradation (soil
erodibility), qrbd is the rating for resisting biochemical degradation based on SOC value, qspg is the rating for
sustaining plant growth (soil pH), and w is the weighing factor for each function. Based on the aggregate score (Q),
soil mapping units under different landforms were grouped as I (Q< 0�33), II (Q¼ 0�33–0�66) and III (Q> 0�66).Higher the orders of soil grouping, better the ability of soil to resist erosion forces. A general guideline developed at
the Iowa State University Statistical laboratory (USDA-NRCS, 1999) was used for computation of ‘T’ value
(Table III).
RESULTS AND DISCUSSION
Soil Properties in Different Landforms
The minimum dataset and range of soil properties in different landforms of Delhi State are presented in Table IV.
SHC varied from 0�39 to 3�59 cm hr�1 in different landforms of Delhi State. It was lower in the soils of hill terrain,
dissected hill, pediment and piedmont plain (0�39–0�93 cm hr�1) and higher in soils of active, recent and old
alluvial plain (0�54–3�59 cm hr�1). The difference in SHC in different landforms of Delhi State could be attributed
to difference in textural composition and SOC content. SOC content ranged between 0�27 and 0�80 per cent. It wasmore in soils of alluvial plain, pediment and piedmont plain and less in soils of hill terrain and dissected hill. Yadav
and Mahapatra (2007) reported annual soil loss of 20–40Mg ha�1 in Aravalli hill range and adjoining areas. Low
SOC content in Hill and dissected hill terrain might be due to this excessive erosion rate, which removes top layer of
soil over a period of time, whereas low value of SOC (0�25 per cent) in some mapping units of older alluvial plain
could be attributed to gentle slope and intensive cultivation practice. Soils of the active and recent alluvial plain
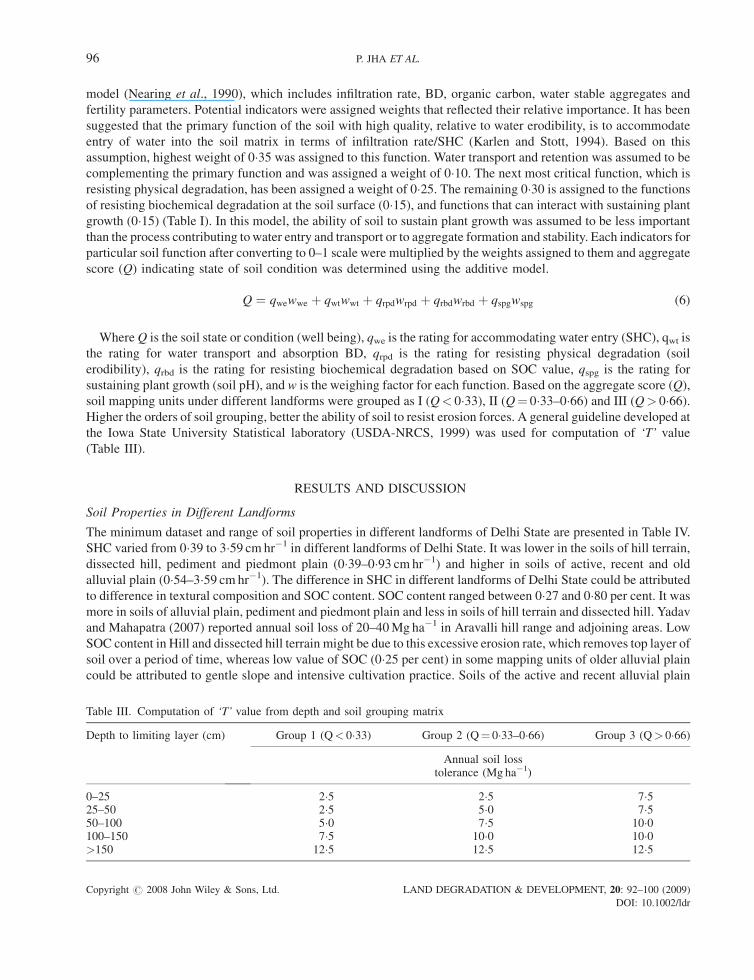
Table III. Computation of ‘T’ value from depth and soil grouping matrix
Depth to limiting layer (cm) Group 1 (Q< 0�33) Group 2 (Q¼ 0�33–0�66) Group 3 (Q> 0�66)
Annual soil losstolerance (Mg ha�1)
0–25 2�5 2�5 7�525–50 2�5 5�0 7�550–100 5�0 7�5 10�0100–150 7�5 10�0 10�0>150 12�5 12�5 12�5
Copyright # 2008 John Wiley & Sons, Ltd. LAND DEGRADATION & DEVELOPMENT, 20: 92–100 (2009)
DOI: 10.1002/ldr
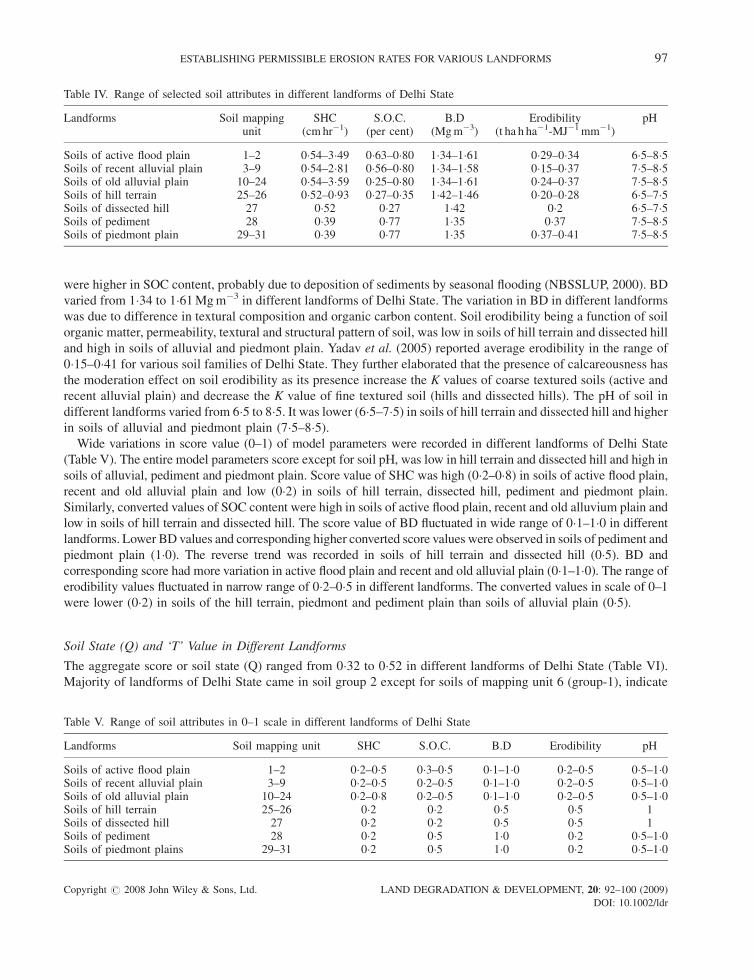
Table IV. Range of selected soil attributes in different landforms of Delhi State
Landforms Soil mappingunit
SHC(cmhr�1)
S.O.C.(per cent)
B.D(Mgm�3)
Erodibility(t ha h ha�1-MJ�1mm�1)
pH
Soils of active flood plain 1–2 0�54–3�49 0�63–0�80 1�34–1�61 0�29–0�34 6�5–8�5Soils of recent alluvial plain 3–9 0�54–2�81 0�56–0�80 1�34–1�58 0�15–0�37 7�5–8�5Soils of old alluvial plain 10–24 0�54–3�59 0�25–0�80 1�34–1�61 0�24–0�37 7�5–8�5Soils of hill terrain 25–26 0�52–0�93 0�27–0�35 1�42–1�46 0�20–0�28 6�5–7�5Soils of dissected hill 27 0�52 0�27 1�42 0�2 6�5–7�5Soils of pediment 28 0�39 0�77 1�35 0�37 7�5–8�5Soils of piedmont plain 29–31 0�39 0�77 1�35 0�37–0�41 7�5–8�5
ESTABLISHING PERMISSIBLE EROSION RATES FOR VARIOUS LANDFORMS 97
were higher in SOC content, probably due to deposition of sediments by seasonal flooding (NBSSLUP, 2000). BD
varied from 1�34 to 1�61Mgm�3 in different landforms of Delhi State. The variation in BD in different landforms
was due to difference in textural composition and organic carbon content. Soil erodibility being a function of soil
organic matter, permeability, textural and structural pattern of soil, was low in soils of hill terrain and dissected hill
and high in soils of alluvial and piedmont plain. Yadav et al. (2005) reported average erodibility in the range of
0�15–0�41 for various soil families of Delhi State. They further elaborated that the presence of calcareousness has
the moderation effect on soil erodibility as its presence increase the K values of coarse textured soils (active and
recent alluvial plain) and decrease the K value of fine textured soil (hills and dissected hills). The pH of soil in
different landforms varied from 6�5 to 8�5. It was lower (6�5–7�5) in soils of hill terrain and dissected hill and higherin soils of alluvial and piedmont plain (7�5–8�5).
Wide variations in score value (0–1) of model parameters were recorded in different landforms of Delhi State
(Table V). The entire model parameters score except for soil pH, was low in hill terrain and dissected hill and high in
soils of alluvial, pediment and piedmont plain. Score value of SHC was high (0�2–0�8) in soils of active flood plain,
recent and old alluvial plain and low (0�2) in soils of hill terrain, dissected hill, pediment and piedmont plain.
Similarly, converted values of SOC content were high in soils of active flood plain, recent and old alluvium plain and
low in soils of hill terrain and dissected hill. The score value of BD fluctuated in wide range of 0�1–1�0 in different
landforms. Lower BD values and corresponding higher converted score values were observed in soils of pediment and
piedmont plain (1�0). The reverse trend was recorded in soils of hill terrain and dissected hill (0�5). BD and
corresponding score had more variation in active flood plain and recent and old alluvial plain (0�1–1�0). The range oferodibility values fluctuated in narrow range of 0�2–0�5 in different landforms. The converted values in scale of 0–1
were lower (0�2) in soils of the hill terrain, piedmont and pediment plain than soils of alluvial plain (0�5).
Soil State (Q) and ‘T’ Value in Different Landforms
The aggregate score or soil state (Q) ranged from 0�32 to 0�52 in different landforms of Delhi State (Table VI).
Majority of landforms of Delhi State came in soil group 2 except for soils of mapping unit 6 (group-1), indicate
Table V. Range of soil attributes in 0–1 scale in different landforms of Delhi State
Landforms Soil mapping unit SHC S.O.C. B.D Erodibility pH
Soils of active flood plain 1–2 0�2–0�5 0�3–0�5 0�1–1�0 0�2–0�5 0�5–1�0Soils of recent alluvial plain 3–9 0�2–0�5 0�2–0�5 0�1–1�0 0�2–0�5 0�5–1�0Soils of old alluvial plain 10–24 0�2–0�8 0�2–0�5 0�1–1�0 0�2–0�5 0�5–1�0Soils of hill terrain 25–26 0�2 0�2 0�5 0�5 1Soils of dissected hill 27 0�2 0�2 0�5 0�5 1Soils of pediment 28 0�2 0�5 1�0 0�2 0�5–1�0Soils of piedmont plains 29–31 0�2 0�5 1�0 0�2 0�5–1�0
Copyright # 2008 John Wiley & Sons, Ltd. LAND DEGRADATION & DEVELOPMENT, 20: 92–100 (2009)
DOI: 10.1002/ldr
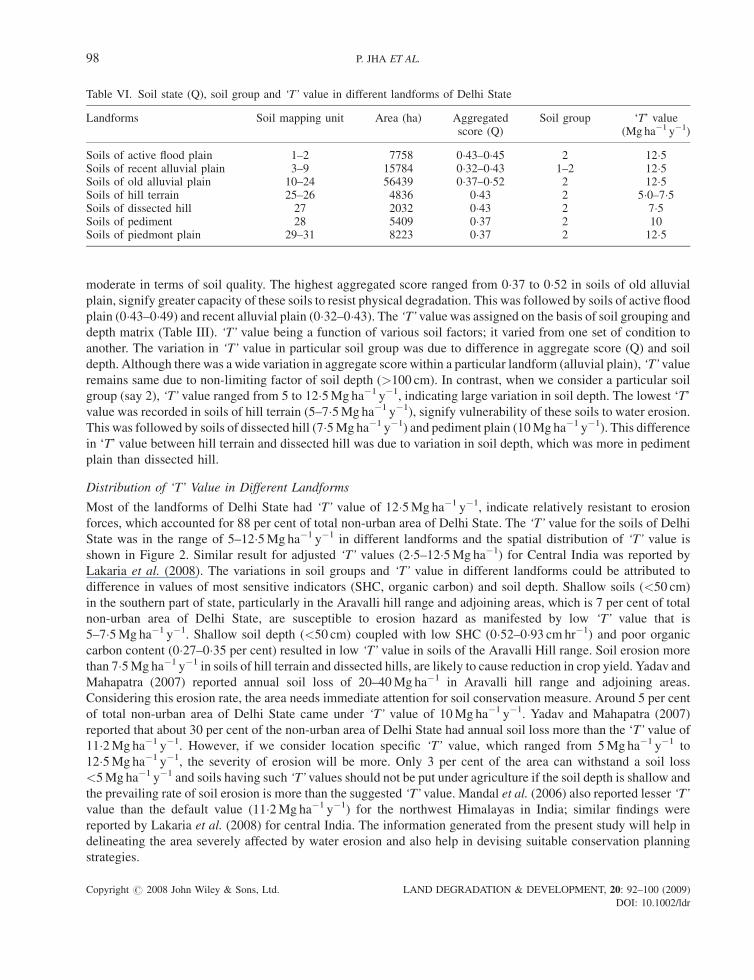
Table VI. Soil state (Q), soil group and ‘T’ value in different landforms of Delhi State
Landforms Soil mapping unit Area (ha) Aggregatedscore (Q)
Soil group ‘T’ value(Mg ha�1 y�1)
Soils of active flood plain 1–2 7758 0�43–0�45 2 12�5Soils of recent alluvial plain 3–9 15784 0�32–0�43 1–2 12�5Soils of old alluvial plain 10–24 56439 0�37–0�52 2 12�5Soils of hill terrain 25–26 4836 0�43 2 5�0–7�5Soils of dissected hill 27 2032 0�43 2 7�5Soils of pediment 28 5409 0�37 2 10Soils of piedmont plain 29–31 8223 0�37 2 12�5
98 P. JHA ET AL.
moderate in terms of soil quality. The highest aggregated score ranged from 0�37 to 0�52 in soils of old alluvial
plain, signify greater capacity of these soils to resist physical degradation. This was followed by soils of active flood
plain (0�43–0�49) and recent alluvial plain (0�32–0�43). The ‘T’ value was assigned on the basis of soil grouping and
depth matrix (Table III). ‘T’ value being a function of various soil factors; it varied from one set of condition to
another. The variation in ‘T’ value in particular soil group was due to difference in aggregate score (Q) and soil
depth. Although there was a wide variation in aggregate score within a particular landform (alluvial plain), ‘T’value
remains same due to non-limiting factor of soil depth (>100 cm). In contrast, when we consider a particular soil
group (say 2), ‘T’ value ranged from 5 to 12�5Mg ha�1 y�1, indicating large variation in soil depth. The lowest ‘T’
value was recorded in soils of hill terrain (5–7�5Mg ha�1 y�1), signify vulnerability of these soils to water erosion.
This was followed by soils of dissected hill (7�5Mg ha�1 y�1) and pediment plain (10Mg ha�1 y�1). This difference
in ‘T’ value between hill terrain and dissected hill was due to variation in soil depth, which was more in pediment
plain than dissected hill.
Distribution of ‘T’ Value in Different Landforms
Most of the landforms of Delhi State had ‘T’ value of 12�5Mg ha�1 y�1, indicate relatively resistant to erosion
forces, which accounted for 88 per cent of total non-urban area of Delhi State. The ‘T’ value for the soils of Delhi
State was in the range of 5–12�5Mg ha�1 y�1 in different landforms and the spatial distribution of ‘T’ value is
shown in Figure 2. Similar result for adjusted ‘T’ values (2�5–12�5Mg ha�1) for Central India was reported by
Lakaria et al. (2008). The variations in soil groups and ‘T’ value in different landforms could be attributed to
difference in values of most sensitive indicators (SHC, organic carbon) and soil depth. Shallow soils (<50 cm)
in the southern part of state, particularly in the Aravalli hill range and adjoining areas, which is 7 per cent of total
non-urban area of Delhi State, are susceptible to erosion hazard as manifested by low ‘T’ value that is
5–7�5Mg ha�1 y�1. Shallow soil depth (<50 cm) coupled with low SHC (0�52–0�93 cm hr�1) and poor organic
carbon content (0�27–0�35 per cent) resulted in low ‘T’ value in soils of the Aravalli Hill range. Soil erosion more
than 7�5Mg ha�1 y�1 in soils of hill terrain and dissected hills, are likely to cause reduction in crop yield. Yadav and
Mahapatra (2007) reported annual soil loss of 20–40Mg ha�1 in Aravalli hill range and adjoining areas.
Considering this erosion rate, the area needs immediate attention for soil conservation measure. Around 5 per cent
of total non-urban area of Delhi State came under ‘T’ value of 10Mg ha�1 y�1. Yadav and Mahapatra (2007)
reported that about 30 per cent of the non-urban area of Delhi State had annual soil loss more than the ‘T’ value of
11�2Mg ha�1 y�1. However, if we consider location specific ‘T’ value, which ranged from 5Mg ha�1 y�1 to
12�5Mg ha�1 y�1, the severity of erosion will be more. Only 3 per cent of the area can withstand a soil loss
<5Mg ha�1 y�1 and soils having such ‘T’ values should not be put under agriculture if the soil depth is shallow and
the prevailing rate of soil erosion is more than the suggested ‘T’ value. Mandal et al. (2006) also reported lesser ‘T’
value than the default value (11�2Mg ha�1 y�1) for the northwest Himalayas in India; similar findings were
reported by Lakaria et al. (2008) for central India. The information generated from the present study will help in
delineating the area severely affected by water erosion and also help in devising suitable conservation planning
strategies.
Copyright # 2008 John Wiley & Sons, Ltd. LAND DEGRADATION & DEVELOPMENT, 20: 92–100 (2009)
DOI: 10.1002/ldr
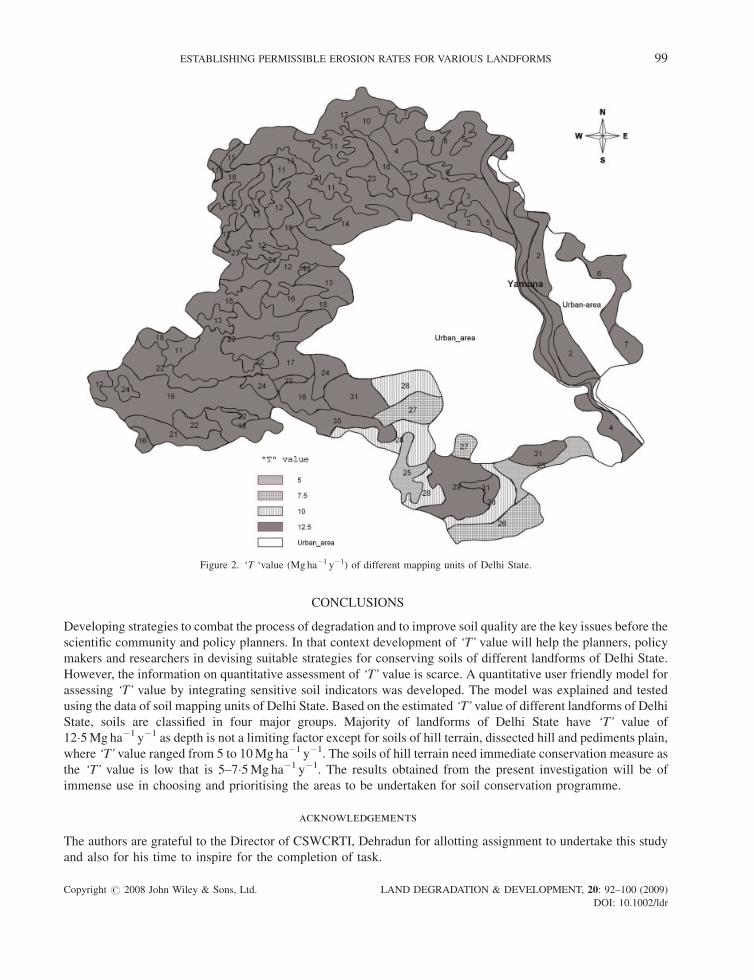
Figure 2. ‘T ‘value (Mgha�1 y�1) of different mapping units of Delhi State.
ESTABLISHING PERMISSIBLE EROSION RATES FOR VARIOUS LANDFORMS 99
CONCLUSIONS
Developing strategies to combat the process of degradation and to improve soil quality are the key issues before the
scientific community and policy planners. In that context development of ‘T’ value will help the planners, policy
makers and researchers in devising suitable strategies for conserving soils of different landforms of Delhi State.
However, the information on quantitative assessment of ‘T’ value is scarce. A quantitative user friendly model for
assessing ‘T’ value by integrating sensitive soil indicators was developed. The model was explained and tested
using the data of soil mapping units of Delhi State. Based on the estimated ‘T’ value of different landforms of Delhi
State, soils are classified in four major groups. Majority of landforms of Delhi State have ‘T’ value of
12�5Mg ha�1 y�1 as depth is not a limiting factor except for soils of hill terrain, dissected hill and pediments plain,
where ‘T’ value ranged from 5 to 10Mg ha�1 y�1. The soils of hill terrain need immediate conservation measure as
the ‘T’ value is low that is 5–7�5Mg ha�1 y�1. The results obtained from the present investigation will be of
immense use in choosing and prioritising the areas to be undertaken for soil conservation programme.
acknowledgements
The authors are grateful to the Director of CSWCRTI, Dehradun for allotting assignment to undertake this study
and also for his time to inspire for the completion of task.
Copyright # 2008 John Wiley & Sons, Ltd. LAND DEGRADATION & DEVELOPMENT, 20: 92–100 (2009)
DOI: 10.1002/ldr
100 P. JHA ET AL.
references
Andrews SS,Mitchell JP, Mancinelli R, Karlen DL, HartzWR, HorwathWR, Pettygrove GS, ScowKM,MunkDS. 2002. On farm assessment ofsoil quality in California’s central valley. Agronomy Journal 94: 12–22.
Anonymous. 2004. Directorate of Statistics-Joint Director Agriculture, Government of National Capital Territory of Delhi.Arshad MA, Lowey B, Grossman RB. 1996. Physical test for assessing soil quality. In Methods for Assessing Soil Quality, Doran JW, Jones AJ(eds). Soil Science Society of America: Madison, WI; 123–141.
Blum WEH. 1998. Basic concepts: degradation, resilience, and rehabilitation. In Methods for Assessment of Soil Degradation, Lal R, BlumWEH, Valentine C, Stewart BA (eds). CRC Press: Boca Raton, FL; 1–16.
Burrough PA, MacMillan RA, Deursen WV. 1992. Fuzzy classification methods for determining land suitability from soil profile observationsand topography. Journal of Soil Science 43: 193–210.
Doran JW, Parkin TB. 1994. Defining and assessing soil quality. In Defining Soil Quality for Sustainable Environment, Doran JW, Coleman DC,Bezdicek DF, Stewart BA (eds). Soil Science Society of America: Madison, WI; 3–21.
Hall GF, Loagan TJ, Young KK. 1985. Criteria for determining tolerable erosion rates. In Soil Erosion and Crop Productivity, Follet RF, StewartBA (eds). American Society of Agronomy: Madison, WI; 173–188.
Harris RF, Karlen DL, Mulla DJ. 1996. A conceptual framework for assessment and management of soil quality and health. In Methods forAssessing Soil Quality, Doran JW, Jones AJ (eds). Soil Science Society of America: Madison, WI; 61–82.
Karlen DL, Parkin TB, Eash NS. 1996. Use of soil quality indicators to evaluate conservation reserve program sites in Iowa. In Methods forAssessing Soil Quality, Doran JW, Jones AJ (eds). Soil Science Society of America: Madison, WI; 345–356.
Karlen DL, Stott DE. 1994. A framework for evaluating physical and chemical indicators of soil quality. In Defining Soil Quality for SustainableEnvironment, Doran JW, Coleman DC, Bezdicek DF, Stewart BA (eds). Soil Science Society of America: Madison, WI; 53–72.
Kok K, Clavaux MBW, Heerebout WM, Bronveld K. 1995. Land degradation and land cover change detection using low resolution satelliteimages and the CORINE database: A case study in Spain. ITC Journal 3: 217–227.
Lakaria BL, Biswas H, Mandal D. 2008. Soil loss tolerance values for different physiographic regions of central India. Journal of Soil Use andManagement 24: 192–198.
Larson WE, Pierce FJ. 1991. Conservation and enhancement of soil quality. In Evaluation for Sustainable Land Management in the DevelopingWorld, Dumanski J, Pushparajah E, Latham M, Myers R (eds). International Board for Soil Research and Management: Bangkok, Thailand;175–203.
Mandal D, Dadhwal KS, Khola OPS, Dhayni BL. 2006. Adjusted T values for conservation planning in Northwest Himalayas of India. Journal ofSoil and Water Conservation 61: 391–397.
Mannering JV. 1981. The use of soil loss tolerance limit as a strategy for soil conservation. In Soil Conservation: Problems and Prospects,Morgan RPC (ed.). John Wiley and Sons: New York, NY; 337–349.
McCormack DE, Young KK, Kimberlin LW. 1982. Current criteria for determining soil loss tolerance. In Determinants of Soil Loss Tolerance,Schmidt BL, Allmaras RR, Mannering JV, Papendick RI (eds). American Society of Agronomy: Madison, WI; 95–111.
NBSSLUP (National Bureau of Soil Survey and Land Use Planning). 2000. Soils of Delhi: Their Kinds, Distribution, Characterization andInterpretation for Optimizing Land Use Bulletin No 72.
Nearing MA, Ascough LD, Laflen JM. 1990. Sensitivity analysis of the WEPP hillslope profile erosion model. Transactions of the AmericanSociety of Agricultural Engineers 33: 839–849.
Saxton KE, RawlsWJ, Romberger JS, Papendick RI. 1986. Estimating generalized soil water characteristics from texture. Soil Science Society ofAmerica Journal 50: 1031–1036.
Schertz DL. 1983. The basis for soil loss tolerances. Journal of Soil and Water Conservation 38: 10–14.Sys C. 1985. Land evaluation. Part I. University of Ghent: Ghent.USDA-NRCS. 1999. National Soil Survey Handbook. 430–VI, US Government Printing Office: Washington DC.Wischmeier WH, Smith DD. 1978. Predicting rainfall erosion losses-a guide to conservation planning. US Department of Agriculture,Agriculture Handbook: 537, Washington DC; 85.
Wymore AW. 1993. Model-Based System Engineering: An Introduction to the Mathematical Theory of Discrete Systems and to the TricotyledonTheory of System Design. CRC Press: Boca Raton, FL.
Yadav RP,Mahapatra SK, Aggarwal RK, Singh SP, Samara JS. 2005. Erodibility of major soils of Delhi. Journal of Indian Society of Soil Science53: 178–183.
Yadav RP, Mahapatra SK. 2007. Assessment of potential soil erosion in Delhi State. Indian Journal of Soil Conservation 35: 222–225.
Copyright # 2008 John Wiley & Sons, Ltd. LAND DEGRADATION & DEVELOPMENT, 20: 92–100 (2009)
DOI: 10.1002/ldr