erosion influences the seismicity of active thrust faults
TRANSCRIPT

ARTICLE
Received 17 Feb 2014 | Accepted 14 Oct 2014 | Published 21 Nov 2014
Erosion influences the seismicity of activethrust faultsPhilippe Steer1, Martine Simoes2, Rodolphe Cattin3 & J. Bruce H. Shyu4
Assessing seismic hazards remains one of the most challenging scientific issues in Earth
sciences. Deep tectonic processes are classically considered as the only persistent
mechanism driving the stress loading of active faults over a seismic cycle. Here we show via a
mechanical model that erosion also significantly influences the stress loading of thrust faults
at the timescale of a seismic cycle. Indeed, erosion rates of about B0.1–20 mm yr� 1, as
documented in Taiwan and in other active compressional orogens, can raise the Coulomb
stress by B0.1–10 bar on the nearby thrust faults over the inter-seismic phase. Mass
transfers induced by surface processes in general, during continuous or short-lived and
intense events, represent a prominent mechanism for inter-seismic stress loading of
faults near the surface. Such stresses are probably sufficient to trigger shallow seismicity or
promote the rupture of deep continental earthquakes up to the surface.
DOI: 10.1038/ncomms6564
1 Geosciences Rennes, Universite Rennes 1 and CNRS UMR 6118, 35042 Rennes, France. 2 Institut de Physique du Globe de Paris, Sorbonne Paris Cite,University Paris Diderot, UMR 7154 CNRS, F-75005 Paris, France. 3 Geosciences Montpellier, Universite Montpellier II and CNRS UMR 5243, 34090Montpellier, France. 4 Department of Geosciences, National Taiwan University, Taipei 10617, Taiwan. Correspondence and requests for materials should beaddressed to P.S. (email: [email protected]).
NATURE COMMUNICATIONS | 5:5564 | DOI: 10.1038/ncomms6564 | www.nature.com/naturecommunications 1
& 2014 Macmillan Publishers Limited. All rights reserved.

The evolution of the Earth’s topography is dictated by theinteractions between tectonics, climate and surface pro-cesses (that is, erosion and sedimentation). Whether this
evolution influences tectonic deformation during mountainbuilding has been widely debated. It is now well accepted thatsurface evolution can drive the localization and intensity oftectonic deformation over geological times1–3 (1–10 Myr). Atintermediate time scales (10 kyr–1 Myr), erosion and thesubsequent isostatic rebound can favour slip along specific faultplanes4–7. However, the link between surface processes andthe stress loading of faults during the seismic cycle (0.1–1 kyr),and in turn the associated deformation mechanisms, remainsunsubstantiated.
Faults represent the main mechanical discontinuities of theelastic–brittle Earth’s upper crust. They accommodate tectonicdeformation by slipping, mostly during earthquakes8.These seismogenic faults are rooted down dip in viscous shearzones8–10. It is generally accepted that, during the inter-seismicphase (that is, before an earthquake), continuous viscous flow inthese deep shear zones leads to the elastic stress loading of activefaults closer to failure, and that during the co-seismic phase (thatis, during an earthquake), failure and slip occur along thepreviously locked fault planes, followed by post-seismic stressrelaxation4,8. Fault failure is commonly defined by the mean ofthe Coulomb stress change, DCFF¼Dtþm0 �Dsn, a function ofthe fault effective friction m0, the shear Dt (positive in thedirection of slip) and normal Dsn (positive if the fault isunclamped) stress changes8,11. Earthquakes can be triggered bytectonic stresses, but also by Coulomb stresses due to episodic andshort-lived events such as hydrologic12 or snow loading13, nearbyearthquakes14–17 and slow-slip events18.
Here, we show that surface processes significantly contribute tothe Coulomb stress loading of thrust faults during the seismic
cycle. To illustrate and then demonstrate our point, we consider amountain range in Taiwan where the rates of erosion19 andtectonic deformation20,21 are extremely high and among the best-documented in the world. We then investigate how erosioninfluences the stress loading of thrust faults using a simple modelfor the seismic cycle.
ResultsCoulomb stress changes induced by erosion in Taiwan. Ourfirst model quantifies the Coulomb stress change DCFF generatedby erosional unloading, as constrained from fluvial suspendedsediment load measured over the 30 yr before the 1999 Mw7.6Chi–Chi earthquake in central Taiwan19 (Fig. 1 and Methods).The three dimensional (3D) velocity field v, strain rate _e andstress rate _r tensors induced by erosion are computed in anelastic half-space using a Boussinesq approach (Fig. 1c andMethods). We use simplified geometries for active thrust faultslocated in the foothills of Taiwan22 (for details, see Methods) andassume a dip angle a of 30�, a 15 km deep brittle–ductiletransition22 and an effective friction m0 of 0.5 to computeCoulomb stress changes per unit time (or loading rates) DCFFdue to erosional unloading on these faults. We find a maximumvalue of B4� 10� 3 bar yr� 1 for the Coulomb stress changeDCFF induced by erosional unloading on the Liuchia fault system(number 8 on Fig. 1) in southwestern Taiwan. Despite a lowtopographic relief, this area has the highest erosion ratesdocumented in Taiwan (up to 24 mm yr� 1), which areproposed to be controlled locally by a low substrate strength, ahigh storminess and a high seismic moment release rate19.However, most of the thrust faults located in the foothills stilldisplay a significant DCFF of B0.5� 10� 3 bar yr� 1, includingthe Chelungpu fault (number 3) that ruptured during the
1
2 3 4
5
7
6
8
0
1
2
3
Z (
km)
1
2 3 4
5
7
6
8
Thrust fault systems1 - Miaoli-Hsinchu2 - Changhua3 - Chelungpu4 - Shuangtung5 - Chushiang6 - Chiuchiung- -keng7 - Chiayi8 - Liuchia
0
10
20
5
15
10–310–4
Taipei
Kaohshiung
Taichung
Tainan
HsinchuTaoyuan
Taitung
Chiayi
Ylan
Hualien
1
2 3 4
5
6
7 8
. E (
mm
per
yea
r)
�CFF (bar per year)
Figure 1 | Faults stress loading rates induced by erosion in the foothills of Taiwan. (a) Topography, simplified main thrust fault systems (red lines
and numbers from 1–8) and location of the 1999 Mw7.6 Chi–Chi earthquake epicenter (red star) that ruptured the Chelungpu fault (number 3).
(b) Inter-seismic erosion rates before the Chi–Chi earthquake, as calculated from fluvial suspended sediment measurements with a 5-km grid
resolution, smoothed at the catchment scale using a circular moving mean with 30-km diameter19. (c) Erosion induced Coulomb stress loading rates
DCFF calculated on the fault planes. The horizontal solid black lines represent scale bars of 50 km.
ARTICLE NATURE COMMUNICATIONS | DOI: 10.1038/ncomms6564
2 NATURE COMMUNICATIONS | 5:5564 | DOI: 10.1038/ncomms6564 | www.nature.com/naturecommunications
& 2014 Macmillan Publishers Limited. All rights reserved.

Chi–Chi earthquake. Integrated over a seismic cycle duration23 ofB500 yr, a DCFF of 0.5 to 4� 10� 3 bar yr� 1 due to erosionalunloading gives a net Coulomb stress change of 0.25–2.0 bar.Similar values of Coulomb stress change are documentedelsewhere to contribute significantly to the stress loading anddynamics of active faults12–18. This suggests that erosionalunloading can significantly influence the short-term dynamicsof faults.
Erosional unloading modifies the Coulomb stress change on afault plane in two ways: (1) it decreases the normal stress andunclamps the fault, and (2) it increases the tangential stress(Fig. 2a). The increment of stress on a fault plane is proportionalto the amount of erosion, but decreases with the square of thedistance r between the fault plane and where erosion occurs(Fig. 2b). Therefore, the amplitude of erosional Coulomb stressloading on a fault is sensitive (1) to the effective friction m0, whichmodulates the effect of erosion on the normal stress, and (2) tothe fault dip angle a, which decomposes the stresses into faultnormal and tangential components and controls the distance ofthe fault plane to the surface. For instance, a higher effectivefriction m0 of 0.8 and a lower dip angle a of 15�, therefore, resultin increasing the induced DCFF up to B1� 10� 2 bar yr� 1 forthe Liuchia fault system (Fig. 2c). In addition, the stressesmodelled here are invariant with the Young modulus of thematerial, as we are considering a linear elastic material subjectedto a surface pressure load (and not to a surface displacement).
Stresses induced by erosion during the seismic cycle. The abovecomputations consider inter-seismic erosion rates calculated fromdata acquired during the 30 yr preceding the Chi–Chi earth-quake19. Even though its amplitude relative to co-seismic rockuplift is debated, co- and post-seismic erosional unloadingrepresent a major contribution to erosion in seismic areas24–27.In mountain belts with hillslopes close to failure, co-seismicground motion and acceleration can induce a significant amountof landslides28. The sediments produced by these landslides arethen transported by rivers mainly during subsequent floods. Thispost-seismic landscape relaxation phase has a documentedpotential duration25,26 of years to decades, one order ofmagnitude shorter than a complete seismic cycle. Therefore, thecontribution of co- and post-seismic erosion to the stress loadingof active faults also needs to be evaluated.
To assess the relative contribution of inter-seismic erosion,co-/post-seismic erosion and tectonics to the Coulomb stressloading of faults, we develop a simple model of the seismic cyclethat accounts for the effect of both erosion and tectonics (Fig. 3and Methods). We assume a steady-state landscape over theseismic cycle, that is, rock uplift rates _U are balanced by erosionrates
.E over this time scale. Because of the response-time of the
geomorphic system to climate or tectonic perturbations andbecause of their stochastic properties29, this assumption isprobably not valid in most settings. However, it offers a simpleand self-consistent approach for modelling first-order surfaceprocesses during the seismic cycle. A Boussinesq approach is usedto compute v, _e and _r, whereas the tectonic stresses and uplift(and therefore erosion) are calculated using dislocationsembedded in an elastic half-space30. The effects of tectonicdeformation during the inter- and co-seismic phases areaccounted for by slip on a deep shear zone and on a shallowbrittle fault, respectively9,31. This seismic cycle model is validwhen considering a fault that is fully locked during the inter-seismic phase, as it is proposed for the thrust faults located in thewestern foothills of Taiwan32–34.
For comparison with faults in the foothills of Taiwan, we definea reference model with a fault trace length of 80 km and a dip
�
Fault��n��n
����
����r
Mass removedby erosion
104103102101
r (m)
100
10–1
10–2
10–3
10–4
10–5
10–6
–2
15 30 45
0.2
0.5
0.8
�′
HighLow
10–310–410–5
ΔCF
F/Δ
CF
Fm
ax
Log10(��)
�CFF (bar per year)
� (°)
a
b
c
Figure 2 | Mechanism of Coulomb stress loading of a thrust fault by
surface erosion. (a) Distribution of stress increment Ds (here purely
illustrative) induced by a punctual erosion at the surface, increasing both
the tangential Dt (driving effect) and the normal stresses Dsn (unclamping
effect). The white solid line indicates a scale bar of 2.5 km. (b) The resulting
fault Coulomb stress change DCFF decreases with the square of the vertical
distance r between the fault plane and where erosion occurs (assuming
a¼ 30� and 1 m of erosion). (c) Sensitivity of DCFF induced by erosion to
the fault dip angle a and effective friction m0, taking the Liuchia fault system
as an example. The black solid line indicates a scale bar of 25 km. The
model in the dashed green box is equivalent to the one in Fig. 1 and Dt and
Dsn are reported in Supplementary Fig. 1.
NATURE COMMUNICATIONS | DOI: 10.1038/ncomms6564 ARTICLE
NATURE COMMUNICATIONS | 5:5564 | DOI: 10.1038/ncomms6564 | www.nature.com/naturecommunications 3
& 2014 Macmillan Publishers Limited. All rights reserved.
angle of 30�, while keeping all the other mechanical propertiesidentical. We also impose a slip velocity Vinter of 40 mm yr� 1 onthe shear zone during the inter-seismic phase, and Vco of40 mm yr� 1 on the associated brittle fault during the co-seismicphase. This model setup provides only a rough approximation ofthe seismic cycle at the scale of the whole western foothills ofTaiwan. Indeed, deformation is partitioned between several activethrust faults in this area that are probably rooted down at depthinto a single decollement with a total slip of B40 mm yr� 1
(refs 21,33). In addition, because our goal is to quantify theco- and post-seismic erosional unloading rates during thelandscape relaxation phase following large earthquakes25,26, wecompute co-seismic slip velocity averaged over the seismic cyclerather than co-seismic instantaneous displacement. Note thatthese two approaches are strictly equivalent in an elastic model.
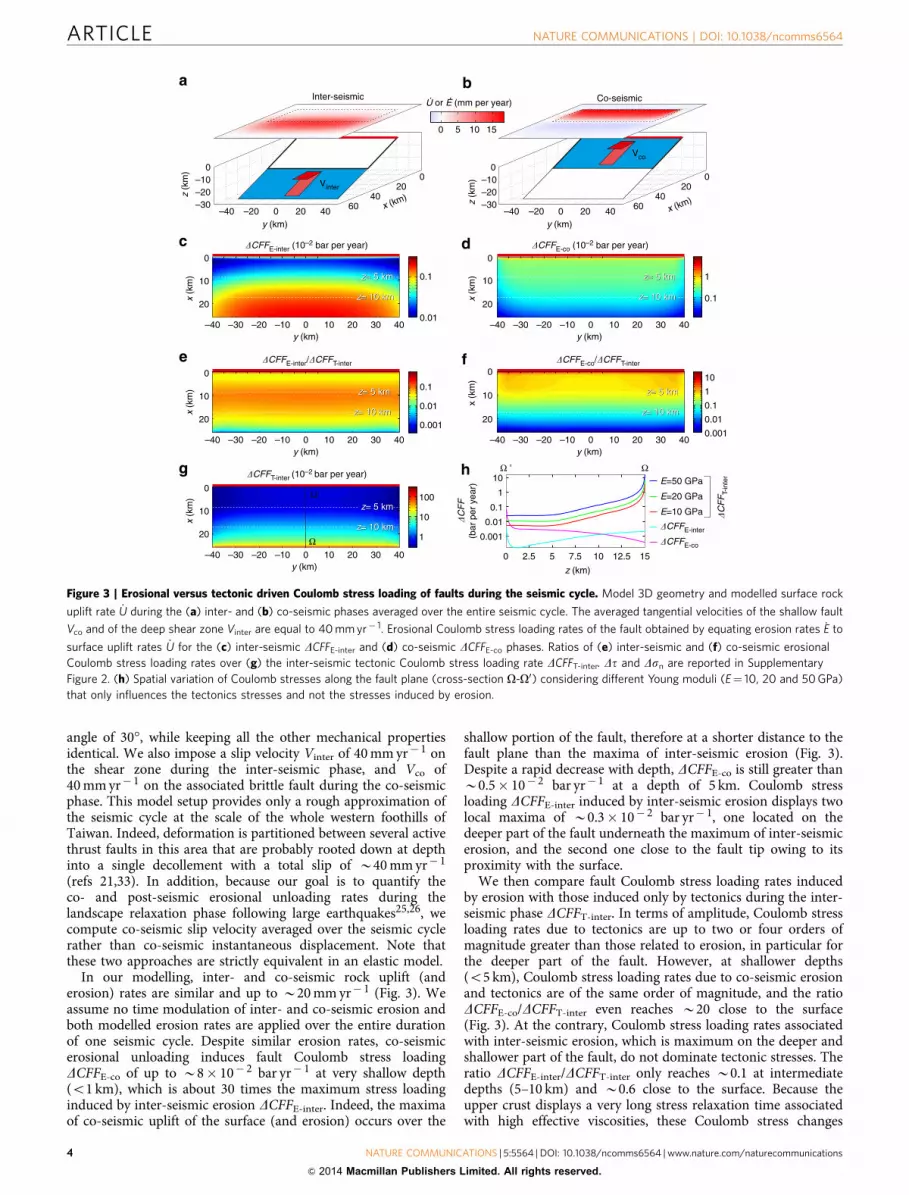
In our modelling, inter- and co-seismic rock uplift (anderosion) rates are similar and up to B20 mm yr� 1 (Fig. 3). Weassume no time modulation of inter- and co-seismic erosion andboth modelled erosion rates are applied over the entire durationof one seismic cycle. Despite similar erosion rates, co-seismicerosional unloading induces fault Coulomb stress loadingDCFFE-co of up to B8� 10� 2 bar yr� 1 at very shallow depth(o1 km), which is about 30 times the maximum stress loadinginduced by inter-seismic erosion DCFFE-inter. Indeed, the maximaof co-seismic uplift of the surface (and erosion) occurs over the
shallow portion of the fault, therefore at a shorter distance to thefault plane than the maxima of inter-seismic erosion (Fig. 3).Despite a rapid decrease with depth, DCFFE-co is still greater thanB0.5� 10� 2 bar yr� 1 at a depth of 5 km. Coulomb stressloading DCFFE-inter induced by inter-seismic erosion displays twolocal maxima of B0.3� 10� 2 bar yr� 1, one located on thedeeper part of the fault underneath the maximum of inter-seismicerosion, and the second one close to the fault tip owing to itsproximity with the surface.
We then compare fault Coulomb stress loading rates inducedby erosion with those induced only by tectonics during the inter-seismic phase DCFFT-inter. In terms of amplitude, Coulomb stressloading rates due to tectonics are up to two or four orders ofmagnitude greater than those related to erosion, in particular forthe deeper part of the fault. However, at shallower depths(o5 km), Coulomb stress loading rates due to co-seismic erosionand tectonics are of the same order of magnitude, and the ratioDCFFE-co/DCFFT-inter even reaches B20 close to the surface(Fig. 3). At the contrary, Coulomb stress loading rates associatedwith inter-seismic erosion, which is maximum on the deeper andshallower part of the fault, do not dominate tectonic stresses. Theratio DCFFE-inter/DCFFT-inter only reaches B0.1 at intermediatedepths (5–10 km) and B0.6 close to the surface. Because theupper crust displays a very long stress relaxation time associatedwith high effective viscosities, these Coulomb stress changes
0 10 155
Vinter
0–10–20–30
z (k
m)
0 20 40–20–40y (km)
x (km)
0
4060
20
Inter-seismic
Vco
0–10–20–30z
(km
)
0 20 40–20–40y (km)
x (km)
0
4060
20
Co-seismic
–20 20–10 100y (km)
–30–40 30 40
0
10
20
x (k
m) z= 5 km
z= 10 km
0
10
20
x (k
m)
z= 5 km
z= 10 km
–20 20–10 100y (km)
–30–40 30 40
0
10
20
x (k
m)
–20 20–10 100y (km)
–30–40 30 40
z= 5 km
z= 10 km
0
10
20
x (k
m)
–20 20 30–10 100y (km)
–30–40 40
z= 5 km
z= 10 km
0
10
20
x (k
m)
–20 20–10 100y (km)
–30–40 30 40
z= 5 km
z= 10 km1
10
100
z= 5 km
z= 10 km
z= 5 km
z= 10 km
z= 5 km
z= 10 km
z= 5 km
z= 10 km
z= 5 km
z= 10 km
Ω
Ω’
0.1
1
0.01
0.1
0.001
0.01
0.1
0.001
0.01
0.1
1
10
�CFFE-co
�CFFE-inter
E=50 GPa
E=20 GPa
E=10 GPa
Ω ’ Ω10
0.01
1
0.1
0.001
155 102.5 7.50 12.5
�CFFE-inter (10–2 bar per year) �CFFE-co (10–2 bar per year)
�CFFE-co/�CFFT-inter
�C
FF
T-in
ter
z (km)
�C
FF
(bar
per
yea
r)�CFFT-inter (10–2 bar per year)
�CFFE-inter/�CFFT-inter
U or E (mm per year). .
Figure 3 | Erosional versus tectonic driven Coulomb stress loading of faults during the seismic cycle. Model 3D geometry and modelled surface rock
uplift rate _U during the (a) inter- and (b) co-seismic phases averaged over the entire seismic cycle. The averaged tangential velocities of the shallow fault
Vco and of the deep shear zone Vinter are equal to 40 mm yr� 1. Erosional Coulomb stress loading rates of the fault obtained by equating erosion rates.E to
surface uplift rates _U for the (c) inter-seismic DCFFE-inter and (d) co-seismic DCFFE-co phases. Ratios of (e) inter-seismic and (f) co-seismic erosional
Coulomb stress loading rates over (g) the inter-seismic tectonic Coulomb stress loading rate DCFFT-inter. Dt and Dsn are reported in Supplementary
Figure 2. (h) Spatial variation of Coulomb stresses along the fault plane (cross-section O-O0) considering different Young moduli (E¼ 10, 20 and 50 GPa)
that only influences the tectonics stresses and not the stresses induced by erosion.
ARTICLE NATURE COMMUNICATIONS | DOI: 10.1038/ncomms6564
4 NATURE COMMUNICATIONS | 5:5564 | DOI: 10.1038/ncomms6564 | www.nature.com/naturecommunications
& 2014 Macmillan Publishers Limited. All rights reserved.

induced by erosion can be accumulated over the time scale of aseismic cycle (B500 yr). On the other hand, increasing the Youngmodulus from the reference value (10 GPa) by a factor of 2(20 GPa) or 5 (50 GPa) results in increasing the Coulomb stresschange induced by tectonics DCFFT-inter by a factor of 2 or 5 anddecreasing the ratios DCFFE-inter/DCFFT-inter and DCFFE-co/DCFFT-inter by the same factor (Fig. 3h). However, these resultsstill demonstrate (1) that erosion can contribute significantly tothrust fault stress loading during the seismic cycle, and (2) thaterosion can even be one of the dominant stress loadingmechanisms for the shallower parts of thrust fault planes.
Model sensitivity analysis. To assess the sensitivity of our resultsto the model parameters, we design a set of models similar to thereference model, but with varying values of the effective frictionm0 (0.1–0.9), the Young modulus E (10, 20 and 50 GPa) and thefault and shear zone dip angle a (15 to 45�). For the sake ofsimplicity, we keep the depth of the brittle–ductile transition at15 km, which in turn implies that the surface area of the brittlefault increases when decreasing a. Using this modelling approach,erosion rates during the inter-seismic
.Einter and the co-seismic
.Eco
phases are only sensitive to a (Fig. 4a,b). Whereas.Einter remains
approximately constant around 13 mm yr� 1,.Eco increases from
11 to 22 mm yr� 1 when a increases from 15–45�.The resulting Coulomb stresses DCFFE-inter and DCFFE-co on
the fault plane are in turn sensitive to (1) the dip angle a, whichcontrols both the distribution and amplitude of
.Einter and
.Eco and
the distance between the Earth surface and the fault plane, and (2)the effective friction m0 by amplifying the influence of normalstress on the Coulomb stress (Fig. 4c,d). The maximum values ofDCFFE-inter and DCFFE-co obtained on the fault plane showsimilar distributions in the parameter space. DCFFE-inter isminimum (B1� 10� 3 bar yr� 1) for a low effective friction(m0r0.2) combined to a high or low dip angle (15� or 45�),whereas it increases when increasing m0 and reaches a maximum(B2.7� 10� 3 bar yr� 1) for a around 25�. DCFFE-co is minimum(B1.5� 10� 2 bar yr� 1) for a low effective friction (m0r0.2)
combined to a high or low dip angle (15� or 45�), whereas itincreases when increasing m0 and reaches a maximum ofB4� 10� 2 bar yr� 1 for a around 30�.
Because the Coulomb stresses induced by tectonics DCFFT-inter
are also sensitive to the Young modulus E, the ratios DCFFE-inter/DCFFT-inter and DCFFE-co/DCFFT-inter are in turn sensitive to a, m0
and E. Increasing the Young modulus from 10 to 20 or 50 GPaincreases DCFFT-inter and decreases DCFFE-inter/DCFFT-inter andDCFFE-co/DCFFT-inter by a factor of 2 or 5, respectively. DCFFE-
inter/DCFFT-inter remains lower than one only for all the modelstested, independent of the Young modulus E. At the contrary,DCFFE-co/DCFFT-inter displays a large domain in the parameterspace with values greater than one (that is, with at least oneelement of the fault plane dominated by stresses induced byerosion). For E¼ 10 GPa, only models with low m0 (o0.5) andhigh a (435�) are dominated by tectonic stresses (DCFFE-co/DCFFT-intero1), whereasile for E¼ 50 GPa, most of the modelswith a greater than 20–30� are dominated by tectonic stresses.Therefore, Coulomb stresses induced by erosion during theseismic cycle represent a significant contribution to fault stressloading, even though their amplitude depends on the propertiesof the fault (dip angle, effective friction) and of the medium(Young modulus).
DiscussionBased on erosion data from Taiwan19, we have demonstrated thatthe elastic Coulomb stresses induced by erosion are of the orderof B0.5� 10� 3 bar yr� 1 on the thrust faults located in thewestern foothills and reach a maximum of B4� 10� 3 bar yr� 1
on the Liuchia fault. These results are consistent with theoutcomes from a simple model of the seismic cycle of a thrustfault that accounts for the effect of both erosion and tectonics,using fault properties and a slip velocity close to the ones inferredfor Taiwan20–22. Coulomb stresses induced by inter-seismicDCFFE-inter and co-seismic DCFFE-co erosion and averaged overthe duration of a seismic cycle (B500 yr) reach values of up toB3� 10� 3 bar yr� 1 and B8� 10� 2 bar yr� 1, respectively.
12
16
20
Co-seismic
20 30 4012
16
20
Inter-seismic
20 30 40
20 30 40
0.2
0.4
0.6
0.8
�′
1.5
2.0
2.5
3.0
3.5
�′
20 30 40
0.2
0.4
0.6
0.8
0.1
0.15
0.2
0.25
E=1
0 G
Pa
E=1
0 G
Pa
E=5
0 G
Pa
E=5
0 G
Pa
E=2
0 G
Pa
E=2
0 G
Pa
EE TT
EETT
EETT
EE erosion dominatederosion dominatedTT tectonics dominatedtectonics dominated
. Ein
ter
(mm
per
yea
r)
. Eco
(mm
per
yea
r)
� (°) � (°)
� (°)
�C
FF
E-I
inte
r (1
0–2 b
ar p
er y
ear)
� (°)
�C
FF
E-c
o (1
0–2 b
ar p
er y
ear)
Figure 4 | Sensitivity of model results to the model parameters. Maximum surface erosion rates obtained during the (a) inter-seismic.Einter and
the (b) co-seismic.Eco periods as a function of the fault and shear zone dip angle a. Maximum fault Coulomb stresses induced by erosion during
(c) inter-seismic DCFFE-inter and (d) co-seismic DCFFE-co periods, which are function of the dip angle a and of the effective friction m0 , are shown with
a plain colour map. White lines indicate the limits of tectonics (black arrow) versus erosion (white arrow) dominated Coulomb stresses in the model
parameter space for varying values of the Young modulus E (10, 20 and 50 GPa). The reference model is represented by a white star. We consider
that Coulomb stresses induced by erosion dominate tectonic stresses when at least one element of the fault is dominated by erosional stresses.
For the inter-seismic erosion induced stresses, we here only consider the deep part of the fault.
NATURE COMMUNICATIONS | DOI: 10.1038/ncomms6564 ARTICLE
NATURE COMMUNICATIONS | 5:5564 | DOI: 10.1038/ncomms6564 | www.nature.com/naturecommunications 5
& 2014 Macmillan Publishers Limited. All rights reserved.
On the shallower part of thrust faults (o5 km deep), the ratio ofthe Coulomb stresses induced by co-seismic erosion DCFFE-co tothe ones induced by tectonic loading DCFFT-inter is about equal toone for a Young modulus E¼ 10 GPa (B0.2 for E¼ 50 GPa) andeven reach a maximum of B20 closer to the surface (B4 forE¼ 50 GPa). In addition, assuming that co-seismic erosionhappens only during a period 10–100 times shorter25,26
(B5–50 yr) than the complete seismic cycle23 (B500 yr),DCFFE-CO increases up to 80� 10� 1 to 8 bar yr� 1 and theratio DCFFE-co/DCFFT-inter to 10 or 100 for E¼ 10 GPa (2–20 forE¼ 50 GPa) during the first B5–50 years following a largeearthquake. Large earthquakes with a potential negative massbalance (that is, erosion greater than uplift), such as theWenchuan earthquake24,27, could induce even higher rates ofDCFFE-co than those predicted by a steady-state model. Ourmodelling approach imposes that co-seismic erosion is maximumclose to the fault trace and above the shallower part of thrustfaults (Fig. 3). This result contrasts with most of the observeddistribution of earthquake-triggered landslides, with a maximumof landslide density close to the epicentral area, and thereforegenerally above the deeper part of thrust faults28. Therefore,depending on the location of large earthquake hypocentersalong the fault plane, our estimates for the contribution ofco-seismic erosion to fault stress loading might likely beoverestimated.
However, our results emphasize that short-lived and intenseerosional events associated with efficient sediment transport, suchas typhoons, could suddenly increase the Coulomb stress ofunderlying faults. On longer time-scales, climatic changes ortransition between fluvial- and glacial-dominated surfaceprocesses could also lead to high transient erosion rates andtherefore to transient increases of the fault stress loading due toerosion4–7. The mechanism proposed in this study is limitedneither to convergent settings nor to erosion only, as sedimentdeposition on the hanging wall of normal faults could also lead toa significant increase in Coulomb stress5. Moreover, some lessactive areas, such as intra-continental faults or old orogens stillexperience intense erosion and episodic seismic activity6,7. In theabsence of major tectonic deformation, surface processes couldsignificantly contribute to the stress loading of faults in theseareas, even when considered independently of the stressesinduced by isostatic rebound.
In summary, our results demonstrate that surface processesrepresent a significant contribution to the Coulomb stress loadingof faults during the seismic cycle. In terms of deformation, theseadditional stresses on the shallower part of fault planes caninduce and trigger shallow earthquakes, as illustrated by theseismicity triggered by the large 2013 Bingham Canyon minelandslide35, or potentially favour the rupture of large deeperearthquakes up to the surface as, for instance, during the Chi–Chiearthquake36. This offers new perspectives on the mechanismsinfluencing stress transfers during the seismic cycle, as well as onseismic hazard assessment in areas experiencing rapid erosion.More generally, Coulomb stress loading of faults induced bysurface processes over short time scales provides an additionalpositive feedback between climate, surface processes andtectonics.
MethodsSeismic cycle model. The deformation model computes the velocity field v, strain_e and stress _r rate tensors induced by surface erosion in a 3D elastic half-spacebased on the Boussinesq approximation37. With respect to this approximation, weassume that the model surface is horizontal (Fig. 1). The effect of such assumptionis here limited as the topography of the western foothills of Taiwan is globallyo1 km. The model is discretized by cubic cells with a 100 m resolution, with aYoung modulus of E¼ 10 GPa, a Poison ratio of n¼ 0.25 and a rock density ofr¼ 2800 kg m� 3.
Velocity, stresses and strain induced by tectonics are simulated by the mean oftriangular dislocations30,31 accounting for the slip (1) of a viscous deep shear zoneduring the inter-seismic phase and of (2) a frictional fault located in the shallowelastic–brittle crust during the co-seismic phase. The imposed averaged tangentialvelocities of the shear zone Vinter and of the fault Vco are both equal to 40 mm yr� 1.Coulomb stress changes are then computed by projecting the stresses due tosurface processes and to tectonics on the fault plane that is discretized with aresolution of 100 m. The extent of fault planes and the dip angle data of the westernfoothills of Taiwan were simplified from ref. 22. Each fault trace was simplified to aline segment that best reproduces the real fault trace geometry.
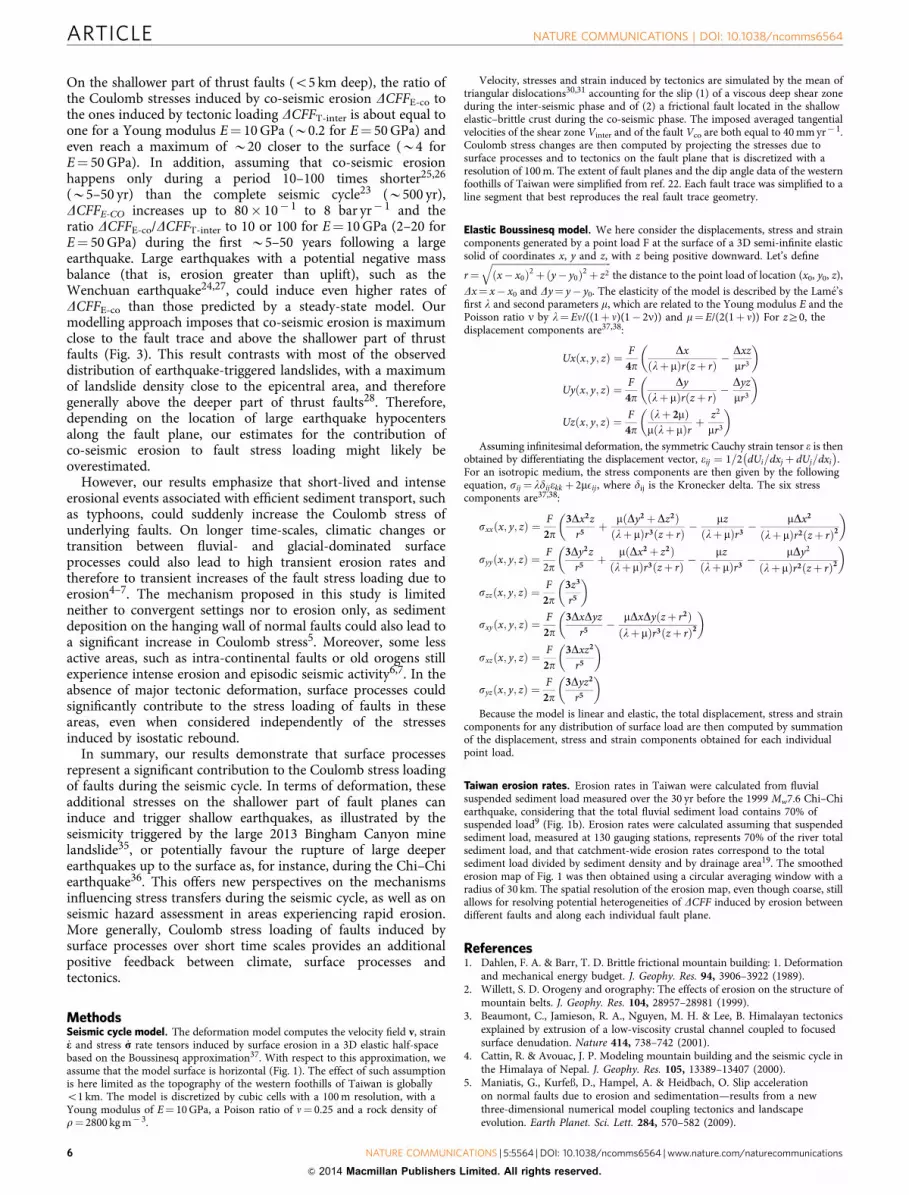
Elastic Boussinesq model. We here consider the displacements, stress and straincomponents generated by a point load F at the surface of a 3D semi-infinite elasticsolid of coordinates x, y and z, with z being positive downward. Let’s define
r¼ffiffiffiffiffiffiffiffiffiffiffiffiffiffiffiffiffiffiffiffiffiffiffiffiffiffiffiffiffiffiffiffiffiffiffiffiffiffiffiffiffiffiffiffiffiffiffiffiffiffix� x0ð Þ2 þ y� y0ð Þ2 þ z2
qthe distance to the point load of location (x0, y0, z),
Dx¼ x� x0 and Dy¼ y� y0. The elasticity of the model is described by the Lame’sfirst l and second parameters m, which are related to the Young modulus E and thePoisson ratio n by l¼En/((1þ n)(1� 2n)) and m¼E/(2(1þ n)) For zZ0, thedisplacement components are37,38:
Uxðx; y; zÞ ¼ F4p
Dxlþ mð Þr zþ rð Þ �
Dxzmr3
� �
Uyðx; y; zÞ ¼ F4p
Dylþmð Þr zþ rð Þ �
Dyzmr3
� �
Uzðx; y; zÞ ¼ F4p
ðlþ 2mÞm lþ mð Þr þ
z2
mr3
� �
Assuming infinitesimal deformation, the symmetric Cauchy strain tensor e is thenobtained by differentiating the displacement vector, eij ¼ 1=2 dUi=dxjþ dUj=dxi
� �.
For an isotropic medium, the stress components are then given by the followingequation, sij ¼ ldijekk þ 2mEij , where dij is the Kronecker delta. The six stresscomponents are37,38:
sxxðx; y; zÞ ¼ F2p
3Dx2zr5
þ mðDy2 þDz2Þlþ mð Þr3 zþ rð Þ �
mzlþ mð Þr3
� mDx2
lþmð Þr2 zþ rð Þ2� �
syyðx; y; zÞ ¼F
2p3Dy2z
r5þ mðDx2 þ z2Þ
lþmð Þr3 zþ rð Þ �mz
lþmð Þr3� mDy2
lþ mð Þr2 zþ rð Þ2� �
szzðx; y; zÞ ¼F
2p3z3
r5
� �
sxyðx; y; zÞ ¼ F2p
3DxDyzr5
� mDxDyðzþ r2Þlþ mð Þr3 zþ rð Þ2
� �
sxzðx; y; zÞ ¼ F2p
3Dxz2
r5
� �
syzðx; y; zÞ ¼F
2p3Dyz2
r5
� �
Because the model is linear and elastic, the total displacement, stress and straincomponents for any distribution of surface load are then computed by summationof the displacement, stress and strain components obtained for each individualpoint load.
Taiwan erosion rates. Erosion rates in Taiwan were calculated from fluvialsuspended sediment load measured over the 30 yr before the 1999 Mw7.6 Chi–Chiearthquake, considering that the total fluvial sediment load contains 70% ofsuspended load9 (Fig. 1b). Erosion rates were calculated assuming that suspendedsediment load, measured at 130 gauging stations, represents 70% of the river totalsediment load, and that catchment-wide erosion rates correspond to the totalsediment load divided by sediment density and by drainage area19. The smoothederosion map of Fig. 1 was then obtained using a circular averaging window with aradius of 30 km. The spatial resolution of the erosion map, even though coarse, stillallows for resolving potential heterogeneities of DCFF induced by erosion betweendifferent faults and along each individual fault plane.
References1. Dahlen, F. A. & Barr, T. D. Brittle frictional mountain building: 1. Deformation
and mechanical energy budget. J. Geophy. Res. 94, 3906–3922 (1989).2. Willett, S. D. Orogeny and orography: The effects of erosion on the structure of
mountain belts. J. Geophy. Res. 104, 28957–28981 (1999).3. Beaumont, C., Jamieson, R. A., Nguyen, M. H. & Lee, B. Himalayan tectonics
explained by extrusion of a low-viscosity crustal channel coupled to focusedsurface denudation. Nature 414, 738–742 (2001).
4. Cattin, R. & Avouac, J. P. Modeling mountain building and the seismic cycle inthe Himalaya of Nepal. J. Geophy. Res. 105, 13389–13407 (2000).
5. Maniatis, G., Kurfe�, D., Hampel, A. & Heidbach, O. Slip accelerationon normal faults due to erosion and sedimentation—results from a newthree-dimensional numerical model coupling tectonics and landscapeevolution. Earth Planet. Sci. Lett. 284, 570–582 (2009).
ARTICLE NATURE COMMUNICATIONS | DOI: 10.1038/ncomms6564
6 NATURE COMMUNICATIONS | 5:5564 | DOI: 10.1038/ncomms6564 | www.nature.com/naturecommunications
& 2014 Macmillan Publishers Limited. All rights reserved.

6. Calais, E., Freed, A. M., Van Arsdale, R. & Stein, S. Triggering ofNew Madrid seismicity by late-Pleistocene erosion. Nature 466, 608–611(2010).
7. Vernant, P. et al. Erosion-induced isostatic rebound triggers extension in lowconvergent mountain ranges. Geology 41, 467–470 (2013).
8. Scholz, C. H. The Mechanics of Earthquakes and Faulting 439 (New York:Cambridge University Press, 1990).
9. Doglioni, C., Barba, S., Carminati, E. & Riguzzi, F. Role of the brittle–ductiletransition on fault activation. Phys. Earth Planet. In. 184, 160–171 (2011).
10. Cowie, P. A., Scholz, C. H., Roberts, G. P., Faure Walker, J. P. & Steer, P.Viscous roots of active seismogenic faults revealed by geologic slip ratevariations. Nat. Geosci. 6, 1036–1040 (2013).
11. Jaeger, J. C. & Cook., N. G. W. Fundamentals of Rock Mechanics 3rd edn(London: Chapman and Hall, 1979).
12. Bettinelli, P. et al. Seasonal variations of seismicity and geodetic strain in theHimalaya induced by surface hydrology. Earth Planet. Sci. Lett. 266, 332–344(2008).
13. Heki, K. Seasonal modulation of interseismic strain buildup in northeasternJapan driven by snow loads. Science 293, 89–92 (2001).
14. Reasenberg, P. A. & Simpson, R. W. Response of regional seismicity to the staticstress change produced by the Loma Prieta earthquake. Science 255, 1687–1690(1992).
15. King, G. C., Stein, R. S. & Lin, J. Static stress changes and the triggering ofearthquakes. Bull. Seism. Soc. Am. 84, 935–953 (1994).
16. Stein, R. S. The role of stress transfer in earthquake occurrence. Nature 402,605–609 (1999).
17. Delescluse, M. et al. April 2012 intra-oceanic seismicity off Sumatra boosted bythe Banda-Aceh megathrust. Nature 490, 240–244 (2012).
18. Segall, P., Desmarais, E. K., Shelly, D., Miklius, A. & Cervelli, P. Earthquakestriggered by silent slip events on Kilauea volcano, Hawaii. Nature 442, 71–74(2006).
19. Dadson, S. J. et al. Links between erosion, runoff variability and seismicity inthe Taiwan orogen. Nature 426, 648–651 (2003).
20. Yu, S. B., Chen, H. Y. & Kuo, L. C. Velocity field of GPS stations in the Taiwanarea. Tectonophysics 274, 41–59 (1997).
21. Simoes, M. & Avouac, J. P. Investigating the kinematics of mountain buildingin Taiwan from the spatiotemporal evolution of the foreland basin and westernfoothills. J. Geophy. Res. 111, B10401 (2006).
22. Shyu, J. B. H., Sieh, K., Chen, Y. G. & Liu, C. S. Neotectonic architecture ofTaiwan and its implications for future large earthquakes. J. Geophy. Res. 110,B08402 (2005).
23. Chen, W. S. et al. Late Holocene paleoseismicity of the southern part of theChelungpu fault in central Taiwan: Evidence from the Chushan excavation site.B. Seismol. Soc. Am. 97, 1–13 (2007).
24. Parker, R. N. Mass wasting triggered by the 2008 Wenchuan earthquake isgreater than orogenic growth. Nat. Geosci. 4, 449–452 (2011).
25. Hovius, N. et al. Prolonged seismically induced erosion and the mass balance ofa large earthquake. Earth Planet. Sci. Lett. 304, 347–355 (2011).
26. Howarth, J. D., Fitzsimons, S. J., Norris, R. J. & Jacobsen, G. E. Lake sedimentsrecord cycles of sediment flux driven by large earthquakes on the Alpine fault,New Zealand. Geology 40, 1091–1094 (2012).
27. Li, G. et al. Seismic mountain building: landslides associated with the 2008Wenchuan earthquake in the context of a generalized model for earthquakevolume balance. Geochem. Geophys. Geosyst. 15, 833–844 (2014).
28. Meunier, P., Hovius, N. & Haines, J. A. Topographic site effects and the locationof earthquake induced landslides. Earth Planet. Sci. Lett. 275, 221–232 (2008).
29. Lague, D., Hovius, N. & Davy, P. Discharge, discharge variability, and thebedrock channel profile. J. Geophy. Res. 110, F04006 (2005).
30. Meade, B. J. Algorithms for the calculation of exact displacements, strains, andstresses for triangular dislocation elements in a uniform elastic half space.Comput. Geosci. 33, 1064–1075 (2007).
31. Vergne, J., Cattin, R. & Avouac, J. P. On the use of dislocations to modelinterseismic strain and stress build-up at intracontinental thrust faults.Geophys. J. Int. 147, 155–162 (2001).
32. Loevenbruck, A., Cattin, R., Le Pichon, X., Courty, M. L. & Yu, S. B. Seismiccycle in Taiwan derived from GPS measurements. C. R. Acad. Sci. IIA 333,57–64 (2001).
33. Dominguez, S., Avouac, J. P. & Michel, R. Horizontal coseismic deformation ofthe 1999 Chi-Chi earthquake measured from SPOT satellite images:Implications for the seismic cycle along the western foothills of central Taiwan.J. Geophy. Res. 108, 2083 (2003).
34. Hsu, Y. J., Simons, M., Yu, S. B., Kuo, L. C. & Chen, H. Y. A two-dimensionaldislocation model for interseismic deformation of the Taiwan mountain belt.Earth Planet. Sci. Lett. 211, 287–294 (2003).
35. Pankow, K. L. et al. Massive landslide at Utah copper mine generates wealth ofgeophysical data. GSA. Today 24, 4–9 (2014).
36. Cattin, R., Loevenbruck, A. & Le Pichon, X. Why does the co-seismic slip of the1999 Chi-Chi (Taiwan) earthquake increase progressively northwestward onthe plane of rupture? Tectonophysics 386, 67–80 (2004).
37. Boussinesq, J. Equilibre d’elasticite d’un sol isotrope sans pesanteur, supportantdifferents poids. CR Math. Acad. Sci. Paris 86, 1260–1263 (1878).
38. Westergaard, H. M. Theory of elasticity and plasticity (Harvard UniversityPress, 1952).
AcknowledgementsWe are grateful to Patience Cowie, Dimitri Lague, Philippe Davy, Thomas Croissant,Niels Hovius, Patrick Meunier, Odin Marc and Frederic Boudin for discussions. Thisstudy was funded by the CNRS-INSU (Centre National de la Recherche Scientifique -Institut National des Sciences de l’Univers, France), the ORCHID program (PartenariatsHubert Curien, France-Taiwan), the EROQUAKE ANR project (Agence Nationale de laRecherche, France) and the Universite Rennes 1. This is IPGP contribution number 3569.
Author contributionsP.S. analyzed the data and performed the modelling. All authors contributed equally tothe design of the study and to the writing of the paper.
Additional InformationSupplementary Information accompanies this paper at http://www.nature.com/naturecommunications
Competing financial interests: The authors declare no competing financial interests.
Reprints and permission information is available online at http://npg.nature.com/reprintsandpermissions/
How to cite this article: Steer, P. et al. Erosion influences the seismicity of active thrustfaults. Nat. Commun. 5:5564 doi: 10.1038/ncomms6564 (2014).
NATURE COMMUNICATIONS | DOI: 10.1038/ncomms6564 ARTICLE
NATURE COMMUNICATIONS | 5:5564 | DOI: 10.1038/ncomms6564 | www.nature.com/naturecommunications 7
& 2014 Macmillan Publishers Limited. All rights reserved.