equilibrium-line altitude (ela)
TRANSCRIPT

E
ELONGATION RATIO
Vijay KumarNational Institute of Hydrology, Roorkee, India
DefinitionElongation ratio is one of the main areal properties ofbasin. Areal properties express the overall plan form anddimensions of the basin. The elongation ratio (Re) isdefined by Schumm (1956) as the ratio of the diameterof a circle with the same area as that of the basin to themaximum basin length:
Re ¼ Dc
Lb
where
Dc, diameter of the circle with the same area as that of thebasin
Lb, maximum basin length
The value of Re approaches 1.0 as the shape ofa drainage basin approaches to a circle. The ratio variesfrom 0.6 to 1.0 over a wide variety of climatic and geo-logic regimes. Typical values are close to 1.0 for regionsof very low relief and are between 0.6 and 0.8 for regionsof strong relief and steep ground slope.
The elongation ratio has important hydrological conse-quences because, in contrast to more circular catchments,precipitation delivered during a storm in highly elongatedbasins has to travel a wide range of distances to reach thebasin outlet. The resulting delay in the arrival ofa proportion of the storm flow consequently leads toa flattening of the storm hydrograph. Statistical analysesof the glacio-morphometric parameters of glaciers of
Vijay P. Singh, Pratap Singh & Umesh K. Haritashya (eds.), Encyclopedia of Snow# Springer Science+Business Media B.V. 2011
Indian Himalayas by Ahmad et al. (2004) indicated thatthe higher relief area gradient and higher elongation ratioare the favorable morphometric condition for survivingthe glaciations for a glacier. Elongated body is moreinfluenced by surrounding reflected diffuse energy andvice versa.
BibliographyAhmad, S., Hasnain, S. I., and Selvan, M. T., 2004. Morpho-metric
characteristics of glaciers in the Indian Himalayas. Asian Journalof Water Environment and Pollution, 1(1, 2), 109–118.
Schumm, S. A., 1956. Evolution of drainage systems and slopes inbadlands at Perth Amboy, New Jersey. Geological Society ofAmerican Bulletin, 67, 597–646.
ENGLACIAL CONDUIT
D. P. DobhalWadia Institute of Himalayan Geology, Dehradun,Uttarakhand, India
DefinitionEnglacial conduits are the primary water transporting sys-tem from the surface of glacier to the base of a glacier.Supraglacial melt water either flows over the ice surfaceor descends vertically into the ice via holes called Moulin,where the water connects in the form of pipes or conduitsof the englacial system. Moulin can go all the way to thebottom of the glacier. Englacial melt water is oftenconnecting to sub-glacier flow system at the base of theglacier. Geometry and hydraulics of englacial conduitsdepends on the structure of the glacier.
, Ice and Glaciers, DOI 10.1007/978-90-481-2642-2,

258 ENGLACIAL PROCESSES
ENGLACIAL PROCESSES
Andrew G. FountainDepartment of Geology, Portland State University,Portland, OR, USA
DefinitionEnglacial processes refer to the body of the glacier, or thatregion between the surface and the bed. In practice it refersto the ice, as opposed to firn, part of the englacialregion away from the surfaces. Although no formal dis-tance away from the surface is adopted, the term generallyimplies that portion of the ice body which is not directlyaffected by the atmosphere. In this view, the englacialregion starts below average crevasse depth from theatmosphere-ice interface. At the bed, no implicit orexplicit distance away from this interface exists.
CharacteristicsThe englacial region is generally considered to be entirelycomposed of ice, although rock debris, water-filled voids(in temperate glaciers), and air-filled voids may be pre-sent. Other impurities that may be scavenged by precipita-tion descending through the atmosphere, or that may beblown onto the snow surface in the accumulation zonebecome incorporated in the englacial region (Cuffey andPaterson, 2010). Ice sheets, and to some degree polar gla-ciers, are generally free of large englacial inclusions, asrevealed by ice radar. Instead, reflecting horizons in icesheets are common and can be followed for hundreds ofkilometers (Figure 1; Siegert and Hodgkins, 2000; Welchand Jacobel, 2003). These horizons are thought to resultfrom changes in snow (ice) chemistry due to volcanic orother dust events that cover the snow surface for long dis-tances (Fujita et al., 1999). In contrast, temperate glaciers
Dep
th (
m)
0
500
1000
1500
2000
2500
80 90 100 110 1
10x Vertical Exaggeration
Ice Stratigraphy
Dista
ST. O L A F C O L LEG
E
FR
AM
FR
AM
KRI STM EN NKR
OS
SM
EN
N
Englacial Processes, Figure 1 Radar reflections within the Antarcticextend from tens to hundreds of kilometers. Taken from Welch and
exhibit many reflectors and are thought to be water-filledinclusions of unknown origin (Figure 2; Murray et al.,2000). Indeed, the number density of these reflectors weresuch that early versions of ice radar technology could notpenetrate significant distances into the ice and it wasn’tuntil the application of long wavelength radar that thebottom of the glacier could be detected.
For the remainder of this discussion, we focus on theenglacial characteristics of temperate glaciers. Investiga-tions of the englacial region have relied strongly on theo-retical considerations, and on three empirical approaches.First, ground penetrating radar, often called “ice radar,”has been employed with great success in the polar icesheets to explore the stratigraphic horizons (Figure 1).Application to temperate glaciers has been less successfuldue to the large number of radar-scatters in the ice, as previ-ously discussed. The hope has been to unambiguously mapthe location and extent of englacial conduits and otherhydraulic features with only a few successful efforts to date.Better success has been achieved in estimating the waterfraction within the ice; however, this has not been indepen-dently tested. The second approach is to inject tracers usingthe travel time and dispersion to infer the geometry of theflow system. However, the tracer is typically routed throughsubglacial pathways before exiting the glacier cloudinginterpretations of englacial hydraulics. Finally, the mostdirect approach is to drill a borehole into a glacier and exam-ine the englacial region directly using submersible videocameras. In addition, hydraulic tests can be conducted tomeasure the permeability of the region. Ground penetratingradar antennas have also been lowered in boreholes to betterdetect deep englacial structures.
In temperate glaciers the englacial region contains sig-nificant volumes of water. At the microscopic scale wateris present along the grain boundaries where three or moreice crystals meet (Raymond and Harrison, 1975). Giventhat the ice is near its melting temperature in such glaciers,
20 130 140 150 160
Bedrock
nce (Km)
ice sheet. The x-axis is kilometers. Note the parallel horizons thatJacobel (2005).

0
500
Layer 1
Layer 2
Deep Deffration
Bed
1000
1500
2000
2500
0
42
84
126
168
210
100 200 300 400 500 600 700
Distance (m)
East West
Tim
e (n
s)
App
roxi
mat
e D
epth
(m
)
A
Englacial Processes, Figure 2 25 MHz GPR data with a 2-4-15-30 MHz bandpass filter applied layer 1 has few reflectors, whereaslayer 2 exhibits apparently random reflectors. Taken from Bradford and Humphrey (2005).
ENGLACIAL PROCESSES 259
thermodynamics considerations predict the presence ofwater at the boundaries. It was once thought thata network of passageways through the grain boundariesrouted water from the glacier surface to bottom; however,the presence of air bubbles and the surface tension of waterprecludes significant water flux rates (<1m s�1) (Lliboutry,1976). Nearly all rain and surface meltwater enters the bodyof the glacier through crevasses and moulins (e.g.,Stenborg, 1973). Crevasses are the most important avenuefor water because they are more numerous than moulinsand are found over the entire glacier, whereas moulins aregenerally restricted to the ablation zone. Water-filled cre-vasses are not common, indicating that they efficiently routewater into the body of the glacier. This conclusion issupported by Stenborg’s (1973) work showing that moulinsdevelop from crevasses. Neither the nature of hydrauliclinks between crevasses and the body of the glacier northe formation of such links is well understood.
Conventional wisdom envisions englacial water flow insemi-circular ice-walled conduits (Fountain and Walder,1998). The mechanics of steady flow in englacial conduitshave been described theoretically. These conduits exist ifthe tendency for closure, from the inward creep of ice, isbalanced by the melt enlargement resulting from the energydissipated by flowing water. Englacial conduits shouldform an upward branching arborescent network, with themean flow direction oriented steeply down-glacier, as deter-mined by the gradient of the total potential (gravity and icepressure) driving the flow. Observations of englacial con-duits, with typically shallow slopes, near a glacier terminusand lower ablation zone are relatively common (Figure 3).In a particularly nice study of conduit geometry Gulleyand Benn (2007) showed that conduits that developed fromdebris-filled crevasses exhibit a wide variety of cross-sectional geometries and formed a sinuous flow path.Empirical results based on the dispersion and travel time
of numerous tracer injections in crevasses support the arbo-rescent-network hypothesis. Most of the information bear-ing on the distribution and geometry of englacialpassageways or on englacial water pressures and flow ratescomes from boreholes drilled to the glacier bottom usinga jet of hot water. About half of all such boreholes drainbefore the glacier bed is reached, indicating that they inter-sect englacial. Measurements of water level, water quality,and flow direction in boreholes and measurements of tracersinjected into boreholes strongly suggest the presence ofenglacial passageways. However, the hydraulic inferencesare contaminated by the hydraulic connections betweenthe englacial passageway and a subglacial connection atthe bottom of the borehole. Therefore, distinguish variationsin flow/pressures in the subglacial connection versus that inenglacial connections cannot be separated with certainty.
A number of direct measurements of englacial passagesexist including englacial voids with typical verticalextents of �0.1 m, and small (�mm in radius), arbores-cent, passages, but whether these voids or passages werepart of an active hydraulic system was unclear. (Void isused here to mean a water-filled pocket in the ice, whichmay or may not be part of the englacial hydraulic system.Isolated voids are known to exist.) Englacial conduitshave been observed where they connect to subglacial tun-nels. Video cameras lowered into boreholes revealed mul-tiple englacial voids through nearly the entire icethickness. Voids that intersected opposite sides of theborehole wall were interpreted as englacial conduits; typ-ically, one or two such features were encountered in eachborehole, with diameters typically �0.1 m (e.g., Harperand Humphrey, 1995). Pohjola (1994) determined thatwater was flowing in a few englacial conduits and estimateda flow speed in one of 0.01–0.1 m/s, the same range esti-mated by Hooke et al. (1988) using dye tracers. Fountainet al. (2005a) intersected two adjacent semi-circular

Englacial Processes, Figure 3 An exceptionally well-developed englacial conduit with incised floor in NgozumpaGlacier. Taken fromGulley and Benn (2007).
Englacial Processes, Figure 4 Englacial fracture inStorglaciaren, Sweden. The view is looking vertically downward,note the drill hole at the bottom. Width of the fracture at thearrows is approximately 4 cm. Taken from Fountain et al.(2005b).
260 ENGLACIAL PROCESSES
englacial conduits at a depth of about 42 m. The diameterswere 0.03 m and 0.1 m and within the conduit water flowspeeds were about 0.1 m s�1. Most conduits seen by bore-hole video seemed to be nearly horizontal.
In the search for englacial conduits Fountain et al.(2005b) found water-filled hydraulically connected frac-tures conveying englacial water to be ubiquitous in theablation zone of an alpine glacier. Conduits were notencountered until the search included a small regionaround moulins. The fracture aperture openings averagedabout 4 cm and were found from near surface to 96% ofthe local ice depth. Water flow speeds in the fractures were1–2 cm s�1. The fractures were near vertical in orientationand associated with clear ice. From this they inferred thatthe fractures are probably partly refrozen crevasses. Thatthese features were also found near the bottom of the gla-cier points to a possible subglacial origin for deep frac-tures. Surface fractures/crevasses can be propagated deepinto a glacier through hydrofracturing (Boon and Sharp,2003; van der Veen, 2007) if it is water filled. The com-mon occurrence of englacial fractures and the lack of con-duits contest the traditional hypothesis that englacialconduits route surface water through the englacial regionof temperate glaciers. Englacial conduits may be limitedto regions down-glacier of moulins and fractures may con-vey most of the water up-glacier of moulins (Figure 4).
The multiple radar reflections and ubiquity of fractureobservations suggests that the englacial region ofa glacier may be quite heterogeneous and rather thana solid mass of ice and a few conduits it is highly fracturedwith water-filled fractures. The implications for glacierhydrology are clear; however, how such a compositionaffects glacier motion is less obvious.
Understanding howwater is routed through the englacialregion is of key importance for understanding the motion oftemperate glaciers and glacier hydrology. Water routing tothe bottom of a glacier is an important control on the basalhydrology and therefore basal drag and glacier motion.Basal water pressure partially offsets ice pressure on thebed reducing sliding friction. In addition, the presence ofbasal water bodies transfers the bulk shear stress to areas

ENVIRONMENTAL ISOTOPES 261
of ice-substrate contact. The influence of englacial routingon subglacial hydraulics can be argued as follows. Wherelarge fluxes of surface water are focused to a few crevasses,we presume efficient flow pathways, moulins andenglacial/subglacial conduits, develop to route the water.In regions where input is much smaller and more disperseamong numerous crevasses, other pathways can accommo-date the water flux and a different configuration of subgla-cial hydraulic features can develop.
Temperate glaciers can store and catastrophicallyrelease water impounded in ice-dammed lakes or storedinternally, presumably in englacial or subglacial regions.Although the evolution of ice-dammed flooding behaviorhas been well-outlined theoretically and largely explainsthe observations, the processes of storage and release areessentially unknown. Outburst floods are an importanthazard in many alpine regions, particularly in theHimalaya Hindu-Kush region. Also, temperate glaciersplay an important role in alpine hydrology, particularlyduring the hot-dry summer months when rainfall isa minimum. Understanding glacier controls on streamflow variations is a relevant concern for dams and otherhuman infrastructure in such regions. In some alpineregions of Norway and Switzerland, water is drained frombeneath some glaciers to drive hydroelectric facilities.
BibliographyBoon, S., and Sharp, M., 2003. The role of hydrologically-driven
ice fracture in drainage system evolution on an Arctic glacier.Geophysical Research Letters, 30, 1916, doi:10.1029/2003GL018034.
Bradford, J., and Harper, J., 2005. Wave field migration as a tool forestimating spatially continuous radar velocity and water contentin glaciers. Geophysical Research Letters, 32, doi:10.1029/2004GL021770.
Cuffey, K., and Paterson,W., 2010. The physics of glaciers, 4th edn.Academic Press, ISBN: 978-0-12-369461-4, 704 pp.
Fountain, A., and Walder, J., 1998. Water flow through temperateglaciers. Reviews of Geophysics, 36, 299–328.
Fountain, A., Schlichting, B., Jansson, P., and Jacobel, R., 2005a.Observations of englacial flow passages: a fracture dominatedsystem. Annals of Glaciology, 40, 25–30.
Fountain, A., Schlicting, R., Jacobel, R., and Jansson, P., 2005b.Fractures as main pathways of water flow in temperate glaciers.Nature, 433, 618–621.
Fujita, S., Maeno, H., Uratsuka, S., Funukawa, T., Mae, S., Fiujii,Y., and Watanabe, O., 1999. Nature of radio echo layering inthe Antarctic ice sheet detected by a two-frequency experiment.Journal of Geophysical Research, 104, 13013–13024.
Gulley, J., and Benn, D., 2007. Structural control of englacial drain-age systems in Himalayan debris-covered glaciers. Journal ofGlaciology, 53, 399–412.
Harper, J., and Humphrey, N., 1995. Borehole video analysis ofa temperate glacier’s englacial and subglacial structure: implica-tions for glacier flow models. Geology, 23, 901–904.
Lliboutry, L., 1976. Temperate ice permeability, stability of waterveins and percolation of internal meltwater. Journal of Glaciol-ogy, 42, 201–211.
Murray, T., Stuart, G. W., Fry, M., Gamble, N., and Crabtree, M.,2000. Englacial water distribution in a temperate glacier fromsurface and borehole radar velocity analysis. Journal of Glaciol-ogy, 46, 389–398.
Pohjola, V., 1994. TV-video observations of englacial voids inStorglaciaren, Sweden. Journal of Glaciology, 40, 231–240.
Raymond, C., and Harrison, W., 1975. Some observations on thebehavior of the liquid and gas phases in temperate glacier ice.Journal of Glaciology, 71, 213–234.
Siegert, M., and Hodgkins, R., 2000. A stratigraphic link across1100 km of the Antarctic ice sheet between the Vostok ice-coresite and Titan Dome (near south pole). Geophysical ResearchLetters, 27, 2133–2136.
Stenborg, T., 1973. Some viewpoints on the internal drainage ofglaciers, in hydrology of glaciers. IAHS Publications, 95,117–129.
van der Veen, C., 2007. Fracture propagation as means of rapidlytransferring surface meltwater to the base of glaciers. Geophysi-cal Research Letters, 34, doi:10.1029/2006GL028385.
Welch, B., and Jacobel, R., 2003. Analysis of deep-penetratingradar surveys of west Antarctica, US-ITASE 2001. GeophysicalResearch Letters, 30, 1444, doi:10:1029/2003GL017210.
Welch, B., and Jacobel, R., 2005. Bedrock topography and winderosion sites in east Antarctica: observations from the 2002US-ITASE traverse. Annals of Glaciology, 41, 92–96.
Cross-referencesCrevassesFirnGlacier Lake Outburst FloodsGlacier HydrologyGround Penetrating Radar Measurements Over GlaciersMoulinsSubglacial ProcessesTemperate Glaciers
ENVIRONMENTAL ISOTOPES
Bhishm KumarHydrological Investigation Division, National Institute ofHydrology, Roorkee, Uttarakhand, India
DefinitionEnvironmental isotopes may be defined as those isotopes,both stable and radioactive, which occur in the environ-ment in varying concentration over which the investigatorhas no control (Payne, 1983).
These can be stable or unstable isotopes. Some ex-amples of stable isotopes include 2H, 3He, 6Li, 11B,13C,15N, 18O, 34S, etc., and some unstable or radioactiveisotopes are 3H, 14C, 36Cl, 137Cs 210Pb, etc. These are prin-cipal elements of hydrological, geological, and biologicalsystems. The stable isotopes of these elements serve astracers of water, carbon, nutrient, and solute cycling.Radioactive environmental isotopes are also important inhydrogeology. The environmental radioisotopes, whethernaturally occurring due to cosmic ray interaction with var-ious gaseous molecules or anthropogenically producedand become the part of hydrological cycle, are safe in nor-mal conditions and do not pose any threat to human health.Environmental radionuclide such as 14C and 3H decaywith time so that they can be used to estimate the age orcirculation of groundwater.

262 EPIGENETIC ICE
UsesSince glaciers are known to preserve the precipitation ofthe past in an unbroken sequence, it might seem that theyare especially well suited for the study of the isotopic com-position of precipitation and its variation with time.Dansgaard (1964) first proposed that the 18O andD contents in glacier ice might reflect climatic conditionsof the past. The other applications include study of accu-mulation rates, run-off ratio, dating of the ice-core, ice-flow pattern, drifting sea ice, and paleoclimates (Clarkand Fritz, 1997).
BibliographyClark, I., and Fritz, P., 1997. Environmental Isotopes in Hydrogeol-
ogy. Boca Raton, FL/New York: Lewis.Dansgaard, W., 1964. Stable isotopes in precipitation. Tellus, 16,
436–438.Payne, B. R., 1983. Guidebook on Nuclear Techniques in Hydrol-
ogy. Technical Report Series No. 91. Vienna: InternationalAtomic Energy Agency.
EPIGENETIC ICE
Chelamallu HariprasadCentre for Studies in Resource Engineering, IITB,Mumbai, Maharashtra, India
DefinitionThe ground ice refers to all types of ice formed in freezingand frozen ground. Broadly ground ice can be categorizedas epigenetic and syngenetic. Epigenetic ground ice formsin situ as permafrost aggrades while syngenetic ground iceforms in combination with deposition. Thus Epigenetic isa type of ground ice, formed in situ under conditions ofpermafrost in the subsoil. In general, frozen ground or per-mafrost represents the area which existed below 0�C forover few years (at least 2 years).
EPIGLACIAL MORPHOLOGY
Claudio Smiraglia, Guglielmina DiolaiutiDepartment of Earth Sciences “A. Desio”, University ofMilano, Milano, Italy
SynonymsEpiglacial environment; Epiglacial landscape; Epiglacialsystem; Supraglacial morphology
DefinitionEpiglacial or supraglacial. Processes acting or featuresbeing evident at the glacier surface.
Epiglacial morphology. Complex of features derivingfrom processes active at the glacier surface, such as differ-ential ablation or meltwater flow.
IntroductionEpiglacial morphology due to the large amplitude of topo-graphical features plays a crucial role in determining thedistinctive landscape of glacial system; in addition it cre-ates the actual epiglacial environment which is wellknown to trekkers, alpine climbers, and mountain travel-lers (Benn and Evans, 1998). Crevasses and ice falls,supraglacial lakes and water ponds, medial moraines anddebris-covered glacier snouts are among the best-knownfeatures belonging to the glacial landscape.
By analyzing the main epiglacial morphology featuresit is possible to deepen the knowledge on ice flow andstrain rate and on debris transfer through the glacialsystem.
A large number of processes, which are different incomplexity and mutual relations, are driving the epiglacialmorphology giving a large amplitude of forms. For sortingthe epiglacial forms and describing their development andevolution, a basic and qualitative classification can beapplied: (1) forms related to glacier motion and flow,(2) forms related to epiglacial meltwater, and (3) formsrelated to differential ablation.
The above classification, although useful for describingthe main features of epiglacial morphology, is not fullyexhaustive, since the largest part of epiglacial forms ispolygenic and actually results from the interactions amongdifferent processes which create a unique complex mor-pho-dynamic system where glacier flow, epiglacial drain-age, and differential ablation are connected by severalpositive and negative feedback mechanisms.
The driving factors shaping the glacier surface anddetermining the different types of epiglacial forms are wellexpressed on temperate glaciers. In the following sectionswe will focus on this glacier type. It is also important toconsider the brief time span covered by epiglacial formevolution: they generate, develop, and end in a short timeframe, thus being considered ephemeras forms which, inparticular on the lower sectors of glacier ablation tongues,may fast change their shape or disappear after a few days.
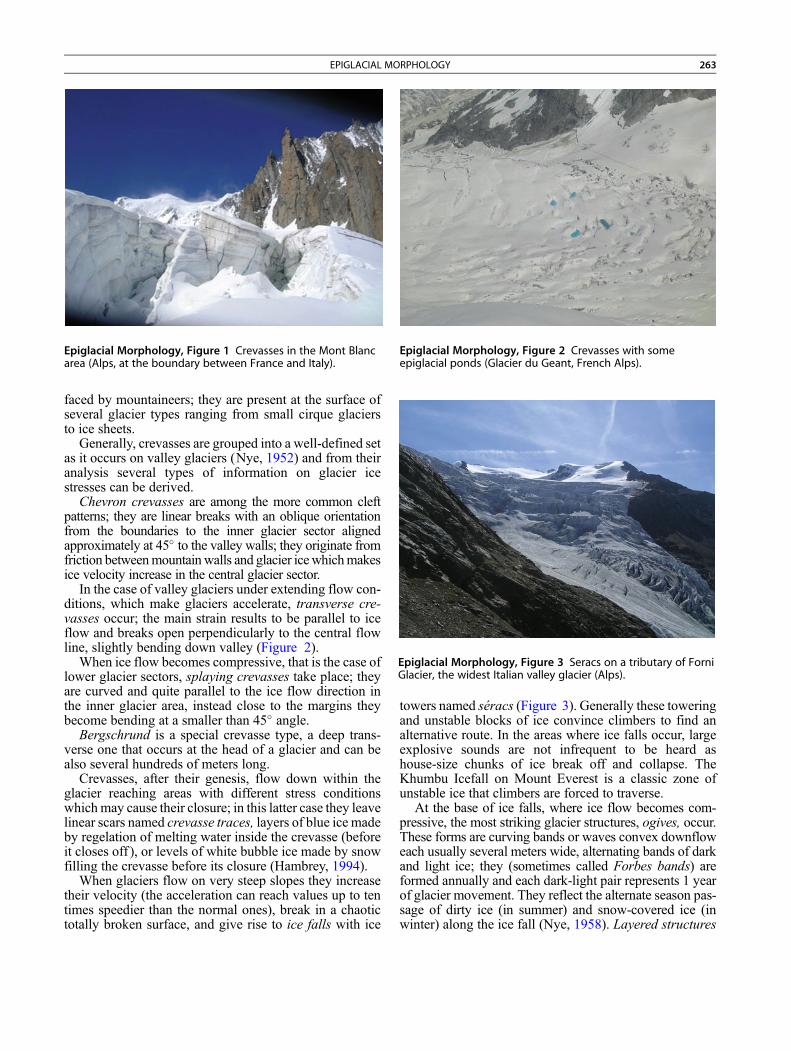
Epiglacial forms related to glacier motionCrevasses are glacier fractures which can be listed amongstructural forms. Glacier fractures occur when ice cannotcreep fast enough to allow a glacier to adjust its shapeunder stress. Crevasses are fractures formed where ice ispulled apart by tensile stresses; these fractures are fairlysuperficial features because at depth creep rates are higherand ice will flow faster than it can split (Figure 1). On tem-perate glaciers, characterized by “soft” ice, they rarelyextend deeper than 30–40 m, whereas on polar and coldglaciers they may be much deeper. Crevasses are surelythe most prominent and well-known features related toglacier flow, since they represent the most serious hazards
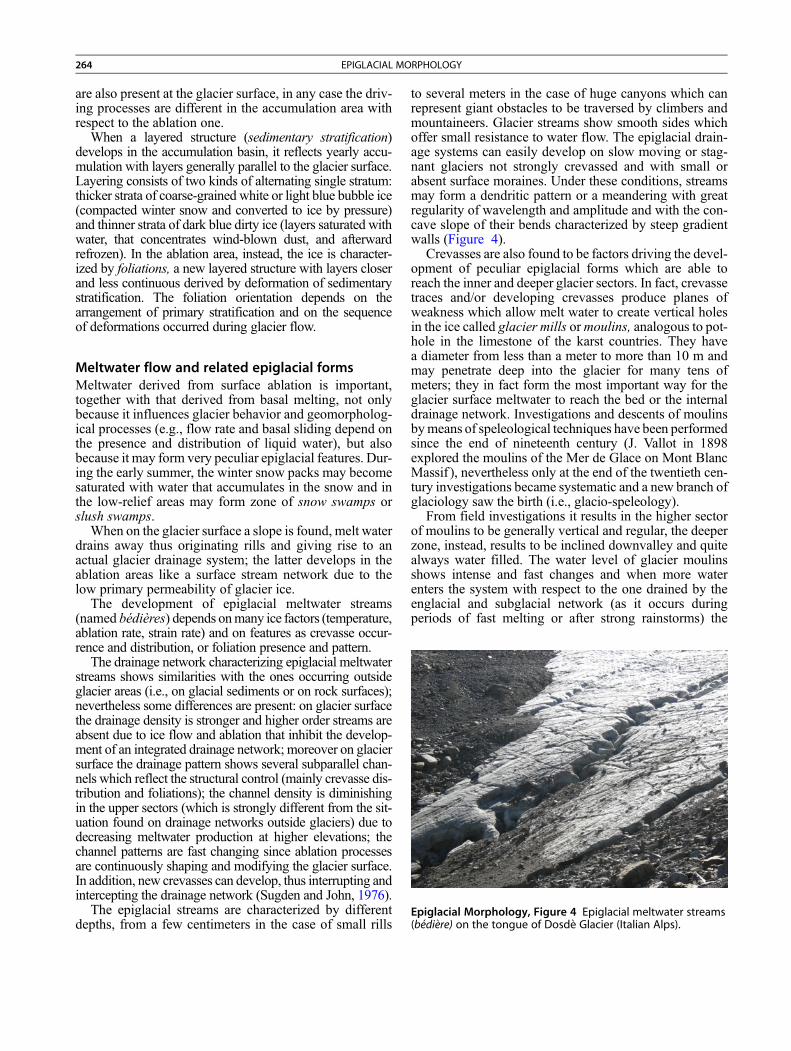
Epiglacial Morphology, Figure 2 Crevasses with someepiglacial ponds (Glacier du Geant, French Alps).
Epiglacial Morphology, Figure 1 Crevasses in the Mont Blancarea (Alps, at the boundary between France and Italy).
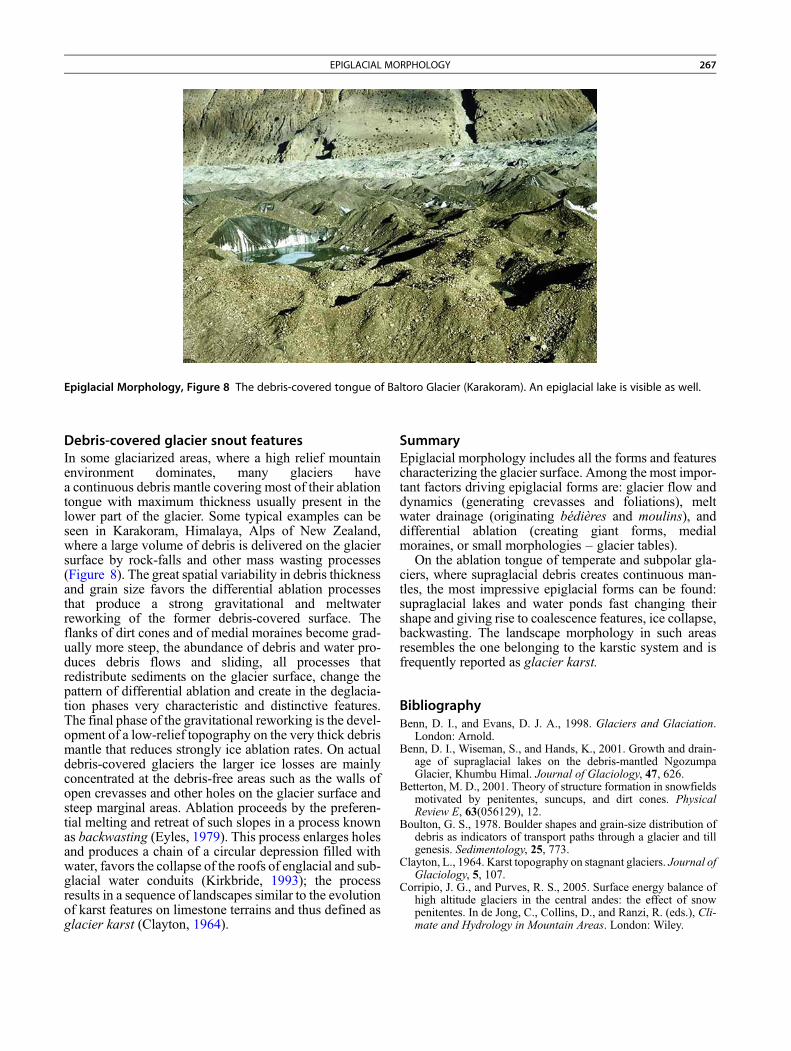
Epiglacial Morphology, Figure 3 Seracs on a tributary of ForniGlacier, the widest Italian valley glacier (Alps).
EPIGLACIAL MORPHOLOGY 263
faced by mountaineers; they are present at the surface ofseveral glacier types ranging from small cirque glaciersto ice sheets.
Generally, crevasses are grouped into a well-defined setas it occurs on valley glaciers (Nye, 1952) and from theiranalysis several types of information on glacier icestresses can be derived.
Chevron crevasses are among the more common cleftpatterns; they are linear breaks with an oblique orientationfrom the boundaries to the inner glacier sector alignedapproximately at 45� to the valley walls; they originate fromfriction betweenmountainwalls and glacier icewhichmakesice velocity increase in the central glacier sector.
In the case of valley glaciers under extending flow con-ditions, which make glaciers accelerate, transverse cre-vasses occur; the main strain results to be parallel to iceflow and breaks open perpendicularly to the central flowline, slightly bending down valley (Figure 2).
When ice flow becomes compressive, that is the case oflower glacier sectors, splaying crevasses take place; theyare curved and quite parallel to the ice flow direction inthe inner glacier area, instead close to the margins theybecome bending at a smaller than 45� angle.
Bergschrund is a special crevasse type, a deep trans-verse one that occurs at the head of a glacier and can bealso several hundreds of meters long.
Crevasses, after their genesis, flow down within theglacier reaching areas with different stress conditionswhichmay cause their closure; in this latter case they leavelinear scars named crevasse traces, layers of blue ice madeby regelation of melting water inside the crevasse (beforeit closes off ), or levels of white bubble ice made by snowfilling the crevasse before its closure (Hambrey, 1994).
When glaciers flow on very steep slopes they increasetheir velocity (the acceleration can reach values up to tentimes speedier than the normal ones), break in a chaotictotally broken surface, and give rise to ice falls with ice
towers named séracs (Figure 3). Generally these toweringand unstable blocks of ice convince climbers to find analternative route. In the areas where ice falls occur, largeexplosive sounds are not infrequent to be heard ashouse-size chunks of ice break off and collapse. TheKhumbu Icefall on Mount Everest is a classic zone ofunstable ice that climbers are forced to traverse.
At the base of ice falls, where ice flow becomes com-pressive, the most striking glacier structures, ogives, occur.These forms are curving bands or waves convex downfloweach usually several meters wide, alternating bands of darkand light ice; they (sometimes called Forbes bands) areformed annually and each dark-light pair represents 1 yearof glacier movement. They reflect the alternate season pas-sage of dirty ice (in summer) and snow-covered ice (inwinter) along the ice fall (Nye, 1958). Layered structures
264 EPIGLACIAL MORPHOLOGY
are also present at the glacier surface, in any case the driv-ing processes are different in the accumulation area withrespect to the ablation one.
When a layered structure (sedimentary stratification)develops in the accumulation basin, it reflects yearly accu-mulation with layers generally parallel to the glacier surface.Layering consists of two kinds of alternating single stratum:thicker strata of coarse-grained white or light blue bubble ice(compacted winter snow and converted to ice by pressure)and thinner strata of dark blue dirty ice (layers saturated withwater, that concentrates wind-blown dust, and afterwardrefrozen). In the ablation area, instead, the ice is character-ized by foliations, a new layered structure with layers closerand less continuous derived by deformation of sedimentarystratification. The foliation orientation depends on thearrangement of primary stratification and on the sequenceof deformations occurred during glacier flow.
Epiglacial Morphology, Figure 4 Epiglacial meltwater streams(bediere) on the tongue of Dosde Glacier (Italian Alps).
Meltwater flow and related epiglacial formsMeltwater derived from surface ablation is important,together with that derived from basal melting, not onlybecause it influences glacier behavior and geomorpholog-ical processes (e.g., flow rate and basal sliding depend onthe presence and distribution of liquid water), but alsobecause it may form very peculiar epiglacial features. Dur-ing the early summer, the winter snow packs may becomesaturated with water that accumulates in the snow and inthe low-relief areas may form zone of snow swamps orslush swamps.
When on the glacier surface a slope is found, melt waterdrains away thus originating rills and giving rise to anactual glacier drainage system; the latter develops in theablation areas like a surface stream network due to thelow primary permeability of glacier ice.
The development of epiglacial meltwater streams(named bédières) depends onmany ice factors (temperature,ablation rate, strain rate) and on features as crevasse occur-rence and distribution, or foliation presence and pattern.
The drainage network characterizing epiglacial meltwaterstreams shows similarities with the ones occurring outsideglacier areas (i.e., on glacial sediments or on rock surfaces);nevertheless some differences are present: on glacier surfacethe drainage density is stronger and higher order streams areabsent due to ice flow and ablation that inhibit the develop-ment of an integrated drainage network; moreover on glaciersurface the drainage pattern shows several subparallel chan-nels which reflect the structural control (mainly crevasse dis-tribution and foliations); the channel density is diminishingin the upper sectors (which is strongly different from the sit-uation found on drainage networks outside glaciers) due todecreasing meltwater production at higher elevations; thechannel patterns are fast changing since ablation processesare continuously shaping and modifying the glacier surface.In addition, new crevasses can develop, thus interrupting andintercepting the drainage network (Sugden and John, 1976).
The epiglacial streams are characterized by differentdepths, from a few centimeters in the case of small rills
to several meters in the case of huge canyons which canrepresent giant obstacles to be traversed by climbers andmountaineers. Glacier streams show smooth sides whichoffer small resistance to water flow. The epiglacial drain-age systems can easily develop on slow moving or stag-nant glaciers not strongly crevassed and with small orabsent surface moraines. Under these conditions, streamsmay form a dendritic pattern or a meandering with greatregularity of wavelength and amplitude and with the con-cave slope of their bends characterized by steep gradientwalls (Figure 4).
Crevasses are also found to be factors driving the devel-opment of peculiar epiglacial forms which are able toreach the inner and deeper glacier sectors. In fact, crevassetraces and/or developing crevasses produce planes ofweakness which allow melt water to create vertical holesin the ice called glacier mills ormoulins, analogous to pot-hole in the limestone of the karst countries. They havea diameter from less than a meter to more than 10 m andmay penetrate deep into the glacier for many tens ofmeters; they in fact form the most important way for theglacier surface meltwater to reach the bed or the internaldrainage network. Investigations and descents of moulinsbymeans of speleological techniques have been performedsince the end of nineteenth century (J. Vallot in 1898explored the moulins of the Mer de Glace on Mont BlancMassif ), nevertheless only at the end of the twentieth cen-tury investigations became systematic and a new branch ofglaciology saw the birth (i.e., glacio-speleology).
From field investigations it results in the higher sectorof moulins to be generally vertical and regular, the deeperzone, instead, results to be inclined downvalley and quitealways water filled. The water level of glacier moulinsshows intense and fast changes and when more waterenters the system with respect to the one drained by theenglacial and subglacial network (as it occurs duringperiods of fast melting or after strong rainstorms) the

EPIGLACIAL MORPHOLOGY 265
higher water level is found. The persistence of activemoulins is driven by forms related to glacial flow; in thecase a crevasse develops at higher elevations thana moulin, it can capture the drainage thus giving the rise,on the same supraglacial stream, of a newmoulin at higherelevations (Holmlund, 1988).
Surface meltwater is not only flowing at the glacier sur-face or in glacier moulins, it may also be temporarily storedup in epiglacial lakes orwater ponds (Figures 2–8). Theseforms are newly witnessing the complexity and the syner-gic action played by glacier processes which createepiglacial morphology. Generally epiglacial lakes developon glacier lower areas like closed-off remnants of cre-vasses or inactive partially filled moulins. They formduring the ablation period and in subpolar regions orwherever ice is below the pressure melting point, andcan persist all the melt season due to the impossibility ofmelt waters to penetrate into the inner ice layers. Ontemperate glaciers the epiglacial lakes are more ephemeral(a proper example could be the Effimerous Lake, whichdeveloped in 2001 on Belvedere Glacier, Monte Rosa,Italy), they normally form early in the ablation seasonbut rapidly drain when the drainage network becomesmore active or the accelerating glacier flow forms new cre-vasses (Benn and others, 2001).
A peculiar type of epiglacial lake is spread where gla-ciers are covered by large amounts of debris (i.e., ondebris-covered glaciers) and their development is causedby differential melting or ablation. In this case lakes andwater ponds act as increasing glacier absorption of incom-ing energy (water albedo is lower than ice one, moreoverwater heat capacity is high and convective fluxes occur)and thus rising glacier ablation. In several cases they arefound to enlarge their size, to become coalescent, and theymay give rise to GLOF phenomena.
Differential ablation processesThe most impressive and diffuse features of epiglacialmorphology derive from differential ablation processes.Differential ablation is defined as the ratio between themelt rate of bare or debris-free ice and the melt rate occur-ring at debris-covered ice at the same elevation.Supraglacial debris cover plays a key role in determiningrates and magnitudes of buried ice ablation (Østrem,1959; Nakawo and Young, 1982). The debris influenceon ice ablation is due to its different albedo, generallylower than the one of bare ice, thus increasing the absorp-tion of incoming solar radiation and ice ablation. Differ-ently, supraglacial debris, whenever thicker than thecritical value (Mattson et al., 1993), reduces themagnitudeand rates of glacier ice ablation; the melt reduction in thecase of thick debris layer is due to the prevailing insulatingeffect played by rock debris. On the glacier surface, espe-cially in the lower part, during the ablation season, anamount of debris ranging in grain size from fine materialas silt or sand to rubble or huge blocks of rock is visible.This supraglacial debris derives from different sources:
(1) mass movements from adjacent mountain slopes,(2) wind-blown dust, (3) volcanic eruptions, (4) salt andmicroorganisms from sea-spray, (5)meteorites, and (6) pol-lutants from human sources (Hambrey, 1994; Kirkbride,1995; Benn and Evans, 1998). The weight played by thedifferent source types depends on the geographic setting:on areas where volcanic activity is important (e.g., Island)volcanic ash and tephra play the major role; on ice sheetsurfaces (e.g., Antarctica) far from rock exposures themaindebris sources are volcanoes and meteorites; on mountainglaciers nested by rock walls and with the occurrence ofnunataks and rock exposures the main debris sources areslope processes (e.g., rock-falls and rock-slides, snow andice avalanches, creep, debris and mud flows).
There are also several mechanisms of debris transport:supraglacial cover can receive material from subglacialglacier sector; in this case debris transport occurs in thebasal shear zone of glaciers (active transport, Boulton,1978). Then debris comes upwards the glacier surface inthe ablation zone; debris may also be transported insupraglacial and englacial positions ( passive transport,Boulton, 1978), in the latter case debris reaches the glaciersurface when ablation of the nesting ice occurs.
Summarizing, the effect of a debris cover on the abla-tion rate of the underlying ice depends on the thermal con-ductivity of the debris, the ice density, the latent heat of icemelting, the surface debris temperature, and most of all, ifthe other factors are constant, the debris layer thickness.
Differential ablation featuresThe complex pattern and distribution of epiglacial debris,which may alternate areas with coverage thicker than thecritical value or large boulders and areas with debrislayer thinner than this threshold, give rise to differentepiglacial features. In the case of thin and fine debriscover, ablation tends to form depressions, such as smalland a few centimeters deep holes that riddle ice giving ita honeycombed appearance (at the bottom of the holes iswell visible the small pebble or the dust that promotesmelting). In some situations, where the surface meltingwaters are able to collect and accumulate a thin depositof small particles, many water filled holes, on the average10–20 cm long and large and a few centimeters deep, withthe bottom covered by a few millimeters thick black finedebris layer are developed in large numbers (cryconites).When the fine debris collected in a hollow by surfacestream becomes thicker than the critical value, differentialablation tends to remove more ice from surrounding areasthan below the debris layer, producing an upstanding dirtmound; it is called dirt cone, formed by a relatively thinveneer of debris, almost sand, covering a cone of ice(Figure 5). Where on the glacier surface, isolated largeboulders, even many decimeters thick, are diffused, therock protects the ice from melting and as a result ittends to be perched on the top of a pedestal of ice that insome large Asian glaciers can more than a man be tall(glacier table) (Figure 6).

Epiglacial Morphology, Figure 5 A dirt cone on the surface ofForni Glacier.
Epiglacial Morphology, Figure 6 Glacier table withglaciologists on the Morteratsch Glacier (Switzerland).
Epiglacial Morphology, Figure 7 The ablation tongue of ForniGlacier: a bigger medial moraine (ISI type) is visible togetherwith some thinner moraines (AD type). Ice seracs, transverse andchevron crevasses, rock outcrops are appreciable as well.
266 EPIGLACIAL MORPHOLOGY
The narrow stripes, sometimes sinuous, of the medialmoraines are among the most striking and spectacular fea-tures of valley glaciers due to differential ablation. Theyare formed by a long dark ridge of coarse debris, a fewcentimeters thick, that hides the underlying ice and over-hangs even for some meters the ice free glacier surface.They may derive from a glacier confluence and be themorphological expression of the merging of two epiglaciallateral moraines; in that case a glacier composed by theconfluence of two basins will have one single medialmoraine, whereas the basins are three the medial morainesare two. This kind of moraine is called ice stream interac-tion (ISI). When the debris forming the moraine derivesfrom emerging through melt-out of englacial material,
the moraine is defined ablation-dominant (AD). In thecase the debris derives from a rock fall event, the moraineis defined avalanche-type (AT) (Eyles and Rogerson,1978) (Figure 7).
Penitentes are the most fascinating epiglacial featuresdue to differential ablation; they are pinnacles of snow orice which grow over all glaciated and snow-covered areasin the Dry Andes above 4,000 m (Lliboutry, 1954). Theyrange in size from a few centimeters to over 5 m (Naruseand Leiva, 1997). They take the form of tall thin bladesof hardened snow or ice closely spaced with the blades ori-ented toward the general direction of the sun. Penitenteswere first described by Darwin (1839) during his travelfrom Santiago de Chile to Mendoza (Argentina). Darwindescribed penitentes as features formed by the strongwinds of the Andes; this explanation had persisted untilthe recent times when deeper investigations on theseepiglacial features were performed. Lliboutry noted thatthe key climatic condition for the differential ablation thatleads to the formation of penitentes is that the dew point isalways below freezing. Thus, snow will sublimate, whichrequires higher energy input than melting. Once the pro-cess of differential ablation starts, the surface geometryof the evolving penitente produces a positive feedbackmechanism, and radiation is trapped by multiple reflec-tions between the walls. The hollows become almosta black body for radiation, while decreased wind leads toair saturation, increasing the dew point temperature andthe onset of melting. In this way peaks, where mass lossis only due to sublimation, will remain, as well as the steepwalls, which intercept only a minimum of solar radiation.In the troughs ablation is enhanced, leading toa downward growth of penitentes (Betterton, 2001;Corripio and Purves, 2005).
Epiglacial Morphology, Figure 8 The debris-covered tongue of Baltoro Glacier (Karakoram). An epiglacial lake is visible as well.
EPIGLACIAL MORPHOLOGY 267
Debris-covered glacier snout featuresIn some glaciarized areas, where a high relief mountainenvironment dominates, many glaciers havea continuous debris mantle covering most of their ablationtongue with maximum thickness usually present in thelower part of the glacier. Some typical examples can beseen in Karakoram, Himalaya, Alps of New Zealand,where a large volume of debris is delivered on the glaciersurface by rock-falls and other mass wasting processes(Figure 8). The great spatial variability in debris thicknessand grain size favors the differential ablation processesthat produce a strong gravitational and meltwaterreworking of the former debris-covered surface. Theflanks of dirt cones and of medial moraines become grad-ually more steep, the abundance of debris and water pro-duces debris flows and sliding, all processes thatredistribute sediments on the glacier surface, change thepattern of differential ablation and create in the deglacia-tion phases very characteristic and distinctive features.The final phase of the gravitational reworking is the devel-opment of a low-relief topography on the very thick debrismantle that reduces strongly ice ablation rates. On actualdebris-covered glaciers the larger ice losses are mainlyconcentrated at the debris-free areas such as the walls ofopen crevasses and other holes on the glacier surface andsteep marginal areas. Ablation proceeds by the preferen-tial melting and retreat of such slopes in a process knownas backwasting (Eyles, 1979). This process enlarges holesand produces a chain of a circular depression filled withwater, favors the collapse of the roofs of englacial and sub-glacial water conduits (Kirkbride, 1993); the processresults in a sequence of landscapes similar to the evolutionof karst features on limestone terrains and thus defined asglacier karst (Clayton, 1964).
SummaryEpiglacial morphology includes all the forms and featurescharacterizing the glacier surface. Among the most impor-tant factors driving epiglacial forms are: glacier flow anddynamics (generating crevasses and foliations), meltwater drainage (originating bédières and moulins), anddifferential ablation (creating giant forms, medialmoraines, or small morphologies – glacier tables).
On the ablation tongue of temperate and subpolar gla-ciers, where supraglacial debris creates continuous man-tles, the most impressive epiglacial forms can be found:supraglacial lakes and water ponds fast changing theirshape and giving rise to coalescence features, ice collapse,backwasting. The landscape morphology in such areasresembles the one belonging to the karstic system and isfrequently reported as glacier karst.
BibliographyBenn, D. I., and Evans, D. J. A., 1998. Glaciers and Glaciation.
London: Arnold.Benn, D. I., Wiseman, S., and Hands, K., 2001. Growth and drain-
age of supraglacial lakes on the debris-mantled NgozumpaGlacier, Khumbu Himal. Journal of Glaciology, 47, 626.
Betterton, M. D., 2001. Theory of structure formation in snowfieldsmotivated by penitentes, suncups, and dirt cones. PhysicalReview E, 63(056129), 12.
Boulton, G. S., 1978. Boulder shapes and grain-size distribution ofdebris as indicators of transport paths through a glacier and tillgenesis. Sedimentology, 25, 773.
Clayton, L., 1964. Karst topography on stagnant glaciers. Journal ofGlaciology, 5, 107.
Corripio, J. G., and Purves, R. S., 2005. Surface energy balance ofhigh altitude glaciers in the central andes: the effect of snowpenitentes. In de Jong, C., Collins, D., and Ranzi, R. (eds.), Cli-mate and Hydrology in Mountain Areas. London: Wiley.

268 EQUILIBRIUM-LINE ALTITUDE (ELA)
Darwin, C., 1839. Journal of Researches into the Geology and Nat-ural History of the Various Countries Visited by H. M. S. Beagle,Under the Command of Captain Fitz Roy, R. N., 1832 to 1836.London: H. Colburn.
Eyles, N., 1979. Facies of supraglacial sedimentation on Icelandicand alpine temperate glaciers. Canadian Journal of EarthSciences, 16, 1341.
Eyles, N., and Rogerson, R. J., 1978. A framework for the investiga-tion of medial moraine formation: Austedalsbreen, Norway, andBerendon Glacier, British Columbia, Canada. Journal of Glaci-ology, 20, 99.
Hambrey, M. J., 1994. Glacial Environments. London: UCL Press.Holmlund, P., 1988. Internal geometry and evolution of moulins,
Storglaciärien, Sweden. Journal of Glaciology, 34, 242.Kirkbride, M. P., 1993. The temporal significance of transitions
frommelting to calving termini at glaciers in the central SouthernAlps of New Zealand. Holocene, 3, 232.
Kirkbride, M. P., 1995. Processes of transportation. In Menzies, J.(ed.), Glacial Environments, Vol. I: Modern Glacial Environ-ments: Processes, Dynamics and Sediments. Oxford:Butterworth-Heinemann, pp. 261–292.
Lliboutry, L., 1954. The origin of penitentes. Journal of Glaciology,2, 331.
Mattson, L. E., Gardner, J. S., and Young, G. J., 1993. Ablation ondebris covered glaciers: an example from the Rakhiot Glacier,Punjab, Himalaya. In Young, G. J. (ed.), Snow andGlacier Hydrol-ogy. Wallingford, Oxon: International Association of HydrologicalSciences Press, pp. 289–296 (IAHS Publication 218).
Nakawo, M., and Young, G. J., 1982. Estimate of glacier ablationunder debris layer from surface temperature and meteorologicalvariables. Journal of Glaciology, 28, 29.
Naruse, R., and Leiva, J. C., 1997. Preliminary study on the shape ofsnow penitents at Piloto Glacier, the Central Andes. Bulletin ofGlacier Research, 15, 99.
Nye, J. F., 1952. A method of calculating the thickness of ice sheets.Nature, 169, 529.
Nye, J. F., 1958. Surges in glaciers. Nature, 181, 1450.Østrem, G., 1959. Ice melting under a thin layer of moraine and the
existence of ice in moraine ridges.Geografiska Annaler, 41, 228.Sugden, D. E., and John, B. S., 1976. Glaciers and Landscape.
London: Arnold.
Cross-referencesCrevassesDebris-Covered GlaciersDebris Thermal Properties and Impact on Ice AblationMelting Processes
EQUILIBRIUM-LINE ALTITUDE (ELA)
Jostein Bakke1, Atle Nesje21Department of Geography/Bjerknes Centre for ClimateResearch, University of Bergen, Bergen, Norway2Department of Earth Science/Bjerknes Centre forClimate Research, University of Bergen, Bergen, Norway
SynonymsSnow line
DefinitionThe equilibrium-line altitude (ELA) marks the area orzone on a glacier separating the accumulation zone from
the ablation zone and represents where annual accumula-tion and ablation are equal.
IntroductionThe equilibrium-line altitude (ELA) on glaciers is theaverage elevation of the zone where accumulation equalsablation over a 1-year period. The ELA can rarely beobserved as a line at the same elevation across the entirewidth of the glacier due to local topographic and climaticvariations in accumulation and ablation (Figure 1). Thus,the ELA is the average altitude of the equilibrium line.The ELA is very closely related to the local climate, partic-ularly winter precipitation and summer air temperature.Variations in the ELA can therefore commonly be attrib-uted to changes of these two variables. This can best beillustrated by its relationship to the net balance. The termnet mass balance is the net gain or loss of ice and snow.The mass balance is highly dependent on the climateconditions. If the annual mass balance of the glacier asa whole is negative, the ELA rises, and when the balanceis positive, the ELA falls. The steady-state ELA is definedas the ELAwhen the annual net balance is zero, as the gla-cier mass and the geometry are in balance with climate.The concept is very useful because it provides a measureof the climatic means related to certain glacier positionsand geometries. The climatic ELA is the average ELAover a 30-year period (corresponding to a climate “nor-mal” [30-year mean] period). Variations in ELA and netmass balance have been measured for many glaciersworldwide (e.g., Storglaciären in Sweden (since 1946)and Storbreen in Norway (1947). For details, see www.geo.unizh.ch/wgms). These time series underpin howfluctuations in the ELA provide an important indicatorof glacier response to climate change and allow recon-structions of former climates and the prediction of futureglacier behavior. Although the ELA is determined by localweather conditions, it is a good indicator of regional cli-mate because glacier mass-balance fluctuations are com-monly strongly correlated over distances of c. 500 km(Letreguilly and Reynaud, 1989).
Climate influencing the ELAThe accumulation on a glacier includes all materials thatadd mass to the glacier, such as snow, refrozen slush, hail,rain, and avalanched snow and ice. The ablation includesdirect ice melt, iceberg calving, wind erosion/deflation,and sublimation. On most glaciers, accumulation is domi-nant in the winter months, whereas ablation mainly occursduring the summer. Where an ice sheet or glacier termi-nates in water, however, iceberg calving may occurthroughout the year. Commonly, accumulation exceedsablation on the upper part of a glacier, whereas ablationis larger than the accumulation in the lower parts. Fora “regular” glacier fed by snowfall in its accumulation areaand that loses mass bymelting of “clean” ice in its ablationarea, altitudinal mass-balance gradients are approximatelylinear, with ablation gradients tending to be steeper than

Equilibrium-Line Altitude (ELA), Figure 1 The southern part of the Folgefonna glacier in western Norway. The ELA can be seenas a meandering line between snow and blue ice (Photo: Jan Rabben).
EQUILIBRIUM-LINE ALTITUDE (ELA) 269
accumulation gradients (Schytt, 1967; Furbish andAndrews, 1984). The links between climate and glaciermass changes have also been investigated by using math-ematical models to find the climatic combinationsrequired to “grow” or “melt” glaciers of a known size ina specified time frame. The most detailed models calculateaccumulation and ablation totals by considering changesin all contributions to accumulation input and energy bal-ance within defined time window (e.g., Gruell andOerlemans, 1986; Kuhn, 1989; Braithwaite and Olesen,1990). Depending on their complexity, these modelsincorporate a number of meteorological input parametersand simulate the temporal evolution of mass-balanceterms (accumulation and ablation) in the course of a yearor over several years (Oerlemans, 2001). The atmosphericforcing is usually provided by weather station data near toor on the glacier surface, which are interpolated to therequired horizontal resolution of the mass-balance model.In addition, glacier characteristics (i.e., extent and a digitalelevation model [DEM]) are needed as input to the model.More simple models integrate the climatic controls intotwo or more easily calculated parameters such as annualeffective precipitation, mean temperature during the abla-tion season, or ablation–altitude relationships (e.g., Buddand Smith, 1981; Laumann and Reeh, 1993; Reeh, 1991).Such models can easily be used to calculate ELA also onreconstructed glaciers based on e.g., dated terminalmoraines.
Wind influencing the ELAClimate processes influencing the ELA on glaciersinvolve ablation (mainly controlled by summer tempera-ture, T ) and direct snowfall (precipitation, P), giving theTP-ELA. In addition, wind (W ) transport of dry snow is
an important factor for the glacier mass balance, in partic-ular during the accumulation season. On plateau glaciers,snow deflation and drifting dominate on the windwardside, whereas snow accumulates on the leeward side. Bycalculating the mean ELA in all glacier quadrants ona plateau glacier, the influence of wind on plateau glaciersmay be negligible. The resulting ELA is therefore definedas the TP-ELA (temperature/precipitation ELA). TheTP-ELA reflects the combined influence of the accumula-tion-season precipitation and ablation-season temperature(Dahl and Nesje, 1992). On wind-exposed mountain pla-teaux, the snow may deflate and accumulate in lowercirques and valleys, either by direct accumulation on thecirque/valley glaciers, or by avalanching from the moun-tain slopes. The accumulation on the cirque/valley glaciersmay therefore be significantly higher than the local precip-itation indicates (Figure 2) (Dahl and Nesje, 1992). Themean ELA on a plateau glacier therefore defines theTP-ELA, whereas the ELA on a cirque glacier, commonlyinfluenced by wind-transported snow, gives the TPW-ELA. Therefore, the TPW-ELA is commonly lower thanthe TP-ELA. Leeward accumulation of windblown snow,including avalanching from the cirque walls, is an impor-tant factor influencing the mass balance of cirque glaciers.Due to the potential upslope transport of dry snow bywind, the additional accumulation of snow in a cirque iscommonly difficult to estimate. One possible approachto this problem is to calculate the ratio between the catch-ment area above the TPW-ELA (D) and the reconstructedglacier accumulation area (A) as a rough measure of thepotential for additional of snow by wind transport andavalanching in cirques (Dahl et al., 1997). Anotherapproach to calculate this ratio is to define the prevailingwind direction and calculate the area in quadrants upslopeand upwind of the glacier surfaces, including plateaux, all

TPW-ELA
TP-ELATP-ELA
TPW-ELA TPW -ELA
TPW-ELA
Low TPW-ELA due toleeward accumulationof wind-blown snow
Mountain topographi-cally suited for anice cap/plateau glacier
High TPW-ELA dueto snow deflation
Prevailing wind direction
Mountain peak nottopographically suitedfor a plateau glacier
Equilibrium-Line Altitude (ELA), Figure 2 The effect of windblown snow can on some glaciers contribute with a large amount ofsnow. Therefore, the term temperature-precipitation-wind (TPW) ELA can be useful when describing the altitudinal distributionof glaciers in an alpine terrain (Dahl and Nesje, 1992).
270 EQUILIBRIUM-LINE ALTITUDE (ELA)
glacier-facing slopes and all other plateau-edge slopeswith gradients <5o irrespective of orientation (Benn andBallantyne, 2005). Further, to take into account snowavalanching, all slopes >25o overlooking the glaciers arecalculated. As the two categories frequently overlap, theresults must be combined into a single snow-contributingarea factor (Ballantyne, 2006). This factor can then besubtracted when calculating the regional ELA in an area.When studying the ELA distribution along a western tran-sect in Scotland during Loch Lomond stadial, the aboveapproach was applied by Ballantyne (2006).
Relationships between precipitation/temperatureand the ELAThere is a very close connection between the ELA andlocal climate, in particular winter accumulation (snow-fall), summer temperature, and wind strength causingtransport of dry snow during the accumulation season.The ELA is therefore sensitive to perturbations of thesevariables; high winter snowfall combined with low sum-mer temperatures the following summer gives a lowELA, whereas low winter accumulation followed bya warm summer yields a high ELA. Fluctuations in theELA over time are therefore an important indicator of cli-mate change and commonly allow reconstructions ofpast climates. Thus, palaeoclimatic reconstructions basedon former glacier extent commonly make use of
reconstructed ELAs. Data on past variations of ELAstherefore provides an important source of proxypalaeoclimatic data in glaciated regions around the world.
Relationships between temperature and precipitation atELAs on glaciers have been established by statistical/analytical approaches (e.g., Liestøl in Dahl et al., 1997;Nesje and Dahl, 2000; Ohmura et al., 1992; Shi et al.,1992; Sissons, 1979). The positive correlation betweenthese two variables for a wide range of glaciers reflectsthe fact that higher values of mass turnover at the ELArequire higher ablation (higher summer temperatures) tobalance the annual specific mass budget. The approachesof Ohmura et al. (1992) and Nesje and Dahl (2000), how-ever, deviate significantly for temperature and precipita-tion >4�C and >3,500 mm, respectively. Some of thediscrepancy may be explained by the fact that Ohmuraet al. (1992) used winter accumulation plus summer pre-cipitation at the ELAs, whereas Nesje and Dahl (2000)used only winter (1 Oct–30 Apr) precipitation.
The temperature-precipitation relationship also explainsthe regional rise in glacier ELAs with increasing distancefrom moisture sources. In areas of lower precipitation, thetemperature required to melt the annual accumulation atthe ELA does not need to be as high as in areas of highprecipitation. Consequently, ELAs tend to be at higher ele-vations in areas with low ablation-season temperatures thanin areas with higher ablation-season temperatures. If palaeoELAs have been reconstructed and if palaeotemperatures

EQUILIBRIUM-LINE ALTITUDE (ELA) 271
are reconstructed from independent proxies (pollen,faunal remains, etc.) nearby, former winter or total precip-itation at the ELA can be calculated from temperature-precipitation relationships (e.g., Dahl and Nesje, 1996).Regional variations of glacier ELAs can be used to inferformer precipitation gradients that may allow prevailingmoisture sources and circulation patterns to bereconstructed (Lehmkuhl, 1998; Lehmkuhl et al., 1998;Miller et al., 1975). In addition, reconstructed ELAs offormer glaciers have been used to correlate moraines inmountain regions (e.g., Maisch, 1982). The term ELAhas, however, been applied to several altitudinal indicescalculated for past glaciers. The relationship betweensome of these indices and climate has, however, not beenfirmly established. Palaeoclimatic reconstructions basedon these indices may therefore be inaccurate (Benn andLehmkuhl, 2000). In some high mountain regions, how-ever, the relationship between climate and glacier ELAsmay be complicated due to avalanches and debris coveron the glacier surface. It is also complicated by differenttypes of accumulation cycles where the most importanttypes are: (a) winter accumulation type, with a weIl-defined winter accumulation season and summer ablationseason; (b) summer accumulation type, with maxima inaccumulation and ablation occurring simultaneously dur-ing the summer months: and (c) year-round ablation type,with one or two accumulation maxima coinciding withwet seasons.
Based on the “Liestøl-equation,” three equationsderived from a close exponential glacier-climate relation-ship at the ELA of Norwegian glaciers were implementedin a geographical information system (Lie et al., 2003).The equations enable calculation of (1) the minimum alti-tude of areas climatically suited for present glacier forma-tion, (2) quantification of the glacial build-up sensitivity(GBS) in an area, and (3) calculation of the theoretical cli-matic temperature-precipitation ELA (TP-ELA) (based ontemperature and precipitation data from meteorologicalstations in southern Norway) in presently non-glaciatedareas by combining GBS with terrain altitude. Theapproach is primarily intended for reconstruction ofpalaeo ELAs in areas with no present glaciers.
Identifying ELA on modern glaciersThe ELA for any given year can be identified by observingthe distribution of snow and ice on the glacier surface atthe time of year when glacier mass is at a minimum(in the end of the accumulation season). Commonly, theELA coincides with the transient snow line. This informa-tion can be obtained by field survey or from any photo-graphic source (e.g., aerophoto, satellite images). Ontemperate glaciers, the ELA can give immediate informa-tion of the state of the glacier in relation to the last mass-balance year, and also the longer term state of the glacier.Paterson (1994) lists the following situations that givesigns of the relationship between the glacier and climateover the last year(s):
1. A low snow line possessing a sharp boundary with bareice indicates a positive net balance (the glacier isgrowing).
2. A similar boundary but at a high altitude indicates thata period of accumulation has interrupted long period ofnegative balance.
3. A snow line separated from bare ice by an area with oldfirn indicates a more negative balance than the preced-ing few years.
Approaches of calculating palaeo ELAsWhen calculating the ELAs when a glacier was larger thanat present, or when the glacier was melted completely, sev-eral approaches for calculating/estimating the ELAs offormer glaciers from geomorphological evidence havebeen developed (see review by Benn and Lehmkuhl,2000; Gross et al., 1976; Meierding, 1982; Torsnes et al.,1993). Former variations in ELA are a valuablepalaeoclimatic proxy as it is also possible to isolate thewinter component of the proxy (see above). The conceptsof the different methods vary significantly, as do their reli-ability and ease of use. Some approaches are based ondetailed evaluation of mass balance and glacierhypsometry (distribution of glacier area over its altitudinalrange). Others are based on the large-scale morphology ofthe glacier catchment, the altitude of marginal moraines,and the cirque floor. A literature survey indicates thatELA depressions from modern values during the last gla-cial maximum, Younger Dryas and the “Little Ice Age”were typically in the range of 1,000 � 300 m, 500 �200 m, and 100� 50 m, respectively. It is likely that manyof the methods discussed below will be redundant bysimple mass-balance models for calculation also of formerELAs.
The maximum elevation of lateral moraines(MELM)Due to the nature of glacier flow toward the center abovethe ELA and toward the margin of the glacier below theELA, lateral moraines are theoretically only deposited inthe ablation zone below the ELA. As a result, the maxi-mum elevation of lateral moraines should ideally reflectthe corresponding ELA. This method is considered bestsuitable for long valley glaciers with large, continuous lat-eral moraines. There are, however, several problems withthis approach. First, englacial material may not reach theglacier surface immediately below the equilibrium line.Thus, lateral moraines may not form at, but below theactual ELA. Second, it is difficult to assess whether ornot a lateral moraine is preserved entirely in the upper partdue to degradation on steep slopes. Consequently, ELAestimates derived from eroded/degraded lateral morainesmay be too low. Third, the valley sides may be too steepfor deposition of lateral moraines, giving estimates of theformer ELA that are too low. Finally, if initial glacierretreat is slow, additional moraine material could bedeposited in the prolongation of the former steady-state

272 EQUILIBRIUM-LINE ALTITUDE (ELA)
lateral moraine. TheMELM approach is, despite the prob-lems, considered the most reliable method where formerglaciers were covered by debris and the mass-balance gra-dient is poorly or not known.
The median elevation of a glacier (MEG)This approach places the ELA half altitudinal differencebetween the glacier front and the top of the glacier. Empir-ical evidence from modern glaciers, however, suggeststhat the MEG overestimates the ELA. In addition, thismethod fails to take into account variations in valley mor-phology, which strongly affects the area-elevation distri-bution of a glacier. However, it works reasonably wellfor small glaciers with an even area/altitude distribution.The main problem is commonly to define the headwardlimit of a former glacier.
The toe-to-headwall altitude ratio (THAR)This method assumes that the ELA lies at a fixed propor-tion of the vertical distance between the highest and lowestpart of a former glacier. A ratio between the maximum andminimum altitude of a glacier (toe-to-headwall altituderatio [THAR]) has been used as a quick estimate to calcu-late the ELA. Ratios of 0.35–0.4 were used by Meierding(1982) for glaciers in Colorado. Values of 0.4–0.5 wereused by Porter et al. (1983) for “clean”-ice glaciers. TheTHAR approach is considered a rough way of estimatingformer ELAs because it does not take into account glacierhypsometry and mass balance. In addition, a major prob-lem is to define the headward limit of a former glacier.The THAR approach allows rapid estimates of formerELAs in remote areas with poor or inaccurate maps.
Toe-to-summit altitude method (TSAM)Away to overcome the problem of defining the upper limitof a former glacier is to use the maximum altitude of theglacier catchment. Louis (1955) suggested that the ELAmay be calculated from the arithmetic mean of the altitudeof the highest mountain and the terminal moraine. For theEuropean Alps, Gross et al. (1976) demonstrated that thisapproach yields ELAs that are about 100 m too high. Formodern glaciers in the northernmost mountain range ofthe Mongolian Altai, the inferred values are in agreementwith snowlines on glaciers observed in the field and onaerial photographs (Lehmkuhl, 1998). The TSAMmethodgives, despite its crudeness, rapid estimates of formerELAs in remote areas. ELA estimates based on the TSAMmethod should be determined for each region separatelybecause they may be due to significant variation due tovariations in glacier type.
The accumulation area ratio to the total glacierarea (AAR)The ratio of the accumulation area to the total area (AAR)is based on the assumption that the steady-state AAR offormer glaciers is typically 0.55–0.65 (Porter, 1975). AnAAR of 0.6� 0.05 is generally considered to characterize
steady-state conditions of valley/cirque glaciers. Ice capsand piedmont glaciers may, however, differ significantlyfrom this ratio. Gross et al. (1976) inferred a mean AARvalue of 0.67 for glaciers in the European Alps. TheAAR of a glacier varies mainly as a function of its massbalance; ratios below 0.5 indicating negative mass bal-ance; 0.5–0.8 corresponding to steady-state conditions,and values above 0.8 reflecting positive mass-balanceregimes. For modern mid- and high-latitude glaciers,steady-state AARs typically lie in the range 0.5–0.8. TheAAR approach requires contour maps of former glaciersurfaces, and this method can therefore only be usedwhere detailed topographic data/maps are available. Infor-mation about mass-balance gradients is not required forthe AAR method. The largest source of inaccuracy relatedto the AAR method of determining the ELA on formerglaciers is the reconstruction of the surface contours, espe-cially if the glacier margins intersect valley-side topo-graphic contours at small angles or coincide with themfor some distance. A theoretical evaluation of the AARapproach, using changing slope angles and valley mor-phology on idealized glaciers, shows that glaciers advanc-ing into flat areas underestimate the ELA depression,whereas glaciers moving into areas of increasing slopeangle overestimate the climatic ELA difference. Conse-quently, topographical and morphological effects on cal-culated ELA depressions on glaciers must be carefullyevaluated.
The balance ratio (BR) methodThe balance ratio (BR) method is a refinement of the AARapproach. As demonstrated above, one shortcoming of theAAR method, and also the MEG approach, is that they donot fully account for variations in the hypsometry. Toovercome this problem, a balance ratio (BR) method wasdeveloped by Furbish and Andrews (1984). This approachtakes account of both glacier hypsometry and the shape ofthe mass-balance curve and is based on the fact that, forglaciers in equilibrium, the total annual accumulationabove the ELA must balance the total annual ablationbelow the ELA. This can be expressed as the areas aboveand below the ELA multiplied by the average accumula-tion and ablation, respectively. The BR approach assumesthat the accumulation and ablation gradients are approxi-mately linear, that the ratio between the two is known,and that the hypsometry of the glacier is known. The BRmethod can thus only be used where detailed topographicmaps are available and the surface contours of former gla-ciers can be reconstructed in detail (Benn and Gemmel,1997). Because accumulation and ablation gradients arecontrolled by different climatic variables, the accumula-tion and ablation gradients generally have different values,with the ablation gradient somewhat steeper than the accu-mulation gradient. In a study of 22 glaciers in Alaska,Furbish and Andrews (1984) found that balance ratiosclustered around 1.8, meaning that the ablation gradientis 1.8 times greater than the accumulation gradient.

Marginal moraines
Equilibrium linealtitue (ELA)
Zone of maximum glacial erosion
Accumulation zone(concave)
Ablation zone(convex)
Cirque glacier with a distal-fed glacial lake
Flow lines
Glacial river transportingglacial debris
Sediment producedby the glacier
Distal-fed glacial lake
Sedimentcore
Equilibrium-Line Altitude (ELA), Figure 3 Erosion beneath the glacier produces “rock-flour,” which is deposited in downstreamproglacial lakes. Quantification of these sediments and later correlation between periods with known glacier size form thefundamentals for doing continuous reconstructions of the ELA in the past.
EQUILIBRIUM-LINE ALTITUDE (ELA) 273
Benn and Gemmel (1997) published a spreadsheet pro-gram that rapidly calculates glacier ELAs using the bal-ance ratio method that allows hypsometric variations tobe accounted for in ELA reconstructions. Later anotherspreadsheet was made available for calculation of theArea-Altitude Balance Ratio (AABR) (Osmaston, 2005).These spreadsheets are becoming increasingly used inpalaeoglacier reconstruction for estimating ELA andsubsequently deriving quantitative estimates ofpalaeoclimate. However, there are still only a few studiesthat have established, from contemporary environments,AABR/BR ratios. Rea (2009) provides an empiricallyderived dataset characterizing AABR ratios, which maybe used for ELA estimation in palaeoglacier reconstruc-tions and for palaeoclimate quantification based on datafrom World Glacier Monitoring Service, US GeologicalSurvey, and Norwegian Water Directorate.
Cirque floor altitudesCirque floor levels or altitudes have been used as indica-tors of the elevation of former glacier snowlines for Pleis-tocene glaciers. The elevation of the cirque floor/basindoes not, however, have a close relationship with theELA of the glacier that formed it (see Benn and Lehmkuhl,2000). Cirques develop cumulatively over many glacialcycles and they can therefore not be attributed to any par-ticular glacial event. They may, however, give someinsight into regional trends in glaciation levels and aver-age climatic conditions over longer time scales.
Proglacial sitesSeveral approaches have been applied to record past vari-ations in ELAs based on lacustrine and terrestrial
proglacial sites (Figure 3). These approaches are basedon quantification of ELA fluctuations based on analysesof sediments deposited in distal glacier-fed lakes. Severalgroups worldwide have worked with this approach; herewe give some examples from Scandinavian glaciers. Dahlet al. (2003) presented a conceptual model of glacier-melt-water-induced sedimentation in which a variety of proxiesare related to the occurrence and size variations (asa response to variations in the ELA) of a glacier ina catchment. In order to quantify glacier reconstructions,it is necessary to validate that the sediments is of glacialorigin (not from any mass movement or sub aquatic pro-cess) (Bakke et al., 2005b). This can be done by differentsediment analyses such as grain-size variations, dry bulkdensity (DBD), magnetic properties, and X-ray (andXRF). When sediment DBD and glacier size based onthe analyses have been established, the altitudinal positionof the moraine can be used to calibrate the ELA curve bya correlation between ELA and DBD (Figure 4). Themoraines need to be independently “dated” by the use oflichenometry and/or historical sources/or by exposure dat-ing. Periods with anomalies in the sediment parameters areremoved from the ELA reconstruction (open squares inFigure 4). The approach has been tested against a net-balance model in a lake downstream from the Folgefonnaglacier in Norway. Tvede (1979) established some equa-tions for modeling of the glacier mass balance (Bw/Bsand Bn) of Folgefonna based on temperature and precipi-tation from the Bergen-Florida meteorological station(station. no. 5054/56). The equation was laterreformulated (Elvehøy, 1998) and established also forthe northern part of Folgefonna:
Bn ¼ 444þ 2:16�P � 54�T3 (1)

1,870 1,930
Artificial damming ofDravladalsvatn (1974)
1,800 1,840 1,880 1,920 1,960 2,000
−1
−0.5
0
0.5
1
0.2
0.4
0.6
0.8
1
−1.5
Net
mas
s ba
lanc
e (B
n)
Year AD
Bul
k de
nsity
(g/
cm3 )
Net mass balance model for northern Folgefonna (Elvehøy, 1998)
Net mass balance model for Folgefonna (Tvede, 1979)
DBDDelay Delay
Historical flood used for age control
Equilibrium-Line Altitude (ELA), Figure 4 Dry bulk density (DBD) compared to two different glacier net mass-balance modelsfor the Folgefonna and the northern Folgefonna glaciers. The dotted line shows amodel developed by Tvede (1979) for the southernpart of the Folgefonna glacier, whereas the black line was produced for northern Folgefonna in this study. Both models arecompared with a glacier net mass-balance model and net-balance measurements from AD 1963 to 1997 (Elvehøy, 1998) atFolgefonna. The reconstruction is based on temperature and precipitation records from Bergen and Ullensvang (Birkeland, 1932).Thick gray-shaded areas indicate periods with moraine formation in front of the glacier (Bakke et al., 2005b).
274 EQUILIBRIUM-LINE ALTITUDE (ELA)
where P is winter precipitation in Bergen (01.10–31.05)and T3 is average summer temperature (01.06–31.08).The equation gives high predictability compared to thenet mass balance from 1963 to 1997 (r2 = 0.84). In thereconstruction, temperature and precipitation records fromBergen back to AD 1841 (data from Meteorological Insti-tute) were put into the equation, whereas a temperaturerecord from Ullensvang was used from AD 1800 to1840 (Birkeland, 1932). As there is a lack of precipitationrecords for this time span, a linear regression modelbetween the January, February, and March temperatures(r= 0.6) to reconstruct the winter precipitation was used.Both models reproduce the AD 1870 (late LIA) glacieradvance and the AD 1930 glacier advances, which corre-spond to two independently dated terminal moraines.The low Bn values from AD 1800 to 1840 reflect theretreat of the glacier after the AD 1750 glacier event, and
may explain the high DBD values during the time span(Figure 5). Based on the assumption that the age depthmodel is correct, another interesting feature is that thereapparently exist lags in the bulk-density record with10 years from a change in net balance to increased bulk-density values. This is suggested to reflect the frontal timelag time of the glacier to mass-balance perturbations.
ELA reconstructions – learning from the pastThe use of proglacial lake sediments to reconstruct contin-uously ELA variations makes it possible to do high-resolution palaeoclimatic analyses. The quantification ofsediment variability and better dating techniques make itpossible to infer detailed information about the climaticfactors affecting the ELA (accumulation and ablation).
In Scandinavia, this approach has been applied in manyglaciated areas (Nesje and Dahl, 1991; Nesje et al., 1995;

1,400
1,340
0
−50
−100
−150
50
100
1,520
1,320
1,360
1,380
1,420
1,440
1,460
1,480
1,540
1,560
1,500
Cal. yr BP02,0004,0006,000 1,0003,0005,000
Glacial input inDravladalsvatn
Glacial input inVassdalsvatn
Floods in Vassdalsvatn
Glacial input in Hestadalsmyra
Abs
olut
e T
P-E
LA (
m)
TP
-ELA
dev
iatio
n fr
om p
rese
nt (
m)
LIAOnset of the neoglaciationat northern Folgefonna
TP-ELA fluctuations at northern Folgefonna
Sorting-mean anomaliesin Dravladalsvatn
Jo-3
Jo-2Jo-1Ju-N2
Ju-N1
? ?
Present TP-ELA = 1465ma.s.l.
0.2 0.4 0.6 0.8 1−40
0
40
80
120
Y = 163.37LN(x) + 144.61r = 0.8586
DBD (g/cm3)
ELA
(m)
from
pre
sent
P < 0.02
A
B
Equilibrium-Line Altitude (ELA), Figure 5 (a) TP-ELA curve for northern Folgefonna based on a record of bulk-density record. Thelower part of the figure is a summary of sources for validating the ELA record; the peat bog in Hestadalsmyra, floods in LakeVassdalsvatn, sorting anomalies in Dravladalsvatn, glacial input in Vassdalsvatn, and record of glacial input to Dravladalsvatn.(b) Regression between periods with known ELA (calibrated against themoraine chronology) and bulk-density values. The regressionmodel is used to transfer the bulk-density record to a continuous TP-ELA curve (Bakke et al., 2005b).
EQUILIBRIUM-LINE ALTITUDE (ELA) 275
Dahl and Nesje, 1996; Nesje et al., 2000; Nesje et al., 2001;Seierstad et al., 2002; Bakke et al., 2005a; Bakke et al.,2005b). The overall evolution of maritime glaciers alongthe western coast of Norway shows a gradual decrease inELA from 5,200 cal. yr BP until after the termination ofthe “Little Ice Age.” This pattern fits well with the generalinsolation curve for 65�N that may indicate a close linkagebetween glacier growth and solar orbital forcing at high lat-itudes during the lateHolocene.Wetter conditions combinedwith lower summer insolation made the climate favuorablefor glacier growth in Scandinavia, especially at maritimesites along the North Atlantic coast of Norway (e.g., Nesjeet al., 2001). The linkage to solar insolation also makes itclear that the retreat of maritime glaciers along the entirewestern Scandinavia over the last century is unprecedented
in the entire Neoglacial period spanning the last 5,200 years.Hence, this observation puts the reported glacier retreat inthe twentieth century (Oerlemans, 2005) into a long-timewesternNorthAtlantic perspective as an anomaly. However,some of themostmaritime glaciers inSouthernNorwaywithshort response time to climate have shown expansion duringthe latest decade of the last millenniumwith a retreat towardthe present. This is proven to be a response to larger winterprecipitation due to positive winter NAO during some yearsin the early 1990s (Nesje et al., 2005).
SummaryThe equilibrium-line altitude (ELA) marks the area or zoneon a glacier where accumulation is balanced by ablation

276 EQUILIBRIUM-LINE ALTITUDE (ELA)
over a 1-year period. The ELA is sensitive to several mete-orological factors, such as variations in winter precipitation,summer temperature, andwind transport of dry snow.Whenthe annual net mass balance is negative, the ELA rises, andwhen the annual net mass balance is positive, the ELA falls.Fluctuations in the ELA provide an important indicator ofglacier response to climate change that allows reconstruc-tions of palaeoclimate (accumulation-season precipitation,ablation-season temperature, and prevailing snow-bearingwind directions). Palaeoclimatic reconstructions based onformer glacier extent commonly include estimates of equi-librium-line altitudes (ELAs) and depression of ELAs frompresent values. Several methods have been developed toestimate steady-state ELAs of former glaciers as a tool toreconstruct palaeoclimates in glaciated regions. A surveyof literature related to ELA depressions during the lastglacial maximum, Younger Dryas, and the “Little IceAge” shows lowerings from modern values in the order of1,000 � 300 m, 500 � 200 m, and 100 � 50 m, respec-tively. High-resolution reconstructions of ELA givevaluable palaeoclimatic information from the terrestrialrealm allowing comparison with other high-resolutionarchives, e.g., ice core and marine sediment records.
BibliographyBakke, J., Dahl, S. O., Paasche, O., Lovlie, R., and Nesje, A., 2005a.
Glacier fluctuations, equilibrium-line altitudes andpalaeoclimate in Lyngen, northern Norway, during theLateglacial and Holocene. Holocene, 15(4), 518–540.
Bakke, J., Lie, Ø., Nesje, A., Dahl, S. O., and Paasche, Ø., 2005b.Utilizing physical sediment variability in glacier-fed lakes forcontinous glacier reconstructions during the Holocene, northernFolgefonna, western Norway. Holocene, 15(2), 161–176.
Ballantyne, C., 2006. The Loch Lomond Readvance on north Arran,Scotland: glacier reconstruction and palaoclomatic implications.Journal of Quaternary Science, 22(4), 343–359.
Benn, D. I., and Ballantyne, C., 2005. Palaeoclimatic reconstructionfrom Loch Lomond Readvance glacier in the West DrumochterHills. Scotland Journal of Quaternary Science, 20(6), 577–592.
Benn, D. I., and Gemmel, A. M. D., 1997. Calculating equilibrium-line altitudes of former glaciers by the balance ratio method:a new computer spreadsheet.Glacial Geology and Geomorphol-ogy, http://ggg.qub.ac.uk/ggg/.
Benn, D. I., and Lehmkuhl, F., 2000. Mass balance and equilibrium-line altitudes of glaciers in high-mountain environments.Quaternary International, 65/66, 15–29.
Birkeland, B. J., 1932. Altere meteorologische beobachtungen inUllensvang, luftdruck und temperatur seit 100 JahrenGeofysiske publikasjoner IX (6), Det norske videnskaps-akademi i Oslo.
Braithwaite, R. J., and Olesen, O. B., 1990. A simple energy balancemodel to calculate ice ablation at the margin of the Greenland icesheet. Journal of Glaciology, 36, 222–228.
Budd, W. F., and Smith, I. N., 1981. The growth and retreat of icesheets in response to orbital radiation changes. In Allison, I.,(ed.), Sea Level, Ice and Climatic Change, Oxfordshire: IAHSPublication 131, pp. 369–409.
Dahl, S. O., and Nesje, A., 1992. Paleoclimatic implications basedon equilibrium-line altitude depressions of reconstructed youn-ger dryas and holocene cirque glaciers in inner Nordfjord,Western Norway. Palaeogeography, Palaeoclimatology,Palaeoecology, 94(1–4), 87–97.
Dahl, S. O., and Nesje, A., 1996. A new approach to calculatingHolocene winter precipitation by combining glacier equilib-rium-line altitudes and pine-tree limits: a case study fromHardangerjokulen, central southern Norway. Holocene, 6(4),381–398.
Dahl, S. O., Nesje, A., and Øvstedal, J., 1997. Cirque glaciers asmorphological evidence for a thin Younger Dryas ice sheet ineast-central southern Norway. Boreas, 26(3), 161–180.
Dahl, S. O., Bakke, J., Lie, Ø., and Nesje, A., 2003. Reconstructionof former glacier equilibrium-line altitudes based on proglacialsites: an evaluation of approaches and selection of sites. Quater-nary Science Reviews, 22, 275–287.
Elvehøy, H., 1998. Samanlikning av massebalanse påHardangerjøkulen og Folgefonna. In Elvehøy, H. (ed.),Oppdragsrapport. Norway: Norges vassdrag-og energiverk, pp.1–27.
Furbish, D. J., and Andrews, J. T., 1984. The use of hypsometry toindicate long-term stability and response to valley glaciersto changes in long-term stability and response of valleyglaciers to changes in mass transfer. Journal of Glaciology, 30,199–211.
Gross, G., Kerschner, H., and Patzelt, G., 1976. MetodischeUntersuchungen über die Schneegrenze in alpinen Gletscher-gebieten. Zeitschrift für Gletscherkunde und Glazialgeologie,12, 223–251.
Gruell, W., and Oerlemans, J., 1986. Sensitivity studies with a mass-balance model including temperature profile calculations insidethe glacier. Zeitschrift für Gletscherkunde und Glazialgeologie,22, 101–124.
Kuhn, M., 1989. The response of the equilibrium line altitude to cli-mate fluctuations: theory and observations. In Oerlemans, J.(ed.), Glacier Fluctuations and Climate Change. Dordrecht:Kluwer, pp. 407–417.
Laumann, T., and Reeh, N., 1993. Sensitivity to climate change ofthe mass balance of glaciers in southern Norway. Journal ofGlaciology, 39, 656–665.
Lehmkuhl, F., 1998. Quaterary glaciations in central and westernMongolia. Quaternary Proceedings, 6, 153–167.
Lehmkuhl, F., Owen, L. A., and Derbyshire, E., 1998. Late Quater-nary glaciel history of Northeast Tibet.Quaternary Proceedings,6, 121–142.
Leonard, E. M., 1985. Glaciological and climatic controls on lakesedimentation, Canadian Rocky Mountains. Zeitscrift fürGletcherkunde und Glazialgeologie 21, 35–42.
Letreguilly, A., and Reynaud, L., 1989. Spatial patterns of massbalance fluctuations of North American glaciers. Journal ofGlaciology, 35, 163–168.
Lie, Ø., Dahl, S. O., and Nesje, A., 2003. Theoretical equilibrium-line altitudes and glacier buildup sensitivity in southern Norwaybased on meteorological data in a geographical informationsystem. Holocene, 13, 373–380.
Liestøl, O., 1967. Storbreen glacier in Jotunheimen. Norway:Norsk Polarinstitutt Skrifter 141.
Louis, H., 1955. Schneegrenze und Schneegrenzbestimmung.Geographisches Taschenbuch 1954/55, pp. 414–418.
Maisch, M., 1982. Zur Gletscher- und Klimageschichte des alpinenSpätglazials. Geographica Helvetica, 37, 93–904.
Meierding, T. C., 1982. Late Pleistocene glacial equilibrium-line inthe Colorado front range, A comparison of methods.QuaternaryResearch, 18, 289–310.
Miller, G. H., Bradley, R. S., and Andrews, J. T., 1975. The glacia-tion level and lowest equilibrium line altitude in the high Cana-dian Arctic: maps and climatic interpretation. Arctic and AlpineResearch, 7, 155–168.
Nesje, A., and Dahl, S. O., 1991. Holocene glacier variations ofBlaisen, Hardangerjokulen, Central Southern Norway. Quater-nary Research, 35(1), 25–40.

EROSION RATE 277
Nesje, A., and Dahl, S. O., 2000. Glaciers and EnvironmentalChange. London: Arnold.
Nesje, A., Dahl, S. O., and Lovlie, R., 1995. Late Holocene glaciersand avalanche activity in the Alfotbreen area, Western Norway –Evidence from a Lacustrine Sedimentary Record. NorskGeologisk Tidsskrift, 75(2–3), 120–126.
Nesje, A., Dahl, S. O., Andersson, C., and Matthews, J. A., 2000.The lacustrine sedimentary sequence in Sygneskardvatnet,western Norway: a continuous, high-resolution record of theJostedalsbreen ice cap during the Holocene. Quaternary ScienceReviews, 19(11), 1047–1065.
Nesje, A., Matthews, J. A., Dahl, S. O., Berrisford, M. S., andAndersson, C., 2001. Holocene glacier fluctuations ofFlatebreen and winter-precipitation changes in theJostedalsbreen region, western Norway, based on glaciola-custrine sediment records. Holocene, 11(3), 267–280.
Nesje, A., Jansen, E., Birks, H. J. B., Bjune, A., Bakke, J.,Dahl, C. A., Dahl, S. O., Kiltgaard-Kristensen, D., Lauritzen,S. E., Lie, Ø., Risebrobakken, B., and Svendsen, J. I., 2005.Holocene climate variability in the northern North Atlanticregion: a review of terrestrial and marine evidence. In Drange,H., Dokken, T., Furevik, T., Rüdiger, G., and Bergen, W.,(eds.), The Nordic Seas: An Integrated Perspective, GeophysicalMonograph Series, American Geophysical Union, Washington,158, pp. 289–322.
Oerlemans, J., 2001. Glaciers and climate change: a meteorologist’sview. Rotterdam: A.A. Balkema.
Oerlemans, J., 2005. Extracting a climate signal from 169 glacierrecords. Science, 308(5722), 675–677.
Ohmura, A., Kasser, P., and Funk, M., 1992. Climate at the equilib-rium line of glaciers. Journal of Glaciology, 38, 397–411.
Osmaston, H., 2005. Estimates of glacier equilibrium line altitudesby the area x altitude, the area x altitude balance ratio and thearea x altitude balance index methods and their validation.Quaternary International, 138, 22–31.
Paterson, W. S. B., 1994. The physics of glaciers. Oxford:Pergamon.
Porter, S. C., 1975. Equilibrium line altitudes of late quaternary gla-ciers in the Southern Alps, New Zealand.Quaterary Research, 5,27–47.
Porter, S. C., Pierce, K. L., andHamilton, T. D., 1983. Late Pleistoceneglaciation in the western United States. In Porter, S. C., (ed.),Late Quaternary Environments in the United States. Minneapolis:University of Minnesota Press, pp. 71–111.
Rea, B. R., 2009. Defining modern day area-altitude balance ratios(AABRs) and their use in glacier-climate reconstructions.Quaternary Science Reviews, 28(3–4), 237–248.
Reeh, N., 1991. Parameterization of melt rate and surface tempera-ture on the Greenland ice sheet. Polarforschung, 59, 113–128.
Schytt, V., 1967. A study of “ablation gradient”. GeografiskaAnnaler, 49A, 327–332.
Seierstad, J., Nesje, A., Dahl, S. O., and Simonsen, J. R., 2002.Holocene glacier fluctuations of Grovabreen and Holocenesnow-avalanche activity reconstructed from lake sediments inGroningstolsvatnet, Western Norway. Holocene, 12(2),211–222.
Shi, Y., Zheng, B., and Li, S., 1992. Last glaciation and maximumglaciation in the Qinghai-Xizang (Tibet) Plateau: a controversyto M. Kuhle’s ice sheet hypothesis. Zeitschrift fürGeomorphologie, B.F. (Suppl) 84, 19–35.
Sissons, J. B., 1979. The loch lomond stadial in the British Isles.Nature, 280, 199–203.
Torsnes, I., Rye, N., and Nesje, A., 1993. Modern and little ice ageequilibrium-line altitudes on outlet valley glaciers fromJostedalsbreen, Western Norway: an evaluation of differentapproaches to their calculation. Arctic and Alpine Research,25, 106–116.
Tvede, A. M., 1979. Likninger til beregning av nettobalansen fraværdata. In Wold, B., and Repp, K. (eds.), Glasiologiskeundersøkelser i Norge 1978, Norway: Norges Vassdrags ogelektrisitetsvesen, p. 71.
Cross-referencesAlpsCalving GlaciersCirque GlaciersClimate Change and GlaciersDebris-Covered GlaciersDynamics of GlaciersProglacial LakesRetreat/Advance of GlaciersTemperature Lapse Rates in Glacierized Basins
EROSION OF HARD ROCK BED
D. P. DobhalWadia Institute of Himalayan Geology, Dehradun,Uttarakhand, India
DefinitionAs the river passes over the hard rock bed, it scours rock.The continuous scouring of the rock produces a verticaldrop in the river channel. It behaves like the waterfall.The energy of the falling water will continue to erode thebed of the river so that eventually a plunge pool willdevelop at the base of the waterfall. The plunge pooldevelops initially because the force of the falling watercreates a slightly deeper pool in the bed of the river. Asthe rivers’ bed load falls into the pool it swirls and scoursthe base of the pool causing it to deepen.
EROSION RATE
Subhajit SinhaDBS College, Dehradun, Uttarakhand, India
DefinitionSedimentation is the process by which material is depos-ited from the water column to the bed. Conversely, erosionoccurs when material is removed. A long-term (say morethan 30 years) average annual erosion rate is the averageamount of erosion that occurs from a watershed or studyarea. The sedimentation/erosion rate in waterways isnaturally variable because of the variability in naturalprocesses influencing it such as water-current/flowpatterns, climate (rainfall, seasonality), geology, slope (ortopography), etc. Human activity (e.g., dredging, impound-ments, hydrodynamic alterations, land clearing, etc.) mayalso result in changes to sedimentation/erosion rates.Increased sedimentation/erosion rates can result in impor-tant changes to the form and function of waterways. Forexample, they may cause changed shoreline and mudflats

278 ESTIMATION OF GLACIER VOLUME AND VOLUME CHANGE BY SCALING METHODS
area, channel infilling, habitat/benthic community smother-ing or removal, community composition changes, increasedturbidity levels, and the burial or re-suspension of nutrients,trace elements, toxicants, and organic matter. In generalerosion rate from the active glaciers is very high.
ESTIMATION OF GLACIER VOLUME AND VOLUMECHANGE BY SCALING METHODS
David B. BahrDepartment of Physics and Computational Science,Regis University, Denver, CO, USA
DefinitionScaling relationship. A power-law exponential equationthat relates two quantities such as volume and area.
Estimating volumeGlacier volume V can be estimated from the glaciersurface area A using the scaling relationship
V ¼ kAg (1)
where g and k are derived from either data or theory(Figure 1). Typical values are g = 1.36 and k = 0.033 km3–2g
for valley glaciers (Macheret et al., 1988; Chen and Ohmura,1990; Bahr et al., 1997; Bahr, 1997). Inmany cases,measure-ments of the glacier volume would be preferable, but this hasbeen done for relatively few glaciers (less than 200), and gen-erally cannot be accomplished without considerable time orexpense. The most common measurement technique uses
10000100010010
Area, km2
0.10.010.001
0.01
Vol
ume,
km
3
0.1
10
100
1000
1
1
Estimation of Glacier Volume and Volume Change by ScalingMethods, Figure 1 On a log-log plot, glacier area andvolume scale linearly. For this set of 144 temperate valleyglaciers from around the world, V = 0.033 A1.36 with a squaredcorrelation coefficient of R2 = 0.97. Data are available onrequest.
ground-penetrating radar (see entry “Ground PenetratingRadar Measurements Over Glaciers”), but with crevassesand inaccessible terrain, hundreds of thousands of glacierscannot be practically measured using this approach.
In contrast, a scaled estimate like Equation 1 usesa power law to relate an easily measured quantity like sur-face area to a difficult to measure property like volume.Other power-law scaling relationships involving glacierlength, thickness, width, and various quantities have beenderived from both theory and data. For example, surfacevelocity scales with thickness and therefore volume(Bahr, 1997). Many of these power laws can be used toestimate volume (Radic et al., 2008), but glacier area isone of the easiest quantities to measure, and abundant areadata have made Equation 1 the most common volume-scaling relationship.
Deriving volume–area scalingThe principle of volume–area scaling can be illustratedwith a box (Figure 2). Given the surface area A of a squarebox, we can calculate the length, width, and depth as thesquare root of the area, A1/2. The volume V of the boxbecomes the cube of the length or V = A3/2. Therefore,for a box, the volume–area scaling exponent is 3/2. Simi-larly, the volume of a glacier is related to its area bya somewhat smaller exponent that reflects a glacier’s moreelongated shape caused by flowing ice. In this case, thevolume–area scaling exponent can be derived directlyfrom the equations of glacier flow.
Glacier flow is described by mass and momentum con-servation along with a constitutive relationship that relatesdeviatoric stresses to strain rates, most commonly Glen’sflow law or a similar modification (see entry “Dynamicsof Glaciers”). Mass conservation (or mass balance) leads tothe continuity equation (see entry “Glacier Mass Balance”).Momentum conservation leads to the force balance equa-tions (see entry “Dynamics of Glaciers”). To derive scaling
Surface Area, A
A1/2
A1/2
A1/2Volume,
V = (A1/2)3 = A3/2
Estimation of Glacier Volume and Volume Change by ScalingMethods, Figure 2 The volume of a box can be derived from itssurface area, similar to a glacier.

Partialvolume,(1/9A)3/2
Total surface Area, A
A1/2
Sum of nine partialvolumes, 9 (1/9 A)3/2
= 1/3 A3/2
Partial area,(1/9) A
Total volume, V = A3/2
Estimation of Glacier Volume and Volume Change by ScalingMethods, Figure 3 Volume–area scaling cannot be applied tosubsections of a glacier. As illustrated with a box, subdividingthe surface into nine parts and then applying scaling will givea fraction of the correct total volume.
ESTIMATION OF GLACIER VOLUME AND VOLUME CHANGE BY SCALING METHODS 279
relationships, each physical quantity in these equations canbe rescaled by multiplying by a constant factor. This leadsto the stretching symmetries of the differential equations(Bahr and Rundle, 1995).
For example, horizontal velocity v can be stretched orrescaled as vstretched = lav, where la is a constant. Simi-larly, thickness h can be rescaled as hstretched = lbh wherelb is another constant. Length x can be rescaled asxstretched = lcx. Mass balance rate _b can be rescaled as_bstretched = ld _b, and so on with stretching constants appliedto each variable. Substituting these stretched quantitiesinto the original equations and factoring out l gives a setof relationships between the exponents a, b, c, d. In otherwords, if the length of the glacier is stretched by a certainamount, then the thickness (and other quantities) will haveto be stretched by another specified amount to maintainconsistency within the equations.
These stretching relationships give nondimensional num-bers for glaciers that are analogous to Reynolds, Froude, andother quantities from the linear-viscous Navier–Stokesequations. For example, the nondimensional number arisingfrom the continuity equation is
b:
xvh
¼ C (2)
for some constant C. Equivalently by rewriting, b:
x / vh,and we see that this nondimensional number relates twowell-known quantities that describe the response time ofglaciers (Jóhannesson et al., 1989).
By combining Equation 2 with other nondimensionalnumbers from force balance and the constitutive relation-ship, we can relate volume to surface area as in Equation 1(Bahr et al., 1997; Bahr, 1997). The scaling exponent gbecomes a function of the flow law exponent n and theslope. For n = 3 and shallow slopes like ice caps,g = 1.25. For n = 3 and steeper slopes, g = 1.375. Thesevalues are in notable agreement with available data whichsuggest values of �1.22 for ice caps (Meier and Bahr,1996) and �1.36 for glaciers (Bahr et al., 1997).
The scaling constant k is derived as a combination ofthe nondimensional numbers like C in Equation 2 (usingthe same combination of nondimensional numbers thatproduce the volume–area scaling relationship). Just likerivers which can have different Reynolds numbersdepending on the amount of turbulence, every glaciercan have a unique set of nondimensional numbers associ-ated with its dynamics. However, unlike rivers, most gla-ciers have relatively similar flow regimes. So whilerivers can have both high and low Reynolds numbers(indicating turbulent flow versus laminar flow), most gla-ciers will have similar nondimensional numbers and there-fore similar scaling constants. Data suggests that thevolume–area scaling constant has a well-defined normaldistribution with a mean value of 0.034 km3–2g and a stan-dard deviation of 0.013 when volume and area are mea-sured in kilometers (Bahr, 1997). A value of 0.12 m3–2g
has also been derived by assuming a total worldwide
volume of ice and tuning the scaling relationshipaccordingly (Van de Wal and Wild, 2001).
Limitations of volume scalingWhen applied to a single glacier, volume–area scalingshould be treated as a reasonable but low-order approxi-mation. Any single glacier is expected to fall along thepower-law curve but may deviate slightly as illustratedin Figure 1. As discussed above for nondimensional num-bers, the volume has a distribution of possible values withthe mean falling on the volume–area curve. For linearregressions on a log-log plot, the standard deviations forlarge glaciers are more pronounced than deviations forsmall glaciers.
Volume–area scaling works most accurately whenapplied to large sets of glaciers. Errors that overestimateone glacier will be offset by errors that underestimateanother glacier. For example, the total volume summedfrom many glaciers will be more accurate than the volumeestimate of any single glacier (Bahr et al., 2009). The num-ber of glaciers necessary for a sufficiently large set isa statistical question and depends in part on the qualityof the data as well as sampling biases such as preferen-tially choosing larger glaciers over smaller glaciers. How-ever, as seen in Figure 1, an order of magnitude of 100glaciers appears sufficient and in many applications farfewer glaciers may be reasonable.
Although published examples exist, volume–area scal-ing cannot be applied to parts or subsections of a glacier.The stretching relationships and nondimensional numbersare derived from the equations for the entire glacier. As anexample, consider a box again with the scaling relation-ship V = A3/2 (Figure 1). If the square surface A of thebox is subdivided by a grid into nine equally sized smallersquares (Figure 3), then each smaller part has a length thatis one-third of the original and has an area that is one-ninthof the original. Using the scaling relationship, the volume

280 ESTIMATION OF GLACIER VOLUME AND VOLUME CHANGE BY SCALING METHODS
of each smaller part will be 1/27 the original. If we add upall nine subsections, the total volume will be only one-third of the correct volume. Although the scaling exponentis different for glaciers, using subsections of a glacierwould result in similar underestimates of the volume.Only linear scaling relationships with an exponent of 1.0can be subdivided in this manner.
Estimating volume changesThe derivation of stretching symmetries does not assumesteady-state conditions, and volume–area scaling can beused to analyze changing volume with time. A numberof numerical simulations have tested the accuracy anddemonstrated the application of scaling to changes in vol-ume in both steady-state and non-steady-state conditions(Pfeffer et al., 1998; Church et al., 2001; Van de Wal andWild, 2001; Radic et al., 2008). In a straightforwardapproach, a derivative of Equation 1 gives
@V ¼ kgAg�1@A (3)
In other words, a change in the volume can be estimated
from the original area as well as the subsequent change inthe area. However, Equation 3 is only exact for the infini-tesimal changes for which the derivative is calculated. Asthe change in area grows large, Equation 3 will becomea poor estimate, and an integration of small changes willbe necessary.Alternatively, finite changes in area can be used. FromEquation 1,
V þ DV ¼ k Aþ DAð Þg (4)
where DV is a finite change in volume caused by a finitechange in area DA. Dividing by the volume gives
1þ pvð Þ ¼ 1þ pAð Þg (5)
where pv = DV/Vand pA = DA/A are the fractional changesin volume and area (Bahr et al., 2009). Equation 5 willwork well for glaciers affected by climate change, mostof which have experienced large fractional changes in area.Conveniently, the scaling constant k is not necessary whenestimating fractional changes in volume from Equation 5.This eliminates a potential source of measurement error.
The change in area necessary for a glacier to reachequilibrium with the current climate (where the glacier isneither gaining nor losing mass) can be estimated fromits accumulation-area ratio, AAR. Using the relationshipbetween AAR and glacier surface areas,
pA ¼ AAR=AAR0 (6)
where AAR0 is the glacier’s accumulation-area ratio whenin equilibrium (Bahr et al., 2009). Data show that theworldwide average AAR0 is 0.57 � 0.01. Consequently,a volume change to AAR scaling relationship is derivedby combining Equations 5 and 6, and the fractional changein volume pv is easily estimated from the glacier’s currentaccumulation-area ratio. The total change in glacier
volume is just pvV. By summing pvVover all glaciers, esti-mates of glacier meltwater contributions to sea-level riseare possible.
SummaryWhile difficult to measure directly, glacier volume can bemore easily approximated by measuring surface area andapplying a power-law scaling relationship. The volume–area scaling relationship has been predicted and wellestablished from field data, theory, and numerical model-ing. As a glacier changes size, the consequent changes inglacier volume also can be estimated and predicted byderivations from the same volume–area relationship.Summing such changes over all the world’s glaciers givesa convenient measure of global changes in sea level.
BibliographyBahr, D. B., 1997. Global distributions of glacier properties:
a stochastic scaling paradigm. Water Resources Research, 33,1669–1679.
Bahr, D. B., and Rundle, J. B., 1995. Theory of lattice Boltzmannsimulations of glacier flow. Journal of Glaciology, 41, 634–640.
Bahr, D. B., Meier, M. F., and Peckham, S., 1997. The physicalbasis of glacier volume-area scaling. Journal of GeophysicalResearch, 102(B9), 20355–20362.
Bahr, D. B., Dyurgerov, M., and Meier, M. F., 2009. Sea-level risefrom glaciers and ice caps: a lower bound.Geophysical ResearchLetters, 36, L03501, doi:10.1029/2008GL036309.
Chen, J., and Ohmura, A., 1990. Estimation of alpine glacier waterresources and their change since the 1870s. International Associ-ation of Hydrological Sciences Publications, 193, 127–135.
Church, J. A., et al., 2001. Changes in sea level. In Houghton, J. T.,et al. (eds.), Climate change 2001: the scientific basis. Contribu-tion of Working Group I to the Third Assessment Report of theIntergovernmental Panel on Climate Change. Cambridge:Cambridge University Press, pp. 639–693.
Jóhannesson, T., Raymond, C., and Waddington, E., 1989.Time-scale for adjustment of glaciers to changes in massbalance. Journal of Glaciology, 35, 355–369.
Macheret, Y. Y., Cherkasov, P. A., and Bobrova, L. I., 1988.Tolschina I ob’em lednikov Djungarskogo Alatau po danniyarororadiozondirovaniya. Materialy GlyatsiologicheskikhIssledovaniy, Khronika Obsuzhdeniya, 62, 59–71.
Meier, M. F., and Bahr, D. B., 1996. Counting glaciers: use of scal-ing methods to estimate the number and size distribution of theglaciers of the world. CRREL Special Reports, 96–27, 89–94.
Pfeffer, W. T., Bahr, D. B., and Sassolas, C., 1998. Response time ofglaciers as a function of size and mass balance: II. Numericalexperiments. Journal of Geophysical Research, 103(B5),9783–9789.
Radic, V., Hock, R., and Oerlemans, J., 2008. Analysis of scalingmethods in deriving future volume evolutions of valley glaciers.Journal of Glaciology, 54, 601–612.
Van de Wal, R. S. W., and Wild, M., 2001. Modelling the responseof glaciers to climate change by applying volume-area scaling incombination with a high resolution GCM. Climate Dynamics,18, 359–366.
Cross-referencesDynamics of GlaciersGlacier Mass BalanceGround Penetrating Radar Measurements Over GlaciersSea-Level

ESTUARY ICE COVER 281
ESTUARY ICE COVER
Brian MorseDepartement of Civil and Water Engineering, LavalUniversity, Quebec, QC, Canada
What is an estuary?An estuary is a semi-enclosed coastal body of water(Figure 1). The downstream limit is where seawater ismeasurably diluted by fresh river water. Its upper bound-ary extends as far as tidal effects are felt. Often, the inter-pretation of the estuary’s limits will depend on thephenomena of interest. For example, some may usea narrow interpretation such as the brackish zone nearthe mouth of a river. Others may use biological markersthat could well extend up into the zone where the wateris always fresh but where the tidal signal is still importantfor flora in shallow zones. If regional processes are ofinterest, then the definition can cover areas as large asthe Arctic Ocean (Macdonald, 2000) since most of thesaltwater within it is indeed diluted by the many riversentering it. Therefore, the working definition of an estuarydepends, to a certain extent, on the phenomenon of inter-est. The important element of an estuary is that there isa mix (to a greater or lesser extent) of sea- and land-basedprocesses.
Estuary classificationEstuaries may be classified according to their geographi-cal location (e.g., Arctic; Sub-Arctic; Continental; etc.);their overall aspect (Archipelago; Delta; Bay; Sound;Fjord; Lake; Gulf; etc.); their size; their shape (e.g.,
Estuary Ice Cover, Figure 1 Ice on the tidal flats of the St. Lawrenc(W. Boone with permission).
narrow; open; funnel); their depth; their direction of flow(northerly, etc.); their source of freshwater: glacier (fjord)or river (ria); their geological origin (sea level rise; sedi-ment deposition; etc.); their tidal amplitude (macrotidal;mesotidal, or microtidal); the fresh/saltwater mix profile(salt wedge, partially mixed, well mixed, or frozen); thelongitudinal salinity gradient (positive or negative); aspolluted or pristine; as healthy, recovering or sick; as pro-ductive or dead; as urban or natural; and, of course, as ice-covered or not.
River and sea dynamicsAll these characterizations are useful and necessary to helpdescribe and understand particular phenomena of interest.Another viewpoint that can help understand estuaries is toview them as battle zones of competing forces and pro-cesses. From the watershed, the river enters an estuaryand must fully succeed in transporting into it, its load ofwater, sediment, suspended particulates, dissolved gases,nutrients, fish, mammals, plants, and pollutants. At thedownstream end, the sea enters the estuary and must acceptthe river’s load but not, however, without imposing its owncharacteristics. The sea’s saltwater is heavier than freshwa-ter, its temperature is normally very different than the riv-er’s, its point of fusion is suppressed (typically �1.9�Cfor fully saline water); and as the brackish water travelsupstream, it does so with the erosive force of its waves, cur-rents and most importantly, its tides. Seawater comes withits own chemistry, fish, plants, mammals, nutrients, andpurity or pollutants. The river and the sea battle for physi-cal, chemical, and biological dominance; the river winsmostly in the upstream reaches while the sea wins mostlyin downstream flats. In the middle is a unique habitat where
e Fluvial Estuary at Quebec City, Canada. February 12, 2010

282 ESTUARY ICE COVER
the plants, fish, and birds present there can adapt to rapidlychanging salinity, water levels, waves, and currents.
The two bodies of water (fresh and saline) are normallytotally out of sync with each other and therefore the fightbetween river and sea is somewhat cyclical. The timingand intensity of the river’s transport is dictated by pro-cesses dependent on the river’s characteristics and on itswatershed size, relief, shape, aspect, content, anthropo-genic activity, climate, season and weather. Seawater isgoverned by longer term weather patterns, changes inocean currents and salt content; the wave intensity is dueto large weather systems, storm surges, and tides that aredictated by the earth’s rotation and the relative positionof heavenly bodies (i.e., moon and sun) having nothingto do with land-based dynamics.
Atmospheric dynamicsThe third actor on the battle field could be described as theatmosphere whose characteristics include humidity; pre-cipitation (rain, snow); wind (speed and direction); air-borne particles (inert, organic, living spores, andpollutants); incoming radiation (short and long wave);insects, and birds. The estuary has no choice but to adaptitself to these inputs.
Anthropogenic influenceThe fourth influence is comprised of human interactionswith the estuaries and includes shore protection; channeldredging; harbor construction; river training; wetlandinfilling; thermal additions (e.g., thermal plumes frompower plants); fishing and overfishing; exotic speciesinvasions; oxygen depletion (by pollution and excessnutrients); and oil, nuclear, and toxic spills, ice manage-ment, and ice-breaking activities.
The spatial nature of the estuary and iceThe spatial extent is sculpted by the relative strengths ofriver’s discharge, the atmosphere’s wind, the anthropo-genic activities, and the sea’s tide. On the flip side, theestuary’s spatial character will highly influence the natureof the interactions, providing a relative advantage to oneover the other and will therefore dictate how the fouractors interact. The estuary physical space is defined byits geographical location; size; width; length; shape; orien-tation; bathymetry; the presence or absence of islands; theextent of its shelf; sediment size; vegetative cover, and thepresence of ice in all its many forms.
The ice cover as a barrier between water andatmosphereThe presence of an ice cover dramatically changes thenature of the battlefield and may go so far as to absolutelychange the character of an estuary (if only seasonally). Anice cover normally reduces mixing (leading to stabilizationand stratification of the water column) because it providesa barrier between the wind and water diminishing thestrength of the sea waves, longshore currents, and Ekman
flows. The cover arrests light penetration affecting plantgrowth and fish dynamics. It limits heat and mass transfer(modifying evaporation rates and protecting tidal flat ani-mals from freezing). It cuts off airborne particles drasticallyreducing sediment transport, limiting reoxygenation andother gaseous exchanges. The cover is a physical barrierforcing sea mammals to come up through ice holes tobreathe and preventing ships from navigating. It offersa platform providing support for bears to fish upon; to sup-port people and animals to traverse; to enable caribou tofind salt and to enable wolves to attack animals upon.
The ice cover as a barrier between fresh- andsaltwaterThe ice cover can also be a pathway or a barrier betweenfresh- and saltwater that can damp tidal amplitudes (e.g.,the presence of sea ice formed over the greater CanadianArchipelago reduces James Bay tidal amplitudes from1.5 m in summer to 1.0 m in winter at the inlet to LaGrande River). The ice sheet can provide conditionsallowing large freshwater penetration under the ice intothe sea in Russian Arctic estuaries and those of EasternHudson’s Bay. At the edge of the cover, a ridge can bebuilt up into a deep (>20 m) ridge. Virtually all of theMackenzie’s winter flow (0.3 m tide) is stored locallybehind this barrier in a unique vertically and longitudi-nally stratified system known as a “winter” estuary(Macdonald, 2000). It is then released in sync with thespring freshet providing a dramatic freshwater pulse tothe Beaufort Sea. In the case of the mesotidal ChurchillEstuary (3.3–4.2 m tide), the ridge’s role only delays theoutpouring of the freshwater into the Western Hudson’sBay by a few days but ice is still the dominant feature ofthe estuary that highly influences physical and biologicalprocesses: “Until late May, the rubble zone partiallyimpounded river discharge, influencing the surface salin-ity, stratification, flushing time, and distribution and abun-dance of nutrients in the estuary. The river discharge, inturn, advanced and enhanced sea ice ablation in the estu-ary by delivering sensible heat. Weak stratification, thesupply of riverine nitrogen and silicate, and a relativelylong flushing time (6 days) in the period preceding meltmay have briefly favored phytoplankton production inthe estuary when conditions were still poor in the sur-rounding coastal environment. However, in late May, thepeak flow and breakdown of the ice-rubble zone aroundthe estuary brought abrupt changes, including increasedstratification and turbidity, reduced marine and freshwaternutrient supply, a shorter flushing time, and the release ofthe freshwater pool into the interior ocean. These condi-tions suppressed phytoplankton productivity whileenhancing the inventory of particulate organic matterdelivered by the river. The physical and biologicalchanges observed in this study highlight the variabilityand instability of small frozen estuaries during winter/spring transition, which implies sensitivity to climatechange” (Kuzyk et al., 2008).

ESTUARY ICE COVER 283
Ice impact on the physical boundariesAn ice cover and the presence of grounded ice on tidalflats reduce the spatial boundaries of an estuary. Inmacrotidal estuaries (e.g., Bay of Fundy, Canada (16 mtide)), estuary ice can reach very significant thickness onthe tidal flats. In a matter of days, the 5-m-thick strandedice accumulated on the Petitcodiac Estuary’s tidal flatsforms “ice walls” that change the channel’s trapezoidalshape (with side walls 1 V to 3.5 H) into a rectangularshape (Desplanque and Bray, 1986). As such, the tidalprism and associated flow rates are substantially reduced.In the 5.9-km longmesotidal Portneuf Estuary, Canada, notidal walls were noted but nevertheless, the midwinter fastice cover (0.5 m thick), through the combined effects ofchange in bathymetry and increased wetted perimeter,attenuates the neap tidal range (1.9 m) and spring tidalrange (4.0 m) by 17% and 37%, respectively, near theupstream end of the estuary. The arrival of low water isalso delayed by about 1.5 h. At the mouth, the cover atten-uates the peak ebb tide flow (200 m3/s) and flood tide flow(500 m3/s) by approximately 18% and 13% (the river’swinter discharge is 20 m3/s). In general, the ice coverattenuates peak velocities by 12% to 20%, although at cer-tain times and locations, its presence could increase veloc-ities. The ice cover also retards and diminishes the saltwedge intrusion (Morse et al., 2006).
Ice as a barrier betweenwater forces and sedimenttransportBottom fast ice can protect permafrost and can help shapethe estuary’s beach profile. Ice on tidal flats can be presentas a smooth cover or multilayered pieces of drift ice thatare frozen together. This ice can rest on the beach, float,or be frozen into the bottom. It provides a barrier betweencurrents, waves, and the shore and can thereby protect theshore from coastal erosion. However, through freezingcontact, it can also pick up significant amounts of sedi-ment and organic material and can be an important agentof tidal flat formation. Some ice pieces grow into hugeblocks laden with sediment and weigh several tons. Theycan be lifted on a flood tide and moved. Since they canpotentially be both neutrally and negatively buoyant, theyrepresent a significant risk to boats, fishing nets, andmarine infrastructure (such as tidal power installations).
Ice as storageThe fast ice preserves water (primarily fresh) untilbreakup. Depending on the severity of the climate andthe tidal range, a substantial amount of water is stored asice. This implies that the freshwater output from the estu-ary is significantly reduced in winter. As freshwater goesinto storage, brine is released leading to salinization andthe creation of a locally “negative” estuary (Macdonald,2000). The eventual melting of the ice is normally in syncwith the spring freshet and thus the freshwater yield(volume of water divided by spatial area) from the estuaryto the sea can be significantly increased. This has many
implications for primary productivity, for ocean currentsand for atmospheric–ocean interactions.
The ice ridge–ice flaw systemAnother feature of some ice-covered estuaries is the exis-tence of an open flaw lead (polynya) separating the iceridge and the mobile sea ice pack. In some cases, the flawexists in absence of the ridge. The lead can generate a greatamount of ice and therefore a great amount of brineresulting in significant vertical mixing. The interplaybetween the lead, the rubble ridge and the ice cover is fas-cinating and is documented by Macdonald et al., (1999).
Global coverage of estuaries subjected to iceprocessesMany estuaries of the world form an ice cover. The fre-quency and duration depend primarily on the local climate(particularly the number of degree-days) and the water tem-perature of the local sea. In some cases, a cover forms eachwinter (Canada, USA, Alaska, Northern Europe and Russiawhere it lasts for 9 months), whereas in lower latitudes iceon estuaries is present infrequently (e.g., Columbia Estuary,OR, USA; Chesapeake Bay, VA, USA or the GaronneEstuary at Bordeaux, France). In the following paragraphs,some chosen estuaries from different geographic locationswill be discussed.
Continental macrotidal estuariesIce cover formation in estuaries depends primarily on thetidal amplitude, the estuary’s spatial layout and the windspeed and direction. After presenting an estuarine iceterminology, Desplanque and Bray (1986) providea detailed discussion of ice formation in a macrotidal estu-ary in eastern Canada: In the upstream zone of the estuary,a classic river-type of ice cover forms. In the second zone(delineated at the upstream end by high water at springtide and at the downstream end by high water at neap tide),a series of layers of drift ice stacking up on the tidal flatsforms ice walls. The third zone is delineated at the down-stream end by the low water associated with spring tides.It is characterized by vast intertidal mud flats whereondrift ice may become temporarily stranded and frozen tothe sediment. The fourth zone is always covered withwater having a salinity of 10–25%. This vast zone pro-duces most of the ice (slush, pan, cake) that is transportedup the estuary as drift ice. Zone 5 is too deep to cool to thefreezing point and therefore produces no ice.
Nelson and Whitney (1996) describe the macrotidalCook Inlet, Alaska. It “is unique in that it has a very highsuspended sediment load, high tides (10 m), a moderatesnow fall and an air freezing index of 1,400�C days per year.These conditions combine to cause low visibility, extremetidal currents (8 kts) and unique modes of ice generationwithin the inlet. The major mode of formation of floatingice is identified as slush ice formation. The slush then coa-lesces in the turbulent waters to form various ice features.Ice features with depths greater than 2 m that formed in less

284 ESTUARY ICE COVER
than 7 days are described. Ice buildup on shore based struc-tures results in significant downward and upward verticalforces as well as potential horizontal forces.”
Continental mesotidal estuariesOne of the most striking descriptions of an ice cover for-mation is given by Meese et al., 1987 for an inner estuaryhaving a 3 m tide near Newington, NH known as GreatBay. The authors note that freshwater inflow is very mod-est (only about 2% of tidal flow) and that the salinity istypically 23%. “The first stage of the freezing processwas characterized by growth of frazil crystals that beganforming on the surface of the water on 17 December1983, giving it a greasy appearance. These crystals, upto 2 cm in diameter, coalesced to form the initial ice sheet.Two days later, wave action caused this sheet to break upinto circular-shaped masses (pancakes) that developedraised rims due to collisions with other masses. Frazil con-tinued to grow between the pancakes until, on 22 Decem-ber, a continuous sheet of ice had formed. By 28December the ice had thickened to 12 cm and the sheetextended to the edge of the cove. Beneath the frazil icea structural transition was observed that was characterizedby a change in the crystalline texture of the ice that ledultimately to the formation of relatively large columnar-shaped crystals exhibiting brine lamella ice plate substruc-ture, the trademark of typical congelation sea ice.Locally, snow ice was found, formed by the flooding ofa snow-covered ice surface by seawater. This results inthe formation of slush which subsequently freezes to formthe top layer of the ice sheet. The crystals in this layer aregenerally fine-grained and have a random orientation.Mixing of snow with rain or melt water followed by freez-ing produces a similar result.” The authors go on to notethat the snow-ice layer can contain a high degree of salin-ity when the sheet is flooded by estuarine water or mayhave a very low salinity when the sheet is flooded by rain.The frazil ice layer had a low salinity. The columnar icelayer’s salinity depended on its age. The older it was themore time it had to reject brine and the fresher it was.
Morse et al. (2006) describe the ice cover in midwinterin a mesotidal estuary and its subsequent breakup. In thiscase, the cover was similar to a river’s with the exceptionof a very large number of longitudinal fissures outliningthe principal channel (thalweg); the precarious nature ofthe ice; the thinning of the ice cover from the banks towardthe deeper portions; and a number of local ice effects (e.g.,slush balls) related to a tidally dynamic environment.Breakup is also described and is shown to occur asa specific sequence over a few spring tide semidiurnalcycles. On the first ebb tide, ice from the main channel isremoved over a certain distance (�1–2 km). On the nextebb tide, ice from the adjacent tidal flats is removed as isthe next upstream section of ice cover in the channel por-tion. After the third ebb tide, thick ice pieces got strandedalong the main channel bottom at low tide creating a seriesof weirs that the water cascaded over. On the followingebb tide, virtually all the ice was gone.
The Saint Lawrence estuaryIce formation and breakup on the St. Lawrence is also ofgreat interest because of its length and socio-economic-environmental importance. Ice on the Estuary is surveyedabout three times a week and is available online fromEnvironment Canada. The St. Lawrence is a huge systemand therefore ice processes vary greatly. Upstream ofMontreal are vast expanses of water commonly referredto as lakes where, until they are frozen over, large quanti-ties of floating sheets are generated. These are broken upthrough the rapids near Montreal wherein frazil ice andanchor ice can also be added to the mix. From Montrealto Sorel, although the River is affected by the tides, thediurnal amplitude signal is absent and therefore, this reachacts just like any river wherein shore ice forms near thebanks and the drift ice increases in thickness and concen-tration as it moves down the River. The Sorel to Trois-Rivières reach is so vast that it is referred to locally asa lake. It has a very small (10–20 cm tide) and is very shal-low (3 m) except through the middle of it where a 12 mnavigation channel is maintained. As such, the shallowportions quickly form a cover (held in place by artificialislands and booms) and the drift ice continues down thenavigation channel. Because of the very small river slope,this reach is particularly susceptible to forming jams underadverse wind conditions. The Trois-Rivières (30 cm tide)to Québec (6 m tide) reach has high concentrations of driftice moving down the river, frazil ice is formed in the watercolumn causing blockages of local water intakes andblocks of ice are stranded on the tidal flats. Near Québec,ice on the flats can build into walls and ice elements ontidal flats have strong interaction with sediment processes.Downstream of Québec, there is primarily drift iceconsisting of very large floes. Late in the winter season,during cold years and under unfavorable wind conditions,ice thickness and concentrations can reach significantlevels and ships must be escorted by ice breakers(Smith et al., 2006).
Canadian arctic estuariesThe ice features of the Churchill (Hudson’s Bay)mesotidal Arctic estuary are beautifully described byKuzyk et al., 2008 (some elements are presented above).Prior to the major flow diversion to the Nelson River inthe mid-1970s, the inner Churchill estuary ice was primar-ily composed of freshwater having an increased salt con-tent as one travels downstream. Pratte (1975) gives aninsight into the ice formation at the Port of Churchill, not-ing that “operations are forced to stop for ice formedupstream in the rapids, which comes down at ebb tide,jamming against the ships at the dock . . . breaking moor-ing lines.”
Ice features of the microtidal Mackenzie estuary arefully described by Macdonald in a large number of papers(e.g., Macdonald et al., 1999). One particular ice-growthhypothesis for the Mackenzie is the formation of frazilice in the overlying freshwater layer because of the colder

ESTUARY ICE COVER 285
saltwater layer below. An associated article incorporatinglocal ecological knowledge is presented by Carmack andMacdonald (2008). It is also compared to the neighboringHusky lake estuary of a very different nature (Macdonald,2000). In all cases, the main winter features of theMcKenzie are a smooth thin ice cover in the river portionof the estuary bounded by a significant ice ridge outsidethe mouth, a flaw lead on the other side and mobile packice further out. The nature of Beaufort nearshore ice andsome explanations for the ice ridge are provided by Timco(2008) and the role of tidal jacking in the Canadian Arcticis discussed by Stander et al. (1988) for inlets north ofBaffin Island.
Some biological processes are described by Emmertonet al., 2008. During river passage through the Mackenzieestuary, particulate matter, dissolved organic carbon andinorganic nutrients showed sedimentation, dilution andbiological uptake patterns common to other arcticand non-arctic estuaries. Alternatively, inorganic contentof particles increased offshore and dissolved organicN and P increased substantially over the shelf, reachingconcentrations among the highest reported for the ArcticOcean. These observations are consistent with the pres-ence of a remnant ice-constrained (“stamukhi”) lake fromthe freshet period and a slow flushing river plumeconstrained by sea-ice in close proximity to shore.
Making the link with biological processes, “snow andsea ice cover melt and/or break-up controls the timing ofthe phytoplankton bloom but primary producers (ice algaeand phytoplankton) on the outer shelf are essentially nutri-ent limited. The total annual primary production (22.7 to27.7 g-C m�2) is thus controlled by nutrient “pre-conditioning” in the previous fall and winter and by thedepth of wind mixing that is controlled in part by the sup-ply of freshwater at the end of spring (ice melt or runoff)”(Lavoie et al., 2009).
According to Barnes (1999), ice causes the most impor-tant disturbance to polar benthic communities. “Thisoccurs in four main forms: the ice-foot, ice scour, anchorice and fast ice, each of which influences benthos ina very different temporal and spatial manner. The fourdescribed forms of ice disturbance are all seasonal, butcombined, influence communities throughout the year.The magnitude of ice mediated disturbance is often cata-strophic and as a result both dominates benthic commu-nity structure and makes recolonization and developmentrates critical.”
The role of water on the ice cover in reducing thealbedo and promoting spring melt due to surface meltingprior to breakup and the imposition of the massive freshetwater. The importance of overlying spring water onthe nearby Simpson Lagoon, Alaska, is discussed byMatthews and Stringer (1984).
Russian arctic estuariesBecause of their large freshwater discharge rates, Russianrivers dominate the Arctic Ocean. An overview or these
estuaries is given by Dolgopolova and Mikhailova(2008). They note that a “distinguishing feature offreeze-up of Siberian rivers is the beginning of ice forma-tion at the supercooled anchor ice then lifting up to thewater surface.” Furthermore, “hanging dams are usuallyformed at the northern rivers . . . meeting the firm estuaryice cover” that normally reaches 2 m thick. Of particularinterest is the role of ice jams upstream in drasticallydiminishing the flow in the estuary that can lead to stagna-tion there: “its color becomes reddish that results in suffo-cation of fish.” Also of interest is the formation of anintermediate “cold layer of brackish water, which is keptafter ice formation” in nontidal estuaries. In fact, one ofthe interesting elements of this paper is that the estuariesare presented as a function not only of estuary mouth typebut, more importantly, as a function of tidal range thatincreases from East to West in the Russian Arctic Ocean.
Eicken et al. (2005) present a very important paper onthe Lena and Yana “open” estuaries of the Laptev Sea.What makes the paper so interesting is the direct compar-ison of these estuaries with theMackenzie. They show thatRussian estuaries are “winter” estuaries (having a uniquesaline stratification due to the presence of ice) but that theydo not have the very important ice rubble ridge to confinefreshwater. “Freshening of under-ice waters during winterand north-/northeastward spreading of the river plumewith under-ice spreading rates of 1.0–2.7 cm s�1” (aboutten times faster than the spreading in the Mackenzie).For the years studied, the Laptev brackish water plumeextended to a depth of 10 m. Stable-isotope data show thatthe landfast shelf ice is composed of about 62% of riverwater, locking up 24% of the total annual Lena and Yanadischarge. Inside the mouth (delta), the ice samplescontained virtually no salt. In the nearshore, salinity ofthe cores increased as a function of distance from themouth and as such there is a gradual 10% (0.2 m) decreasein fast ice cover thickness.
Arkhipov et al. (1997) present the results of a two-dimensional laterally averaged model developed todescribe the hydrodynamic and thermohaline processesin the Ob and Tas Rivers estuary. Koziy et al. (1998)developed a one-of-a-kind 3-D model for the assessmentof contamination in coastal seas and inland water bodies.It includes a high resolution numerical hydrodynamicsubmodel, a dynamic-thermodynamic ice submodel, andsubmodels for suspended sediment and pollution transport.Presented are simulations for the assessment of the conse-quences of the possible release of radionuclides fromscuttled nuclear reactors in the Novaya Zemlya fjords andthe East Novaya Zemlya Trough of the Kara Sea.
Northern European estuariesAccording to Carstensen (2008), “ice events may naturallyoccur on the German coasts. Ice at the Baltic Sea coast existsmainly as drifting ice. In coastal regions a continuous icecover over a wide area forms only in very severe wintersalso due to the salinity of thewater. These ice covers are then

286 ESTUARY ICE COVER
generally broken up when storms cause water level fluctua-tions and the resulting ice floes are subsequently carried outto the sea or onshore depending on the currents (induced bywind or tides) and/or the wind. Ice events such as ridging(ca. 0.5 m high) or hummocking can force ice to pile up toseveral meters in height. Such ice events can greatly damagecoastal protection structures and in the worse case makethem unfit for use.” Furthermore, “when spray water ordefrosting water freezes on pile constructions or groynesabove the water surface level, ice is accumulated, buildingformations several times the diameter of the structure. Dueto these accreted formations, rising water levels may exertbuoyant forces on these structures therewith pulling themup and diminishing there stability against collapse andusability.” Water quality parameters in northern Germanyestuaries are described by Grisard (1994).
Ice floes are widely known to abrade surfaces of struc-tures constructed in seawater areas where ice floes moveactively in the Gulf of Bothnia, Sweden.
Although people use to skate most winters on Norwegianfjords, over last 2 decades, there has been virtually no ice.This, of course, is a significant cultural loss and the fjordsare changing because they are now open to much strongerwinter storms. Much further north, the interplay of icebergsand bergy bits with currents and sediment processes forKongsfjorden, northwest Spitsbergen are described in detailin Dowdeswell and Forsberg (1992).
ConclusionEstuary ice has many interesting features (smooth cover,hummocks, ridges, stamukha, blocks, ice feet, hangingdams, ice weirs, ice walls, slush balls, frazil ice, anchorice, landfast ice, bottomfast ice, cakes, pans, floes, brash,nilas, huge lengths of thick ice in Arctic Estuaries knownas “massives,” slush ice, spray ice, grease ice, bellycatters,etc.). Many of these are related to the stratification andsalinity of the water; tidal fluctuations (particularly overtidal flats); wind and waves; and the associated currents.Spray, drifting ice and neutrally buoyant ice can all damagestructures and vessels; bottom fast ice can protect shoresbut can rip also them apart; ice walls and stranded ice canreduce flow rates and currents and protect organisms fromfreezing; ice covers can impede commercial navigation,change mammal behavior, block out heat, cold and sun;separating water from wind (significantly reducing thefetch required for erosional processes), ice covers can causeunique and very stable salinity vertical and longitudinalstratification known as “winter estuaries”; ice covers canimpede or encourage freshwater plumes in the nearshore;ice pressure ridges can form a barrier separating the estuaryfrom the sea that can retard freshwater’s voyage by days,weeks, or months; ice can dominate biological processes,can dictate ocean currents, and can jam up inside the mouthcausing significant flooding that can damage infrastructurebut can also revitalize ecological communities.
When present, an ice cover has a tendency to providegreat stability to the estuary, however, covers can disappear
very rapidly thereby dramatically changing the nature of theestuarywith all the associated impacts on local biota and far-field ocean currents. Depending on the geographical loca-tion, the estuary could be very vulnerable to climate change.In isolated cases, the impact is only local but should a groupof estuaries change regime, there could be “a strong impacton the thermohaline circulation and sea-ice regimes over theshelves and in the Arctic Basin” (Eicken et al., 2005).
One can only conclude that estuaries are terribly fasci-nating because of their spatial diversity and the intricacyof the interplay between cryological, hydrodynamic,atmospheric, oceanographic, astronomical, sedimentary,biological, anthropological, and climatic processes.
BibliographyArkhipov, B. V., Solbakov, V. V., and Tsvetsinsky, A. S., 1997.
Hydrothermodynamic model of the Ob and Tas Rivers estuary.In Proceedings of the International Offshore and Polar Engi-neering Conference, Vol. 3, pp. 772–777.
Barnes, D. K. A., 1999. The influence of ice on polar nearshore ben-thos. Journal of the Marine Biological Association of the UK,79, 401–407.
Carstensen, D., 2008. Ice conditions and ice forces. In Chinese-German Joint Symposium on Hydraulic and Ocean Engineer-ing, August 24–30, 2008, Darmstadt, pp. 283–287.
Desplanque, C., and Bray, D. I., 1986. Winter ice regime in the tidalestuaries of the Northeastern portion of the Bay of Fundy, NewBrunswick. Canadian Journal of Civil Engineering, 13(2),130–139.
Dolgopolova, E., and Mikhailova, M., 2008. Classification of arcticriver mouths and regularities of currents in icecovered estuaries.In Proceedings of the 19th IAHR International Symposium onIce. Vancouver, British Columbia, Canada.
Dowdeswell, J. A., and Forsberg, C. F., 1992. The size and fre-quency of icebergs and bergy bits derived from tidewater gla-ciers in Kongsfjorden, northwest Spitsberben. Polar Research,11(2), 81–91.
Eicken, H., Dmitrenko, I., Tyshko, K., Darovskikh, A., Dierking, W.,Blahak, U., Groves, J., and Kassens, H., 2005. Zonation ofthe Laptev Sea landfast ice cover and its importance in a frozenestuary. Global and Planetary Change, 48(1–3), 55–83.
Emmerton, C. A., Lesack, L. F. W., and Vincent, W. F., 2008. Nutri-ent and organic matter patterns across theMackenzie River, estu-ary and shelf during the seasonal recession of sea-ice. Journal ofMarine Systems, 74(3–4), 741–755.
Grisard, K., 1994. Eight years experience with the Elbe estuaryenvironmental survey net. In Proceedings OCEANS 94. (Cat.No.94CH3472-8), p I/38–43 vol. 1.
Koziy, L., Maderich, V., Margvelashvili, N., and Zheleznyak, M.,1998. Three-dimensional model of radionuclide dispersion inestuaries and shelf seas. Environmental Modelling and Software,13(5–6), 413–420.
Kuzyk, Z. A., Macdonald, R. W., Granskog, M. A., Scharien, R. K.,Galley, R. J., Michel, C., Barber, D., and Stern, G., 2008. Sea ice,hydrological, and biological processes in the Churchill Riverestuary region, Hudson Bay. Estuarine, Coastal and ShelfScience, 77, 369–384. Elsevier.
Lavoie, D., Macdonald, R. W., and Denman, K. L., 2009. Primaryproductivity and export fluxes on the Canadian shelf of theBeaufort Sea: a modelling study. Journal of Marine Systems,75(1–2), 17–32.
Macdonald, R. W., 2000. Arctic estuaries and ice: a positive-negative estuarine couple. In Lewis, E. L. (ed.), The Freshwater

ESTUARY ICE COVER 287
Budget of the Arctic Ocean. Netherlands: Kluwer, pp.383–407.
MacDonald, R. W., Carmack, E. C., and Paton, D. W., 1999. Usingd18O composition in landfast ice as a record of arctic estuarineprocesses. Marine Chemistry, 65(1–2), 3–24.
Matthews, J. B., and Stringer, W. J., 1984. Spring breakup andflushing of an Arctic lagoon estuary. Journal of GeophysicalResearch, 89(C2), 2073–2079.
Meese, D. A., Gow, A. J., Mayewski, P. A., Ficklin, W., and Loder,T. C., 1987. Chemical, physical and structural properties of estu-arine ice in Great Bay, New Hampshire. Estuarine, Coastal andShelf Science, 9(1), 833–840.
Morse, B., Ringô, B., Messier, D., Thanh-Quach, T., and Stander,E., 2006. Hydrodynamics of a mesotidal estuary in winter.Journal of Cold Regions Engineering, 20(3), 95–115.
Nelson, W. G., and Whitney, J. W., 1996. Description of summerand winter environmental conditions within Cook Inlet, Alaska.In Proceedings – SPE Annual Western Regional Meeting,Denver, CO, pp. 381–392.
Pratte, B. D., 1975. Churchill River salt water tidal model. NationalResearch Council of Canada, Quarterly Bulletin of the Divisionof Mechanical Engineering, 27–36.
Smith, G. C., Saucier, F. J., and Straub, D., 2006. Response of thelower St. Lawrence estuary to external forcing in winter. Journalof Physical Oceanography, 36(8), 1485–1501.
Stander, E., Frederking, R. M. W., and Nadreau, J.-P., 1988. Theeffects of tidal jacking on ice displacement and strain inthe nearshore environment. In 9th IAHR International Sympo-sium on Ice, Sapporo, Japan, August 23–27. Vol. 1,pp. 526–536.
