environmental derivatives, risk analysis, and conservation management
TRANSCRIPT
LETTER
Environmental Derivatives, Risk Analysis, and ConservationManagementL. Richard Little1, John Parslow1, Gavin Fay1,2, R. Quentin Grafton3, Anthony D.M. Smith1, Andre E. Punt1,4,& Geoffrey N. Tuck1
1 CSIRO Marine and Atmospheric Research and CSIRO Wealth from Oceans Flagship, GPO Box 1538, Hobart, TAS, Australia2 National Marine Fisheries Service, 166 Water Street, Woods Hole, MA 02543, USA3 Crawford School of Public Policy, The Australian National University, Canberra, ACT, Australia4 School of Aquatic and Fishery Sciences, Box 355020, University of Washington, Seattle, WA, USA
KeywordsBio-economic modeling; conservation finance;
environmental derivatives; environmental risk
analysis; management strategy evaluation;
recovery costs; restoration.
CorrespondenceL. Richard Little, CSIRO Marine and Atmospheric
Research and CSIRO Wealth from Oceans
Flagship, GPO Box 1538, Hobart, TAS 7000,
Australia.
Tel: +61-3-6232-5006; fax: +61-3-6232-5053.
E-mail: [email protected]
Received19 December 2012
Accepted16 May 2013
EditorPhillip Levin
doi: 10.1111/conl.12041
Abstract
Two key challenges in conservation management are: (1) how to quantify andmanage the risk that natural populations will fall below critical thresholds and(2) how to fund recovery plans should a population do so. Statistically esti-mated, process-based simulation models of two distinct fish populations areused to forecast the species population levels, and capture the risk of crossinga management defined trigger point. We show how to calculate the environ-mental derivative price, which is the amount a risk-neutral investor wouldrequire for promising a pay-out should the species abundance fall below thetrigger level. The approach provides the potential for environmental deriva-tives to support species recovery, and a method for measuring the underlying“health” of a managed population and calculating risk-cost tradeoffs amongalternative management strategies.
Introduction
Conservation management agencies regularly attempt tomanage natural assets within specific limits, and con-stantly face the risk of crossing these limits, triggeringcostly restoration activities. Both public agencies and pri-vate industries, faced with paying for these actions, areusually unwilling or unable to secure funds for this pur-pose (Holl & Howarth 2000), which in turn leads to socialand political pressures to ignore trigger points or delaythe response, resulting in further, and at times extreme,damage. Faced with this risk, managers must thereforeask: How do management decisions affect risk? What riskmeasures can be used to inform management decisions?And, what can be done to share the financial risk in theevent a threshold is crossed?
Similar issues are routinely addressed in other areasincluding agriculture, commodities, and finance, withmarket-based mechanisms and financial instruments,which transfer risk to a willing second party. Environ-mental management is increasingly looking at such ap-proaches to manage risk (Dalton 2005; Fenichel et al.
2008; Mandel et al. 2009; Sethi 2010; Sethi et al. 2012;Sullivan 2013). For example, Mandel et al. (2010) sug-gested a class of products called derivatives could be usedlike assurance bonds (Costanza & Perrings 1990), to alignthe incentives of investors and stakeholders with the re-covery and conservation objectives for species like theendangered red-cockaded woodpecker (Picoides borealis).We suggest that derivatives can be used to manage thefinancial risk of recovery and restoration, and ensure
196 Conservation Letters, May/June 2014, 7(3), 196–207 C©2013 The Authors. Conservation Letters published by Wiley Periodicals, Inc.This is an open access article under the terms of the Creative Commons Attribution-NonCommercial License, which permits use, distribution and reproduction in any medium,provided the original work is properly cited and is not used for commercial purposes.
L.R. Little et al. Environmental derivatives
that conservation managers use effective managementstrategies.
Derivatives are widely used to manage or hedge riskin financial and commodity markets. They are also usedto manage risk associated with environmental conditions,such as weather (Jewson et al. 2005). The environmentalderivative we envisage, analogous to a financial deriva-tive called an option, would operate in such a way thatone party, called the owner, would pay another party,called the writer, to incur the risk of funding recoveryoperations. The writer is contractually obliged to makea pay-out to the owner for recovery efforts if the un-derlying asset, for example, a red-cockaded woodpeckerpopulation, falls or remains below a pre-defined triggerpoint, called the strike, prior to an expiry date. However,if the population stayed above the trigger point, no pay-out would be required and the writer (investor) wouldkeep their payment.
Derivatives have acquired a poor reputation becausetheir speculative and reckless use contributed to the re-cent global financial crisis. However, they are in essence aform of insurance and continue to be used widely and re-sponsibly in that role. An important point highlighted bythe global financial crisis is that pricing derivatives, or anyform of insurance contract, requires accurate quantifica-tion of risk. The widespread failure of statistical modelsto accurately quantify financial risks contributed to theglobal financial crisis (Salmon 2009), and a lack of robustrisk measurement methods represents a substantial bar-rier to their use for conservation. We show that stochasticpopulation models are a well-established platform for ob-jectively measuring the risk of crossing trigger points, andcalculating the derivative payment price.
The use of environmental derivatives, based on objec-tively characterizing risk, offers multiple direct and in-direct benefits for conservation management. Directly,it ensures that funds are available to implement agreedrebuilding initiatives if assets drop below trigger points.Indirectly, it pressures managers to invest in effectiveconservation strategies. For example, managers are typ-ically faced with a choice of strategies having differentrisk profiles, and may be under pressure to adopt a strat-egy that promises higher economic returns, but higherrisk of population collapse. Managers may also, less ob-viously, be under pressure to reduce investment in mon-itoring and assessment needed to underpin the strategychosen. The requirement that a management agency in-sure against the risk of population collapse using environ-mental derivatives, at a price that increases in proportionto risk, offers a countervailing pressure that favors risk-averse strategies.
In this article, we outline risk assessment methods thatcan be used to develop environmental derivatives for
conservation purposes and calculate prices for deriva-tives associated with three management strategies. Therisk assessment and pricing methods outlined here offera direct financial measure of the benefits of investmentin management procedures that reduce uncertainty andrisk. The methods are illustrated for two marine fish pop-ulations.
Methods
The derivative price is the payment the writer (investor)of the contract requires for incurring the risk of a pay-out. Consequently, the greater the probability that thepopulation will fall below the threshold, the higher thederivative price should be. Probabilities were calculatedfrom stochastic simulations forecast from a statisticallyestimated process-based population dynamics model (bi-ological model) of two fish species, school whiting (Sil-
lago flindersi) and tiger flathead (Platycephalus richardsoni).These species were chosen based on their life historycharacteristics, their current estimated status, and theuncertainty associated with that estimate. School whit-ing is a fast growing short-lived species, whose spawn-ing biomass is currently thought to be at a relativelyhigh fraction (0.6) of the undisturbed spawning biomass(Day 2010). The longer-lived tiger flathead is generallythought to be at a lower (0.4), but more certain level(Klaer 2010).
Derivative prices accounted for observation error, andwere generated for three management control strategies(Appendix), each involving a data collection and estima-tion procedure performed by an observation model, anda decision procedure to set an allowable harvest that re-flects a management objective of balancing conservationand economic goals. Each strategy is currently used bythe management agency on a range of species, and rep-resented different operating costs (for monitoring and as-sessment): management control 1 is the costliest, and setsallowable harvest based on an estimated population sizeusing annually collected age, growth and mortality data;management control 2 sets allowable harvest based ona population size estimated from annually collected agedata; and management control 3 represents the cheapestprocedure by setting allowable harvest based on annuallycollected catch-rate data.
Prices were calculated for the different species, initialforecast conditions, and management controls. The ap-proach is described in more detail in the Appendix, butcan be summarized qualitatively as follows. The currentpopulation size and the biological parameters controllingthe population dynamics are uncertain. Probability dis-tributions for these variables were obtained by applying
Conservation Letters, May/June 2014, 7(3), 196–207 C©2013 The Authors. Conservation Letters published by Wiley Periodicals, Inc. 197
Environmental derivatives L.R. Little et al.
a statistical estimation procedure based on historical ob-servations. A large random sample from these probabil-ity distributions was used to initialize an ensemble of in-dependent simulations. For each ensemble member, wesimulated not only the population trajectory as definedby the biological model and its parameterization, but alsothe application of each management control. This gave atime series of the underlying population size, and a par-allel time series of the estimated population size derivedfrom the estimation component of the management con-trol, because in a real world situation managers wouldnot know the “true” population size, but only an esti-mate of it. Derivative prices were calculated as the ex-pected pay-out, based on the ensemble of this estimatedpopulation size and the probability a pay-out would betriggered in any year throughout the contract term.
The pay-out conditions were defined by a financialoption, which gives one party (the contract owner) theoption to exercise the contract under specific conditionsprior to an expiry or “maturity” date, and receive a pay-out from the second party (the contract writer; Hull2009). For conservation management, we assume thecontract owner (management agency) would have the“option” to exercise the contract and receive a pay-outfrom the contract writer if the average spawning biomassis seen to cross the trigger point, or strike, of 20% ofthe undisturbed level, at any time before maturity in 20years, thus initiating recovery efforts. This is analogous toan American-style “put option” contract in financial riskmanagement (Jewson et al. 2005). Prices were calculatedfrom the estimated population size as the expected out-come of a $100 pay-out, and represented the amount thecontract writer would require, as a risk-neutral investor,from the contract owner, to incur the risk of a pay-outshould the population be perceived to have crossed themanagement threshold. Prices were also calculated onthe underlying population to show the effect of error inthe population estimate on the derivative price.
In weather derivatives and financial options contracts,pay-out is usually proportional to the difference betweenthe trigger and the asset state (Jewson et al. 2005; Hull2009). Thus, an asset that falls to 19% of the undisturbedlevel would have a lower pay-out than if the asset fell to15%, assuming a trigger point of 20%. Consequently, thecontract owner has the choice or “option” either to exer-cise the contract and take the pay-out, or not, and waitin the hope that the asset declines further. The difficultywith this type of option when applied to natural assets isthat it provides a perverse incentive to contract ownerswho might try to maximize their pay-out by waiting forthe asset to decline further below the trigger point beforeexercising the contract. A derivative contract based on aconstant pay-out as we have specified (Appendix) would
not lead to this behavior because there would be no fi-nancial incentive for the contract owner to wait for theasset to fall further.
Results
School whiting
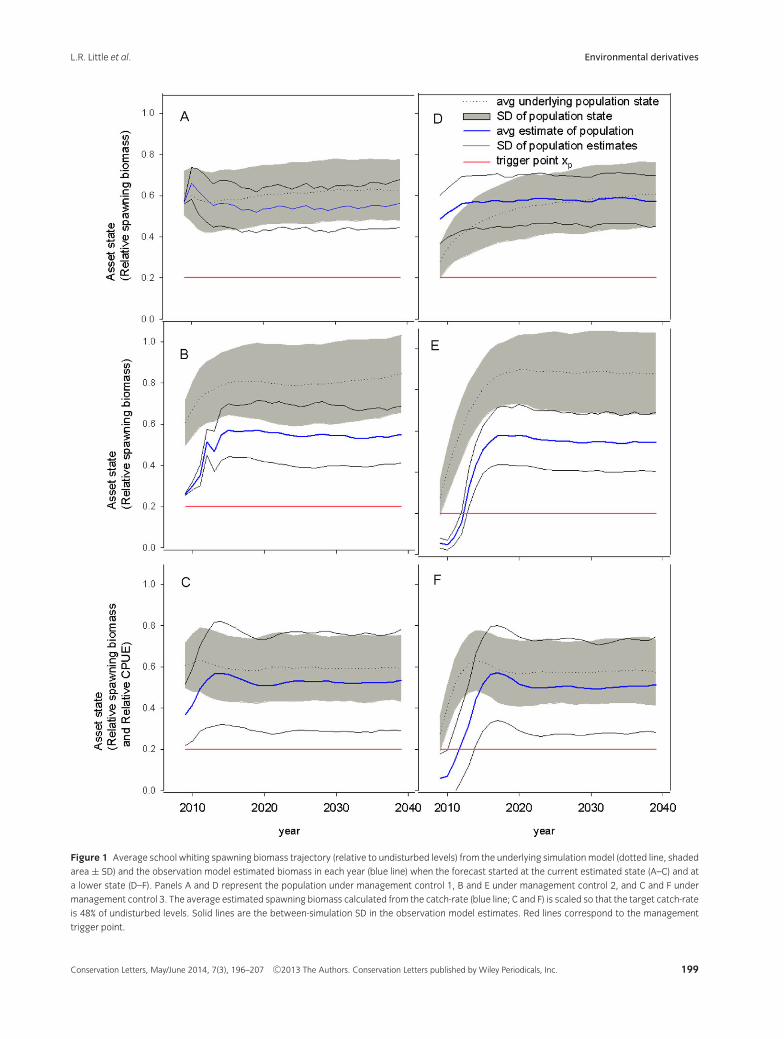
The simulation results suggested all three controls arereasonably robust, in the sense that the ensemble meanof the “true” biomass is maintained above 60% of undis-turbed levels, and the ensemble mean minus one en-semble standard deviation still stays above the triggerlevel of 20%, at least when starting from observed levels(Figure 1A-C). When initial mean population levels areartificially lowered to 30% of undisturbed levels, themanagement controls all lead to recovery of meanbiomass to levels of 60% or higher (Figure 1D-F). Notethat management control 2 is more conservative, andtends to maintain spawning population at around 80%of undisturbed levels.
For management control 1, the mean estimated pop-ulation size was under-estimated in the long-term whenforecast from the initial estimated state (Figure 1A). Incontrast, it converged to the actual underlying state whenthe initial mean population levels were artificially low-ered (Figure 1D). The reason for the difference is thatthe observation model interpreted the initial 2009 reduc-tion in Figure 1D as a stochastic deviation resulting in alower 2009 estimate than in Figure 1(A). Other data thatcame through to the observation model in Figure 1(D),however, indicated increasing productivity in the under-lying population, which led to an estimate that increasedthrough the projection period eventually coinciding withthe actual underlying population state.
Management control 2 substantially under-estimatedthe population because the estimation procedure in-volved estimating the age-structure of the species, whichconsists of relatively few ages. Management control 3only slightly under-estimated the true biomass level, butwas much more variable because it relies on a simple in-dex that is assumed to be proportional to abundance. Asa result, the line marking the estimated mean less 1 stan-dard deviation is quite close to the trigger level in Figure1C. When the initial biomass was artificially lowered, themean initial estimates from management controls 2 and3 all fell below the trigger level, indicating a high proba-bility of the need for recovery efforts
Tiger flathead
Management control 1 tended to maintain average “true”biomass at around 50% of undisturbed levels, with the
198 Conservation Letters, May/June 2014, 7(3), 196–207 C©2013 The Authors. Conservation Letters published by Wiley Periodicals, Inc.
L.R. Little et al. Environmental derivatives
Figure 1 Average school whiting spawning biomass trajectory (relative to undisturbed levels) from the underlying simulation model (dotted line, shaded
area ± SD) and the observation model estimated biomass in each year (blue line) when the forecast started at the current estimated state (A–C) and at
a lower state (D–F). Panels A and D represent the population under management control 1, B and E under management control 2, and C and F under
management control 3. The average estimated spawning biomass calculated from the catch-rate (blue line; C and F) is scaled so that the target catch-rate
is 48% of undisturbed levels. Solid lines are the between-simulation SD in the observation model estimates. Red lines correspond to the management
trigger point.
Conservation Letters, May/June 2014, 7(3), 196–207 C©2013 The Authors. Conservation Letters published by Wiley Periodicals, Inc. 199
Environmental derivatives L.R. Little et al.
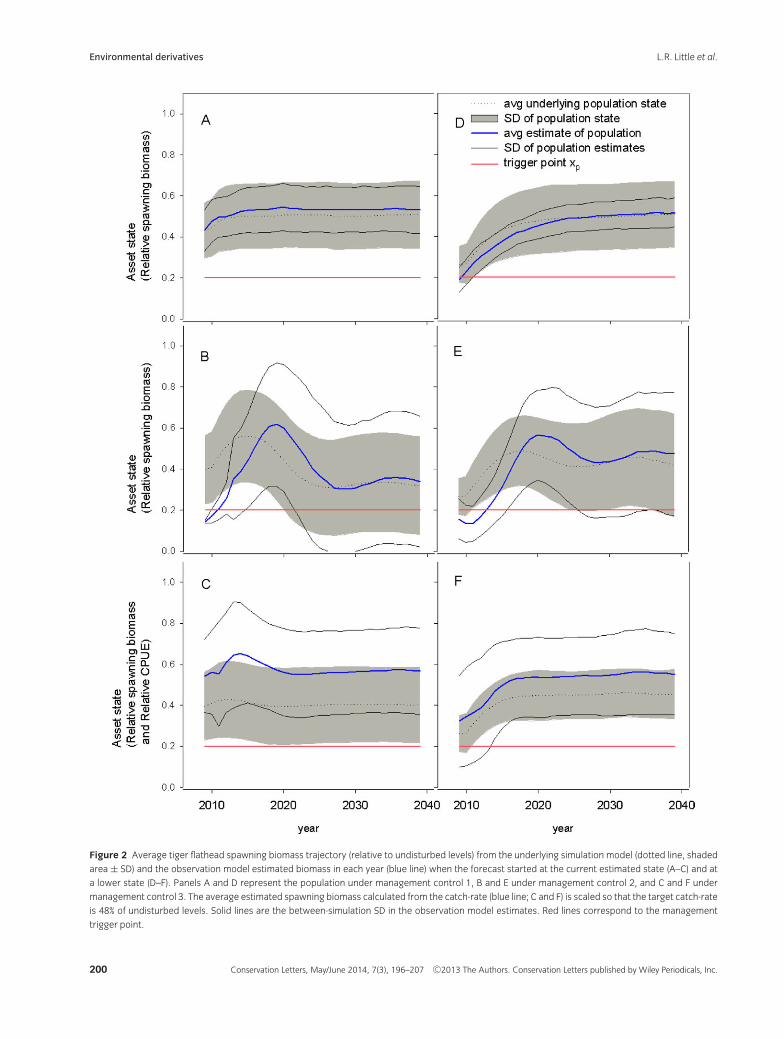
Figure 2 Average tiger flathead spawning biomass trajectory (relative to undisturbed levels) from the underlying simulation model (dotted line, shaded
area ± SD) and the observation model estimated biomass in each year (blue line) when the forecast started at the current estimated state (A–C) and at
a lower state (D–F). Panels A and D represent the population under management control 1, B and E under management control 2, and C and F under
management control 3. The average estimated spawning biomass calculated from the catch-rate (blue line; C and F) is scaled so that the target catch-rate
is 48% of undisturbed levels. Solid lines are the between-simulation SD in the observation model estimates. Red lines correspond to the management
trigger point.
200 Conservation Letters, May/June 2014, 7(3), 196–207 C©2013 The Authors. Conservation Letters published by Wiley Periodicals, Inc.
L.R. Little et al. Environmental derivatives
mean less one standard deviation above the 20% triggerlevel (Figure 2A). The observation model slightly over-estimated biomass, but seemed to be more sensitive to adecrease in initial biomass (Figure 2D). Management con-trols 2 and 3 were less robust for this species, with meantrue biomass declining to around 40% or less of undis-turbed levels, and the mean less one standard deviationat or below the trigger level (Figure 2B and C). Biomassestimates were highly variable for management control2 (Figure 2B and E). The biomass was greatly over-estimated for management control 3 (Figure 2 C and F),mainly because the analysis procedure is not a formal sta-tistical estimate, but instead relies on a general heuristic.
Prices
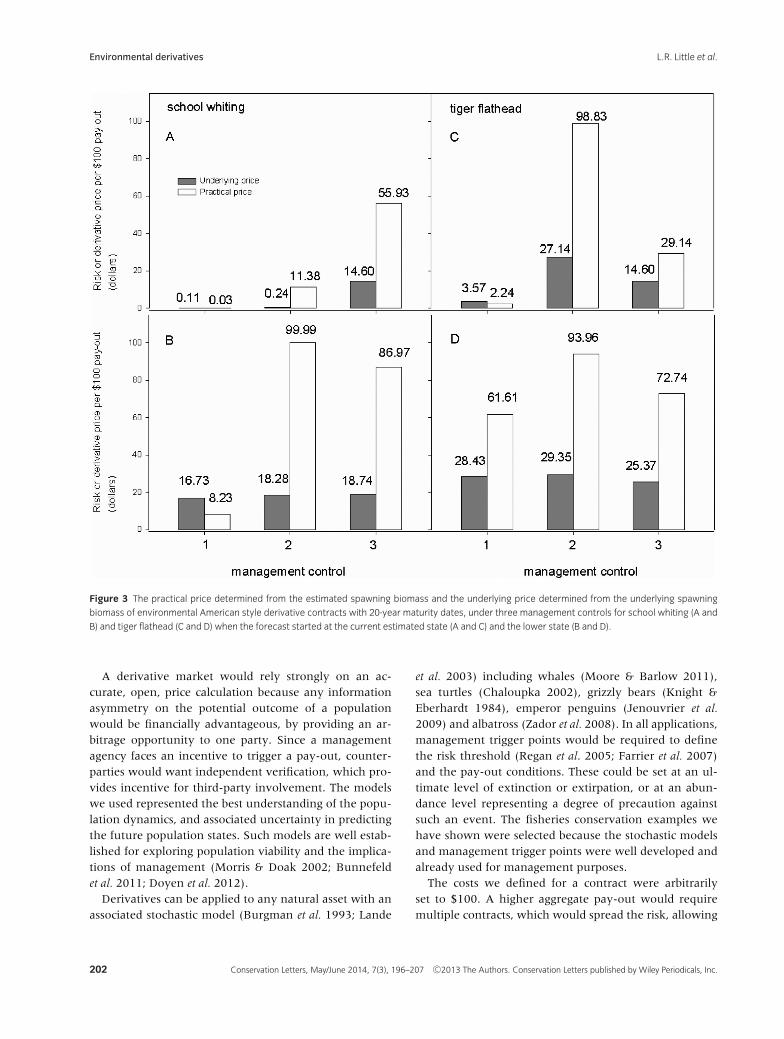
Several estimates of the underlying population were con-sistently biased. School whiting under management con-trol 2, for example, showed the greatest under-estimatedstatus (Figure 1B and E). Biases in population estimateswill lead to distortions in price, and potential “errors”in management, triggering payouts and rebuilding whenthey are not necessary, or failing to trigger rebuildingwhen it is needed. The effect of these biases on deriva-tive prices can be shown by comparing derivative pricescalculated from the estimated biomass that would be usedin practice (i.e., the practical price; Figure 3), with deriva-tive prices calculated from the underlying biomass (i.e.,the underlying price; Figure 3), on which the estimateswere based.
Derivative prices ranged between $0.03 and close to$99.99, depending on the species, initial conditions andmanagement control (Figure 3). A price of $100 is thetheoretically maximum price, signifying the populationis expected to cross the trigger point and initiate a $100pay-out immediately and with 100% certainty. All priceswere less than this maximum, but four cases gave pricesabove $85 (Figure 3) because the average estimatedspawning biomass started below the 20% threshold(Figures 1E and F, 2B and E).
Risk-management tradeoffs
The prices shown in Figure 3 show the interactive effectsof species dynamics (school whiting, tiger flathead), ini-tial state (current best estimate, artificially lowered) andmanagement control method. As expected, higher pricesresult when the initial biomass is lower, because the prob-ability of triggering a payout is higher. Nevertheless, thereis a strong interaction with management control. For in-stance, management control 1 leads to lower practicalprices than management controls 2 and 3 under almostall conditions. It is also more expensive to implement.
The penalties for using “cheap” management controls, interms of higher contract prices or “insurance premiums,”therefore would be substantial.
Management control 1 offers a price advantage (lowerrisk) for both species when forecast from the current bestestimate of the state, suggesting that the “true” biomassis more likely to stay above the trigger point (Figure 3Aand C). There is little or no difference in the underly-ing price among management controls when the fore-casts start from a lower initial state, suggesting that thedifferences in practical prices are due to differences in themanagement controls, particularly the bias and spread inthe biomass estimates (Figure 3B and D).
Discussion
Conservation management must address many risks.There is the conservation risk that a population has fallenbelow a threshold, and there is the financial risk thatrestoration and recovery efforts require financial sup-port. Risk is generally regarded as being composed of twoparts: the probability of an event, and its consequence.We calculated the conservation risk of crossing a man-agement trigger point in the derivative prices, as the ex-pected cost. Probability was captured using a statisticallyfitted, process-based, population dynamics model, pro-jected stochastically under different management con-trols. The consequence of the event was based on the fi-nancial risk management concept of a put option, whichspecifies a pay-out to be exercised if the asset falls belowthe trigger level.
The derivative prices we calculated have a natural ex-tension to a risk market. We suggest that derivatives,specifically the environmental put options defined here,could be used in a risk market to hedge against the risk ofunforeseen environmental events.
The obvious direct purpose of an environmentalderivative market is to address the financial risk associ-ated with conservation management. A market in envi-ronmental put options would operate to transfer the fi-nancial risk of recovery, which can be large, to investorswilling to bear it. It also creates a class of investors with afinancial incentive in the conservation status of the pop-ulation (Mandel et al. 2010).
By providing a funding source, an environmentalderivatives market would more likely result in manage-ment intervention, if it is needed. Currently, in the ab-sence of such a fund, recovery efforts require unbud-geted expenditure from government, or foregone incomeand potentially prolonged, severe losses to those that relyon the asset, two outcomes with strong opposition. Thefailure to implement these efforts, however, would resultin further asset degradation.
Conservation Letters, May/June 2014, 7(3), 196–207 C©2013 The Authors. Conservation Letters published by Wiley Periodicals, Inc. 201
Environmental derivatives L.R. Little et al.
Figure 3 The practical price determined from the estimated spawning biomass and the underlying price determined from the underlying spawning
biomass of environmental American style derivative contracts with 20-year maturity dates, under three management controls for school whiting (A and
B) and tiger flathead (C and D) when the forecast started at the current estimated state (A and C) and the lower state (B and D).
A derivative market would rely strongly on an ac-curate, open, price calculation because any informationasymmetry on the potential outcome of a populationwould be financially advantageous, by providing an ar-bitrage opportunity to one party. Since a managementagency faces an incentive to trigger a pay-out, counter-parties would want independent verification, which pro-vides incentive for third-party involvement. The modelswe used represented the best understanding of the popu-lation dynamics, and associated uncertainty in predictingthe future population states. Such models are well estab-lished for exploring population viability and the implica-tions of management (Morris & Doak 2002; Bunnefeldet al. 2011; Doyen et al. 2012).
Derivatives can be applied to any natural asset with anassociated stochastic model (Burgman et al. 1993; Lande
et al. 2003) including whales (Moore & Barlow 2011),sea turtles (Chaloupka 2002), grizzly bears (Knight &Eberhardt 1984), emperor penguins (Jenouvrier et al.
2009) and albatross (Zador et al. 2008). In all applications,management trigger points would be required to definethe risk threshold (Regan et al. 2005; Farrier et al. 2007)and the pay-out conditions. These could be set at an ul-timate level of extinction or extirpation, or at an abun-dance level representing a degree of precaution againstsuch an event. The fisheries conservation examples wehave shown were selected because the stochastic modelsand management trigger points were well developed andalready used for management purposes.
The costs we defined for a contract were arbitrarilyset to $100. A higher aggregate pay-out would requiremultiple contracts, which would spread the risk, allowing
202 Conservation Letters, May/June 2014, 7(3), 196–207 C©2013 The Authors. Conservation Letters published by Wiley Periodicals, Inc.
L.R. Little et al. Environmental derivatives
more parties to participate. The total number of such con-tracts would depend on several factors, including the di-rect costs of restoring the asset, and the potential losses ineconomic returns (e.g., tourism) and ecosystem servicesincurred from crossing the threshold.
Even if a functional derivatives market operated tomanage the financial risk associated with conservation,the question remains as to whether a derivatives mar-ket could actually reduce conservation risk by reducingthe probability of an asset crossing a threshold. We be-lieve that a derivatives market would achieve this byclearly quantifying the effects of management. Typically,the costs of investment in management are relativelyclear, but the benefits are frequently left unquantified.A market with a suitable method for computing deriva-tive prices, of the kind presented here, would strongly pe-nalize high risk management activities, including under-investment in monitoring and assessment, by attachinghigh derivative prices to them. In principle, with appro-priate regulation and compliance measures, this couldbe sufficient to reduce conservation risk. If, for exam-ple, marine fisheries were required to take out deriva-tive protection against over-use with derivative pricesbased on the projected management strategy, and pay-out conditional on compliance with the strategy, thenthe financial penalty for using poor, high-risk manage-ment, and data collection strategies, or for not complyingwith more rigorous strategies, would be severe. Verifiedcompliance with a management strategy would preventmanagement from engaging in moral hazard, and takingincreased risks, in the assurance or hope of a financialpay-out (Mumford et al. 2009).
We acknowledge that environmental derivativeswould be difficult to apply to all natural assets. A mar-ket requires affordable prices for management agencies,which implies that the risk of the asset crossing thethreshold should not be excessive. The trade-off betweenhigh derivative prices and the cost of effective manage-ment and monitoring implies that natural assets withhighly variable or uncertain population dynamics, or highmanagement and monitoring costs would probably notbe affordable to management agencies. Such cases wheresophisticated management procedures are too costly, andweak management results in expensive derivative prices,would nevertheless indicate that economic and conserva-tion objectives are not reconcilable.
The biggest difference between the use of derivativesin environmental management described here and theuse in financial markets is that the state of the under-lying natural asset is not certain, whereas the state of anunderlying asset in a financial market is typically knownwith great certainty through the market price. The conse-quences for an environmental derivatives market are that
errors can be made in exercising a contract based on theperceived status (Mapstone 1995). For example, the per-ceived status could be below the trigger level when theactual status is above it, or alternatively the status mayappear to be above the trigger when in fact it is below.This discrepancy is indicated in our example as the differ-ence between the underlying and practical prices. In thereal world, only the practical price, calculated from theestimated state of the underlying asset, would be avail-able, without any knowledge of how accurately it wouldmeasure the risk.
To reduce the danger of such errors, trigger levels andpayout conditions could be adjusted to achieve an agreedlevel of precaution. Conservation objectives often consistof both a threshold and a tolerance level (Mapstone et al.2008), with tolerance defined in terms of a probability thethreshold will not be crossed. In our example, we defineda threshold of 20% of the undisturbed state, and the tol-erance was considered as the average biomass from thesimulations, which represents about the 50th percentile.Increasing the threshold, say to 30%, or reducing the tol-erance to ensure each simulation had only a 5% chanceof crossing the threshold would accordingly increase thederivative price. For tiger flathead under managementcontrol 1 and assumed to be at the currently estimatedstate, the price of a contract would increase from $2.24to $7.99 for the increased threshold, and $52.20 for thereduced tolerance.
The derivative prices we calculated quantified the riskassociated with available management controls. In gen-eral, the most data- and computationally demanding,and potentially most costly, management control resultedin lower prices or risk values. A comparison of thesemanagement strategies in terms of implementation costswould allow for a detailed risk-cost trade-off analysis thatis typically not undertaken by management (Restrepoet al. 1992; Goldstein et al. 2008; Dowling et al. 2013). Wefind that the environmental derivative price is a leadingindicator of the current and future health of an environ-mental asset, and a valuable and quantifiable key perfor-mance indicator for managers.
Acknowledgments
We would like to acknowledge the CSIRO condor cycleharvesting system for the computing capability to com-plete this work. Funding was provided by the CSIROWealth from Oceans Flagship. Rich Hillary and FabioBoschetti are thanked for comments on earlier versions ofthe manuscript. The manuscript was also improved basedon comments from the editors and several anonymousreviewers.
Conservation Letters, May/June 2014, 7(3), 196–207 C©2013 The Authors. Conservation Letters published by Wiley Periodicals, Inc. 203
Environmental derivatives L.R. Little et al.
Appendix
Since actual recovery costs are difficult to estimate, andare species- and situation-specific, a standard payout wasset to $100. The prices we calculate therefore reflect thepayment price the investor would require for each $100promised in pay-out, should the asset cross the triggerpoint prompting recovery operations.
Forecast results
Prices were calculated based on an ensemble of 1,000stochastic projections from a simulation model of twofish species in the Australian Southern and Eastern Scale-fish and Shark Fishery (SESSF), subject to managementcontrol procedures in a management strategy evalua-tion framework (cf. Bunnefeld et al. 2011). Two scenarioswere examined to explore the effect of the initial popula-tion state on the derivative price:
(1) Forecasts started at the current estimate of state, or(2) Forecasts started from a lower initial state con-
structed by artificially increasing historical exploita-tion rates.
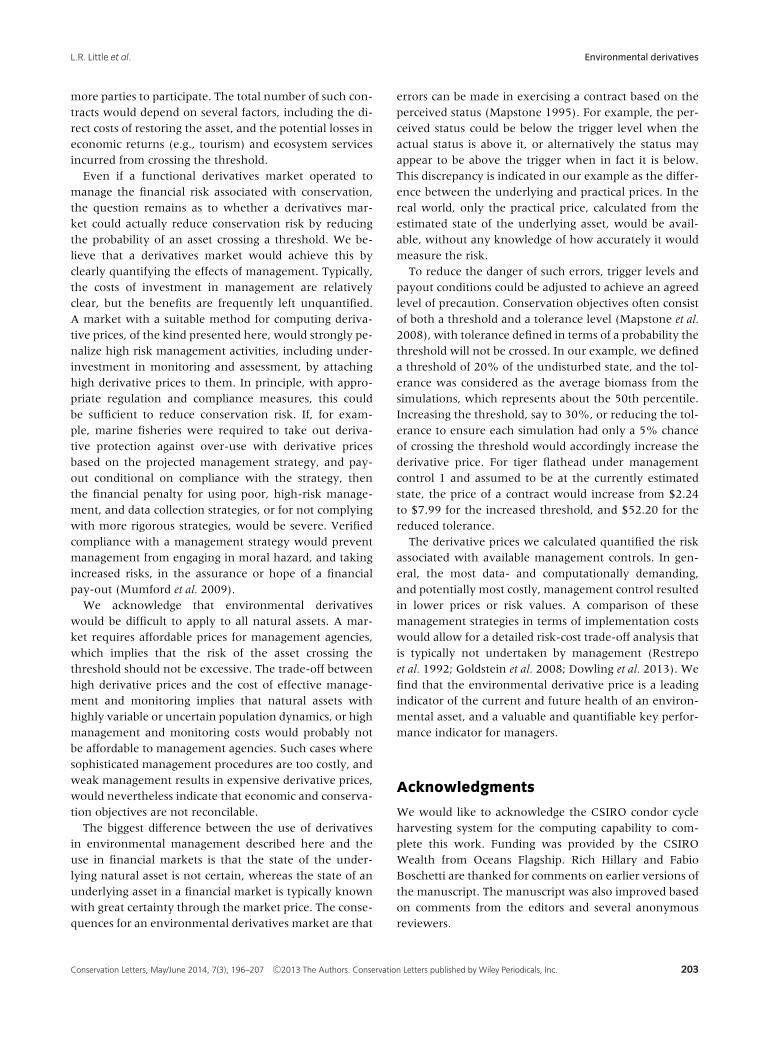
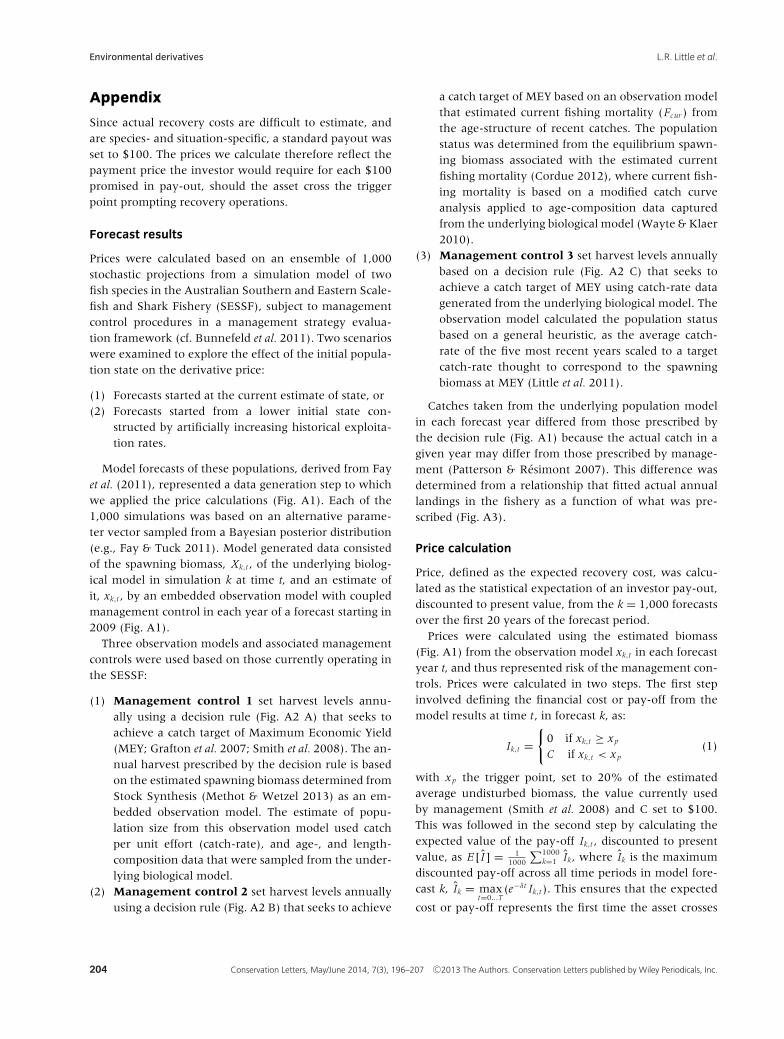
Model forecasts of these populations, derived from Fayet al. (2011), represented a data generation step to whichwe applied the price calculations (Fig. A1). Each of the1,000 simulations was based on an alternative parame-ter vector sampled from a Bayesian posterior distribution(e.g., Fay & Tuck 2011). Model generated data consistedof the spawning biomass, Xk,t , of the underlying biolog-ical model in simulation k at time t, and an estimate ofit, xk,t , by an embedded observation model with coupledmanagement control in each year of a forecast starting in2009 (Fig. A1).
Three observation models and associated managementcontrols were used based on those currently operating inthe SESSF:
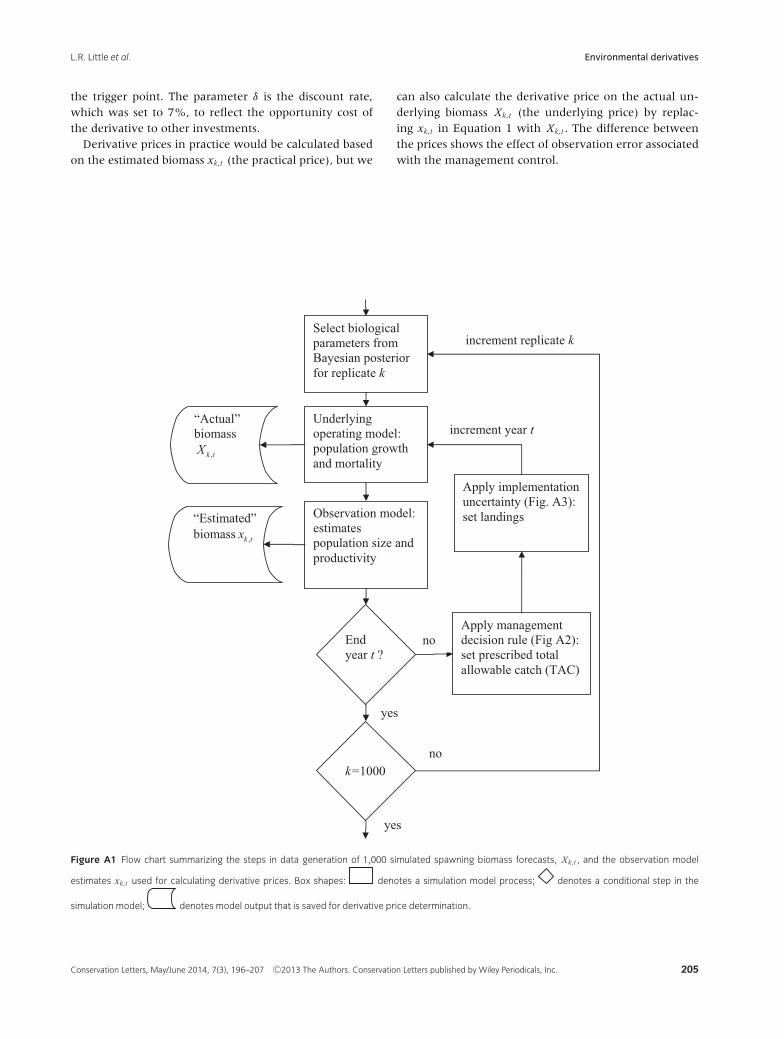
(1) Management control 1 set harvest levels annu-ally using a decision rule (Fig. A2 A) that seeks toachieve a catch target of Maximum Economic Yield(MEY; Grafton et al. 2007; Smith et al. 2008). The an-nual harvest prescribed by the decision rule is basedon the estimated spawning biomass determined fromStock Synthesis (Methot & Wetzel 2013) as an em-bedded observation model. The estimate of popu-lation size from this observation model used catchper unit effort (catch-rate), and age-, and length-composition data that were sampled from the under-lying biological model.
(2) Management control 2 set harvest levels annuallyusing a decision rule (Fig. A2 B) that seeks to achieve
a catch target of MEY based on an observation modelthat estimated current fishing mortality (Fc ur ) fromthe age-structure of recent catches. The populationstatus was determined from the equilibrium spawn-ing biomass associated with the estimated currentfishing mortality (Cordue 2012), where current fish-ing mortality is based on a modified catch curveanalysis applied to age-composition data capturedfrom the underlying biological model (Wayte & Klaer2010).
(3) Management control 3 set harvest levels annuallybased on a decision rule (Fig. A2 C) that seeks toachieve a catch target of MEY using catch-rate datagenerated from the underlying biological model. Theobservation model calculated the population statusbased on a general heuristic, as the average catch-rate of the five most recent years scaled to a targetcatch-rate thought to correspond to the spawningbiomass at MEY (Little et al. 2011).
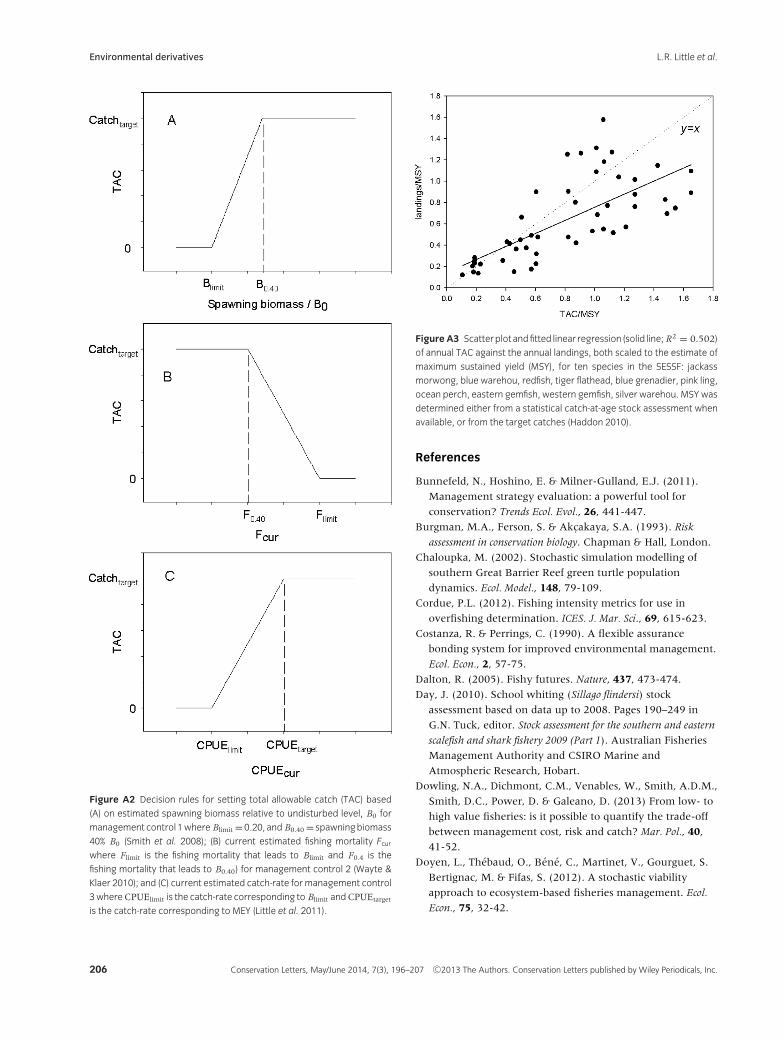
Catches taken from the underlying population modelin each forecast year differed from those prescribed bythe decision rule (Fig. A1) because the actual catch in agiven year may differ from those prescribed by manage-ment (Patterson & Resimont 2007). This difference wasdetermined from a relationship that fitted actual annuallandings in the fishery as a function of what was pre-scribed (Fig. A3).
Price calculation
Price, defined as the expected recovery cost, was calcu-lated as the statistical expectation of an investor pay-out,discounted to present value, from the k = 1,000 forecastsover the first 20 years of the forecast period.
Prices were calculated using the estimated biomass(Fig. A1) from the observation model xk,t in each forecastyear t, and thus represented risk of the management con-trols. Prices were calculated in two steps. The first stepinvolved defining the financial cost or pay-off from themodel results at time t , in forecast k, as:
Ik,t ={
0 if xk,t ≥ x p
C if xk,t < x p(1)
with x p the trigger point, set to 20% of the estimatedaverage undisturbed biomass, the value currently usedby management (Smith et al. 2008) and C set to $100.This was followed in the second step by calculating theexpected value of the pay-off Ik,t , discounted to presentvalue, as E[ I ] = 1
1000
∑1000k=1 Ik, where Ik is the maximum
discounted pay-off across all time periods in model fore-cast k, Ik = max
t=0...T(e−δt Ik,t ). This ensures that the expected
cost or pay-off represents the first time the asset crosses
204 Conservation Letters, May/June 2014, 7(3), 196–207 C©2013 The Authors. Conservation Letters published by Wiley Periodicals, Inc.
L.R. Little et al. Environmental derivatives
the trigger point. The parameter δ is the discount rate,which was set to 7%, to reflect the opportunity cost ofthe derivative to other investments.
Derivative prices in practice would be calculated basedon the estimated biomass xk,t (the practical price), but we
can also calculate the derivative price on the actual un-derlying biomass Xk,t (the underlying price) by replac-ing xk,t in Equation 1 with Xk,t . The difference betweenthe prices shows the effect of observation error associatedwith the management control.
Underlyingoperating model: population growth and mortality
Observation model: estimates population size and productivity
Apply management decision rule (Fig A2): set prescribed total allowable catch (TAC)
Apply implementation uncertainty (Fig. A3): set landings
Endyear t ?
“Actual”biomass
,k tX
“Estimated” biomass ,k tx
no
yes
Select biological parameters from Bayesian posterior for replicate k
k=1000no
yes
increment year t
increment replicate k
Figure A1 Flow chart summarizing the steps in data generation of 1,000 simulated spawning biomass forecasts, Xk,t , and the observation model
estimates xk,t used for calculating derivative prices. Box shapes: denotes a simulation model process; denotes a conditional step in the
simulation model; denotes model output that is saved for derivative price determination.
Conservation Letters, May/June 2014, 7(3), 196–207 C©2013 The Authors. Conservation Letters published by Wiley Periodicals, Inc. 205
Environmental derivatives L.R. Little et al.
Figure A2 Decision rules for setting total allowable catch (TAC) based
(A) on estimated spawning biomass relative to undisturbed level, B0 for
management control 1where Blimit =0.20, and B0.40 = spawningbiomass
40% B0 (Smith et al. 2008); (B) current estimated fishing mortality Fcurwhere Flimit is the fishing mortality that leads to Blimit and F0.4 is the
fishing mortality that leads to B0.40) for management control 2 (Wayte &
Klaer 2010); and (C) current estimated catch-rate for management control
3whereCPUElimit is the catch-rate corresponding to Blimit andCPUEtarget
is the catch-rate corresponding to MEY (Little et al. 2011).
Figure A3 Scatterplot andfitted linear regression (solid line; R2 = 0.502)
of annual TAC against the annual landings, both scaled to the estimate of
maximum sustained yield (MSY), for ten species in the SESSF: jackass
morwong, blue warehou, redfish, tiger flathead, blue grenadier, pink ling,
ocean perch, eastern gemfish, western gemfish, silver warehou. MSY was
determined either from a statistical catch-at-age stock assessment when
available, or from the target catches (Haddon 2010).
References
Bunnefeld, N., Hoshino, E. & Milner-Gulland, E.J. (2011).
Management strategy evaluation: a powerful tool for
conservation? Trends Ecol. Evol., 26, 441-447.
Burgman, M.A., Ferson, S. & Akc¶akaya, S.A. (1993). Risk
assessment in conservation biology. Chapman & Hall, London.
Chaloupka, M. (2002). Stochastic simulation modelling of
southern Great Barrier Reef green turtle population
dynamics. Ecol. Model., 148, 79-109.
Cordue, P.L. (2012). Fishing intensity metrics for use in
overfishing determination. ICES. J. Mar. Sci., 69, 615-623.
Costanza, R. & Perrings, C. (1990). A flexible assurance
bonding system for improved environmental management.
Ecol. Econ., 2, 57-75.
Dalton, R. (2005). Fishy futures. Nature, 437, 473-474.
Day, J. (2010). School whiting (Sillago flindersi) stock
assessment based on data up to 2008. Pages 190–249 in
G.N. Tuck, editor. Stock assessment for the southern and eastern
scalefish and shark fishery 2009 (Part 1). Australian Fisheries
Management Authority and CSIRO Marine and
Atmospheric Research, Hobart.
Dowling, N.A., Dichmont, C.M., Venables, W., Smith, A.D.M.,
Smith, D.C., Power, D. & Galeano, D. (2013) From low- to
high value fisheries: is it possible to quantify the trade-off
between management cost, risk and catch? Mar. Pol., 40,
41-52.
Doyen, L., Thebaud, O., Bene, C., Martinet, V., Gourguet, S.
Bertignac, M. & Fifas, S. (2012). A stochastic viability
approach to ecosystem-based fisheries management. Ecol.
Econ., 75, 32-42.
206 Conservation Letters, May/June 2014, 7(3), 196–207 C©2013 The Authors. Conservation Letters published by Wiley Periodicals, Inc.

L.R. Little et al. Environmental derivatives
Farrier, D., Whelan, R. & Mooney, C. (2007). Threaten
species listing as a trigger for conservation action. Environ.
Sci. Pol., 10, 219-229.
Fay, G., Punt, A.E. & Smith, A.D.M. (2011). Impacts of spatial
uncertainty on performance of age structure-based harvest
strategies for blue eye trevalla (Hyperoglyphe antarctica).
Fish. Res., 110, 391-407.
Fay, G. & Tuck, G. (2011). Development of a multi-gear spatially
explicit assessment and management strategy evaluation for the
Macquarie Island Patagonian toothfish fishery. Australian
Fisheries Management Authority and CSIRO Marine and
Atmospheric Research, Wealth from Oceans Flagship,
Hobart, Australia, pp. 178.
Fenichel, E., Tsao, J.I., Jones, M.L. & Hickling, G.L. (2008).
Real options for precautionary fisheries management. Fish
Fish., 9, 121-137.
Goldstein, J.H., Pejchar, L. & Daily, G.C. (2008). Using
return-on-investment to guide restoration: a case study
from Hawaii. Conserv. Lett., 1, 236-243.
Grafton, R.Q., Kompas T. & Hilborn R. (2007). Economics of
overexploitation revisited. Science, 318, 1601.
Haddon, M. (2010). Tier 4 Analyses 1986–2009. Report to
Australian Fisheries Management Authority, Canberra.
Holl, K.D. & Howarth, R.B. (2000). Paying for restoration.
Restor. Ecol., 8, 260–267.
Hull, J.C. (2009). Options, futures, and other derivatives, 7th ed.
Pearson Prentice Hall, Upper Saddle River, New Jersey.
Jenouvrier, S., Barbraud, C., Weimerskirch, H. & Caswell, H.
(2009). Limitation of population recovery: a stochastic
approach to the case of the emperor penguin. Oikos, 118,
1292-1298.
Jewson, S., Brix, A. & Ziehmann, C. (2005). Weather derivative
valuation: the meteorological, statistical and mathematical
foundations. Cambridge University Press, Cambridge.
Klaer, N. (2010). Tiger flathead (Neopltycephalus richardsoni)
stock assessment based on data up to 2008. Pages 164–189
in G.N. Tuck, editor. Stock assessment for the southern and
eastern scalefish and shark fishery 2009 (Part 1). Australian
Fisheries Management Authority and CSIRO Marine and
Atmospheric Research, Hobart.
Knight, R.R. & Eberhardt, L.L. (1984). Projected futire
abundance of the Yellowstone Grizzly Bear. J. Wildl.
Manage., 48, 1434-1438.
Lande, R., Engen, S. & Sæther, B.-E. (2003). Stochastic
dynamics in ecology and conservation. Oxford University Press,
New York.
Little, L.R., Wayte, S.E., Tuck, G.N., Smith, A.D.M., Klaer, N.,
Haddon, M., Punt, A.E., Thomson, R., Day, J. & Fuller M.
(2011). Development and evaluation of a cpue-based
harvest control rule for the southern and eastern scalefish
and shark fishery of Australia. ICES. J. Mar. Sci., 68,
1699-1705.
Mandel, J.T., Donlan, C.J. & Armstrong J. (2010). A
derivative approach to endangered species conservation.
Front. Ecol. Environ., 8, 44-49.
Mandel, J.T., Donlan, C.J., Wilcox, C., Cudney-Bueno, R.,
Pascoe, S. & Tulchin, D. (2009). Debt investment as a tool
for value transfer in biodiversity conservation. Conserv. Lett.,
2, 233-239.
Mapstone, B.D. (1995). Scalable decision rules for
environmental-impact studies—effect size, Type-I, and
Type-II errors. Ecol. Appl., 5, 401-410.
Mapstone, B.D., Little, L.R., Punt, A.E., Davies, C.R., Smith,
A.D.M., Pantus, F., McDonald, A.D., Williams, A.J. &
Jones, A. (2008). Management strategy evaluation for line
fishing in the Great Barrier Reef: balancing conservation
and multi-sector fishery objectives. Fish. Res., 94, 315-
329.
Methot, R.D. & Wetzel, C.R. (2013). Stock synthesis: A
biological and statistical framework for fish stock
assessment and fishery management. Fish. Res., 142, 86-99.
Moore, J. E. & Barlow, J. (2011). Bayesian state-space model
of fin whale abundance trends from a 1991–2008 time
series of line-transect surveys in the California Current. J.
Appl. Ecol., 48, 1195-1205.
Morris, W.F. & Doak, D.F. (2002). Quantitative conservation
biology: the theory and practice of population viability analysis.
Sinauer Associates, Sunderland, MA.
Mumford, J.D., Leach, A.W., Levontin, P. & Kell, L.T. (2009).
Insurance mechanisms to mediate economic risks in
marine fisheries. ICES. J. Mar. Sci., 66, 950-959.
Patterson, K. & Resimont, M. (2007). Change and stability in
landing: the responses of fisheries to scientific advice and
TACs. ICES. J. Mar. Sci., 64, 714-717.
Regan, H.M., Ben-Haim, Y., Langford, B., Wilson, W.G.,
Lundberg, P., Andelman, S.J. & Burgman, M.A. (2005).
Robust decision-making under severe uncertainty for
conservation management. Ecol. Appl., 15, 1471-1477.
Restrepo, V., Hoenig, J.M., Powers, J.E., Baird, J.W. & Turner
S.C. (1992). A simple simulation approach to risk and cost
analysis, with applications to swordfish and cod fisheries.
Fish. Bull., 90, 736-748.
Salmon, F. (2009). Recipe for disaster: the formula that killed
Wall Street. Wired Magazine, 17, 3 (23 Feb. 2009).
Sethi, S.A. (2010). Risk management for fisheries. Fish. Fish.,
11, 341-365.
Sethi, S.A., Dalton, M. & Hilborn, R. (2012). Quantitative risk
measures applied to Alaskan commercial fisheries. Can. J.
Fish. Aquat. Sci., 69, 487-498.
Smith, A.D.M., et al. (2008). Experience in implementing
harvest strategies in Australia’s south-eastern fisheries.
Fish. Res., 94, 373-379.
Sullivan, S. (2013). Banking Nature? The spectacular
financialisation of environmental conservation. Antipode,
45, 198-217.
Wayte, S.E. & Klaer, N.L. (2010). An effective harvest strategy
using improved catch-curves. Fish. Res., 106, 310-320.
Zador, S.G., Punt, A.E. & Parrish, J.K. (2008). Population
impacts of endangered short-tail albatross bycatch in the
Alaskan trawl fishery. Biol. Conserv., 141, 872–882.
Conservation Letters, May/June 2014, 7(3), 196–207 C©2013 The Authors. Conservation Letters published by Wiley Periodicals, Inc. 207