entrepreneurship and growth in local, regional and national economies: frontiers in european...
TRANSCRIPT

Entrepreneurship and Growth in Local, Regional and National Economies

Editorial BoardDavid Brooksbank, University of Wales Institute, Cardiff , UKHermann Frank, Vienna University of Economics and Business Administration,
AustriaMark Freel, University of Ottawa, CanadaJonas Gabrielson, Lund University, SwedenTeemu Kautonen, University of Vaasa, FinlandEddy Laveren, University of Antwerp, BelgiumMarie Löwegren, Lund University, SwedenColm O’Gorman, Dublin City University, IrelandJ. Hanns Pichler, Vienna University of Economics and Business Administration,
AustriaPeter Rosa, University of Edinburgh, UK André van Stel, EIM Business and Policy Research, the NetherlandsKashifa Suddle, EIM Business and Policy Research, the NetherlandsJosé Veciana, Autonomous University of Barcelona, SpainFriederike Welter, Jönköping University, Sweden
Entrepreneurship and Growth in Local, Regional and National EconomiesFrontiers in European Entrepreneurship Research
Edited by
David SmallboneProfessor of Small Business and Entrepreneurship, Small Business Research Centre, Kingston University, UK
Hans LandströmProfessor in Business Administration, Institute of Economic Research, School of Economics and Management, Lund University, Sweden
Dylan Jones-EvansDirector of Research and Innovation, University of Wales, UK
IN ASSOCIATION WITH THE ECSB
Edward ElgarCheltenham, UK • Northampton, MA, USA

© David Smallbone, Hans Landström and Dylan Jones-Evans 2009
All rights reserved. No part of this publication may be reproduced, stored in aretrieval system or transmitted in any form or by any means, electronic,mechanical or photocopying, recording, or otherwise without the priorpermission of the publisher.
Published byEdward Elgar Publishing LimitedThe Lypiatts15 Lansdown RoadCheltenhamGlos GL50 2JAUK
Edward Elgar Publishing, Inc.William Pratt House9 Dewey CourtNorthamptonMassachusetts 01060USA
A catalogue record for this bookis available from the British Library
Library of Congress Control Number: 2009930858
ISBN 978 1 84844 592 5
Printed and bound by MPG Books Group, UK
v
Contents
List of contributors viiForeword by Friederike Welter ix
PART I INTRODUCTION
1 Introduction 3 David Smallbone, Hans Landström and Dylan Jones-Evans
PART II REGIONAL PERSPECTIVES ON ENTREPRENEURSHIP
2 Regional innovation, collective entrepreneurship and greenclusters 17
Philip Cooke
3 Determinants of early-stage entrepreneurial activity inEuropean regions: distinguishing low and high ambitionentrepreneurship 49
Niels Bosma and Veronique Schutjens
PART III NEW VENTURE CREATION AND GROWTH
4 Can new ventures develop pioneer behaviour in industrieswith unfavourable conditions? The role of capabilities 81
Pedro M. García-Villaverde and María J. Ruiz-Ortega
5 Switching from paid employment to entrepreneurship: theeff ect on individuals’ earnings 107
Miguel Torres Preto, Rui Baptista and Francisco Lima
6 The fi nancial requirements of early-stage entrepreneurs 126 Colm O’Gorman
7 An examination of the link between growth attitudes andrealized growth 139
Anders Isaksson and Vladimir Vanyushyn
vi Contents
PART IV BUSINESS EXITS
8 Becoming an ex-entrepreneur: fi rm performance and thesell-out or dissolution decision 157
A. Miguel Amaral, Rui Baptista and Francisco Lima
9 The entrepreneur in ‘risk society’: the personal consequences of business failure 184
Colin Mason, Sara Carter and Stephen Tagg
PART V KNOWLEDGE-BASED ENTREPRENEURSHIP
10 The creation of higher education institutions and fi rm entry: a policy evaluation 207
Joana Mendonça, Rui Baptista and Francisco Lima
11 Cooperation with universities and research institutions for corporate entrepreneurship activities: the infl uence of the technology intensity of the environment 231
Ángela González-Moreno and Francisco J. Sáez-Martínez
12 ICT-related small fi rms with diff erent collaborative networkstructures: diff erent species or variations on a theme? 254
Vinit Parida and Mats Westerberg
PART VI ENTREPRENEURSHIP AND SOCIAL INCLUSION
13 Does enterprise discourse have the power to enable or disable deprived communities? 281
Carole Howorth, Caroline Parkinson and Alan Southern
14 Transnationalism, mixed embeddedness and Somali entrepreneurs in Leicester 312
Trevor Jones, Monder Ram and Nicholas Theodorakopoulos
15 The emergence of entrepreneurial potential in transition environments: a challenge for entrepreneurship theory or adevelopmental perspective? 339
Friederike Welter and David Smallbone
Index 361

vii
Contributors
A. Miguel Amaral, Technical University of Lisbon, Portugal
Rui Baptista, Technical University of Lisbon, Portugal
Niels Bosma, Utrecht University, Netherlands
Sara Carter, University of Strathclyde, UK
Philip Cooke, Cardiff University, UK
Pedro M. García-Villaverde, University of Castilla la Mancha, Spain
Ángela González-Moreno, University of Castilla la Mancha, Spain
Carole Howorth, Lancaster University, UK
Anders Isaksson, University of Gothenburg and Umeå University, Sweden
Trevor Jones, De Montfort University, UK
Dylan Jones-Evans, University of Wales, UK
Hans Landström, Lund University, Sweden
Francisco Lima, Technical University of Lisbon, Portugal
Colin Mason, University of Strathclyde, UK
Joana Mendonça, Technical University of Lisbon, Portugal
Colm O’Gorman, Dublin City University, Ireland
Vinit Parida, Luleå University of Technology, Sweden
Caroline Parkinson, Lancaster University, UK
Monder Ram, De Montfort University, UK
María J. Ruiz-Ortega, University of Castilla la Mancha, Spain
Francisco J. Sáez-Martínez, University of Castilla la Mancha, Spain
Veronique Schutjens, Utrecht University, Netherlands
David Smallbone, Kingston University, UK

viii Contributors
Alan Southern, University of Liverpool, UK
Stephen Tagg, University of Strathclyde, UK
Nicholas Theodorakopoulos, De Montfort University, UK
Miguel Torres Preto, Technical University of Lisbon, Portugal
Vladimir Vanyushyn, Umeå University, Sweden
Friederike Welter, Jönköping University, Sweden
Mats Westerberg, Luleå University of Technology, Sweden
ix
Foreword
With this book, the European Council for Small Business and Entrepreneurship (ECSB) presents the fourth volume in a series of papers from the annual Research in Entrepreneurship and Small Business Conference (RENT). RENT XXI was held in Cardiff in November 2007. Since its inauguration in 1996, RENT has grown to become one of Europe’s best known and globally recognized conferences in the entrepre-neurship fi eld. RENT is organized jointly by the European Institute for Advanced Studies in Management (EIASM) and ECSB.
This book assembles selected best papers from RENT XXI, which centred on entrepreneurship and small business development making the diff erence in local, regional and national economies. Besides new venture creation and business exits, the papers in this book look at knowledge-based entrepreneurship and the role entrepreneurship can play related to social inclusion. Each of the papers went through a rigorous selection and review process. I thank the editors and reviewers who assisted in selecting papers, for their great eff ort. With this book and series, ECSB continues to off er a look into current European entrepreneurship research, thus facilitating knowledge transfer and international discussions.
Friederike WelterPresident, ECSB


PART I
Introduction


3
1. IntroductionDavid Smallbone, Hans Landström and Dylan Jones-Evans
INTRODUCTION
This book provides a window on contemporary European entrepreneur-ship and small business research, through a selection of some of the best papers presented at the twenty-fi rst Research in Entrepreneurship (RENT) Conference held in Cardiff in November 2007. The papers selected for inclusion demonstrate the applied nature of entrepreneur-ship research, as well as the various contributions that entrepreneurship can make to local, regional and national development, from both a social and an economic perspective. The papers also reveal the heterogeneity of the fi eld of entrepreneurship, especially in terms of substantive content and the methodologies employed, with both quantitative and qualitative approaches well represented. This heterogeneity partly refl ects diff erent traditions and priorities in diff erent European countries, which has always been part of the attraction and relevance of the RENT conference since its origin in 1986.
Following this introduction, the papers selected for inclusion have been grouped into fi ve main themes: regional perspectives on entrepreneurship; new venture creation and growth; business exits; knowledge-based entre-preneurship; and entrepreneurship and social inclusion. While the divi-sion represents a convenient way of organizing the book, a number of the papers selected contribute to more than one theme. In addition, although RENT is primarily a scientifi c conference, all papers included in this volume have some implications for the contribution of entrepreneurship to economic development at the local, regional and/or national scales.
Although the nature and extent of the contribution of entrepreneurship to economic development is a well-established theme in the fi eld, the papers included in this book off er new insights or perspectives on the topic, with potential implications for both policy makers and academics concerned with theories of entrepreneurship. Regional perspectives on entrepre-neurship are important to policy makers because regional variations in
4 Entrepreneurship and growth
economic development and resources aff ect the needs and priorities of regions from a policy perspective. As well as being at the heart of entrepre-neurship as a fi eld of study, both the level and qualitative characteristics of new venture creation are increasingly seen by policy makers as key factors infl uencing the performance of countries and regions in terms of economic development. Business exit is a topic that has been attracting increasing interest, not least because it is not easily defi ned by many academic studies. There is also growing recognition that entrepreneurial societies require easy exit from, as well as easy entry into, entrepreneurship, if scarce resources are to fl ow from less to more productive activities. Knowledge-based entrepreneurship is at the heart of the European Union’s Lisbon Agenda, with entrepreneurship and innovation as key pillars infl uencing the competitiveness of the European economy in the twenty-fi rst century. Alongside this, entrepreneurship is seen as an important contributor to social cohesion across Europe, although some academics have challenged the evidence base in this regard (Blackburn and Ram, 2006).
REGIONAL PERSPECTIVES ON ENTREPRENEURSHIP
In the fi rst of two chapters explicitly concerned with entrepreneurship at the regional level, Philip Cooke presents new research on ‘green’ entrepreneur-ship, innovation and clusters (Chapter 2). This is the latest in a stream of papers over the last 20 years in which Cooke has argued that the regional level is particularly well suited to supporting the innovation activities of small and medium size enterprises (SMEs), through the myriad of public and private knowledge organizations that make up regional innovation systems. In drawing attention to the variation that exists between countries in political traditions, Cooke describes a concept of collective entrepre-neurship, where the latter is induced at the regional level through subsidy, contrasting with more individualized notions of enterprise that are typically part of the Anglo-Saxon political tradition. The emergence of clusters is presented as a topic where the role of collective, as well as individual, entre-preneurship may be explored, illustrated with reference to the entrepre-neurial networks that underpinned the emergence of industrial districts.
The core of Cooke’s chapter is concerned with so-called ‘green’ inno-vation and green clusters, which he relates to technological convergence among diverse industries (e.g. biotechnology, ICT and clean technologies) within a particular geographic space. As well as referring to already docu-mented clusters in California (agri-food, horticulture) and Denmark (solar thermal energy, wind turbine production), Cooke describes a recently
Introduction 5
‘discovered’ cluster in Wales, which includes bioenergy from crops and other novel agricultural products. Cooke’s analysis demonstrates the role of small enterprises, as well as some large fi rms, in the emergence of green clusters, together with the importance of an applied and basic research infrastructure, demonstrating the interdependence that exists within the context of regional innovation systems. Emphasizing the need for a multidisciplinary perspective and referring to both North American and European examples of green clusters, Cooke highlights the replication of processes that have historically underpinned industrial districts in the emergence of new economic activities.
In the second chapter in this section on regional perspectives (i.e. Chapter 3), Niels Bosma and Veronique Schutjens focus on the determinants of early-stage entrepreneurship in European regions. Their core proposition is that regional economic development depends on the type, as well as the level, of entrepreneurship. Using 400 000 individual observations from the Global Entrepreneurship Monitor (GEM) database, the authors focus on innovation and growth oriented entrepreneurship at the regional level. The analysis considers regional variations in innovation and growth oriented entrepreneurs, contrasting the pattern of entrepreneurs with and without a growth ambition. The empirical part of the chapter uses data from the GEM study to create indicators of regional entrepreneurial activity (dependent variables) and attitudes (independent variables), with addi-tional regional level variables obtained from other sources. Four types of early stage entrepreneurship are distinguished: non-ambitious, ambitious, high growth and innovative. Analysis of harmonized entrepreneurship data over 225 regions in 18 countries shows diff erences between the four types in terms of their determinants. This has implications for the types of policies that are likely to be eff ective in stimulating diff erent forms of entrepreneurship.
NEW VENTURE CREATION AND GROWTH
Four papers are included in the section on new venture creation and growth. The fi rst, by Pedro García-Villaverde and María Ruiz-Ortega, is concerned with the advantages and risks associated with the entry timing of new ventures (Chapter 4). It is suggested that entry timing is important because of the need to compare windows of opportunity to gain competi-tive advantage and the liabilities of newness. The focus of the study is on the relationship between external environmental conditions and the capa-bilities of new ventures (particularly marketing and managerial capabili-ties), which the authors suggest aff ect entry timing.
6 Entrepreneurship and growth
The results confi rm the interactive eff ects between the capabilities of a new venture, on the one hand, and market conditions on the other, on the timing of market entry. For example, the presence of managerial and marketing capabilities favours pioneer behaviour by new ventures in industries with a high level of imitation. This suggests that such capa-bilities may be used by entrepreneurs to create barriers to impede follower fi rms from reducing fi rst mover advantages. As well as contributing to the literature on industrial organization, the authors identify implications for practitioners and specifi cally owners/managers of new businesses who are interested in assessing if their enterprises have suitable capabilities to take advantage of fi rst mover advantages in unfavourable environmental conditions.
In Chapter 5, Miguel Torres Preto, Rui Baptista and Francisco Lima focus on the choice faced by individuals between paid employment and self-employment, from an economic perspective. While the economic theory of occupational choice suggests that diff erences in expected earn-ings are the main factor infl uencing this choice, this is not fully supported by empirical evidence. In this context, the chapter analyses the earnings of individuals who switch from paid employment to business owner-ship, in comparison with individuals who change fi rms but remain paid employees.
A longitudinal matched employer–employee data set from Portugal is used to investigate the mobility of workers and business owners during the period 1995–2003. Four models are presented to examine the eff ects of switching from paid employment to business ownership on individual incomes. Results suggest a severe income penalty in the short run for indi-viduals who switch from paid employment to self-employment. Overall, the results show that opportunity costs play a signifi cant role in infl uenc-ing whether entering self-employment leads to an increase in earnings in the short run. This is refl ected in observed diff erences between those enter-ing self-employment from paid employment compared with those who were previously unemployed.
The next paper by Colm O’Gorman (Chapter 6) focuses on the fi nancial needs of ‘early-stage’ entrepreneurs, suggesting that international diff er-ences in levels of entrepreneurship may be infl uenced by variations in the level of resources required to start a business. GEM data from 2002–06 are used to identify the mean and median planned fi nancial requirements of early-stage entrepreneurs across nine Euro-zone countries. The results show signifi cant diff erences between countries in the mean level of fi nance required to start a fi rm, although this appears to mainly refl ect a high mean in the Netherlands and a low mean in Spain. More generally, O’Gorman fi nds there are not large diff erences between countries in the anticipated
Introduction 7
total fi nance required for market entry by nascent entrepreneurs. He also fi nds the expected fi nancial requirements of early stage entrepreneurs to be low, with medians ranging from 20 000 to 100 000 euros across the nine countries studied. It should be stressed, however, that these are expected rather than actual start-up costs, since respondents are still at the pre- market or early market entry stage and not all of them will actually continue their eff orts to start a business
In Chapter 7, Anders Isaksson and Vladimir Vanyushyn examine the link between growth attitudes and realized growth, using a conceptual frame drawn from the theory of planned behaviour. The focus of the chapter is an important topic, in view of the growing body of evidence emphasizing the link between an entrepreneur’s motivation and aspira-tions and the growth performance of their enterprises. One of the distin-guishing features of the research design is the attempt to measure attitudes to growth at one point in time and actual growth performance during a later time period. Moreover, unlike many other studies, the approach seeks a representative sample of enterprises rather than focusing on high performing fi rms, or fi rms where there are strong a priori reasons for expecting growth orientation (e.g. high-tech fi rms). As a result, the actual employment growth performance of enterprises during the study period included fi rms experiencing negative growth, as well as fi rms experiencing positive growth; although, not surprisingly perhaps, the majority showed no change in employment. Growth performance was analysed in relation to a four-fold classifi cation of attitudes to growth. The results support the hypothesized link between intentions and outcomes, as stated by the theo-ries of planned behaviour and reasoned action, although the association was weak and the diff erences in growth performance between high and low aspiration groups relatively small. This indicates the need to incorpo-rate other factors when seeking to explain growth performance. In other words, entrepreneurs’ attitudes to growth are important, but should not be considered in isolation.
BUSINESS EXITS
The next two papers deal with diff erent aspects of business exits. Chapter 8 by Miguel Amaral, Rui Baptista and Francisco Lima is concerned with entrepreneurs’ decisions to sell or dissolve their businesses, recognizing that business exit is not necessarily an indication of business failure, since some exit decisions are voluntary. Voluntary exit may be a result of an entrepreneur recognizing either a better business opportunity or more pos-itive occupational prospects in, for example, paid employment. Voluntary
8 Entrepreneurship and growth
exit by an entrepreneur may be achieved through winding up the fi rm or selling it. Part of the context for the chapter is the high proportion of indi-viduals in the Portuguese economy who become entrepreneurs through acquisition, rather than ‘de novo’ start-up, which is refl ected in high rates of business ownership but low start-up rates.
More specifi cally, the chapter investigates diff erences between indi-vidual and fi rm level factors that infl uence the mode of voluntary exit (i.e. sell-out and dissolution), which the authors seek to link to fi rm perform-ance at the time of exit. A large longitudinal matched employer–employee database from Portugal is used to test a typology of voluntary exits, while addressing three key issues: fi rstly, the factors associated with exit from entrepreneurship; secondly, distinguishing features of individuals who exit entrepreneurship by discontinuing a fi rm compared with those who exit by selling the fi rm; and thirdly, how an individual’s decision to sell or close a business relates to the performance of the latter in the market. Results from the logit model estimations for the two diff erent modes of voluntary exit provide support for the hypothesized heterogeneity across forms of exit, in terms of individual and fi rm level characteristics. Interestingly, being the founder of a fi rm appears to impact negatively on the decision to leave the fi rm and exit entrepreneurship. This is interpreted as refl ect-ing the fact that founders have assets that encourage and facilitate their persistence (such as specifi c business and market knowledge and a higher level of intrinsic involvement in the venture) than second or third genera-tion owners. Not surprisingly perhaps, older fi rms are more likely to be the subject of voluntary exit than younger fi rms, with the negative association with the age of enterprise being stronger in the case of dissolution than for sell-out. Similarly, exit through dissolution is negatively associated with a fi rm’s sales revenue, although the relation is not confi rmed in the case of the decision to exit through sell-out.
In contrast to the paper by Amaral and his colleagues, the second chapter in this section, by Colin Mason, Sara Carter and Stephen Tagg, is concerned with business failure, or involuntary exit, focusing on its personal consequences for entrepreneurs (Chapter 9). The chapter is con-cerned with the position of small business owners in a risk society, where risk is equated with the personal fi nancial consequences of the failure of their business. Two key questions are examined: fi rstly, the proportion of small business owners that are highly exposed to personal fi nancial risk; and secondly, how this risk is distributed across diff erent types of busi-ness owners. Data for the study undertaken by Mason and his colleagues were drawn from a large biannual survey of small businesses undertaken on behalf of one of the main membership associations representing small fi rms in the UK. The survey involved almost 19 000 responses,
Introduction 9
and included a question asking respondents for a self-assessment of the consequences of business insolvency. The results showed a marked vari-ation in the perceived consequences of insolvency, ranging from a more restrained lifestyle to more severe eff ects. Detailed analysis showed that entrepreneurs seeking to grow their businesses rapidly are potentially vulnerable to greater personal fi nancial risk. By contrast, owners who are the least exposed to personal fi nancial risk should their businesses fail, typically have little or no household wealth invested in the business, operate from home, and are engaged in service industries with low capital intensity. It is important to emphasize that the chapter is concerned with perceived sources of personal fi nancial risk rather than actual business failure. Nevertheless, the fi ndings have implications for the understand-ing of growth orientation in small fi rms, as well as contributing to the under-researched area of risk.
KNOWLEDGE-BASED ENTREPRENEURSHIP
This section contains three papers concerned with knowledge-based entre-preneurship. The fi rst, by Joana Mendonça, Rui Baptista and Francisco Lima, is a policy oriented investigation of the role of higher education institutions in the formation of knowledge-based ventures (Chapter 10). The chapter is based on Portugal, which is a country where the higher education system has expanded considerably in the last 30 years, with the emergence of several new public and private universities. The focus is on the eff ect of the creation of these new higher education institutions on regional levels of entry by knowledge-based fi rms, based on compar-ing fi rm entry rates of regions with new universities with similar regions where the number of universities has remained constant. The data used enable short, medium and longer term eff ects to be identifi ed over the period 1992–2002. The results indicate that the creation of a new higher education institution in a region has a positive impact on the share of new fi rm entry in knowledge intensive sectors. This emphasizes the contribu-tion of universities in Portugal to the regional development of knowledge intensive activities, as well as the wider contribution of higher education institutions to the shift to a knowledge-based economy, not only through knowledge spillover eff ects from institutions, but also through the eff ect on the supply of more educated people.
Chapter 11 by Ángela González-Moreno and Francisco Sáez-Martínez focuses on cooperation with universities and research institutions for entrepreneurship in established fi rms rather than in new ventures. The aim of the chapter is to examine how a fi rm’s innovation strategy infl uences the
10 Entrepreneurship and growth
decision to engage in research and development cooperation with univer-sities and research institutes, which includes a comparison between high-tech and low and medium technology industries. The chapter is based on data from the European Community’s Innovation Survey in Spain, with a sample of 9684 fi rms in low and medium technology activities and 2094 in high technology sectors. The fi ndings show that fi nancial constraints are the main motive for cooperating with universities and research institutes in low and medium technology sectors, whereas in high-tech industries, it is a lack of market information and the perception of risk that are important. The fi ndings also show that a fi rm innovation strategy aff ects its propen-sity to cooperate with universities and research institutes, as does increas-ing fi rm size, particularly in low and medium technology sectors. In low and medium technology activities, external cooperation of this type can act as a substitute for formal research and development activity in-house, although the frequency of such cooperation is typically less than in high technology sectors. More generally, fi rms that carry out internal research and development have a greater propensity to cooperate with universi-ties and research institutes, suggesting that a fi rm’s internal absorptive capacity infl uences it propensity to collaborate externally.
The third paper in the section (Chapter 12), by Vinit Parida and Mats Westerberg, is concerned with collaborative network structures involving small fi rms in the ICT sector. The study focuses on external relationships that contribute to a fi rm’s revenue and are repetitive, in an attempt to con-centrate on relationships that are important to the fi rms. Using entrepre-neurial orientation (EO) as the dependent variable, the authors explore the relationship between the level of EO and diff erent types of collaborative network, together with fi rm characteristics (age, size, etc.) and capabilities, specifi cally those related to networking and ICT. Hence, the purpose of the study was to investigate how diff erent collaborative network structures of ICT-related small fi rms can be linked to ICT and networking capabili-ties and entrepreneurial orientation.
The analysis distinguishes four groups of fi rms. The fi rst group (‘stuck without contacts’) comprises fi rms with few collaboration partners and low networking capacity, which is associated with low entrepreneurial ori-entation compared with other fi rms and low ICT capability. The second group (‘on the move’) consists of fi rms with few collaboration partners but high networking and ICT capabilities. Firms in this group also scored highly on entrepreneurial orientation. Firms in the third group (‘stuck with contacts’) have many collaborative partners but low networking capability, suggesting uncertain outcomes. Firms in this group are also low on ICT capability but exhibit a similar level of entrepreneurial orien-tation to fi rms in groups two and four. Firms in the fourth group (‘at full

Introduction 11
potential’) have many collaboration partners and high networking capa-bility. They also have high ICT capability, which they combine to achieve high entrepreneurial potential. Across the sample as a whole, a link is identifi ed between entrepreneurial orientation and ICT capability and networking, suggesting that fi rms not only need collaboration structures but also the tools to handle them. With regard to entrepreneurial orienta-tion, the results suggest there are diff erent ways for small fi rms in the ICT sector to achieve it, although further research is required to investigate the relationship with fi rm performance.
ENTREPRENEURSHIP AND SOCIAL INCLUSION
The fi nal set of papers deal with diff erent aspects of the relationship between entrepreneurship and social inclusion. Chapter 13 by Carole Howorth, Caroline Parkinson and Alan Southern is concerned with the discourse of enterprise and whether or not it has the power to enable or disable deprived communities. The chapter is inspired by the number of economic development initiatives in the UK that connect enterprise with deprived areas, which includes, but is not confi ned to, the promotion of social enterprise. Following a critical overview of UK enterprise policy with respect to deprived areas and a literature review, the authors analyse the discourse around enterprise policy and compare the language used by three diff erent groups involved in social enterprise activities: support workers, social entrepreneurs and community leaders. This is based on a series of interviews with representatives of each group, in which qualitative data were gathered.
From their analysis of the language used by these three groups, the authors conclude that application of the enterprise discourse to the social enterprise agenda can potentially lock out certain players and activities. This can result from the exclusionary eff ects of less business-minded people and/or activities that do not comply with the legal forms of social enterprise organizations. Although all three groups interviewed echo the imperative of existing social organizations becoming more businesslike, unlike support workers, social entrepreneurs and community leaders establish discursive boundaries between being ‘business like’ and serving important social needs. Bordieu’s concept of ‘symbolic violence’ is used as an interpretive frame, which refers to the gradual subordination of people to ideas and structures promulgated by the dominant groups in the society. The study uses a novel approach to an important topic that has implications for wider debates about enterprise culture, as well as specifi c implications for policy on enterprise in deprived areas.

12 Entrepreneurship and growth
Chapter 14, by Trevor Jones, Monder Ram and Nicholas Theodorakopoulos, is concerned with Somali entrepreneurs in Leicester, which is predicted to be the fi rst city in the UK where ethnic minority people will become the majority. The study adopts a mixed embedded-ness perspective to critically analyse the characteristics and behaviours of one of the more recently arrived immigrant groups in the UK. The approach adopted emphasizes the social embeddedness of immigrant and ethnic minority entrepreneurship, and particularly the economic and institutional context. The empirical focus of the chapter is on the extent to which UK-based Somalis are drawing on transnational links to estab-lish and develop their small enterprises. In so far as they are, this may be interpreted as an extension of social capital into the international sphere through transnational trading and investment linkages. The study is part of a critical examination of transnationalism, which the authors describe as the latest fashion in ethnic exceptionalism. A qualitative research design was adopted to examine the nature of transnational links and the actual experiences of Somali business owners in Leicester, based on in-depth interviews with them.
The results show that, in some respects, transnational co-ethnic links act as an important resource for ethnic minority and/or immigrant small business activity. Examples include accessing fi nance, labour and commer-cially useful information. At the same time, the political-economic context is said to impose harsh constraints on Somali business activity that the mobilization of social capital at any spatial scale is unable to circumvent. In such conditions, the authors conclude that transnational entrepreneur-ship is likely to be the preserve of a minority of minorities.
The fi nal paper (Chapter 15), by Friederike Welter and David Smallbone, deals with the emergence of entrepreneurial potential in economies in tran-sition, which like the previous two chapters emphasizes the importance of interpreting entrepreneurship in its social context. Specifi cally, the chapter is concerned with the process of creation and development of new ven-tures in three of the Newly Independent States (NIS): Ukraine, Belarus and Moldova, which are all relatively harsh environments for the devel-opment of productive entrepreneurship. The authors use case studies to demonstrate the potential for venture creation from simple petty trading activities (or informal arbitrage activity), in a context where more con-ventional approaches to venture creation face serious resource and other constraints. The empirical evidence suggests that some of the activities operating outside the legal framework are adding value to the process of economic and social transformation in these countries. Conceptually, the evidence is used to challenge simplistic divisions between entrepreneurs and proprietors, opportunity and necessity entrepreneurs and the formal
Introduction 13
and informal economy. Instead, the cases are used to demonstrate the blurred nature of these boundaries empirically and thus the limitations of some of the related conceptualizations. Overall, the chapter demonstrates a need for entrepreneurship theory to be robust enough to be applicable in a variety of social contexts, of which the countries included here provide some of the harsh conditions for entrepreneurship to become established.
CONCLUSION
We very much hope that readers will fi nd the selection of papers included in this collection stimulating and thought provoking. Entrepreneurship has grown rapidly as a fi eld of study in Europe in recent years and this is demonstrated by the success of the RENT conference, which, in Cardiff , entered its twenty-fi rst year. The dynamism of the fi eld of study in Europe is also refl ected in the emergence of entrepreneurship research groups in universities and research institutes across a growing number of countries. This is refl ected in this volume, where contributions from Spain and Portugal feature prominently alongside the more traditional centres of research in the fi eld in northern Europe. As editors of this volume, we are pleased to be able to report that, on the basis of the research presented at the RENT conference and specifi cally the contributions included in this book, European entrepreneurship research remains alive and well, both in terms of the heterogeneity of content and methods, and the vibrancy associated with emerging centres of research excellence.
REFERENCE
Blackburn, R. and M. Ram (2006), ‘Fix or fi ction? The contributions of small fi rms to social inclusion’, Entrepreneurship and Regional Development, 18(1), 73–89.


PART II
Regional Perspectives on Entrepreneurship

17
2. Regional innovation, collective entrepreneurship and green clustersPhilip Cooke
INTRODUCTION
The subject of this chapter is innovation and regions, highlighting new research on ‘green’ entrepreneurship, innovation and clusters. Accordingly it focuses particularly on the contribution that has been made to regional growth and prosperity through the operation of regional innovation systems and strategies. Of course a chapter on such a subject must recog-nize that the processes and outcomes being presented are not limited to regions alone. However, it has become increasingly clear during the past 15 years or so since the subject was fi rst aired in the academic literature (Cooke, 1992) that the regional focus is particularly well suited to sup-porting the innovation activities of fi rms and knowledge organizations. The latter include university research centres and institutes, as well as public and private specialist research institutes outside the university sphere. These interact and display strong connectivity in robust regional innovation systems.
Knowledge fl ows to those who need it, and commercial opportunities arise. This is the aim, and in many cases the achievement, of democratic authorities, their agencies and private associations of fi rms and other innovation organizations that make up a regional innovation system. In recent years, such governance mechanisms have sometimes evolved with only light touch steering being applied, elsewhere they have been designed by a multilevel governance process. Some countries draw on traditions of enterprise, individualistic as well as collective; others induce it at regional level by subsidizing what may be deemed collective entrepreneurship. Collective entrepreneurship goes along with connective innovation in a systems approach to the subject.
Collective entrepreneurship is an interesting approach, which is com-fortable with systems thinking and contrasting with the individualized notion of the entrepreneur. Systems centrally involve nodal points of power or infl uence and network connectivity between nodes; social
18 Entrepreneurship and growth
systems are mainly open systems. The notion of entrepreneur as individual hero has dominated the fi eld of study and action in entrepreneurship since Schumpeter (Schumpeter, 1975) although by that publication even he had evolved his thinking to recognize the element of teamwork that charac-terized corporate innovation. Entrepreneurship and innovation are not identical. A venture capitalist is entrepreneurial but his or her method is tried and tested. An innovator’s off ering is always to some degree novel, thus at risk. Mention of Schumpeter suggests an appropriate point at which to defi ne some of the other key concepts that have been mentioned that will inform the following text. In this tradition (e.g. Freeman, 2008) innovation is defi ned with great clarity as: the commercialization of new knowledge. Thus its marketability diff erentiates innovation from inven-tion. Innovation may be thought of as operating at a number of scales; global, international, national and regional (possibly also local in regard to innovative clusters – see below). Regional is taken as the meso-level of a country below the national and above the local level. Research has also been conducted into sectoral and technological innovation systems. However the former is increasingly somewhat constrained by a notion of ‘sector’ that seems increasingly to be breaking down given the prevalence of general purpose or ‘platform’ technological innovation, while the latter seems somewhat deterministic and hardware-focused given that innova-tion is increasingly concentrated in services and, currently, industries like agriculture (biofuels) or even culture (i.e. creative industries) that were only a few years ago widely thought rather low-tech or even no-tech (OECD, 1999; CEC, 2001). From this perspective, innovation takes fi ve forms: product, process and organizational are the well-known ones found in, for example, the Frascati manual.
Even more interesting in some respects are Schumpeter’s two other categories of innovation: region and input. The latter might include the quartz input to the (digital) watch. Of these, and for obvious reasons it is region as innovation type that is most fascinating for the purpose of this report. Sadly, however, Schumpeter left no well-formulated theory of regional innovation and entrepreneurship. But, as will be shown below, as with many things about Schumpeter, a combination of deep refl ection, an appropriately informed empirical object, and a historical perspective can work wonders. Finally, from this work we observe fi ve types of innova-tion process. The best known are radical; that is, ‘root and branch’, a total change in the whole system by which a commodity is supplied – a new classic being DVD rendering video obsolescent overnight, and Blu-ray doing the same to DVD. Incremental innovations involve improvements to existing products or processes such that, for example, cost is lowered and quality improved simultaneously. To these, recent proposals have
Regional innovation, collective entrepreneurship and green clusters 19
been added: sustaining and disruptive innovation (Christensen, 1997). The former is, to stay with video/DVD competition, a fi rm producing better and better video recording equipment for a settled market segment (i.e. video in the media industry); while the latter off ers typically cheaper, easier to use (e.g. DVD, now, as noted, being replaced by Blu-ray) technology.
Last is the type of innovation that Schumpeter thought was generic to all innovation in varying degrees, namely ‘new combinations’ (of existing knowledge) but this is too restrictive, leaving out the possible interaction of existing and wholly new knowledge. Spotting the ‘new combinations’ insight, Hargadon (2003) made the mistake of characterizing all innova-tion as ‘recombinant’, a topical term from biotechnology with its discover-ies in recombinant DNA. In Cooke and Schall (1997, 2007) we proposed recombinant innovation to be that which recombined a specifi c innovation in numerous ways customized according to demand. Thus smart cards may be used to measure temperature, where a fi rm fi nds its bananas rip-ening too soon; frequency when a customer wants controls electronically applied around the clock to prevent, say, capacity overfl ows; or pressure in containers, engines or heaters and so on. Sensors have a similarly protean adaptability, as do increasing numbers of general purpose innovations (Helpman, 1998) in ICT, biotechnology and nanotechnology. Many of these converge in ‘green innovation’ as will be shown below.
The chapter proceeds as follows. The fi rst section is devoted to the pro-duction of taxonomies of the above levels, categories and types of innova-tion accompanied by illustrative material. The second section highlights key aspects of entrepreneurship, notably of the collective kind, that is often overlooked in the relevant literature. The following section explores important evolutionary economic geography concepts, such as ‘related variety’, lateral absorptive capacity, proximity and portfolio, platform and platform policy, cluster mutation and Jacobian clustering. The third section examines four cases of green regional innovation systems based on Jacobian clustering. This is followed by a conclusion that sustains the notion that regional innovation is signifi cantly responsible for creation of national value.
INNOVATION SYSTEM TAXONOMY
It is helpful to juxtapose the categorizations outlined above to investigate any important relationships such an exercise might reveal. At this stage of conceptualization, when we are primarily concerned with relating the fi ve Schumpeterian innovation categories to the fi ve neo-Schumpeterian innovation intensities, we are looking for elements of consistency along the
20 Entrepreneurship and growth
columns and rows that help clarify the diff erential path dependencies or trajectories of innovation associated with underlying corporate strategies. When, later, we focus particularly strongly on Schumpeterian regional innovation, the interest in having observed corporate or cluster trajectories that are foundational for regional policy evolution will be to the forefront. The intersection between corporate culture and regional culture with respect to innovation and entrepreneurship choices is only now beginning to be explored in regional innovation system studies, utilizing a combina-tion of ‘varieties of capitalism’, ‘business systems’ and ‘worlds of produc-tion’ frameworks (Cooke and Clifton, 2007; Casper et al., 1999; Whitley, 2000).
Innovation Intensity and Type: Some Regional Innovation Inferences
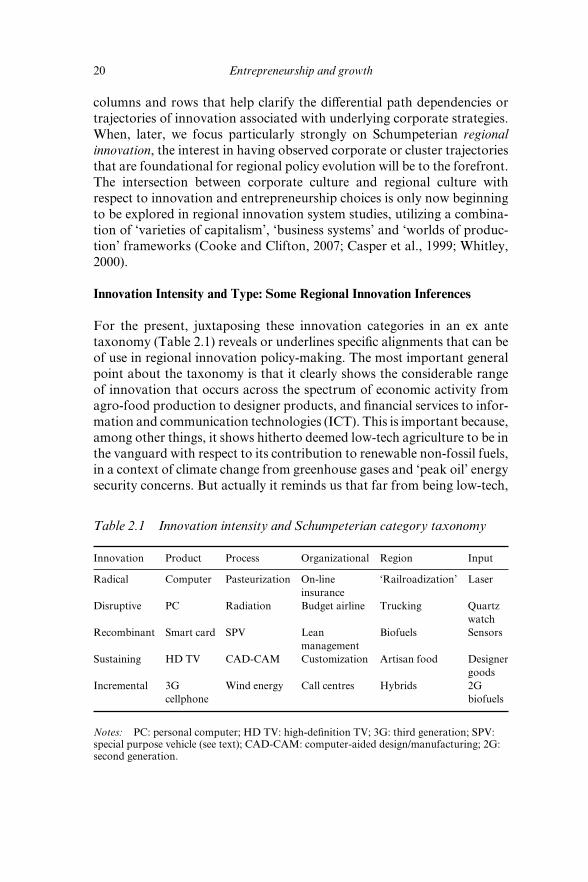
For the present, juxtaposing these innovation categories in an ex ante taxonomy (Table 2.1) reveals or underlines specifi c alignments that can be of use in regional innovation policy-making. The most important general point about the taxonomy is that it clearly shows the considerable range of innovation that occurs across the spectrum of economic activity from agro-food production to designer products, and fi nancial services to infor-mation and communication technologies (ICT). This is important because, among other things, it shows hitherto deemed low-tech agriculture to be in the vanguard with respect to its contribution to renewable non-fossil fuels, in a context of climate change from greenhouse gases and ‘peak oil’ energy security concerns. But actually it reminds us that far from being low-tech,
Table 2.1 Innovation intensity and Schumpeterian category taxonomy
Innovation Product Process Organizational Region Input
Radical Computer Pasteurization On-line insurance
‘Railroadization’ Laser
Disruptive PC Radiation Budget airline Trucking Quartz watch
Recombinant Smart card SPV Lean management
Biofuels Sensors
Sustaining HD TV CAD-CAM Customization Artisan food Designer goods
Incremental 3G cellphone
Wind energy Call centres Hybrids 2G biofuels
Notes: PC: personal computer; HD TV: high-defi nition TV; 3G: third generation; SPV: special purpose vehicle (see text); CAD-CAM: computer-aided design/manufacturing; 2G: second generation.
Regional innovation, collective entrepreneurship and green clusters 21
agro-food is one of the most science and technology intensive activities of all and has been since the onset of intensive and industrialized agriculture and food processing in the second half of the last century.
The illustrative selection of innovations is revealing for other reasons, particularly in clarifying diff erences among, for example, innovation intensities. Thus, as indicated earlier, radical innovation changes its context as well as commercializing unforeseen applications potential. Disruptive innovation, by contrast, is obsolescence-inducing and to some extent competence-destroying but essentially cheapens and ‘democratizes’ innovation, creating and broadening demand for new competences among its vastly increased user community. Recombinant innovation is agile in the adaptability of its fundamental properties to new combinations and contexts. One now notorious variant of recombinant innovation is the Special Purpose Vehicle (SPV).1 Sustaining innovation, it becomes clear, involves moves up-market to escape competition. In this respect it is dis-tinguished in this dimension also from disruptive innovation, which tends to cheapen. Finally, incremental innovation tends to off er more quality at less cost for a pre-existing innovation and is thus clearly diff erent from sustaining innovation.
A further point of interest concerns sustaining innovation. As it clearly involves moving up-market to escape competition from disruptive and other innovators, it can be generalized to certain kinds of corporate or cluster organization where a particular regional mix of products or serv-ices is assailed by cheaper competition. The obvious regional exemplar of this as a cluster strategy supported by regional innovation policy is Emilia-Romagna and, it could be argued, the ‘Third Italy’ more generally. Thus CAD-CAM was introduced by the regional innovation system in the 1990s so that knitwear fi rms could escape developing country imitations and was made available to the collective entrepreneurs in the relevant industrial districts (Cooke and Morgan, 1998) by utilizing advanced technology with more agile design-intensive production at higher quality and cost than hitherto. Hence we could typify this and other appropriate Third Italy regions as having in the past and apparently for the future become locked in to a sustaining innovation developmental trajectory. This applies to all ‘Made in Italy’ production clusters such as shoes, leather goods, jewellery, clothing and furniture. In policy terms the emphasis on support for quality improvement has helped these traditional industry clusters to survive and thrive but whether it can continue so to do is an open question.
Penultimately, in regard to the illumination given to regional innovation by the taxonomy in Table 2.1, we may briefl y indicate the rather unsurpris-ing element of lock-in that also typifi es incremental innovation. Unless it becomes disjointed, whereby it would arguably move into recombinant,
22 Entrepreneurship and growth
it remains somewhat ‘path dependent’. A good example of incremental product innovation occurs in telecom clusters like that for wireless com-munications at Aalborg in Denmark where what came to be called the NorCOM cluster collectively innovated the Global System for Mobile Communications (GSM) infrastructure system for supporting mobile telephony. Despite inward merger and acquisition by the likes of Texas Instruments, Motorola and Siemens, the cluster thrives and is innovating around third generation (3G) mobile telephony as well as researching 4G and 5G. In 2007 Denmark introduced regions, among whose obligations is that of supporting regional innovation.
Relatedly, in conjunction with medical technology innovation nearby, NorCOM has spawned an emergent BioMedico cluster of biotechnology fi rms in a process we elsewhere refer to as Jacobian cluster mutation. This evolutionary process is found in a number of innovative regions character-ized by rapid knowledge fl ows among collective entrepreneurs and knowl-edge organizations. North Jutland is one example, California another, with Wales and the Central region of Israel yet others. This regional innovation process displays cross-fertilization among clusters in convergent industries that display ‘platform-like’ related variety (proposed by Jane Jacobs as the key driver of innovation in cities; Jacobs, 1969). Mutation occurs through high lateral absorptive capacity of knowledge spillovers among related industries and their entrepreneurs. Thus such external economies realize yet another form of collective entrepreneurship that is massively assisted by geographic proximity that avoids the ‘portfolio’ eff ect experienced in regions with low related variety, low knowledge spillovers and cognitive dissonance among fi rms rather than high lateral absorptive capacity. These are clear gains to regional innovation and growth performance where a single innovation might be adapted and applied in, say, six diff erent contexts within the regional development platform.
Finally, we will look into Schumpeter’s only writing to embrace the notion of ‘region’, which occurs in his discussion of a fourth kind of innovation that he exemplifi es by the radical innovation process of ‘rail-roadization’. This too had pronounced regional development platform elements, involving infrastructure, mobility, construction, agriculture and pedagogy of various kinds as well as collective and individual aspects of entrepreneurship. Railroadization was the process led by large railroad corporations as oligopolies opening up new agricultural lands. This hap-pened wherever and whenever the railroad arrived. It was very evident on a vast scale in Eastern Europe and Russia; and on a smaller scale in Scandinavia, notably in Jutland, Denmark and of course North America. The railroad route was selected, towns were built at the train stations, land was made available cheaply to pioneer farmers, agricultural equipment
Regional innovation, collective entrepreneurship and green clusters 23
entrepreneurs arrived, farm services were built at the railhead, insurance (the even earlier fi nancial services innovations called ‘futures’ and ‘options’ occurred in connection with railroadization) and varieties of training were established, including setting up craft schools and agricultural extension colleges but also the distribution by the railroad companies of training manuals for would-be farmers, who helped each other get started in prac-tical terms. Schumpeter refers to this as almost the purest form of radical innovation because it represents a disturbance to the general equilibrium of the national and even global economy by a signifi cantly punctuated evolutionary moment. Traditions are overturned (‘creative destruction’), productivity receives a massive boost from the greater effi ciency and eff ectiveness of production, and bursts of innovation are set off in neigh-bouring sectors, such as the aforementioned futures and options markets, the organizational innovation of marketing complete farm equipment, including dwellings, through mail-order catalogues such as those of Sears and Roebuck, and much speedier product delivery, hence vast expansion of markets, again by railroad and by steamship. Later in this chapter railroadization is shown to explain the current proliferation of Jacobian clusters in the innovative growth region of north Jutland in Denmark. A taste of that analysis may be had by refl ecting on the wind turbine blade innovations that branched from the railroadization era agricultural equipment (ploughs) and marine engineering (ships’ propellers) industries that preceded wind turbines. The Danish national system subsidized the development of what became a highly successful strategic industry organ-ized at the level of the north Jutland regional innovation system. As will emerge later in this report, collective entrepreneurship rather than public administration supplied the governance drivers for regional innovation in this, at the time, weakly ‘regionalized’ innovation system. As noted, in January 2007, well after the innovation had triumphed, Denmark defi ned its offi cial regions, of which there are fi ve – one being north Jutland.
COLLECTIVE ENTREPRENEURSHIP
In orthodox discussions on and research into entrepreneurship it has been traditional to place the focus of theoretical attention on attributes of individual entrepreneurs, for example psychological or behavioural dispositions, their status as recent immigrants, and so on. This approach unquestionably explains certain aspects of entrepreneurship as part of a larger, presumably more homogeneous adult population but it does not throw useful light on geographical variation in entrepreneurship. That is except insofar as recent immigrants might be expected to have located in
24 Entrepreneurship and growth
or near ports, which can be shown historically to have higher than normal rates of entrepreneurship (Nijdam and de Langen, 2003). Nowadays mass air travel has diluted that observation to some extent, although port cities remain entrepreneurial places (Edvinsson, 2006).
Nevertheless, research on immigrant and/or ethnic entrepreneurship is often forced to relax individualistic theoretical assumptions and account for entrepreneurship in terms that highlight social networks of religious, linguistic or other cultural kinds. Notions like embeddedness, social capital, ‘structural holes’ and ‘relational proximity’ enter the discourse to capture the social dimension of economic activities that a more orthodox, not to say neo-classical approach neglects (Granovetter, 1992; Burt, 1992; Putnam, 1993; Cooke and Clifton, 2005; Boschma, 2005). In the analysis and empirical research that follows the notion of entrepreneurship that acts as a main vehicle for the emergence of Jacobian clusters is this kind of collective entrepreneurship. A compelling reason for this choice is the more structural and institutional analysis that the evolutionary economic geog-raphy implied by the key concept of regional innovation systems invokes. New economic geographic thinking about crucial questions, not least for policy observers let alone regional scientists, such as how and when do clusters emerge also necessarily takes us into a collective entrepreneurship rather than an individualist entrepreneurship discourse. That is not to say individual entrepreneurship is ignored in this perspective. Rather, where observable, as for instance with the notion of ‘lead entrepreneur’ and ‘entrepreneurial’ or ‘triggering event’, it plays a part. Though not studied in depth here, cluster emergence can be traced back in important ways in all empirical instances portrayed in this chapter, such as the NorCOM cluster genesis in north Jutland, Denmark (SP Radio, 1948, ship-to-shore radio), the wireless cluster in San Diego (Linkabit, 1968, military communications; Simard and West, 2003), photovoltaics in Wales (Thales Optronics, 1957, lenses), and software fi rewalls in Israel (NDS, 1977, encryption algorithms). However, in all cases these entrepreneurial events were accompanied by swiftly imitating spin-off s (Klepper, 2002) that together with elements of public investment and academic knowledge resulted in cluster emergence.
Hence, these elements of origination through interaction, among those capable in exploration (research), examination (testing) and exploitation (commercialization), lie at the heart of modern collective entrepreneurship. In earlier periods, the networks sustaining collective entrepreneurship had been more community-based forms of embeddedness as found in indus-trial districts. Something distinctive from this, which may have been more corporately induced but still retaining numerous collective considerations, can be envisaged with Schumpeter’s notion of North American ‘railroadi-zation’ with its responsibilities for soft and hard infrastructure, pedagogy
Regional innovation, collective entrepreneurship and green clusters 25
and so on in newly opened lands. Elements of this style of western coop-erative competition form the core of Saxenian’s (1994) study of Silicon Valley. Finally, establishment of self-organized, publicly supported tech-nology institutes and craft schools inter alia in new communities, with reli-gious worship also sustaining pioneer communities (as in California too), were common in the early modernization of Jutland, Wales and Israel. Evolving over time, such that religious embeddedness elements became attenuated, and venture capital and/or the state as key support investor rose in its place, nevertheless, it has been shown by Kristensen (1992), Saxenian (1994), Avnimelech (2008), also Teubal et al. (2002) and Cooke (this chapter, below) that collective entrepreneurship in regional innova-tion systems (RIS) is a viable and valid way of understanding regional evolution in the cases examined.
RECENT ADVANCES IN RIS RESEARCH
One of the most interesting research areas opened up in RIS research in the recent past concerns the insights of Jane Jacobs (1969) and can also be referred to as addressing the challenging issue of ‘cluster emergence’. In particular by examining the emergence of a number of ‘green clusters’ on a regional canvas, we see emphasis in ‘green innovation’ on technological convergence among diverse industries. These include biotechnology, infor-mation technology and nanotechnology (but not limited to these high-tech activities) and among them we also see a process of cluster ‘species mutation’. Of particular fascination here is that some regions have the capability relatively rapidly to mutate many ‘Jacobian’ clusters – so-called because although diff erent they display evolutionary characteristics of ‘related variety’ (Boschma, 2005).
Jacobian Clusters
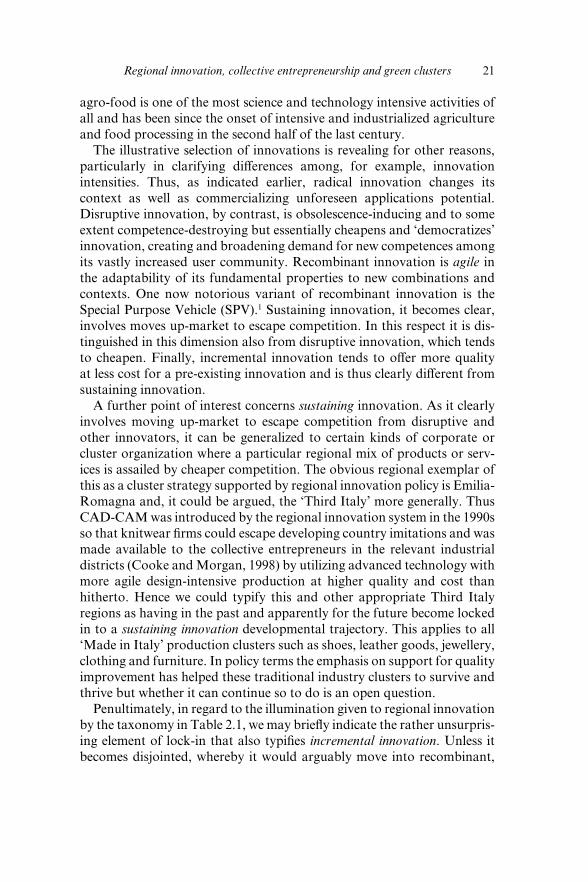
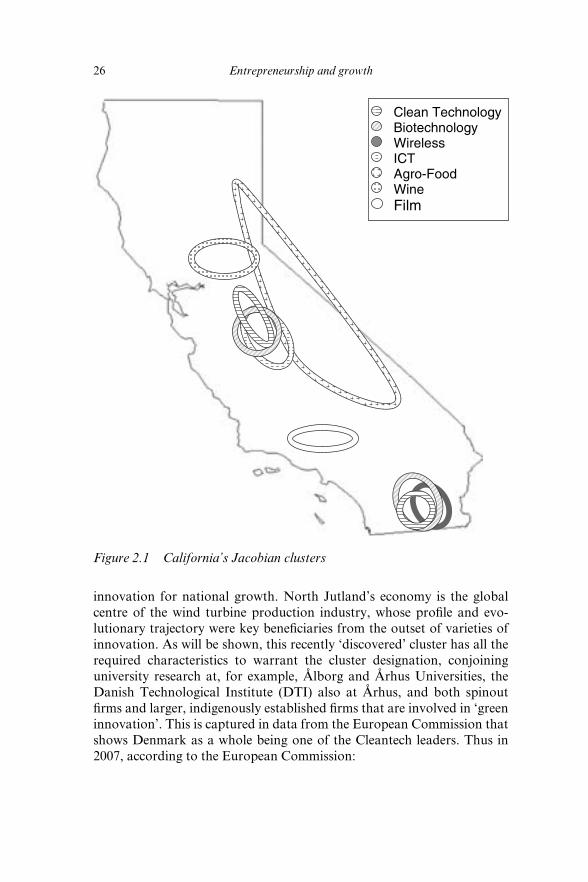
One such region is northern California whose ICT, biotechnology and clean technology clusters overlap in proximity to San Francisco but also near various agro-food clusters like wine in the Napa, Sonoma and Russian River valleys and varieties of horticulture in the San Joaquin and Sacramento River valleys (see Figure 2.1). But notice, Figure 2.1 also shows southern California having prominent Jacobian clusters in Los Angeles and San Diego (Cooke, 2008). North Jutland in Denmark is another such region, as apparently is Wales in the UK, as we shall see (Cooke, 2008, 2009). The important points here are the importance of national policy for regional innovation and the importance of regional
26 Entrepreneurship and growth
innovation for national growth. North Jutland’s economy is the global centre of the wind turbine production industry, whose profi le and evo-lutionary trajectory were key benefi ciaries from the outset of varieties of innovation. As will be shown, this recently ‘discovered’ cluster has all the required characteristics to warrant the cluster designation, conjoining university research at, for example, Ålborg and Århus Universities, the Danish Technological Institute (DTI) also at Århus, and both spinout fi rms and larger, indigenously established fi rms that are involved in ‘green innovation’. This is captured in data from the European Commission that shows Denmark as a whole being one of the Cleantech leaders. Thus in 2007, according to the European Commission:
Clean Technology Biotechnology Wireless ICT Agro-Food Wine Film
Figure 2.1 California’s Jacobian clusters
Regional innovation, collective entrepreneurship and green clusters 27
environmental technology is one of Denmark’s largest business clusters, and includes 420 companies (60,000 employees) . . . analysis showed a number of ‘strongholds’ for potential to develop new environmental technologies clusters. They include off shore turbines and water purifi cation. (European Commission, 2007)
The Danish Ministry of Economic and Business Aff airs (FORA) report (Environment Ministry, 2006) shows that a further 46 knowledge institu-tions consider themselves to be primarily active in environmental technology research. The FORA report shows one means by which the emergence of ‘green innovation’ clusters may be performed partly at the behest of government activity. This is referred to elsewhere as ‘articulation of discourse’ (Davenport and Leitch, 2009), which is a powerful cognitive and ideological process by means of which a discourse of action and promotion occurs within the state apparatus but articulated both to wider, global concerns, the interests and concerns of local business, and a modernizing discourse expressing a policy-advisory consensus, in this case privileging clusters, innovation and climate change. For illustrative purposes, clearly, on inspection, the quote from the European Commission (2007) report is taken directly from the FORA report. This report shows how the FORA business and economic research unit defi ned environmental businesses and mapped a Danish cluster. This cluster occupies the abstract space of Denmark’s national environmental industry. It is the loosest defi nition of ‘clustering’ as promulgated by Porter (1990).
Hence apart from being in Denmark the ‘cluster’ has no geographi-cal specifi city of the kind Porter (1998, p. 199) was rather more sensitive towards. He referred there to a cluster as: ‘a geographically proximate group of interconnected companies and associated institutions in a particular fi eld, linked by commonalties and complementarities’.
With regard to such clusters the most important analytical task is to establish the extent of interconnections, commonalities and complemen-tarities since this is what distinguishes a localized cluster, its specialization or diff erentiation and its potential for exploiting knowledge spillovers for competitive advantage.
In the FORA exercise, the fi rst step was to identify the ‘clump’ of environ-mental technology fi rms throughout Denmark prior to articulating that they constitute a cluster. Next, the ‘cluster’ is divided into sub-clusters based on the environmental challenge faced by the company or knowledge institution; that is, into which sub-category of the abstracted cluster do specifi c actors ‘fi t’? Eight of these were identifi ed. Next a pilot project was run examining three of these sub-clusters: energy/climate change, water and chemicals. The rationale for selecting these fi rst for further analysis was scale (‘three sizeable clusters’), including high-tech smaller and large Danish companies, and areas in which Danish research institutes are perceived to be conducting
28 Entrepreneurship and growth
world-class research and development (R&D). The two target groups, fi rms and research institutes were then invited to profi le their extent of ‘green inno-vation’, market expectations of their chosen course of action, and extent of collaboration (key to clustering) with others in this pursuit. Next, these answers were assessed in relation to sub-cluster critical mass (unspecifi ed), knowledge (world class or not), and market potential (preferably global). Hence the articulated discourse of what have now become Denmark’s envi-ronmental technology clusters draws on global excellence, innovativeness, collaboration and scale. Interestingly, photovoltaics, another pronounced cluster in north Jutland is not highlighted in this report.
Therefore on this basis fi ve promising clusters were selected:
Wind energy turbines (pioneered in Denmark since the 1970s, see ●
below).Water purifi cation (well-established businesses). ●
Industrial biotechnology (well established, e.g. fermentation, ●
enzymes).Biofuels (spin-off s from existing industry, for development). ●
Fuel cells (spin-off s from existing industry, for development). ●
Companies in such industries were then asked what frame conditions (i.e. gov-ernment support) would help them to evolve their potential or actual ‘strong-hold’ status. These included regulation, stimulus to collaboration, public research funding and entrepreneurship. In the Appendix reporting contacts with research institutes only, some 10 per cent of these seem to have occurred outside Copenhagen, indicating the offi cial ‘cluster’ discourse probably has a geography (and a ‘scale’ bias) that is centred on the capital city, even though substantial economic activity takes place in Jutland and elsewhere. This shows how national innovation systems leaders favour core over periphery, giving impetus to collective action at the periphery, as will be suggested below. Such an interpretation is reinforced in respect of the large scale of business inter-viewees, thus only a few, larger Jutland fi rms like Vestas and Siemens Wind Power (wind turbines), Grundfos and Danfoss (both engineering) feature among the total number of environmental technology interviewees.
FURTHER EVIDENCE OF JACOBIAN CLUSTERS
Jacobian Clusters in Jutland
We noted above the presence of Jacobian clusters in the Californian RIS, commenting how such convergence was rendered more visible by
Regional innovation, collective entrepreneurship and green clusters 29
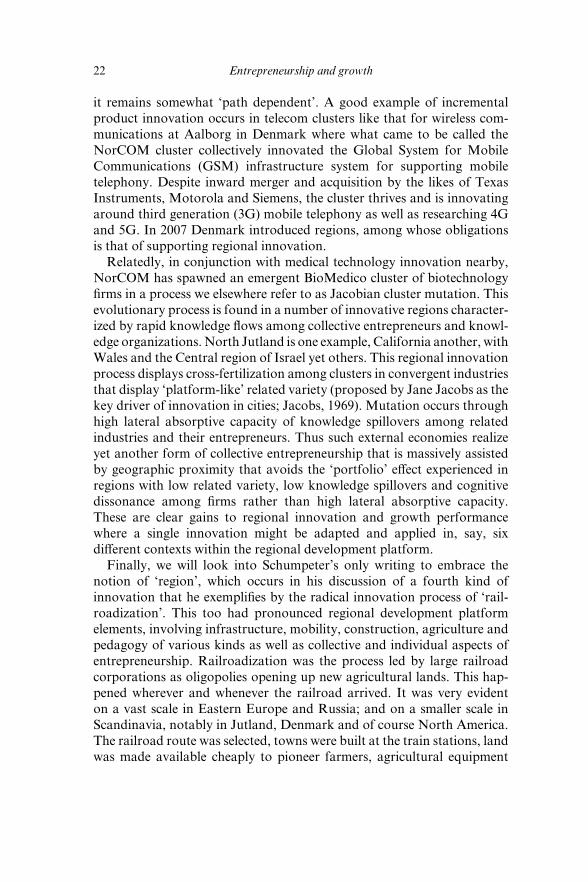
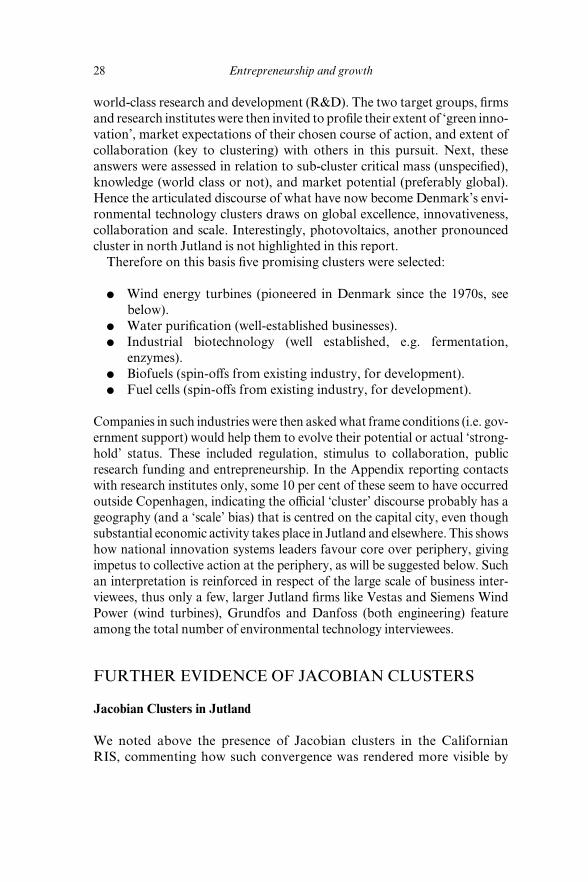
examining green innovation, which is necessarily highly convergent. Continuing in this vein and focusing for the moment on wind energy, the question of whether what is in North Jutland is a wind-turbine cluster had fi rst to be addressed. On this, Andersen et al. (2006) point to the wind energy industry having passed through an early phase characterized by numerous small and medium-sized enterprises (SMEs) producing domestically scaled wind power for individual farms and householders. But latterly, especially since the government subsidy to domestic consumers was removed in 2000, exports have risen, the scale of equipment has increased tenfold and sea power from large-scale off shore wind farms has come to predominate. As wind turbines have only some ten years life expectancy, most early wind turbines in rural Denmark will soon disappear if they have not already done so. So the current industry structure is large Danish (Vestas) or foreign (Siemens, Gamesa, Suzlon) producers and a supply platform of SMEs. There may be less local sourcing of key equipment like gearboxes than in the early days when North Jutland shipbuilding fi rms could adapt to meet the nascent wind energy demand. Services and special logistics fi rms, the latter capable of transporting the now typically massive fi breglass turbine blades, also exist in proximity as do a great many components suppliers (Figure 2.2).
Stoerring (2007) agrees with this evolutionary profi le, pointing out that scale was also partly induced in the early 1980s by huge demand for wind turbines from the US and more particularly California. Then, in the late 1980s this market collapsed because California’s state administration removed its subsidy regime and the Reagan administration cut alternative energy research budgets. At this time, many US turbines malfunctioned badly and even the superior Danish three-blade design was prone to breakdowns. Thereafter, the industry recovered as demand in European and Asian markets rose. Nowadays around half global production capac-ity is accounted for by Danish fi rms, like world leader Vestas Wind Systems of Randers, near Århus (acquirer of Danish fi rms NEG-Micon; Nordtank; Wind World) and Siemens (Bonus) at Brande and Ålborg. Gamesa Wind Engineering, Spain’s largest producer of turbines is at Silkeborg. Suzlon, India’s leader is located at Århus. LM Glasfi ber of Lunderskov near Århus in Jutland is the leading supplier of fi breglass wind turbine blades, and so on. Of the Danish Wind Industry Association’s 70 members, 50 are in Jutland, mostly north-central Jutland.
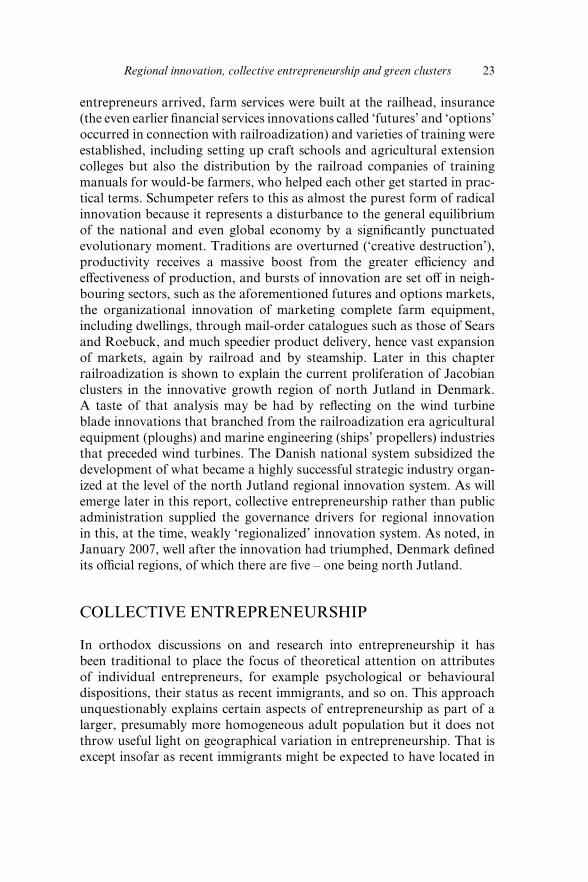
Unrealized until now, overlapping this substantial and globally leading wind turbine technology cluster is the main Danish solar thermal energy cluster (Figure 2.3). This consists of largely indigenous fi rms and their suppliers, which involve fi rms in two types of supply chain as follows:
30 Entrepreneurship and growth
Manufacturer
Key:
Materials
Components LogisticServices
Siemens
Vestas
Gamesa
Siemens
BSB M
BSB9
Reichhold
Vest-Fiber
Fiberline
LM Glasfiber
DOT J&U
Suzlon
S
Ålborg
Århus
RandersL
S
S
S
SL
LL
L
SS
S
AU
AU
DTI
Source: Drawn from Danish Wind Industry Association statistics.
Figure 2.2 The North Central Jutland wind turbine cluster

Regional innovation, collective entrepreneurship and green clusters 31
Solar collectors ●
Glazed (roofs): ●
(Flat plate collectors): ●
Glass ●
Heat absorbent copper/aluminium ●
Coatings, paint ●
Pipes welded to absorber plate ●
Vacuum collectors: ●
Parallel glass tubes ●
Absorber ●
Transfer pipes ●
Vacuum is insulator ●
Unglazed (swimming pools) long tubes ●
Danfoss A/S
Viessmann A/S
Cowi ConsultPoul Lodberg
Aidt Miljø A/S
Energi- og Miljødata
Nordvestjysk Folkecenter forVedvarende Energi
NIRAS
Rambøll A/S, SvendborgDjurs Solverme I/S
Michael Madsen & Petersen PlanEnergiARCON Solvarme A/S
EsbensenSol-Energi.
ED Heating ApS
Fyens Solvarme
Grundfos Sensor
Source: Composed from ESTIF data.
Figure 2.3 North Jutland’s solar thermal energy cluster
32 Entrepreneurship and growth
Synthetic absorbent material ●
Hydraulics in pool fi ltration system ●
Heat storage and back-up heating ●
Plumbing and Installation. ●
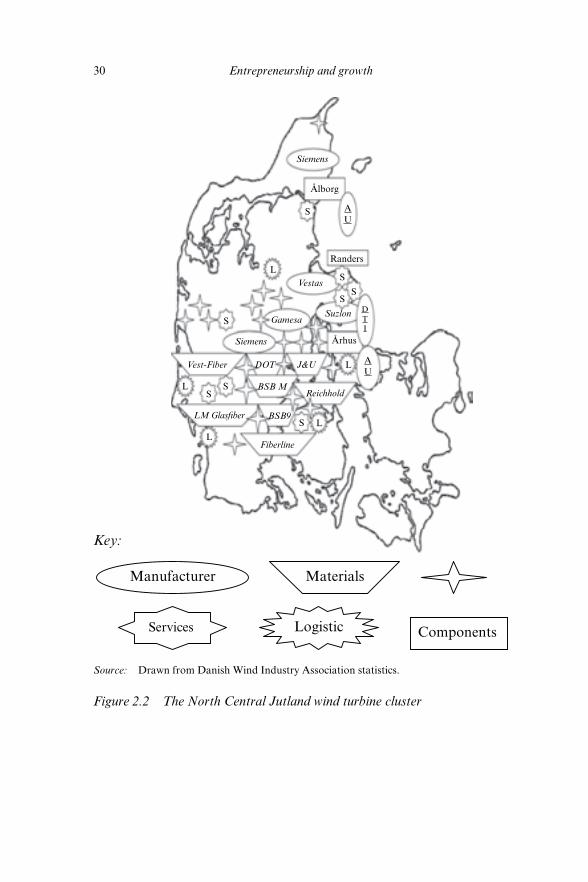
Finally, exemplifying North Jutland’s Jacobian cluster profi le it is worth considering Figure 2.4 and 2.5, the fi rst of which reveals established cluster evolution in the shape of the NorCOM wireless communications cluster at Ålborg and the possibly emergent and overlapping biomedical technology cluster in close proximity (Stoerring, 2007). Here, the long-established wireless telecommunications cluster (Stoerring and Dalum, 2007) has given rise to possible cluster mutation by interaction with the healthcare activities associated with clinical trials and testing related to biomedical equipment. Many of these activities are closely associated with science and technology commercialization through academic entrepreneurship at Ålborg University. In Figure 2.5 are shown the most prominent (though many have yet to be fully researched) of North Jutland’s Jacobian clus-ters, which are characterized as emergent clusters or established ones by their ‘related variety’ characteristics in relation to each other. This may be understood as follows:
Cluster Evolution and Species Multiplication inAalborg?
BIOMEDICO Cluster Emergence: Aalborg, Denmark
BiotechnologyClinical/Hospital
BiomedicalTechnology
Electronics/ITInformatics
Telecommunication
Source: Stoerring (2007).
Figure 2.4 Jacobian cluster emergence in North Jutland
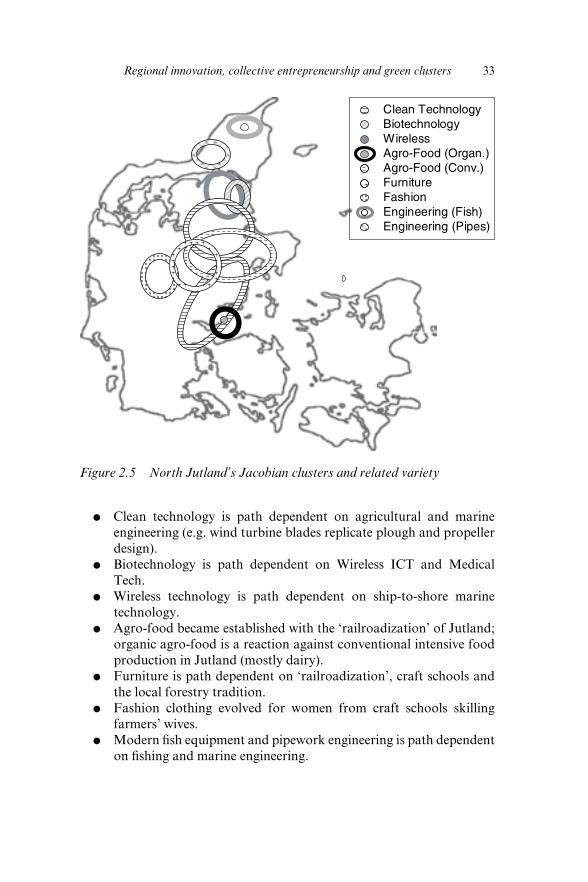
Regional innovation, collective entrepreneurship and green clusters 33
Clean technology is path dependent on agricultural and marine ●
engineering (e.g. wind turbine blades replicate plough and propeller design).Biotechnology is path dependent on Wireless ICT and Medical ●
Tech.Wireless technology is path dependent on ship-to-shore marine ●
technology.Agro-food became established with the ‘railroadization’ of Jutland; ●
organic agro-food is a reaction against conventional intensive food production in Jutland (mostly dairy).Furniture is path dependent on ‘railroadization’, craft schools and ●
the local forestry tradition.Fashion clothing evolved for women from craft schools skilling ●
farmers’ wives.Modern fi sh equipment and pipework engineering is path dependent ●
on fi shing and marine engineering.
Clean TechnologyBiotechnologyWirelessAgro-Food (Organ.)Agro-Food (Conv.)FurnitureFashionEngineering (Fish)Engineering (Pipes)
Figure 2.5 North Jutland’s Jacobian clusters and related variety
34 Entrepreneurship and growth
There is insuffi cient space to off er a satisfying explanation for the Jacobian cluster mutation process in North Jutland but Kristensen (1992) underlines ‘railroadization’ as a key process where Jutland as a whole was opened up on a smaller scale but with similar inspiration to that of the Frontier West in the nineteenth-century USA. With this came two key movements. The fi rst was the farmers’ cooperative movement, where farmers supplied their own production and household needs, includ-ing banks. The second movement was the craft schools, established in over 350 centres; followed by the still fl ourishing Danish Technological Institutes from 1907. Together these made a form of social or collective entrepreneurship possible; in other words, the infrastructure, education, technical support, fi nance and markets. Hence ‘social capital’ remains an important dimension of the SME-based collective entrepreneurship of North Jutland. It makes technological branching by means of related variety evolution possible.
Finally, the existence of an RIS infrastructure of technological insti-tutes, technical and craft schools and universities sustains entrepre-neurship and localized knowledge transfer. Hence this is a strong case, probably as much as California, of an RIS animated by a tradition of collective entrepreneurship rather than administratively guided. Much the same can be said of our penultimate regional illustration. From the ruins of Wales’ FDI-led RIS strategy and the under-performance of its generic entrepreneurship successor, has emerged a related variety platform of mostly rurally based innovation excellence driven by research laboratories and spinouts in the broad agro-food platform, which is now rapidly being augmented by biofuels and biomass energy innovation. In a brief fi nal sub-section the generalization of RIS-based Jacobian clustering around these convergent technologies is extended to Israel.
Bioenergy from Crops in Wales
One of the most surprising, perhaps, but unquestionably innovative developments in the bioenergy fi eld has occurred in recent years in Wales. Descriptively speaking it involves patented knowledge derived by the Institute for Grassland and Environmental Research (IGER) based at Aberystwyth in rural, central Wales. This UK Biological Research Council-funded research institute has, for 70 years to 2007, been the UK’s main, specialist grassland research institute. It was tasked from the outset with improving the quality of fodder for cattle and sheep feedstock, which is mainly grass. By the early 1980s, research involved not simply breeding richer grasses but understanding the rumen of these ruminative animals. It had revealed that a limit to quality on these mountain-bred animals

Regional innovation, collective entrepreneurship and green clusters 35
occurred because the enzymes that broke down fodder into protein were actually consuming a signifi cant portion of the nutritional value of the fodder eaten by the animal.
Following many years of lengthy fi eld trials and laboratory research, cross-breeding the basic ryegrass commonly utilized for cattle and sheep fodder with breeds possessing enhanced sugar content produced optimal results. The enzymes took some of the enhanced sugar content, transform-ing it directly into energy, but left a substantial portion for the animal, suffi cient for the amount, nutritional value and fl avour of the animal to be signifi cantly enhanced. A patent was approved for this in 1987. This came to the market at a time when consumer demand for leaner meat of the type raised in mountainous areas rose signifi cantly and continuous improve-ment to the original AberDart strain of ryegrass, marketed by Germinal Holdings, over the intervening years led to it reaching 50 per cent of the UK market. It further secured the status of Welsh black beef and Welsh lamb as premium products and enabled signifi cant improvements to occur in comparable upland cattle breeds, such as Aberdeen Angus.
In 2003, it was realized that IGER had, in the form of these SugarGrasses, an indigenous product to add to its burgeoning portfolio of biofuels. Tests had shown that SugarGrass had twice the calorifi c value of sugar cane, the source of much of the world’s biofuel. IGER thus evolved a second string to its grassland expertise by developing a renewables research division. One of the biofuel feedstocks in which it became supreme early on was the growing and processing of Miscanthus, more popularly known as Elephant Grass, an Asian tall grass that grows on marginal land. Accordingly it doesn’t compete for land with food crops, one of the criticisms of the US and Europe’s ‘bolt for biofuels’. This has seen the ears and cobs of wheat and corn being turned into ethanol because of easy availability and major subsidy, causing up to 40 per cent increases in the price of such cereals, and grief in developing country food markets.
Tellingly, IGER is widely perceived as in a global class of its own in these specifi c bioenergy sub-fi elds. The offi cial view is that maybe the University of California, Berkeley is a serious rival, now they have received a $500 million endowment for a Climate Change research institute from British Petroleum (BP). Apart from the University of Illinois, also mentioned as a possible future competitor (but only those two), IGER has a current lead on both of them. But in any case, SugarGrass is also twice as calorifi c as Miscanthus and SugarGrass is thus favoured as the technology with the best long-term prospect to replace oil. Willow woodchip has also been researched for renewable biomass energy and is seen as a leading candidate for combustion power generation. IGER has the patent for SugarGrass, currently earning royalties of £100 000 per year from sales of seed varieties
36 Entrepreneurship and growth
for fodder. But as the world awakens to the relatively simple processes of biorefi ning the product, these are likely to grow substantially. So much so that agreement has been reached with Welsh government offi cials about the promise of funds to help build an experimental biorefi nery. Thinking had gone as far as to speculate that when oil ceases to be refi ned at the huge Milford Haven refi neries in neighbouring Pembrokeshire, the pool of talent and infrastructural sunk costs would make them ideal candidates for becoming SugarGrass (and Miscanthus) biorefi neries. These would continue to meet a huge share of the UK’s future energy. But it is not simply a spinout venture capital model that is in mind, possibly because a spinout model doesn’t yet work as well as a commercialization out-sourcing model in this nascent fi eld. For example, Molecular Nature, the spinout identifi ed in Figure 2.6, burnt up its venture capital, but because of the value of its patent for biofuels potential as well as its fodder market, it was acquired by spin-in company Summit. Moreover, true to the tra-ditions of collective entrepreneurship among Welsh mountain farmers, IGER promotes a new vision of mixed farming whereby groups of farmers grow Miscanthus on their poorest soil, devote some fi elds for SugarGrass fuel cropping and raise quality Welsh lamb or Welsh black beef on their best SugarGrass land.
Precision farming, whereby seed is automatically sown in varying intensities according to GPS fi eld data on variability in soil humidity and fertility, held in the laptop in the farmer’s tractor cab, makes for enhanced effi ciency and eff ectiveness in this increasingly high-tech farming model (Pedersen and Pedersen, 2006). But the prospect is that farmer coop-eration would enable them to undertake local, small-scale biorefi ning. SugarGrass is fermentable for extracting the juice that becomes ethanol to be used on the farm or sold. But the dried remnants can also be used either as fodder, or as feedstock for yet another bioenergy variant, in biomass power station burning. A bio-revolution seems to be afoot in rural Wales, as not only biofuels but biocomposites are also being researched and experimentally produced among groups of entrepreneurial farmers linked to Bangor University in north Wales. Mercedes cars use hemp-based insulation material of the kind being produced by an eight-farm group in Snowdonia and ‘Future Farmers of Wales’, which is a 140-strong associa-tion of younger farmers willing to diversify into biofuels, functional foods and cosmeceuticals, is thriving.
Hence, Figure 2.7 attempts to delineate key interactions in the emer-gence of a biocomposites, biofuels and related agro-biotechnology plat-form of inter-connected and emergent clusters in north Wales, while Figure 2.8 maps the photovoltaics cluster, again in north Wales but also the networks of photovoltaics producers throughout Wales. In this
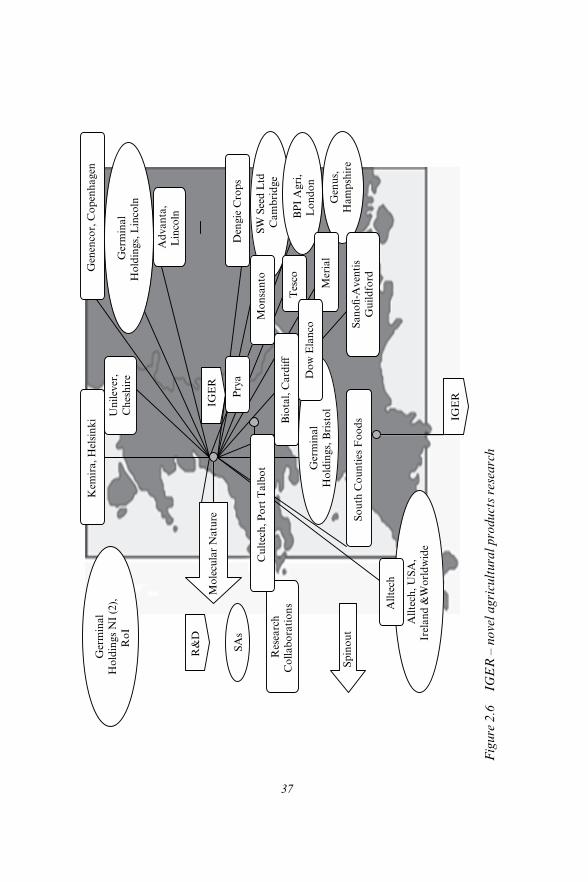
37
Ger
min
alH
oldi
ngs,
Bris
tol
Ger
min
alH
oldi
ngs,
Lin
coln
IGE
R
IGE
R
SW S
eed
Ltd
Cam
brid
ge
Gen
us,
Ham
pshi
re
Allt
ech,
USA
,Ir
elan
d &
Wor
ldw
ide
BPI
Agr
i,L
ondo
n
R&
D
SAs
Res
earc
hC
olla
bora
tions
Sano
fi-A
vent
isG
uild
ford
Adv
anta
,L
inco
ln
Uni
leve
r,C
hesh
ire
Gen
enco
r, C
open
hage
n
Allt
ech
Mer
ial
Bio
tal,
Car
diff
Tes
co
Sout
h C
ount
ies F
oods
Den
gie
Cro
ps
Dow
Ela
nco
Mon
sant
o C
ulte
ch, P
ort T
albo
t
Prya
Kem
ira, H
elsin
ki
Mol
ecul
ar N
atur
e
Spin
out
Ger
min
alH
oldi
ngs N
I (2)
,R
oI
Figu
re 2
.6
IGE
R –
nov
el a
gric
ultu
ral p
rodu
cts r
esea
rch
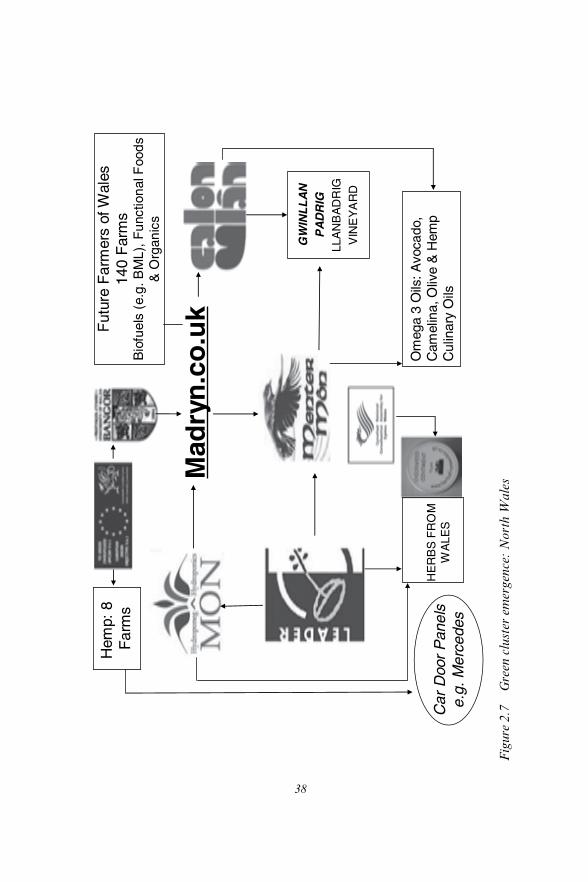
38
Mad
ryn
.co
.uk
GW
INL
LA
NP
AD
RIG
LLA
NB
AD
RIG
VIN
EY
AR
D
Hem
p: 8
F
arm
s
Car
Doo
r P
anel
se.
g. M
erce
des
Fut
ure
Far
mer
s of
Wal
es14
0 F
arm
sB
iofu
els
(e.g
. BM
L), F
unct
iona
l Foo
ds&
Org
anic
s
Om
ega
3 O
ils: A
voca
do,
Cam
elin
a, O
live
& H
emp
Cul
inar
y O
ilsH
ER
BS
FR
OM
WA
LES
Figu
re 2
.7
Gre
en c
lust
er e
mer
genc
e: N
orth
Wal
es
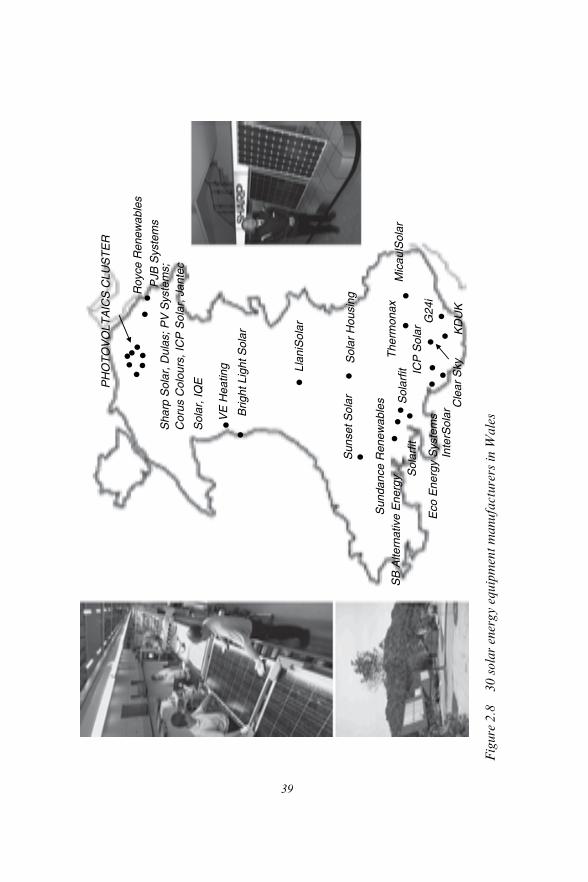
39
Llan
iSol
ar
G24
i
Sha
rp S
olar
, Dul
as; P
V S
yste
ms;
C
orus
Col
ours
, IC
P S
olar
, Jan
tec
Sol
ar, I
QEPH
OT
OV
OLT
AIC
S C
LUS
TE
R
ICP
Sol
ar
Mic
aulS
olar
Cle
ar S
ky
The
rmon
axS
unda
nce
Ren
ewab
les
Roy
ce R
enew
able
s
PJB
Sys
tem
s
Sol
ar H
ousi
ng
Sol
arfit
KD
UK
Sun
set S
olar
SB
Alte
rnat
ive
Ene
rgy
Brig
ht L
ight
Sol
ar
VE
Hea
ting
Eco
Ene
rgy
Sys
tem
s
Sol
arfit
Inte
rSol
ar
Figu
re 2
.8
30 so
lar e
nerg
y eq
uipm
ent m
anuf
actu
rers
in W
ales

40 Entrepreneurship and growth
emergent and relatively sub-regional innovation system a number of key organizations are found. For example, EU Convergence Funding plays a role in a project whereby a number of farms experiment with hemp as a biocomposite of the kind utilized by automotive fi rms, such as Mercedes as insulation in car body panels.
Partnership with Bangor University’s Biocomposites Centre is a means by which knowledge generated in the Centre is exploited commercially. However, also important to the network is Madryn, an intermediary fi rm that acts as a combination of ‘knowledge aggregator’ and ‘entrepreneur-ship accelerator’. It works closely with, on the one hand, an association of farmers seeking to diversify into agro-bio and sustainable product development and marketing, while, on the other, engaging in serial entre-preneurship itself and entrepreneurship acceleration among other busi-nesses. These range from fi rms producing ‘green cosmeceuticals’ (herbal make-up) to functional foods and locally grown culinary oils enriched with, for example Omega-3 oils. These include relatively recently intro-duced olive trees that survive the hitherto cold winters of north Wales as a consequence of climate change.
Photovoltaics produce solar thermal energy as in North Jutland. In Wales, this has been studied by authors (Hendry et al., 2003) comparing the broader opto-electronics cluster, which also specializes in fi bre-optic cabling, with those such as that associated with Carl Zeiss in Jena, eastern Germany. However, in relation to this present discussion about ‘green clusters’, it is the photovoltaics capability that comes to the fore. Figure 2.8 reveals the presence of sub-divisions of multinationals such as Japanese electronics corporation Sharp whose Sharp Solar subsidiary is based at St Asaph alongside Corus Colours, a subsidiary of Corus, the UK–Dutch steel manufacturer, acquired in 2007 by Indian giant Tata Steel. This company has developed the radical innovation of solar energy paint that can be applied to steel-clad buildings: 100 000 square metres of steel clad-ding yields the equivalent of 50 medium-sized wind farms. Other fi rms in the photovoltaics cluster at St Asaph are indigenously owned, such as Cardiff headquartered microprocessor fi rm IQE and ‘green engineering’ fi rm Dulas, headquartered in mid-Wales.
Hence, in conclusion, we see that numerous indications of clustering among small fi rms, but also some large enterprises, together with an applied and basic research infrastructure, characterize important loca-tions of ‘green clusters’, mainly, in this analysis, focused on the produc-tion of non-fossil fuel energy that contributes to the moderation of global warming. A key feature to be discussed in the concluding section of this chapter is that in some cases there is an element of cluster ‘species’ multi-plication that, from an evolutionary economic geography perspective can

Regional innovation, collective entrepreneurship and green clusters 41
readily be hypothesized. As shown in Figure 2.1, the Californian clean technology clusters are to be found in juxtaposition to the ICT and bio-technology, food and wine clusters of the San Francisco region of north-ern California and the wireless telecom and biotechnology clusters of San Diego in southern California. Indeed, so-called Cleantech is widely seen as arising from the combination of biotechnology (including biopolymers and biofuels), ICT (sensors) and nanotechnology (catalysts and fi ltration membranes). However, while agro-food is also one of California’s key industries, agro-food path and agro-engineering2 RIS Jacobian cluster mutation are more pronounced in the cases of Jutland and Wales (Figures 2.5 and 2.9), as we have seen, while in yet another case forestry is important to Sweden’s biofuels cluster in Örnsköldsvik (Cooke, 2007).
A fi nal, comparable instance is shown in Figure 2.10 in relation to Israel. Agro-food had long been a predominating industry there. Until the 1990s it had supplied the largest share of Israeli exports. But immigra-tion from post-Soviet Russia brought numerous highly qualifi ed scientists and engineers, for whom the Israeli government designed an innovation system programme involving construction of some 200 incubators where small start-up businesses could locate, and a public–private venture capital system to fi nance the best prospects. Some two to three thousand
AerospaceAutomotives
PhotovoltaicsFibre Optics
ElectronicsAgro-Food ©
Agro-Food (O)Arts & Crafts
©
Figure 2.9 Jacobian clusters in Wales
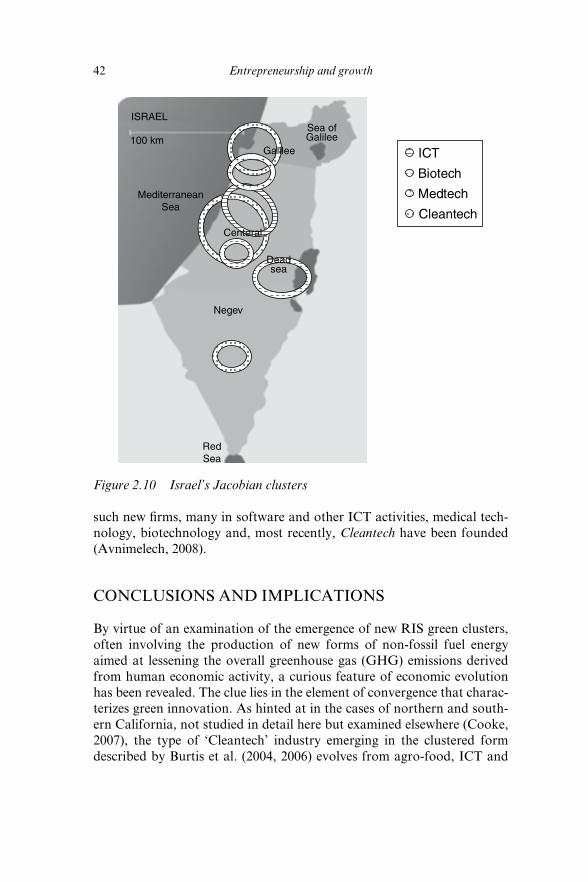
42 Entrepreneurship and growth
such new fi rms, many in software and other ICT activities, medical tech-nology, biotechnology and, most recently, Cleantech have been founded (Avnimelech, 2008).
CONCLUSIONS AND IMPLICATIONS
By virtue of an examination of the emergence of new RIS green clusters, often involving the production of new forms of non-fossil fuel energy aimed at lessening the overall greenhouse gas (GHG) emissions derived from human economic activity, a curious feature of economic evolution has been revealed. The clue lies in the element of convergence that charac-terizes green innovation. As hinted at in the cases of northern and south-ern California, not studied in detail here but examined elsewhere (Cooke, 2007), the type of ‘Cleantech’ industry emerging in the clustered form described by Burtis et al. (2004, 2006) evolves from agro-food, ICT and
ICT
Biotech
Medtech
Cleantech
ISRAEL
100 km
MediterraneanSea
RedSea
Negev
Deadsea
Centeral
Galilee
Sea ofGalilee
Figure 2.10 Israel’s Jacobian clusters

Regional innovation, collective entrepreneurship and green clusters 43
biotechnology. In North Jutland, we see something comparable having occurred. Thus the wind turbine and solar thermal clusters are found in the more agricultural and marine engineering regions of Denmark. In writing the history of the former industry, Karnøe and Jørgensen (1996) and Jørgensen and Karnøe (1995) note how the Danish design of wind tur-bines defeated the main global competitor from where a signifi cant renew-able technology demand also arose simultaneously from the 1970s, namely California. As noted, Danish wind turbine blade design was infl uenced by the agricultural engineering industry, notably the design of modern ploughing equipment. In the experimental innovation phase when some 30 fi rms engaged in the design of prototype turbine blades, knowledge spillovers from the design of propellers by marine engineers in the Jutland shipbuilding industry were also absorbed. This resulted in a three blade solution and the idea that the greater effi ciency in the operation of such blades came from pointing them into the wind. California’s aeronautics tradition, by the 1970s predominantly relying on jet propulsion, led to the recovery of historic knowledge of propeller-driven aeroplanes. This suggested a two-blade solution pointing downwind. The Danish solution proved far superior to the Californian in this technological contest.
Hence in these multi-cluster locations, it is clear that a good deal of technological convergence is possible and probably necessary. But, inter-estingly, comparable technological assets do not necessarily produce optimum solutions from such Schumpeterian ‘new combinations’. Nevertheless, it is clear that in some regions cluster forms can evolve quite readily from other cluster forms; the cluster ‘species’ multiplication giving the region more of a cluster ‘platform’ characteristic to its industrial organization. On further inspection, both California and Jutland prove to have spawned many clusters. In the former case, wine clusters overlap the horticultural zones, Hollywood’s fi lm cluster is well known and Porter (1998) also profi les other, sometimes highly specialized clusters, such as the alloy golf club cluster at Carlsbad in the southern Californian desert. Further inspection of the cluster history of Jutland (Figure 2.5) reveals the detailed cases of Salling (furniture) and Ikast (clothing), the even more closely studied NorCOM wireless telephony cluster at Ålborg (Stoerring and Dalum, 2007), the emergent BioMedico cluster also at Ålborg, as well as so far unexamined cluster candidates in insulated pipework near Ålborg, and fi sh processing equipment near Skagen, at Jutland’s northern tip. At Barritskov, east Jutland, is the estate that sustains the Årstiderne Organic Food Network, a cooperative retail network that delivers 30 000 boxes per week of organic food throughout Denmark. It could also be argued that there is a high degree of knowledge transfer from varieties of agricultural production to bioenergy production in Wales leading to possibly nascent
44 Entrepreneurship and growth
cluster formation, but also from glass technology to fi bre-optic cables and then photovoltaics by a diff erent route into renewable energy in a multi-functional opto-electronics cluster. Species multiplication or muta-tion of this kind would be perfectly consistent with an underlying theory of evolutionary economic geography, especially that part referring to the opportunities for innovation and growth arising where there is related variety among industries. Absorptive capacity for adaptation to new com-binations based on easily understood knowledge spillovers would be the mechanism by which such species multiplication is explained, as the case of Jutland’s wind turbine technology illustrates especially clearly.
In other cases, focusing on ‘green innovation’ cluster specialization, as ascribed to Marshall–Arrow–Romer (MAR) thinking, seems on the face of it to be more convincing than the idea of Jacobian clustering. Yet even where limited clustering occurs, as in Rhineland or Brazil, previously exist-ing industries, whether the coal, steel and chemicals super-clusters of the Ruhr Valley (bioremediation) or the sugar producing industry on Brazil (bioethanol), are suggestive of the presence of important spillovers from knowledge of fi ltration and ventilation in the former and fermentation in the latter cases. These were of profound importance to the evolution of new, convergent combinations of innovative products and processes. This tends to confi rm the widespread and common sense policy experience that clusters cannot be easily built in vacuo but may fi nd a less rigorous evolutionary trajectory to emergence, where the regional context gives opportunities for Schumpeterian ‘new combinations’ from regionalized ‘related variety’. Where such related variety is more attenuated, as perhaps with biofuels in Brazil or north-east England (biodiesel), fewer ‘Jacobian clusters’ emerge.
However, that is not the whole of the explanation for Jacobian cluster mutation; rather it is an important contextual factor as noted, for example, in the work of Cantwell and Iammarino (2003). Other key features that may be hypothesized, but further research is needed to test, are that Jacobian clustering benefi ts from other more social, institutional, and organizational assets, such as those listed below, in addition to more economic assets concerning related variety, knowledge spillovers and high lateral absorptive capacity:
Social capital ●
Collective entrepreneurship ●
Technological branching (‘new combinations’ opportunities) ●
Peripherality (perceived distance from key governance core) ●
Infant industry subsidy ●
Innovation system – regional research and technological institutes ●
Universities, regional innovation platform policy and funding. ●

Regional innovation, collective entrepreneurship and green clusters 45
The key concluding point of this section is that, for the fi rst time in regard to new industries, we see replication of processes that have his-torically underpinned successful regional economies that once spawned many traditional industrial districts or clusters. Evolutionists like Klepper (2002), for example, would also highlight the transfer of routines from one industry to another by means of ‘mobility of talent’, as in the cases of the US, German and Italian automotive and engineering industries (see also Boschma and Wenting, 2007). Probably the key fi ndings of this contri-bution in relation to evolutionary theory are the following. First, while Schumpeter had little to say about regional innovation, his concept of innovation by ‘railroadization’ proves to be highly apposite as an explana-tion of, at least, the case of Denmark’s opening up of North Jutland and elsewhere in the west in the nineteenth century, and its modern evolution into an arena of Jacobian clustering in related variety industries. It may prove to be, on further historical refl ection, also the case in Wales. Second, the green perspective has somehow thrown the evolution of this kind of industry organization into clearer perspective because it focuses on a horizontal and convergent technology ‘platform concept’ rather than a more traditional industrial economics perspective that emphasizes verti-cal structures like sectors or clusters. Finally, regarding cluster emergence within a Regional Innovation Systems context, the research reported showed the importance of social capital, which even in California may be considered strong, as the work of Saxenian (1994) on Silicon Valley showed, as an evolutionary driver of certain kinds of regional innova-tion system. Indeed, whether as ‘bonding’, or more institutional ‘bridg-ing’ social capital, it is the key element of the hidden power of networks, both social and institutional, that has always been at the heart of the RIS approach to evolutionary science.
This means RIS thinking may usefully be linked to a general policy perspective that aims to enhance related variety industrial structures, espe-cially where these can be embedded in established skills and capabilities suitably adapted and modernized. The aim must always involve building ‘bridging’ social capital between regional institutions and organizations, not least because these enhance the transmission of knowledge spillovers. It seems that single or few knowledge centres are also able to maximize their innovation eff ect, where there is a related variety platform to inter-act with. Geographical proximity and the possibility of Jacobian cluster mutation can be profoundly dynamic economic development vehicles in such circumstances, as demonstrated. Finally, policy organization itself must be transformed away from vertical sector and specialized cluster approaches into more horizontal, ‘joined-up’ and lateral project-based policy activity. A portfolio of relevant innovation policy instruments such
46 Entrepreneurship and growth
as those described, including fi nancial, infrastructural and skills-related instruments, must be made available as fl exible packages for entrepre-neurs. But this may also have to be conducted in a much more pragmatic way, whereby public management targeting is de-emphasized and, when it comes to subsidizing infant innovative industries, subsidies to customers to be able to purchase innovations should be considered in some contexts, such as green innovation, as possibly superior support instruments than those normally provided only to producers.
NOTES
1. This was innovated in Hollywood as a mean of fi nancing fi lms by placing revenues in a special off -balance sheet account; hence if a fi lm lost money it didn’t aff ect the health of the fi lm company, while if it was successful it was off -balance sheet so did not attract taxation until it was on the balance sheet. It was later to feature in the energy industry as the vehicle by means of which Enron and others fraudulently avoided declaring huge trading losses, fi nally bringing the fi rm to bankruptcy. Tarnished by association with Enron, recently SPV have spawned many new variants in fi nancial services as the entities into which ‘sliced and diced’ sub-prime mortgage debt was traded through variable inter-est entities (VIEs) or ‘conduits’, special investment vehicles (SIVs) and collateralized debt obligations (CDO), in 2007 leading to numerous bank collapses.
2. In Wales the cluster mutation path dependences move from agro- and mining engineer-ing to automotive and aerospace and latterly to ICT, then opto-electronics and photo-voltaics. Conventional agriculture led to alternative agriculture in functional, organic/artisan foods, biocomposites and latterly biomass and biofuels industries that show signs of potential as emergent clusters. As in Denmark arts and crafts are intimately interac-tive with rural skills such as weaving, ceramics and painting – nowadays tied closely to ‘cultural’ tourism.
REFERENCES
Andersen, P., M. Borup and M. Olesen (2006) ‘Innovation in energy technologies’, Risø Energy Report, 5, 21–27.
Avnimelech, G. (2008) An Evolutionary Model of Startup-Intensive and Venture Capital-Backed High Tech Cluster Development, Be’er Sheva: Ben Gurion University of the Negev.
Boschma, R. (2005) ‘Proximity and innovation: a critical assessment’, Regional Studies, 39, 61–74.
Boschma, R. and R. Wenting (2007) ‘The spatial evolution of the British automobile industry: does location matter?’, Industrial and Corporate Change, 16, 213–38.
Burt, R. (1992) Structural Holes: The Social Structure of Competition, Cambridge, MA: Harvard University Press.
Burtis, P., R. Epstein and R. Hwang (2004) Creating the California Cleantech Cluster, San Francisco, CA: Natural Resources Defence Association.
Burtis, P., R. Epstein and N. Parker (2006) Creating Cleantech Clusters, San Francisco, CA: Natural Resources Defence Association.
Regional innovation, collective entrepreneurship and green clusters 47
Cantwell, J. and S. Iammarino (2003) Multinational Corporations and European Regional Systems of Innovation, London: Routledge.
Casper, S., M. Lehrer and D. Soskice (1999) ‘Can high technology industries prosper in Germany? Institutional frameworks and the evolution of the German software and biotechnology industries’, Industry and Innovation, 6, 5–24.
CEC (2001) Regions: Statistical Yearbook 2001, Luxemburg: Commission of the European Communities.
Christensen, C. (1997) The Innovator’s Dilemma: When New Technologies Cause Great Firms to Fail, Boston, MA: Harvard Business School Press.
Cooke, P. (1992) ‘Regional innovation systems: competitive regulation in the new Europe’, Geoforum, 23, 365–82.
Cooke, P. (2007) Growth Cultures: The Global Bioeconomy and Its Bioregions, London: Routledge.
Cooke, P. (2008) ‘Cleantech and an analysis of the platform nature of life sci-ences: further refl ections upon platform policies’, European Planning Studies, 16, 1–19.
Cooke, P. (2009) ‘Green clusters: green innovation and Jacobian cluster mutation’, Geografi ska Annaler, 1, forthcoming.
Cooke, P. and N. Clifton (2005), ‘Social capital, fi rm embeddedness and regional development’, Regional Studies, 39, 1065–78.
Cooke, P. and N. Clifton (2007) ‘Evolving a conceptual framework: from RIS anal-ysis to “worlds” and “varieties” of regional economy and governance Culture’, Background Paper for EU FP 6 Corporate Culture and Regional Embeddedness (CURE) Research Project, Cardiff , Centre for Advanced Studies.
Cooke, P. and K. Morgan (1998) The Associational Economy, Oxford: Oxford University Press.
Cooke, P. and N. Schall (1997) ‘How do fi rms innovate?’, Regional Industrial Research Paper 29, Cardiff : Centre for Advanced Studies.
Cooke, P. and N. Schall (2007) ‘Schumpeter and varieties of innovation’, in H. Hanusch and A. Pyka (eds), The Companion to Neo-Schumpeterian Economics, Cheltenham, UK and Northampton, MA, USA: Edward Elgar publishing.
Davenport, S. and S. Leitch (2009) ‘Creating space for the successor: the discourse strategies of pro- and anti-GM factions regarding the future of agriculture in New Zealand’, European Planning Studies, 17 (7), 943–61.
Edvinsson, L. (2006) ‘Aspects of the city as a knowledge tool’, Journal of Knowledge Management, 10, 6–13.
Environment Ministry (2006) Environmental Technology Strongholds in Denmark, Copenhagen: Environment Ministry and FORA.
European Commission (2007) ‘The European Cluster Memorandum: promoting European innovation through clusters – an agenda for policy action’, available at: www.clusterobservatory.eu.
Freeman, C. (2008) Systems of Innovation: Selected Essays in Evolutionary Economics, Cheltenham, UK and Northampton, MA, USA: Edward Elgar publishing.
Granovetter, M. (1992) ‘Problems of explanation in economic sociology’, in N. Nohria and R. Eccles (eds), Networks and Organisations: Structure, Form and Action, Boston, MA: Harvard Business School Press.
Hargadon, A. (2003) How Breakthroughs Happen, Boston, MA: Harvard Business School Press.
Helpman, E. (ed.) (1998) General Purpose Technologies and Economic Growth, Cambridge, MA: MIT Press.
48 Entrepreneurship and growth
Hendry, C., J. Brown, H. Ganter and S. Hilland (2003), ‘Facilitating innovation in opto-electronics in a national, global, and regional context’, Environment and Planning C: Government and Policy, 21, 53–70.
Jacobs, J. (1969) The Economy of Cities, New York: Vintage.Jørgensen, U. and P. Karnøe (1995) ‘The Danish wind turbine story: technical
solutions to political visions’, in A. Rip, T. Misa and J. Schot (eds), Managing Technology in Society: The Approach of Constructive Technology Management, London: Pinter.
Karnøe, P. and U. Jørgensen (1996) The International Position and Development of the Danish Wind Turbine Industry, Copenhagen: AKF.
Klepper, S. (2002) ‘Capabilities of new fi rms and the evolution of the US automo-bile industry’, Industrial and Corporate Change, 11, 645–66.
Kristensen, P. (1992) ‚Industrial districts in West Jutland, Denmark’, in F. Pyke and W. Sengenberger (eds), Industrial Districts and Local Economic Development, Geneva: International Institute for Labour Studies.
Nijdam, M. and P. de Langen (2003) Leader Firms in the Netherlands Maritime Cluster, Delft: Delft University Press.
OECD (1999) S&T Indicators: Benchmarking the Knowledge-Based Economy, Paris: Organisation for Economic Co-operation and Development.
Pedersen, S. and J. Pedersen (2006) ‘Innovation and diff usion of site-specifi c crop management’, in J. Sundbo, A. Gallina, G. Serin and J. Davis (eds), Contemporary Management of Innovation, London: Palgrave.
Porter, M. (1990) The Competitive Advantage of Nations, New York: The Free Press.
Porter, M. (1998) On Competition, Boston, MA: Harvard Business School Press.Putnam, R. (1993) Making Democracy Work, Princeton, NJ: Princeton University
Press.Saxenian, A. (1994) Regional Advantage, Cambridge, MA: Harvard University
Press.Schumpeter, J. (1975) Capitalism, Socialism & Democracy, New York: Harper.Simard, C. and J. West (2003) ‘The role of founder ties in the formation of San
Diego’s “Wireless Valley”’, paper presented at DRUID summer conference Creating, Sharing and Transferring Knowledge, ‘Geographical Agglomerations’ theme, Copenhagen, 12–14 June.
Stoerring, D. (2007) ‘Emergence and growth of high technology clusters’, PhD thesis, Department of Business Studies, Aalborg University.
Stoerring, D. and B. Dalum (2007) ‘Cluster emergence: a comparative study of two cases in North Jutland, Denmark’, in P. Cooke and D. Schwartz (eds), Creative Regions: Technology, Culture and Knowledge Entrepreneurship, London: Routledge.
Teubal, M., G. Avnimelech and A. Gayego (2002) ‘Company growth, acquisitions and access to complementary assets in Israel’s data security sector’, European Planning Studies, 10, 933–54.
Whitley, R. (2000) ‘The institutional structuring of innovation strategies: business systems, fi rm types and patterns of technical change in diff erent market econo-mies’, Organization Studies, 21, 855–86.
49
3. Determinants of early-stage entrepreneurial activity in European regions: distinguishing low and high ambition entrepreneurshipNiels Bosma and Veronique Schutjens
INTRODUCTION
Entrepreneurship has received increasing attention in the past three decades and has been shown to be one of the engines of regional economic growth (Acs et al., 2003; Audretsch and Keilbach, 2004; Wennekers, 2006). Theoretically, entrepreneurship and new fi rm formation contribute to economic growth in at least three ways. First, in the Schumpeterian vocabulary, a direct economic eff ect is a result of the fact that entre-preneurs themselves are the people making ‘Neue Kombinationen’ of products and markets (Schumpeter, 1934). Schumpeter regarded an entre-preneur as ‘a master innovator, as a force behind economic development’ (Etzioni, 1987, p. 177). Among the many other scientists who defi ned entrepreneurship, ranging from Marshall’s ‘coordinator of economic resources’ in 1890 to Casson’s ‘decision maker’ (see Van Praag, 1999 for an overview), Schumpeter stood out in stressing that innovativeness is the key characteristic of an entrepreneur. This type of entrepreneur introduces new products, new processes, new market applicants and new organiza-tion structures. In the end, this innovative entrepreneurship fuels produc-tivity growth of individual fi rms – and at a higher level, regional economic development. A second direct eff ect of entrepreneurship relates to employ-ment creation. In particular, gazelles (rapidly growing fi rms, who succeed in combining resources and opportunities) fuel employment growth (Henrekson and Johansson, 2008). Many of these gazelles turn out to be young fi rms, who grow more organically than older gazelles (Henrekson and Johansson, 2008, p. 11). Finally, a third, more indirect, eff ect of entre-preneurship on economic growth, relates to the competition eff ect of new market entry, leading to passive and active learning of incumbents, and eventually to an increase in productivity.
50 Entrepreneurship and growth
In conceptualizing the economic eff ects of new fi rm formation, a key notion is entrepreneurial variety. Not all fi rms can be characterized as truly ‘entrepreneurial’ (Wennekers and Thurik, 1999) and entrepreneurial activities in the region, shaped by institutions forming the rules of the game, need not be ‘productive’ (Baumol, 1990). In reality many new fi rms walk well-trodden paths and can be regarded as imitators instead of innovators (Schutjens and Wever, 2000). Setting up a new fi rm is a risky business, and ‘playing safe’ by entering familiar markets with familiar products, can at least partly lift the burden of uncertainty. Although even imitators are necessary for knowledge diff usion, market expansion and industry development, stimulating the genuine entrepreneurial pioneers in innovation and growth presumably has the largest multiplier eff ects in the regional economy (Carree and Thurik, 2003). It seems that not only the level of regional entrepreneurship matters to the regional economy, but also the type of entrepreneurship, especially its quality (in surviving) and potential (in growth and innovative productivity). In our view the distinction between high and low ambition entrepreneurship is key to recent propositions of the role of ‘entrepreneurship capital’ (Audretsch et al., 2006) or entrepreneurship as the ‘knowledge fi lter’ (Acs et al., 2003) in fuelling economic growth. However, in seeking empirical support for this, predominantly measurements of entrepreneurship have been used that also include non-ambitious entrepreneurs; while a large share of these can, in economic terms, be in fact considered as labour or at most resemble managerial business owners with a limited distinctive impact on growth. Positive exceptions to this are studies focusing on entrepreneurship in specifi c sectors.
Because of their relatively large direct economic eff ects, it is innova-tion and growth-oriented entrepreneurship we focus on in this chapter. Following Davidsson et al. (2006) we argue that both fi rms’ growth and innovative potential are strongly determined by the aspirations and expec-tations of the entrepreneurs at the time of start-up. As argued above, most new entrepreneurs have low growth ambitions, and show satisfying behaviour in running a fi rm (small business ownership, shopkeeping or refugee fi rms), which is refl ected in relatively low survival or growth rates of new fi rms. But many people who start off with high ambitions about future growth and innovation, eventually turn their young business into a ‘gazelle’ in terms of number of employees (Birch, 1979) or into a real innovative business. Wong et al. (2005) came up with empirical evidence that high growth oriented early stage entrepreneurial activity signifi cantly stimulated GDP growth per worker, while overall early stage entrepre-neurial activity did not. With respect to employment eff ects, Autio (2007) showed that nascent and new fi rms with high job growth ambitions (10
Determinants of early-stage entrepreneurial activity in European regions 51
per cent of the sample) represented 80 per cent of total expected job crea-tion. This is in line with the work of Wiklund (2006), who stated that fi rm performance depends on entrepreneurial strategy, which can be captured by a company’s entrepreneurial orientation measured by innovation, proactiveness and risk taking.
It has been shown that most explanations of diff erences in entrepreneur-ship rates can be found at the sub-national level, instead of the national level (Reynolds et al., 2005; Sternberg, 2000; Tamásy, 2006; Bosma and Schutjens, 2009). Furthermore, there is empirical evidence of regional dif-ferences in growth- and innovation-oriented entrepreneurship (Bosma and Schutjens, 2007). What we propose is to study regional prevalence rates of ambitious, early-stage entrepreneurial activity, identifi ed at the indi-vidual level, in a similar fashion as Wong et al. (2005) did at the national level. However, where Wong et al. focused on economic eff ects in linking prevalence rates to economic growth, we investigate the determinants of regional variation in ambitious entrepreneurship.
In this chapter we therefore analyse whether some regions perform better than others in innovative- and growth-oriented entrepreneurship, and whether the regional pattern of ambitious (new) entrepreneurship in Europe diff ers from the pattern of non-ambitious entrepreneurship. Furthermore, in search for underlying processes we investigate potential determinants of the regional patterns of both non-ambitious and ambi-tious entrepreneurship. As we include factors at both the regional and the national level, this is a multilevel exercise. Studying determinants of both non-ambitious and ambitious entrepreneurship over regions and countries enables us to disentangle specifi c regional attributes (e.g. market opportu-nities), regional demography eff ects (an overrepresentation of groups of individuals with high entrepreneurial and/or ambitious spirits), and an institutional component consisting of informal institutions (culture, values, norms) and formal institutions (rules, laws, regulations) (North, 1990). The results are relevant to policy makers in two ways. First, a high preva-lence of innovative and high growth oriented early stage entrepreneurs at present, may in the near future boost employment growth or innova-tion at the fi rm level, and economic growth at the regional level (Autio et al., 2007). Second, the outcomes give insight into which spatial levels of intervention and which specifi c policy instruments can be most eff ective to stimulate promising entrepreneurial activities.
In the next section we explore the literature on explanations of regional variations in entrepreneurship and, more specifi cally, ambitious entre-preneurship. Next, we pay attention to the data and methodology we use for obtaining measures of ambitious entrepreneurial activity in European regions. Based on entrepreneurship rates calculated from over 400 000
52 Entrepreneurship and growth
individual observations from the Global Entrepreneurship Monitor (GEM), we show regional patterns of people’s involvement in diff erent types of early-stage entrepreneurial activity in 125 (mainly) Nuts1 regions in 18 European countries. In the following section we explain regional variation in four diff erent types of entrepreneurship. The last section concludes and discusses our fi ndings.
EXPLAINING REGIONAL DIFFERENCES IN ENTREPRENEURSHIP: LITERATURE REVIEW WITH A FOCUS ON AMBITIOUS ENTREPRENEURSHIP
The literature on explaining diff erences in regional entrepreneurship rates – albeit low or high ambitious entrepreneurship – shows that its underly-ing processes play at diff erent analytical levels (Schutjens and Wever, 2000). As the basic decision to start a fi rm lies within the individual, the event of taking this step highly depends on the balance between economic opportunities and individual values, preferences, personality and capa-bilities (Frank et al., 2007). At the regional level, for instance, local avail-ability of (mainly cheap) business premises, regional market perspectives, employment possibilities, competition structure and accessibility may aff ect personal opportunities. Also at the regional level, the population composition infl uences fi rm entry, as an aggregate of individual entrepre-neurial capabilities and personal attitudes towards entrepreneurship. At a higher level, both analytically and spatially, socio-cultural values and attitudes towards fi rm ownership or even national regulatory impediments matter to individual values and individual assessments of capabilities and opportunities. As a consequence, regional diff erences in entrepreneurship may be the eff ect of both specifi c regional economic attributes (e.g. job or market opportunities), a regional demography component (an overrepresen-tation of groups of individuals with high entrepreneurial spirits or actual entrepreneurial behaviour), and an institutional component encompassing informal (national or regional values concerning self-employment) and formal (national or regional regulations to employment protection, tax policies) factors.
Regional Economic Attributes
At the regional level, specifi c ‘opportunity-related’ factors may enhance or limit entrepreneurship rates. In the view of traditional industrial econom-ics, the carrying capacity of the market indicates whether there is room left for new fi rms. Market entry and exit arise from the confrontation of
Determinants of early-stage entrepreneurial activity in European regions 53
demand and supply. The industry structure involved plays an important role here, especially with respect to fi rm size, innovativeness, competition and job opportunities. Market concentration (Tödtling and Wanzenböck, 2003), a high share of small and medium sized fi rms (Fritsch, 1992), and high entry and exit barriers negatively aff ect new fi rm entrance. It has also been stated that turbulent and high growth industrial sectors generate more innovative start-ups than mature industries (Schumpeter, 1942). A negative relation exists between high shares of alternative job opportu-nities and entrepreneurship. On the demand side, market potential and market growth, as well as GDP change, infl uence fi rm formation. Market conditions both at the national and the regional level infl uence entrepre-neurial activity: good market opportunities will trigger new entrepreneurs. Originally based on the urban incubator hypothesis, the large market potential in terms of both customers and suppliers and high knowledge intensity are important benefi ts for potential entrepreneurs (Tödtling and Wanzenböck, 2003). With respect to agglomeration economies, the current debate is whether the presence of similar types of fi rms or diff erent fi rm types stimulates new fi rm formation (localization and urbanization eff ects respectively) (Fotopoulos and Louri, 2000, Rocha and Sternberg, 2005). Also, regional unemployment rates may aff ect start-up rates, in the sense that for the unemployed the opportunity costs of self-employment are relatively low.
The Regional Demography Component
As starting a fi rm is an individual decision, individual characteristics are important determinants of new fi rm formation. Therefore many scholars in the fi eld of entrepreneurship use the labour market approach, instead of the business stock perspective, when explaining regional rates of entry (Bosma et al., 2008c). As in the latter perspective entrepreneurship or fi rm formation rates are calculated as a percentage of the existing busi-ness stock, it assumes that characteristics of the incumbent fi rms, such as numbers or average fi rm size, lie behind fi rm formation. In contrast, the labour market approach, in which the rate of new fi rms is measured with labour market size as the denominator, emphasizes that individual decisions depend on personal characteristics or – at a regional level – on population structure (Santarelli and Vivarelli, 2007). According to this labour market approach to fi rm formation (Koster, 2007), age structure, gender and education structure of the population play a central role in explaining fi rm formation rates (Delmar and Davidsson, 2000). In their study on the eff ects of social capital on new fi rms, Liao and Welsch (2003) stress that in the early fi rm formation stage, getting access to resources is
54 Entrepreneurship and growth
crucial, and that social capital ‘can be a substitute for other resources’ (p. 152). A relatively recent but popular contribution to this view is the work of Florida (Lee et al., 2004), pointing to the positive eff ect of a creative class on entrepreneurship and especially new fi rm formation.
An Institutional Component
As regards informal institutions, there is a widely held view that entre-preneurial perceptions precede entrepreneurial activity (see e.g. Arenius and Minniti, 2005; Freytag and Thurik, 2007). For instance in the GEM conceptual model that is used to guide the GEM data collection, entrepre-neurial perceptions – in particular perceived opportunities and perceived capabilities – are thought to be intermediate states between so-called ‘Entrepreneurial Framework Conditions’ (EFCs) and entrepreneurial activity.1 Levie and Autio (2008) extensively describe these relationships and test the impact for one of these entrepreneurial framework conditions: entrepreneurship education and training. For high income countries they fi nd that there is a positive link between the EFC on ‘Higher education’ and the perceived opportunities to start a business, controlling for other relevant factors.2 They also fi nd a positive link between perceived oppor-tunities and early-stage entrepreneurial activity – overall as well as high growth oriented early-stage entrepreneurial activity – and that perceived opportunities are moderating the eff ect of higher education on entre-preneurial activity. Freytag and Thurik (2007) did not fi nd a direct link between measures of national entrepreneurial culture and entrepreneurial activity, even though the relationship between national entrepreneurial culture and entrepreneurial preference was signifi cant. A possible explana-tion is the spatial level applied in their work. Attitudes to entrepreneur-ship may, as discussed above, diff er within countries and therefore impact entrepreneurial activity at the regional level rather than the national level.
At the regional level, indeed, a positive relationship exists between entrepreneurial perceptions and entrepreneurial activity (Bosma and Schutjens, 2009). Regions with higher levels of entrepreneurial percep-tions show higher levels of entrepreneurial activity. This in itself does not exclusively point at a positive impact of entrepreneurial attitudes on entrepreneurial activity; it is also established that the reverse eff ect may hold: entrepreneurial activity can manifest ‘contagiously’ in the region. Bosma et al. (2008b) found in an empirical study on three Dutch regions (based on the GEM survey) that for more than half of the early-stage entrepreneurs another entrepreneur – or fi rm – served as an example when setting up their fi rms. Over 70 per cent of the entrepreneurial role models worked in the same labour market area. Also, the vast majority of people
Determinants of early-stage entrepreneurial activity in European regions 55
who personally knew someone who started their business in the past two years lived in the same labour market area. These fi ndings point at a reinforcing mechanism between entrepreneurial perceptions and entre-preneurial activity. The results of this study also make clear that the net-working activities by individuals – the ‘personifi cation’ of this reinforcing mechanism – largely take place within the region.
A second noteworthy issue is that there could be regional and national forces at play that hinder (or reinforce) a direct ‘transition’ from attitudes to activity. For example, if region A is characterized by an abundance of good job opportunities, or a high degree of social security, thus increas-ing the opportunity costs of entrepreneurship for individuals, the observed entrepreneurial activity may be lower than what could be expected from observed entrepreneurial attitudes. These interaction eff ects should be taken into account. A regional indicator comprising (individual) attitudes toward entrepreneurship and business ownership, may contribute to our understanding of variations in (diff erent types of) entrepreneurship rates, especially if it is also possible to take the abovementioned opportunity costs of entrepreneurship into account.
From the studies focusing on international diff erences in formal insti-tutions related to entrepreneurship, the impact of national factors on entrepreneurial attitude and maybe even subsequently activity is striking. The World Bank report (2005) has revealed enormous national diff erences with respect to laws, regulations and procedures in entrepreneurship regis-tration. These regulatory obstacles may discourage entrepreneurial spirit.3 Therefore national institutional forces (regulations, policy instruments) also aff ect entrepreneurial activity. With respect to entrepreneurship policy, large national diff erences exist – and have always existed, accord-ing to an extensive international comparison of policy in ten countries (Stevenson and Lundström, 2001). Within many European countries, spe-cifi c regional policy instruments have been used to aff ect entrepreneurship rates, but the most infl uential factors (taxes, regulations, and laws) are still set out by national policy makers.
Ambitious Entrepreneurship
As mentioned earlier, it is a stylized fact that entrepreneurship has many diff erent faces. Not all entrepreneurs start a fi rm that survives and eventually grows into a large or innovative business, as the distinctions between managerial business owners, imitative and innovative entrepre-neurs (Wennekers and Thurik, 1999; Koellinger, 2008), ‘real’ entrepre-neurs and ‘revolving door’ entrepreneurs (Santarelli and Vivarelli, 2007, p. 464) or ‘mice, gazelles and elephants’ (Acs and Mueller, 2008) indicate.
56 Entrepreneurship and growth
The employment and innovation eff ect of new fi rms shows enormous vari-ation, which has to be taken into account in linking economic growth to entrepreneurship (Baumol, 1990). In explaining actual fi rm growth and innovation, factors of diff erent spatial levels come up: individual factors, fi rm characteristics, industry eff ects, business cycle eff ects, (regional) market size and growth. However, there is only limited empirical evidence of factors explaining actual fi rm growth or innovative performance of new fi rms, mainly because of the longitudinal data needed. A notable exception is the seminal work of Davidsson (1991), who conducted a longitudinal analysis on realized fi rm growth showing that growth motivation of the entrepreneur had a signifi cantly positive eff ect. Vivarelli and Audretsch (1998) also found empirical evidence of a positive eff ect of innovative propensity on post-entry performance, both in economic returns, employ-ment growth and export growth. In another study, Arrighetti and Vivarelli (1999) also found that innovative motivation and previous innovative experience positively correlated with post-entry performance.
However, this is not to say that growth motivation is the only factor aff ecting fi rm growth, as evidence shows that despite high aspirations many new entrepreneurs do not reach their goals. Also the other way around: fi rm growth may occur even among entrepreneurs without explicit growth ambitions. The same goes for entrepreneurial intentions with respect to innovation, of which a realistic assessment at the time of start-up is almost impossible. According to Koellinger et al. (2007), many new entrepreneurs are overconfi dent about their own entrepreneurial capacities and are overoptimistic about future prospects. This incapacity to grasp market and competition reality at the time of start-up and the inability to manage internal and external threats to and opportunities for the fi rm in the early stages of its life course are the main reasons why growth ambition and actual fi rm growth are not perfectly correlated. Furthermore, entrepre-neurial growth intentions may change over time, especially in the fi rst period after a venture is initiated (Kreuger, 2000; Dutta and Thornhill, 2008). However, we may conclude that entrepreneurial ambition is a strong predictor of actual fi rm performance in later stages.
In our search for explanations of regional diff erences in ambitious entrepreneurship rates, again we seek refuge in the labour market per-spective. As we support the view that at the basis of entrepreneurship is a person taking the step to start a business, conditioned by individual and personality characteristics, we believe these aspects are even more important when we focus on his or her ambitions or intentions related to this fi rm. Eventually, especially in the early stages, fi rms are embodied by the person or persons who founded them and the ambitions of the new fi rm can then be equated with the ambitions of the entrepreneur involved
Determinants of early-stage entrepreneurial activity in European regions 57
(Garnsey et al., 2006). Our focus on the individual level is also justifi ed by the extensive literature overview on drivers of initial growth intention carried out by Dutta and Thornhill (2008), who found many more studies with empirical evidence on eff ects of individual factors, than with evidence of organizational or environmental eff ects.
Turning back to Davidsson’s fi nding that entrepreneurial motivations aff ect actual outcomes, he also showed that this motivation depends on the entrepreneur’s ability, opportunity and need to grow. However, even more interesting was his conclusion that not only objective measures of ability, opportunity and need matter, but also the entrepreneur’s indi-vidual perception of ability, opportunity and need. He concluded that objective aspects only explain part of actual growth. In this view, variables related to the personal characteristics of the entrepreneur, the fi rm or the environment, are less important.
If perceptions of individual ability, opportunity and need are important to fi rm growth motivation, what then explains these individual perceptions? The theory of planned behaviour (Ajzen, 1985, 1991) sheds light on this relation between motivations, perceptions and actual behaviour. The idea is that a person’s value attached to certain behaviour is strongly aff ected by the expected consequences of this particular behaviour (Wiklund et al., 2003). If nascent entrepreneurs perceive high administrative burdens associated with hiring and fi ring employees, their ambitions in terms of fi rm size will be relatively low. This line of reasoning also applies to posi-tive eff ects: when regional income and welfare are high or growing, people expect market growth they can take advantage of by starting a new ambi-tious fi rm. In this sense, GRP growth might trigger highly ambitious entre-preneurs. From their empirical study on revenue aspirations of nascent entrepreneurs, Liao and Welsch (2003) conclude that social capital (both network size and trust) positively infl uences growth aspiration, while human capital variables (experience and education) have no eff ect. A sig-nifi cant positive eff ect of fi nancial capital on growth aspirations, however, existed, together with a positive infl uence of cognitive capital; that is, strong shared norms and values.
Based on both Ajzen’s theory of planned behaviour and the fi ndings of Liao and Welsch, it can be expected that traditional explanations based on entrepreneurial characteristics such as age and education level only par-tially explain ambitious entrepreneurship. In the explanatory studies on fi rm growth ambitions of Wiklund et al. (2003), Davidsson (1991) and Liao and Welsch (2003), personal characteristics of the entrepreneur, the fi rm or the environment, are less important than perceptions, personal strate-gies and shared values. Koellinger (2008) also found empirical evidence for the importance of perceptions in explaining innovative aspirations of

58 Entrepreneurship and growth
nascent entrepreneurs. These innovative ambitions strongly correlated with perceptions of both individual skills and regional opportunities, next to gender, education level, working status and national economic devel-opment. Based on this, compared to general entrepreneurial activity, in analysing ambitious entrepreneurship we might expect lower explanatory power of entrepreneurial personal characteristics, and stronger eff ects of entrepreneurial attitudes, values and perceptions towards future fi rm growth or innovation (Koellinger, 2008; see also Wiklund et al., 2003). Both hypotheses on ambitious entrepreneurship – that is: (1) compared to non-ambitious entrepreneurship, the relatively limited signifi cance of traditional determinants in explaining regional diff erences in ambitious entrepreneurship, and (2) compared to non-ambitious entrepreneurship, the relatively large eff ect of (regional) entrepreneurial attitudes in studying ambitious entrepreneurship – are tested in this chapter.
DATA AND METHODOLOGY
We use data from the Global Entrepreneurship Monitor (GEM) for creat-ing indicators on regional entrepreneurial activity (dependent variables) and attitudes (independent variables). Additional independent variables at the regional level are obtained from Cambridge Econometrics, European Regional Data and at the national level from the OECD. The selection of countries included in our study is restricted by data availability. First, we require GEM participation for at least three years in the 2001–06 period. This results in indices on entrepreneurial activity and entrepreneurial per-ceptions over 125 larger regions in 18 countries.4 By mapping these indica-tors we are able initially to explore cultural, institutional and urbanization eff ects relating to our four measures of entrepreneurial activity. We then proceed with empirically investigating determinants of each type of entre-preneurial activity. To this end, we fi rst identify some dense regions situated in the previously identifi ed larger regions; if the sample size permits us to do so, we abstract these dense regions and treat them separate from the larger region they are part of. An example is the Munich metropolitan area. This area is situated in the Nuts1 region of Bavaria. However, based on the literature we can expect diff erent patterns of entrepreneurial activity in the Munich area as compared to the rest of Bavaria. Therefore we identify Munich and the Bavarian region excluding Munich as two separate regions in our empirical analysis. In sum, this exercise leads to an augmented sample of 147 regions.5 Because of data availability for the independent variables and our restriction of a sample size of at least 750 valid cases per region, we end up with 121 observations over 16 countries in the regression analysis.

Determinants of early-stage entrepreneurial activity in European regions 59
Dependent Variables
Since 1999 GEM has provided several national indicators on entrepre-neurial activity for an increasing number of countries (see Reynolds et al., 2005; Bosma et al., 2008a). The indicators are based on telephone surveys among the adult population. A key GEM indicator is the early-stage entrepreneurial activity (ESEA) rate.6 This measure is defi ned as the prevalence rate (in the 18–64 population) of individuals who are involved in either nascent entrepreneurship or involved as an owner-manager in a new fi rm existing for up to 42 months. Nascent entrepreneurs are identi-fi ed as individuals who are, at the time of the GEM survey, setting up a business. Moreover they have indicated: (1) that they have ‘done anything to help start a new business, such as looking for equipment or a location, organizing a start-up team, working on a business plan, beginning to save money, or any other activity that would help launch a business’; and (2) that they will be the single owner or a co-owner of the fi rm in gestation. Also, they have not paid any salaries, wages or payment in kind (includ-ing to themselves) for more than three months – if they have they are considered to be an owner-manager of a (new) fi rm.
While the ESEA rate is an ‘overall’ measure of early-stage entrepre-neurial activity, identifying diff erent types is also possible. An example of a specifi c type of entrepreneurship is ‘high growth-expectation’ entrepre-neurship (see e.g. Autio, 2007). We make a similar distinction but identify three diff erent groups of growth orientation:
1. Early-stage entrepreneurial activity with low growth ambitions (ESEAGR_LO): Individuals in early-stage entrepreneurial activity who expect to have no more than one employee in the next fi ve years
2. Early-stage entrepreneurial activity with modest growth ambitions (ESEAGR_MD): Individuals in early-stage entrepreneurial activity who expect to have between two and nine employees in the next fi ve years
3. Early-stage entrepreneurial activity with high growth ambitions (ESEAGR_HI): Individuals in early-stage entrepreneurial activity who expect to have ten or more employees in the next fi ve years
A second type of entrepreneurship involves the innovative orientation of early-stage entrepreneurs. All entrepreneurs have been asked to indicate if all, many or none of their (potential) customers consider this product or service new and unfamiliar (answers: all/some/none). Also, they have indicated if many, few, or no other businesses are off ering the same prod-ucts or services to their (potential) customers. We identify early-stage
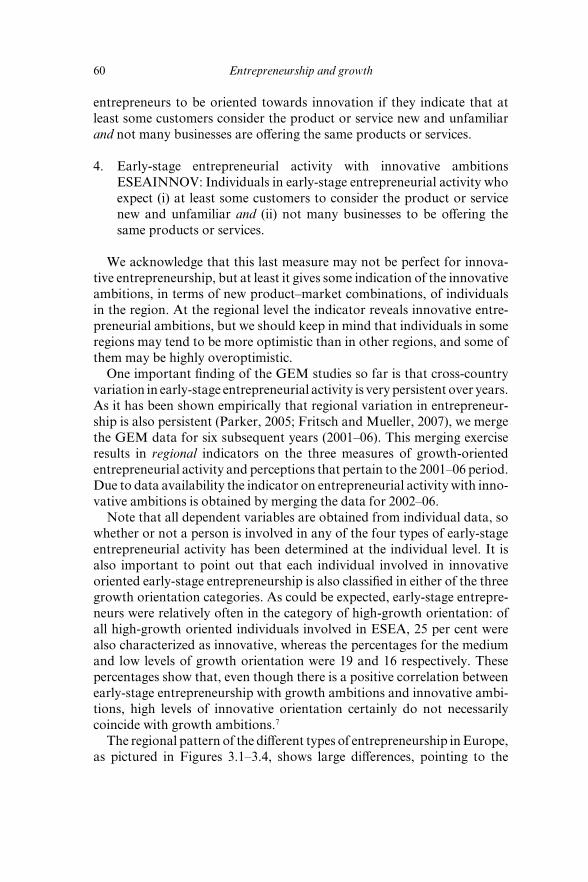
60 Entrepreneurship and growth
entrepreneurs to be oriented towards innovation if they indicate that at least some customers consider the product or service new and unfamiliar and not many businesses are off ering the same products or services.
4. Early-stage entrepreneurial activity with innovative ambitions ESEAINNOV: Individuals in early-stage entrepreneurial activity who expect (i) at least some customers to consider the product or service new and unfamiliar and (ii) not many businesses to be off ering the same products or services.
We acknowledge that this last measure may not be perfect for innova-tive entrepreneurship, but at least it gives some indication of the innovative ambitions, in terms of new product–market combinations, of individuals in the region. At the regional level the indicator reveals innovative entre-preneurial ambitions, but we should keep in mind that individuals in some regions may tend to be more optimistic than in other regions, and some of them may be highly overoptimistic.
One important fi nding of the GEM studies so far is that cross-country variation in early-stage entrepreneurial activity is very persistent over years. As it has been shown empirically that regional variation in entrepreneur-ship is also persistent (Parker, 2005; Fritsch and Mueller, 2007), we merge the GEM data for six subsequent years (2001–06). This merging exercise results in regional indicators on the three measures of growth- oriented entrepreneurial activity and perceptions that pertain to the 2001–06 period. Due to data availability the indicator on entrepreneurial activity with inno-vative ambitions is obtained by merging the data for 2002–06.
Note that all dependent variables are obtained from individual data, so whether or not a person is involved in any of the four types of early-stage entrepreneurial activity has been determined at the individual level. It is also important to point out that each individual involved in innovative oriented early-stage entrepreneurship is also classifi ed in either of the three growth orientation categories. As could be expected, early-stage entrepre-neurs were relatively often in the category of high-growth orientation: of all high-growth oriented individuals involved in ESEA, 25 per cent were also characterized as innovative, whereas the percentages for the medium and low levels of growth orientation were 19 and 16 respectively. These percentages show that, even though there is a positive correlation between early-stage entrepreneurship with growth ambitions and innovative ambi-tions, high levels of innovative orientation certainly do not necessarily coincide with growth ambitions.7
The regional pattern of the diff erent types of entrepreneurship in Europe, as pictured in Figures 3.1–3.4, shows large diff erences, pointing to the
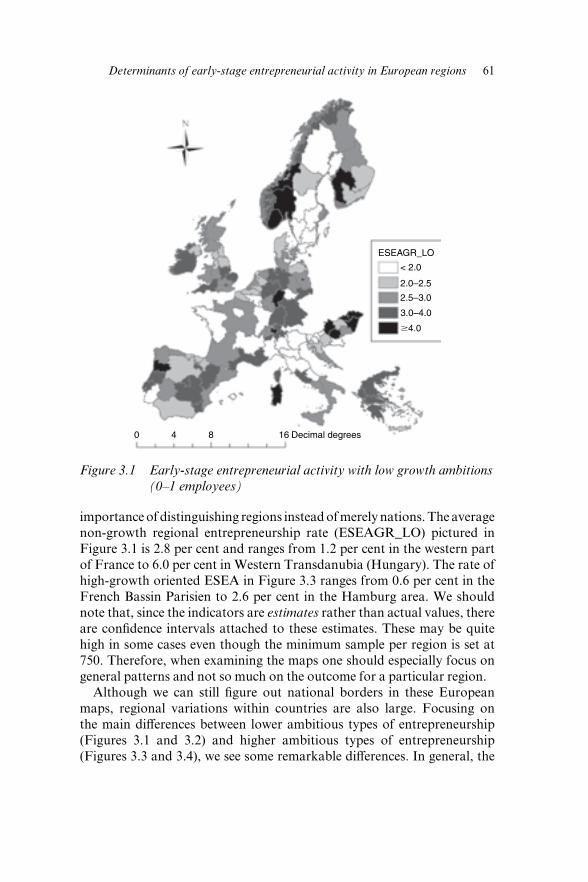
Determinants of early-stage entrepreneurial activity in European regions 61
importance of distinguishing regions instead of merely nations. The average non-growth regional entrepreneurship rate (ESEAGR_LO) pictured in Figure 3.1 is 2.8 per cent and ranges from 1.2 per cent in the western part of France to 6.0 per cent in Western Transdanubia (Hungary). The rate of high-growth oriented ESEA in Figure 3.3 ranges from 0.6 per cent in the French Bassin Parisien to 2.6 per cent in the Hamburg area. We should note that, since the indicators are estimates rather than actual values, there are confi dence intervals attached to these estimates. These may be quite high in some cases even though the minimum sample per region is set at 750. Therefore, when examining the maps one should especially focus on general patterns and not so much on the outcome for a particular region.
Although we can still fi gure out national borders in these European maps, regional variations within countries are also large. Focusing on the main diff erences between lower ambitious types of entrepreneurship (Figures 3.1 and 3.2) and higher ambitious types of entrepreneurship (Figures 3.3 and 3.4), we see some remarkable diff erences. In general, the
ESEAGR_LO
0 4 8 16 Decimal degrees
< 2.0
2.0–2.5
2.5–3.0
3.0–4.0
�4.0
Figure 3.1 Early-stage entrepreneurial activity with low growth ambitions (0–1 employees)
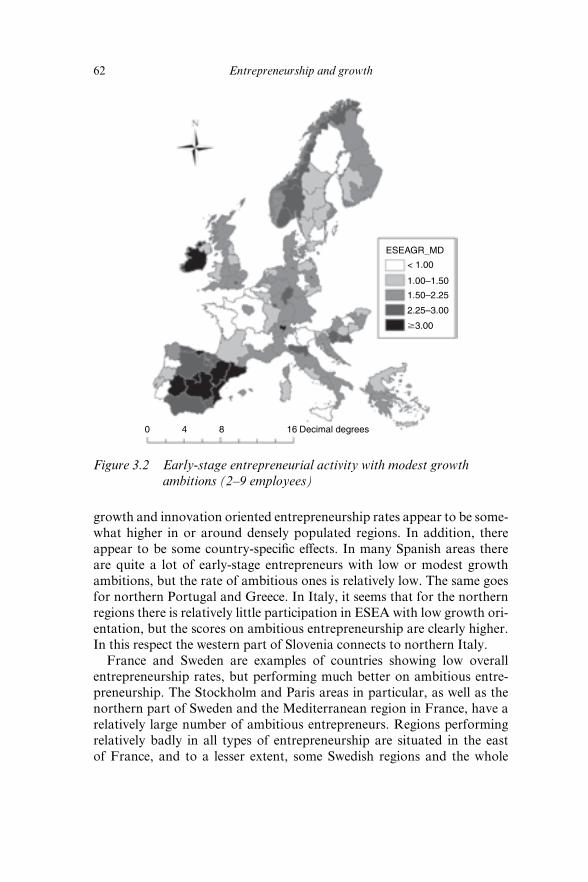
62 Entrepreneurship and growth
growth and innovation oriented entrepreneurship rates appear to be some-what higher in or around densely populated regions. In addition, there appear to be some country-specifi c eff ects. In many Spanish areas there are quite a lot of early-stage entrepreneurs with low or modest growth ambitions, but the rate of ambitious ones is relatively low. The same goes for northern Portugal and Greece. In Italy, it seems that for the northern regions there is relatively little participation in ESEA with low growth ori-entation, but the scores on ambitious entrepreneurship are clearly higher. In this respect the western part of Slovenia connects to northern Italy.
France and Sweden are examples of countries showing low overall entrepreneurship rates, but performing much better on ambitious entre-preneurship. The Stockholm and Paris areas in particular, as well as the northern part of Sweden and the Mediterranean region in France, have a relatively large number of ambitious entrepreneurs. Regions performing relatively badly in all types of entrepreneurship are situated in the east of France, and to a lesser extent, some Swedish regions and the whole
ESEAGR_MD
0 4 8 16 Decimal degrees
< 1.00
1.00–1.50
1.50–2.25
2.25–3.00
�3.00
Figure 3.2 Early-stage entrepreneurial activity with modest growth ambitions (2–9 employees)
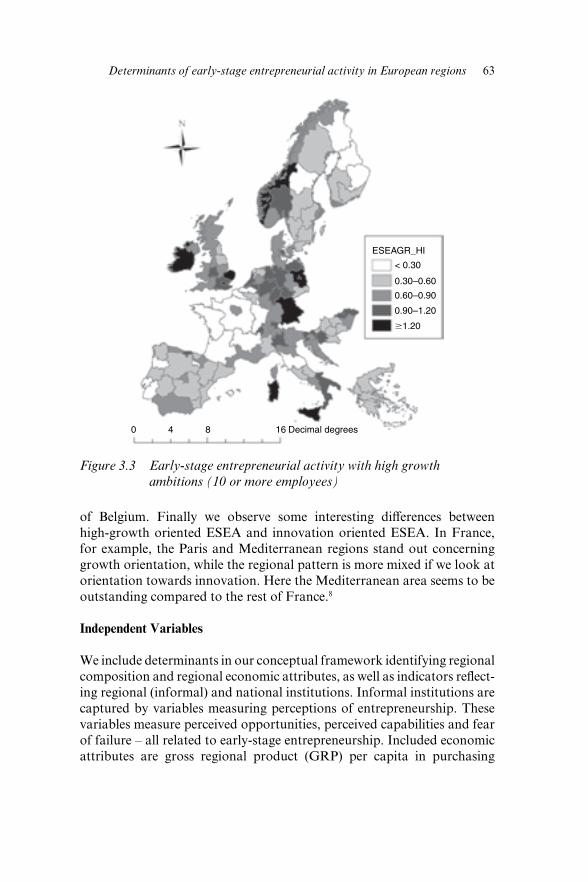
Determinants of early-stage entrepreneurial activity in European regions 63
of Belgium. Finally we observe some interesting diff erences between high-growth oriented ESEA and innovation oriented ESEA. In France, for example, the Paris and Mediterranean regions stand out concerning growth orientation, while the regional pattern is more mixed if we look at orientation towards innovation. Here the Mediterranean area seems to be outstanding compared to the rest of France.8
Independent Variables
We include determinants in our conceptual framework identifying regional composition and regional economic attributes, as well as indicators refl ect-ing regional (informal) and national institutions. Informal institutions are captured by variables measuring perceptions of entrepreneurship. These variables measure perceived opportunities, perceived capabilities and fear of failure – all related to early-stage entrepreneurship. Included economic attributes are gross regional product (GRP) per capita in purchasing
ESEAGR_HI
0 4 8 16 Decimal degrees
< 0.30
0.30–0.60
0.60–0.90
0.90–1.20
�1.20
Figure 3.3 Early-stage entrepreneurial activity with high growth ambitions (10 or more employees)
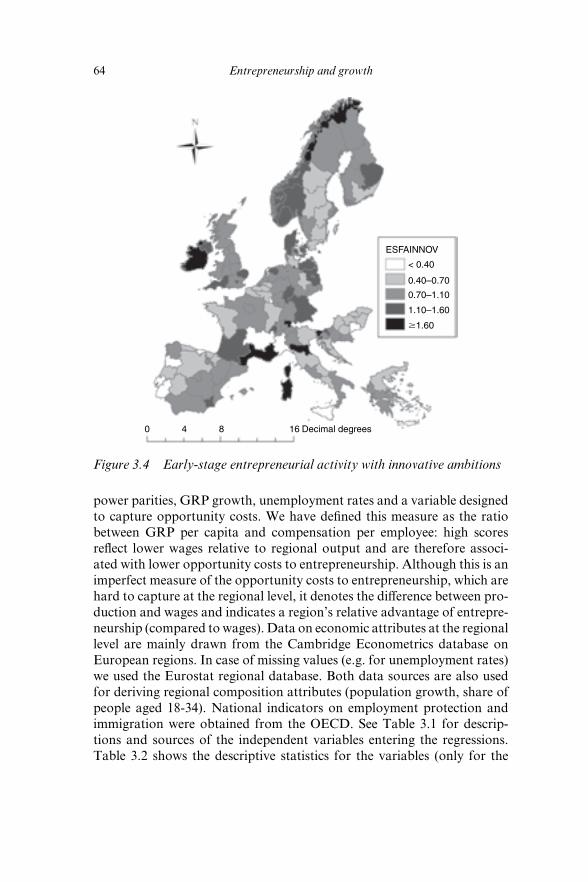
64 Entrepreneurship and growth
power parities, GRP growth, unemployment rates and a variable designed to capture opportunity costs. We have defi ned this measure as the ratio between GRP per capita and compensation per employee: high scores refl ect lower wages relative to regional output and are therefore associ-ated with lower opportunity costs to entrepreneurship. Although this is an imperfect measure of the opportunity costs to entrepreneurship, which are hard to capture at the regional level, it denotes the diff erence between pro-duction and wages and indicates a region’s relative advantage of entrepre-neurship (compared to wages). Data on economic attributes at the regional level are mainly drawn from the Cambridge Econometrics database on European regions. In case of missing values (e.g. for unemployment rates) we used the Eurostat regional database. Both data sources are also used for deriving regional composition attributes (population growth, share of people aged 18-34). National indicators on employment protection and immigration were obtained from the OECD. See Table 3.1 for descrip-tions and sources of the independent variables entering the regressions. Table 3.2 shows the descriptive statistics for the variables (only for the
ESFAINNOV
0 4 8 16 Decimal degrees
< 0.40
0.40–0.70
0.70–1.10
1.10–1.60
�1.60
Figure 3.4 Early-stage entrepreneurial activity with innovative ambitions
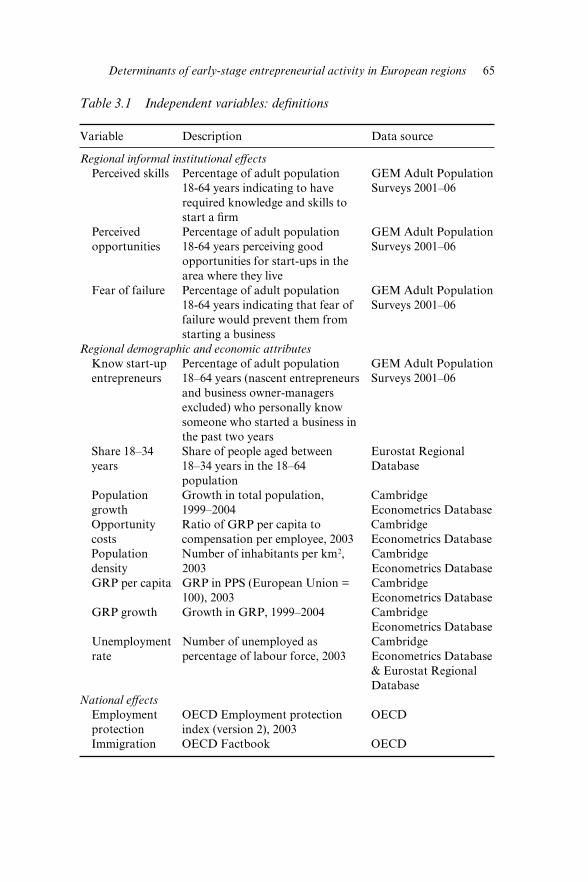
Determinants of early-stage entrepreneurial activity in European regions 65
Table 3.1 Independent variables: defi nitions
Variable Description Data source
Regional informal institutional eff ects Perceived skills Percentage of adult population
18-64 years indicating to have required knowledge and skills to start a fi rm
GEM Adult Population Surveys 2001–06
Perceived opportunities
Percentage of adult population 18-64 years perceiving good opportunities for start-ups in the area where they live
GEM Adult Population Surveys 2001–06
Fear of failure Percentage of adult population 18-64 years indicating that fear of failure would prevent them from starting a business
GEM Adult Population Surveys 2001–06
Regional demographic and economic attributes Know start-up
entrepreneursPercentage of adult population 18–64 years (nascent entrepreneurs and business owner-managers excluded) who personally know someone who started a business in the past two years
GEM Adult Population Surveys 2001–06
Share 18–34 years
Share of people aged between 18–34 years in the 18–64 population
Eurostat Regional Database
Population growth
Growth in total population, 1999–2004
Cambridge Econometrics Database
Opportunity costs
Ratio of GRP per capita to compensation per employee, 2003
Cambridge Econometrics Database
Population density
Number of inhabitants per km2, 2003
Cambridge Econometrics Database
GRP per capita GRP in PPS (European Union = 100), 2003
Cambridge Econometrics Database
GRP growth Growth in GRP, 1999–2004 Cambridge Econometrics Database
Unemployment rate
Number of unemployed as percentage of labour force, 2003
Cambridge Econometrics Database & Eurostat Regional Database
National eff ects Employment
protectionOECD Employment protection index (version 2), 2003
OECD
Immigration OECD Factbook OECD
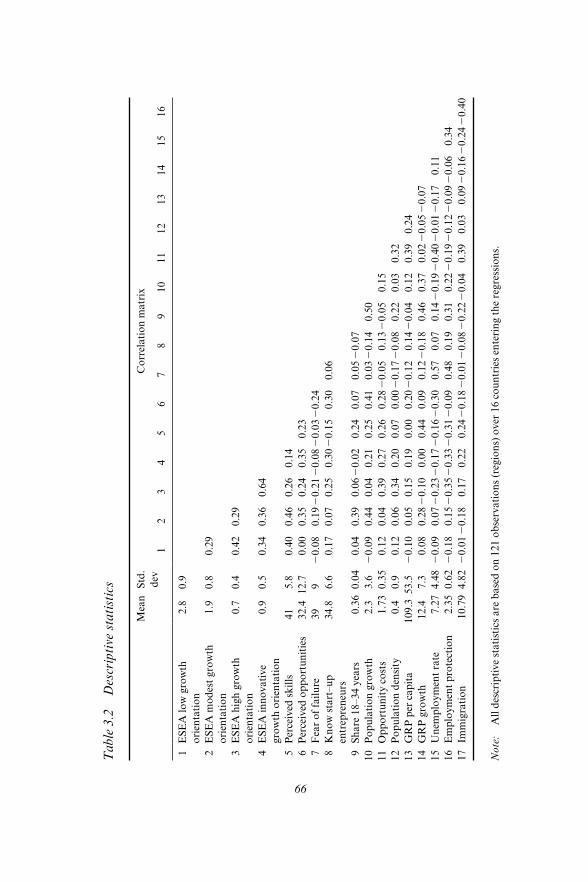
66
Tab
le 3
.2
Des
crip
tive
stat
istic
s
Mea
nSt
d.
dev
Cor
rela
tion
mat
rix
12
34
56
78
910
1112
1314
1516
1E
SEA
low
gro
wth
or
ient
atio
n2.
80.
9
2E
SEA
mod
est g
row
th
orie
ntat
ion
1.9
0.8
0.29
3E
SEA
hig
h gr
owth
or
ient
atio
n0.
70.
40.
420.
29
4E
SEA
inno
vativ
e gr
owth
orie
ntat
ion
0.9
0.5
0.34
0.36
0.64
5Pe
rcei
ved
skill
s41
5.8
0.40
0.46
0.26
0.14
6Pe
rcei
ved
oppo
rtun
ities
32.4
12.7
0.00
0.35
0.24
0.35
0.23
7F
ear o
f fai
lure
39
92
0.08
0.19
20.
212
0.08
20.
032
0.24
8K
now
star
t–up
en
trep
rene
urs
34.8
6.6
0.17
0.07
0.25
0.30
20.
150.
300.
06
9Sh
are
18–3
4 ye
ars
0.36
0.04
0.04
0.39
0.06
20.
020.
240.
070.
052
0.07
10Po
pula
tion
grow
th2.
33.
62
0.09
0.44
0.04
0.21
0.25
0.41
0.03
20.
140.
5011
Opp
ortu
nity
cos
ts1.
730.
350.
120.
040.
390.
270.
260.
282
0.05
0.13
20.
050.
1512
Popu
latio
n de
nsity
0.4
0.9
0.12
0.06
0.34
0.20
0.07
0.00
20.
172
0.08
0.22
0.03
0.32
13G
RP
per c
apita
109.
353
.52
0.10
0.05
0.15
0.19
0.00
0.20
20.
120.
142
0.04
0.12
0.39
0.24
14G
RP
grow
th12
.47.
30.
080.
282
0.10
0.00
0.44
0.09
0.12
20.
180.
460.
370.
022
0.05
20.
0715
Une
mpl
oym
ent r
ate
7.27
4.48
20.
090.
072
0.23
20.
172
0.16
20.
300.
570.
070.
142
0.19
20.
402
0.01
20.
170.
1116
Em
ploy
men
t pro
tect
ion
2.35
0.62
20.
180.
152
0.35
20.
332
0.31
20.
090.
480.
190.
310.
222
0.19
20.
122
0.09
20.
060.
3417
Imm
igra
tion
10.7
94.
822
0.01
20.
180.
170.
220.
242
0.18
20.
012
0.08
20.
222
0.04
0.39
0.03
0.09
20.
162
0.24
20.
40
Not
e:
All
desc
riptiv
e st
atist
ics a
re b
ased
on
121
obse
rvat
ions
(reg
ions
) ove
r 16
coun
trie
s ent
erin
g th
e re
gres
sions
.
Determinants of early-stage entrepreneurial activity in European regions 67
regions included in the empirical analysis). We intended to include social security rates in accordance with Hessels et al. (2007). However, in tests for multicollinearity, the high correlation between social security rates and employment protection gave some problems. We decided to include the employment protection index because this measure is more specifi c and because we are particularly interested in its eff ect on ambitious types of early-stage entrepreneurial activity. Individuals who have the potential to become a growth or innovation oriented entrepreneur may prefer to remain employed if there are strong employment benefi ts.
Potential reversed causality issues at the individual level (I am ambitious because I have succeeded so far versus I am ambitious and therefore I will be successful) are to some extent prevented by adopting the regional level rather than the individual level. However, as described earlier, also at the regional level reversed causality is not ruled out. One should also be cau-tious when interpreting our results with respect to informal eff ects meas-ured by perceptions of entrepreneurship. Signifi cantly positive results are more likely to be interpreted as a two-way reinforcing mechanism between perceptions and activity. Therefore, we initially run a regression model excluding the variables measuring perceptions of entrepreneurship. This enables us to better grasp the eff ects informal institutions can have and to what extent they interplay with the other determinants. The regression analysis has been conducted for the dependent variables separately, using multilevel analysis (allowing for random intercepts for country levels). The likelihood ratio tests all suggested that we should indeed consider the national level as a relevant spatial scale.9
RESULTS AND IMPLICATIONS
What now determines the regional variation in the four distinguished types of early-stage entrepreneurship? The estimation results are described in Table 3.3. Each type of entrepreneurship is assessed by two models; the fi rst excluding informal institutional eff ects and the second including these determinants. All dependent and independent variables have been standardized before they entered the regression. A fi rst overview of the table gives support to the hypothesis that non-ambitious entrepreneur-ship has diff erent determinants as compared to ambitious entrepreneur-ship. In particular the explanations for the fi rst two types of early-stage entrepreneurship (models 1 and 2) diff er from those for the high-growth oriented ESEA (model 3) and innovation oriented ESEA (model 4). Early-stage entrepreneurial activity with no growth orientation is largely explained by perception of skills and knowledge to start a business
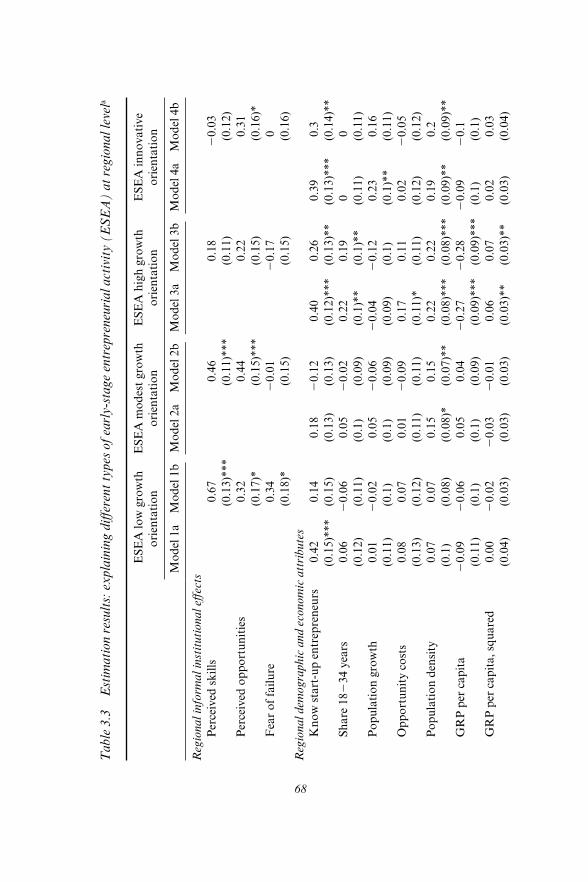
68
Tab
le 3
.3
Est
imat
ion
resu
lts: e
xpla
inin
g di
ff ere
nt ty
pes o
f ear
ly-s
tage
ent
repr
eneu
rial
act
ivity
(E
SEA
) at
regi
onal
leve
la
ESE
A lo
w g
row
th
orie
ntat
ion
ESE
A m
odes
t gro
wth
or
ient
atio
nE
SEA
hig
h gr
owth
or
ient
atio
nE
SEA
inno
vativ
e or
ient
atio
n
Mod
el 1
aM
odel
1b
Mod
el 2
aM
odel
2b
Mod
el 3
aM
odel
3b
Mod
el 4
aM
odel
4b
Reg
iona
l inf
orm
al in
stitu
tiona
l eff e
cts
Perc
eive
d sk
ills
0.67
(0.1
3)**
*0.
46(0
.11)
***
0.18
(0.1
1)2
0.03
(0.1
2)
Pe
rcei
ved
oppo
rtun
ities
0.32
(0.1
7)*
0.44
(0.1
5)**
*0.
22(0
.15)
0.31
(0.1
6)*
Fea
r of f
ailu
re
0.34
(0.1
8)*
20.
01(0
.15)
20.
17(0
.15)
0 (0.1
6)R
egio
nal d
emog
raph
ic a
nd e
cono
mic
att
ribu
tes
Kno
w st
art-
up e
ntre
pren
eurs
0.42
(0.1
5)**
*0.
14(0
.15)
0.18
(0.1
3)2
0.12
(0.1
3)0.
40(0
.12)
***
0.26
(0.1
3)**
0.39
(0.1
3)**
*0.
3(0
.14)
**
Sh
are
182
34 y
ears
0.06
(0.1
2)2
0.06
(0.1
1)0.
05(0
.1)
20.
02(0
.09)
0.22
(0.1
)**
0.19
(0.1
)**
0 (0.1
1)0 (0.1
1)
Po
pula
tion
grow
th0.
01(0
.11)
20.
02(0
.1)
0.05
(0.1
)2
0.06
(0.0
9)2
0.04
(0.0
9)2
0.12
(0.1
)0.
23(0
.1)*
*0.
16(0
.11)
Opp
ortu
nity
cos
ts0.
08(0
.13)
0.07
(0.1
2)0.
01(0
.11)
20.
09(0
.11)
0.17
(0.1
1)*
0.11
(0.1
1)0.
02(0
.12)
20.
05(0
.12)
Popu
latio
n de
nsity
0.07
(0.1
)0.
07(0
.08)
0.15
(0.0
8)*
0.15
(0.0
7)**
0.22
(0.0
8)**
*0.
22(0
.08)
***
0.19
(0.0
9)**
0.2
(0.0
9)**
GR
P pe
r cap
ita2
0.09
(0.1
1)2
0.06
(0.1
)0.
05(0
.1)
0.04
(0.0
9)2
0.27
(0.0
9)**
*2
0.28
(0.0
9)**
*2
0.09
(0.1
)2
0.1
(0.1
)
G
RP
per c
apita
, squ
ared
0.00
(0.0
4)2
0.02
(0.0
3)2
0.03
(0.0
3)2
0.01
(0.0
3)0.
06(0
.03)
**0.
07(0
.03)
**0.
02(0
.03)
0.03
(0.0
4)
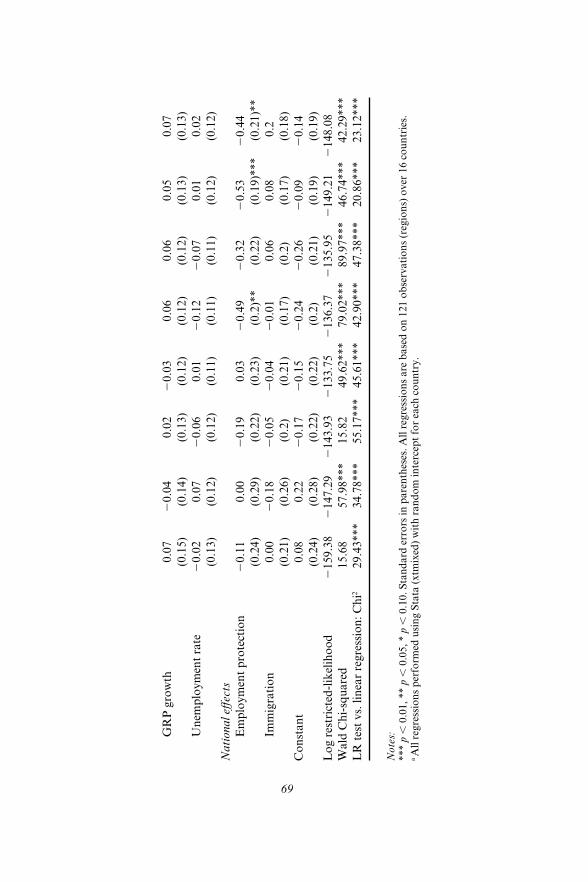
69
GR
P gr
owth
0.07
(0.1
5)2
0.04
(0.1
4)0.
02(0
.13)
20.
03(0
.12)
0.06
(0.1
2)0.
06(0
.12)
0.05
(0.1
3)0.
07(0
.13)
Une
mpl
oym
ent r
ate
20.
02(0
.13)
0.07
(0.1
2)2
0.06
(0.1
2)0.
01(0
.11)
20.
12(0
.11)
20.
07(0
.11)
0.01
(0.1
2)0.
02(0
.12)
Nat
iona
l eff e
cts
Em
ploy
men
t pro
tect
ion
20.
11(0
.24)
0.00
(0.2
9)2
0.19
(0.2
2)0.
03(0
.23)
20.
49(0
.2)*
*2
0.32
(0.2
2)2
0.53
(0.1
9)**
*2
0.44
(0.2
1)**
Imm
igra
tion
0.00
(0.2
1)2
0.18
(0.2
6)2
0.05
(0.2
)2
0.04
(0.2
1)2
0.01
(0.1
7)0.
06(0
.2)
0.08
(0.1
7)0.
2(0
.18)
Con
stan
t0.
08(0
.24)
0.22
(0.2
8)2
0.17
(0.2
2)2
0.15
(0.2
2)2
0.24
(0.2
)2
0.26
(0.2
1)2
0.09
(0.1
9)2
0.14
(0.1
9)L
og re
stric
ted-
likel
ihoo
d2
159.
382
147.
292
143.
932
133.
752
136.
372
135.
952
149.
212
148.
08W
ald
Chi
-squ
ared
15.6
857
.98*
**15
.82
49.6
2***
79.0
2***
89.9
7***
46.7
4***
42.2
9***
LR
test
vs.
linea
r reg
ress
ion:
Chi
229
.43*
**34
.78*
**55
.17*
**45
.61*
**42
.90*
**47
.38*
**20
.86*
**23
.12*
**
Not
es:
***
p ,
0.0
1, *
* p
, 0
.05,
* p
, 0
.10.
Sta
ndar
d er
rors
in p
aren
thes
es. A
ll re
gres
sions
are
bas
ed o
n 12
1 ob
serv
atio
ns (r
egio
ns) o
ver 1
6 co
untr
ies.
a A
ll re
gres
sions
per
form
ed u
sing
Stat
a (x
tmix
ed) w
ith ra
ndom
inte
rcep
t for
eac
h co
untr
y.
70 Entrepreneurship and growth
(model 1b). If we exclude perceptions to entrepreneurship (model 1a) the explained variance decreases signifi cantly and partly shifts to the factor of knowing entrepreneurs who started a business. We did not fi nd a relationship with any of the economic attributes. Also we found no impact of national levels of employment protection. Hence, involvement in non-growth oriented entrepreneurship at the regional level seems to be largely determined by processes refl ecting an ‘I can also do this’ mentality, a combination of perceptions and seeing other early-stage entrepreneurs rather than a rational choice on economic grounds. Knowing people in ESEA personally may also enhance the self-perceived skills to start a business. We should note that we were not able to include some poten-tially relevant attributes, such as education levels. Perceptions are also important in explaining the early-stage entrepreneurship with modest growth orientation. In addition a positive but weakly signifi cant eff ect is found for population density.
For growth oriented early-stage entrepreneurship the picture is clearly diff erent. We fi nd very limited evidence on the importance of informal institutional eff ects. Perceived skills, perceived opportunities and fear of failure are all insignifi cant. However, we do fi nd a signifi cant and posi-tive eff ect for the variable measuring a network eff ect; that is, knowing entrepreneurs who recently started a business (note that entrepreneurs themselves were not included when deriving this measure from the repre-sentative sample of the regional adult population). An important fi nding is that ambitious entrepreneurs, both in terms of job growth orientation and in terms of innovation, are predominantly prevalent in densely populated areas. Furthermore we fi nd that the share of younger people has a positive impact on ESEA with high growth orientation. Interestingly, the degree of employment protection has a negative eff ect on ambitious entrepreneur-ship concerning orientation to both employment growth and innovation, see models 3a and 4a. There are two possible explanations that may com-plement each other. First, in a regime with high degrees of employment protection, potential high-ambition entrepreneurs – whether these ambi-tions refl ect desire for growth or for innovation – may feel fewer incentives to engage in entrepreneurship and prefer safer and fairly generous employ-ment. Second, new entrepreneurs may lower their expectations for high growth because of the regime of high employment protection. We observe that the impact of employment protection disappears (in model 3b) or weakens (in model 4b) when we include informal institutional eff ects, even though these eff ects themselves are not found to be signifi cant. In our view this result points out that the eff ects of formal institutions may not only impact individuals’ activities but also their perceptions. Indeed Table 3.2 indicates that the correlation of national levels of employment
Determinants of early-stage entrepreneurial activity in European regions 71
protection with regional aggregates of individuals’ perceived skills to start a business is considerably negative (–0.31), and the correlation with fear of failure is substantial and positive (0.48). Thus, the distinction between informal institutions (in our exercise: perceptions to entrepreneurship) and formal institutions (employment protection) may not be as clear-cut as is sometimes proposed.
DISCUSSION AND CONCLUSIONS
This chapter contributes to fi eld of entrepreneurship studies by presenting and analysing harmonized entrepreneurship data over European regions and countries in two ways. First, by mapping patterns in both general and ambitious entrepreneurial activity for 125 regions over 18 countries, we initially showed that the regional level is an appropriate level to study entrepreneurship. The second main contribution is the distinction between several types of entrepreneurial activity and analysing their determinants. Based on the existing literature we expected that the determinants for higher ambitious types of entrepreneurship would diff er from those of lower ambitious types of entrepreneurship. Our empirical analysis on regional rates of ambitious entrepreneurship showed that only part of the determinants of lower growth oriented entrepreneurial activity played a signifi cant role, as expected. For instance, population density does not matter for lower ambitious entrepreneurship rates, but is related to ambi-tious entrepreneurship. Furthermore, a subdivision of ambitious entre-preneurship in growth oriented and innovation oriented entrepreneurship shows that also here, the impact of regional and national factors varies to some extent. While growth oriented entrepreneurship is positively associated with the share of younger people and exhibits a U-shaped relationship with regional wealth levels, population growth is positively linked to innovation oriented entrepreneurship. Common determinants are network eff ects (measured by the degree to which people – excluding entrepreneurs – personally know someone who started a business in the past two years), population density and a negative eff ect of the national degree of employment protection.
Our hypothesis regarding a higher impact of regional entrepreneurial perceptions on ambitious entrepreneurship rates than on overall entre-preneurship rates, however, was not confi rmed. Whereas regional levels of self-perceived attitudes towards start-up skills are of signifi cant impor-tance in explaining lower ambitious early-stage entrepreneurial activity, none of the three regional attitude indices was signifi cant in explaining ambitious early-stage entrepreneurial activity. The infl uence of perceived
72 Entrepreneurship and growth
skills on non-ambitious entrepreneurship needs some more detailed inspection. Observing the regional variation in the maps (see also Bosma and Schutjens, 2009 for maps displaying perceptions of entrepreneurship), we have reason to believe that starting a business is being considered less as a special event (put diff erently, an event embedded in society) in south-ern Europe and therefore people may perceive that fewer skills and less knowledge are required for starting a business. It may even be the case that the ‘average’ business in some countries is perceived diff erently in other countries (or regions) – and therefore the perceptions of opportuni-ties and required capabilities relating to start-ups may diff er substantially. Also we should note that the variables included in our study relate to starting a business rather than growing a business or starting an innovative business.
As regards formal institutions at the national level, these appear to aff ect total early-stage entrepreneurial activity to some extent, even in our case with 16 countries across Europe. We fi nd some evidence of negative impacts; that is, of employment protection on growth and innovation oriented entrepreneurial activity. This fi nding certainly asks for further research. Our results indicate that this eff ect, as an example of a ‘formal institutional’ eff ect, may to some extent also be captured in variables measuring individual perceptions of entrepreneurship. This calls for more research on how formal institutions aff ect informal institutions and vice versa.
The limitations of our study are fourfold. First, our focus on regional entrepreneurship levels obscures the infl uence of individual characteristics on both the decision to start a fi rm, and second, the growth and innova-tion ambitions with respect to this new fi rm. According to many studies based on the labour market perspective, it is exactly this individual level at which the most decisive determinants can be found: age, gender, educa-tion level, income level, network (see e.g. Davidsson, 1991). In our study we circumvented this omission of the individual level by including regional demographic characteristics, but we are aware that the regional composi-tion eff ect at best proxies the individual characteristics involved in the quite personal decision of becoming an (ambitious) entrepreneur. New research fi ndings are under way in which we do control for this individual level.
Second, our focus on the ambitions of entrepreneurs in the period before or soon after the start-up does not permit inferences on realizations of job growth and innovation. As explained in the literature overview, this relation is not straightforward because of high uncertainty about existing and future markets, competition and capabilities to cope with internal and external challenges, especially in the exciting fi rst phases of the fi rm’s
Determinants of early-stage entrepreneurial activity in European regions 73
life course. Longitudinal analysis is needed to track down post start-up performance of new fi rms.
A third limitation of our contribution is that we have to distinguish rather large regions, because of limited data availability and small sample sizes on a lower spatial scale. Ideally we would have worked with Nuts3 regions only but this is currently not feasible in the GEM research design. For some countries we have abstracted smaller, dense areas from the larger areas. Another consequence of using regional aggregates of indi-vidual observations is that we had to merge 2001–06 data for obtaining regional measures on entrepreneurial activity and entrepreneurial percep-tions. This boils down to a cross-sectional analysis and interpretations on causality, especially concerning the relationship between entrepreneurial perceptions and activity, should be made with care.
Finally, more data are needed at the regional level in order to grasp the possible eff ects of economic specialization, knowledge intensity, and agglomeration economies on entrepreneurship in general and innova-tion oriented entrepreneurship in particular. In addition, regional data on unemployment levels may improve explanations of not only non-ambitious entrepreneurship, but also growth oriented entrepreneurship as low labour costs may increase growth aspirations. Finally, data on the regional fi rm size structure, especially small-size businesses and new and young fi rms, may shed light on our fi nding that regional networks as proxied by knowing other new entrepreneurs, positively relate to regional entrepreneurship rates.
Our outcomes can be of relevance to policy makers aiming at stimulat-ing the most promising types of entrepreneurship. In stimulating new fi rm formation by specifi c national regulations and institutions, one should be aware that this does not automatically positively aff ect ambitious entre-preneurship. In order to address this group of fi rms in particular, making employment more fl exible could be a key trigger. Further research should be conducted in this area. As regards policy implications at the regional level, a general message from our results is that one should be aware that densely populated areas have advantages for fostering ambitious entre-preneurship, in line with traditional agglomeration economies stimulat-ing concentration of economic activity. Not only are dense areas directly associated with ambitious entrepreneurial activity; dense areas also tend to have relatively high shares of younger populations and more network-ing possibilities (i.e. people in dense areas will know more people, and probably also more people who recently started a fi rm). Entangling the exact mechanisms underlying these urban advantages for ambitious entre-preneurship, in order to develop policy instruments, now is a challenge to both academics and policy makers.
74 Entrepreneurship and growth
ACKNOWLEDGEMENT
The authors would like to thank all the GEM teams for sharing their data. Although GEM data were used, their interpretation and use are the sole responsibility of the authors. The chapter has benefi ted from useful com-ments of two anonymous referees. All errors are ours.
NOTES
1. The GEM conceptual model is described in most annual GEM Global Reports (see for instance Bosma et al., 2008a) and more thorough theoretical underpinnings are supplied by Levie and Autio (2008).
2. The EFC ‘Higher education’ is a composite factor on the scores of three items in the annual ‘National Expert Survey’ that is held annually among experts in the fi eld of entrepreneurship (see Reynolds et al., 2005). The items relate to the degree to which, according to the experts, (i) colleges and universities (ii) the level of business and manage-ment education, and (iii) the vocational, professional and continuing education systems provide good and adequate preparation for starting-up and growing new fi rms. See for more details Levie and Autio (2008).
3. The World Bank ‘Doing Business’ Indicators, including those related to start-ups, are based on regulations involving business with 250 employees or more. Therefore the World Bank fi gures do not allow a very good measurement of the link between formal institutions and start-up activity. However, one could argue that the perceptions to institutional barriers may be correlated with the World Bank measures related to start-ups.
4. In this fi rst selection we have indices for 125 regions corresponding to the clas-sifi cation used by ESRI. This classifi cation comprises of Nuts1 levels for Belgium, France, Germany, Greece, Ireland, the Netherlands and the United Kingdom. Nuts2 levels are applied for Croatia, Denmark, Finland, Hungary, Norway, Portugal, Slovenia and Sweden, and a combination of Nuts1 and Nuts2 for Italy, Spain and Switzerland.
5. The abstracted regions that are not shown in Figures 3.1–3.4 are Antwerp and Ghent (Belgium); Aarhus (Denmark); Helsinki (Finland); Duisburg-Essen, Düsseldorf, Köln, Rhein-Main, Stuttgart and Munich (Germany); Budapest (Hungary); Dublin, ‘Border/Midlands/Western’, ‘Southern/Eastern’ (Ireland); Amsterdam, Rotterdam, The Hague and Utrecht (Netherlands); Barcelona, Valencia, Seville and Malaga (Spain).
6. This is the same measure as what is known as ‘TEA’ in most GEM reports. We have chosen to use the abbreviation ESEA because it better refl ects the early-stage nature of the measure.
7. The correlations between the dependent variables are all positive and signifi cant at the .05 level, ranging from 0.29 (ESEAGR_LO and ESEAGR_MD) to 0.64 (ESEAGR_HI and ESEAINNOV).
8. This region includes the Sophia–Antipolis cluster.9. If we did not fi nd the country level to be important, we could have modelled all
four dependent variables simultaneously in a Seemingly Unrelated Regression (SUR). SUR estimation takes the potential correlation of residuals of the equations into account. However, SUR estimation is to our knowledge not available in a multilevel setting.

Determinants of early-stage entrepreneurial activity in European regions 75
REFERENCES
Acs, Z., D. Audretsch, P. Braunerhjelm and B. Carlsson (2003), The Missing Link: The Knowledge Filter and Endogenous Growth, Stockholm, Sweden: Center for Business and Policy Studies.
Acs, Z. and P. Mueller (2008), ‘Employment eff ects of business dynamics: mice, gazelles and elephants’, Small Business Economics, 30, 85–100.
Ajzen, I. (1985), ‘From intentions to actions: a theory of planned behaviour’, in J. Kuhl and J. Bechmann (eds), Action-Control: From Cognition to Behaviour, Heidelberg: Springer, pp. 11–39.
Ajzen, I. (1991), ‘The theory of planned behaviour’, Organizational Behaviour and Human Processes, 50, 179–221.
Arenius, P. and M. Minniti (2005), ‘Perceptual variables and nascent entrepre-neurship’, Small Business Economics, 24 (3), 233–47.
Arrighetti, A. and M. Vivarelli (1999), ‘The role of innovation in the post entry performance of new small fi rms: evidence from Italy’, Southern Economic Journal, 65, 927–39.
Audretsch, D.B. and M. Keilbach (2004), ‘Entrepreneurship capital and economic performance’, Regional Studies, 38 (8), 949–60.
Audretsch, D.B., M.C. Keilbach and E.E. Lehmann (2006), Entrepreneurship and Economic Growth, Oxford: Oxford University Press.
Autio, E. (2007), Global Entrepreneurship Monitor; 2007 Global Report on High-Growth Entrepreneurship, London: Babson College, London Business School, and Global Entrepreneurship Research Association (GERA).
Autio, E., M. Kronlund and A. Kovalainen (2007), ‘High-growth SME support initiatives in nine countries: analysis, categorization, and recom-mendations’, report prepared for the Finnish Ministry of Trade andIndustry.
Baumol, W.J. (1990), ‘Entrepreneurship: productive, unproductive, and destruc-tive’, Journal of Political Economy, 98 (5), 893–921.
Birch, D. (1979), The Job Generation Process, Cambridge, MA: MIT Program on Neighbourhood and Regional Change.
Bosma, N.S. and V.A.J.M. Schutjens (2007), ‘Outlook on Europe: patterns of promising entrepreneurial activity in European regions’, Tijdschrift voor Economische en Sociale Geografi e, 98 (5), 675–86.
Bosma, N.S. and V.A.J.M. Schutjens (2009), ‘Mapping entrepreneurial activity and entrepreneurial attitudes in European regions’, International Journal of Entrepreneurship and Small Business, 7 (2), forthcoming.
Bosma, N.S., K. Jones, E. Autio and J. Levie (2008a), Global Entrepreneurship Monitor 2007, Executive Report, London: Babson College, London Business School and Global Entrepreneurship Research Association.
Bosma, N.S., V.A.J.M. Schutjens and K. Suddle (2008b), Whither a Flat Landscape? Regional Diff erences in Entrepreneurship in the Netherlands, EIM Scales paper H200805, Zoetermeer: EIM.
Bosma, N.S., A.J. Van Stel and K. Suddle (2008c), ‘The geography of new fi rm formation: evidence from independent start-ups and new subsidiaries in the Netherlands’, International Entrepreneurship and Management Journal, 4 (2), 129–46.
Carree, M.A. and A.R. Thurik (2003), ‘The impact of entrepreneurship on economic
76 Entrepreneurship and growth
growth’, in Z. Acs and D.B. Audretsch (eds), Handbook of Entrepreneurship Research, Dordrecht: Kluwer, pp. 437–72.
Davidsson, P. (1991), ‘Continued entrepreneurship: ability, need, and opportu-nity as determinants of small fi rm growth’, Journal of Business Venturing, 6 (6), 405–29.
Davidsson, P., F. Delmar and J. Wiklund (2006), ‘Entrepreneurship as growth; growth as entrepreneurship’, in P. Davidsson, F. Delmar and J. Wiklund (eds), Entrepreneurship and the Growth of Firms, Cheltenham, UK and Northampton, MA, USA: Edward Elgar publishing, pp. 21–38.
Delmar, F. and P. Davidsson (2000), ‘Where do they come from? Prevalence and characteristics of nascent entrepreneurs’, Entrepreneurship and Regional Development, 12, 1–23.
Dutta, D.K. and S. Thornhill (2008), ‘The evolution of growth intentions: toward a cognition-based model’, Journal of Business Venturing, 23, 307–32.
Etzioni, A. (1987), ‘Entrepreneurship, adaptation and legimation’, Journal of Economic Behavior and Organization, 8, 175–89.
Fotopoulos, G. and H. Louri (2000), ‘Location and survival of new entry’, Small Business Economics, 14, 311–21.
Frank, H., M. Lueger and C. Korunka (2007), ‘The signifi cance of personal-ity in business start-up intentions, start-up realization and business success’, Entrepreneurship and Regional Development, 19, 227–51.
Freytag, A. and A.R. Thurik (2007), ‘Entrepreneurship and its determinants in a cross-country setting’, Journal of Evolutionary Economics, 17 (2), 117–31.
Fritsch, M. (1992), ‘Regional diff erences in new fi rm formation: evidence from West Germany’, Regional Studies, 25, 233–41.
Fritsch, M. and P. Mueller (2007), ‘The persistence of regional new business formation-activity over time – assessing the potential of policy promotion pro-grams’, Journal of Evolutionary Economics, 17, 299–315.
Garnsey, E., E. Stam and P. Heff ernan (2006), ‘New fi rm growth: exploring proc-esses and paths’, Industry and Innovation, 13 (1), 1–20.
Henrekson, M. and D. Johansson (2008), Gazelles as Job Creators, IFN Working Paper No. 733, Stockholm: Research Institute of Industrial Economics.
Hessels, J., A.J. Van Stel, P. Brouwer and A.R.M. Wennekers (2007), ‘Social secu-rity arrangements and early-stage entrepreneurial activity’, Comparative Labour Law and Policy Journal, 28 (4), 743–74.
Koellinger, P. (2008), ‘Why are some entrepreneurs more innovative than others?’, Small Business Economics, 31, 21–37.
Koellinger, P., M. Minniti and C. Schade (2007), ‘I think I can, I think I can . . . a study of entrepreneurial behaviour’, Journal of Economic Psychology, 28 (3), 502–27.
Koster, S. (2007), ‘The entrepreneurial and replication function of new fi rm forma-tion’, Tijdschrift voor Economische en Sociale Geografi e, 98 (5), 667–74.
Krueger, N.F. (2000), ‘The cognitive infrastructure on opportunity emergence’, Entrepreneurship Theory and Practice, 24, 5–23.
Lee, S.Y., R. Florida and Z.J. Acs (2004), ‘Creativity and entrepreneurship: a regional analysis of new fi rm formation’, Regional Studies, 38 (8), 879–91.
Levie, J. and Autio, E. (2008), ‘A theoretical grounding and test of the GEM model’, Small Business Economics, 31 (3), 235–63.
Liao, J. and H. Welsch (2003), ‘Social capital and entrepreneurial growth aspira-tions: a comparison of technology and non-technology-based nascent entrepre-neurs’, Journal of High Technology Management Research, 14, 149–70.

Determinants of early-stage entrepreneurial activity in European regions 77
North, D.C. (1990), Institutions, Institutional Change and Economic Performance, Cambridge: Cambridge University Press.
Parker, S.C. (2005), ‘Explaining regional variations in entrepreneurship as multi-ple equilibria’, Journal of Regional Science, 45, 829–50.
Reynolds, P.D., N.S. Bosma, E. Autio, S. Hunt, N. de Bono, I. Servais, et al. (2005), ‘Global Entrepreneurship Monitor: data collection design and imple-mentation 1998–2003’, Small Business Economics, 24 (3), 205–31.
Rocha, H. and R. Sternberg (2005), ‘Entrepreneurship: the role of clusters. Theoretical perspectives and empirical evidence from Germany’, Small Business Economics, 24 (3), 267–92.
Santarelli, E. and M. Vivarelli (2007), ‘Entrepreneurship and the process of fi rms’ entry, survival and growth’, Industrial and Corporate Change, 16 (3), 455–88.
Schumpeter, J.A. (1934), The Theory of Economic Development, Cambridge, MA: Harvard University Press.
Schumpeter, J.A. (1942), Capitalism, Socialism and Democracy, New York: Harper & Row.
Schutjens, V.A.J.M. and E. Wever (2000), ‘Determinants of new fi rm success’, Papers in Regional Science, 79 (2), 135–53.
Sternberg, R. (2000), ‘Gründungsforschung – Relevanz des Raumes und Aufgaben der Wirtschaftsgeographie’, Geografi sche Zeitschrift, 88, 199–219.
Stevenson, L. and A. Lundström (2001), ‘Patterns and trends in entrepreneurship/SME policy and practice in ten economies’, Entrepreneurship Policy for the Future Series, 3, Swedish Foundation for Small Business Research.
Tamásy, C. (2006), ‘Determinants of regional entrepreneurship dynamics in con-temporary Germany: a conceptual and empirical analysis’, Regional Studies, 40 (4), 364–84.
Tödtling, F. and H. Wanzenböck (2003), ‘Regional diff erences in structural charac-teristics of start-ups’, Entrepreneurship and Regional Development, 15, 351–70.
Van Praag, C.M. (1999), ‘Some classic views on entrepreneurship’, De Economist, 147 (3), 311–35.
Vivarelli, M. and D.B. Audretsch (1998), ‘The link between the entry decision and post-entry performance: evidence from Italy’, Industrial and Corporate Change, 7, 485–500.
Wennekers, A.R.M. (2006), ‘Entrepreneurship at country level; economic and non-economic determinants’, ERIM PhD Series Research in Management, Erasmus University Rotterdam.
Wennekers, A.R.M. and A.R. Thurik (1999), ‘Linking entrepreneurship and eco-nomic growth’, Small Business Economics, 13, 27–55.
Wiklund, J. (2006), ‘The sustainability of the entrepreneurial orientation–per-formance relationship’, in P. Davidsson, F. Delmar and J. Wiklund (eds), Entrepreneurship and the Growth of Firms, Cheltenham, UK and Northampton, MA, USA: Edward Elgar, pp. 141–55.
Wiklund, J., P. Davidsson and F. Delmar (2003), ‘What do they think and feel about growth? An expectancy-value approach to small business managers’ atti-tudes towards growth’, Entrepreneurship Theory and Practice, 27 (3), 247–66.
Wong, P.K., Y.P. Ho and E. Autio (2005), ‘Entrepreneurship, innovation, and economic growth: evidence from GEM data’, Small Business Economics, 24 (3), 335–50.
World Bank (2005), Doing Business in 2005: Removing Obstacles to Growth, Washington, DC: World Bank.


PART III
New Venture Creation and Growth

81
4. Can new ventures develop pioneer behaviour in industries with unfavourable conditions? The role of capabilitiesPedro M. García-Villaverde and María J. Ruiz-Ortega
INTRODUCTION
Most studies on entry timing have focused on analysing the direct and indirect infl uence of the moment of market entry on the fi rm’s perform-ance (for example, Coeurderoy and Durand, 2004; Shamsie et al., 2004). We have found few empirical studies that focus on analysing the advan-tages and risks of entry timing for new ventures (for example, Shepherd et al., 2000; Williams et al., 1991). However, none of these empirical studies on the factors that infl uence entry timing is focused on new ventures (Mitchell, 1989; Robinson et al., 1992; Schoenecker and Cooper, 1998). We think that entry timing and entrepreneurship studies are strongly linked because of the shared need to compare windows of opportunity to gain competitive advantage and the liabilities of newness (Shepherd and Shanley, 1998).
We believe that environmental conditions determine new ventures’ expectations to obtain fi rst mover advantages and, therefore, bring about the moment of entry into the market (Covin et al., 2000). While the extant literature highlights the importance of the competitive dynamic, stating that the pioneer strategy can aff ect the competitive position of competitors in a relevant way (Geroski, 1995), we analyse the level of imitation and rivalry in the industry, which are two unfavour-able environmental conditions to develop fi rst mover advantages (Kerin et al., 1992).
Following population ecology (Hannan and Freeman, 1977), new ven-tures that perceive important potential advantages of early entry tend to enter a new market quickly if they have suitable resources and capabilities
82 Entrepreneurship and growth
to allow it (Schoenecker and Cooper, 1998). The possession of certain complementary resources and capabilities can encourage new ventures to develop a pioneer behaviour to succeed in the marketplace, even when the environmental conditions are unfavourable for obtaining fi rst mover advantages (Teece, 1986; Makadok, 1998). Besides, under unfavour-able environmental conditions, the availability of certain capabilities can encourage new ventures to develop late follower type behaviour because late entry will enable new ventures to learn from the pioneers’ mistakes, so providing better adaptation to the unfavourable environmental condi-tions. We expect to demonstrate that a high level of imitation and rivalry favours late follower behaviour of new ventures and that the possession of several capabilities aff ects the infl uence of these environmental conditions on the entry timing of the new ventures.
The contributions of our study are fourfold. First, we include the level of imitation among the analysed environmental conditions. Though excluded from the great majority of developed studies about entry timing, this variable is linked with the sustainability of fi rst mover advantages and its inclusion in an empirical study allowed us to establish important con-clusions (Lee et al., 2000). Second, we have included two kinds of capabili-ties hardly included before in this fi eld of research; that is, managerial and marketing capabilities.1 We include managerial capabilities, which can be a basic factor for the sustainability of fi rst mover advantages, through organizational fl exibility, the fi rm’s adaptation capability to environmen-tal changes and constant innovation. We also include marketing capa-bilities, which can have strong implications in the exploitation of potential advantages derived from pioneer entry into the market (Schoenecker and Cooper, 1998). Third, we correct methodological biases from previ-ous studies (for example, Shepherd and Shanley, 1998; Lieberman and Montgomery, 1998; Covin et al., 2000). In particular, we have measured the moment of entry as a continuous variable, avoiding the bias arising from self-classifi cation (Shepherd and Shanley, 1998). Finally, we develop the empirical study in a high-technology industry, in which the advan-tages of a pioneer strategy are not as evident as in more mature industries (Golder and Tellis, 1993).
The rest of the chapter is divided into four sections. Next, we provide the theory development. Then, we give an overview of the methods fol-lowed by the results obtained. Finally, we close with the discussion and conclusions.
The role of capabilities 83
THEORY DEVELOPMENT AND HYPOTHESES
Environmental Conditions and Pioneering New Ventures
Several studies in industrial organisation (for example, Bain, 1956) have stated the infl uence of environmental conditions on the decision of new ventures’ entry timing (Levesque and Shepherd, 2004). From this per-spective, the sector structure is the determining factor in a new venture’s behaviour, infl uencing its goals, strategies, practices and performance (Robinson, 1998). Evolutionary economics regards competition as a dynamic process, in which fi rms try to adapt their strategies to market conditions and, at the same time, by means of their strategic decisions, to develop actions that allow them to infl uence environmental conditions (Nelson and Winter, 1982). From this standpoint, in a market without balance, new ventures will be able to tap into the constant opportuni-ties that appear in the market (Geroski, 1995; Dean and Meyer, 1996). Accordingly, new ventures face uncertainty, either because of the lack of information about their industry and competitors, or from their concern over the adverse eff ects of the market environment on survival and success (Chrisman et al., 1998). In the present study, we analyse the infl uence of two environmental variables that the literature has traditionally consid-ered unfavourable for the development of pioneer behaviour: imitation capability of the competitors and rivalry (Shepherd and Shanley, 1998; Covin et al., 2000; Levesque and Shepherd, 2004).2
New ventures may develop pioneer type behaviour in appropriate emer-gent segments, achieve scale economies, dominate industry standards or control distribution channels, which can allow them to achieve a strong market position (Golder and Tellis, 1993). The pioneer new ventures usually make an important eff ort in R&D investment, market develop-ment and customer education, which could entail high risk. The chances of taking advantage of the pioneer’s eff ort by means of imitation is one of the advantages that the follower companies can achieve, but only if these com-panies have suitable imitation capabilities (Shepherd et al., 2000). New ven-tures will enter later into the market if there is a positive diff erence between the innovation costs and the imitation costs (Kerin et al., 1992). As a result, new ventures’ perception of a high level of imitation in the industry favours late follower behaviour (Levesque and Shepherd, 2004), because it has a negative infl uence on their expectation to obtain sustainable fi rst mover advantages (Durand and Coeurderoy, 2001). Hence,
H1: A greater level of imitation in an industry favours late follower type behaviour for new ventures.
84 Entrepreneurship and growth
High market rivalry can decrease the profi ts that pioneer new ven-tures expect to obtain at the monopoly stage (Romanelli, 1989).3 This is because the intense pressure on resources that is generated in hostile environments limits the available resources and capabilities to develop and introduce new products into the market (Miller and Friesen, 1984). In addition, constant price wars and scant consumer loyalty lead new ventures to develop late entry into the market, avoiding the risks of early entry (Lieberman and Montgomery, 1998). In hostile environments there are disadvantages related to business climate, supply conditions and strict regulations that lead the new ventures to develop late follower behaviour (Kerin et al., 1992). Not surprisingly, Zahra (1996) showed that in highly hostile environments new ventures tend to behave as followers.4 From these arguments we propose the following hypothesis:
H2: Greater rivalry in an industry favours late follower type behaviour for new ventures.
Capabilities, Environmental Conditions and Pioneering New Ventures
Under population ecology, environmental conditions are the main factor that determines a fi rm’s behaviour and performance (Hannan and Freeman, 1977). Somewhat opposed to industrial organization and evolutionary economics, population ecology acknowledges the important role of a fi rm’s resources and capabilities. In doing so, population ecology highlights that strategic behaviour is the way in which fi rms within a population exploit the resources and opportunities that exist in a niche (Hannan and Freeman, 1977). In consequence, a fi rm tends to spread out rapidly when its key capabilities match the capabilities needed to survive in a new market (Brittain and Freeman, 1980). We argue that the interac-tions between the new venture’s specifi c capabilities and market conditions have the greatest infl uence on entry timing.
New ventures that have suitable capabilities to gain fi rst mover advan-tages in favourable environmental conditions will have greater incen-tives to enter early into the market (Williams et al., 1991).5 In contrast, several studies have highlighted that, when fi rst mover advantages in an industry are not strong enough, a new venture’s resource position does not infl uence the timing of entry in a signifi cant way. Along these lines, Schoenecker and Cooper (1998) point out that in particular industries, early entrants may have been unusually effi cient in the specifi c technology, or ‘lucky’ in their R&D eff orts so that they were ahead of rivals. We posit that, even when market conditions are unfavourable for obtaining fi rst mover advantages, the possession of certain complementary resources
The role of capabilities 85
and capabilities to achieve success in the market can encourage these new ventures to develop pioneer type behaviour (Giarratana, 2004). Thus, we think that the possibility of creating strong resource position barriers can generate expectations for new ventures to obtain sustainable fi rst mover advantages.6 In contrast to studies that have been solely focused on the infl uence of market conditions or a new venture’s resources and capabili-ties on the pioneer or follower type behaviour, we have included the inter-active eff ects. These eff ects between the perception of the environmental conditions and the possession of certain resources and capabilities explain the moment of market entry (Lieberman and Montgomery, 1988; Suárez and Lanzolla, 2005).
As mentioned previously, a new venture’s perception of the industrial level of imitation infl uences the moment of market entry signifi cantly, favouring later entry of this new venture into the market. However, even when there are strong imitation and entry threats in an industry because of the lack of entry barriers, if new ventures have certain key resources and capabilities that can develop ‘resource position barriers’, they will achieve and even maintain fi rst mover advantages for a long period of time (Makadok, 1998). Therefore, competitors that have suitable resources can imitate certain attributes of the product or actions linked to the market pioneer, but cannot imitate complex actions, especially when tacit skills are involved (Lippman and Rumelt, 1982).7
Lieberman and Asaba (2006) stress that the success or failure of the commercialization of a new product can take months, and that market uncertainties of new technologies can take a few years to disappear. However, the organizational innovations created by means of managerial capabilities are characterized by longer gestation lags and more residual uncertainty. Thus, managerial and organizational processes promote the fl exibility to respond quickly to changes as well as constant learning and innovation (Nadler and Tushman, 1997). These factors are basic in order to develop an early market entry because of the diffi culties of achieving the product benefi ts when the fi rm’s competitors exert a strong threat of imitation.
Managerial and organizational capabilities appear as a basic factor for obtaining fi rst mover advantages in imitation environments (Teece et al., 1997). In this context, followers cannot gain advantages when they do not have the resources to imitate. This eff ect is bigger when the complex-ity, understood as the tacit character or the causal ambiguity of certain managerial capabilities, prevents them from understanding the pioneers’ innovations (Lieberman and Asaba, 2006). Therefore, we consider that new ventures that have strong managerial and organizational capabilities will tend to develop pioneer type behaviours, and will achieve fi rst mover
86 Entrepreneurship and growth
advantages that will be very diffi cult to imitate by competitors with strong imitation capabilities.
First mover advantage will have a shorter life if a fi rm’s competitors are capable of quickly imitating a new product’s strengths and attributes (Lee et al., 2000). We argue that when companies in an industry have high imi-tation capabilities, those new ventures with a higher commitment to their successful products will neither have incentives to develop and introduce new products into the market, nor incentives to react in the fi rst stages of their development. Higher commitment is refl ected in the accumulation of specialized marketing capabilities. These new ventures will only draw on their capabilities to enter early into the market when the innovations are incremental. However, when there is a strong imitation threat, the new ventures with strong marketing capabilities will not want to develop radical innovations for fear of cannibalization with their own products (Taylor and Anderson, 2001). We consider that these new ventures will tend to develop late follower behaviour. In consequence,
H3: In industries with a high level of imitation, greater managerial capa-bilities favour pioneer type behaviour for new ventures, and greater marketing capabilities favour late follower type behaviour.
In hostile environments there are constant threats against new ventures’ viability (Zahra and Bogner, 1999). Therefore, when the rivalry is low, pioneer new ventures can use the monopoly conditions to control the market, develop economies of scale and strengthen their position. In this context, the pioneer new ventures can create entry barriers that will allow them to achieve and maintain strategic and economic advantages (Shankar et al., 1998). When the competitive rivalry is high, new ven-tures face constant price wars and diffi culties in maintaining consumers’ loyalty.8 Then, there is a strong competition for resources and opportuni-ties in the industry. The pioneer new venture’s expectations to gain profi ts with regard to suppliers, consumers or followers will mainly depend on the availability of complementary resources linked to the new product’s exploitation (Mitchell, 1989).9
Following Carpenter and Nakamoto (1994), we regard marketing resources and capabilities as essential for the market success of new products, especially when there is strong rivalry among competitors to infl uence the formation of consumer preferences. Thus, pioneer new ventures’ strengths in advertising, promotion and educational capabilities can allow them to achieve consumers’ loyalty and to lead and form consumer preferences. Furthermore, these strengths favour product diff erentiation and the crea-tion of a strong brand image that consumers can identify with the standard

The role of capabilities 87
of the product in the market. Whereas the distinctiveness of the pioneers’ product off ering can allow them to command a premium price in hostile environments, the follower companies will have to compete on the basis of price, because their products will be less diff erentiated (Covin et al., 2000).
In hostile environments, where growth opportunities are limited, pioneer new ventures can also enter and saturate the market with greater potential profi ts if they have control of distribution channels. Thus, selective control of distribution channels will allow the pioneer new ventures to attract the most desirable market segments, forcing follower companies to gain access to the rest (Makadok, 1998). Furthermore, a new venture’s possession of down-stream capabilities will allow it to open new geographic markets in which to establish, broadening its opportunities of growth (Giarratana, 2004).
We have noted that managerial resources and capabilities are linked to planning, learning and adaptation. In line with Day and Schoemaker (2001), we consider that these capabilities can lead new ventures to adopt defensive behaviour – maintaining their strategic commitment with the successful products and markets – given the risk that new ventures face in high hostile environments. Thus, new ventures with strong manage-rial capabilities can obtain advantages from developing late follower behaviour when their viability has been proved. Then, in hostile environ-ments, the late entry could allow new ventures to obtain greater levels of performance than the pioneer new ventures (Conant et al., 1990).
We believe that in highly hostile environments, new ventures that have strong marketing capabilities will have expectations of appropriating the rents that are derived from the early introduction of new products into the market and, therefore, these fi rms will tend to adopt pioneer type behaviour. On the contrary, those new ventures that have strong managerial capabili-ties will probably tend to develop late follower type behaviour. Therefore:
H4: In industries with high levels of rivalry, greater marketing capa-bilities favour pioneer type behaviour for new ventures, and greater managerial capabilities favour late follower type behaviour.
SAMPLE AND METHODS
Sample
To carry out the empirical study, we have chosen to focus on the informa-tion and communications technology sector in Spain, starting by com-bining information from fi ve data bases: ANIEL, Census of Exporters, Promotion of the Production, Europage and Camerdata. To avoid
88 Entrepreneurship and growth
heterogeneity problems because of fi rm size, and following Spanos and Lioukas (2001), we dropped from the sampling frame fi rms with fewer than ten employees, as well as fi rms with missing data. Besides, we only included non-diversifi ed new ventures; that is, companies that make at least 70 per cent of their income from their main activity (Rumelt, 1974). This yielded an initial sample frame of 283 new ventures created between 1991 and 2002.10 After sending the questionnaire once, and then again three weeks later, we received 104 valid questionnaires; an acceptable response rate of 36.75 per cent.
With regard to the sampling error, for a confi dence level of 95 per cent, and the least favourable situation of p = q = 0.5, we have an error of 7.6 per cent. We developed a T-test for all the variables included in the study between the fi rms that responded during the fi rst three weeks (76) and the fi rms that responded later (28). We did not fi nd any signifi cant diff erences between these two groups. Furthermore, we compared the mean level of the size variable between the whole population and the fi rms included in the sample, and obtained very similar values for both groups. Therefore, follow-ing Armstrong and Overton (1977), a ‘non-response bias’ was not detected.
Measurement
The questionnaire design was developed from a wide review of the litera-ture, which allowed us to measure the great majority of analysed variables from valid scales. In order to improve the content validity (Hambrick, 1981), we developed a pre-test with nine new ventures within the sector. We sent a lengthy questionnaire, in which the managers could indicate the degree of comprehensibility of the questions, as well as express their opinion on whether the questions were appropriate for the proposals that we were trying to make. Likewise, we also had in-depth discussions with academics and experts on the design of the questionnaires. In these meetings, we went through the questionnaire, so that these experts could suggest possible critiques and improvements. We made sure that, for every variable, we were choosing the best possible scale of measure (see Appendix Table 4A.1).
Control Variables
AgeThe variable age is usually included in the studies about entrepreneurship in order to control its infl uence on a fi rm’s survival. In this sense, as a new venture’s age increases, the risk of failure decreases, with a consequent positive infl uence on fi rm performance (Chandler and Hanks, 1994).
The role of capabilities 89
SizeThis variable is frequently included in studies to control the eff ect that it can have on new ventures’ performance. Large fi rms can own more resources to obtain a better position in the market and develop scale economies that will help them achieve a better performance (McEvily and Zaheer, 1999). This variable has been included through the natural logarithm of the number of employees (Spanos and Lioukas, 2001; Tsai, 2001).
OriginThere are several studies that analyse the infl uence of a new venture’s origin (independent or corporate) on the pioneer strategy and on a fi rm’s performance (Roure and Maidique, 1986; Zahra, 1996; Shepherd and Shanley, 1998). These authors highlight that independent new ventures will tend to develop a pioneer behaviour because these fi rms can anticipate the customers’ needs. This anticipation will allow the independent new ventures to be successful in developing new products.
DynamismMarket dynamism refl ects the diffi culty of predicting industrial changes (Dess and Beard, 1984) and a steady movement of entry and exit in the industry (Miller and Friesen, 1984). In this case, after revising several scales we decided to include an adaptation of the scale proposed by Miller (1987), because we consider it to be the most suitable scale for our study. This variable was measured by means of a four-item scale. The scale is as follows: the opportunities in the environment to grow strongly; the technol-ogy in my sector changes frequently; the innovation in processes and prod-ucts or services grow strongly; and the research and development activity in my sector grows strongly (Cronbach’s alpha of 0.726).
Dependent Variable
We have included ‘entry timing’ as the dependent variable. This variable was measured with a three-item scale adapted from the study of Covin et al. (2000).11 This scale is as follows: we compete heavily on the basis of being fi rst to the market with new product; we typically precede our major competitors in bringing new products to the market; and we off er products that are unique and distinctly diff erent from those of our major competitors (Chronbach’s alpha of 0.712). This scale has allowed us to use a variable that refl ects the new ventures’ propensity to develop a pioneer type behav-iour, which is not exactly to create a new product or to enter in a specifi c market, but a way of going about making decisions and taking actions

90 Entrepreneurship and growth
(Covin et al., 2000). We have used a fi ve-point Likert scale that, though it supports some bias derived from subjective valuation of the moment of entry in the market, eliminates the tendency of the late follower group that existed in the PIMS database to self-exclude (Golder and Tellis, 1993).
In order to establish the response consistency of the moment of entry variable we examined the correlation between the moment of entry and the competitive proactivity variable,12 which is measured with two items adapted from Venkatraman (1989) (Chronbach’s alpha of 0.772). The results obtained show a level of correlation of 0.548 positive and sig-nifi cant to 99 per cent, so that we may consider the response consistency established.
Independent Variables
Environmental conditionsWe have measured environmental conditions by means of requesting the new ventures’ chief executive offi cers to value their perceptions of the industrial level of imitation and market rivalry. Thus, we could analyse the infl uence of these variables on the decision of when to enter the market. For these, and for all the variables included in this study, the new ven-tures’ chief executive offi cers have valued their perceptions of them. We believe that the perceptions of the market environment are most relevant for studies that focus on new ventures’ specifi c actions, such as the choice of entry timing (Boyd et al., 1993). We asked the managers about their view of industry conditions, because managers’ views of their fi rms’ main industry shape their strategic choices (Covin et al., 2000; Keats and Hitt, 1988).
Imitation. We can defi ne the imitation level in the sector as the group of market reactions to a new product’s introduction (Chaney et al., 1991). This means the imitation level will be high if, when a new product is intro-duced into the market, there are many actions to imitate it. Conversely, the imitation level will be low if there are hardly any actions to imitate it at all. In this case, we have not found a validated scale for measuring this variable, so we have created a measurement scale. This variable was meas-ured with a two-item scale created13 from Lee et al. (2000). The scale is as follows: the fi rms in the sector usually imitate new products introduced into the market rapidly; and competitors have unique capabilities of imitating new products introduced into the market (Cronbach’s alpha of 0.783).
Rivalry. Rivalry refl ects an unfavourable business climate, with intense competition for resources and market opportunities (Iansiti, 1995). This
The role of capabilities 91
variable was measured by a fi ve-item scale adapted from Covin et al. (2000). The scale is as follows: the number of fi rms that fail in my sector is high; the competitive intensity based on quality is high in my sector; the competitive intensity based on service is high in my sector; the competitive intensity based on prices is high in my sector; and the number of competitors is high in my sector (Cronbach’s alpha of 0.705).
CapabilitiesIn relation to the measurement of fi rm capabilities we have reviewed several studies in order to select the most suitable scales (Chandler and Hanks, 1994; Li and Calantone, 1998; Lilien and Yoon, 1990; Makadok, 1998; Miller, 1996; Robinson et al., 1992; Shepherd et al., 2000; Spanos and Lioukas, 2001; Williams et al., 1991).14 Finally, we have included part of the scale15 proposed by Spanos and Lioukas (2001) because we consider it to be the most suitable scale for our study. Thus, we have included two kinds of capabilities:16 managerial and marketing capabilities.
Managerial capabilities. These capabilities are linked to organizational and managerial processes. The construct includes seven items: fi rms’ climate, effi ciency in the organisational structure, mechanisms of effi cient coordination, knowledge and skills of employees, managerial competences, the procedures of strategic planning and the ability to attract creative employees (Cronbach’s alpha of 0.842).
Marketing capabilities. These capabilities refer to the output-based competences. The construct includes four items: the advantages in the relations with clients, the customer ‘installed base’, control and access to the distribution channels and market knowledge (Cronbach’s alpha of 0.796).
Interaction terms. As explained previously, we have hypothesized that the interactions between a new venture’s specifi c capabilities and market conditions have an infl uence on entry timing. In order to measure these interactions we need to create the interaction terms among market condi-tions (imitation and rivalry) and new ventures’ capabilities (managerial and marketing). We have built these interaction terms by multiplying both groups of variables (Cohen and Cohen, 1983).
Analysis
After measuring variables we developed several statistical techniques in order to test the hypotheses specifi ed in our research. First, we developed a correlation analysis to verify that there are no multicollinearity problems
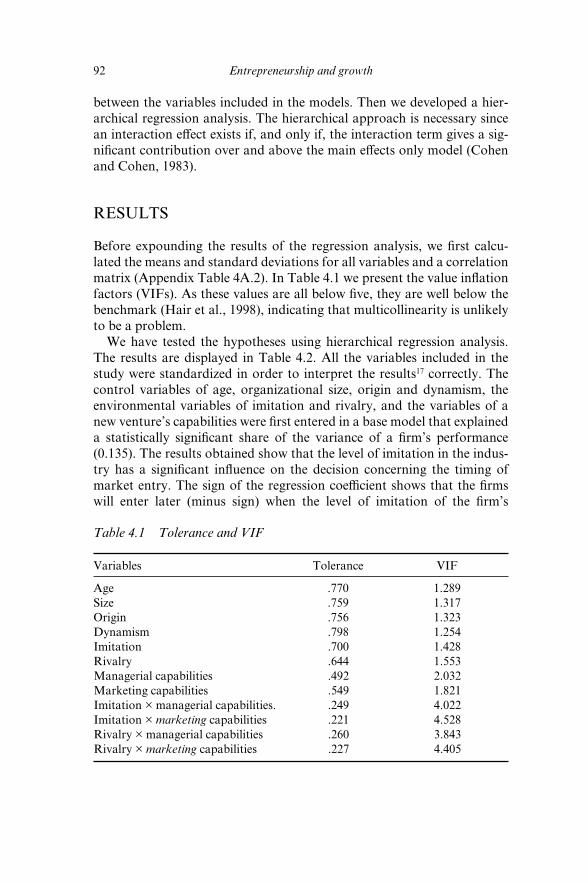
92 Entrepreneurship and growth
between the variables included in the models. Then we developed a hier-archical regression analysis. The hierarchical approach is necessary since an interaction eff ect exists if, and only if, the interaction term gives a sig-nifi cant contribution over and above the main eff ects only model (Cohen and Cohen, 1983).
RESULTS
Before expounding the results of the regression analysis, we fi rst calcu-lated the means and standard deviations for all variables and a correlation matrix (Appendix Table 4A.2). In Table 4.1 we present the value infl ation factors (VIFs). As these values are all below fi ve, they are well below the benchmark (Hair et al., 1998), indicating that multicollinearity is unlikely to be a problem.
We have tested the hypotheses using hierarchical regression analysis. The results are displayed in Table 4.2. All the variables included in the study were standardized in order to interpret the results17 correctly. The control variables of age, organizational size, origin and dynamism, the environmental variables of imitation and rivalry, and the variables of a new venture’s capabilities were fi rst entered in a base model that explained a statistically signifi cant share of the variance of a fi rm’s performance (0.135). The results obtained show that the level of imitation in the indus-try has a signifi cant infl uence on the decision concerning the timing of market entry. The sign of the regression coeffi cient shows that the fi rms will enter later (minus sign) when the level of imitation of the fi rm’s
Table 4.1 Tolerance and VIF
Variables Tolerance VIF
Age .770 1.289Size .759 1.317Origin .756 1.323Dynamism .798 1.254Imitation .700 1.428Rivalry .644 1.553Managerial capabilities .492 2.032Marketing capabilities .549 1.821Imitation × managerial capabilities. .249 4.022Imitation × marketing capabilities .221 4.528Rivalry × managerial capabilities .260 3.843Rivalry × marketing capabilities .227 4.405
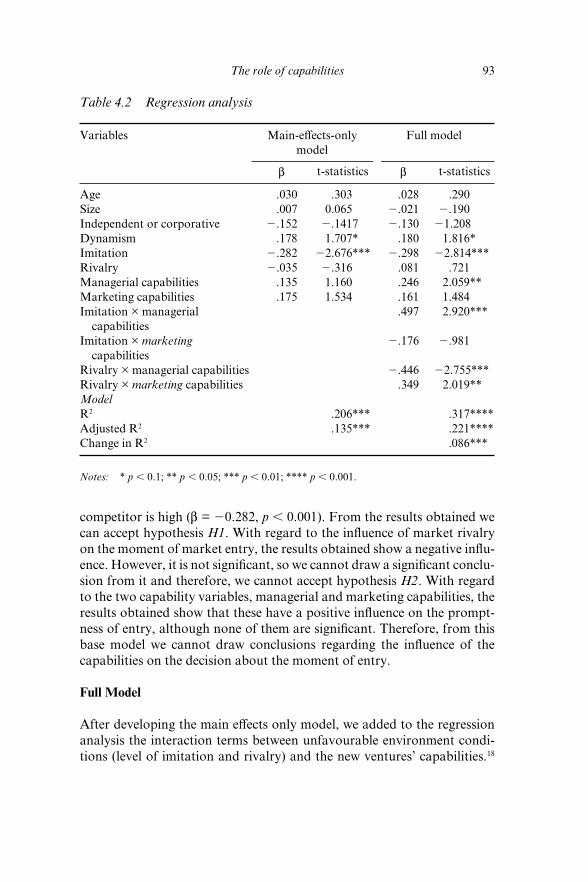
The role of capabilities 93
competitor is high (b = 20.282, p , 0.001). From the results obtained we can accept hypothesis H1. With regard to the infl uence of market rivalry on the moment of market entry, the results obtained show a negative infl u-ence. However, it is not signifi cant, so we cannot draw a signifi cant conclu-sion from it and therefore, we cannot accept hypothesis H2. With regard to the two capability variables, managerial and marketing capabilities, the results obtained show that these have a positive infl uence on the prompt-ness of entry, although none of them are signifi cant. Therefore, from this base model we cannot draw conclusions regarding the infl uence of the capabilities on the decision about the moment of entry.
Full Model
After developing the main eff ects only model, we added to the regression analysis the interaction terms between unfavourable environment condi-tions (level of imitation and rivalry) and the new ventures’ capabilities.18
Table 4.2 Regression analysis
Variables Main-eff ects-only model
Full model
b t-statistics b t-statistics
Age .030 .303 .028 .290Size .007 0.065 2.021 2.190Independent or corporative 2.152 2.1417 2.130 21.208Dynamism .178 1.707* .180 1.816*Imitation 2.282 22.676*** 2.298 22.814***Rivalry 2.035 2.316 .081 .721Managerial capabilities .135 1.160 .246 2.059**Marketing capabilities .175 1.534 .161 1.484Imitation × managerial capabilities
.497 2.920***
Imitation × marketing capabilities
2.176 2.981
Rivalry × managerial capabilities 2.446 22.755***Rivalry × marketing capabilities .349 2.019**ModelR2 .206*** .317****Adjusted R2 .135*** .221****Change in R2 .086***
Notes: * p , 0.1; ** p , 0.05; *** p , 0.01; **** p , 0.001.
94 Entrepreneurship and growth
The addition of the interaction terms gives an explanatory contribution over and above that of the base model (ΔR2 = 0.086, p , 0.001). This sug-gests that interaction eff ects are indeed present, thus the interactive eff ects between imitation and rivalry – and a fi rm’s capabilities – infl uence the decision concerning the timing of entry into the market. Specifi cally, the results show that greater managerial capabilities (b = .246, p , 0.005), greater environmental dynamism (b = .180, p , 0.01) and a lower level of imitation (b = –.298 p , 0.001) favour prompt entry into the market.
In relation to the interactive eff ects the results obtained allow us to state that, as proposed in H3 and H4, in environments with high levels of imita-tion and rivalry, the possession of certain kinds of capabilities will infl u-ence the new ventures’ decision concerning the moment of market entry. Specifi cally the results show that the availability of managerial capabili-ties in sectors with high levels of imitation (b = .497, p , 0.001) favours pioneer type behaviour, whereas the possession of greater marketing capa-bilities favours later follower type behaviour, although not in a signifi cant way. Furthermore, the results obtained show that in industries with high levels of rivalry, greater marketing capabilities favour early entry into the market (b = .349, p , 0.005) whereas greater managerial capability (b = –.446, p , 0.001) favours late entry into the market. From the results obtained we can accept H3 (partially) and H4.
DISCUSSION AND CONCLUSIONS
With regard to the environmental conditions, the results obtained show that only the level of imitation in the industry creates a signifi cantly unfavourable environment in order to develop pioneer type behaviour by new ventures. However, rivalry does not infl uence in a signifi cant way the new ventures’ moment of entry into the market. With regard to the infl u-ence of the new ventures’ managerial and marketing capabilities, we have verifi ed that, although their infl uence on the promptness of the moment of entry is always positive, there are none that are signifi cant. Only in the full model did we fi nd that greater managerial capabilities favour pioneer type behaviour in the new ventures. As expected, the interactive eff ects between the new ventures’ capabilities and market conditions have a strong infl uence on the moment of market entry. In industries with a high level of imitation, those new ventures with greater managerial capabilities will enter earlier into the market. In more hostile environments, greater marketing capabilities favour an earlier entry. However, greater manage-rial capabilities favour later entry.
The results obtained also show that new ventures adapt their activity
The role of capabilities 95
to the environmental conditions and their evolution. With regard to the level of imitation, we also obtained the expected result, because imitation leads to later entry of the new ventures into the market. Thus, new ven-tures avoid the potentially negative eff ect of pioneer entry when there is imitation (Lee et al., 2000). These results add empirical evidence to studies that suggest that a high ability for a competitor to imitate negatively aff ects the expectations of achieving a sustainable competitive advantage with pioneer market entry (Bowman and Gatignon, 1995; Durand and Coeurderoy, 2001).
With regard to the infl uence of market rivalry on the moment of entry the results obtained are not conclusive. In our research the opposite eff ects raised in the entry timing literature have been highlighted (Zahra and Bogner, 1999; Levesque and Shepherd, 2004). Therefore, as Miller and Friesen (1984) observed, market rivalry does not only have one pos-sible relationship with the moment of market entry, so it would be neces-sary to include other moderating variables that allow us to explain this relationship.
Furthermore, with regard to the infl uence of resources and capabilities on the moment of entry into the market (Lieberman and Montgomery, 1998), we have not found conclusive results. In this sense, only in the full model did managerial capabilities have a positive and signifi cant infl u-ence on entry timing. These results refl ect the doubts we have found in the market literature about the direct eff ect of certain resources and capabili-ties on the timing of the entry of new ventures into the market (Williams et al., 1991; Kerin et al., 1992; Deeds et al., 1999). With regard to studies that have demonstrated how certain resources favour early entry into the market (Mitchell, 1989; Robinson et al., 1992; Schoenecker and Cooper, 1998; Thomas, 1996), this can be explained by the fact that these studies are mostly developed in industries whose characteristics favour the obtain-ing of fi rst mover advantages by those new ventures that have suitable capabilities (Henderson, 1993; Henderson and Clark, 1990).
Of particular relevance are the results obtained regarding the infl uence of the availability of certain capabilities in unfavourable environmen-tal conditions on the new ventures’ moment of entry into the market. Managerial and organizational capabilities favour pioneer type behaviour by new ventures in industries with a high level of imitation. These capa-bilities are based on organizational innovations characterized by longer gestation lags and more residual uncertainty (Lieberman and Asaba, 2006). Thus, by means of early entry, new ventures can exploit their managerial capabilities, creating strong resource position barriers that impede follower fi rms from damaging fi rst mover advantages, although they have strong imitation capabilities. With regard to the infl uence of
96 Entrepreneurship and growth
the marketing capabilities in environments with high levels of imitation, the results obtained show the negative infl uence of this variable on the promptness of the new ventures’ moment of entry, although these results are not statistically signifi cant. This seems to be an unfavourable situa-tion for obtaining fi rst mover advantage. The availability of marketing capabilities can favour the development of follower behaviour, given the risk of cannibalizing their own products – not late follower behaviour but early follower behaviour. In this sense, the availability of marketing capa-bilities, traditionally linked to early follower behaviour (Schoenecker and Cooper, 1998; Lee et al., 2000), would explain both the negative infl uence that we have obtained in the regression analysis and the lack of signifi cant infl uence. This is mainly because these capabilities favour an intermediate entry between the pioneer and the late follower.
The results obtained show that, in environments with high levels of rivalry, marketing capabilities favour earlier entry into the market. These capabilities are the most relevant complementary assets in order for pioneer new ventures to obtain commercial success from new product exploitation in environments with strong competition for opportunities and market resources (Shepherd et al., 2000). This is because these capa-bilities allow the fi rms to infl uence the formation of consumer preferences, avoiding price wars and the scarce loyalty to products that is usual in hostile environments. Furthermore, the control of distribution chan-nels allows pioneer new ventures to tap into the most attractive market segments, forcing the follower companies to gain access to the rest.
In contrast, greater managerial capabilities lead to later entry in highly hostile industries. In this sense, given the high risk that new ventures face in environments with high rivalry, these capabilities, which are linked to planning, learning and adaptation, can lead a new venture to defensive behaviour – maintaining its strategic commitment with successful prod-ucts and markets (Day and Schoemaker, 2001; Mitchell, 1989). In this sense, those new ventures with greater managerial capabilities in highly hostile environments will make use of their experience and management teams in a better way if they adopt late entry into the market.
One of the main contributions of this study involves analysing how the possession of a certain kind of resource in an industry with specifi c unfavourable characteristics will infl uence new ventures’ behaviour with regard to the moment of entry into the market.19 It confi rms the need to study the interactive eff ects of market conditions and a fi rm’s capabilities, previously raised by several authors (for example, Teece et al., 1997). With this study we give empirical support to the industrial organization and evolutionary economy approaches, because the obtained results support the infl uence of market conditions on new ventures’ behaviour (Levesque
The role of capabilities 97
and Shepherd, 2004). However, the main contribution of our results is linked to the population ecology approach. We appreciate that, when new ventures have key capabilities that coincide with the capabilities needed for survival and success in a new market, they enter early into the market (Brittain and Freeman, 1980), even when they perceive unfavourable environmental conditions.
We can conclude that new ventures will tend to develop late follower type behaviour if they perceive unfavourable conditions in the industry linked to the threat of competitors’ imitation, because these conditions can both increase the survival risk and make obtaining fi rst mover advantages diffi cult. Nevertheless, the availability of relevant managerial capabili-ties to face an unfavourable environment leads a new venture to develop pioneer type behaviour. However, we have not found that rivalry leads to developing late follower type behaviour in new ventures. We have found that the availability of strong marketing capabilities in new ventures to face a highly hostile environment successfully favours pioneer type behav-iour. Similar to Makadok (1998), given a new venture’s perception of unfavourable environmental conditions, the availability of key capabili-ties to develop and market new products in a constant way and the pos-sibility of creating strong ‘resource position barriers’ will favour pioneer behaviour on its part.
With this study we contribute to overcoming several methodological biases in studies that have analysed the new ventures’ moment of entry (e.g. Zahra, 1996; Shepherd and Shanley, 1998; Zahra and Bogner, 1999; Covin et al., 2000; Levesque and Shepherd, 2004). We have included tra-ditional control variables (age and size) and the independent or corporate origin of new ventures, because the fi rm’s origin can aff ect its strategic behaviour (Zahra, 1996) and initial success (Chrisman et al., 1998; Shrader and Simon, 1997). We have also included the perception of the market dynamism that the neo-Austrian perspective highlights as a variable both favouring the generation of new opportunities (Hill and Deeds, 1996) and aff ecting the strategic behaviour of new ventures (Dean and Meyer, 1996). Furthermore, following the suggestions developed by Shepherd and Shanley (1998) and Covin et al. (2000), we have considered the vari-able entry timing as continuous, spreading from market pioneer to late follower. This scale has allowed us to use a variable that refl ects a fi rm’s propensity to develop pioneer behaviour.20 Moreover, we have included adolescent fi rms among the population of new ventures (Bantel, 1998). We include these fi rms because in technological industries, the infl uence of environmental factors and capabilities on a new venture’s behaviour and performance can appear across a number of years (Chandler and Hanks, 1994).21
98 Entrepreneurship and growth
In the development of the present study, we note several limitations that may aff ect the results obtained. First, we must indicate the cross-sectional and non-longitudinal nature of the study. Nevertheless, we think that, because of the detailed information required to achieve our research aims, a longitudinal study would be excessively complex.
In addition, the perceptions of the CEOs with regard to industry con-ditions and new venture capabilities will not necessarily coincide exactly with objective reality, which might lead to possible limitations in the results obtained. However, we consider that the managerial perceptions refl ect the new ventures’ view of reality in their industry, relative capabili-ties and entry timing (Zahra, 1996; Shepherd et al., 2000). Furthermore, the measurement of entry timing as a continuous variable and its high cor-relation level with proactivity reinforces the validity of the measurement of this variable (Covin et al., 2000).
From the results obtained, we can expound several implications for new ventures’ managers. In this sense, we consider that managers must judge if their fi rms have suitable capabilities to take advantage of fi rst mover advantages given unfavourable environmental conditions. They must also evaluate the joint risks derived from pioneer entry given unfavourable conditions and the high risk of new ventures in their early years (Williams et al., 1991; Zahra and Bogner, 1999; Shepherd et al., 2000). In this sense, the managers of new ventures can develop and exploit certain capabilities in order to take advantage of the opportunities of early entry in industries with imitation and rivalry.
The conclusions of this chapter lead us to establish a series of proposals for future studies. A possible line of research would be its extension to other sectors of industrial activity, as well as to service sector companies. We also propose the inclusion of new market conditions, such as the heterogeneity or market potential, and new resources and capabilities that are specifi c to the analysed sector. This would allow deeper study of the infl uence of new interactions on the entry timing of new ventures into the market. We also consider it would be interesting to analyse several environmental conditions in a joined-up way (for example, imitation, rivalry and dynamism). Finally, a possible extension of this study would be to compare the direct and inter-active eff ects of environmental conditions and new ventures’ capabilities on entry timing among independent and corporate new ventures.
NOTES
1. In this chapter, we have not included technological capabilities that have been analysed in previous studies (Mitchell, 1989; Schoenecker and Cooper, 1998; Thomas, 1996).

The role of capabilities 99
2. The environmental factors are refl ected in the managers’ perceptions of their fi rm’s major industry, because we consider that managerial perceptions are the main factors that determine the fi rms’ strategic behaviour (Covin et al., 2000).
3. The rivalry is generally associated with reductions in the profi tability of the industry (Porter, 1985). Zahra and Bogner (1999) identify rivalry with hostility.
4. Zahra and Bogner (1999) determine that in both ‘price’ and ‘no price’ hostile envi-ronments, early entry into the market is negatively associated with the new ventures’ performance.
5. Mitchell (1989) points out that the new ventures that perceive important potential advantages of an early market entry will tend to enter quickly into the new market if their resources and capabilities allow it.
6. Makadok (1998) suggests that these advantages will be resistant to the entry of new competitors, even in industries with few entry and imitation barriers.
7. Rivkin (2000) highlights that the imitation process can become unprofi table if it is nec-essary to imitate many elements and interactions to achieve success.
8. Boulding and Christen (2003) consider that if there are limited entry barriers after a pioneer entry, the follower fi rms will take advantage of the pioneer’s previous invest-ments in product design and marketing.
9. Several authors have pointed out that market hostility does not have only one relation-ship with the fi rm’s innovation (Miller and Friesen, 1984). In this sense, it highlights the need to study which are the new venture’s capabilities that favour early market entry in a highly hostile industry (Teece et al., 1997).
10. We established a maximum age of 12 years to defi ne the population of new ventures, according to Chandler and Hanks (1994) and Bantel (1998).
11. We excluded one of the items of the Covin et al. (2000) scale in order to improve its coherence and to get a better adaptation to our study.
12. We have examined the correlation between the moment of entry and competitive proactiveness (Venkatraman, 1989) because according to Covin et al. (2000), these two variables refl ect a similar fi rm’s behaviour, and when we prove that these variables are correlated we can consider the response consistency established.
13. We have created a scale for measuring imitation. We have included these two items in the scale because after reviewing the literature we concluded that these two items refl ected the fi rms’ behaviour we wanted to measure.
14. Several of these papers analyse the new ventures.15. The scale proposed by Spanos and Lioukas (2001) distinguishes among three kinds of
capabilities: managerial, marketing and technical capabilities.16. In this sense, as we have explained previously, we want to analyse the infl uence of
managerial and marketing capabilities on the moment of entry, and this scale (Spanos and Lioukas, 2001) gathers these variables.
17. The values for mean and standard deviation are included in the table of correlations and were calculated before to standardize the variables.
18. We developed the hierarchical approach because an interaction eff ect exists if, and only if, the interaction term gives a signifi cant contribution over and above the main eff ects only model (Cohen and Cohen, 1983).
19. As we proposed in the hypothesis, we have proved that if a new venture has the capa-bilities needed to face the competitive market conditions, this will directly infl uence its moment of market entry.
20. Thus, we eliminate the biases derived from the utilization of self-defi nition measures, like those established in the PIMS database, avoiding the tendency for self-exclusion of the late follower group.
21. We have included the variable age in order to control its eff ect on the moment of entry into the market.

100 Entrepreneurship and growth
REFERENCES
Armstrong, J.S. and T. Overton (1977), ‘Estimating nonresponse bias in mail surveys’, Journal of Marketing Research, 14, 396–402.
Bain, J.S. (1956), Barriers to New Competition, Cambridge, MA: Harvard University Press.
Bantel, K.A. (1998), ‘Technology-based, adolescent fi rm confi gurations: strategy identifi cation, context, and performance’, Journal of Business Venturing, 13, 205–30.
Boulding, W. and M. Christen (2003), ‘Sustainable pioneering advantage: profi t implications of market entry order’, Marketing Science, 22 (3), 371–92.
Bowman, D. and H. Gatignon (1995), ‘Determinants of competitor response time to a new product introduction’, Journal of Marketing Research, 23, 42–53.
Boyd, B., G.C. Dess and A. Rasheed (1993), ‘Divergence between archival and perceptual measures of the environment: causes and consequences’, Academy of Management Review, 18, 204–26.
Brittain, J. and J. Freeman (1980), ‘Organizational proliferation and density dependent selection’, in J. Kimberly and R. Miles (eds), The Organization Life Cycle, San Francisco, CA: Jossey-Bass, pp. 291–338.
Carpenter, G.S. and K. Nakamoto (1994), ‘Refl ections on consumer preference formation and pioneering advantage’, Journal of Marketing Research, 31, 570–3.
Chandler, G.N. and S.H. Hanks (1994), ‘Market attractiveness, resource-based capabilities, venture strategies, and venture performance’, Journal of Business Venturing, 9, 331–49.
Chaney, P.K., T.M. Devinney and R.S. Winer (1991), ‘The impact of new product introductions on the market value of fi rms’, Journal of Business, 64, 573–610.
Chrisman, J.J., A. Bauerschmidt and C.W. Hofer (1998), ‘The determinants of new venture performance: an extended model’, Entrepreneurship Theory and Practice, 23 (1), 5–29.
Coeurderoy, R. and R. Durand (2004), ‘Leveraging the advantage of early entry: proprietary technologies versus cost leadership’, Journal of Business Research, 57, 583–90.
Cohen, J. and P. Cohen (1983), Applied Multiple Regression/Correlation Analysis for the Behavioural Sciences, 2nd edn, Hillsdale, NJ: Lawrence Erlbaum Associates, Inc.
Conant, J., M.P. Mokwa and P.R. Varadarajan (1990), ‘Strategic types, distinctive marketing competencies and organizational performance: a multiple-measures based study’, Strategic Management Journal, 11, 365–83.
Covin, J.G., D.P. Slevin and M.B. Heeley (2000), ‘Pioneers and followers: com-petitive tactics, environment, and fi rm growth’, Journal of Business Venturing, 15, 175–210.
Cronbach, L.J. (1951), ‘Coeffi cient alpha and the internal structure of test’, Psychometrika, 31, 93–6.
Day, G. and P. Schoemaker (2001), ‘Avoiding the pitfalls of emerging technolo-gies’, California Management Review, 42, 8–33.
Dean, T.J. and G.D. Meyer (1996), ‘Industry environments and new venture for-mations in U.S. manufacturing: a conceptual and empirical analysis of demand determinants’, Journal of Business Venturing, 11, 107–32.

The role of capabilities 101
Deeds, D.L., D. De Carolis and J. Coombs (1999), ‘Dynamic capabilities and new product development in high technology ventures: an empirical analysis of new biotechnology fi rms’, Journal of Business Venturing, 15 (3), 211–30.
Dess, G.G. and D.W. Beard (1984), ‘Dimensions of organizational task environ-ments’, Administrative Science Quarterly, 29, 52–73.
Durand, R. and R. Coeurderoy (2001), ‘Age, order of entry, strategic orientation, and organizational performance’, Journal of Business Venturing, 16, 471–94.
Geroski, P.A. (1995), ‘What do we know about entry?’, International Journal of Industrial Organization, 13, 421–40.
Giarratana, M.S. (2004), ‘The birth of a new industry: entry by start-ups and the drivers of fi rm growth. The case of encryption software’, Research Policy, 33, 787–806.
Golder, P.N. and G.J. Tellis (1993), ‘Pioneer advantage: marketing logic or mar-keting legend?’, Journal of Marketing Research, 30, 158–70.
Hair, J.F., R.E. Anderson, R.L. Tatham and W.C. Black (1998), Multivariate Data Analysis, New York: Prentice Hall International.
Hambrick, D.C. (1981), ‘Environment, strategy and power within top manage-ment teams’, Administrative Science Quarterly, 26, 253–76.
Hannan, M.T. and J. Freeman (1977), ‘The population ecology of organizations’, American Journal of Sociology, 82 (5), 929–64.
Henderson, R. (1993), ‘Underinvestment and incompetence as responses to radical innovation: evidence from the photolithographic alignment equipment indus-try’, Rand Journal of Economics, 24 (2), 248–70.
Henderson, R.M. and K.B. Clark (1990), ‘Architectural innovation: the recon-fi guration of existing product technologies and the failure of established fi rms’, Administrative Science Quarterly, 35, 9–30.
Hill, C.W.L. and D.L. Deeds (1996), ‘The importance of industry structure for the determination of fi rm profi tability: a neo-Austrian perspective’, Journal of Management Studies, 33 (4), 429–51.
Iansiti, M. (1995), ‘Shooting the rapids: managing product development in turbu-lent environments’, California Management Review, 38 (1), 37–58.
Keats, B. and M.A. Hitt (1988), ‘A casual model of linkages among environmental dimensions, macro organizational characteristics, and performance’, Academy of Management Journal, 31, 570–98.
Kerin, R., R.R. Varadarajan and R. Peterson (1992), ‘First-mover advantage: a synthesis, conceptual framework, and research propositions’, Journal of Marketing, 56 (4), 33–52.
Lee, H., K.G. Smith, C.M. Grimm and A. Schomburg (2000), ‘Timing, order and durability of new product advantages with imitation’, Strategic Management Journal, 21 (1), 23–30.
Levesque, M. and D.A. Shepherd (2004), ‘Entrepreneurs’ choice of entry strat-egy in emerging and developed markets’, Journal of Business Venturing, 19, 29–54.
Li, T. and R.J. Calantone (1998), ‘The impact of market knowledge competence on new product advantage: conceptualization and empirical examination’, Journal of Marketing, 62, 13–29.
Lieberman, M.B. and S. Asaba (2006), ‘Why do fi rms imitate each other?’, Academy of Management Review, 31 (2), 366–85.
Lieberman, M.B. and D.B. Montgomery (1988), ‘First mover advantages’, Strategic Management Journal, Summer Special Issue, 9, 41–58.
102 Entrepreneurship and growth
Lieberman, M.B. and D.B. Montgomery (1998), ‘First mover (dis)advantages: retrospective and link with the resource-based view’, Strategic Management Journal, 19, 1111–25.
Lilien, G.L and E. Yoon (1990), ‘The timing of competitive market entry: an exploratory study of new industrial products’, Management Science, 36 (5), 568–85.
Lippman, S.A. and R.P. Rumelt (1982), ‘Uncertain imitability: an analysis of inter-fi rm diff erences in effi ciency under competition’, Bell Journal of Economics, 13, 418–38.
McEvily, B. and A. Zaheer (1999), ‘Bringing ties. A source of fi rm heterogeneity in competitive capabilities’, Strategic Management Journal, 20, 1133–56.
Makadok, R. (1998), ‘Can fi rst-mover and early-mover advantages be sustained in an industry with low barriers to entry/imitation?’, Strategic Management Journal, 19 (7), 683–96.
Miller, D. (1987), ‘Strategy making and structure: analysis and implications for performance’, Academy of Management Journal, 30 (1), 7–32.
Miller, D. (1996), ‘Confi gurations revisited’, Strategic Management Journal, 17, 505–12.
Miller, D. and P.H. Friesen (1984), Organizations: A Quantum View, Englewood Cliff s, NJ: Prentice Hall.
Mitchell, W. (1989), ‘Whether and when? Probability and timing of incumbents entry into emerging industrial subfi elds’, Administrative Science Quarterly, 34, 208–30.
Nadler, D.A. and M. Tushman (1997), Competing By Design: The Power of Organizational Architecture, New York: Oxford University Press.
Nelson, R.R. and S.G. Winter (1982), An Evolutionary Theory of Economic Change, Cambridge, MA: Harvard University Press.
Porter, M. (1985), Competitive Advantage: Creating and Sustaining Superior Performance, New York: Free Press.
Rivkin, J.W. (2000), ‘Imitation of complex strategies’, Management Science, 46, 824–44.
Robinson, K.C. (1998), ‘An examination of the infl uence of industry structure on eight alternative measures of new venture performance for high potential inde-pendent new ventures’, Journal of Business Venturing, 14, 165–87.
Robinson, W.T., C. Fornell and M. Sullivan (1992), ‘Are market pioneers intrinsi-cally stronger than later entrants?’, Strategic Management Journal, 13, 609–24.
Romanelli, E. (1989), ‘Environments and strategies of organization start-up: eff ects on early survival’, Administrative Science Quarterly, 34, 369–87.
Roure, J.B. and M.A. Maidique (1986), ‘Linking pre-funding factors and high-technology venture success: an exploratory study’, Journal of Business Venturing, 1 (3), 295–306.
Rumelt, R.P. (1974), ‘Towards a strategic theory of the fi rm’, in R. Lamb (ed.), Competitive Strategic Management, Englewood Cliff s, NJ: Prentice Hall, pp. 556–70.
Schoenecker, T.S. and A.C. Cooper (1998), ‘The role of fi rm resources and organi-zational attributes in determining entry timing: a cross-industry study’, Strategic Management Journal, 19, 1127–43.
Shamsie, J., C. Phelps and J. Kuperman (2004), ‘Better late than never: study of late entrants in household electrical equipment’, Strategic Management Journal, 25, 69–84.
The role of capabilities 103
Shankar, V., G. Carpenter and L. Krishnamurthi (1998), ‘Late mover advantage: how innovative late entrants outsell pioneers’, Journal of Marketing Research, 35, 54–70.
Shepherd, D.A. and M. Shanley (1998), New Venture Strategy. Timing, Environment Uncertainty, and Performance, Thousand Oaks, CA: Sage Publications.
Shepherd, D.A., R. Ettenson and A. Crouch (2000), ‘New venture strategy and profi tability: a venture capitalist’s assessment’, Journal of Business Venturing, 15, 449–67.
Shrader, R.C. and M. Simon (1997), ‘Corporate versus independent new ventures: resource, strategy, and performance diff erences’, Journal of Business Venturing, 12, 47–66.
Spanos, Y.E. and S. Lioukas (2001), ‘An examination into the causal logic of rent generation: contrasting Porter’s competitive strategy framework and the resource based perspective’, Strategic Management Journal, 22, 907–34.
Suárez, F.Y. and G. Lanzolla (2005), ‘The half-truth of fi rst mover advantages’, Harvard Business Review, 83 (4), 121–7.
Taylor, A. and P. Anderson (2001), ‘Note on fi rst mover advantage’, Working Paper, the Ruck School of Business at Dartmouth.
Teece, D.J. (1986), ‘Profi ting from innovation’, in D.J. Teece (ed.), The Competitive Challenge, New York: Harper & Row, pp. 26–54.
Teece, D.J., G. Pisano and A. Shuen (1997), ‘Dynamic capabilities and strategic management’, Strategic Management Journal, 20, 509–33.
Thomas, L.A. (1996), ‘Brand capital and entry order’, Journal of Economics and Management Strategy, 5 (1), 107–29.
Tsai, W. (2001), ‘Knowledge transfer in intra-organizational networks. eff ects of network position and absorptive capacity on business unit innovation and per-formance’, Academy of Management Journal, 44 (5), 996–1004.
Venkatraman, N. (1989), ‘Strategic orientation of business enterprises’, Management Science, 35 (8), 942–62.
Williams, M.L., M.H. Tsai and D. Day (1991), ‘Intangible assets, entry strategies, and venture success in industrial markets’, Journal of Business Venturing, 6, 315–33.
Zahra, S.A. (1996), ‘Technology strategy and fi nancial performance: examining the moderating role of the fi rm’s competitive environment’, Journal of Business Venturing, 11, 189–219.
Zahra, S.A. and W.C. Bogner (1999), ‘Technology strategy and software new venture performance’, Journal of Business Venturing, 15, 135–73.
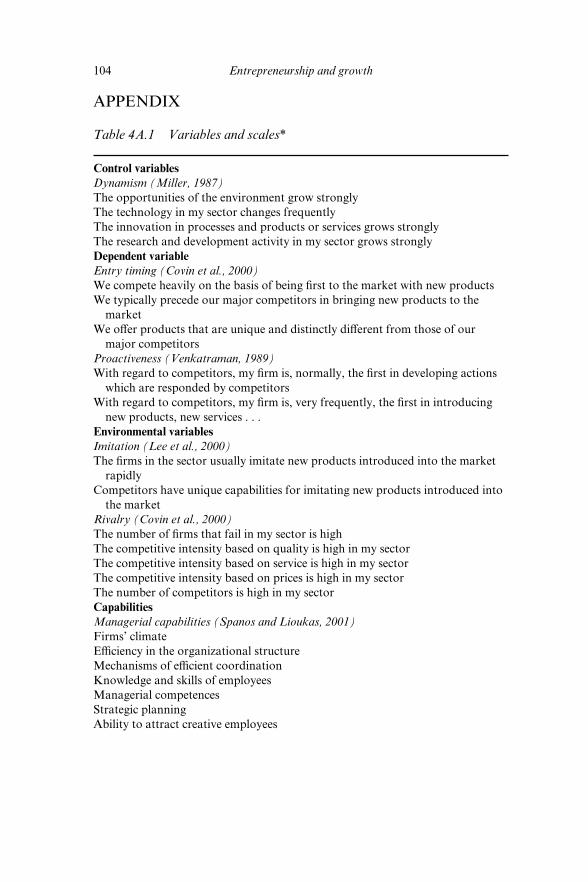
104 Entrepreneurship and growth
APPENDIX
Table 4A.1 Variables and scales*
Control variablesDynamism (Miller, 1987)The opportunities of the environment grow stronglyThe technology in my sector changes frequentlyThe innovation in processes and products or services grows stronglyThe research and development activity in my sector grows stronglyDependent variableEntry timing (Covin et al., 2000)We compete heavily on the basis of being fi rst to the market with new productsWe typically precede our major competitors in bringing new products to the
marketWe off er products that are unique and distinctly diff erent from those of our
major competitorsProactiveness (Venkatraman, 1989)With regard to competitors, my fi rm is, normally, the fi rst in developing actions
which are responded by competitorsWith regard to competitors, my fi rm is, very frequently, the fi rst in introducing
new products, new services . . .Environmental variablesImitation (Lee et al., 2000)The fi rms in the sector usually imitate new products introduced into the market
rapidlyCompetitors have unique capabilities for imitating new products introduced into
the marketRivalry (Covin et al., 2000)The number of fi rms that fail in my sector is highThe competitive intensity based on quality is high in my sectorThe competitive intensity based on service is high in my sectorThe competitive intensity based on prices is high in my sectorThe number of competitors is high in my sectorCapabilitiesManagerial capabilities (Spanos and Lioukas, 2001)Firms’ climateEffi ciency in the organizational structureMechanisms of effi cient coordinationKnowledge and skills of employeesManagerial competencesStrategic planningAbility to attract creative employees

The role of capabilities 105
Table 4A.1 (continued)
Marketing capabilities (Spanos and Lioukas, 2001)Advantages in the relations with clientsCustomer ‘installed base’Control and access to the distribution channelsMarket knowledge
Note: *As we have explained in the chapter, some of these scales are adapted from the original.
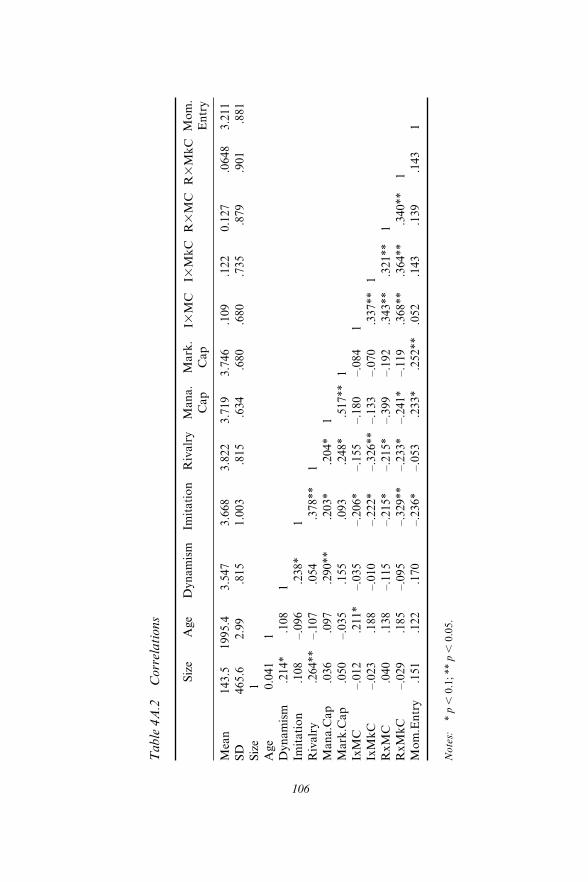
106
Tab
le 4
A.2
C
orre
latio
ns
Size
Age
Dyn
amism
Imita
tion
Riv
alry
Man
a.C
apM
ark.
Cap
I3M
CI3
MkC
R3
MC
R3
MkC
Mom
.E
ntry
Mea
n14
3.5
1995
.43.
547
3.66
83.
822
3.71
93.
746
.109
.122
0.12
7.0
648
3.21
1SD
465.
62.
99.8
151.
003
.815
.634
.680
.680
.735
.879
.901
.881
Size
1A
ge0.
041
1D
ynam
ism.2
14*
.108
1Im
itatio
n.1
08–.
096
.238
*1
Riv
alry
.264
**–.
107
.054
.378
**1
Man
a.C
ap.0
36.0
97.2
90**
.203
*.2
04*
1M
ark.
Cap
.050
–.03
5.1
55.0
93.2
48*
.517
**1
IxM
C–.
012
.211
*–.
035
–.20
6*–.
155
–.18
0–.
084
1Ix
MkC
–.02
3.1
88–.
010
–.22
2*–.
326*
*–.
133
–.07
0.3
37**
1R
xMC
.040
.138
–.11
5–.
215*
–.21
5*–.
399
–.19
2 .3
43**
.321
**1
RxM
kC–.
029
.185
–.09
5–.
329*
*–.
233*
–.24
1*–.
119
.368
**.3
64**
.340
**1
Mom
.Ent
ry.1
51.1
22.1
70–.
236*
–.05
3.2
33*
.252
**.0
52.1
43.1
39.1
431
Not
es:
* p
, 0
.1; *
* p
, 0
.05.
107
5. Switching from paid employment to entrepreneurship: the eff ect on individuals’ earningsMiguel Torres Preto, Rui Baptista and Francisco Lima
INTRODUCTION
The role played by the characteristics and preferences of individuals, as well as general and specifi c human capital in determining whether indi-viduals choose wage employment or self-employment, has been addressed by some key theoretical and empirical works in the discipline of econom-ics (Lucas, 1978; Kihlstrom and Laff ont, 1979; Evans and Leighton, 1989a; Blanchfl ower and Oswald, 1998; and Lazear, 2005). While theo-retical models highlight diff erences in expected earnings as the main factor determining the decision, empirical evidence does not provide clear support that earnings diff erentials play a signifi cant (or, at least, the most signifi cant) role in the choice between these two occupations (Parker, 2004). Moreover, empirical evidence on earnings diff erentials between the self-employed and wage employees does not favour the former (Hamilton, 2000).
The main objective of this chapter is to look at the pecuniary impact of becoming a business owner after being employed in a fi rm. We use data that allow us to observe individual and fi rm level eff ects on incomes simul-taneously, thus avoiding misspecifi cation problems associated with panel studies that only include personal data. We account for multiple deter-minants of wage earnings, such as individual attributes (age, education), employer characteristics (fi rm size, economic sector, and administrative region), and individuals’ career paths.
In line with labour economics research, while estimating individual earn-ings, we estimate diff erent types of earnings models, each including diff er-ent kinds of information concerning wage determinants. We fi rst consider individual attributes such as age, schooling and tenure, while controlling for fi rm characteristics, including fi rm size, industry and region. Secondly,
108 Entrepreneurship and growth
we include mobility variables for two specifi c groups, namely individuals switching from paid employment to business ownership and those switch-ing from paid employment in one fi rm to paid employment in another fi rm. Thirdly, we account for specifi c pecuniary eff ects for those individu-als who leave their current job to become entrepreneurs. Finally, infor-mation about the individuals’ careers is included as our data comprise historical employment data for individuals.
The following section reviews the literature on earnings diff erentials between waged workers and the self-employed. The third section dis-cusses the data and methodological issues. The fourth section presents the empirical specifi cation of the study. The fi fth section displays the esti-mation results and summarizes the main fi ndings, while the fi nal section concludes.
BACKGROUND
Economic models of occupational choice between wage employment and self-employment are mostly based on the expectation that individuals are attracted to business ownership because of higher expected earnings rela-tive to paid employment. In other words, paid employment earnings are the opportunity cost for entrepreneurs. However, the majority of recent evidence suggests that for comparable levels of education and experience, most self-employed individuals earn less than paid employees. An impor-tant stream of literature shows that over-optimism about future earnings as an entrepreneur plays a role in explaining this fact (Kahneman and Lovallo, 1993; Camerer and Lovallo, 1999). However, over-optimism does not explain persistence in self-employment by individuals who earn less than they could if they were paid employees. Some researchers argue that the evolution of earnings over time should show sharper increases for the self-employed than for paid employees as the self-employed do not share the rents of their investments in human capital (Becker, 1975). Others contend that earnings for waged workers should increase more sharply over time, in order to discourage shirking because of agency prob-lems, especially given that as a wage worker progresses up the job ladder, shirking becomes more costly to the fi rm (Lazear and Moore, 1984).
A stream of literature examines the diff erence between the earnings of waged employees and those of the self-employed. While most studies using cross-sectional data fi nd that the self-employed have lower earn-ings than paid employees (Bregger, 1963; Ray, 1975; Fain, 1980; Becker, 1984; Haber et al., 1987; and Carrington et al., 1996), studies using longi-tudinal data fi nd that mean earnings are to some extent analogous (Rees
Switching from paid employment to entrepreneurship 109
and Shah, 1986; Gill, 1988; Borjas and Bronars, 1989). Some of these latter studies indicate that initial earnings growth for entrepreneurs in a new business is larger than the growth in wages for salaried employees starting a new job (Brock and Evans, 1986; Rees and Shah, 1986; Borjas and Bronars, 1989; Evans and Leighton, 1989a; and Hamilton, 2000). Other empirical studies report an average income advantage for the self-employed (Form, 1985; Borjas, 1986; Carroll and Mosakowski, 1987; Ferber and Waldfogel, 1998; Quadrini, 1999; and Fairlie, 2004). There are multiple determinants explaining the decision to become self-employed. Hsu et al. (2007) highlight the importance of fi nancial and opportunity cost-based determinants. Individuals are more likely to start new fi rms if their opportunity costs are lower; that is, they have relatively low current wage earnings and their liquidity constraints are less binding than for others (Evans and Jovanovic, 1989; Amit et al., 1995; Iyigun and Owen, 1998; Blanchfl ower and Oswald, 1998; Dunn and Holtz-Eakin, 2000). Additionally, employees are more likely to leave their existing organiza-tion and become self-employed when there is a slowdown in sales growth (Gompers et al., 2005). Other studies fi nd a negative correlation between tax rates and self-employment in lower tax brackets (Blau, 1987).
Human capital theory proposes a positive relationship between factors such as formal education or professional experience with labour produc-tivity (Mincer, 1974; Becker, 1975). Theoretical models of entrepreneurial choice and dynamics, such as those by Lucas (1978) and Jovanovic (1982), posit that entrepreneurial ability (whether pre-determined or learned) is a fundamental determinant of occupational choice. While experienced and educated wage workers are expected to be more produc-tive and are consequently rewarded with higher earnings in the labour market, Casson (2003) argues that the skills that make good entrepre-neurs are not necessarily the same as those embodied in formal quali-fi cations. Even if individuals are not endowed with the complete set of skills necessary to start a business, they can acquire those skills. Lazear (2005) suggests that entrepreneurs should be generalists while those who work for others should be specialists, implying that human capital invest-ments diff er between those who end up as entrepreneurs and those who end up in salary or waged work. While Evans and Leighton (1989a) and Evans and Jovanovic (1989) fi nd no connection between formal educa-tion and entrepreneurial earnings, Silva (2006) fi nds that changes in the spread of knowledge across diff erent fi elds do not necessarily increase the prevalence of entrepreneurship.
Some studies show that relative earnings do not play a signifi cant role in labour market status (i.e. self-employment vs. paid employment), suggesting that pecuniary rewards may not be the primary motivation
110 Entrepreneurship and growth
for choosing self-employment. Parker (2003) stresses that, in general, occupational choice between self-employment and paid employment is not robustly related to pecuniary factors. Taylor (1999) suggests that individuals are attracted to self-employment by the freedom from manage-rial constraints that it off ers. Hamilton (2000) argues that non-pecuniary benefi ts of self-employment are substantial, because entrepreneurs persist in business even when they have both lower initial earnings and lower earn-ings growth than they could obtain in paid employment. Following the literature on over-optimism, Koellinger et al. (2007) fi nd strong evidence that subjective, and often biased, perceptions have a crucial impact on new business creation.
The study of actual transitions from paid employment to entrepreneur-ship has attracted less attention. In an important study, Carrasco (1999) fi nds that the unemployed are more likely to enter self-employment, but their businesses generate lower earnings and face higher failure rates. Hamilton (2000) fi nds that the earnings of individuals entering self-employment are not signifi cantly diff erent from those of waged employees. In a recent study, Ñopo and Valenzuela (2007), using data for Chile, fi nd that individuals switching from paid employment to self-employment experience positive average increases in income. The present chapter aims to contribute to this particular segment of the literature by examining and comparing the determinants of the earnings of individuals who switch from paid employment to self-employment with those of individuals who change fi rms while remaining paid employees.
DATA AND METHODOLOGY
As pointed out above, the present study concentrates on the earnings of those individuals who switch from paid employment to entrepreneurship, and of those individuals who change fi rms but remain paid employees. Additionally, paid employees who do not change fi rms represent our control group. We estimate earnings equations for paid employees and business owners as a function of individual/personal characteristics, while controlling for the characteristics of the fi rm, such as size, industry and region. The availability of matched employer–employee data allows for this kind of analysis.
Hamilton (2000) considers diff erent measures of self-employment earn-ings, namely: net profi t, draw, and equity-adjusted draw. Net profi t from running an enterprise is the standard measure widely used in the litera-ture as measure of self-employment income. Given the potential under-reporting problem associated with net profi t, other measures constitute
Switching from paid employment to entrepreneurship 111
good alternatives, such as ‘draw’, which is the amount of consumption the business generates for the owner. Another measure less frequently used is the draw plus the growth in business equity. This measure is adjusted to account for the opportunity cost of business equity. In fact, the measure-ment of entrepreneur income constitutes a problem established in the liter-ature (Parker, 2004). Typically, four types of problems exist in this regard, namely income under-reporting by the self-employed; relatively high non-response rates to survey income questions by the self-employed; failure to deal properly with negative incomes; and erroneous income reporting.
Since we lack specifi c data on entrepreneurs’ income, we use the earn-ings of the highest paid employee in each fi rm as a proxy for the business owner’s income. While the proxy chosen in the present study might in most cases understate the true business owner’s earnings, the earnings dis-tribution of the highest paid employee in a new fi rm is likely to be similar to the true earnings distribution of the business owner during the fi rst years after start-up, as the fi rm has not yet had time to accumulate profi ts and generate capital gains.
The main data source is the ‘Quadros de Pessoal’ (QP) micro-data, a longitudinal matched employer–employee data set including extensive information on worker mobility and business owners for 1995 through to 2003. QP includes annual data from all establishments with at least one wage-earner in Portugal. There are over two million workers in each annual survey who can be traced over time through the use of a unique identifi ca-tion number associated with the Portuguese social security system. Data for each business owner and paid employee include occupation, tenure, schooling and careers.
The population under analysis focuses on all male individuals, paid employees and business owners, aged between 16 and 65 years old who are observable in the data set by 1995 and traceable through to 2003. For the purpose of this research, a broad defi nition of ‘business owner’ is used. It includes all individuals who are reported as owning a business with at least one waged employee (sole contractors are excluded), regardless of whether they have full or partial ownership, and have started, acquired or inherited the business. We choose not to delve into a conceptual distinction between the terms business owner, self-employed and entrepreneur.
Individual earnings equations are defi ned for all the periods from 1995 to 2003. Individuals are compared using earnings as the variable of inter-est for paid employees and the earnings of the highest paid employee as a proxy for entrepreneurial income. We compute for each year and for each fi rm the earnings of the highest paid employee and assign that wage to the business owner of the fi rm. Controls for the events are defi ned as mobility across fi rms, distinguishing those workers who remain as paid employees

112 Entrepreneurship and growth
from those who become business owners. Age, education, tenure, and fi rm characteristics are also controlled. As we know the hierarchical level of the worker, we also control for promotions and demotions.
EMPIRICAL SPECIFICATION
We begin by estimating a typical earnings equation (Mincer, 1974) using a log-linear wage function:
ln yit 5 a 1 Xitb 1 Ditg 1 uit (5.1)
where yit is the monthly wages received by individual i in year t; Xit is a vector of both individual characteristics – including age (and its squared term), education (three dummy variables), and tenure (and its squared term) – and fi rm characteristics – including fi rm size, industry and administrative region (which can be varying or invariant over time); Dit represents the dummy variables accounting for transitions; and uit is the equation error term.
In our analysis we also apply a panel data methodology as to control for individual unobserved heterogeneity. We defi ne a fi xed eff ects model for wage equation as:
ln yit 5 a 1 Xitb 1 Ditg 1 ui 1 eit (5.2)
where ui is a vector of unobservable individual time-constant eff ects, and eit is the error term refl ecting time-varying unobservable factors.
As previously mentioned, the period under study starts in 1995 and concludes with 2003. The analysis is restricted to males, who account for 61 per cent of all individuals present in the data set in 1995. Individuals aged between 16 and 65 in 1995 correspond to 97 per cent of the original sample. The dependent variable in the earnings equations is the natural logarithm of monthly wage calculated by the sum of basic wage with regular payments, defl ated using the Consumer Price Index. Overtime payments are not included as part of the dependent variable.
Table 5.1 shows the descriptive statistics. The mean age is nearly 44 for business owners and 39 for paid employees. Business owners are better educated, having achieved a university level education. On average, the tenure of business owners is little lower than the tenure of individuals who are always paid employees.
Education is included in the model through three dummy variables accounting for (1) individuals who completed the nine years of Portugal’s

Switching from paid employment to entrepreneurship 113
Table 5.1 Descriptive statistics, 1995–2003
Variables Statistics All individuals
Paid employees
Business owners
N 6 170 011 5 810 330 359 681Monthly wage (log) Mean 6.610 6.620 6.446
St. dev. 0.547 0.548 0.491Age (years) Mean 39.593 39.291 44.472
St. dev. 10.606 10.585 9.717Nine years education
(dummy)MeanSt. dev.
0.155 0.362
0.154 0.361
0.165 0.372
Secondary education (dummy)
MeanSt. dev.
0.125 0.330
0.125 0.330
0.126 0.332
College education (dummy) Mean 0.034 0.033 0.048St. dev. 0.180 0.178 0.213
Tenure (years) Mean 9.574 9.613 8.946St. dev. 9.357 9.441 7.840
Firm size (log) Mean 4.364 4.500 2.172St. dev. 2.309 2.301 0.899
Entry into business ownership (BO) (dummy)
MeanSt. dev.
0.006 0.076
0.001 0.038
0.076 0.265
Paid employees (PE) fi rm change (dummy)
MeanSt. dev.
0.098 0.298
0.105 0.306
0.000 0.000
Direct transition into BO (dummy)
MeanSt. dev.
0.003 0.051
0.001 0.025
0.036 0.185
PE fi rm change: get promoted (dummy)
MeanSt. dev.
0.020 0.142
0.022 0.146
0.000 0.000
PE fi rm change: stay current level (dummy)
MeanSt. dev.
0.057 0.233
0.061 0.239
0.000 0.000
PE fi rm change: get demoted (dummy)
MeanSt. dev.
0.016 0.125
0.017 0.129
0.000 0.000
Promotion (dummy) Mean 0.043 0.044 0.043St. dev. 0.204 0.204 0.203
Demotion (dummy) Mean 0.029 0.029 0.027St. dev. 0.167 0.167 0.164
Note: Monthly wage is calculated by summing base wage with regular payments, defl ated by the Consumer Price Index. The size of the fi rm is measured by number of employees. Age and tenure are measured in years. Nine years of education, secondary education, college education, entry to business ownership, paid employees fi rm change, direct transition to business ownership, promotion and demotion are defi ned as dummy variables. When the worker changes fi rm, promotion and demotion are identifi ed by comparing the hierarchical level before and after the move. The direct transition into business ownership is the event where an employee leaves the fi rm and become a business owner within a one-year window.
114 Entrepreneurship and growth
compulsory education; (2) individuals who completed their secondary education; and (3) individuals who completed tertiary education, which usually corresponds to a university degree. Table 5.1 shows that only a very small percentage of individuals have tertiary education.
Our study follows two types of individuals, namely those who switch from paid employment to business ownership, observed through a binary variable accounting for entry into business ownership, and those who switch from paid employment in one fi rm to paid employment in another fi rm, identifi ed by a binary variable tracking such changes. Paid employees who do not switch fi rms in the period covered by the study are used as a control group.
A central concern of this chapter is to understand the role of oppor-tunity costs in determining the pecuniary eff ect of switching from waged employment to self-employment. In order to shed light on this, we dif-ferentiate between individuals who enter self-employment directly from paid employment (thus facing an opportunity cost equal to their previous wage) from those entering from unemployment (thus facing a compara-bly lower opportunity cost). We consider individuals who take less than one year between leaving wage employment and becoming self-employed in the former category. The rationale behind this observation is twofold: fi rstly, individuals who pay an opportunity cost to enter self-employment are more likely to have discovered a profi table entrepreneurial oppor-tunity, and also face fewer liquidity constraints that may lead to a sub-optimal start-up size; secondly, even if the human capital required for entrepreneurship does not correspond directly with formal education, it is more likely to be acquired while employed. Therefore people who have spent signifi cant time unemployed before becoming a business owner are less likely to have signifi cant stocks of human capital. Thus it is expected that individuals who enter self-employment directly from paid employment will have relatively higher self-employment earnings.
In order to address the relationship between the evolution of wages and occupational mobility, we control not only for demographic variables, but also for fi rm characteristics across time, such as fi rm size, economic sector and the administrative region where the fi rm is located. The variable size is measured using the natural logarithm of the number of employees in the fi rm, for individual i at time t. For sector, we consider fi ve groups of economic sectors, namely, primary sector (ISIC code 1–14), total manu-facturing (ISIC code 15–37), energy and construction (ISIC code 40–45), services (ISIC code 50–74), and community social and personal services (ISIC code 75-99). For the regional variable, we follow the NUTS 2 level of aggregation that consists of seven diff erent regions in Portugal (fi ve regions in mainland Portugal plus the two autonomous regions).

Switching from paid employment to entrepreneurship 115
Table 5.2 presents the percentage of individuals who enter business ownership (even if they pass through a unemployment spell in between) at two specifi c times, the last year as paid employees and the fi rst year as business owners, per size of the fi rm and per hierarchical level.
About 29 per cent of individuals switching from wage employment to business ownership were previously employed by medium or large fi rms (50 employees or more). About 97 per cent of individuals who become business owners do so in micro and small businesses (fewer than 50 employ-ees). Over 55 per cent of individuals leaving paid employment to become business owners are ‘qualifi ed professionals’, that is, individuals with spe-cialized knowledge acquired through formal education and/or on-the-job training. Over 90 per cent of individuals who become business owners take up a ‘top manager’ position in the fi rm, which means they are responsible for the coordination of the fi rm’s fundamental activities. As a consequence, more than 90 per cent of the business owners are likely to earn an income equal to, or greater than, the highest wage paid by the fi rm, thus validating at least partially our choice of proxy variable for entrepreneurial income.
Table 5.2 Entry into business ownership by fi rm characteristics
Variables All individuals (%)
Last year as employee
(%)
First year as business
owner (%)
Firm size Micro businesses 20.24 37.26 71.20 Small businesses 27.78 33.75 25.65 Medium businesses 22.54 17.12 2.66 Large businesses 29.44 11.87 0.48Hierarchical levels Apprentices, interns, trainees 2.84 3.89 0.01 Non-qualifi ed professionals 8.3 4.31 0.37 Semi-qualifi ed professionals 11.84 7.7 0.36 Qualifi ed professionals 50.21 55.35 5.91 Higher qualifi ed professionals 6.93 7.23 0.75 Supervisors, team leaders 6.28 7.22 0.71 Intermediary managers 3.76 5.24 1.33 Top managers 9.84 9.06 90.56
Note: Firm size is measured by number of workers and is divided into fi ve categories: micro fi rms (1–9 employees), small fi rms (10–49 employees), medium fi rms (50–249 employees), and large fi rms (over 250 employees). QP discriminates employee hierarchy in the fi rm according to the eight diff erent levels from apprentices, interns and trainees (level 1) to top managers (level 8).
116 Entrepreneurship and growth
Lastly, we also identify career paths, following from one year to the next for career events such as promotions and demotions. We also add an interaction variable that simultaneously reconciles paid employees, fi rm change and the evolution of hierarchical levels. Here, we consider the three hypotheses, namely individuals promoted with the fi rm change, which means the worker experiences an upward movement to a higher hierarchi-cal level; individuals remaining at the same hierarchical level after the fi rm change; and individuals demoted with the fi rm change, which means the worker moves to a lower hierarchical level. When a worker moves from one fi rm to another, the data do not allow us to identify the reason for that change and the worker can quit or be dismissed. Those who quit have a higher probability of fi nding a better job with a higher hierarchical posi-tion (i.e. of getting promoted). Those who were made redundant have a higher probability of taking a job with a lower hierarchical position (i.e. of getting demoted). Promotion and demotion are here used in an informal way given that we are comparing hierarchical levels in two diff erent fi rms and not within the same fi rm.
RESULTS
We begin by presenting the pooled regression results, followed by the fi xed eff ects results for all the models. Model (i) includes as independent variables individual attributes, namely: age, education, tenure, and fi rm characteristics, specifi cally the logarithm of fi rm size, and industry and regional dummies. Model (ii) adds two mobility dummies, one account-ing for entry into business ownership and the other accounting for fi rm changes by paid employees. Model (iii) contains a new variable that con-siders direct transitions into business ownership as a determinant of indi-vidual wages. Finally, in model (iv) information about employees’ careers event is introduced.
Pooled Regression
Results for models (i)–(iv) are presented in Table 5.3, which shows pooled cross-section regression coeffi cients for our initial wage equation, as described in equation (5.1). Dummies measuring specifi c eff ects concern-ing years, industries and regions are included for all models. Most of the coeffi cients are statistically signifi cant at the 1 per cent level.
The linear coeffi cient of the age variable is positive. Educational attain-ment level also has a positive eff ect on income. Better educated individuals are more likely to earn higher wages than those with secondary or lower
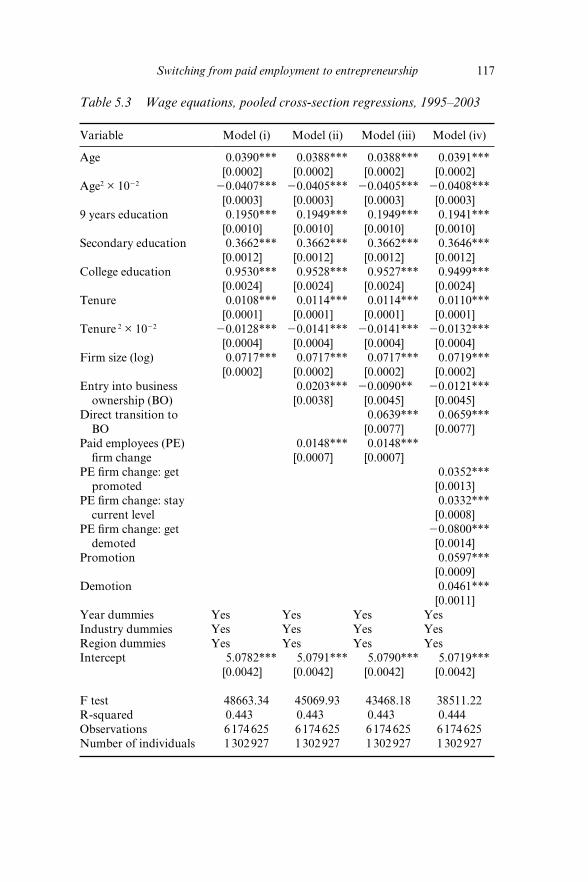
Switching from paid employment to entrepreneurship 117
Table 5.3 Wage equations, pooled cross-section regressions, 1995–2003
Variable Model (i) Model (ii) Model (iii) Model (iv)
Age 0.0390*** 0.0388*** 0.0388*** 0.0391***[0.0002] [0.0002] [0.0002] [0.0002]
Age2 × 1022 20.0407*** 20.0405*** 20.0405*** 20.0408***[0.0003] [0.0003] [0.0003] [0.0003]
9 years education 0.1950*** 0.1949*** 0.1949*** 0.1941***[0.0010] [0.0010] [0.0010] [0.0010]
Secondary education 0.3662*** 0.3662*** 0.3662*** 0.3646***[0.0012] [0.0012] [0.0012] [0.0012]
College education 0.9530*** 0.9528*** 0.9527*** 0.9499***[0.0024] [0.0024] [0.0024] [0.0024]
Tenure 0.0108*** 0.0114*** 0.0114*** 0.0110***[0.0001] [0.0001] [0.0001] [0.0001]
Tenure 2 × 10²² 20.0128*** 20.0141*** 20.0141*** 20.0132***[0.0004] [0.0004] [0.0004] [0.0004]
Firm size (log) 0.0717*** 0.0717*** 0.0717*** 0.0719***[0.0002] [0.0002] [0.0002] [0.0002]
Entry into business ownership (BO)
0.0203*** 20.0090** 20.0121***[0.0038] [0.0045] [0.0045]
Direct transition to BO
0.0639*** 0.0659***[0.0077] [0.0077]
Paid employees (PE) fi rm change
0.0148*** 0.0148***[0.0007] [0.0007]
PE fi rm change: get promoted
0.0352***[0.0013]
PE fi rm change: stay current level
0.0332***[0.0008]
PE fi rm change: get demoted
20.0800***[0.0014]
Promotion 0.0597***[0.0009]
Demotion 0.0461***[0.0011]
Year dummies Yes Yes Yes YesIndustry dummies Yes Yes Yes YesRegion dummies Yes Yes Yes YesIntercept 5.0782*** 5.0791*** 5.0790*** 5.0719***
[0.0042] [0.0042] [0.0042] [0.0042]
F test 48663.34 45069.93 43468.18 38511.22R-squared 0.443 0.443 0.443 0.444Observations 6 174 625 6 174 625 6 174 625 6 174 625Number of individuals 1 302 927 1 302 927 1 302 927 1 302 927

118 Entrepreneurship and growth
educational levels. As expected, the dummy variable for nine-year educa-tion has less infl uence on wage evolution than the secondary education dummy, while the dummy for tertiary education has a stronger eff ect on wage evolution than the dummy for secondary education. Firm size is statistically signifi cant and positively associated with wage, which is in line with the literature suggesting that smaller fi rms pay lower wages (Evans and Leighton, 1989b; Brown et al., 1990; Oi and Idson, 1999).
According to model (i), individuals see their wage increased by almost 1 per cent for every additional year of tenure. Both human capital and matching theories predict that the conditional mean of wages should rise with tenure, as discussed by Becker (1975) in the context of the devel-opment and exposition of the theory of human capital, and Jovanovic (1979a, 1979b, 1984) for the job matching argument. When we introduce dummies accounting for fi rm change and entry into business ownership, this variable keeps the same magnitude. By analysing model (ii), indi-viduals entering business ownership see their estimated income increase by almost 2 per cent, while workers who remain paid employees but move to a diff erent fi rm benefi t from a wage increase of 1.5 per cent. Model (iii) includes a binary variable that diff erentiates direct transitions from waged employment to business ownership from transitions occurring after a spell of unemployment. This variable is positively associated with income. The incomes of individuals who move directly from paid employment into self-employment rise by more than 6 per cent. Model (iv) shows that those individuals who make a direct transition from paid employment to self-employment increase their income, even controlling for career events such as demotions or persistence at the same hierarchical level in their previous fi rm, so opportunity costs matter even when some dissatisfaction may occur in the previous wage job.
Fixed Eff ects Regression
Results for models (i)–(iv) are presented in Table 5.4, showing fi xed eff ects (within) regression coeffi cients for the wage equation described in equa-tion (5.2). Most of the coeffi cients are statistically signifi cant at the 1 per
Table 5.3 (continued)
Notes:Dependent variable is the natural logarithm of monthly wage. Age and tenure are measured in years. Nine years of education, secondary education, college education, entry to business ownership, paid employees fi rm change, direct transition to business ownership, promotion and demotion are defi ned as dummy variables. Robust standard errors are in brackets.* Signifi cant at 10%; ** signifi cant at 5%; *** signifi cant at 1%.
Switching from paid employment to entrepreneurship 119
cent level. The fi xed eff ects estimation displays very similar eff ects of age, education and fi rm size to the pooled regression.
Model (i) indicates that the eff ect of tenure is still signifi cant, but the size of the coeffi cient reveals that individuals see their income increase by less that 0.2 per cent (instead of 1 per cent in the pooled model), for every additional year of previous experience in the fi rm. This result suggests that the eff ect of tenure may vary with unobserved individual characteristics. Model (ii) shows that individuals entering business ownership suff er a drastic income penalty of about 14 per cent, while workers who remain as paid employees, but switch to a diff erent fi rm, experience an insignifi cant impact on their wage level. However in model (iii), when diff erentiating direct transitions from waged employment to self-employment, as compared with transitions from unemployment to self-employment, we observe that those who switch from paid employ-ment directly into self-employment see their incomes rise by nearly 4 per cent, while those who move from unemployment into self-employment experience a decrease in income of about 16 per cent when compared with their last wage before becoming unemployed. The wage change for paid employees who switch fi rms remains insignifi cant. In model (iv) we observe that paid employees switching fi rms who were demoted in the process suff er a wage decrease of about 7 per cent; those who remain at the same hierarchical level experience a small positive change (0.6 per cent); and those who move to a higher hierarchical level receive wage premium of over 4 per cent. While unrelated to self-employment, these last results strongly suggest that wages are also determined by job assign-ment and career events, as proposed by Baker et al. (1994) and Gibbons and Waldman (1999, 2006).
CONCLUSION
The aim of this chapter is to examine the eff ect of switching from paid employment to business ownership on individuals’ earnings. Using a longitudinal matched employer–employee data set from Portugal we have followed the mobility of workers and business owners for the period 1995–2003, estimating personal and fi rm level eff ects on incomes simul-taneously, and accounting for multiple determinants of wage earnings, such as individual attributes, employer characteristics, and individuals’ organizational careers.
The wages of individuals are determined by several factors including occupational and fi rm mobility, personal attributes and career events. The four models presented have attempted to examine the eff ect of switching
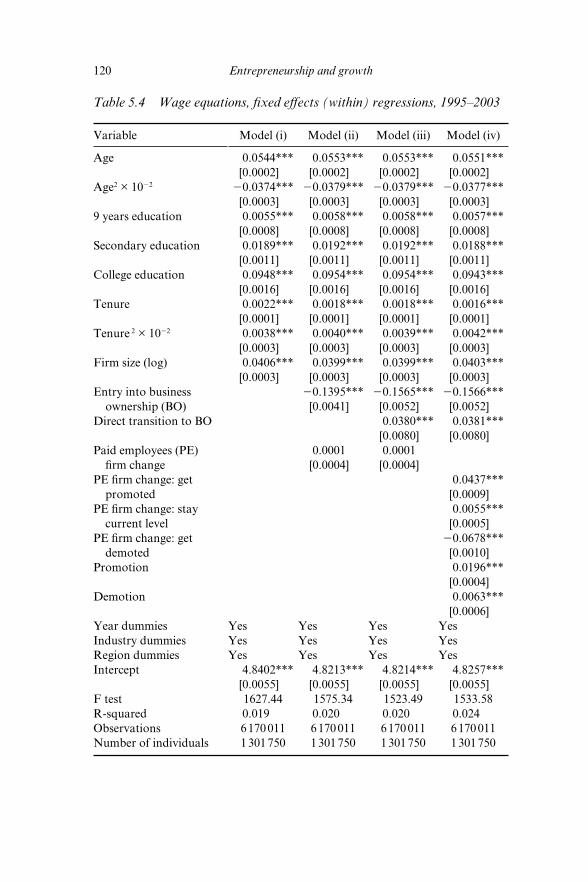
120 Entrepreneurship and growth
Table 5.4 Wage equations, fi xed eff ects (within) regressions, 1995–2003
Variable Model (i) Model (ii) Model (iii) Model (iv)
Age 0.0544*** 0.0553*** 0.0553*** 0.0551***[0.0002] [0.0002] [0.0002] [0.0002]
Age2 × 1022 20.0374*** 20.0379*** 20.0379*** 20.0377***[0.0003] [0.0003] [0.0003] [0.0003]
9 years education 0.0055*** 0.0058*** 0.0058*** 0.0057***[0.0008] [0.0008] [0.0008] [0.0008]
Secondary education 0.0189*** 0.0192*** 0.0192*** 0.0188***[0.0011] [0.0011] [0.0011] [0.0011]
College education 0.0948*** 0.0954*** 0.0954*** 0.0943***[0.0016] [0.0016] [0.0016] [0.0016]
Tenure 0.0022*** 0.0018*** 0.0018*** 0.0016***[0.0001] [0.0001] [0.0001] [0.0001]
Tenure 2 × 10²² 0.0038*** 0.0040*** 0.0039*** 0.0042***[0.0003] [0.0003] [0.0003] [0.0003]
Firm size (log) 0.0406*** 0.0399*** 0.0399*** 0.0403***[0.0003] [0.0003] [0.0003] [0.0003]
Entry into business ownership (BO)
20.1395***[0.0041]
20.1565***[0.0052]
20.1566***[0.0052]
Direct transition to BO 0.0380*** 0.0381***[0.0080] [0.0080]
Paid employees (PE) fi rm change
0.0001[0.0004]
0.0001[0.0004]
PE fi rm change: get promoted
0.0437***[0.0009]
PE fi rm change: stay current level
0.0055***[0.0005]
PE fi rm change: get demoted
20.0678***[0.0010]
Promotion 0.0196***[0.0004]
Demotion 0.0063***[0.0006]
Year dummies Yes Yes Yes YesIndustry dummies Yes Yes Yes YesRegion dummies Yes Yes Yes YesIntercept 4.8402*** 4.8213*** 4.8214*** 4.8257***
[0.0055] [0.0055] [0.0055] [0.0055]F test 1627.44 1575.34 1523.49 1533.58R-squared 0.019 0.020 0.020 0.024Observations 6 170 011 6 170 011 6 170 011 6 170 011Number of individuals 1 301 750 1 301 750 1 301 750 1 301 750
Switching from paid employment to entrepreneurship 121
from paid employment to business ownership on individuals’ incomes. Model (i) considered individual attributes as well as fi rm characteristics as determinants of earnings. Model (ii) included mobility variables for two specifi c groups: those individuals who switch from paid employment to business ownership; and those who switch from paid employment in one fi rm to paid employment in another fi rm. Model (iii) considered direct transitions from paid employment to self-employment as opposed to tran-sitions with a signifi cant (at least two years) spell of unemployment occur-ring in-between jobs. Finally, model (iv) introduced information about the individuals’ organizational careers, based on changes in hierarchical levels within fi rms.
The results indicate a concave relation between income and age. We also observe a bell-shaped relationship between wages and tenure. However, the return on age decreases a lot more quickly than that on tenure. Age and education are always positively associated with income. Results show that, on average, there is an earnings penalty for those who enter self-employment, and that smaller start-ups pay lower wages, confi rming results from previous empirical work.
When information about individuals who switch from paid employ-ment to self-employment and those who switch fi rms while remaining paid employees is included, fi xed eff ects estimation results indicate a severe income penalty in the short run for those individuals who become entrepreneurs. However, when diff erentiating those who switch directly from paid employment to entrepreneurship from those who enter self-employment from unemployment, we fi nd that the former actually capture an earnings premium, while there is an earnings penalty for novice entrepreneurs. Results also show that switching fi rms while in paid employment only has a strong positive eff ect on wages when such transition implies a progression in terms of hierarchical levels within organizations.
As entrepreneurs that switch directly from paid employment to self-employment create more income than those entrepreneurs who enter self-employment after a stint in unemployment, we would expect their
Table 5.4 (continued)
Notes:Dependent variable is the natural logarithm of monthly wage. Age and tenure are measured in years. Nine years of education, secondary education, college education, entry to business ownership, paid employees fi rm change, direct transition to business ownership, promotion and demotion are defi ned as dummy variables. Robust standard errors are in brackets.* Signifi cant at 10%; ** signifi cant at 5%; *** signifi cant at 1%.
122 Entrepreneurship and growth
impact on economic growth to be greater. However, we should be cautious about suggesting that policy makers should focus exclusively on promot-ing opportunity entrepreneurship in the sense of those individuals who enter self-employment directly from paid employment. Block and Wagner (2009) discuss this issue, arguing that we do not know enough about the marginal eff ects of money spent on promoting what they called necessity or opportunity entrepreneurship.
Overall, results clearly show that opportunity costs play a signifi cant role in determining whether entering self-employment leads to an increase in earnings in the short run. Individuals in paid employment are more likely to search for entrepreneurial opportunities that provide them with greater chances of higher earnings from self-employment at the outset. Even though our results control for fi rm size, it is also possible to specu-late that they should also be better able to raise the necessary fi nancing to launch such types of ventures. From a policy perspective, further research might compare those individuals who enter self-employment directly from paid employment, thus facing an opportunity cost equal to their previous wage, and those individuals who become business owners after a spell in unemployment, who should face a comparatively lower opportunity cost. One would expect signifi cant diff erences in entrepreneurial income, fi rm performance, and job creation ability between these types of business owners, leading to important implications for public policy.
ACKNOWLEDGEMENTS
The authors thank the GEP (Gabinete de Estratégia e Planeamento from Ministério do Trabalho e Solidariedade Social) for providing the data used in this study. Miguel Torres Preto is grateful to the Fundação para a Ciência e Tecnologia (FCT) for their fi nancial support (grant number SFRH/BD/22648/2005). The authors are also grateful to FCT for their fi nancial support for this line of research (project number PTDC-ESC-71080-2006).
REFERENCES
Amit, R., E. Muller and I. Cockburn (1995), ‘Opportunity costs and entrepre-neurial activity’, Journal of Business Venturing, 10 (2), 95–106.
Baker, G., M. Gibbs and B. Holmstrom (1994), ‘The internal economics of the fi rm: evidence from personnel data’, Quarterly Journal of Economics, 109 (4), 881–919.
Switching from paid employment to entrepreneurship 123
Becker, E. (1984), ‘Self-employed workers: an update to 1983’, Monthly Labor Review, 107 (7), 14–18.
Becker, G.S. (1975), Human Capital: A Theoretical and Empirical Analysis, with Special Reference to Education, 2nd edn, New York: Columbia University Press.
Blanchfl ower, D.G. and A.J. Oswald (1998), ‘What makes an entrepreneur?’, Journal of Labor Economics, 16 (1), 26–60.
Blau, D.M. (1987), ‘A time-series analysis of self-employment in the United States’, Journal of Political Economy, 95 (3), 445–67.
Block, J. and M. Wagner (2009), ‘Necessity and opportunity entrepreneurs in Germany: characteristics and earnings diff erentials’, Schmalenbach Business Review, forthcoming.
Borjas, G.J. (1986), ‘The self-employment experience of immigrants’, Journal of Human Resources, 21 (4), 485–506.
Borjas, G.J. and S.G. Bronars (1989), ‘Consumer discrimination and self- employment’, Journal of Political Economy, 97 (3), 581–605.
Bregger, J. (1963), ‘Self-employment in the United States, 1948–1962’, Monthly Labor Review, 86 (Jan.), 37–43.
Brock, W.A. and D.S. Evans (1986), The Economics of Small Businesses: Their Role and Regulation in the U.S. Economy, New York: Holmes & Meier.
Brown, C., J. Hamilton and J.L. Medoff (1990), Employers Large and Small, Cambridge, MA: Harvard University Press.
Camerer, C.F. and D. Lovallo (1999), ‘Overconfi dence and excess entry: an experi-mental approach’, American Economic Review, 89 (1), 306–18.
Carrasco, R. (1999), ‘Transitions to and from self-employment in Spain: an empir-ical analysis’, Oxford Bulletin of Economics and Statistics, 61 (3), 315–41.
Carrington, W.J., K. McCue and B. Pierce (1996), ‘The role of employer/employee interactions in labour market cycles: evidence from the self-employed’, Journal of Labor Economics, 14 (4), 571–602.
Carroll, G.R. and E. Mosakowski (1987), ‘The career dynamics of self- employment’, Administrative Sciences Quarterly, 32 (4), 570–89.
Casson, M. (2003), The Entrepreneur: An Economic Theory, 2nd edn, Cheltenham, UK, and Northampton, MA, USA: Edward Elgar.
Dunn, T. and D. Holtz-Eakin (2000), ‘Financial capital, human capital, and the transition to self-employment: evidence from intergenerational links’, Journal of Labor Economics, 18 (2), 282–305.
Evans, D.S. and B. Jovanovic (1989), ‘An estimated model of entrepreneurial choice under liquidity constraints’, Journal of Political Economy, 97 (4), 808–27.
Evans, D.S. and L.S. Leighton (1989a), ‘Some empirical aspects of entrepreneur-ship’, American Economic Review, 79 (3), 519–35.
Evans, D.S. and L.S. Leighton (1989b), ‘Why do smaller fi rms pay less?’, Journal of Human Resources, 24 (2), 299–318.
Fain, T. (1980), ‘Self-employed Americans: their number has increased’, Monthly Labor Review, 103 (11), 3–8.
Fairlie, R. (2004), ‘Does business ownership provide a source of upward mobility for Blacks and Hispanics?’, in D. Holtz-Eakin and H. S. Rosen (eds), Public Policy and the Economics of Entrepreneurship, Cambridge, MA: MIT Press, pp. 153–79.
Ferber, M.A. and J. Waldfogel (1998), ‘The long-term consequences of non- traditional employment’, Monthly Labor Review, 121 (5), 3–12.
124 Entrepreneurship and growth
Form, W.H. (1985), Divided We Stand: Working Class Stratifi cation in America, Urbana, IL: University of Illinois Press.
Gibbons, R. and M. Waldman (1999), ‘A theory of wage promotions dynamics inside fi rms’, Quarterly Journal of Economics, 114 (4), 1321–58.
Gibbons, R. and M. Waldman (2006), ‘Enriching a theory of wage and promotion dynamics inside fi rms’, Journal of Labor Economics, 24 (1), 59–107.
Gill, A.M. (1988), ‘Choice of employment status and the wages of employees and the self-employed, some further evidence’, Journal of Applied Econometrics, 3 (3), 229–34.
Gompers, P., J. Lerner and D. Scharfstein (2005), ‘Entrepreneurial spawning: public corporations and the genesis of new ventures, 1986-1999’, Journal of Finance, 60 (2), 577–614.
Haber, S., E. Lamas and J. Lichtenstein (1987), ‘On their own: the self-employed and others in private business’, Monthly Labor Review, 110 (5), 17–23.
Hamilton, B.H. (2000), ‘Does entrepreneurship pay? An empirical analysis of the returns to self-employment’, Journal of Political Economy, 18 (3), 604–31.
Hsu, D.H., E.B. Roberts and C.E. Eesley (2007), ‘Entrepreneurs from technology-based universities: evidence from MIT’, Research Policy, 36 (5), 768–88.
Iyigun, M.F. and A.L. Owen (1998), ‘Risk, entrepreneurship, and human capital accumulation’, American Economic Review, 88 (2), 454–57.
Jovanovic, B. (1979a), ‘Firm specifi c capital and turnover’, Journal of Political Economy, 87, 1246–60.
Jovanovic, B. (1979b), ‘Job matching and the theory of turnover’, Journal of Political Economy, 87, 972–90.
Jovanovic, B. (1982), ‘Selection and the evolution of industry’, Econometrica, 50 (3), 649–70.
Jovanovic, B. (1984), ‘Matching, turnover, and unemployment’, Journal of Political Economy, 92, 108–22.
Kahneman, D. and D. Lovallo (1993), ‘Timid choices and bold forecasts: a cogni-tive perspective on risk taking’, Management Science, 39 (1), 17–31.
Kihlstrom, R. and J. Laff ont (1979), ‘A general equilibrium entrepreneurial theory of fi rm formation based on risk aversion’, Journal of Political Economy, 87 (4), 719–40.
Koellinger, P., M. Minniti and C. Schade (2007), ‘I think I can, I think I can – over-confi dence and entrepreneurial behaviour’, Journal of Economic Psychology, 28 (4), 502–27.
Lazear, E.P. (2005), ‘Entrepreneurship’, Journal of Labor Economics, 23 (4), 649–80.
Lazear, E.P. and R.L. Moore (1984), ‘Incentives, productivity, and labour con-tracts’, Quarterly Journal of Economics, 99 (2), 275–96.
Lucas, R.E. (1978), ‘On the size distribution of business fi rms’, Bell Journal of Economics, 9 (2), 508–23.
Mincer, J. (1974), Schooling, Experience, and Earnings, New York: Columbia University Press.
Ñopo, H. and P. Valenzuela (2007), ‘Becoming an entrepreneur’, IZA Discussion Paper No. 2716.
Oi, W.Y. and T. Idson (1999), ‘Firm size and wages’, in O. Ashenfelter and D. Card (eds), Handbook of Labor Economics, Vol. 3, Amsterdam: Elsevier Science, pp. 2165–214.

Switching from paid employment to entrepreneurship 125
Parker, S.C. (2003), ‘Does tax evasion aff ect occupational choice?’, Oxford Bulletin of Economics and Statistics, 65 (3), 379–94.
Parker, S.C. (2004), The Economics of Self-employment and Entrepreneurship, Cambridge: Cambridge University Press.
Quadrini, V. (1999), ‘The importance of entrepreneurship for wealth concentra-tion and mobility’, Review of Income and Wealth, 45 (1), 1–19.
Ray, R. (1975), ‘A report on self-employed Americans in 1973’, Monthly Labor Review, 98 (1), 49–54.
Rees, H. and A. Shah (1986), ‘An empirical analysis of self-employment in the UK’, Journal of Applied Econometrics, 1 (1), 101–8.
Silva, O. (2006), ‘The jack-of-all-trades entrepreneur: innate talent or acquired skill?’, Economics Letters, 97 (2), 118–23.
Taylor, M.P. (1999), ‘Survival of the fi ttest? An analysis of self-employment duration in Britain’, Economic Journal, 109 (454), 140–55.
126
6. The fi nancial requirements of early-stage entrepreneursColm O’Gorman
INTRODUCTION
How much fi nance do early-stage entrepreneurs expect to use when start-ing a fi rm? Does the level of fi nance required to start a fi rm diff er across countries? Do country diff erences in aspects of the institutional environ-ment that shape the choices of individuals – who becomes an entrepreneur; the nature of entrepreneurship; in what sectors does entrepreneurship occur; and the cost of market entry – lead to variation in the fi nancial requirements of nascent entrepreneurs?
In seeking to infl uence levels of entrepreneurial activity, the policy maker faces two signifi cant problems. First, to eff ectively infl uence the scale and scope of entrepreneurial activity policy makers need to understand ‘what determines the supply of productive entrepreneurship’ (Baumol, 1993, p. 16) or, phrased diff erently, what factors infl uence a country’s ‘entre-preneurial capital’, defi ned by Audretsch and Keilbach, as the ‘regional milieu of agents that is conducive to the creation of new fi rms’ (2004, p. 420). Clearly not all national economic systems are equally good at supporting entrepreneurship or new market entry, as evidenced by varia-tions in the levels of entrepreneurial activity across national context (Acs et al., 2004; Audretsch et al., 2002; Scarpetta, 2003), within national contexts (Johnson, 2004; Reynolds et al., 1994), and over time (Carree et al., 2002; Chandler, 1990). Policy choices made at national and regional levels give rise to the evolution of diff ering institutional arrangements between countries and within countries. Providing direct and indisputable evidence of the relationship between any given institutional arrangements and entrepreneurial activity is a ‘diffi cult and perhaps an impossible task’ (Davidsson and Henrekson, 2002, p. 89). As such there is still ambiguity about which aspects of context explain variation in entrepreneurial activ-ity, and therefore, what policies might be appropriate for encouraging more entrepreneurial activity (Storey, 2000).
Second, even if the appropriate set of conditions for increased

The fi nancial requirements of early-stage entrepreneurs 127
entrepreneurial activity are identifi ed, it may not be clear how the policy maker can best infl uence the environment to cause an increase in the supply of entrepreneurs. Baumol suggests that many of the factors that infl uence the supply of entrepreneurial activity may be diffi cult to infl uence, as the process of change is ‘slow and undependable’ (1993, p. 17). For example, in countries where a collectivistic, high uncertainty avoidance culture is seen as an inhibitor of entrepreneurial activity, a policy intervention in the education system may be considered appropriate (Mueller and Thomas, 2001). However, a long period of time may need to elapse before an educa-tion initiative targeted at, say, primary school children might be expected to impact on levels of entrepreneurial activity. Similarly, if low levels of entrepreneurial activity refl ect current industry structure, as Davidsson and Henrekson (2002) argue is the case in Sweden, how does the policy maker seed the development of new industries?
Recognizing these two diffi culties, Baumol calls on researchers and policy makers to identify aspects of the current environment that can be modifi ed ‘to stimulate the volume and intensity of entrepreneurial activity’ (1993, p. 17). One factor that might infl uence the level of entre-preneurship and be subject to infl uence by policy makers is the level of fi nancial resources needed to start a new business. As entrepreneurship policy becomes increasingly important in developed economies, there is evidence of attempts by policy makers to remove barriers to market entry (for example, deregulation) and to reduce the time and cost of starting a new business. In a recent review of government policies towards business, Gilbert et al. argued that entrepreneurship policies ‘are emerging as one of the most essential instruments for economic growth’ (2004, p. 313). The rhetoric and actions of many policy makers suggest that they increas-ingly believe this to be so. For example, in the recent EU Action Plan: The European Agenda for Entrepreneurship, the Commission of the European Communities sought to outline how member states of the European Union could reduce the defi cit in entrepreneurial activity and capacity in EU member countries (Commission of the European Communities, 2004).
We suspect that the fi nancial resources required to start a fi rm are an important determinant of the level of entrepreneurial activity. While ex ante entrepreneurs cannot know how much in terms of fi nancial resources will be required to start a business, they must make an informed guess as to whether they will be able to start the business, and this guess involves an implicit or explicit estimation of the resources required. In this chapter we study the planned fi nancial requirements of nascent entrepreneurs. We explore two research questions: fi rst, what level of fi nance do entre-preneurs expect to use in starting a fi rm; and second, are there diff erences across countries in the anticipated level of fi nance needed to start a fi rm?
128 Entrepreneurship and growth
We use the Global Entrepreneurship Monitor data set to identify the mean and median level of planned fi nancial requirement of early-stage entrepre-neurs. We then compare the planned fi nancial requirements of early-stage entrepreneurs across nine Euro-zone countries.
LITERATURE REVIEW AND RESEARCH QUESTIONS
Planned Financial Requirements of Entrepreneurs
A nascent entrepreneur is someone who initiates serious activities that are intended to culminate in a viable business start-up (Reynolds et al., 1994). To create a new organization a nascent entrepreneur requires access to resources (Aldrich, 1999). The tangible and intangible resources that a nascent entrepreneur requires include, among others things, a product idea, technical know-how, personal contacts, fi nancial resources, and customer orders (Vesper, 1990). The level of planned fi nancial resources will be infl uenced by personal, sector and country-level factors. First, at the level of the individual, existing personal fi nancial resources will infl uence the level of planned fi nance required for the start-up. Saxenian (1990) argues that access to local networks is critical to understanding how entrepreneurs amass the resources required to start a new fi rm. Second, minimum capital requirements and barriers to entry diff er across sectors and will infl uence the level of fi nance required to start a new fi rm. Third, country level factors such as minimum required capital to form a company, licensing costs and the cost of doing business will all infl uence the amount of capital the nascent entrepreneur needs to start a business.
While these factors might suggest that there will be variations in the level of fi nance required to start a fi rm, there is also the argument that given the uncertainty associated with new fi rm creation, nascent entrepre-neurs will only be able to access small amounts of fi nance. So while there may be diff erences in the level of fi nance required by nascent entrepreneurs refl ecting personal and sector factors, the overall level of fi nance that entrepreneurs anticipate they will be able to access may be low. This might be expected because of the uncertainty and market judgements inherent to the entrepreneurial process (Knight, 1921; Casson, 2003). Uncertainty as to the likely success of a new venture and information asymmetries between entrepreneurs and investors make it diffi cult for investors to identify entrepreneurial successes. This results in entrepreneurs facing diffi culties in accessing external fi nance during the early stage of venture creation. Furthermore nascent entrepreneurs and the new organizations
The fi nancial requirements of early-stage entrepreneurs 129
they seek to create typically lack legitimacy with customers and resource providers. Consequently we expect most entrepreneurs to start with limited resources.
This argument is supported by some empirical research. Prior research on the fi nancial resource endowments of new fi rms suggests that many fi rms start with relatively few resources. Empirical evidence suggests that in terms of two critical resources that entrepreneurs need to create a new business, fi nancial and human, resource requirements of founding are very low. Typically, most entrepreneurs start with little capital and with few, if any, employees (Aldrich, 1999). Financial resources are particularly important to nascent entrepreneurs as they allow the nascent entrepreneur to access other resources. Aldrich presents evidence suggesting that the majority of new fi rms start with fewer than fi ve employees and that the majority of entrepreneurs might need as little as US$5000 (based on survey data collected in 1987) to start a new business. Bhidé (2000) suggests that new ventures are ‘unremarkable in their origins’, with the fastest growing new ventures being characterized by signifi cant capital constraints, with nearly 80 per cent of INC 500 companies starting with less than $50 000; and that new ventures are improvised; that is, they ‘replicated or modifi ed an idea they encountered through previous employment or by accident’ (Bhidé, 2000). Bygrave has shown that nascent entrepreneurs typically rely on their own resources and those of close family members during the early stages of venture creation (Bygrave et al., 2003; Bygrave, 2005). There is also evidence that some entrepreneurs seek to reduce their resource requirements by adopting bootstrapping strategies and by using ‘resources at hand’ (Baker, Miner and Eesley, 2003; Winborg and Landström, 2001).
In this chapter we study the level of fi nance that entrepreneurs expect to need to start a new fi rm, and the extent to which entrepreneurs expect to use small amounts of fi nancial resources in starting fi rms. This leads to our fi rst research question: what level of fi nance do entrepreneurs expect to use in starting a business?
Cross-country Variation in the Planned Financial Requirements of Nascent Entrepreneurs
If the level of fi nance an entrepreneur expects to use refl ects their personal resources, the sector of activity, and the institutional context that the new venture is created in, it is likely that the cost of entry will diff er across countries. There is evidence that variation in these factors impacts on the level of entrepreneurship. For example, variation in industrial structure across regions may partly explain variation in entrepreneurial activity

130 Entrepreneurship and growth
(Johnson, 2004). Diff erences in reported levels of entrepreneurial activ-ity may refl ect the composition of industry sector as entry and exit rates diff er by sector and by time within sectors (periods of high entry and low entry as products or technologies mature) (Scarpetta, 2003). Audretsch (1995) concluded that new fi rm start-up activity tends to be substantially more prevalent under what he terms the ‘entrepreneurial regime’, a period when small fi rms account for the bulk of innovative activity, rather than under the ‘routinized regime’, when large incumbents account for the bulk of innovative activity. Davidsson and Henrekson (2002) concluded that low levels of entrepreneurial activity in Sweden partly refl ected the lack of entrepreneurial opportunity in the service sector because of the relative high taxes on labour and a political choice to produce some services in the public sector.
Diff erences in levels of entrepreneurial activity may also refl ect the institutional environment in terms of the cost and time required to start a business. Djankov et al. (2002) demonstrated that there are diff erences in both the numbers of procedures required to register in a new country and the relative cost of company registration across diff erent countries. They attributed these diff erences to variations in institutional regimes, with countries characterized by more democratic governments and by lighter governments having looser regulations. Relative to the 85 countries they studied, the countries in the European Union would be characterized as ‘more’ democratic.
The OECD (Scarpetta, 2003) has recently argued that entrants to new markets in the US are smaller, as compared to selected European coun-tries.1 Market entrants in the US tend to be smaller and grow faster, what they refer to as a process of ‘market experimentation’. In the ‘market experimentation’ model entrepreneurs pursue opportunities in the short term to identify if opportunities prove worthy of start-up or prove to be poor choices that should be abandoned (Carter et al., 1996). In contrast, in the European countries studied, entrants tend to be larger, suggesting to the OECD that there is more ‘pre-market selection’. They suggest that these diff erences in market entry processes refl ect diff erences in regulatory and policy considerations surrounding the ease of start-ups, new fi rm access to fi nance, and access to markets. While the OECD notes that there is no evidence that one model dominates the other in terms of increasing productivity, ‘in a time of signifi cant technological change it might be that the longer-term advantage will accrue to countries characterised by the “market experimentation” model’ (Scarpetta, 2003, pp. 155–6).
In this chapter we explore whether the amount of fi nance planned diff ers across countries. This is important as such diff erences may partly explain variation in levels of entrepreneurial activity. It might be expected that
The fi nancial requirements of early-stage entrepreneurs 131
there will be diff erences in the planned fi nancial investment of early-stage entrepreneurs. These diff erences refl ect institutional diff erences that shape the choices of individuals in terms of who decides to become an entrepre-neur, the availability of own and external fi nance to entrepreneurs, the sectors that new fi rms are started in, and the costs associated with starting a new fi rm. While personal, sector and country eff ects might be expected to explain the level of fi nance required, we only explore country eff ects in this chapter. As country level institutional factors shape both the individ-ual’s access to capital and the distribution by sector of entrepreneurship, comparing planned fi nancial investments of nascent entrepreneurs across countries should refl ect the inherent diff erences in institutional contexts for entrepreneurship within these countries. This leads to our second research question: does the level of fi nance required for market entry via entrepreneurship vary across countries?
METHODOLOGY
We use the Global Entrepreneurship Monitor (GEM) databases for 2002, 2003, 2004, 2005 and 2006 (see Levie and Autio, 2008 and Reynolds et al., 2005, for a full description and explanation of the GEM model and meth-odology). Based on a population survey in each participating country, the GEM project seeks to identify levels of early-stage entrepreneurial activ-ity, including nascent entrepreneurial activity and those that have started a fi rm within the previous 42 months, by directly asking people if they are engaged in such activity. Within GEM an early-stage entrepreneur is someone classifi ed as either a nascent entrepreneur or a new fi rm entre-preneur. A nascent entrepreneur is someone who responded positively to the following statement: ‘you are, alone or with others, currently trying to start a new business, including any self-employment or selling any goods or services to others’, provided they have not yet paid themselves a wage for more than three months. A new fi rm entrepreneur is someone who at least part owns and manages a new business that is between 4 and 42 months old and has not paid salaries for longer than this period. Such people are asked a number of questions that capture aspects of their personal context and aspects of the business they are trying to start.
For the period 2002–06 we use GEM data for nine of the 12 Euro-zone countries. These are Belgium, Finland, France, Germany, Greece, Ireland, Italy, Netherlands, and Spain. The missing three countries are Austria, Luxembourg, and Portugal.
For these nine countries there were 5112 early-stage entrepreneurs who responded to a question about the fi nancial requirements of the new
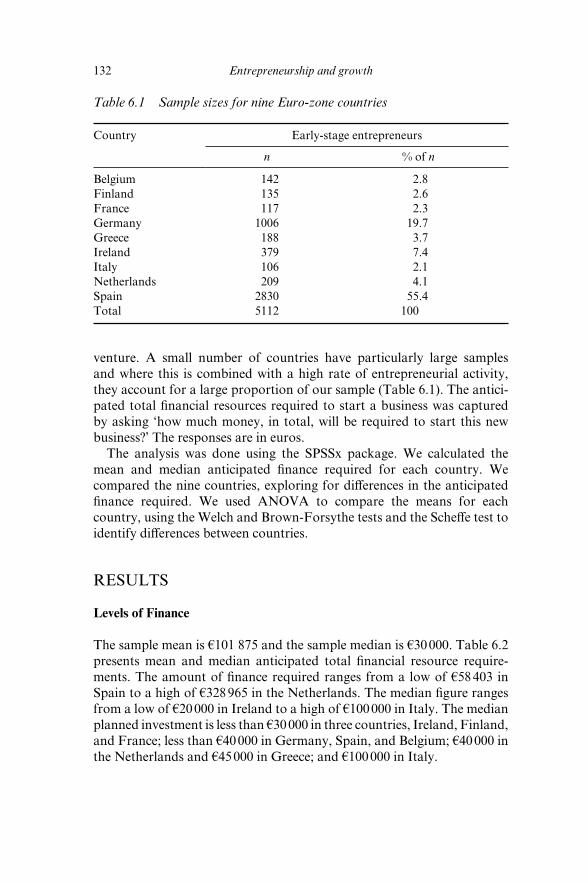
132 Entrepreneurship and growth
venture. A small number of countries have particularly large samples and where this is combined with a high rate of entrepreneurial activity, they account for a large proportion of our sample (Table 6.1). The antici-pated total fi nancial resources required to start a business was captured by asking ‘how much money, in total, will be required to start this new business?’ The responses are in euros.
The analysis was done using the SPSSx package. We calculated the mean and median anticipated fi nance required for each country. We compared the nine countries, exploring for diff erences in the anticipated fi nance required. We used ANOVA to compare the means for each country, using the Welch and Brown-Forsythe tests and the Scheff e test to identify diff erences between countries.
RESULTS
Levels of Finance
The sample mean is €101 875 and the sample median is €30 000. Table 6.2 presents mean and median anticipated total fi nancial resource require-ments. The amount of fi nance required ranges from a low of €58 403 in Spain to a high of €328 965 in the Netherlands. The median fi gure ranges from a low of €20 000 in Ireland to a high of €100 000 in Italy. The median planned investment is less than €30 000 in three countries, Ireland, Finland, and France; less than €40 000 in Germany, Spain, and Belgium; €40 000 in the Netherlands and €45 000 in Greece; and €100 000 in Italy.
Table 6.1 Sample sizes for nine Euro-zone countries
Country Early-stage entrepreneurs
n % of n
Belgium 142 2.8Finland 135 2.6France 117 2.3Germany 1006 19.7Greece 188 3.7Ireland 379 7.4Italy 106 2.1Netherlands 209 4.1Spain 2830 55.4Total 5112 100
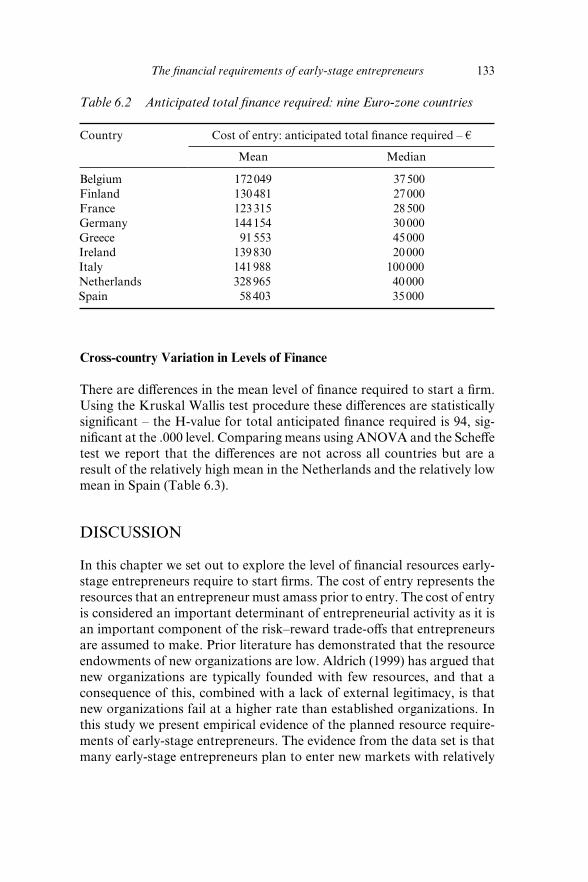
The fi nancial requirements of early-stage entrepreneurs 133
Cross-country Variation in Levels of Finance
There are diff erences in the mean level of fi nance required to start a fi rm. Using the Kruskal Wallis test procedure these diff erences are statistically signifi cant – the H-value for total anticipated fi nance required is 94, sig-nifi cant at the .000 level. Comparing means using ANOVA and the Scheff e test we report that the diff erences are not across all countries but are a result of the relatively high mean in the Netherlands and the relatively low mean in Spain (Table 6.3).
DISCUSSION
In this chapter we set out to explore the level of fi nancial resources early-stage entrepreneurs require to start fi rms. The cost of entry represents the resources that an entrepreneur must amass prior to entry. The cost of entry is considered an important determinant of entrepreneurial activity as it is an important component of the risk–reward trade-off s that entrepreneurs are assumed to make. Prior literature has demonstrated that the resource endowments of new organizations are low. Aldrich (1999) has argued that new organizations are typically founded with few resources, and that a consequence of this, combined with a lack of external legitimacy, is that new organizations fail at a higher rate than established organizations. In this study we present empirical evidence of the planned resource require-ments of early-stage entrepreneurs. The evidence from the data set is that many early-stage entrepreneurs plan to enter new markets with relatively
Table 6.2 Anticipated total fi nance required: nine Euro-zone countries
Country Cost of entry: anticipated total fi nance required – €
Mean Median
Belgium 172 049 37 500Finland 130 481 27 000France 123 315 28 500Germany 144 154 30 000Greece 91 553 45 000Ireland 139 830 20 000Italy 141 988 100 000Netherlands 328 965 40 000Spain 58 403 35 000
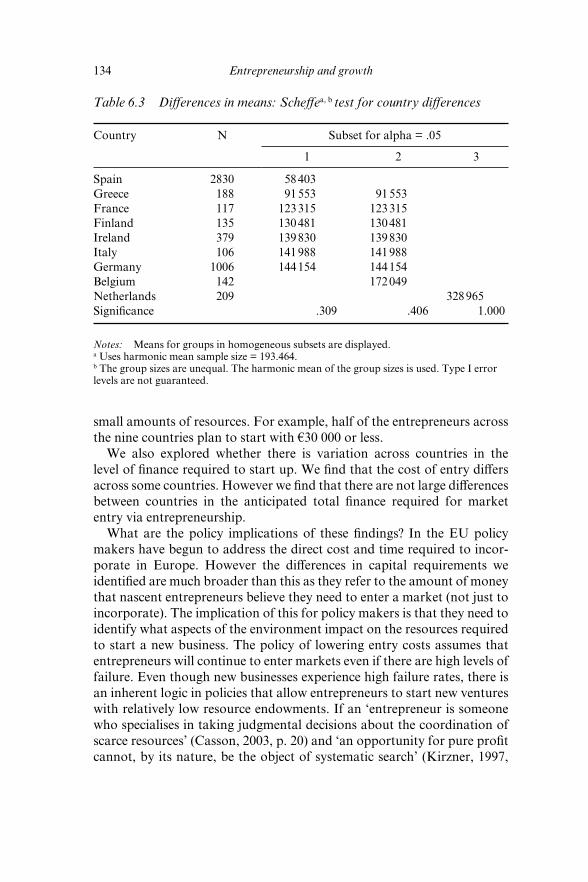
134 Entrepreneurship and growth
small amounts of resources. For example, half of the entrepreneurs across the nine countries plan to start with €30 000 or less.
We also explored whether there is variation across countries in the level of fi nance required to start up. We fi nd that the cost of entry diff ers across some countries. However we fi nd that there are not large diff erences between countries in the anticipated total fi nance required for market entry via entrepreneurship.
What are the policy implications of these fi ndings? In the EU policy makers have begun to address the direct cost and time required to incor-porate in Europe. However the diff erences in capital requirements we identifi ed are much broader than this as they refer to the amount of money that nascent entrepreneurs believe they need to enter a market (not just to incorporate). The implication of this for policy makers is that they need to identify what aspects of the environment impact on the resources required to start a new business. The policy of lowering entry costs assumes that entrepreneurs will continue to enter markets even if there are high levels of failure. Even though new businesses experience high failure rates, there is an inherent logic in policies that allow entrepreneurs to start new ventures with relatively low resource endowments. If an ‘entrepreneur is someone who specialises in taking judgmental decisions about the coordination of scarce resources’ (Casson, 2003, p. 20) and ‘an opportunity for pure profi t cannot, by its nature, be the object of systematic search’ (Kirzner, 1997,
Table 6.3 Diff erences in means: Scheff ea, b test for country diff erences
Country N Subset for alpha = .05
1 2 3
Spain 2830 58 403Greece 188 91 553 91 553France 117 123 315 123 315Finland 135 130 481 130 481Ireland 379 139 830 139 830Italy 106 141 988 141 988Germany 1006 144 154 144 154Belgium 142 172 049Netherlands 209 328 965Signifi cance .309 .406 1.000
Notes: Means for groups in homogeneous subsets are displayed.a Uses harmonic mean sample size = 193.464.b The group sizes are unequal. The harmonic mean of the group sizes is used. Type I error levels are not guaranteed.
The fi nancial requirements of early-stage entrepreneurs 135
p. 71), by starting small entrepreneurs can test their judgements, and in the process generate new knowledge that may assist them (for example, ‘I am not good at running a business’ or ‘there is little demand for my specialized services’) or others in launching a new business. McGrath (1999) argues that such failures can create system level learning, and so the individual failures of specifi c entrepreneurs may be important in facilitating innova-tion by others. Therefore, it could be argued that policy makers should seek to facilitate entry by reducing the costs of entry.
However, there is a policy dilemma as the policy of providing direct supports that encourage more market entry is not uniformly accepted (Storey, 1994). For example, more entries might lead to displacement among existing businesses; and the collective cost of entry in terms of the fi nancial and time commitments of new entrants is high and might be more productively used in other activities. Furthermore, low entry costs essen-tially decrease the barriers to market entry and therefore may reduce the profi tability of incumbent fi rms. It could be argued that higher entry costs might discourage entry that would otherwise lead to displacement. The counter argument is that economic ‘churn’ is an important contributor to economic growth and development as it is a mechanism for new innova-tions to be brought to market and for increased competition that leads to better utilization of resources.
CONCLUSIONS
The chapter makes a number of important empirical contributions. First, we show that the fi nancial requirements of early-stage entrepreneurs are relatively low, with a sample median of €30 000 and medians ranging from €20 000 to €100 000 across nine countries. Second, we show that there are relatively small diff erences across countries in the mean anticipated cost of start-up. The empirical data we present contribute to our understand-ing of the resources required to create new commercial organizations (Aldrich, 1999); to the determinants of entrepreneurial activity (Baumol, 1993); and to how government policies might be important in encouraging entrepreneurial activity (Chandler, 1990).
There are a number of limitations associated with this study. It looks at early-stage entrepreneurs. While this has the advantage of capturing entrepreneurial activity at a very early stage in its development (all market entrants via entrepreneurship must, by defi nition, have been nascent entrepreneurs for some period of time), it also raises a number of ques-tions. First, as early-stage entrepreneurs are still at the pre-market or early market entry stage, they might be systematically under-estimating or

136 Entrepreneurship and growth
over-estimating the cost of entry. Second, not all early-stage entrepreneurs will continue their eff orts at start-up. While this may be the outcome of an assessment by the entrepreneur of the viability of the venture or of the risk and rewards associated with the venture, there also appears to be a group of nascent entrepreneurs that Reynolds refers to as ‘hobby’ nascent entre-preneurs – nascent entrepreneurs who appear to continuously explore their business idea without ever acting on it. Their estimates of the cost of entry might distort upwards or downwards the reported means and medians. Third, the focus on early-stage entrepreneurs means that market entry by established fi rms is excluded from our analysis. A further limitation of our work is that we did not explore the eff ect of diff erent sector composi-tion of early-stage entrepreneurial activity on the cost of entry. Instead we chose to focus on country diff erences. The next stage of the analysis will be to shift our focus from country eff ects only to a study of how individual, sector and country combine to determine the anticipated fi nance required by early-stage entrepreneurs.
In conclusion, the history of economic growth suggests that stimulat-ing productive economic activity is neither an easy process nor a ‘natural’ outcome in a democratic free market economy (North, 1990). North has argued that institutional change is both incremental and path depend-ent. According to evolutionary theories such as the population ecology model, evolutionary change depends on diversity in economic actions (Aldrich, 1999). In an economic context, such change partly refl ects the independent actions of entrepreneurs. Therefore it is generally assumed that entrepreneurial activity is important. The argument is that the entry by, among others, nascent entrepreneurs into markets explains the Schumpeterian process of ‘creative destruction’. If the ‘cost of entry’ matters to entrepreneurial activity and economic growth and develop-ment, as is assumed in much of the extant literature and the policy choices of many governments, it is important to know the ‘cost of entry’ and how countries diff er in ‘cost of entry’. In this chapter we have provided initial data on the level of the anticipated cost of starting a new business in nine Euro-zone countries.
ACKNOWLEDGEMENTS
Data used in this chapter were collected by the Global Entrepreneurship Monitor Consortium. The analysis and interpretation are the sole responsibility of the author.
The fi nancial requirements of early-stage entrepreneurs 137
NOTE
1. The Organisation for Economic Co-operation and Development research is based on ten OECD countries (the US, Germany, France, Italy, the UK, Canada, Denmark, Finland, the Netherlands, and Portugal). The data are based on entry and exit of fi rms (not estab-lishments) and exclude single-person fi rms. The OECD suggests that this size threshold may not be a major shortfall based on a sensitivity analysis of the Finnish data (using 5 employees and 20 employees as the cut-off yielded similar results).
REFERENCES
Acs, Z., P. Arenius, M. Hay and M. Minniti (2004), Global Entrepreneurship Monitor: 2004 Executive Report, London: Babson College and London Business School.
Aldrich, H. (1999), Organizations Evolving, London: Sage.Audretsch, D. (1995), ‘Innovation, growth and survival’, International Journal of
Industrial Organisation, 13 (4), 441–57.Audretsch, D., M. Carree, A. van Stel and R. Thurik (2002), ‘Impeded industrial
restructuring: the growth penalty’, Kyklos, 55 (1), 81–98.Audretsch, D. and M. Keilbach (2004), ‘Does entrepreneurship capital matter?’,
Entrepreneurship Theory and Practice, 28 (5), 419–29.Baker, T., A. Miner and D. Eesley (2003), ‘Improvising fi rms: bricolage, account
giving and improvisational competencies in the founding process’, Research Policy, 32 (2), 255–76.
Baumol, W. (1993), Entrepreneurship, Management, and the Structure of Payoff s, Cambridge, MA: MIT University Press.
Bhidé, A. (2000), The Origin and Evolution of New Businesses, New York: Oxford University Press.
Bygrave, W. (2005), Financing Entrepreneurial Ventures: Global Entrepreneurship Monitor Financing Report, London: Babson College and London Business School (with Stephen Hunt).
Bygrave, W., M. Hay, E. Ng and P. Reynolds (2003), ‘Executive forum: a study of informal investing in 29 nations composing the Global Entrepreneurship Monitor’, Venture Capital, 5 (2), 101–16.
Carree, M., A. van Stel, R. Thurk and S. Wennekers (2002), ‘Economic develop-ment and business ownership: an analysis using data of 23 OECD countries in the period of 1976–1996’, Small Business Economics, 19 (3), 271–90.
Carter, N., W. Gartner and P. Reynolds (1996), ‘Exploring start-up event sequences’, Journal of Business Venturing, 11 (3), 151–66.
Casson, M. (2003), The Entrepreneur: An Economic Theory, Cheltenham, UK and Northampton, MA, USA: Edward Elgar.
Chandler, A. (1990), Scale and Scope: The Dynamics of Industrial Capitalism, London and Cambridge, MA: Belknap Press.
Commission of the European Communities (2004), Action Plan: The European Agenda for Entrepreneurship, Communication from the Commission to the Council, the European Parliament, the European Economic and Social Committee and the Committee of the Regions, Brussels, 11.02.2004, COM(2004).
Davidsson, P. and M. Henrekson (2002), ‘Determinants of the prevalence of start-ups and high-growth fi rms’, Small Business Economics, 19 (2), 81–94.
138 Entrepreneurship and growth
Djankov, S., R. La Porta, F. Lopez-De-Silanes and A. Shleifer (2002), ‘The regulation of entry’, Quarterly Journal of Economics, 117 (1), 1–37.
Gilbert, B., D. Audretsch and P. McDougall (2004), ‘The emergence of entre-preneurship policy’, Small Business Economics, 22 (3/4), 313–23.
Johnson, P. (2004), ‘Diff erences in regional fi rm formation rates: a decomposition analysis’, Entrepreneurship Theory and Practice, 28 (5), 431–45.
Kirzner, I. (1997), ‘Entrepreneurial discovery and the competitive market process: an Austrian approach’, Journal of Economic Literature, 35 (1), 60–85.
Knight, F. (1921), Risk Uncertainty and Profi t, Boston, MA: Kessinger Publishing.
Levie, J. and E. Autio (2008), ‘A theoretical grounding and test of the GEM model’, Small Business Economics, 31 (3), 235–63.
McGrath, R.G. (1999), ‘Falling forward: real options reasoning and entrepre-neurial failure’, Academy of Management Review, 24 (1), 13–30.
Mueller, S. and A. Thomas (2001), ‘Culture and entrepreneurial potential: a nine country study of locus of control and innovativeness’, Journal of Business Venturing, 16 (1), 51–75.
North, D. (1990), Institutions, Institutional Change and Economic Performance, Cambridge: Cambridge University Press.
Reynolds, P., N. Bosma, E. Autio, S. Hunt, N. De Bono, I. Servais, et al. (2005), ‘Global Entrepreneurship Monitor: data collection design and implementation 1998–2003’, Small Business Economics, 24 (3), 205–31.
Reynolds, P., D. Storey and P. Westhead (1994), ‘Cross-national comparisons of the variation in new fi rm formation rates’, Regional Studies, 28 (4), 443–56.
Saxenian, A. (1990), ‘Regional networks and the resurgence of Silicon Valley’, California Management Review, 33 (1), 89–112.
Scarpetta, S. (2003), The Sources of Economic Growth in OECD Countries, Paris: Organisation for Economic Co-operation and Development.
Storey, D.J. (1994), Understanding the Small Business Sector, London: Routledge.Storey, D.J. (2000), ‘Six steps to heaven: evaluating the impact of public poli-
cies to support small businesses in developed economies’, in D. Sexton and H. Landström (eds), The Blackwell Handbook of Entrepreneurship, Oxford: Blackwell Publishers, pp. 176–93.
Vesper, K. (1990), New Venture Strategies, Englewood Cliff s, NJ: Prentice Hall.Winborg, J. and H. Landström (2001), ‘Financial bootstrapping in small
businesses: examining small business managers’ resource acquisition behav-iours’, Journal of Business Venturing, 16 (3), 235–54.
139
7. An examination of the link between growth attitudes and realized growthAnders Isaksson and Vladimir Vanyushyn
INTRODUCTION
The growth of new ventures and SMEs has long been recognized as an important stream of research in the fi eld of small business and entrepre-neurship (Delmar et al., 2003; Storey, 1994; Birch, 1987; Boswell, 1973). The volume of literature on the subject off ers a range of insights into the nature and causes of growth, two of which are of particular importance to this study. The fi rst is recognition of the fact that growth is a complex multi dimensional phenomenon that requires sophisticated tools to capture and analyse, since the use of classical measures such as employment, sales, or market share may obscure the complexity of the phenomenon under scrutiny (Gilbert et al., 2006). The second is the acknowledgement of the importance of the entrepreneur’s motivation and aspirations when study-ing growth, as entrepreneurs may defy the narrow profi t maximization imperative and choose not to grow in order to preserve the atmosphere of a small organization (Wiklund et al., 2003).
In this study, we investigate the link between growth attitudes and realized growth. The theoretical arguments for the link between growth attitudes and realized growth can be traced back to the fundamental psy-chological theory of reasoned action (TRA) (Ajzen and Fishbein, 1980; Fishbein and Ajzen, 1975; Sheppard et al., 1988) and the theory of planned behaviour (TPB) (Ajzen, 1991). TRA suggests that a person’s behavioural intention depends on the person’s attitude toward the behaviour and sub-jective norms (Ajzen and Fishbein, 1980; Fishbein and Ajzen, 1975). In other words, if a person intends to pursue a certain line of action then it is likely that the person will do so. TRA assumed that most human social behaviour is under volitional control and, therefore, can be predicted from intentions alone (Ajzen, 2002). The theory of planned behavior has further advanced the TRA by adding perceived behavioural control as a
140 Entrepreneurship and growth
new component. Perceived behavioural control (self-effi cacy and control-lability) is the self-belief that one can successfully execute the behaviour required to produce the outcomes (Fishbein and Cappella, 2006; Ajzen, 2002).
The theory of reasoned action and the theory of planned behaviour are well suited for research into entrepreneurial behaviours and have been used in numerous studies. For instance, Kolvereid and Isaksen (2006) used the theory of planned behaviour, fi nding that salient beliefs concerning self-employment determine attitudes toward self-employment. Florin et al. (2007) studied attitudinal dimensions of entrepreneurial drive in busi-ness education and Maula et al. (2005) used the theory to study determi-nants of business angels’ investments in entrepreneurial fi rms. TRA and TPB are also of great interest for policy makers in order to decide whether promoting entrepreneurship and growth among entrepreneurial fi rms should focus on changing attitudes or behaviour (see Dreisler et al., 2003, for a discussion regarding attitudes vs. behaviour).
Previous studies generally confi rm the positive relationship between motivation and actual growth, however, with noticeable variability in the results. Part of this variability may be attributed to how the growth/size is conceptualized and measured. At the conceptualization stage, there is a debate about heterogeneity versus homogeneity (Yolande et al. 2006) with respect to growth. The second part, namely the problem of measurement, is not unique to the fi eld of entrepreneurship and small business manage-ment. For example, a meta-analytic study of the relationship between fi rm innovativeness and size (Camison-Zornoza et al., 2004) has shown that the magnitude and direction of the relationship are aff ected by the operationalization of size (i.e. the number of employees, fi nancial indica-tors, physical capacity), and whether direct or logarithmic measures were used.
Wiklund et al. (2003), in their seminal paper examining attitudes towards growth, suggested investigating the link between attitudes and actual growth as an important area for future research. In a diff erent study that appeared in the same year (Wiklund and Shepherd, 2003), the authors looked more closely at the link between motivation and actual growth, pointing out that, despite the interest in and importance of the topic, only four published studies were available at the time. The reason for this paucity was suggested to be the demands placed on the research design that would involve measuring motivations at one point of time and actual growth later:
The relative scarcity of such studies may be attributed to research design requirements, as temporal separation of motivation and growth outcomes is necessary. Firm growth is not instantaneous. The motivations and behaviours
The link between growth attitudes and realized growth 141
of today will aff ect size changes into the future. Therefore, it is important to assess motivation at one point of time and size changes from that point onwards. (Wiklund and Shepherd, 2003, p. 1920)
Thus, the overarching purpose of this study is to investigate whether attitudes to growth motivation have an infl uence on actual growth. The design of the study refl ects this purpose, in that we measure attitudes at one point of time and actual growth over a later time period. While pur-suing this objective, we employ multiple measures to assess the levels of motivation, relative change in employment, and relative change in sales as measures of subsequent growth.
Furthermore, the objective of our study is to analyse the attitudes and growth of fi rms in a region. In other words, we will not focus on high- growers or larger SMEs and will restrict analysis to one relatively homogeneous geographic area, as opposed to regions with a high con-centration of high-tech fi rms. By limiting ourselves to the Västerbotten county of Sweden, we believe that we get a cross- section of such a region. Västerbotten County is situated in the northern part of Sweden and is the second largest county in Sweden in terms of territory (at around one-eighth of the total area), but is inhabited by only 3 per cent of the Swedish population. Business in the county is based largely on basic industries, such as forestry, mining and hydropower. The gross domestic product (GDP) per capita in the region is close to the national average. If entre-preneurial activity is measured as newly started enterprises per capita, the authors have estimated from offi cial statistics that the region is slightly above the national average (with 313 newly started fi rms per 1000 people in comparison with the national average of 280 fi rms per 1000).
The rest of the chapter is structured as follows. The next section describes the research design, sampling and measurement issues, followed by a presentation of the analytical procedures and the results. Then, we discuss the results and how they relate to the existing body of knowledge, and summarize the key points in the conclusions.
THE RESEARCH DESIGN AND METHOD
The Sample
The data for this study come from two sources: a survey that contained measures of the attitudes to growth, and external data on the actual growth of businesses over a four-year period. The survey was mailed out in April 2004. The questionnaire was sent to managers and/or owners of all
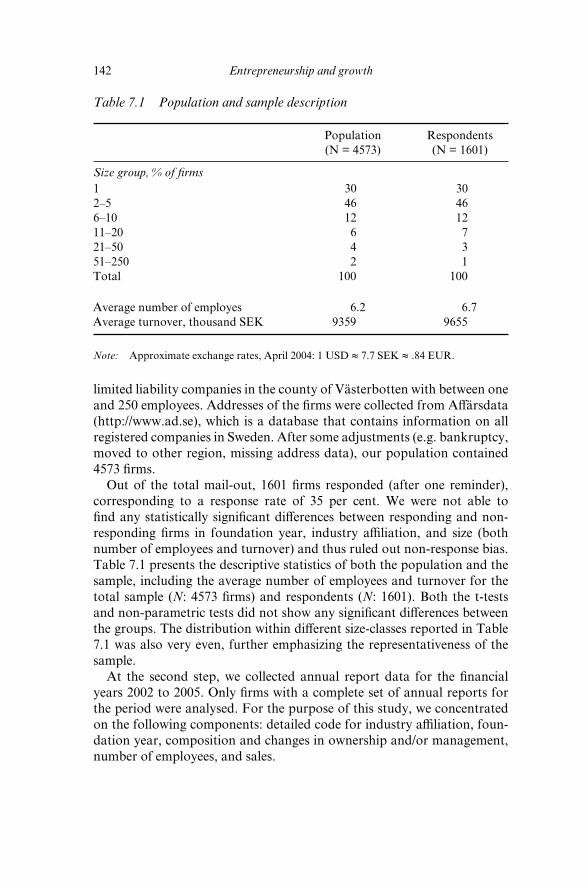
142 Entrepreneurship and growth
limited liability companies in the county of Västerbotten with between one and 250 employees. Addresses of the fi rms were collected from Aff ärsdata (http://www.ad.se), which is a database that contains information on all registered companies in Sweden. After some adjustments (e.g. bankruptcy, moved to other region, missing address data), our population contained 4573 fi rms.
Out of the total mail-out, 1601 fi rms responded (after one reminder), corresponding to a response rate of 35 per cent. We were not able to fi nd any statistically signifi cant diff erences between responding and non-responding fi rms in foundation year, industry affi liation, and size (both number of employees and turnover) and thus ruled out non-response bias. Table 7.1 presents the descriptive statistics of both the population and the sample, including the average number of employees and turnover for the total sample (N: 4573 fi rms) and respondents (N: 1601). Both the t-tests and non-parametric tests did not show any signifi cant diff erences between the groups. The distribution within diff erent size-classes reported in Table 7.1 was also very even, further emphasizing the representativeness of the sample.
At the second step, we collected annual report data for the fi nancial years 2002 to 2005. Only fi rms with a complete set of annual reports for the period were analysed. For the purpose of this study, we concentrated on the following components: detailed code for industry affi liation, foun-dation year, composition and changes in ownership and/or management, number of employees, and sales.
Table 7.1 Population and sample description
Population (N = 4573)
Respondents (N = 1601)
Size group, % of fi rms1 30 302–5 46 466–10 12 1211–20 6 721–50 4 351–250 2 1Total 100 100
Average number of employes 6.2 6.7Average turnover, thousand SEK 9359 9655
Note: Approximate exchange rates, April 2004: 1 USD ≈ 7.7 SEK ≈ .84 EUR.
The link between growth attitudes and realized growth 143
Of the original responding fi rms, 1443 (or 90.1 per cent) were still reg-istered as active in 2007. Thirteen of these fi rms lacked one annual report or more and were removed, leaving 1430 fi rms. Fourteen fi rms that had annual reports that were out of date (i.e. the most recent report was from 2004 or older) were also removed from selection (leaving 1416 fi rms). To conclude, the fi nal sample consisted of 1416 fi rms that correctly fi lled in the questionnaire and had full annual report data for the four fi nancial years 2002–05.
A caveat needs to be made at this point. The data suggest exits were about 10 per cent, although it should be noted that the fact that a fi rm ceased to be registered as active does not necessarily mean that it went out of business or became bankrupt. While for some of the exits this certainly was the case, other fi rms may have simply changed organizational form, merged with or were acquired by other fi rms. There are other events that might require a fi rm to change its legal identifi cation number. Thus, these 10 per cent should not be interpreted as a ‘death rate’.
Measurement
The questionnaire contained both direct and indirect measures of attitudes to growth, such as growth versus lifestyle businesses (Churchill and Lewis, 1983) and an assessment of external factors, such as the perceived level of competition (Roper, 1998). The question measuring growth intention (i.e. GGgoal) has been used in previous studies in Sweden as a proxy for identifying growth fi rms (Olofsson and Berggren, 1998; Olofsson, 1994). Overall, fi ve measures were employed. The fi rst question asked directly whether sales growth was a goal for the fi rm and was used as a measure of growth aspiration. The second evaluated entrepreneurs’ perception of growth as a competitive necessity. Items three and four captured the extent to which a fi rm is a bread-and-butter provider, checking whether it is a signifi cant source of employment and income for the owners. The last question assessed whether running a fi rm is a hobby-like endeavour for the owner.
The exact wording of the questions, italicized variable labels, means, standard deviations and correlations are reported in Table 7.2. Item number 5, that is the question ‘the fi rm is almost a hobby’, produced a very low mean value, which was only marginally diff erent from 1 (strongly disagree), and was excluded from further analysis.
The relative, or percentage, change in employment served as a platform for measuring realized growth (Gilbert et al., 2006). First, we calculated the relative change in employment during the years 2004–05, which was a period immediately after the survey data were collected. The relative
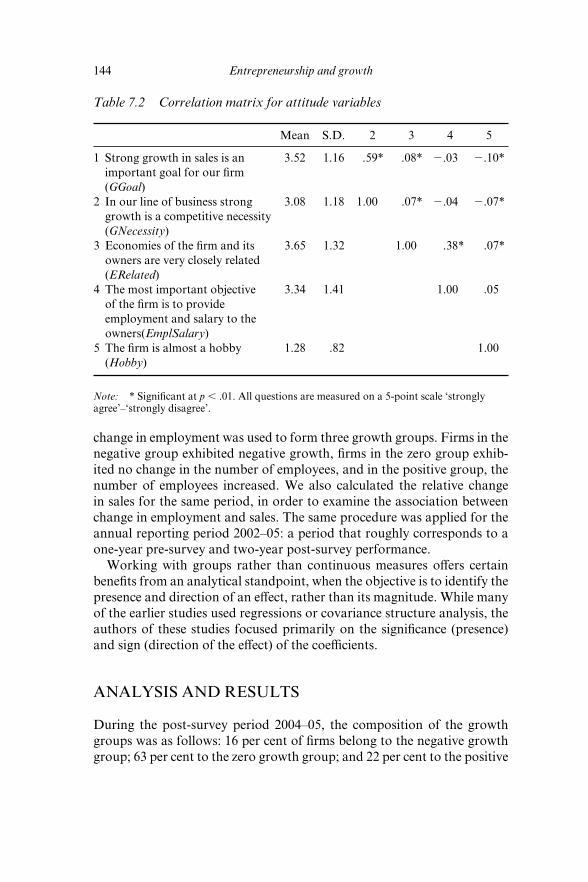
144 Entrepreneurship and growth
change in employment was used to form three growth groups. Firms in the negative group exhibited negative growth, fi rms in the zero group exhib-ited no change in the number of employees, and in the positive group, the number of employees increased. We also calculated the relative change in sales for the same period, in order to examine the association between change in employment and sales. The same procedure was applied for the annual reporting period 2002–05: a period that roughly corresponds to a one-year pre-survey and two-year post-survey performance.
Working with groups rather than continuous measures off ers certain benefi ts from an analytical standpoint, when the objective is to identify the presence and direction of an eff ect, rather than its magnitude. While many of the earlier studies used regressions or covariance structure analysis, the authors of these studies focused primarily on the signifi cance (presence) and sign (direction of the eff ect) of the coeffi cients.
ANALYSIS AND RESULTS
During the post-survey period 2004–05, the composition of the growth groups was as follows: 16 per cent of fi rms belong to the negative growth group; 63 per cent to the zero growth group; and 22 per cent to the positive
Table 7.2 Correlation matrix for attitude variables
Mean S.D. 2 3 4 5
1 Strong growth in sales is an important goal for our fi rm (GGoal)
3.52 1.16 .59* .08* 2.03 2.10*
2 In our line of business strong growth is a competitive necessity (GNecessity)
3.08 1.18 1.00 .07* 2.04 2.07*
3 Economies of the fi rm and its owners are very closely related (ERelated)
3.65 1.32 1.00 .38* .07*
4 The most important objective of the fi rm is to provide employment and salary to the owners(EmplSalary)
3.34 1.41 1.00 .05
5 The fi rm is almost a hobby (Hobby)
1.28 .82 1.00
Note: * Signifi cant at p , .01. All questions are measured on a 5-point scale ‘strongly agree’–‘strongly disagree’.
The link between growth attitudes and realized growth 145
growth group. For the period 2002–05, the composition of the groups is somewhat more even: 25 per cent negative; 45 per cent zero; and 30 per cent positive growth. One immediate result is that there are a large number of fi rms that remain stable in terms of the number of the employees during both the one year and three year periods of time.
We then used an ANOVA procedure to examine the diff erences among mean values of the attitudinal variables GGoal, GNecessity, ERelated and EmplSalary. Tables 7.3 and 7.4 report the mean values of each variable, signifi cance levels, the results of Bonferroni-corrected post hoc t-tests. The last two columns present in Tables 7.3 and 7.4 report the results of partitioning the between-groups sums of squares into linear and quadratic trend components. To aid the interpretation, Figure 7.1 plots the mean values of the variables of interest against the growth groups, or fi xed factor values, for the post-survey period.
The assumption of the equality of variances was met for both periods 2004–05 and 2002–05, with the signifi cance levels of Levene’s statistic in excess of 0.1; with the variable ‘Relative change in sales 2002–05’ being the only exception. Given the large sample size, the Welch and Brown-Forsythe statistics could be used as alternatives to the usual F test. These also were signifi cant and indicated diff erence between group means. The robust test was also signifi cant for the variable ‘Relative change in sales 2004–05’ (p , .00).
Given that the levels of the fi xed factor are ordered, that is, negative–zero–positive growth in employment, it is possible to partition the between-groups sums of squares into trend components. The visual inspection of the plot of means presented in Figure 7.1, and of the results of post hoc tests of individual diff erences represented by subscripts in Tables 7.3 and 7.4, suggests that both the linear and quadratic trends might be present. For example, variable GGoal appears to exhibit a linear trend, that is, an increase across the ordered values of relative change in employment; while variable EmplSalary suggests the presence of quadratic shape.
The last two columns in the tables showing the ANOVA results present the condensed fi ndings from partitioning the variation between groups into linear and quadratic trends for both periods. As the full ANOVA table with trends is rather cumbersome, only F-statistic and p-values for the weighted trend are reported. In the tables, the low p-values signify the presence of the trend. For the period 2004–05, which was the one after the survey was completed, variable GGoal exhibits both linear and quadratic trends; with the variable GNecessity following the same pattern. Note, however, the F-statistic values are much higher for the quadratic term, which means that the between-groups sum of squares associated with this term are much higher. Variables ERelated and EmplSalary show highly
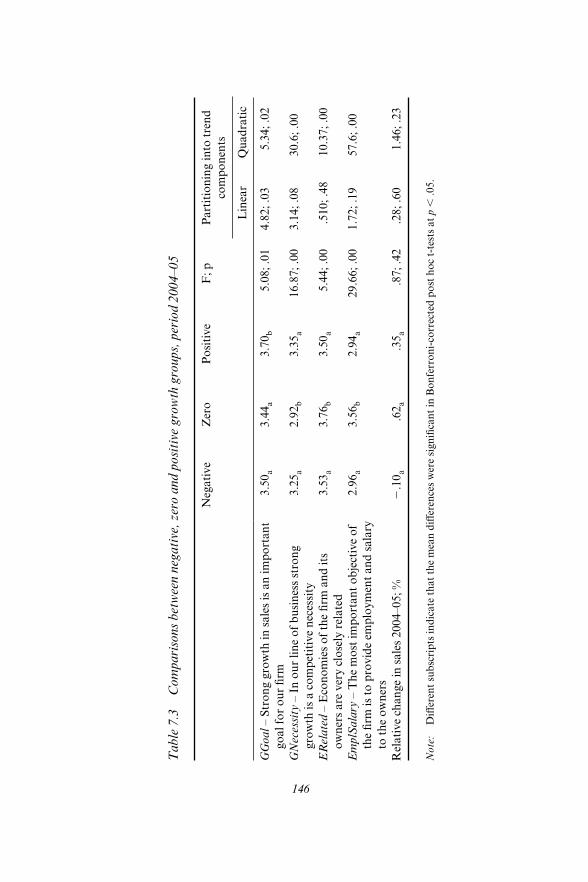
146
Tab
le 7
.3
Com
pari
sons
bet
wee
n ne
gativ
e, z
ero
and
posi
tive
grow
th g
roup
s, p
erio
d 20
04–0
5
Neg
ativ
eZ
ero
Posit
ive
F; p
Part
ition
ing
into
tren
d co
mpo
nent
s
Lin
ear
Qua
drat
ic
GG
oal –
Str
ong
grow
th in
sale
s is a
n im
port
ant
go
al fo
r our
fi rm
3.50
a3.
44a
3.70
b5.
08; .
014.
82; .
035.
34; .
02
GN
eces
sity
– In
our
line
of b
usin
ess s
tron
g
grow
th is
a c
ompe
titiv
e ne
cess
ity3.
25a
2.92
b3.
35a
16.8
7; .0
03.
14; .
0830
.6; .
00
ER
elat
ed –
Eco
nom
ies o
f the
fi rm
and
its
ow
ners
are
ver
y cl
osel
y re
late
d3.
53a
3.76
b3.
50a
5.44
; .00
.510
; .48
10.3
7; .0
0
Em
plSa
lary
– T
he m
ost i
mpo
rtan
t obj
ectiv
e of
the
fi rm
is to
pro
vide
em
ploy
men
t and
sala
ry
to th
e ow
ners
2.96
a3.
56b
2.94
a29
.66;
.00
1.72
; .19
57.6
; .00
Rel
ativ
e ch
ange
in sa
les 2
004–
05; %
2.1
0 a.6
2 a.3
5 a.8
7; .4
2.2
8; .6
01.
46; .
23
Not
e:
Diff
eren
t sub
scrip
ts in
dica
te th
at th
e m
ean
diff e
renc
es w
ere
signi
fi can
t in
Bon
ferr
oni-c
orre
cted
pos
t hoc
t-te
sts a
t p ,
.05.
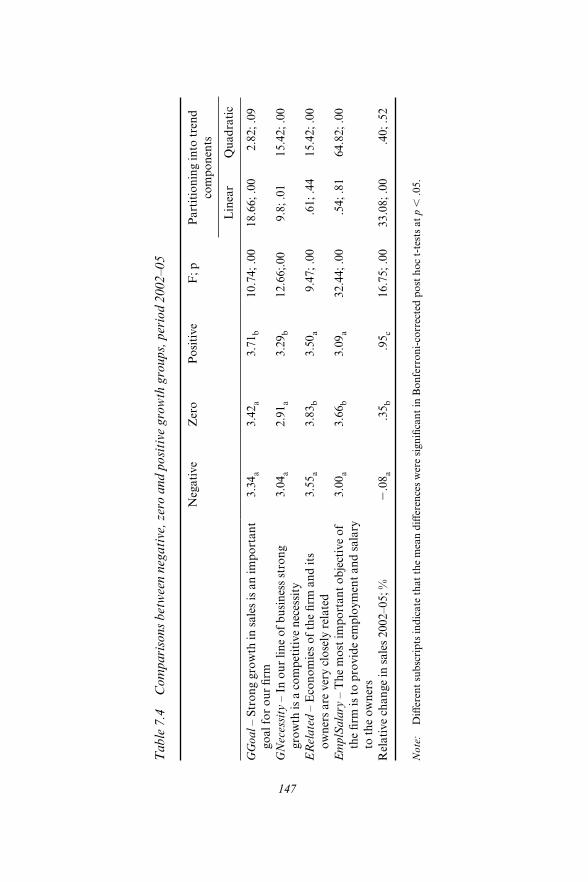
147
Tab
le 7
.4
Com
pari
sons
bet
wee
n ne
gativ
e, z
ero
and
posi
tive
grow
th g
roup
s, p
erio
d 20
02–0
5
Neg
ativ
eZ
ero
Posit
ive
F; p
Part
ition
ing
into
tren
d co
mpo
nent
s
Lin
ear
Qua
drat
ic
GG
oal –
Str
ong
grow
th in
sale
s is a
n im
port
ant
go
al fo
r our
fi rm
3.34
a3.
42a
3.71
b10
.74;
.00
18.6
6; .0
02.
82; .
09
GN
eces
sity
– In
our
line
of b
usin
ess s
tron
g
grow
th is
a c
ompe
titiv
e ne
cess
ity3.
04a
2.91
a3.
29b
12.6
6;.0
09.
8; .0
115
.42;
.00
ER
elat
ed –
Eco
nom
ies o
f the
fi rm
and
its
ow
ners
are
ver
y cl
osel
y re
late
d3.
55a
3.83
b3.
50a
9.47
; .00
.61;
.44
15.4
2; .0
0
Em
plSa
lary
– T
he m
ost i
mpo
rtan
t obj
ectiv
e of
the
fi rm
is to
pro
vide
em
ploy
men
t and
sala
ry
to th
e ow
ners
3.00
a3.
66b
3.09
a32
.44;
.00
.54;
.81
64.8
2; .0
0
Rel
ativ
e ch
ange
in sa
les 2
002–
05; %
2.0
8 a.3
5 b.9
5 c16
.75;
.00
33.0
8; .0
0.4
0; .5
2
Not
e:
Diff
eren
t sub
scrip
ts in
dica
te th
at th
e m
ean
diff e
renc
es w
ere
signi
fi can
t in
Bon
ferr
oni-c
orre
cted
pos
t hoc
t-te
sts a
t p ,
.05.
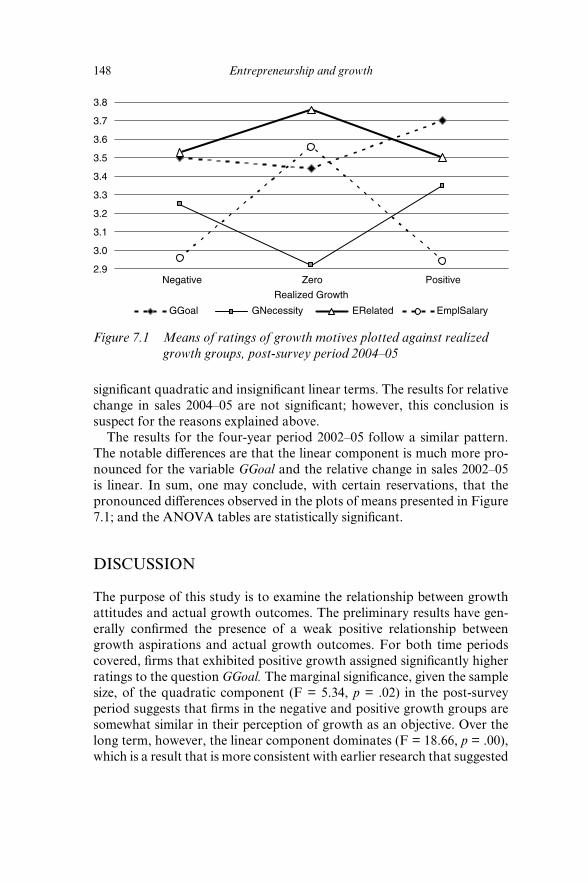
148 Entrepreneurship and growth
signifi cant quadratic and insignifi cant linear terms. The results for relative change in sales 2004–05 are not signifi cant; however, this conclusion is suspect for the reasons explained above.
The results for the four-year period 2002–05 follow a similar pattern. The notable diff erences are that the linear component is much more pro-nounced for the variable GGoal and the relative change in sales 2002–05 is linear. In sum, one may conclude, with certain reservations, that the pronounced diff erences observed in the plots of means presented in Figure 7.1; and the ANOVA tables are statistically signifi cant.
DISCUSSION
The purpose of this study is to examine the relationship between growth attitudes and actual growth outcomes. The preliminary results have gen-erally confi rmed the presence of a weak positive relationship between growth aspirations and actual growth outcomes. For both time periods covered, fi rms that exhibited positive growth assigned signifi cantly higher ratings to the question GGoal. The marginal signifi cance, given the sample size, of the quadratic component (F = 5.34, p = .02) in the post-survey period suggests that fi rms in the negative and positive growth groups are somewhat similar in their perception of growth as an objective. Over the long term, however, the linear component dominates (F = 18.66, p = .00), which is a result that is more consistent with earlier research that suggested
2.9
3.0
3.1
3.2
3.3
3.4
3.5
3.6
3.7
3.8
PositiveZeroNegative
Realized Growth
GGoal GNecessity ERelated EmplSalary
Figure 7.1 Means of ratings of growth motives plotted against realized growth groups, post-survey period 2004–05
The link between growth attitudes and realized growth 149
a positive linear form of relationship between growth aspirations and real-ized growth. The same long-term pattern holds true for the relationship between growth in sales and growth in number of employees. While there was no discernible pattern for the period 2004–05, when a longer-term period is considered (see the last row in Table 7.4), the positive and linear relationship between growth in sales and growth in employment is present and signifi cant, in line with previous research (Gilbert et al., 2006).
We have also identifi ed the presence of a large group of zero-growth fi rms that did not exhibit even a slight change in number of employees in the one-year post-survey period (63 per cent of the sample) and three-year period (45 per cent of the sample). The fi rms in this group turned out to be diff erent from both the positive-growth and negative-growth groups in their attitude towards growth as a competitive necessity, as manifested by the high signifi cance of the quadratic component in both periods studied (F = 30.6, p = .00 and F = 15.42, p = .00). Figure 7.1 also suggests that the owners of these fi rms, as compared to fi rms in the other two groups, perceived their fi rms as an important source of income and employment. On the other hand, fi rms that had either grown or declined during the time periods studied exhibited a relatively high degree of simi-larity in attitudes to and perception of growth, a fi nding that provides a tentative indication of the win-or-lose type of outcome in the fi rms that aspire to grow.
Even though the mean diff erences for the attitude variables are statisti-cally signifi cant, they may appear small from a practical standpoint. This is not surprising per se, as the low estimates of the model fi t are not uncom-mon in similar studies. For example, Wiklund and Shepherd (2003) report adjusted R2 of .06 for the model linking actual growth, aspirations, and control variables. They have also shown that the bivariate correlations between growth and growth aspirations are not signifi cantly diff erent from 0, even if aspiration is multiplied by other variables, such as education, experience, and fi nancial capital, to account for the interaction eff ect.
Our sample is also diff erent from those used in similar studies. We use a representative cross-section of a region where the bulk of the fi rms (76 per cent) have fi ve or fewer employees (Table 7.1). Thus, our conclusions may diff er somewhat from the studies where the bulk of the fi rms employed more than fi ve employees. Furthermore, we did not exclusively focus on high or consistent growth fi rms. In our sample, only 4 per cent of the fi rms exhibited consistent growth in employment over the four-year period, and 90 per cent of these growers employed more than ten people: a result that is drastically diff erent from the sample and population. In terms of sales, 27 per cent of fi rms had shown consecutive positive increase over the four-year period.
150 Entrepreneurship and growth
Hence, our results indicate that the basic theoretical link between inten-tions and outcome stated by theories of reasoned action and planned behaviour (Ajzen, 1991; Ajzen and Fishbein, 1980) seems to be con-fi rmed. Our results also confi rm results from previous research, such as Kolvereid and Bullvåg (1996), who also found a small positive relation-ship between growth intentions and achieved growth. However, some important considerations need to be mentioned.
While our results do not provide strong support to the TPB/TRA (as the diff erence between high and low aspiration groups is very small in Figure 7.1), the small magnitude of the diff erences in no way invalidates the theories or makes them any less useful in the fi eld of small business and entrepreneurship. This situation is rather typical for research that relies on, or explores TRA/TPB. Bagozzi and Warshaw (1992) stated, for instance, that research investigating the attitude–behaviour relation typically indicates a slight connection at best.
In the theory of planned behaviour, behavioural control is an impor-tant factor that moderates the link between aspiration and behaviour. In our study, we only consider the direct infl uence of growth intention and actual growth. On the other hand, one can also argue that our measures of growth intention capture some aspects of the entrepreneurs’ behavioural control. Entrepreneurs who have an intention to grow have also taken into account the presence of the resources and opportunities that are the behavioural controls they need to grow. In other words, our measure of growth intention might also, to some extent, capture behavioural control.
As mentioned previously, the magnitude of the relationship between growth aspiration and growth outcomes is not very large from a practical standpoint. It has been established that small business growth is aff ected by a wide range of factors, from general macroeconomic conditions to work climate in a fi rm, although our study did not include the moderat-ing variables. In the study of growth aspiration and achieved growth, Wiklund and Shepherd (2003) found the presence of (small but signifi cant) interaction eff ects in the form of education, experience and environmental dynamism. Our data limit us to the analysis of the entrepreneurs’ behav-ioural control, but following the results of previous research, the link might be even stronger than what we would have found if these factors had been included.
Overall, our study suggests that other measures have to be considered when looking for growth fi rms. From the policy viewpoint, our study implies that growth attitudes per se are important in discerning between growth and non-growth entrepreneurs, although that value is limited if used in isolation.
The link between growth attitudes and realized growth 151
Limitations
This study has several important limitations that need to be addressed. First, while the formation of negative, zero, and positive growth groups may be justifi ed, grouping does result in some information loss. Second, the average fi rm size in each group varied, with the smallest fi rms located in the zero-growth group. While there is empirical evidence from studies conducted in a similar environment that business size is not related to growth or growth aspirations (Wiklund and Shepherd, 2003), such con-clusions may not apply to the smallest fi rms. Third, our analysis is limited to only two measures of growth and the time span between measuring aspirations and outcomes is one and a half years. Consequently, expand-ing the analysis by using other measures of growth and collecting more growth data is necessary. As this study will benefi t from additional annual report data, these defi ciencies will be remedied in future work. A more serious limitation and the one that cannot be changed retrospectively is that the fi ndings reported here may be country- and even region-specifi c. Therefore, a more thorough investigation of the empirical evidence col-lected in diff erent countries and settings is required in order to examine the applicability of the reported fi ndings to diff erent contexts.
CONCLUSIONS
Overall, our study has confi rmed the presence of a weak positive relation-ship between growth aspirations and actual growth outcomes. We have also identifi ed the presence of a large group of zero-growth fi rms that did not exhibit even a slight change in number of employees in either the one-year post-survey period or the three-year period. The fi rms in this group turned out to be diff erent from both positive- and negative-growth groups in their attitude towards growth as a competitive necessity. The owners of these fi rms also perceived their fi rms as a primary source of income and employment. On the other hand, fi rms that had either grown or declined during the time periods studied exhibited a high degree of similarity in atti-tudes to and perception of growth; a fi nding that provides a tentative indi-cation of the win-or-lose type of outcome in the fi rms that aspire to grow.
REFERENCES
Ajzen, I. (1991), ‘The theory of planned behaviour’, Organizational Behavior and Human Decision Processes, 50 (2), 179–211.
152 Entrepreneurship and growth
Ajzen, I. (2002), ‘Perceived behavioural control, self-effi cacy, locus of control, and the theory of planned behaviour’, Journal of Applied Social Psychology, 2 (4), 665–83.
Ajzen, I. and M. Fishbein (1980), Understanding Attitudes and Predicting Social Behavior, Englewood Cliff s, NJ: Prentice Hall.
Bagozzi, R. and P.R. Warshaw (1992), ‘An examination of the etiology of the atti-tude–behaviour relation for goal-directed behaviours’, Multivariate Behavioural Research, 27 (4), 601–34.
Birch, D. (1987), Job Creation in America, New York: Free Press.Boswell, J. (1973), The Rise and Decline of Small Firms, London: Allen &
Unwin.Camison-Zornoza, C., R. Lapiedra-Alcami, M. Segarra-Cipres and M. Boronat-
Navarro (2004), ‘A meta-analysis of innovation and organizational size’, Organization Studies, 25 (3), 331–61.
Churchill, N.C. and V.L. Lewis (1983), ‘The fi ve stages of small business growth’, Harvard Business Review, 61 (3), 30–39.
Delmar F., P. Davidsson and W.B. Gartner (2003), ‘Arriving at the high-growth fi rm’, Journal of Business Venturing, 18 (2), 189–216.
Dreisler, P., P. Blenker and K. Nielsen (2003), ‘Promoting entrepreneurship – changing attitudes or behaviour?’, Journal of Small Business and Enterprise Development, 10 (4), 383–92.
Fishbein, M. and I. Azjen (1975), Belief, Attitude, Intention Research, Reading, MA: Addison-Wesley.
Fishbein, M. and J.N. Cappella (2006), ‘The role of theory in developing eff ective health communications’, Journal of Communication, 56 (Supplement), 1–17.
Florin, J., R. Karri and N. Rossiter (2007), ‘Fostering entrepreneurial drive in business education: an attitudinal approach’, Journal of Management Education, 31 (1), 17–42.
Gilbert, B.A., P.P. McDougall and D.B. Audretsch (2006), ‘New venture growth: a review and extension’ Journal of Management, 32 (6), 926–50.
Kolvereid, L. and E. Bullvåg (1996), ‘Growth intentions and actual growth: the impact of entrepreneurial choice’, Journal of Enterprising Culture, 4 (1) 1–17.
Kolvereid, L. and E. Isaksen (2006), ‘New business start-up and subsequent entry into self-employment’, Journal of Business Venturing, 21 (6), 866–885.
Maula, M., E. Autio and P. Arenius (2005), ‘What drives micro-angel invest-ments?’, Small Business Economics, 25 (5), 459–75.
Olofsson, C. (1994), ‘Små och medelstora företags fi nansiella villkor – en enkät-studie’ [‘Financial conditions for SMEs – a survey’], in Näringsdepartementet [Ministry for Trade and Commerce], Småföretagens riskkapitalförsörjning [Risk Capital Supply for SMEs], Ds 1994:52, Stockholm: Näringsdepartementet, pp. 131–60.
Olofsson, C. and B. Berggren (1998), Finansiella villkor för mindre företag [Financial Conditions for SMEs], CEF Working Report 1998:102, Uppsala: CEF.
Roper, S. (1998), ‘Entrepreneurial characteristics, strategic choice and small busi-ness performance,’ Small Business Economics, 11 (1), 11–24.
Sheppard, B.H., J. Hartwick and P.R. Warshaw (1988), ‘The theory of reasoned action: A meta-analysis of past research with recommendations for modifi ca-tions and future research’, Journal of Consumer Research, 15, 325–43.
Storey, D.J. (1994), Understanding the Small Business Sector. London: Routledge.

The link between growth attitudes and realized growth 153
Wiklund, J., P. Davidsson and F. Delmar (2003), ‘What do they think and feel about growth? An expectancy-value approach to small business managers’ atti-tudes toward growth’, Entrepreneurship Theory and Practice, 27 (3), 247–70.
Wiklund, J. and D. Shepherd (2003), ‘Aspiring for, and achieving growth: the moderating role of resources and opportunities’, Journal of Management Studies, 40 (8), 1919–41.
Yolande, E.C., B. Niraj and T.S. Christopher (2006), ‘Having arrived: the homo-geneity of high-growth small fi rms’, Journal of Small Business Management, 44 (3), 426–40.


PART IV
Business Exits

157
8. Becoming an ex-entrepreneur: fi rm performance and the sell-out or dissolution decisionA. Miguel Amaral, Rui Baptista and Francisco Lima
INTRODUCTION
A signifi cant amount of research in entrepreneurship and market dynam-ics focuses on the determinants of fi rm entry and survival as a way of understanding business performance (Santarelli and Vivarelli, 2006). The most common views underlying this research suggest that fi rm dissolution relates mostly with failure (Caves, 1998), thus supporting the argument that fi rm survival is an adequate indicator for measuring entrepreneurial success. However, there are obvious inconsistencies between this view and reality. For instance, an individual may cease to be an entrepreneur by giving up ownership of his/her fi rm, meaning that there can be entre-preneurial exit without fi rm exit or dissolution. It may also happen that exiting fi rms were performing better before closing than surviving fi rms. Such discrepancies have led to the recognition of ‘entrepreneurial exit’ as a heterogeneous phenomenon that is distinct from, but related to, fi rm exit.
By looking solely at the life duration of a fi rm one cannot completely capture its performance, since not all fi rms are compulsorily liquidated and not all entrepreneurs’ decisions to exit are involuntary. Taylor (1999) investigated the duration of self-employment spells, diff erentiating between involuntary and voluntary terminations. The author found that while a relatively small percentage of self-employment terminations were a result of bankruptcy, leading to individuals’ unemployment, the highest percentage of businesses terminated with a move of the entrepreneur to a better or diff erent alternative activity. Chrisman and McMullan (2000) have also detected that dissolution through bankruptcy is a relatively rare event.
Hence, exit can also be seen as a voluntary decision of the entrepre-neur, driven by lack of willingness to continue in business. Voluntary
158 Entrepreneurship and growth
entrepreneurial exit is associated with diverse factors; namely, recognition of a better business opportunity (McGrath and Macmillan, 2000; Shane, 2000), resource allocation to better markets (McGrath, 1999), positive occupational prospects as a paid employee (Van Praag, 2003; Bates, 2005) or re-entrance as an entrepreneur through starting-up or acquiring a dif-ferent fi rm in the market (Westhead and Wright, 1998). Furthermore, voluntary exit of the entrepreneur can either take place through discontin-uation of the fi rm or through sell-out where the fi rm continues operating with a diff erent owner (Holmes and Schmitz, 1995, 1996; Bates, 1999).
The fact that exit can be voluntary implies that when investigating entrepreneurial ‘success’, one should consider both the entrepreneurs’ and the fi rms’ thresholds of performance. Entrepreneurial exit may not occur because fi rm performance is insuffi cient to meet the requirements of the market, but because the entrepreneur deems that same performance to be insuffi cient. We have therefore a diff erent set of determinants for fi rm dis-solution (associated with competitive conditions in the industry, fi rm and individual characteristics) and for entrepreneurial exit (associated with individual preferences in which the entrepreneur establishes a ‘threshold’ for business performance below which he/she chooses to exit) (Gimeno et al., 1997; Headd, 2003).
The purpose of the present study is to further explore diff erences between the individual and fi rm-level factors infl uencing the modes of entrepre-neurial exit (i.e. ‘sell-out’ and ‘dissolution’) and to link those factors to fi rm performance at the moment of exit. Specifi cally, the analysis uses a longitudinal matched employer–employee database to test a typology of ‘entrepreneurial exit’, while addressing three key questions:
1. What are the factors associated with exit from entrepreneurship?2. What distinguishes individuals who exit entrepreneurship by dis-
continuing the fi rm from those who exit entrepreneurship through sell-out?
3. How does the entrepreneur’s individual decision to sell out or close the business relate to its performance in the market?
The article is structured as follows. The next section briefl y describes the underlying theoretical contributions on entrepreneurial exit, defi nes the research goals and propositions of the present study and proposes a theoretical framework for the analysis. The third section presents the data, discusses in some detail the issues in construction of the variables and describes the empirical methods used. The fourth section displays the estimation results, and the fi nal section provides some discussion and concluding remarks.
Becoming an ex-entrepreneur 159
BACKGROUND LITERATURE AND HYPOTHESES
Modes of Entrepreneurial Exit
Many diff erent types of exit are discussed in the literature. A large majority of the extant studies focus on the fi rm or industry level and explore diff er-ent types of fi rm discontinuance, such as market exit or technological exit (Bowman and Singh, 1993; Burgelman, 1994; Argyres, 1996). However, as pointed out earlier, recent scholarship has been shifting attention towards the exit decisions of the entrepreneur, perceiving business dissolution and entrepreneurial failure as distinct phenomena.
In an early study in this vein, Schary (1991) considers that entrepre-neurs can choose at any time to continue operations, sell the fi rm, volun-tarily liquidate or declare bankruptcy. Additionally, this author considers that there are important economic diff erences between the diff erent forms of exit, estimating models linking the form of exit to profi tability, fi rm characteristics and decision-making processes. Watson and Everett (1993, 1996) introduce fi ve categories for exit; namely, ceasing to exist (discon-tinuation for any reason), change in ownership, fi ling for bankruptcy, closing to limit losses, and failing to reach fi nancial goals. Clark and Wrigley (1997) assert that exit can happen by means of closure, de-merger or divestment. Holmes and Schmitz’s (1995, 1996) research on business turnover distinguishes small business discontinuity (failures) from sale (success). For the purpose of the present study, the following hypothesis is formulated:
H1: There exists signifi cant heterogeneity across forms of exit involving individual and fi rm-level characteristics and performance.
Looking at individual-specifi c variables associated with exit, Holmes and Schmitz (1995, 1996), using a model matching the owner and the busi-ness as well as the characteristics of fi rms that survive beyond that match, fi nd that the probability that a business manager changes jobs, in the case of the fi rm being sold, is the highest for those with the shortest tenure. Taylor (1999) fi nds that previous labour market experience is in general a strong predictor of the probability of exit from self-employment. This author fi nds that individuals who have work experience as paid employees and/or no previous unemployment experience are more likely to voluntar-ily exit (within the context of Taylor’s research, voluntary exits are identi-fi ed with sell-outs). On the basis of this result, a second hypothesis can be formulated in the present study:
160 Entrepreneurship and growth
H2: The number of years of experience as a paid employee (entrepre-neur or non-employed) is positively (negatively) associated with exit through sell-out.
The fi nding that fi rms’ exit rates decline with age (Mata and Portugal, 1994; Carroll and Hannan, 2000) is only partially corroborated when looking at the modes of exit. Mitchell (1994) fi nds that while the dissolu-tion rate declines with age for start-up fi rms, sell-out rates increase with age. This fi nding is corroborated by Holmes and Schmitz (1995, 1996), who claim that, among fi rms with managers who have the same tenure at their business, the probability that a fi rm is dissolved decreases with the age of the business. Drawing on these fi ndings, the following hypothesis is proposed:
H3: Exit through dissolution (sell-out) is negatively (positively) associated with fi rms’ age.
Entrepreneurial Exit and Firm Performance
The literature in economics and business focusing on fi rm performance and entrepreneurial success uses a great variety of often disconnected measures, whether normative (such as fi rm survival, market share, sales revenue, productivity, profi tability or growth) or subjective (such as entre-preneurial perceptions of failure).
Approaches such as those developed by Taylor (1999) or Van Praag (2003) diff er from the traditional views on performance as measured by duration of the fi rm, such as Chopra’s (2005) review of survival. While the former author estimates separate models distinguishing voluntary and involuntary terminations, the latter uses a competing risks model where success in business is defi ned as negative if the fi rm experiences compul-sory exit (dissolution) and positive if exit results from a voluntary decision (sell-out) of the entrepreneur.
The literature presents mixed evidence regarding the relationship between fi rm performance (as measured by economic measures such as turnover or profi tability) and exit. Mitchell (1994) stresses that dissolution declines with greater sales for start-ups, but sell-out rates are not signifi cantly related with sales. Furthermore, sales levels have little eff ect on the divesti-ture rate. Wennberg and Wiklund (2006), using data on exit for both fi rms and entrepreneurs, distinguish between ‘sell-off ’, ‘closure’ and ‘full exit’, characterizing the large majority of entrepreneurial exits as being ‘exits by success’; that is, fi rms that are sold while outperforming other incumbent fi rms in the market (in terms of gross turnover). However, Schary (1991) fi nds no signifi cant relation between exit and profi tability. For the purpose of the present study, the following hypothesis is tested:
Becoming an ex-entrepreneur 161
H4: Exit through dissolution (sell-out) is negatively (positively) associ-ated with fi rms’ sales revenue.
With regard to entrepreneurs’ perceptions of success (or failure) when dissolving the business, Headd (2003) fi nds that about half of new fi rms survive beyond four years and about a third of closed businesses were successful at dissolution. This author also fi nds that fi rms with no start-up capital and relatively young owners were more frequently considered successful at dissolution, while entrepreneurs’ race and gender played neg-ligible roles in determining survivability and success at dissolution. Bates (2005) fi nds that successful dissolution is more likely to take place among highly educated owners running fi rms in skilled-service fi elds such as pro-fessional services; individuals with prior experience in the fi eld where they set up their small business; and where there are strong owner human capital traits, namely college graduates with relevant prior work experience.
The failure of entrepreneurs in achieving their intangible goals (Headd, 2003; Bates, 2005) and the poor economic performance of fi rms (Gimeno et al., 1997) per se may not be suffi cient to guarantee fi rm dissolution or entrepreneurial exit. In fact, many individuals re-enter or continue in entrepreneurship despite not having had success in their previous entre-preneurial eff orts (Flores-Romero and Blackburn, 2006). Hence, along with the investigation of hypotheses resulting from the literature, the present study draws on the theoretical underpinnings of entrepreneurial exit seeking to match modes of exit (sell-out vs. dissolution) with fi rms’ observed economic performance (sales revenue above or below the market average). For this purpose, four diff erent modes of exit are proposed, identifi ed and described empirically using the available data:
entrepreneurial failure ● (dissolution with low economic perfor-mance);1
divestment choice ● (dissolution with high economic performance);managerial turnover ● (sell-out with low economic performance);planned exit strategy ● (sell-out with high economic performance).
RESEARCH DESIGN
Data Description and Construction of the Variables
The present investigation uses detailed information on individuals’ back-grounds, career paths, and fl ows between fi rms and sectors in the Portuguese economy. The main data source is the ‘Quadros de Pessoal’
162 Entrepreneurship and growth
(QP), a unique database gathered from mandatory information submit-ted each year by Portuguese fi rms to the Ministry of Social Security and Labour. The longitudinal matched employer–employee data is available for the period 1986–2003. The sample under study covers the period 1986–2000 and, after data cleansing, accounts for about 340 000 exits from entrepreneurship out of nearly 1.2 million individual observations.
For the purpose of this research, a broad defi nition of ‘entrepreneur’ is used, incorporating all those individuals who are reported as busi-ness owners in the QP, regardless if they have full or partial ownership, and have started, acquired or inherited the business. The choice not to restrict the analysis to those individuals who started new businesses was deliberate, since it allows us to examine diff erences between starters and acquirers/inheritors in the empirical analysis.
The data allow disentangling continuance from discontinuance of fi rms.2 The QP data result from a questionnaire that is mandatory for all private fi rms in the Portuguese economy. Hence, if at a certain period one fi rm stops being present in the data set and does not return in the following two years, we assume that it has been discontinued. For this reason, the analysis uses only individuals and fi rms that are present within the period 1986–2000, so that we can guarantee that only complete spells are being considered.3
Three major dimensions of variables are considered for the empirical analysis:
Owner demographic traits and human capital: age; retirement (more ●
than 65 years old); gender; university education; years of experience, as a paid employee, as an entrepreneur and as non-employed; expe-rience in diff erent fi rms, in diff erent fi rms as an entrepreneur or in diff erent sectors; the owner, who is the founder of the fi rm; number of business owners in the fi rm; earnings; exit from entrepreneurship; and modes of entrepreneurial exit.Firm-level characteristics: age of the fi rm; fi rm size; fi rm sales ●
revenue; and sector of economic activity.Macroeconomic context: performance of the sector (average ●
turnover) and unemployment rate.
Dependent Variables
The main variable of interest is ‘entrepreneurial exit’, which is defi ned as a binary dependent variable. An individual is considered to exit entre-preneurship if he or she leaves his or her current business to enter non-employment4 or paid employment in another fi rm. Entrepreneurial exit
Becoming an ex-entrepreneur 163
excludes those cases of entrepreneurs who, despite exiting the fi rm, do not change their professional occupation. In other words, an individual who switches directly5 to another fi rm but continues as an entrepreneur (busi-ness owner) in that fi rm is not considered to have exited entrepreneurship.6 The binary dependent variable distinguishes ‘entrepreneurial exit’ (assum-ing value 1) from a control group for ‘continuance in entrepreneurship’ (assuming value 0).
The second main variable of interest is ‘modes of entrepreneurial exit’ and is defi ned as a categorical dependent variable. The multiple response distinguishes between a control group of individuals who ‘continue in entrepreneurship’ (assuming value 0); entrepreneurial exit with continu-ance of the fi rm; that is, through ‘sell-out’ (assuming value 1) and, fi nally, entrepreneurial exit with discontinuance of the fi rm; that is, through ‘dissolution’ (assuming value 2).
In order to account for exits with high or low performance in our descriptive analysis, a dummy variable was constructed based on informa-tion on average sales revenue per sector of economic activity, at the two-digit level of NACE. This variable equals 1 – ‘high performance’ – if, at the moment of exit, sales revenue per employee is equal to or higher than the sector average; and equals 0 – ‘low performance’ – if sales revenue per employee is lower than the sector average. This allows for the use of a variable that is the product of interaction of ‘modes of entrepreneurial exit’ and the ‘performance’ binary variable so that the four types of exit proposed in the last section can be empirically assessed.7
Independent Variables
Two variables are included in the models in a way that accounts for own-ership status: number of business owners in the fi rm and a binary variable, distinguishing individuals who have started the fi rm from those who did not. We assume that entry into entrepreneurship occurs through a start-up if an individual enters a fi rm for the fi rst time and that same fi rm is new in the market (i.e. the fi rm’s date of foundation and the owner’s date of admission in the fi rm are the same). Otherwise, we consider that an existing fi rm has been acquired by the entrepreneur.
In order to study the infl uence of specifi c and general experience in the labour market, diff erent variables are built, accounting for the number of years individuals have spent in paid employment, entrepreneurship and non-employment. Moreover, a set of variables also measure the number of prior entrepreneurial experiences in diff erent fi rms, and the number of prior experiences in diff erent economic sectors.
In the original database, information on entrepreneurs’ earnings is
164 Entrepreneurship and growth
provided only for a negligible number of cases. As a way to overcome this limitation, the highest wage paid by the fi rm is used as a proxy for entre-preneurs’ earnings. Hourly earnings are calculated by dividing the base wage plus regular payments by the number of hours worked per month, and defl ated using the Consumer Price Index. Overtime payments are not included.
Control Variables
Several factors have been shown by the literature to impact on individuals’ decisions to exit entrepreneurship. The more important of these factors are considered in the present study through the inclusion of control variables.
Estimations control for sector of economic activity because specifi c business environments may impact diff erently on fi rms’ profi tability and performance as well as on the individual choice to exit or continue in entrepreneurship. Dummy variables distinguish between primary sectors, manufacturing, energy and construction, services and community, social and personal services.
A measure of industry performance uses the yearly variation in average sales revenue per two digit sector. A control variable for macroeconomic environment is also included. This variable was constructed by calculat-ing the unemployment rate variation8 relative to the homologous last quarters in 1986–2000, based on offi cial statistical information regarding unemployment rate, drawn from INE – Statistics Portugal.
It is important to acknowledge the inability of the data to provide evi-dence regarding some factors that inevitably play a role in determining entrepreneurial exit (e.g. ill health, death). In order to partially account for these issues a dummy variable is included to control for exits that may be a result of entrepreneurial retirement. This variable assumes the value 1 if the individual is aged 65 or more years, and 0 otherwise.
Empirical Methods
In order to investigate why individuals exit entrepreneurship and the dif-ferent modes of such exit, the present study resorts to a form of the classic discrete choice model as reviewed by Parker (2004). In these models, occu-pational choice is determined by the expected utility from each diff erent occupation. Given the type of response variable, the logit and the multi-nomial logit models are found to be a suitable empirical strategy (follow-ing similar approaches to entrepreneurial exit developed by, for example, Schary, 1991; Headd, 2003; Bates, 2005).
The model assumes that there are two entrepreneurial choices (j), here
Becoming an ex-entrepreneur 165
denoted by E (exit entrepreneurship) and C (continue in entrepreneur-ship). Each individual (i) has a vector Xi of observed characteristics and derives utility Uij= U(Xi,j) 1 uij if they work in a j specifi c situation (E or C), where U(Xi,j) is observable utility and uij is idiosyncratic unobserved utility. The vector Xi comprises measures of individual demographic char-acteristics, human capital and experience, organizational features, and economic environment.
Expected utility is defi ned as [E(Uij)]. An individual will exit entrepre-neurship if E (Ui E) . E(Ui C), and will continue as an entrepreneur if E (UiE) , E (Ui C).
A logit specifi cation was used to assess the factors aff ecting the decision to exit entrepreneurship. Hence, our model becomes:
Pr(zi 5 1) 5e(b Xi)
1 1 e(b Xi) (8.1)
The initial logit model (8.1) is extended to estimate diff erent modes of exit. Hence, we consider that individual i has J possible outcomes and let zij denote the jth observation for individual i, j = 1, . . . ,J. If there are J possible response states, then Pr(zit 5 j 0Xij) , j 5 1, . . . ,J is the probability that individual i has response j given Xij, a column vector of explanatory variables for that observation.
The multinomial model is expressed as:
Pr(zij 5 j 0Xij) 5e(bijXij)
aJ
j51e(bijXij)
(8.2)
The model pairs each response category with an arbitrary baseline cat-egory. In our analysis the response has three states (J = 3): individuals who continue in entrepreneurship (j = 0), individuals who exit entrepreneurship through sell-out (j = 1) and individuals who exit entrepreneurship through dissolution (j = 2). The group of individuals who do not exit entrepreneur-ship is set as the reference category in order to facilitate interpretation of the results, so that b1 = 0.
Two diff erent models accounting for individual and fi rm-level factors associated with entrepreneurial exit are estimated:
Model I: ● the probability of exiting entrepreneurship (a logit model reporting marginal eff ects).Model II: ● the probability of exiting entrepreneurship through dif-ferent modes: sell-out versus dissolution (multinomial logit model reporting both log-odds and marginal eff ects).
166 Entrepreneurship and growth
RESULTS
Descriptive Statistics
Descriptive statistics (presented in Table 8.1) show female entrepreneurs are more likely to exit through dissolution than sell-out when compared to male entrepreneurs. On average, individuals exiting through sell-out are older than individuals exiting through dissolution (about 47 vs. about 44 years old). With regard to individuals of retirement age (over 65 years old), around 8 per cent leave entrepreneurship through sell-out, while only 6 per cent exit by closing their fi rms.
Descriptive statistics of individual experience in a given professional occupation show that a higher percentage of individuals who exit through dissolution have spent more time as paid employees or in non-employment before exiting, than individuals who exit through sell-out. Conversely, the frequency of individuals with more entrepreneurial experience is higher for the ones who exit through sell-out than for those who close the fi rm. Levels of education are similar for both sell-outs and dissolutions. However, there is a higher frequency of individuals with university educa-tion among sell-outs than among dissolutions. Average earnings per hour are two times higher for entrepreneurs who continue in entrepreneurship or exit by selling, than for those who exit through fi rm dissolution.
When distinguishing between fi rm founders or acquirers, the data reveal a higher frequency of founders who close the fi rm (23 per cent) than of sellers (10 per cent). This may be connected to the fact that there are, on average, more entrepreneurial partnerships among individuals who sell (1.7 owners) than among individuals who close their fi rms (1.4 owners).
Concerning individual experience across diff erent fi rms, only 4.5 per cent of entrepreneurs who exit through sell-out have experience in two or more fi rms (regardless of their occupational attainment within those fi rms) comparing to the fi gure of around 9 per cent for dissolutions. However, when looking specifi cally at individuals’ previous entrepreneurial experi-ences in diff erent fi rms, there is a higher frequency of cases with two or more entrepreneurial events who exit entrepreneurship through dissolu-tion, compared to the ones who sell out and even to those who do not exit. Individuals with experience in two or more sectors of activity more frequently dissolve than sell their fi rms.
The average age of the fi rm at the moment individuals decide to exit entrepreneurship is around 16 years for sell-out and 11 years for dis-solution, while the average age for all fi rms in the dataset is 15 years. Firm size, measured in number of workers, is 14 people on average for all cases considered in the data set and also for those who continue in
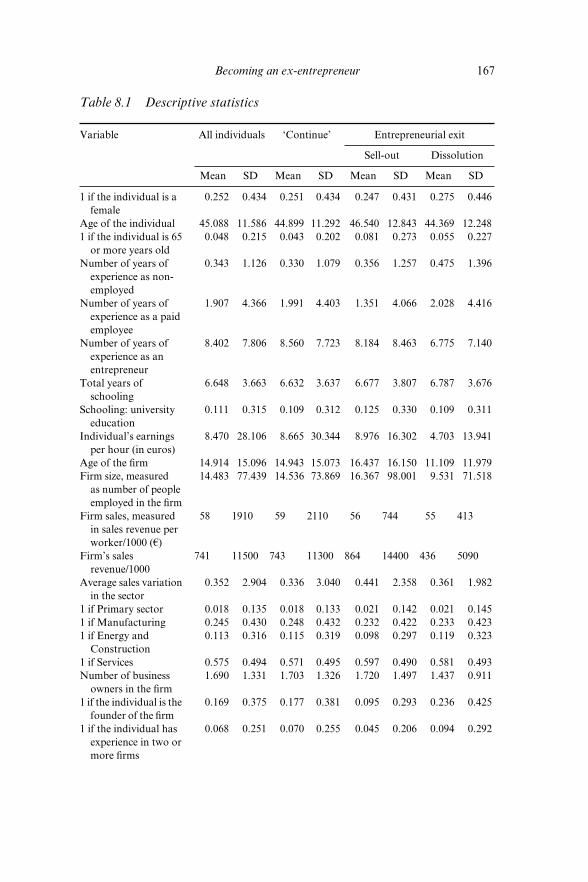
Becoming an ex-entrepreneur 167
Table 8.1 Descriptive statistics
Variable All individuals ‘Continue’ Entrepreneurial exit
Sell-out Dissolution
Mean SD Mean SD Mean SD Mean SD
1 if the individual is a female
0.252 0.434 0.251 0.434 0.247 0.431 0.275 0.446
Age of the individual 45.088 11.586 44.899 11.292 46.540 12.843 44.369 12.2481 if the individual is 65
or more years old 0.048 0.215 0.043 0.202 0.081 0.273 0.055 0.227
Number of years of experience as non-employed
0.343 1.126 0.330 1.079 0.356 1.257 0.475 1.396
Number of years of experience as a paid employee
1.907 4.366 1.991 4.403 1.351 4.066 2.028 4.416
Number of years of experience as an entrepreneur
8.402 7.806 8.560 7.723 8.184 8.463 6.775 7.140
Total years of schooling
6.648 3.663 6.632 3.637 6.677 3.807 6.787 3.676
Schooling: university education
0.111 0.315 0.109 0.312 0.125 0.330 0.109 0.311
Individual’s earnings per hour (in euros)
8.470 28.106 8.665 30.344 8.976 16.302 4.703 13.941
Age of the fi rm 14.914 15.096 14.943 15.073 16.437 16.150 11.109 11.979Firm size, measured
as number of people employed in the fi rm
14.483 77.439 14.536 73.869 16.367 98.001 9.531 71.518
Firm sales, measured in sales revenue per worker/1000 (€)
58 1910 59 2110 56 744 55 413
Firm’s sales revenue/1000
741 11500 743 11300 864 14400 436 5090
Average sales variation in the sector
0.352 2.904 0.336 3.040 0.441 2.358 0.361 1.982
1 if Primary sector 0.018 0.135 0.018 0.133 0.021 0.142 0.021 0.1451 if Manufacturing 0.245 0.430 0.248 0.432 0.232 0.422 0.233 0.4231 if Energy and
Construction0.113 0.316 0.115 0.319 0.098 0.297 0.119 0.323
1 if Services 0.575 0.494 0.571 0.495 0.597 0.490 0.581 0.493Number of business
owners in the fi rm1.690 1.331 1.703 1.326 1.720 1.497 1.437 0.911
1 if the individual is the founder of the fi rm
0.169 0.375 0.177 0.381 0.095 0.293 0.236 0.425
1 if the individual has experience in two or more fi rms
0.068 0.251 0.070 0.255 0.045 0.206 0.094 0.292
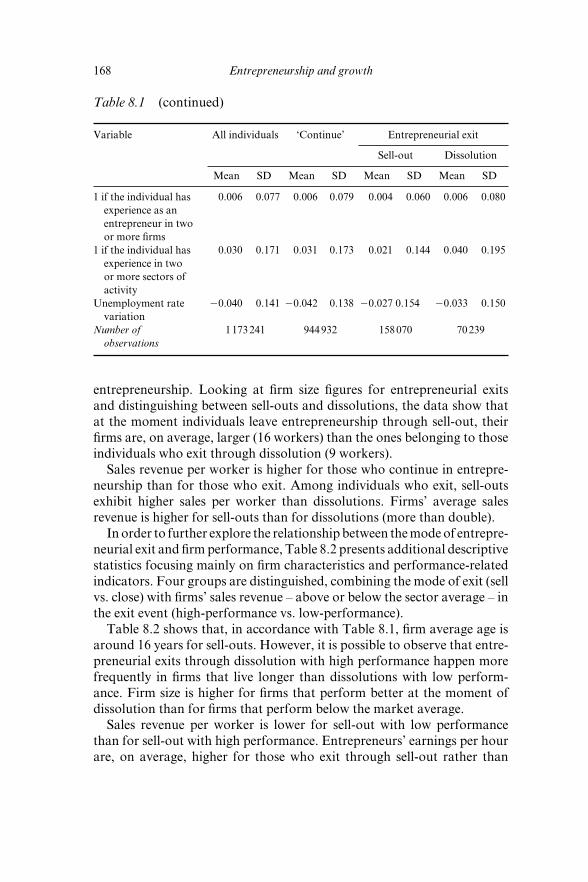
168 Entrepreneurship and growth
entrepreneurship. Looking at fi rm size fi gures for entrepreneurial exits and distinguishing between sell-outs and dissolutions, the data show that at the moment individuals leave entrepreneurship through sell-out, their fi rms are, on average, larger (16 workers) than the ones belonging to those individuals who exit through dissolution (9 workers).
Sales revenue per worker is higher for those who continue in entrepre-neurship than for those who exit. Among individuals who exit, sell-outs exhibit higher sales per worker than dissolutions. Firms’ average sales revenue is higher for sell-outs than for dissolutions (more than double).
In order to further explore the relationship between the mode of entrepre-neurial exit and fi rm performance, Table 8.2 presents additional descriptive statistics focusing mainly on fi rm characteristics and performance-related indicators. Four groups are distinguished, combining the mode of exit (sell vs. close) with fi rms’ sales revenue – above or below the sector average – in the exit event (high-performance vs. low-performance).
Table 8.2 shows that, in accordance with Table 8.1, fi rm average age is around 16 years for sell-outs. However, it is possible to observe that entre-preneurial exits through dissolution with high performance happen more frequently in fi rms that live longer than dissolutions with low perform-ance. Firm size is higher for fi rms that perform better at the moment of dissolution than for fi rms that perform below the market average.
Sales revenue per worker is lower for sell-out with low performance than for sell-out with high performance. Entrepreneurs’ earnings per hour are, on average, higher for those who exit through sell-out rather than
Table 8.1 (continued)
Variable All individuals ‘Continue’ Entrepreneurial exit
Sell-out Dissolution
Mean SD Mean SD Mean SD Mean SD
1 if the individual has experience as an entrepreneur in two or more fi rms
0.006 0.077 0.006 0.079 0.004 0.060 0.006 0.080
1 if the individual has experience in two or more sectors of activity
0.030 0.171 0.031 0.173 0.021 0.144 0.040 0.195
Unemployment rate variation
20.040 0.141 20.042 0.138 20.027 0.154 20.033 0.150
Number of observations
1 173 241 944 932 158 070 70 239

169
Tab
le 8
.2
Des
crip
tive
stat
istic
s (fi r
m p
erfo
rman
ce a
t the
exi
t mom
ent)
Var
iabl
eC
ontin
ue in
E
ntre
pren
eurs
hip
Sell-
out w
ith h
igh
perf
orm
ance
(Pla
nned
exi
t str
ateg
y)
Sell-
out w
ith lo
w
perf
orm
ance
(Man
ager
ial t
urno
ver)
Diss
olut
ion
with
hig
h pe
rfor
man
ce(D
ives
tmen
t cho
ice)
Diss
olut
ion
with
low
pe
rfor
man
ce(E
ntre
pren
euria
l fa
ilure
)
Mea
nSD
Mea
nSD
Mea
nSD
Mea
nSD
Mea
nSD
Age
of t
he fi
rm14
.943
15.0
7322
.734
18.0
4914
.797
15.1
9516
.051
15.3
3510
.508
11.3
59F
irm si
ze (n
o. o
f pe
ople
em
ploy
ed
in th
e fi r
m)
14.5
3673
.869
48.8
1520
7.79
87.
916
22.6
6840
.651
213.
123
5.74
79.
108
Firm
sale
s re
venu
e pe
r w
orke
r/10
00 (€
)
58.9
2110
154
1630
3140
.923
012
3033
.453
.9
Firm
sale
s re
venu
e/10
00 (€
)74
311
300
3440
3150
019
344
428
4015
200
144
232
Ave
rage
sale
s va
riatio
n in
the
sect
or
0.33
63.
040
0.07
01.
140
0.53
82.
573
0.04
40.
478
0.39
92.
089
Indi
vidu
al’s
earn
ings
per
ho
ur (€
)
8.66
530
.344
16.9
9627
.649
6.88
710
.712
9.88
915
.854
4.07
213
.556
Num
ber o
f ob
serv
atio
ns94
4 932
32 66
312
5 407
7 614
62 62
5

170 Entrepreneurship and growth
for those entrepreneurs who dissolve the business. Comparing diff erent modes of exit combined with the fi rm performance measure, our typology shows that within sell-out and dissolution groups, those who exit high- performing fi rms earn more than those who exit low-performing fi rms.
In opposition to the common perception that individuals leave entre-preneurship through dissolution – which is often associated with poor fi rm performance (bankruptcy or insolvency) – our descriptive analysis shows a large percentage of entrepreneurs exiting their fi rms through sell-out (about 70 per cent) instead of dissolution; that is, leaving the business does not imply the extinction of the fi rm.
Hence, it can be argued that, notwithstanding being interdependent entities, the fi rm and the entrepreneur(s) can be analysed separately. In particular, the performance thresholds that lead to entrepreneurs’ exit from a fi rm are not necessarily the same as those that lead to fi rm exit from the market.
As shown in Figure 8.1, about 80 per cent of exits from entrepreneurship are associated with low performance of the fi rm when compared with the average performance of the industry. The fact that a considerable number of entrepreneurial exits take place despite fi rm success in the market (the remaining 20 per cent of exits occur when fi rms are performing above the industry average) is in line with hypothesis H1 and suggests that exit should be dissociated from failure.
Sell-off ClosureHigh performance:
Sell-off ClosureLow performance:
0%
20%
40%
60%
80%
100%
1986
1987
1988
1989
1991
1992
1993
1994
1995
1996
1997
1998
1999
2000
Year
% exiters
‘Entrepreneurial failure’
‘Managerial turnover’
‘Divestment choice’‘Planned exit strategy’
Figure 8.1 Percentage of entrepreneurs selling or discontinuing ‘high’ or ‘low performance’ businesses in 1986–2000
Becoming an ex-entrepreneur 171
Estimations on Entrepreneurial Exit (Logit Regression Reporting Marginal Eff ects)
In order to fi t the fi nal model, several estimations were analysed and compared. Specifi cally, a simple logit model including only individuals’ characteristics was extended to a subsequent model including non-linear independent variables for age and years of occupational experience. Firm-level, sector-specifi c and macroeconomic variables were also included in the estimations and fi t was assessed considering the conceptual back-ground discussed in the introductory section of this chapter. The assess-ment of diverse measures of fi t provided additional empirical support for the variables included in the fi nal models.
Results presented in Table 8.3 show marginal eff ects estimated around mean points and the log-odds. The predicted probability of entrepreneur-ial exit is lower for females than for males, for someone who is average in the remaining variables. The marginal eff ect of age on the likelihood of exit is negative. Being 65 (or more) years old does not impact on entre-preneurial exit and this may suggest that a signifi cant percentage of the entrepreneurs remain active instead of exiting once they reach retirement age or that, otherwise, individuals leave entrepreneurship before they reach retirement age.
Professional experience in diff erent occupations is negative, thus deter-ring the likelihood of exiting entrepreneurship. Comparing diff erent mag-nitudes across occupations, it is possible to observe that the more years an individual had previously remained in paid employment, the lower the likelihood of exiting entrepreneurship. The eff ect is less negative for years of previous experience as an entrepreneur and very small for years of pre-vious experience as non-employed (i.e. out of the database). Nevertheless, it is important to note that when analysing non-linear terms for occupa-tional experience variables, the estimation reports positive coeffi cients.
Individuals’ previous professional experience can also be assessed by considering the number of fi rms they were engaged with. The fact that individuals have been previously present in two or more diff erent fi rms is negatively associated with the decision to exit entrepreneurship. This negative eff ect on entrepreneurial exit is considerably stronger when con-sidering previous experience in two or more diff erent fi rms as entrepre-neurs. Having prior professional experience in diverse sectors of economic activity does not impact signifi cantly on exit.
Results show that the higher the entrepreneurs’ earnings per hour, the lower the likelihood of exiting entrepreneurial activity. Being a fi rm founder also impacts negatively on the decision to exit entrepreneur-ship. The number of entrepreneurs in the same fi rm has a small negative

172 Entrepreneurship and growth
Table 8.3 Logit regressions on entrepreneurial exit
Variable Marginal eff ects Log-odds
1 if the individual is a female 20.005*** 20.036***[0.001] [0.006]
Age of the individual 20.008*** 20.051***[0.000] [0.001]
Squared age of the individual (divided by 1000)
0.104*** 0.690***[0.002] [0.017]
1 if the individual is 65 or more years old 20.002 20.013[0.002] [0.015]
Years of experience as non-employed 20.003*** 20.021***[0.001] [0.005]
Squared years of experience as non-employed (/ 1000)
1.372*** 9.079***[0.087] [0.577]
Years of experience as a paid employee 20.013*** 20.087***[0.000] [0.002]
Squared years of experience as a paid employee (/ 1000)
0.393*** 2.604***[0.010] [0.065]
Years of experience as an entrepreneur 20.010*** 20.063***[0.000] [0.001]
Squared years of experience as an entrepreneur (/ 1000)
0.180*** 1.194***[0.003] [0.021]
1 if the individual has university education 0.022*** 0.145***[0.001] [0.008]
Logarithm of fi rm age (in years) 20.012*** 20.077***[0.001] [0.004]
Logarithm of the individual’s earnings per hour
20.027*** 20.182***[0.001] [0.004]
1 if the individual has experience in two or more fi rms
20.016*** 20.105***[0.002] [0.011]
1 if the individual has experience as an entrepreneur in two or more fi rms
20.054*** 20.359***[0.002] [0.014]
1 if the individual has experience in two or more sectors of activity
0.002 0.012[0.001] [0.008]
Logarithm of fi rm size (people employed in the fi rm)
20.004*** 20.029***[0.001] [0.003]
Logarithm of fi rm sales (sales revenue per worker)
20.010*** 20.068***[0.000] [0.002]
Average sales variation in the sector 0.001*** 0.004***[0.000] [0.001]
Number of business owners in the fi rm 20.002*** 20.012***[0.000] [0.002]
1 if the individual is the founder of the fi rm
20.066*** 20.436***[0.001] [0.008]
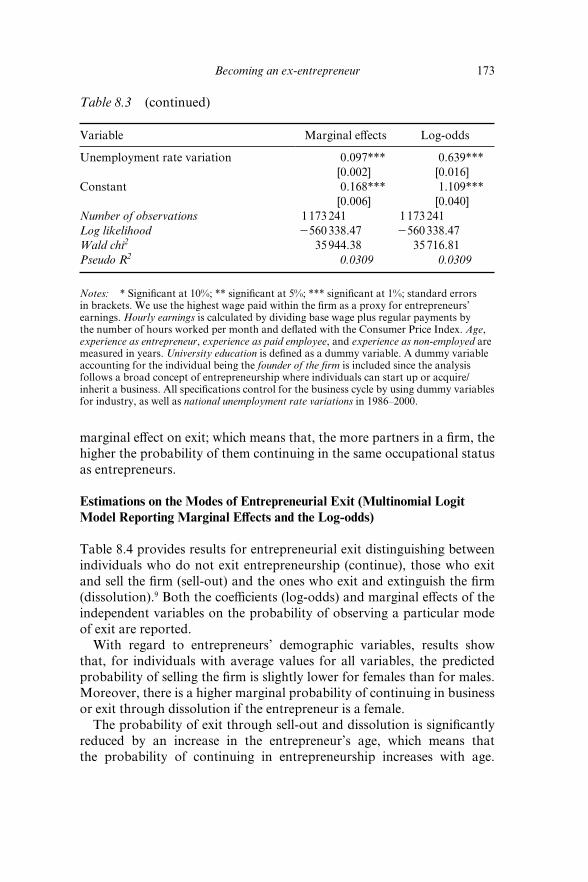
Becoming an ex-entrepreneur 173
marginal eff ect on exit; which means that, the more partners in a fi rm, the higher the probability of them continuing in the same occupational status as entrepreneurs.
Estimations on the Modes of Entrepreneurial Exit (Multinomial Logit Model Reporting Marginal Eff ects and the Log-odds)
Table 8.4 provides results for entrepreneurial exit distinguishing between individuals who do not exit entrepreneurship (continue), those who exit and sell the fi rm (sell-out) and the ones who exit and extinguish the fi rm (dissolution).9 Both the coeffi cients (log-odds) and marginal eff ects of the independent variables on the probability of observing a particular mode of exit are reported.
With regard to entrepreneurs’ demographic variables, results show that, for individuals with average values for all variables, the predicted probability of selling the fi rm is slightly lower for females than for males. Moreover, there is a higher marginal probability of continuing in business or exit through dissolution if the entrepreneur is a female.
The probability of exit through sell-out and dissolution is signifi cantly reduced by an increase in the entrepreneur’s age, which means that the probability of continuing in entrepreneurship increases with age.
Table 8.3 (continued)
Variable Marginal eff ects Log-odds
Unemployment rate variation 0.097*** 0.639***[0.002] [0.016]
Constant 0.168*** 1.109***[0.006] [0.040]
Number of observations 1 173 241 1 173 241Log likelihood 2560 338.47 2560 338.47Wald chi2 35 944.38 35 716.81Pseudo R2 0.0309 0.0309
Notes: * Signifi cant at 10%; ** signifi cant at 5%; *** signifi cant at 1%; standard errors in brackets. We use the highest wage paid within the fi rm as a proxy for entrepreneurs’ earnings. Hourly earnings is calculated by dividing base wage plus regular payments by the number of hours worked per month and defl ated with the Consumer Price Index. Age, experience as entrepreneur, experience as paid employee, and experience as non-employed are measured in years. University education is defi ned as a dummy variable. A dummy variable accounting for the individual being the founder of the fi rm is included since the analysis follows a broad concept of entrepreneurship where individuals can start up or acquire/inherit a business. All specifi cations control for the business cycle by using dummy variables for industry, as well as national unemployment rate variations in 1986–2000.
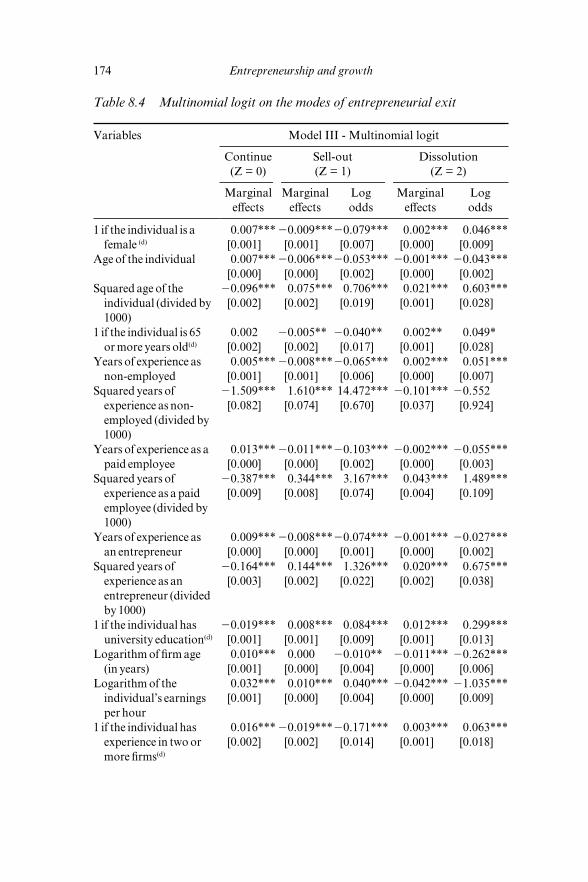
174 Entrepreneurship and growth
Table 8.4 Multinomial logit on the modes of entrepreneurial exit
Variables Model III - Multinomial logit
Continue (Z = 0)
Sell-out (Z = 1)
Dissolution (Z = 2)
Marginal eff ects
Marginal eff ects
Log odds
Marginal eff ects
Log odds
1 if the individual is a female (d)
0.007*** 20.009***20.079*** 0.002*** 0.046***[0.001] [0.001] [0.007] [0.000] [0.009]
Age of the individual 0.007*** 20.006***20.053*** 20.001*** 20.043***[0.000] [0.000] [0.002] [0.000] [0.002]
Squared age of the individual (divided by 1000)
20.096*** 0.075*** 0.706*** 0.021*** 0.603***[0.002] [0.002] [0.019] [0.001] [0.028]
1 if the individual is 65 or more years old(d)
0.002 20.005** 20.040** 0.002** 0.049*[0.002] [0.002] [0.017] [0.001] [0.028]
Years of experience as non-employed
0.005*** 20.008***20.065*** 0.002*** 0.051***[0.001] [0.001] [0.006] [0.000] [0.007]
Squared years of experience as non-employed (divided by 1000)
21.509*** 1.610*** 14.472*** 20.101*** 20.552[0.082] [0.074] [0.670] [0.037] [0.924]
Years of experience as a paid employee
0.013*** 20.011***20.103*** 20.002*** 20.055***[0.000] [0.000] [0.002] [0.000] [0.003]
Squared years of experience as a paid employee (divided by 1000)
20.387*** 0.344*** 3.167*** 0.043*** 1.489***[0.009] [0.008] [0.074] [0.004] [0.109]
Years of experience as an entrepreneur
0.009*** 20.008***20.074*** 20.001*** 20.027***[0.000] [0.000] [0.001] [0.000] [0.002]
Squared years of experience as an entrepreneur (divided by 1000)
20.164*** 0.144*** 1.326*** 0.020*** 0.675***[0.003] [0.002] [0.022] [0.002] [0.038]
1 if the individual has university education(d)
20.019*** 0.008*** 0.084*** 0.012*** 0.299***[0.001] [0.001] [0.009] [0.001] [0.013]
Logarithm of fi rm age (in years)
0.010*** 0.000 20.010** 20.011*** 20.262***[0.001] [0.000] [0.004] [0.000] [0.006]
Logarithm of the individual’s earnings per hour
0.032*** 0.010*** 0.040*** 20.042*** 21.035***[0.001] [0.000] [0.004] [0.000] [0.009]
1 if the individual has experience in two or more fi rms(d)
0.016*** 20.019***20.171*** 0.003*** 0.063***[0.002] [0.002] [0.014] [0.001] [0.018]
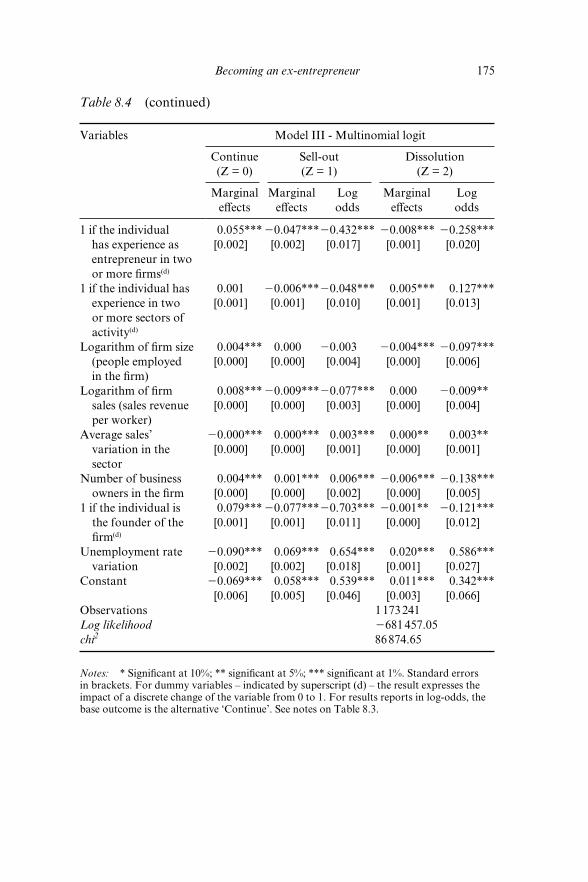
Becoming an ex-entrepreneur 175
Table 8.4 (continued)
Variables Model III - Multinomial logit
Continue (Z = 0)
Sell-out (Z = 1)
Dissolution (Z = 2)
Marginal eff ects
Marginal eff ects
Log odds
Marginal eff ects
Log odds
1 if the individual has experience as entrepreneur in two or more fi rms(d)
0.055*** 20.047***20.432*** 20.008*** 20.258***[0.002] [0.002] [0.017] [0.001] [0.020]
1 if the individual has experience in two or more sectors of activity(d)
0.001 20.006***20.048*** 0.005*** 0.127***[0.001] [0.001] [0.010] [0.001] [0.013]
Logarithm of fi rm size (people employed in the fi rm)
0.004*** 0.000 20.003 20.004*** 20.097***[0.000] [0.000] [0.004] [0.000] [0.006]
Logarithm of fi rm sales (sales revenue per worker)
0.008*** 20.009***20.077*** 0.000 20.009**[0.000] [0.000] [0.003] [0.000] [0.004]
Average sales’ variation in the sector
20.000*** 0.000*** 0.003*** 0.000** 0.003**[0.000] [0.000] [0.001] [0.000] [0.001]
Number of business owners in the fi rm
0.004*** 0.001*** 0.006*** 20.006*** 20.138***[0.000] [0.000] [0.002] [0.000] [0.005]
1 if the individual is the founder of the fi rm(d)
0.079*** 20.077***20.703*** 20.001** 20.121***[0.001] [0.001] [0.011] [0.000] [0.012]
Unemployment rate variation
20.090*** 0.069*** 0.654*** 0.020*** 0.586***[0.002] [0.002] [0.018] [0.001] [0.027]
Constant 20.069*** 0.058*** 0.539*** 0.011*** 0.342***[0.006] [0.005] [0.046] [0.003] [0.066]
Observations 1 173 241Log likelihood 2681 457.05chi2 86 874.65
Notes: * Signifi cant at 10%; ** signifi cant at 5%; *** signifi cant at 1%. Standard errors in brackets. For dummy variables – indicated by superscript (d) – the result expresses the impact of a discrete change of the variable from 0 to 1. For results reports in log-odds, the base outcome is the alternative ‘Continue’. See notes on Table 8.3.
176 Entrepreneurship and growth
Individuals at retirement age (65, or more, years old) have a lower likeli-hood of exit and selling their fi rms rather than entrepreneurs younger than 65 years old. The opposite eff ect happens for dissolutions; that is, the probability of people at retirement age exiting through dissolution is higher than for sell-out. Retirement age does not impact signifi cantly on the probability of continuing rather than exiting entrepreneurship.
Regarding human capital and experience, it is possible to observe that having a university education increases the likelihood of entrepreneurs exiting businesses, whether through selling or closing the fi rm. Results for previous occupational experience show that for non-employment, there are diff erent impacts across modes of exit. The more years that entrepre-neurs have experienced non-employment the lower the probability of exiting through sell-out, with the probability of closing or continuing being increased by the number of previous spells out of the private labour market. Both previous experiences as an entrepreneur or as a paid employee seem to deter the marginal probability of exit, whether selling or closing the fi rm.
Results report diff erences between the signs of the marginal probabilities for entrepreneurs’ previous experience across diff erent fi rms (regardless of their occupation within those fi rms) and across diff erent economic sectors. Evidence shows that these two types of experience impact negatively on exit through sell-out and positively on exit through fi rm dissolution; that is, entrepreneurs are likely to choose to continue or close their business and exit, rather than sell and exit. However, when considering the specifi c case of experience in diff erent fi rms as an entrepreneur, there is a higher probability that individuals continue in entrepreneurship rather than exit indistinctly through sell-out or dissolution.
Individuals with higher earnings per hour are more likely to continue as entrepreneurs and if they decide to exit, higher earnings will be associated with a higher marginal probability of exiting through sell-out rather than through dissolution.
Variables controlling for fi rm-level characteristics report that the older the fi rm, the lower the probability of exiting and selling compared to the probability of continuing as an entrepreneur. The same reasoning applies for exit and closing compared to continuing. Additionally, while increas-ing the number of employees reduces the marginal probability of exiting through dissolution, fi rm size is not signifi cant for the sell-out alternative. Each additional entrepreneur owning a share of the fi rm will margin-ally increase the probability of entrepreneurial exit through selling (or continuing) and decrease the probability of exiting and closing for all the entrepreneurial team.
Results on our proxy for fi rm productivity (sales revenue) show that, as expected, higher sales revenue per worker will impact positively on the
Becoming an ex-entrepreneur 177
entrepreneur’s decision to continue in business rather than to sell or close the fi rm and abandon entrepreneurship. Entrepreneurs’ decisions to con-tinue in business are strongly and positively associated with the fact they have started the business instead of having acquired it.
Unemployment rate variation is used as a proxy for the macroeconomic cycle, and evidence suggests that in contexts of high unemployment, indi-viduals’ probability of exiting entrepreneurship is signifi cant and high, particularly for sell-outs.
DISCUSSION AND CONCLUDING REMARKS
Results from estimations on the two diff erent modes of entrepreneurial exit – sell-out and dissolution – provide support for the initial claim that heterogeneity exists across forms of exit, involving individual and fi rm-level characteristics (H1). In eff ect, some of the factors associated with entrepreneurial exit through sell-out contrast with the characteristics that make individuals more likely to exit entrepreneurship through fi rm disso-lution. Some of those factors are related to demographic variables such as gender, entrepreneur’s age of retirement, earnings, professional experience and composition of the entrepreneurial team. The fact that females are less likely to sell than to exit may help in explaining the lower incidence of female entrepreneurship in the Portuguese context where, to a great extent, entrepreneurial activity results from businesses acquisition rather than start-up. Retirement age is negatively associated with exit in general. It might be that the positive eff ect of age found in the literature regarding entrepreneurial entry (Van Praag and Van Ophem, 1995) and learning processes allowing older people to build better networks for creating and exploiting opportunities (Calvo and Wellisz, 1980) may also hold for individuals’ persistence in entrepreneurship. However, the results are not conclusive regarding the reasons underlying the positive eff ect of retire-ment age on fi rm dissolution contrasting with a negative eff ect for sell-out. Entrepreneurs’ earnings also appear to be a relevant variable associated with heterogeneity between modes of exit. In fact, results for earnings are in line with the descriptive statistics presented in Table 8.2 and the higher an individual’s earnings, the higher the probability of continuing in entre-preneurship. Nevertheless, if exiting, they are likely to sell out rather than dissolve the business.
Results on the number of business owners within the same fi rm impact negatively on exit in general and diff er between sell-out (positive eff ect) and dissolution (negative eff ect). This suggests that having partial ownership of a fi rm implies a shared responsibility and strategic decision-making.
178 Entrepreneurship and growth
Thus, for instance, if the fi rm fails to continue in the market it does not necessarily jeopardize each of the owners’ continuance in the occupation of entrepreneur (e.g. they can immediately start or acquire a diff erent fi rm). Furthermore, diff erent impacts of this variable among modes of exit might be explained by the fact that if one business owner decides to exit entrepreneurship, it does not necessarily imply that all the remaining partners will do so and dissolve the business.
The data reveal diff erent categories of exit that fi t our proposed typol-ogy in the following way: 27 per cent of dissolutions with low performance (‘entrepreneurial failure’); 3 per cent of dissolutions with high perform-ance (‘divestment choice’); 48 per cent of sell-outs with low performance (‘managerial turnover’) and 22 per cent of sell-outs with high perform-ance (‘planned exit strategy’). The high proportion of sell-outs and, in particular, the fact that a majority of fi rm sell-outs are of low-performing fi rms, deserves further discussion. Results show that being the founder of the fi rm impacts negatively on the decision to leave the fi rm and exit entrepreneurship, which suggests that founders may be more intrinsically involved with their venture and possess relevant knowledge about the specifi cities of the business and the market where they operate. This may represent an important asset facilitating entrepreneurial persistence. In a context of high fi rm turbulence (entries and exits from the market) such as the Portuguese one, the relative scarcity of starters implies that high turbulence happens also at the occupational mobility level into, and out of, entrepreneurship.
The high proportion of individuals who become entrepreneurs through acquisition is a distinguishing characteristic of the Portuguese economy; that is, one with high rates of business ownership but with relatively low start-up rates (Baptista and Thurik, 2007; Baptista et al., 2008), and is probably associated with high start-up costs and bureaucracy. However, the proportion of sell-outs of low-performance fi rms indicates that entre-preneurs have signifi cantly diff erent preferences and performance thresh-olds with regard to the businesses they wish to own. The study of the determinants of these performance thresholds is therefore an important avenue of research for future exploration.
Drawing on the literature, H2 proposes that years of experience as an entrepreneur or paid employee (unemployed) is positively (negatively) associated with exit through sell-out. The results partially support this hypothesis since a negative eff ect on sell-out was found for individuals with non-employment experiences. The eff ect is also negative for years of experience in the two remaining occupations, namely paid employment and entrepreneurship. When considering dummy variables for assessing experience in diff erent fi rms, in diff erent fi rms as an entrepreneur or in

Becoming an ex-entrepreneur 179
diff erent economic sectors, the eff ect still negatively infl uences the likeli-hood of exit through sell-out.
Results confi rm that exit through dissolution (sell-out) is negatively (positively) associated with fi rms’ age (H3). The eff ect of fi rm age on entre-preneurial exit is, in general, negative. Moreover, it is possible to observe that the infl uence of fi rm age is signifi cantly stronger for dissolution rather than for sell-out. Multinomial estimations validate the proposition that exit through dissolution is negatively associated with fi rms’ sales revenue (H4), although the positive infl uence of sales revenue over the decision to exit through sell-out is not confi rmed. Sales revenue per worker seems to have a general negative infl uence on entrepreneurial exit, regardless of the mode of that exit. Although the fact that exit through dissolution (sell-out) does not necessarily associate with fi rms’ negative (positive) economic performance (H4) can be derived intuitively from the descriptive statis-tics, additional empirical research should focus on the diff erent modes of exit proposed in this chapter, namely ‘entrepreneurial failure’, ‘divest-ment choice’, ‘managerial turnover’ and ‘planned exit strategy’. Hence, further research work drawing on this exploratory study should seek to answer the specifi c question of how fi rms’ observed threshold of perform-ance in the market infl uences individuals’ decisions to sell-out or close the business. One possible methodological approach may be to model simultaneously fi rm performance (measured as fi rm sales revenue above or below the sector average) and individuals’ decision to exit entrepre-neurship through sell-out or dissolution. This methodological choice has to do with the fact that the relation between entrepreneurial exit and fi rm performance cannot be studied using a single logit equation framework as the entrepreneur’s decision to exit may not be independent of the fi rm’s observable performance. In such a framework, it is admitted there is a possibility that the disturbances in the fi rm performance equation are cor-related with those in the exit decision equation, and therefore assume the existence of unobservable characteristics that aff ect the decisions under study. Finally, the use of discrete choice duration models with ‘frailty’ may also be a suitable strategy to deal with transitions to diff erent occupations after entrepreneurial exit.
This study has provided an exploratory investigation of the modes and determinants of entrepreneurial exit using a large longitudinal dataset linking fi rms and individuals. More specifi cally, the analysis examines the characteristics and backgrounds of individuals who exit entrepreneurship towards non-employment or paid-employment. Determinants of entre-preneurial exit are examined in the framework of an occupational choice model using a wide array of variables, including individuals’ demograph-ics, general human capital (formal education), specifi c human capital
180 Entrepreneurship and growth
(labour market and entrepreneurial experience), fi rm-level characteristics and macroeconomic context. This investigation also proposes and tests a typology consisting of four diff erent modes of exit: ‘entrepreneurial failure’, ‘divestment choice’, ‘managerial turnover’ and ‘planned exit strat-egy’. Several hypotheses based on the literature were explored, unveiling new evidence for entrepreneurial dynamics in the Portuguese context, as well as for the advance of research in the fi eld of entrepreneurial dynamics.
NOTES
1. We consider that, among these four typologies, only entrepreneurial failure is associated with involuntary exit. For the purpose of this study, the remaining forms of exit are deemed voluntary.
2. In the present study the concept of fi rm dissolution is adopted for the cases when the fi rm ceases to exist when the entrepreneur leaves; as opposed to sell-out, when the fi rm continues operating in the market after the entrepreneur leaves, being run by someone else. However, as the literature often uses diverse terms such as fi rm exit, liquidation, dis-solution, discontinuance or closure, they are hereafter used interchangeably.
3. We forward-track fi rms’ lifecycle after the entrepreneur exits and only those fi rms that remain out of the data set in the following three years after entrepreneurial exit are deemed not to have survived. Additionally, we estimate a proxy for merger accounting for dissolutions, by looking at the extent to which a sizeable part of the workforce of each fi rm moves to a diff erent one in the QP database. We reach the conclusion that less than 1 per cent of the total number of dissolutions is due to merger within the Portuguese private sector, which suggests that an inability to track mergers is not likely to impact signifi cantly on results.
4. In this study, ‘non-employed’ is defi ned as individuals who are disengaged from any fi rm (i.e. exit the database) for two or more years, either because they are unemployed or because they exited the job market.
5. In the context of the present study, ‘switching directly’ refers to the cases where entre-preneurs leave their fi rms to re-enter entrepreneurship in another fi rm immediately in the next year.
6. We acknowledge the fact that these entrepreneurs – known in the literature as serial entrepreneurs (Westhead and Wright, 1998) – despite not changing their occupation, have to face a sell or liquidate decision. However, since they change fi rm but do not leave entrepreneurship, we treat them as part of the counterfactual group in our empirical analysis.
7. The choice of exploring performance as an economic outcome was contingent on the information available in our data set (data do not provide information on owners’ perceptions). However, despite its signifi cance for entrepreneurship research, subjective measures of success (overlooking economic indicators) may be associated with a sort of ‘choice-supportive bias’, where after exit entrepreneurs have the tendency to remember their choices as better than they actually were and overestimate fi rm performance. In fact, the literature provides evidence that entrepreneurs may suff er from unrealistic opti-mism in anticipating high entrepreneurial performance in the start-up process (Cooper et al., 1988; De Meza and Southey, 1996) or during the development process (Lowe and Ziedonis, 2006). Overoptimism can also be viewed as one possible explanation for the high rate of new business failures (Camerer and Lovallo, 1999).
8. In order to calculate the unemployment rate variation, we employ the formula

Becoming an ex-entrepreneur 181
(UNt – UNt–1) / UNt–1, where UN refers to the unemployment rate at year t, or at the previous year t - 1.
9. Multinomial logit estimation imposes the Independence of Irrelevant Alternative (IIA) assumption. This assumption requires that for any two alternatives, the ratio of their choice probabilities is independent of the specifi cation of any alternative in the choice set (i.e. any combination of continue, sell-out and dissolution). Specifi c tests were used in order to account for the IIA. Specifi cally, the Hausman and McFadden (1984) test and the Small and Hsiao (1985) test were computed, providing positive support for IIA, therefore validating the use of a multinomial model (see Long and Freese, 2005 for operational issues).
REFERENCES
Argyres, N. (1996), ‘Capabilities, technological diversifi cation, and divisionaliza-tion’, Strategic Management Journal, 17, 395–410.
Baptista, R. and A.R. Thurik (2007), ‘The relationship between entrepreneurship and unemployment: is Portugal an outlier?’, Technological Forecasting and Social Change, 74 (1), 75–89.
Baptista, R., V. Escária and P. Madruga (2008), ‘Entrepreneurship, regional development and job creation: the case of Portugal’, Small Business Economics, 30 (1), 49–58.
Bates, T. (1999), ‘Exiting self-employment: an analysis of Asian immigrant-owned small businesses’, Small Business Economics, 13 (3), 171–83.
Bates, T. (2005), ‘Analysis of young, small fi rms that have closed: delineating successful from unsuccessful closures’, Journal of Business Venturing, 20 (3), 343–58.
Bowman, E.H. and H. Singh (1993), ‘Corporate restructuring: reconfi guring the fi rm’, Strategic Management Journal, 14, 5–14.
Burgelman, R. (1994), ‘Fading memories: a process theory of strategic business exit in dynamic environments’, Administrative Science Quarterly, 39, 24–56.
Calvo, G.A. and S. Wellisz (1980), ‘Technology, entrepreneurs and fi rm size’, Quarterly Journal of Economics, 95 (4), 663–77.
Camerer, C.F. and D. Lovallo (1999), ‘Overconfi dence and excess entry: an experi-mental approach’, American Economic Review, 89 (1), 306–18.
Carroll, G.R. and M.T. Hannan (2000), The Demography of Corporations and Industries, Princeton, NJ: Princeton University Press.
Caves, R.E. (1998), ‘Industrial organization and new fi ndings on the turnover and mobility of fi rms’, Journal of Economic Literature, XXXVI, 1947–82.
Chopra, A. (2005), ‘Survival’, paper presented at the Academy of Management Meeting, Hawaii, 5–8 August.
Chrisman, J.J. and W.E. McMullan (2000), ‘A preliminary assessment of outsider assistance as a knowledge resource: the longer-term impact of new venture coun-selling’, Entrepreneurship Theory and Practice, 24 (3), 37–54.
Clark, G.L. and N. Wrigley (1997), ‘Exit, the fi rm and sunk costs: reconceptual-izing the corporate geography of disinvestment and plant closure’, Progress in Human Geography, 21 (3), 338–58.
Cooper, A.C., C.J. Woo and W.C. Dunkelberg (1988), ‘Entrepreneurs’ perceived chances for success’, Journal of Business Venturing, 2, 97–108.
182 Entrepreneurship and growth
De Meza, D. and C. Southey (1996), ‘The borrower’s curse: optimism, fi nance and entrepreneurship’, Economic Journal, 106 (435), 375–86.
Flores-Romero, M. and R. Blackburn (2006), ‘Is entrepreneurship more about sticking with a fi rm, or about running several of them? Evidence from novice and serial entrepreneurs’, paper presented at the Workshop on Firm Exit and Serial Entrepreneurship, Max Planck Institute of Economics, Jena, 4 January.
Gimeno, J., T.B. Folta, A.C. Cooper and C.Y. Woo (1997), ‘Survival of the fi ttest? Entrepreneurial human capital and the persistence of underperforming fi rms’, Administrative Science Quarterly, 42 (4), 750–83.
Hausman, J. and D. McFadden (1984), ‘Specifi cation tests for the multinomial logit model’, Econometrica, 52 (5), 1219–40.
Headd, B. (2003), ‘Redefi ning business success: distinguishing between closure and failure’, Small Business Economics, 21, 51–61.
Holmes, T.J. and J.A. Schmitz Jr (1995), ‘On the turnover of business fi rms and business managers’, Journal of Political Economy, 103 (5), 1005–38.
Holmes, T.J. and J.A. Schmitz Jr (1996), ‘Managerial tenure, business age, and small business turnover’, Journal of Labor Economics, 14, 79–99.
Long, J.S. and J. Freese (2005), Regression Models for Categorical Outcomes Using Stata, 2nd edn, College Station, TX: Stata Press.
Lowe, R.A. and A.A Ziedonis (2006), ‘Overoptimism and the performance of entrepreneurial fi rms’, Management Science, 52 (2), 173–86.
McGrath, R.G. (1999), ‘Falling forward: real options reasoning and entrepre-neurial failure’, Academy of Management Review, 24 (1), 13–30.
McGrath, R.G. and I. Macmillan (2000), The Entrepreneurial Mindset, Boston, MA: Harvard Business School Press.
Mata, J. and P. Portugal (1994), ‘Life duration of new fi rms’, Journal of Industrial Economics, 42, 227–46.
Mitchell, W. (1994), ‘The dynamics of evolving markets: the eff ects of business sales and age on dissolutions and divestitures’, Administrative Science Quarterly, 39 (4), 575–602.
Parker, S. (2004), The Economics of Self-employment and Entrepreneurship, Cambridge: Cambridge University Press.
Santarelli, E. and M. Vivarelli (2006), ‘Entrepreneurship and the process of fi rms’ entry, Survival and Growth’, IZA Discussion Paper No. 2475, December.
Schary, M.A. (1991), ‘The probability of exit’, RAND Journal of Economics, 22 (3), 339–53.
Shane, S. (2000), ‘Prior knowledge and the discovery of entrepreneurial opportuni-ties’, Organization Science, 11, 448–69.
Small, K.A. and C. Hsiao (1985), ‘Multinomial logit specifi cation tests’, International Economic Review, 26, 619–27.
Taylor, M.P. (1999), ‘Survival of the fi ttest? An analysis of self-employment dura-tions in Britain’, Economic Journal, 109 (454), C140–C155.
Van Praag, C.M. (2003), ‘Business survival and success of young small business owners’, Small Business Economics, 21, 1–17.
Van Praag, C.M. and H. Van Ophem (1995), ‘Determinants of willingness and opportunity to start as an entrepreneur’, Kyklos, 48 (4), 513–40.
Watson, J. and J. Everett (1993), ‘Defi ning small business failure’, International Small Business Journal, 11 (3), 35–48.
Watson, J. and J. Everett (1996), ‘Do small businesses have high failure rates?’, Journal of Small Business Management, 34 (4), 45–62.

Becoming an ex-entrepreneur 183
Wennberg, K. and J. Wiklund (2006), ‘Entrepreneurial exit’, paper presented at the Academy of Management Meeting, Atlanta, 11–16 August.
Westhead, P. and M. Wright (1998), ‘Novice, portfolio, and serial founders: are they diff erent?’, Journal of Business Venturing, 13 (3), 173–204.
184
9. The entrepreneur in ‘risk society’: the personal consequences of business failureColin Mason, Sara Carter and Stephen Tagg
INTRODUCTION
Ulrich Beck is one of a number of theorists to have argued that advanced societies are experiencing a structural break with the past that is producing a new kind of capitalism, a new kind of labour, a new kind of social order and a new kind of society (Beck, 2003). However, Beck’s distinctive per-spective is to argue that, as a consequence of these discontinuities, risk has become a pervasive and integral part of the modern condition, permeating through social life. His risk society perspective has been applied in a variety of contexts but most notably in terms of employment. Indeed, Beck (2000) ‘singles out labour market change as a decisive factor in the development of uncertain and insecure forms of lived experience’ (Mythen, 2005, p. 130). Work has become de-standardized. Firms have sought to become more fl exible in how they use their employees so as to more closely match their labour needs with demand cycles and more generally to reduce their costs. This has involved a shift from a system of full-time employment to non-standard labour, including greater use of part-time, temporary and contract labour, greater utilization of sub-contracting to independ-ent businesses and the growth of project work involving freelance labour (Ekinsmyth, 2002). Jobs are based on less secure, individualized employ-ment contracts and organizations have become more fragmented. This has provided fl exibility for employers but created a ‘risk fraught system of employment’ (Reimer, 1998) for the employee. Workers face new sets of uncertainties that in turn have fashioned a ‘new form of individualism’ in which they are forced to fall back on their own resources to navigate their own individual paths through life, with all its hazards and inher-ent insecurities (Beck, 1992; Allen and Henry, 1997; Ekinsmyth, 1999, 2002). Moreover employment risk and uncertainties have permeated more
The entrepreneur in ‘risk society’ 185
deeply into the workforce, impacting on a wider section of society than in previous eras of restructuring (Mythen, 2005).
The consequences of this growth of ‘de-standardized labour’ are both ambivalent and contradictory. On the one hand they have transferred risk from employer to worker, creating greater insecurity for individuals. Accompanying this greater uncertainty is a new form of individualism that has forced workers to accept a higher level of personal responsibility for their individual destinies (e.g. upgrading skills, pension provision), to be pro-active in seeking opportunities (whether career or business) and to place increased reliance on private experts for health, pension, legal and accountancy needs. On the other hand, these changes provide certain freedoms from old regimes and structures of work, fl exibility (e.g. in terms of hours worked) and choice (e.g. to ‘be one’s own boss’), but at the risk of increased self-exploitation. The risks and the benefi ts in this new condition are diff erentiated by such factors as social class and gender, creating new opportunities for those with tradable skills and knowledge. For some people, the benefi ts therefore outweigh the risks (Reimer, 1998; Ekinsmyth, 1999, 2002).
Our focus in this chapter is on the position of the small business owner in risk society, a group that has been largely ignored in the literature on economic uncertainty and insecurity. There are a variety of ways in which risk in a small business context can be defi ned and measured. Because of the nature of the data available to us, we equate risk with the personal fi nancial consequences for the small business owner of the failure of their business. The chapter addresses two questions. First, what proportion of small business owners are highly exposed to personal fi nancial risk? Second, how is this risk distributed across diff erent types of small business owners?
SMALL BUSINESS OWNERSHIP AND RISK
Risk is fundamental to entrepreneurship. Indeed, one infl uential view of the entrepreneur is ‘someone who is prepared to undertake risk in an uncertain world’ in return for the prospect of reward (Deakins and Freel, 2006, p. 6). However, risk is a multi-faceted concept. There are gambling-type risks where there is no control over the outcome. There are also insurable risks, where potential losses can be protected on the basis of actuarial calculations of the statistical probability of specifi c outcomes. ‘Entrepreneurial risk’, in contrast, arises from uncertainty that, in turn, stems from imperfect information. An entrepreneur is someone who is able to manage this uncertainty-related risk in a way that gets the odds in
186 Entrepreneurship and growth
their favour. But clearly, by no means all small business owners are able to successfully manage risk. So, what is the risk that a small business will fail?
Various defi nitional and measurement problems are encountered in attempting to answer this question. First, in terms of defi nitions, busi-nesses that cease trading (often termed business dissolutions or exits) do so for a variety of reasons. Many do so for voluntary reasons. The business may be sold and its activities absorbed into the acquirer’s operations, so its separate legal identity is lost. The retirement of the owner is another reason for voluntary closure. The owner may take up a better opportunity as an employee. One study of closures reported that 29 per cent of owners considered that their fi rm was successful at the time of closure (Headd, 2003). At the other extreme are businesses that fail. These businesses typi-cally leave customers unpaid and may result in the personal bankruptcy of the owner, especially if they are self-employed or in a partnership, if creditors pursue their debts through the courts by claiming the owner’s personal assets. In the case of limited companies, the inability to pay credi-tors can lead to insolvency, then receivership, with a receiver appointed to dispose of the assets with their value going to the creditors. This is also likely to lead to personal fi nancial loss on the part of the entrepreneur, and even personal bankruptcy, if they have invested a signifi cant proportion of their own wealth in the business or have given personal guarantees to their bank or landlord. However, some businesses are closed voluntarily by their owners in the knowledge that they are fi nancially unsuccessful and to avoid further losses. Such businesses are unlikely to get to the point where they are put into receivership and the owners face personal bankruptcy. These business owners who have ‘failed to make a go of it’ confuse the apparent sharp distinction between voluntary closures and failed businesses.
Measuring business failure is also fraught with diffi culty. First, it is clear from the preceding discussion that business closure is not the same as business failure – even though many commentators fail to make this critical distinction. Second, some statistics (including the UK’s VAT database) classify a change of ownership of an existing business as an exit and entry (Johnson and Conway, 1997). Third, offi cial statistics on bankruptcy, receiverships and liquidations underestimate the extent of business failures, as by no means all failing businesses will end up in any of these categories. However, the consensus view is that only a small proportion of fi rms that cease to trade represent fi nancial failures. In the USA, failures account for less than 10 per cent of all closures. To put it another way, eight times as many fi rms stop operations voluntarily than fail (Phillips, 1993). The same point is made by Watson and Everett
The entrepreneur in ‘risk society’ 187
(1996) in a study of Australian retailers: the ten-year rate of business dis-continuance was 64.2 per cent, whereas the equivalent rate for bankruptcy was just 5.3 per cent.
SMALL BUSINESS AND FAILURE
The literature on business failure is surprisingly limited, especially in com-parison with the attention that has been given to business start-up. Four strands can be recognized. The fi rst, and largest, strand comprises studies of the types of businesses most at risk of failure. This is fairly consistent in highlighting a strong link between failure and the age of the business. For example, Cressy (2006) notes that failure rates rise steeply after start-up to peak at 18–24 months, and then fall gradually with increased longev-ity. There are also strong links between failure and the size of the business (larger businesses being less at risk of failure) and past growth (businesses that have been growing are less at risk of failure) (Storey, 1994). Some studies also identify sectoral eff ects (higher failure in retailing) and own-ership eff ects (higher failure among sole proprietors and partnerships) (Carter and Van Auken, 2006). It is argued that technology fi rms are less likely to fail because even failing fi rms are likely to have assets (e.g. intel-lectual property) that are attractive to a trade buyer (Bruno et al., 1992). There is also a debate about whether franchisees are at a lower risk of failure (Stanworth and Purdy, 2006).
A second, and much smaller, strand focuses on links between failure and owner characteristics. It might be expected that various dimensions of the business owner’s human capital (e.g. education, prior management experience, nature of prior work experience, prior experience as a busi-ness owner, etc.) would infl uence the probability of business survival and failure. However, research has failed to identify any strong links (e.g. see Van Praag, 2003). Hayward et al.’s (2006) hubris theory of entrepreneur-ship links overconfi dence of the entrepreneur, a cognitive attribute, to failure.
A third strand of literature looks at the reasons why businesses fail. These studies are of two types. The fi rst type are quantitative studies, based on company accounts, which have sought to identify failures based on fi nancial ratios and thereby develop predictive models (e.g. Storey et al., 1987; Pompa and Bilderbeek, 2005). The second type comprises qualitative studies that have sought to attribute the causes of business failure (e.g. Berryman, 1983). These studies typically focus on the percep-tions of the owner-manager, but some have extended this perspective by comparing the views of the owner-manager with those of other actors,
188 Entrepreneurship and growth
such as the offi cial receiver (Hall and Young, 1991; Hall, 1992, 1995), and venture capital investors (Zacharakis et al., 1999). However, as Fredland and Morris (1976, p. 8) note, ‘pinpointing the causes of failure is largely a matter of defi nition’. It is very easy to attribute the causes of business failure to ‘poor management’ (Berryman, 1983). ‘The causes of failure may always be said to be poor management. No matter what disaster befalls a fi rm in the marketplace, suffi cient management foresight could by defi nition have avoided it’ (Fredland and Morris, 1976, p. 8). Equally, ‘the cause of failure may always be said to be lack of funds, for if the fi rm had suffi cient funds to pay its obligations there would be no losses to creditors’ (Fredland and Morris, 1976, p. 8). Nevertheless, there is con-siderable evidence from these studies that failure is largely attributable to weaknesses in operational management and under-capitalization. Carter and Van Auken (2006) also noted that bankrupt fi rms were more likely to exhibit cash fl ow and fi nancing problems than surviving fi rms. Perry (2001) observes that failed fi rms do less planning (in the form of producing written documents) than similar surviving fi rms.
However, it is likely to be an over-simplifi cation to attribute failure to a single cause. Burns (2007, p. 329) suggests that ‘it is a coincidence of a number of factors that is likely to lead to failure’. He identifi es four main ingredients of business failure:
Entrepreneurial character: negative characteristics of the entrepre- ●
neur (e.g. delusional optimism and self-confi dence).Business decisions: this includes decisions made with a lack of infor- ●
mation or unwillingness to understand the information available, limited management team, lack of delegation and ‘betting the ranch’ decisions.Company weaknesses: which may refl ect bad management decisions ●
in the past, such as poor fi nancial control and over-dependence on a small number of customers.The external environment: macroeconomic changes (e.g. demand, ●
interest rates) and ‘Acts of God’ (e.g. illness, strikes, fi re).
These factors interact. Some may be latent in a small business but only become signifi cant when there is a trigger event, often linked to an outside factor, and may lead to further bad decisions being made.
The fi nal strand in the research literature comprises a handful of studies that have explored the impact of failure on the entrepreneur. Brockhaus (1985) looks at how failure aff ects owner-managers and their ability to resume life. Shepherd and Wiklund (2005) suggest that failed entrepre-neurs go through a grieving process. Ronstadt (1985) and Stokes and
The entrepreneur in ‘risk society’ 189
Blackburn (2001) have explored what happens to business owners after the failure. An emerging theme is that failure can be a learning experience for business owners (Cope, 2005).
This chapter takes a distinctive perspective on small business failure that cuts across these four strands. Its focus is on a subset of business failures, namely those that would have a profound negative fi nancial impact on the entrepreneur and their households. It links with the literature on the impact of business failure by exploring eff ects of business failure – or, strictly speaking, the prospect of business failure – on the entrepreneur’s personal fi nances and lifestyle. However, it also links with the fi rst and second strands by considering which characteristics of the businesses and owner-managers are associated with those failures that have a severe negative impact on the owner’s personal fi nancial position.
METHODOLOGY
Data for this study were drawn from a large-scale biennial survey of small business attitudes and opinions undertaken on behalf of the Federation of Small Businesses (FSB), a voluntary membership association of independ-ent business owners in the UK. The sampling frame consisted of the FSB membership list. Questionnaires designed to elicit small business attitudes and opinions on a wide range of contemporary issues were distributed to 169 418 FSB members in September 2005 (Carter et al., 2006). By the November 2005 cut-off date, 18 939 responses were received, a usable response rate of 11.17 per cent. Cost restrictions prevented follow-up mailings to boost response rates, and data protection restrictions on the mailing list prevented the research team from identifying and contact-ing non-respondents in order to investigate response bias. Without the option of conventional non-response bias tests, a comparison of early and late responses was used to test response bias. No signifi cant diff erences were found between early and late responses across any of the variables typically used to describe the owners and the fi rms (age of owner, business entry mode, age of business, sales volume and VAT registration). An anal-ysis of respondents with regard to their sectoral and regional distribution suggested a sample with close similarities to that of the total population of UK VAT registered SMEs (Offi ce for National Statistics, 2005; Small Business Service, 2005)
The dependent variable was a self-assessed measure of the consequence of business insolvency using a nominal scale. There were four alternative response categories relating to the consequences of insolvency off ered within the questionnaire:

190 Entrepreneurship and growth
‘My standard of living would be unaff ected’;1. ‘I would have to scale down my lifestyle’;2. ‘My basic survival and home would be under threat’; and3. ‘I would lose everything, become bankrupt’.4.
Responses to this question were received from 18 332 respondents; 607 (3.2 per cent) respondents failed to complete this question and were excluded from the analysis.
The research questions required both univariate and multivariate analysis. As an exploratory study, the initial analysis comprised cross-tabulations of the dependent variable against a selection of measures in order to provide a broad indication of patterns. Following this, multino-mial logistic regression was undertaken to explore the possibility of pre-dicting respondents’ levels of fi nancial risk as a consequence of business insolvency. Given the generalist nature of the FSB survey and the resulting wide range of topics covered, the choice of independent variables was con-strained by the nature of the questions asked. Nevertheless, information was available on a wide range of business and owner characteristics that have been used in previous studies of fi rm failure.
PROFILE OF RESPONDENTS
The respondents can be profi led in terms of both their business charac-teristics and the characteristics of their owner-managers (see Carter et al., 2006 for further details). In terms of business characteristics, respondents were concentrated in just four industry sectors: retail, wholesale and motor trades (25 per cent), business services (18 per cent), construction (12 per cent) and manufacturing (11 per cent). The majority were small. In terms of turnover, 42 per cent had sales of £100,000 or less and 80 per cent had sales of £500,000 or less. Measured by number of employees, 42 per cent had fewer than fi ve workers and 66 per cent fewer than ten employees (including owners). Just over three-quarters were registered for VAT. Just over half (54 per cent) had increased sales in the previous year and 59 per cent were seeking to grow over the next two years, with 10 per cent seeking to grow rapidly.
Turning to the characteristics of the owners, there was a wide spread in terms of their age, with just 7 per cent under 35 years old, 55 per cent between 35 and 54 years old, 31 per cent in the 55–64 age band and 7 per cent were aged 65 years and over. This diversity was also refl ected in the length of time that the present owner had owned the business, ranging from less than three years (24 per cent) to over 20 years (19
The entrepreneur in ‘risk society’ 191
per cent). In 38 per cent of cases the business was co-owned with other family members, but in only 26 per cent of cases did family members, typically the spouse, play a management role. However, male ownership dominated: males were the exclusive or majority owners of 53 per cent of businesses; 33 per cent of businesses had equal male–female owner-ship, and only 14 per cent had female majority or exclusive ownership. In terms of their education 28 per cent of business owners had a degree and 26 per cent had non-degree professional qualifi cations. Only 13 per cent had no qualifi cations. A remarkably high proportion of respond-ents were habitual entrepreneurs: 46 per cent had owned one or more businesses previously (serial entrepreneurs) and 26 per cent currently owned another business (portfolio entrepreneurs). The vast majority of the respondents worked full-time in the business: only 7 per cent worked less than 30 hours and 6 per cent worked 30–40 hours. For two-thirds of the respondents this business was their only source of income; for 80 per cent of respondents their only income came from this and their other businesses.
RESULTS
Exposure to Financial Risk as a Consequence of Business Insolvency
The fi rst research question concerned identifying the proportion of small business owners who believe that they are highly exposed to fi nancial risk if their business becomes insolvent. This question is most simply answered by an analysis of the responses to the basic survey question: What would be the personal consequences of the business becoming insolvent? Only a minority (11 per cent) of business owners reported that their standard of living would be unaff ected by insolvency and a further 44 per cent of respondents, the largest proportion, reported that, following insolvency, they would have to scale down their lifestyle. The remaining respondents reported more severe consequences of insolvency. Just over one-third (34 per cent) reported that their basic survival and home would be under threat and a further 11 per cent reported that they would lose everything and become bankrupt (Table 9.1).
These results demonstrate that the consequences of business insol-vency vary quite markedly. At the extremes, roughly 10 per cent of busi-ness owners would be unaff ected and 10 per cent risk losing everything. However, for the majority of business owners, the consequences of insol-vency lie somewhere between a more restrained lifestyle and more severe eff ects.
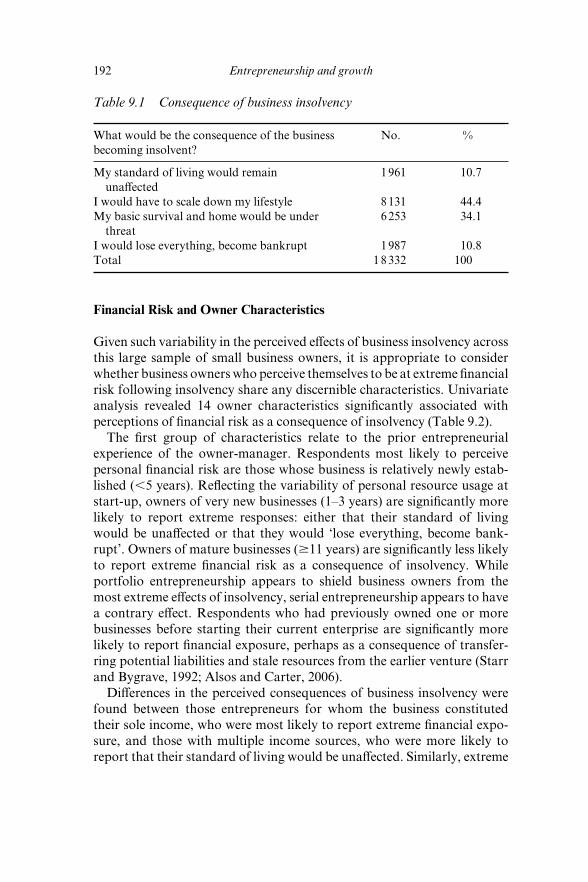
192 Entrepreneurship and growth
Financial Risk and Owner Characteristics
Given such variability in the perceived eff ects of business insolvency across this large sample of small business owners, it is appropriate to consider whether business owners who perceive themselves to be at extreme fi nancial risk following insolvency share any discernible characteristics. Univariate analysis revealed 14 owner characteristics signifi cantly associated with perceptions of fi nancial risk as a consequence of insolvency (Table 9.2).
The fi rst group of characteristics relate to the prior entrepreneurial experience of the owner-manager. Respondents most likely to perceive personal fi nancial risk are those whose business is relatively newly estab-lished (,5 years). Refl ecting the variability of personal resource usage at start-up, owners of very new businesses (1–3 years) are signifi cantly more likely to report extreme responses: either that their standard of living would be unaff ected or that they would ‘lose everything, become bank-rupt’. Owners of mature businesses ($11 years) are signifi cantly less likely to report extreme fi nancial risk as a consequence of insolvency. While portfolio entrepreneurship appears to shield business owners from the most extreme eff ects of insolvency, serial entrepreneurship appears to have a contrary eff ect. Respondents who had previously owned one or more businesses before starting their current enterprise are signifi cantly more likely to report fi nancial exposure, perhaps as a consequence of transfer-ring potential liabilities and stale resources from the earlier venture (Starr and Bygrave, 1992; Alsos and Carter, 2006).
Diff erences in the perceived consequences of business insolvency were found between those entrepreneurs for whom the business constituted their sole income, who were most likely to report extreme fi nancial expo-sure, and those with multiple income sources, who were more likely to report that their standard of living would be unaff ected. Similarly, extreme
Table 9.1 Consequence of business insolvency
What would be the consequence of the business becoming insolvent?
No. %
My standard of living would remain unaff ected
1 961 10.7
I would have to scale down my lifestyle 8 131 44.4My basic survival and home would be under threat
6 253 34.1
I would lose everything, become bankrupt 1 987 10.8Total 1 8 332 100
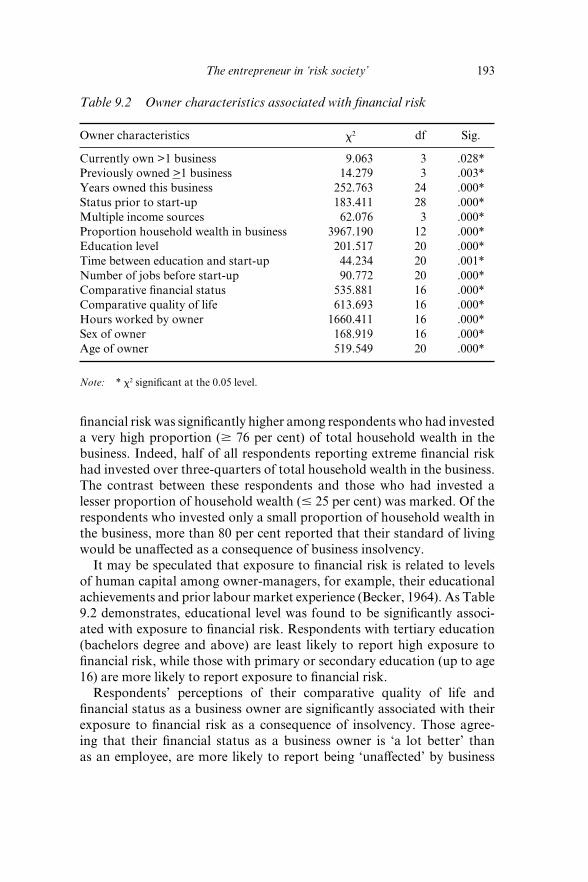
The entrepreneur in ‘risk society’ 193
fi nancial risk was signifi cantly higher among respondents who had invested a very high proportion ($ 76 per cent) of total household wealth in the business. Indeed, half of all respondents reporting extreme fi nancial risk had invested over three-quarters of total household wealth in the business. The contrast between these respondents and those who had invested a lesser proportion of household wealth (# 25 per cent) was marked. Of the respondents who invested only a small proportion of household wealth in the business, more than 80 per cent reported that their standard of living would be unaff ected as a consequence of business insolvency.
It may be speculated that exposure to fi nancial risk is related to levels of human capital among owner-managers, for example, their educational achievements and prior labour market experience (Becker, 1964). As Table 9.2 demonstrates, educational level was found to be signifi cantly associ-ated with exposure to fi nancial risk. Respondents with tertiary education (bachelors degree and above) are least likely to report high exposure to fi nancial risk, while those with primary or secondary education (up to age 16) are more likely to report exposure to fi nancial risk.
Respondents’ perceptions of their comparative quality of life and fi nancial status as a business owner are signifi cantly associated with their exposure to fi nancial risk as a consequence of insolvency. Those agree-ing that their fi nancial status as a business owner is ‘a lot better’ than as an employee, are more likely to report being ‘unaff ected’ by business
Table 9.2 Owner characteristics associated with fi nancial risk
Owner characteristics �2 df Sig.
Currently own >1 business 9.063 3 .028*Previously owned >1 business 14.279 3 .003*Years owned this business 252.763 24 .000*Status prior to start-up 183.411 28 .000*Multiple income sources 62.076 3 .000*Proportion household wealth in business 3967.190 12 .000*Education level 201.517 20 .000*Time between education and start-up 44.234 20 .001*Number of jobs before start-up 90.772 20 .000*Comparative fi nancial status 535.881 16 .000*Comparative quality of life 613.693 16 .000*Hours worked by owner 1660.411 16 .000*Sex of owner 168.919 16 .000*Age of owner 519.549 20 .000*
Note: * �2 signifi cant at the 0.05 level.
194 Entrepreneurship and growth
insolvency. In contrast, those who believe their fi nancial status to be ‘a lot worse’ as a business owner are twice as likely to be highly exposed to fi nan-cial risk. Similar results were seen with regard to respondents’ comparative quality of life as a business owner. Those who believe their quality of life to be ‘a lot better’ as a business owner are least exposed to personal fi nancial risk, while those for whom quality of life had deteriorated by becoming a business owner (‘a lot worse’) are signifi cantly more likely to be highly exposed to personal fi nancial risk in the event of insolvency.
Finally, three further owner characteristics (age, sex, hours worked) are signifi cantly associated with fi nancial risk. The age groups most likely to report extreme fi nancial exposure are the median age ranges (35–44 years and 45–54 years), while those in the older age groups (55–64 years and over 65 years) are more likely to be unaff ected by the consequences of business insolvency. Owners of businesses equally co-owned by men and women, usually matrimonial partnerships, are signifi cantly more likely to be fi nan-cially exposed, while the owners of businesses wholly owned by women are more likely to be unaff ected by business insolvency. As expected, business owners operating businesses on a part-time basis, or which occupied less than 30 hours per week of owners’ time, are more likely to report being unaff ected, while those running businesses that occupied more than 60 hours of owners’ time per week are the most likely to report fi nancial exposure to business insolvency.
Financial Risk and Firm-level Characteristics
Univariate analysis also identifi es 15 separate fi rm level characteristics that are signifi cantly associated with exposure to fi nancial risk following business insolvency (Table 9.3). Respondents owning VAT registered businesses (77 per cent of all respondents) are signifi cantly more likely to report extreme fi nancial exposure, as are those operating partnerships (17 per cent) and sole traderships (33 per cent). Industry sectors that demon-strate the greatest fi nancial exposure as a consequence of insolvency are the hotels & catering and the wholesale & retail sectors. In contrast, owners of business services ventures are signifi cantly less likely to report that they would ‘lose everything’ through insolvency. Demonstrating their capacity to shield themselves from fi nancial risk by their relatively low cost base, owners of home-based businesses (36 per cent of all respondents) are more likely to report being ‘unaff ected’ by insolvency. A strong relationship between entry mode and fi nancial risk was also revealed. The insolvency of businesses started from scratch is less likely to result in fi nancial risk to the owners, while the insolvency of businesses bought as a going concern is signifi cantly more likely to result in owner bankruptcy.
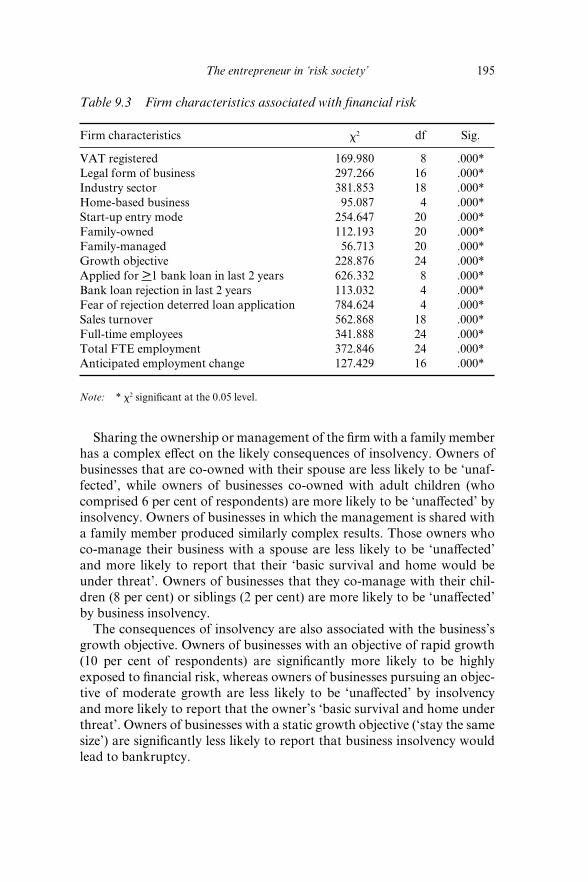
The entrepreneur in ‘risk society’ 195
Sharing the ownership or management of the fi rm with a family member has a complex eff ect on the likely consequences of insolvency. Owners of businesses that are co-owned with their spouse are less likely to be ‘unaf-fected’, while owners of businesses co-owned with adult children (who comprised 6 per cent of respondents) are more likely to be ‘unaff ected’ by insolvency. Owners of businesses in which the management is shared with a family member produced similarly complex results. Those owners who co-manage their business with a spouse are less likely to be ‘unaff ected’ and more likely to report that their ‘basic survival and home would be under threat’. Owners of businesses that they co-manage with their chil-dren (8 per cent) or siblings (2 per cent) are more likely to be ‘unaff ected’ by business insolvency.
The consequences of insolvency are also associated with the business’s growth objective. Owners of businesses with an objective of rapid growth (10 per cent of respondents) are signifi cantly more likely to be highly exposed to fi nancial risk, whereas owners of businesses pursuing an objec-tive of moderate growth are less likely to be ‘unaff ected’ by insolvency and more likely to report that the owner’s ‘basic survival and home under threat’. Owners of businesses with a static growth objective (‘stay the same size’) are signifi cantly less likely to report that business insolvency would lead to bankruptcy.
Table 9.3 Firm characteristics associated with fi nancial risk
Firm characteristics �2 df Sig.
VAT registered 169.980 8 .000*Legal form of business 297.266 16 .000*Industry sector 381.853 18 .000*Home-based business 95.087 4 .000*Start-up entry mode 254.647 20 .000*Family-owned 112.193 20 .000*Family-managed 56.713 20 .000*Growth objective 228.876 24 .000*Applied for >1 bank loan in last 2 years 626.332 8 .000*Bank loan rejection in last 2 years 113.032 4 .000*Fear of rejection deterred loan application 784.624 4 .000*Sales turnover 562.868 18 .000*Full-time employees 341.888 24 .000*Total FTE employment 372.846 24 .000*Anticipated employment change 127.429 16 .000*
Note: * �2 signifi cant at the 0.05 level.

196 Entrepreneurship and growth
Owners of businesses that had applied for a bank loan within the previ-ous two years (29 per cent of all respondents) are signifi cantly more likely to be highly exposed to fi nancial risk. Financial risk was greater for those that had applied for more than one bank loan in this period (5 per cent of all respondents). In contrast, owners of businesses that had not applied for bank debt were signifi cantly more likely to report that their standard of living would be ‘unaff ected’ by business insolvency. Owners of busi-nesses that had been successful in their bank loan application (91 per cent of applicants) were more likely to report that bankruptcy would lead to them ‘scaling down their lifestyle’, while those that had failed to secure bank debt, or had been deterred from applying because of fear of rejection (10 per cent of all respondents), were more likely to report that insolvency would lead them to ‘lose everything’.
Size of fi rm, measured by sales turnover, is signifi cantly associated with fi nancial exposure. Owners of the smallest businesses (# £50 000) are least likely to be aff ected by business insolvency, while owners of median-size businesses (£100 001–£250 000) are the most likely to report extreme fi nancial risk. Interestingly, the owners of businesses with the highest sales turnover (over £1 million) appear relatively cushioned from the fi nancial risks associated with bankruptcy. Employment size, an alternative measure of business size, is also signifi cantly associated with fi nancial risk. The employment size of businesses whose owners face most extreme fi nancial risk following insolvency are those in the 5–9 full-time equivalent (FTE) employment size band. Owners of businesses with 1 FTE are most likely to report that their standard of living would be unaff ected by insolvency. Anticipated employment change is also sig-nifi cantly associated with fi nancial exposure. Those anticipating defi nite increases in employment numbers within the next year (11 per cent) are more likely to report extreme fi nancial exposure to insolvency. Similarly, business owners anticipating defi nite (3 per cent) or possible (6 per cent) decreases in employment numbers are also more likely to report being highly exposed.
Predicting Exposure to Financial Risk
While univariate analysis provides a descriptive insight into the range of characteristics associated with exposure to fi nancial risk, the use of the chi-square statistic at a univariate level with a large number of cases is likely to be over-sensitive. Understanding the more powerful relationships that underpin exposure to fi nancial risk requires an overall analysis. As the dependent variable was a nominal variable, stepwise multinomial logistic regression was selected as the appropriate analysis procedure, both to

The entrepreneur in ‘risk society’ 197
predict which cases would be allocated to a particular response category, and to identify the potential predictor variables associated with category membership. The alternative analytic approach, ordinal regression, was rejected as it can only model the relationships assuming eff ects increase across the four categories in Table 9.1. However, it was expected that some eff ects would relate to the middle categories. Multinomial logistic regres-sion also allows the use of a mixture of predictor variables at various levels of measurement in the same analysis.
The initial analysis was conducted with a large range of potential pre-dictors, but the results proved unstable. In order to stabilize the results, non-signifi cant variables were removed from the analysis. While univari-ate cross-tabulations had shown relationships with most of the initial large range of variables, only a sub-set of variables remained signifi cant in the presence of other predictors. This was probably because of the overlap between the predictor variables. The likelihood ratio test was used to assess the extent of error not explained by model fi tting. The chi-square was 4076, df = 120 p , .001, which showed that there was a consider-able amount of unexplained variation in the dependent variable with the sub-set model in Table 9.4. This shows that the predictive element of the multinomial analysis was incomplete.
Despite this, the model allows an insight into the large number of potential predictors associated with response category membership. Table 9.4 shows the multinomial parameters (with the reference category ‘I would have to scale down my lifestyle’) in the sub-set model. Several category distinctions are signifi cant without being signifi cant overall. The table gives a note-form for interpreting the direction of the signifi cant relationships.
Individual level variables signifi cant at the overall level include a range of investment, human capital and perceptual factors. Notably, the model demonstrates the strength of the relationship between the proportion of household wealth invested in the venture and exposure to fi nancial risk following insolvency. Similarly, it appears that high levels of investment in the form of owner-manager time (hours worked by owner) are also sig-nifi cantly related to fi nancial risk. Multiple business ownership is strongly related to fi nancial risk, though the model shows that this will lead to port-folio entrepreneurs being both less likely to ‘remain unaff ected’ and more likely to anticipate bankruptcy.
Human capital variables, including number of jobs prior to start-up and educational level, are also related to fi nancial risk. The greater the number of jobs held prior to start-up, the more likely respondents are to be ‘under threat’ or to face bankruptcy following insolvency. The relation-ship between education level and risk of fi nancial exposure is modest; this

198 Entrepreneurship and growth
Table 9.4 Multinomial B parameters: versus group 2 (scale down lifestyle)
Variable Overall Group 1 unaff ected
Group 3 under threat
Group 4 bankrupt
Interpretation
Years owned this business
* 2.021 .050* 2.018 More years = more under threat
Years as business owner
* 2.078* 2.056* 2.004 More years = 2 unaff ected 2 under threat
Sales turnover *** 2.248*** 2.033* 2.042 Higher = 2 unaff ected 2 under threat
Proportion household wealth in business
*** 2.378*** .510*** 1.130*** Higher = 2 unaff ected + under threat + bankrupt
Number of jobs before start up
*** 2.028 .069*** .089** More jobs = + under threat + bankrupt
Comparative fi nancial status as owner
*** 2.031 2.112*** 2.171*** Better off = 2 under threat 2 less bankrupt
Comparative quality of life as owner
*** 2.005 2.069*** 2.089** Better off = 2 under threat 2 less bankrupt
Hours worked by owner
*** 2.150*** .194*** .345*** More hours = 2 unaff ected + under threat + bankrupt
Age of owner *** .119** 2.249*** 2.300*** Older age = + unaff ected 2 under threat 2 bankrupt
Currently own >1 business
*** 2.371*** .221 .178* Own >1 business = 2 unaff ected + bankrupt
Previously owned >1 business
.025 .085 2.006
Legal status (compared to LLP)
*** 2.095 2.015 2.403
Sex of owner(s) (compared to 100% female)
*** .007 2.181 2.403* Male majority = 2 less fear of bankruptcy
Equal male/female 2.008 2.103 .143* + more bankruptcy fear
Share owner /spouse *** .218* 2.003 .133 + unaff ected
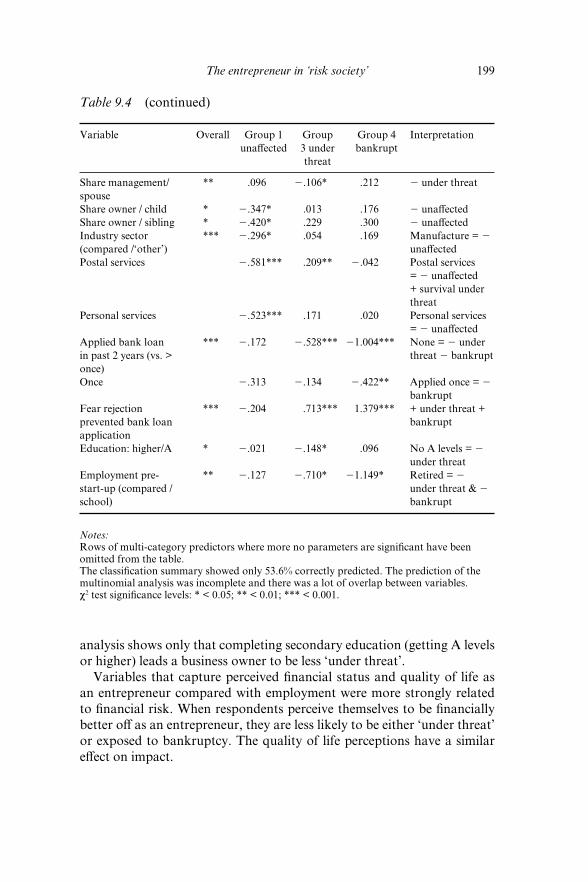
The entrepreneur in ‘risk society’ 199
analysis shows only that completing secondary education (getting A levels or higher) leads a business owner to be less ‘under threat’.
Variables that capture perceived fi nancial status and quality of life as an entrepreneur compared with employment were more strongly related to fi nancial risk. When respondents perceive themselves to be fi nancially better off as an entrepreneur, they are less likely to be either ‘under threat’ or exposed to bankruptcy. The quality of life perceptions have a similar eff ect on impact.
Table 9.4 (continued)
Variable Overall Group 1 unaff ected
Group 3 under threat
Group 4 bankrupt
Interpretation
Share management/spouse
** .096 2.106* .212 2 under threat
Share owner / child * 2.347* .013 .176 2 unaff ectedShare owner / sibling * 2.420* .229 .300 2 unaff ectedIndustry sector (compared /‘other’)
*** 2.296* .054 .169 Manufacture = 2 unaff ected
Postal services 2.581*** .209** 2.042 Postal services = 2 unaff ected + survival under threat
Personal services 2.523*** .171 .020 Personal services = 2 unaff ected
Applied bank loan in past 2 years (vs. > once)
*** 2.172 2.528*** 21.004*** None = 2 under threat 2 bankrupt
Once 2.313 2.134 2.422** Applied once = 2 bankrupt
Fear rejection prevented bank loan application
*** 2.204 .713*** 1.379*** + under threat + bankrupt
Education: higher/A * 2.021 2.148* .096 No A levels = 2 under threat
Employment pre-start-up (compared / school)
** 2.127 2.710* 21.149* Retired = 2 under threat & 2 bankrupt
Notes:Rows of multi-category predictors where more no parameters are signifi cant have been omitted from the table.The classifi cation summary showed only 53.6% correctly predicted. The prediction of the multinomial analysis was incomplete and there was a lot of overlap between variables.c2 test signifi cance levels: * < 0.05; ** < 0.01; *** < 0.001.

200 Entrepreneurship and growth
Two personal characteristics are signifi cantly related at the overall level to fi nancial risk. The older the owners, the more likely they are to be ‘unaf-fected’ by insolvency, and the less likely they are to be exposed to extreme fi nancial risk, either ‘under threat’ or facing bankruptcy following insol-vency. Sex of ownership also emerges as signifi cant at the overall level. Firms that are wholly male owned are less likely to anticipate bankruptcy, and equal male–female owned fi rms – usually matrimonial partnerships – are more likely to anticipate bankruptcy.
Firm level variables that are signifi cant at the overall level include a measure of size, legal status, sector, shared ownership and management and recent application for bank debt. The larger the fi rm’s sales turnover, the less likely respondents are to be ‘unaff ected’ by insolvency and the less likely they are to be under threat. Legal status is also signifi cant at the overall level: it suggests that non limited liability fi rms are more likely to have to scale down their lifestyle.
Sharing the ownership of the fi rm with a spouse is signifi cantly likely to increase the likelihood of being unaff ected by the failure of the business. (The apparent contradiction with the earlier fi nding for equal male–female owned fi rms needs further investigation.) Sharing management, but not necessarily ownership, with a spouse reduces the risk of being under threat. In contrast, owners who share ownership with siblings are less likely to be unaff ected.
Finally, recent application for bank debt is strongly related to fi nancial risk following insolvency. Respondents who have not applied for bank debt in the previous two years are signifi cantly less likely to be ‘under threat’ or face bankruptcy as a consequence of insolvency. Respondents who have made only one recent application for bank debt are also less likely to be exposed to extreme fi nancial risk. In contrast, entrepreneurs who have been constrained in applying for bank debt because of a fear of rejection are signifi cantly more likely to be ‘under threat’ and face bankruptcy as a consequence of insolvency.
Discussion
Two clear themes run through this analysis. The fi rst is that small business owners who are seeking to grow rapidly, and who have made signifi cant commitments of time and fi nancial resources in their businesses, are potentially vulnerable to increased personal fi nancial risk in the event that their business fails. Those business owners who anticipate severe personal fi nancial implications in the event that their business becomes insolvent are seeking the rapid growth of their business, have made signifi cant fi nancial investment (in the form of personal investment in the business
The entrepreneur in ‘risk society’ 201
and raising bank loans) and work long hours. The businesses are typically relatively new and small, often co-owned with a spouse, and are seeking to expand from just a handful of employees. It is the owners of these busi-nesses who are exposed to the greatest personal fi nancial risk should the business fail. On the other hand, this risk may be worthwhile given the evidence that owners of larger businesses and owners who perceive them-selves to be fi nancially better off compared with their likely situation as an employee (suggesting that their business has been fi nancially successful) perceive themselves to be at little or no personal fi nancial risk should their business fail.
The second theme is refl ects the opposite situation. Owners of businesses requiring little or no personal investment by the owner, and those that have low capital intensity, and older owners, are at little or no personal fi nancial risk should their business fail. Owners who are least exposed to personal fi nancial risk should their business fail have little or none of their household wealth invested in their business, operate from home and are in service industries (which typically have low capital intensity). This supports Bhidé’s (2001) thesis that owners who bootstrap their business at start-up, either from choice or because they are forced to, do not face much personal fi nancial risk.
The chapter is not concerned with actual business failures. Nevertheless, it can observed that the characteristics of the businesses and owners identi-fi ed in the literature associated with business failure are only an imperfect match with those of the businesses whose owners are personally the most fi nancially vulnerable to failure. Specifi cally, whereas the age and size of the business are associated with the risk of business failure, growth is not featured in the literature as being statistically associated with a high risk of business failure: if anything, growth has the eff ect of reducing failure (Storey, 1994). Moreover, there are few human capital variables that link business failure to personal fi nancial risk, whereas they are somewhat more strongly associated with the risk of business failure.
CONCLUSION
This chapter has taken a distinctive perspective on business failure. Starting with the notion that individuals are exposed to greater economic risks than in the past, we off er an initial exploration of the vulnerability of small business owners to personal fi nancial risk in the event that their business should fail. It reveals that exposure to risk is diff erentiated across the small business sector. Only a minority of small business owners face extreme risk (10 per cent state that they would lose everything and become
202 Entrepreneurship and growth
bankrupt), but a substantial minority (a further 33 per cent) face some risk, stating that their basic survival and home would be ‘under threat’. Just over half of respondents report being relatively unaff ected by business insolvency, and of these, 10 per cent report that their standard of living would be unaff ected.
Exposure to risk is most associated with personal fi nancial investment in the business, the recent use of bank debt and growth from a small base (scaling up). The greatest risk appears to be associated with growth busi-nesses, especially those growing from micro to small (5–9 employees). However, personal fi nancial risk is likely to be reduced if growth is suc-cessfully achieved. Owners who have little or no personal fi nancial expo-sure in the event of business failure are likely to own larger businesses and perceive themselves to have a higher fi nancial status than if they had been employees.
The evidence presented here on the types of business owners who are most exposed to personal fi nancial risk should be a source of disquiet for policy makers. There is a general concern, both in the UK and elsewhere, that although enterprise policies have resulted in the creation of consider-able numbers of micro businesses, there are insuffi cient businesses that create jobs for more than just the owner and their immediate family. Removing impediments to growth should therefore be a key focus for policy. The case for intervention requires evidence on two key issues. First, does the recognition of the considerable personal fi nancial risk that is involved in growing a business encourage business owners to remain small? Second, does it prompt forms of ‘loss aversion behaviour’ (Bhidé, 2001), such as selling the business at the earliest opportunity to capture the value that has been created, or consolidating rather than going on to build a large business? If further research reveals evidence of these outcomes then two further questions arise. First, can policy makers design forms of intervention that can change such behaviour? Second, is this a legitimate focus for intervention? There are many other issues where evidence is required. What are the actual risks of failing of businesses that are seeking to scale up from a handful of employees? Is the failure experience of the owners of these businesses distinctive? For example, are they less willing, or less able (for fi nancial or emotional reasons), to start another business? Do the owner-managers recognize their exposure to these personal fi nan-cial risks? In short, this points to the need for the business failure litera-ture to broaden out from its present focus on what types of fi rms fail to consider in much more detail the impacts of failure on the business owner, whether the impacts of failure are diff erentiated across the small business population, and the impact of the perception of the risk and eff ects of failure on the behaviour of business owners.
The entrepreneur in ‘risk society’ 203
REFERENCES
Allen, J. and N. Henry (1997), ‘Ulrich Beck’s “risk society” at work: labour and employment in the contract service industries’, Transactions of the Institute of British Geographers, 22 (2), 180–96.
Alsos, G. and S. Carter (2006), ‘Multiple business ownership in the Norwegian farm sector: resource transfer and performance consequences’, Journal of Rural Studies, 22 (3), 313–22.
Beck, U. (1992), Risk Society: Towards a New Modernity, London: Sage.Beck, U. (2000), The Brave New World of Work, Cambridge: Polity Press.Beck, U. (2003), ‘The theory of refl exive modernization: problematic, hypothesis
and research programme’, Theory, Culture and Society, 20 (2), 1–33.Becker, G. (1964), Human Capital: A Theoretical and Empirical Analysis, with
Special Reference to Education, New York: Columbia University Press for National Bureau of Economic Research.
Berryman, J. (1983), ‘Small business failure and bankruptcy: a survey of the litera-ture’, European Small Business Journal, 1 (4) 47–59.
Bhidé, A.V. (2001), The Origin and Evolution of New Businesses, New York: Oxford University Press.
Brockhaus, R.H. (1985), ‘Is there life after death: the impact of unsuccessful entrepreneurial endeavours on the life of the entrepreneur’, in Frontiers of Entrepreneurship Research 1985, Wellesley, MA: Center for Entrepreneurial Studies, Babson College, pp. 468–81.
Bruno, A., E. McQuarrie and C. Torgrimson (1992), ‘The evolution of high technology companies: a twenty-year perspective’, Journal of Business Venturing, 7 (4), 291–302.
Burns, P. (2007), Entrepreneurship and Small Business, 2nd edn, Basingstoke: Palgrave.
Carter, R. and H. Van Auken (2006), ‘Small fi rm bankruptcy’, Journal of Small Business Management, 44 (4), 493–512.
Carter, S., C. Mason and S. Tagg (2006), Lifting the Barriers to Growth in UK Small Businesses: The FSB Biennial Membership Survey 2006, London: FSB.
Cope, J. (2005), ‘Towards a dynamic learning perspective of entrepreneurship’, Entrepreneurship Theory and Practice, 29, 373–98.
Cressy, R. (2006), ‘Why do most fi rms die young?’, Small Business Economics, 26, 103–16.
Deakins, D. and M. Freel (2006), Entrepreneurship and Small Firms, 4th edn, Maidenhead: McGraw-Hill.
Ekinsmyth, C. (1999), ‘Professional workers in a risk society’, Transactions of the Institute of British Geographers, 24 (3), 353–66.
Ekinsmyth, C. (2002), ‘Project organisation, embeddedness and risk in magazine publishing’, Regional Studies, 36 (3), 229–43.
Fredland, J.E. and C.E. Morris (1976), ‘A cross section analysis of small business failure’, American Journal of Small Business, 1, 7–18.
Hall, G. (1992), ‘Reasons for insolvency amongst small fi rms – a review and fresh evidence’, Small Business Economics, 4 (3), 237–50.
Hall, G. (1995), Surviving and Prospering in the Small Firm Sector, London: Routledge.
Hall, G. and B. Young (1991), ‘Factors associated with insolvency amongst small fi rms’, International Small Business Journal, 9 (2) 54–63.

204 Entrepreneurship and growth
Hayward, M.L.A., D.A. Shepherd and D. Griffi n (2006), ‘A hubris theory of entrepreneurship’, Strategic Management Journal, 52, 160–72.
Headd, B. (2003), ‘Redefi ning business success: distinguishing between closure and failure’, Small Business Economics, 21, 51–61.
Johnson, P. and C. Conway (1997), ‘How good are the UK VAT registration data at measuring fi rm births?’, Small Business Economics, 9, 403–9.
Mythen, G. (2005), ‘Employment, individualisation and insecurity: rethinking the risk society perspective’, Sociological Review, 53, 129–49.
Offi ce for National Statistics (2005), UK Business: Activity, Size and Location – 2005, London: Offi ce for National Statistics.
Perry, S.C. (2001), ‘The relationship between written business plans and the failure of small businesses in the US’, Journal of Small Business Management, 39, 201–8.
Phillips, B.D. (1993), ‘The infl uence of industry and location on small busi-ness failure rates’, paper presented to the Babson Entrepreneurship Research Conference, Houston, Texas.
Pompa, P.P.M. and J. Bilderbeek (2005), ‘The prediction of bankruptcy of small and medium-sized industrial fi rms’, Journal of Business Venturing, 20, 847–68.
Reimer, S. (1998), ‘Working in a risk society’, Transactions of the Institute of British Geographers, 23 (1), 116–27.
Ronstadt, R. (1985), ‘Every entrepreneur’s nightmare: the decision to become an ex-entrepreneur and work for someone else’, in Frontiers of Entrepreneurship Research 1985, Wellesley, MA: Center for Entrepreneurial Studies, Babson College, pp. 409–34.
Shepherd, D.A. and J. Wiklund (2005), Entrepreneurial Small Businesses, Cheltenham, UK and Northampton, MA, USA: Edward Elgar.
Small Business Service (2005), Business Start-ups and Closures: VAT Registrations and Deregistrations in 2004, Statistical Press Release URN 05/11 12 October 2005, London: Small Business Service.
Stanworth, J. and D. Purdy (2006), ‘Franchising and the small business’, in S. Carter and D. Jones-Evans (eds), Enterprise and Small Business, Harlow, Essex: FT Prentice Hall; pp. 441–64.
Starr, J.A. and W.D. Bygrave (1992), ‘The second time around: the outcomes, assets and liabilities of prior start-up experience’, in S. Birley and I.C. MacMillan (eds), International Perspectives on Entrepreneurship Research, Amsterdam: Elsevier, pp. 340–63.
Stokes, D. and R. Blackburn (2001), ‘Opening up business closures: a study of businesses that close and owners’ exit routes’, A Research Report for HSBC, Kingston University Small Business Research Centre.
Storey, D. (1994), Understanding the Small Business Sector, London: Routledge.Storey, D.J., K. Keasey, R. Watson and P. Wynarczyk (1987), The Performance of
Small Firms: Profi ts, Jobs and Failures, London: Croom-Helm.Van Praag, C.M. (2003), ‘Business survival and success of young small business
owners’, Small Business Economics, 21, 1–17.Watson, J. and J.E. Everett (1996), ‘Do small businesses have high failure rates?’,
Journal of Small Business Management, 34, 45–62.Zacharakis, A.L., G.D. Mayer and J. DeCastro (1999), ‘Diff ering perceptions
of new venture failure: a matched exploratory study of venture capitalists and entrepreneurs’, Journal of Small Business Management, 37 (3), 1–14.

PART V
Knowledge-based Entrepreneurship


207
10. The creation of higher education institutions and fi rm entry: a policy evaluationJoana Mendonça, Rui Baptista and Francisco Lima
INTRODUCTION
Various studies have examined the role played by universities in promot-ing entrepreneurship in nearby regions. Results obtained by Audretsch et al. (2005) suggest that, in general, new knowledge-based fi rms have a high propensity to locate close to universities. In addition, academic research and development expenditure has been found to be signifi cantly associated with rates of new fi rm formation across regions (Lee et al., 2004). There is also strong evidence from the United States of a growth eff ect of clusters infl uenced by research-active universities (Feldman, 2000).
In a modern economy, universities are generators of a steady fl ow of novel technical ideas, and the system of public research and higher education is largely responsible for the capability in modern technolo-gies (Mazzoneli and Nelson, 2007). In addition to their traditional role as sources of ideas, knowledge and intellectual capital, universities have become agents of innovations through the development and commer-cialization of new ideas generated by academic research and development (R&D). Entrepreneurial universities enhance regional development and international competitiveness and their role is especially important in structurally weak and peripheral regions, where universities tend to have a monopoly over the production of intellectual capital.
The local presence of universities can generate positive externalities through both the performance of knowledge-generating R&D activities and the education of specialized human capital, capable of absorbing such knowledge. Firms can cultivate relationships with universities, participat-ing in research consortia and partnering with academics who do related scientifi c work (Audretsch and Feldman, 2004). For instance, personal networks of academics and industrial researchers facilitate the commercial

208 Entrepreneurship and growth
exploitation of knowledge generated at universities by existing fi rms or university spin-off start-ups. Moreover, fresh graduates may be impor-tant channels for disseminating the latest knowledge from academia to the local high-technology industry (Varga, 2000). Empirical studies have found that new fi rms are highly likely to start in the home region of their founders (Klepper, 2002) and, as a result, universities and other research institutions can become important focal points for regional economic development.
The presence of a university in a region is an additional factor infl uenc-ing the location decision made by new fi rms. This infl uence should be greater in industries where new knowledge plays a more important role. The transmission of new, as yet uncodifi ed, knowledge tends to occur only within limited geographic areas, embedding economic activity based on this knowledge within the region (Baptista and Swann, 1999). As a result, it is expected that access to local knowledge sources is particularly signifi cant for high-technology and knowledge-based manufacturing and services.
In Portugal, there was a revolution in 1974 ending the dictatorship. Until then, the higher university education system was made for the elite and characterized by a low number of students. After the revolu-tion education was democratized, and the higher education system was expanded. In the 1980s, there was political support for the growth of the private university higher education sector (Correia et al., 2002) and, as a result of this political context, several new private and public schools emerged. In this chapter, we examine the eff ect of the creation of these new higher education institutions on subsequent regional levels of entry by knowledge-based fi rms. We apply a procedure based on propensity score matching methods because with this methodology we can identify the shift in the distribution of fi rm entry rates for regions with new universities as compared with regions that maintain the same number of universities but otherwise share similar characteristics.
Our results indicate that the creation of new higher education school in a region has a positive impact on the lagged share of new fi rm entry in knowledge-intensive sectors, which is followed by a signifi cant decrease in the entry of fi rms in low-technology sectors. In general, our results illus-trate that universities eff ectively contribute to the regional development of knowledge-related activities.
The chapter is organized as follows. The next section presents some background literature on the role of universities in regional development, presenting the research questions addressed. The third section presents the data and methodological approach used in the present study, while the fourth section reports and discusses the results obtained. The fi nal section

The creation of higher education institutions and fi rm entry 209
presents our main conclusions, and highlights avenues for improving and broadening this research.
UNIVERSITIES AND NEW FIRM CREATION
Universities and Location
One of the major socio-economic trends observed in the last decades is the rise of entrepreneurship as a driver of innovation, competitiveness and economic development. Both academics and policy makers have claimed that entrepreneurial activity is vital to economic progress. As a result, government policies fostering new fi rm creation have been adopted by many countries. Empirical research has suggested that the entrepreneurial eff orts most likely to impact on subsequent economic development and employment growth are knowledge-based fi rms (Baptista and Preto, 2006). Knowledge-based entrepreneurial activity requires a steady fl ow of novel ideas in order to fl ourish. The existence of human capital with the technological knowledge required to recognize and implement entrepre-neurial opportunities arising from novel ideas is essential for successful technology commercialization. Universities and R&D laboratories are fundamental sources of technical knowledge that can be commercialized. Universities and polytechnic institutes also play a major role in educating human capital capable of recognizing and implementing technological opportunities.
Recent research has addressed the issue of ‘technology transfer and commercialization’, referring to the mechanisms and incentives through which universities can bring knowledge developed in R&D activities to the market. Fewer works have addressed the regional dimension of university knowledge transfer. A variety of research streams have dem-onstrated the importance of geographical proximity for the transmis-sion of new knowledge, and it is therefore reasonable to expect that the economic exploitation of such knowledge will occur close to the sources generating it.
Complex technological knowledge, seemingly the most valuable type of knowledge, usually contains a strong element of tacitness, meaning its fl ow and diff usion are constrained by the geographic proximity and extent of interaction among individuals within whom the tacit component resides. Considering tacit knowledge as an important element for new innovative fi rms, access to this type of knowledge can become a major determinant in the competitiveness of regions and the location of these fi rms (Audrestch et al., 2004). A host of recent empirical studies have confi rmed that

210 Entrepreneurship and growth
knowledge spillovers are geographically bounded (Jaff e, 1989, Anselin et al., 1997). Accordingly, the location decision of new fi rms should be infl uenced signifi cantly by access to the sources of knowledge spillovers, including specialized human capital and institutions performing R&D activities (Audretsch et al., 2005). In addition, the propensity to cluster geographically should be higher in industries where new knowledge plays a more important role as such knowledge is less likely to be codifi ed and easy to transmit over great distances, with no need for personal contact (Baptista and Swann, 1999).
Recent literature has advocated that knowledge spillovers play an impor-tant role in fostering entrepreneurship and innovative activity (Sorenson and Audia, 2000; Baum and Sorenson, 2003). Companies in innovative sectors tend to choose locations where signifi cant knowledge-generating activities associated with these sectors occur (Zucker et al., 1998, 2002; Audretsch and Stephan, 1996) and these activities may be performed by universities or other fi rms, and implies the presence of world class scien-tifi c research and human capital. Spillovers from universities, as well as from private fi rms, have been recognized as key sources promoting fi rm innovation and performance (Stuart and Sorenson, 2003). Stahlecker and Koschatzky (2004) indicate that spatial proximity matters for the founding and early performance of fi rms in the knowledge-intensive business serv-ices sectors. Also, Capello (2002) has found that high-technology indus-tries display high spatial concentration and, in contrast to start-ups with traditional products and processes, knowledge-based fi rms tend to off er new or improved products, operating in markets in early development stages. Thus, access to knowledge sources should be particularly signifi -cant for high-technology and knowledge-based industries and services.
Universities as Knowledge Sources
Modern universities have had a role in the dissemination and transmis-sion of knowledge since their creation (Caraça et al., 2000). In particular, university research contributes to the basic stock of scientifi c knowledge available in any country or region, and it appears to have the potential to improve national competitiveness (Spencer, 2001). In addition, research has identifi ed the important role that universities play in generating knowledge spillovers (Audretsch et al., 2004). Studies have also found that academic research can be linked to the development of a high percent-age of product innovations, and that the development of certain sectors happened in countries where there were strong university research pro-grammes in related areas. Public research is used not only to help generate ideas, but also to help complete existing R&D projects in fi rms (Laursen

The creation of higher education institutions and fi rm entry 211
and Salter, 2004). Start-ups, in particular, can be a vehicle to transfer university research into commercial innovation, especially in science-based sectors (Laursen and Salter, 2004). Geographical proximity of an academic institution to a knowledge-intensive industry may be a source of positive knowledge externalities, since fi rms can cultivate relationships with universities, establishing partnerships with academics who do related scientifi c work, thus allowing the sharing and exchange of tacit knowledge (Audretsch and Feldman, 2004). Cooperative relationships can be con-sidered as a channel for knowledge spillovers, and the establishment of such cooperation is favoured by location proximity (Fritsch, 2001). For instance, personal networks of academics and industrial researchers may lead to the commercial exploitation of knowledge generated at universities by existing fi rms or university spin-off start-ups. The possibility of devel-oping research partnerships with academic institutions may also positively aff ect the absorptive capacity of fi rms (Scott, 2003). Fresh graduates may be important channels for disseminating the latest knowledge from academia to the local high-technology industry (Varga, 2000). Students can also provide a channel to transmit knowledge from the university where it is created to the fi rm where it can be commercialized (Audretsch et al., 2004). In addition, the establishment of new fi rms can also be advantageous to the universities, since they can make the institutions more attractive to students, faculty and other partners. By creating new knowledge and training people, universities can support the formation of new fi rms, and therefore have been considered as an important source of investment ideas by venture capitalist (Lerner, 2005).
Given that the commercialization of knowledge depends on knowledge generation by universities and public R&D laboratories, as well as R&D activities by fi rms, a low level of new business formation in knowledge-dependent sectors should be associated with a lack of knowledge- generating sources (Cohen and Levinthal, 1989). Acs et al. (1994) fi nd that small fi rms are recipients of R&D spillovers generated both in universities and in the R&D centres of their larger counterparts, and such spillovers are apparently more signifi cant in stimulating innovative activity by small fi rms than by large corporations. Anselin et al. (1997) fi nd evidence of local spatial externalities between university research and high-technology innovative activity. Feldman (2000) reports strong evidence in favour of a growth eff ect of geographical clusters infl uenced by active research uni-versities for the United States. Fisher and Varga (2003) provide evidence of the importance of geographically mediated knowledge spillovers from university research activities to regional knowledge production in high-tech industries in Austria. Other studies, such as Bania et al. (1993), fi nd that the relationship between university research and fi rm births varies
212 Entrepreneurship and growth
across industrial sectors. Furthermore, the role of universities in the com-mercialization of knowledge has increased over time; Henderson et al. (1998) have found an increase in the rate of technology transfer to the private sector.
HYPOTHESIS FORMULATION
On 25 April 1974, there was a revolution in Portugal leading to the fall of the government of Marcelo Caetano and ending the authoritarian regime that had lasted for almost half a century. During the regime, there was extensive state regulation and predominantly private ownership of the means of production. The state exercised extensive authority regarding private investment decisions and the level of wages. After the revolution, there was a time of political uncertainty and turbulence. Following the revolution, the Portuguese higher education system grew very signifi cantly as a consequence of a political eff ort to democratize and facilitate access to universities and an associated increase in the demand for higher educa-tion. Since then, several public and private higher education institutions have been created across the country, giving rise to a private higher educa-tion sector and to a network of polytechnic institutions supported by the government. This growth is refl ected in the number of enrolled students, which increased from an average of 30 000 in the 1960s to 400 000 in the 1990s (Horta, 2008; Correia et al., 2002). The emergence of these institu-tions represented an attempt to off er new degrees and to address specifi c local or regional needs. In particular, new private higher education institu-tions tried to explore market niches that remained untouched (Correia et al., 2002). This policy development enables us to recognize the creation of new higher education institutions in specifi c regions and to address their eff ects.
Observing this phenomenon allows us to identify the impact of these institutions in the regions where they are located. If universities do have a role in fostering entrepreneurial activity, we can assume that the creation of universities in regions will have an impact on the number of start-ups in the same region. In this mindset, we wish to address the following research question: What is the impact of the creation of a new university on the levels of fi rm entry in a region? We address this research question by testing the following hypothesis:
H1: The creation of a new higher education institution in a municipality has a positive eff ect on subsequent levels of new fi rm entry in that municipality.

The creation of higher education institutions and fi rm entry 213
Furthermore, it is not clear if universities will aff ect entrepreneurial activ-ity across industries, or if this eff ect will be more pronounced in knowledge-related sectors. Firms in high-technology industries often seek to increase levels of intellectual capital through the use of external sources, making prox-imity to a university more important. Thus, we test a second hypothesis:
H2: The impact of a new higher education institution in a municipality will vary according to the sector considered.
In particular, we assume that there should be a more short-term immedi-ate impact on the entry of new fi rms, focused on supplying the new higher education institutions with services and technology. We also expect that there will be a gradual eff ect, more long term, which can take some years to reach a peak, whereby new fi rms are started by faculty and graduates of these institutions, and as a consequence of knowledge spillovers generated by education and research activities. In addition, we assume that activities in knowledge-based industry and services will benefi t more from locating in the proximity of higher education institutions and we expect these new institutions to have a bigger impact in knowledge-dependent sectors.
DATA AND METHODOLOGY
The Data
Data on fi rm dynamics and levels of human capital were drawn from the Portuguese Quadros de Pessoal database. This is a longitudinal employer–employee matched database built from mandatory information submitted by fi rms to the Ministry for Employment and Social Security. It includes extensive information on all private fi rms, establishments, workers and business owners in the Portuguese economy. There are on average over 145 000 fi rms, 170 000 establishments and two million workers in each annual return, which are fully linked through the use of a unique identifi ca-tion number, thus allowing for the recognition of new entrants and exiting fi rms, as well as the opening and closure of subsidiary establishments. For each fi rm, data are available for size, age, location, sector and number of establishments. Data on business owners and employees for each fi rm and establishment include gender, age, function, tenure, schooling and skill levels.1 The present study focuses on fi rms in manufacturing sectors and in knowledge-intensive business services, making use of the OECD classifi -cation (OECD, 2002) (see the Appendix for detailed sector descriptions). We identifi ed entry by observing the appearance of a new fi rm identifi er in
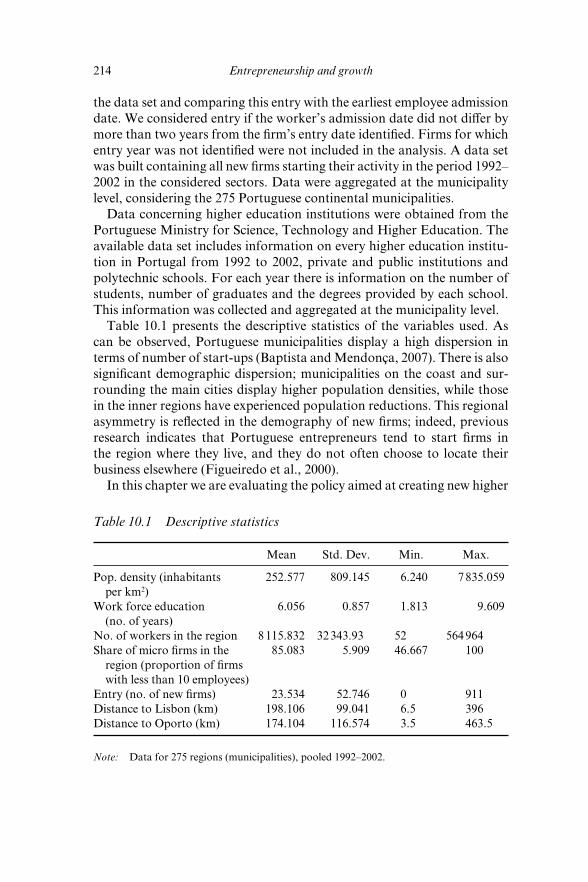
214 Entrepreneurship and growth
the data set and comparing this entry with the earliest employee admission date. We considered entry if the worker’s admission date did not diff er by more than two years from the fi rm’s entry date identifi ed. Firms for which entry year was not identifi ed were not included in the analysis. A data set was built containing all new fi rms starting their activity in the period 1992–2002 in the considered sectors. Data were aggregated at the municipality level, considering the 275 Portuguese continental municipalities.
Data concerning higher education institutions were obtained from the Portuguese Ministry for Science, Technology and Higher Education. The available data set includes information on every higher education institu-tion in Portugal from 1992 to 2002, private and public institutions and polytechnic schools. For each year there is information on the number of students, number of graduates and the degrees provided by each school. This information was collected and aggregated at the municipality level.
Table 10.1 presents the descriptive statistics of the variables used. As can be observed, Portuguese municipalities display a high dispersion in terms of number of start-ups (Baptista and Mendonça, 2007). There is also signifi cant demographic dispersion; municipalities on the coast and sur-rounding the main cities display higher population densities, while those in the inner regions have experienced population reductions. This regional asymmetry is refl ected in the demography of new fi rms; indeed, previous research indicates that Portuguese entrepreneurs tend to start fi rms in the region where they live, and they do not often choose to locate their business elsewhere (Figueiredo et al., 2000).
In this chapter we are evaluating the policy aimed at creating new higher
Table 10.1 Descriptive statistics
Mean Std. Dev. Min. Max.
Pop. density (inhabitants per km2)
252.577 809.145 6.240 7 835.059
Work force education (no. of years)
6.056 0.857 1.813 9.609
No. of workers in the region 8 115.832 32 343.93 52 564 964Share of micro fi rms in the region (proportion of fi rms
with less than 10 employees)
85.083 5.909 46.667 100
Entry (no. of new fi rms) 23.534 52.746 0 911Distance to Lisbon (km) 198.106 99.041 6.5 396Distance to Oporto (km) 174.104 116.574 3.5 463.5
Note: Data for 275 regions (municipalities), pooled 1992–2002.
The creation of higher education institutions and fi rm entry 215
education institutions by measuring its impact on the formation of new fi rms. Thus, we compare levels of fi rm entry in municipalities where new higher education institutions were created, with fi rm entry in municipali-ties where there were no new institutions. This will check whether or not the creation of a new institution signifi cantly aff ects subsequent rates of new business formation, and how if this eff ect varies in diff erent sectors. As such, we consider the creation of a new institution to be a treatment variable and evaluate the impact of this treatment by comparing munici-palities where the treatment variable is equal to one with those where the treatment variable is equal to zero (i.e. municipalities where no new higher education institutions were created in that same period). We compare the group of municipalities where a new higher education institution was created with two control groups, namely municipalities where the number of institutions is zero and remains zero during the entire time of the study (group A); and municipalities where the number of institutions is diff erent from zero and remains constant (group B). We have excluded the municipalities for which there was a decrease in the number of institu-tions, because there may be eff ects of this decrease that we were unable to control. We also excluded municipalities where new institutions were created outside the time span of our analysis, since these new institutions may have impacts that we could not distinguish, and to make sure that we were observing the eff ect of only new institutions.
From 1992 to 2002, we can identify 46 municipalities where a new insti-tution was created, and 14 municipalities where more than one institution appeared during this time. There are 204 municipalities that remain with no institution in the same period (group A), and 17 municipalities for which the number of institutions is diff erent from zero and remains the same throughout the period (group B).
In this analysis, we have chosen to observe the treatment for the years 1993 and 1994, so that we would have at least two years before treatment to control for pre-treatment characteristics. As we are comparing munici-palities in the diff erent groups, we need to be able to observe the munici-palities at least two years before the treatment, to make sure we compare municipalities with similar characteristics regardless of the creation of the new institution. In addition, we wish to have a considerable number of years after the treatment in order to distinguish short-term, indirect eff ects and long-term eff ects. Furthermore, using two adjacent years avoids com-paring the treatment in diff erent environmental conditions.
In 1993 and 1994, we have identifi ed 17 new institutions in 17 diff er-ent municipalities. From these new institutions, we have identifi ed six private schools, eight polytechnics, fi ve that have active research centres and develop research activities, and four that provide technology-related
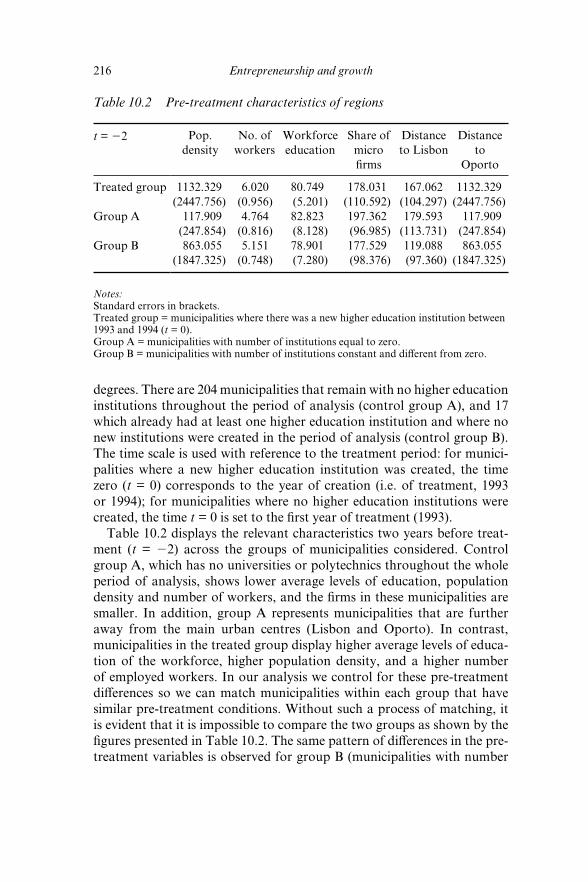
216 Entrepreneurship and growth
degrees. There are 204 municipalities that remain with no higher education institutions throughout the period of analysis (control group A), and 17 which already had at least one higher education institution and where no new institutions were created in the period of analysis (control group B). The time scale is used with reference to the treatment period: for munici-palities where a new higher education institution was created, the time zero (t = 0) corresponds to the year of creation (i.e. of treatment, 1993 or 1994); for municipalities where no higher education institutions were created, the time t = 0 is set to the fi rst year of treatment (1993).
Table 10.2 displays the relevant characteristics two years before treat-ment (t = 22) across the groups of municipalities considered. Control group A, which has no universities or polytechnics throughout the whole period of analysis, shows lower average levels of education, population density and number of workers, and the fi rms in these municipalities are smaller. In addition, group A represents municipalities that are further away from the main urban centres (Lisbon and Oporto). In contrast, municipalities in the treated group display higher average levels of educa-tion of the workforce, higher population density, and a higher number of employed workers. In our analysis we control for these pre-treatment diff erences so we can match municipalities within each group that have similar pre-treatment conditions. Without such a process of matching, it is evident that it is impossible to compare the two groups as shown by the fi gures presented in Table 10.2. The same pattern of diff erences in the pre-treatment variables is observed for group B (municipalities with number
Table 10.2 Pre-treatment characteristics of regions
t = 22 Pop. density
No. of workers
Workforce education
Share of micro fi rms
Distance to Lisbon
Distance to
Oporto
Treated group 1132.329 6.020 80.749 178.031 167.062 1132.329(2447.756) (0.956) (5.201) (110.592) (104.297) (2447.756)
Group A 117.909 4.764 82.823 197.362 179.593 117.909(247.854) (0.816) (8.128) (96.985) (113.731) (247.854)
Group B 863.055 5.151 78.901 177.529 119.088 863.055(1847.325) (0.748) (7.280) (98.376) (97.360) (1847.325)
Notes:Standard errors in brackets.Treated group = municipalities where there was a new higher education institution between 1993 and 1994 (t = 0).Group A = municipalities with number of institutions equal to zero.Group B = municipalities with number of institutions constant and diff erent from zero.
The creation of higher education institutions and fi rm entry 217
of institutions constant and diff erent from zero). The municipalities in this group are larger than those in group A, but smaller than those treated, as measured by population density and number of workers. The same type of relationship is found for average years of education for the workforce. As expected, these municipalities are closer to the two main urban centres (measured in km). Moreover, the share of small fi rms is smaller than in municipalities belonging to the other two groups.
EMPIRICAL ANALYSIS
First-diff erences Method
We start by applying a fi rst-diff erences method to determine the eff ect of the creation of a new higher education institution on the entry rates of new fi rms. This methodology is often used with data obtained from a natural experiment, which occurs when some exogenous event, such as a change in government policy, changes the environment. A natural experi-ment always has a control group, which is not subject to any change, and a treatment group, which is aff ected by the policy change. In this case, the exogenous event is the creation of higher education institutions, which were created during the 1990s as a consequence of government policies to change the structure of the higher education sector, and increase the number of graduates in Portugal. Accordingly, the control group consists of municipalities that have experienced no change in the number of higher education institutions (in the entire period from 1992 to 2002) while the treatment group consists of those municipalities where a new higher education was created in the period 1993–94.
A fi rst-diff erenced equation of the entry rates of fi rms is estimated by ordinary least squares (OLS) distinguishing the control group from the treated. The treatment is introduced using a dummy variable that assumes the value one for treated regions, and zero otherwise. The treatment eff ect is captured in the municipality entry rates. We diff erentiate the entry rates across time for the same cross-sectional units, and diff erentiating adjacent time periods. We control for diff erences between municipalities by includ-ing a set of control factors, which are also diff erentiated over time, such as population density; the share of micro fi rms; number of employees (log); the distances to the main urban centres, Oporto and Lisbon; and year dummies to capture time/business cycle eff ects. We use these variables to control for the probability that new fi rms will locate in each municipality regardless of the existence of higher education institutions (Figueiredo et al., 2000).

218 Entrepreneurship and growth
The fi rst-diff erences estimator on the treatment variable is not statisti-cally signifi cant, which means that we were unable to capture the eff ect of a new university on the one year lag of regional rates of entry of fi rms.2 The fi rst-diff erences estimator compares the group of treated regions with the group of non-treated regions, regardless of individual characteristics within the two groups. Since we have very heterogeneous groups of munic-ipalities, which cannot be directly compared, we are unable to isolate the eff ect of the creation of new higher education institutions. Another reason for these results is that one year diff erences are not enough to observe any eff ects of the new institutions on the regional levels of new fi rm forma-tion. It is reasonable to assume that a new institution will take more than one year to aff ect new fi rm creation in the region. This may be even more signifi cant in knowledge-intensive activities that can be generated through knowledge spillovers resulting from university R&D, or from companies started from graduates coming out from these institutions.
In order to observe the treatment eff ect more exactly, we used a diff er-ent matching technique, allowing for a more accurate comparison between municipalities. We therefore make use of the propensity score match-ing estimator, which will allow us to match municipalities according to their characteristics, and observe the eff ect more than one year after the creation of new institutions.
Propensity Score Matching Method
The propensity score matching method is a matching technique that makes the distribution of observable characteristics of treatment and control groups similar (Rosenbaum and Rubin, 1983). The diff erence is that we now compare treated municipalities with non-treated municipalities that are similar in a number of characteristics, controlling for the heterogeneity of the treated group. This is the advantage of propensity scores match-ing methods, since they correct for sample selection bias resulting from observable diff erences between the treatment and comparison groups (Dehejia and Wahba, 2002).
The propensity score is the conditional probability of receiving a par-ticular treatment (in this case, having a new higher education institution) given a vector of observed covariates (pre-treatment characteristics):
p(X) ; Pr{D 5 1 0X} 5 E{D 0X} (10.1)
Where D = {0, 1} is the indicator of exposure to treatment and X is the multidimensional vector of pre-treatment characteristics (Becker and Ichino, 2002).
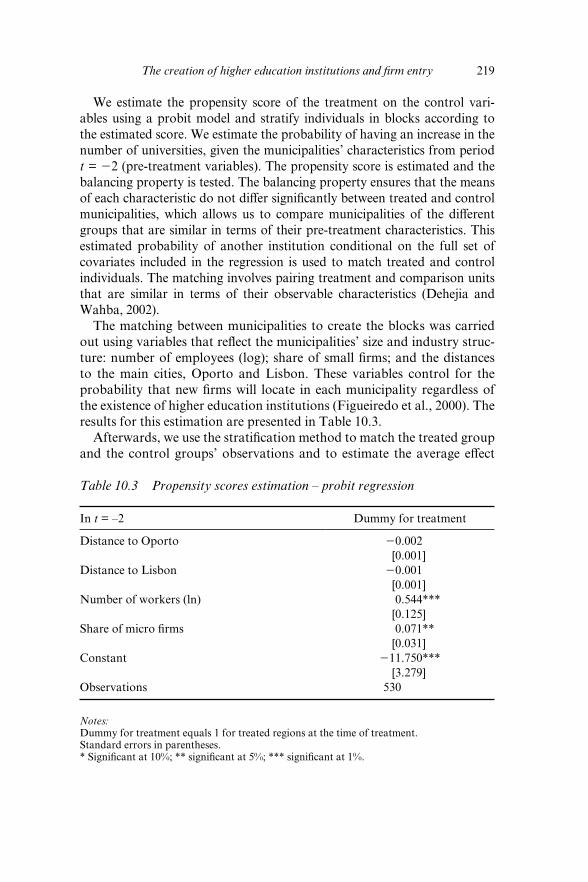
The creation of higher education institutions and fi rm entry 219
We estimate the propensity score of the treatment on the control vari-ables using a probit model and stratify individuals in blocks according to the estimated score. We estimate the probability of having an increase in the number of universities, given the municipalities’ characteristics from period t = 22 (pre-treatment variables). The propensity score is estimated and the balancing property is tested. The balancing property ensures that the means of each characteristic do not diff er signifi cantly between treated and control municipalities, which allows us to compare municipalities of the diff erent groups that are similar in terms of their pre-treatment characteristics. This estimated probability of another institution conditional on the full set of covariates included in the regression is used to match treated and control individuals. The matching involves pairing treatment and comparison units that are similar in terms of their observable characteristics (Dehejia and Wahba, 2002).
The matching between municipalities to create the blocks was carried out using variables that refl ect the municipalities’ size and industry struc-ture: number of employees (log); share of small fi rms; and the distances to the main cities, Oporto and Lisbon. These variables control for the probability that new fi rms will locate in each municipality regardless of the existence of higher education institutions (Figueiredo et al., 2000). The results for this estimation are presented in Table 10.3.
Afterwards, we use the stratifi cation method to match the treated group and the control groups’ observations and to estimate the average eff ect
Table 10.3 Propensity scores estimation – probit regression
In t = –2 Dummy for treatment
Distance to Oporto 20.002[0.001]
Distance to Lisbon 20.001[0.001]
Number of workers (ln) 0.544***[0.125]
Share of micro fi rms 0.071**[0.031]
Constant 211.750***[3.279]
Observations 530
Notes:Dummy for treatment equals 1 for treated regions at the time of treatment.Standard errors in parentheses.* Signifi cant at 10%; ** signifi cant at 5%; *** signifi cant at 1%.
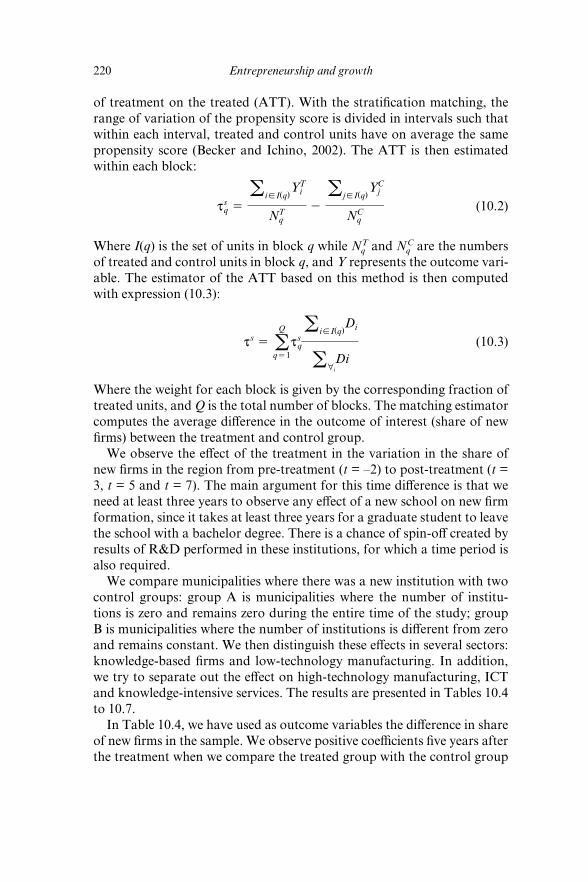
220 Entrepreneurship and growth
of treatment on the treated (ATT). With the stratifi cation matching, the range of variation of the propensity score is divided in intervals such that within each interval, treated and control units have on average the same propensity score (Becker and Ichino, 2002). The ATT is then estimated within each block:
tsq 5
a i[I(q)YT
i
NTq
2a j[I(q)
YCj
NCq
(10.2)
Where I(q) is the set of units in block q while NqT and Nq
C are the numbers of treated and control units in block q, and Y represents the outcome vari-able. The estimator of the ATT based on this method is then computed with expression (10.3):
ts 5 aQ
q51ts
q
a i[I(q)Di
a4iDi
(10.3)
Where the weight for each block is given by the corresponding fraction of treated units, and Q is the total number of blocks. The matching estimator computes the average diff erence in the outcome of interest (share of new fi rms) between the treatment and control group.
We observe the eff ect of the treatment in the variation in the share of new fi rms in the region from pre-treatment (t = –2) to post-treatment (t = 3, t = 5 and t = 7). The main argument for this time diff erence is that we need at least three years to observe any eff ect of a new school on new fi rm formation, since it takes at least three years for a graduate student to leave the school with a bachelor degree. There is a chance of spin-off created by results of R&D performed in these institutions, for which a time period is also required.
We compare municipalities where there was a new institution with two control groups: group A is municipalities where the number of institu-tions is zero and remains zero during the entire time of the study; group B is municipalities where the number of institutions is diff erent from zero and remains constant. We then distinguish these eff ects in several sectors: knowledge-based fi rms and low-technology manufacturing. In addition, we try to separate out the eff ect on high-technology manufacturing, ICT and knowledge-intensive services. The results are presented in Tables 10.4 to 10.7.
In Table 10.4, we have used as outcome variables the diff erence in share of new fi rms in the sample. We observe positive coeffi cients fi ve years after the treatment when we compare the treated group with the control group

The creation of higher education institutions and fi rm entry 221
B (group with constant and positive number of universities). This means that for general manufacturing fi rms, the creation of a new university in a region generated an increase of 6.5 per cent in the share of new fi rms fi ve years after the entrance of a new higher education institution. All other estimations provided insignifi cant results. These results mean that there is no signifi cant diff erence in the rates of new fi rm entry between treated municipalities and the control groups, when considering the manufacturing sectors.
In Table 10.5, we present the results for knowledge-based fi rms. We observe that the creation of new universities has a positive impact on the entry of fi rms in knowledge-related activities. This positive eff ect is observed in the diff erences in the share of new fi rms three and fi ve years after the treatment. When we use both control groups together, we obtain an eff ect of 21 and 24 per cent, which increases when we compare only with group A (with no universities), where the eff ect rises to 30 per cent and 33 per cent. Comparing with control group B provided insignifi cant results. For the diff erence in the share of new knowledge-based fi rms seven years after treatment, we observe an increase of 27 per cent when using both control groups, but this impact is not visible when comparing separately
Table 10.4 Eff ect of a new higher education institution on fi rm entry in regions – ATT estimation with the stratifi cation matching method
No. treated No. control ATT Std. error
Diff erence in the share of new fi rms between t = 3 and t = 22 Control group A+B 15 441 22.176 1.448 Control group A 13 406 22.806 2.125 Control group B 13 37 0.087 2.185Diff erence in the share of new fi rms between t = 5 and t = 22 Control group A+B 15 441 0.115 1.799 Control group A 13 406 21.247 1.995 Control group B 13 37 6.511* 2.036Diff erence in the share of new fi rms between t = 7 and t = 22 Control group A+B 15 441 21.489 2.146 Control group A 13 406 22.712 2.593 Control group B 13 37 2.436 2.319
Notes:ATT = average treatment eff ect on the treated.* Signifi cant at 10%; ** signifi cant at 5%; *** signifi cant at 1%.Group A = municipalities with number of institutions equal to zero.Group B = municipalities with number of institutions constant and diff erent from zero.

222 Entrepreneurship and growth
with control groups A and B. Access to external knowledge sources is important for fi rms’ innovative activity. Thus we would expect sectors that are more dependent on new knowledge to benefi t more from locating near a university. According to Audretsch et al. (2004), younger fi rms are more likely to locate closer to universities with a high number of students. These results refl ect this tendency and provide evidence of the role of higher edu-cation institutions in the shift towards knowledge-based sectors, visible in municipalities where a new university was created. This result is strength-ened when we compare the treated group with municipalities that have no higher education institutions, suggesting once more that universities do make a diff erence to make this shift to knowledge-based sectors.
The opposite eff ect is observed when we focus only on low-technology fi rms, as can be seen in Table 10.6. All estimations revealed a negative and signifi cant coeffi cient, showing a negative impact of new higher educa-tion institutions on entry of fi rms in these sectors. There is evidence that low-technology sectors benefi t less from locating close to a university, since they are less likely to use it as a source of knowledge and as a coop-eration partner (Faria et al., 2007). These results are also in agreement with a transfer towards the ‘new economy’. The decrease of entry in low-
Table 10.5 Eff ect of a new higher education institution on the entry of knowledge-based fi rms in regions – ATT estimation with the stratifi cation matching method
No. treated No. control ATT Std. error
Diff erence in the share of new fi rms between t = 3 and t = 22 Control group A+B 15 441 23.862* 13.069 Control group A 13 406 30.338* 17.132 Control group B 15 35 166.945 120.570Diff erence in the share of new fi rms between t = 5 and t = 22 Control group A+B 15 441 26.739** 13.286 Control group A 13 406 33.068** 15.715 Control group B 15 35 172.001 118.146 Diff erence in the share of new fi rms between t = 7 and t = 22 Control group A+B 15 441 27.014* 16.047 Control group A 13 406 – – Control group B 13 37 321.946 225.462
Notes:ATT = average treatment eff ect on the treated.* Signifi cant at 10%; ** signifi cant at 5%; *** signifi cant at 1%.Group A = municipalities with number of institutions equal to zero.Group B = municipalities with number of institutions constant and diff erent from zero.

The creation of higher education institutions and fi rm entry 223
technology sectors is stronger in regions where a new university is created, when compared with others. Again, these results suggest that higher education institutions have a role in the change of economic activity in municipalities.
We try to distinguish if entry of knowledge-based fi rms is more focused on high technology activities, ICT, or knowledge-intensive services, by dividing our sample into these three sectors. The results obtained are illus-trated in Table 10.7. In the knowledge-intensive services sample, we obtain a positive eff ect in the diff erence of the share of new fi rms between t = 5 and t = –2, when comparing the treated group with control group B. Thus, we observe a 9 per cent increase in the entry of fi rms in knowledge-intensive services for the treated group fi ve years after treatment, when compared with regions with a constant number of universities. This may be a combi-nation of short- and long-term eff ects, on the one hand a consequence of fi rms in services sectors starting their activity to serve the needs of a new institution in the municipality, and on the other hand some fi rms in con-sulting businesses coming out of faculty members and/or students from the institutions. All the other estimations lead to insignifi cant results. These results are unexpected; we were expecting an eff ect on entry of ICT fi rms,
Table 10.6 Eff ect of a new higher education institution on the entry of low-technology fi rms in regions – ATT estimation with the stratifi cation matching method
No. treated No. control ATT Std. error
Diff erence in the share of new fi rms between t = 3 and t = 22 Control group A+B 15 441 23.989*** 1.010 Control group A 15 407 23.484*** 1.071 Control group B 15 35 24.723*** 1.461Diff erence in the share of new fi rms between t = 5 and t = 22 Control group A+B 15 441 23.190** 1.574 Control group A 15 407 23.725** 1.599 Control group B 15 35 0.792 1.620Diff erence in the share of new fi rms between t = 7 and t = 22 Control group A+B 15 441 24.589*** 1.914 Control group A 15 407 24.502** 2.106 Control group B 13 37 –2.788 2.230
Notes:ATT = average treatment eff ect on the treated.* Signifi cant at 10%; ** signifi cant at 5%; *** signifi cant at 1%.Group A = municipalities with number of institutions equal to zero.Group B = municipalities with number of institutions constant and diff erent from zero.
224 Entrepreneurship and growth
Table 10.7 Eff ect of a new higher education institution on the entry of diff erent knowledge-based sectors – ATT estimation with the stratifi cation matching method
No. treated No. control ATT Std. error
High-tech fi rmsDiff erence in the share of new fi rms between t = 3 and t = 22 Control group A+B 15 441 20.138 17.746 Control group A 15 407 2.997 20.439 Control group B 15 35 – –Diff erence in the share of new fi rms between t = 5 and t = 22 Control group A+B 15 441 24.219 19.251 Control group A 15 407 23.649 13.738 Control group B 15 35 – –Diff erence in the share of new fi rms between t = 7 and t = 22 Control group A+B 15 441 213.088 20.797 Control group A 15 407 213.080 22.898 Control group B 15 35 – –ICT fi rmsDiff erence in the share of new fi rms between t = 3 and t = 22 Control group A+B 15 441 2.857 13.507 Control group A 15 407 5.983 13.647 Control group B 15 35 – –Diff erence in the share of new fi rms between t = 5 and t = 22 Control group A+B 15 441 23.271 9.999 Control group A 15 407 0.146 11.467 Control group B 15 35Diff erence in the share of new fi rms between t = 7 and t = 22 Control group A+B 15 441 27.626 9.507 Control group A 15 407 23.842 11.139 Control group B 13 37 – –Knowledge-intensive service fi rmsDiff erence in the share of new fi rms between t = 3 and t = 22 Control group A+B 15 441 20.997 2.697 Control group A 15 407 1.143 3.239 Control group B 15 35 3.459 6.148Diff erence in the share of new fi rms between t = 5 and t = 22 Control group A+B 15 441 2.778 2.879 Control group A 15 407 5.396 3.388 Control group B 13 37 9.942*** 3.868Diff erence in the share of new fi rms between t = 7 and t = 22 Control group A+B 15 441 0.785 3.135 Control group A 15 407 1.558 3.272 Control group B 13 37 8.489 7.675
The creation of higher education institutions and fi rm entry 225
at least in the short run, entering by using the opportunity to serve the needs of the new institutions in the municipality. One of the explanations for this is that we decrease the number of fi rms entering, the number of observations in the sample, which does not allow us to observe any eff ect.
The results give partial support for hypothesis 1, since the impact of a new higher education institution will aff ect new fi rm entry only in certain sectors, and provide support for hypothesis 2, given that we obtained diff erent results when diff erentiating the sector.
CONCLUDING REMARKS
In this chapter we determined the impact of the creation of new higher education institutions in municipalities on the subsequent levels of new fi rm entry. We studied this eff ect making use of the fi rst-diff erences and propensity score matching, appropriate to the study of policy analysis, to capture the eff ect of an increase in the number of universities in a munici-pality on the levels of new fi rm entry, and explain diff erences between the treatment and the control groups. We compare municipalities where there was an increase in the number of universities with municipalities that have no universities throughout the entire time period and with munici-palities with a constant number of universities. We fi nd that these three groups (the treatment and two control groups) have diff erent patterns of new fi rm entry throughout time. Estimations of the averaged treatment eff ect reveal a positive impact of the creation of new universities in the lagged share of new fi rm entry in knowledge-intensive sectors. There is a signifi cant decrease in the entry of fi rms in low-technology industries in regions where a new higher education institution was created. We also observe an increase in the entry of fi rms in knowledge-intensive services, fi ve years after treatment. We cannot observe any other eff ects when dis-tinguishing knowledge-based activities in high-tech manufacturing, ICT and knowledge-related services, probably because of the small number of entries observed in these sectors using the municipality as the regional unit of analysis. The overall results indicate that the creation of a new higher
Table 10.7 (continued)
Notes:ATT = average treatment eff ect on the treated.* Signifi cant at 10%; ** signifi cant at 5%; *** signifi cant at 1%.Group A = municipalities with number of institutions equal to zero.Group B = municipalities with number of institutions constant and diff erent from zero.
226 Entrepreneurship and growth
education school in a region will contribute to the shift to a knowledge-based economy.
Our analysis contributes to the literature on the role played by universities and the regional knowledge base as sources of entrepreneurial opportunities, through the use of data allowing the application of econometric techniques for the analysis of policy and treatment eff ects. The identifi cation of the structural determinants that have an impact on the growth of start-up rates, at a regional level, is useful to formulate public policies that have as objective infl uence the start-up activity by region. Many governments have created initiatives to foster technological commercialization, and with that purpose in mind have supported the interaction between universities and regions (Laursen and Salter, 2004). However, even without establishing formal relationships, fi rms and regions can benefi t from the presence of a university. Our results indicate that universities enhance regional development and that less favoured regions would benefi t from the establishment of a new institu-tion. These regions can benefi t not only from knowledge spillovers from the institutions, but also from the availability of more highly educated people.
NOTES
1. See Cabral and Mata (2003) for a description of the quality and coverage of the data.2. Results available from the authors.
REFERENCES
Acs, Z., D.B. Audretsch and M.P. Feldman (1994), ‘R&D spillovers and recipient fi rm size’, Review of Economics and Statistics, 76 (2), 336–40.
Anselin, L., A. Varga and Z. Acs (1997), ‘Local geographic spillovers between uni-versity research and high technology innovations’, Journal of Urban Economics, 42 (3), 422–48.
Audretsch, D.B. and M.P. Feldman (2004), Knowledge spillovers and the geog-raphy of innovation, in Handbook of Regional and Urban Economics, Vol. 4, Amsterdam: Elsevier, pp. 2713–39.
Audretsch, D.B., E. Lehmann and S. Warning (2004), ‘University spillovers: does the kind of science matter?’, Industry and Innovation, 11 (3), 193–205.
Audretsch, D.B., E. Lehmann and S. Warning (2005), ‘University spillovers and new fi rm location’, Research Policy, 34 (7), 1113–22.
Audretsch, D.B. and P.E. Stephan (1996), ‘Company-scientist locational links: the case of biotechnology’, The American Economic Review, 86 (3), 641–52.
Bania, N., R.W. Eberts and M.S. Fogarty (1993), ‘Universities and the start-up of new companies: can we generalise from Route 128 and Silicon Valley?’, The Review of Economics and Statistics, 75, 761–66.
Baptista, R. and J. Mendonça (2007), ‘Proximity to knowledge sources and the
The creation of higher education institutions and fi rm entry 227
location of knowledge based start-ups’, Workshop on Agglomeration and Growth in Knowledge-based Societies, Kiel Institute for the World Economy, Kiel, Germany.
Baptista, R. and M.T. Preto (2006), ‘Entrepreneurship and industrial re-structur-ing: what kinds of start-ups matter most for job creation?’, Discussion Paper 06/06, Centre for Innovation, Technology and Policy Research, IN1, Instituto Superior Técnico, Technical University of Lisbon, Portugal.
Baptista R. and P. Swann (1999), ‘A comparison of clustering dynamics in the US and UK computer industries’, Journal of Evolutionary Economics, 9 (3), 373–99.
Baum, J.A.C. and O. Sorenson (eds) (2003), Advances in Strategic Management: Geography and Strategy, Vol. 20, Greenwich, CT: JAI Press.
Becker, S.O. and A. Ichino (2002), ‘Estimation of average treatment eff ects based in propensity scores’, Stata Journal, 2 (4), 358–77.
Cabral, L.M.B. and J. Mata (2003), ‘On the evolution of the fi rm size distribution: facts and theory’, American Economic Review, 93 (4), 1075–90.
Capello, R. (2002), ‘Entrepreneurship and spatial externalities: theory and meas-urement’, The Annals of Regional Science, 36 (3), 387–402.
Caraça, J., P. Conceição and M.V. Heitor (2000), ‘Towards a public policy for the research university in Portugal’, Higher Education Policy, 13 (2), 181–201.
Cohen, W.M. and D.A. Levinthal (1989), ‘Innovation and learning: the two faces of R&D’, The Economic Journal, 99 (397), 569–96.
Correia, F., A. Amaral and A. Magalhães (2002), ‘Public and private higher education in Portugal: unintended eff ects of deregulation’, European Journal of Education, 37 (4), 457–72.
Dehejia, R.H. and S. Wahba (2002), ‘Propensity score-matching methods for nonexperimental causal studies’, The Review of Economics and Statistics, 84 (1), 151–61.
Faria, P., F. Lima and R. Santos (2007), ‘Cooperation in innovation: empiri-cal evidence from an innovation survey’, Academy of Management, Annual Meeting, Philadelphia, USA.
Feldman, M.P. (2000), ‘Location and innovation: the new economic geography of innovation’, in G. Clark, M.P. Feldman and M. Gertler (eds), Oxford Handbook of Economic Geography, Oxford: Oxford University Press.
Figueiredo, O., P. Guimarães and D. Woodward (2000), ‘Home-fi eld advantage: location decisions of Portuguese entrepreneurs’, Journal of Urban Economies, 52 (2), 341–61.
Fisher, M.M. and A. Varga (2003), ‘Spatial knowledge spillovers and univer-sity research: evidence from Austria’, The Annals of Regional Science, 37 (2), 303–22.
Fritsch, M. (2001), ‘Cooperation in regional innovation systems’, Regional Studies, 35 (4), 297–307.
Henderson, R., A.B. Jaff e and M. Trajtenberg (1998), ‘Universities as a source of commercial technology: a detailed analysis of university patenting, 1965–1988’, Review of Economics and Statistics, 80 (1), 119–27.
Horta, H. (2008), ‘On improving the university research base: the Technical University of Lisbon case in perspective’, Higher Education Policy, 21 (1) 123–46.
Jaff e, A. (1989), ‘Real eff ects of academic research’, The American Economic Review, 79 (5), 957–69.

228 Entrepreneurship and growth
Klepper, S. (2002), ‘The capabilities of new fi rms and the evolution of the US auto-mobile industry’, Industrial and Corporate Change, 11 (4), 645–66.
Laursen, K. and A. Salter (2004), ‘Searching high and low: what types of fi rms use universities as a source of innovation?’, Research Policy, 33 (8), 1201–15.
Lee, S., R. Florida and Z. Acs (2004), ‘Creativity and entrepreneurship: a regional analysis of new fi rm formation’, MPI, Discussion Papers on Entrepreneurship, Growth and Public Policy 1704.
Lerner, J. (2005), ‘The universities and the start-up: lessons from the past two decades’, Journal of Technology Transfer, 30 (1/2), 49–56.
Mazzoneli, R. and R.R. Nelson (2007), ‘Public research institutions and economic catch-up’, Research Policy, 36 (10), 1512–28.
OECD (2002), Science, Technology and Industry, Paris: Organisation for Economic Co-operation and Development.
Rosenbaum, P. and D. Rubin (1983), ‘The central role of the propensity score in observational studies for causal eff ects’, Biometrika, 70 (1), 41–55.
Scott, J.T. (2003), ‘Absorptive capacity and the effi ciency of research partnerships’, Technology Analysis and Strategic Management, 15 (2), 247–53.
Sorenson, O. and G. Audia (2000), ‘The social structure of entrepreneurial activ-ity: geographic concentration of footwear production in the U.S., 1940–1989’, American Journal of Sociology, 106 (2), 324–62.
Spencer, J.W. (2001), ‘How relevant is university-based scientifi c research to private high-technology fi rms? a United States–Japan comparison’, Academy of Management Journal, 44 (2), 432–40.
Stahlecker, T. and K. Koschatzky (2004), ‘On the signifi cance of geographical proximity for the structure and development of newly founded knowledge inten-sive business service fi rms’, Working Papers Firms and Regions, No. R2/2004, Fraunhofer Institute.
Stuart, T.E. and O. Sorenson (2003), ‘The geography of opportunity: spatial heterogeneity in founding rates and the performance of biotechnology fi rms’, Research Policy, 32 (2), 229–53.
Varga, A. (2000), ‘Local academic knowledge transfers and the concentration of economic activity’, Journal of Regional Science, 40 (2), 289–309.
Zucker, L., M.R. Darby and J. Armstrong (1998), ‘Intellectual human capital and the birth of U.S. biotechnology enterprises’, The American Economic Review, 88 (1), 290–306.
Zucker, L., M.R. Darby and J. Armstrong (2002), ‘Commercializing knowledge: university science, knowledge capture and fi rm performance in biotechnology’, Management Science, 48 (1), 138–53.

The creation of higher education institutions and fi rm entry 229
APPENDIX: SECTORS CONSIDERED (OECD, 2002)
High-technology Industries
Aircraft and spacecraft (35.3) ●
Pharmaceuticals (24.4) ●
Offi ce and computing machinery (30) ●
Radio, TV and communication equipment (32) ●
Medical, precision and optical equipment (33) ●
Medium-high-technology Industries
Chemicals excluding pharmaceuticals (24 excp. 24.4) ●
Machinery and equipment (29) ●
Electrical machinery and apparatus (34) ●
Motor vehicles and trailers (34) ●
Railroad and transport equipment (352 ● 1 359)
Medium-low-technology Industries
Coke, refi ned petroleum products and nuclear fuel (23) ●
Rubber and plastic services (25) ●
Other non-metallic mineral products (26) ●
Basic metals (27) ●
Fabricated metal products except machinery and equipment (28) ●
Building and repairing of ships and boats (351) ●
Low-technology Industries
Food products, beverages and tobacco (15–16) ●
Textile, textile products, leather and footware (17–19) ●
Wood, pulp, paper, paper products, printing and publishing ●
(21–22)Manufacturing and recycling (21–22) ●
Information and Communication Technologies Industries (ICT)
Offi ce and computing machinery (30) ●
Radio, TV and communication equipment (32) ●
Medical, precision and optical equipment (33) ●
Post and Communication (64) ●
Computer and related activities (72) ●

230 Entrepreneurship and growth
Knowledge-based industries (KBE)
High-technology industries: Aircraft and spacecraft (35.3) ● 1 phar-maceuticals (24.4) 1 Offi ce and computing machinery (30) 1 Radio, TV and communication equipment (32) 1 Medical, precision and optical equipment (33)Medium-high-technology: Chemicals excluding pharmaceuticals (24 ●
excp. 24.4) 1 Machinery and equipment (29) 1 Electrical machinery and apparatus (34) 1 motor vehicles and trailers (34) 1 Railroad and transport equipment (352 1 359)Post and communication (64) ●
Finance and insurance (65–67) ●
Business services (71–74) ●
231
11. Cooperation with universities and research institutions for corporate entrepreneurship activities: the infl uence of the technological intensity of the environmentÁngela González-Moreno and Francisco J. Sáez-Martínez
INTRODUCTION
Entrepreneurship research has primarily been concerned with the start-up of new fi rms, being traditionally viewed as an individual-level activity related to the creation of new organizations. However, entrepreneurship has recently become accepted as a fi rm-level phenomenon (Teng, 2007), which is of relevance to managers regardless of the size and age of their organization. The notion of corporate entrepreneurship (CE) extends the idea of being bold, proactive and aggressive to established fi rms and can be defi ned as ‘the sum of a company’s innovation, renewal and venturing eff orts’ (Zahra, 1995, p. 227). CE is therefore defi ned as entrepreneurship activities within an existing organization.
Innovation is the most common and important aspect of CE (Covin and Miles, 1999). Innovation activities have often emphasized research and development (R&D) work leading to technological novelties, with academics traditionally paying attention to high-technology sectors, while largely neglecting or underestimating innovations in low- and medium-technology industries. CE activities have a high degree of risk, and fi rms try to improve the odds of innovation through various approaches, with one example being the formation of R&D alliances to carry out joint research (Hagedoorn, 1993). In R&D alliances, fi rms can share costs and risks, as well as achieve economies of scale in research (Deeds and Hill, 1996). There is growing interest in cooperative arrangements for innovation in the literature, and innovation is seen as becoming increasingly distrib-uted as fewer fi rms are able to ‘go it alone’ in technological development

232 Entrepreneurship and growth
(Tether, 2002, p. 947). This is particularly important for fi rms located in low- and medium-technology industries who look for cooperation in the absence of formal R&D activities on their own part.
High-technology sectors are associated with high technological oppor-tunities and fi rms in these types of industries are expected to be more frequent innovators than those in low-technology sectors. Tether (2002) found that high-technology fi rms are more likely than other fi rms to coop-erate with regard to innovation. However, the relationship between the sector and the motivation of fi rms for cooperation still remains unclear. One open question is whether the fi rm’s innovation strategy infl uences its proclivity to pursue external alliances, and whether there is a diff erent pattern of cooperation regarding the technological intensity of the indus-try in which the fi rm operates. This chapter intends to fi ll this gap in the literature.
Firms benefi t from entering into cooperative arrangements regarding innovation with diff erent types of organizations. However, there is a risk in losing one’s distinctive competencies through collaboration, as partners can appropriate fi rm-specifi c knowledge (Hamel, 1991). Bercovitz and Feldman (2007) suggest that universities are preferred partners when there are concerns about the perceived ability to fully appropriate the results of R&D investments. For the purpose of this chapter, we analyse the cooper-ation arrangements with universities and research institutions (U&RI), as both are important contributors to the supply of new technological knowl-edge. The growing level of activity at the university–industry interface makes it imperative that we increase our understanding of this relation-ship. Although fi rm–university cooperative relationships have been ana-lysed in several papers (Acosta and Modrego, 2001; Bayona et al., 2002), it has been mainly done from the university point of view (Jones-Evans and Klofsten, 1998; Azagra-Caro et al., 2006). A remaining question is if, or how, the balance a fi rm maintains with the R&D conducted in-house infl u-ences the fi rm’s proclivity to pursue U&RI cooperation (Bercovitz and Feldman, 2007) and whether there is a diff erent pattern of cooperation in low- and medium-technology sectors compared to high-technology indus-tries. This chapter contributes to the literature by answering this question. The objective is to investigate how a fi rm’s innovation strategy, in terms of internal focus and internal organization, infl uences the decision to engage in R&D cooperation with U&RI, and to analyse the main motivation for these arrangements. We also analyse whether a fi rm’s motivation to cooperate with U&RI and its innovation strategy is diff erent in the case of high-tech industries than in fi rms in low- and medium-technology sectors. In doing so, we investigate the determinants of cooperative arrangements with U&RI in Spain during the period between 1998 and 2000.
Cooperation with universities and research institutions 233
The chapter is organized as follows. In the next section, we present the main motivations to cooperate with U&RI identifi ed in the literature. Next, we consider the characteristics of low- and medium-technology sectors and their relationship with R&D cooperation with U&RI. Then we present the theoretical framework used to examine the connections between a fi rm’s innovation strategy and its cooperation with U&RI, followed by presenta-tion of the data and the methodology. Finally, we show the results of our empirical analysis and the main conclusions that can be extracted.
LITERATURE REVIEW
Why Cooperate with Universities and Research Institutions?
A common thread throughout the literature on fi rm strategy and perform-ance is the widespread use of collaboration at all stages of the innovation process in order to accelerate innovative activities (Hall and Bagchi-Sen, 2007; Terziosvki and Morgan, 2006). Furthermore, the circular or inter-active model of innovation process in which multiple relationships must be established between all the departments of the fi rm, as well as with external agents, means that cooperative R&D is a necessary condition for a fi rm to survive (Häusler et al., 1994).
Hagedoorn et al. (2000) describe the literature that attempts to explain, from a theoretical point of view, why fi rms enter into cooperative arrange-ments. They point out three broad categories of literature, namely trans-action costs, strategic management and industrial organization theory. Industrial organization theory typically examines the eff ects of fi rms’ actions on industrial structure, social welfare and economic effi ciency, whereas management theory focuses on the fi rm and the internal organiza-tion of its activities. Transaction costs also attempts to explain the reasons for fi rms to organize internally. As we have already mentioned, the objec-tive of this chapter is to study how a fi rm’s innovation strategy, in terms of internal focus and internal organization, infl uences its decision to engage in R&D cooperation with U&RI. Our focus is on the fi rm’s organiza-tion of R&D activities, and following Combs (1999), we use the strategic management approach with transactions costs as a framework to analyse the main reasons that lead a fi rm to cooperate with U&RI (Table 11.1). Rather than mutually exclusive, these approaches are complementary.
Transaction costs economics (Williamson, 1985) considers cooperation agreements as a hybrid form of organization between the market and the hierarchy that facilitates carrying out R&D activities. From this theo-retical point of view, fi rms would engage in cooperation with U&RI to
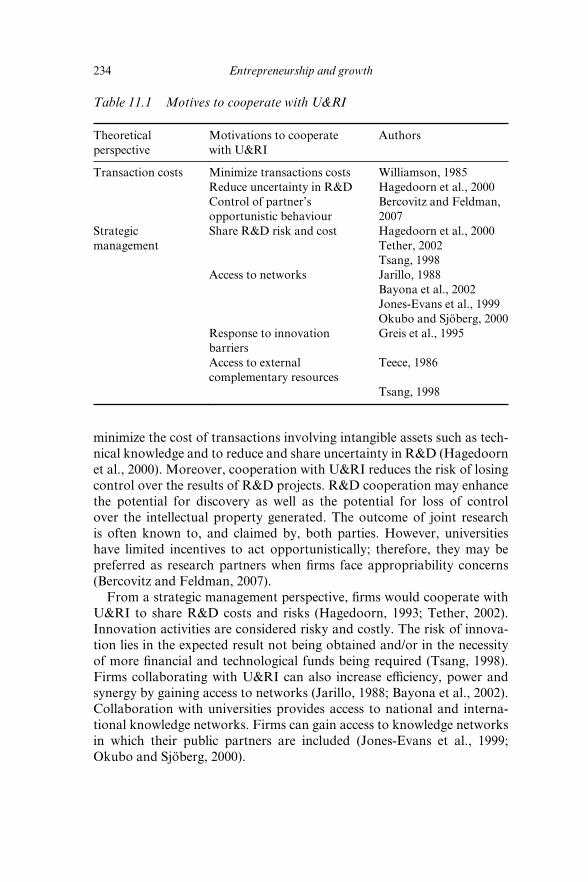
234 Entrepreneurship and growth
minimize the cost of transactions involving intangible assets such as tech-nical knowledge and to reduce and share uncertainty in R&D (Hagedoorn et al., 2000). Moreover, cooperation with U&RI reduces the risk of losing control over the results of R&D projects. R&D cooperation may enhance the potential for discovery as well as the potential for loss of control over the intellectual property generated. The outcome of joint research is often known to, and claimed by, both parties. However, universities have limited incentives to act opportunistically; therefore, they may be preferred as research partners when fi rms face appropriability concerns (Bercovitz and Feldman, 2007).
From a strategic management perspective, fi rms would cooperate with U&RI to share R&D costs and risks (Hagedoorn, 1993; Tether, 2002). Innovation activities are considered risky and costly. The risk of innova-tion lies in the expected result not being obtained and/or in the necessity of more fi nancial and technological funds being required (Tsang, 1998). Firms collaborating with U&RI can also increase effi ciency, power and synergy by gaining access to networks (Jarillo, 1988; Bayona et al., 2002). Collaboration with universities provides access to national and interna-tional knowledge networks. Firms can gain access to knowledge networks in which their public partners are included (Jones-Evans et al., 1999; Okubo and Sjöberg, 2000).
Table 11.1 Motives to cooperate with U&RI
Theoretical perspective
Motivations to cooperate with U&RI
Authors
Transaction costs Minimize transactions costs Williamson, 1985Reduce uncertainty in R&D Hagedoorn et al., 2000Control of partner’s opportunistic behaviour
Bercovitz and Feldman, 2007
Strategic management
Share R&D risk and cost Hagedoorn et al., 2000Tether, 2002Tsang, 1998
Access to networks Jarillo, 1988Bayona et al., 2002Jones-Evans et al., 1999Okubo and Sjöberg, 2000
Response to innovation barriers
Greis et al., 1995
Access to external complementary resources
Teece, 1986
Tsang, 1998

Cooperation with universities and research institutions 235
Another explanation from this theoretical point of view is that fi rms cooperating with U&RI gain access to external complementary resources such as fi nancial, personnel and knowledge resources (Teece, 1986; Tsang, 1998). Firms seek cooperation and external partnering as a response to innovation barriers (Greis et al., 1995). These barriers usually refl ect a lack of resources and the impact of regulations and other factors that make innovation diffi cult. In summary, from the perspective of transaction costs and strategic management, we can affi rm that fi rms will cooperate with U&RI in order to gain access to resources (fi nancial, organizational, etc.) that without them make innovation diffi cult. Firms cooperate for innovation because they do not have all the necessary resources internally. Formally, we propose:
H1: The probability of cooperating with U&RI for CE activities is posi-tively related to the perception of factors hampering innovation.
Innovation Strategy and Cooperation with U&RI
Innovation strategy is strongly related to cooperation, and research has found that fi rms that undertake R&D are more rather than less likely to enter into cooperation agreements (Fritsch and Lukas, 2001; Tether, 2002). Firms carry on R&D partly to raise their absorptive capacity; that is, their ability to learn from their environment and from the work of others (Cohen and Levinthal, 1990). The greater the importance the company gives to R&D, the greater its propensity to cooperate.
Collaboration as an innovation strategy allows individual fi rms lacking the specifi c resources or expertise to advance scientifi c discoveries. However, internal capability and external cooperation have been found to be complementary to each other rather than substitutes (Rothaermel, 2001). Some studies have found that higher levels of R&D spending and technological sophistication are positively associated with higher levels of cooperation (Hagedoorn, 1995). Firms with strong R&D possess the resources and technological base to off er potential partners, and, hence, are more likely to be presented with opportunities to cooperate (Rothaermel, 2001).
A fi rm’s investment in internal R&D builds absorptive capacity that positions the fi rm to take advantage of external cooperation. Absorptive capacity is particularly acute when tapping university-based resources:
When outside knowledge is less targeted to the fi rm’s particular needs and concerns, a fi rm’s own R&D becomes more important in permitting it to rec-ognize the value of knowledge and to assimilate and exploit it. Sources that
236 Entrepreneurship and growth
produce less targeted knowledge would include university labs involved in basic research. (Cohen and Levinthal, 1990, p. 140)
Following this argument, some authors (e.g. Fontana et al., 2006; Schartinger et al., 2001) incorporate the level of R&D expenditure when analysing fi rm–university relationships.1 Firms that invest heavily in R&D are likely to possess high technological capability. This capability also allows them to absorb the knowledge developed outside the fi rm. According to the notion of absorptive capacity, the higher the fi rm’s internal R&D, the higher the probability of cooperation with U&RI. R&D-intensive fi rms might be more likely to establish cooperation with U&RI, as they are active at the technological cutting edge and thus are more dependent on innovation developments than other fi rms. Firms with little internal exploration will be poorly positioned to either recognize or assimilate knowledge generated externally compared with fi rms that are actively generating new and diverse knowledge internally (Cohen and Levinthal, 1990).
Recently, Hall and Bagchi-Sen (2007) have found that fi rms with high levels of R&D intensity placed signifi cantly more importance on their own research capability, their access to university research, and their ability to enter into cooperation with universities. Similarly, Tether (2002) showed that fi rms engaged in R&D were more likely to have cooperative arrangements with universities. Moreover, the intensity of R&D also had an impact. Firms that undertook R&D on a continuous basis, and also spent especially highly on R&D, were more likely to cooperate with uni-versities for innovation purposes. Therefore, we would expect the higher a fi rm’s internal R&D, the higher its propensity to cooperate with U&RI. Based on the concept of absorptive capacity and the mentioned empirical fi ndings, we postulate:
H2: The probability of cooperating with U&RI for CE activities is positively related to the fi rm’s internal R&D expenses.
Laursen and Salter (2004) found that a fi rm’s ‘open’ searching activ-ity is an important determinant of university–industry collaborations. Following this line, but with a broader perspective, Fontana et al. (2006)2 found that openness impacted on the probability of a fi rm to develop a research project with U&RI, as well as on the number of research agree-ments developed. The percentage of external expenditure of independent organizations in total fi rm R&D expenditure is used as a proxy for the ‘openness of the fi rm’. Firms with a higher propensity to establish R&D collaboration with external organizations may have a greater propensity
Cooperation with universities and research institutions 237
to cooperate with U&RI. This could be explained by saying that once fi rms have developed the skills needed to manage cross-boundary relationships, they are likely to be more willing to cooperate with other external part-ners (U&RI) in the development of innovation activities. We would then expect that the greater the fi rm’s external expenses in R&D the greater its propensity to cooperate with U&RI. Formally, we propose:
H3: The probability of cooperating with U&RI for CE activities is positively related to the fi rm’s external R&D expenses.
Finally, other elements of innovation strategy such as the acquisition of machinery and equipment, other external knowledge (licences and patents), internal and external training for personnel, and marketing activities aimed at the introduction of the fi rm’s innovation may also aff ect its propensity to cooperate with U&RI for innovation. However, we do not make any a priori hypothesis about their infl uence.
Technology Intensity of the Environment and R&D Cooperation with U&RI
Companies innovate and take risks in anticipation of, or in response to, their environment, which poses challenges and off ers new opportunities to which organizations must respond creatively through CE (Zahra, 1993). The environment also serves as a source of ideas for innovations, and sup-pliers, competitors and customers provide incentives for fi rms’ innovation and risk taking. Firms in turbulent rather than stable environments tend to be more innovative and proactive (Naman and Slevin, 1993).
Dynamic environments have been found to encourage CE behaviour (Miller et al., 1988) and organizations often respond to challenging envi-ronments, such as dynamic environments, by taking risks, innovating and exhibiting proactive behaviours (Khandwalla, 1987). According to Miller and Friesen (1982, p. 6):
entrepreneurial fi rms are often found in dynamic environments [. . .] Such fi rms may even be partly responsible for making the environment dynamic [. . .] Because innovation prompts imitation, the more innovative the fi rms, the more dynamic their environments can become.
These arguments suggest a bi-directional relationship between environ-mental conditions and CE, which makes the latter a necessary condition to survive in dynamic environments. There are several sources of environ-mental dynamism, such as technological intensity (Sarkar et al., 2001).

238 Entrepreneurship and growth
Sectors with high technological opportunity are associated with high-technology activities, and fi rms in these sectors are expected to be more frequent innovators than those with low-technology activities.
Industries with greater aggregate levels of R&D intensity tend to support higher rates of fi rm-level innovative activity (Thornhill, 2006). The technological intensity of the environment aff ects innovation strate-gies, such as cooperative R&D. Empirically, Bayona et al. (2001) found that high-technology fi rms have a higher propensity to cooperate with clients. In the service industry, Tether (2002) found that high-technology fi rms were more likely to cooperate in innovation, as suggested in existing literature on knowledge-intensive and technology-based services (Sundbo and Gallouj, 2000). Regarding cooperation with universities, Tether (2002) found that high-technology manufacturers were more likely to have coop-eration with universities than low-technology ones were. Technological intensity of the environment aff ects R&D cooperation in three ways. It aff ects partner identifi cation, motivation for cooperative arrangements and the intensity of the relationship. For the purpose of this chapter, we focus on the motivation for cooperative arrangements with U&RI.
In the majority of cooperative partnerships, acquiring complementary knowledge is one of the main reasons to engage in these arrangements. Firms cooperate with U&RI as part of a demand for basic knowledge and for generic information, which U&RI are able to off er. Collaboration with U&RI is more focused on basic or generic knowledge (Bonaccorsi and Piccaluga, 1994; Vonortas, 1997). However, there is growing demand for applied knowledge (Gonard, 1999) and universities are modifying their approach by developing more applied research that is closely geared to the needs of business world (Santoro and Chakrabarti, 1999). Basic knowledge is always associated with high-technology industries, and in sectors with a higher complexity of technology, R&D cooperation with U&RI will be more frequent than in sectors with a lower complexity of technology (Santangelo, 2000; Orsenigo et al., 2001; Hagedoorn, 2002). Therefore, we can expect high-technology fi rms to have a higher propen-sity to cooperate with U&RI. Formally, we propose:
H4: High-technology fi rms will have a higher propensity to cooperate with U&RI than low- and medium-technology fi rms.
However, a remaining question is whether the profi le of the fi rm that cooperates with U&RI and its motivation are diff erent depending on the industry in which the fi rm operates. Increased complexity of technology and the inter-industrial nature of new technologies are motivations for strategic alliances. According to Hagedoorn (1993) the technological
Cooperation with universities and research institutions 239
intensity of diff erent sectors of industry can be expected to aff ect the motivation of companies to participate in strategic alliances. Strategic technology partnering in high-technology industries is strongly related to R&D cooperation, whereas in low- and medium-technology sectors, research is not a dominant feature of partnering and market access objectives prevail. Firms in low- and medium-technology industries seek cooperation in the absence of formal R&D activities on their own part. Therefore, we would expect that the motivations for cooperating with U&RI will be diff erent regarding the technology intensity of the industry. Formally, we propose:
H5: The motivations for cooperating with U&RI for CE activities of fi rms located in low- and medium-technology industries are diff er-ent from those of fi rms located in high-technology sectors.
In order to test our hypotheses, we investigate the determinants of cooperative arrangements with U&RI in Spain during the period 1998 to 2000. In the next section, we briefl y explain the data and the measures of variables.
DATA – THE SPANISH CONTEXT
The Spanish innovation system is characterized by reducing expenditures on R&D and a reduction of the importance of the public sector. Spain spends about 1.07 per cent of its GDP on R&D, which is little more than half the European average of 1.86 per cent (INE, 2005). Moreover, about 80 per cent of researchers belong to public institutions, compared with an average of 50 per cent in the European Union as a whole. Only 11 per cent of Spanish fi rms are innovative, compared with 25 per cent in the European Union. Private R&D accounts for 0.4 per cent of Spanish GDP, while in Europe it is about 1.2 per cent (Azagra-Caro et al., 2006).
In the USA and Japan, alliances with university partners are surpris-ingly common. As an example, Cohen et al. (2002a) found that more than one-third of their respondent fi rms used public research to address existing problems. On the contrary, in Europe, and particularly in Spain, this type of collaboration is less common. Spanish U&RI have been under pressure to move closer to industry, with government seeking to encour-age these institutions to undertake more industrially relevant research and to increase the competitiveness of Spanish industry through U&RI’s assistance. However, there is no tradition of these types of collaboration in the Spanish economy. In 1998, 7.8 per cent of innovating fi rms had
240 Entrepreneurship and growth
cooperation agreements with U&RI (INE, 1998); in 2005 only 6.12 per cent of innovating fi rms were cooperating with U&RI (INE, 2005).
In this chapter, information regarding the fi rm’s innovation and cooper-ation activities was drawn from the Third Community Innovation Survey (CIS3) carried out by the Spanish Statistical Institute (INE) in 2000. The unit of analysis is the fi rm and the sampling covered both manufacturing and services, excluding fi rms with fewer than ten employees. Our fi nal sample consisted of 11 778 fi rms: 9684 fi rms in low- and medium-tech-nology industries and 2094 fi rms in high-technology industries. Of these, 21.7 per cent of the former and 46 per cent of the latter carried out some innovation activity.3
The CIS3 survey explicitly defi nes cooperation as active participation in joint innovation projects (including R&D) with other organizations. It does not necessarily imply that either partner derives immediate commer-cial benefi t from the venture. Pure contracting out of work, where there is no active collaboration, is not defi ned as cooperation in this survey. In our sample, 2.3 per cent of low-technology fi rms had a cooperation arrange-ment with U&RI during the period 1998–2000, whereas 11.2 per cent of high-technology fi rms had this type of arrangement
METHODOLOGY
In this chapter, we study how the fi rm’s innovation strategy and its moti-vations aff ect the likelihood of a fi rm cooperating in innovation with U&RI. Table 11.2 describes the defi nition of variables. Cooperation with U&RI is measured using a dummy variable that takes the value one if a fi rm reports that it cooperates with any university within Spain, and zero otherwise.
Regarding motivations for cooperating, we included a range of eco-nomic and internal factors that hamper innovation. The variables measure, in a Likert-type scale, the perceptions of the importance of these factors hampering innovation activities. These factors are: the economic risk of innovation, the availability and cost of fi nance for innovation, organiza-tional rigidities, lack of qualifi ed personnel, lack of information on tech-nology and/or markets, diffi culties with regulations or standards, and lack of customers’ responsiveness to innovation.4
As we have mentioned in the theoretical foundations, both the stra-tegic management and transaction cost economics literature consider the reduction and sharing of risk and costs as one of the main motiva-tions for cooperating with U&RI (Hagedoorn et al., 2000; Tether, 2002). Following the literature, we also consider the lack of resources such as
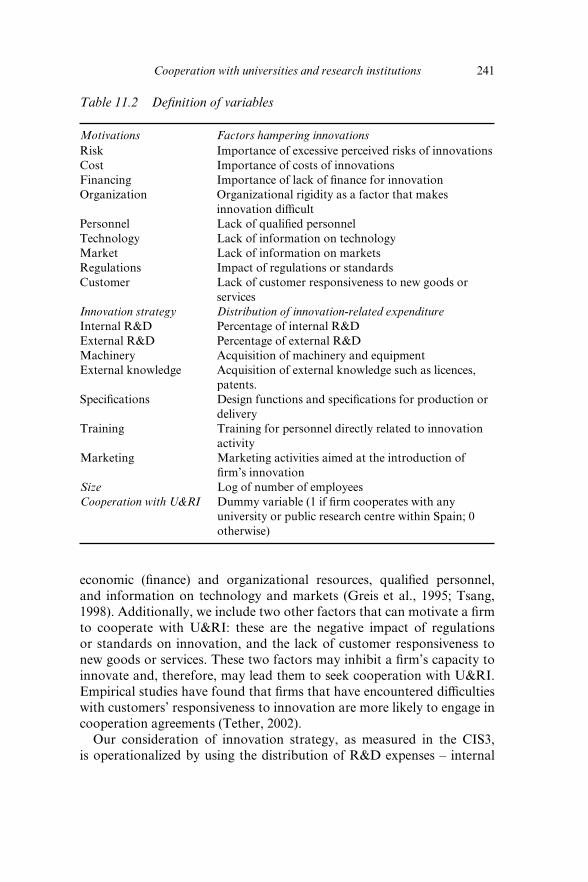
Cooperation with universities and research institutions 241
economic (fi nance) and organizational resources, qualifi ed personnel, and information on technology and markets (Greis et al., 1995; Tsang, 1998). Additionally, we include two other factors that can motivate a fi rm to cooperate with U&RI: these are the negative impact of regulations or standards on innovation, and the lack of customer responsiveness to new goods or services. These two factors may inhibit a fi rm’s capacity to innovate and, therefore, may lead them to seek cooperation with U&RI. Empirical studies have found that fi rms that have encountered diffi culties with customers’ responsiveness to innovation are more likely to engage in cooperation agreements (Tether, 2002).
Our consideration of innovation strategy, as measured in the CIS3, is operationalized by using the distribution of R&D expenses – internal
Table 11.2 Defi nition of variables
Motivations Factors hampering innovationsRisk Importance of excessive perceived risks of innovationsCost Importance of costs of innovationsFinancing Importance of lack of fi nance for innovationOrganization Organizational rigidity as a factor that makes
innovation diffi cultPersonnel Lack of qualifi ed personnelTechnology Lack of information on technologyMarket Lack of information on marketsRegulations Impact of regulations or standardsCustomer Lack of customer responsiveness to new goods or
servicesInnovation strategy Distribution of innovation-related expenditureInternal R&D Percentage of internal R&DExternal R&D Percentage of external R&DMachinery Acquisition of machinery and equipmentExternal knowledge Acquisition of external knowledge such as licences,
patents.Specifi cations Design functions and specifi cations for production or
deliveryTraining Training for personnel directly related to innovation
activityMarketing Marketing activities aimed at the introduction of
fi rm’s innovationSize Log of number of employeesCooperation with U&RI Dummy variable (1 if fi rm cooperates with any
university or public research centre within Spain; 0 otherwise)

242 Entrepreneurship and growth
versus external – including acquisition of machinery and equipment, licences and patents, training for personnel, and marketing activities aimed at the introduction of the fi rm’s innovation. Finally, we have also included the size of the fi rm in our empirical analysis. Size is measured using the log of number of employees. Although there is no consensus in the literature on the relationship between organizational size and coop-eration (Robertson and Gatignon, 1998), size has been considered in the literature as a factor aff ecting fi rm–U&RI relationships (Cohen et al., 2002b; Fontana et al., 2006). Larger fi rms are considered to have more resources to establish relationships with U&RI and we have included size in our analysis.
In order to analyse the infl uence of the technological intensity of the environment, we divided the sample into two sub-samples following Organisation for Economic Co-operation and Development (OECD) cri-teria: high-technology fi rms and low- and medium-technology fi rms. Next, the non-parametric Mann–Whitney U-test was applied. This enables us to see whether, when industry is taken as a group variable, the two resulting samples show an equal distribution with respect to the remaining vari-ables. We compared both types of industries (high-technology and low- and medium-technology) in terms of cooperation with U&RI, motivations for cooperating and innovation strategy. This technique also enables us to test our fourth hypothesis.
Finally, three logistic regression models for cooperation with U&RI were tested, one for each type of industry and one for the whole sample. These models aim to explain the motivations of a fi rm for engaging in R&D cooperation with U&RI – H1 and H5 – and the impact of the fi rm’s innovation strategy – H2 and H3. The propensity of a fi rm to cooperate with U&RI is then explained by its size, its motivations and its innovation strategy.
RESULTS
Table 11.3 contains the descriptive statistics: mean, standard deviation, and correlations of the whole sample.
Table 11.4 refl ects the results of the Mann–Whitney U-test, which allow us to determine whether the two sub-samples are equally distributed with respect to the variables. The data reveal that among high-technology fi rms there is a signifi cant presence of larger fi rms. Furthermore, these fi rms have a greater R&D capacity, as refl ected by the mean values of the varia-bles that represent their innovation strategy. High-technology fi rms spend more on internal R&D, external R&D, machinery and equipment, training

243
Tab
le 1
1.3
Des
crip
tive
stat
istic
s
Size
Risk
Cost
Financing
Organization
Personnel
Technology
Market
Regulation
Customer
Internal R&D
External R&D
Machinery
External knowledge
Specifi cation
Training
Marketing
Cooperation U&RI
Size
1R
isk–.
050
1C
ost
–.02
6.7
041
Fin
anci
ng–.
038
.620
.652
1O
rgan
izat
ion
.049
.470
.464
.432
1Pe
rson
nel
–.02
4.5
11.5
45.5
00.5
651
Tec
hnol
ogy
–.02
6.5
10.5
42.5
01.5
30.6
471
Mar
ket
–.03
3.5
34.5
35.5
36.5
17.5
93.7
381
Reg
ulat
ions
.034
.475
.464
.457
.454
.467
.476
.512
1C
usto
mer
.013
.472
.464
.415
.430
.445
.466
.512
.498
1In
tern
al R
&D
.146
.155
.178
.160
.095
.116
.106
.140
.131
.132
1E
xter
nal R
&D
.103
.061
.083
.047
.075
.061
.048
.062
.057
.039
.070
1M
achi
nery
.025
.124
.169
.105
.089
.125
.097
.101
.087
.072
–.04
5.0
041
Ext
erna
l kno
wle
dge
.051
.020
.033
.012
.032
.027
.008
.007
.012
.031
–.00
3.0
09.0
251
Spec
ifi ca
tions
.000
.054
.068
.048
.035
.053
.045
.051
.043
.047
.006
.001
–.00
9.0
021
Tra
inin
g.0
43.0
53.0
72.0
57.0
66.0
69.0
58.0
54.0
48.0
49.0
52.0
34.0
58.0
47.0
551
Mar
ketin
g.0
33.0
71.0
88.0
52.0
43.0
60.0
55.0
68.0
64.0
95.0
54.0
25.0
21.0
37.0
60.0
701
Coo
pera
tion
U&
RI
.155
.120
.120
.127
.079
.072
.067
.101
.100
.077
.375
.185
.042
.040
.016
.029
.063
1M
ean
4.67
2.9
281.
151
.821
.566
.773
.642
.618
.608
.695
10.3
052.
114
12.5
80.2
571.
794
1.33
71.
897
.048
Sd.7
081.
167
1.27
71.
128
.912
1.05
9.9
53.9
41.9
891.
016
26.3
2310
.712
29.2
802.
250
10.5
927.
222
9.61
7.2
13
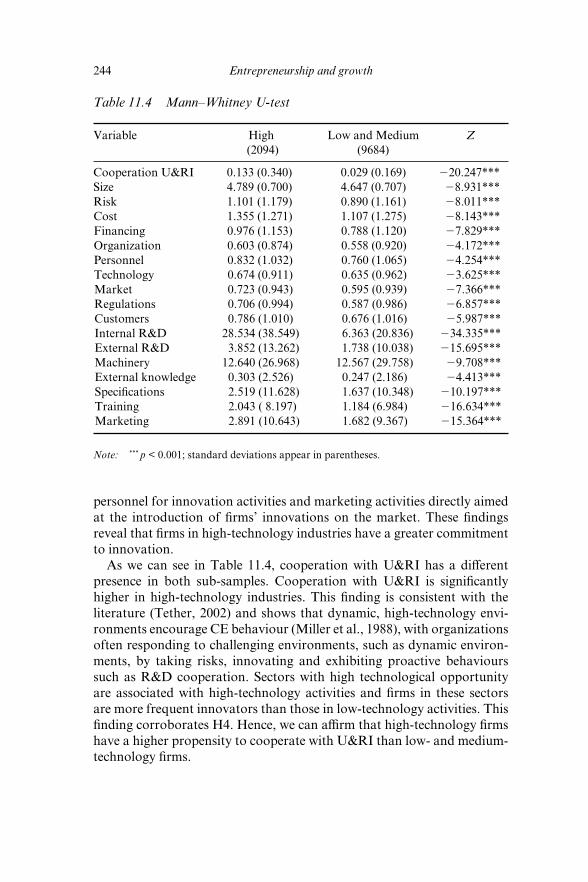
244 Entrepreneurship and growth
personnel for innovation activities and marketing activities directly aimed at the introduction of fi rms’ innovations on the market. These fi ndings reveal that fi rms in high-technology industries have a greater commitment to innovation.
As we can see in Table 11.4, cooperation with U&RI has a diff erent presence in both sub-samples. Cooperation with U&RI is signifi cantly higher in high-technology industries. This fi nding is consistent with the literature (Tether, 2002) and shows that dynamic, high-technology envi-ronments encourage CE behaviour (Miller et al., 1988), with organizations often responding to challenging environments, such as dynamic environ-ments, by taking risks, innovating and exhibiting proactive behaviours such as R&D cooperation. Sectors with high technological opportunity are associated with high-technology activities and fi rms in these sectors are more frequent innovators than those in low-technology activities. This fi nding corroborates H4. Hence, we can affi rm that high-technology fi rms have a higher propensity to cooperate with U&RI than low- and medium-technology fi rms.
Table 11.4 Mann–Whitney U-test
Variable High (2094)
Low and Medium (9684)
Z
Cooperation U&RI 0.133 (0.340) 0.029 (0.169) 220.247***Size 4.789 (0.700) 4.647 (0.707) 28.931***Risk 1.101 (1.179) 0.890 (1.161) 28.011***Cost 1.355 (1.271) 1.107 (1.275) 28.143***Financing 0.976 (1.153) 0.788 (1.120) 27.829***Organization 0.603 (0.874) 0.558 (0.920) 24.172***Personnel 0.832 (1.032) 0.760 (1.065) 24.254***Technology 0.674 (0.911) 0.635 (0.962) 23.625***Market 0.723 (0.943) 0.595 (0.939) 27.366***Regulations 0.706 (0.994) 0.587 (0.986) 26.857***Customers 0.786 (1.010) 0.676 (1.016) 25.987***Internal R&D 28.534 (38.549) 6.363 (20.836) 234.335***External R&D 3.852 (13.262) 1.738 (10.038) 215.695***Machinery 12.640 (26.968) 12.567 (29.758) 29.708***External knowledge 0.303 (2.526) 0.247 (2.186) 24.413***Specifi cations 2.519 (11.628) 1.637 (10.348) 210.197***Training 2.043 ( 8.197) 1.184 (6.984) 216.634***Marketing 2.891 (10.643) 1.682 (9.367) 215.364***
Note: *** p < 0.001; standard deviations appear in parentheses.
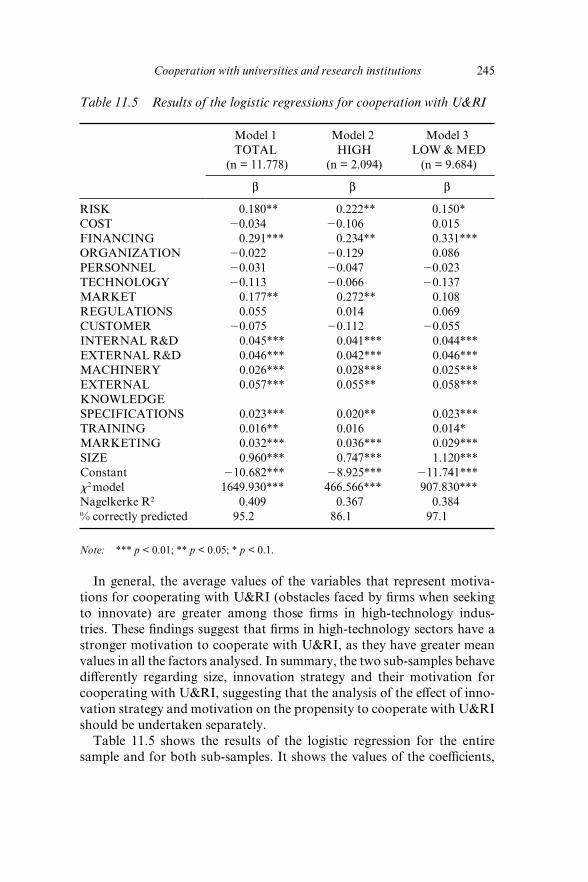
Cooperation with universities and research institutions 245
In general, the average values of the variables that represent motiva-tions for cooperating with U&RI (obstacles faced by fi rms when seeking to innovate) are greater among those fi rms in high-technology indus-tries. These fi ndings suggest that fi rms in high-technology sectors have a stronger motivation to cooperate with U&RI, as they have greater mean values in all the factors analysed. In summary, the two sub-samples behave diff erently regarding size, innovation strategy and their motivation for cooperating with U&RI, suggesting that the analysis of the eff ect of inno-vation strategy and motivation on the propensity to cooperate with U&RI should be undertaken separately.
Table 11.5 shows the results of the logistic regression for the entire sample and for both sub-samples. It shows the values of the coeffi cients,
Table 11.5 Results of the logistic regressions for cooperation with U&RI
Model 1 TOTAL
(n = 11.778)
Model 2 HIGH
(n = 2.094)
Model 3 LOW & MED
(n = 9.684)
b b b
RISK 0.180** 0.222** 0.150*COST 20.034 20.106 0.015FINANCING 0.291*** 0.234** 0.331***ORGANIZATION 20.022 20.129 0.086PERSONNEL 20.031 20.047 20.023TECHNOLOGY 20.113 20.066 20.137MARKET 0.177** 0.272** 0.108REGULATIONS 0.055 0.014 0.069CUSTOMER 20.075 20.112 20.055INTERNAL R&D 0.045*** 0.041*** 0.044***EXTERNAL R&D 0.046*** 0.042*** 0.046***MACHINERY 0.026*** 0.028*** 0.025***EXTERNAL KNOWLEDGE
0.057*** 0.055** 0.058***
SPECIFICATIONS 0.023*** 0.020** 0.023***TRAINING 0.016** 0.016 0.014*MARKETING 0.032*** 0.036*** 0.029***SIZE 0.960*** 0.747*** 1.120***Constant 210.682*** 28.925*** 211.741***x2 model 1649.930*** 466.566*** 907.830***Nagelkerke R2 0.409 0.367 0.384% correctly predicted 95.2 86.1 97.1
Note: *** p < 0.01; ** p < 0.05; * p < 0.1.
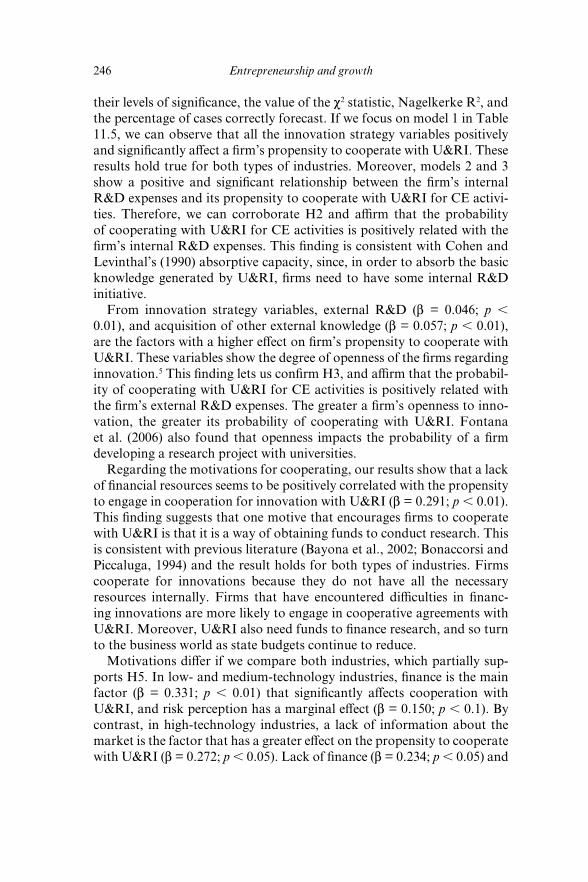
246 Entrepreneurship and growth
their levels of signifi cance, the value of the c2 statistic, Nagelkerke R2, and the percentage of cases correctly forecast. If we focus on model 1 in Table 11.5, we can observe that all the innovation strategy variables positively and signifi cantly aff ect a fi rm’s propensity to cooperate with U&RI. These results hold true for both types of industries. Moreover, models 2 and 3 show a positive and signifi cant relationship between the fi rm’s internal R&D expenses and its propensity to cooperate with U&RI for CE activi-ties. Therefore, we can corroborate H2 and affi rm that the probability of cooperating with U&RI for CE activities is positively related with the fi rm’s internal R&D expenses. This fi nding is consistent with Cohen and Levinthal’s (1990) absorptive capacity, since, in order to absorb the basic knowledge generated by U&RI, fi rms need to have some internal R&D initiative.
From innovation strategy variables, external R&D (b = 0.046; p , 0.01), and acquisition of other external knowledge (b = 0.057; p , 0.01), are the factors with a higher eff ect on fi rm’s propensity to cooperate with U&RI. These variables show the degree of openness of the fi rms regarding innovation.5 This fi nding lets us confi rm H3, and affi rm that the probabil-ity of cooperating with U&RI for CE activities is positively related with the fi rm’s external R&D expenses. The greater a fi rm’s openness to inno-vation, the greater its probability of cooperating with U&RI. Fontana et al. (2006) also found that openness impacts the probability of a fi rm developing a research project with universities.
Regarding the motivations for cooperating, our results show that a lack of fi nancial resources seems to be positively correlated with the propensity to engage in cooperation for innovation with U&RI (b = 0.291; p , 0.01). This fi nding suggests that one motive that encourages fi rms to cooperate with U&RI is that it is a way of obtaining funds to conduct research. This is consistent with previous literature (Bayona et al., 2002; Bonaccorsi and Piccaluga, 1994) and the result holds for both types of industries. Firms cooperate for innovations because they do not have all the necessary resources internally. Firms that have encountered diffi culties in fi nanc-ing innovations are more likely to engage in cooperative agreements with U&RI. Moreover, U&RI also need funds to fi nance research, and so turn to the business world as state budgets continue to reduce.
Motivations diff er if we compare both industries, which partially sup-ports H5. In low- and medium-technology industries, fi nance is the main factor (b = 0.331; p , 0.01) that signifi cantly aff ects cooperation with U&RI, and risk perception has a marginal eff ect (b = 0.150; p , 0.1). By contrast, in high-technology industries, a lack of information about the market is the factor that has a greater eff ect on the propensity to cooperate with U&RI (b = 0.272; p , 0.05). Lack of fi nance (b = 0.234; p , 0.05) and
Cooperation with universities and research institutions 247
perceived risk of innovation (b = 0.222; p , 0.05) also have a signifi cant and positive eff ect. Surprisingly, lack of information on the market is the factor with a greater eff ect on cooperation with U&RI in high-technology sectors. This could be explained by the fact that universities are develop-ing more applied research nowadays, such as market research, and fi rms in high-tech industries are aware of this. Another possible explanation comes from the network perspective. Firms are also aware that they can gain access to the knowledge networks in which their U&RI partners are included (Jones-Evans et al., 1999). Access to these networks would also provide them with information on diff erent markets.
In Table 11.5, we can observe that only two factors hampering innova-tion have a diff erent eff ect in high-technology industries than in low- and medium-technology industries. Although not signifi cant, cost and organi-zation have a negative sign in model 2 (high-technology) and a positive sign in model 3. In high-technology fi rms, innovation costs and organiza-tional rigidities reduce the probability of cooperation with U&RI. On the contrary, in less technology-intensive sectors, fi rms tend to mitigate these diffi culties thus increasing their cooperation with public research centres. The fact that none of the factors that reduce the probability of cooperat-ing with U&RI (negative sign) are signifi cant, suggests that factors that hamper innovation or perceived obstacles motivate cooperation with U&RI but they do not discourage it. Hence, we have some evidence to support H1.
Finally, our fi ndings show that the propensity to engage in cooperative arrangements for innovation with universities increases with fi rm size. The results show that size has a positive and signifi cant eff ect on coopera-tion with U&RI (b = 0.960; p , 0.01). The greater the size of the fi rm, the greater its propensity to cooperate. Moreover, this positive eff ect is signifi cant in both industries, although it is higher in low- and medium-technology fi rms (b = 1.120; p , 0.01) than in high-technology industries (b = 0.747; p , 0.01). This fi nding is similar to previous studies (Tether, 2002) and refl ects the greater resources of larger fi rms, which makes them attractive to these institutions, but also the greater awareness of larger fi rms as to the services available from U&RI.
CONCLUSION
Corporate entrepreneurship activities have a high degree of risk, and fi rms try to improve the odds of innovation through cooperation with univer-sities and research institutions. Cooperation with U&RI is particularly important for fi rms that operate in low- and medium-technology sectors.
248 Entrepreneurship and growth
These fi rms seek cooperation in the absence of formal R&D activities on their own part. This chapter aimed to study how a fi rm’s innovation strat-egy infl uences the decision to engage in R&D cooperation with U&RI, and the main motivations for these arrangements. Our purpose was to answer the question of whether the balance a fi rm maintains with inter-nally conducted R&D infl uences its propensity to cooperate with U&RI and whether there is a diff erent pattern of cooperation regarding the technology intensity of the industry in which the fi rm operates.
We gathered information on the fi rms’ innovation and cooperation activities from the Spanish CIS3. Our fi nal sample consisted of 9684 fi rms in low- and medium-technology industries and 2094 fi rms in high- technology sectors. We carried out a non-parametric test to compare both types of industries in terms of innovation strategy and cooperation activities. Results of this analysis showed that the two sub-samples behave diff erently, suggesting a further and separate analysis on the factors that aff ect cooperation with U&RI. We tested three logit models, one for each type of industry, and one for the whole sample.
Our fi ndings show that greater technological intensity of the environ-ment fosters cooperation with U&RI. In sectors with higher complexity of technology, R&D cooperation with U&RI is more frequent than in sectors with lower complexity of technology. This is consistent with previ-ous literature (Santangelo, 2000; Orsenigo et al., 2001; Hagedoorn, 2002). Our results also showed that motivations for cooperating are diff erent in high-technology industries compared to low- and medium-technology sectors. Firms cooperate with U&RI in low-technology sectors basically because they have some diffi culties fi nancing their innovation projects. On the contrary, in high-technology industries, apart from a lack of fi nance for innovation, fi rms are motivated to cooperate with U&RI as a way of reducing the risks of CE activities and to gain information on the market. However, the innovation strategy of the fi rm similarly aff ects its propen-sity to cooperate with U&RI irrespective of the type of industry in which the company operates.
Internal R&D capability is critical to basic research and research-based innovation. Moreover, high R&D intensity fi rms seek collaboration with U&RI. Firms that devote a signifi cant amount of resources to research and product development, while focusing on their internal research capa-bility, would utilize U&RI in order to advance their research-based inno-vation (Hall and Bagchi-Sen, 2007). Cooperation with these institutions would allow these fi rms access to physical and technological resources. Our fi ndings show that fi rms that carry out internal R&D have a greater propensity to cooperate with U&RI. This result is in accordance with the idea that internal R&D provides the capacity to absorb the knowledge
Cooperation with universities and research institutions 249
generated by U&RI. Additionally, all innovation strategy factors have a positive and signifi cant eff ect on cooperation, and this holds for both sub-samples. This fi nding supports Cohen and Levinthal’s (1990) absorp-tive capacity. Therefore, we can affi rm that companies with internal R&D capabilities have more probabilities of cooperating with U&RI irre-spectively of the industry. These internal R&D initiatives provide them with the necessary capacity to recognize and take advantage of external knowledge.
Moreover, we found that fi rms that invest in external R&D and acquire external knowledge, have a greater propensity for cooperating with U&RI. Thus, the degree of openness of the fi rms regarding innovation, positively aff ects their cooperation activities. From our results we can conclude that the options of either carrying out internal R&D activities or acquiring them externally through purchase or cooperation are not mutu-ally exclusive. A future line of research would be an analysis of the joint eff ect of internal and external innovation expenses from a confi gurational approach.
The propensity of carrying out R&D cooperation with U&RI depends on the size of the fi rm, as was previously shown (Cohen et al., 2002b). Larger fi rms are more likely to cooperate with U&RI. Our empirical analysis showed a signifi cant and positive eff ect of size on the probability of cooperation with U&RI. This fi nding could also be indicating that fi rms have diff erent motivations for cooperating with these institutions according to their size. We also found that size has a greater impact on the propensity to cooperate in low- and medium-technology industries. An interesting further line of research would be to investigate whether the dif-ferences in motivations considered in this chapter are maintained depend-ing on the size of the fi rm. Future research should analyse the motivations and innovation strategy in each type of industry, comparing small and medium sized enterprises with large companies.
One of the limitations of our chapter is that it is cross-sectional, which means that any causality eff ect should be considered with caution. Future research should approach this issue from a longitudinal perspective. Longitudinal studies would be able to address causality as well as analyse the relationship between cooperation, CE activities and technology inten-sity of the industry more accurately. Nevertheless, the results of our research should help managers and governments (policy makers) discover or recognize the fi rm-level innovation strategies that favour cooperation with U&RI, as well as motivations for cooperating with these institu-tions. Promoting these factors will notably increase cooperation with U&RI. This interaction between fi rms and publicly funded knowledge institutions is an important determinant of innovation and is strongly

250 Entrepreneurship and growth
related to economic growth and national competitiveness. Cooperation between U&RI and private fi rms for CE activities is a way of converting publicly funded research into commercialized innovations and productiv-ity growth. Policy makers aiming to increase R&D cooperation between these agents should be aware that motivations on the part of the fi rms are diff erent depending on the technology intensity of the industry in which they operate. However, in order to recognize and take advantage of the knowledge generated by publicly funded institutions, fi rms need to have some internal R&D initiatives. Therefore, policies aimed at increasing cooperation between fi rms and U&RI should be fi lled with those policies that promote the fact that fi rms develop R&D on their own part. Policy makers should promote internal R&D on the part of the fi rms. Firms without absorptive capacity will not be able to either recognize or absorb the knowledge generated by public research institutions. Governments should make an eff ort to increase the ability of fi rms to carry out their own internal R&D. These internal R&D initiatives would provide them with the necessary capacity to recognize external knowledge and the ability to take advantage of cooperation with U&RI.
ACKNOWLEDGEMENT
A previous version of this chapter was presented at the XXI RENT Conference in Cardiff . We are grateful to conference participants for their comments. Financial support from Junta de Comunidades de Castilla-La Mancha, Consejería de Educación y Ciencia, España, PAI07-0099-3219, is gratefully acknowledged.
NOTES
1. Fontana et al. (2006) provide information about the number of fi rm–university R&D projects, which allows them to study the determinants of the extent of fi rm–university collaboration.
2. In their paper, openness is considered a set of activities carried out by the fi rm that can be divided into three components: searching, screening and signalling.
3. In the Spanish survey – CIS3 – innovation is defi ned as a new or signifi cantly improved product (goods or service) introduced into the market (product or service innovation) or the introduction within the fi rm of a new or signifi cantly improved process (process innovation).
4. Following Tether (2002) we are assuming that fi rms have entered into cooperation to reduce these diffi culties and that cooperation agreements were not themselves the source of diffi culty.
5. This openness could also show a lack of internal resources to carry out innovation activities.
Cooperation with universities and research institutions 251
REFERENCES
Acosta, J. and A. Modrego (2001), ‘Public fi nancing of cooperative R&D projects in Spain: the concerted projects under the national R&D plan’, Research Policy, 30, 625–41.
Azagra-Caro, A., F. Archontakis, A. Gutierrez-García and I. Fernandez-de-Lucio (2006), ‘Faculty support for the objectives of university–industry relations versus degree of R&D cooperation: the importance of regional absorptive capacity’, Research Policy, 35, 37–55.
Bayona, C., T. García-Marco and E. Huerta (2001), ‘Firms’ motivations for cooperative R&D: an empirical analysis of Spanish fi rms, Research Policy, 30, 1289–307.
Bayona, C., T. García-Marco and E. Huerta (2002), ‘Collaboration in R&D with universities and research centres: an empirical study of Spanish fi rms’, R&D Management, 32, 321–45.
Bercovitz, J.E.L. and M.P. Feldman (2007), ‘Fishing upstream: fi rm innovation strategy and university research alliances’, Research Policy, 36 (2), 930–48.
Bonaccorsi, A. and A. Piccaluga (1994), ‘A theoretical framework for the evalua-tion of university–industry relationships’, R&D Management, 24, 229–47.
Cohen, W., A. Goto, A Nagata, R. Nelson and J. Walsh (2002a), ‘R&D spillovers, patents and the incentives to innovate in Japan and the United States’, Research Policy, 31, 1349–67.
Cohen, W. and D. Levinthal (1990), ‘Absorptive capacity: a new perspective on learning and innovation’, Administrative Science Quarterly, 35, 129–52.
Cohen, W., R. Nelson and J. Walsh (2002b), ‘Links and impacts: the infl uence of public research on industrial R&D’, Management Science, 48, 1–23.
Combs, K. (1999), ‘The role of information sharing in cooperative research and development’, International Journal of Industrial Organization, 11, 535–51.
Covin, J. and M. Miles (1999), ‘Corporate entrepreneurship and the pursuit of competitive advantage’, Entrepreneurship Theory and Practice, 23, 47–63.
Deeds, D.L. and C.W.L Hill (1996), ‘Strategic alliances and the rate of new product development: an empirical study of entrepreneurial biotechnology fi rms’, Journal of Business Venturing, 11, 41–55.
Fontana, R., A. Geuna and M. Matt (2006), ‘Factors aff ecting university–industry R&D projects: the importance of searching, screening and signalling’, Research Policy, 35, 309–23.
Fritsch, M. and R. Lukas (2001), ‘Who cooperates on R&D?’, Research Policy, 30, 297–312.
Gonard, T. (1999), ‘The process of change in relationships between public research and industry: two case studies from France’, R&D Management, 29 (2), 143–53.
Greis, N.P., M.D. Dibner and A.S. Bean (1995), ‘External partnering as a response to innovation barriers and global competition in biotechnology’, Research Policy, 24, 609–30.
Hagedoorn, J. (1993), ‘Understanding the rationale of strategic technology part-nering: interorganisational modes of cooperation and sectoral diff erences’, Strategic Management Journal, 14 (5), 371–85.
Hagedoorn, J. (1995), ‘Strategic technology partnering during the 1980s: trends, networks, and corporate patterns in non-core technologies’, Research Policy, 24, 207–31.
252 Entrepreneurship and growth
Hagedoorn, J. (2002), ‘Inter-fi rm R&D partnerships: an overview of major trends and patterns since 1960’, Research Policy, 31, 477–92.
Hagedoorn, J., A.N. Link and N.S Vonortas (2000), ‘Research partnerships’, Research Policy, 29, 567–86.
Hall, L.A. and S. Bagchi-Sen (2007), ‘An analysis of fi rm-level innovation strate-gies in the US biotechnology industry’, Technovation, 27, 4–14.
Hamel, G. (1991), ‘Competition for competence and inter-partner learning within international strategic alliances’, Strategic Management Journal, 12, 83–103.
Häusler, J., H.-W. Honh and S. Lütz (1994), ‘Contingencies of innovative net-works: a case study of successful inter-fi rm R&D cooperation’, Research Policy, 23, 47–66.
INE (1998), ‘Encuesta sobre innovación tecnológica de las empresas’, available at: www.ine.es.
INE (2005), ‘Encuesta sobre innovación tecnológica de las empresas’, available at: www.ine.es.
Jarillo, J. (1988), ‘On strategic network’, Strategic Management Journal, 19, 31–41.Jones-Evans, D. and M. Klofsten (1998), ‘The role of the university in the tech-
nology transfer process: a European view’, Science and Public Policy, 25 (6), 373–80.
Jones-Evans, D., M. Klofsten, E. Anderson and D. Pandya (1999), ‘Creating a bridge between university and industry in small European countries: the role of the Industrial Liaison Offi ce’, R&D Management, 29 (1), 47–56.
Khandwalla, P.N. (1987), ‘Generators of pioneering innovative management: some Indian evidence’, Organization Studies, 8 (1), 39–59.
Laursen, K. and A. Salter (2004), ‘Searching low and high: what types of fi rms uses universities as a source of innovation?’, Research Policy, 33, 1201–15.
Miller, D., C. Droge and J. Toulouse (1988), ‘Strategic process and content as medi-ators between organizational context and structure’, Academy of Management Journal, 31, 544–69.
Miller, D. and P.H. Friesen (1982), ‘Innovation in conservative and entrepreneur-ial fi rms: two models of strategic momentum’, Strategic Management Journal, 3, 1–25.
Naman, J.L. and D.P. Slevin (1993), ‘Entrepreneurship and the concept of fi t: a model and empirical tests’, Strategic Management Journal, 14, 137–53.
Okubo, Y. and C. Sjöberg (2000), ‘The changing pattern of industrial scientifi c research collaboration in Sweden’, Research Policy, 29 (1), 81–98.
Orsenigo, L., F. Pammolli and M. Riccaboni (2001), ‘Technological change and network dynamics. Lessons from the pharmaceutical industry’, Research Policy, 30, 485–508.
Robertson, T. and H. Gatignon (1998), ‘Technology development mode: a trans-action cost conceptualisation’, Strategic Management Journal, 19, 515–31.
Rothaermel, F. (2001), ‘Complementary assets, strategic alliances, and the incum-bent’s advantage: an empirical study of industry and fi rm eff ects in the biophar-maceutical industry’, Research Policy, 30 (8), 1235–51.
Santangelo, G.D. (2000), ‘Corporate strategic technological partnerships in the European information and communications technology industry’, Research Policy, 29 (9), 1015–31.
Santoro, M.D. and A.K. Chakrabarti (1999), ‘Building industry–university research centres: some strategic considerations’, International Journal of Management Reviews, 1 (3), 225–44.

Cooperation with universities and research institutions 253
Sarkar, M.B., R.A.J. Echambadi and J.S. Harrison (2001), ‘Alliance entrepreneur-ship and fi rm market performance’, Strategic Management Journal, 22, 701–11.
Schartinger, D., C. Rammer, M.M. Fischer and J. Fröhlich (2001), ‘Knowledge interactions between universities and industry in Austria: sectoral patterns and determinants’, Research Policy, 31 (3), 303–28.
Sundbo, J. and F. Gallouj (2000), ‘Innovation as a loosely coupled system in services’, International Journal of Services Technology and Management, 1 (1), 15–36.
Teece, D. (1986), ‘Profi ting from technological innovation: implications for integration, collaboration, licensing and public policy’, Research Policy, 15, 285–305.
Teng, B. (2007), ‘Corporate entrepreneurship activities through strategic alliances: a resource-based view approach toward competitive advantage’, Journal of Management Studies, 33 (1), 119–42.
Terziosvki, M. and J.P. Morgan (2006), ‘Management practices and strategies to accelerate the innovation cycle in the biotechnology industry’, Technovation, 36, 545–52.
Tether, B.S. (2002), ‘Who co-operates for innovation, and why: an empirical analysis’, Research Policy, 31, 947–67.
Thornhill, S. (2006), ‘Knowledge, innovation and fi rm performance in high- and low-technology regimes’, Journal of Business Venturing, 21, 687–703.
Tsang, E. (1998), ‘Motives for strategic alliances: a resource-based perspective’, Scandinavian Journal of Management, 14 (3), 207–21.
Vonortas, N.S. (1997), Cooperation in Research and Development, Boston, MA: Kluwer Academic Publishers.
Williamson, O.E. (1985), The Economic Institutions of Capitalism, New York: Free Press.
Zahra, S.A. (1993), ‘A conceptual model of entrepreneurship as fi rm behaviour: a critique and extension’, Entrepreneurship: Theory and Practice, 17, 319–40.
Zahra, S.A. (1995), ‘Corporate entrepreneurship and company performance: the case of management leveraged buyouts’, Journal of Business Venturing, 10, 225–47.
254
12. ICT-related small fi rms with diff erent collaborative network structures: diff erent species or variations on a theme?Vinit Parida and Mats Westerberg
INTRODUCTION
Small fi rms make up the backbone of the modern economy and are an important source of employment and growth (Storey, 1994). Thus, it is essential to understand more about them and how they become success-ful. As these fi rms constitute a large heterogeneous group, we have in this study focused on a single industry, namely ICT (information and commu-nication technology) related small fi rms. These fi rms deal with technologi-cally oriented products or services, such as developing software, mobile functions and so on. This industry is interesting for several reasons. First, small fi rms operating in this high-tech industry have the potential to work globally, since many tools in the ICT-related fi rms tend to be the same all over the world. Second, as they represent a high growth potential industry, they have the potential to generate a higher level of employment and eco-nomic development compared with other industries (Delmar et al., 2003). Third, as these fi rms operate in a dynamic environment, securing their source of competitiveness holds special and urgent value. Finally, many ICT-related small fi rms are important partners to other fi rms, which indi-cates that securing success for this industry can also benefi t other fi rms. Taken together, ICT-related small fi rms are the forerunners in developing global markets that benefi t both themselves and other fi rms they work with. Investigating how these fi rms operate and achieve competitive advantage is therefore interesting for both researchers and practitioners.
Even if heterogeneity is decreased, all ICT-related small fi rms are cer-tainly not similar. An important aspect that may separate diff erent fi rms in this industry from each other is how they choose to collaborate with other fi rms. In Sweden, some 60 per cent of small fi rms have some kind of organized collaboration with at least one other fi rm and another 15

ICT-related small fi rms with diff erent collaborative network structures 255
per cent have some sort of collaboration with another type of partner (Westerberg and Ylinenpää, 2003). Therefore, a fi rm’s collaborative network structure seems to be a potential construct for reducing heteroge-neity. Traditionally, network structure represents ‘the pattern of relation-ships that are engendered from the direct and indirect ties between actors’ (Hoang and Antoncic, 2003, p. 166). However, this study focuses only on those ties or relationships that are strategic (contributing to the fi rm’s revenue) and repetitive (represented by continuous interactions) in nature. By doing so, we only focus on those relationships that have important value for the small fi rms. In addition, a fi rm’s collaborative network struc-ture can have three dimensions, namely the type of partner (for example, small fi rms, large fi rms, universities or government agencies); the type of relationship with the partner (supplier, customer or other) and fi nally, the number of relations in each category. For diff erent structures of partner setup, other characteristics of the fi rm, and also how these characteristics are linked to performance, may diff er. Therefore, this study uses collabora-tive network structure as a basis for the analysis and investigates whether fi rms displaying dissimilar collaborative network structures also display diff erences in other areas. The characteristics we touch upon in this study are networking capability, ICT capability and entrepreneurial orientation. The motivation for selecting each of these constructs is presented next.
The fi rst diff erentiating characteristic in our study is ‘entrepreneurial orientation’ (EO). EO is also our chosen dependent variable because it has been shown to have a stable relation to fi rm performance in several studies and when environmental dynamism is higher, this link tends to be greater (Wiklund, 1999; Lumpkin and Dess, 1996; Walter et al., 2006). Thus, by being proactive, risk taking and innovative, a small fi rm can achieve competitive advantage in a more dynamic environment (Covin and Slevin, 1991). Regarding the level of EO and network structure, it would be inter-esting to explore whether the level of EO diff ers for diff erent types of col-laborative networks and whether there are diff erent links to EO from other fi rm characteristics, depending on the collaborative network structure.
The ‘other characteristics’ that we study as independent variables are general characteristics such as fi rm age, fi rm size (number of employees and turnover), and fi rm capabilities. Regarding fi rm capabilities, we address two specifi c capabilities, namely networking and ICT (informa-tion and communication technology) capability. Networking capability is defi ned as a fi rm’s ‘ability to develop and utilize inter-organizational rela-tionships to gain access to various resources held by other actors’ (Walter et al., 2006, p. 542). Thus, having ample networking capability seems to be the key to getting a functional collaborative network. Firms with pre-vious experience of networking can be more capable than fi rms without
256 Entrepreneurship and growth
any previous experience (Gulati et al., 2000). Since we study small fi rms operating in a high-technology industry, we expect them to be extensive users of networking and also to have signifi cant networking capability (Hagedoorn et al., 2006). Furthermore, it has been observed that high networking capability leads to being more entrepreneurial and achieving better performance (Walter et al., 2006). Furthermore, as the fi rms under study are ICT-related small fi rms, we expect many of them to be high on ICT capability. According to Matlay and Addis (2003), ICT capability can be broadly defi ned as fi rm’s ability to use a wide array of technol-ogy, ranging from database programs to local area networks. In simpler terms, ICT capability is a fi rm’s ability to strategically use information and communication technology in their business activities such as use of emails, websites, e-commerce, web conferencing, intranet, extranet and other similar functions. By limiting our study to strategically used ICT capability, we stress high level ICT usages that can lead to competitive advantage (Johannessen et al., 1999). For small fi rms, ICT capability can be especially valuable, as ICT can bring many advantages at relatively low cost. By a rather low investment in ICT, a small fi rm can achieve a high degree of eff ectiveness and innovativeness (Venkatraman, 1994; Gago and Rubalcaba, 2007). It will therefore be interesting to observe the level of networking and ICT capability for small fi rms with diff erent collaborative network structures and also how these capabilities are related to EO.
Based on the above background, the purpose of this study is to investi-gate how diff erent collaborative network structures of ICT-related small fi rms can be linked to ICT and networking capabilities and entrepreneur-ial orientation, both in terms of absolute levels and in terms of relations between capabilities and entrepreneurial orientation. This purpose can be further sub-divided into three research questions:
RQ1: Can ICT-related small fi rms be diff erentiated based on their ●
collaborative network structure?RQ2: Do ICT-related small fi rms with dissimilar collaborative ●
network structures also have dissimilarity in terms of their ICT capability, networking capability and entrepreneurial orientation?RQ3: Does the infl uence of ICT capability and network capability ●
on entrepreneurial orientation diff er based on an ICT-related small fi rm’s collaborative network structure?
This study has two main contributions. First, it aims to diff erentiate small fi rms based on their collaborative network structure and so will contribute towards the literature of ‘inter-organization network research’ (Kale et al., 2002; Anand and Khanna, 2000; Powell et al., 1996). Second,

ICT-related small fi rms with diff erent collaborative network structures 257
our study does not only relate inter-fi rm networking to entrepreneurial orientation, but also relates network structure to entrepreneurial orienta-tion, both directly in terms of diff erences in absolute levels and indirectly in terms of relations. Therefore, this chapter also contributes towards the entrepreneurship literature (Lumpkin and Dess, 1996; Wiklund, 1999; Covin and Slevin, 1991). This study is divided into fi ve sections. After the introduction, we discuss the theoretical background of this study. In the third section, the methodological aspects are presented followed by the empirical results in the fourth section. Finally, in the last section we discuss the results and off er some conclusions regarding the research.
LITERATURE REVIEW
Why do small fi rms network? What are the underlying reasons for it? When reviewing the literature, there were several answers off ered. When boiling it down, it seems the main benefi ts of networking for small fi rms come in the form of access to technical or commercial resources (Hoang and Antoncic, 2003; Baum et al., 2000), enhanced organizational learn-ing (Kale et al., 2002; Oliver, 2001) and innovation (Pittaway et al., 2004; Powell et al., 1996). During the start-up phase, a small fi rm’s network can provide it with external knowledge and guidance. Networking also helps small fi rms to get noticed and recognized in their respective industry. According to Stuart (2000), this recognition or legitimacy has links to better performance. The inter-fi rm relationships can also facilitate organi-zational learning. However, assuming that learning within the organiza-tional structure is complex, it will be even more complex in a network setting. Thus fi rms also have to be capable of identifying and using external knowledge for learning, which closely relates to the concept of ‘absorptive capability’, that is, a fi rm’s ability and capacity to identify and utilize external knowledge for commercial success (Cohen and Levinthal, 1990). According to Oliver (2001), learning from networking is not linear throughout the life cycle of small fi rms. The level of learning diff ers based on the experience and needs of the fi rms. Finally, one of the most critical outcomes from networking results in innovations. According to Powell et al. (1996), the locus of innovation is no longer within individual fi rms but in their network. When fi rms collaborate, new ideas emerge because each fi rm brings its unique competence to the network. The chances of a successful innovation increase when it is developed within a network as it tends to be more technologically and economically viable (Pittaway et al., 2004). Now that we have established the main benefi ts from networking, we focus on the fi rm’s collaborative network structure.

258 Entrepreneurship and growth
Collaborative Network Structure
Networking is considered to be an important activity by both small and larger fi rms (Oliver, 2001; Lorenzoni and Lipparini, 1999). However, each fi rm has its own unique way of collaborating with other fi rms, but it is still likely that we will fi nd similarities in the collaborative network structure among a population of fi rms. The view of diff erentiating small fi rms based on their collaborative network structure has not been widely researched (Pittaway et al., 2004) and was motivated based on our qualitative pre-study of three small ICT-related Swedish fi rms (Parida and Westerberg, 2006). One of the main fi ndings from the pre-study was the occurrence of diff erent collaborative network structures used by the small fi rms. Each fi rm’s collaborative network structure was not just limited to its network-ing activity, but was also linked to its entire business model and strategy. For example, one of the fi rms collaborating with many small fi rms located a long distance away invested heavily in ICT capability because the CEO believed that it was the only way the fi rm could maintain close functional relations with its partners.
As explained before, we examine a fi rm’s collaborative network struc-ture from three dimensions. First, the type of partner, which can be small fi rms, large fi rms, universities or government agencies; second, the type of relation with the partner (supplier, customer or other); and third, the number of relations in each category. In addition, we only focus on those ties or relationships that are strategic (contributing to the fi rm’s revenue) and repetitive (continuing interactions) in nature. This results in identifi ca-tion of only other actors’ relationships that are valuable to the focal fi rm.
So why is it interesting to group fi rms based on their collaborative network structure? According to Ostgaard and Birley (1994), looking into diff erent network structures helps us to understand more about fi rms. Firms develop diff erent network structures, because they want to have a specifi c strategic focus (Koch, 2004) or an innovation focus (Gemunden et al., 1996). Alternatively, they aim towards a diff erent performance level (Baum et al., 2000). From the literature review, we found only a handful of studies that have investigated the eff ects of networking structure. A study by Koch (2004) examined one segment that collaborated with few companies and a software house, and another with a more complex and extensive innovation network. The results showed that negotiations, shifting positions and inter-action between internal and external collaborating actors are important for network success. In another study, seven diff erent types of technologically oriented network confi gurations were identifi ed. The results showed that dif-ferent network confi gurations have diff erent outcomes in terms of product and process innovation (Gemunden et al., 1996). Furthermore, Ostgaard
ICT-related small fi rms with diff erent collaborative network structures 259
and Birley (1994) empirically supported the idea that entrepreneurial fi rms often formed network structures based on their strategic orientation com-pared to other fi rms. Thus, we believe that diff erentiating small fi rms based on their collaborative network structure should provide us with interesting and diverse results as indicated by previous studies.
Firms tend to have relations with various partners, such as customers, suppliers, competitors, or public organizations (universities or govern-ment institutions) (Walter et al., 2006). Let us briefl y examine the main reasons for becoming involved with each partner.
Customer collaborationAccording to Pittaway et al. (2004), collaborating with customers is the most favoured form of collaboration for achieving innovation. Customer involvement in the production process makes the end product closer to the fi rms’ needs and wants (Jacob, 2006). In high-technology industries, small fi rms collaborate with large fi rms at customer level because they lack marketing capabilities. Thus through collaboration small fi rms are able to sell their products to a large number of customers and, according to Jacob (2006), such customer integration has direct links to market success.
Supplier collaborationSmall fi rms usually collaborate with suppliers with long-term plans as they commit signifi cant resources to these forms of collaboration. Strong collaboration creates a sense of belonging and trust, which helps in moti-vating diff erent actors to focus more on network goals rather than their own goal. Furthermore, as repeated transactions occur with suppliers, small fi rms are able to reduce the costs of production, improve the quality of products and services, increase the rate of product development, and improve the level of productivity (Bradley et al., 2006; Arend, 2006).
Partnership collaborationThis form of collaboration can involve actors or partners that don’t neces-sarily share any direct relationships through their value chain. These actors form partnerships with diff erent motives; for example, a university might collaborate in partnership to spread and publish knowledge of its research work. Similarly, government institutions might collaborate with fi rms to support regional development in the form of employment and increased taxes (Etzkowitz and Leydesdorff , 2000). Small fi rms can also form partnerships with larger fi rms to enter international markets (Audretsch and Feldman, 2003); with universities to get new and high technological knowledge (Pittaway et al., 2004); and with government institutions to gain recognition and legitimacy (Baum and Oliver, 1991).
260 Entrepreneurship and growth
Entrepreneurial Orientation
Entrepreneurial orientation captures the fi rm-level practices, decision making style and strategic orientation of an entrepreneurially oriented fi rm (Lumpkin and Dess, 1996). Entrepreneurial orientation is, as we have already noted, our dependant variable and proxy for competitiveness. It has been proposed that small fi rms operating in a turbulent business envi-ronment can achieve competitive advantage by acting entrepreneurially, which fi ts the fi rm under study (Covin and Slevin, 1991; Wiklund, 1999). EO has also shown a stable relation to fi rm performance and, as Madsen (2007) observed in a longitudinal study of Norwegian small and medium sized fi rms, there is a link between EO and better fi rm performance in term of employment growth.
There are fi ve main dimensions of EO, namely innovativeness, risk-tak-ing, proactiveness, autonomy, and competitive aggressiveness (Lumpkin and Dess, 1996), although most studies measure EO by the fi rst three dimensions. Innovativeness implies a fi rm’s willingness to support new ideas, creativity and experimentation, which will result in changing the fi rm’s traditional business practices. Proactiveness is about a fi rm’s ability to be prepared for any unexpected scenario and act at an early stage, which can help a fi rm to change threats into opportunities. Finally, risk-taking is associated with a fi rm’s readiness to take daring actions that might lead to substantial losses. It also implies that a fi rm might invest in unknown ventures where outcomes are unknown but promising (Lumpkin and Dess, 1996). Many studies have supported the idea that successful entre-preneurs are highly active in networking and also achieve better growth (Lee et al., 2001). In our study, it would be interesting to investigate how ICT and networking capability link with EO for small fi rms with diff erent collaborative network structures.
Network and ICT Capabilities
The previous section explains the importance of external links for achiev-ing access to diff erent benefi ts. However, this process is not simple and before fi rms are able to utilize external links, they need to possess and structure their own capabilities (Bougrain and Haudeville, 2002). In this study, we have focused on two seemingly important capabilities for networking and competitiveness, namely networking capability and ICT capability. According to Walter et al. (2006, p. 542), network capability is the ‘fi rm’s ability to develop and utilize inter-organizational relationships to gain access to various resources held by other actors’. They conceptual-ized networking capability as a multidimensional construct consisting of

ICT-related small fi rms with diff erent collaborative network structures 261
four components, namely coordination, relational skills, partner knowl-edge and internal communication. All these components are distinct but still related. For example, fi rms with good relationship skills will be able to get access to external knowledge that, in turn, can enhance their partner knowledge. A fi rm’s coordination activities help it in synchroniz-ing with diff erent external partners and achieving mutual benefi ts. Partner knowledge can be important for small fi rms, as it allows them to better understand and utilize their relationships (Anand and Khanna, 2002). Good partner knowledge can lead to stable and long-term relationships between diff erent actors because they clearly understand each other’s needs and wants. Relationship skills refer to a fi rm’s ability to maintain healthy relationships, and are an important component of network-ing capability as fi rms with such social skills are able to manage several relationships. Eff ective internal communication is the life-blood of an organization. According to Walter et al. (2006), it is important from a rela-tionship perspective that appropriate partner information is disseminated through eff ective internal communication channels. This also enhances fi rms’ learning ability as they are able to reduce misunderstandings and create synergies between partners (Cohen and Levinthal, 1990). These four components capture network capability to some extent, but we feel that previous authors have missed an important aspect related to the building of new relationships. Thus, we add a new component that is related to the building of new relationships, which refers to fi rms’ ability to be open to new relationships with new partners. This requires fi rms to be proactive and to initiate the contact with a new partner. Overall, it can be assumed that fi rms with a high networking capability will be able to more eff ectively use their network compared to fi rms lacking such capability.
A fi rm with high network capability will be able to identify prospec-tive partners, establish relationships, and utilize the relationships to build competitiveness. However, not all inter-fi rm relationships are benefi cial as some can be diffi cult to manage and complex in nature (Anand and Khanna, 2000). Thus, fi rms with a high level of networking capability should be able to strategically position themselves in a network and form relationships with selective strategic partners (Hagedoorn et al., 2006). The ability to form and manage a partnership is important in all industries, but the relevance of such a capability is particularly high in technologically related industries. In a technological industry, the business environment is rapidly changing and this infl uences fi rms to innovate regularly, especially as many authors believe that networking can enhance a fi rm’s ability to innovative (Pittaway et al., 2004; Powell et al., 1996). It can also provide new knowledge that can be a source of idea generation and can help it gather information to recognize entrepreneurial opportunities (Hoang

262 Entrepreneurship and growth
and Antoncic, 2003). Thus we can visualize a strong link between network capability and EO.
Similar to networking capability, ICT capability is also an essential tool for promoting networking. In this technologically driven era, ICT capa-bility enables fi rms to develop an eff ective communication infrastructure (Dholakia and Kshetri, 2004). From the literature review, we are able to identify three key aspects of ICT, namely for internal use (Levy et al., 2001), use for collaboration (Sarshar and Isikdag, 2004; Levy et al., 2001), and use for communication (Martin and Matlay, 2001). The use of ICT within a small fi rm can be at diff erent levels and it will accordingly infl uence organi-zational skills, knowledge and competence (Caldeira and Ward, 2003). The most basic use of ICT comes in the form of lowering the cost of production, better document handling, and making the internal processes effi cient (Levy et al., 2001). Small fi rms can also use ICT as an important tool for keeping a check on competitors and new ideas. This makes it possible for them to take calculated risks and have eff ective strategic planning (Fillis et al., 2003). Small fi rms can also use virtual teams or groupware applications through which they can be in constant communication with their collaborative part-ners (Sarshar and Isikdag, 2004). This leads to a continuous fl ow of external information, which can enhance learning for the small fi rm (Venkatraman, 1994). According to Ruiz-Mercader et al. (2006), when small fi rms use ICT they increase the individual’s capacity to learn by creating knowledge through the extension of memory and eff ective communication. Thus, an increase in individual knowledge has a signifi cant impact on organizational learning, which positively aff ects fi rm performance. External knowledge is important for the learning process and fi rms with ICT capability are able to take advantage of this opportunity. The investment required by small fi rms to utilize technological tools is relatively low compared to the benefi ts they can achieve. One important benefi t involves the possibility of collaborating with several actors and therefore small fi rms are no longer limited because of their size but have an increased opportunity for international business and collaboration (Dholakia and Kshetri, 2004). They can achieve quicker and better performance even in the initial stages.
Some studies argue that using ICT does not necessarily lead to competi-tive advantage. As most of the ICT tools are readily available for all fi rms, they don’t yield any specifi c advantage (Johannessen, 1994; Venkatraman, 1994). The expression ‘productivity paradox’ has also been used to explain this statement. However, we believe that ICT capability is important for most small fi rms, and it should be particularly vital for ICT-related small fi rms (Lee et al., 2001). According to the quantitative study by Johannessen et al. (1999), ICT is positively related to innovation and performance, which is a result of the fact that learning and change are achieved by the use of ICT
ICT-related small fi rms with diff erent collaborative network structures 263
in Norwegian IT companies. It can be assumed that when fi rms are techno-logically strong and have a large network, they need a good information and communication fl ow. This should enhance their skills of environmental scan-ning that would make them well informed about the external environment and better equipped to take calculative risks and act proactively. Thus, we expect that a fi rm’s ICT capability will infl uence its EO and fi rms with high ICT capability will have a more extensive collaborative network structure.
We now go on to test whether we can fi nd diff erent collaborative network structures among small ICT-related fi rms and to see if there are links between ICT capability, networking capability and EO. In doing so, we will next outline the methodological considerations of the study.
RESEARCH METHODOLOGY
Data Collection and Sample
The research sample consisted of small fi rms working within the ICT sector in Sweden. The current study is mainly exploratory and is a con-tinuation of a pre-study that was done the previous year (Parida and Westerberg, 2006). Taking the pre-study as the baseline, the studied fi rms’ Swedish industry index code (SNI code: 72 220) was obtained. This code indicates consultancy-related computer systems or computer software fi rms. Sample fi rms were either manufacturing or trading with ICT products or services. When we searched on this code, we found approximately 9000 active fi rms, and after putting in parameters of fewer than 50 employees (i.e. small fi rms according to EU defi nition) and more than one million Swedish kronor in sales (to ensure an active fi rm), we ended up with 3907 active fi rms, which was considered as the total population. From 3907 fi rms, 1471 were selected for the study in the following way. First, the 3907 fi rms were divided into fi ve groups based on number of employees: 885 fi rms have one employee, 983 have two employees, 868 have three to fi ve employees, 473 have six to nine employees and 698 have ten to 49 employees. The goal was to achieve a total number of usable responses exceeding 300, which with a response rate of 20 per cent meant that we needed about 1500 to start with. Even though the smallest companies (in terms of employees) are interesting for study, it was not deemed appropri-ate that they should be sampled in relation to their actual numbers (i.e. as a random sample over the population) otherwise the vast majority of fi rms studied would be (small) micro fi rms. Therefore, a random sample of 100 were drawn from the fi rst three categories, while the entire population was chosen for the latter two. This means that our study refl ects the six to 49
264 Entrepreneurship and growth
employee fi rms to a higher degree than if we had drawn a random sample from the entire population of small fi rms.
Three waves of questionnaires were sent by mail during May–July 2007. Each questionnaire included three items: (1) a cover letter, (2) a business reply envelope and (3) an eight-page questionnaire. The cover letter was addressed to the chief executive offi cer (CEO) of the fi rm, explaining the motivation for this study. As the unit of analysis was at fi rm level, and to get a holistic view of fi rms’ operations, it was deemed most appropriate to send the questionnaire to the CEO. The cover letter was signed by the researchers and personalized for each fi rm. Furthermore, within the cover letter three options were available, which made it clear as to who was not part of the sample. First, all fi rms should be working with ICT-related products or services; second, they should have more then one million Swedish kronor in sales during last year; and fi nally, the fi rm should still be actively conducting business.
From the sample of 1471 fi rms, 93 were taken out since they did not meet at least one of the three mentioned criteria. Furthermore, six ques-tionnaires did not reach the identifi ed fi rms and it was not possible to contact them. This reduced the sample size to 1372 fi rms. We received 306 replies. Of these, four were fi lled out incorrectly, one was a duplicate, and ten came from fi rms where the CEO addressed another entity than the one targeted (e.g. a group instead of a single fi rm). Thus, the workable ques-tionnaires were reduced to 291, giving us a response rate of 21 per cent. From these, 257 were used in this analysis, as a result of missing data in the categories used in this chapter, which makes the usable response rate just below 19 per cent. Although this is not very high, it is suffi cient for adequate statistical analysis.
Measurements
In the study, we have used four main variables, namely, collaborative network structure, entrepreneurial orientation, network capability and ICT capability. For all the items (except collaborative network structure) seven-point Likert scales were used, ranging from ‘strongly disagree’ to ‘strongly agree’ (see Appendix Table 12A.1).
Collaborative network structureCollaborative network structure was measured by asking respondents to state the number of organizations they have strategic and repetitive contact with in ten diff erent categories. These categories are small fi rms as customer, supplier or partner; large fi rms as customer, supplier or partner; govern-ment agency as customer or partner; and university as customer or partner.

ICT-related small fi rms with diff erent collaborative network structures 265
ICT capabilityThe measurement for ICT capability has been partially adopted from the study of Johannessen et al. (1999) and modifi ed based on our own pre-study of three small Swedish fi rms in the ICT sector (Parida and Westerberg, 2006). We were able to identify 13 diff erent items that meas-ured diff erent strategic use of ICT. After performing factor analysis, we divided the ICT capability into three main groups based on use of tech-nology for collaboration (3 items), communication (3 items) and internal purpose (4 items) by ICT-related small fi rms. The alpha-values of ICT capability were satisfactory (collaboration; a = 0.78; communication; a = 0.64; and internal a = 0.75).
Network capabilityThis variable was mainly measured based on the scale developed by Walter et al. (2006). They conceptualize it as a higher order construct com-prising four components (coordination activity, relational skills, partner knowledge, and internal communication). We added another component, namely building new relationships, as a fi fth aspect of network capabil-ity. All components had three items each. All fi ve sub-aspects of network capability showed good measurement properties, but since we only use it as a single construct we only report reliability for network capability as a whole (a = 0.76).
Entrepreneurial orientationThis was our dependent variable for the regression analysis and was meas-ured based on the scale developed by Lumpkin and Dess (1996), where we consider three of the fi ve aspects of EO, namely the ‘classical’ innova-tiveness (3 items), proactiveness (3 items), and risk-taking (3 items). The a-value for EO was 0.73, indicating a reliable scale.
In this study, we have fi ve control variables. To control for the environ-ment we use dynamism, hostility and heterogeneity. The measurement scale for environment was according to the study by Miller and Friesen (1983). Firm size was measured using the log-number of employees, and age of the fi rm was calculated using log-number of the years the fi rm had been in operation.
Data Analysis
We carried out our analysis using software package SPSS (statistical package of social science) version 14.0. Initially, we used factor analysis to observe any irregularity and whether the items formed as expected.
266 Entrepreneurship and growth
Using the option of automatic categorization, we divided each of the ten aspects of collaborative network relations (such as university as partner) into seven categories. This was done to standardize each aspect before the cluster analysis. Using the ten standardized aspects as input variables, we performed a number of K-mean cluster analyses. The only solution with clear distinction between clusters was the two cluster solution, basically dividing the fi rms into one group having a relatively weak collaborative network structure and one group having a relatively strong collaborative network structure. These two clusters were then divided into four by split-ting the two into a high networking capability group (≥2.00 on a scale from 23 to 13) and low networking capability group (,2.00). By doing this, we formed two ‘matching’ clusters, where the level of networking capability is in line with the size of the collaborative structure, and two ‘mismatching’ clusters, where we have fi rms with low networking capability and a strong collaborative network structure, and vice versa. This will enable us to see if the clusters need to be matched for results to be positive. The levels for most variables in each cluster are stated as low (.0.25 below mean), medium (mean ± 0.25) and high (.0.25 above mean) based on their relation to the overall mean. To distinguish diff erences in absolute level, ANOVA and t-tests were performed. Finally, for relational level, hierarchical regression analysis was performed with EO as the dependent variable for all fi rms and each cluster.
RESULTS
This section is divided into two parts. The fi rst part presents the results of absolute eff ects, which were obtained by performing cluster analysis, ANOVA and t-tests. The second part presents the relational eff ects, which were based on the regression analysis.
Absolute Levels
As indicated, we formed four diff erent clusters (groups) within the ICT-related small fi rm based on level of collaboration and level of network-ing (see Table 12.1). These are low collaboration with low networking capability (cluster I), low collaboration with high networking capability (cluster II), high collaboration with low networking capability (cluster III) and high collaboration with high networking capability (cluster IV). As can be noted, fi rms within cluster IV were mostly high on all the forms of relationships with large fi rms, small fi rms, government institutions and university, whereas cluster I was low on all such relationships. Cluster II

ICT-related small fi rms with diff erent collaborative network structures 267
was quite similar to cluster I but still a bit diff erent, such as in the case of relations with large fi rms as partners. Likewise cluster III was quite similar to cluster IV but still diff erent such as in the case of relations with universi-ties as customers.
In terms of fi rm size (turnover and employees), clusters I and II were lower than cluster III and IV. For fi rm age, cluster II is younger than clus-ters III and IV. Networking capability was naturally high for clusters II and IV and low for clusters I and III. ICT use for collaboration was lowest in clusters I and III and highest in clusters II and IV. For ICT communica-tion and internal use, cluster I was lower than all the others. Finally, for entrepreneurial orientation cluster I was signifi cantly lower than all the other clusters.
Table 12.1 Cluster analysis for ICT-related small fi rms
Low collaboration High collaboration
Cluster ILow
networking capability (N = 96)
Cluster IIHigh
networking capability (N = 34)
Cluster IIILow
networking capability (N = 75)
Cluster IVHigh
networking capability (N = 52)
Small customer Low Low High HighSmall supplier Low Low High HighSmall partnership Low Low High HighLarge customer Low Low High HighLarge supplier Low Low High HighLarge partnership Low Low High HighGovernment customer Low Low High HighGovernment partnership Medium Medium Medium MediumUniversity customer Low Low High MediumUniversity partnership Medium Medium Medium MediumNetworking capability Medium High Medium HighMean fi rm size (employees) 11 14 18 21Mean fi rm size (turnover) 10 19 20 26Mean fi rm age 11 9 12 12ICT internal use Low High Medium MediumICT collaboration Medium High Medium HighICT communication Low Medium Medium HighEntrepreneurial orientation Low High High High
Note: When there are diff erences between diff erent levels of clusters based on the t-test, the highest ones are bold. Cluster level is italic when they are lower than bold. And bold italics are used when cluster levels are lower than bold but higher than italic. All levels that have no signifi cance (p < 0.05) are neither in bold nor in italic.
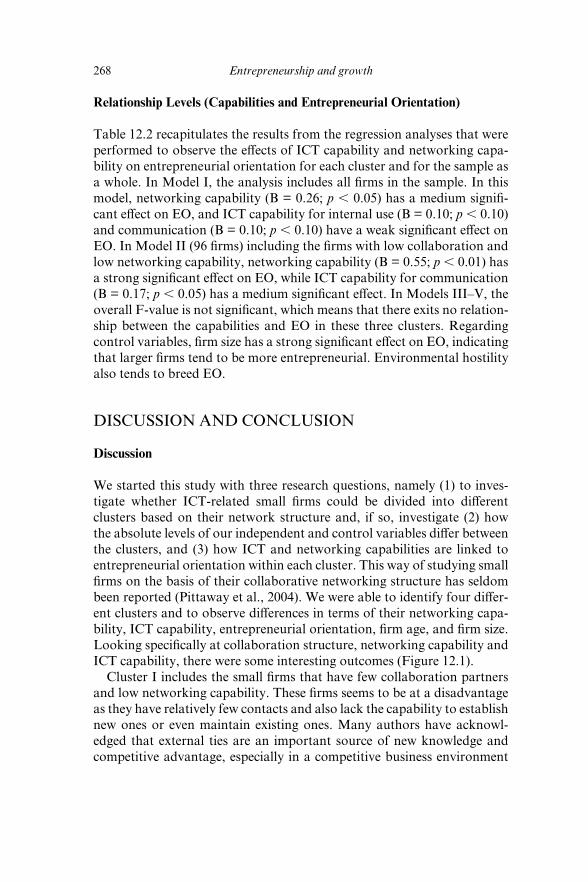
268 Entrepreneurship and growth
Relationship Levels (Capabilities and Entrepreneurial Orientation)
Table 12.2 recapitulates the results from the regression analyses that were performed to observe the eff ects of ICT capability and networking capa-bility on entrepreneurial orientation for each cluster and for the sample as a whole. In Model I, the analysis includes all fi rms in the sample. In this model, networking capability (B = 0.26; p , 0.05) has a medium signifi -cant eff ect on EO, and ICT capability for internal use (B = 0.10; p , 0.10) and communication (B = 0.10; p , 0.10) have a weak signifi cant eff ect on EO. In Model II (96 fi rms) including the fi rms with low collaboration and low networking capability, networking capability (B = 0.55; p , 0.01) has a strong signifi cant eff ect on EO, while ICT capability for communication (B = 0.17; p , 0.05) has a medium signifi cant eff ect. In Models III–V, the overall F-value is not signifi cant, which means that there exits no relation-ship between the capabilities and EO in these three clusters. Regarding control variables, fi rm size has a strong signifi cant eff ect on EO, indicating that larger fi rms tend to be more entrepreneurial. Environmental hostility also tends to breed EO.
DISCUSSION AND CONCLUSION
Discussion
We started this study with three research questions, namely (1) to inves-tigate whether ICT-related small fi rms could be divided into diff erent clusters based on their network structure and, if so, investigate (2) how the absolute levels of our independent and control variables diff er between the clusters, and (3) how ICT and networking capabilities are linked to entrepreneurial orientation within each cluster. This way of studying small fi rms on the basis of their collaborative networking structure has seldom been reported (Pittaway et al., 2004). We were able to identify four diff er-ent clusters and to observe diff erences in terms of their networking capa-bility, ICT capability, entrepreneurial orientation, fi rm age, and fi rm size. Looking specifi cally at collaboration structure, networking capability and ICT capability, there were some interesting outcomes (Figure 12.1).
Cluster I includes the small fi rms that have few collaboration partners and low networking capability. These fi rms seems to be at a disadvantage as they have relatively few contacts and also lack the capability to establish new ones or even maintain existing ones. Many authors have acknowl-edged that external ties are an important source of new knowledge and competitive advantage, especially in a competitive business environment
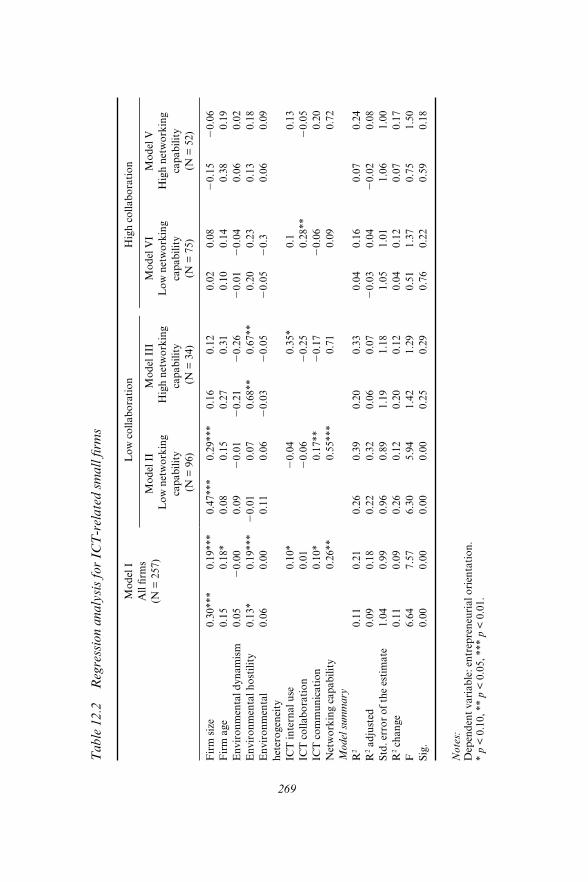
269
Tab
le 1
2.2
Reg
ress
ion
anal
ysis
for I
CT
-rel
ated
smal
l fi r
ms
Mod
el I
All
fi rm
s (N
= 2
57)
Low
col
labo
ratio
nH
igh
colla
bora
tion
Mod
el II
Low
net
wor
king
ca
pabi
lity
(N =
96)
Mod
el II
I H
igh
netw
orki
ng
capa
bilit
y (N
= 3
4)
Mod
el V
I L
ow n
etw
orki
ng
capa
bilit
y (N
= 7
5)
Mod
el V
H
igh
netw
orki
ng
capa
bilit
y (N
= 5
2)
Firm
size
0.30
***
0.19
***
0.47
***
0.29
***
0.16
0.12
0.02
0.08
20.
152
0.06
Firm
age
0.15
0.18
*0.
080.
150.
270.
310.
100.
140.
380.
19E
nviro
nmen
tal d
ynam
ism0.
052
0.00
0.09
20.
012
0.21
20.
262
0.01
20.
040.
060.
02E
nviro
nmen
tal h
ostil
ity0.
13*
0.19
***
20.
010.
070.
68**
0.67
**0.
200.
230.
130.
18E
nviro
nmen
tal
hete
roge
neity
0.06
0.00
0.11
0.06
20.
032
0.05
20.
052
0.3
0.06
0.09
ICT
inte
rnal
use
0.10
*2
0.04
0.35
*0.
10.
13IC
T c
olla
bora
tion
0.01
20.
062
0.25
0.28
**2
0.05
ICT
com
mun
icat
ion
0.10
*0.
17**
20.
172
0.06
0.20
Net
wor
king
cap
abili
ty0.
26**
0.55
***
0.71
0.09
0.72
Mod
el su
mm
ary
R2
0.11
0.21
0.26
0.39
0.20
0.33
0.04
0.16
0.07
0.24
R2 a
djus
ted
0.09
0.18
0.22
0.32
0.06
0.07
20.
030.
042
0.02
0.08
Std.
err
or o
f the
est
imat
e1.
040.
990.
960.
891.
191.
181.
051.
011.
061.
00R
2 cha
nge
0.11
0.09
0.26
0.12
0.20
0.12
0.04
0.12
0.07
0.17
F6.
647.
576.
305.
941.
421.
290.
511.
370.
751.
50Si
g.0.
000.
000.
000.
000.
250.
290.
760.
220.
590.
18
Not
es:
Dep
ende
nt v
aria
ble:
ent
repr
eneu
rial o
rient
atio
n.*
p <
0.1
0, *
* p
< 0
.05,
***
p <
0.0
1.
270 Entrepreneurship and growth
(Pittaway et al., 2004; Cohen and Levinthal, 1990). This also holds true here, since fi rms in cluster I have a signifi cantly lower entrepreneurial ori-entation than the other fi rms. The fi rms in cluster I also have the lowest level of ICT capability, which means that they are not able to strategically utilize ICT and still use it for ad hoc processes. In any case, this would also work against their growth potential (Venkatraman, 1994). We have named this cluster ‘stuck without contacts’. However, since the regression analysis pointed to a rather strong relation between the capabilities (networking and ICT for communication) and entrepreneurial orientation, fi rms in this cluster may improve their position by building these capabilities and thus move towards cluster II. While it is also possible to move towards cluster III, it seems inappropriate to build a larger network without having a strong networking capability.
In cluster II, we fi nd the fi rms that have few collaboration partners but high networking capability. These fi rms were the youngest in the group and although they currently have a rather low collaboration level, they have the ability to change collaboration partners and also to build a stronger collaboration network. Thus, we have named them small fi rms ‘on the move’. Firms in cluster II were not only high on networking capa-bility but also high on ICT capability. This gives them an advantage as, in terms of networking capability, they had positioned themselves in the right place for future alliances (Hagedoorn et al., 2006). Also, in terms of ICT capability, they can use their technological infrastructure to support internal and external processes for building competitive advantage. These small fi rms were high on entrepreneurial orientation, which lends supports to authors like Kale et al. (2002) and Gulati et al. (2000) arguing that it’s not having a lot of collaboration that is important, but rather to have the right collaboration with selected partners. However, it is also possible that
Cluster II(On the Move)
Cluster IV(At Full Potential)
Cluster III(Stuck with Contacts)
Cluster I(Stuck without Contacts)
High
High
Low
Low ICT & NetworkingCapabilities
NetworkStructure
Figure 12.1 Eff ect of diff erent capabilities and networking structure for ICT-related small fi rms

ICT-related small fi rms with diff erent collaborative network structures 271
they can use their networking and ICT capability and build more fruitful collaborations and move towards cluster IV as very competitive fi rms.
Cluster III is where we fi nd fi rms with many collaborative partners but low networking capability. This seems to be a mismatch since they have a lot of contacts and yet lack the capability to manage these in a way that is benefi cial for the fi rm in the long run. Thus, the name ‘stuck with con-tacts’. These fi rms might have invested in many relations but because they have low networking capability, the outcome might be uncertain. Firms within cluster III were also low on ICT capability, which could work against them as without an appropriate level of technological competence, they might fi nd diffi cult to support several technology-oriented activities, such as using intranet and extranet functions. However, these small fi rms have the same level of entrepreneurial orientation as clusters II and IV, which means that they are obviously doing fi ne presently. Over time, if it becomes necessary to renew the network, these fi rms may face severe prob-lems if they do not develop their capabilities. Therefore, we would like to have a longitudinal dimension where we would be able to detect whether fi rms in this cluster only manage for a short while or are able to compete successfully for an extended period.
Finally, cluster IV are the fi rms with many collaboration partners and high networking capability, thus we call them ‘at full potential’. Moreover they are high users of ICT for all three areas (i.e. internal purpose, col-laboration and communication). Cluster IV fi rms are a good example of fi rms who can combine an extensive collaborative network with ICT and networking capability to achieve entrepreneurial orientation. Thus, we believe that if small fi rms are able to fi nd the right balance between ICT and networking capability, they will not only perform better but will also increase the possibility of future growth. However, as the entrepreneurial orientation is at the same level in this cluster as in clusters II and III, we can’t say that these fi rms are the most competitive. Again, we would need a longitudinal dimension to untangle the key to success in the longer perspective.
As noted before, we performed regression analysis with entrepreneurial orientation as our dependent variable for all clusters and for the entire sample of fi rms. Looking at the entire sample, there is a link between entre-preneurial orientation and capability for ICT (internal and communica-tion use) and networking among our fi rms. Entrepreneurial orientation is linked to proactiveness, risk-taking and innovativeness. By having a high networking capability, fi rms can create a cushion against environmen-tal threats and can take more daring actions (Lorenzoni and Lipparini, 1999). Also, access to external information is the most important source of innovation (Powell et al., 1996; Pittaway et al., 2004). Small fi rms can

272 Entrepreneurship and growth
also use ICT for environmental scanning and to scan for changes that can enhance their ability to be proactive (Fillis et al., 2003). Also, com-municating new information within and outside the fi rm by the use of an intranet or extranet enhances learning (Ruiz-Mercader et al., 2006) from diff erent sources such as suppliers, customers and competitors, and can lead to the development of commercially viable innovations (Johannessen et al., 1999). The only cluster where we found a link with entrepreneurial orientation was cluster I. Thus, for the other clusters, more capability in ICT and networking do not lead to higher EO. This might be because these fi rms already have high EO compared to cluster I fi rms. In terms of ICT and networking capability, fi rms may not be required to be more entrepreneurial at the current stage. Another related explanation is that there are diminishing returns on investing in networking and ICT capabil-ity; that is, when you have reached a certain level of capability, raising it even higher will not pay off .
This study is of course not without limitations. As mentioned before, it is not possible to make clear-cut generalizations from this study because of the absence of longitudinal data. Also, the number of fi rms in some clusters is rather small (especially for cluster II), which could be the reason for not having signifi cant relations in the regression analysis.
CONCLUSION
We started this study with the purpose of fi nding diff erent clusters within ICT-related small fi rms and of observing how diff erent clusters can have diff erent eff ects. Within our study, we identifi ed four clusters and each of them had its own unique characteristics. We found that fi rms with few collaborative partners and lacking networking capability are signifi cantly lower in entrepreneurial orientation compared to the other three groups. Among the other three groups, it seems those with networking capability are better off , but our results do not support this. Cluster III, containing fi rms with a strong collaboration structure but lacking the tools to handle this (i.e. networking capability) seems to cope anyway. This is a genuinely intriguing fi nding and future studies need to examine this further to come up with more detailed explanations.
From the regression results, we have clear indications that it pays off in terms of higher entrepreneurial orientation to invest in improving capabil-ities in ICT and networking. This is especially true if the fi rm is rather low in these capabilities and lacks a strong collaborative network structure.
Finally, as an answer to the question in the title, it seems that small fi rms in the ICT industry can work in diff erent ways to produce the same results

ICT-related small fi rms with diff erent collaborative network structures 273
in terms of entrepreneurial orientation. Some build networks without the capabilities that seem to be needed, while others possess the capabilities but do not build a large network. A third group has the capabilities and the large network. It seems it takes diff erent types of logic to work success-fully in the three situations and our study is unable to provide any clear answers about this logic at this point. We hope this study has provided some interesting answers and has opened up a number of questions in the area of small fi rm inter-organization network research.
REFERENCES
Anand, B.N. and T. Khanna (2000), ‘Do fi rms learn to create value? The case of alliances’, Strategic Management Journal, 21 (3), 295–315.
Arend, R.J (2006), ‘SME–supplier alliance activity in manufacturing: contingent benefi ts and perceptions’, Strategic Management Journal, 27 (8), 741–63.
Audretsch, D.B. and M.P. Feldman (2003), ‘Small-fi rms’ strategic research partnerships: the case of biotechnology’, Technology Analysis and Strategic Management, 15 (2), 273–88.
Baum J.A.C., T. Caladrese and B.S. Silverman (2000), ‘Don’t go it alone: alliances, network composition and start-ups’ performance in Canadian biotechnology’, Strategic Management Journal, 21 (3), 267–94.
Baum, J.A.C. and C. Oliver (1991), ‘Institutional linkages and organizational mor-tality’, Administrative Science Quarterly, 36 (2), 187–218.
Bougrain, F. and B. Haudeville (2002), ‘Innovation, collaboration and SMEs’ internal research capacities’, Research Policy, 31 (5), 735–47.
Bradley, F., R. Meyer and Y. Gao (2006), ‘Use of supplier–customer relationships by SMEs to enter foreign markets’, Industrial Marketing Management, 35 (6), 652–65.
Caldeira, M.M. and J.M. Ward (2003), ‘Using resource-based theory to inter-pret the successful adoption and use of information systems and technology in manufacturing small and medium-sized enterprises’, European Journal of Information Systems, 12 (2), 127–41.
Cohen, W.M. and D.A. Levinthal (1990), ‘Absorptive capacity: a new perspective on learning and innovation’, Administrative Science Quarterly, 35 (1), 128–52.
Covin, J.G. and D.P. Slevin (1991), ‘A conceptual model of entrepreneurship as fi rm behavior’, Entrepreneurship Theory and Practice, 16 (1), 7–25.
Delmar, F., P. Davidsson and W.B. Gartner (2003), ‘Arriving at the high-growth fi rm’, Journal of Business Venturing, 18 (2), 189–216.
Dholakia, R.R. and N. Kshetri (2004), ‘Factors impacting the adoption of the Internet among SMEs’, Small Business Economics, 23 (4), 311–22.
Etzkowitz, H. and L. Leydesdorff (2000), ‘The dynamics of innovation: from national systems and “mode a” to a triple helix of university–industry– government relations’, Research Policy, 29 (2), 109–23.
Fillis, I., U. Johansson and B. Wagner (2003), ‘A conceptualisation of the oppor-tunities and barriers to e-business development in the smaller fi rm’, Journal of Small Business and Enterprise Development, 10 (3), 336–44.

274 Entrepreneurship and growth
Gago, D. and L. Rubalcaba (2007), ‘Innovation and ICT in service fi rms: towards a multidimensional approach for impact assessment’, Journal of Evolutionary Economics, 17 (1), 25–44.
Gemunden, H.G., T. Ritter and P. Heydebreck (1996), ‘Network confi guration and innovation success: an empirical analysis in German high-tech industries’, International Journal of Research in Marketing, 13 (5), 449–62.
Gulati, R., N. Nohria and A. Zaheer (2000), ‘Strategic networks’, Strategic Management Journal, 21 (3), 203–16.
Hagedoorn, J., N. Roijakkers and H.V. Karneburg (2006), ‘Inter-fi rm R&D net-works: the importance of strategic network capabilities for high-tech partner-ship formation’, British Journal of Management, 17 (1), 39–53.
Hoang, H. and B. Antoncic (2003), ‘Network-based research in entrepreneurship: a critical review’, Journal of Business Venturing, 18 (2), 165–87.
Jacob, F (2006), ‘Preparing industrial suppliers for customer integration’, Industrial Marketing Management, 35 (1), 45–56.
Johannessen, J.A. (1994), ‘Information technology and innovation: identifying critical innovation factors’, Information Management and Computer Security, 2 (2), 4–9.
Johannessen, J.A., J. Olaisen and B. Olsen (1999), ‘Strategic use of information technology for increased innovation and performance’, Information Management and Computer Security, 7 (1), 5–22.
Kale, P., J.H. Dyer and H. Singh (2002), ‘Alliance capability, stock market response, and long-term alliance success: the role of the alliance function’, Strategic Management Journal, 23 (8), 747–67.
Koch, C. (2004), ‘Innovation networking between stability and political dynam-ics’, Technovation, 24 (9), 729–39.
Lee, C., K. Lee and J.M. Pennings (2001), ‘Internal capabilities, external networks and performance: a study of technology-based ventures’, Strategic Management Journal, 22 (6/7), 615–40.
Levy, M., P. Powell and P. Yetton (2001), ‘SMEs: aligning IS and the strategic context’, Journal of Information Technology, 16 (3), 133–44.
Lorenzoni, G. and A. Lipparini (1999), ‘The leveraging of interfi rm relation-ships as a distinctive organizational capability: a longitudinal study’, Strategic Management Journal, 20 (4), 317–38.
Lumpkin, G.T. and G.G. Dess (1996), ‘Clarifying the entrepreneurial orientation construct and linking it to performance’, The Academy of Management Review, 21 (1), 135–72.
Madsen, E.L (2007), ‘The signifi cance of sustained entrepreneurial orientation of performance of fi rms: a longitudinal analysis’, Entrepreneurship and Regional Development, 19 (2), 185–204.
Martin, L. and H. Matlay (2001), ‘Blanket approaches to promoting ICT in small fi rms: some lessons from the DTI ladder adoption model in the UK’, Internet Research, 11 (5), 399–410.
Matlay, H. and M. Addis (2003), ‘Adoption of ICT and e-commerce in small busi-nesses: an HEI-based consultancy perspective’, Journal of Small Business and Enterprise Development, 10 (3), 321–35.
Miller, D. and P.H. Friesen (1983), ‘Strategy-making and environment: the third link’, Strategic Management Journal, 4 (3), 221–35.
Oliver, A.L (2001), ‘Strategic alliances and the learning life-cycle of biotechnology fi rms’, Organization Studies, 22 (3), 467–89.
ICT-related small fi rms with diff erent collaborative network structures 275
Ostgaard, T.A. and S. Birley (1994), ‘Personal networks and fi rm competitive strategy: a strategic or coincidental match?’, Journal of Businesses Venturing, 9 (4), 281–305.
Parida, V. and M. Westerberg (2006), ‘ICT use for innovation and competitive-ness in Swedish industrial service SMEs’, paper presented at The 1st Nordic Innovation Research Conference, Oulu, Finland.
Pittaway, L., M. Robertos, K. Munir, D. Denyer and A. Neely (2004), ‘Networking and innovation: a systematic review of the evidence’, International Journal of Management Reviews, 5 (6), 137–68.
Powell W.W., K.W. Koput and L. Smith-Doerr (1996), ‘Interorganizational col-laboration and the locus of innovation: networks of learning in biotechnology’, Administrative Science Quarterly, 41 (1), 116–45.
Ruiz-Mercader, J., A.L. Merono-Cerdan and R. Sabater-Sanchez (2006), ‘Information technology and learning: their relationship and impact on organi-sational performance in small businesses’, International Journal of Information Management, 26 (1), 16–29.
Sarshar, M. and U. Isikdag (2004), ‘A survey of ICT use in the Turkish construc-tion industry’, Engineering, Construction and Architectural Management, 11 (4), 238–47.
Storey, David J. (1994), Understanding the Small Business Sector, London: Routledge.
Stuart, T.E. (2000), ‘Interorganizational alliances and the performance of fi rms: a study of growth and innovation rates in a high-technology industry’, Strategic Management Journal, 21 (8), 791–811.
Venkatraman, N. (1994), ‘IT-enabled business transformation: from automation to business scope redefi nition’, Sloan Management Review, 35 (2), 73–88.
Walter, A., M. Auer and T. Ritter (2006), ‘The impact of networking capabilities and entrepreneurial orientation on university spin-off performance’, Journal of Business Venturing, 21 (4), 541–67.
Westerberg, M. and H. Ylinenpää (2003), ‘Cooperation among smaller fi rms and its relation to competence, entrepreneurship and performance’, paper presented at the 17th Nordic Conference on Business Studies, Reykjavik, Iceland.
Wiklund, J (1999), ‘The sustainability of the entrepreneurial orientation– performance relationship’, Entrepreneurship Theory and Practice, 24 (1), 37–49.

276 Entrepreneurship and growth
APPENDIX
Table 12A.1 Descriptives, factor loading and construct reliability
Construct Items Loading Alpha Mean S.D
Risk-taking In our fi rms. . . we see bold, wide-ranging acts are necessary to achieve the fi rm’s objectives
0.76
. . . we have a strong aptitude for high risk projects (with chances of high returns)
0.88 0.82 0.43 1.34
. . . my fi rm typically adopts a bold posture when confronted with decisions involving uncertainty, to maximize the exploitation of opportunities
0.85
Proactiveness . . . we tend to be ahead of competitors regarding the introduction of products and ideas
0.78
. . . we typically initiate actions which competitors then respond to
0.86 0.85 0.77 1.26
. . . we are often the fi rst to introduce new products and services, new ways to produce these or new administrative methods
0.82
Innovativeness . . . we have a strong emphasis on R&D, technological leadership, and innovations
0.76
. . . changes in product or service lines have usually been quite dramatic to achieve competitive advantage
0.75 0.76 0.97 1.43
. . . one of the main goals is to launch many new lines of products/services in next 3 years
0.79
EO – Entrepreneurial orientation
Risk-taking 0.72 0.76 0.72 1.08Proactiveness 0.84Innovativeness 0.84
Coordination . . . we analyse what we would like and desire to achieve with which partner
0.78
. . . we develop relations with each partner based on what they can contribute
0.68 0.74 1.39 1.01
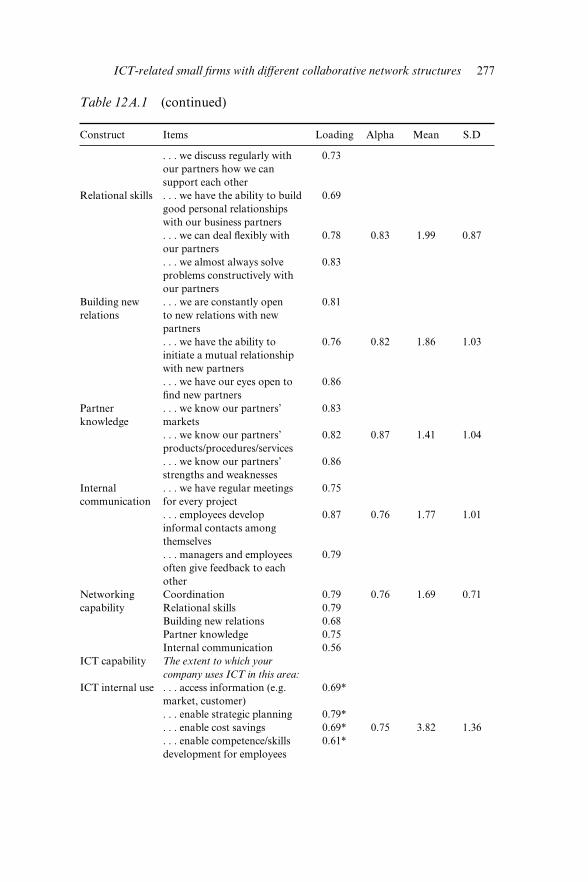
ICT-related small fi rms with diff erent collaborative network structures 277
Table 12A.1 (continued)
Construct Items Loading Alpha Mean S.D
. . . we discuss regularly with our partners how we can support each other
0.73
Relational skills . . . we have the ability to build good personal relationships with our business partners
0.69
. . . we can deal fl exibly with our partners
0.78 0.83 1.99 0.87
. . . we almost always solve problems constructively with our partners
0.83
Building new relations
. . . we are constantly open to new relations with new partners
0.81
. . . we have the ability to initiate a mutual relationship with new partners
0.76 0.82 1.86 1.03
. . . we have our eyes open to fi nd new partners
0.86
Partner knowledge
. . . we know our partners’ markets
0.83
. . . we know our partners’ products/procedures/services
0.82 0.87 1.41 1.04
. . . we know our partners’ strengths and weaknesses
0.86
Internal communication
. . . we have regular meetings for every project
0.75
. . . employees develop informal contacts among themselves
0.87 0.76 1.77 1.01
. . . managers and employees often give feedback to each other
0.79
Networking capability
Coordination 0.79 0.76 1.69 0.71Relational skills 0.79Building new relations 0.68Partner knowledge 0.75Internal communication 0.56
ICT capability The extent to which your company uses ICT in this area:
ICT internal use . . . access information (e.g. market, customer)
0.69*
. . . enable strategic planning 0.79*
. . . enable cost savings 0.69* 0.75 3.82 1.36
. . . enable competence/skills development for employees
0.61*

278 Entrepreneurship and growth
Table 12A.1 (continued)
Construct Items Loading Alpha Mean S.D
ICT collaboration
. . . maintain collaboration with existing business partners
0.84*
. . . establish business collaborations with new partners
0.78* 0.78 4.34 1.36
. . . enable work fl exibility (e.g. work outside the offi ce)
0.63*
ICT communication
. . . handle communication within the fi rm (e.g. intranet)
0.66*
. . . handle external communication with the fi rm’s stakeholders (e.g. extranet)
0.82* 0.75 3.85 1.31
. . . promote marketing activities
0.57*
Note: Likert scale: –3 to +3; * Likert scale: 1 to 6.

PART VI
Entrepreneurship and Social Inclusion

281
13. Does enterprise discourse have the power to enable or disable deprived communities?Carole Howorth, Caroline Parkinson and Alan Southern
INTRODUCTION
Many local economic development and regeneration initiatives have con-nected enterprise and deprived areas. They posit enterprise as a tool for releasing human, social and economic potential. Policy makers are keen to promote enterprise as the solution to deprivation, recognizing employ-ment opportunities through new business start-up and local growth. In this sense, not only are communities being asked to take responsibility for their own futures by being enterprising (see Blackburn and Ram, 2006), the implication is that they will be held accountable for the lack of enterprise that is leading to their deprivation. This is seen in many UK approaches to local economic development but is particularly evident in the drive for social enterprise over the last ten years and as a broader part of both social and economic regeneration.
Social enterprise is thus attracting signifi cant interest from a policy perspective and also as a new context for the study of entrepreneurship. The rhetoric of social enterprise adopts the language of business and entrepreneurship as a way forward for particular sections of society. Pomerantz (2003, p. 26) expresses a widely held view in writing, ‘The key to social enterprise involves taking a business-like, innovative approach to the mission of delivering community services.’ The people who run social enterprises are often called ‘social entrepreneurs’ because they are expected to combine ‘entrepreneurial fl air with a commitment to giving something back to the community’ (Michael, 2006).1 However, Parkinson and Howorth (2008) found that managers of social enterprises, whom others labelled as social entrepreneurs, did not themselves identify with the entrepreneur label. The application of the entrepreneurship paradigm to this social sphere has been questioned conceptually, practically and
282 Entrepreneurship and growth
ideologically (Krashinsky, 1998; Paton, 2003; Pearce, 2003; Dees, 2004; Cho, 2006) and there are concerns that the repackaging of longstanding community processes as a new form of entrepreneurship is neglecting some of the ideological and political principles at their roots (Pearce, 2003). Berglund and Johansson (2007) argue that the dominant enterprise discourse actually suppresses entrepreneurial initiatives in their study of a region in decline in Sweden.
A vast body of literature points to a range of problematics in under-standing the interplay between community, entrepreneurship and dep-rivation. There is a danger that policy could overlook the conceptual and ideological complexities inherent in every aspect of enterprise and deprived communities. Previous research has highlighted issues around the changing dynamics of poverty (Fitzpatrick, 2004) and social exclusion (Power, 2001; Blackburn and Ram, 2006); the eff ectiveness of area based policies (Chatterton and Bradley, 2000); the impact of entrepreneurship on deprivation in regeneration and economic development policy terms (Lloyd and Mason, 1984; Haywood and Nicholls, 2004; Nolan, 2003; Southern, 2006); the impact of regional structural eff ects (Johnson, 2004); the infl uence of peripherality on munifi cence (Benneworth, 2004); links between small business and the local community (Curran et al., 2000), and the infl uence of civic engagement on social-economic well-being (Tolbert et al., 1998).
Previous research alludes to the importance of the relationship between dominant world views encapsulated in enterprise policy and those com-peting on the ground. Theories on inequitable social relations and social reproduction, particularly those with a Marxist starting point (see for example, Althusser, 1984; Bordieu, 1985, 1989; Foucault, 1972, 1982; Gramsci, 1971), would suggest that hegemonic discourses, in this case the ‘grand’ discourse of enterprise that has pervaded western society since the 1980s, perpetuate the normative views of those in power and impose ‘calls to order’ that those subordinated to the discourses are bound to follow. There seems to be a tension in recent literature, however, with critics of this deterministic view fi nding that counter hegemony is thriving and that groups and individuals are able to contest or appropriate discourses for themselves (Cohen and Musson, 2000; Jones and Spicer, 2005; Moulaert et al., 2007; Parkinson and Howorth, 2008).
Enterprise and entrepreneurship are nevertheless fi rmly established in the lexicon of regeneration and renaissance. This chapter critically exam-ines the discourse around such policies. It provides a critical perspective on the top down promotion of enterprise targeted at places identifi ed in policy terms as deprived, with particular reference to social enterprise. By reviewing both the discursive features of recent enterprise policy and
Can enterprise discourse enable or disable deprived communities? 283
the discourse analysis of interviews with three levels of social enterprise agents, competing world views are revealed, which raises cautionary points relevant to academic and practitioner worlds. Through an analysis of language, the infl uence of the enterprise narrative or myth is explored. We attempt to demonstrate how deprived communities have become an arena for a sometimes negotiated, and often contested, space as enter-prise policy is formed and particular conceptualizations of enterprise and entrepreneurship are favoured.
In this chapter we analyse the structured discourse that prevails in national and regional policy circles and contrast it with the discourse of three groups: social enterprise support workers, social and local entre-preneurs and community workers. We highlight ideological tensions and confusion that improve our understanding of the mixed results reported for enterprise policy in deprived communities (Blackburn and Ram, 2006). This is extremely important in determining the appropriateness and effi -cacy of enterprise policy and in developing an understanding of how it works (or not) ‘on the ground’.
We fi rst provide a critical overview of UK enterprise policy in deprived areas. We then set out the value of Bordieu’s theories of symbolic violence for understanding the subordination of communities that are deemed deprived. We then present some counter arguments that could allow us to perceive communities as more active agents – not constrained by a habitus acquired over time and from experience. Following this we explain the method adopted, which was based on discourse analysis. Our analysis examines the emergence of a structured discourse around recent policy on enterprise, before comparing the language used by three diff erent groups involved in social enterprise activities. Our conclusions highlight the important implications of the study for policy and practice.
ENTERPRISE IN UK LOCAL POLICY: THE SALVATION OF DEPRIVED AREAS
Enterprise has been a central thread in local economic development (LED) from the second half of the twentieth-century, as a strategy for addressing decline, recession and more lately the eff ects of internation-alization, globalization and social exclusion (Blackburn and Ram, 2006; Eisenschitz and Gough, 1993; Wong, 1999). A political response to macro eff ects impacting on the prosperity of local areas, it has been through various phases throughout 40 years in the UK but always supported by political consensus (Eisenschitz and Gough, 1993). At the same time as a policy push for enterprise, a lack of enterprise has characterized political

284 Entrepreneurship and growth
responses to localism, such as anti-enterprise views of British culture of the Thatcher years (Eisenschitz and Gough, 1993) and public policy diagnoses of neighbourhood decline (Kintrea, 2007).
LED has always linked social and economic issues. However, since the election of a Labour government in 1997, enterprise, or at least enter-prise policy, has gained an extra dimension: redressing social exclusion in depleted communities, neighbourhoods that conventional wisdom suggest have a defi cit in levels of entrepreneurial behaviour. It appears that policy makers and advisers promote enterprise as ‘the solution’ to deprivation. Moreover, in the most intractably problematic areas, social and commu-nity enterprise are positioned as the panacea for entrenched economic and social ills.
This is perhaps most evident in the policy investment in social entre-preneurship and social enterprise over the last decade in the UK. Many clearly locate social enterprise within community or economic develop-ment, where it has a political agenda of alternative democratic structures and processes. Pearce (2003) traces the history of the movement in the UK back to the 1970s Job Creation Programme, when the focus was on community development, and the cooperative movement. Haughton (1998) situates the UK movement within sustainable regeneration, itself a response to the failure of top down urban policy approaches throughout the 1980s. Social and community entrepreneurship in the UK emerged out of structures aimed at anchoring the benefi ts of the local economy within communities. It was not until the end of the 1990s in the UK that the discourse around social enterprises as businesses emerged. Since then, the topic has seen a radical and rapid discursive shift through various agendas, now critiqued (Krashinsky, 1998; Paton, 2003; Pearce, 2003; Dees, 2004; Cho, 2006), including those above, to the social economy and social entrepreneurship.
An ideological vision of enterprise, embodied in LED in the 1960s and 1970s, was captured by Eisenschitz and Gough (1993, p. 4) when talking about LED’s vision for local communities to become ‘active shapers of their destiny’:
The central way in which [. . .] local resources are conceptualised is as ‘enter-prise’. Enterprise denotes the initiative not only of business but also of workers, as workers or as would-be entrepreneurs, and of volunteers, organisations and communities groups. In an even wider sense, enterprise suggests the need to shake off past routine, to question past assumptions, to think and act radically; every local organisation, public as well as private, economic as well as social, is to be enterprising in this sense. All local social groups are to be involved, and their collaboration is to constitute the locality as a unifi ed entity, a community, able to fi ght for its place within the hostile world outside. The movement, then, marches under the banners of local autonomy, enterprise and community.

Can enterprise discourse enable or disable deprived communities? 285
Some have suggested that this promotion of enterprise as ‘the solution’ to deprivation is akin to communities being asked to take responsibility for their own futures through their adaptation to enterprising behaviour, while at the same time noting that there is little evidence to support any views that such policy actually works (see for example Blackburn and Ram, 2006). Overall, the presumption of public policy reliant on enter-prise as a solution to social and economic ills of target groups or areas has come under attack (Macdonald and Coffi eld, 1991; Gavron et al., 1998; Servon, 1997; Blackburn and Ram, 2006). Blackburn and Ram (2006, p. 77), for example, explicate the fundamental tension in expecting business and enterprise to tackle social exclusion which is a product of the very capitalist system in which they operate.
The following section considers how one world view (e.g. enterprise is ‘the solution’) can prevail and become hegemonic.
BORDIEU, SYMBOLIC VIOLENCE AND THE ARTICULATION OF DEPRIVED COMMUNITIES
Bordieu (1989) conceptualizes the process of world views gaining domi-nance in terms of symbolic violence. Symbolic violence refers to the gradual and complicit subordination of people to ideas and structures, promulgated by those in possession of symbolic capital (Bordieu, 1989; Bordieu et al., 1994). Symbolic violence is the antithesis of physical vio-lence in that it is indirect and socially reproduced, bringing about one’s own subordination through a complicity that is neither enforced nor pas-sively deferential (Connolly and Healy, 2004). Instead, symbolic violence is seen as occurring iteratively and stems from individuals’ predispositions to the world around them that are developed over time (Connolly and Healy, 2004) – the much cited ‘habitus’ Bordieu’s work is often reduced to. Through the symbolic violence exerted by dominant groups in society, their values/norms/world view are quietly accepted until they become taken for granted, part of the pre-refl exive agreement of the commonsense world (Bordieu et al., 1994, p. 15).
Interestingly, Bordieu (1989) argues that ‘elusive’ social collectives such as ‘the community’ come into being through the very act of being classifi ed or codifi ed. Through words, collectives are nominalized and social divi-sions become distinguishable. The naming process is a fundamental part of world making and, more specifi cally, class struggle. In relation to this study, nominalization of areas in terms of deprivation, community and area based regeneration, and local economic development would repro-duce social privilege, by diff erent tiers and agents within society. This is
286 Entrepreneurship and growth
not a benign act but a political process: ‘The power to make visible and explicit social divisions that are implicit is political power par excellence’ (Bordieu, 1989, pp. 23–4).
Bordieu et al. (1994) argue that holders of capital (e.g. physical force, economic capital, informational or cultural capital and symbolic capital) use it to fi ght for power. Within this fi ght over social space, the role of the state is paramount, and it is portrayed as the holder of the monopoly of legitimate symbolic violence and the ‘repository of common sense’ (Bordieu, 1989, p. 22). Offi cial discourse is held up as quasi ‘divine’; pro-viding identities, prescribing what people should be doing, recording what people have done. It is of relevance therefore to recognize how the concept of symbolic violence helps us to refl ect on the contested space associated with policies aimed at deprived communities. Bordieu’s work has been used to look at how broader societal issues aff ect inequality, particularly in the fi eld of education.2 Bordieu’s theories of symbolic violence are however predicated on subordination and compliance, notions that are challenged in some recent entrepreneurship literature.
ENTREPRENEURSHIP – CHALLENGING HEGEMONY?
Entrepreneurship is no longer accepted solely as an economic entity. The cultural turn in entrepreneurship research has led to a wide body of work focusing on the links between entrepreneurship and diff erent aspects of society or contexts. These range from the reciprocal benefi ts from the interaction between fi rms and their local environments (Tolbert et al., 1998; Kilkenny et al., 1999; Laukkanen, 2000; Johannisson et al., 2002) and the informal economy (Portes, 1994; Evans et al., 2004; Williams, 2005) to ethnic minority enterprise (Ram and Smallbone, 2003; Deakins et al., 2007) and the linguistic turn in entrepreneurship studies (Hjorth and Steyaert, 2004; Berglund and Johansson, 2007). Entrepreneurship is con-ceived as a process taking place in various spaces and dimensions, socially embedded and constructed (Johannisson et al., 2002), communally and relationally constituted (Zafi rovski, 1999; Hodson and Kaufman, 1982; Fletcher, 2006; Anderson and Jack, 2002). Entrepreneurial processes have meaning that is specifi c to a particular time and place (Hjorth and Johanisson, 2003; Fletcher, 2006), perhaps also ‘liminal’ in that it takes place at the edges or in between structures (Anderson, 2005; Jones and Spicer, 2005). At the level of research at least, entrepreneurship is recog-nized as a complex social phenomenon.
Despite this acknowledged complexity, the literature points to the
Can enterprise discourse enable or disable deprived communities? 287
hegemonic power of the enterprise discourse in policy and popular media. Ogbor (2000) argues that dominant entrepreneurial discourses portray the entrepreneur as an aggressive hero. It is argued that a ‘reproduction of familiar ethnocentric, discriminatory and gender biased assumptions of entrepreneurship’ is encouraged (Fletcher, 2003, p. 129). This provides us with the ‘grand narrative of entrepreneurs and small businesses’ (Perren and Jennings, 2005, p. 176), which presents a narrow understanding of what it means to be entrepreneurial and is refl ected by locking into a specifi c ‘enterprise solution’. It provides an understanding of a particular policy drive (i.e. more enterprise as it is uncritically good for society), a particular objective (i.e. more entrepreneurs as their behaviour will give us, uncritically, more enterprise) at a particular scale (i.e. the local, for it is here where the answers to global forces can be found.)
In terms of popular readings of this discourse, Anderson (2005) points to the persistent power of the heroic entrepreneurial metaphor. Nicholson and Anderson (2005) propose that the myth embodied in cultural beliefs, popular literature and journalism becomes self-perpetuating; mystery is created around the myth of the entrepreneur and is perpetually reinforced. The mystery shrouding the myth grows; the myth becomes shorthand and eventually ‘the uncorrected “collective memory”’. (Nicholson and Anderson, 2005, p. 166). The discourse of the enterprise culture can be seen as reasserting individualism (Nicholson and Anderson, 2005).
In a macro sense, therefore, the dominant discourse of entrepreneurship fi ts into a neo-liberal world view of how social and economic problems should be addressed. In line with Bordieu, above, much of this work assumes that language is a refl ection of power relations, struggles and dynamics (Foucault, 1972, 1982). A Foucauldian stance is adopted in that discourses themselves are creative and determine how power and knowl-edge are produced (see Parker, 1999; Ahl, 2007).
However, at a micro level there are challenges to the hegemony of enter-prise or entrepreneurship discourses. The Foucauldian perspective and its antecedents are criticized for assuming that the individual is slave to ide-ologies or discourses and is powerless to resist (Cohen and Musson, 2000; Jones and Spicer, 2005). That view of the individual is seen as determinis-tic, leaving no room for individuals to resist and fi nd their own alternative discourses. An alternative view is that individuals appropriate or re-write the discourse to make sense of their specifi c realities. Various studies show how individuals and groups reproduce idealized views of entrepreneurs and what it means to be entrepreneurial, while simultaneously challeng-ing and re-writing the enterprise discourse (Fletcher, 2006; Cohen and Musson, 2000). Contrary to the hegemonic view, Cohen and Musson (2000) present individuals as able to discriminate between discourses and
288 Entrepreneurship and growth
appropriate them to their circumstances, with some elements of the busi-ness or enterprise discourse being appropriated and others rejected. Cohen and Musson (2000) argue that meaning cannot be solely constructed by those in positions of power to exclude or include certain groups, since this is also alterable by the subjects of the discourse.
In their study of urban development, Moulaert et al. (2007) found that the hegemonic discourse was neither omnipotent nor self-fulfi lling in prac-tice and that policy and practice remain pragmatic in the face of the rapid advance of neo-liberal logic. Instead, ‘counter-hegemonic forces’ make up part of the patchwork of local agents, and through social innovation can actually permeate macro structures (Moulaert et al., 2007, p. 202). They also found that the gap between practice and the ‘grand discourse’ is wider as people are closer to real communities, where the connection to path dependency is stronger. As Begg (2002) argues, it is at the local level that discourse is challenged and reproduced.
In terms of enterprise policy, this indicates the potential for communities or groups to author their own futures to a degree, in spite of social repro-duction of asset-poor communities by the state through the hegemonic discourse of enterprise. This empowerment is a powerful tenet of social regeneration and social inclusion initiatives, as well as social enterprise.
The above discussions present two connected but diff erent perspectives on the power of discourse in terms of how it is authored and, critically, how it is reproduced. This study seeks to understand which perspective helps to explain the eff ects of the enterprise discourse within deprived areas. It looks fi rst at the discourse in UK enterprise policy, which pro-vides the discursive context within which communities and agencies may be working, and then at interview data to provide a snapshot of how dif-ferent actors embrace or contest these discourses in articulating their own situations.
METHOD
The research method is discourse analysis.3 We draw broadly on Fairclough (1989, 1992, 1995) and Weiss and Wodak (2003), whose works on critical discourse analysis (CDA) suggest that discourse is more than refl ective of social power situations, in that language infl uences, as much as it is infl uenced by, social practice. Discourse must therefore be studied in ref-erence to the social and political context (Fairclough and Wodak, 1997). Critical discourse analysis includes situations, objects of knowledge and the social identities of and relationships between people and groups of people (Weiss and Wodak, 2003). Language is constitutive of meaning, the
Can enterprise discourse enable or disable deprived communities? 289
‘prism through which we conceptualise the world’ (Jacobs, 2004, p. 819) and is seen as a social practice shaping, and shaped by, social relations and structures. Analysis is critical in that it is explicitly linked to the research-ers’ interest in a social issue – in this case enterprise policy and its eff ects on people in its targeted deprived areas.
In particular we refer to the Frankfurter school of discourse analysis. We conducted a loose CDA on our interview data, which followed a three-stage framework of text production (the macro context within which statements are made, how they connect to other debates and how the interviewees generally framed their spoken texts), text analysis (the micro processes of discourse that shape the text (Fairclough, 1992), including modality and word meaning) and fi nally social practice (eff ect of the texts on wider power relations and ideologies). To analyse the prevailing discourses in UK policy, we used a broader approach, analysing state-ments from key documents out of which current UK enterprise policy in deprived areas emerged.
The study was based in a defi ned UK area of deprivation, which has persistently ranked in the worst 10 per cent of areas in the UK accord-ing to the Index of Multiple Deprivation (IMD).4 These indices are the basis for governments to develop area-based responses to the persistence of poverty and social exclusion, including initiatives aimed at increas-ing levels of enterprise such as the Neighbourhood Renewal Fund. The study thus focuses on one specifi c deprived area, which qualifi es for a range of particular funding streams and enterprise development assist-ance, in order to provide a similar geographical basis for participants’ experiences.
Semi-structured and unstructured interviews were held in 2006 with ten individuals taking part in a learning and development programme for social enterprise managers or social entrepreneurs. These included three enter-prise support workers; three managers of social enterprises with varying experience, plus one local entrepreneur involved in starting up a social venture; and two community leaders, one of whom managed a community centre and the other managed a community gym, but both were involved in activities labelled as social enterprise. Table 13.1 provides a summary of the basic characteristics of the interviewees. All interviews were recorded, lasted between one and one and a half hours and took place mainly at the interviewees’ own workplaces. In addition, the researchers observed and recorded a steering group meeting of a three-year social enterprise support initiative, involving 11 participants, including representatives of local and regional funding bodies, offi cers from two local authorities, (social) enterprise support agencies, one social enterprise representative and an academic. The recordings were transcribed verbatim.

290 Entrepreneurship and growth
After an initial reading of the entire interviews, sections of the interviews of one page or less were selected for analysis. The excerpts were chosen to be most revealing in terms of how the enterprise discourse, texts or content were reproduced or contested. More precisely, the sections were chosen that give insights into at least one of three factors: how the enterprise discourse was manifest or contested; how the discourse might have the eff ect of including or excluding diff erent agents; or self-representation in relation to the enterprise discourse. Within-group analysis was undertaken on the ten interviews in three groups: support workers, entrepreneurs and community leaders. Cross-group comparisons were then made.
ANALYSIS AND FINDINGS
As stated above, the analysis examined two levels of discourse: the pre-vailing discourses in UK enterprise policy, with specifi c reference to social enterprise; and the enterprise discourse as embraced by local actors when asked to talk about their own perceived realities. The former aims to set the discursive context within which local actors operate. The latter aims to understand how the enterprise discourse, including the texts or content from these prevailing discourses, is reproduced or contested in our own interview data.
Table 13.1 Characteristics of interviewees
Support workers:*SW1 M Director of a cooperative consultancySW2 F Project manager of an SE support projectSW3 M Local authority offi cer with remit for
supporting social and community enterpriseSocial entrepreneurs:*E1 M Manager of a white goods recycling
enterpriseE2 F Manager of a disability projectE3 M Manager of a community gymE4 M Director of a sea training schoolCommunity leaders:*CL1 F Community centre managerCL2 M Setting up a community gym
Note: * These labels were allocated by the researchers to distinguish between categories of local actors, and may not necessarily be used or accepted by the participants.

Can enterprise discourse enable or disable deprived communities? 291
Prevailing Discourses in UK Enterprise Policy: Structuring a Discourse of (In)Equality
The following section looks at the language used in constructing policy. It is based on selective quotes, all from the point at which the current strand of UK enterprise policy emerged.
The fi rst comes from the Policy Action Team 3 (PAT 3), a group of policy makers and practitioners who brought together the new view on enterprise. These could be referred to as the visionaries who sought to introduce the ‘Third Way’ into ideas about enterprise from the 1997 watershed. From their initial document we see clearly stated the intention of the new Labour administration in 1999 to draw on enterprise to address matters of social and economic exclusion. This document, titled simply but with some degree of force ‘Enterprise and Social Exclusion’, set the tone for what was to follow:
A shortage of jobs, local services and enterprise is one aspect of exclusion facing people in disadvantaged neighbourhoods. The challenge in economic terms is to rebuild livelihoods and restore robust local markets. Sustainable neighbour-hood renewal will not happen without enterprise development. Conversely, enterprise development will be of only marginal relevance unless it is part of a wider strategy to develop people’s skills and self-esteem and help them use mainstream services from which they feel excluded. (Policy Action Team 3, 1999, p. 6, emphasis added)
This extract presents a structural perspective related to societal rebuilding, restoration, renewal and development. In this sense we see language asso-ciated with construction and physical action used as a metaphor, with the key ‘tool’ (to continue the metaphor) being enterprise. Furthermore:
[p]romoting enterprise to expand employment opportunities can build confi -dence and capacity and off er a route out of exclusion through economic oppor-tunity. Enterprise development should therefore be an important indicator of the success or failure of neighbourhood renewal. (Ibid.)
Not only is the metaphor embellished as demonstrated in this extract, but brought into play is the idea of new economic opportunities emerging. This emergence is an important feature in the language of enterprise and how it is associated with depleted communities. It is entirely consistent with the views of Blackburn and Ram (2006, p. 74) when they state ‘the notion of “enterprise” has been positioned as a key means of helping to overcome social exclusion’.
Following the view from the group of experts who made up PAT 3 comes a second example to demonstrate how politicians support the policy
292 Entrepreneurship and growth
initiative that brought in the Phoenix Fund. The Phoenix Fund was an initiative that came from the PAT 3 report and was established in 2000 aimed at encouraging entrepreneurship in disadvantaged areas. Patricia Hewitt, the then Trade and Industry Secretary commented on this initia-tive: ‘The Government is committed to enterprise for all, no matter where people live or whatever their circumstances. The new money will help more people start up in business’ (Business Hotline Publications, 2003, p. 1, emphasis added). This line of ‘enterprise for all’ was pushed further by the Small Business Minister, Nigel Griffi ths. Griffi ths outlined the role of Community Development Finance Institutions (CDFIs), a means by which fi nance for enterprise could be accessed in depleted communities. He stated:
The Government recognises that CDFIs have a vital role to play in providing fi nance to some of our most imaginative and tenacious entrepreneurs. CDFIs are fi lling a vital gap in access to fi nance in more disadvantaged communities, forming a bridge between the public and private sectors. CDFIs are helping us to provide enterprise opportunities for all, and ensure that the best possible support is in place for those who want to start or grow their own business – no matter what their background. (Small Business Service Press Release, 14 April 2004, emphasis added)
Enterprise, still in its heroic sense, has become an egalitarian mantra and is inclusive and for all. Such is the reiterated message. This is refl ected in the name of this initiative, ‘Phoenix’, that refers to a mythical bird that is reborn from the ashes in much the way that politicians seek enterprise to be the magical remedy from which depleted communities can be reborn.
A third example, as part of the structured discourse, comes from the cautious but realistic practitioner, the Bank of England who (prior to the Phoenix initiative but in response to PAT 3) looked at fi nance for small businesses in deprived areas. The Bank noted how the promotion of enter-prise in depleted communities can assist the circulation of money within a neighbourhood and provide much-needed jobs. They state:
The causes of social and fi nancial exclusion are complex and there are a variety of symptoms. The nature of deprivation in a particular area depends on many factors, including its history, the origin and duration of its economic prob-lems and the particular industry or industries which have declined. (Bank of England, 2000, p. 3 emphasis added)
This is a cautionary tale to indicate that the private sector is not wholly responsible for the vagaries suff ered by those living in depleted communi-ties. It is a change in emphasis from the language used by policy makers and politicians, a contrast to the metaphor of building, seizing opportunity
Can enterprise discourse enable or disable deprived communities? 293
and inclusion. It is further embellished through the Bank’s report, for example: ‘While the promotion of businesses in deprived areas can have a number of positive impacts on local people, several studies have stressed that business establishment on its own should not be viewed as a primary tool for tackling deprivation’ (ibid, p. 14). The almost defensive position of the Bank noted here not only seeks to exonerate the private sector from the responsibility for social and economic exclusion but is also apologetic for enterprise not being the answer for such problems. In this respect they may well be correct. However this is not the point but that they, the Bank of England, are an important part of the structured discourse on enterprise in deprived communities.
In a review of core policy and strategy texts on social enterprise from national, regional and local agencies, Parkinson and Howorth (2008) highlight many similar concepts: for example, ‘doing lots with very little, fi nancial independence through sustainability, contributing to the main-stream economy, bringing business discipline to social ventures, innovat-ing for change, helping people take charge of their lives and futures’. It is assumed that social enterprises will take on the existing business model, which excludes the potential to develop new models. For example, ‘Social enterprises must see themselves as businesses, seek to become more pro-fessional and continuously raise their standards of performance and their ambitions’ (DTI, 2002). And social enterprises are encouraged to be part of the mainstream economy: ‘social enterprise should “become part of the solution to reviving and strengthening local economies” but should not be seen as a side show to the real economy’ (NWDA, 2003). Pearce argues that there has been a shift in language from political engagement to problem fi xing, collective action to individual entrepreneurs, and from democratic structures to a focus on social purpose (Pearce, 2003). The charge is that in the rise of the social enterprise agenda, community has been sidelined discursively, and complex values and meanings behind the social ignored.
It is important to note that we are not suggesting that these initiatives are wrong or that they are intrinsically fl awed. What we are suggesting is that the policy drive may bring with it a particular discourse that is limited. It is possibly restrictive in that it could reduce the entrepreneur who oper-ates in a depleted community (and his or her voice) to being a passive recipient of the dominant policy discourse. It takes little if any account of the contested space that is policy formation, or the contested space that is entrepreneurship and business in deprived communities.
By locking into this narrow, particular view of enterprise, the social regenerative potential from initiatives that manifest in new forms of social or local enterprise may be lost. No account is taken of eff ects on family
294 Entrepreneurship and growth
and kinship, the raising of aspirations and self-esteem and the impact on the community psychology that prevail in localized neighbourhoods. In fact, the structured discourse not only acts as an exclusive narrative but it brings into play individual actors as part of an economic response, at the expense of local politics and alternative ideals about the meaning of enterprise (Gibson-Graham, 2006).
Our aim in the second analysis is to look at the language of those indi-viduals and consider the extent to which they challenge or appropriate the structured policy discourse. As we attempt to do this we seek to iden-tify those ideological tensions and contradictions that become apparent within individuals as well as between groups in depleted communities. This can help draw out some of the complexities that are implicit in policy objectives; not least the potential of enterprise policies aimed at deprived communities in reinforcing inequitable social relations and economic inequity.
ANALYSIS OF INTERVIEW DATA
The fi ndings discuss use of, and associations with, the enterprise discourse promoted in the policies, among each of the three groups. We summarize briefl y the main issues at the end of each section before discussing the fi nd-ings in relation to each other, particularly the intended and unintended eff ects of the enterprise discourse as it is reproduced by the diff erent groups.
Support Workers
The support workers display a polarized conceptualization of (social) enterprise, in which enterprising activities are defi ned in contrast to funding dependency. Funding and grant schemes are seen as both the driver behind the existence of many social enterprises and their weakness. Enterprise on the other hand, and trading in particular, is positioned as the antidote to dependency and complacency.
In the following extract, Support Worker 1 (SW1) contrasts positively framed enterprising activities (income generation, trading) with more negatively framed ‘looking for funding’:
I think we need to make things reasonably clear that people who are interested in enterprising activities, income generation, becoming a trading organisation and we will assist them. I think if they’re interested . . . if they’re only going to be looking for funding then I don’t think . . . you know, I think there’s other . . . there’s other people that are in that market. (SW1)

Can enterprise discourse enable or disable deprived communities? 295
It becomes clear that he considers the priority is to help existing social enterprises, operating within a constituted framework (by omission, there-fore, individuals and communities engaging in social entrepreneurship more widely), to achieve income through trading. This is also seen in the views of SW 2, who equates ‘true’ social enterprise with sustainability, defi ned as generating money to cover costs:
SW2: Oh gosh . . . I would say it’s a business that’s run with social aims [. . .] But on the whole, if it’s true social enterprise it should be able to sustain itself.
I: What do you mean by sustainable?SW2: Pay its own bills, pay its core costs, yeah, not be a funding junkie, as we
say . . .
Trading is presented here in opposition to dependence and the ‘false’ state of relying on funding. The negative association with funding is further compounded by use of the drugs-related term ‘junkie’. In the steering group meeting, various references are made to the other side or the other way, which reinforce this polarization:
M: . . . it’s gone more to the other side now . . . the other way, you know, looking for grants.
F: YeahM: Looking for grant schemes and writing business plan and people obvi-
ously know stuff . Now it’s turned the other way round, which I think a lot of social enterprises are going that way now.
The eff ect of this dichotomy is to marginalize the social and exclude other forms of organization and activity. Interestingly, in the steering group meeting, there is overt discussion of this shift to a business language, which it is claimed off ers relief from the jargon presumably prevailing in the social sector:
M: And kind of the business plan was the way of getting some money, so it was a sort of means to an end. Whereas now, there seems to be much more talk about having a sustainable business plan and all those types of issues have come to the forefront. And then the funding’s kind of an add-on that they may be able to get. But fi rst and foremost, it’s a plan for a business and not just . . .
In fact, achieving this discursive shift to a language, in which the busi-ness plan is more meaningful, is held as a triumph in its own right. The statement ‘and not just . . . ’, above, has the eff ect of marginalizing other forms of social enterprise organization. This is perpetuated by SW2 who is dismissive of not just the term social enterprise but of the people involved, whose activities she compares against enterprise:

296 Entrepreneurship and growth
I: Why do you think they don’t think of themselves as being a social enter-prise then?
SW2: I think they just sort of think of themselves as doing a service. I just don’t think that they even think that’s what they are, community sort of businesses or whatever they want to call themselves. . . . They just don’t, they just think ‘oh we’re a bunch of ladies who get together and . . . ’, yeah.
In the process, the social element of the social enterprise’s endeavours is tacitly (and, at points, overtly) discredited. In the following excerpt from Support Worker 3’s interview, a valuable social service is praised in its own right but critiqued for attempting to be a social enterprise:
SW3: . . . there was a review of the service about two years ago now I think, that gave it a glowing report . . . It showed categorically that there was an improvement in the reading of the people that they’d worked with. But where’s the income? [. . .] It’s a great project, brilliant outcomes, all that stuff , but who’s going to pay for it?
Paradoxically, we fi nd out later that the reason for the project’s transition was externally driven; to take on a separate status from the county council (the local authority that employs SW3), in order to continue accessing funding.
Within the support workers’ narrative of becoming business-like, the two main tenets are sustainability and money/income, all interconnected and used interchangeably. Paying bills appears central to the support workers’ construction of enterprise. The same point is made in the steering group meeting, where consensus on this resonates:
F: . . . But you’ve still got to be business-like and you’ve still got to pay your bills. And that’s the point.
F: That’s the point, yes.
In both excerpts, sustainability appears to be the end goal of enterprise, and the imperative for social enterprises is the process of becoming sus-tainable. Social need, usually closely associated with social entrepreneur-ship, is backgrounded by this emphasis on sustainability.
The enterprises’ ability to generate money and thereby become sustain-able becomes a condition of support from the social enterprise support project. While rhetorical emphasis is placed on good relationships built on trust between social enterprises and the project, this relationship is both conditional and transformational in its agenda. In the following extract from the steering group meeting, support is seen to depend more on viability than need:

Can enterprise discourse enable or disable deprived communities? 297
F: . . . I want to see this happen anyway if we possibly can. But to take the previous point, you know, is it a viable business. If it is, then we’ll pull out stops and make it happen.
M: yeahF: yeah, if it’s got the right . . .M: if it’s got legs?F: yeah.
In this organizational perspective on social enterprise, there is less value given to entrepreneurship or being entrepreneurial. In line with accepted understandings of entrepreneurship, being entrepreneurial is defi ned pri-marily in terms of packaging resources and the notion of spotting or generating ideas. The familiar neo-conservative perspective of the heroic individual entrepreneur is reinforced, by SW1 and SW3 particularly. SW3 places emphasis on the individual, in spite of earlier value placed on idea generation being a community or collective process:
SW3: Usually you need someone who is very committed to delivering that project and it usually is one person. [. . .] but it tends to be one person that that has the sort of . . . not necessarily the idea but the wherewithal to take the idea forward.
I: yeah, what do you mean by [wherewithal] . . . ?SW3: I suppose I mean the . . . whatever the social enterprise version . . . of
Alan Sugar is.
There appears to be some tension between this perspective and other ideological positions on power. SW3, despite the above statements, pro-motes a grassroots community action ideology, in which local people are the holders of power in terms of both creating ideas and bringing about change. There is also an interesting ideological contrast between SW1 and SW2. One displays fi rm commitment to social ownership and suggests that involvement in social enterprise should be democratic; the other expresses clear views that local people should earn the right to involvement through entrepreneurial skills (for which read business knowledge):
SW1: . . . because ownership of course is not included in the government social enterprise defi nition, then the argument about something being social enterprise because it is socially owned doesn’t wash. I mean I think my position is that if it’s socially owned, it’s a social enterprise.
I: Right, what if it’s not socially owned?SW1: Well, if it’s not socially owned, it’s probably not a social enterprise.
Contrast this with:
SW2: And these people don’t even really know . . . some of them off the estate don’t even know how to read a business . . . a spreadsheet, never mind
298 Entrepreneurship and growth
[. . .] and I think the trouble is that some of these need entrepreneurial skills and they just . . . you know, how do you say, ‘well I’m sorry, you’ve got to live in the estate but you have to be an entrepreneur type person or have some business knowledge before we’ll let you on’? (laughs).
Finally, there is an interesting struggle in the steering group meeting over a social enterprise’s identity or status, between the manager of that social enterprise and a representative of a support organization. Not only does this show clearly the perceived demarcation between social and business, discussed above, but it also betrays dynamics of power, with the steering group member (F here) contradicting the social enterprise manager and informing him of his organization’s actual status:
M: I think we’re more of a business now than what we were when we set out because we weren’t . . . it wasn’t a business was it really, but now it’s more of a business than it is a social enterprise.
F: well no, you’re a social enterprise but you . . .M: yeah, but it’s gone more to the other side . . .
Importantly, it also shows an eagerness on the part of the social enterprise manager to conform to the ‘business-like’ agenda being discussed within the steering group, by aligning his organization more closely with a busi-ness than a social organization. The tussle around defi nitions between the two speakers exposes his desire to play along with the funders and local authority representatives.
In summary, analysis of the excerpts from the support workers’ interviews reveals overt statements about inclusion and exclusion in social enterprise, reinforced by discursive practices. The enterprise and sustainability discourses are used semi-interchangeably and as shorthand for business (also business-like behaviour) and money. They are used particularly in reference to helping existing organizations to make the transition out of the apparently dead-end social sector into the more positive arena of enterprise. There is less focus on being enterprising or entrepreneurial, and where entrepreneurial references are made, some familiar conventional/popular assumptions reinforced. While mainly reproducing government rhetoric, the support workers nonetheless show some resistance to policy level assumptions about social enterprise in their communities. This is important to highlight as it suggests the prevailing discourses at policy level are not necessarily reproduced wholesale at the local/regional agency level, as might be assumed. Ideological tensions are also apparent between members of this group regarding inclusion and ownership.

Can enterprise discourse enable or disable deprived communities? 299
Social Entrepreneurs
Enterprise is often equated with freedom and independence by this group. This freedom can be either political or, more usually, pragmatic in terms of bureaucratic funding and grants:
E1: . . . As you know with previous organisations [in the voluntary sector], that was the problem. You would always have to sit there and say ‘yes, sir’, ‘no, sir’ to people. But now we don’t, I can say what I like to whom I like and not worry about it. I’m quite free in that way, you know.
Like the support workers, the entrepreneurs often re-write enterprise as business, though project is more common. Where business is referred to, however, it emerges as conceptually tricky for the speakers. How to bridge delivery of a service with talk of a market is one example of this tension from Entrepreneur 1 (E1):
E1: . . . but I feel it’s slightly more diffi cult for something like this project because you’re not selling a commodity, you’re not selling a widget or manufacturing a widget to sell to somebody.
I: that the public understands?E1: Exactly. What we do is sell something totally unseen. And some will be
totally unquantifi able, you know, and we’ll be creating youth workers. How do you measure a smile? How do you put that down on a piece of paper?
Money and sustainability are again dominant themes, as with the support workers. Pricing and charging are highlighted by E2 as another example of the tension between her construction of enterprise and her organization’s commitment to its social service or product. Here sustainability is seen as a barrier:
E2: . . . you know, it’s a problem here because how am I going to make it self-sustainable, that learning centre self-sustainable? Because I can’t hire out the facilities because they’re too small. [. . .] So you’re depend-ing on funders saying, ‘yeah, you’ve got a really brilliant idea, we’ll keep chucking money at you’ even though you’re not going to exist after three years because you’ll be going to the same funders again.
I: So where does it [end up]?E2: Well, it won’t will it, it will eventually . . . it will die because there’ll be
no way of sustaining it. Unless people pay and people haven’t got the money to pay.
With this emphasis on charging, there appears to be slightly less empha-sis on income generation per se than among the support workers group. Referring to the national and regional bodies of the NHS (National
300 Entrepreneurship and growth
Health Service) and PCT (Primary Care Trust), one social entrepreneur expresses fatigue at the push for income generation and states his ideologi-cal disregard for the capitalism he associates with profi teering enterprise:
E3: But I can see . . . like the NHS or PCT can’t keep forking money out. But . . . and the sad thing is the exercise on referrals going . . . in an ideal world, somebody with diabetes could get referred in and just pay the same price as prescriptions, for example, £6.20 or whatever it is, would last them for 12 weeks of exercise. But money talks really, so that . . . Yeah, I mean I wouldn’t want to do it as a business as such because I wouldn’t want to kind of make a profi t out of other people’s ill health and stuff . But yeah.
Sustainability is central in their construction of social enterprise. Often, views about sustainability and the business drive appear confused. Interestingly, profi t is only mentioned by the SME manager (E4); other concepts associated with trading by the support workers, such as sales and markets, are absent – or are used to emphasize the social value of their work. This might indicate that the commercial imperative of trading, sought by the support workers as the route to sustainability, is marked on the surface of the social entrepreneurs’ texts at best. In other words, the social entrepreneurs seem to be echoing some of the texts of the enterprise/business discourse but in the process contesting their validity or meaning for this group.
Indeed, sustainability is frequently talked about with despondency, as if it were the unattainable holy grail, as seen in E2’s excerpt above. There appears to be discomfort also around the drive for enterprise generally. The pressure to be business-like, in particular balancing this top-down agenda with their day-to-day pressures to deliver a needed service, is expressed by E3:
E3: Well I’ll not deny it . . . I don’t know, I maybe wish it was a bit easier to get money on merit if you like. Instead of having to have a precise costing for everything, I would like it if somebody could just say, ‘here’s like . . . you know, it looks like a good business plan, here’s £300,000, see how it gets on [. . .] And if I hadn’t had to do all that I could have put so much more time into promotion and marketing and actually getting people in and making the service better.
However, this is counterbalanced by a tired unease with funding and grants. Both funding and enterprise therefore, the two concepts seen with the support workers to form a polemic binary in which enterprise (sus-tainable business) is positive and grant dependency negative, are equally negative for the social entrepreneurs.
The four interviewees tend to detach themselves from the entrepre-neurial identity they associate again with the popular heroic myth. Here

Can enterprise discourse enable or disable deprived communities? 301
E2 lists vision, audacity and independence among qualities of the entrepre-neur, even though she was asked to talk about social entrepreneurs:
I: So how would you defi ne him as a social entrepreneur?E2: He just went out for it, he just went out for it. He’s got the confi dence. I
mean he started off as a salesperson and then he worked for a company in London as a salesperson. And then he went into partnership with someone. And then he had the gall to get out of the partnership and his wife was behind him and everything. And to put his house up and everything and to have a dream and go for it. That’s a social entrepre-neur; someone who has got this vision and this goal and they go for it and just take the risk . . .
The speaker is assigning popular characteristics of an entrepreneur to social entrepreneurs but, interestingly, does not at any point, either in this excerpt or later, question her total omission of the social – meaning social action or purpose. The result is that the social is subsumed under the popular discourse of the entrepreneur, betraying the fact that this interviewee, like others in this study, refers to the dominant ‘mainstream’ understanding of entrepreneurship, even if echoing the social entrepre-neurship discourse. As seen, this is often a way of detaching themselves from an identity they see as foreign to their roles in society.
In summary, the enterprise discourse in the social entrepreneurs’ texts does reproduce many of the same tenets as the support workers – sustainability, business, money. However, as much as these are echoed, they are also challenged in the context of the speakers’ social activities and purposes. Noteworthy is that enterprise is also defi ned in their narratives as freedom and independence from funding regimes. Funding is negatively framed, as it was by the support workers. However, enterprise is equally negatively reproduced, for creating friction with social objectives and pressure to become business-like. The speakers detach themselves from the individual entrepreneurial identity put forward by the support workers, preferring to portray their roles in the social entrepreneurship process as building and expanding. They place emphasis on their teams in generating new ideas and little value on public sector support. In the process, they seem to resist the notion that formal enterprise creation, so central to the prevailing discourses at policy level and the support workers, is the key to improving the enterprise capacity of their areas.
Community Leaders
Community leaders are expected to have had less exposure to the social enterprise discourse. As with the social entrepreneurs, enterprise

302 Entrepreneurship and growth
is associated with independence and, in CL1’s case, with grassroots development.
CL1: Well yeah, it is a social enterprise. We started at the bottom and we’re sort of branching out, so it is a social enterprise [. . .] We’ve got to start out in our own right now, we’re not having housing anymore and we’re starting out in our own right.
However, these two interviewees tend to talk far less about business than the previous two groups, referring more usually to project or venture, perhaps refl ecting their start-up status or, as is our presumption, their interest in community development and social inclusion over (social) enterprise. They prefer to talk about local issues, particularly people:
CL2: I live right in the middle of heroin alley and I’ve kept my lads off the drugs but they’re still into having a tipple you know, having a drink or two.
CL2: I said, it’s time to move on. That’s why I’ve created something like this, not only for my own but for other families’ kids [. . .] Like sometimes I’m battling here, like I say, for nearly three or four year and they always put somebody in front of you like, where many a fella would have just got. . . . I believe in what I do.
Enterprise for them is clearly secondary to the social issues faced by their communities. The enterprise entity is the means to the social end, much more so than in the previous interviews. The legal aspect of incorporation is held as merely allowing them to achieve their goals. The social focus of the community gym is also forefront in CL2’s mind when asked about enterprise:
I: Okay, how do you see this enterprise generally, how do you see it going?
CL2: I do, aye. I really believe it’ll take right off . And I do believe that we will be employing a few people in here like, that’s a bonus.
I: How many are you intending to employ or hoping to?CL2: Well I’d like to employ everybody and their fathers but you can’t can
you.I: No.CL2: But I’ve got lads that’s came in here and gone to college and got their
certifi cates for being gym instructors and nutrition. Three lads in par-ticular that’s got their certifi cates six weeks ago, the same three wouldn’t go to school, couldn’t get them to school.
The same themes of sustainability and money are again prominent, although less so than with the social entrepreneurs, and again contested

Can enterprise discourse enable or disable deprived communities? 303
by their ideological diffi culties with pricing/charging in respect of their audiences. Sustainability appears more closely connected to them as indi-viduals in their eyes and articulated in terms of tenacity, as is evident with CL2:
CL2: I had to convince him. So I went and I bought half a gym that was closing down and get the men organised. And he come and he goes, ‘I’m going to get behind this club’. I said, ‘we’re not here for show, we’re here to do business, like.’
CL2: This is a big venture, you know what I mean, so you’ve got to be staying with it all the time.
I: Yeah. Do you feel daunted by it?CL2: No, never been put off it once. If I had, there wouldn’t have been
anybody because everything is on me. If I walk away, this club closes. I won’t be walking away.
Indeed, both these speakers seem more attached to an entrepreneurial identity that they associate with fi ghting the local corner and the status that comes with that:
CL1: My strength is because I have no fear, nothing fazes me. If somebody knocked on the door and said ‘my child’s just been molested’ then I’d bring them in, I’d sit them down, I’d point them in the right direction and I’d get them every help they need. [. . .] I have no fear as I’m not afraid to tackle anything. You know, if it benefi ts the people of [place] . . . then I will go for it, within reason.
Ideas, as with the social entrepreneurs, are generally portrayed as coming from the community around them. This is the source of some pride for CL2, talking again about one of his protégés from the local neighbourhood:
CL2: Out of them three lads, one of them’s starting off his own business. [. . .] Because like I had to mentor him and all that [. . .] But he’s gone on his . . . with doing that, he can take himself further. Well that’s great isn’t it?
The enterprise discourse in the community leaders’ texts again repro-duces the same tenets as the support workers – sustainability and money. Business, however, is far less prevalent, with the interviewees preferring to talk about their projects or social ventures and, more prominently, the people aff ected. Sustainability is re-written as tenacity and longevity and linked to their infl uence and/or the physical assets pertaining to their projects. This is refl ective of a more political narrative overall, in which enterprise is subjugated under discourses of community or social action.
304 Entrepreneurship and growth
In keeping with this, the speakers attach themselves to a more radical entrepreneurial identity, in which their roles are perceived as fi ghting and battling on behalf of people in their specifi c communities.
Our analysis suggests that the three groups interviewed reproduce aspects of the policy discourse with diff ering degrees of loyalty to the texts and content. This seems to be on a spectrum that corresponds to the hierarchy, represented by our three categories, albeit somewhat artifi cial (support workers at the top being closer to policy speak; community leaders at the bottom being furthest removed). Almost on the same sliding scale, however, all groups also contest or re-write aspects of the enterprise discourse to suit their ideological concerns and social morality. This is cer-tainly too small a sample to reach general conclusions but it does appear that the community leaders, who are likely to have had less exposure to the social enterprise discourse, remain more focused on social aims even when prompted by the enterprise discourse. Equally, the enterprise discourse fi nds fewer reverberations among the social entrepreneurs’ excerpts than among the support workers’, drawing less on business and management speak. Where they do use it, it is discursively demarcated as separate from the discourse of social need that is otherwise dominant. Business dis-courses were more prevalent among interviewees who were closer to policy makers, particularly support workers, and vice versa.
CONCLUSION
This analysis suggests that the application of the enterprise discourse to the social sphere, in the guise of the social enterprise agenda (and the micro-rhetoric of sustainability in particular) does have the potential to lock out certain players and activities. At the level of the support workers, the focus on enterprise is seen to negate the social values and ideologies seen else-where as important to the speakers (social ownership in the case of SW1; community action and development in the case of SW3). The discourse of enterprise presented by social enterprise policy is allowed to work domi-nantly and to delimit discussion of social value. With this, exclusionary eff ects are seen to potentially lock out less business-minded people or activities that do not comply with the legally constituted forms of social enterprise organization – both of which are particularly signifi cant given the context of deprived communities.
Importantly, however, the residual lock-out eff ect on the two groups working ‘on the ground’ seems to be resisted by the speakers, who echo the rhetoric of becoming business-like or sustainable, but do not allow it to violate social values.

Can enterprise discourse enable or disable deprived communities? 305
Therefore, while the enterprise discourse may reinforce conventional understandings common to the popular myth of entrepreneurship and those promoted by social enterprise policy, in other ways it is contested and appropriated by all three groups. The support workers focus on exist-ing organizations becoming more business-like, with emphasis on money and viability, yet challenge ideologies at the heart of these perspectives. The social entrepreneurs and leaders echo the imperative of becoming business-like, possibly playing along with the game for politically expe-dient purposes and resources, but establish clear discursive boundaries between being business-like and serving important social needs.
In respect of Bordieu’s symbolic violence concept, this study has cer-tainly highlighted explicit use of a business dominated discourse of social entrepreneurship. This could risk subordinating the very people and activities in deprived communities that the policy is overtly attempting to support. The rhetoric as it is interpreted and enacted by the support workers can be seen to reinforce inequitable social relations among poor areas and ‘people on the estate’, who are positioned as not business-like and therefore not enterprising, in need of fi xing by external intervention. In the process, welfare and social regeneration objectives that are clearly forefront for the social entrepreneurs and community leaders are under-pinned by a neo-liberal view of enterprise as a tool of economic regen-eration. In line with Bordieu, the discourse at all levels, from the policy statements down to the community leaders, appears to lead to the social reproduction of privilege and social inequalities.
However, this process – seen largely by Bordieu as a political process controlled predominantly by those in power – is not necessarily played out in the case of the enterprise discourse. Instead, the discussions in the second section of this chapter highlight the popular and collective proc-esses by which the enterprise discourse and myths work – and are allowed to work – hegemonically. We would suggest, from this study, that the prevailing discourses of UK enterprise policy work are controlled as much by cultural as by political factors and work hegemonically on all tiers of agency. While the state, as holder of the monopoly of symbolic violence, is certainly important in the interview texts, it is important to recognize the role of individuals and social collectives in co-constructing and perpetually reinforcing/redefi ning the enterprise discourse.
Indeed, the analysis revealed competing world views that undermine the subordination eff ect of the enterprise discourse. As in Moulaert et al. (2007) and Begg (2002), our analysis suggests that it is at the micro level (i.e. fur-thest removed from the state) that the discourse is most clearly contested. Ideologies appear to be strikingly diff erent on the ground in comparison to macro or meso levels. In some ways, the enterprise discourse appears
306 Entrepreneurship and growth
to have developed iteratively over time until it has become an entrenched part of modern western society, a taken for granted and shared way of understanding the world. At an individual level, though, people eff ectively resist (either through appropriation or negation) the discourse by default-ing to the dominant popular myth of the entrepreneur or enterprise and then demarcating boundaries between that world and their own.
This has implications for entrepreneurship research and discourse studies. It seems clear that caution is required at multiple levels but not least by researchers, who may be tempted as Eisenschitz and Gough suggest (1993) to overplay the power of policy discourse at the local level, or indeed generate their own symbolic violence through uncritical pursuance of taken for granted assumptions. It is tempting to look at policy statements as indeed quasi divine, to use Bordieu’s terms, and to assume hegemonic discourses are politically sustained for political gains. Ultimately, we would question whether the prevailing discourse in this case stems from the producers of policy, from the hegemony of the enter-prise discourse itself given its pervasiveness in western societies (in that the state as creator of policy is as much an unwitting reproducer of the enterprise discourse’s symbolic capital as its subjects), from the meso level intermediaries through their interpretation and enactment of the rheto-ric or, signifi cantly, from the masses perpetuating the popular myths of enterprise and entrepreneurship.
The study has highlighted certain questions for further research. What is not clear, yet, is how far the symbolic violence inherent in the rhetoric and intermediaries’ texts fi lters from the meso to the micro level, where social enterprise is enacted. Also worth further research might be the residual impact of offi cial enterprise discourses on the propensity of communities more widely to engage in enterprising activities, or consider themselves to be enterprising. Further research could examine to what extent local actors may be echoing the texts and content of the enterprise discourse for the sake of playing along with policy and funding discourses and how this aff ects the behaviours, actions or outcomes of people engaged in enterprise activities (in deprived communities and elsewhere).
The study also reveals implications for UK policy on enterprise in deprived areas and social enterprise. Policy makers need to refl ect on the implicit demands on the subjects of the policies, in this case people engaged with social enterprise, and how any symbolic capital may be handled down the hierarchy of local regimes. In particular, they need to be wary about the possible symbolic violence on already vulnerable communities in rein-forcing social inequalities and privilege. At the same time, however, given the entrenched cultural attachments to enterprise and entrepreneurship seen in our interview texts – and the competing infl uence of ideologies and
Can enterprise discourse enable or disable deprived communities? 307
social morality for those on the ground – expectations about the poten-tial for enterprise interventions that derive from mainstream enterprise discourses need to be realistic. Practitioners, in turn, should avoid further distilling inequality for people in the most deprived areas by reproducing permissions to be part of the enterprise culture, based on a business-led conceptualization of enterprising potential.
NOTES
1. Often, the terms ‘enterprise’ and ‘entrepreneurship’ are used interchangeably with little attempt to distinguish between the two. The defi nition of ‘entrepreneurship’ is prob-ably more contested than that of ‘enterprise’ (see Howorth et al., 2005). Parkinson and Howorth (2008) identify that in the fi eld there is much overlap between the two. For the purposes of this chapter, enterprise is used when referring to specifi c organizations and in relation to government policy. Entrepreneurship is used to refer to the art of acting in an enterprising manner and the academic fi eld of study. However, in the analysis partici-pants’ own use of the terms are refl ected.
2. Connolly and Healy (2004) in their study of working- and middle-class boys in Belfast, examined the way social structures and processes of inequality are incorporated diff er-ently by the two diff erent groups. The working-class boys’ world view, their habitus, was linked with territoriality and localism and reinforced, through schooling, their subor-dination. In a similar study in the US, Herr and Anderson (2003) found that symbolic forms of violence in school helped reinforce social inequality and inequitable social rela-tions. Their work highlights how, even where pupils (the victims of symbolic violence) are assisted to challenge the macro discourse (in this case, of meritocracy), their challenge may still leave them and their teacher vulnerable to the symbolic violence inherent in the system of educational leadership. Indeed, and perhaps ironically, it also requires us as researchers to refl ect on not only the role of policy making, but of research and educa-tion, in perpetuating symbolic violence if we fail to challenge assumptions embodied in the social problems that, Bordieu would argue, are created partly by the state.
3. See Achtenberg and Welter (2007) for an overview of discourse methods in entrepreneur-ship research.
4. The UK government provides a measure of deprivation in England, Wales, Scotland and Northern Ireland. Each administrative authority formulates their respective count, with for example the Department for Communities and Local Government deriving the Index of Multiple Deprivation for England. In the case of England, the indices consist of income, employment, health and disability, education, skills and training, housing and services, crime and living environment. These are weighted unequally to derive an aggregated measure. Deprivation measures are built up from the smallest geography, which is currently the ‘Lower layer Super Output Area (LSOA)’ that for lay person usage is smaller than a ward or neighbourhood. This provides the basis for aggrega-tion to compare district level indices of deprivation for instance. See Department for Communities and Local Government (2007) for more technical detail.
While the measures provide us with detail on deprivation, the data are not all com-parable across time. Although fi gures for 2007 can be compared with 2004 fi gures, they cannot be compared with fi gures for 2000 and for 1998. Crucial therefore, is the inter-pretation of measures and the need for a qualitative understanding of what deprivation means for a community, and within a community. Of even greater value is the longstand-ing debate on poverty initiated by those such as Booth and Rowntree but relevant in its current context by reference to the work of Townsend (Townsend, 1970, 1979) and more recently Alcock (1993) and Lister (2004).
308 Entrepreneurship and growth
REFERENCES
Achtenberg, L. and F. Welter (2007), ‘Media discourse in entrepreneurship research’, in H. Neergaard and J.P. Ulhoi, Handbook of Qualitative Research Methods in Entrepreneurship, Cheltenham, UK and Northampton, MA, USA: Edward Elgar, pp. 193–215.
Ahl, H. (2007), ‘A Foucauldian framework for discourse analysis’, in H. Neergaard and J.P. Ulhoi, Handbook of Qualitative Research Methods in Entrepreneurship, Cheltenham, UK and Northampton, MA, USA: Edward Elgar, pp. 216–50.
Alcock, P. (1993), Understanding Poverty, Basingstoke: Macmillan.Althusser, L. (1984), Essays on Ideology, London: Verso.Anderson, A.R. (2005), ‘Enacted metaphor: the theatricality of the entrepreneurial
process’, International Small Business Journal, 23 (6), 585–603.Anderson, A.R. and S.L. Jack (2002), ‘The articulation of social capital in entre-
preneurial networks: a glue or a lubricant?’, Entrepreneurship and Regional Development, 14 (3), 193–210.
Bank of England (2000), Finance for Small Businesses in Deprived Communities, November 2000, London: Bank of England, Domestic Finance Division.
Begg, I. (2002), Urban Competitiveness: Policies for Dynamic Cities, Bristol: Policy Press.
Benneworth, P. (2004), ‘In what sense “regional development”? Entrepreneurship, underdevelopment and strong tradition in the periphery’, Entrepreneurship and Regional Development, 16, 439–58.
Berglund, K. and A.W. Johansson (2007), ‘Entrepreneurship, discourses and con-scientisation in process of regional development’, Entrepreneurship and Regional Development, 19 (6), 499–525.
Blackburn, R. and M. Ram (2006), ‘Fix or fi xation? The contributions and limitations of entrepreneurship and small fi rms to combating social exclusion’, Entrepreneurship and Regional Development, 18 (1), 73–89.
Bordieu, P. (1985), ‘The social space and the genesis of groups’, Theory and Society, 14 (6), 723–44.
Bordieu, P. (1989), ‘Social space and symbolic power’, Sociological Theory, 7 (1), 14–25.
Bordieu, P., L. Wacquant and S. Farage (1994), ‘Rethinking the state: genesis and structure of the bureaucratic fi eld’, Sociological Theory, 12 (1), 1–18.
Business Hotline Publications (2003), ‘The no-nonsense guide to government rules and regulations for setting up your business’, available at: http://www.business-hotlinepublications.co.uk/case_study.asp?id=16, accessed July 2008.
Chatterton, P. and D. Bradley (2000), ‘Bringing Britain together?’, Local Economy, 15 (2), 98–111.
Cho, A.H. (2006), ‘Politics, values and social entrepreneurship: a critical appraisal’, in J. Mair, J. Robinson and K. Hockerts (eds), Social Entrepreneurship, Basingstoke: Palgrave Macmillan.
Cohen, L. and G. Musson (2000), ‘Entrepreneurial identities: refl ections from two case studies’, Organization, 7 (1), 31–48.
Connolly, P. and J. Healy (2004), ‘Symbolic violence, locality and social class: the educational and career aspirations of 10–11-year-old boys in Belfast’, Pedagogy, Culture and Society, 12 (1), 15–33.
Can enterprise discourse enable or disable deprived communities? 309
Curran, J., R. Rutherford and S. Lloyd-Smith (2000), ‘Is there a local business community?’, Local Economy, 15 (2), 128–43.
Deakins, D., I. Mohammed, D. Smallbone, G. Whitham and J. Wyper (2007), ‘Ethnic minority businesses in Scotland and the role of social capital’, International Small Business Journal, 25 (3), 307–26.
Dees, G. (2004), ‘Rhetoric, reality and research: building strong intellectual foundations for the emerging fi eld of social entrepreneurship’, paper presented at the 2004 Skoll World Forum on Social Entrepreneurship, March 2004, Oxford.
Department for Communities and Local Government (2007), The English Indices of Deprivation 2007, Wetherby: Communities and Local Government Publications.
DTI (2002), Social Enterprise: A Strategy for Success, London: Department of Trade and Industry.
Eisenschitz, A. and J. Gough (1993), The Politics of Local Economic Policy, Basingstoke: Macmillan.
Evans, M., S. Syrett and C. Williams (2004), The Informal Economy and Deprived Neighbourhoods: A Systematic Review, London: Offi ce of the Deputy Prime Minister.
Fairclough, N. (1989), Language and Power, London: Longman.Fairclough, N. (1992), Discourse and Social Change, Cambridge: Polity Press.Fairclough, N. (1995), Critical Discourse Analysis: The Critical Study of Language,
London: Longman.Fairclough, N. and R. Wodak (1997), ‘Critical discourse analysis’, in T. van Dijk
(ed.), Discourse as Social Interaction, London: Sage.Fitzpatrick, S. (2004), ‘Poverty of place’, keynote address at the University of
York, 14 December 2004, Joseph Rowntree Foundation.Fletcher, D.E. (2003), ‘Framing organisational emergence: discourse, identity
and relationship’, in C. Steyaert and D. Hjorth (eds), New Movements in Entrepreneurship, Cheltenham, UK and Northampton, MA, USA: Edward Elgar, pp. 125–42.
Fletcher, D.E. (2006), ‘Entrepreneurial processes and the social construction of opportunity’, Entrepreneurship and Regional Development, 18 (5), 421–40.
Foucault, M. (1972), The Archaeology of Knowledge, New York: Pantheon Books.Foucault, M. (1982), ‘The subject and power’, in H. Dreyfus and P. Rabinow,
Michel Foucault: Beyond Structuralism and Hermeneutics, Chicago: University of Chicago Press.
Gavron, R., M. Cowling, G. Holtham and A. Westall (1998), The Entrepreneurial Society, London: IPPR.
Gibson-Graham, J.K. (2006), The End of Capitalism (As We Knew It): A Feminist Critique of Political Economy, Minneapolis: University of Minnesota Press.
Gramsci, A. (1971), Selections from the Prison Notebooks, trans. Q. Hoare and G. Nowell-Smith, London: Lawrence & Wishart.
Haughton, G. (1998), ‘Principles and practice of community economic develop-ment’, Regional Studies, 32 (9), 872–77.
Haywood, G. and J. Nicholls (2004), ‘Enterprise dynamics in the 20% most deprived wards in England’, Betamodal Ltd.
Herr, K. and G. Anderson (2003), ‘Violent youth or violent schools? A critical incident analysis of symbolic violence’, International Journal of Leadership in Education, 6 (4), 415–33.

310 Entrepreneurship and growth
Hjorth, D. and B. Johannisson (2003), ‘Conceptualising the opening phase of regional development as the enactment of a regional identity’, Concepts and Transformations, 8 (1), 69.
Hjorth, D. and C. Steyaert (2004), Narrative and Discursive Approaches in Entre-preneurship, Cheltenham, UK and Northampton, MA, USA: Edward Elgar.
Hodson, R. and R.L. Kaufman (1982), ‘Economic dualism: a critical review’, American Sociological Review, 47 (6), 727–39.
Howorth, C., S. Tempest and C. Coupland (2005), ‘Rethinking entrepreneurship methodology and defi nitions of the entrepreneur’, Journal of Small Business and Enterprise Development, 12 (1), 24–40.
Jacobs, K. (2004), ‘Waterfront redevelopment: a critical discourse analysis of the policy-making process within the Chatham Maritime Project’, Urban Studies, 41 (4), 817–32.
Johannisson, B., M. Ramirez-Pasillas and G. Karlsson (2002), ‘The institutional embeddedness of local inter-fi rm networks: a leverage for business creation’, Entrepreneurship and Regional Development, 14 (4), 297–315.
Johnson, P. (2004), ‘Diff erences in regional fi rm formation rates: a decomposition analysis’, Entrepreneurship Theory and Practice, 28 (5), 431–45.
Jones, C. and A. Spicer (2005), ‘The sublime object of entrepreneurship’, Organization, 12 (2), 223–46.
Kilkenny, M., L. Nalbarte and T. Besser (1999), ‘Reciprocated community support and small town–small business success’, Entrepreneurship and Regional Development, 11 (3), 231–46.
Kintrea, K. (2007), ‘Policies and programmes for disadvantaged neighbourhoods: recent English experience’, Housing Studies, 22 (2), 261–82.
Krashinsky, M. (1998), Does Auspice Matter? The Case of Day Care for Children in Canada, New Haven and London: Yale University Press.
Laukkanen, M. (2000), ‘Exploring alternative approaches in high-level entre-preneurship education: creating micro-mechanisms for endogenous regional growth’, Entrepreneurship and Regional Development, 12 (1), 25–47.
Lister, R. (2004), Poverty, Cambridge: Polity Press.Lloyd, P. and C. Mason (1984), ‘Spatial variations in new fi rm formation in the
United Kingdom: comparative evidence from Merseyside, Greater Manchester and South Hampshire’, Regional Studies, 18 (3), 207–20.
Macdonald, R. and F. Coffi eld (1991), Risky Business? Youth and the Enterprise Culture, London: Falmer Press.
Michael, A. (2006), ‘Securing social enterprise’s place in the economy’, Social Enterprise Coalition Conference, Manchester, 25 January 2006, SBS press release, available at: www.sbs.gov.uk/sbsgov/action/news.
Moulaert, F., F. Martinelli, S. Gonzalez and E. Swyngedouw (2007), ‘Introduction: social innovation and governance in European cities: urban development between path dependency and radical innovation’, European Urban and Regional Studies, 14 (3), 195–209.
Nicholson, L. and A.R. Anderson (2005), ‘News and nuances of the entrepre-neurial myth and metaphor: linguistic games in entrepreneurial sense-making and sense-giving’, Entrepreneurship Theory and Practice, 29 (2), 153–72.
Nolan, A. (2003), Entrepreneurship and Local Economic Development: Policy Innovations in Industrialised Countries, Paris: OECD.
NWDA (2003), Social Enterprise Survey, Warrington: North West Development Agency.
Can enterprise discourse enable or disable deprived communities? 311
Ogbor, J.O. (2000), ‘Mythicizing and reifi cation in entrepreneurial discourse: ideology-critique of entrepreneurial studies’, Journal of Management Studies, 37 (5), 605–35.
Parker, I. (1999), Critical Textwork: An Introduction to Varieties of Discourse and Analysis, Buckinghamshire: Open University Press.
Parkinson, C. and C. Howorth (2008), ‘The language of social entrepreneurs’, Entrepreneurship and Regional Development, 20 (3), 285–309.
Paton, R. (2003), Managing and Measuring Social Enterprises, London: Sage.Pearce, J. (2003), Social Enterprise in Anytown, London: Calouste Gulbenkian
Foundation.Perren, L. and P.L. Jennings (2005), ‘Government discourses on entrepreneurship:
issues of legitimization, subjugation, and power’, Entrepreneurship Theory and Practice, 29 (2), 173–84.
Policy Action Team 3 (1999), Enterprise and Social Exclusion, National Strategy for Neighbourhood Renewal, Social Exclusion Unit PAT 3, London: HM Treasury.
Pomerantz, M. (2003), ‘The business of social entrepreneurship in a “down economy”’, Business, 25 (3), 25–30.
Portes, A. (1994), ‘The informal economy’, in N.J. Smelser and R. Swedberg (eds), The Handbook of Economic Sociology, Princeton, NJ: Sage Foundation, pp. 426–49.
Power, A. (2001), ‘Social exclusion and urban sprawl: is the rescue of cities pos-sible?’, Regional Studies, 35 (8), 731–42.
Ram, M. and D. Smallbone (2003), ‘Policies to support ethnic minority enterprise: the English experience’, Entrepreneurship and Regional Development, 15 (2), 151–66.
Servon, L.J. (1997), ‘Microenterprise programs in US inner cities: economic devel-opment or social welfare?’, Economic Development Quarterly, 11 (2), 166–80.
Small Business Service (2004), ‘Griffi ths unveils new Phoenix Fund for disadvan-taged communities’, Press Release, 14 April 2004, London, DTI.
Southern, A. (2006), ‘Enterprise and regeneration’, paper presented at First Lancaster Social Entrepreneurship Research Seminar, Lancaster University, September 2006.
Tolbert, C. M., T.A. Lyson and M.D. Irwin (1998), ‘Local capitalism, civic engage-ment and socio-economic well-being’, Social Forces, 77 (2), 401–27.
Townsend, P. (ed.) (1970), The Concept of Poverty, London: Heinemann.Townsend, P. (1979), Poverty in the United Kingdom, London: Heinemann.Weiss, G. and R. Wodak (2003), Critical Discourse Analysis: Theory and
Interdisciplinarity, Basingstoke: Palgrave Macmillan.Williams, C.C. (2005), ‘Tackling undeclared work in advanced economies: towards
an evidence based public policy approach’, Policy Studies, 25 (4), 243–58.Wong, C. (1999), ‘Determining factors for local economic development: the
perception of practitioners in the North West and Eastern regions of the UK’, Regional Studies, 32 (8), 707–20.
Zafi rovski, M. (1999), ‘Probing into the social layers of entrepreneurship: outlines of the sociology of enterprise’, Entrepreneurship and Regional Development, 11 (4), 351–71.

312
14. Transnationalism, mixed embeddedness and Somali entrepreneurs in LeicesterTrevor Jones, Monder Ram and Nicholas Theodorakopoulos
INTRODUCTION
In a recent critique of current ethnic minority business (EMB) literature, the present authors draw special attention to what they see as an unfor-tunate tendency towards ahistoricism, in which ethnic entrepreneurs are presented as essentially an unprecedented novelty, subject to few if any of the historical forces and economic laws governing the generality of small business operators (Jones and Ram, 2007). To judge from one tenaciously persistent strand of UK literature running from Werbner (1980) through to Basu and Altinay (2002), we might be forgiven for concluding that EMB use of informal social capital networks in business is a new innova-tive practice, the product of unique cultural attributes. Naturally such context-free interpretations cannot go unchallenged, with Light (2007) reminding us of Granovetter’s (1985) defi nition of social embeddedness as the universal basis of all entrepreneurial activity for all groups at all times. Far from exceptional – or, come to that, exceptionally success-ful – postwar immigrant businesses in Europe are better seen as the latest recruits to a time-honoured occupation, whose rules of engagement are harsh and ruthlessly enforced by the capitalist market (Bechofer and Elliott, 1978; Rainnie 1989). In this precarious struggle for survival, social capital has always been an indispensable prop. For EMBs faced with addi-tional costs imposed by racist barriers (Ram and Jones, 2008), the avail-ability of cheap capital and labour from family and community takes on extra urgency. More recently these principles have been further elucidated by Kloosterman et al.’s (1999) theory of mixed embeddedness. As well as recognizing that EMBs are indeed fi rmly grounded in their own special heritage cultures, these authors also insist that ethnic business outcomes are even more decisively shaped by the ‘wider economic and institutional

Transnationalism and Somali entrepreneurs in Leicester 313
context into which immigrants are inevitably also inserted’ (Kloosterman et al., 1999, p. 252). There is an ever-present danger that structural limitations may be ignored in the promotion of ethnic agency.
Yet, indestructible as a mutant virus, ethnic exceptionalism has once more re-emerged in the currently fashionable guise of transnationalism. Here the focus is upon the permanent cross-border social networks that many immigrant groups maintain both with the country of origin and throughout their diasporas (Portes, 1996). Notably, there has been rela-tively little British research on the role of diasporic networks in promoting EMB competitiveness, though recent years have seen an emergent aware-ness of the possibilities here (Henry et al., 2002; Hepburn, 2004; Kitching et al., 2009; McEwan et al., 2005; Sepulveda et al., 2006).
As convincingly demonstrated by McEwan et al. (2005), transnational trading and investment linkages may off er a hugely expanded sphere of social capital, in which EMB retains all the advantages of preferential insider access but this time with no geographical limits. In the same vein, Bagwell (2006) in her study of Vietnamese businesses in London stressed the role of global family networks in providing business ideas, advice and fi nance, and market opportunities. For these authors, transnational social capital off ers a genuine comparative advantage in place of the sweated labour and other desperate cost-cutting practices traditionally used to survive in marginal activities shunned by mainstream businesses (Jones et al., 2000). This has led to impressive growth and earnings far beyond those enjoyed by the standard EMB. Yet, as the authors themselves concede, their case studies may be unrepresentative of the rank and fi le of EMB, a qualifi cation in line with a more cautious school of thought, which warns that any pay-off from transnationalism is contingent on a complex range of other variables (Morawska, 2004; Portes et al., 2002). Particularly vulnerable to this external context are the more recent smaller but more socially diff erentiated groups who embody what Vertovec (2006) calls the new ‘superdiversity’. Typical of these are overseas Somalis, the subject of the present chapter, a community for whom transnationalism is virtually a defi ning hallmark. Apparently released from the traditional prison of space by cheap air travel, the internet and other communications technol-ogy, the lives of many Somali business operators revolve around a con-stant fl ow of information, remittances and other exchanges with Somalis world-wide (Lindley, 2005). Such a high degree of spatial liberation might be thought to provide the ultimate litmus test of the entrepreneurial eff ec-tiveness of transnationalism. Accordingly we examine the case histories of 25 Somali enterprises in Leicester to discover how far the cross-border marshalling of business resources can overcome the usual constraints on EMB. Crucially, however, this exercise is performed within the rubric of
314 Entrepreneurship and growth
mixed embeddedness, moving beyond itemizing their social capital, global and otherwise, to fi xing them within their political-economic environment. As we shall see, although the deregulated UK regime is much more favour-able than elsewhere in Europe to the formation of overseas Somali busi-ness fi rms, their performance tends to founder against the rock of hostile local market conditions.
TRANSNATIONAL ECONOMIC NETWORKS
Although, as Portes et al. (1999) note, migrants’ overseas networks have profound political and cultural repercussions, for present purposes the focus is on the economic and specifi cally the entrepreneurial, the way in which immigrant self-employment is nurtured by diasporic connections. In Britain, recent years have witnessed the emergence of interest in the role of overseas connections as a competitive resource for EMB (Sepulveda et al., 2006; Henry et al., 2002; Hepburn, 2004; McEwan et al., 2005; Kitching et al., 2009), with McEwan et al. (2005) providing an especially useful analy-sis of outstandingly successful ethnic fi rms in Birmingham, who appear to be diff erentiated from the general mass of plodders and strugglers by their strong commercial links to the home country and to other overseas co- ethnic business clusters. Outstanding here is the Chinese business com-munity, among whose members are several prototypically transnational operators, whose operations have clearly achieved extra competitive vigour through cultivating their trading, investment and information exchange with Hong Kong, the place of origin for most Birmingham Chinese, as well as other parts of their diaspora. Among many eye-catching instances of the transnational dividend is a major supermarket employing more than 70 workers locally and sourcing a huge range of foods and other imports preferentially via ethnic trading channels from South East and East Asia. Also cited is the role of overseas Chinese investment in the lavish redevel-opment of the city’s Chinese quarter. Alongside this, the city is now the location for numerous ethnic food manufacturers, South Asian as well as Chinese, catering to a nationwide clientele of supermarkets. The authors also celebrate creative industries like the local Bhangra music industry, the vibrant off spring of ‘innovation, fusion and transnationalism’ (McEwan et al., 2005, p. 927); and broadcasting ventures in partnership with India-based companies. When all this is added to similar work by other authors such as Dwyer and Jackson (2003) on the fashion industry, a plausible case can be made for transnationalism as a decisive shaper both of the urban economy and of the ethnic entrepreneur.
From McEwan et al.’s economic geography perspective, such
Transnationalism and Somali entrepreneurs in Leicester 315
transnationally boosted EMB has to be seen as a highly proactive key element in a local economy now increasingly enmeshed in a multitude of evolving global linkages (Dwyer and Jackson, 2003), a refreshing change of direction that attempts to recast losers as winners, indeed as emergent leaders in the development of the local economy. Through their membership of diasporic communities, ethnic entrepreneurs may enjoy a decisive competitive advantage over non-members, with privileged insider access to all manner of global commercial resources. Moreover, as post- industrial cities like Birmingham continue to reposition themselves in relation to economic globalization, what could be more natural than that this move be led by those of its local business community whose identity is itself ‘globalized’?
Essentially this is part of a recent ‘globalization-from-below’ discourse (Light, 2007; Portes, 1996, 1999; Portes et al., 2002; Vertovec, 2006), which seeks to depart from the notion of migrants as victims of structural forces and to highlight instead the opportunities opened up by globalization for profi table entrepreneurial strategies. Applying this to the EMB literature, we would argue that the central signifi cance of transnationalism for the entrepreneurs themselves is its opening up of access to vastly enlarged social capital. Ever since Granovetter’s (1985) path-breaking account of economic transactions as embedded in social relations, social capital has become central to enterprise studies, with its emphasis on personal net-works of trust as the principal source of business resources. Since shared ethnicity is one of the most potent of all forms of trust, it is unsurprising that EMB studies have continually singled out ethnic minority entre-preneurs as benefi ting from more than usually dense and solidary social networks of trust (Janjuha-Jivraj, 2003). These comprise a fertile source of labour, capital and myriad other kinds of informal business support, often available at below market rates (Flap et al., 2000; Nee and Sanders, 2001; but see Jones and Ram, 2007, and Ram et al., 2007) on the perils of over-arguing ethnic specifi city). Since access to these networks is eff ec-tively closed to group outsiders, there is a strong element of protectionism in which group members enjoy key business resources on advantageous terms denied to non-members. McEwan et al.’s (2005) contribution is to draw attention to the way these insider networks can now operate on a hugely expanded geographical scale, thanks to the ‘time–space compres-sion’ (Kivisto, 2001) created by advanced communication technologies. No longer must EMB social capital be restricted by local family and community networks, since entrepreneurs can now enjoy a global range without losing any of their preferential insider dealings.
Such is the rationale of McEwan et al.’s (2005) cases, much of whose competitive life force derives from exclusive access to ethnic fi nancial and

316 Entrepreneurship and growth
trading connections virtually world wide. Important though this may be, however, there are widespread doubts about how far transnational entrepreneurs are representative of EMB as a whole (Portes et al., 2002). Signifi cantly, McEwan et al. (2005, p. 927) themselves recognize the pos-sibility that these ventures may be unrepresentative of an EMB economy more generally ‘characterized by low wages, poor working conditions and racism’. For seasoned researchers in the fi eld, this need to guard against a (perhaps understandably) over-enthusiastic celebration of the entrepreneurial achievements of disadvantaged groups (see for example, Gidoomal, 1997) is a matter of eternal vigilance. As noted in the intro-ductory section, EMB is more typically beset by a widespread poverty of resources and a struggle for survival against heavy external barriers (Jones et al., 1994; Light and Gold, 2000). Historically, dynamic high perform-ance EMB fi rms are always a tiny minority (Jones et al., 1994), a refl ection not only of conditions peculiar to racialized minorities but pertaining also to the general population of independent fi rms, with survey after survey showing the ‘fast trackers’ to be heavily outnumbered by the ‘trundlers’ and the failures (see Storey, 1994 for summary). At the highest level of generalization, this expresses the continuing concentration of capital (Harvey, 1993), a seemingly inevitable tendency irrespective of globaliza-tion, transnationalism or any other form of restructuring (Kieley, 2007; Virdee, 2006). In a competitive capitalist system, structural shifts cannot be expected to do away with winners and losers but simply to shuffl e the pecking order, creating new opportunities for a few while annihilating the many. Globalization, as Hay and Watson (1999, p. 420) remind us, ‘may well be empowering for those already empowered by their access to capital’. This, we suspect, is the underlying rationale for McEwan et al.’s (2005) high performing entrepreneurs. Certainly they are to be congratu-lated on their vision and their strategic deployment of their cross-border cross-cultural networks to take advantage of a changing world. In the fi nal analysis, however, they must be seen as a minority of a minority, thriv-ing by virtue of exceptional advantages by defi nition denied to the great struggling mass of EMB owners.
These warnings must act as a constant guide when assessing the business histories of Somalis in Leicester. Of the many research-worthy qualities of this new immigrant community, it was their genuinely transnational ori-entation that principally attracted our attention, a cross-border solidarity given additional strength by (in many cases) refugee status and ‘politi-cal convulsions at home’ (Portes, 1999, p. 464). As entrepreneurs, these global linkages off er potentially their greatest advantage. Given that this is in many other senses an acutely disadvantaged group, we might see this as the ultimate test of transnationalism, a question of whether diasporic
Transnationalism and Somali entrepreneurs in Leicester 317
networks alone can overcome both the poverty of other resources and an unfavourable local commercial environment.
METHODS
Somalis and Leicester are a particularly apposite conjunction to test the connection between ‘superdiversity’, transnationalism and entrepreneur-ship. The Somali community can be seen as a ‘critical case’ in that it is new, comparatively small in the UK (although growing), quite highly dispersed, transnationally linked and socio-economically diff erentiated (Vertovec, 2006, p. 1). With over one million Somalis living abroad and labour consti-tuting its principal export, Somalis are truly a ‘globalized’ society (Lindley, 2005). Diasporic connections extend to Canada, the USA, Scandinavia, as well as the UK (Bang Nielsen, 2004). Transnational links are supported by an elaborate informal remittance system and ‘multi-local’ (Vertovec, 2006) attachment that characterize social networks among many Somalis (Bang Nielsen, 2004).
Leicester has hosted a major concentration of British Indians since the 1960s; but over the last decade or so it has followed the national trend of increasing ethnic diversity, with a growing infl ux from the Middle East and Africa, including Somalia itself. Now estimated (typically imprecisely) at between 6000 and 17 000 (Daahir et al., 2004; LCC, 2006), Somalis have been attracted to the city by the presence of a pre-existing Somali community and by perceptions of the UK’s multi-cultural tolerance, allowing them to practise their Muslim religion more freely than in many other European countries (Daahir et al., 2004). Almost 40 per cent of the population is made up of ethnic minorities (LCC, 2006).
A qualitative research design was adopted to examine the nature of transnational links and the actual experiences of Somali business owners in Leicester. This comprised face-to-face, in-depth interviews with 25 Somalis in business, and 25 employees/volunteers (one from each enterprise). Basic profi le data of the fi rm, such as activities, employment size, age, location and sectors, along with information on the entrepreneur, including age, gender, ethnicity, migrant status, management qualifi cations/training and experience, as well as motives for starting and running the business were considered. Furthermore, a semi-structured interview protocol was used to assess the drivers and inhibitors impacting Somali entrepreneurship. The research design was enhanced by considering three focus groups (one of which was all-female). These helped clarify some of the issues revealed during the interviews and delved deeper into respondents’ experiences of enterprising in Leicester.

318 Entrepreneurship and growth
Conducting research in communities that have often been subjected to hostile political coverage like the Somalis presents challenges with regard to accessing the right informants (Faugier and Sargeant, 1997; Harris, 2004; Jones et al., 2006). A snowball sampling method was used since this is particularly eff ective for accessing ‘hidden’ populations (Hendricks and Blanken, 1992) and more suitable for small sample sizes (Black and Champion, 1976). It is cost-effi cient, while refusal rates are minimized with the process of referrals from gatekeepers/participants (Penrod et al., 2003). To circumvent potential challenges related to sample bias, the researchers adopted an enhanced snowballing approach, known as chain referral sampling or multiple-snowballing. ‘This technique maximizes variation in the determinants identifi ed by the researcher as critical to the phenomenon or concept of interest’ (Penrod et al., 2003, p. 105). In this study, care was been taken to direct referral strategically, in order to increase variation in the sampled population; the object was to minimize sample bias by enhancing the scope and hence the generalizability of the fi ndings. Diff erent gatekeepers were recruited to locate and gain access to suitable participants of diff erent business sectors and backgrounds in Leicester.
Notably, to overcome the trust barrier, data collection was undertaken with the assistance of a trusted intermediary, who had extensive links with the Somali community and a track record of eff ective collaboration with the university sector. However, devising the interview protocols and undertaking all data analysis, interpretation and presentation activities was incumbent on the researchers. In order to analyse data systematically and create an audit trail (i.e. documenting data analysis and interpretation procedures) the QSR NVivo software package was used.
SOMALI ENTERPRISE AND TRANSNATIONALISM
Typical of many newly arrived Third World origin immigrant groups, Somalis in Leicester are highly dependent on the social capital embed-ded in tight-knit ethnic and especially kinship networks. This is operative across a whole range from the settling-in process to the launching and support of business ventures. In the former case, the already settled com-munity plays an invaluable role in sheltering and mentoring new arrivals to the UK. A typical account is provided below:
family friends guided us to the main service offi ces in the city, assisted us in locating good housing . . . this helped us to settle into Leicester life very quickly. (Owner-manager Beta)

Transnationalism and Somali entrepreneurs in Leicester 319
When it comes to business itself, family and community social capital comes into play to major eff ect, notably in the form of cheap and reliable labour.
Moreover, as suggested, one very distinctive aspect of Somali networks is their extensive transnational scope, with many families maintaining ties of mutual aid with members in Somalia itself and throughout the diaspora. Indeed, this constant long distance inter-communication is strikingly evocative of Portes’s (1996, p. 3) defi nition of transnational migrants as ‘communities that sit astride political borders . . . “neither here nor there” but in both places simultaneously’. Signifi cantly, these networks, ‘simulta-neously dense and extensive over long physical distances’ (Portes, 1996, p. 8), constitute a substantial addition to the stock of social capital, in both material and intangible ways. As Box 14.1 indicates, family members con-tribute moral support and motivation, as well as much needed fi nancial assistance in some cases.
From these comments we can appreciate how deeply Somali enterprise in Leicester is enmeshed in a sprawling ‘transnational fi eld’ (Vertovec, 1999) of insider social relationships, a potentially rich repository of business resources extending far beyond what would be available to an isolated entrepreneurial minority solely dependent on its own locally resident community. Here we note that in almost every place Somalis have settled, they have achieved high rates of self-employed business ownership, creating what amounts to an entrepreneurial diaspora (Horst, 2002). Somali business owners in Leicester are typically in perpetual touch with similarly entrepreneurial relatives and friends in mainland Europe, North America and the Arab world as well as elsewhere in Britain. They perfectly exemplify Portes’s (1996, p. 9) notion of a ‘class of entrepreneurs who shuttle regularly across countries and maintain daily contact with events and activities abroad’. As R2 tells it, ‘We are in constant contact via the net and through visits at least once a year’ (Owner manager Xi). This is a reminder of the way in which twenty-fi rst-century transnational-ism is enabled by cheap air travel and new communication technologies. Though e-mail is not a face-to-face exchange in the narrow literal sense, it can nevertheless operate as an eff ective means of cementing social bonds over global space. Indeed, the internet might almost have been invented with communities like the Somalis in mind. Liberated from old-fashioned spatial bonds, Somali business is in eff ect now able to operate as a virtual entity across four continents, undeterred by sheer distance or even the Atlantic Ocean itself.
In practical terms, one benefi t of this is that entrepreneurs R2 to R6 have been able to tap into much needed fi nancial assistance from vastly distant sources. Given the crippling obstacles to raising capital typically

320 Entrepreneurship and growth
BOX 14.1 RESPONDENTS’ COMMENTS ON WORLDWIDE KINSHIP AND SOCIAL LINKAGES
R1: I have family members in Dubai, Canada and USA. They are all in business and help with business ideas and encouragement. (Owner-manager Pi)
R2: I needed about £20,000 to start this business. I got initial supplies from my uncle who has a business in Dubai. This made it easier to get cheaper products. Hopefully we can expand in future and my Dubai relative is willing to provide the funds. (Owner-manager Xi)
R3: I borrowed £5,500 from my brother in Montreal for a start-up, an interest-free loan to be paid back over the next two years. (Owner-manager Upsilon)
R4: Two of my friends in Dubai lent me £6,000. This was much needed assistance for starting my business. I am thankful for such true friends. (Owner-manager Alpha)
R5: I have family members in the USA, Europe, Dubai, Saudi Arabia and Canada and close friends who come from my clan back home. We are all very close. My cousin in the USA lent me the money to start the business. (Owner-manager Eta)
R6: My family abroad play a good role, both fi nancial and in terms of business ideas. If I need to buy more goods, I request to borrow some money and I repay them after I have sold the goods. I do the same for them whenever they need help from me. (Owner-manager Lambda)
R7: I have relatives in Toronto and Houston, I keep in constant contact with them. My uncle gave me most of the money towards the start-up of my business. I value my relatives, not just for the material things but for the support and the fellowship. This is the great value of the extended family in Somalia. (Owner-manager Omicron)
R8: I have a lot of friends in other countries and I contact them regularly. They order tickets from my agency. (Owner-manager Iota)
Transnationalism and Somali entrepreneurs in Leicester 321
faced by EMB (Jones et al., 1994; Ram et al., 2002b), this advantage can hardly be exaggerated and it is apparent that overseas funding has played an important part in the start-up of several businesses in the present sample. It might also contribute to the expansion plans of fi rms like R3 and R4, who otherwise might be obliged to delay any growth through lack of space and stock.
At this stage, however, we need to consider the entrepreneurial advan-tages of these cross-border linkages with caution. Though it would indeed be pleasant to report on transnationalism as a true force for entrepre-neurial empowerment, in the present case the inescapable impression is of an entrepreneurial minority essentially stuck in much the same rut as any other chronically under-resourced group of racialized entrepreneurs. One immediate explanation for this disappointing outcome is that by no means all Somalis in Leicester do enjoy access to these fertile international chan-nels of market intelligence, low cost supplies and fi nancial capital. On the contrary, there are sharp class divisions within the community, which in this case means that transnationalism tends to be the preserve of better off individuals. Our fi ndings suggest that those excluded from transnational linkages perform less well than those who do enjoy them. Whether this is because these are generally the least well resourced is not clear at this stage.
More to the point, however, it has to be recognized that even those Somalis who do benefi t from such linkages do not generally present a picture of rude entrepreneurial health. On the contrary, all the signs point to a set of marginal and often precariously surviving fi rms, typifi ed by one respondent who laments: ‘Any small situation in my life can cause
R9:1 I have family who live mostly in Africa, America and Europe as well as the UK, especially in London, Nottingham and Birmingham. They are mostly running businesses and we call each other to exchange business tactics and experi-ence. We work together to fi nd suitable business places around the world. (Owner-manager Nu)
R10: Members of my family have businesses in Dubai, Canada and the USA. I have been in a business environment since childhood and I had to start a business of my own once I got here, as it was something I had always desired. I like the independence and dignity it gives. I am my own boss and it is also a source of great personal pride. (Owner-manager Rho)
322 Entrepreneurship and growth
my business to fail’ (Owner-manager Gamma). For perhaps a majority of these fi rms, transnational social capital manifests itself mostly in the form of information exchange and moral support rather than the lavish fi nancial backing required to break the constraints in which EMB is cus-tomarily confi ned. While these intangibles certainly do contribute hugely to entrepreneurial motivation, confi dence and morale, all the evidence from the present survey points to the transnational dimension as off ering little more than a buff er for a set of fi rms that, in almost every respect, are simply reproducing the age-old EMB symptoms of marginality and precarious survival. Business life for many Somalis in Leicester is, as one shopkeeper complains, ‘hard work without much return’, echoing one of the long-running refrains of ethnic business studies.
Entrepreneurs themselves clearly recognize these drawbacks and one aspiring Somali business entrant went so far as to tell us: ‘I have a very poor opinion of Somali business. Products are rubbish’ (Focus group participant FG1). While this might seem a little over-judgemental, it accurately captures a sense of social exclusion and frustration at unre-alized potential. In classic mode, Somali fi rms in Leicester are locked into that demi-monde, described by Kloosterman as ‘the lower end of the distribution of fi rms: very small scale, low value-added and labour intensive, with a small capital to labour ratio’ (Kloosterman, 2000, p. 95). Unhappily, many of the negative symptoms of this are present in particularly acute form in the present sample. Tellingly, the overwhelm-ing majority of these fi rms are located in the least rewarded and indeed least desired sectors of the economy (Table 14.1), perhaps the most graphic indicator of entrepreneurial disadvantage (Ram and Jones, 2008). Corner shop retailing and consumer services like catering are the historic preserve of immigrant entrepreneurs in western cities and this over-reliance on these over-crowded low yielding onerous activities looms large once again in the present sample. Apart from a few excep-tions dealing in lines like travel agencies and computer repair, there is a lack of diversity, with fi rms largely confi ned to low order retailing and restaurants. Of the 25 fi rms listed in Table 14.1, 12 are wholly or partially reliant on retailing activities and a further six run restaurants or cafes. Though such a limited sample is not claimed as statistically representative, it is more than indicative of a quite inordinate degree of sectoral concentration.
In substance, then, there is very little here to distinguish Somali enter-prise from the general run of EMB. Moreover, there is a palpable sense of history repeating itself. The resemblance to the fi rst wave of strug-gling South Asian businesses in Britain as charted by early researchers like Aldrich et al. (1981) and Rafi q (1985) is almost uncanny. The only

323
Tab
le 1
4.1
Sam
ple
of S
omal
i fi r
ms i
n th
e st
udy
Bus
ines
s nam
e ps
eudo
nym
Sect
orO
wne
rshi
pT
enur
e (m
onth
s)N
o. o
f em
ploy
ees
No.
of
help
ers
Ow
ner’s
ge
nder
Age
Edu
catio
nG
row
th
orie
ntat
ion
Net
in
com
e
Alp
haR
etai
lSo
le T
rade
r84
01
Mal
e25
–34
Seco
ndar
yN
oSt
atic
Bet
a R
etai
lPa
rtne
rshi
p24
03
Mal
e45
–54
Gra
duat
eY
esSt
atic
Gam
ma
Ret
ail
Sole
Tra
der
360
1F
emal
e45
–54
Seco
ndar
yY
esF
allin
gD
elta
Ret
ail
Sole
Tra
der
60
1M
ale
35–4
4Se
cond
ary
Yes
Stat
icE
psilo
nR
etai
lSo
le T
rade
r 6
01
Mal
e45
–54
Seco
ndar
yY
esN
/AZ
eta
Ret
ail
Sole
Tra
der
240
2M
ale
45–5
4G
CSE
Yes
Stat
icE
taSe
rvic
es/c
afé/
reta
ilSo
le T
rade
r24
01
Mal
e45
–54
Prim
ary
Yes
Risi
ngT
heta
Ele
ctro
nics
/com
p.
repa
irSo
le T
rade
r36
10
Mal
e25
–34
NV
QY
esSt
atic
Iota
Tra
vel a
gent
/med
iaL
td24
01
Mal
e45
–54
Gra
duat
eY
esSt
atic
Kap
paT
rave
l age
ntL
td36
10
Mal
e35
–44
NV
Q 2
Y
esR
ising
Lam
bda
Ret
ail/c
omp.
repa
irSo
le T
rade
r10
01
Mal
e45
–54
Seco
ndar
y N
oSt
atic
Mu
Hai
rdre
sser
s/re
tail
Sole
Tra
der
110
1M
ale
35–4
4Pr
imar
y C
No
New
Nu
Impo
rts/
expo
rts/
dist
rib./r
etai
lL
td24
01
Mal
e35
–44
GC
SEY
esSt
atic
Xi
Inte
rn. c
afé
& te
l./re
tail
Ltd
240
1M
ale
35–4
4G
CSE
Yes
Stat
ic
Om
icro
nIn
tern
. caf
é/co
mp.
sa
les &
repa
irSo
le T
rade
r24
02
Mal
e45
–54
Seco
ndar
y N
oSt
atic
PiR
esta
uran
t & in
door
ga
mes
Sole
Tra
der
482
1M
ale
45–5
4N
VQ
3Y
esR
ising
Rho
Ret
ail
Sole
Tra
der
80
1F
emal
e35
–44
NV
Q 2
Y
esSt
atic
Sigm
aT
el./m
oney
tran
sfer
/fo
od in
tern
. caf
é/m
oney
Sole
Tra
der
100
2M
ale
45–5
4N
VQ
2N
oSt
atic
Tau
Tra
nsfe
r/fo
odPa
rtne
rshi
p17
10
Mal
e35
–44
Seco
ndar
y N
oR
ising

324
Tab
le 1
4.1
(con
tinue
d)
Bus
ines
s nam
e ps
eudo
nym
Sect
orO
wne
rshi
pT
enur
e (m
onth
s)N
o. o
f em
ploy
ees
No.
of
help
ers
Ow
ner’s
ge
nder
Age
Edu
catio
nG
row
th
orie
ntat
ion
Net
in
com
e
Ups
ilon
Aut
o re
pairs
Sole
Tra
der
604
0M
ale
25–3
4Se
cond
ary
Yes
Risi
ngPh
iR
esta
uran
t So
le T
rade
r36
30
Mal
e45
–54
Seco
ndar
yY
esR
ising
Chi
Ret
ail/g
roce
rsSo
le T
rade
r18
10
Mal
e55
+Se
cond
ary
Yes
Risi
ngPs
iIn
tern
et c
afé/
tel.
Ltd
361
0M
ale
45–5
4Se
cond
ary
Yes
Risi
ngO
meg
aB
utch
er/g
roce
rSo
le T
rade
r12
10
Mal
e45
–54
Seco
ndar
y Y
esR
ising
Alp
haE
nR
etai
l/gro
cer
Sole
Tra
der
180
1M
ale
35–4
4N
VQ
3Y
esR
ising
Transnationalism and Somali entrepreneurs in Leicester 325
hint that almost three decades have passed is the presence of a handful of internet cafes, though this may be more a refl ection of changing style than anything of practical substance. Furthermore, given that the majority of early Asian entrepreneurs were manual workers displaced by industriali-zation, whereas the Somalis appear to be a largely self-selected group of entrepreneurially motivated individuals (Daahir et al., 2004; Ram and Patton, 2003), the lack of contrast is even more striking. To some degree, their disadvantage may be a partial product of their newness, and evidence from a focus group of aspiring business owners suggests the possibility of some diversifi cation in the near future. Optimistically, one of these aspir-ants is qualifying to become a self-employed accountant, while another intends to start a building fi rm. Each of these proposals would, if realized, represent a signifi cant breakout from the present sectoral trap. As yet, however, these are but miniscule straws in the wind and history suggests that a tiny minority of Somali fi rms might be hugely successful, a great many will die and the in-between majority will exist on the basis of much sweat and tears.
Even more directly indicative of a struggle for survival is the fi nding that many if not most of the fi rms interviewed depend for their viability on that other typical EMB last resort of low paid or even unwaged labour. In itself, this is a further expression of under-capitalization, yet another of the congenital disadvantages facing immigrant business owners (Ram et al., 2002a). Very much in the manner of every other entrepreneurial minor-ity, the Somali business economy is based on the substitution of labour for capital; labour that comes cheaply because it is provided by family members and co-ethnics on a personal rather than a contractual basis (Ram et al., 2007). This cost-cutting strategy is absolutely central to the Somali business economy. According to the candid testimony of one of the retailers: ‘employing Somali co-ethnics is a means of getting assistance without paying a high salary’ (Owner-manager Zeta).
Several of the workers interviewed told us they were not taking any pay at all. Strictly speaking, the labour process in many of these operations is not based on ‘employees’ in the true sense but on ‘helpers’. This apparently fl agrant injustice is in a great many cases rationalized in terms of mutual benefi ts and deferred gratifi cation, with workers/helpers viewing their situation as a kind of business apprenticeship. A couple of representative quotes give the fl avour of this: ‘I am keen to get into business. I am not getting full pay but I am gaining experience’ (Worker Lambda). ‘I don’t get paid but the important thing is to learn a skill’ (Worker Gamma). Apart from the consideration that entrepreneurial apprenticeship is a complex and intensely contested notion in itself (Ram et al., 2001), this widespread reliance on uncosted labour is hardly suggestive of an entrepreneurial
326 Entrepreneurship and growth
economy dynamized by transnationalism or any other extraordinary innovation. This impression is reinforced by the further widespread use of unwaged family members, typifi ed by one retailer, assisted in running his shop by his wife, who explains: ‘She is not paid a salary at all. What we make in the shop is suffi cient for the family and we can’t aff ord a second salary’ (Owner-manager AlphaEn). As ever, there is no straightforward black and white verdict on a highly traditional informal labour process, where the distinction between the domestic and the productive spheres is blurred to the point of invisibility; and where there is constant trade-off between material and non-material rewards, monetary versus personal considerations (Ram et al., 2007).
Indeed, from a purely humanistic viewpoint, we might rejoice with Werbner (1999) that, in a consumerist age of unprecedented materialism, sentiment and cultural values are still capable of trumping cold-blooded calculation. Reassuringly, a further acquaintance with the burgeoning literature on the informal economy (Leonard, 1998; Williams, 2006) off ers a mass of evidence on the pervasive infl uence of altruistic work motiva-tions. Yet, while freely acknowledging all this, our point is simply that reliance on informal practices to the extreme degree evident in the present case betrays a serious lack of economic resources as understood in the conventional sense. Since market imperatives are ultimately a matter of commercial life or death, they cannot be wished away by other-worldly idealism.
More specifi cally for present purposes, it is clear that cross-border link-ages do not pay off for Somalis in the way they do for the cases outlined by McEwan et al. (2005). Highly dynamic transnational networks do not seem to translate into highly dynamic business performance. In eff ect, the business resources generated by Somali diasporic social networks are insuffi cient to compensate for defi ciencies in forms of capital (Nee and Sanders, 2001) other than social capital. Not only are Somali entre-preneurs seriously starved of fi nancial capital but they also lack human capital, in the shape of educational and professional qualifi cations rec-ognized in the UK. This is compounded by problems with what Nee and Sanders (2001) would call ‘cultural capital’, with language barriers one of the many symptoms of social dislocation suff ered by any recently arrived migrant community. Arguably this goes far to explain both a high degree of reliance on self-employment as a refuge for individuals ill equipped to compete in the open labour market; and for their struggle to thrive in that most demanding of occupations. Even so, we would argue that personal resource inadequacies tell only part of the story and need to be located in their proper context in order to arrive at anything approaching a full explanation.
Transnationalism and Somali entrepreneurs in Leicester 327
THE STRUCTURAL CONTEXT
Following Rainnie’s (1989) argument that, irrespective of ethnic identity, small fi rms can only be properly understood in relation to their external context, we would move the analysis beyond internal group resources to a consideration of the way these interact with the external environment. Here we are especially interested in what Waldinger et al. (1990) call the ‘opportunity structure’; that is, the mix of entrepreneurial possibilities and hazards presented by the receiving society that Somali entrepreneurs must negotiate. In the EMB fi eld, the most advanced theorization of this political-economic context is off ered by Kloosterman et al.’s (1999, see also Kloosterman, 2000; Kloosterman and Rath, 2001, 2003) mixed embeddedness model. Here they seek to reinterpret the position of ethnic entrepreneurs by examining ‘not only their rather concrete embedded-ness in social networks of immigrants but also their rather more abstract embeddedness in the socio-economic and politico-institutional environ-ment of the country of settlement’ (Kloosterman and Rath, 2001, p. 190). They worry about an over-emphasis in the EMB literature on ethnic social capital and internal group characteristics at the expense of a full analysis of the opportunity structure.
Such theorizing does of course require intensely delicate tightrope walking, since we should never lose sight of the actors themselves, of what Virdee (2006, p. 614) calls ‘the self-activity of racialized minorities in reshaping . . . adverse circumstances’. Even so, Kloosterman and Rath (2003, p. 5) are adamant that ‘many researchers confi ne themselves to exploring and refi ning agency . . . instead of elaborating on the interplay of agency and structure’. Ever mindful that ethnic entrepreneurs should never be depicted as pawns or victims, they nevertheless insist that even active agents ‘have to accept the specifi c socio-economic make-up of their new place of living’ (Kloosterman and Rath, 2001, p. 196). Yet, while ethnic entrepreneurs are certainly never without some degree of strategic choice, they must ultimately conform to stringent rules and tight param-eters laid down by the market. Here we note that this interaction between a narrow range of strategic options and a narrow range of market oppor-tunities is a universal non-ethnic-specifi c principle applying to all but the very largest corporations with monopolistic leverage (Scase, 2002). For various reasons, however, the straitjacket is laced even tighter on EMB than it is for the general run of enterprises (Ram and Jones, 2008).
Bearing all this in mind, we now attempt to understand the Somali entrepreneurial position through their struggle to come to terms with the harsh laws laid down by the market. For Kloosterman and Rath (2001), the market forces impinging on EMB are heavily conditioned by the
328 Entrepreneurship and growth
political and institutional as well as the purely economic. High importance is attached to diff erences in national government regulatory regimes, where the relatively deregulated economies of North America and Britain have been shown to off er a very favourable environment for immigrant entrepreneurs. By contrast, the much more tightly regulated regimes of continental Europe place all manner of legal and institutional barriers to their business entry (Haberfellner, 2003), with the result that EMB development in those countries lags signifi cantly behind that in Britain.
In itself, this has an immediate bearing on British-based Somali entre-preneurs, many of whom were previously resident in the Netherlands and Denmark, where their business ambitions had been thwarted (Bang Nielsen, 2004). Our sample contains many of these secondary migrants. Characteristic is the account provided by one of our respondents: ‘When I went to business school in Holland my objective was to go into busi-ness there. However, that proved harder than I thought. When I visited Leicester and saw what Somali people had achieved there, I decided to move’ (Owner-manager Omicron). On the face of it, this is a textbook example of positive agency, a migrant not only positively motivated towards entrepreneurship but also able to use transnational links to tran-scend structural barriers. Unhappily, this would be a simplistic interpre-tation, since any idea of deregulated Britain as a land of opportunity for migrant business founders on the fundamental distinction between quality and quantity. As demonstrated by Barrett et al. (2003), the absence of any formal entry barriers certainly does permit the proliferation of vast numbers of EMB in the UK, but in the long run this merely ensures a surfeit of fi rms and cut-throat competition. In the general absence of eff ec-tive business resources, above all fi nancial capital, the majority of these great swarms of little fi rms are destined to eke out an existence on the economic margins.
This could hardly be more graphically illustrated than by the position of Leicester Somalis. At the very outset, their freedom of movement has been drastically circumscribed by their extremely modest stocks of fi nancial and other resources. Very much in the mode of every other newly arrived set of raw entrepreneurs, they have had little choice but to gravitate towards low threshold sectors, markets that are the easiest to enter because they ‘require only small outlays of capital and relatively low levels of education’ (Kloosterman and Rath, 2001, p. 191). Self-evidently, this accounts for their enormous over-representation in micro-scale retailing and catering, where the need for minimal outlay on premises, equipment and stock has off ered a business opening to several of our most cash-strapped respond-ents. In one case, ‘I was an indigent refugee with no resources of any kind. I only had a small amount of pocket money given by government offi cials’
Transnationalism and Somali entrepreneurs in Leicester 329
(Owner-manager Chi). That he is now running a shop is a great source of personal pride – though not, regrettably, of great personal wealth.
As repeatedly noted by EMB researchers, the down side of easy entry is that it almost by defi nition guarantees only poor earnings (Aldrich et al., 1981; Jones et al., 2000), given the elementary rule that returns on capital are proportionate to the investment. What comes out is determined by what goes in. Coupled with this, ‘low entry barriers are synonymous with high levels of competition . . . as a result, profi ts tend to be low, failure rates high and the . . . mere existence of the fi rm increasingly depends on infor-mal or illegal practices’ (Engelen, 2001, p. 217). On this last point, another recurrent theme in the recent British literature concerns the use of illegal immigrant workers and the undercutting of the National Minimum Wage as desperate cost-cutting survival strategies for marginal EMB (Jones et al., 2004, 2006; Ram et al., 2007). In the present case, some Somali entre-preneurs are found to be using precisely this survival stratagem, though theirs is a perfectly legal version in that their unpaid ‘helpers’ do not come within any sort of offi cial defi nition of ‘employee’. Even so, their function – low cost survival lifeline – is essentially the same as any other invisible labour force, as is that of the many unpaid family members. In terms of the ever-present agency/structure dialectic, this deployment of invisible labour certainly comes within the literal defi nition of autonomous decision- making, while at the same time underlining the rather desperate nature of the options open to bottom end business owners. ‘Hobson’s Choice’ would be the most realistic description of their room for manoeuvre.
At root, all this is a refl ection of Engelen’s (2001) point about high levels of competition. By defi nition, the very ease of entry to these low value sectors is a virtual guarantee that they will attract vast numbers of small scale entrepreneurs too poorly resourced to seek their salvation in more demanding sectors of the market. Jones et al. (2000) use the term ‘entrepreneurial overpopulation’ to describe the way that the consumer potential in these markets is insuffi cient to support the number of fi rms at an economic level of return. This apparent violation of the neo-classical principle of equilibrium stems from the fact that Somalis, like any other micro business proprietors, are not rationally calculative and are prepared to operate for returns well below anything likely to be deemed ‘economic’ by the yardsticks of capitalist accountancy.
This interpretation is forcefully borne out by our sample responses. When asked about their most pressing problems, Somali entrepreneurs repeatedly cite intense competition as one of the highest hurdles in their path. For many, the impossibility of drumming up suffi cient custom to earn a decent living is a consequence of direct competition with a multitude of other ethnic minority fi rms, owned by Indians and other much longer

330 Entrepreneurship and growth
settled groups. Now deep-rooted, with accumulated capital and an estab-lished local customer base, supply chains and other commercial links built up through time and familiarity, these incumbent competitors are diffi cult to live with and still more so to displace. This is especially so in Leicester, where the entrepreneurial position of Indians and East African Asians is extraordinarily far reaching (Ram and Patton, 2003). The practical eff ects of this built-in competitive disadvantage are highlighted by the complaint of a barely profi table shopkeeper: ‘Along this street there are many Asian businesses that are well fi nanced and can attract more customers than I can because they have more products’ (Owner manager Beta). Expressing a widespread perception of a kind of ethnic monopoly and superiority of the Asian customer base, respondents claim: ‘Currently the Asians are supplying everyone’s needs’ (Owner-manager Zeta). ‘In this location, most businesses are owned by Asian people. Hence it is diffi cult to compete, as they have a larger population to service’ (Owner-manager Rho).
Likewise, one of the food retailers defi nes his own greatest problem as ‘Competition from other cash and carry shops in the neighbourhood with much greater variety of products’ (Owner-manager AlphaEn). Once again we are reminded of the inter-relationship between market position and capital, the lack of which is the prime cause of poor market choice and inability to compete on level terms.
There are countless historical precedents and the EMB literature on ‘vacancy chains’ is illuminating here (Ram and Jones, 2008). According to this perspective, newly arrived immigrant groups tend to establish them-selves in business by taking over business opportunities vacated by their previous incumbents, a process of entrepreneurial succession that often proceeds hand-in-hand with residential succession (Aldrich and Reiss, 1976). In cities like Leicester during the 1970s, this took the form of South Asian shops and services inserting themselves into the space abandoned by white owners (Aldrich et al., 1981). Now, in the latest round, another wave of newcomers like Somalis are inserting themselves in much the same way. As suggested by Ram and Patton (2003), there is in Leicester an emerging trend for the established South Asian entrepreneurs to move to higher level business or out of self-employment altogether. Already this is opening up space for them to move into, but as yet Asian business is still omnipresent and competitively formidable. Even where Somalis can fi nd space, they are still confi ned to low level market opportunities, which is of course the very reason why Asians are willing to abandon them. In addi-tion, there is no necessary guarantee that the tendency will continue far enough and fast enough to completely accommodate Somali demands for business opportunities.
Before closing this discussion of sectoral constraints, we must strongly

Transnationalism and Somali entrepreneurs in Leicester 331
emphasize that, powerful though the structural forces may be, Somali enterprise should not be simply dismissed as passively allocated to a posi-tion in some sort of racialized division of labour. On the contrary, their position is neither immutable nor non-negotiable. This is best seen in the attitudes of the focus group of young would-be entrepreneurs, many of whom show not a little strategic vision. Among other issues like the need for training and access to business support, there is widespread aware-ness of the need for sectoral diversifi cation and widening of the customer base. ‘We need to penetrate into communities other than Somali. That is the only way Somali business can gain more customers’ (Owner-manager Epsilon). ‘The more people our businesses can appeal to, the better the amount of trade we can do’ (Owner manager Nu). ‘Opening to other markets should be assisted’ (Owner manager Tau). Even with this aware-ness and will to conquer barriers, however, these barriers must still be recognized as formidable. If past precedents are any guide, it is likely to be only the very best equipped who will scale them. Once again, options are available but within a very narrow range.
THE URBAN SPATIAL DIMENSION
Closely articulated with the sectoral dimension is the spatial dimension, whose infl uence on the mix of opportunities and constraints often tends to reinforce that of sector. In the preceding discussion we frequently used the term ‘space’ in an essentially non-geographic sense to denote the scale of market opportunities available to competing entrepreneurial minorities. Yet there is a more literally spatial dimension to the opportunity structure, as Kloosterman and Rath (2001, p. 197) remind us, ‘Access to markets and their growth potential diff er not only from city to city but from neighbour-hood to neighbourhood within cities’. Just as EMB tends to be excluded from the plum sectors of the economy, so too is it from the prime urban locations and sites (Rekers and Van Kempen, 2000). A further reminder of this is given by our respondents, whose repeated complaints about the drawbacks of their physical location are closely related to their competi-tive disadvantages: ‘The place of my business premises is not that good. My business could grow well if I got good premises’ (Owner-manager Nu). ‘The thing is, we need a bigger space in a better location’ (Owner-manager Delta). ‘My shop premises are not in the right place’ (Owner-manager Iota). ‘My shop is not in an attractive location, therefore my competitors can defeat me’ (Owner-manager Gamma).
As argued by Rekers and Van Kempen (2000), access to prime loca-tions and quality premises is strictly rationed by capital and thus denied
332 Entrepreneurship and growth
to most small immigrant entrepreneurs. In the case of the small retail and consumer service outlets that predominate in the Somali enterprise economy, customer potential depends in the fi rst instance on the size and affl uence of the local resident population. This is picked up by one of the focus group discussants, whose business entry strategy includes ‘looking for rich areas’. Theoretically, the optimum formula is to be the only spe-cialist business in a highly affl uent suburb (Jones et al., 2006). Needless to say, in practice most Leicester Somalis ply their trade cheek by jowl with a host of competitors in the least rich areas of the city. Given the reliance on family and co-ethnic labour and other community links, fi rms are over-whelmingly located within or near the main Somali residential clusters. Largely because of the asylum dispersal process, these are concentrated in relatively deprived areas like Highfi elds and South Braunstone (LCC, 2006), ensuring a rather depressed customer base of low income local residents, Somali and non-Somali alike. On top of this, such urban stress locations usually impose all manner of additional security costs (Jones et al., 2000). Several respondents echo the aggrieved shopkeeper’s account: ‘There is a big problem of stock and vandalism, especially by local kids’ (Owner-manager Rho).
A further aspect of market location explored by Ram et al.’s (2002a) study of curry houses is the agglomeration eff ect, the strategic cluster of shops and services, where each individual fi rm benefi ts from the presence of others in what is a recognized port of call for shoppers and diners. It seems that few of our respondents benefi t from this and there are several complaints about the ‘lack of passing trade’. Continuing the rather pes-simistic theme, we must nevertheless remind ourselves that entry to such retail and service centres is rationed by higher rents and other costs.
One particularly unpleasant barrier that fi nally rears its head at this spatial level is racism. While racism may well be implicated in an imper-sonal sense in other aspects of business resource allocation, it is rarely directly identifi ed as such by our respondents. On the contrary, more than one of them go out of their way to praise what they see as Leicester’s multicultural inclusiveness. However, when it comes to business premises there is widespread perception of discrimination, voiced by the focus group member who claims, ‘There are some areas who say “no place” when Somali people apply to rent. They are simply hostile’ (Owner-manager Kappa). In the Somali case, exclusionary practices in the local property market are undoubtedly reinforced by negative stereotyping of asylum-seekers and refugees. Whatever the reason, its practical eff ect is to unfairly restrict access to business property as well as housing. Hence our respondents’ long string of complaints about inadequate premises in sub-prime locations.
Transnationalism and Somali entrepreneurs in Leicester 333
CONCLUSION
In a fi eld where historical and structural context are often ignored and insuffi ciently theorized, the link between ‘transnationalism’ and entrepre-neurship is potentially a seductive one, chiming as it does with comple-mentary discourses on ‘globalization from below’ and the contribution of ‘ethnic diversity’ to competitiveness. The extant (and largely non-UK) literature on the phenomenon of transnational entrepreneurship has documented how EMBs use their diasporic networks to access an array of valuable resources additional to those available locally (Zhou, 2004).
Yet, amid the feverish enthusiasm for this novel addition to ethnic agency, vital structural elements are unaccounted for and the present chapter has attempted to apply a corrective through the introduction of Kloosterman et al.’s (1999) theory of mixed embeddedness to examine the (often negative) impact of the structural environment. As well as bridging a conceptual gap here, we might also claim to have bridged a transatlantic gap, a tendency among the highly infl uential American pace-setters in this fi eld to ignore mixed embeddedness and other European theoretical contributions. Empirically, the chapter has examined the extent to which UK-based Somalis – a community emblematic of the new era of ‘super-diversity’ – are drawing on their transnational links to establish small enterprises. Here it became immediately evident that the transnational co-ethnic links of Somalis served as a crucial resource for the nurturing of small business activity. For the many ‘secondary’ movers in the sample, pre-existing ties in the UK were crucial to the identifi cation of places to settle, labour market information, and an array of other resources. Somalis routinely drew on transnational links to access fi nance, labour and commercially useful information. Though the utilization of co-ethnic social capital is a much remarked upon feature of ethnic minority enter-prise (Jones and Ram, 2007), its centrality to the operation of most of the fi rms in the sample is nonetheless surprising. But as the day-to-day experiences of our business owners and workers illustrate, this falls con-siderably short of neo-liberal depictions of the propitious consequences of globalization. The political-economic context imposes harsh constraints on Somali business activity that cannot be circumvented by the mobili-zation of social capital, be it local or transnational. In the light of these constraints, transnational entrepreneurship is likely to be the preserve of a minority of minorities.
By illuminating the dynamics of ‘transnational’ Somali business activ-ity, we have begun to address a gap in the literature on ethic minority enterprise, which has struggled to address the ‘diversifi cation of diversity’ (Vertovec, 2006) that attends the arrival of new communities in the UK.
334 Entrepreneurship and growth
Moreover, in the fi eld of migration, there has been much discussion on the importance of ‘conditioning factors’ in explaining the ‘integration’ of new arrivals (Castles et al., 2002). One set of factors are undoubtedly the diff erent ‘forms of capital’ (Nee and Sanders, 2001) that new arrivals draw on; that is, immigrant incorporation or integration is largely a function of the social, fi nancial and human capital of families, as well as how these resources are used by individuals within and apart from the structure of ethnic networks and institutions. However, these resources have to be set against the conditions of the receiving context, which include the nature of the product and labour markets in which new arrivals operate, distribu-tion, segregation/concentration in specifi c areas, and the support available to pursue business opportunities. We have shown how both sets of factors interact.
The fi ndings also present challenges to policy makers. Though diasporic sources of capital and capital were routinely used by this truly ‘globalized’ community, policy makers could fruitfully explore ways in which they could be developed (Lyon et al., 2006). In conjunction with this, interven-tions to improve the local context for migrant entrepreneurship could boost both local regeneration and Somali business activity itself, a thrust congruent with the government’s agenda to promote ‘enterprise for all’. However, the quality of the businesses reported here is highly question-able, as indicated by the widespread nature of ‘informal’ activity in the sample (see also Sepulveda et al., 2006). Policy makers face the diffi cult choice of ignoring such practices, condoning informality, or attempting to transition such enterprises into the ‘formal’ economy. Future research in this area, examining and/or enacting successful transitions, would be benefi cial.
REFERENCES
Aldrich, H. and A. Reiss Jr. (1976), ‘Continuities in the study of ecological succes-sion: changes in the racial composition of neighborhoods and their businesses’, American Journal of Sociology, 81 (4), 846–66.
Aldrich, H., J. Cater, T. Jones and D. McEvoy (1981), ‘Business development and self-segregation: Asian enterprise in three British cities’, in C. Peach, V. Robinson and S. Smith (eds), Ethnic Segregation in Cities, London: Croom Helm.
Bagwell, S. (2006), ‘UK Vietnamese businesses: cultural infl uences and intercul-tural diff erences’, Environment and Planning C: Government and Policy, 24, 51–69.
Bang Nielsen, K. (2004), ‘Next stop Britain: the infl uence of transnational net-works on the secondary movement of Danish Somalis’, Working Paper no. 22, Centre for Migration Research, Sussex.
Transnationalism and Somali entrepreneurs in Leicester 335
Barrett, G., T. Jones and D. McEvoy (2003), ‘United Kingdom: severely con-strained entrepreneurialism’, in R. Kloosterman and J. Rath (eds), Immigrant Entrepreneurs: Venturing Abroad in the Age of Globalisation, Oxford: Berg.
Basu, A. and E. Altinay (2002), ‘The interaction between culture and entrepreneur-ship in London’s immigrant businesses’, International Small Business Journal, 20 (4), 371–94.
Bechofer, F. and B. Elliott (1978), ‘The voice of small business and the politics of survival’, Sociological Review, 26, 57–88.
Black J.A. and D.J. Champion (1976), Methods and Issues in Social Research, Chichester: John Wiley and Sons.
Castles, S., M. Korac, E. Vasta and S. Vertovec (2002), ‘Integration: mapping the fi eld’, Home Offi ce Online Report 28/03.
Daahir, J., M. Bargchi and T. Abdishakur (2004), ‘Mapping Somali children’s educational needs in Leicester’, report submitted to LCC, Leicester Partnership through Neighbourhood Renewal Funding, Regent College, Leicester.
Dwyer, C. and P. Jackson (2003), ‘Commodifying diff erence: selling EASTern fashion, Environment and Planning D, 21 (3), 269–91.
Engelen, E. (2001), ‘“Breaking in” and “breaking out”: a Weberian approach to entrepreneurial opportunities’, Journal of Ethnic and Migration Studies, 27 (2), 203–23.
Faugier, J. and M. Sargeant (1997), ‘Sampling hard to reach populations’, Journal of Advanced Nursing, 26, 790–797.
Flap, H., B. Bulderand and A. Kumcu (2000), ‘The social capital of ethnic entre-preneurs and their business success’, in J. Rath (ed.), Immigrant Businesses: The Economic, Political and Social Environment, London: Macmillan.
Gidoomal, R. (1997), The UK Maharajahs: Inside the Asian Success Story, London: Nicholas Brealey.
Granovetter, M. (1985), ‘Economic action and social structures: the problem of embeddedness’, American Journal of Sociology, 91 (3), 481–510.
Haberfellner, R. (2003), ‘Austria: still a highly regulated economy, in R. Kloosterman and J. Rath (eds), Immigrant Entrepreneurship: Venturing Abroad in the Age of Globalisation, Oxford: Berg.
Harris, H. (2004), The Somali Community in the UK: What We Know and How We Know It, London: King’s College, Information Centre about Asylum and Refugees in the UK (ICAR).
Harvey, D. (1993), The Condition of Post-Modernity, Oxford: Blackwell.Hay, C. and M. Watson (1999), ‘Globalisation: sceptical notes on the 1999 Reith
Lectures’, Political Quarterly, 70 (4), 418–25.Hendricks, V.M. and P. Blanken (1992), ‘Snowball sampling: theoretical and
practical considerations’, in V.M Hendirck, P. Blanken and N. Adrians (eds), Snowball Sampling: A Pilot Study on Cocaine Use, Rotterdam: IVO.
Henry, N., C. McEwan and J. Pollard (2002), ‘Globalisation from below: Birmingham postcolonial workshop’, Area, 34 (2), 117–27.
Hepburn, J. (2004), Ethnic Minority Entrepreneurship in the UK, London: Business in the Community and Lloyds TSB.
Horst, C. (2002), ‘Transnational dialogues: developing ways to do research in a diasporic community’, unpublished paper, Transnationalism Seminar, Utrecht University, CERES Summer School, 26–28 June.
Janjuha-Jivraj, S. (2003), ‘The sustainability of social capital within ethnic networks’, Journal of Business Ethics, 47 (1), 31–43.
336 Entrepreneurship and growth
Jones, T. and M. Ram (2007), ‘Re-embedding the ethnic business agenda’, Work, Employment and Society, 21 (3), 439–57.
Jones, T., G. Barrett and D. McEvoy (1994), ‘Raising capital for the ethnic minor-ity fi rm’, in A. Hughes and D. Storey (eds), Finance and the Small Firm, London: Routledge.
Jones, T., G. Barrett and D. McEvoy (2000), ‘Market potential as a decisive infl u-ence on the performance of ethnic minority business’, in J. Rath (ed.), Immigrant Businesses: The Economic, Political and Social Context, London: Macmillan.
Jones, T., M. Ram and P. Edwards (2004), ‘Illegal immigrants and the Asian underground economy in the West Midlands, International Journal of Economic Development, 6 (1), 92–113.
Jones, T., M. Ram and P. Edwards (2006), ‘Shades of grey in the black economy’, International Journal of Sociology and Social Policy, 23 (2), 9–10,
Kieley, R. (2007), ‘Globalisation and poverty and the poverty of globalisation theory’, Current Sociology, 53 (6), 895–914.
Kitching, J., D. Smallbone and R. Athayde (2009), ‘Ethnic diasporas and business competitiveness: a study of minority-owned enterprises in London’, Journal of Ethnic and Migration Studies, 35 (4), 689–705.
Kivisto, P. (2001), ‘Theorizing transnational immigrants: a critical review of current eff orts’, Ethnic and Racial Studies, 24 (4), 549–77.
Kloosterman, R. (2000), ‘Immigrant entrepreneurship and the institutional context: a theoretical exploration’, in J. Rath (ed.), Immigrant Businesses: The Economic, Political and Social Environment, London: Macmillan.
Kloosterman, R. and J. Rath (2001), ‘Immigrant entrepreneurs in advanced socie-ties: mixed embeddedness further explored’, Journal of Ethnic and Migration Studies, 27 (2), 189–201.
Kloosterman, R. and J. Rath (2003), ‘Introduction’, in R. Kloosterman and J. Rath (eds), Immigrant Entrepreneurs: Venturing Abroad in the Age of Globalisation, Oxford: Berg.
Kloosterman, R., J. Van Leun and J. Rath (1999), ‘Mixed embeddedness: (in)formal economic activities and immigrant businesses in the Netherlands’, International Journal of Urban and Regional Research, 23 (2), 252–66.
LCC (2006), The Diversity of Leicester: A Demographic Profi le, Leicester: LCC Community Cohesion Project Team and LPIG, October.
Leonard, M. (1998), Invisible Work, Invisible Workers, Basingstoke: Macmillan.Light, I. (2007), ‘Global entrepreneurship and transnationalism’, in L. Dana (ed.),
Handbook of Research on Ethnic Minority Entrepreneurship, Cheltenham, UK and Northampton, MA, USA: Edward Elgar.
Light, I. and S. Gold (2000), Ethnic Economies, San Diego, CA: Academic Press.Lindley, A. (2005), ‘Somalia country study’, Working paper, Oxford Centre on
Migration, Policy and Society, Oxford.Lyon, F., L. Sepulveda and A. Botero-Jethwa (2006), ‘Enterprising refugees: their
impact, constraints and lessons for support providers’, proceedings of the 29th ISBE National Small Firms Conference, Cardiff , 30 October – 1 November.
McEwan, C., J. Pollard and N. Henry (2005), ‘The “global” in the city economy: multicultural economic development in Birmingham’, International Journal of Urban and Regional Research, 29 (4), 916–33.
Morawska, E. (2004), ‘Immigrant transnational entrepreneurs in New York: three varieties and their correlates’, International Journal of Entrepreneurial Behaviour and Research, 10, 325–48.
Transnationalism and Somali entrepreneurs in Leicester 337
Nee, V. and J. Sanders (2001), ‘Understanding the diversity of immigrant incorporation: a forms-of-capital model, Ethnic and Racial Studies, 24 (3), 386–411.
Penrod, J., D. Preston, R.E. Cain and M.T. Starks (2003), ‘A discussion of chain referral as a method of dampling hard-to-reach populations’, Journal of Transcultural Nursing, 14 (2), 100–107.
Portes, A. (1996), ‘Transnational communities: their emergence and signifi cance in the contemporary world system’, in R. Korzeniewicz and W. Smith (eds), Latin America and the World Economy, Westport, CT: Greenwood Press.
Portes, A. (1999), ‘Conclusion’, Ethnic and Racial Studies, 20 (2), 463–77.Portes, A., L. Guarnizo and P. Landolt (1999), ‘The study of transnationalism:
pitfalls and promise of an emergent research fi eld’, Ethnic and Racial Studies, 22 (2), 217–37.
Portes, A., W. Haller and L. Guarnizo (2002), ‘Transnational entrepreneurship: the emergence of an alternative form of immigrant economic adaptation’, American Sociological Review, 67, 278–98.
Rafi q, M. (1985), Asian Businesses in Bradford: Profi le and Prospect, Bradford: Bradford Metropolitan Council.
Rainnie, A. (1989), Industrial Relations in Small Firms, London: Routledge.Ram, M. and T. Jones (2008), Ethnic Minorities in Business, 2nd edn, Milton
Keynes: Small Business Research Trust.Ram, M. and D. Patton (2003), A Strategy for the Support of Black and Minority
Ethnic Businesses in Leicestershire, Leicester: Business Link Leicestershire.Ram, M., T. Abbas, B. Sanghera, G. Barlow and T. Jones (2001), ‘Apprentice
entrepreneurs? Ethnic minority workers in the independent restaurant sector’, Work, Employment and Society, 15 (2), 353–72.
Ram, M., T. Jones, T. Abbas and B. Sanghera (2002a), ‘Ethnic minority enterprise in its urban context: South Asian restaurants in Birmingham’, International Journal of Urban and Regional Research, 26 (3), 24–40.
Ram, M., D. Smallbone and D. Deakins (2002b), ‘Ethnic minority businesses in the UK: access to fi nance and business support’, British Bankers Association, London, September, 133 pp.
Ram, M., P. Edwards, and T. Jones (2007), ‘Staying underground: informal work, small fi rms and employment regulation in the UK’, Work and Occupations, 34 (3), 290–317.
Rekers, A. and R. Van Kempen (2000), ‘Location matters: ethnic entrepreneurs and the spatial context’, in J. Rath (ed.), Immigrant Businesses: The Economic, Political and Social Environment, London: Macmillan.
Scase, R. (2002), ‘Employment relations in small fi rms’, in P. Edwards (ed.), Industrial Relations: Theory and Practice, Oxford: Blackwell.
Sepulveda, L., F. Lyon and S. Syrett (2006), Refugee, New Arrivals and Enterprise: Their Contributions and Constraints, London: Small Business Service and Business Link.
Storey, D. (1994), Understanding the Small Business Sector, London: Routledge.Vertovec, S. (ed.) (1999), Migration and Social Cohesion, Cheltenham, UK and
Northampton, MA, USA: Edward Elgar.Vertovec, S. (2006), ‘The emergence of super-diversity in Britain’, Working paper
no. 25, University of Oxford.Virdee, S. (2006), ‘“Race”, employment and social change: a critique of current
orthodoxies’, Ethnic and Racial Studies, 29 (4), 605–28.

338 Entrepreneurship and growth
Waldinger, R., H. Aldrich and R. Ward (1990), ‘Opportunities, group characteris-tics and strategies’, in R. Waldinger, H. Aldrich, R. Ward and associates (eds), Ethnic Entrepreneurs: Immigrant Business in Industrial Society, Newbury Park, CA: Sage.
Werbner, P. (1980) ‘From rugs to riches: Manchester Pakistanis in the textile trade’, New Community, 9, 84–95.
Werbner, P. (1999), ‘What colour success? Distorting values in studies of ethnic entrepreneurship’, Sociological Review, 47, 548–79.
Williams, C. (2006), The Hidden Enterprise Culture, Cheltenham, UK and Northampton, MA, USA: Edward Elgar.
Zhou, M. (2004), ‘Revisiting ethnic entrepreneurship: convergences, controver-sies, and conceptual advancements’, International Migration Review, 38 (3), 1040–74.
339
15. The emergence of entrepreneurial potential in transition environments: a challenge for entrepreneurship theory or a developmental perspective?Friederike Welter and David Smallbone
INTRODUCTION
The importance of analysing entrepreneurship in its social context has recently been emphasized in the mainstream entrepreneurship literature (Davidsson, 2003). Under transition conditions, entrepreneurship has distinctive characteristics and behaviours, refl ecting the specifi c external conditions pertaining and the wider social context. This includes forms of self-employment and part-time businesses (Arzeni, 1996); where self-employment can provide a means of ‘self-help’ support for those who have lost their jobs through restructuring, or who have been unable to fi nd employment. Other forms of entrepreneurship range from nomenclature businesses where well-connected party offi cials and directors of former state enterprises used their privileges to gain from privatizing businesses or setting up new ventures, to a variety of types of formal and informal microenterprise and small enterprise activity, often involving diff erent members of a household on a paid and unpaid basis (Smallbone and Welter, 2001).
In such a context, researchers often discuss the contribution of ‘simple’ entrepreneurial activities, sometimes categorizing such activities as necessity-driven entrepreneurship, or proprietorship rather than entre-preneurship, or in the case of petty trading as arbitrage, rather than entre-preneurship, with little development potential. However, it can be argued that reality is more complex, making such a dichotomy overly simplistic in practice, particularly in a rapidly changing and hostile environment, and one where there is evidence of entrepreneurs having considerable human capital (e.g. Smallbone and Welter, 2001; Wasilczuk, 2000), which is likely
340 Entrepreneurship and growth
to increase their adaptive capacity. Research has shown that in the context of hostile environments, such as in a transition context, where property rights are not fully ensured and governments do not foster entrepreneur-ship and small business in practice, entrepreneurship can emerge from humble origins, frequently involving bootstrapping solutions undertaken by entrepreneurs in the face of serious institutional defi ciencies.
As a consequence, an analysis of entrepreneurship development and entrepreneurial potential in such conditions needs to be grounded in the context that pertains in such environments, if it is to accurately refl ect the empirical reality, with implications for existing entrepreneurship theory. This chapter focuses on the relationship between petty trading and entrepreneurship. This is because, on the one hand, such activity may be dismissed as ‘arbitrage’, operating outside the confi nes of the formal economy and highly dependent on relative price diff erentials on either side of the border, while on the other hand, it may be seen as a potential mechanism for entrepreneurial individuals to accumulate resources that can subsequently be invested in the development of more substantial ven-tures, in conditions where resource mobilization for entrepreneurship is extremely diffi cult. It is an assessment of this aspect that forms the focus of the chapter.
In this context, the specifi c aim of the chapter is to investigate an under-researched source of entrepreneurship in transition economies, namely ‘petty trading’ or arbitrage activity. The proposition is that in resource- and institutionally defi cient environments, the entrepreneurial process may include an evolution from simple trading activity, much of which may take place outside the formal economy, to productive and more formal entrepreneurial activities. Although the chapter is an exploratory one, the underlying aim is to demonstrate a need to adapt conventional views of the entrepreneurial process, based largely on experience in mature market environments, to incorporate distinctive characteristics of the context found in transition environments. This is important if entre-preneurship is to be viewed in its social context and theories of entrepre-neurship are to be applicable in a wide variety of external conditions. The methodology employed is qualitative, involving the use of case studies of individual entrepreneurs and enterprises, drawn from a recent project on cross-border entrepreneurship in three of the newly independent states (NIS).
The rest of the chapter is divided into four main sections: fi rstly, a review of relevant literature; secondly, a description of the methodology employed; thirdly, a presentation and discussion of case study evidence to explore the emergence of entrepreneurial potential; and lastly, conclusions and implications for both theory and policy.

The emergence of entrepreneurial potential in transition environments 341
LITERATURE REVIEW: INFORMAL AND FORMAL ENTREPRENEURSHIP
In reviewing some of the key literature relevant to a discussion of the entrepreneurial potential of those involved in petty trading activities, this section is divided into three main parts. The fi rst discusses Scase’s distinc-tion between entrepreneurship and proprietorship, which he argues best describes the majority of business owners in transition conditions. The second reviews literature that specifi cally refers to a development path from informal to formal types of entrepreneurial activity. The fi nal part emphasizes the heterogeneity of types of informal activity.
Entrepreneurship or Proprietorship?
Some authors have questioned the extent to which ‘entrepreneurship’ really exists in transition economies and thus the nature of its contribu-tion to economic transformation. For example, according to Scase (1997, 2003), most business ownership in transition conditions may be more appropriately characterized as proprietorship rather than entrepreneur-ship, based on the motivation of those involved, but with implications also for their business behaviour and contribution to economic development. He distinguishes between entrepreneurship and proprietorship, based on ‘contrasting psychologies of business founders; their attitudes towards trading; and their orientation towards capital accumulation’ (Scase, 2003, p. 67). According to Scase, entrepreneurship refers to a person’s commit-ment to capital accumulation and business growth, whereas proprietorship describes the ownership of property and other assets, which may be used for trading purposes to realize profi ts, but are not utilized for longer term purposes of capital accumulation. Any surpluses generated by proprietors are likely to be consumed rather than reinvested for business purposes, and much of Scase’s proprietorship is likely to be undertaken outside the formal economy.
In the pursuit of capital accumulation and long-term growth, an entrepreneur may forgo personal consumption and may actively search out market opportunities, which involves taking risks and coping with uncertainty. In the case of proprietorship, according to Scase, the motives of individuals are quite diff erent, since surpluses are not reinvested in the business for future long-term capital accumulation but rather are consumed and used to sustain living standards. According to Scase, in the transitional economies of Russia and Central Europe, proprietorship rather than entrepreneurship best describes the majority of small business activity. His assessment is that while small businesses may be numerically
342 Entrepreneurship and growth
signifi cant, particularly in sectors such as services and retailing, off ering employment and providing income for those involved, the proprietors who own and run most of these fi rms are incapable of constituting an indigenous force for economic development.
The central proposition being examined in this chapter challenges the simple dichotomy adopted by Scase, in emphasizing the development potential of some of the individuals who Scase classifi es as ‘proprietors’. The rapidly changing nature of external conditions in transition environ-ments, together with the learning capability of some individuals, may result in their motives and aspirations changing over time, interacting with external environmental changes.
Informal Activities as Seedbed for Enterprise Development?
An important part of the context for a discussion of entrepreneurial and trading activities in post-Soviet societies is the legacy inherited from the Soviet period. During Soviet times, diff erent forms of private entrepre-neurial activities co-existed alongside state ownership and entrepreneur-ship within state enterprises. Conceptually, researchers have distinguished between, on the one hand, a formal economy, which included state enterprises and legalized private enterprises and, on the other, the grey economy, which itself consisted of the second and the illegal economy. The ‘second economy’ included any form of unlicensed but tolerated private entrepreneurial activities. This included unlicensed activities in the private sector that were not offi cially recorded, as well as the clandes-tine use of state property (e.g. raw materials, machines, labour, services) for private business activities (Dallago, 1990). In other words, informal entrepreneurial behaviour existed within state owned enterprises during the communist period as a necessary response to the constant shortage of materials. Finally, during the socialist period an illegal economy existed, made up of quasi-criminal activities within state enterprises (i.e. bribes, theft of resources) and also criminal private activities. However, in some countries (such as the former Soviet republics) any type of private business activity could technically be considered to be part of the illegal economy, as prior to the start of the reform process in the late 1980s, no private business activity was legally acceptable. As a consequence, the legacy of entrepreneurship inherited from the communist period is complex (Rehn and Taalas, 2004, p. 243), not least because the same authors argue that entrepreneurship fl ourished in the daily lives of individuals during the Soviet period, as people struggled to cope with material shortages that were a common occurrence in the Soviet system.
Against this background, it is hardly surprising that informal economic
The emergence of entrepreneurial potential in transition environments 343
activity has fl ourished during the transition period. While the informal sector in developing countries has been reviewed extensively, so far few studies exist on its ‘analogue’ in a post-Soviet context. Informal activities include a wide variety of activities on a ‘cash-in-hand-basis’, some of which may be viewed as specifi c features of the post-Soviet period. These include petty trading or shuttle trading, where traders trade across borders, and the widespread use of informal employment. Such activities may be used to supplement an individual’s income from the formal economy, but in some circumstances may constitute the sole income for a household or family. With reference to the former, Williams et al. (2007) found that 51 per cent of all Ukrainian households reliant on informal strategies to earn income are multiple-earner households; only 6 per cent are no-earner households (i.e. with no employment possibilities outside the informal sector), while nearly two thirds of self-employed entrepreneurs have no licence and are thus operating informally and illegally. Williams (2005a) also fi nds informal activities to be a widespread phenomenon, with just two thirds of households in post-Soviet economies relying on incomes earned in the formal sector.
Some judge such informal activities as a transient phenomenon (e.g. see Welter, 1989 for a review of the respective literature), while others refer to ‘a regression to an earlier form of subsistence; for example, peasant-style self-suffi ciency as a survival mechanism’ (Wallace and Latcheva, 2006, p. 84). These authors suggest a typology of diff erent types of infor-mal activities, distinguishing between, on the one hand, activity at the household level that is non-monetized and alegal, such as ‘growing own food’ or ‘repairing the house’ (ibid., p. 85), and on the other, ‘earnings of a second job’ or ‘incidental earnings’, which are classifi ed as part of the black economy; that is monetized and outside the law. An empirical study of Moscow households emphasizes the ‘multiple economies’ that existed during the transition period, including formal and informal, private and state as well as those operating in monetized and non-monetized spheres (Pavlovskaya, 2004). The author points out that these ‘sub-economies’ are not to be seen as dichotomies, but rather as being complementary to one another; with boundaries that are permeable and fuzzy, which is a key argument in this chapter. Several empirical studies show that legal and illegal (or grey) activities co-exist in a transition context, with most new and small fi rms involved in both productive and rent seeking activities at the same time (e.g. Rehn and Taalas, 2004; Scase, 2003; Smallbone and Welter, 2001).
The fuzzy boundaries between formal and informal activities have con-sequences for our understanding of entrepreneurial activities in transition environments. They suggest that informal activities may be a seedbed for

344 Entrepreneurship and growth
more substantial entrepreneurial ventures, as several authors have previ-ously argued for developing and transition economies (e.g. Bennett and Estrin, 2007; Guariglia and Kim, 2006; Maloney, 2004; Smallbone and Welter, 2006; Williams et al., 2007). In the case of developing countries, Bennett and Estrin (2007) show how informal activities allow entrepre-neurs to explore the profi tability of their venture idea, acting as a ‘stepping stone’ towards more substantial businesses, allowing them to ‘experiment cheaply in an uncertain environment’. Similar results are available for Russia and the Ukraine. Williams et al. (2007) show that 85 per cent of those small-scale entrepreneurs formally registered alluded to conducting part of their business informally, while another 90 per cent stated that they had started their venture on ‘a cash-in-hand basis’, thus progressing from illegal to legal business once their venture became more established. For Russia, Guariglia and Kim (2006) fi nd that one quarter of newly self-employed entrepreneurs have been ‘moonlighting’ in the past. Aidis and van Praag (2007) confi rm such positive benefi ts of illegal entrepre-neurial experiences acquired under socialism to entrepreneurship and economic development in a transition period; Aidis (2003) demonstrates the entrepreneurship visible in traders at open-air markets.
Other authors emphasize the contributions of the informal sector to employment growth and economic development in its own right, regard-less of whether or not informal enterprises necessarily transit to being legalized and/or registered. In analysing Latin American experiences, Maloney (2004, p. 1159) argues that the informal sector should be reinter-preted as ‘the unregulated developing country analogue of the voluntary entrepreneurial small fi rm sector found in advanced countries’. However, in a transition country context, informality is often implicitly considered as a transient phenomenon that eventually will disappear once the busi-ness environment is functioning properly and the legal framework for entrepreneurial activities has been set. For example, despite their results confi rming informality as a seedbed for more substantial entrepreneurial activities, Guariglia and Kim (2006) also confi rm that ‘moonlighting’ is transitory, with people who want to shift jobs using this to test new employment possibilities.
The Heterogeneity of Informal Activity
In this context, it is important to recognize the heterogeneity of informal activity that exists, only some of which is likely to have real potential as a development route into more formal forms of entrepreneurship. Williams (2005b) for example, has distinguished four principal types of informal work: fi rstly, ‘organized informal work’, which involves people working on
The emergence of entrepreneurial potential in transition environments 345
an informal basis for businesses that undertake some or all of their activity informally; secondly, ‘informal work conducted by micro entrepreneurs’, where informal activity is used by the business owner as a short-term risk minimization strategy, either to test out a fl edgling business venture or to establish themselves; thirdly, ‘informal work by more established busi-nesses’, as part of a ‘getting by’ strategy in a serial and ongoing manner; and fourthly, ‘informal work by family, friends and acquaintances’, where cash is given for favours and exchanges that perhaps in the past might have been unpaid. It is the second category of the Williams typology that would appear to be the most relevant to the proposition under investigation in this chapter.
The following sections examine the heterogeneity of informal activities and the question of whether or not they can be a seedbed for more sub-stantial entrepreneurial ventures, based on empirical evidence from some former Soviet republics. The analysis seeks to identify antecedents and the factors infl uencing the transition to more substantial enterprises. Before that, we briefl y present the methodology and data base.
METHODOLOGY AND DATA SOURCES
Empirically, the chapter uses in-depth case material, drawn mainly from a study of cross-border entrepreneurship and trading activity in the Ukraine, Belarus and Moldova. Within this project (Intas 04-79-6991), a total of 240 in-depth interviews (in each region 20 enterprises and 10 individuals/households) were conducted in a total of eight border regions (three border regions in the Ukraine and Belarus respectively and two in Moldova) between 2005 and 2007. Although these cases have been used as a basis for this exploratory paper, a larger set of case material from a number of research projects on entrepreneurship and small enterprise development in ‘early stage’ transition conditions, is in the process of being systematically analysed for a similar purpose. Interviews in all projects were semi-structured. The sensitive nature of some of the ques-tions studied, together with the exploratory nature of the research, made a qualitative approach the most appropriate. Enterprises involved in cross-border activities were identifi ed either through meetings with representa-tives of business associations, business support agencies and other local institutions, or through the snowball method. In the case of individuals involved in cross-border trading activities, the semi-legal nature of some of this activity was a practical problem facing the research team. In this case, respondents were identifi ed by researchers at random, through observa-tion of petty trading activities at markets and bus stations on both sides
346 Entrepreneurship and growth
of the border and/or at railway stations at border crossing points. In some cases, researchers accompanied respondents in their cross-border journey, conducting an interview en route, representing a form of ‘participant observation’.
Case studies have been analysed using NVivo software, in order to allow a systematic search for patterns of entrepreneurial activity in the semi-structured and unstructured data gathered from respondents, as described above. The aim is to investigate the entry into entrepreneurship, the moti-vation for that, and whether or not these motivations change over time; to analyse development paths over time; and to consider the implications for entrepreneurial behaviour, and for the contribution of entrepreneurship to social and economic transformation. Enterprise case studies have been analysed in order to identify and assess the origins of the business activity and any relationship with petty trading and informal activity; case studies with individual petty traders from the point of view of their development potential, in the context of the aspirations of business owners. Particular emphasis is paid to identifying the nature and extent of entrepreneurial activities, motives for engaging in such activities, the role of diff erent members of the household, their entrepreneurial strategies and factors either inhibiting or favouring their entrepreneurial activities, as well as the development of such activities over time.
EXPLORING THE EMERGENCE OF ENTREPRENEURIAL POTENTIAL
So far, and adopting a cross-sectional view, our analysis suggests that those involved in petty trading activities may be divided into two broad categories: fi rstly, those driven by proprietorship-type motivation, where individuals lack the interest and ability for entrepreneurship and thus lack (currently at least) development potential (traders). The second, by contrast, is driven by more entrepreneurial individuals, whose motiva-tion, drive and resourcefulness make them nascent entrepreneurs. The fi rst category involves petty trading as an income strategy, where the main goal is driven by a need to gain, or to add to, a family’s income. Such petty trading often is not a registered activity and is conducted informally. The second category contains diff erent types of entrepreneurial activities, namely (i) shuttle trade on a larger scale, although since it operates mainly on an illegal basis, this limits the contribution of such activities to overall economic development; (ii) illegal or semi-legal petty trading as a starting point for more substantial entrepreneurial activities, often used later as an additional means to obtain working capital or as supplementary strategy
The emergence of entrepreneurial potential in transition environments 347
to obtain input for legal entrepreneurial activities; and (iii) petty trading as a testing ground for entrepreneurial skills, also leading to more substantial entrepreneurial ventures in the long run. The latter patterns are similar to the second of Williams’ four categories (2005b) of informal work, namely that conducted by micro and more established entrepreneurs.
Petty Trading Without Major Development Potential
In a transition context, an individual’s decision to become involved in busi-ness activity is frequently linked to the needs of their household or family, rather than just their own individual needs. In this regard, the empirical results suggest that where households or families are involved in petty trading activity, the latter is usually the main source of household income in the case of pensioners and older respondents, but is an additional source of income in the case of younger participants. As a result of the transi-tion process, during which unemployment or underemployment increased dramatically in countries such as Belarus, Moldova or the Ukraine, petty trading is a survival strategy for many respondents, contributing 50 per cent or more to a family’s income (Box 15.1). ‘Lack of money’, ‘too small pension’, ‘no job’ are all commonly stated motives for entering the ‘shuttle trade’ business. Often, petty traders have to care for their parents and/or are single mothers, and/or their wages in formal employment are too low to cover household expenditures. In such situations, cross-border coopera-tion and petty trading become a ‘life-saving activity’, as one respondent in Belarus put it, stressing the hard nature of the daily work associated with this activity, as well as the fact that it is a constant headache. Others com-plained about constant harassment, health risks and the attitude of the state towards private trade. In no sense does this form of activity represent a soft option for those involved in it. Instead, those individuals engaged in it are demonstrating entrepreneurial attributes in terms of initiative and ‘doing something for themselves’, rather than simply waiting for others to help them. Regardless of their motives, such people are undoubtedly demonstrating aspects of entrepreneurial behaviour, even if their motives are those Scase classifi es as those of ‘proprietors’.
There are many motives for getting involved in petty trading and it is overly simplistic to classify all petty trading as a ‘survival strategy’ (Smith, 2002; Smallbone and Welter, 2006). Many traders emphasize how cross-border trading has allowed them to substantially increase their household income. For example, in one case, such activities not only helped to guar-antee a steady income for the family members involved, but suffi cient surplus was generated for the younger son to be able to build a house. Often, cross-border activities allow respondents to buy goods and services

348 Entrepreneurship and growth
BOX 15.1 PETTY TRADING AS A MAJOR SOURCE OF INCOME
1. This respondent had been divorced for fi ve years (CS7HH/Vitebsk). In order to earn income, she started weaving tap-estries, which she sold through art shops in Belarus, while at the same time going on regular trips to Poland, organized by her church. Initially, she took some of her tapestry with her as gifts, but she soon discovered that there was an opportunity to sell her goods through art galleries in Poland.
2. This respondent and her husband have made their hobby a profi table cross-border trading activity (CS6HH/Vitebsk). They both have been active in foot orienteering since school days, participating in championships during Soviet times and getting to know friends in Poland with the same inter-est. When transition started, they used this friendship to import electronic goods to Poland and to bring cosmetics and clothes to Poland. When the wife lost her job as an engineer in a television factory because of staff reduction, she saw a need to more seriously engage in cross-border trading in order to complement their household income. She now works for a low wage in a state regional association for out-of-school work, teaching orienteering to schoolboys. Additionally, she trades camping outfi ts that she receives from her Polish partners.
3. This woman, living in Cahul in Moldova (CS3HH/Cahul), has been involved in shuttle trading activities since the beginning of the 1990s, when she began with small lots that she could fi t into one bag. Today, she brings merchandise for herself and for two small-scale traders from a neighbouring district. She specializes in stockings, socks and pants, importing from Turkey. Her main motive for entering petty trading has been to earn an income for herself and her son. Her activity is illegal, since it is not registered.
Source: Own interviews, Intas 04-79-6991.
The emergence of entrepreneurial potential in transition environments 349
they could not otherwise aff ord. In most cases, respondents also bring back goods and foodstuff for personal use. It can be argued that despite their low development potential, the individuals engaged in such activi-ties are demonstrating attributes usually associated with entrepreneurial behaviour, even if the activities themselves may not be considered forms of entrepreneurship.
Petty Trading With Development Potential
Although the main objective of most petty traders is to generate income for current consumption, some use such activities to accumulate capital for more substantial entrepreneurial ventures, thus qualifying as ‘entrepre-neurs’ in Scase’s understanding. This is refl ected in interviews which show that more substantial entrepreneurial activities can have their origin in former (or ongoing) shuttle trading experiences, which helped the partici-pants to accumulate fi nancial capital as well as the networks and contacts required to build up their ventures. Interestingly, such substantial entre-preneurial activities are not always operating within the law. However, our analysis also shows cases where substantial, albeit illegal large-scale shuttle trading activity evolved from ‘simple’ and small-scale petty trading activi-ties (Box 15.2), thus adding another category of ‘longstanding substantial informal entrepreneurial activity’ to Williams’s (2005b) classifi cation.
This pattern is an interesting one insofar as it demonstrates entre-preneurial potential and also the (sometimes) substantial development potential of petty trading activities. At the same time, the cases also show the unwillingness of respondents to legalize their activities, which restricts the contribution of such activities to economic development. While some may choose to stress the ethical dilemma inherent in all informal activity, an alternative view is to emphasize the arbitrary nature of the regulatory regime in many ‘early stage’ transition countries, which means that infor-mality is mainly a response to the absence of what in a mature market context would be seen as the basic framework conditions for entrepre-neurship. Such illegal activities create employment not only for the shuttle trader him/herself, but for others also, particularly where shuttle traders are embedded in wider networks of cross-border activities, as some of the cases show. Intermediaries organize joint border crossings, negotiating with the customs offi cers and border police. Individuals sell their services as ‘passengers’ or goods transporters, thus giving additional meaning to Williams’s (2005b) category of ‘informal work’.
As a consequence, activities that start as simple trading activities on a small scale can subsequently evolve over a period of time into substantial enter-prise activity with future development potential. All examples in this section
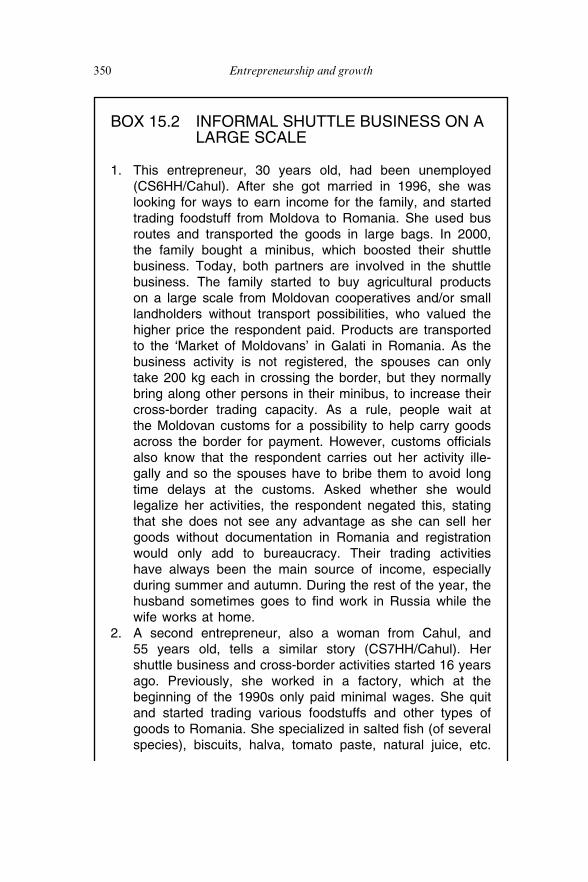
350 Entrepreneurship and growth
BOX 15.2 INFORMAL SHUTTLE BUSINESS ON A LARGE SCALE
1. This entrepreneur, 30 years old, had been unemployed (CS6HH/Cahul). After she got married in 1996, she was looking for ways to earn income for the family, and started trading foodstuff from Moldova to Romania. She used bus routes and transported the goods in large bags. In 2000, the family bought a minibus, which boosted their shuttle business. Today, both partners are involved in the shuttle business. The family started to buy agricultural products on a large scale from Moldovan cooperatives and/or small landholders without transport possibilities, who valued the higher price the respondent paid. Products are transported to the ‘Market of Moldovans’ in Galati in Romania. As the business activity is not registered, the spouses can only take 200 kg each in crossing the border, but they normally bring along other persons in their minibus, to increase their cross-border trading capacity. As a rule, people wait at the Moldovan customs for a possibility to help carry goods across the border for payment. However, customs offi cials also know that the respondent carries out her activity ille-gally and so the spouses have to bribe them to avoid long time delays at the customs. Asked whether she would legalize her activities, the respondent negated this, stating that she does not see any advantage as she can sell her goods without documentation in Romania and registration would only add to bureaucracy. Their trading activities have always been the main source of income, especially during summer and autumn. During the rest of the year, the husband sometimes goes to fi nd work in Russia while the wife works at home.
2. A second entrepreneur, also a woman from Cahul, and 55 years old, tells a similar story (CS7HH/Cahul). Her shuttle business and cross-border activities started 16 years ago. Previously, she worked in a factory, which at the beginning of the 1990s only paid minimal wages. She quit and started trading various foodstuffs and other types of goods to Romania. She specialized in salted fi sh (of several species), biscuits, halva, tomato paste, natural juice, etc.
The emergence of entrepreneurial potential in transition environments 351
demonstrate the potential for venture creation that exists from ‘simple’ petty trading activities, in a context where a more conventional approach (in the mainstream literature sense) to venture creation is diffi cult, because of the constraints imposed by a combination of institutional defi ciencies and a lack of access to necessary resources. Trading activities in the cases described in Box 15.3 developed from simple sales activity to more sophisticated entre-preneurial activities, which are mainly legal. This involved an active search for customers and markets and was often based on some professional expe-riences in the fi eld the respondents trade in. The age of the entrepreneurs appears sometimes to play a role, in that younger respondents appear to be more fl exible in adapting to adverse environments and in locating and exploiting business opportunities, although this is not a consistent pattern.
The Context
While emphasizing the development potential that exists in some individ-uals engaged in petty trading activities, an adverse business environment
as well as illegally exported cigarettes. During the fi rst fi ve years of her business activities, she acted as a shuttle trader, transporting goods in bags on buses to the market in Galati (Romania). When she had acquired Romanian citizenship, she rented a market stall and started trading foodstuff and other goods brought by other Moldovans. The respondent rents a one-room fl at in Galati as she usually spends three weeks per month in Romania and just a week in Moldova. She has arrangements with several persons in Moldova who supply her with goods. When she goes back to Moldova, she also buys foodstuff for reselling in Romania. The respond-ent is the main earner for the family, as the husband’s wage is very low. They therefore have agreed that the husband keeps the house while the wife earns the income. Customs and border controls represent a serious barrier for her illegal activities, demanding bribes and sometimes confi scating illegal goods, which she tries to circumvent by only exporting small quantities of goods to minimize the risk of loss. When asked if she would legalize her business, her answer was that if she did, the business would cease to exist.
Source: Own interviews, Intas 04-79-6991.

352 Entrepreneurship and growth
BOX 15.3 FROM PETTY TRADING TO MORE SUBSTANTIAL ENTREPRENEURIAL ACTIVITIES
1. This Ukrainian entrepreneur became involved in his father’s shuttle business when still at school (CS18ENT/Lviv). The shuttle trade was launched in the early 1990s. The goods traded were exported to Poland initially and included a wide range, from deodorant sprays to TV sets, wheels and bicycles. In later years, the father concentrated on importing goods from Poland to the Ukraine. The business was semi-offi cial, but trade was chaotic: wheels were handed over to friends at the market; two wheels were advertised for sale while there were many more that were added on a piece-by-piece basis. Traders did not keep accounting books or records. Today, the business is offi cially registered, it pays a fi xed tax and since 1999, they have owned a small shop, although they still have to pay rent including a small fee to the market security guards for its location at the central market. Three years ago, the entrepreneur started focusing on trading goods made in Ukraine, as importing goods from Poland became more and more diffi cult.
2. This fi rm is located in Zakarpattya in Ukraine (CS18ENT/Zarkapattya). Since 2000, it has been an offi cial repre-sentative of a Czech fi rm, selling second-hand clothes and footwear to a network of enterprises in Ukraine. By Ukrainian standards, it is a large supplier, ranking 13 in 2002. The company employs 11 persons, including four drivers in another small business providing cargo serv-ices. The entrepreneur is 37 years old. He attended the Kiev Institute of Light Industry, obtaining a degree from the Department for the Automation of Technological Processes. Since he was a teenager, he has occupied himself with trading different goods in order to earn money. Already in 1991, he registered as an individual entrepreneur. At that time, he mainly was involved in – illegal – shuttle trade, but he refrained from elaborating on this in more detail. After having earned some capital, he opened a company (with friends) selling input material and accessories for the light industry in Kiev. When moving to Uzhgorod in Western
The emergence of entrepreneurial potential in transition environments 353
Ukraine, he sold his share in that company and opened two enterprises, only one of which turned out to be successful. Nevertheless, for someone who started his life as a petty trader, this individual has acquired the attributes of a habitual entrepreneur.
3. This trader in Vitebsk, Belarus, is a 35-year-old trained engi-neer (radio engineering), formally employed by the public telecommunication company (CS1HH/Vitebsk). His fi rst expe-riences with shuttle trading go back to when he was a student. This respondent began making regular trips to Russia when he decided to get married, in order to earn enough money for the wedding. His fi rst activities were importing various goods such as clothes, telephone sets and electrical goods from Russia. However, later he switched to buying ‘vouchers’ for regular travels to Bialystok in Poland, where he shopped for housekeeping goods, tools and other goods. Some years ago, he decided to specialize in importing mobile phones, which is an area related to his regular employment. On demand, he buys in Poland and sells both in Belarus and Pskov in Russia, where, thanks to his wife’s relatives, he has a ready-made distribution channel.
4. This entrepreneur, 36 years old, owns a private limited company in Edinet, Moldova, with currently seven employees (CS19ENT/Edinet). The company was established in 1996. The statutes stipulate several activities, at the moment the fi rm concentrates on the import and export of agricultural goods. From 1996 to 2001 the entrepreneur also developed TV activ-ity in his region and provided cargo transport services abroad to domestic and foreign fi rms. Since 2001, he has exclusively concentrated on exporting and importing agricultural goods. This includes potatoes from Poland and Romania and export-ing fruits mainly to Russia. In the early 1990s, the entrepre-neur started with illegal shuttle trading, exporting and selling Russian and Moldovan-produced TV sets to Romania. Today, the cross-border activities are still partly illegal. Usually, when crossing the border he declares lower quantities in his docu-ments and lower costs for his goods in order to avoid customs dues.
Source: Own interviews, Intas 04-79-6991.
354 Entrepreneurship and growth
that is common in transition environments can also restrict the develop-ment potential of petty trading activities. The cases in Box 15.4 demon-strate the diffi culties of establishing a formal sector business by legalizing trading activities in an environment where rules and regulations are administered on an ad hoc basis and not implemented properly. While clearly such institutional defi ciencies may contribute to the establishment of such forms of informal activity in the fi rst place, they can also aff ect the potential for individuals engaged in them using the resources gener-ated to support more substantial business activities. On the other hand, it must be stressed that we also have cases that have traded fully legally from the beginning, thus requiring a deeper analysis into the genuine reasons for informality.
This leads to traders operating semi-legally, in the sense that they use illegal cross-border trade in order to secure input for registered activities in their home country. This places them into Williams’s (2005b) category of ‘informal work by more established entrepreneurs’ where the informal-ity is used as a ‘getting-by’ strategy on an ongoing basis. A typical case is that of a woman trader who holds a licence allowing her to trade goods in the territory of Moldova, but not to import goods from Romania and Ukraine (CS1HH). Besides trading imported textiles from Romania and Ukraine, the respondent acts as an offi cial distributor of medical products for a European company, whose products are also imported illegally. She named the high level of import taxes as the main reason for her illegal border trade. In the long run, however, such behaviour impedes business development as well as hindering these entrepreneurs from fully realizing the contribution they could make to economic and social development.
Identifying Opportunities
A particular feature emerging from the interviews is the inventiveness and entrepreneurial alertness of respondents currently engaged in petty trading activity to recognize opportunities, in which they demonstrate some of the key qualities associated with entrepreneurship. As suggested previously, this challenges a simple categorization of all petty trading activities as ‘propri-etorship’, because some of the individuals involved are behaving entrepre-neurially, even if their main motive in the short term is income generation. Often, opportunities are identifi ed because respondents themselves miss a particular good or service or are looking for cheaper sources of supply (Box 15.5). Others react to demands made by friends or colleagues, which they then identify as a wider potential opportunity for shuttle trading. Moreover, the case interviews show respondents adapting to changing market condi-tions and demands in selecting the goods they trade.

The emergence of entrepreneurial potential in transition environments 355
BOX 15.4 EXTERNAL BARRIERS TO REALIZING THE DEVELOPMENT POTENTIAL OF PETTY TRADING ACTIVITIES
1. A typical case showing the diffi culties involved in real-izing the development potential of petty trading involves two sisters, both in their 30s, who trade in window ledges (CS10HH/Grodno), helped by their mother. The business activity was started six years ago, mainly to boost family income. Today, they have two trading places at markets in Grodno, Belarus: one is a typical ‘plastic cell’ of 2 sq m.; the other is their own small shop. The respondents go to Poland to search for suitable products in markets there. The busi-ness is based on responding to requests from their custom-ers. They bring the products purchased to the border where they are distributed among the transporters, the capacity of which is one of the constraints on the development potential of this particular trading activity. A more substantial business in window ledges would require documents confi rming the sales in Poland as a requirement for the respondents to reg-ister customs fees and to import goods beyond the individual customs-free limit. However, as most sales partners are operating semi-legally themselves, the sisters would have to change their business partners in order to operate entirely within the law.
2. The second case is an entrepreneur, 48 years old, who abandoned his job as an executive for ‘Youth and Sports’ in the commune Cucoara in Moldova, because of low wages (CS8HH/Cahul). For several years, he worked illegally as a construction worker in Russia and Germany. Having accu-mulated capital, he decided to start his own small business and obtained a licence for passenger transport in Moldova and Romania. When in early 2005, private minibuses were replaced by a government-owned fi rm he lost his licence several times and had to re-purchase it through bribes, until he decided to sell his minibus. Instead, he bought a small car and illegally began transporting passengers. He also started trading in illegal goods, namely cigarettes and petrol. Petrol is transported in his car’s petrol tank and sold at a higher price in Romania. Cigarettes are permitted for

356 Entrepreneurship and growth
In this context, much of the entrepreneurship literature has emphasized that opportunities do not only ‘exist out there’ (Davidsson, 2003), but are also created. In this regard, respondents were often creating their own opportunities, or signifi cantly developing what was initially an external stimulus, such as a request from a relative for a particular item. While the
transportation in a quantity of 10 packets per person. The respondent buys cigarettes in Moldova and distributes them among his passengers before crossing the border. In 2003–04 he also traded vegetables, fruits and walnuts from his own land, but because of confl icts with customs (he choose not to elaborate on that) he stopped that activity. Income from all these activities does not contribute to sustaining his family, but according to the respondent is saved for opening up a more substantial business later on.
Source: Own interviews, Intas 04-79-6991.
BOX 15.5 ENTREPRENEURSHIP IN THE CONTEXT OF PETTY TRADING: INVENTIVENESS AND OPPORTUNITY IDENTIFICATION
This entrepreneur from Grodno in Belarus (CS2HH/Grodno) started importing baby carriages for twins from Poland, when his twins were born. At that time, he bought a baby carriage in Poland, which his wife did not like. As a result, he placed an advertise-ment in the newspapers to sell this carriage, which he did before going to Poland to buy another one for his family. Having earned around $50 from this sale, he started what became a fl ourishing trading activity and the Polish seller quickly agreed to establish a profi table partnership. Today, the entrepreneur, who works in a state company, visits Poland on average twice per month. Before specializing in baby carriages, he imported household electrical accessories, various accessories for car owners and gold, on an irregular basis.
Source: Own interviews, Intas 04-79-6991.
The emergence of entrepreneurial potential in transition environments 357
specifi c nature of some of the opportunities may be transient, the behav-iour demonstrated by respondents overall shows a high level of sensitivity and responsiveness to the needs of customers, who are themselves heavily infl uenced by institutional conditions.
CONCLUSIONS AND IMPLICATIONS
With regard to entrepreneurship theory, Davidsson (2003) and Baker et al. (2005), for example, have emphasized the need for entrepreneur-ship research to acknowledge the heterogeneity of environmental condi-tions, outcomes and behaviours that exist. This chapter contributes to the ongoing discussion of the nature of entrepreneurship across diff erent envi-ronments in a number of respects. Firstly, by focusing on the fuzzy nature of the boundary between formal and informal activity, the study contrib-utes new evidence on one of the routes to entrepreneurship in resource and institutionally defi cient environments. In this respect, the chapter makes an empirical contribution to the transition literature, which with some notable exceptions (e.g. Aidis, 2003; Aidis and van Praag, 2007) tends to concen-trate mainly on entrepreneurial activity that is part of the formal economy.
In seeking to assess the entrepreneurial potential of those involved in petty trading activity, the case evidence is divided into four categories, describing diff erent types of situation with varying development potential. While not all petty traders have such potential, some do, either as ‘entre-preneurs’ operating large-scale ventures within the informal economy, or by using accumulated resources to invest in the development of produc-tive enterprises in the formal economy. It may be argued that individuals in both groups are demonstrating qualities of entrepreneurship, thereby emphasizing the rather static nature of the entrepreneur–proprietor type dichotomies, as proposed by Scase and others.
As well as exploring unique case data to investigate development potential over time, the chapter also contributes to the emerging litera-ture emphasizing the embeddedness of entrepreneurship in specifi c social contexts, which in transition economies contain a number of specifi c features. In this regard, Williams (2005a) argues that coping practices in the informal sphere are not limited to poor and unemployed households/ individuals but rather cut across socio-economic spheres and contexts. We take up this argument by extending his fourfold classifi cation of informal entrepreneurial activities, suggesting that it may be more appropriate to think of a continuum of informality instead of attempting to develop exclusive categories. At the same time, the view that research should transcend the widely painted negative portrayal of informal activities
358 Entrepreneurship and growth
as a hindrance to economic development because of its exploitative and low-paid nature and vice versa (Williams et al., 2007), is supported and extended by the evidence presented here.
In terms of policy implications, Maloney (2004) emphasizes the volun-tary element of informality, which exists, he suggests, because of the laxity of enforcement and implementation, thus allowing entrepreneurs and small traders a choice regarding the ‘optimal degree of participation in formal institutions’ (Maloney, 2004, p. 1173). An alternative view is that in situations where the regulatory framework includes penal and/or continu-ously changing tax rates, the lack of an appropriate legal framework and other institutional defi ciencies, activities that in some countries may be able to operate profi tably and legally are only viable if they operate partly outside the law. To the extent that this can be demonstrated, the choice for business owners is to operate at least partly informally or not to operate at all. If petty traders and small entrepreneurs, as depicted in this chapter, remain informal (illegal) voluntarily, they manage to do so because the business framework is incomplete and/or is not enforced properly. This means that policies that focus on increasing the ‘formality’ of petty trading might clash or contradict with policies to foster entrepreneurship develop-ment: ‘[D]eterring informal employment will result in governments stamp-ing out with one hand precisely the entrepreneurship and enterprise that with another hand they are so desperately seeking to nurture’ (Williams et al., 2007, p. 409).
REFERENCES
Aidis, R. (2003), ‘Offi cially despised yet tolerated: open-air markets and entre-preneurship in post-socialist countries’, Post-Communist Economies, 15 (3), 461–73.
Aidis, R. and M. van Praag (2007), ‘Illegal entrepreneurship experience: does it make a diff erence for business performance and motivation?’, Journal of Business Venturing, 22, 283–310.
Arzeni, S. (1996), ‘Entrepreneurship in Eastern Europe: a critical view’, in H. Brezinski and M. Fritsch (eds), The Economic Impact of New Firms in Post Socialist Countries: Bottom-Up Transformation in Eastern Europe, Cheltenham, UK and Brookfi eld, USA: Edward Elgar, pp. 52–8.
Baker, T., E. Gedajlovic and M. Lubatkin (2005), ‘A framework for comparing entrepreneurship processes across nations’, Journal of International Business Studies, 36 (5), 492–504.
Bennett, J. and S. Estrin (2007), ‘Informality as a stepping stone: entrepreneurial entry in a developing economy’, IZA Discussion Paper 2950, IZA, Bonn.
Dallago, B. (1990), The Irregular Economy: The ‘Underground’ Economy and the ‘Black’ Labour Market, Aldershot: Dartmouth.
The emergence of entrepreneurial potential in transition environments 359
Davidsson, P. (2003), ‘The domain of entrepreneurship research: some sugges-tions’, in J. Katz and D. Shepherd (eds), Advances in Entrepreneurship, Firm Emergence and Growth, Vol. 6, Oxford: Elsevier/JAI Press, pp. 315–72.
Guariglia, A. and B.-Y. Kim (2006), ‘The dynamics of moonlighting in Russia’, Economics of Transition, 14 (1), 1–45.
Maloney, W.F. (2004), ‘Informality revisited’, World Development, 32 (7), 1159–78.
Pavlovskaya, M. (2004), ‘Other transitions: multiple economies of Moscow house-holds in the 1990s, Annals of the Association of American Geographers, 94 (2), 329–51.
Rehn, A. and S. Taalas (2004), ‘“Znakomstva I svyazi” (acquaintances and connec-tions) – Blat, the Soviet Union and mundane entrepreneurship’, Entrepreneurship and Regional Development, 16 (3), 235–50.
Scase, R. (1997), ‘The role of small businesses in the economic transformation of Eastern Europe: real but relatively unimportant?’, International Small Business Journal, 16 (1), 13–21.
Scase, R. (2003), ‘Entrepreneurship and proprietorship in transition: policy implications for the SME sector’, in R. McIntyre and B. Dallago (eds), Small and Medium Enterprises in Transitional Economies, Basingstoke, Palgrave Macmillan, pp. 64–77.
Smallbone, D. and F. Welter (2001), ‘The distinctiveness of entrepreneurship in transition economies’, Small Business Economics, 16, 249–62.
Smallbone, D. and F. Welter (2006), ‘Conceptualising entrepreneurship in a tran-sition context’, International Journal of Entrepreneurship and Small Business, 3 (2), 190–206.
Smith, A. (2002), ‘Culture/economy and spaces of economic practice: position-ing households in post-communism’, Transactions of the Institute of British Geographers, 27, 232–50.
Wallace, C. and R. Latcheva (2006), ‘Economic transformation outside the law. Corruption, trust in public institutions and the informal economy in transition countries of Central and Eastern Europe’, Europe Asia Studies, 58 (1), 81–102.
Wasilczuk, J. (2000), ‘Advantageous competence of owner/managers to grow the fi rm in Poland: empirical evidence’, Journal of Small Business Management, 38 (2), 88–94.
Welter, F. (1989), Der informelle Sektor in Entwicklungsländern dargestellt an Beispielen in Afrika [The Informal Sector in Developing Countries, Illustrated with Examples from Africa], Materialien und kleine Schriften des Instituts für Entwicklungsforschung und Entwicklungspolitik, 125, Bochum: Institut für Entwicklungsforschung und Entwicklungspolitik, Ruhr-Universität Bochum.
Williams, C. (2005a), ‘Surviving post-socialism: coping practices in East-Central Europe’, International Journal of Sociology and Social Policy, 25 (9), 65–77.
Williams, C. (2005b), ‘The undeclared sector, self-employment and public policy’, International Journal of Entrepreneurial Behaviour and Research, 11 (4), 244–57.
Williams, C., J. Round and P. Rodgers (2007), ‘Beyond the formal/informal economy binary hierarchy’, International Journal of Social Economics, 34 (6), 402–14.


Index
Aalborg, Denmark, wireless communications cluster 22, 32
AberDart ryegrass 35Achtenberg, L. 307Acosta, J. 232Acs, Z. 49, 50, 55, 126, 211Addis, M. 256agro-food, as high-tech 20–21Ahl, H. 287Aidis, R. 344, 357Ajzen, I. 57, 139, 140, 150Alcock, P. 307Aldrich, H. 128, 129, 133, 135, 136,
322, 329, 330Allen, J. 184Alsos, G. 192Althusser, L. 282Altinay, E. 312ambitious entrepreneurship
literature 55–8overview 49–52study conclusions 71–3study data and methodology
58–67study results 67–71
Amit, R. 109Anand, B.N. 256, 261Andersen, P. 29Anderson, A.R. 286, 287Anderson, G. 307Anderson, P. 86Anselin, L. 210, 211Antoncic, B. 255, 257, 262arbitrage activity, see petty tradingArend, R.J. 259Arenius, P. 54Argyres, N. 159Armstrong, J.S. 88Arrighetti, A. 56Arzeni, S. 339Asaba, S. 85, 95Audia, G. 210
Audretsch, D.B. 49, 50, 56, 126, 130, 207, 209, 210, 211, 222, 259
Autio, E. 50, 51, 54, 59, 74, 131Avnimelech, G. 25, 42Azagra-Caro, A. 232, 239
Bagchi-Sen, S. 233, 236, 248Bagozzi, R. 150Bagwell, S. 313Bain, J.S. 83Baker, G. 119Baker, T. 129, 357Bang Nielsen, K. 317, 328Bania, N. 211Bank of England, and discourse
on enterprise in deprived communities 292–3
bankruptcyand business size 196and businesses bought as a going
concern 194and educational level 197and entrepreneurial exit 170and growth objectives 195risk of 187and sex of ownership 200
Bantel, K.A. 97, 99Baptista, R. 178, 208, 209, 210, 214Barrett, G. 328Basu, A. 312Bates, T. 158, 161, 164Baum, J.A.C. 210, 257, 258, 259Baumol, W.J. 50, 56, 126, 127, 135Bayona, C. 232, 234, 238, 246Beard, D.W. 89Bechofer, F. 312Beck, U. 184Becker, E. 108Becker, G.S. 108, 109, 118, 193Becker, S.O. 218, 220Begg, I. 288, 305Belarus, see petty trading, study
361

362 Index
Belgiumambitious entrepreneurship 63planned fi nancial requirements of
early-stage entrepreneurs 132Bennett, J. 344Benneworth, P. 282Bercovitz, J.E.L. 232, 234Berggren, B. 143Berglund, K. 282, 286Berryman, J. 187, 188Bhidé, A.V. 129, 201, 202Bilderbeek, J. 187biofuels, Welsh clusters 34–42Birch, D. 50, 139Birley, S. 258, 259Birmingham Chinese businesses
314Black, J.A. 318Blackburn, R. 4, 161, 189, 281, 282,
283, 285, 291Blanchfl ower, D.G. 107, 109Blanken, P. 318Blau, D.M. 109Block, J. 122Bogner, W.C. 86, 95, 97, 98, 99Bonaccorsi, A. 238, 246Bordieu, P. 282, 285, 286Borjas, G.J. 109Boschma, R. 24, 25, 45Bosma, N.S. 51, 53, 54, 59, 72, 74Boswell, J. 139Bougrain, F. 260Boulding, W. 99Bowman, D. 95Bowman, E.H. 159Boyd, B. 90Bradley, D. 282Bradley, F. 259Bregger, J. 108Brittain, J. 84, 97Brock, W.A. 109Brockhaus, R.H. 188Bronars, S.G. 109Brown, C. 118Bruno, A. 187Bullvåg, E. 150Burgelman, R. 159Burns, P. 188Burt, R. 24Burtis, P. 42
business decisions, and business failure 188
business exit, overview 4, 7–9Bygrave, W.D. 129, 192
Cabral, L.M.B. 226Calantone, R.J. 91Caldeira, M.M. 262California, Jacobian clusters 22, 25Calvo, G.A. 177Camerer, C.F. 108, 180Camison-Zornoza, C. 140Cantwell, J. 44Capello, R. 210Cappella, J.N. 140Caraça, J. 210Carpenter, G.S. 86Carrasco, R. 110Carree, M.A. 50, 126Carroll, G.R. 109, 160Carter, N. 130Carter, R. 187, 188, 189, 190Carter, S. 192Casper, S. 20Casson, M. 109, 128, 134Castles, S. 334Caves, R.E. 157CE, see corporate entrepreneurshipchain referral sampling 318Chakrabarti, A.K. 238Champion, D.J. 318Chandler, A. 126, 135Chandler, G.N. 88, 91, 97, 99Chaney, P.K. 90Chatterton, P. 282Cho, A.H. 282, 284Chopra, A. 160Chrisman, J.J. 83, 97, 157Christen, M. 99Christensen, C. 19Churchill, N.C. 143Clark, G.L. 159Clark, K.B. 95Cleantech 41, 42–6Clifton, N. 20, 24Coeurderoy, R. 81, 83, 95Coffi eld, F. 285Cohen, J. 91, 92, 99Cohen, L. 282, 287, 288Cohen, P. 91, 92, 99

Index 363
Cohen, W.M. 211, 235, 236, 239, 242, 246, 249, 257, 261, 270
collaborative networkingand ICT capabilities 260–63motivations for 257structure 258–9
collective entrepreneurship 17–18, 23–5Combs, K. 233company weaknesses, and business
failure 188Conant, J. 87Connolly, P. 285, 307Conway, C. 186Cooke, P. 17, 19, 20, 21, 24, 25, 41, 42Cooper, A.C. 81, 82, 84, 95, 96, 98, 180coordination activities 261Cope, J. 189corporate entrepreneurship (CE) 231
and universities and research institutions (U&RI)
innovation strategy and cooperation 235–7
literature 233–9overview 231–3, 247–9reasons for cooperation 233–5study context 239–40study methodology 240–42study results 242–7technology intensity and R&D
cooperation 237–9Correia, F. 208, 212Covin, J.G. 81, 82, 83, 87, 89, 90, 91,
97, 98, 99, 104, 231, 255, 257, 260Cressy, R. 187Curran, J. 282customer collaboration, as motivation
for networking 259
Daahir, J. 317, 325Dallago, B. 342Dalum, B. 32, 43Davenport, S. 27Davidsson, P. 50, 53, 56, 57, 72, 126,
127, 130, 339, 356, 357Day, G. 87, 96de Langen, P. 24De Meza, D. 180Deakins, D. 185, 286Dean, T.J. 83, 97Deeds, D.L. 95, 97, 231
Dees, G. 282, 284Dehejia, R.H. 218, 219Delmar, F. 53, 139, 254Denmark
cluster identifi cation 26–8introduction of regions 22
Dess, G.G. 89, 255, 257, 260, 265Dholakia, R.R. 262disruptive innovation 19, 21dissolution, and entrepreneurial exit
170, 173, 176divestment choice 161, 178–80Djankov, S. 130draw 111Dreisler, P. 140Dulas 40Dunn, T. 109Durand, R. 81, 83, 95Dutta, D.K. 56, 57Dwyer, C. 314, 315
early-stage entrepreneurial activity (ESEA) rate 59
earnings, impact of becoming a business owner
literature 108–10overview 107–8, 119–22study
data and methodology 110–12empirical specifi cation 112–16results 116–19
earnings, proxies for 163–4Edinet 353educational level
and bankruptcy 197and entrepreneurial exit 176
Edvinsson, L. 24Eesley, D. 129EFCs (Entrepreneurial Framework
Conditions) 54Eisenschitz, A. 283, 284, 306Ekinsmyth, C. 184, 185Elliott, B. 312EMB (ethnic minority business)
overview 312–14see also Somali entrepreneurs in
LeicesterEmilia-Romagna 21employment protection, and ambitious
entrepreneurship 64, 67, 70–71, 72

364 Index
Engelen, E. 329enterprise discourse
and deprived areascommunity leaders’ interviews
301–4social entrepreneur interviews
298–301study analysis and fi ndings 290–94study method 288–90support worker interviews 294–8UK 281–5, 291–4, 306–7
overview 281–3, 304–7entrepreneur risk
small business failure studydiscussion 200–202fi nancial exposure 191–2fi rm-level characteristics 194–6methodology 189–90owner characteristics 192–4predicting exposure 196–200profi le of respondents 190–91
entrepreneurial character, and business failure 188
entrepreneurial exitfi rm performance 160literature 159–61modes of 159–60, 173–7overview 157–8, 177–80study
descriptive statistics 166–70design 161–5estimations analysis 171–3estimations on modes of exit 173–7
entrepreneurial failure 161, 178–80Entrepreneurial Framework
Conditions (EFCs) 54entrepreneurial orientation (EO)
and collaborative networking 255, 260
measurement 265see also ambitious entrepreneurship
entrepreneurial overpopulation 329entrepreneurial risk 185entrepreneurs’ earnings
proxies for 163–4see also earnings, impact of
becoming a business ownerentrepreneurship
as challenging hegemony 286–8and innovation 18
institutional component 54–5and proprietorship 341–2regional demography component
53–4regional economic attributes 52–3
entry timing and environmental conditions
overview 81–2study
data sample 87–8methodology 88–92, 104–5results 92–4
theory and hypotheses 83–7EO (entrepreneurial orientation)
and collaborative networking 255, 260
measurement 265see also ambitious entrepreneurship
ESEA (early-stage entrepreneurial activity) rate 59
ESEAGR_HI (early-stage entrepreneurial activity with high growth ambitions) 59, 61–3
ESEAGR_LO (early-stage entrepreneurial activity with low growth ambitions) 59–63,67–71
ESEAGR_MD (early-stage entrepreneurial activity with modest growth ambitions) 59, 61–3
ESEAINNOV (early-stage entrepreneurial activity with innovative ambitions) 60, 61–3
Estrin, S. 344ethnic minority business (EMB)
overview 312–14see also Somali entrepreneurs in
LeicesterEtzioni, A. 49Etzkowitz, H. 259Evans, D.S. 107, 109, 118Evans, M. 286Everett, J.E. 159, 186
Fain, T. 108Fairclough, N. 288, 289Faria, P. 222Faugier, J. 318Feldman, M.P. 207, 211, 232, 234, 259
Index 365
femalesand entrepreneurial exit 166, 171see also bankruptcy, and sex of
ownershipFerber, M.A. 109Figueiredo, O. 214, 217, 219Fillis, I. 262, 272fi nancial requirements, see planned
fi nancial requirements, early-stage entrepreneurs
Finland, planned fi nancial requirements of early-stage entrepreneurs 132
fi rm sizeand bankruptcy 196and entrepreneurial exit 168
Fishbein, M. 139, 140, 150Fisher, M.M. 211Fitzpatrick, S. 282Flap, H. 315Fletcher, D.E. 286, 287Flores-Romero, M. 161Florin, J. 140Fontana, R. 236, 242, 246, 250FORA report (Danish Environment
Ministry, 2006) 26–7Form, W.H. 109Fotopoulos, G. 53Foucault, M. 282, 287founders, and entrepreneurial exit 166,
177France
ambitious entrepreneurship 62–3planned fi nancial requirements of
early-stage entrepreneurs 132Frank, H. 52Fredland, J.E. 188Freel, M. 185Freeman, C. 18Freeman, J. 81, 84, 97Freese, J. 181Freytag, A. 54Friesen, P.H. 84, 89, 95, 99, 237, 265Fritsch, M. 53, 60, 211, 235‘at full potential’ fi rms 271
Gago, D. 256Gallouj, F. 238Garnsey, E. 57Gatignon, H. 95, 242Gavron, R. 285
gazelles 49Gemunden, H.G. 258Germany, planned fi nancial
requirements of early-stage entrepreneurs 132
Germinal Holdings 35Geroski, P.A. 81, 83Giarratana, M.S. 85, 87Gibbons, R. 119Gibson-Graham, J.K. 294Gidoomal, R. 316Gilbert, B.A. 127, 139, 143, 149Gill, A.M. 109Gimeno, J. 158, 161‘globalization-from-below’ 315Gold, S. 316Golder, P.N. 82, 83, 90Gompers, P. 109Gonard, T. 238Gough, J. 283, 284, 306Gramsci, A. 282Granovetter, M. 24, 312, 315Greece
ambitious entrepreneurship 62planned fi nancial requirements of
early-stage entrepreneurs 132Greis, N.P. 235, 241Griffi ths, Nigel 292growth attitudes and realized growth
overview 139–41, 151study
discussion 148–50limitations 151measurement 143–4results 144–8sample 141–3
growth-oriented entrepreneurship, see ambitious entrepreneurship
Guariglia, A. 344Gulati, R. 256, 270
Haber, S. 108Haberfellner, R. 328habitus 285Hagedoorn, J. 231, 233, 234, 235, 238,
240, 248, 256, 261, 270Hair, J.F. 92Hall, G. 188Hall, L.A. 233, 236, 248Hambrick, D.C. 88
366 Index
Hamel, G. 232Hamilton, B.H. 107, 110Hanks, S.H. 88, 91, 97, 99Hannan, M.T. 81, 84, 160Hargadon, A. 19Harris, H. 318Harvey, D. 316Haudeville, B. 260Haughton, G. 284Häusler, J. 233Hausman, J. 181Hay, C. 316Hayward, M.L.A. 187Haywood, G. 282Headd, B. 158, 161, 164, 186Healy, J. 285, 307Helpman, E. 19Henderson, R.M. 95, 212Hendricks, V.M. 318Hendry, C. 40Henrekson, M. 49, 126, 127, 130Henry, N. 184, 313, 314Hepburn, J. 313, 314Herr, K. 307Hessels, J. 64Hewitt, Patricia 292high growth-expectation
entrepreneurship 59Hill, C.W.L. 97, 231Hitt, M.A. 90Hjorth, D. 286Hoang, H. 255, 257, 262‘hobby’ nascent entrepreneurs 136, 143Hodson, R. 286Holmes, T.J. 158, 159, 160Holtz-Eakin, D. 109Horst, C. 319Horta, H. 212hostile environments, and new venture
entry timing 86–7Howorth, C. 281, 282, 293, 307Hsiao, C. 181Hsu, D.H. 109
Iammarino, S. 44Iansiti, M. 90Ichino, A. 218, 220ICT capability 256
and collaborative networking 260–63measurement 265
ICT-related small fi rms 254collaborative network structure
studydata collection and sample 263–5discussion 268–72literature review 257–63methodology 264–6overview 254–7, 272–3research questions 256results 266–8
Idson, T. 118IGER (Institute for Grassland and
Environmental Research) 34–5imitation
and new venture entry timing 81–2, 83, 85, 94–5, 97
study variable 90incremental innovation 18, 21–2informal activities
and enterprise development 342–4heterogeneity of 344–5
innovationcategories 18defi nitions 18and entrepreneurship 18intensities 19–21types 18–19
innovation systems, taxonomy 19–23innovative entrepreneurship, see
ambitious entrepreneurshipinnovativeness (entrepreneurial
orientation) 260input innovation 18insolvency, and entrepreneurial exit 170Institute for Grassland and
Environmental Research (IGER) 34–5
internal communication 261IQE 40Ireland, planned fi nancial requirements
of early-stage entrepreneurs 132Isaksen, E. 140Isikdag, U. 262Israel, Central region, as example of
Jacobian cluster mutation 22Italy
ambitious entrepreneurship 62planned fi nancial requirements of
early-stage entrepreneurs 132Iyigun, M.F. 109

Index 367
Jack, S.L. 286Jackson, P. 314, 315Jacob, F. 259Jacobian cluster mutation 25–8,
42–6examples
Denmark 22–3Israel 41–2Wales 41
Jacobs, J. 22, 25Jacobs, K. 289Jaff e, A. 210Janjuha-Jivraj, S. 315Jarillo, J. 234Jennings, P.L. 287Job Creation Programme (UK) 284Johannessen, J.A. 256, 262, 265, 272Johannisson, B. 286Johansson, A.W. 282, 286Johansson, D. 49Johnson, P. 126, 130, 186, 282Jones, C. 282, 286, 287Jones-Evans, D. 232, 234, 247Jones, T. 312, 313, 315, 316, 318, 321,
322, 327, 329, 330, 332, 333Jørgensen, U. 43Jovanovic, B. 109, 118
Kahneman, D. 108Kale, P. 256, 257, 270Karnøe, P. 43Kaufman, R.L. 286Keats, B. 90Keilbach, M. 49, 126Kerin, R. 81, 83, 84, 95Khandwalla, P.N. 237Khanna, T. 256, 261Kieley, R. 316Kihlstrom, R. 107Kilkenny, M. 286Kim, B.-Y. 344Kintrea, K. 284Kirzner, I. 134Kitching, J. 313, 314Kivisto, P. 315Klepper, S. 24, 45, 208Klofsten, M. 232Kloosterman, R. 312, 313, 322, 327,
328, 331, 333Knight, F. 128
knowledge-based entrepreneurship, overview 4, 9–11
Koch, C. 258Koellinger, P. 55, 56, 57, 58, 110Kolvereid, L. 140, 150Koschatzky, K. 210Koster, S. 53Krashinsky, M. 282, 284Kristensen, P. 25, 34Krueger, N.F. 56Kshetri, N. 262
Laff ont, J. 107Landström, H. 129Lanzolla, G. 85Latcheva, R. 343Laukkanen, M. 286Laursen, K. 210, 211, 226, 236Lazear, E.P. 108, 109Lee, C. 260, 262Lee, H. 82, 86, 90, 96, 104Lee, S.Y. 54, 207Leighton, L.S. 107, 109, 118Leitch, S. 27Leonard, M. 326Lerner, J. 211Levesque, M. 83, 95, 97Levie, J. 54, 74, 131Levinthal, D.A. 211, 235, 236, 246,
249, 257, 261, 270Levy, M. 262Lewis, V.L. 143Leydesdor, L. 259Li, T. 91Liao, J. 53, 57Lieberman, M.B. 82, 84, 85, 95Light, I. 312, 315, 316Lilien, G.L. 91Lindley, A. 313, 317Lioukas, S. 88, 89, 91, 99, 104, 105Lipparini, A. 258, 271Lippman, S.A. 85Lister, R. 307Lloyd, P. 282Long, J.S. 181Lorenzoni, G. 258, 271Louri, H. 53Lovallo, D. 108, 180Lowe, R.A. 180Lucas, R.E. 107, 109

368 Index
Lukas, R. 235Lumpkin, G.T. 255, 257, 260, 265Lundström, A. 55Lyon, F. 334
Macdonald, R. 285Macmillan, I. 158Madryn 40Madsen, E.L. 260Maidique, M.A. 89Makadok, R. 82, 85, 87, 91, 97, 99Maloney, W.F. 344, 358managerial capabilities
and new venture entry timing 85, 87, 96–7
study variable 91managerial turnover 161, 178–80market dynamism 89market experimentation 130marketing capabilities
and new venture entry timing 86, 96study variable 91
Martin, L. 262Mason, C. 282Mata, J. 160, 226Matlay, H. 256, 262Maula, M. 140Mazzoneli, R. 207McEvily, B. 89McEwan, C. 313, 314, 315, 316, 326McFadden, D. 181McGrath, R.G. 135, 158McMullan, W.E. 157Mendonça, J. 214Mercedes 36, 40Meyer, G.D. 83, 97Michael, A. 281Miles, M. 231Miller, D. 84, 89, 91, 95, 99, 104, 237,
244, 265Mincer, J. 109, 112Miner, A. 129Minniti, M. 54Miscanthus 35–6Mitchell, W. 81, 86, 95, 96, 98, 99, 160mixed embeddedness 327Modrego, A. 32Moldova, see petty trading, studyMolecular Nature 36Montgomery, D.B. 82, 84, 85, 95
Moore, R.L. 108Morawska, E. 313Morgan, J.P. 233Morgan, K. 21Morris, C.E. 188Mosakowski, E. 109Moulaert, F. 282, 288, 305‘on the move’ fi rms 270–71Mueller, P. 55, 60Mueller, S. 127multiple-snowballing 318Musson, G. 282, 287, 288Mythen, G. 184, 185
Nadler, D.A. 85Nakamoto, K. 86Naman, J.L. 237Nee, V. 315, 326, 334Nelson, R.R. 83, 207Netherlands, planned fi nancial
requirements of early-stage entrepreneurs 132
network capability, measurement 265Nicholls, J. 282Nicholson, L. 287Nijdam, M. 24Nolan, A. 282Ñopo, H. 110NorCOM cluster 22, 32North, D.C. 51, 136North Jutland, Jacobian clusters 22,
25–6, 28–34
Ogbor, J.O. 287Oi, W.Y. 118Okubo, Y. 234Oliver, A.L. 257, 258Oliver, C. 259Olofsson, C. 143organized informal work 344Orsenigo, L. 238, 248Ostgaard, T.A. 258, 259Oswald, A.J. 107, 109Overton, T. 88Owen, A.L. 109
Parida, V. 258, 263, 265Parker, I. 287Parker, S.C. 60, 107, 110, 111, 164Parkinson, C. 281, 282, 293, 307
Index 369
partner knowledge 261partnership collaboration, as
motivation for networking 259PAT 3 (Policy Action Team 3) 291Paton, R. 282, 284Patton, D. 325, 330Pavlovskaya, M. 343Pearce, J. 282, 284, 293Pedersen, J. 36Pedersen, S. 36Penrod, J. 318Perren, L. 287Perry, S.C. 188petty trading
literature review 341–5overview 339–40, 357–8study
context 351–4with development potential
349–51emergence of entrepreneurial
potential 346–57external barriers 355–6identifying opportunities 354–7without major development
potential 347–9methodology and data 345–6
Phillips, B.D. 186Phoenix Fund 292photovoltaics clusters, Wales 40Piccaluga, A. 238, 246Pittaway, L. 257, 258, 259, 261, 268,
270, 271planned behaviour theory 54planned exit strategy 161, 178–80planned fi nancial requirements, early-
stage entrepreneurscross-country variation 129–31, 133literature 128–31overview 126–8, 135–6study
discussion 133–5methodology 131–2results 132–3
‘platform’ technological innovation 18Policy Action Team 3 (PAT 3) 291Pomerantz, M. 281Pompa, P.P.M. 187port cities, entrepreneurship 23–4Porter, M. 27, 43, 99
Portes, A. 286, 313, 314, 315, 316, 319Portugal
1974 revolution and universities 208ambitious entrepreneurship 62
Portugal, P. 160Powell, W.W. 256, 257, 271Power, A. 282pre-market selection 130Preto, M.T. 209proactiveness (entrepreneurial
orientation) 260productivity paradox 262professional experience, and
entrepreneurial exit 166, 171, 176proprietorship, and entrepreneurship
341–2Purdy, D. 187Putnam, R. 24
Quadrini, V. 109Quadros de Pessoal (QP) 111, 161–2,
213
radical innovation 18, 21, 23Rafi q, M. 322railroadization 20, 22–3
North Jutland 34Rainnie, A. 312, 327Ram, M. 4, 281, 282, 283, 285, 286,
291, 312, 315, 321, 322, 325, 326, 327, 329, 330, 332, 333
Rath, J. 327, 328, 331Ray, R. 108recombinant innovation 19, 21Rees, H. 109regional innovation systems (RIS)
innovation intensity and type20–23
overview 17–19see also Jacobian cluster mutation
regional perspectives on entrepreneurship, overview 3–5
Rehn, A. 342, 343Reimer, S. 184, 185Reiss, A., Jr 330Rekers, A. 331‘related variety’ characteristics 32–3relationship skills 261repetitive collaborative relationships
255, 258
370 Index
Research in Entrepreneurship Conference (RENT XXI, Cardiff , November 2007) 3, 13
research institutions, see universities and research institutions
retirement, and entrepreneurial exit 166, 171, 176
Reynolds, P.D. 51, 59, 74, 126, 128, 131, 136
RIS (regional innovation systems)innovation intensity and type 20–23overview 17–19see also Jacobian cluster mutation
risk, small business ownership and 185–7
risk society 184–5risk-taking (entrepreneurial
orientation) 260rivalry
and new venture entry timing 81–2, 84, 87, 94–5, 97
study variable 90–91Rivkin, J.W. 99Robertson, T. 242Robinson, K.C. 83Robinson, W.T. 81, 91, 95Romanelli, E. 84Ronstadt, R. 188Roper, S. 143Rosenbaum, P. 218Rothaermel, F. 235Roure, J.B. 89Rubalcaba, L. 256Rubin, D. 218Ruiz-Mercader, J. 262, 272Rumelt, R.P. 85, 88
Salter, A. 211, 226, 236Sanders, J. 315, 326, 334Santangelo, G.D. 238, 248Santarelli, E. 53, 55, 157Santoro, M.D. 238Sargeant, M. 318Sarkar, M.B. 237Sarshar, M. 262Saxenian, A. 25, 45, 128Scarpetta, S. 126, 130Scase, R. 327, 341, 343Schall, N. 19Schartinger, D. 236
Schary, M.A. 159, 160, 164Schmitz, J.A., Jr 158, 159, 160Schoemaker, P. 87, 96Schoenecker, T.S. 81, 82, 84, 95, 96, 98Schumpeter, J.A. 18, 22–3, 49, 53Schutjens, V.A.J.M. 50, 51, 52, 54, 72Scott, J.T. 211second economy 342sectoral innovation systems 18Sepulveda, L. 313, 314, 334Servon, L.J. 285Shah, A. 109Shamsie, J. 81Shane, S. 158Shankar, V. 86Shanley, M. 81, 82, 83, 89, 97Sharp Solar 40Shepherd, D.A. 81, 82, 83, 89, 91, 95,
96, 97, 98, 140, 141, 149, 150, 151, 188
Sheppard, B.H. 139Shrader, R.C. 97shuttle trading 343Silva, O. 109Simard, C. 24Simon, M. 97simple entrepreneurial activities 339Singh, H. 159Sjöberg, C. 234Slevin, D.P. 237, 255, 257, 260small business failure
entrepreneur risk studydiscussion 200–202fi nancial exposure 191–2fi rm-level characteristics 194–6methodology 189–90owner characteristics 192–4predicting exposure 196–200profi le of respondents 190–91
literature 187–9Small, K.A. 181Smallbone, D. 286, 339, 343, 344, 347Smith, A. 347snowball sampling 318social entrepreneurs 281
interviews 298–301social inclusion 4, 11–13social security rates, and ambitious
entrepreneurship 64solar energy paint 40

Index 371
solar thermal energy clusters, North Jutland 29–32
Somali entrepreneurs in Leicesteroverview 313–14, 333–4structural context 327–31study method 317–18transnationalism 318–26urban spatial dimension 331–2
Sorenson, O. 210Southern, A. 282Southey, C. 180Spain
ambitious entrepreneurship 62innovation context 239–40planned fi nancial requirements of
early-stage entrepreneurs 132Spanos, Y.E. 88, 89, 91, 99, 104, 105Special Purpose Vehicle (SPV) 21, 46Spencer, J.W. 210Spicer, A. 282, 286, 287Stahlecker, T. 210Stanworth, J. 187Starr, J.A. 192Stephan, P.E. 210Sternberg, R. 51Stevenson, L. 55Steyaert, C. 286Stoerring, D. 29, 32, 43Stokes, D. 189Storey, D.J. 126, 135, 139, 187, 201,
254, 316strategic collaborative relationships
255, 258Stuart, T.E. 210, 257‘stuck without contacts’ cluster 270–71Suárez, F.Y. 85SugarGrass 35–6Summit 36Sundbo, J. 238superdiversity 313, 333supplier collaboration, as motivation
for networking 259sustaining innovation 19, 21Swann, P. 208, 210Sweden, ambitious entrepreneurship
62symbolic violence 285–6
Taalas, S. 342, 343Tamásy, C. 51
Taylor, A. 86Taylor, M.P. 110, 157, 159, 160Teece, D.J. 82, 85, 96, 99, 234, 235Tellis, G.J. 82, 83, 90Teng, B. 231Terziosvki, M. 233Tether, B.S. 232, 234, 235, 236, 238,
240, 241, 244, 247, 250Teubal, M. 25Third Italy regions 21Thomas, A. 127Thomas, L.A. 95, 98Thornhill, S. 56, 57, 238Thurik, A.R. 50, 54, 55, 178Tödtling, F. 53Tolbert, C.M. 282, 286Townsend, P. 307TPB (theory of planned behaviour)
139–40, 150TRA (theory of reasoned action)
139–40, 150transition context 340
and petty trading 347transnational economic networks
314–17transnationalism 313Tsai, W. 89Tsang, E. 234, 235, 241Tushman, M. 85
U&RI, see universities and research institutions
UKenterprise policy and deprived areas
281–5, 291–4, 306–7see also Somali entrepreneurs in
LeicesterUkraine, see petty trading, studyunderpaid labour 329universities and research institutions
(U&RI)and corporate entrepreneurship
innovation strategy and cooperation 235–7
literature 233–9overview 231–3, 247–9reasons for cooperation 233–5study context 239–40study methodology 240–42study results 242–7

372 Index
technology intensity and R&D cooperation 237–9
as knowledge sources 210–12and new fi rm location
hypothesis formulation 212–13literature 209–10overview 225–6study empirical analysis 217–25study methodology 213–17
and new knowledge-based fi rms 207–9
unpaid labour 325–6
Valenzuela, P. 110Van Auken, H. 187, 188Van Kempen, R. 331Van Ophem, H. 177Van Praag, C. Mirjam 49, 158, 160,
177, 187, 344, 357Varga, A. 208, 211Västerbotten County, Sweden 141VAT registration, and fi nancial
exposure 194Venkatraman, N. 90, 99, 104, 256, 262,
270Vertovec, S. 313, 315, 317, 319, 333Vesper, K. 128Virdee, S. 316, 327Vivarelli, M. 53, 55, 56, 157Vonortas, N.S. 238
Wagner, M. 122Wahba, S. 218, 219Waldfogel, J. 109Waldinger, R. 327Waldman, M. 119Wales
biofuels and related agro-biotechnology platform 34–42
Jacobian clusters 22, 25Wallace, C. 343Walter, A. 255, 256, 259, 260, 261,
265Wanzenböck, H. 53Ward, J.M. 262Warshaw, P.R. 150Wasilczuk, J. 339
Watson, J. 159, 186Watson, M. 316Weiss, G. 288Wellisz, S. 177Welsch, H. 53, 57Welter, F. 307, 339, 343, 344, 347Wennberg, K. 160Wennekers, A.R.M. 49, 50, 55Wenting, R. 45Werbner, P. 312, 326West, J. 24Westerberg, M. 255, 258, 263, 265Westhead, P. 158, 180Wever, E. 50, 52Whitley, R. 20Wiklund, J. 51, 57, 58, 139, 140, 141,
149, 150, 151, 160, 188, 255, 257, 260
Williams, C.C. 286, 326, 343, 344, 347, 349, 354, 357, 358
Williams, M.L. 81, 84, 91, 95, 98Williamson, O.E. 233Winborg, J. 129wind-turbine technology, North
Jutland 29, 43Winter, S.G. 83wireless communications cluster,
Aalborg, Denmark 22, 32Wodak, R. 288Wong, C. 283Wong, P.K. 50, 51Wright, M. 158, 180Wrigley, N.159
Ylinenpää, H. 255Yolande, E.C. 140Yoon, E. 91Young, B. 188
Zacharakis, A.L. 188Zafi rovski, M. 286Zaheer, A. 89Zahra, S.A. 84, 86, 89, 95, 97, 98, 99,
231, 237Zhou, M. 333Ziedonis, A.A. 180Zucker, L. 210