endline report – india, rgvn mfs ii country evaluations
TRANSCRIPT
Endline report – India, RGVN MFS II country evaluations
Capacity of Southern Partner Organisations (5C) component
Cecile Kusters1
Bibhu Prasad Mohapatra2
Sonam Sethi2
Nicky Buizer1
Anand Das2
Robert Wilson Bhatra2
Paroma Sen2
1 Centre for Development Innovation, Wageningen UR
2 India Development Foundation
Centre for Development Innovation
Wageningen, January 2015
Report CDI-15-021
Kusters, C., Mohapatra, B.P., Sethi, S., Buizer, N.N., Das, A., Bhatra R. W., Sen P., 2014. Endline
report – India, RGVN Foundation. MFS II country evaluations; Capacity of Southern Partner
Organisations (5C) component. Centre for Development Innovation, Wageningen University &
Research centre. Report CDI-15-021. Wageningen.
This report presents the findings of the endline of the evaluation of the organisational capacity
component of the MFS II country evaluations. The focus of this report is India, RGVN. The format is
based on the requirements by the synthesis team and NWO/WOTRO. The endline was carried out in
2014. The baseline workshop was carried out in 2012 (interview with director in 2013).
Key words: 5C (five core capabilities); attribution; baseline; causal map; change; CFA (Co-financing
Organisation) endline; organisational capacity development; SPO (Southern Partner Organisation).
© 2015 Centre for Development Innovation, part of the Dienst Landbouwkundig Onderzoek
foundation. P.O. Box 88, 6700 AB Wageningen, The Netherlands. T + 31 (0)317 48 68 00,
E [email protected], www.wageningenUR.nl/cdi.
The Centre for Development Innovation uses a Creative Commons Attribution 3.0 (Netherlands)
licence for its reports.
The user may copy, distribute and transmit the work and create derivative works. Third-party material
that has been used in the work and to which intellectual property rights apply may not be used
without prior permission of the third party concerned. The user must specify the name as stated by
the author or licence holder of the work, but not in such a way as to give the impression that the work
of the user or the way in which the work has been used are being endorsed. The user may not use this
work for commercial purposes.
The Centre for Development Innovation accepts no liability for any damage arising from the use of the
results of this research or the application of the recommendations.
Report CDI-15-021 |
Contents
Acknowledgements 5
List of abbreviations and acronyms 6
1 Introduction & summary 7
1.1 Purpose and outline of the report 7 1.2 Brief summary of analysis and findings 8
2 General Information about the SPO – RGVN 9
2.1 General information about the Southern Partner Organisation (SPO) 9 2.2 The socio-economic, cultural and political context in which the partner operates 9 2.3 Contracting details 11 2.4 Background to the Southern Partner Organisation 11
3 Methodological approach and reflection 15
3.1 Overall methodological approach and reflection 15 3.2 Assessing changes in organisational capacity and reasons for change - evaluation
question 1 and 4 16 3.3 Attributing changes in organisational capacity - evaluation question 2 and 4 18
3.3.1 Selection of SPOs for 5C process tracing 18 3.3.2 Key steps in process tracing for the 5C study 18 3.3.3 Methodological reflection 19
4 Results 23
4.1 MFS II supported capacity development interventions 23 4.2 Changes in capacity and reasons for change - evaluation question 1 and 4 24
4.2.1 Changes in the five core capabilities 24 4.2.2 General changes in the organisational capacity of the SPO 29
5 Discussion and conclusion 37
5.1 Methodological issues 37 5.2 Changes in organisational capacity 38
List of Respondents 42
Methodological approach & reflection 43 Appendix 1
Background information on the five core capabilities framework 68 Appendix 2
Changes in organisational capacity of the SPO - 5C indicators 70 Appendix 3
Results - key changes in organisational capacity - general causal map 86 Appendix 4

Report CDI-15-021 | 5
Acknowledgements
We are grateful to all the people that have contributed to this report. We particularly would like to
thank the Southern Partner Organisation Rashtriya Gramin Vikas Nidhi (RGVN) and the Co-Financing
Agency Hivos for their endless patience and support during this challenging task of collecting the
endline data. We hope that this endline report will provide useful insights to RGVN, Hivos, the
synthesis team, IOB and NWO/Wotro.
The India 5C evaluation team
6 | Report CDI-15-021
List of abbreviations and acronyms
5 C Capacity development model which focuses on 5 core capabilities
BRLF Bharat Rural Livelihoods Foundation
Causal map Map with cause-effect relationships. See also ‘detailed causal map’.
Causal mechanisms The combination of parts that ultimately explains an outcome. Each part of
the mechanism is an individually insufficient but necessary factor in a whole
mechanism, which together produce the outcome
CDI Centre for Development Innovation, Wageningen UR
CFA Co-Financing Agency
CPSE Central Public Sector Enterprise
CSR Corporate Social Responsibility
CU Concern Universal
Detailed causal map Also ‘model of change’. the representation of all possible explanations –
causal pathways for a change/ outcome. These pathways are that of the
intervention, rival pathways and pathways that combine parts of the
intervention pathway with that of others. This also depicts the reciprocity of
various events influencing each other and impacting the overall change. In
the 5C evaluation identified key organisational capacity changes and
underlying reasons for change (causal mechanisms) are traced through
process tracing (for attribution question).
EU European Union
General causal map Causal map with key organisational capacity changes and underlying reasons
for change (causal mechanisms), based on SPO perception.
HR Human Resources
IDF India Development Foundation
IFHD India Foundation for Humanistic Development
IIMP Invest India Micro Pension
JTT Jamsedji Tata Trust, Mumbai
L&T Larsen & Toubro
M&E Monitoring and Evaluation
MF Microfinance
MFS Dutch co-financing system
MGNREGA Mahatma Gandhi National Rural Employment Guarantee Act
MIS Management Information System
NCSRHET National Corporate Social Responsibility Hub Empanelment team
NGO Non-Governmental Organisation.
NTFP Non-Timber Forest Produce
OD Organisational Development
PME Planning, Monitoring and Evaluation
ProCIF Producer Entrepreneurship Catalyst and Incubation Facility
Process tracing Theory-based approach to trace causal mechanisms
PSU Public Sector Unit
RGVN Rashtriya Gramin Vikas Nidhi
RTE Right to Education
RTI Right to Information
SDTT Sir Dorabji Tata Trust
SHG Self Help Group
SIDBI Small Industrial Development Bank of India
SLEEP Sustainable Livelihood Enhancement and Enterprise Promotion
SPO Southern Partner Organisation
SRI System of Rice Intensification
ToC Theory of Change
Wageningen UR Wageningen University & Research centre
Report CDI-15-021 | 7
1 Introduction & summary
1.1 Purpose and outline of the report
The Netherlands has a long tradition of public support for civil bi-lateral development cooperation,
going back to the 1960s. The Co-Financing System (Medefinancieringsstelsel, or ‘MFS’) is its most
recent expression. MFS II is the 2011-2015 grant framework for Co-Financing Agencies (CFAs), which
is directed at achieving a sustainable reduction in poverty. A total of 20 consortia of Dutch CFAs have
been awarded €1.9 billion in MFS II grants by the Dutch Ministry of Foreign Affairs (MoFA).
The overall aim of MFS II is to help strengthen civil society in the South as a building block for
structural poverty reduction. CFAs receiving MFS II funding work through strategic partnerships with
Southern Partner Organisations.
The MFS II framework stipulates that each consortium is required to carry out independent external
evaluations to be able to make valid, evaluative statements about the effective use of the available
funding. On behalf of Dutch consortia receiving MFS II funding, NWO-WOTRO has issued three calls for
proposals. Call deals with joint MFS II evaluations of development interventions at country level.
Evaluations must comprise a baseline assessment in 2012 and a follow-up assessment in 2014 and
should be arranged according to three categories of priority result areas as defined by MoFA:
Achievement of Millennium Development Goals (MDGs) & themes;
Capacity development of Southern partner organisations (SPO) (5 c study);
Efforts to strengthen civil society.
This report focuses on the assessment of capacity development of southern partner organisations. This
evaluation of the organisational capacity development of the SPOs is organised around four key
evaluation questions:
1. What are the changes in partner organisations' capacity during the 2012-2014 period?
2. To what degree are the changes identified in partner capacity attributable to development
interventions undertaken by the MFS II consortia (i.e. measuring effectiveness)?
3. Were the efforts of the MFS II consortia efficient?
4. What factors explain the findings drawn from the questions above?
The purpose of this report is to provide endline information on one of the SPOs involved in the
evaluation: RGVN in India. The baseline report is described in a separate document.
Chapter 2 describes general information about the Southern Partner Organisation (SPO). Here you can
find general information about the SPO, the context in which the SPO operates, contracting details and
background to the SPO. In chapter 3 a brief overview of the methodological approach is described.
You can find a more detailed description of the methodological approach in appendix 1.Chapter 4
describes the results of the 5c endline study. It provides an overview of capacity development
interventions of the SPO that have been supported by MFS II. It also describes what changes in
organisational capacity have taken place since the baseline and why (evaluation question is 1 and 4).
This is described as a summary of the indicators per capability as well as a general causal map that
provides an overview of the key organisational capacity changes since the baseline, as experienced by
the SPO. The complete overview of descriptions per indicator, and how these have changed since the
baseline is described in appendix 3. The complete visual and narrative for the key organisational
capacity changes that have taken place since the baseline according to the SPO staff present at the
endline workshop is presented in appendix 4.
8 | Report CDI-15-021
Chapter 5 presents a discussion on the findings and methodology and a conclusion on the different
evaluation questions.
The overall methodology for the endline study of capacity of southern partner organisations is
coordinated between the 8 countries: Bangladesh (Centre for Development Studies, University of
Bath; INTRAC); DRC (Disaster Studies, Wageningen UR); Ethiopia (CDI, Wageningen UR); India (CDI,
Wageningen UR: Indonesia (CDI, Wageningen UR); Liberia (CDI, Wageningen UR); Pakistan (IDS;
MetaMeta); Uganda (ETC). Specific methodological variations to the approach carried out per country
where CDI is involved are also described in this document.
This report is sent to the Co-Financing Agency (CFA) and the Southern Partner Organisation (SPO) for
correcting factual errors and for final validation of the report.
1.2 Brief summary of analysis and findings
Over the last two years, RGVN has seen no change in its overall capability to act and commit. The
main improvements were the daily operations, staff skills, trainings and RGVN’s proposal writing
capacity. There was however a slight deterioration in staff incentives and RGVN’s funding situation. In
the overall capability to adapt and self-renew RGVN also showed no change, though management
became more responsive to critical reflection and there was a very slight improvement in M&E
application. In terms of the overall capability to deliver on development objectives, there has been no
change. RGVN has only improved very slightly in balancing quality and efficiency. In the overall
capability to relate there was again no change. RGVN very slightly improved its relations with
government departments and the private sector. Finally, RGVN showed no change in the overall
capability to achieve coherence but has revisited their strategies which are still in line with their vision
and mission.
The evaluators considered it important to also note down the SPO’s perspectives on the most
important changes in in the organisation since the baseline. During the endline workshop the key
organisational capacity changes that were brought up by RGVN’s staff were: improved staff capacity to
train partners on technology and other issues; and improved relationships with networks. According to
RGVN their capacity in training their partners improved partly because of the field experience that
they gained and trainings and exposure visits they went on that were funded by Hivos (MFS II), SIDBI
and SDTT. RGVN staff got more access to trainings and visits because of gap identification and a
change in the strategic plan which required staff to develop new skills. The gaps were identified as a
result of fortnightly meetings and strengthened M&E because of donor (Hivos) requirements. RGVN
improved its relationships with the government, market, PSUs and private sector. The relations with
the government improved because of the new programmes RGVN is involved in and because of some
trainings of government department that they attended. The linkages with the market improved
because of new programmes and trainings by Hivos, SDTT and SIDBI. The relations with PSUs and the
private sector improved because of new programmes and RGVN obtaining a CSR eligibility certificate.
RGVN improved its network with government, market, PSUs and the private sector also because of
working on new programmes that fitted their new sustainable livelihood strategic focus of RGVN,
which was triggered by floods, the Phailin cyclone, the microfinance crisis and the changes in donor’s
priorities (from microfinance to agriculture/livelihoods). According to RGVN, MFS II funded capacity
development interventions have played a role in the key organisational capacity changes, particularly
in terms of improving their staff capacity to train partners on technology and other issues and
improved linkages with the market.
Report CDI-15-021 | 9
2 General Information about the SPO –
RGVN
2.1 General information about the Southern Partner
Organisation (SPO)
Country India
Consortium People Unlimited
Responsible Dutch NGO Hivos
Project (if applicable) Graduating NGOs in Micro Finance Institutions (MFIs) in the state of Odisha
Sustainable livelihood enhancement and enterprise promotion (SLEEP)
Southern partner organisation Rashtriya Gramin Vikas Nidhi (RGVN)
The project/partner is part of the sample for the following evaluation component(s):
2.2 The socio-economic, cultural and political context in
which the partner operates
Rastriya Gramya Vikas Nidhi (RGVN) was established and registered in 1990 with its headquarters at
Guwahati (North-East India). In 1992 the operational area was extended and RGVN regional unit
Bhubaneswar was established with the aim to create sustainable livelihoods for rural poor where
women are given priority. At the first hand, RGVN had tried to address the credit (in the form of soft
loans) and basic capacity building (in the form of grants) needs of the rural family to ensure
sustainable livelihood for them. On the other hand to make this process more effective and
sustainable, RGVN had tried to deliver its support (both loan and grant) through local grassroots level
civil societies (CBOs/ NGOs). This process of support not only addresses the livelihood issues of poor
people but also provides adequate scope for local fledging initiatives/NGOs to be nurtured and
strengthened under the ambit of RGVN’S support. RGVN Bhubaneswar operates in the tribal
dominated regions of western Odisha, southern Odisha, northern Odisha and selective coastal plain
areas of Odisha and six coastal districts of Andhra Pradesh. RGVN received MFS II funding for
graduating NGOs in Microfinance institutions programme which was stopped in mid-2012 due to the
microfinance crisis. Then the focus was shifted to Sustainable Livelihood Enhancement and Enterprise
Promotion programme funded by MFS II.
The tribal population in the state of Odisha is 22.1 percent of the total population as per the Ministry
of Tribal Affairs Annual Report 2013-2013. As per the report of 2013-20141 of the Directorate of
Economics and Statistics Odisha, the percentage share of agriculture in total Gross Domestic Product
at current prices is 19.61 percent and its annual growth for that year is 12.35 percent. Agriculture
along with animal husbandry contributes 12.74 percent in total GSDP during the year 2013-2014.
Livelihood of the tribal regions is dependent on Non-Timber Forest Produce (NTFP) also known as
minor forest produce. The Tribal economy is mainly dependent on subsistence agriculture with forest
1 http://www.odisha.gov.in/pc/Download/Economic_Survey_2013-14.pdf
Achievement of MDGs and themes X
Capacity development of Southern partner organisations X
Efforts to strengthen civil society
10 | Report CDI-15-021
forming an essential part of their livelihood.2 As per the Government Estimates, a total of 100 million
forest dwellers are dependent on Minor Forest Produce (MFP) for food, shelter, medicines, cash income
etc. Despite being rich in NTFP products there has been gross underutilization of NTFP products which
has adversely affected livelihood of the region for the poor forest dwellers. Lack of information, skill
and opportunity for the tribals also makes underutilisation of NTFP products for livelihood. Poverty is
further increased due to low social status of women, who comprise a substantial section working in
collection of NTFP products. Forest and forest products contribute significantly to the state’s economy.
As part of Odisha government’s Forestry Vision,2020, The State Forest and Environment Department
finalized its strategies to focus on: increased flow of Non-Timber Forest Produce NTFPs and wood,
biodiversity conversations and strategies and higher allocations, investment, insurance and incentives
for better forest management.
The main source of income of the people is agriculture and allied activities. Low production is further
influenced by increasing cost of cultivation due to use of fertilizers, pesticides provided by private
suppliers. As most of the farmers are poor and in order to sustain their livelihoods there is dependence
on informal lending leading to moneylenders demanding exorbitant interest rates from the farmers.
Cultivation is also affected by the natural calamities in the region especially cyclones (e.g. Phailin
2013) and flood (e.g. 2011 & 2014).
Microfinance institutions were a help for the small/poor farmers to receive loans/credits to sustain and
promote their livelihood. In this regard the formal financial institutions / banks have had a remarkable
contribution to bring the rural poor under the benefit of small financial services (only small credit)
through SHG bank linkage program. However, SHGs/Cooperatives faced the MFI (Micro-Finance
Institution) crisis due to over lending, irregularities in the operation of the cooperatives etc. Due to a
sharp fall in the repayment and the MFI crisis formal financial institutions/banks stopped
lending/funding SHGs/Cooperatives.
In 2013, the state government of Odisha addressed the MFI crisis by promulgating the Odisha Self-
Help Co-operatives Ordinance 2013 by repealing the Odisha Self-Help Cooperatives Act 2001, and by
bringing all the cooperatives under the original 1962 Act. This was done in order to regulate all non-
banking financial companies, including the co-operative credit societies operating under the Orissa
Self-Help Co-operative Act, 2001. It was identified that there had been irregularities in the operation
of the cooperatives and misappropriation of depositors’ money. With the repeal of the 2001 Act, the
government increased its control over these co-operative credit societies and curbed their independent
functioning. For example, the business transactions of these societies would be regularly audited
either by a panel of independent auditors or by government auditors. After such an audit these
societies would amend their laws and report to the Registrar of Cooperative Societies within three
months. When such a society failed to elect its board members every five years, the Board of Directors
of such a cooperative credit society is dissolved. In this case the management of the cooperative
society is vested in the Registrar of Cooperative Societies, who can then make changes in the
organisation as per the provisions of the Odisha Cooperative Societies Act, 1962.
In this situation RGVN plays a vital role in creating livelihood opportunities, particularly for women and
their skill development, formation of producer groups, strengthening market linkages and supporting
the marginalized access to government schemes. Government’s new regulation to bring all the
cooperatives and SHGs management under its control will further strengthen RGVN’s effort to help
poor and marginalized people to be uplift socially and economically.
2 http://tribal.nic.in/WriteReadData/CMS/Documents/201410170519295222004StatisticalProfileofSTs2013.pdf
Report CDI-15-021 | 11
2.3 Contracting details
When did cooperation with this partner start: 2000
What is the MFS II contracting period: 2011-2015
• Graduating NGOs into Micro Finance Institutions in the state of Odisha – Phase II: 1 July 2009 till 30
June 2012 (under MFS II from 1 January 2011 – 30 June 2012).
• Sustainable livelihood enhancement and enterprise promotion (SLEEP) in Odisha: 1 July 2012 till 30
June 2015.
Did cooperation with this partner end? No
If yes, when did it finish? NA
What is the reason for ending the cooperation with this partner: NA
Is there any expected collaboration after 30 June 2015? Further collaboration is not foreseen after the
end date of the current contract that runs until 30 June 2015. This in relation to the changes in the
nature of Hivos’ work due to the reduced funding from the Dutch Ministry of Foreign Affairs. It could
be that Hivos will work with RGVN in the future if the work of this partner fits well within a new
programme or project of Hivos.
2.4 Background to the Southern Partner Organisation
History
Rashtriya Gramin Vikas Nidhi (RGVN) Bhubaneswar works in Odisha and two districts of Andhra
Pradesh (Srikakulam and Vizianagaram) to improve the economic and social status of the poor and
underprivileged rural and urban people through sustainable livelihood, skill development and
graduating individual groups into entrepreneurship.
In 1988, Mr. S.N. Paliya, the executive director of IDBI bank, got together with like-minded people like
Laxmi Chand Jain (Indian Ambassador to South Africa, respected Gandhian thinker and later member
of the Planning Commission of India), Deep Joshi (credited for bringing professionalism to the NGO
sector in India, winner of Magsaysay award for Community Leadership 2009, and co-Founder of
Pradan, a network of MFI organisations),and Brij Mohan (Head of SIDBI).They wanted to establish an
organisation that would strengthen grass roots level organisations and help them grow and focus on
the poor to provide them with a regular source of income. They decided to choose those organisations
that had the intention of helping the poor irrespective of their legal registration status. Trust was the
only collateral they were looking for. They wanted to prove that the poor were credit worthy. Their
priority was north- eastern states and tribal areas of India.
In 1990, RGVN was established and registered under the Society’s Registration Act of 1860 with its
headquarters in Guwahati. In 1992 operations were extended by establishing regional branches in
Bihar, Odisha and Andhra Pradesh. The objective was to support emergent organisations and
encourage income generation activities of the poor. Loans were given at 6% rate of interest with
reducing balance.3 The idea of providing loans on a returnable basis was to ensure and enable
ownership. RGVN pioneered this concept at a time when people were accustomed to a culture of
subsidies and grants. RGVN wanted to prove that the poor were credit worthy. They offered both
returnable and non-returnable grants depending upon the need of the organisation.
In 1992 there was a debate in the development sector regarding the grant based and credit based
development process in India. RGVN decided to experiment with community based organisations
which were not officially registered and yet were trusted by the community, in Sambalpur, Odisha,
and Kanker in Chhattisgarh (5 unregistered groups).
3 Method of calculating the interest amount on the principal balance (and not on the original loan amount) that reduces with
repayment of each loan instalment.
12 | Report CDI-15-021
Between 1992 and 1997, the strategy of RGVN was not so much to recover the money given, but to
reach the unreached people who had no alternative source of livelihood. Many times money was lost
and not spent on what it was intended for as NGOs and the borrowers did not understand properly the
dynamics of subsidy and credit.
In 1997-98 RGVN experimented with a model which would develop collaboration rather than
competition among NGOs and for two consecutive years the network of 5 NGOs worked and it failed in
the third year. The other experiment was creating a network with joint responsibilities in Baleshwar
district of Odisha with a mandate for joint management of credit and recovery. Selected NGOs within a
minimum distance of 30 km and maximum of 60 km were chosen for this experiment and similar
types of organisations were brought together under one network. One NGO appraised the other,
setting up a system of mutual accountability. Such groups have been operating since the past 15
years. They apply for funds together from the government and international donors. In one such joint
management program out of 5 NGOs one defaulted but the other 4 NGOs took on the responsibility of
recovering loans that the defaulting organisation had disbursed.
Between 1997 and 2003, RGVN tried to find people with traditional sources of income which can be
enhanced, and identify people with no access to bank loans. The strategy was to channel money in
such a way that changes were visible in the lives of the clients in a short period of time. It becomes
evident that RGVN wanted to expand during this period, as RGVN was convinced of the fact that the
poor are not necessarily unworthy of credit. This phase of RGVN also saw major setbacks in terms of
accountability within the organisation and transparency within the networks established till then. In
2003-2004 RGVN had created an inventory of dedicated NGOs and now the focus was to mobilise
more funds to move from a loan range of 30,000-60,000 to 4-5 lakhs INR. In 1999, RGVN
rehabilitated 500 victim families who lost their houses & livelihoods during the super cyclone which
struck Odisha.
In 2005-2006, RGVN adopted the strategy of mentoring NGOs. Organisations with specific capabilities
were hired and RGVN partners were systematically trained in delinquency management, risk
mitigation and program strategies. In 2005, RGVN turned its Credit and Savings Programme in Odisha
into a cooperative, named Utkal Mahila Swayam Sahayak Sammabaya Ltd. (UMaSS), and located in
Ganjam district, Odisha. UMaSS was established and registered as a state level cooperative under the
Odisha Self Help Cooperative Act. 2001. In 2006 the concept of microfinance and microcredit came to
be accepted as a mode of cushioning poverty in India. Microfinance organisations like SKSS, Society
for Action in Disability and Health (SADHAN) and BASIX came up, and poached employees of
established organisations of the grass roots by paying higher salaries. Also they encroached upon the
customer base by providing them higher loans and insurance packages.
Currently, RGVN gives loan at 15% to its partners, which in turn gives a loan at 24% interest to the
SHGs. Over a period of time, partners have become long standing partners of RGVN, which has
resulted in quicker and smoother disbursements. Earlier partners took 15 days to disburse 4-5 lakhs
but now 40 lakhs are distributed within two days. This means that RGVN has been able to withstand
the blow and its partners have survived by diversifying their activities.
In 2009 RGVN received MFS I fund from Hivos for the project “Graduating NGOs in to MF Institutions”.
Under this project it had outlined and piloted an action plan of institution building where four
grassroots level NGOs in Odisha were selected to be graduated in to micro Finance institutions.
In 2009, MICROSAVE conducted a training program on “Strategic Business Planning for Market led
Financial Institutions” for RGVN executives. In 2010 RGVN Credit and Savings programme got the
legal status of Non-banking Financial Company (NBFC) named RGVN (NE) Micro Finance Ltd.
During 2009 - 2010 while MFI was slowly gaining ground, the sudden crisis in the microfinance sector
such as non-availability of funds for disbursement and sharp fall of repayment affected its operation.
Due to this crisis the organisation went through a rough patch and flood in 2011 in the organisation’s
partner areas further worsened the situation. The partners’ ability to recover loans meted out and pay
back to RGVN was questionable in the face of such large scale disaster. The organization was not able
to recuperate fully from the Microfinance crisis in 2009 and the floods in 2011.
In the 2011 board meeting there was a lot of debate on whether RGVN should give money that makes
more money or if they should stick to their original goal of income cushioning for the poor. The MFS II
Report CDI-15-021 | 13
funding for graduating NGOs in MFIs stopped in mid-2012. During this time RGVN Bhubaneswar
shifted its focus from microfinance to sustainable livelihood enhancement of the target group.
However, at this time this strategy was in a nascent stage. It received funds from Jamsedji Tata Trust
to promote sustainable rural livelihoods in sub sectors like- Goatery, Bamboo work, vermicomposting,
organic farming (vegetable & paddy farming through System of Rice Intensification (SRI) technology)
and cycle rickshaw/trolley at the house hold level.
After the MFS II 5c baseline in August 2012 the executive board of RGVN decided to restrict external
borrowings from banks and other financial institutions anticipating the inability of the partner
organisations to repay RGVN. This compelled the organisation to think of converging and linking their
projects and programmes with government programmes, the market, Public Sector Units (PSUs) and
the private sector to enhance the livelihood security of the target groups.
During this period (after baseline in August 2012) RGVN initiated and funded “Bazaar on Wheels”, a
new project to strengthen producer organizations and their access to market. The project focuses
especially on access to market for the women producer groups. In the post Phailin (October 2013)
period RGVN in association with ACC Limited (formerly The Associated Cement Companies Limited)
supports and rehabilitates the Phailin and flood affected people of Odisha. Also in collaboration with
Larsen & Toubro (L&T), RGVN has taken up the project in the post Phailin period to provide placement
to the semi-skilled Phailin and Flood effected people.
Vision [Source: Startegy_Minutes]
Creating an enabling environment where the poor and underprivileged can ensure sustainable
livelihood with dignity.
Mission [Source: Startegy_Minutes]
To improve the economic and social status of the poor and underprivileged rural and urban people
through combining Economic and Social intervention.
Objectives and strategies [Source: Startegy_Minutes, Proposal-_HIVOS_by__RGVN-revised.doc]
In order to achieve its mission RGVN’s objectives are to:
To create enabling environment for food security of rural and urban poor, physically and
socio-economically handicapped people;
To focus on the core livelihood sub sectors mainly NTFP, Agriculture and Allied agriculture,
Dairy, Handicraft etc.
Focus attention on people which are disadvantageously placed in society, but have the
potential for pursuing socially and economically productive activities;
Assist the rural and urban poor especially tribal, scheduled caste, women, physically handicap
for economic improvement
To build the internal capacity of the NGOs/COOPs/Federations/SHGs through capacity building
and skill development trainings
To build measures for gradually moving towards social and financial sustainability in a
predefined period
RGVN in its endeavour towards achieving its goals works with NGOs/CBOs by providing them with
financial, technical and management support.
To achieve the objectives RGVN has the following strategies:
Livelihood:
Create food security through various livelihood sub sector intervention focusing on NTFP, Agriculture
and Allied, Dairy, Handicraft etc. Inculcating community mobilization skills among women in
agriculture, NTFP and Bell Metal thereby demonstrating and articulating the benefits of the sustainable
livelihood methods to them. Facilitate access to fair and remunerative markets including linking
producer groups to marketing opportunities.
14 | Report CDI-15-021
Micro Enterprise Promotion:
Promotion of various livelihood development clusters and graduating those clusters in to Micro
Enterprise. The model is graduating individuals (women) to SHGs to Producer federation to Producer
Company/Cooperative through entrepreneurship development.
Capacity building and Skill Development:
Capacity building of SHGs and skill up-gradation through handholding, formal and vocational courses
will be emphasized.
Report CDI-15-021 | 15
3 Methodological approach and
reflection
3.1 Overall methodological approach and reflection
This chapter describes the methodological design and challenges for the assessment of capacity
development of Southern Partner Organisations (SPOs), also called the ‘5C study’. This 5C study is
organised around four key evaluation questions:
1. What are the changes in partner organisations’ capacity during the 2012-2014 period?
2. To what degree are the changes identified in partner capacity attributable to development
interventions undertaken by the MFS II consortia (i.e. measuring effectiveness)?
3. Were the efforts of the MFS II consortia efficient?
4. What factors explain the findings drawn from the questions above?
It has been agreed that the question (3) around efficiency cannot be addressed for this 5C study. The
methodological approach for the other three questions is described below. At the end, a
methodological reflection is provided.
Note: this methodological approach is applied to 4 countries that the Centre for Development
Innovation, Wageningen University and Research centre is involved in in terms of the 5C study
(Ethiopia, India, Indonesia, Liberia). The overall approach has been agreed with all the 8 countries
selected for this MFS II evaluation. The 5C country teams have been trained and coached on this
methodological approach during the evaluation process. Details specific to the SPO are described in
chapter 5.1 of the SPO report A detailed overview of the approach is described in appendix 1.
The first (changes in organisational capacity) and the fourth evaluation question are addressed
together through:
Changes in the 5C indicators since the baseline: standard indicators have been agreed upon for
each of the five capabilities of the five capabilities framework (see appendix 2) and changes between
the baseline, and the endline situation have been described. For data collection a mix of data
collection methods has been used, including self-assessments by SPO staff; interviews with SPO
staff and externals; document review; observation. For data analysis, the Nvivo software program
for qualitative data analysis has been used. Final descriptions per indicator and per capability with
corresponding scores have been provided.
Key organisational capacity changes – ‘general causal map’: during the endline workshop a
brainstorm has been facilitated to generate the key organisational capacity changes as perceived by
the SPO since the baseline, with related underlying causes. For this purpose, a visual as well as a
narrative causal map have been described.
In terms of the attribution question (2 and 4), ‘process tracing’ is used. This is a theory-based
approach that has been applied to a selected number of SPOs since it is a very intensive and costly
methodology, although it provides rich information and can generate a lot of learning within the
organisations. This approach was presented and agreed-upon during the synthesis workshop on 17-18
June 2013 by the 5C teams for the eight countries of the MFS II evaluation. A more detailed
description of the approach was presented during the synthesis workshop in February 2014. The
synthesis team, NWO-WOTRO, the country project leaders and the MFS II organisations present at the
workshop have accepted this approach. It was agreed that this approach can only be used for a
selected number of SPOs since it is a very intensive and costly methodology. Key organisational
capacity changes/ outcomes of the SPO were identified, based on their relationship to the two selected
capabilities, the capability to act and commit the capability to adapt and self-renew, and an expected
relationship with CFA supported capacity development interventions (MFS II funding). It was agreed to
16 | Report CDI-15-021
focus on these two capabilities, since these are the most targeted capabilities by the CFAs, as
established during the baseline process.
Please find below an explanation of how the above-mentioned evaluation questions have been
addressed in the 5C evaluation.
At the end of this appendix a brief methodological reflection is provided.
3.2 Assessing changes in organisational capacity and
reasons for change - evaluation question 1 and 4
This section describes the data collection and analysis methodology for answering the first evaluation
question: What are the changes in partner organisations’ capacity during the 2012-2014
period? And the fourth evaluation question: “What factors explain the findings drawn from the
questions above?”
In order to explain the changes in organisational capacity development between baseline and endline
(evaluation question 1) the CDI and in-country evaluation teams needed to review the indicators and
how they have changed between baseline and endline and what reasons have been provided for this.
This is explained below. It has been difficult to find detailed explanations for changes in each of the
separate 5c indicators, but the ’general causal map’ has provided some ideas about some of the key
underlying factors actors and interventions that influence the key organisational capacity changes, as
perceived by the SPO staff.
The evaluators considered it important to also note down a consolidated SPO story and this would also
provide more information about what the SPO considered to be important in terms of organisational
capacity changes since the baseline and how they perceived these key changes to have come about.
Whilst this information has not been validated with sources other than SPO staff, it was considered
important to understand how the SPOs has perceived changes in the organisation since the baseline.
For those SPOs that are selected for process tracing (evaluation question 2), more in-depth
information is provided for the identified key organisational capacity changes and how MFS II
supported capacity development interventions as well as other actors, factors and interventions have
influenced these changes. This is integrated in the next session on the evaluation question on
attribution, as described below and in the appendix 1.
How information was collected and analysed for addressing evaluation question 1 and 4, in terms of
description of changes in indicators per capability as well as in terms of the general causal map,
based on key organisational capacity changes as perceived by the SPO staff, is further described
below.
During the baseline in 2012 information has been collected on each of the 33 agreed upon indicators
for organisational capacity. For each of the five capabilities of the 5C framework indicators have been
developed as can be seen in Appendix 2. During this 5C baseline, a summary description has been
provided for each of these indicators, based on document review and the information provided by
staff, the Co-financing Agency (CFA) and other external stakeholders. Also a summary description has
been provided for each capability. The results of these can be read in the baseline reports.
The description of indicators for the baseline in 2012 served as the basis for comparison during the
endline in 2014. In practice this meant that largely the same categories of respondents (preferably the
same respondents as during the baseline) were requested to review the descriptions per indicator and
indicate whether and how the endline situation (2014) is different from the described situation in
20124.
4 The same categories were used as during the baseline (except beneficiaries, other funders): staff categories including
management, programme staff, project staff, monitoring and evaluation staff, field staff, administration staff; stakeholder
categories including co-financing agency (CFA), consultants, partners.
Report CDI-15-021 | 17
Per indicator they could indicate whether there was an improvement or deterioration or no change and
also describe these changes. Furthermore, per indicator the interviewee could indicate what
interventions, actors and other factors explain this change compared to the baseline situation. See
below the specific questions that are asked for each of the indicators. Per category of interviewees
there is a different list of indicators to be looked at. For example, staff members were presented with
a list of all the indicators, whilst external people, for example partners, are presented with a select
number of indicators, relevant to the stakeholder.
The information on the indicators was collected in different ways:
1) Endline workshop at the SPO - self-assessment and ‘general causal map’: similar to data
collection during the baseline, different categories of staff (as much as possible the same people
as during the baseline) were brought together in a workshop and requested to respond, in their
staff category, to the list of questions for each of the indicators (self-assessment sheet). Prior to
carrying out the self-assessments, a brainstorming sessions was facilitated to develop a ‘general
causal map’, based on the key organisational capacity changes since the baseline as perceived by
SPO staff. Whilst this general causal map is not validated with additional information, it provides a
sequential narrative, based on organisational capacity changes as perceived by SPO staff;
2) Interviews with staff members: additional to the endline workshop, interviews were held with
SPO staff, either to provide more in-depth information on the information provided on the self-
assessment formats during the workshop, or as a separate interview for staff members that were
not present during the endline workshop;
3) Interviews with externals: different formats were developed for different types of external
respondents, especially the co-financing agency (CFA), but also partner agencies, and
organisational development consultants where possible. These externals were interviewed, either
face-to-face or by phone/Skype. The interview sheets were sent to the respondents and if they
wanted, these could be filled in digitally and followed up on during the interview;
4) Document review: similar to the baseline in 2012, relevant documents were reviewed so as to
get information on each indicator. Documents to be reviewed included progress reports,
evaluation reports, training reports, etc. (see below) since the baseline in 2012, so as to identify
changes in each of the indicators;
5) Observation: similar to what was done in 2012, also in 2014 the evaluation team had a list with
observable indicators which were to be used for observation during the visit to the SPO.
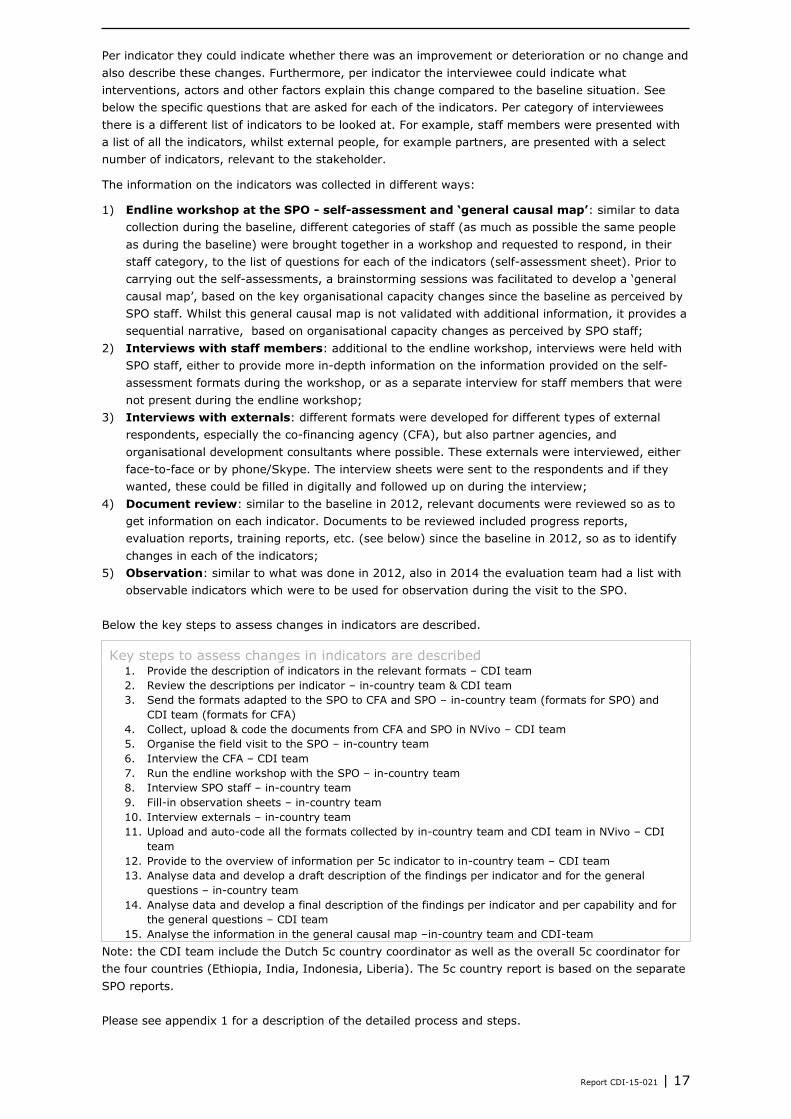
Below the key steps to assess changes in indicators are described.
Key steps to assess changes in indicators are described 1. Provide the description of indicators in the relevant formats – CDI team
2. Review the descriptions per indicator – in-country team & CDI team
3. Send the formats adapted to the SPO to CFA and SPO – in-country team (formats for SPO) and
CDI team (formats for CFA)
4. Collect, upload & code the documents from CFA and SPO in NVivo – CDI team
5. Organise the field visit to the SPO – in-country team
6. Interview the CFA – CDI team
7. Run the endline workshop with the SPO – in-country team
8. Interview SPO staff – in-country team
9. Fill-in observation sheets – in-country team
10. Interview externals – in-country team
11. Upload and auto-code all the formats collected by in-country team and CDI team in NVivo – CDI
team
12. Provide to the overview of information per 5c indicator to in-country team – CDI team
13. Analyse data and develop a draft description of the findings per indicator and for the general
questions – in-country team
14. Analyse data and develop a final description of the findings per indicator and per capability and for
the general questions – CDI team
15. Analyse the information in the general causal map –in-country team and CDI-team
Note: the CDI team include the Dutch 5c country coordinator as well as the overall 5c coordinator for
the four countries (Ethiopia, India, Indonesia, Liberia). The 5c country report is based on the separate
SPO reports.
Please see appendix 1 for a description of the detailed process and steps.
18 | Report CDI-15-021
3.3 Attributing changes in organisational capacity -
evaluation question 2 and 4
This section describes the data collection and analysis methodology for answering the second
evaluation question: To what degree are the changes identified in partner capacity
attributable to (capacity) development interventions undertaken by the MFS II consortia
(i.e. measuring effectiveness)? and the fourth evaluation question: “What factors explain the
findings drawn from the questions above?”
In terms of the attribution question (2), ‘process tracing’ is used. This is a theory-based approach that
has been applied to a selected number of SPOs since it is a very intensive and costly methodology,
although it provides rich information and can generate a lot of learning within the organisations. Key
organisational capacity changes/ outcomes of the SPO were identified, based on their relationship to
the two selected capabilities, the capability to act and commit the capability to adapt and self-renew,
and an expected relationship with CFA supported capacity development interventions (MFS II funding).
It was agreed to focus on these two capabilities, since these are the most targeted capabilities by the
CFAs, as established during the baseline process.
Below, the selection of SPOs for process tracing as well as the different steps involved for process tracing in the selected SPOs, are further explained.
3.3.1 Selection of SPOs for 5C process tracing
Process tracing is a very intensive methodology that is very time and resource consuming (for
development and analysis of one final detailed causal map, it takes about 1-2 weeks in total, for
different members of the evaluation team). It has been agreed upon during the synthesis workshop on
17-18 June 2013 that only a selected number of SPOs will take part in this process tracing for the
purpose of understanding the attribution question. The selection of SPOs is based on the following
criteria:
MFS II support to the SPO has not ended before 2014 (since this would leave us with too small a
time difference between intervention and outcome);
Focus is on the 1-2 capabilities that are targeted most by CFAs in a particular country;
Both the SPO and the CFA are targeting the same capability, and preferably aim for similar
outcomes;
Maximum one SPO per CFA per country will be included in the process tracing.
The intention was to focus on about 30-50% of the SPOs involved. Please see the tables below for a
selection of SPOs per country. Per country, a first table shows the extent to which a CFA targets the
five capabilities, which is used to select the capabilities to focus on. A second table presents which
SPO is selected, and takes into consideration the selection criteria as mentioned above.
For the detailed results of this selection, in the four countries that CDI is involved in, please see
appendix 1. The following SPOs were selected for process tracing:
Ethiopia: AMREF, ECFA, FSCE, HUNDEE (4/9)
India: BVHA, COUNT, FFID, SMILE, VTRC (5/10)
Indonesia: ASB, ECPAT, PtPPMA, YPI, YRBI (5/12)
Liberia: BSC, RHRAP (2/5).
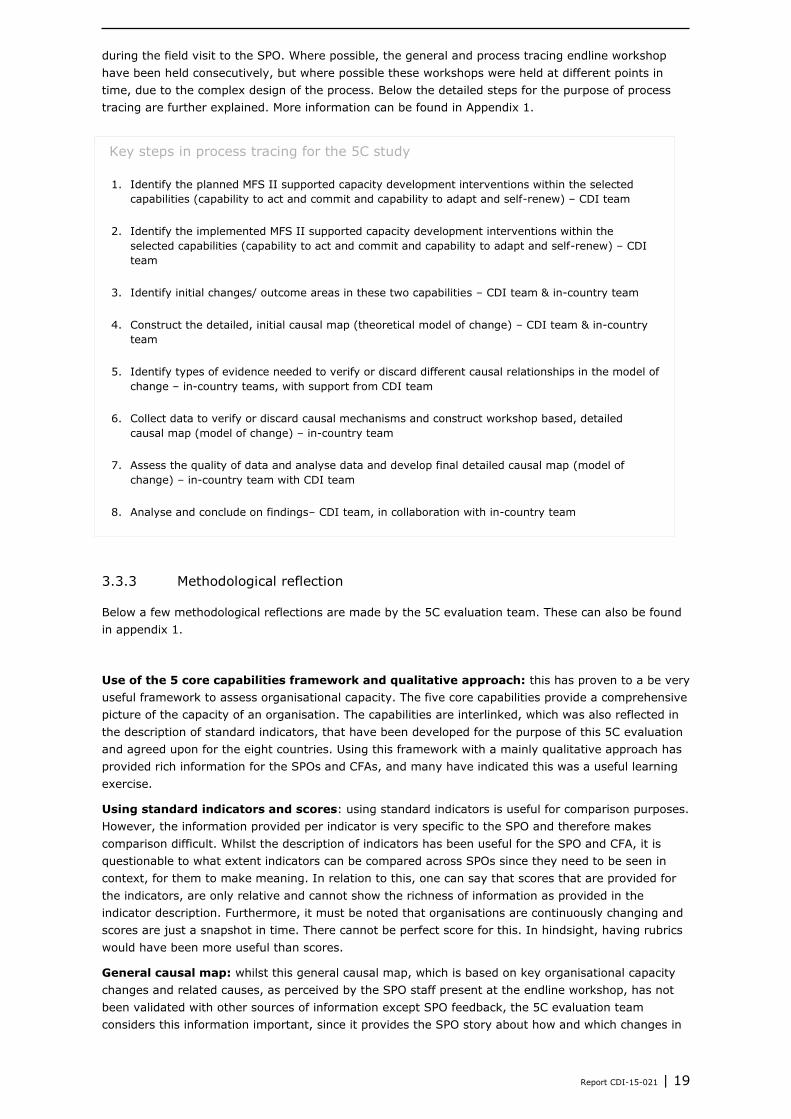
3.3.2 Key steps in process tracing for the 5C study
In the box below you will find the key steps developed for the 5C process tracing methodology. These
steps will be further explained here. Only key staff of the SPO is involved in this process:
management; programme/ project staff; and monitoring and evaluation staff, and other staff that
could provide information relevant to the identified outcome area/key organisational capacity change.
Those SPOs selected for process tracing had a separate endline workshop, in addition to the ‘ general
endline workshop. This workshop was carried out after the initial endline workshop and the interviews
Report CDI-15-021 | 19
during the field visit to the SPO. Where possible, the general and process tracing endline workshop
have been held consecutively, but where possible these workshops were held at different points in
time, due to the complex design of the process. Below the detailed steps for the purpose of process
tracing are further explained. More information can be found in Appendix 1.
Key steps in process tracing for the 5C study
1. Identify the planned MFS II supported capacity development interventions within the selected
capabilities (capability to act and commit and capability to adapt and self-renew) – CDI team
2. Identify the implemented MFS II supported capacity development interventions within the
selected capabilities (capability to act and commit and capability to adapt and self-renew) – CDI
team
3. Identify initial changes/ outcome areas in these two capabilities – CDI team & in-country team
4. Construct the detailed, initial causal map (theoretical model of change) – CDI team & in-country
team
5. Identify types of evidence needed to verify or discard different causal relationships in the model of
change – in-country teams, with support from CDI team
6. Collect data to verify or discard causal mechanisms and construct workshop based, detailed
causal map (model of change) – in-country team
7. Assess the quality of data and analyse data and develop final detailed causal map (model of
change) – in-country team with CDI team
8. Analyse and conclude on findings– CDI team, in collaboration with in-country team
3.3.3 Methodological reflection
Below a few methodological reflections are made by the 5C evaluation team. These can also be found
in appendix 1.
Use of the 5 core capabilities framework and qualitative approach: this has proven to a be very
useful framework to assess organisational capacity. The five core capabilities provide a comprehensive
picture of the capacity of an organisation. The capabilities are interlinked, which was also reflected in
the description of standard indicators, that have been developed for the purpose of this 5C evaluation
and agreed upon for the eight countries. Using this framework with a mainly qualitative approach has
provided rich information for the SPOs and CFAs, and many have indicated this was a useful learning
exercise.
Using standard indicators and scores: using standard indicators is useful for comparison purposes.
However, the information provided per indicator is very specific to the SPO and therefore makes
comparison difficult. Whilst the description of indicators has been useful for the SPO and CFA, it is
questionable to what extent indicators can be compared across SPOs since they need to be seen in
context, for them to make meaning. In relation to this, one can say that scores that are provided for
the indicators, are only relative and cannot show the richness of information as provided in the
indicator description. Furthermore, it must be noted that organisations are continuously changing and
scores are just a snapshot in time. There cannot be perfect score for this. In hindsight, having rubrics
would have been more useful than scores.
General causal map: whilst this general causal map, which is based on key organisational capacity
changes and related causes, as perceived by the SPO staff present at the endline workshop, has not
been validated with other sources of information except SPO feedback, the 5C evaluation team
considers this information important, since it provides the SPO story about how and which changes in
20 | Report CDI-15-021
the organisation since the baseline, are perceived as being important, and how these changes have
come about. This will provide information additional to the information that has been validated when
analysing and describing the indicators as well as the information provided through process tracing
(selected SPOs). This has proven to be a learning experience for many SPOs.
Using process tracing for dealing with the attribution question: this theory-based and mainly
qualitative approach has been chosen to deal with the attribution question, on how the organisational
capacity changes in the organisations have come about and what the relationship is with MFS II
supported capacity development interventions and other factors. This has proven to be a very useful
process, that provided a lot of very rich information. Many SPOs and CFAs have already indicated that
they appreciated the richness of information which provided a story about how identified
organisational capacity changes have come about. Whilst this process was intensive for SPOs during
the process tracing workshops, many appreciated this to be a learning process that provided useful
information on how the organisation can further develop itself. For the evaluation team, this has also
been an intensive and time-consuming process, but since it provided rich information in a learning
process, the effort was worth it, if SPOs and CFAs find this process and findings useful.
A few remarks need to be made:
Outcome explaining process tracing is used for this purpose, but has been adapted to the situation
since the issues being looked at were very complex in nature.
Difficulty of verifying each and every single change and causal relationship:
- Intensity of the process and problems with recall: often the process tracing workshop was done
straight after the general endline workshop that has been done for all the SPOs.In some cases,
the process tracing endline workshop has been done at a different point in time, which was
better for staff involved in this process, since process tracing asks people to think back about
changes and how these changes have come about. The word difficulties with recalling some of
these changes and how they have come about. See also the next paragraph.
- Difficulty of assessing changes in knowledge and behaviour: training questionnaire is have been
developed, based on Kirkpatrick’s model and were specifically tailored to identify not only the
interest but also the change in knowledge and skills, behaviour as well as organisational changes
as a result of a particular training. The retention ability of individuals, irrespective of their
position in the organisation, is often unstable. The 5C evaluation team experienced that it was
difficult for people to recall specific trainings, and what they learned from those trainings. Often
a change in knowledge, skills and behaviour is a result brought about by a combination of
different factors , rather than being traceable to one particular event. The detailed causal maps
that have been established, also clearly pointed this. There are many factors at play that make
people change their behaviour, and this is not just dependent on training but also
internal/personal (motivational) factors as well as factors within the organisation, that stimulate
or hinder a person to change behaviour. Understanding how behaviour change works is
important when trying to really understand the extent to which behaviour has changed as a
result of different factors, actors and interventions. Organisations change because people
change and therefore understanding when and how these individuals change behaviour is
crucial. Also attrition and change in key organisational positions can contribute considerably to
the outcome.
Utilisation of the evaluation
The 5C evaluation team considers it important to also discuss issues around utility of this evaluation.
We want to mention just a few.
Design – mainly externally driven and with a focus on accountability and standard indicators and
approaches within a limited time frame, and limited budget: this MFS II evaluation is originally based
on a design that has been decided by IOB (the independent evaluation office of the Dutch Ministry of
Foreign Affairs) and to some extent MFS II organisations. The evaluators have had no influence on the
overall design and sampling for the 5C study. In terms of learning, one may question whether the
most useful cases have been selected in this sampling process. The focus was very much on a rigorous
evaluation carried out by an independent evaluation team. Indicators had to be streamlined across
countries. The 5C team was requested to collaborate with the other 5C country teams (Bangladesh,
Report CDI-15-021 | 21
Congo, Pakistan, Uganda) to streamline the methodological approach across the eight sampled
countries. Whilst this may have its purpose in terms of synthesising results, the 5C evaluation team
has also experienced the difficulty of tailoring the approach to the specific SPOs. The overall
evaluation has been mainly accountability driven and was less focused on enhancing learning for
improvement. Furthermore, the timeframe has been very small to compare baseline information
(2012) with endline information (2014). Changes in organisational capacity may take a long,
particularly if they are related to behaviour change. Furthermore, there has been limited budget to
carry out the 5C evaluation. For all the four countries (Ethiopia, India, Indonesia, Liberia) that the
Centre for Development Innovation, Wageningen University and Research centre has been involved in,
the budget has been overspent.
However, the 5C evaluation team has designed an endline process whereby engagement of staff, e.g.
in a workshop process was considered important, not only due to the need to collect data, but also to
generate learning in the organisation. Furthermore, having general causal maps and detailed causal
maps generated by process tracing have provided rich information that many SPOs and CFAs have
already appreciated as useful in terms of the findings as well as a learning process.
Another issue that must be mentioned is that additional requests have been added to the country
teams during the process of implementation: developing a country based synthesis; questions on
design, implementation, and reaching objectives of MFS II funded capacity development interventions,
whilst these questions were not in line with the core evaluation questions for the 5C evaluation.
Complexity and inadequate coordination and communication: many actors, both in the
Netherlands, as well as in the eight selected countries, have been involved in this evaluation and their
roles and responsibilities, were often unclear. For example, 19 MFS II consortia, the internal reference
group, the Ministry of Foreign Affairs, Partos, the Joint Evaluation Trust, NWO-Wotro, the evaluators
(Netherlands and in-country), 2 external advisory committees, and the steering committee. Not to
mention the SPO’s and their related partners and consultants. CDI was involved in 4 countries with a
total number of 38 SPOs and related CFAs. This complexity influenced communication and
coordination, as well as the extent to which learning could take place. Furthermore, there was a
distance between the evaluators and the CFAs, since the approach had to be synchronised across
countries, and had to adhere to strict guidelines, which were mainly externally formulated and could
not be negotiated or discussed for the purpose of tailoring and learning. Feedback on the final results
and report had to be provided mainly in written form. In order to enhance utilisation, a final workshop
at the SPO to discuss the findings and think through the use with more people than probably the one
who reads the report, would have more impact on organisational learning and development.
Furthermore, feedback with the CFAs has also not been institutionalised in the evaluation process in
the form of learning events. And as mentioned above, the complexity of the evaluation with many
actors involved did not enhance learning and thus utilization.
5C Endline process, and in particular thoroughness of process tracing often appreciated as
learning process: The SPO perspective has also brought to light a new experience and technique of
self-assessment and self-corrective measures for managers. Most SPOs whether part of process
tracing or not, deeply appreciated the thoroughness of the methodology and its ability to capture
details with robust connectivity. This is a matter of satisfaction and learning for both evaluators and
SPOs. Having a process whereby SPO staff were very much engaged in the process of self-assessment
and reflection has proven for many to be a learning experience for many, and therefore have
enhanced utility of the 5C evaluation.

22 | Report CDI-15-021
Report CDI-15-021 | 23
4 Results
4.1 MFS II supported capacity development interventions
The information available about the MFS II supported capacity development interventions comes
partly from the support to capacity development sheet filled in by Hivos in September 2012 and other
progress reports received. Unfortunately the person within Hivos who was well familiar with RGVN no
longer works for Hivos India and therefore could not provide additional inside information on the
capacity development of RGVN. Tasks and responsibilities were transferred to the Hivos head office in
the Netherlands upon closure of the Bangalore office in December 2013 and in anticipation of the
establishment of a new office in Mumbai in August 2014.
Under the project “Graduating NGOs in MF Institutions in the state of Odisha”, that was supported by
Hivos until 2012, several capacity development interventions took place in which also RGVN
executives participated. These are: training of trainers (TOT) on strategic business plans; workshop on
development of result oriented framework and monitoring indicators; follow-up workshop on result
orientation and monitoring indicators and a loan portfolio audit. However, these interventions are not
mentioned by Hivos as capacity strengthening interventions for RGVN and no budget is known.
During the endline evaluation HRM/Admin staff, programme staff and management of RGVN indicated
in their self-assessment sheets that the following trainings were supported by Hivos:
Training on Leadership, financial management and group dynamics in Jamunali supported by
Hivos in July 2013
Exposure visit to Badamba, Raipur, Parbatipuram and Agriculture university firm, Hyderabad
Training on Organic farming process at Rambhadhrapuram in October 2013
Training on enterprise promotion and business development in 2013 and August 2014 in
Bhubaneswar
Workshop on Producer Entrepreneurship Catalyst and Incubation Facility (ProCIF) organised
by Vrutti Livelihoods sponsored by Hivos 22-23 May 2014 at Bangalore to help the staff
graduate poor producer organisations into self-reliant enterprises. This resulted in the staff to
improve capacity in training the partners on enterprise management skill and techniques of
enterprise promotion activity to supplement the objective of scale up, profitability and market
linkages. They could better plan for community level enterprise promotion and prepared a
road map for the registration of the cluster with suitable legal identity
The Financial Audited Statement for the financial year April 2013 to March 2014 shows that the following expenditures were made under the category Capacity Building.
By Capacity Building a) Training. on Vegetable Farming INR 670.000,- b) Training. on NTFP INR 140.000,- c) Training. on Bell Metal INR 102.500,- d) Training & Workshop (Central) INR 106.100,- e) Exposure Visit Expenses INR 60.000,- These interventions were carried out to strengthen the internal capacity of the community based
organizations like Self Help Groups, partners NGOs as well as RGVN itself. In addition, the 2014 Annual Review Report indicates that the following capacity building activities have been planned for RGVN staff between April 2014 and March 2015.
24 | Report CDI-15-021
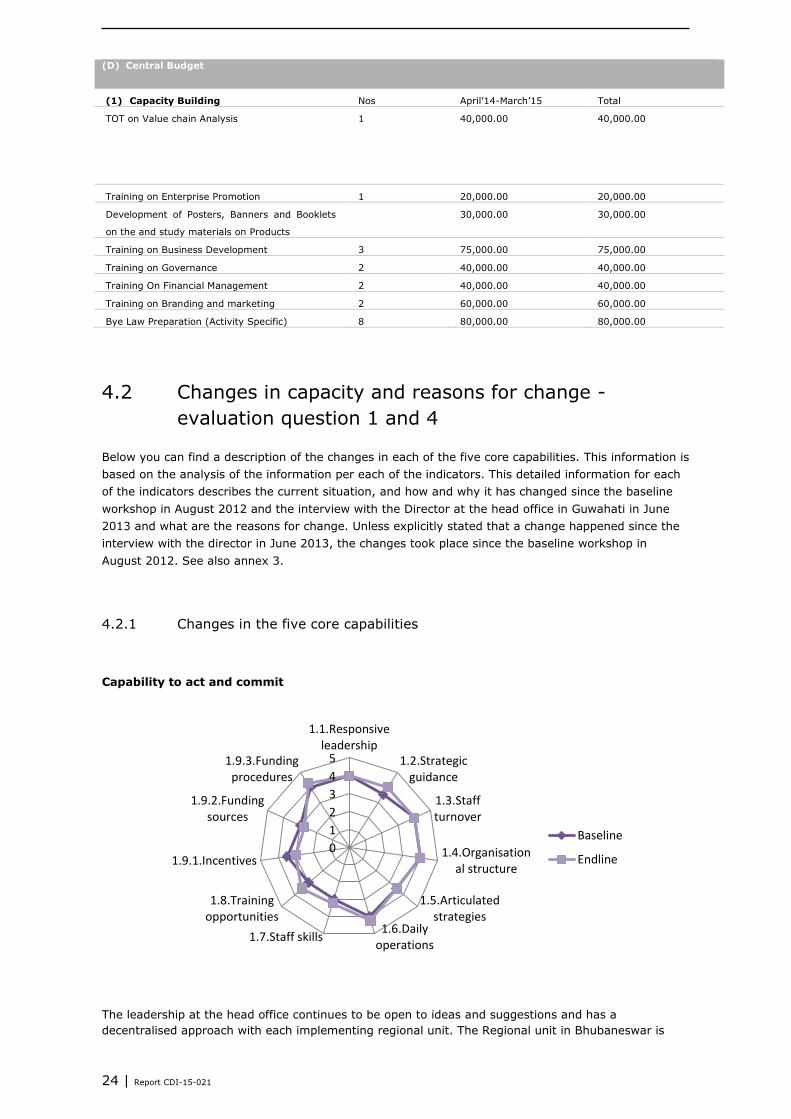
(D) Central Budget
(1) Capacity Building Nos April’14-March’15 Total
TOT on Value chain Analysis 1 40,000.00 40,000.00
Training on Enterprise Promotion 1 20,000.00 20,000.00
Development of Posters, Banners and Booklets
on the and study materials on Products
30,000.00 30,000.00
Training on Business Development 3 75,000.00 75,000.00
Training on Governance 2 40,000.00 40,000.00
Training On Financial Management 2 40,000.00 40,000.00
Training on Branding and marketing 2 60,000.00 60,000.00
Bye Law Preparation (Activity Specific) 8 80,000.00 80,000.00
4.2 Changes in capacity and reasons for change -
evaluation question 1 and 4
Below you can find a description of the changes in each of the five core capabilities. This information is
based on the analysis of the information per each of the indicators. This detailed information for each
of the indicators describes the current situation, and how and why it has changed since the baseline
workshop in August 2012 and the interview with the Director at the head office in Guwahati in June
2013 and what are the reasons for change. Unless explicitly stated that a change happened since the
interview with the director in June 2013, the changes took place since the baseline workshop in
August 2012. See also annex 3.
4.2.1 Changes in the five core capabilities
Capability to act and commit
The leadership at the head office continues to be open to ideas and suggestions and has a
decentralised approach with each implementing regional unit. The Regional unit in Bhubaneswar is
0
1
2
3
4
5
1.1.Responsiveleadership
1.2.Strategicguidance
1.3.Staffturnover
1.4.Organisational structure
1.5.Articulatedstrategies
1.6.Dailyoperations
1.7.Staff skills
1.8.Trainingopportunities
1.9.1.Incentives
1.9.2.Fundingsources
1.9.3.Fundingprocedures
Baseline
Endline
Report CDI-15-021 | 25
autonomous and responsible for its fundraising, but contracts have to be approved and signed by the
RGVN executive director. The executive director feels that despite repeated suggestions the leader at
the Bhubaneswar office has not submitted any funding proposals to the head office. The leadership at
RGVN Bhubaneswar is however, very committed, competent, experienced, responsive and proactive in
taking decisions. The leadership in Bhubaneswar continues to give strategic guidance. While the 2011-
2012 strategic plans could not be implemented mainly due to the micro-finance crisis, and a flood and
cyclone followed, the management made the strategic decision to shift from micro-finance to
sustainable livelihood enhancement. Also external resource mobilisation began to play an important
role as the head office decided to no longer allow external borrowings from banks. RGVN’s new Project
Finance Committee plays an important role in monitoring progress and responding to proposals for
funding. Leadership is now staying more abreast with the latest developments and encourages
innovative ideas in strategy making. Staff turnover continues to be low at the regional unit
Bhubaneswar and staff has become experienced in their work. There has been no new recruitment at
the Bhubaneswar office during the last two years, as the organisation has not been able to procure
any new projects. The Sustainable Livelihood Enhancement and Enterprise Promotion (SLEEP) project
till 2015, funded by Hivos does not have enough funds to attract extra manpower. The organisational
structure at the headquarters in Guwahati and the regional office in Bhubaneswar continued to be the
same, but new board members have replaced the earlier ones. RGVN continues to work in 14 states of
India. The executive director heads the organisation and is based in Guwahati while the four regional
offices at Guwahati, Patna, Bhubaneshwar and Raipur are headed by Regional Coordinators. Hivos
continues to supports RGVN for its work in Odisha, for which the team works from Bhubaneswar.
RGVN’s strategies continue to be well defined and based on good situation analysis and its experience
in working in its operational areas. The overall strategy from RGVN has moved from microfinance to
sustainable livelihood enhancement. In the related project SLEEP, RGVN articulates its strategies
based on their longstanding experience of mobilising and strengthening women produces, artisans,
and forest dwellers. With the change in the strategic plan and changing environment the day-to-day
operational plans have been revised. Fortnightly review meetings are now conducted to monitor day-
to-day operation; this has streamlined the operationalization of the strategic plan of the organization.
Over the period RGVN staff has gained skills and knowledge on certain areas that were recommended
during the baseline and more due to trainings supported by Hivos and other donors like the Small
Industrial Development Bank of India and through staff’s considerable field experience. However, due
to limited staff strength in the regional office of Bhubaneswar the staff has to multi-task and takes up
additional responsibilities. Over the MFS II period the staff participated in ample training programmes
and exposure visits supported both by Hivos (MFS II) and others. Staff now seems to have more
access to trainings on new trends and strategies as the above trainings fit well with RGVN’s new
strategy to focus on sustainable livelihood enhancement. Freedom at work, freedom of
experimentation with ideas and skill building through various trainings and exposure visits continue to
motivate staff at work. However, performance linked incentives have stopped after the baseline in
August 2012 because of the executive board’s decision to no longer borrow commercial funds and the
end of MFS II funding. During the baseline, RGVN had 11 different funders and was receiving funding
in the form of grants and loans, while RGVN is approaching new donors related to livelihoods and with
its CSR eligibility certificate, currently they are receiving funding from a smaller set of funders than
during the baseline. RGVN continues to have clear cut funding procedures RGVN has a national level
copy of procedures for exploring new funding opportunities which includes a separate section
applicable to RGVN Bhubaneswar. RGVN head office Guwahati has given autonomy to the regional
branches to mobilise funds at its own and to choose the projects they work on.
Score baseline: 3.6
Score endline: 3.7 (no change)
26 | Report CDI-15-021
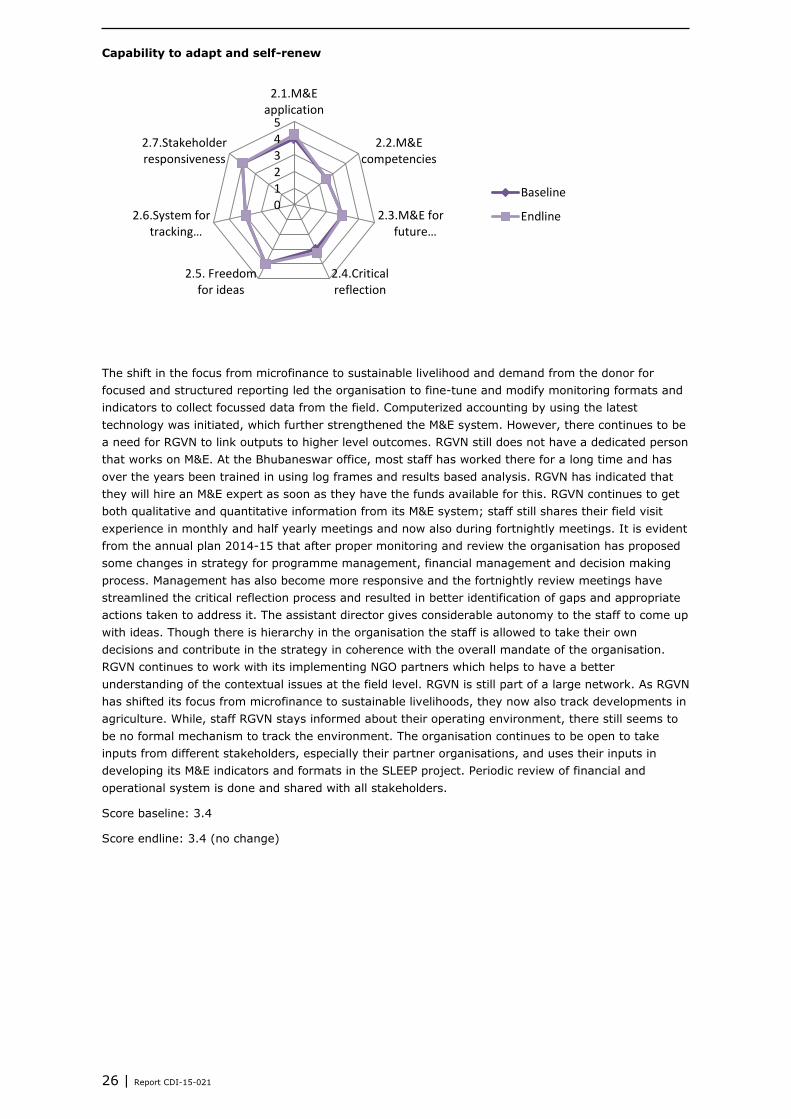
Capability to adapt and self-renew
The shift in the focus from microfinance to sustainable livelihood and demand from the donor for
focused and structured reporting led the organisation to fine-tune and modify monitoring formats and
indicators to collect focussed data from the field. Computerized accounting by using the latest
technology was initiated, which further strengthened the M&E system. However, there continues to be
a need for RGVN to link outputs to higher level outcomes. RGVN still does not have a dedicated person
that works on M&E. At the Bhubaneswar office, most staff has worked there for a long time and has
over the years been trained in using log frames and results based analysis. RGVN has indicated that
they will hire an M&E expert as soon as they have the funds available for this. RGVN continues to get
both qualitative and quantitative information from its M&E system; staff still shares their field visit
experience in monthly and half yearly meetings and now also during fortnightly meetings. It is evident
from the annual plan 2014-15 that after proper monitoring and review the organisation has proposed
some changes in strategy for programme management, financial management and decision making
process. Management has also become more responsive and the fortnightly review meetings have
streamlined the critical reflection process and resulted in better identification of gaps and appropriate
actions taken to address it. The assistant director gives considerable autonomy to the staff to come up
with ideas. Though there is hierarchy in the organisation the staff is allowed to take their own
decisions and contribute in the strategy in coherence with the overall mandate of the organisation.
RGVN continues to work with its implementing NGO partners which helps to have a better
understanding of the contextual issues at the field level. RGVN is still part of a large network. As RGVN
has shifted its focus from microfinance to sustainable livelihoods, they now also track developments in
agriculture. While, staff RGVN stays informed about their operating environment, there still seems to
be no formal mechanism to track the environment. The organisation continues to be open to take
inputs from different stakeholders, especially their partner organisations, and uses their inputs in
developing its M&E indicators and formats in the SLEEP project. Periodic review of financial and
operational system is done and shared with all stakeholders.
Score baseline: 3.4
Score endline: 3.4 (no change)
012345
2.1.M&Eapplication
2.2.M&Ecompetencies
2.3.M&E forfuture…
2.4.Criticalreflection
2.5. Freedomfor ideas
2.6.System fortracking…
2.7.Stakeholderresponsiveness
Baseline
Endline
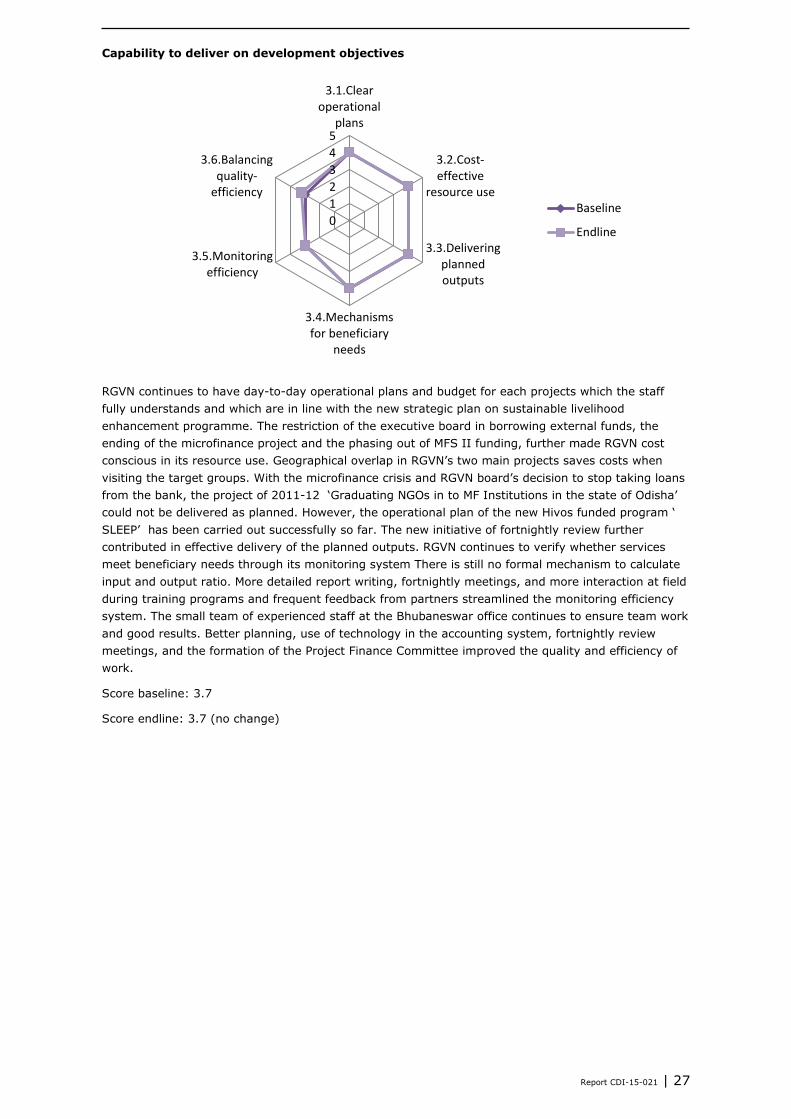
Report CDI-15-021 | 27
Capability to deliver on development objectives
RGVN continues to have day-to-day operational plans and budget for each projects which the staff
fully understands and which are in line with the new strategic plan on sustainable livelihood
enhancement programme. The restriction of the executive board in borrowing external funds, the
ending of the microfinance project and the phasing out of MFS II funding, further made RGVN cost
conscious in its resource use. Geographical overlap in RGVN’s two main projects saves costs when
visiting the target groups. With the microfinance crisis and RGVN board’s decision to stop taking loans
from the bank, the project of 2011-12 ‘Graduating NGOs in to MF Institutions in the state of Odisha’
could not be delivered as planned. However, the operational plan of the new Hivos funded program ‘
SLEEP’ has been carried out successfully so far. The new initiative of fortnightly review further
contributed in effective delivery of the planned outputs. RGVN continues to verify whether services
meet beneficiary needs through its monitoring system There is still no formal mechanism to calculate
input and output ratio. More detailed report writing, fortnightly meetings, and more interaction at field
during training programs and frequent feedback from partners streamlined the monitoring efficiency
system. The small team of experienced staff at the Bhubaneswar office continues to ensure team work
and good results. Better planning, use of technology in the accounting system, fortnightly review
meetings, and the formation of the Project Finance Committee improved the quality and efficiency of
work.
Score baseline: 3.7
Score endline: 3.7 (no change)
0
1
2
3
4
5
3.1.Clearoperational
plans
3.2.Cost-effective
resource use
3.3.Deliveringplannedoutputs
3.4.Mechanismsfor beneficiary
needs
3.5.Monitoringefficiency
3.6.Balancingquality-
efficiencyBaseline
Endline
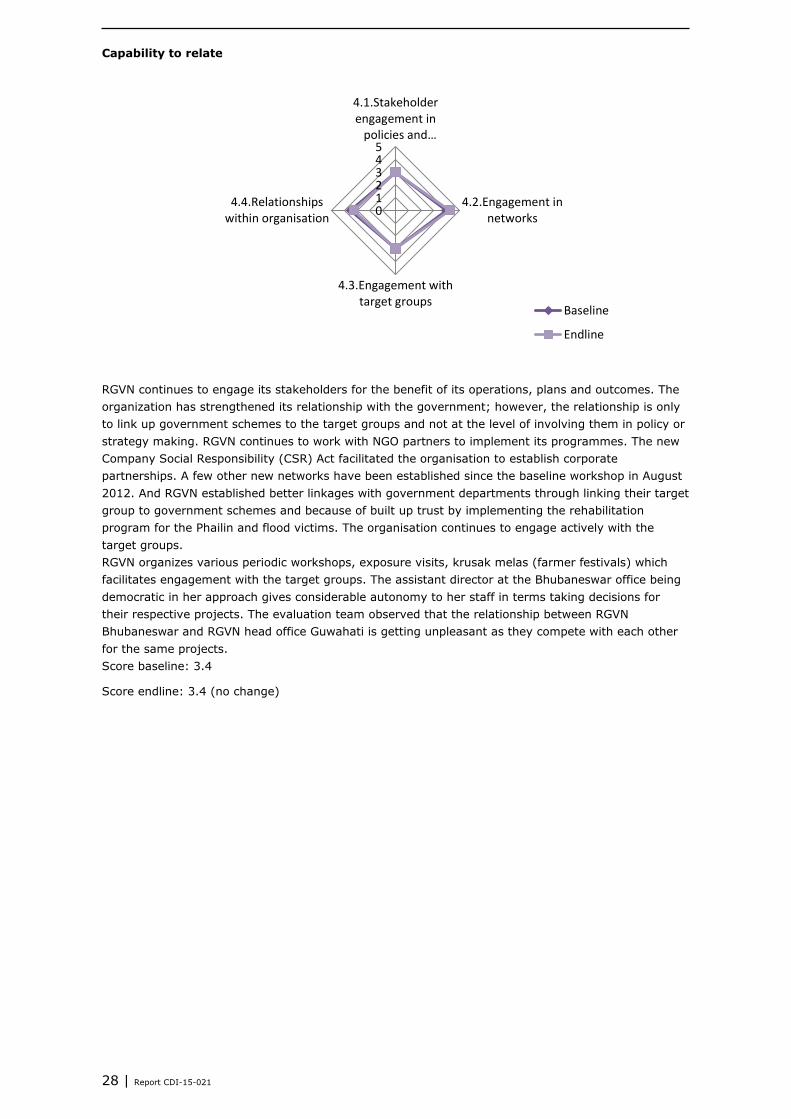
28 | Report CDI-15-021
Capability to relate
RGVN continues to engage its stakeholders for the benefit of its operations, plans and outcomes. The
organization has strengthened its relationship with the government; however, the relationship is only
to link up government schemes to the target groups and not at the level of involving them in policy or
strategy making. RGVN continues to work with NGO partners to implement its programmes. The new
Company Social Responsibility (CSR) Act facilitated the organisation to establish corporate
partnerships. A few other new networks have been established since the baseline workshop in August
2012. And RGVN established better linkages with government departments through linking their target
group to government schemes and because of built up trust by implementing the rehabilitation
program for the Phailin and flood victims. The organisation continues to engage actively with the
target groups.
RGVN organizes various periodic workshops, exposure visits, krusak melas (farmer festivals) which
facilitates engagement with the target groups. The assistant director at the Bhubaneswar office being
democratic in her approach gives considerable autonomy to her staff in terms taking decisions for
their respective projects. The evaluation team observed that the relationship between RGVN
Bhubaneswar and RGVN head office Guwahati is getting unpleasant as they compete with each other
for the same projects.
Score baseline: 3.4
Score endline: 3.4 (no change)
012345
4.1.Stakeholderengagement in
policies and…
4.2.Engagement innetworks
4.3.Engagement withtarget groups
4.4.Relationshipswithin organisation
Baseline
Endline
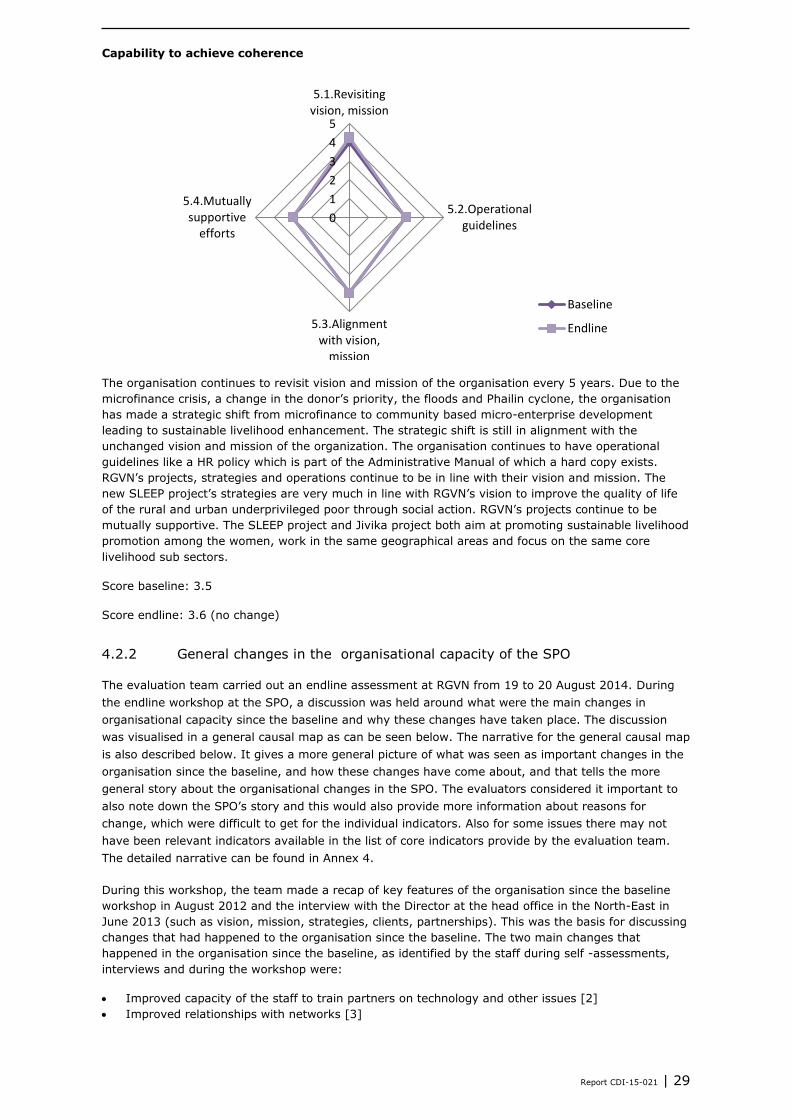
Report CDI-15-021 | 29
Capability to achieve coherence
The organisation continues to revisit vision and mission of the organisation every 5 years. Due to the
microfinance crisis, a change in the donor’s priority, the floods and Phailin cyclone, the organisation
has made a strategic shift from microfinance to community based micro-enterprise development
leading to sustainable livelihood enhancement. The strategic shift is still in alignment with the
unchanged vision and mission of the organization. The organisation continues to have operational
guidelines like a HR policy which is part of the Administrative Manual of which a hard copy exists.
RGVN’s projects, strategies and operations continue to be in line with their vision and mission. The
new SLEEP project’s strategies are very much in line with RGVN’s vision to improve the quality of life
of the rural and urban underprivileged poor through social action. RGVN’s projects continue to be
mutually supportive. The SLEEP project and Jivika project both aim at promoting sustainable livelihood
promotion among the women, work in the same geographical areas and focus on the same core
livelihood sub sectors.
Score baseline: 3.5
Score endline: 3.6 (no change)
4.2.2 General changes in the organisational capacity of the SPO
The evaluation team carried out an endline assessment at RGVN from 19 to 20 August 2014. During
the endline workshop at the SPO, a discussion was held around what were the main changes in
organisational capacity since the baseline and why these changes have taken place. The discussion
was visualised in a general causal map as can be seen below. The narrative for the general causal map
is also described below. It gives a more general picture of what was seen as important changes in the
organisation since the baseline, and how these changes have come about, and that tells the more
general story about the organisational changes in the SPO. The evaluators considered it important to
also note down the SPO’s story and this would also provide more information about reasons for
change, which were difficult to get for the individual indicators. Also for some issues there may not
have been relevant indicators available in the list of core indicators provide by the evaluation team.
The detailed narrative can be found in Annex 4.
During this workshop, the team made a recap of key features of the organisation since the baseline
workshop in August 2012 and the interview with the Director at the head office in the North-East in
June 2013 (such as vision, mission, strategies, clients, partnerships). This was the basis for discussing
changes that had happened to the organisation since the baseline. The two main changes that
happened in the organisation since the baseline, as identified by the staff during self -assessments,
interviews and during the workshop were:
Improved capacity of the staff to train partners on technology and other issues [2]
Improved relationships with networks [3]
0
1
2
3
4
5
5.1.Revisitingvision, mission
5.2.Operationalguidelines
5.3.Alignmentwith vision,
mission
5.4.Mutuallysupportive
efforts
Baseline
Endline
30 | Report CDI-15-021
The two main organisational capacity changes are described in the light orange boxes and some of
their key consequences are noted above these cards in dark orange. Unless explicitly stated that a
change happened since the interview with the Director in June 2013, the changes took place since the
baseline workshop in August 2012. Light purple boxes represent factors and aspects that influence the
key organisational capacity changes (in light orange). Key underlying factors that have impacted the
organisation are listed at the bottom in dark purple. The narrative describes per organisational
capacity change, the contributing factors as described from the top down. The numbers in the visual
correspond with the numbers in the narrative.
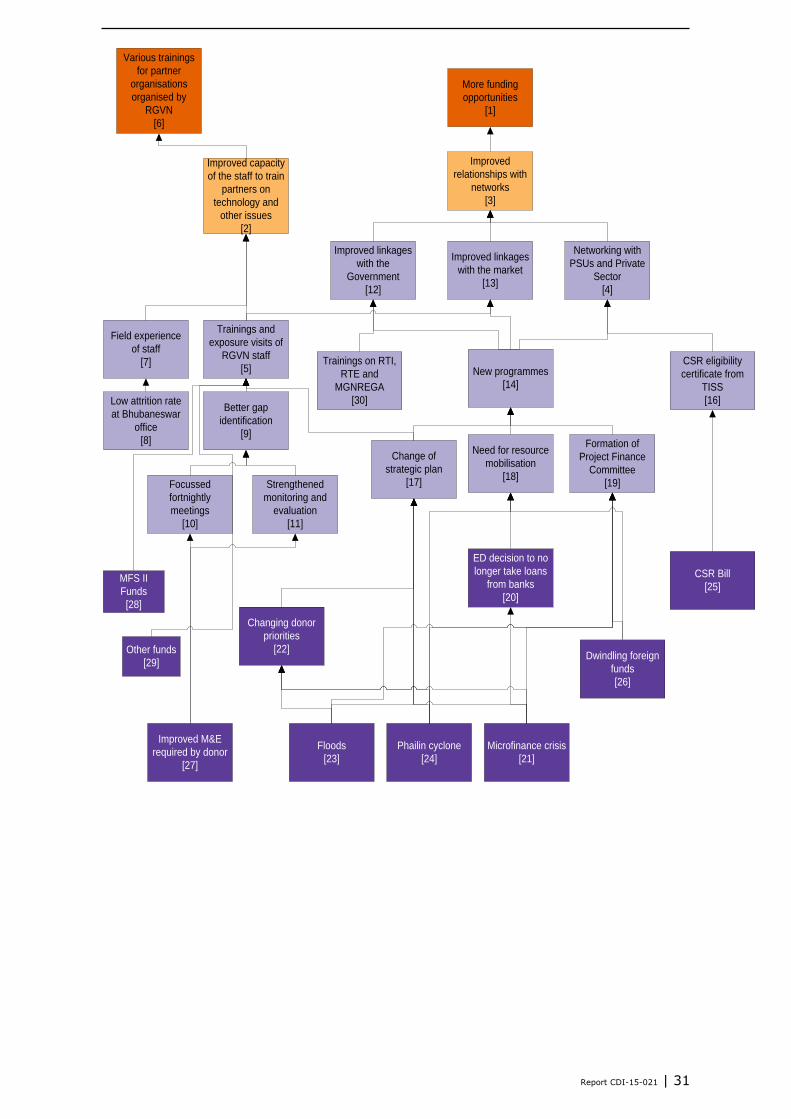
Report CDI-15-021 | 31
Improved capacity
of the staff to train
partners on
technology and
other issues
[2]
Improved
relationships with
networks
[3]
Trainings and
exposure visits of
RGVN staff
[5]
Better gap
identification
[9]
Strengthened
monitoring and
evaluation
[11]
Focussed
fortnightly
meetings
[10]
Improved linkages
with the
Government
[12]
Improved linkages
with the market
[13]
Networking with
PSUs and Private
Sector
[4]
CSR eligibility
certificate from
TISS
[16]
New programmes
[14]
Change of
strategic plan
[17]
Need for resource
mobilisation
[18]
Formation of
Project Finance
Committee
[19]
CSR Bill
[25]
ED decision to no
longer take loans
from banks
[20]
Changing donor
priorities
[22]
Microfinance crisis
[21]
Floods
[23]
Phailin cyclone
[24]
Various trainings
for partner
organisations
organised by
RGVN
[6]
Field experience
of staff
[7]
Low attrition rate
at Bhubaneswar
office
[8]
Dwindling foreign
funds
[26]
Trainings on RTI,
RTE and
MGNREGA
[30]
More funding
opportunities
[1]
Improved M&E
required by donor
[27]
MFS II
Funds
[28]
Other funds
[29]
32 | Report CDI-15-021
Improved capacity of the staff to train partners on technology and other issues [2]
RGVN is committed to the sustainable livelihood enhancement of rural poor in accordance with its
vision and mission. The main source of income of the target population is agriculture and allied
activities. Lack of technical knowledge on agriculture, marketing, value addition, lack of irrigation
facilities, and exploitation by middlemen, periodic natural disasters and lack of financial inclusion
affected the target groups’ livelihood security. Since the baseline, the organization has undertaken
steps to improve the basic skill sets and marketing linkages of the target groups by improving the
capacity of the RGVN staff in these directions. The improved capacity of RGVN staff to train partners
on technology and other issues has had a trickledown effect on the capacity of RGVN’s partners. This
has consequently had enabled the target groups’ ability to cope with adverse situations. As a result of
RGVN’s improved capacity to organize and give trainings to partners, several capacity building
trainings on value addition, market linkages, organic farming, vermicomposting production were
organized by RGVN staff [6] as per the contract with Hivos for the new project ‘Sustainable Livelihood
Enhancement and Entrepreneur Promotion’ (SLEEP). This project replaced the previous one on
microfinance after the microfinance crisis.
Staff’s capacity to train partners [2] improved because of the field experience that staff got [7] and
because of RGVN staff attending various trainings and exposure visits [5]. Both are further explained
below.
Field experience of staff [7]
Capacity of the staff to train partners on technology and other issues also improved because some
RGVN staff has been there for a long time working in a small compact unit, doing a variety of activities
they also have learnt from field experience. This was because of a low attrition rate at the
Bhubaneswar office [8]. This is where the team works that is supported by Hivos to work on the SLEEP
project.
Trainings and exposure visits of RGVN staff [5]
Increased capacity of the RGVN staff [2] was furthermore due to various capacity building trainings
and exposure visits [5] supported by Hivos and other donors. These trainings include:
Two-day training was organized by Vrutti Livelihoods, Bangalore on 22-23 May 2014 sponsored by
Hivos (MFS II) on producer entrepreneurship catalyst and incubation facility. The focus of the
training was to help the staff to assist unviable producer organisations into self-reliant enterprises.
Funded by MFS II [28]. The training was attended by assistant director of RGVN, Bhubaneswar
Region.
Two- day training was organised with the support of Hivos (MFS II) on 18-19 August 2014 at
Bhubaneswar on enterprise promotion and business development. The programme coordinators of
RGVN participated in this. Funded by MFS II [28]. The programme coordinators of RGVN
participated in the training programme.
Training programme on vermicomposting pit by Sir Dorabji Tata Trust, (SDTT) Mumbai in 2013.
Funded by SDTT [29]. The training was attended by 3 project staff and programme coordinator of
RGVN, Bhubaneswar.
Leadership training was organized by Small Industrial Development Bank of India (SIDBI) in
2014. Funded by SIDBI [2]. The Programme Coordinator of RGVN, Bhubaneswar attended the
training.
The organization also arranged a number of exposure visits for the staff during the last two years to
help them learn about vermicomposting, bio-pesticides, governance, value chain analysis and organic
farming.
Staff was sent to trainings and exposure visits [5] since they realised there is a gap in terms of
knowledge and skills [9] and also because of the change in the strategic plan [17], as working topics
like strengthening livelihoods in the SLEEP project required further training to gain knowledge and
skills on this. The identification of gaps in knowledge and skills [9] was done during fortnightly
meetings [10] where a strategy for diversification of resource mobilisation was being discussed. It was
also the result of having strengthened monitoring and evaluation [11]. These are further explained
below.
- Focused fortnightly meetings [10]
The fortnightly meeting was a new initiative taken by the management in order to streamline the
reporting and monitoring structure. Here day-to-day planned operations were monitored and
reviewed, gaps in knowledge and skills were better identified which streamlined the strategic plan
Report CDI-15-021 | 33
of the organization for smooth functioning of projects and planning of trainings and exposure
visits.
- Strengthened monitoring and evaluation [11]
There was change in the strategic plan to shift to sustainable livelihood enhancement, demand
from the donor to have detailed and focused data collection, commitment of the organization to
fulfil the needs of the target group and increasing focus of donors on evidence based grant making
and value for money analysis pushed the organisation to strengthen their monitoring and
evaluation. As a result they refined the monitoring and evaluation formats and indicators. Now the
data collection is both qualitative and quantitative, whereas during the baseline it was only
quantitative.
Focused fortnightly meetings [10] were taken up by the management and monitoring and evaluation
was strengthened [11] to streamline the monitoring and evaluation structures and processes because
of the donors requirements [27].
Improved relationships with networks [3]
There have been a couple of issues that have greatly affected RGVN and the need to look for
additional funding by strengthening their networks. After the microfinance crisis in 2009 [21] the
organization went through a rough patch as floods in 2011 and 2014 [23] and the cyclone Phailin in
2013 [24] in the organisation’s partner areas further worsened the situation. The partners’ ability to
recover loans meted out and pay back to RGVN was questionable in the face of such large scale
disaster. The organization was not able to recuperate fully from the Microfinance crisis in 2009 and the
floods in 2011 till the baseline workshop conducted in August 2012. During this time the focus had
already shifted from microfinance to sustainable livelihood enhancement of the target group. However,
the strategy was still in an embryonic stage. In the post baseline period, the executive board of RGVN
decided to restrict external borrowings from banks and other financial institutions anticipating the
inability of the partner organisations to repay RGVN. This initiated the RGVN management to think in
the direction of external resource mobilization, develop linkages with government programs and
schemes, linkages with market and improve capacity of the staff to implement sustainable livelihood
programmes to the target group.
The precarious funding situation, compelled the management to think of converging and linking with
government programmes, the market, Public Sector Units (PSUs) and the private sector to enhance
the livelihood security of the target groups [3]. Improved relationships with networks [3] is expected
to lead to more funding opportunities for RGVN [1]. Improved relationships with networks with
different kind of partners [3] was due to improved linkages with the government [12], improved
linkages with the market [13] and networking with PSUs and the private sector [4]. Each of these
linkages are further explained below.
Linkages with the government [12]
During the baseline workshop (August 2012) there was a need identified for RGVN to develop a
relationship with government institutions and maintain a strategic relationship, so that they could
better translate their commitments to the target groups. The organization’s initiative to rehabilitate
the Flood (August 2014) and Phailin (October 2013) affected people and the capacity to implement
sustainable livelihood programs, facilitated the organization to develop a trust relationship with the
government in the last one and half years (2013-14). Since 2013, RGVN staff has better linkages with
government line departments at local level, state level officials and other semi-governmental
organisations and corporations which run delivery programmes for the poor. This is evident from the
fact that the organization could linkup government schemes and programs to the target groups
(farmers in Odisha). With the support of RGVN the target groups could access the inputs provided by
the government in the form of a vermicomposting pit. Nearly 25 vermicomposting pits have been
constructed by the State Agriculture Department of Odisha in one of the vegetable growing clusters in
the Anugul district. In another vegetable growing cluster area in Dhenkanal the farmers have been
helped in getting support from the State Agriculture Department of Odisha for Shade Net Nursery.
Also NTFP collectors and traders have been able to receive 5 tamarind cake making machines with
support from the Tribal Development Corporation. All these have been facilitated by RGVN and its
partners. Some of the plans are in the pipeline. For example, RGVN has approached the state and
national horticulture board, state agricultural technology institutes, the forest department, the state
handicraft development board and the state Khadi and Village Industry board to link with them
through different schemes. Banks and financial institutions (FIs) have been approached for providing
working capital support for product enhancement at a low interest rate. Given that some of the board
members are heads of FIs, it should not be an uphill task, yet while RGVN Guwahati gets its share,
34 | Report CDI-15-021
RGVN Bhubaneswar is left out. RGVN strengthening its linkages with the government is thus; because
of the new programmes [14] they have been and will be involved in with government agencies (ore on
new programmes later on) and trainings [30] on Right to Information (RTI), Right to Education (RTE),
Mahatma Gandhi National Rural Employment Guarantee Act (MGNREGA).
Linkages with the market [13]
Due to lack of knowledge and skills on value addition, marketing, variable market condition,
exploitative middlemen, and other factors the target groups often find it difficult to get out of the
poverty trap. RGVN is committed to align its work with its vision and mission to enhance the livelihood
of the target groups. In order to do so they provide them with handholding support in areas like value
addition and creating direct linkages with the market. To be able to provide this support RGVN has
trained itself after the baseline workshop in August 2012 on these topics [5]. For example, in terms of
value addition: Value addition is a process in which the farmers are given handholding support to give
due care during processing, preservation and sorting and grading in NTFP and vegetable product
which have a positive impact on the pricing and marketing of the products. During last two years
(August 2012-2014) RGVN staff provided trainings and handholding support to the target groups on
value addition, marketing, etc. They also facilitated access to fair & remunerative markets including
linking producer groups to marketing opportunities by market aggregators. An example of value
addition activities was tamarind collection and marketing. With the technical support provided by
RGVN now the farmers have better capacity in processing, sorting, packaging and grading for proper
pricing of the product and to maintain quality aspect with the buyers [Source: ARR + Work Plan
2013-14-15, Endline Evaluation Workshop].
During the last two years (August 2012- August 2014) RGVN initiated and funded “Bazaar on Wheels”,
a new project to strengthen producer organizations and their access to market. The project focuses
especially on access to market for the women producer groups. They are provided with capacity
building trainings and provision of a van for marketing their products. This is a pilot project carried out
by RGVN through Jagruti Mahila Mahasangha at Govindpur of Dhenkanal district. At present the Mahila
Mahasangha (Federation) has a membership of 1200 women and diversified its production to non-
farm activities. This has enabled wider markets and enhanced profits. Improved linkages with the
market [13] for RGVN has thus been a result of the new programmes [14] they have been involved in
and the trainings and exposure visits staff went to [5].
Networking with different Public Sector Units (PSUs) and private sector [4]
RGVN Bhubaneswar has started having better working relations with Public Sector Units and to some
extent the private sector agencies. The microfinance crisis and the executive board’s decision to
restrict borrowing commercial funds created financial crunch in the organization. Also, as the
implementation focus has been concentrated on production enhancement, marketing linkages,
working capital linkages, value addition etc. to move the clusters into the next phase of sustainability
of the activities compelled the organization to make strategic change for resource mobilization. Some
of the new networked partners are ACC Limited (formerly The Associated Cement Companies Limited),
Larsen & Toubro (L&T), Jamsedji Tata Trust and the 8 new partners in the SLEEP project.
Networking with PSUs and Private sectors [4] improved because of new programmes [14] and CSR
eligible certificate from Tata Institute of Social Science (TISS) [16].
- New programmes [4]
The following are some of the new programmes that were undertaken by RGVN during the last
two years (August 2012- August 2014):
Placement linked target program is part of the Phailin rehabilitation program that
started after October 2013, which was initiated by RGVN in association with ACC and L&T.
SLEEP project facilitated the organization to approach new programs such as, NTFP
processing, value addition & marketing, Organic vegetable farming, DWCRA5 / bell metal
work from production to marketing. This project runs from July 1st, 2012 till June 30th
2015.
The JIVIKA programme started in June 2012 and was outlined based on the
experiences gained during the survey and relief distribution program conducted by RGVN
with support from Jamsedji Tata Trust, Mumbai (JTT).
5 The Development of women and children in Rural Areas or DWCRA is a government sponsored anti-poverty programme of
the Ministry of Rural Development.
Report CDI-15-021 | 35
Working capital support to rickshaw pullers: Graduating rickshaw pullers to become
owner of the rickshaws they use to make a living.
RGVN initiated new programmes [14] due to a change in their strategic plan [17], a need for
resource mobilization [18] and the formation of a Project Finance Committee (PFC)[19].
These are further explained below.
Change of strategic plan [17]
There was change of strategic plan to shift from microfinance to Sustainable Livelihood
Enhancement and Enterprise Promotion due to the microfinance crisis [21] and
consequently the failure of the microfinance project’s implementation. The Microfinance
crisis, the floods and the Phailin cyclone also caused donors to focus more on sustainable
livelihoods [22] and mid-course corrective actions in order to keep the target group
support afloat. Apart from changing their funding priorities, donors have also been
revising their grant making policies [22]. More and more donors are funding agriculture
based programs with a focus on improved livelihoods for the poor. Furthermore, The
RGVN board too became cautious about recovery of loans and restricted the RGVN
Bhubaneswar office from commercial borrowing [20]. The floods in 2011 and 2014
[23]and the cyclone Phailin in 2013 [24] worsened the situation in the organisation’s
partner areas even further, which also triggered the involvement of RGVN in programmes
that were more focused on sustainable livelihood enhancement. All these factors
compelled the organization to change its strategy to sustainable livelihood enhancement
by focusing on the core livelihood sub sectors like NTFP, agriculture and allied agriculture
through the System of Rice Intensification (SRI) model, dairy, organic paddy cultivation,
organic vegetable farming, handicraft, etc.
Need for resource mobilization [18]
With the microfinance crisis the organization was already undergoing a rough patch which
further worsened during 2011-12 period. The board’s decision to restrict external
commercial borrowing of funds [20], the effect of Phailin [24] and dwindling foreign
funding [26] worsened the financial situation of RGVN. All these factors compelled the
organization to think of diversifying their strategy for resource mobilization.
Formation of Project Finance Committee (PFC) [19]
RGVN used to work with the LAC (Local Area Committee), which has now been disbanded.
To recover from the rough patch it was undergoing (including the floods [23], cyclone
[24], microfinance crisis [21] and dwindling foreign funds [26]), internally RGVN has set
up a Project Finance Committee comprising the Executive Director, Assistant Director, and
programme staff. This is a body created to expedite the decision making process, monitor
progress, and respond to proposals for funding.
- CSR6 eligibility certificate from TISS [16]
RGVN became a team member of the National CSR Hub Empanelment team of TISS. This
certification made them eligible for receiving CSR funds for developmental activities. The
empanelment process aims to provide CPSEs (Central Public Sector Enterprises) with a list of
reliable and credible organisations as partners for CSR activities. The empanelment process is
designed to serve the requirements of CPSEs. The National Corporate Social Responsibility (NCSR)
Hub shall empanel those organisations that are people-centric, have experience and expertise in a
specific field and have a planned approach to developmental activities with a specific focus on the
welfare and rights of the vulnerable groups in society. This means all the Public Sector Companies
(state/government owned companies) of India may consider RGVN for implementation of big CSR
project. RGVN getting this certification [16] was triggered by the new CSR Bill [25], which got
approved by the Parliament and is effective from April 2014. It has a very strong CSR Clause,
which mandates companies with an average profit of INR 50 million in the last three years, to
proactively design and undertake welfare and other developmental activities. This is seen as a
great opportunity for RGVN as the corporate sector would be required to spend 2 % of their net
profit for social development actions.
6 The new Companies Act 2014, with a very strong CSR Clause, mandates companies with an average profit of INR 50 million in last three years,
to proactively design and undertake welfare and other developmental activities.

Report CDI-15-021 | 37
5 Discussion and conclusion
5.1 Methodological issues
In order to get detailed information on the capacity development of the staff, self-assessment forms
were filled out by the management (Assistant Director), programme staff (two Programme
Coordinators) and HR/Admin staff (Programme Coordinator Finance). RGVN doesn’t have a separate
M&E unit. The staff performs multiple tasks including M&E. Their financial condition does not allow it to
have a separate team for M&E and programme coordination and therefore no M&E person was
interviewed. The agreed questionnaire was aimed at teasing out information from various levels of
staff without putting them in any awkward situation.The modified and nuanced repetition of questions
when translated to an audience not properly exposed to the English language, created a sense of
repetitiveness. Evaluators tried to resolve this, by clarifying the responses by a follow-up interview
after studying the responses.
RGVN’s focus is to strengthen the partners. It largely works through its partners and at times
implements projects on its own. As a result field staff was not invited for the workshop. Due to shift in
their programme (from microfinance to Sustainable Livelihood Enhancement and Enterprise Promotion
(SLEEP)), RGVN stopped working with the partners they worked with during the baseline. RGVN
started working with new partners in the post baseline period. Therefore, evaluators decided not to
interview new partners as they were not part of the baseline assessment. RGVN rarely uses
Organisation Development Consultants since the staff is well versed and experienced in the area of
interventions. The projects under review for funding by Hivos did not have one Organisation
Development Consultant. Initially Hivos handheld RGVN and helped it shape the contours of the
programme.
The baseline of RGVN was conducted in August 2012 at the Bhubaneshwar office and the executive
director was interviewed in June 2013 in Guwahati. The endline was conducted in August, 2014,
followed by an interview with their Executive Director in September, 2014.Therefore, there was
difficulty in observing the changes within the organisation due to different time frame. Our focus of
evaluation was the RGVN Bhubaneswar office. Since RGVN has this unique division of ownership/
leadership, we also wanted to get the view of the head office regarding the performance and quality of
the regional office, in this case Bhubaneswar office. RGVN Bhubaneswar is autonomous to the extent
of raising resources and designing the operations of its projects, but their salary comes from RGVN
head office in Guwahati. The regional office does not submit any reports to the head office. It directly
submits reports annually to the board of trustees. As a result, the Executive Director did not have
much information about the functioning of its Bhubaneshwar office and his views contradicted the
views given by the RGVN staff in Bhubaneshwar.
The information on the capacity development interventions was “reconstructed” based on the baseline
report, progress reports, with the help of the CFA, Netherlands (the person responsible for managing
the India portfolio in the transition of offices), as the person within Hivos (the CFA) who was well
familiar with RGVN no longer works for Hivos India.
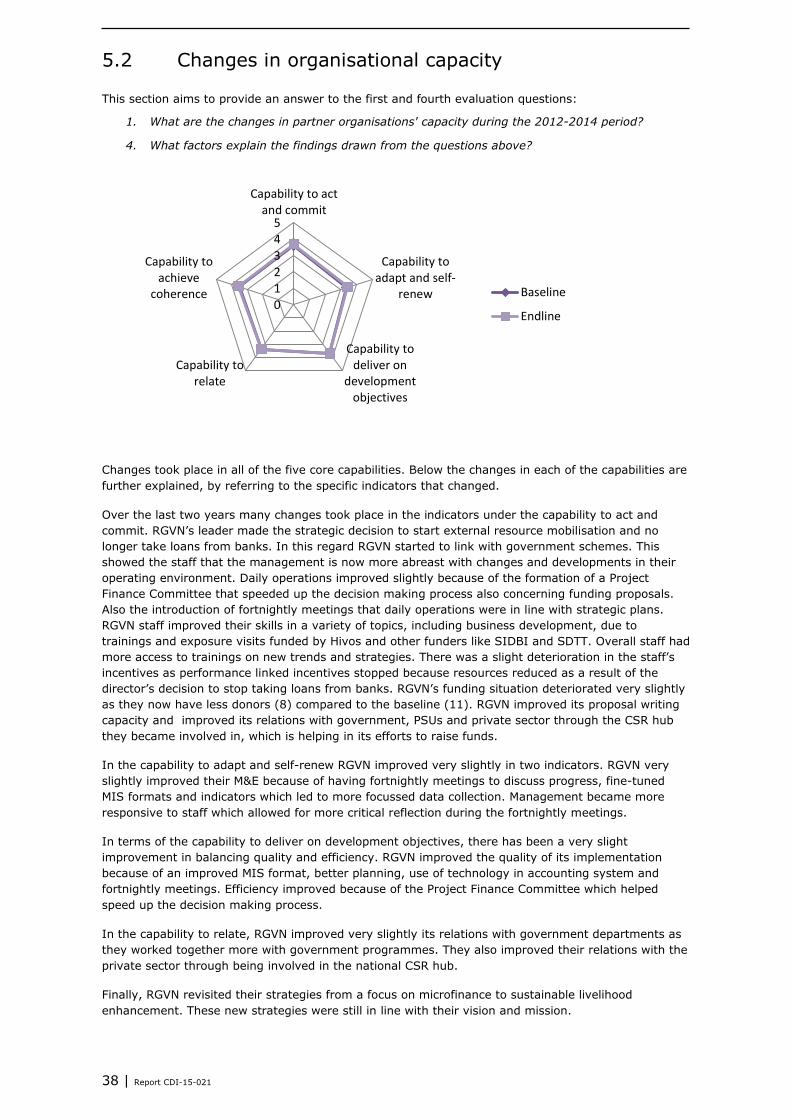
38 | Report CDI-15-021
5.2 Changes in organisational capacity
This section aims to provide an answer to the first and fourth evaluation questions:
1. What are the changes in partner organisations' capacity during the 2012-2014 period?
4. What factors explain the findings drawn from the questions above?
Changes took place in all of the five core capabilities. Below the changes in each of the capabilities are
further explained, by referring to the specific indicators that changed.
Over the last two years many changes took place in the indicators under the capability to act and
commit. RGVN’s leader made the strategic decision to start external resource mobilisation and no
longer take loans from banks. In this regard RGVN started to link with government schemes. This
showed the staff that the management is now more abreast with changes and developments in their
operating environment. Daily operations improved slightly because of the formation of a Project
Finance Committee that speeded up the decision making process also concerning funding proposals.
Also the introduction of fortnightly meetings that daily operations were in line with strategic plans.
RGVN staff improved their skills in a variety of topics, including business development, due to
trainings and exposure visits funded by Hivos and other funders like SIDBI and SDTT. Overall staff had
more access to trainings on new trends and strategies. There was a slight deterioration in the staff’s
incentives as performance linked incentives stopped because resources reduced as a result of the
director’s decision to stop taking loans from banks. RGVN’s funding situation deteriorated very slightly
as they now have less donors (8) compared to the baseline (11). RGVN improved its proposal writing
capacity and improved its relations with government, PSUs and private sector through the CSR hub
they became involved in, which is helping in its efforts to raise funds.
In the capability to adapt and self-renew RGVN improved very slightly in two indicators. RGVN very
slightly improved their M&E because of having fortnightly meetings to discuss progress, fine-tuned
MIS formats and indicators which led to more focussed data collection. Management became more
responsive to staff which allowed for more critical reflection during the fortnightly meetings.
In terms of the capability to deliver on development objectives, there has been a very slight
improvement in balancing quality and efficiency. RGVN improved the quality of its implementation
because of an improved MIS format, better planning, use of technology in accounting system and
fortnightly meetings. Efficiency improved because of the Project Finance Committee which helped
speed up the decision making process.
In the capability to relate, RGVN improved very slightly its relations with government departments as
they worked together more with government programmes. They also improved their relations with the
private sector through being involved in the national CSR hub.
Finally, RGVN revisited their strategies from a focus on microfinance to sustainable livelihood
enhancement. These new strategies were still in line with their vision and mission.
012345
Capability to actand commit
Capability toadapt and self-
renew
Capability todeliver on
developmentobjectives
Capability torelate
Capability toachieve
coherence Baseline
Endline
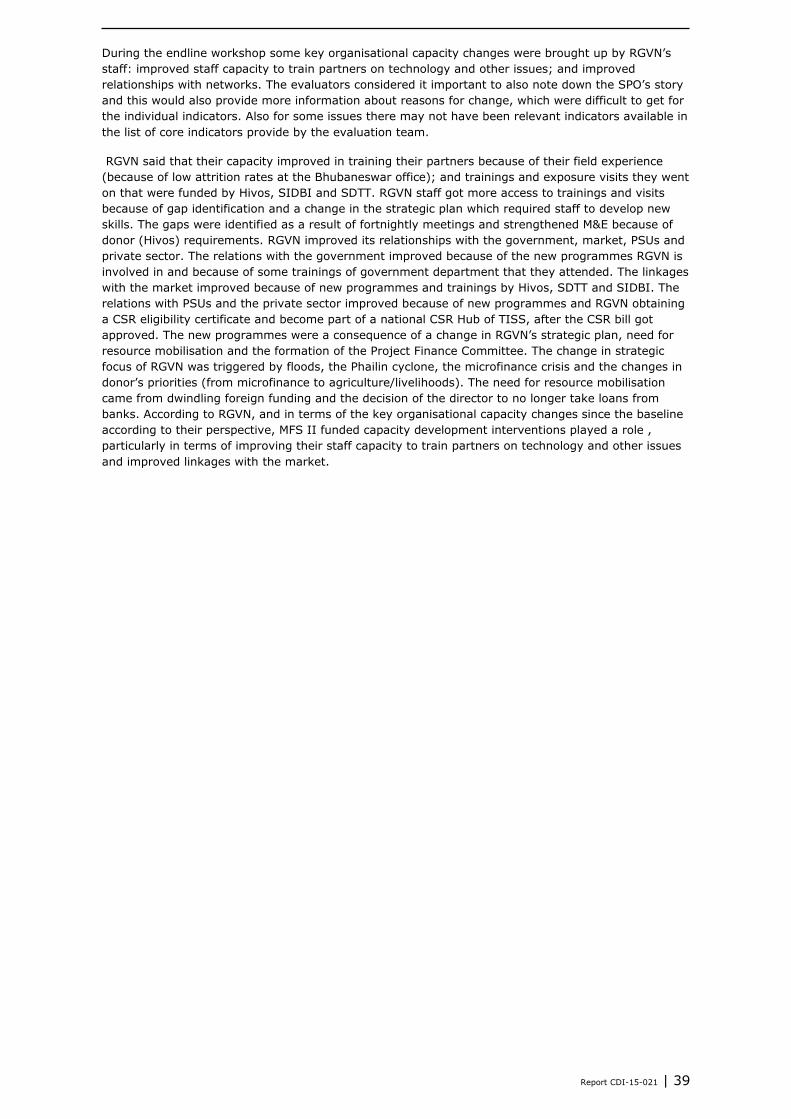
Report CDI-15-021 | 39
During the endline workshop some key organisational capacity changes were brought up by RGVN’s
staff: improved staff capacity to train partners on technology and other issues; and improved
relationships with networks. The evaluators considered it important to also note down the SPO’s story
and this would also provide more information about reasons for change, which were difficult to get for
the individual indicators. Also for some issues there may not have been relevant indicators available in
the list of core indicators provide by the evaluation team.
RGVN said that their capacity improved in training their partners because of their field experience
(because of low attrition rates at the Bhubaneswar office); and trainings and exposure visits they went
on that were funded by Hivos, SIDBI and SDTT. RGVN staff got more access to trainings and visits
because of gap identification and a change in the strategic plan which required staff to develop new
skills. The gaps were identified as a result of fortnightly meetings and strengthened M&E because of
donor (Hivos) requirements. RGVN improved its relationships with the government, market, PSUs and
private sector. The relations with the government improved because of the new programmes RGVN is
involved in and because of some trainings of government department that they attended. The linkages
with the market improved because of new programmes and trainings by Hivos, SDTT and SIDBI. The
relations with PSUs and the private sector improved because of new programmes and RGVN obtaining
a CSR eligibility certificate and become part of a national CSR Hub of TISS, after the CSR bill got
approved. The new programmes were a consequence of a change in RGVN’s strategic plan, need for
resource mobilisation and the formation of the Project Finance Committee. The change in strategic
focus of RGVN was triggered by floods, the Phailin cyclone, the microfinance crisis and the changes in
donor’s priorities (from microfinance to agriculture/livelihoods). The need for resource mobilisation
came from dwindling foreign funding and the decision of the director to no longer take loans from
banks. According to RGVN, and in terms of the key organisational capacity changes since the baseline
according to their perspective, MFS II funded capacity development interventions played a role ,
particularly in terms of improving their staff capacity to train partners on technology and other issues
and improved linkages with the market.
40 | Report CDI-15-021
References and Resources
Overall evaluation methodology
Bamberger, Michael. August 2012. Introduction to mixed methods in impact evaluation. Impact
evaluation notes, number 3.
Barrett, Jennifer, Paula Bilinsky, Caroline Desalos, Annemarie Groot Kormelinck, Dorothea Hillhorst,
Erik Kamphuis, Dieuwke Klaver. Cecile Kusters (CDI team leader 5C study), May 2012. Evaluation
methodology MFS II Country Evaluations. Capacity of Southern Partner Organisations (5C)
Component. Evaluation methodology for DRC, Ethiopia, India, Indonesia, Liberia and Uganda.
Beach, Derek and Rasmus Brun Pederson. 2013. Process tracing methods. Foundations and guidelines.
The University of Michigan Press.
Bennett, Andrew. 2005. The Guns That Didn’t Smoke: Ideas and the Soviet Non-Use of Force in 1989.
Journal of Cold War Studies 7 (2): 89-109.
Bennett, Andrew. 2008a. Process tracing: a Bayesian perspective. In The Oxford Handbook of Political
Methodology, ed. Janet M. Box-Steffensmeier, Henry E.Brady, and David Collier, 702-21. Oxford:
Oxford University Press.
Bennett, Andrew. 2008b. The Mother of All “Isms”: Organising Political Science around Causal
Mechanisms. In Revitalising Causality: Realism about Causality in Philosophy in Social Science, ed.
Ruth Groff, 205-19. London: Routledge. P. 52.
Checkle, Geoffrey T. 2008. Tracing Causal Mechanisms. International Studies Review 8 (2): 362-70.
Delahais, Thomas and Jacques Toulemonde. 2012. Applying contribution analysis: Lessons from five
years of practice. Evaluation July 2012 vol. 18 no. 3 281-293
George, Alexander L., and Andrew Bennett. 2005 . Case Studies and Theory Development in the Social
Sciences. Cambridge: MIT Press. P. 206-207.
Glennan, Steward S. 1996. Rethinking Mechanistic Explanation. Philosophy of Science 69: 342-53.
Kusters, Cecile S.L, with Nicky Buizer, Caroline Desalos, Dieuwke Klaver, Anja Wolsky , Bekti Andari,
Sam Gotomo, Bibhu Prasad Mohapatra, Sonam Sethi, Elias Zerfu. 2012. Operational guidelines
endline (draft). MFS II country evaluations. Capacity of Southern Partner Organisations (5C)
component. Centre for Development Innovation, Wageningen University and Research centre.
Lemire, Sebastian T., Steffen Bohni Nielsen and Line Dybdal. 2012. Making contribution analysis work: A practical framework for handling influencing factors and alternative explanations. Evaluation18(3) 294– 309. Sage Journals.
Mayne, John. 2012. Contribution analysis: Coming of age? Evaluation July 2012 vol. 18 no. 3 270-280
Rogers, Patricia. March 2012. Introduction to impact evaluation, Impact evaluation notes, number 1.
Stern, Elliott (Team Leader), Nicoletta Stame, John Mayne, Kim Forss, Rick Davies, Barbara Befani.
April 2012.‘ Broadening the range of designs and methods for impact evaluation. Report of a study
commissioned by the Department for International Development. DFID, Working Paper 32.
Woolcock, Michael. 9 October 2012. But How Generalizable is That? A Framework for Assessing the
Internal and External Validity of ‘Complex’ Development Interventions’. World Bank and Harvard
University. Presentation at DFID, East Kilbride, 9 October 2012.
Report CDI-15-021 | 41
Woolcock, Michael. 2009. Toward a plurality of methods in project evaluation: a contextualised
approach to understanding impact trajectories and efficacy, Journal of Development Effectiveness,
1:1, 1-14.
List of documents available:
1004806_RGVN_Approval of 2014 Annual Review Report.pdf
1004806_RGVN_Assessment of 2014 Annual Review Report.pdf
RGVN _ Additional information received - responses to questions raised in assesment letter (June
2014).doc
RGVN (1001449) Narrative action plan 2012-2013.doc
RGVN (1001449) Narrative Report and FAS_2011-2012___MFIB_.docx
RGVN (1001449) Budget April-June 2012.xls
Hivos assessment RGVN (1001449) FAS 2010-2011.docx
Hivos assessment RGVN (1001449) FAS 2011-2012 (draft).docx
Approval letter RGVN (1001449) Workplan and Budget Apr2012-Jun 2012.pdf
Approval letter RGVN (1001449) FAS and progress report 2011-12.pdf
Approval letter RGVN (1001449) Workplan and budget 2011-2012.pdf
Signed contract-hard copy1.pdf
Signed contract-hard copy.pdf
Approval FAS 2012-13.docx
Proposal-_HIVOS_by__RGVN-revised.doc
ARR + Work Plan 2013-14-15.docx
ARR+WP 12-13-14.docx
WORKPLAN-13-14.docx
2013-14 GE_RA_1.docx
2013-14 GE_RA_2.docx
2013-14 GE_RA_3.docx
Financial Audited report 2012-13.pdf
From FC-6 (12-13) 003-004.docx
MR-1213 001.jpg
RP-12-13 001.jpg
RP-12-13 002.jpg
RP-12-13 003.jpg
RP-12-13 004.jpg
RP-12-13 005.jpg
FAS add info.doc
FC-6(12-13) 001.jpg
FC-6(12-13) 002.jpg
FC-6(12-13) 003.jpg
FC-6(12-13) 004.jpg
FCRA and MR.docx
FCRA(12-13) 001.jpg
FCRA(12-13) 002.jpg
FCRA(12-13) 003.jpg
Fieldwork data:
Annex L_5c endline interview guide_subgroup_management_selected indicators RGVN.docx
5c endline self-assessment sheet_programme staff_India_RGVN.docx
5c endline self-assessment sheet__admin HRM Staff_India_RGVN.docx
5c endline self-assessment sheet_management_India_RGVN.docx
Annex K_5c endline workshop_key changes and factors_SPO perspective_country_RGVN.docx
ATTENDANCE SHEET for RGVN 19 & 20 AUG Workshop.docx
5c endline observation sheet - observations by in-country evaluators during the endline capacity
assessment at the SPO_RGVN.docx
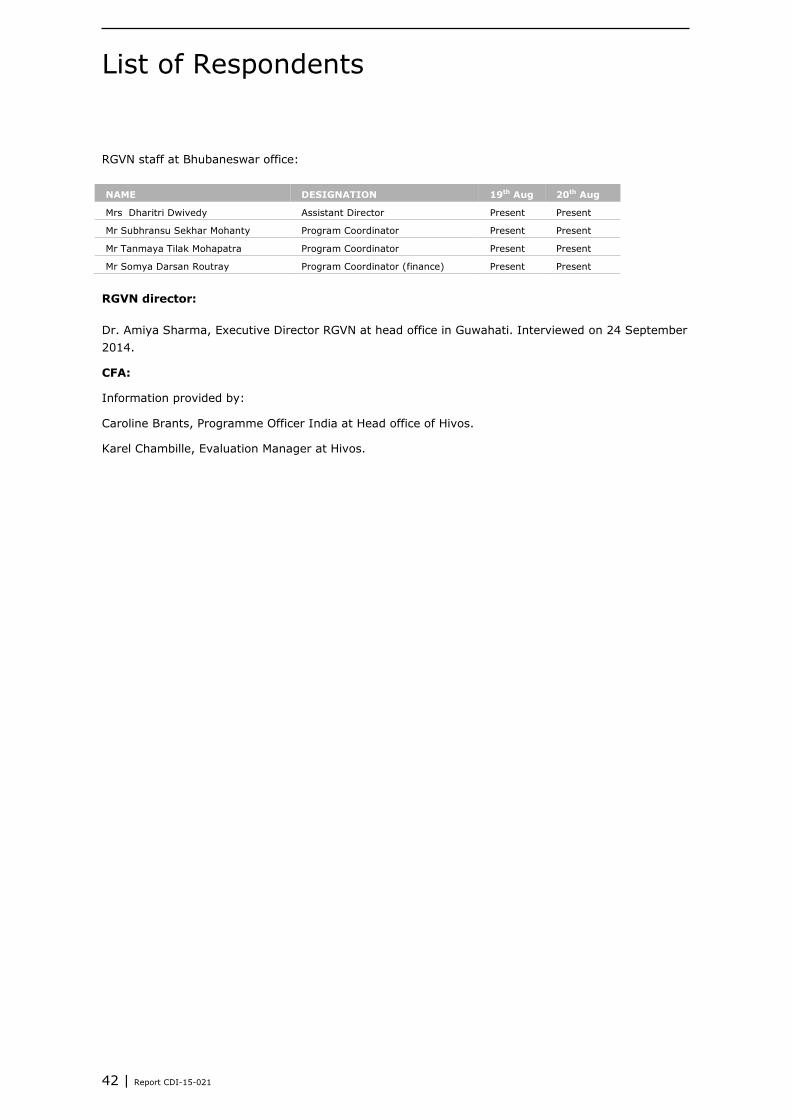
42 | Report CDI-15-021
List of Respondents
RGVN staff at Bhubaneswar office:
NAME DESIGNATION 19th Aug 20th Aug
Mrs Dharitri Dwivedy Assistant Director Present Present
Mr Subhransu Sekhar Mohanty Program Coordinator Present Present
Mr Tanmaya Tilak Mohapatra Program Coordinator Present Present
Mr Somya Darsan Routray Program Coordinator (finance) Present Present
RGVN director:
Dr. Amiya Sharma, Executive Director RGVN at head office in Guwahati. Interviewed on 24 September
2014.
CFA:
Information provided by:
Caroline Brants, Programme Officer India at Head office of Hivos.
Karel Chambille, Evaluation Manager at Hivos.
Report CDI-15-021 | 43
Methodological approach & Appendix 1
reflection
1. Introduction
This appendix describes the methodological design and challenges for the assessment of capacity
development of Southern Partner Organisations (SPOs), also called the ‘5C study’. This 5C study is
organised around four key evaluation questions:
1. What are the changes in partner organisations’ capacity during the 2012-2014 period?
2. To what degree are the changes identified in partner capacity attributable to development
interventions undertaken by the MFS II consortia (i.e. measuring effectiveness)?
3. Were the efforts of the MFS II consortia efficient?
4. What factors explain the findings drawn from the questions above?
It has been agreed that the question (3) around efficiency cannot be addressed for this 5C study. The
methodological approach for the other three questions is described below. At the end, a
methodological reflection is provided.
In terms of the attribution question (2), ‘process tracing’ is used. This is a theory-based approach that
has been applied to a selected number of SPOs since it is a very intensive and costly methodology,
although it provides rich information and can generate a lot of learning within the organisations. This
approach was presented and agreed-upon during the synthesis workshop on 17-18 June 2013 by the
5C teams for the eight countries of the MFS II evaluation. A more detailed description of the approach
was presented during the synthesis workshop in February 2014. The synthesis team, NWO-WOTRO,
the country project leaders and the MFS II organisations present at the workshop have accepted this
approach. It was agreed that this approach can only be used for a selected number of SPOs since it is
a very intensive and costly methodology. Key organisational capacity changes/ outcomes of the SPO
were identified, based on their relationship to the two selected capabilities, the capability to act and
commit the capability to adapt and self-renew, and an expected relationship with CFA supported
capacity development interventions (MFS II funding). It was agreed to focus on these two capabilities,
since these are the most targeted capabilities by the CFAs, as established during the baseline process.
Please find below an explanation of how the above-mentioned evaluation questions have been
addressed in the 5C evaluation.
Note: the methodological approach is applied to 4 countries that the Centre for Development
Innovation, Wageningen University and Research centre is involved in in terms of the 5C study
(Ethiopia, India, Indonesia, Liberia). The overall approach has been agreed with all the 8 countries
selected for this MFS II evaluation. The 5C country teams have been trained and coached on this
methodological approach during the evaluation process. Details specific to the SPO are described in
chapter 5.1 of the SPO report. At the end of this appendix a brief methodological reflection is
provided.
2. Changes in partner organisation’s capacity –
evaluation question 1
This section describes the data collection and analysis methodology for answering the first evaluation
question: What are the changes in partner organisations’ capacity during the 2012-2014
period?
This question was mainly addressed by reviewing changes in 5c indicators, but additionally a ‘general
causal map’ based on the SPO perspective on key organisational capacity changes since the baseline
44 | Report CDI-15-021
has been developed. Each of these is further explained below. The development of the general causal
map is integrated in the steps for the endline workshop, as mentioned below.
During the baseline in 2012 information has been collected on each of the 33 agreed upon indicators
for organisational capacity. For each of the five capabilities of the 5C framework indicators have been
developed as can be seen in Appendix 2. During this 5C baseline, a summary description has been
provided for each of these indicators, based on document review and the information provided by
staff, the Co-financing Agency (CFA) and other external stakeholders. Also a summary description has
been provided for each capability. The results of these can be read in the baseline reports.
The description of indicators for the baseline in 2012 served as the basis for comparison during the
endline in 2014. In practice this meant that largely the same categories of respondents (preferably the
same respondents as during the baseline) were requested to review the descriptions per indicator and
indicate whether and how the endline situation (2014) is different from the described situation in
2012.7 Per indicator they could indicate whether there was an improvement or deterioration or no
change and also describe these changes. Furthermore, per indicator the interviewee could indicate
what interventions, actors and other factors explain this change compared to the baseline situation.
See below the specific questions that are asked for each of the indicators. Per category of interviewees
there is a different list of indicators to be looked at. For example, staff members were presented with
a list of all the indicators, whilst external people, for example partners, are presented with a select
number of indicators, relevant to the stakeholder.
The information on the indicators was collected in different ways:
1) Endline workshop at the SPO - self-assessment and ‘general causal map’: similar to data
collection during the baseline, different categories of staff (as much as possible the same people
as during the baseline) were brought together in a workshop and requested to respond, in their
staff category, to the list of questions for each of the indicators (self-assessment sheet). Prior to
carrying out the self-assessments, a brainstorming sessions was facilitated to develop a ‘general
causal map’, based on the key organisational capacity changes since the baseline as perceived by
SPO staff. Whilst this general causal map is not validated with additional information, it provides a
sequential narrative, based on organisational capacity changes as perceived by SPO staff;
2) Interviews with staff members: additional to the endline workshop, interviews were held with
SPO staff, either to provide more in-depth information on the information provided on the self-
assessment formats during the workshop, or as a separate interview for staff members that were
not present during the endline workshop;
3) Interviews with externals: different formats were developed for different types of external
respondents, especially the co-financing agency (CFA), but also partner agencies, and
organisational development consultants where possible. These externals were interviewed, either
face-to-face or by phone/Skype. The interview sheets were sent to the respondents and if they
wanted, these could be filled in digitally and followed up on during the interview;
4) Document review: similar to the baseline in 2012, relevant documents were reviewed so as to
get information on each indicator. Documents to be reviewed included progress reports,
evaluation reports, training reports, etc. (see below) since the baseline in 2012, so as to identify
changes in each of the indicators;
5) Observation: similar to what was done in 2012, also in 2014 the evaluation team had a list with
observable indicators which were to be used for observation during the visit to the SPO.
Below the key steps to assess changes in indicators are described.
7 The same categories were used as during the baseline (except beneficiaries, other funders): staff categories including
management, programme staff, project staff, monitoring and evaluation staff, field staff, administration staff; stakeholder
categories including co-financing agency (CFA), consultants, partners.
Report CDI-15-021 | 45
Key steps to assess changes in indicators are described 16. Provide the description of indicators in the relevant formats – CDI team
17. Review the descriptions per indicator – in-country team & CDI team
18. Send the formats adapted to the SPO to CFA and SPO – in-country team (formats for SPO) and
CDI team (formats for CFA)
19. Collect, upload & code the documents from CFA and SPO in NVivo – CDI team
20. Organise the field visit to the SPO – in-country team
21. Interview the CFA – CDI team
22. Run the endline workshop with the SPO – in-country team
23. Interview SPO staff – in-country team
24. Fill-in observation sheets – in-country team
25. Interview externals – in-country team
26. Upload and auto-code all the formats collected by in-country team and CDI team in NVivo – CDI
team
27. Provide to the overview of information per 5c indicator to in-country team – CDI team
28. Analyse data and develop a draft description of the findings per indicator and for the general
questions – in-country team
29. Analyse data and develop a final description of the findings per indicator and per capability and for
the general questions – CDI team
30. Analyse the information in the general causal map –in-country team and CDI-team
Note: the CDI team include the Dutch 5c country coordinator as well as the overall 5c coordinator for
the four countries (Ethiopia, India, Indonesia, Liberia). The 5c country report is based on the separate
SPO reports.
Below each of these steps is further explained.
Step 1. Provide the description of indicators in the relevant formats – CDI team
These formats were to be used when collecting data from SPO staff, CFA, partners, and consultants.
For each of these respondents different formats have been developed, based on the list of 5C
indicators, similar to the procedure that was used during the baseline assessment. The CDI team
needed to add the 2012 baseline description of each indicator. The idea was that each respondent
would be requested to review each description per indicator, and indicate whether the current
situation is different from the baseline situation, how this situation has changed, and what the
reasons for the changes in indicators are. At the end of each format, a more general question is
added that addresses how the organisation has changed its capacity since the baseline, and what
possible reasons for change exist. Please see below the questions asked for each indicator as well as
the more general questions at the end of the list of indicators.
46 | Report CDI-15-021
General questions about key changes in the capacity of the SPO
What do you consider to be the key changes in terms of how the organisation/ SPO has developed its
capacity since the baseline (2012)?
What do you consider to be the main explanatory reasons (interventions, actors or factors) for these
changes?
List of questions to be asked for each of the 5C indicators (The entry point is the the description of
each indicator as in the 2012 baseline report):
1. How has the situation of this indicator changed compared to the situation during the baseline in
2012? Please tick one of the following scores:
o -2 = Considerable deterioration
o -1 = A slight deterioration
o 0 = No change occurred, the situation is the same as in 2012
o +1 = Slight improvement
o +2 = Considerable improvement
2. Please describe what exactly has changed since the baseline in 2012
3. What interventions, actors and other factors explain this change compared to the baseline situation
in 2012? Please tick and describe what interventions, actors or factors influenced this indicator, and
how. You can tick and describe more than one choice.
o Intervention, actor or factor at the level of or by SPO: ...... .
o Intervention, actor or factor at the level of or by the Dutch CFA (MFS II funding): .... .
o Intervention, actor or factor at the level of or by the other funders: ...... .
o Other interventions, actors or factors: ...... .
o Don’t know.
Step 2. Review the descriptions per indicator – in-country team & CDI team
Before the in-country team and the CDI team started collecting data in the field, it was important that
they reviewed the description for each indicator as described in the baseline reports, and also added to
the endline formats for review by respondents. These descriptions are based on document review,
observation, interviews with SPO staff, CFA staff and external respondents during the baseline. It was
important to explain this to respondents before they filled in the formats.
Step 3. Send the formats adapted to the SPO to CFA and SPO – in-country team (formats for SPO)
and CDI team (formats for CFA)
The CDI team was responsible for collecting data from the CFA:
5C Endline assessment Dutch co-financing organisation;
5C Endline support to capacity sheet – CFA perspective.
The in-country team was responsible for collecting data from the SPO and from external respondents
(except CFA). The following formats were sent before the fieldwork started:
5C Endline support to capacity sheet – SPO perspective.
5C Endline interview guides for externals: partners; OD consultants.
Step 4. Collect, upload & code the documents from CFA and SPO in NVivo – CDI team
The CDI team, in collaboration with the in-country team, collected the following documents from SPOs
and CFAs:
Project documents: project proposal, budget, contract (Note that for some SPOs there is a contract
for the full MFS II period 2011-2015; for others there is a yearly or 2-yearly contract. All new
contracts since the baseline in 2012 will need to be collected);
Technical and financial progress reports since the baseline in 2012;.
Report CDI-15-021 | 47
Mid-term evaluation reports;
End of project-evaluation reports (by the SPO itself or by external evaluators);
Contract intake forms (assessments of the SPO by the CFA) or organisational assessment scans
made by the CFA that cover the 2011-2014 period;
Consultant reports on specific inputs provided to the SPO in terms of organisational capacity
development;
Training reports (for the SPO; for alliance partners, including the SPO);
Organisational scans/ assessments, carried out by the CFA or by the Alliance Assessments;
Monitoring protocol reports, especially for the 5C study carried out by the MFS II Alliances;
Annual progress reports of the CFA and of the Alliance in relation to capacity development of the
SPOs in the particular country;
Specific reports that are related to capacity development of SPOs in a particular country.
The following documents (since the baseline in 2012) were requested from SPO:
Annual progress reports;
Annual financial reports and audit reports;
Organisational structure vision and mission since the baseline in 2012;
Strategic plans;
Business plans;
Project/ programme planning documents;
Annual work plan and budgets;
Operational manuals;
Organisational and policy documents: finance, human resource development, etc.;
Monitoring and evaluation strategy and implementation plans;
Evaluation reports;
Staff training reports;
Organisational capacity reports from development consultants.
The CDI team will coded these documents in NVivo (qualitative data analysis software program)
against the 5C indicators.
Step 5. Prepare and organise the field visit to the SPO – in-country team
Meanwhile the in-country team prepared and organised the logistics for the field visit to the SPO:
General endline workshop consisted about one day for the self-assessments (about ½ to ¾ of the
day) and brainstorm (about 1 to 2 hours) on key organisational capacity changes since the baseline
and underlying interventions, factors and actors (‘general causal map’), see also explanation below.
This was done with the five categories of key staff: managers; project/ programme staff; monitoring
and evaluation staff; admin & HRM staff; field staff. Note: for SPOs involved in process tracing an
additional 1 to 1½ day workshop (managers; program/project staff; monitoring and evaluation staff)
was necessary. See also step 7;
Interviews with SPO staff (roughly one day);
Interviews with external respondents such as partners and organisational development
consultants depending on their proximity to the SPO. These interviews coulc be scheduled after the
endline workshop and interviews with SPO staff.
General causal map
During the 5C endline process, a ‘general causal map’ has been developed, based on key organisational capacity changes and
underlying causes for these changes, as perceived by the SPO. The general causal map describes cause-effect relationships,
and is described both as a visual as well as a narrative.
As much as possible the same people that were involved in the baseline were also involved in the
endline workshop and interviews.
48 | Report CDI-15-021
Step 6. Interview the CFA – CDI team
The CDI team was responsible for sending the sheets/ formats to the CFA and for doing a follow-up
interview on the basis of the information provided so as to clarify or deepen the information provided.
This relates to:
5C Endline assessment Dutch co-financing organisation;
5C Endline support to capacity sheet - CFA perspective.
Step 7. Run the endline workshop with the SPO – in-country team
This included running the endline workshop, including facilitation of the development of the general
causal map, self-assessments, interviews and observations. Particularly for those SPOs that were
selected for process tracing all the relevant information needed to be analysed prior to the field visit,
so as to develop an initial causal map. Please see Step 6 and also the next section on process tracing
(evaluation question two).
An endline workshop with the SPO was intended to:
Explain the purpose of the fieldwork;
Carry out in the self-assessments by SPO staff subgroups (unless these have already been filled
prior to the field visits) - this may take some 3 hours.
Facilitate a brainstorm on key organisational capacity changes since the baseline in 2012 and
underlying interventions, factors and actors.
Purpose of the fieldwork: to collect data that help to provide information on what changes took
place in terms of organisational capacity development of the SPO as well as reasons for these
changes. The baseline that was carried out in 2012 was to be used as a point of reference.
Brainstorm on key organisational capacity changes and influencing factors: a brainstorm was
facilitated on key organisational capacity changes since the baseline in 2012. In order to kick start the
discussion, staff were reminded of the key findings related to the historical time line carried out in the
baseline (vision, mission, strategies, funding, staff). This was then used to generate a discussion on
key changes that happened in the organisation since the baseline (on cards). Then cards were
selected that were related to organisational capacity changes, and organised. Then a ‘general causal
map’ was developed, based on these key organisational capacity changes and underlying reasons for
change as experienced by the SPO staff. This was documented as a visual and narrative.This general
causal map was to get the story of the SPO on what they perceived as key organisational capacity
changes in the organisation since the baseline, in addition to the specific details provided per
indicator.
Self-assessments: respondents worked in the respective staff function groups: management;
programme/ project staff; monitoring and evaluation staff; admin and HRM staff; field staff. Staff
were assisted where necessary so that they could really understand what it was they were being
asked to do as well as what the descriptions under each indicator meant.
Note: for those SPOs selected for process tracing an additional endline workshop was held to facilitate
the development of detailed causal maps for each of the identified organisational change/ outcome
areas that fall under the capability to act and commit, and under the capability to adapt and self-
renew, and that are likely related to capacity development interventions by the CFA. See also the next
section on process tracing (evaluation question two). It was up to the in-country team whether this
workshop was held straight after the initial endline workshop or after the workshop and the follow-up
interviews. It could also be held as a separate workshop at another time.
Step 8. Interview SPO staff – in-country team
After the endline workshop (developing the general causal map and carrying out self-assessments in
subgroups), interviews were held with SPO staff (subgroups) to follow up on the information that was
provided in the self-assessment sheets, and to interview staff that had not yet provided any
information.
Report CDI-15-021 | 49
Step 9. Fill-in observation sheets – in-country team
During the visit at the SPO, the in-country team had to fill in two sheets based on their observation:
5C Endline observation sheet;
5C Endline observable indicators.
Step 10. Interview externals – in-country team & CDI team
The in-country team also needed to interview the partners of the SPO as well as organisational
capacity development consultants that have provided support to the SPO. The CDI team interviewed
the CFA.
Step 11. Upload and auto-code all the formats collected by in-country team and CDI team – CDI
team
The CDI team was responsible for uploading and auto-coding (in Nvivo) of the documents that were
collected by the in-country team and by the CDI team.
Step 12. Provide the overview of information per 5C indicator to in-country team – CDI team
After the analysis in NVivo, the CDI team provided a copy of all the information generated per
indicator to the in-country team for initial analysis.
Step 13. Analyse the data and develop a draft description of the findings per indicator and for
the general questions – in-country team
The in-country team provided a draft description of the findings per indicator, based on the
information generated per indicator. The information generated under the general questions were
linked to the general causal map or detailed process tracing related causal map.
Step 14. Analyse the data and finalize the description of the findings per indicator, per capability
and general – CDI team
The CDI team was responsible for checking the analysis by the in-country team with the Nvivo
generated data and to make suggestions for improvement and ask questions for clarification to which
the in-country team responded. The CDI team then finalised the analysis and provided final
descriptions and scores per indicator and also summarize these per capability and calculated the
summary capability scores based on the average of all indicators by capability.
Step 15. Analyse the information in the general causal map –in-country team & CDI team
The general causal map based on key organisational capacity changes as perceived by the SPO staff
present at the workshop, was further detailed by in-country team and CDI team, and based on the
notes made during the workshop and where necessary additional follow up with the SPO. The visual
and narrative was finalized after feedback by the SPO. During analysis of the general causal map
relationships with MFS II support for capacity development and other factors and actors were
identified. All the information has been reviewed by the SPO and CFA.
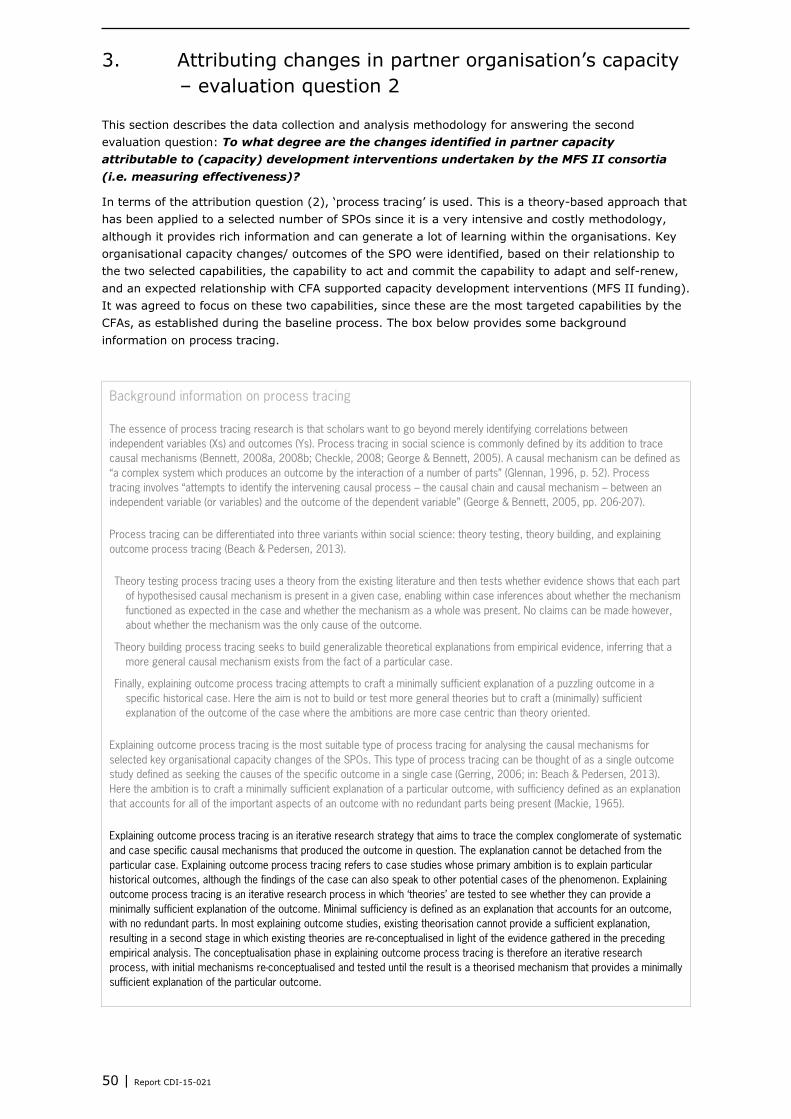
50 | Report CDI-15-021
3. Attributing changes in partner organisation’s capacity
– evaluation question 2
This section describes the data collection and analysis methodology for answering the second
evaluation question: To what degree are the changes identified in partner capacity
attributable to (capacity) development interventions undertaken by the MFS II consortia
(i.e. measuring effectiveness)?
In terms of the attribution question (2), ‘process tracing’ is used. This is a theory-based approach that
has been applied to a selected number of SPOs since it is a very intensive and costly methodology,
although it provides rich information and can generate a lot of learning within the organisations. Key
organisational capacity changes/ outcomes of the SPO were identified, based on their relationship to
the two selected capabilities, the capability to act and commit the capability to adapt and self-renew,
and an expected relationship with CFA supported capacity development interventions (MFS II funding).
It was agreed to focus on these two capabilities, since these are the most targeted capabilities by the
CFAs, as established during the baseline process. The box below provides some background
information on process tracing.
Background information on process tracing
The essence of process tracing research is that scholars want to go beyond merely identifying correlations between
independent variables (Xs) and outcomes (Ys). Process tracing in social science is commonly defined by its addition to trace
causal mechanisms (Bennett, 2008a, 2008b; Checkle, 2008; George & Bennett, 2005). A causal mechanism can be defined as
“a complex system which produces an outcome by the interaction of a number of parts” (Glennan, 1996, p. 52). Process
tracing involves “attempts to identify the intervening causal process – the causal chain and causal mechanism – between an
independent variable (or variables) and the outcome of the dependent variable” (George & Bennett, 2005, pp. 206-207).
Process tracing can be differentiated into three variants within social science: theory testing, theory building, and explaining
outcome process tracing (Beach & Pedersen, 2013).
Theory testing process tracing uses a theory from the existing literature and then tests whether evidence shows that each part
of hypothesised causal mechanism is present in a given case, enabling within case inferences about whether the mechanism
functioned as expected in the case and whether the mechanism as a whole was present. No claims can be made however,
about whether the mechanism was the only cause of the outcome.
Theory building process tracing seeks to build generalizable theoretical explanations from empirical evidence, inferring that a
more general causal mechanism exists from the fact of a particular case.
Finally, explaining outcome process tracing attempts to craft a minimally sufficient explanation of a puzzling outcome in a
specific historical case. Here the aim is not to build or test more general theories but to craft a (minimally) sufficient
explanation of the outcome of the case where the ambitions are more case centric than theory oriented.
Explaining outcome process tracing is the most suitable type of process tracing for analysing the causal mechanisms for
selected key organisational capacity changes of the SPOs. This type of process tracing can be thought of as a single outcome
study defined as seeking the causes of the specific outcome in a single case (Gerring, 2006; in: Beach & Pedersen, 2013).
Here the ambition is to craft a minimally sufficient explanation of a particular outcome, with sufficiency defined as an explanation
that accounts for all of the important aspects of an outcome with no redundant parts being present (Mackie, 1965).
Explaining outcome process tracing is an iterative research strategy that aims to trace the complex conglomerate of systematic
and case specific causal mechanisms that produced the outcome in question. The explanation cannot be detached from the
particular case. Explaining outcome process tracing refers to case studies whose primary ambition is to explain particular
historical outcomes, although the findings of the case can also speak to other potential cases of the phenomenon. Explaining
outcome process tracing is an iterative research process in which ‘theories’ are tested to see whether they can provide a
minimally sufficient explanation of the outcome. Minimal sufficiency is defined as an explanation that accounts for an outcome,
with no redundant parts. In most explaining outcome studies, existing theorisation cannot provide a sufficient explanation,
resulting in a second stage in which existing theories are re-conceptualised in light of the evidence gathered in the preceding
empirical analysis. The conceptualisation phase in explaining outcome process tracing is therefore an iterative research
process, with initial mechanisms re-conceptualised and tested until the result is a theorised mechanism that provides a minimally
sufficient explanation of the particular outcome.
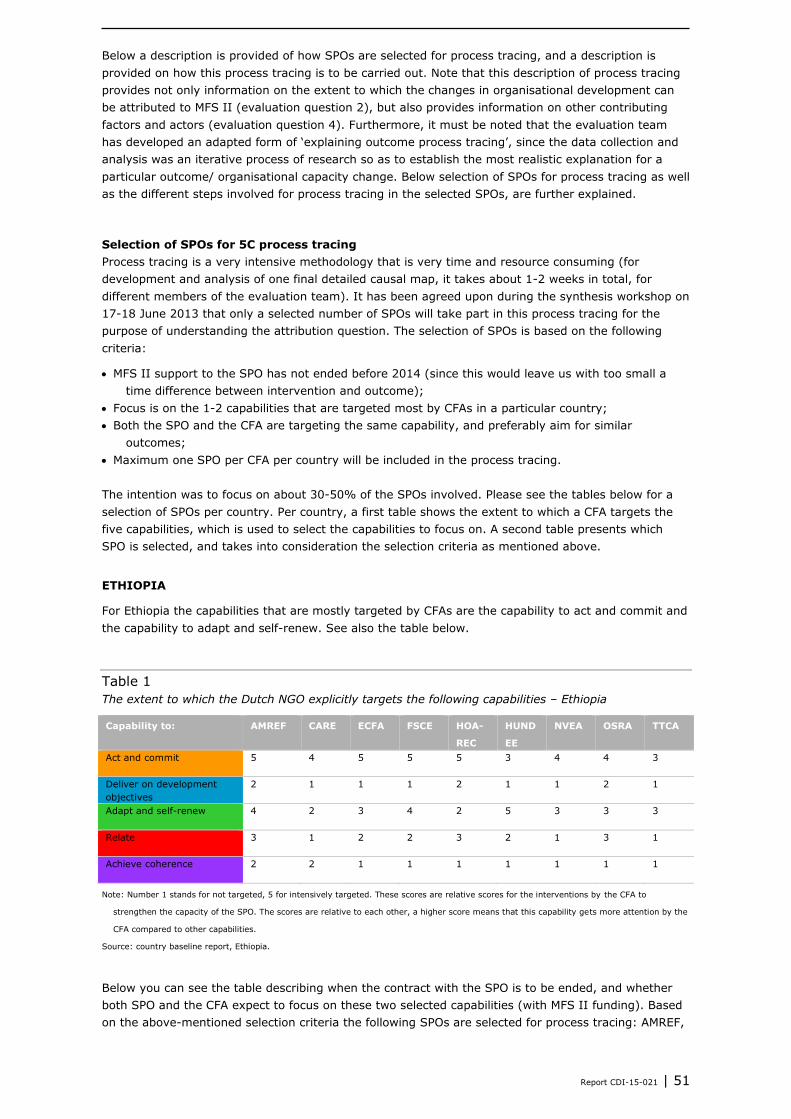
Report CDI-15-021 | 51
Below a description is provided of how SPOs are selected for process tracing, and a description is
provided on how this process tracing is to be carried out. Note that this description of process tracing
provides not only information on the extent to which the changes in organisational development can
be attributed to MFS II (evaluation question 2), but also provides information on other contributing
factors and actors (evaluation question 4). Furthermore, it must be noted that the evaluation team
has developed an adapted form of ‘explaining outcome process tracing’, since the data collection and
analysis was an iterative process of research so as to establish the most realistic explanation for a
particular outcome/ organisational capacity change. Below selection of SPOs for process tracing as well
as the different steps involved for process tracing in the selected SPOs, are further explained.
Selection of SPOs for 5C process tracing
Process tracing is a very intensive methodology that is very time and resource consuming (for
development and analysis of one final detailed causal map, it takes about 1-2 weeks in total, for
different members of the evaluation team). It has been agreed upon during the synthesis workshop on
17-18 June 2013 that only a selected number of SPOs will take part in this process tracing for the
purpose of understanding the attribution question. The selection of SPOs is based on the following
criteria:
MFS II support to the SPO has not ended before 2014 (since this would leave us with too small a
time difference between intervention and outcome);
Focus is on the 1-2 capabilities that are targeted most by CFAs in a particular country;
Both the SPO and the CFA are targeting the same capability, and preferably aim for similar
outcomes;
Maximum one SPO per CFA per country will be included in the process tracing.
The intention was to focus on about 30-50% of the SPOs involved. Please see the tables below for a
selection of SPOs per country. Per country, a first table shows the extent to which a CFA targets the
five capabilities, which is used to select the capabilities to focus on. A second table presents which
SPO is selected, and takes into consideration the selection criteria as mentioned above.
ETHIOPIA
For Ethiopia the capabilities that are mostly targeted by CFAs are the capability to act and commit and
the capability to adapt and self-renew. See also the table below.
Table 1
The extent to which the Dutch NGO explicitly targets the following capabilities – Ethiopia
Capability to: AMREF CARE ECFA FSCE HOA-
REC
HUND
EE
NVEA OSRA TTCA
Act and commit 5 4 5 5 5 3 4 4 3
Deliver on development
objectives
2 1 1 1 2 1 1 2 1
Adapt and self-renew 4 2 3 4 2 5 3 3 3
Relate 3 1 2 2 3 2 1 3 1
Achieve coherence 2 2 1 1 1 1 1 1 1
Note: Number 1 stands for not targeted, 5 for intensively targeted. These scores are relative scores for the interventions by the CFA to
strengthen the capacity of the SPO. The scores are relative to each other, a higher score means that this capability gets more attention by the
CFA compared to other capabilities.
Source: country baseline report, Ethiopia.
Below you can see the table describing when the contract with the SPO is to be ended, and whether
both SPO and the CFA expect to focus on these two selected capabilities (with MFS II funding). Based
on the above-mentioned selection criteria the following SPOs are selected for process tracing: AMREF,
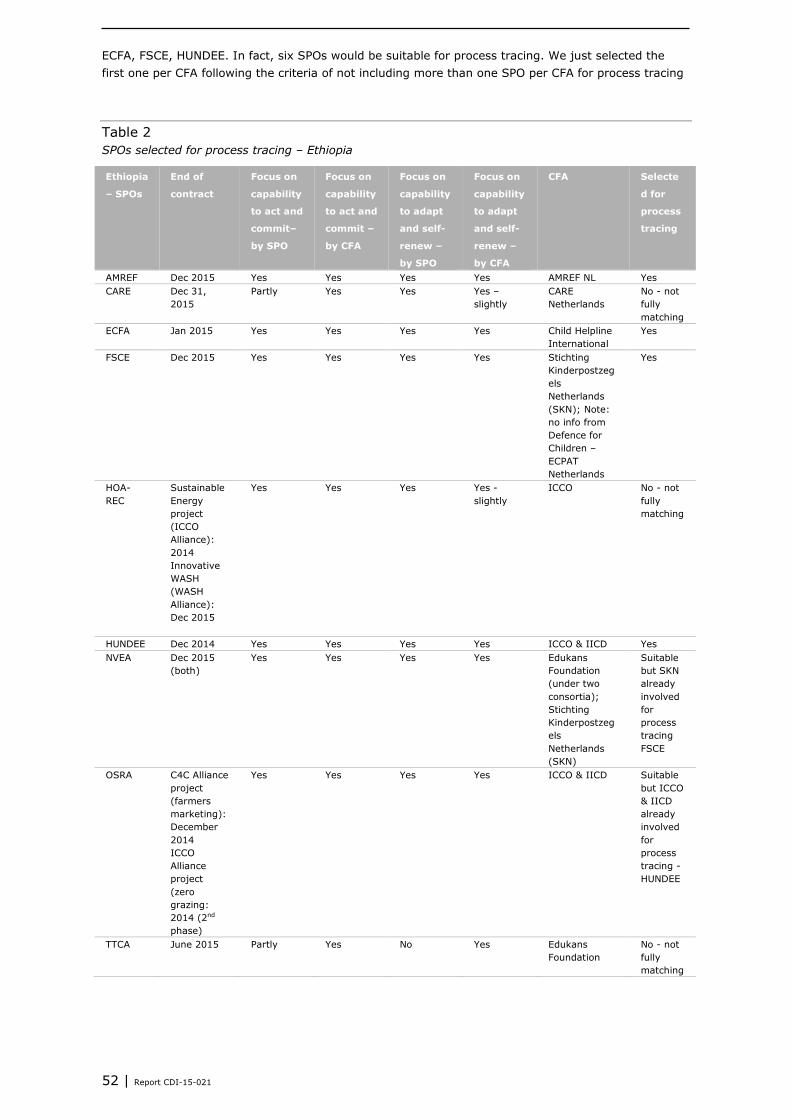
52 | Report CDI-15-021
ECFA, FSCE, HUNDEE. In fact, six SPOs would be suitable for process tracing. We just selected the
first one per CFA following the criteria of not including more than one SPO per CFA for process tracing
Table 2
SPOs selected for process tracing – Ethiopia
Ethiopia
– SPOs
End of
contract
Focus on
capability
to act and
commit–
by SPO
Focus on
capability
to act and
commit –
by CFA
Focus on
capability
to adapt
and self-
renew –
by SPO
Focus on
capability
to adapt
and self-
renew –
by CFA
CFA Selecte
d for
process
tracing
AMREF Dec 2015 Yes Yes Yes Yes AMREF NL Yes
CARE Dec 31,
2015
Partly Yes Yes Yes –
slightly
CARE
Netherlands
No - not
fully
matching
ECFA Jan 2015 Yes Yes Yes Yes Child Helpline
International
Yes
FSCE Dec 2015 Yes Yes Yes Yes Stichting
Kinderpostzeg
els
Netherlands
(SKN); Note:
no info from
Defence for
Children –
ECPAT
Netherlands
Yes
HOA-
REC
Sustainable
Energy
project
(ICCO
Alliance):
2014
Innovative
WASH
(WASH
Alliance):
Dec 2015
Yes Yes Yes Yes -
slightly
ICCO No - not
fully
matching
HUNDEE Dec 2014 Yes Yes Yes Yes ICCO & IICD Yes
NVEA Dec 2015
(both)
Yes Yes Yes Yes Edukans
Foundation
(under two
consortia);
Stichting
Kinderpostzeg
els
Netherlands
(SKN)
Suitable
but SKN
already
involved
for
process
tracing
FSCE
OSRA C4C Alliance
project
(farmers
marketing):
December
2014
ICCO
Alliance
project
(zero
grazing:
2014 (2nd
phase)
Yes Yes Yes Yes ICCO & IICD Suitable
but ICCO
& IICD
already
involved
for
process
tracing -
HUNDEE
TTCA June 2015 Partly Yes No Yes Edukans
Foundation
No - not
fully
matching
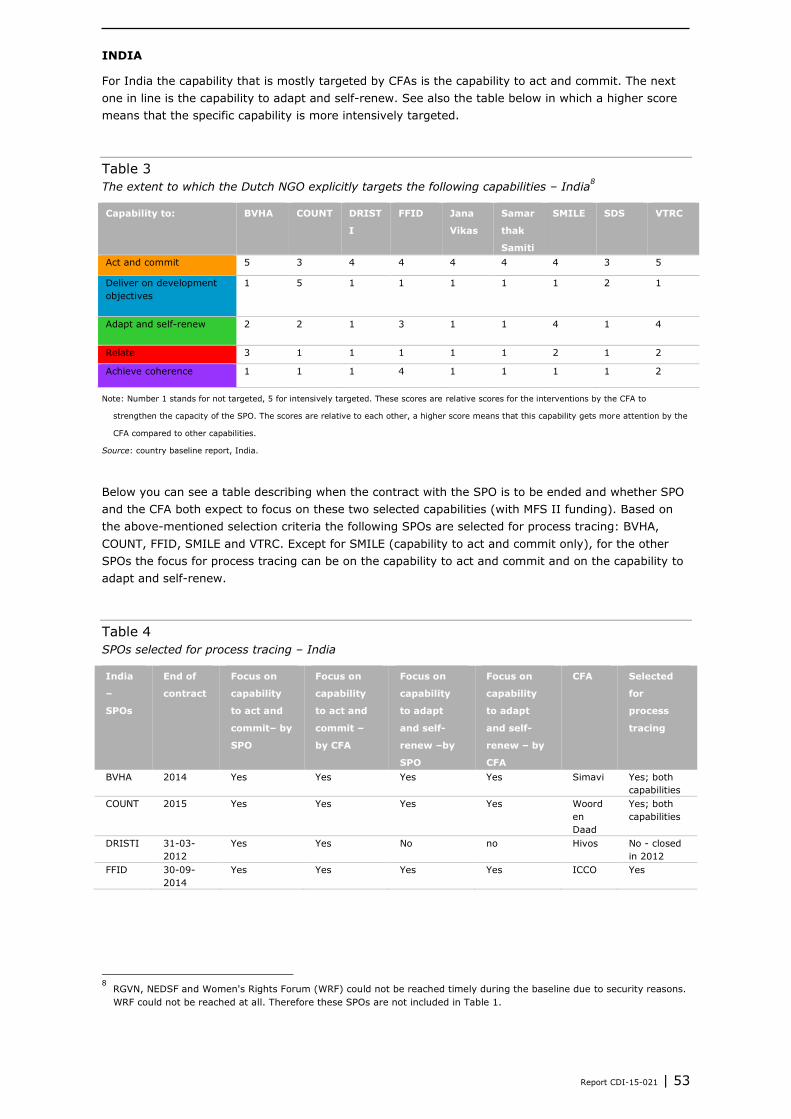
Report CDI-15-021 | 53
INDIA
For India the capability that is mostly targeted by CFAs is the capability to act and commit. The next
one in line is the capability to adapt and self-renew. See also the table below in which a higher score
means that the specific capability is more intensively targeted.
Table 3
The extent to which the Dutch NGO explicitly targets the following capabilities – India8
Capability to: BVHA COUNT DRIST
I
FFID Jana
Vikas
Samar
thak
Samiti
SMILE SDS VTRC
Act and commit 5 3 4 4 4 4 4 3 5
Deliver on development
objectives
1 5 1 1 1 1 1 2 1
Adapt and self-renew 2 2 1 3 1 1 4 1 4
Relate 3 1 1 1 1 1 2 1 2
Achieve coherence 1 1 1 4 1 1 1 1 2
Note: Number 1 stands for not targeted, 5 for intensively targeted. These scores are relative scores for the interventions by the CFA to
strengthen the capacity of the SPO. The scores are relative to each other, a higher score means that this capability gets more attention by the
CFA compared to other capabilities.
Source: country baseline report, India.
Below you can see a table describing when the contract with the SPO is to be ended and whether SPO
and the CFA both expect to focus on these two selected capabilities (with MFS II funding). Based on
the above-mentioned selection criteria the following SPOs are selected for process tracing: BVHA,
COUNT, FFID, SMILE and VTRC. Except for SMILE (capability to act and commit only), for the other
SPOs the focus for process tracing can be on the capability to act and commit and on the capability to
adapt and self-renew.
Table 4
SPOs selected for process tracing – India
India
–
SPOs
End of
contract
Focus on
capability
to act and
commit– by
SPO
Focus on
capability
to act and
commit –
by CFA
Focus on
capability
to adapt
and self-
renew –by
SPO
Focus on
capability
to adapt
and self-
renew – by
CFA
CFA Selected
for
process
tracing
BVHA 2014 Yes Yes Yes Yes Simavi Yes; both
capabilities
COUNT 2015 Yes Yes Yes Yes Woord
en
Daad
Yes; both
capabilities
DRISTI 31-03-
2012
Yes Yes No no Hivos No - closed
in 2012
FFID 30-09-
2014
Yes Yes Yes Yes ICCO Yes
8 RGVN, NEDSF and Women's Rights Forum (WRF) could not be reached timely during the baseline due to security reasons.
WRF could not be reached at all. Therefore these SPOs are not included in Table 1.
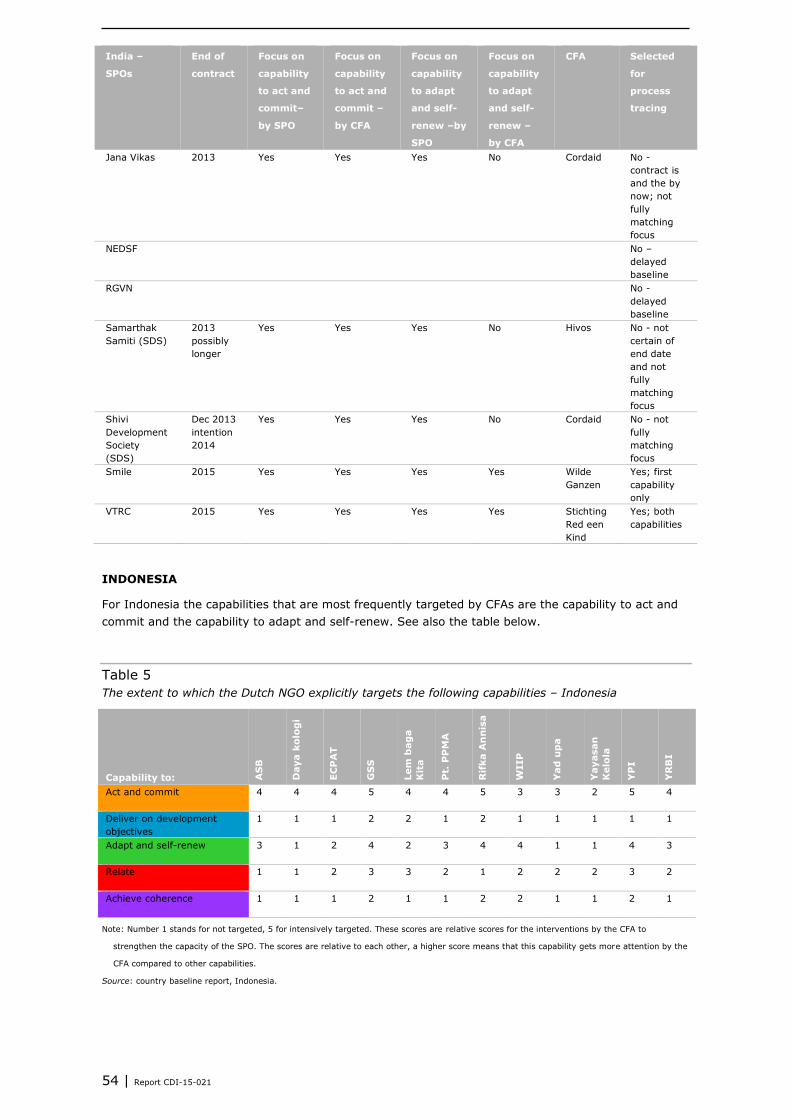
54 | Report CDI-15-021
India –
SPOs
End of
contract
Focus on
capability
to act and
commit–
by SPO
Focus on
capability
to act and
commit –
by CFA
Focus on
capability
to adapt
and self-
renew –by
SPO
Focus on
capability
to adapt
and self-
renew –
by CFA
CFA Selected
for
process
tracing
Jana Vikas 2013 Yes Yes Yes No Cordaid No -
contract is
and the by
now; not
fully
matching
focus
NEDSF No –
delayed
baseline
RGVN No -
delayed
baseline
Samarthak
Samiti (SDS)
2013
possibly
longer
Yes Yes Yes No Hivos No - not
certain of
end date
and not
fully
matching
focus
Shivi
Development
Society
(SDS)
Dec 2013
intention
2014
Yes Yes Yes No Cordaid No - not
fully
matching
focus
Smile 2015 Yes Yes Yes Yes Wilde
Ganzen
Yes; first
capability
only
VTRC 2015 Yes Yes Yes Yes Stichting
Red een
Kind
Yes; both
capabilities
INDONESIA
For Indonesia the capabilities that are most frequently targeted by CFAs are the capability to act and
commit and the capability to adapt and self-renew. See also the table below.
Table 5
The extent to which the Dutch NGO explicitly targets the following capabilities – Indonesia
Capability to: AS
B
Daya k
olo
gi
EC
PA
T
GS
S
Lem
bag
a
Kit
a
Pt.
PP
MA
Rif
ka A
nn
isa
WIIP
Yad
up
a
Yayasan
Kelo
la
YP
I
YR
BI
Act and commit 4 4 4 5 4 4 5 3 3 2 5 4
Deliver on development
objectives
1 1 1 2 2 1 2 1 1 1 1 1
Adapt and self-renew 3 1 2 4 2 3 4 4 1 1 4 3
Relate 1 1 2 3 3 2 1 2 2 2 3 2
Achieve coherence 1 1 1 2 1 1 2 2 1 1 2 1
Note: Number 1 stands for not targeted, 5 for intensively targeted. These scores are relative scores for the interventions by the CFA to
strengthen the capacity of the SPO. The scores are relative to each other, a higher score means that this capability gets more attention by the
CFA compared to other capabilities.
Source: country baseline report, Indonesia.
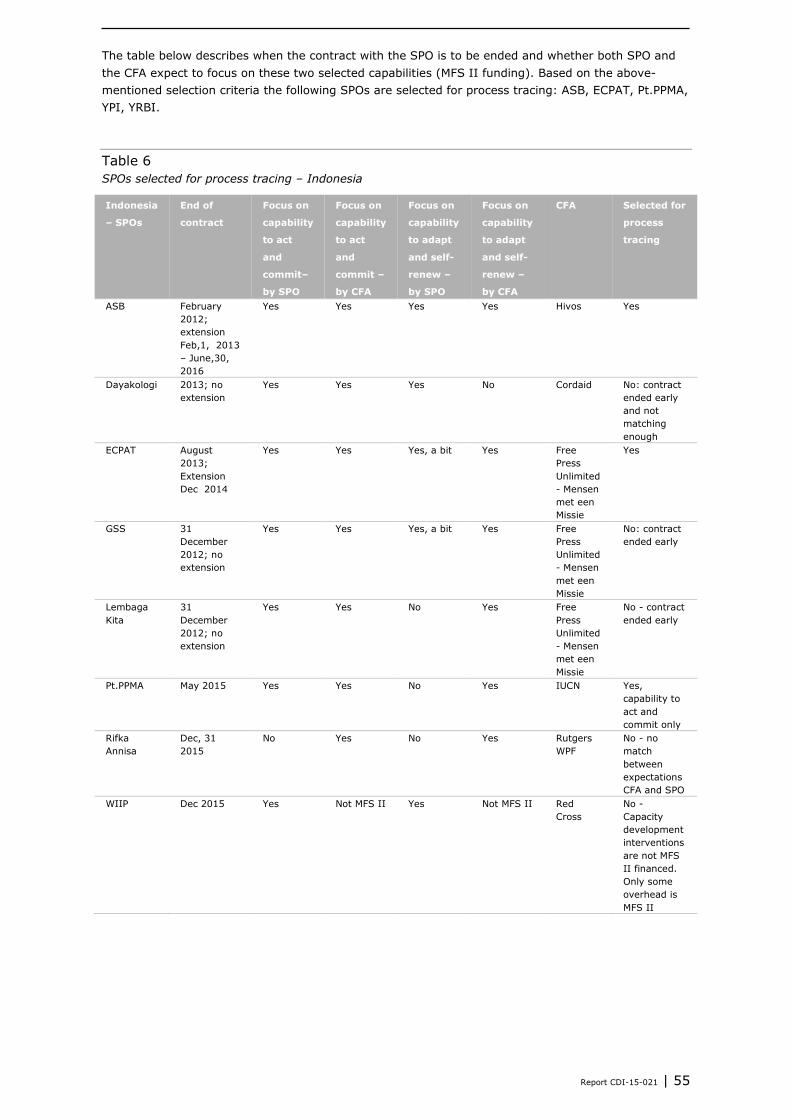
Report CDI-15-021 | 55
The table below describes when the contract with the SPO is to be ended and whether both SPO and
the CFA expect to focus on these two selected capabilities (MFS II funding). Based on the above-
mentioned selection criteria the following SPOs are selected for process tracing: ASB, ECPAT, Pt.PPMA,
YPI, YRBI.
Table 6
SPOs selected for process tracing – Indonesia
Indonesia
– SPOs
End of
contract
Focus on
capability
to act
and
commit–
by SPO
Focus on
capability
to act
and
commit –
by CFA
Focus on
capability
to adapt
and self-
renew –
by SPO
Focus on
capability
to adapt
and self-
renew –
by CFA
CFA Selected for
process
tracing
ASB February
2012;
extension
Feb,1, 2013
– June,30,
2016
Yes Yes Yes Yes Hivos Yes
Dayakologi 2013; no
extension
Yes Yes Yes No Cordaid No: contract
ended early
and not
matching
enough
ECPAT August
2013;
Extension
Dec 2014
Yes Yes Yes, a bit Yes Free
Press
Unlimited
- Mensen
met een
Missie
Yes
GSS 31
December
2012; no
extension
Yes Yes Yes, a bit Yes Free
Press
Unlimited
- Mensen
met een
Missie
No: contract
ended early
Lembaga
Kita
31
December
2012; no
extension
Yes Yes No Yes Free
Press
Unlimited
- Mensen
met een
Missie
No - contract
ended early
Pt.PPMA May 2015 Yes Yes No Yes IUCN Yes,
capability to
act and
commit only
Rifka
Annisa
Dec, 31
2015
No Yes No Yes Rutgers
WPF
No - no
match
between
expectations
CFA and SPO
WIIP Dec 2015 Yes Not MFS II Yes Not MFS II Red
Cross
No -
Capacity
development
interventions
are not MFS
II financed.
Only some
overhead is
MFS II
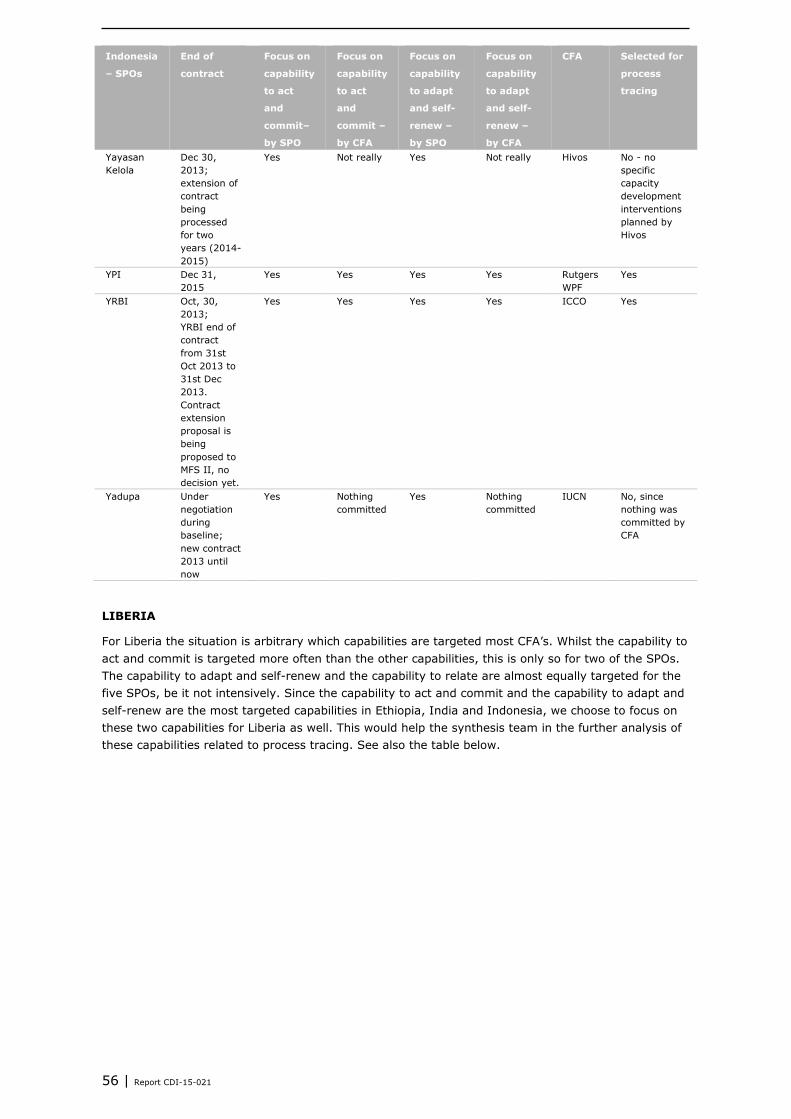
56 | Report CDI-15-021
Indonesia
– SPOs
End of
contract
Focus on
capability
to act
and
commit–
by SPO
Focus on
capability
to act
and
commit –
by CFA
Focus on
capability
to adapt
and self-
renew –
by SPO
Focus on
capability
to adapt
and self-
renew –
by CFA
CFA Selected for
process
tracing
Yayasan
Kelola
Dec 30,
2013;
extension of
contract
being
processed
for two
years (2014-
2015)
Yes Not really Yes Not really Hivos No - no
specific
capacity
development
interventions
planned by
Hivos
YPI Dec 31,
2015
Yes Yes Yes Yes Rutgers
WPF
Yes
YRBI Oct, 30,
2013;
YRBI end of
contract
from 31st
Oct 2013 to
31st Dec
2013.
Contract
extension
proposal is
being
proposed to
MFS II, no
decision yet.
Yes Yes Yes Yes ICCO Yes
Yadupa Under
negotiation
during
baseline;
new contract
2013 until
now
Yes Nothing
committed
Yes Nothing
committed
IUCN No, since
nothing was
committed by
CFA
LIBERIA
For Liberia the situation is arbitrary which capabilities are targeted most CFA’s. Whilst the capability to
act and commit is targeted more often than the other capabilities, this is only so for two of the SPOs.
The capability to adapt and self-renew and the capability to relate are almost equally targeted for the
five SPOs, be it not intensively. Since the capability to act and commit and the capability to adapt and
self-renew are the most targeted capabilities in Ethiopia, India and Indonesia, we choose to focus on
these two capabilities for Liberia as well. This would help the synthesis team in the further analysis of
these capabilities related to process tracing. See also the table below.
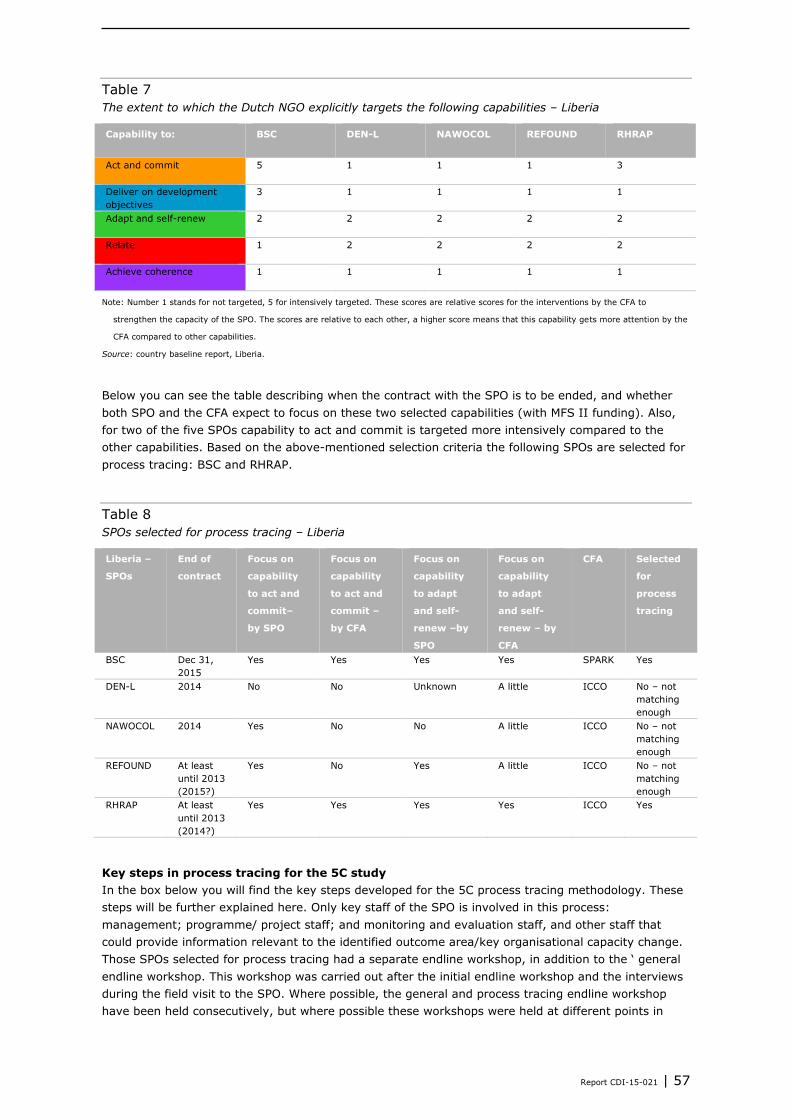
Report CDI-15-021 | 57
Table 7
The extent to which the Dutch NGO explicitly targets the following capabilities – Liberia
Capability to: BSC DEN-L NAWOCOL REFOUND RHRAP
Act and commit
5 1 1 1 3
Deliver on development
objectives
3 1 1 1 1
Adapt and self-renew
2 2 2 2 2
Relate
1 2 2 2 2
Achieve coherence
1 1 1 1 1
Note: Number 1 stands for not targeted, 5 for intensively targeted. These scores are relative scores for the interventions by the CFA to
strengthen the capacity of the SPO. The scores are relative to each other, a higher score means that this capability gets more attention by the
CFA compared to other capabilities.
Source: country baseline report, Liberia.
Below you can see the table describing when the contract with the SPO is to be ended, and whether
both SPO and the CFA expect to focus on these two selected capabilities (with MFS II funding). Also,
for two of the five SPOs capability to act and commit is targeted more intensively compared to the
other capabilities. Based on the above-mentioned selection criteria the following SPOs are selected for
process tracing: BSC and RHRAP.
Table 8
SPOs selected for process tracing – Liberia
Liberia –
SPOs
End of
contract
Focus on
capability
to act and
commit–
by SPO
Focus on
capability
to act and
commit –
by CFA
Focus on
capability
to adapt
and self-
renew –by
SPO
Focus on
capability
to adapt
and self-
renew – by
CFA
CFA Selected
for
process
tracing
BSC Dec 31,
2015
Yes Yes Yes Yes SPARK Yes
DEN-L 2014 No No Unknown A little ICCO No – not
matching
enough
NAWOCOL 2014 Yes No No A little ICCO No – not
matching
enough
REFOUND At least
until 2013
(2015?)
Yes No Yes A little ICCO No – not
matching
enough
RHRAP At least
until 2013
(2014?)
Yes Yes Yes Yes ICCO Yes
Key steps in process tracing for the 5C study
In the box below you will find the key steps developed for the 5C process tracing methodology. These
steps will be further explained here. Only key staff of the SPO is involved in this process:
management; programme/ project staff; and monitoring and evaluation staff, and other staff that
could provide information relevant to the identified outcome area/key organisational capacity change.
Those SPOs selected for process tracing had a separate endline workshop, in addition to the ‘ general
endline workshop. This workshop was carried out after the initial endline workshop and the interviews
during the field visit to the SPO. Where possible, the general and process tracing endline workshop
have been held consecutively, but where possible these workshops were held at different points in
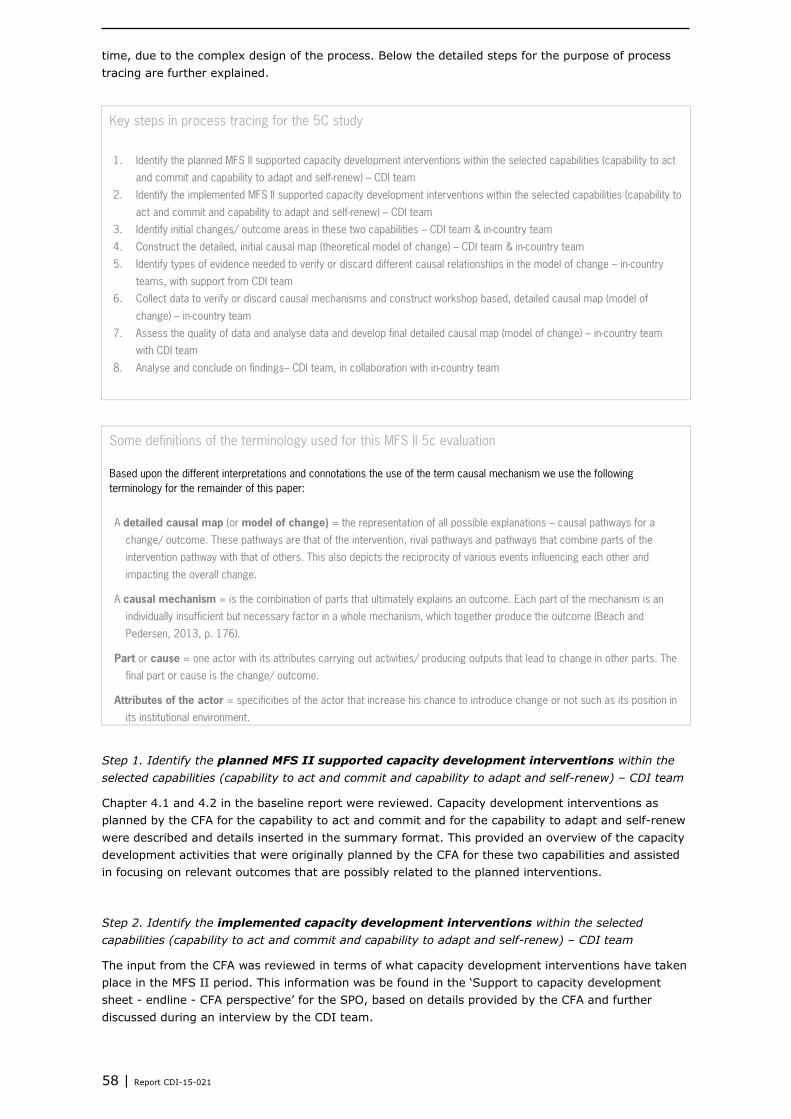
58 | Report CDI-15-021
time, due to the complex design of the process. Below the detailed steps for the purpose of process
tracing are further explained.
Key steps in process tracing for the 5C study
1. Identify the planned MFS II supported capacity development interventions within the selected capabilities (capability to act
and commit and capability to adapt and self-renew) – CDI team
2. Identify the implemented MFS II supported capacity development interventions within the selected capabilities (capability to
act and commit and capability to adapt and self-renew) – CDI team
3. Identify initial changes/ outcome areas in these two capabilities – CDI team & in-country team
4. Construct the detailed, initial causal map (theoretical model of change) – CDI team & in-country team
5. Identify types of evidence needed to verify or discard different causal relationships in the model of change – in-country
teams, with support from CDI team
6. Collect data to verify or discard causal mechanisms and construct workshop based, detailed causal map (model of
change) – in-country team
7. Assess the quality of data and analyse data and develop final detailed causal map (model of change) – in-country team
with CDI team
8. Analyse and conclude on findings– CDI team, in collaboration with in-country team
Some definitions of the terminology used for this MFS II 5c evaluation
Based upon the different interpretations and connotations the use of the term causal mechanism we use the following
terminology for the remainder of this paper:
A detailed causal map (or model of change) = the representation of all possible explanations – causal pathways for a
change/ outcome. These pathways are that of the intervention, rival pathways and pathways that combine parts of the
intervention pathway with that of others. This also depicts the reciprocity of various events influencing each other and
impacting the overall change.
A causal mechanism = is the combination of parts that ultimately explains an outcome. Each part of the mechanism is an
individually insufficient but necessary factor in a whole mechanism, which together produce the outcome (Beach and
Pedersen, 2013, p. 176).
Part or cause = one actor with its attributes carrying out activities/ producing outputs that lead to change in other parts. The
final part or cause is the change/ outcome.
Attributes of the actor = specificities of the actor that increase his chance to introduce change or not such as its position in
its institutional environment.
Step 1. Identify the planned MFS II supported capacity development interventions within the
selected capabilities (capability to act and commit and capability to adapt and self-renew) – CDI team
Chapter 4.1 and 4.2 in the baseline report were reviewed. Capacity development interventions as
planned by the CFA for the capability to act and commit and for the capability to adapt and self-renew
were described and details inserted in the summary format. This provided an overview of the capacity
development activities that were originally planned by the CFA for these two capabilities and assisted
in focusing on relevant outcomes that are possibly related to the planned interventions.
Step 2. Identify the implemented capacity development interventions within the selected
capabilities (capability to act and commit and capability to adapt and self-renew) – CDI team
The input from the CFA was reviewed in terms of what capacity development interventions have taken
place in the MFS II period. This information was be found in the ‘Support to capacity development
sheet - endline - CFA perspective’ for the SPO, based on details provided by the CFA and further
discussed during an interview by the CDI team.
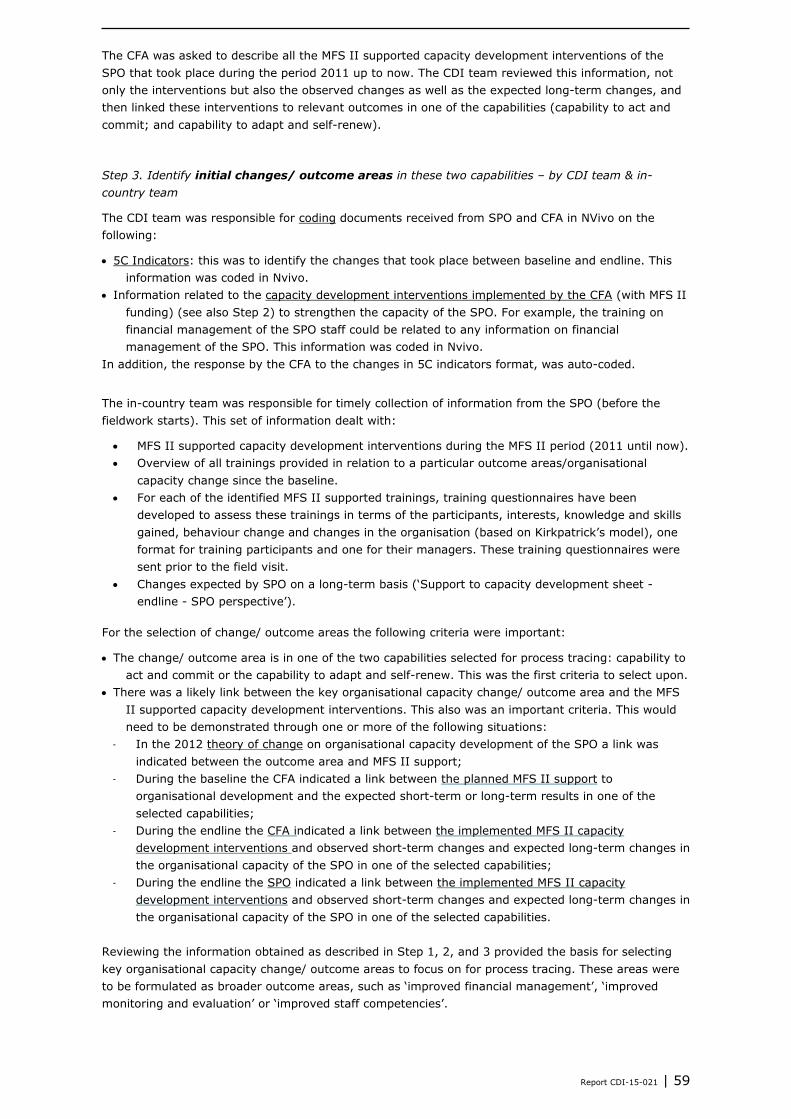
Report CDI-15-021 | 59
The CFA was asked to describe all the MFS II supported capacity development interventions of the
SPO that took place during the period 2011 up to now. The CDI team reviewed this information, not
only the interventions but also the observed changes as well as the expected long-term changes, and
then linked these interventions to relevant outcomes in one of the capabilities (capability to act and
commit; and capability to adapt and self-renew).
Step 3. Identify initial changes/ outcome areas in these two capabilities – by CDI team & in-
country team
The CDI team was responsible for coding documents received from SPO and CFA in NVivo on the
following:
5C Indicators: this was to identify the changes that took place between baseline and endline. This
information was coded in Nvivo.
Information related to the capacity development interventions implemented by the CFA (with MFS II
funding) (see also Step 2) to strengthen the capacity of the SPO. For example, the training on
financial management of the SPO staff could be related to any information on financial
management of the SPO. This information was coded in Nvivo.
In addition, the response by the CFA to the changes in 5C indicators format, was auto-coded.
The in-country team was responsible for timely collection of information from the SPO (before the
fieldwork starts). This set of information dealt with:
MFS II supported capacity development interventions during the MFS II period (2011 until now).
Overview of all trainings provided in relation to a particular outcome areas/organisational
capacity change since the baseline.
For each of the identified MFS II supported trainings, training questionnaires have been
developed to assess these trainings in terms of the participants, interests, knowledge and skills
gained, behaviour change and changes in the organisation (based on Kirkpatrick’s model), one
format for training participants and one for their managers. These training questionnaires were
sent prior to the field visit.
Changes expected by SPO on a long-term basis (‘Support to capacity development sheet -
endline - SPO perspective’).
For the selection of change/ outcome areas the following criteria were important:
The change/ outcome area is in one of the two capabilities selected for process tracing: capability to
act and commit or the capability to adapt and self-renew. This was the first criteria to select upon.
There was a likely link between the key organisational capacity change/ outcome area and the MFS
II supported capacity development interventions. This also was an important criteria. This would
need to be demonstrated through one or more of the following situations:
- In the 2012 theory of change on organisational capacity development of the SPO a link was
indicated between the outcome area and MFS II support;
- During the baseline the CFA indicated a link between the planned MFS II support to
organisational development and the expected short-term or long-term results in one of the
selected capabilities;
- During the endline the CFA indicated a link between the implemented MFS II capacity
development interventions and observed short-term changes and expected long-term changes in
the organisational capacity of the SPO in one of the selected capabilities;
- During the endline the SPO indicated a link between the implemented MFS II capacity
development interventions and observed short-term changes and expected long-term changes in
the organisational capacity of the SPO in one of the selected capabilities.
Reviewing the information obtained as described in Step 1, 2, and 3 provided the basis for selecting
key organisational capacity change/ outcome areas to focus on for process tracing. These areas were
to be formulated as broader outcome areas, such as ‘improved financial management’, ‘improved
monitoring and evaluation’ or ‘improved staff competencies’.
60 | Report CDI-15-021
Note: the outcome areas were to be formulated as intermediates changes. For example: an improved
monitoring and evaluation system, or enhanced knowledge and skills to educate the target group on
climate change. Key outcome areas were also verified - based on document review as well as
discussions with the SPO during the endline.
Step 4. Construct the detailed, initial causal map (theoretical model of change) – CDI & in-country
team
A detailed initial causal map was developed by the CDI team, in collaboration with the in-country
team. This was based on document review, including information provided by the CFA and SPO on
MFS II supported capacity development interventions and their immediate and long-term objectives as
well as observed changes. Also, the training questionnaires were reviewed before developing the initial
causal map. This detailed initial causal map was to be provided by the CDI team with a visual and
related narrative with related references. This initial causal map served as a reference point for further
reflection with the SPO during the process tracing endline workshop, where relationships needed to be
verified or new relationships established so that the second (workshop-based), detailed causal map
could be developed, after which further verification was needed to come up with the final, concluding
detailed causal map.
It’s important to note that organisational change area/ outcome areas could be both positive and
negative.
For each of the selected outcomes the team needed to make explicit the theoretical model of change.
This meant finding out about the range of different actors, factors, actions, and events etc. that have
contributed to a particular outcome in terms of organisational capacity of the SPO.
A model of change of good quality includes:
The causal pathways that relate the intervention to the realised change/ outcome;
Rival explanations for the same change/ outcome;
Assumptions that clarify relations between different components or parts;
Case specific and/or context specific factors or risks that might influence the causal pathway, such
as for instance the socio-cultural-economic context, or a natural disaster;
Specific attributes of the actors e.g. CFA and other funders.
A model of change (within the 5C study called a ‘detailed causal map’) is a complex system which
produces intermediate and long-term outcomes by the interaction of other parts. It consists of parts or
causes that often consist of one actor with its attributes that is implementing activities leading to
change in other parts (Beach & Pedersen, 2013). A helpful way of constructing the model of change is
to think in terms of actors carrying out activities that lead to other actors changing their behaviour.
The model of change can be explained as a range of activities carried out by different actors (including
the CFA and SPO under evaluation) that will ultimately lead to an outcome. Besides this, there are also
‘structural’ elements, which are to be interpreted as external factors (such as economic conjuncture);
and attributes of the actor (does the actor have the legitimacy to ask for change or not, what is its
position in the sector) that should be looked at (Beach & Pedersen, 2013). In fact Beach and
Pedersen, make a fine point about the subjectivity of the actor in a dynamic context. This means, in
qualitative methodologies, capturing the changes in the actor, acted upon area or person/organisation,
in a non sequential and non temporal format. Things which were done recently could have corrected
behavioural outcomes of an organisation and at the same ime there could be processes which
incrementally pushed for the same change over a period of time. Beach and Pedersen espouse this
methodology because it captures change in a dynamic fashion as against the methodology of logical
framework. For the MFS II evaluation it was important to make a distinction between those paths in
the model of change that are the result of MFS II and rival pathways.
The construction of the model of change started with the identified key organisational capacity
change/ outcome, followed by an inventory of all possible subcomponents that possibly have caused
the change/ outcome in the MFS II period (2011-up to now, or since the baseline). The figure below
presents an imaginary example of a model of change. The different colours indicate the different types
of support to capacity development of the SPO by different actors, thereby indicating different
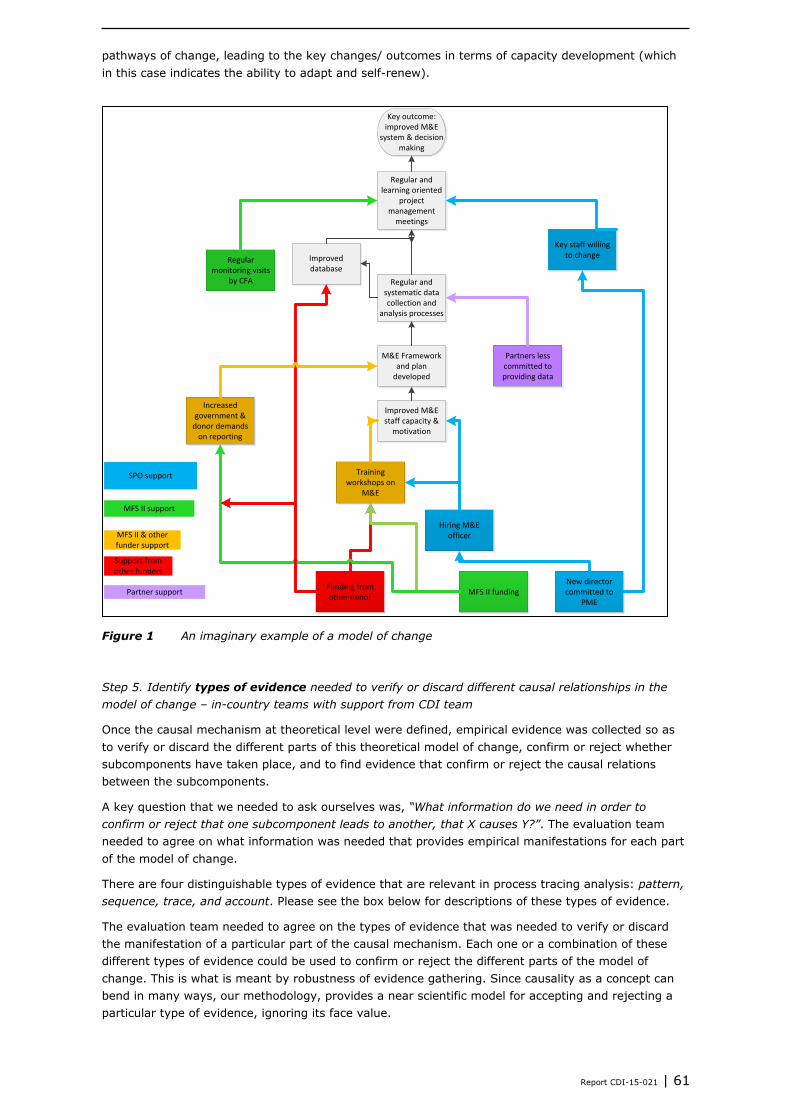
Report CDI-15-021 | 61
pathways of change, leading to the key changes/ outcomes in terms of capacity development (which
in this case indicates the ability to adapt and self-renew).
Figure 1 An imaginary example of a model of change
Step 5. Identify types of evidence needed to verify or discard different causal relationships in the
model of change – in-country teams with support from CDI team
Once the causal mechanism at theoretical level were defined, empirical evidence was collected so as
to verify or discard the different parts of this theoretical model of change, confirm or reject whether
subcomponents have taken place, and to find evidence that confirm or reject the causal relations
between the subcomponents.
A key question that we needed to ask ourselves was, “What information do we need in order to
confirm or reject that one subcomponent leads to another, that X causes Y?”. The evaluation team
needed to agree on what information was needed that provides empirical manifestations for each part
of the model of change.
There are four distinguishable types of evidence that are relevant in process tracing analysis: pattern,
sequence, trace, and account. Please see the box below for descriptions of these types of evidence.
The evaluation team needed to agree on the types of evidence that was needed to verify or discard
the manifestation of a particular part of the causal mechanism. Each one or a combination of these
different types of evidence could be used to confirm or reject the different parts of the model of
change. This is what is meant by robustness of evidence gathering. Since causality as a concept can
bend in many ways, our methodology, provides a near scientific model for accepting and rejecting a
particular type of evidence, ignoring its face value.
Key outcome: improved M&E
system & decision making
Improved M&E staff capacity &
motivation
Hiring M&E officer
Training workshops on
M&E
Improved database
Regular and learning oriented
project management
meetings
M&E Framework and plan
developed
Regular and systematic data collection and
analysis processes
MFS II fundingFunding from other donor
New director committed to
PME
Increased government &
donor demands on reporting
Partners less committed to providing data
Key staff willing to change
Regular monitoring visits
by CFA
MFS II support
Support from other funders
MFS II & other funder support
SPO support
Partner support
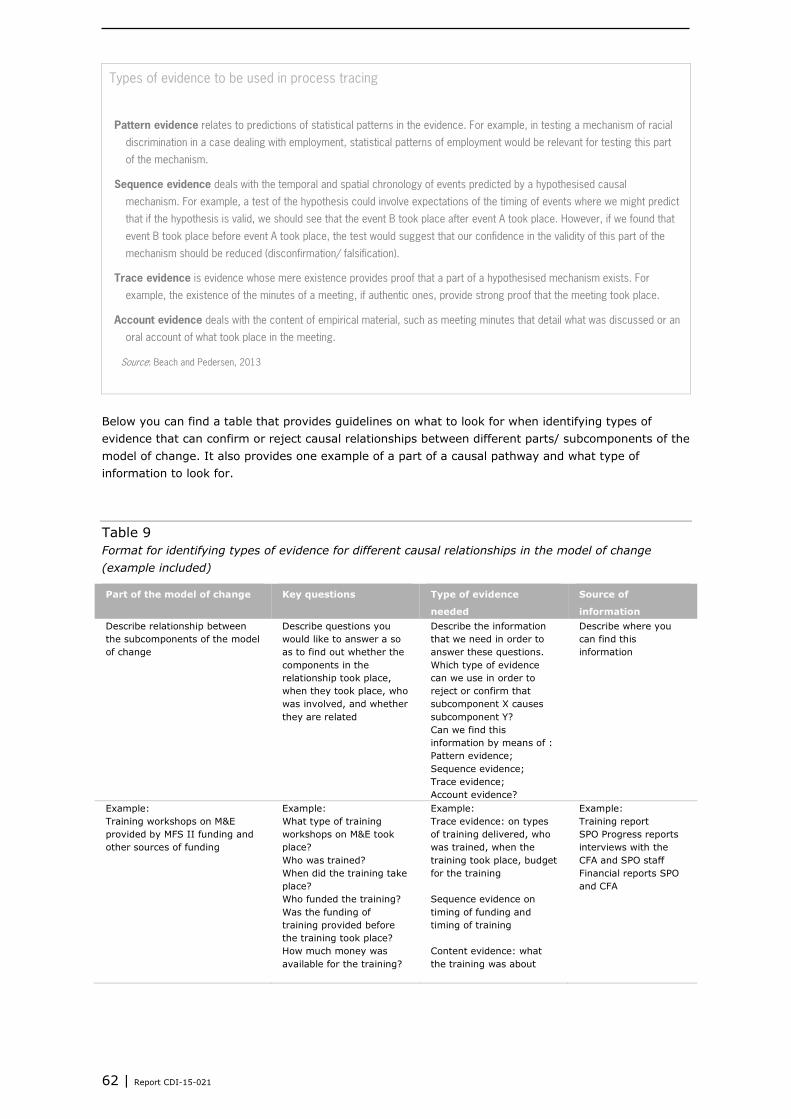
62 | Report CDI-15-021
Types of evidence to be used in process tracing
Pattern evidence relates to predictions of statistical patterns in the evidence. For example, in testing a mechanism of racial
discrimination in a case dealing with employment, statistical patterns of employment would be relevant for testing this part
of the mechanism.
Sequence evidence deals with the temporal and spatial chronology of events predicted by a hypothesised causal
mechanism. For example, a test of the hypothesis could involve expectations of the timing of events where we might predict
that if the hypothesis is valid, we should see that the event B took place after event A took place. However, if we found that
event B took place before event A took place, the test would suggest that our confidence in the validity of this part of the
mechanism should be reduced (disconfirmation/ falsification).
Trace evidence is evidence whose mere existence provides proof that a part of a hypothesised mechanism exists. For
example, the existence of the minutes of a meeting, if authentic ones, provide strong proof that the meeting took place.
Account evidence deals with the content of empirical material, such as meeting minutes that detail what was discussed or an
oral account of what took place in the meeting.
Source: Beach and Pedersen, 2013
Below you can find a table that provides guidelines on what to look for when identifying types of
evidence that can confirm or reject causal relationships between different parts/ subcomponents of the
model of change. It also provides one example of a part of a causal pathway and what type of
information to look for.
Table 9
Format for identifying types of evidence for different causal relationships in the model of change
(example included)
Part of the model of change Key questions Type of evidence
needed
Source of
information
Describe relationship between
the subcomponents of the model
of change
Describe questions you
would like to answer a so
as to find out whether the
components in the
relationship took place,
when they took place, who
was involved, and whether
they are related
Describe the information
that we need in order to
answer these questions.
Which type of evidence
can we use in order to
reject or confirm that
subcomponent X causes
subcomponent Y?
Can we find this
information by means of :
Pattern evidence;
Sequence evidence;
Trace evidence;
Account evidence?
Describe where you
can find this
information
Example:
Training workshops on M&E
provided by MFS II funding and
other sources of funding
Example:
What type of training
workshops on M&E took
place?
Who was trained?
When did the training take
place?
Who funded the training?
Was the funding of
training provided before
the training took place?
How much money was
available for the training?
Example:
Trace evidence: on types
of training delivered, who
was trained, when the
training took place, budget
for the training
Sequence evidence on
timing of funding and
timing of training
Content evidence: what
the training was about
Example:
Training report
SPO Progress reports
interviews with the
CFA and SPO staff
Financial reports SPO
and CFA
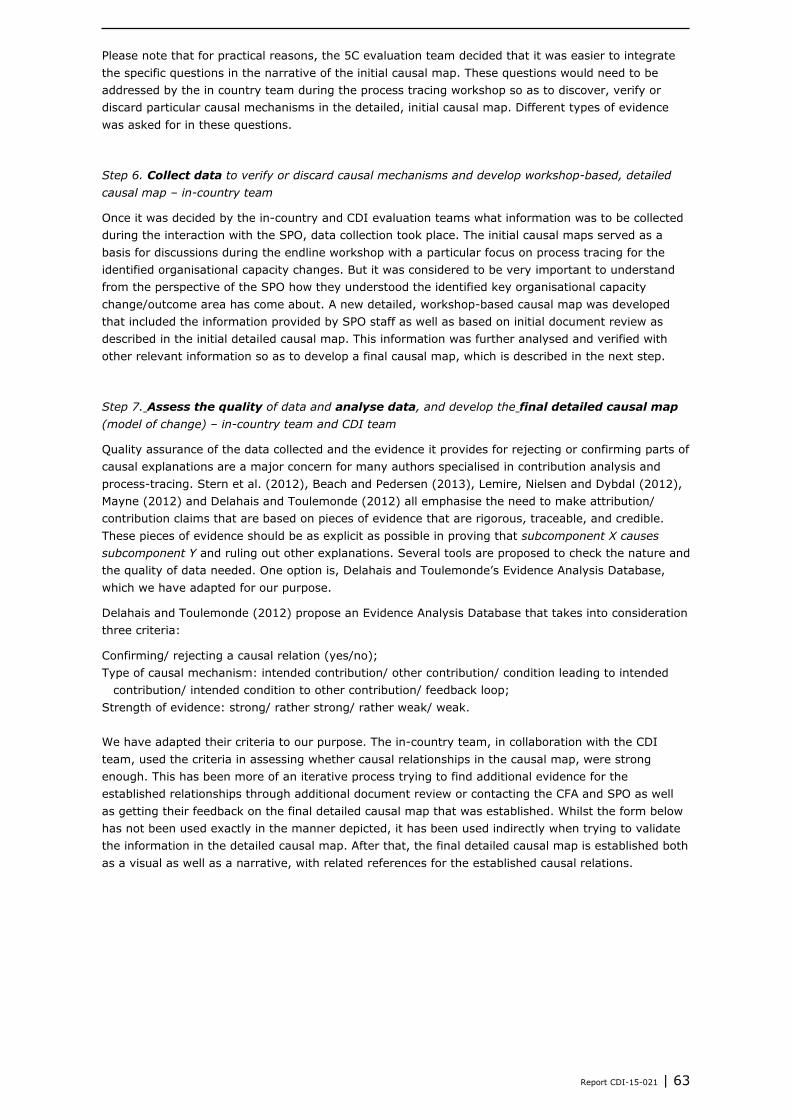
Report CDI-15-021 | 63
Please note that for practical reasons, the 5C evaluation team decided that it was easier to integrate
the specific questions in the narrative of the initial causal map. These questions would need to be
addressed by the in country team during the process tracing workshop so as to discover, verify or
discard particular causal mechanisms in the detailed, initial causal map. Different types of evidence
was asked for in these questions.
Step 6. Collect data to verify or discard causal mechanisms and develop workshop-based, detailed
causal map – in-country team
Once it was decided by the in-country and CDI evaluation teams what information was to be collected
during the interaction with the SPO, data collection took place. The initial causal maps served as a
basis for discussions during the endline workshop with a particular focus on process tracing for the
identified organisational capacity changes. But it was considered to be very important to understand
from the perspective of the SPO how they understood the identified key organisational capacity
change/outcome area has come about. A new detailed, workshop-based causal map was developed
that included the information provided by SPO staff as well as based on initial document review as
described in the initial detailed causal map. This information was further analysed and verified with
other relevant information so as to develop a final causal map, which is described in the next step.
Step 7. Assess the quality of data and analyse data, and develop the final detailed causal map
(model of change) – in-country team and CDI team
Quality assurance of the data collected and the evidence it provides for rejecting or confirming parts of
causal explanations are a major concern for many authors specialised in contribution analysis and
process-tracing. Stern et al. (2012), Beach and Pedersen (2013), Lemire, Nielsen and Dybdal (2012),
Mayne (2012) and Delahais and Toulemonde (2012) all emphasise the need to make attribution/
contribution claims that are based on pieces of evidence that are rigorous, traceable, and credible.
These pieces of evidence should be as explicit as possible in proving that subcomponent X causes
subcomponent Y and ruling out other explanations. Several tools are proposed to check the nature and
the quality of data needed. One option is, Delahais and Toulemonde’s Evidence Analysis Database,
which we have adapted for our purpose.
Delahais and Toulemonde (2012) propose an Evidence Analysis Database that takes into consideration
three criteria:
Confirming/ rejecting a causal relation (yes/no);
Type of causal mechanism: intended contribution/ other contribution/ condition leading to intended
contribution/ intended condition to other contribution/ feedback loop;
Strength of evidence: strong/ rather strong/ rather weak/ weak.
We have adapted their criteria to our purpose. The in-country team, in collaboration with the CDI
team, used the criteria in assessing whether causal relationships in the causal map, were strong
enough. This has been more of an iterative process trying to find additional evidence for the
established relationships through additional document review or contacting the CFA and SPO as well
as getting their feedback on the final detailed causal map that was established. Whilst the form below
has not been used exactly in the manner depicted, it has been used indirectly when trying to validate
the information in the detailed causal map. After that, the final detailed causal map is established both
as a visual as well as a narrative, with related references for the established causal relations.
64 | Report CDI-15-021
Example format
for the adapted
evidence
analysis
database
(example
included)
Description of
causal relation
Confirming/
rejecting a causal
relation (yes/no)
Type of
information
providing the
background to the
confirmation or
rejection of the
causal relation
Strength of
evidence:
strong/ rather
strong/ rather
weak/ weak
Explanation for why
the evidence is
(rather) strong or
(rather) weak, and
therefore the
causal relation is
confirmed/
rejected
e.g. Training staff
in M&E leads to
enhanced M&E
knowledge, skills
and practice
e.g. Confirmed e.g. Training reports
confirmed that staff
are trained in M&E
and that knowledge
and skills increased
as a result of the
training
Step 8. Analyse and conclude on findings– in-country team and CDI team
The final detailed causal map was described as a visual and narrative and this was then analysed in
terms of the evaluation question two and evaluation question four: “To what degree are the changes
identified in partner capacity attributable to development interventions undertaken by the MFS II
consortia (i.e. measuring effectiveness)?” and “What factors explain the findings drawn from the
questions above?” It was analysed to what extent the identified key organisational capacity change
can be attributed to MFS II supported capacity development interventions as well as to other related
factors, interventions and actors.
4. Explaining factors – evaluation question 4
This paragraph describes the data collection and analysis methodology for answering the fourth
evaluation question: “What factors explain the findings drawn from the questions above?”
In order to explain the changes in organisational capacity development between baseline and endline
(evaluation question 1) the CDI and in-country evaluation teams needed to review the indicators and
how they have changed between baseline and endline and what reasons have been provided for this.
This has been explained in the first section of this appendix. It has been difficult to find detailed
explanations for changes in each of the separate 5c indicators, but the ’general causal map’ has
provided some ideas about some of the key underlying factors actors and interventions that influence
the key organisational capacity changes, as perceived by the SPO staff.
For those SPOs that are selected for process tracing (evaluation question 2), more in-depth
information was procured for the identified key organisational capacity changes and how MFS II
supported capacity development interventions as well as other actors, factors and interventions have
influenced these changes. This is integrated in the process of process tracing as described in the
section above.
5. Methodological reflection
Below a few methodological reflections are made by the 5C evaluation team.
Use of the 5 core capabilities framework and qualitative approach: this has proven to a be very
useful framework to assess organisational capacity. The five core capabilities provide a comprehensive
picture of the capacity of an organisation. The capabilities are interlinked, which was also reflected in
Report CDI-15-021 | 65
the description of standard indicators, that have been developed for the purpose of this 5C evaluation
and agreed upon for the eight countries. Using this framework with a mainly qualitative approach has
provided rich information for the SPOs and CFAs, and many have indicated this was a useful learning
exercise.
Using standard indicators and scores: using standard indicators is useful for comparison purposes.
However, the information provided per indicator is very specific to the SPO and therefore makes
comparison difficult. Whilst the description of indicators has been useful for the SPO and CFA, it is
questionable to what extent indicators can be compared across SPOs since they need to be seen in
context, for them to make meaning. In relation to this, one can say that scores that are provided for
the indicators, are only relative and cannot show the richness of information as provided in the
indicator description. Furthermore, it must be noted that organisations are continuously changing and
scores are just a snapshot in time. There cannot be perfect score for this. In hindsight, having rubrics
would have been more useful than scores.
General causal map: whilst this general causal map, which is based on key organisational capacity
changes and related causes, as perceived by the SPO staff present at the endline workshop, has not
been validated with other sources of information except SPO feedback, the 5C evaluation team
considers this information important, since it provides the SPO story about how and which changes in
the organisation since the baseline, are perceived as being important, and how these changes have
come about. This will provide information additional to the information that has been validated when
analysing and describing the indicators as well as the information provided through process tracing
(selected SPOs). This has proven to be a learning experience for many SPOs.
Using process tracing for dealing with the attribution question: this theory-based and mainly
qualitative approach has been chosen to deal with the attribution question, on how the organisational
capacity changes in the organisations have come about and what the relationship is with MFS II
supported capacity development interventions and other factors. This has proven to be a very useful
process, that provided a lot of very rich information. Many SPOs and CFAs have already indicated that
they appreciated the richness of information which provided a story about how identified
organisational capacity changes have come about. Whilst this process was intensive for SPOs during
the process tracing workshops, many appreciated this to be a learning process that provided useful
information on how the organisation can further develop itself. For the evaluation team, this has also
been an intensive and time-consuming process, but since it provided rich information in a learning
process, the effort was worth it, if SPOs and CFAs find this process and findings useful.
A few remarks need to be made:
Outcome explaining process tracing is used for this purpose, but has been adapted to the
situation since the issues being looked at were very complex in nature.
Difficulty of verifying each and every single change and causal relationship:
Intensity of the process and problems with recall: often the process tracing workshop was done
straight after the general endline workshop that has been done for all the SPOs.In some cases,
the process tracing endline workshop has been done at a different point in time, which was
better for staff involved in this process, since process tracing asks people to think back about
changes and how these changes have come about. The word difficulties with recalling some of
these changes and how they have come about. See also the next paragraph.
Difficulty of assessing changes in knowledge and behaviour: training questionnaire is have been
developed, based on Kirkpatrick’s model and were specifically tailored to identify not only the
interest but also the change in knowledge and skills, behaviour as well as organisational
changes as a result of a particular training. The retention ability of individuals, irrespective of
their position in the organisation, is often unstable. The 5C evaluation team experienced that it
was difficult for people to recall specific trainings, and what they learned from those trainings.
Often a change in knowledge, skills and behaviour is a result brought about by a combination of
different factors , rather than being traceable to one particular event. The detailed causal maps
that have been established, also clearly pointed this. There are many factors at play that make
people change their behaviour, and this is not just dependent on training but also
internal/personal (motivational) factors as well as factors within the organisation, that stimulate
or hinder a person to change behaviour. Understanding how behaviour change works is
important when trying to really understand the extent to which behaviour has changed as a
66 | Report CDI-15-021
result of different factors, actors and interventions. Organisations change because people
change and therefore understanding when and how these individuals change behaviour is
crucial. Also attrition and change in key organisational positions can contribute considerably to
the outcome.
Utilisation of the evaluation
The 5C evaluation team considers it important to also discuss issues around utility of this evaluation.
We want to mention just a few.
Design – mainly externally driven and with a focus on accountability and standard indicators and
approaches within a limited time frame, and limited budget: this MFS II evaluation is originally based
on a design that has been decided by IOB (the independent evaluation office of the Dutch Ministry of
Foreign Affairs) and to some extent MFS II organisations. The evaluators have had no influence on the
overall design and sampling for the 5C study. In terms of learning, one may question whether the
most useful cases have been selected in this sampling process. The focus was very much on a rigorous
evaluation carried out by an independent evaluation team. Indicators had to be streamlined across
countries. The 5C team was requested to collaborate with the other 5C country teams (Bangladesh,
Congo, Pakistan, Uganda) to streamline the methodological approach across the eight sampled
countries. Whilst this may have its purpose in terms of synthesising results, the 5C evaluation team
has also experienced the difficulty of tailoring the approach to the specific SPOs. The overall
evaluation has been mainly accountability driven and was less focused on enhancing learning for
improvement. Furthermore, the timeframe has been very small to compare baseline information
(2012) with endline information (2014). Changes in organisational capacity may take a long,
particularly if they are related to behaviour change. Furthermore, there has been limited budget to
carry out the 5C evaluation. For all the four countries (Ethiopia, India, Indonesia, Liberia) that the
Centre for Development Innovation, Wageningen University and Research centre has been involved in,
the budget has been overspent.
However, the 5C evaluation team has designed an endline process whereby engagement of staff, e.g.
in a workshop process was considered important, not only due to the need to collect data, but also to
generate learning in the organisation. Furthermore, having general causal maps and detailed causal
maps generated by process tracing have provided rich information that many SPOs and CFAs have
already appreciated as useful in terms of the findings as well as a learning process.
Another issue that must be mentioned is that additional requests have been added to the country
teams during the process of implementation: developing a country based synthesis; questions on
design, implementation, and reaching objectives of MFS II funded capacity development interventions,
whilst these questions were not in line with the core evaluation questions for the 5C evaluation.
Complexity and inadequate coordination and communication: many actors, both in the Netherlands, as
well as in the eight selected countries, have been involved in this evaluation and their roles and
responsibilities, were often unclear. For example, 19 MFS II consortia, the internal reference group,
the Ministry of Foreign Affairs, Partos, the Joint Evaluation Trust, NWO-Wotro, the evaluators
(Netherlands and in-country), 2 external advisory committees, and the steering committee. Not to
mention the SPO’s and their related partners and consultants. CDI was involved in 4 countries with a
total number of 38 SPOs and related CFAs. This complexity influenced communication and
coordination, as well as the extent to which learning could take place. Furthermore, there was a
distance between the evaluators and the CFAs, since the approach had to be synchronised across
countries, and had to adhere to strict guidelines, which were mainly externally formulated and could
not be negotiated or discussed for the purpose of tailoring and learning. Feedback on the final results
and report had to be provided mainly in written form. In order to enhance utilisation, a final workshop
at the SPO to discuss the findings and think through the use with more people than probably the one
who reads the report, would have more impact on organisational learning and development.
Furthermore, feedback with the CFAs has also not been institutionalised in the evaluation process in
the form of learning events. And as mentioned above, the complexity of the evaluation with many
actors involved did not enhance learning and thus utilization.
Report CDI-15-021 | 67
5C Endline process, and in particular thoroughness of process tracing often appreciated as learning
process: The SPO perspective has also brought to light a new experience and technique of self-
assessment and self-corrective measures for managers. Most SPOs whether part of process tracing or
not, deeply appreciated the thoroughness of the methodology and its ability to capture details with
robust connectivity. This is a matter of satisfaction and learning for both evaluators and SPOs. Having
a process whereby SPO staff were very much engaged in the process of self-assessment and reflection
has proven for many to be a learning experience for many, and therefore have enhanced utility of the
5C evaluation.
68 | Report CDI-15-021
Background information on Appendix 2
the five core capabilities
framework
The 5 capabilities (5C) framework was to be used as a framework for the evaluation of capacity
development of Southern Partner Organisations (SPOs) of the MFS II consortia. The 5C framework is
based on a five-year research program on ‘Capacity, change and performance’ that was carried out by
the European Centre for Development Policy Management (ECDPM). The research included an
extensive review of the literature and sixteen case studies. The 5C framework has also been applied in
an IOB evaluation using 26 case studies in 14 countries, and in the baseline carried out per
organisation by the MFS II organisations for the purpose of the monitoring protocol.
The 5C framework is structured to understand and analyse (changes in) the capacity of an
organization to deliver (social) value to its constituents. This introduction briefly describes the 5C
framework, mainly based on the most recent document on the 5C framework (Keijzer et al., 2011).
The 5C framework sees capacity as an outcome of an open system. An organisation or collaborative
association (for instance a network) is seen as a system interacting with wider society. The most
critical practical issue is to ensure that relevant stakeholders share a common way of thinking about
capacity and its core constituents or capabilities. Decisive for an organisation’s capacity is the context
in which the organisation operates. This means that understanding context issues is crucial. The
use of the 5C framework requires a multi-stakeholder approach because shared values and results
orientation are important to facilitate the capacity development process. The 5C framework therefore
needs to accommodate the different visions of stakeholders and conceive different strategies for
raising capacity and improving performance in a given situation.
The 5C framework defines capacity as ‘producing social value’ and identifies five core capabilities
that together result in that overall capacity. Capacity, capabilities and competences are seen as
follows:
Capacity is referred to as the overall ability of an organisation or system to create value for others;
Capabilities are the collective ability of a group or a system to do something either inside or outside
the system. The collective ability involved may be technical, logistical, managerial or generative (i.e.
the ability to earn legitimacy, to adapt, to create meaning, etc.);
Competencies are the energies, skills and abilities of individuals.
Fundamental to developing capacity are inputs such as human, material and financial resources,
technology, and information. To the degree that they are developed and successfully integrated,
capabilities contribute to the overall capacity or ability of an organisation or system to create value for
others. A single capability is not sufficient to create capacity. All are needed and are strongly
interrelated and overlapping. Thus, to achieve its development goals, the 5C framework says that
every organisation or system must have five basic capabilities:
The capability to act and commit;
The capability to deliver on development objectives;
The capability to adapt and self-renew;
The capability to relate (to external stakeholders);
The capability to achieve coherence.
In order to have a common framework for evaluation, the five capabilities have been reformulated in
outcome domains and for each outcome domain performance indicators have been developed.
Report CDI-15-021 | 69
There is some overlap between the five core capabilities but together the five capabilities result in a
certain level of capacity. Influencing one capability may have an effect on one or more of the other
capabilities. In each situation, the level of any of the five capabilities will vary. Each capability can
become stronger or weaker over time.
70 | Report CDI-15-021
Changes in organisational Appendix 3
capacity of the SPO - 5C
indicators
Below you will find a description for each of the indicators under each of the capabilities, what the
situation is as assessed during the endline, how this has changed since the baseline workshop in
August 2012 and the interview with the Director at the head office in Guwahati in June 2013 and what
are the reasons for change. Unless explicitly stated that a change happened since the interview with
the director in June 2013, the changes took place since the baseline workshop in August 2012.
Capability to act and commit
Level of effective leadership
1.1.Responsive leadership: 'Leadership is responsive, inspiring, and sensitive'
This is about leadership within the organisation (operational, strategic). If there is a larger body then
you may also want to refer to leadership at a higher level but not located at the local organisation.
The leadership at the head office continues to be open to ideas and suggestions and has a
decentralised approach with each implementing regional unit. This creates a platform for the regional
units to grow, strengthen themselves and work towards being self-sustainable. The Regional unit is
autonomous to the extent of raising resources and completely designing the operations of its projects
but all project contracts have to be approved and signed by the RGVN Director, head office and the
funds are also channelled through them. The leadership at RGVN Bhubaneswar is however, very
committed, competent, experienced, responsive and proactive in taking decisions. This is evident from
the initiatives taken by the leader after the micro-finance crisis in 2009 and floods in 2011 and cyclone
Phailin in 2013. The leader responded by shifting the focus from micro-finance to sustainable
livelihood enhancement of the target group. Further, in response to the executive board of RGVN
deciding to restrict external borrowings from banks and other financial institutions, the leader along
with the management decided to initiate external resource mobilization, develop linkages with
government programs and schemes, linkages with market, network with NGOs and public sector units
and improve capacity of the staff to provide sustainable livelihood security to the target group. Though
there is hierarchy in the organization the leader at the Bhubaneswar office gives considerable
autonomy to the staff to contribute in the organizational strategy, decision making, operation,
capacity development etc., which further enhanced the capacity of the staff for self-sustainability.
Score baseline: 4.0
Score endline: 4.0 (no change)
1.2.Strategic guidance: 'Leaders provide appropriate strategic guidance (strategic leader and
operational leader)'
This is about the extent to which the leader(s) provide strategic directions
The leadership in Bhubaneswar continues to give strategic guidance. The strategic plan of 2011-2012
on strengthening micro-finance institutions could not be implemented because of the micro-finance
crisis in 2009, flood and cyclone Phailin in 2011 and 2013. The management initiated to shift from
micro-finance to sustainable livelihood enhancement of the target group. This decision was taken
during the baseline but the strategy was still in an inception stage. In the post baseline period the
executive board of RGVN decided to restrict external borrowings from Banks and other financial
institutions anticipating the inability of the partner organisation to repay their loans. Thus, the
Report CDI-15-021 | 71
management made a strategic change to initiate external resource mobilization and develop linkages
with government programs and schemes, linkages with market, network with NGOs and public sector
units and improve capacity of the staff for better sustainability of the programme. During the baseline
there was a call for leadership to stay abreast with the latest developments and encourage innovative
ideas in strategy making. This is now taking place as management has made the strategic change
based on developments in their operating environment.
After the baseline workshop in August 2012, RGVN has set up a Project Finance Committee comprising
the executive director, assistant director, and programme staff. This has contributed to improved
strategic guidance. This is a body created to expedite the decision making process, monitor progress,
and respond to proposals for funding. The executive board continues to review the operations of each
regional office separately in its periodic meetings and extends strategic direction as and when
required. Thus, though the regional units are given autonomy to implement the project, mobilise
funds, write proposals, approach donors etc., this autonomy is restricted as the final approval comes
from the executive director.
Score baseline: 3.5
Score endline: 4.0 (slight improvement)
1.3.Staff turnover: 'Staff turnover is relatively low'
This is about staff turnover.
Over the last two years there has been no change in this indicator. Staff turnover continues to be low
at the regional unit Bhubaneswar. The organisation provides an environment in which the staff
members are trusted and delegated authority and responsibilities commensurate to their abilities.
There has been no new recruitment during the last two years, as the organisation has not grown. They
have not been able to procure any new projects and the Hivos fund for the Sustainable Livelihood
Enhancement and Enterprise Promotion (SLEEP) project till 2015 is not enough to hire new project
staff. The low staff turnover has the positive effect that staff has learnt a lot through experience and is
applying this in their daily work.
Score baseline: 4.0
Score endline: 4.0 (no change)
Level of realistic strategic planning
1.4.Organisational structure: 'Existence of clear organisational structure reflecting the objectives of
the organisation'
Observable indicator: Staff have copy of org structure and understand this
The organisational structure at the headquarters in Guwahati and the regional office in Bhubaneswar
continue to be the same, but new board members have replaced the earlier ones. RGVN has set up
the Project Finance Committee which is comprised of the executive director, assistant director, and
programme staff. This is a body created to expedite the decision making process, monitor progress,
and respond to proposals for funding. With the change in the strategy RGVN stopped working with old
NGO partners on micro-finance and aligned with eight new partners to work on enhancing sustainable
livelihoods. Out of these eight, four partners are in Orissa and the other four are in Andhra Pradesh.
RGVN has an established effective structure at the regional and head office which ensures a sound
decision making process and a transparent financial and programme management system. In the
SLEEP project they are making some changes in the decision making process, staff structure and
financial and programme management system at the Partner NGO level for better realization of the
overall objectives of the project. While the livelihood coordinator now heads the project and takes all
the operational decisions, the chief functionary of each partner organisation would do lead head the
project and make operational decisions. Furthermore, the decision making process has to be
participatory with involvement of the beneficiaries, the facilitating staff members and the chief
functionary of each facilitating NGOs.
72 | Report CDI-15-021
RGVN continues to work in 14 states of India. The executive director heads the organisation and is
based in Guwahati while the four regional offices at Guwahati, Patna, Bhubaneshwar and Raipur are
headed by Regional Coordinators. The organisation has a well-developed staff structure with separate
departments for accounts, personnel and operations. RGVN has a team of 313 (259 on contract basis)
staff drawn from the fields of management, social sciences, social work, agriculture, veterinary science
and engineers. Hivos supports RGVN for its work in Odisha State. The Odisha team that works from
the Bhubaneswar office is comprised of 5 key personnel of whom 2 are women and they manage the
day to day operations.
Score baseline: 4.0
Score endline: 4.0 (no change)
1.5.Articulated strategies: 'Strategies are articulated and based on good situation analysis and
adequate M&E'
Observable indicator: strategies are well articulated. Situation analysis and monitoring and evaluation
are used to inform strategies.
Over the period RGVN has devised certain strategies for the sustainability of the organisation moving
from microfinance into sustainable livelihood enhancement. The strategies continue to be well defined
and based on a proper contextual analysis and monitoring which staff now understand better.
Sustainable livelihood enhancement is done by focusing on the core livelihood sub sectors like Non
Timber Forest Produce (NTFP), agriculture and allied agriculture on System of Rice Intensification
(SRI) technology, dairy, organic paddy cultivation, organic vegetable farming, handicraft, etc. For
better achievement of the outcomes RGVN mobilized and strengthened women producers, artisans,
and forest dwellers in its operational areas. The strategies that RGVN is following in the SLEEP project
are:
A three phase model of graduating women in producers groups to producer federations to
producer cooperatives through using the entrepreneurship development concept.
Use of locally adopted, resource saving, knowledge-centric, farmer-led and environment-friendly
technologies.
Coordinated action by communities and community based institutions such as the women self-
help groups, cooperatives, farmer groups and local NGOs.
Inculcating community mobilization skills among women in agriculture, NTFP and bell metal
thereby demonstrating and articulating the benefits of the sustainable livelihood methods to them.
Enhancing the skill base of the women in these livelihood activities to enable them to pursue their
livelihoods on a sustainable basis.
Partnering with local resource agencies for effective deliverance and desired output.
All these strategies are articulated in a participatory manner, making use of good situation analysis,
bottom-up planning and RGVN’s longstanding experience of mobilising and strengthening women
produces, artisans, and forest dwellers in its operational areas.
Score baseline: 3.5
Score endline: 3.5 (no change)
Level of translation of strategy into operations
1.6.Daily operations: 'Day-to-day operations are in line with strategic plans'
This is about the extent to which day-to-day operations are aligned with strategic plans.
With the change in the strategic plan and changing environment the day-to-day operational plans
have been revised. The organisation continues to maintain a bottom up approach in strategic planning.
Plans are normally followed except sometimes due to unavoidable circumstances. The Project Finance
Committee was established to speed up the decision making process. Fortnightly review meetings are
conducted to monitor day-to-day operation and gather informal feedback for smooth execution of the
plan. This has streamlined the operationalization of the strategic plan of the organization. Focused half
yearly, quarterly, monthly and fortnightly monitoring and review meetings continue to be in place to
discuss the progress in the programmes.
Report CDI-15-021 | 73
Score baseline: 4.0
Score endline: 4.25 (very slight improvement)
Level of staff capacity and motivation
1.7.Staff skills: 'Staff have necessary skills to do their work'
This is about whether staff have the skills necessary to do their work and what skills they might they
need.
Over the period RGVN staff has gained skills and knowledge on certain areas that were recommended
during the baseline, such as, sectorial understanding in agriculture, communication and their reports
now read well. Furthermore, skills and knowledge of staff have been increased on business
development, producer entrepreneurship, organic farming, market linkages, value chain and
organisational development, vermin compost production, conducting training of trainers, training their
partner organisations, to initiate dialogue with government line department for support and
convergence. Increased skills and knowledge have been primarily due to capacity building trainings
supported by Hivos and other donors like the Small Industrial Development Bank of India. The low
attrition rate has also helped staff to acquire considerable field experience while working in a compact
unit working on a plethora of activities. Skills on fundraising, M&E, MIS and financial management
have not yet been addressed through trainings. Due to limited staff strength in the regional office of
Bhubaneswar the staff has to multi-task and takes up additional responsibilities. The executive
director feels that despite repeated suggestions the staff at the Bhubaneswar office has not been
unable to put a proposal together for submission to a donor.
Score baseline: 3.0
Score endline: 3.25 (very slight improvement)
1.8.Training opportunities: 'Appropriate training opportunities are offered to staff'
This is about whether staff at the SPO are offered appropriate training opportunities
Over the period the staff participated in ample training programmes and exposure visits supported
both by Hivos (MFS II) and others. The following training and exposure visits were offered to staff in
the last years:
Exposure visit to SAMBANDH supported by Sir Dorabji Tata Trust in 2013.
Exposure visit to Badamba, Raipur, Parbatipuram and Agriculture university firm, Hyderabad
supported by Hivos in 2013.
Training on Portfolio Audit 2012.
Vermicomposting pit development training by Sri Damodar Tata Trust, Mumbai in 2013.
Training on Leadership, financial management and group dynamics in July 2013, Jamunali
supported by Hivos.
Training on Organic farming process in October 2013 at Rambhadhrapuram supported by Hivos.
Training on enterprise promotion and business development in 2013 and August 2014 in
Bhubaneswar supported by Hivos.
Exposure visit to Construction Skills Training Institute, Kolkatta in the year 2014.
Leadership training by Grameen India Foundation, funded by SIDBI in 2014.
Workshop on Producer Entrepreneurship Catalyst and Incubation Facility (ProCIF) organised by
Vrutti Livelihoods sponsored by Hivos 22-23 May 2014 at Bangalore to help the staff graduate
poor producer organisations into self-reliant enterprises. This resulted in the staff to improve
capacity in training the partners on enterprise management skill and techniques of enterprise
promotion activity to supplement the objective of scale up, profitability and market linkages. They
could better plan for community level enterprise promotion and prepared a road map for the
registration of the cluster with suitable legal identity.
74 | Report CDI-15-021
Staff now seems to have more access to trainings on new trends and strategies as the above trainings
fit well with RGVN’s new strategy to focus on sustainable livelihood enhancement. This has improved
since the baseline.
Score baseline: 3.0
Score endline: 3.5 (slight improvement)
1.9.1.Incentives: 'Appropriate incentives are in place to sustain staff motivation'
This is about what makes people want to work here. Incentives could be financial, freedom at work,
training opportunities, etc.
Freedom at work, freedom of experimentation with ideas and skill building through various trainings
and exposure visits continue to motivate staff at work. Pay and benefits are almost at par in the
sector. Benefits like provident fund, leave travel allowance, telephone bills reimbursements and
accommodation are made available to staff. The organisation continues to support internal learning
and reflection processes as part of its culture of creating informed knowledge base and sharing. The
mutual learnings and cross sharing of ideas provide opportunities for staff members to be recognised
and given enhanced responsibilities. However, performance linked incentives for staff have been
stopped since the baseline workshop in August 2012 because of the executive board’s decision to no
longer borrow commercial funds and the end of MFS II funding.
Score baseline: 3.5
Score endline: 3.0 (slight deterioration)
Level of financial resource security
1.9.2.Funding sources: 'Funding from multiple sources covering different time periods'
This is about how diversified the SPOs funding sources are over time, and how the level of funding is
changing over time.
During the baseline in August 2012, RGVN had 11 different funders and was receiving funding in the
form of grants and loans. Now the executive board has made the decision to no longer take loans from
banks, anticipating the inability of the partner organisation to repay their loans. The formation of
Project Finance Committee and Company Social Responsibility (CSR) eligibility certificate from Tata
Institute of Social Studies further strengthened the organisation to explore funding opportunities for
financial sustainability. In 2013, RGVN received funding from the following foreign donors: Hivos,
Indian Network on Ethics and Workshop on Climate Change (funded by EU), Assam Foundation of
North America (United States), Concern Universal (CU), Bangladesh – project funded by EU and
Oxfam India (received from UK). With the change in strategy from microfinance (after the
microfinance crisis) to sustainable livelihood enhancement, RGVN has been able to continue to receive
support from Hivos, and in addition has received funding for this topic from Jamsedji Tata Trust, ACC
Ltd (formerly The Associated Cement Companies Limited) and Larsen & Toubro. For the SLEEP project,
Hivos is the main funder, but RGVN has also contacted several government institutions and other
donors like Malviya foundation, OXFAM, National livelihood mission, National Horticulture mission for
possible support. There are proposals in the pipeline to get funding from: Invest India Micro Pension
Services Private Limited, Vattikuti Foundation, India Foundation for Humanistic Development (IFHD),
Bharat Rural Livelihoods Foundation (BRLF) and the Invest India Micro Pension (IIMP). While RGVN is
approaching new donors and this looks promising, currently they are receiving funding from around 8
donors which is a smaller set of funders than during the baseline.
Score baseline: 3.0
Score endline: 2.75 (very slight deterioration)
1.9.3.Funding procedures: 'Clear procedures for exploring new funding opportunities'
This is about whether there are clear procedures for getting new funding and staff are aware of these
procedures.
Report CDI-15-021 | 75
RGVN continues to have clear cut funding procedures. RGVN has a national level copy of procedures
for exploring new funding opportunities which includes a separate section applicable to RGVN
Bhubaneswar. For the sustainability of the programmes the staff has developed new proposals to
approach different donors. The organisation has started having better working relations with
government agencies, Public Sector Units (PSUs) and to some extent the private sector agencies for
mobilizing funds. The new Company Social Responsibility Act opened an opportunity for RGVN to
mobilise funds. RGVN became a member of National Company Social Responsibility (CSR) Hub
Empanelment team of Tata Institute of Social Science. This is a network working to provide CPSEs
(Central Public Sector Enterprises) with a list of reliable and credible organisations as partners for CSR
activities.9 This Company Social Responsibility (CSR) eligibility certificate from Tata Institute of Social
Studies further strengthened the organisation to explore funding opportunities for financial
sustainability.
RGVN has set up a Project Finance Committee comprising the executive director, assistant director,
and programme staff. This is a body created to expedite the decision making process, monitor
progress, and respond to proposals for funding. Since the baseline interview with the director in 2013,
RGVN head office Guwahati has given autonomy to the regional branches to mobilise funds at its own
and to choose the projects they work on. However, all the application must go through the executive
director. The head office gives strategic support to the regional branches to mobilise funds.
Bhubaneswar regional unit started working among rickshaw pullers on financial inclusion. The idea
came from the executive director and was to create better livelihood opportunities for the rickshaw
pullers and enhance the visibility of RGVN to attract new funders.
The change in strategy from microfinance to sustainable livelihood enhancement has widened their
scope to approach new donors. For example, they are receiving support from ACC (formerly The
Associated Cement Companies Limited) and Larsen & Toubro (L&T) to work the youth skill
development and placement programme which is part of the Phailin cyclone rehabilitation programme.
This programme was initiated by RGVN. RGVN identifies and motivates semi-skilled youths/workers to
receive training facilitated by L&T. This resulted in better networking and visibility of the organisation
to leverage more funds. There are proposals in the pipeline to get funding from: Invest India Micro
Pension Services Private Limited, Vattikuti Foundation, India Foundation for Humanistic Development
(IFHD), Bharat Rural Livelihoods Foundation (BRLF) and the Indian Institute of Planning and
Management (IIMP).
Score baseline: 4.0
Score endline: 4.25 (very slight improvement)
Summary of capability to act and commit
The leadership at the head office continues to be open to ideas and suggestions and has a
decentralised approach with each implementing regional unit. The Regional unit in Bhubaneswar is
autonomous and responsible for its fundraising, but contracts have to be approved and signed by the
RGVN executive director. The executive director feels that despite repeated suggestions the leader at
the Bhubaneswar office has not submitted any funding proposals to the head office. The leadership at
RGVN Bhubaneswar is however, very committed, competent, experienced, responsive and proactive in
taking decisions. The leadership in Bhubaneswar continues to give strategic guidance. While the 2011-
2012 strategic plans could not be implemented mainly due to the micro-finance crisis, and a flood and
cyclone followed, the management made the strategic decision to shift from micro-finance to
sustainable livelihood enhancement. Also external resource mobilisation began to play an important
role as the head office decided to no longer allow external borrowings from banks. RGVN’s new Project
Finance Committee plays an important role in monitoring progress and responding to proposals for
funding. Leadership is now staying more abreast with the latest developments and encourages
9 The new CSR Bill which got approved by the Parliament (and effective from April 2014), with a very strong CSR Clause,
mandates companies with an average profit of INR 50 million in the last three years, to proactively design and undertake
welfare and other developmental activities. The corporate sector would be required to spend 2 % of their net profit for
social development actions.
76 | Report CDI-15-021
innovative ideas in strategy making. Staff turnover continues to be low at the regional unit
Bhubaneswar and staff has become experienced in their work. There has been no new recruitment at
the Bhubaneswar office during the last two years, as the organisation has not been able to procure
any new projects. The Sustainable Livelihood Enhancement and Enterprise Promotion (SLEEP) project
till 2015, funded by Hivos does not have enough funds to attract extra manpower. The organisational
structure at the headquarters in Guwahati and the regional office in Bhubaneswar continued to be the
same, but new board members have replaced the earlier ones. RGVN continues to work in 14 states of
India. The executive director heads the organisation and is based in Guwahati while the four regional
offices at Guwahati, Patna, Bhubaneshwar and Raipur are headed by Regional Coordinators. Hivos
continues to supports RGVN for its work in Odisha, for which the team works from Bhubaneswar.
RGVN’s strategies continue to be well defined and based on good situation analysis and its experience
in working in its operational areas. The overall strategy from RGVN has moved from microfinance to
sustainable livelihood enhancement. In the related project SLEEP, RGVN articulates its strategies
based on their longstanding experience of mobilising and strengthening women produces, artisans,
and forest dwellers. With the change in the strategic plan and changing environment the day-to-day
operational plans have been revised. Fortnightly review meetings are now conducted to monitor day-
to-day operation; this has streamlined the operationalization of the strategic plan of the organization.
Over the period RGVN staff has gained skills and knowledge on certain areas that were recommended
during the baseline and more due to trainings supported by Hivos and other donors like the Small
Industrial Development Bank of India and through staff’s considerable field experience. However, due
to limited staff strength in the regional office of Bhubaneswar the staff has to multi-task and takes up
additional responsibilities. Over the MFS II period the staff participated in ample training programmes
and exposure visits supported both by Hivos (MFS II) and others. Staff now seems to have more
access to trainings on new trends and strategies as the above trainings fit well with RGVN’s new
strategy to focus on sustainable livelihood enhancement. Freedom at work, freedom of
experimentation with ideas and skill building through various trainings and exposure visits continue to
motivate staff at work. However, performance linked incentives have stopped in after the baseline in
August 2012 because of the executive board’s decision to no longer borrow commercial funds and the
end of MFS II funding. During the baseline, RGVN had 11 different funders and was receiving funding
in the form of grants and loans, while RGVN is approaching new donors related to livelihoods and with
its CSR eligibility certificate, currently they are receiving funding from a smaller set of funders than
during the baseline. RGVN continues to have clear cut funding procedures RGVN has a national level
copy of procedures for exploring new funding opportunities which includes a separate section
applicable to RGVN Bhubaneswar. RGVN head office Guwahati has given autonomy to the regional
branches to mobilise funds at its own and to choose the projects they work on.
Score baseline: 3.6
Score endline: 3.7 (no change)
Capability to adapt and self-renew
Level of effective application of M&E
2.1.M&E application: 'M&E is effectively applied to assess activities, outputs and outcomes'
This is about what the monitoring and evaluation of the SPO looks at, what type of information they
get at and at what level (individual, project, organisational).
The shift in the focus from microfinance to sustainable livelihood and demand from the donor for
focused and structured reporting led the organisation to fine-tune and modify monitoring formats and
indicators to collect focussed data from the field. RGVN continues to get both qualitative and
quantitative information from its M&E system. During monthly and half yearly meetings staff continues
to share their field visit experiences. A new initiative is the fortnightly meetings. The management has
initiated fortnightly (informal) review meetings to review and analyse the day to day operation and the
data. It is indicated in the annual plan for the SLEEP project for 2014-15 that the objectives,
indicators, achievements, output and target are well defined to have better evaluation and monitoring
of the programmes. Fine-tuned MIS formats and modified MIS indicators made data collection from
Report CDI-15-021 | 77
the field more focused. RGVN followed the reporting guidelines of Hivos which resulted not only in
better reporting but also triggered RGVN to have a close look at the achievements. As per the contract
a bi-lingual process manual was developed for Orissa and Andhra Pradesh to review the progress of all
the clusters on a quarterly basis for better programme management. Computerized accounting by
using the latest technology was initiated. This has further strengthened the M&E system, but an
overall comprehensive M&E system for the organisation is missing. However, there continues to be a
need for RGVN to link outputs to higher level outcomes.
Score baseline: 4.0
Score endline: 4.25 ( very slight improvement)
2.2.M&E competencies: 'Individual competencies for performing M&E functions are in place'
This is about whether the SPO has a trained M&E person; whether other staff have basic
understanding of M&E; and whether they know what information to collect, how to process the
information, how to make use of the information so as to improve activities etc.
There has been no change in this indicator. RGVN still does not have a dedicated person that works on
M&E. Staff members have a good understanding of M&E. At the Bhubaneswar office, most staff has
worked there for a long time and has over the years been trained in using log frames and results
based analysis. Continuous feedback from Hivos also has helped them improve their knowledge on
monitoring the progress of the SLEEP programme. As a result there is focused data collection and
structured reporting. However, there continues to be a need to setup a proper monitoring system by
establishing a separate monitoring department and hiring a dedicated person for M&E. RGVN has
indicated that they will hire an M&E expert as soon as they have the funds available for this.
Score baseline: 2.5
Score endline: 2.5
Level of strategic use of M&E
2.3.M&E for future strategies: 'M&E is effectively applied to assess the effects of delivered products
and services (outcomes) for future strategies'
This is about what type of information is used by the SPO to make decisions; whether the information
comes from the monitoring and evaluation; and whether M&E info influences strategic planning.
In the fortnightly meetings, day to day planned operations are monitored and reviewed, and gaps
better identified. Inputs from these frequent meetings are used in the half yearly meetings in which
the strategic plan of the organization is discussed. RGVN continue to receive feedback from the donor
which further helps in planning. It is evident from the annual plan 2014-15 that after proper
monitoring and review the organisation has proposed some changes in strategy for programme
management, financial management and decision making process. However, information on the link
between outputs and higher level outcomes are still missing, so these are not guiding the strategic
decisions for the future.
Score baseline: 3.0
Score endline: 3.0 (no change)
Level of openness to strategic learning
2.4.Critical reflection: 'Management stimulates frequent critical reflection meetings that also deal with
learning from mistakes'
This is about whether staff talk formally about what is happening in their programs; and, if so, how
regular these meetings are; and whether staff are comfortable raising issues that are problematic.
There has been a slight improvement in this indicator. During the endline evaluation workshop it was
shared to the evaluation team that while monthly, quarterly and annual meetings continued to take
78 | Report CDI-15-021
place, now fortnightly review meetings were introduced by management. These fortnightly meetings
form a new platform/initiative for the staff to reflect upon the progress of the project, discuss on the
plan and other issues with the assistant director. Management has also become more responsive. This
streamlined the critical reflection process and resulted in better identification of gaps and appropriate
actions taken to address it. Because of a small compact unit of staff at the Bhubaneswar office the
meetings are carried out in an informal way and without any prior notice.
Score baseline: 3.0
Score endline: 3.25 (very slight improvement)
2.5. Freedom for ideas: 'Staff feel free to come up with ideas for implementation of objectives
This is about whether staff feel that ideas they bring for implementation of the program are welcomed
and used.
There has been no change in this indicator. The organisation continues to follow a bottom up approach
and practices flexibility in strategic planning. The assistant director gives considerable autonomy to
the staff to come up with ideas. There has been no new recruitment at the Bhubaneswar office and
most of the staff has been in the organisation for a fairly long period. Though there is hierarchy in the
organisation the staff is allowed to take their own decisions and contribute in the strategy in
coherence with the overall mandate of the organisation.
Score baseline: 4.0
Score endline: 4.0 (no change)
Level of context awareness
2.6.System for tracking environment: 'The organisation has a system for being in touch with general
trends and developments in its operating environment'
This is about whether the SPO knows what is happening in its environment and whether it will affect
the organization.
There has been no change in this indicator. The organisation continues to follow the existing system
for tracking the issues that may affect the functioning of the organisation. For instance, it continues to
work with its implementing NGO partners which helps to have better understanding of the contextual
issues at the field level. The head quarter at Guwahati also shares information with the regional offices
during board meetings and Project Finance Committee meetings. The board members are widely
experienced and guide the staff in adverse situations. Internet, newspapers, government policies,
media and other stakeholders are also used as a source for information on the external environment.
RGVN is still part of a large network. Since the baseline they became a member of the National
Corporate Social Responsibility Hub Empanelment team (NCSRHET) of Tata Institute of Social Science.
This is a network working to provide CPSEs (Central Public Sector Enterprises) with a list of reliable
and credible organisations as partners for CSR activities. This ensures that the organisation keeps a
track on the latest developments in its operating environment in terms of opportunities related to the
CSR Bill. As RGVN has shifted its focus from microfinance to sustainable livelihoods, they now also
track developments in agriculture. In light of large scale government promotional activities for organic
cultivation RGVN has planned for 2014-15 to create conducive environment for the farming
community to shift from non-organic cultivation process to organic based cultivation. This further
ensures that it keeps a track on the latest developments. While, staff RGVN stays informed about their
operating environment, there still seems to be no formal mechanism to track the environment.
Score baseline: 3.0
Score endline: 3.0 (no change)
Report CDI-15-021 | 79
2.7.Stakeholder responsiveness: 'The organisation is open and responsive to their stakeholders and
the general public'
This is about what mechanisms the SPO has to get input from its stakeholders, and what they do with
that input.
There has been no change in this indicator. The organisation continues to be open to take inputs from
different stakeholders and is sensitive to their needs. For example, RGVN has developed its M&E
indicators and formats in the SLEEP project in consultation with the facilitating NGO partners for
effective implementation and reporting of the project activities. RGVN also continues to involve its
partner organisations during the planning phase. At the regional level the draft planning is prepared
and this is send to the head office for review and approval by the Governing Board. Regular visits to
and communication with the partners maintain an open level of interaction. RGVN maintains
transparency in operation and financial matters. There is a periodic sharing of accounts and
operational information to all stakeholders and general public. Periodic review of financial and
operational system is done and shared with all stakeholders.
Score baseline: 4.0
Score endline: 4.0 (no change)
Summary of capability to adapt and self-renew
The shift in the focus from microfinance to sustainable livelihood and demand from the donor for
focused and structured reporting led the organisation to fine-tune and modify monitoring formats and
indicators to collect focussed data from the field. Computerized accounting by using the latest
technology was initiated, which further strengthened the M&E system. However, there continues to be
a need for RGVN to link outputs to higher level outcomes. RGVN still does not have a dedicated person
that works on M&E. At the Bhubaneswar office, most staff has worked there for a long time and has
over the years been trained in using log frames and results based analysis. RGVN has indicated that
they will hire an M&E expert as soon as they have the funds available for this. RGVN continues to get
both qualitative and quantitative information from its M&E system; staff still shares their field visit
experience in monthly and half yearly meetings and now also during fortnightly meetings. It is evident
from the annual plan 2014-15 that after proper monitoring and review the organisation has proposed
some changes in strategy for programme management, financial management and decision making
process. Management has also become more responsive and the fortnightly review meetings have
streamlined the critical reflection process and resulted in better identification of gaps and appropriate
actions taken to address it. The assistant director gives considerable autonomy to the staff to come up
with ideas. Though there is hierarchy in the organisation the staff is allowed to take their own
decisions and contribute in the strategy in coherence with the overall mandate of the organisation.
RGVN continues to work with its implementing NGO partners which helps to have a better
understanding of the contextual issues at the field level. RGVN is still part of a large network. As RGVN
has shifted its focus from microfinance to sustainable livelihoods, they now also track developments in
agriculture. While, staff RGVN stays informed about their operating environment, there still seems to
be no formal mechanism to track the environment. The organisation continues to be open to take
inputs from different stakeholders, especially their partner organisations, and uses their inputs in
developing its M&E indicators and formats in the SLEEP project. Periodic review of financial and
operational system is done and shared with all stakeholders.
Score baseline: 3.4
Score endline: 3.4 (no change)
80 | Report CDI-15-021
Capability to deliver on development objectives
Extent to which organisation delivers on planned products and services
3.1.Clear operational plans: 'Organisation has clear operational plans for carrying out projects which
all staff fully understand'
This is about whether each project has an operational work plan and budget, and whether staff use it
in their day-to-day operations.
There has been no change in this indicator. RGVN continues to have day-to-day operational plans and
budget for each project which the staff fully understands and which are in line with the strategic plan.
Since the baseline workshop in August 2012, with the shift in the strategy from microfinance to the
sustainable livelihood enhancement programme there is a modification in the strategic and operational
plans. Annual strategic and operational plans are prepared with clear indication of activities, output
and results. Bi-monthly operational work plan also prepared which is in line with the annual plan.
Attention has been given for quality enhancement and strict adherence to budget in daily operations.
Score baseline: 4.0
Score endline: 4.0 (no change)
3.2.Cost-effective resource use: 'Operations are based on cost-effective use of its resources'
This is about whether the SPO has the resources to do the work, and whether resources are used cost-
effectively.
There has been no change in this indicator. The restriction of the executive board in borrowing
external funds, the ending of the microfinance project and the phasing out of MFS II funding, further
made RGVN cost conscious in its resource use. RGVN continues to be cost-effective in resource use by
planning the day-to-day operations in line with the annual budget and giving attention to strict
adherence to the budget. As RGVN’s two main projects work in the same geographical areas this
facilitates and saves costs when giving capacity building trainings, organising review meetings and
going on monitoring visits.
Score baseline: 4.0
Score endline: 4.0 (no change)
3.3.Delivering planned outputs: 'Extent to which planned outputs are delivered'
This is about whether the SPO is able to carry out the operational plans.
With the microfinance crisis and RGVN board’s decision to stop taking loans from the bank, the project
of 2011-12 ‘Graduating NGOs in to MF Institutions in the state of Odisha’ could not be delivered as
planned. However, the operational plan of the new Hivos funded program ‘SLEEP’ has been carried
out successfully so far. It is evident from the 2012-13 and 2013-14 annual reports and the donor
assessment of the annual report that the outputs are being delivered as planned. For example the
2013-14 annual report indicates 100% achievement in mobilizing women farmers/Forest
dwellers/DWCRA10
artisans to form producer groups: there is an improvement from 1700 in 2012-13
to 3650 in 2013-14 against the targeted 3650. The new initiative of fortnightly review meetings along
with the existing half yearly and annual review meetings further contributed in effective delivery of the
planned outputs.
Score baseline: 4.0
Score endline: 4.0 (no change)
10
The Development of women and children in Rural Areas or DWCRA is a government sponsored anti-poverty programme
of the Ministry of Rural Development.

Report CDI-15-021 | 81
Extent to which delivered products and services are relevant for target population in terms
of the effect they have
3.4.Mechanisms for beneficiary needs: 'The organisation has mechanisms in place to verify that
services meet beneficiary needs'
This is about how the SPO knows that their services are meeting beneficiary needs
This indicator has not changed since the baseline. RGVN continues to verify whether services meet
beneficiary needs through its monitoring system. Over the period the report format for quarterly
review has been fine-tuned. RGVN staff is now included in the cluster level quarterly review meetings
which were earlier done by only the NGO partners. This further facilitated to know whether services
meet beneficiary needs. The workshops organised by RGVN for SHG leaders and krusak melas (farmer
festivals) also facilitated informal discussion with the target groups to know the outcome of the
projects. The process to know whether service meet beneficiaries needs improved as the MIS
indicators and format was fine-tuned to get proper data from the field. Also fortnightly meetings
streamlined the process.
Score baseline: 4.0
Score endline: 4.0 (no change)
Level of work efficiency
3.5.Monitoring efficiency: 'The organisation monitors its efficiency by linking outputs and related
inputs (input-output ratio’s)'
This is about how the SPO knows they are efficient or not in their work.
There is no formal mechanism to calculate input and output ratio. However, through the fortnightly,
monthly and quarterly review of the projects the efficiency is measured which is linked to the
deliverables. The donor feedback on the annual reports of RGVN and the assessment of planned
targets and its achievements also contribute in monitoring efficiency of the organisation. There is an
internal audit and the external audit by RGVN head office to ensure transparency and accountability in
utilisation of funds. More detailed report writing, more interaction at field during training programs and
frequent feedback from partners streamlined the monitoring efficiency system.
Score baseline: 3.0
Score endline: 3.0 (no change)
3.6.Balancing quality-efficiency: 'The organisation aims at balancing efficiency requirements with the
quality of its work'
This is about how the SPO ensures quality work with the resources available
The small team of experienced staff at the Bhubaneswar office continues to ensure team work and
good results. The staff could better implement the project as there is an operational plan and
improved MIS format to monitor the project’s quality and efficiency. The staff has been there for a
long time and is well-experienced, which contributes in balancing efficiency with the quality of work.
Better planning, use of technology in the accounting system, fortnightly review meetings, and the
formation of the Project Finance Committee improved the quality and efficiency of work. Appropriate
trainings are given to the partners and beneficiaries to deliver quality work.
Score baseline: 3.0
Score endline: 3.25 (very slight improvement)
82 | Report CDI-15-021
Summary of capability to deliver on development objectives
RGVN continues to have day-to-day operational plans and budget for each projects which the staff
fully understands and which are in line with the new strategic plan on sustainable livelihood
enhancement programme. The restriction of the executive board in borrowing external funds, the
ending of the microfinance project and the phasing out of MFS II funding, further made RGVN cost
conscious in its resource use. Geographical overlap in RGVN’s two main projects saves costs when
visiting the target groups. With the microfinance crisis and RGVN board’s decision to stop taking loans
from the bank, the project of 2011-12 ‘Graduating NGOs in to MF Institutions in the state of Odisha’
could not be delivered as planned. However, the operational plan of the new Hivos funded program ‘
SLEEP’ has been carried out successfully so far. The new initiative of fortnightly review further
contributed in effective delivery of the planned outputs. RGVN continues to verify whether services
meet beneficiary needs through its monitoring system There is still no formal mechanism to calculate
input and output ratio. More detailed report writing, fortnightly meetings, and more interaction at field
during training programs and frequent feedback from partners streamlined the monitoring efficiency
system. The small team of experienced staff at the Bhubaneswar office continues to ensure team work
and good results. Better planning, use of technology in the accounting system, fortnightly review
meetings, and the formation of the Project Finance Committee improved the quality and efficiency of
work.
Score baseline: 3.7
Score endline: 3.7 (no change)
Capability to relate
Level of involving external parties in internal policy/strategy development
4.1.Stakeholder engagement in policies and strategies: 'The organisation maintains relations/
collaboration/alliances with its stakeholders for the benefit of the organisation'
This is about whether the SPO engages external groups in developing their policies and strategies, and
how.
There has been no change in this indicator. RGVN continues to engage its stakeholders for the benefit
of its operations, plans and outcomes. They are proactive in analysing trends jointly with other
stakeholders. RGVN Governing board takes all policy and governance related decisions on a quarterly
and annual basis. The organization has strengthened its relationship with the government which was
weak during baseline. However, the relationship is only to the point of linking up government schemes
and programmes to the target groups but not at the level of involving them in policy or strategy
making.
Score baseline: 3.0
Score endline: 3.0 (no change)
Level of engagement of organisation in networks, alliances and collaborative efforts
4.2.Engagement in networks: 'Extent to which the organization has relationships with existing
networks/alliances/partnerships'
This is about what networks/alliances/partnerships the SPO engages with and why; with they are local
or international; and what they do together, and how do they do it.
In RGVN’s new programmes they continue to work with NGO partners to implement its programmes.
Over the period with the shift in the strategic plan the organisation has established relationships with
eight new NGO partners, out of whom four are in Orissa and the other four are in Andhra Pradesh. The
new Company Social Responsibility (CSR) Act facilitated the organisation to establish corporate
partnership with ACC Limited (formerly The Associated Cement Companies Limited) and Larsen &
Toubro (L&T) for training and employment of semi-skilled workers from the under privileged segment.
Report CDI-15-021 | 83
RGVN became a member of National CSR Hub Empanelment team of Tata Institute of Social Science.
This is a network working to provide CPSEs (Central Public Sector Enterprises) with a list of reliable
and credible organisations as partners for CSR activities. A few new networks have been established
since the baseline workshop in August 2012: Invest India Micro Pension, VattiKutti Foundation, Jindal
Association. In the last months RGVN established better linkages with government departments
through linking and converging with government programs and schemes. Also there was trust built
with the government by implementing the rehabilitation program for the Phailin and flood victims.
Score baseline: 4.0
Score endline: 4.25 (very slight improvement)
Extent to which organisation is actively engaging with target groups
4.3.Engagement with target groups: 'The organisation performs frequent visits to their target groups/
beneficiaries in their living environment'
This is about how and when the SPO meets with target groups.
There has been no change in this indicator. The organisation continues to engage actively with the
target groups. The downward communication generally happens through developing and
strengthening other partner organisations to reach out effectively to the primary stakeholders. RGVN
organizes various periodic workshops, exposure visits, krusak melas (farmer festivals) which facilitates
engagement with the target groups.
Score baseline: 3.0
Score endline: 3.0 (no change)
Level of effective relationships within the organisation
4.4.Relationships within organisation: 'Organisational structure and culture facilitates open internal
contacts, communication, and decision-making'
How do staff at the SPO communicate internally? Are people free to talk to whomever they need to
talk to? When and at what forum? What are the internal mechanisms for sharing information and
building relationships?
The assistant director at the Bhubaneswar office being democratic in her approach gives considerable
autonomy to her staff in terms taking decisions for their respective projects. The small team in
Bhubaneswar has been working together for a long period. This has facilitated better communication
both at the professional and personal front. In general there continues to be open communication in
the organisation. RGVN teams have internal team meetings, and the senior management team meets
every three months. Formal meetings are mostly through monthly meetings, quarterly review, training
and workshops, strategic planning exercises, retreats etc. The evaluation team observed that the
relationship between RGVN Bhubaneswar and RGVN head office Guwahati is getting unpleasant as
they compete with each other for the same projects.
Score baseline: 3.5
Score endline: 3.25 (very slight deterioration)
Summary of capability to relate
RGVN continues to engage its stakeholders for the benefit of its operations, plans and outcomes. The
organization has strengthened its relationship with the government; however, the relationship is only
to link up government schemes to the target groups and not at the level of involving them in policy or
strategy making. RGVN continues to work with NGO partners to implement its programmes. The new
Company Social Responsibility (CSR) Act facilitated the organisation to establish corporate
partnerships. A few other new networks have been established since the baseline workshop in August
2012. And RGVN established better linkages with government departments through linking their target
group to government schemes and because of built up trust by implementing the rehabilitation
84 | Report CDI-15-021
program for the Phailin and flood victims. The organisation continues to engage actively with the
target groups.
RGVN organizes various periodic workshops, exposure visits, krusak melas (farmer festivals) which
facilitates engagement with the target groups. The assistant director at the Bhubaneswar office being
democratic in her approach gives considerable autonomy to her staff in terms taking decisions for
their respective projects. The evaluation team observed that the relationship between RGVN
Bhubaneswar and RGVN head office Guwahati is getting unpleasant as they compete with each other
for the same projects.
Score baseline: 3.4
Score endline: 3.4 (no change)
Capability to achieve coherence
Existence of mechanisms for coherence
5.1.Revisiting vision, mission: 'Vision, mission and strategies regularly discussed in the organisation'
This is about whether there is a vision, mission and strategies; how often staff discuss/revise vision,
mission and strategies; and who is involved in this.
The organisation continues to revisit vision and mission of the organisation every 5 years. Due to the
microfinance crisis, a change in the donor’s priority, the floods and Phailin cyclone, the organisation
has made a strategic shift from microfinance to community based micro-enterprise development
leading to sustainable livelihood enhancement. The strategic shift is in alignment with the vision (a
world where the poor and underprivileged can live with dignity and prosperity) and mission (to
improve the quality of life of the urban and rural poor and underprivileged through microfinance and
social action) of the organization.
Score baseline: 4.0
Score endline: 4.25 (very slight improvement)
5.2.Operational guidelines: 'Operational guidelines (technical, admin, HRM) are in place and used and
supported by the management'
This is about whether there are operational guidelines, which operational guidelines exist; and how
they are used.
There is no change in this indicator. The organisation continues to have operational guidelines like a
HR policy which is part of the Administrative Manual of which a hard copy exists. The performance
appraisal system is still part of the HR policy. There are also operational manuals. Separate books of
account and ledger are maintained and a separate audit reports are prepared as per the funder’s
requirement.
Score baseline: 3.0
Score endline: 3.0 (no change)
Level of coherence of various efforts of organisation
5.3.Alignment with vision, mission: 'Projects, strategies and associated operations are in line with the
vision and mission of the organisation'
This is about whether the operations and strategies are line with the vision/mission of the SPO.
RGVN’s projects, strategies and operations continue to be in line with their vision and mission. The
new Sustainable Livelihood Enhancement and Enterprise Promotion project aims at empowerment of
women in agriculture, NTFP and handicraft by making systematic interventions to enhance their
participation and productivity. The aim is gradually graduate individuals (women) from SHGs to
producer federations to producer companies through entrepreneurship development for sustainable
Report CDI-15-021 | 85
livelihoods. It works in the four Tribal dominated pockets of Southern Odisha, Central Odisha, where
predominantly tribal, unprivileged, poor people live. This is very much in line with RGVN’s vision to
improve the quality of life of the rural and urban underprivileged poor through social action.
Score baseline: 4.0
Score endline: 4.0 (no change)
5.4.Mutually supportive efforts: ‘The portfolio of project (activities) provides opportunities for mutually
supportive efforts’
This is about whether the efforts in one project complement/support efforts in other projects.
There has been no change in this indicator. RGVN’s projects continue to be mutually supportive. The
Jivika rehabilitation of flood victims in Puri & Nayagarh districts of Odisha project was outlined based
on the experiences gained during RGVN’s survey and relief distribution programme in 2011 with
support from Jamsedji Tata Trust, Mumbai (JTT). The project promotes sustainable rural livelihoods in
sub sectors like goatery, bamboo work, vermicomposting, organic farming and cycle rickshaw/trolley
at the house hold level. This project aims at empowering women among the marginalized poor people
of this area. The SLEEP project and Jivika project both aim at promoting sustainable livelihood
promotion among the women, work in the same geographical areas and focus on the same core
livelihood sub sectors. This facilitates mutually supportive efforts in organizing capacity building
trainings, review meetings and monitoring visits.
Score baseline: 3.0
Score endline: 3.0 (no change)
Summary of capability to achieve coherence
The organisation continues to revisit vision and mission of the organisation every 5 years. Due to the
microfinance crisis, a change in the donor’s priority, the floods and Phailin cyclone, the organisation
has made a strategic shift from microfinance to community based micro-enterprise development
leading to sustainable livelihood enhancement. The strategic shift is still in alignment with the
unchanged vision and mission of the organization. The organisation continues to have operational
guidelines like a HR policy which is part of the Administrative Manual of which a hard copy exists.
RGVN’s projects, strategies and operations continue to be in line with their vision and mission. The
new SLEEP project’s strategies are very much in line with RGVN’s vision to improve the quality of life
of the rural and urban underprivileged poor through social action. RGVN’s projects continue to be
mutually supportive. The SLEEP project and Jivika project both aim at promoting sustainable livelihood
promotion among the women, work in the same geographical areas and focus on the same core
livelihood sub sectors.
Score baseline: 3.5
Score endline: 3.6 (no change)
86 | Report CDI-15-021
Results - key changes in Appendix 4
organisational capacity -
general causal map
Below you will find a description of the general causal map that has been developed for the SPO
during the endline workshop. Key changes in organisational capacity since the baseline as identified by
the SPO during this endline workshop, are described as well as the expected effects and underlying
causal factors, actors and events.
The evaluation team carried out an endline assessment at RGVN from 19 to 20 August 2014. During
this workshop, the team made a recap of key features of the organisation since the baseline workshop
in August 2012 and the interview with the Director at the head office in the North-East in June 2013
(such as vision, mission, strategies, clients, partnerships). This was the basis for discussing changes
that had happened to the organisation since the baseline. The two main changes that happened in the
organisation since the baseline, as identified by the staff during self -assessments, interviews and
during the workshop were:
Improved capacity of the staff to train partners on technology and other issues [2]
Improved relationships with networks [3]
The two main organisational capacity changes are described in the light orange boxes and some of
their key consequences are noted above these cards in dark orange. Unless explicitly stated that a
change happened since the interview with the Director in June 2013, the changes took place since the
baseline workshop in August 2012. Light purple boxes represent factors and aspects that influence the
key organisational capacity changes (in light orange). Key underlying factors that have impacted the
organisation are listed at the bottom in dark purple. The narrative describes per organisational
capacity change, the contributing factors as described from the top down. The numbers in the visual
correspond with the numbers in the narrative.
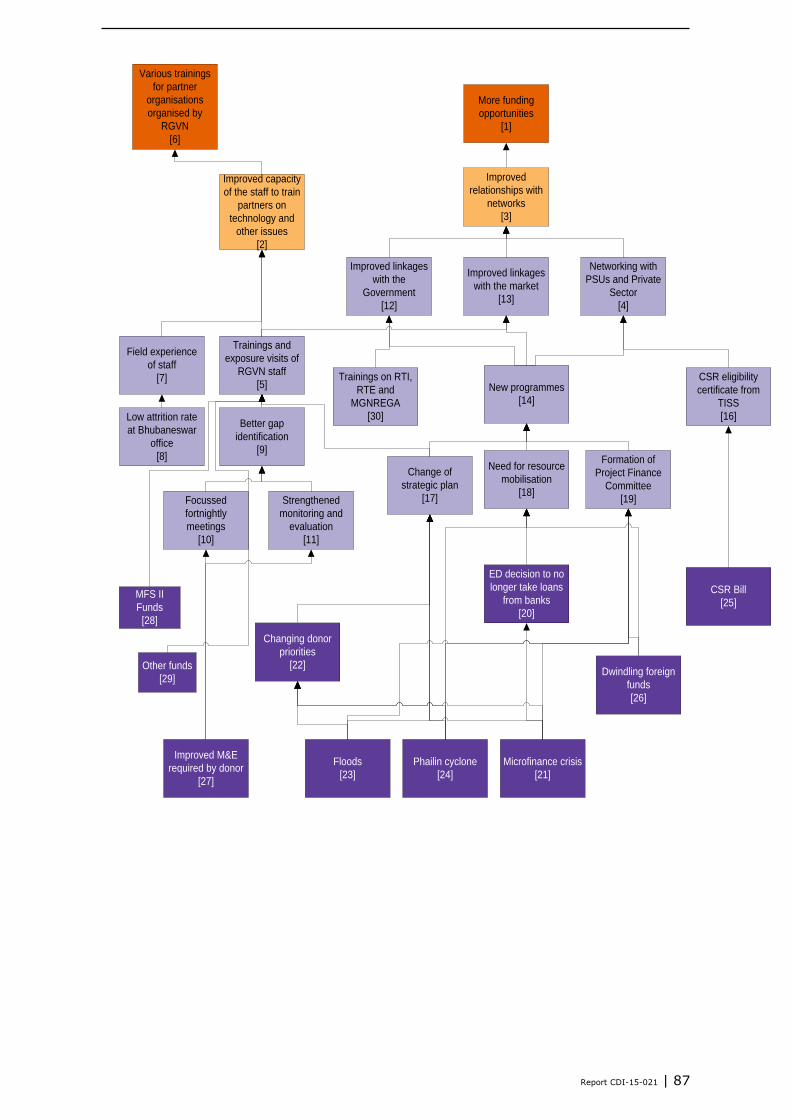
Report CDI-15-021 | 87
Improved capacity
of the staff to train
partners on
technology and
other issues
[2]
Improved
relationships with
networks
[3]
Trainings and
exposure visits of
RGVN staff
[5]
Better gap
identification
[9]
Strengthened
monitoring and
evaluation
[11]
Focussed
fortnightly
meetings
[10]
Improved linkages
with the
Government
[12]
Improved linkages
with the market
[13]
Networking with
PSUs and Private
Sector
[4]
CSR eligibility
certificate from
TISS
[16]
New programmes
[14]
Change of
strategic plan
[17]
Need for resource
mobilisation
[18]
Formation of
Project Finance
Committee
[19]
CSR Bill
[25]
ED decision to no
longer take loans
from banks
[20]
Changing donor
priorities
[22]
Microfinance crisis
[21]
Floods
[23]
Phailin cyclone
[24]
Various trainings
for partner
organisations
organised by
RGVN
[6]
Field experience
of staff
[7]
Low attrition rate
at Bhubaneswar
office
[8]
Dwindling foreign
funds
[26]
Trainings on RTI,
RTE and
MGNREGA
[30]
More funding
opportunities
[1]
Improved M&E
required by donor
[27]
MFS II
Funds
[28]
Other funds
[29]
88 | Report CDI-15-021
Improved capacity of the staff to train partners on technology and other issues [2]
After the Micro Finance crisis in 2009 the organization went through a rough patch and the 2011 flood
and cyclone Phailin [Source: Flood & Phailin details] in the organisation’s partner areas further
worsened the condition. The partners’ ability to recover loans meted out and pay back RGVN was
questionable in the face of such large scale disaster. The organization was not able to recuperate fully
till the baseline conducted in 2012. During this time the focus had already shifted from micro finance
to sustainable livelihood enhancement of the target group. The main source of income of the target
population is agriculture and allied activities. However, the strategy was still in an embryonic stage.
RGVN is committed to the sustainable livelihood enhancement of rural poor in accordance with its
vision and mission. Lack of technical knowledge on agriculture, marketing, value addition, lack of
irrigation facilities, and exploitation by middlemen, periodic natural disasters and lack of financial
inclusion affected the target groups’ livelihood security. Since the baseline, the organization has
undertaken steps to improve the basic skill sets and marketing linkages of the target groups by
improving the capacity of the RGVN staff in these directions. [Source: ARR+WP 12-13-14]. The
improved capacity of RGVN staff to train partners on technology and other issues, which has had a
trickledown effect on the capacity of RGVN’s partners and the target group in coping mechanisms. As
a result of RGVN’s improved capacity to organize and give trainings to partners, several capacity
building trainings on value addition, market linkages, organic farming, vermicomposting production
were organized by RGVN staff [6] as per the contract with Hivos for the new project ‘Sustainable
Livelihood Enhancement and Entrepreneur Promotion’ (SLEEP) [Source: Signed contract-hard copy].
This project replaced the previous one on microfinance after the microfinance crisis. These trainings
include:
- Two days training on ‘Group Dynamics, Conflict Resolution, Leadership and Financial Management’
was organized by RGVN at Jamunali on 19-20 July 2013 for the SHG leaders. They were trained
on allied agricultural development, group dynamics, market linkages, and basics of financial
viability of an association [Source: Sample Field trg. Minutes].
- Two days training on ‘Vermicomposting production’ was organized by RGVN at Pratappur on 9-10
August 2013 funded by Hivos. The objective of the training was to develop the skill and knowledge
of the farmers on Vermicomposting production, its impact on land, its marketability and household
level labour saving aspect [Source: Sample Vermi Trg.Minutes].
- One day Krusak Mela (farmers’ get-together) was organized by RGVN at Kanasa in March 2013.
The objective was to orient the farmers on organic farming, market linkages, preparing indigenous
cold storage and show casing best practices and practitioners [Source: Krusak Mela].
- One day training program on “Enterprise Promotion and Business Development Plan” was
organized by RGVN on 14-15 May 2014 at Vizagapatam, AP. This enhanced the knowledge of the
partners in business development, market linkages, value chain, banking practices, financial
inclusion etc. Resource person Mr. I.B Raju, Assistant Professor, GIM, GITAM University,
Visakhapatnam was invited to facilitate the training [Source: Sample Central Training Minutes].
Staff’s capacity to train partners [2] improved because of the field experience that staff got [7] and
because of RGVN staff attending various trainings and exposure visits [5]. Both are further explained
below.
Field experience of staff [7]
Capacity of the staff to train partners on technology and other issues also improved because some
RGVN staff has been there for a long time working in a small compact unit, doing a variety of activities
they also have learnt from field experience [Source: ARR+WP 12-13-14, ARR+Work Plan 2013-14-15,
5c endline self-assessment sheet_ management _India_ RGVN]. This was because of a low attrition
rate at the Bhubaneswar office [8]. This is where the team works that is supported by Hivos to work
on the SLEEP project.
Trainings and exposure visits of RGVN staff [5]
Increased capacity of the RGVN staff [2] was furthermore due to various capacity building trainings
and exposure visits [5] supported by Hivos and other donors. These trainings include:
Two-day training was organized by Vrutti Livelihoods, Bangalore on 22-23 May 2014 sponsored by
Hivos on producer entrepreneurship catalyst and incubation facility. The focus of the training was
to help the staff to assist unviable producer organisations into self-reliant enterprises [Source: 5c
endline self-assessment sheet_management_India_RGVN, Workshop on Producer
Report CDI-15-021 | 89
Entrepreneurship Catalyst and Incubation Facility May 2014]. Funded by MFS II [28]. The training
was attended by assistant director of RGVN, Bhubaneswar Region.
Two- day training was organised with the support of Hivos (MFS II) on 18-19 August 2014 at
Bhubaneswar on enterprise promotion and business development. The programme coordinators of
RGVN participated in this [Source: 5c endline self-assessment sheet_programme
staff_India_RGVN]. Funded by MFS II [28]. The programme coordinators of RGVN participated in
the training programme.
Training programme on vermicomposting pit by Sir Dorabji Tata Trust (SDTT), Mumbai in 2013
[Source: 5c endline self-assessment sheet_programme staff_India_RGVN]. Funded by SDTT [29].
The training was attended by 3 project staff and programme coordinator of RGVN, Bhubaneswar.
Leadership training was organized by Small Industrial Development Bank of India (SIDBI) in 2014
[Source: 5c endline self-assessment sheet_programme staff_India_RGVN]. Funded by SIDBI [29].
The Programme Coordinator of RGVN, Bhubaneswar attended the training.
The organization also arranged a number of exposure visits for the staff during the last two years to
help them learn about vermicomposting, bio-pesticides, governance, value chain analysis and organic
farming [Source: 5c endline self-assessment sheet_management_India_RGVN]:
Exposure visit to Badamba, Raipur, Parbatipuram and Agriculture university farm, Hyderabad,
supported by Hivos enabled the staff to have practical knowledge and skills which was passed on
to the partner organisations later. These visits also enabled the staff to network with likeminded
organisations [Source: 5c endline self-assessment sheet_management_India _RGVN]. Funded by
MFS II [28].
Visit to SAMBANDH supported by Sir Dorabji Tata Trust. Sambandh is a Microfinance institution,
which also trains organisations to graduate to producer companies [Source: 5c endline self-
assessment sheet_management_India_RGVN]. Funded by SDTT [29].
Staff was sent to trainings and exposure visits [5] since they realised there is a gap in terms of
knowledge and skills [9] and also because of the change in the strategic plan [17], as working topics
like strengthening livelihoods in the SLEEP project required further training to gain knowledge and
skills on this. The identification of gaps in knowledge and skills [9] was done during fortnightly
meetings [10] where a strategy for diversification of resource mobilisation was being discussed. It was
also the result of having strengthened monitoring and evaluation [11] [Source: 5c endline self-
assessment sheet_management_India_RGVN]. These are further explained below.
- Focused fortnightly meetings [10]
The fortnightly meeting was a new initiative taken by the management in order to streamline the
reporting and monitoring structure. Here day-to-day planned operations were monitored and
reviewed, gaps in knowledge and skills were better identified which streamlined the strategic plan
of the organization for smooth functioning of projects and planning of trainings and exposure
visits[Source: ARR + Work Plan 2013-14-15, 5c endline self-assessment
sheet_management_India_RGVN].
- Strengthened monitoring and evaluation [11]
There was change in the strategic plan to shift to sustainable livelihood enhancement, demand
from the donor to have detailed and focused data collection, commitment of the organization to
fulfil the needs of the target group and increasing focus of donors on evidence based grant making
and value for money analysis pushed the organisation to strengthen their monitoring and
evaluation. As a result they refined the monitoring and evaluation formats and indicators. Now the
data collection is both qualitative and quantitative, whereas during the baseline it was only
quantitative [Source: Endline evaluation workshop, 5c endline self-assessment
sheet_management_India_RGVN, 1004806_RGVN_Assessment of 2014 Annual Review Report]
Focused fortnightly meetings [10] were taken up by the management and monitoring and evaluation
was strengthened [11] to streamline the monitoring and evaluation structures and processes because
of the donors requirements [27].
Improved relationships with networks [3]
There have been a couple of issues that have greatly affected RGVN and the need to look for
additional funding by strengthening their networks. After the microfinance crisis in 2009 [21] the
organization went through a rough patch as floods in 2011 and 2014 [23] and the cyclone Phailin in
2013 [24] in the organisation’s partner areas further worsened the situation [Source: Flood & Phailin
details]. The partners’ ability to recover loans meted out and pay back to RGVN was questionable in
the face of such large scale disaster. The organization was not able to recuperate fully from the
90 | Report CDI-15-021
Microfinance crisis in 2009 and the floods in 2011 till the baseline workshop conducted in August
2012. During this time the focus had already shifted from microfinance to sustainable livelihood
enhancement of the target group. However, the strategy was still in an embryonic stage [Source:
RGVN Baseline report]. In the post baseline period, the executive board of RGVN decided to restrict
external borrowings from banks and other financial institutions anticipating the inability of the partner
organisations to repay RGVN. This initiated the RGVN management to think in the direction of external
resource mobilization, develop linkages with government programs and schemes, linkages with
market and improve capacity of the staff to implement sustainable livelihood programmes to the
target group [Source: 5c endline self-assessment sheet_management_India_RGVN, ARR+WP 12-13-
14, RGVN-Annual-Report-2012-13-Final-Draft].
The precarious funding situation, compelled the management to think of converging and linking with
government programmes, the market, Public Sector Units (PSUs) and the private sector to enhance
the livelihood security of the target groups [3][Source: Endline evaluation workshop, 5c endline self-
assessment sheet_management_India_RGVN, Flood & Phailin details]. Improved relationships with
networks [3] is expected to lead to more funding opportunities for RGVN [1]. Improved relationships
with networks [3] was because of improved linkages with the government [12], improved linkages
with the market [13] and networking with PSUs and the private sector [4]. Each of these linkages are
further explained below.
Linkages with the government [12]
During the baseline workshop (August 2012) there was a need for RGVN to develop a relationship with
government institutions and maintain a strategic relationship, so that they could better translate their
commitments to the target groups. The organization’s initiative to rehabilitate the Flood (August 2014)
and Phailin (October 2013) affected people and the capacity to implement sustainable livelihood
programs, facilitated the organization to develop a trust relationship with the government in the last
one and half years (2013-14). Since 2013, RGVN staff has better linkages with government line
departments at local level, state level officials and other semi-governmental organisations and
corporations which run delivery programmes for the poor [Source: 5c endline self-assessment
sheet_management_India_RGVN, Flood & Phailin details,
http://www.slideshare.net/RanjanPraharaj/phailin-response-by-uaa-in-ganjam-district-of-odisha]. This
is evident from the fact that the organization could linkup government schemes and programs to the
target groups (farmers in Odisha). With the support of RGVN the target groups could access the inputs
provided by the government in the form of a vermicomposting pit. Nearly 25 vermicomposting pits
have been constructed by the State Agriculture Department of Odisha in one of the vegetable growing
clusters in the Anugul district. In another vegetable growing cluster area in Dhenkanal the farmers
have been helped in getting support from the State Agriculture Department of Odisha for Shade Net
Nursery. Also NTFP collectors and traders have been able to receive 5 tamarind cake making machines
with support from the Tribal Development Corporation. All these have been facilitated by RGVN and its
partners [Source: ARR + Work Plan 2013-14-15]. Some of the plans are in the pipeline. For example,
RGVN has approached the state and national horticulture board, state agricultural technology
institutes, the forest department, the state handicraft development board and the state Khadi and
Village Industry board to link with them through different schemes. Banks and financial institutions
(FIs) have been approached for providing working capital support for product enhancement at a low
interest rate [Source: ARR + Work Plan 2013-14-15]. Given that some of the board members are
heads of FIs, it should not be an uphill task, yet while RGVN Guwahati gets its share, RGVN
Bhubaneswar is left out. RGVN strengthening its linkages with the government is thus; because of the
new programmes [14] they have been and will be involved in with government agencies, (more on
new programmes later on) and trainings [30] on Right to Information (RTI), Right to Education (RTE),
Mahatma Gandhi National Rural Employment Guarantee Act (MGNREGA) [Source: Endline evaluation
workshop, 5c endline self-assessment sheet_management_India_RGVN, Flood & Phailin details].
Linkages with the market [13]
Due to lack of knowledge and skills on value addition, marketing, variable market condition,
exploitative middlemen, and other factors the target groups often find it difficult to get out of the
poverty trap. RGVN is committed to align its work with its vision and mission to enhance the livelihood
of the target groups. In order to do so they provide them with handholding support in areas like value
addition and creating direct linkages with the market. To be able to provide this support RGVN has
trained itself after the baseline workshop in August 2012 on these topics [5]. For example, in terms of
value addition: Value addition is a process in which the farmers are given handholding support to give
due care during processing, preservation and sorting and grading in NTFP and vegetable product
which have a positive impact on the pricing and marketing of the products. During last two years
(August 2012-2014) RGVN staff provided trainings and handholding support to the target groups on
Report CDI-15-021 | 91
value addition, marketing, etc. They also facilitated access to fair & remunerative markets including
linking producer groups to marketing opportunities by market aggregators [Source: Endline evaluation
workshop, ARR+WP 12-13-14]. An example of value addition activities was tamarind collection and
marketing. With the technical support provided by RGVN now the farmers have better capacity in
processing, sorting, packaging and grading for proper pricing of the product and to maintain quality
aspect with the buyers [Source: ARR + Work Plan 2013-14-15, Endline Evaluation Workshop].
During the last two years (August 2012- August 2014) RGVN initiated and funded “Bazaar on Wheels”,
a new project to strengthen producer organizations and their access to market. The project focuses
especially on access to market for the women producer groups. They are provided with capacity
building trainings and provision of a van for marketing their products. This is a pilot project carried out
by RGVN through Jagruti Mahila Mahasangha at Govindpur of Dhenkanal district. At present the Mahila
Mahasangha (Federation) has a membership of 1200 women and diversified its production to non-
farm activities. This has enabled wider markets and enhanced profits [Source: RGVN-Annual-Report-
2012-13-Final-Draft, 5c endline self-assessment sheet_programme staff_India_RGVN]. Improved
linkages with the market [13] for RGVN has thus been a result of the new programmes [14] they have
been involved in and the trainings and exposure visits staff went to [5].
Networking with different Public Sector Units (PSUs) and private sector [4]
RGVN Bhubaneswar has started having better working relations with Public Sector Units and to some
extent the private sector agencies. The microfinance crisis and the executive board’s decision to
restrict borrowing commercial funds created financial crunch in the organization. Also, as the
implementation focus has been concentrated on production enhancement, marketing linkages,
working capital linkages, value addition etc. to move the clusters into the next phase of sustainability
of the activities compelled the organization to make strategic change for resource mobilization
[Source: Endline evaluation workshop, ARR + Work Plan 2013-14-15, Strategy_Minutes]. Some of
the new networked partners are:
- In the post Phailin (October 2013) period RGVN in association with ACC Limited (formerly The
Associated Cement Companies Limited) supports and rehabilitates the Phailin and flood affected
people of Odisha. Also in collaboration with Larsen & Toubro (L&T), RGVN has taken up the project
in the post Phailin period to provide placement to the semi-skilled Phailin and Flood effected
people [Source: Endline evaluation workshop, 5c endline self-assessment
sheet_management_India_RGVN].
- Jamsedji Tata Trust: Since 2012 RGVN has developed a network with Jamsedji Tata Trust to
promote sustainable livelihood of the poor flood and Phailin effected people [Source:
Narrative_Annual_report_of_Project-_JIVIKA_June_1, 2012-May_31, 2013, Flood & Phailin details,
Endline evaluation workshop].
- With the inception of the new project Sustainable Livelihood Enhancement and Enterprise
Promotion (SLEEP) there are eight new partner NGOs with RGVN. This project runs from July 1st,
2012 till June 30th 2015. Out of these eight, four partners are in Orissa: SHAKTI, Raygada; Viswa
Yuva Kendra, Baninali, Angul; Gania Sisu Raija, Gania, Nayagargh Integrated Rural Harijana
Adibasi Development Centre, Dhenkanal. The other four partners are in Andhra Pradesh:
Chaitanya Bharathi – Vizianagaram, SAMIDA, Yelamanchili, NATURE Araku, and CMS Hyderabad.
While this project had started when the baseline workshop was conducted, it was still in its initial
stage. In the post baseline workshop period (after August 2012) the project gradually
strengthened and implemented [Source: Endline evaluation workshop, ARR + Work Plan 2013-14-
15, 5c endline self-assessment sheet_management_India_RGVN, RGVN-Annual-Report-2012-13-
Final-Draft, Strategy_Minutes].
Networking with PSUs and Private sectors [4] improved because of new programmes [14] and CSR
eligible certificate from Tata Institute of Social Science (TISS) [16].
- New programmes [4]
The following are some of the new programmes that were undertaken by RGVN during the last
two years (August 2012- August 2014):
Placement linked target program is part of the Phailin rehabilitation program that
started after October 2013, which was initiated by RGVN in association with ACC and L&T.
RGVN identifies and motivates semi-skilled youths/workers to receive training facilitated
by L&T. As of now 81 candidates are sponsored by RGVN. L&T has initiated the
Construction Skilled Training Institutes in a joint venture with vocational training
institutes across the country to train rural youth. The 8th Construction Skills Training
Institute (CSTI) at Gopalpur, Cuttack in the state of Odisha was established in June 2012.
The training institute is a joint initiative between the Government of Odisha and L&T. The
building and land infrastructure is provided by the State and L&T is the knowledge
92 | Report CDI-15-021
provider and training partner. Subsequent to the training, L&T also facilitates placement
of trainees through subcontractors at project sites for the willing candidates [Source:
Endline Evaluation Workshop, 5c endline self-assessment
sheet_management_India_RGVN,
http://www.lntecc.com/homepage/csti/jointventures.htm].
SLEEP project facilitated the organization to approach new programs such as, NTFP
processing, value addition & marketing, Organic vegetable farming, DWCRA11 / bell metal
work from production to marketing. This project runs from July 1st, 2012 till June 30th
2015 [Source: ARR + Work Plan 2013-14-15, Micro Plan- Ramanaguda NTFP cluster].
The JIVIKA programme started in June 2012 and was outlined based on the
experiences gained during the survey and relief distribution program conducted by RGVN
with support from Jamsedji Tata Trust, Mumbai (JTT). The project promotes sustainable
rural livelihoods in sub sectors like- Goatery, Bamboo work, vermicomposting, organic
farming (vegetable & paddy farming through System of Rice Intensification SRI
technology) and cycle rickshaw/trolley at the house hold level. This also includes
recognizing and strengthening potential SHGs who would be the vectors for such activities
as beneficiaries, verification, and final distribution on the need based report. While this
programme started before the baseline workshop in August 2012, it was implemented
and strengthened after the baseline workshop [Source:
Narrative_Annual_report_of_Project-_JIVIKA_June_1, 2012-May_31, 2013, Flood &
Phailin details].
Working capital support to rickshaw pullers: Graduating rickshaw pullers to become
owner of the rickshaws they use to make a living. RGVN had identified 35 flood victims to
become involved in this project. However, with the approved budget for the activity
(capital cost) they could manage to extend the number up to 40 cycle rickshaw/trolley to
40 beneficiaries and 5 bi-cycles to 5 women beneficiaries to expedite their mobility in the
business of stone carving items, toy business & fast food business. The synthesis of the
total attempt was to create adequate livelihood opportunity at the house hold level and
ensure food security. The model has been so effective that it has been adopted by
Syndicate Bank and Allahabad Bank, two of the leading banking partners with credible
presence in the project area. This is evidence of spill over effect of piloting and
demonstrating in order to network with PSUs [Source: Endline Evaluation Workshop,
RGVN-Annual-Report-2012-13-Final-Draft, Narrative_Annual_report_of_Project-
JIVIKA_June_1, 2012-May_31, 2013, Workshop on Rickshaw puller interface, Flood &
Phailin details].
There are some proposals which are in the pipeline with VattiKutti Foundation, India
Foundation for Humanistic Development (IFHD) Vishakhapatnam Steel Plant, Bharat Rural
Livelihoods Foundation (BRLF) and Invest India Micro Pension Services Private Limited
(IIMP) [Source: 5c endline self-assessment sheet_management_India_RGVN, 5c endline
self-assessment sheet_programme staff_India_RGVN].
RGVN initiated new programmes [14] due to a change in their strategic plan [17], a need for
resource mobilization [18] and the formation of a Project Finance Committee (PFC)[19]
[Source: Endline evaluation workshop, 5c endline self-assessment
sheet_management_India_RGVN, Endline Evaluation Workshop]. These are further explained
below.
Change of strategic plan [17]
There was change of strategic plan to shift from microfinance to Sustainable Livelihood
Enhancement and Enterprise Promotion due to the microfinance crisis [21] and
consequently the failure of the microfinance project’s implementation. The Microfinance
crisis, the floods and the Phailin cyclone also caused donors to focus more on sustainable
livelihoods [22] and mid-course corrective actions in order to keep the target group
support afloat. Apart from changing their funding priorities, donors have also been
revising their grant making policies [22]. More and more donors are funding agriculture
based programs with a focus on improved livelihoods for the poor. Furthermore, The
RGVN board too became cautious about recovery of loans and restricted the RGVN
Bhubaneswar office from commercial borrowing [20]. The floods in 2011 and 2014
[23]and the cyclone Phailin in 2013 [24] worsened the situation in the organisation’s
11
The Development of women and children in Rural Areas or DWCRA is a government sponsored anti-poverty programme of
the Ministry of Rural Development.
Report CDI-15-021 | 93
partner areas even further, which also triggered the involvement of RGVN in programmes
that were more focused on sustainable livelihood enhancement [Source: Flood & Phailin
details]. All these factors compelled the organization to change its strategy to sustainable
livelihood enhancement by focusing on the core livelihood sub sectors like NTFP,
agriculture and allied agriculture through the System of Rice Intensification (SRI) model,
dairy, organic paddy cultivation, organic vegetable farming, handicraft, etc. [Source:
Startegy_Minutes, Organic Agriculture, 5c endline self-assessment
sheet_management_India_RGVN, 5c endline self-assessment sheet_programme
staff_India_RGVN].
Need for resource mobilization [18]
With the microfinance crisis the organization was already undergoing a rough patch which
further worsened during 2011-12 period. The board’s decision to restrict external
commercial borrowing of funds [20], the effect of Phailin [24] and dwindling foreign
funding [26] worsened the financial situation of RGVN. All these factors compelled the
organization to think of diversifying their strategy for resource mobilization [Source:
Endline Evaluation Workshop, 5c endline self-assessment
sheet_management_India_RGVN].
Formation of Project Finance Committee (PFC) [19]
RGVN used to work with the LAC (Local Area Committee), which has now been disbanded.
To recover from the rough patch it was undergoing (including the floods [23], cyclone
[24], microfinance crisis [21] and dwindling foreign funds [26]), internally RGVN has set
up a Project Finance Committee comprising the Executive Director, Assistant Director, and
programme staff. This is a body created to expedite the decision making process, monitor
progress, and respond to proposals for funding [Source: RGVN-Annual-Report-2012-13-
Final-Draft, PFC Minute, 5c endline self-assessment sheet_management_India_RGVN].
- CSR12 eligibility certificate from TISS [16]
RGVN became a team member of the National CSR Hub Empanelment team of TISS. This
certification made them eligible for receiving CSR funds for developmental activities. The
empanelment process aims to provide CPSEs (Central Public Sector Enterprises) with a list of
reliable and credible organisations as partners for CSR activities. The empanelment process is
designed to serve the requirements of CPSEs. The National Corporate Social Responsibility (NCSR)
Hub shall empanel those organisations that are people-centric, have experience and expertise in a
specific field and have a planned approach to developmental activities with a specific focus on the
welfare and rights of the vulnerable groups in society. This means all the Public Sector Companies
of India may consider RGVN for implementation of big CSR projects [Source: Endline Evaluation
Workshop, 5c endline self-assessment sheet_programme staff_India_RGVN,
FINAL_EMPANELMENT TISS]. RGVN getting this certification [16] was triggered by the new CSR
Bill [25], which got approved by the Parliament and is effective from April 2014. It has a very
strong CSR Clause, which mandates companies with an average profit of INR 50 million in the last
three years, to proactively design and undertake welfare and other developmental activities. This
is seen as a great opportunity for RGVN as the corporate sector would be required to spend 2 %
of their net profit for social development actions.
12
The new Companies Act 2014, with a very strong CSR Clause, mandates companies with an average profit of INR 50 million in last three
years, to proactively design and undertake welfare and other developmental activities.
Centre for Development Innovation
Wageningen UR
P.O. Box 88
6700 AB Wageningen
The Netherlands
T +31 (0)317 48 68 00
www.wageningenUR.nl/cdi
Report CDI-15-021
The Centre for Development Innovation works on processes of innovation
and change in the areas of food and nutrition security, adaptive agriculture,
sustainable markets, ecosystem governance, and conflict, disaster and
reconstruction. It is an interdisciplinary and internationally focused unit of
Wageningen UR within the Social Sciences Group. Our work fosters
collaboration between citizens, governments, businesses, NGOs, and the
scientific community. Our worldwide network of partners and clients links
with us to help facilitate innovation, create capacities for change and broker
knowledge.
The mission of Wageningen UR (University & Research centre) is ‘To explore
the potential of nature to improve the quality of life’. Within Wageningen UR,
nine specialised research institutes of the DLO Foundation have joined forces
with Wageningen University to help answer the most important questions in
the domain of healthy food and living environment. With approximately 30
locations, 6,000 members of staff and 9,000 students, Wageningen UR is one
of the leading organisations in its domain worldwide. The integral approach
to problems and the cooperation between the various disciplines are at the
heart of the unique Wageningen Approach.