enanpad 2017
TRANSCRIPT
EnANPAD 2017 São Paulo / SP - 01 a 04 de Outubro de 2017
Socioeconomic Determinants of Support and Brand Value Perception: A Survey withMicrofranchisees
AutoriaMariângela Carli Santiago - [email protected]
Prog de Mestr em Admin/UNIP - Universidade Paulista
Andrea Giovani Lanfranchi - [email protected] de Mestr em Admin/UNIP - Universidade Paulista
Pedro Lucas de Resende Melo - [email protected] de Mestr em Admin/UNIP - Universidade Paulista
Julio Araujo Carneiro da Cunha - [email protected] de Pós-Grad em Admin/Mestr e Dout Acadêmico - PPGA/UNINOVE - Universidade Nove de Julho
Renato Telles - [email protected] de Mestr em Admin/UNIP - Universidade Paulista
ResumoFor more than ten years the franchising industry has been growing in Brazil. In this marketsegment are the microfranchises to act as a franchise whose initial investment amount is upto US$ 26,000.00. The purpose of this study is to verify if there is variation in the perceivedvalue of microfranchisees regarding the support provided by the franchisor and thedevelopment of the franchise chain brand due to their socioeconomic class. To analyze thesupport the variables used were: training, prospecting and installation of the franchise unit,legal and financial support, field consulting and operating manuals; in relation to the brandthe variables used were: advertising and promotion, brand strength and customer loyalty.The variables used are quantitative, and 148 microfranchisees in São Paulo were selected forthe survey. The statistical results did not support the association between the independentvariables and the dependent variables of the research.
EnANPAD 2017 São Paulo / SP - 01 a 04 de Outubro de 2017
1
Socioeconomic Determinants of Support and Brand Value Perception: A Survey with
Microfranchisees
ABSTRACT
For more than ten years the franchising industry has been growing in Brazil. In this market
segment are the microfranchises to act as a franchise whose initial investment amount is up to
US$ 26,000.00. The purpose of this study is to verify if there is variation in the perceived
value of microfranchisees regarding the support provided by the franchisor and the
development of the franchise chain brand due to their socioeconomic class. To analyze the
support the variables used were: training, prospecting and installation of the franchise unit,
legal and financial support, field consulting and operating manuals; in relation to the brand the
variables used were: advertising and promotion, brand strength and customer loyalty. The
variables used are quantitative, and 148 microfranchisees in São Paulo were selected for the
survey. The statistical results did not support the association between the independent
variables and the dependent variables of the research.
Keywords: Franchise chain. Strategy. Microentrepreneurship. Socioeconomic classes.
Microfranchise.
1. INTRODUCTION
In the last ten years there has been an emergence and growth of microfranchises in
Brazil, in which the franchisor requires an initial investment up to US$ 26 thousand. This
limit is stipulated by the ABF based on three times the value of GDP Per capita. In 2014 there
were 433 active brands in several segments of the economy, that registered a growth in
number of units of 12.8% compared to 2013 (ABF, 2015).
Internationally, the emergence of microfranchises took place with a social character,
aiming at the creation of job and income opportunities to minimize poverty in the pyramid
base markets in Africa, Asia and Latin America, in countries that have an intense presence of
informal microenterprises (Fairbourne, 2006).
Microfranchises have emerged from the franchise model. They are a recent and
growing phenomenon in the universe of Brazilian companies that still lack academic support
for their understanding (Melo; Borini & Carneiro-Da-Cunha, 2014). They are legally ruled by
the same law that regulates the conventional franchises, law no. 8.955 / 94, although they
have peculiarities in their management, especially by the smaller value of the investment.
The franchise contract states that the franchisor must provide the franchisee with the
necessary support for the implementation of the business, training, supervision of activities
and management support. In addition, in the franchise model the franchisor grants the
franchisee the right to sell products or services under its brand name and also grants this
franchising compound comprised of the support and brand. Given these characteristics, small
entrepreneurs are attracted by the franchises, because, in theory, they bring more security to
the business, reducing the risk of failure (Combs; Michael & Castrogiovanni, 2004;
Grünhagen et al., 2008; Nijmeijer; Fabbricotti & Huijsman, 2014).
When microfranchises appeared in Brazil they sought adhesion of lower middle class
entrepreneurs, since they had a lower initial investment rate. Such class has grown
substantially in the last fifteen years in emerging countries. This growth is recognized in
studies that analyze socioeconomic classes in Brazil in this period (Neri, 2010; Souza &
Lamounier, 2010). However, the lower value of investment also attracted microentrepreneurs
from various socioeconomic backgrounds, for various reasons, such as the younger generation
EnANPAD 2017 São Paulo / SP - 01 a 04 de Outubro de 2017
2
seeking for job opportunities and women seeking to supplement their family income (ABF,
2014).
Microfranchises have become an entrepreneurial option for various social classes,
which are expected to have different needs and perceptions regarding the business. Education
is a factor that differentiates the upper classes from the others, in years of formal education
and in the proportion of individuals attending university, according to data from the national
household sample survey (PNAD/IBGE, 2009). The motives that lead people to undertake
microfranchises are also of several natures: (1) desire to have their own business; (2) personal
or family history; (3) job dissatisfaction; and (4) unemployment (Valale; Correia & Reis,
2014; Serasa Experian, 2014).
The small entrepreneur does not always have training in the business area (Melo,
Borini & Carneiro-Da-Cunha, 2014). When small entrepreneurs decide to invest in a
microfranchise, their goal is to minimize the risks of starting a business, because they will
operate a brand and a product that have already been developed and tried out in the market,
they will have the know-how and assistance from the franchisor, all that with a low
investment. In some cases, it is not even necessary to have a site to open a physical store and
it is possible to manage the business from home.
The value of a franchisor for the franchisee is measured by the difference between the
overall benefit of being a franchisee and the total cost of the franchise acquisition (Grünhagen
& Dorsch, 2003). The intensity and effectiveness of the support provided by the franchisor to
the franchisee, allied with a strong brand, recognized by the public, can be determinant factors
for the success of the business unit and, therefore, has value for the microentrepreneur
(Grünhagen & Dorsch, 2003; Huang; Phau & Chen, 2007). This value, which is perceived by
the microfranchisee in terms of the support and brand of the franchise chain, may be different
according to its socioeconomic class of origin. The higher education in the higher classes
propitiates that the entrepreneur has a more critical view compared to microfranchisees of
lower classes with less education, in addition to the characteristic values inherent to each
socioeconomic class. (Neri, 2010; Melo; Borini & Carneiro-Da-Cunha, 2014).
This research aims to investigate whether microfranchisees belonging to different
socioeconomic classes perceive heterogeneously the support and the brand of the
microfranchise chain. The thesis is that microfranchisees that have values and life
trajectories influenced by social and economic factors attribute different perceptions of value
to the support and the brand provided by the microfranchisors. If this line is proven, it
indicates that microfranchisors should adopt business policies that particularize their
microfranchisees due to their socioeconomic origin.
In order to achieve this, two specific objectives are set: (1) to analyze the perception
regarding the support of the microfranchise chain, understood by the following attributes:
training, field consulting, operation manuals, legal and financial support. The second specific
objective involves (1) to verify the perception of the brand of the microfranchise chain by the
following attributes: advertising and promotion, brand strength and loyalty. This work has the
following structure: literature review, composed of microfranchise chains, support in
franchise chains, brand in franchise chains; hypothesis development; methodology; discussion
of the research results; and conclusion.
2. LITERATURE REVIEW
2.1. Microfranchise chains
Microfranchises were originally created with a social character, with the purpose of
reducing poverty by creating employment for the population at the base of the pyramid in
EnANPAD 2017 São Paulo / SP - 01 a 04 de Outubro de 2017
3
poor countries of Africa, Asia and Latin America, which is composed of more than three
billion people. According to Fairbourne (p.19, 2006) "Microfranchise is the systematization
and replication of microenterprises with the intention of reducing poverty."
In the remote areas of Nepal it was possible to have schools operating in the form of
microfranchises with a successful model of distance education (Ivins, 2008), which made it
possible to improve the work and income conditions of those involved in distant places where
social services are insufficient. In Kenya, under the microfranchise approach as social
institutions, a microfranchise system built from a partnership between the kenyan government
and a non-governmental organization enabled the distribution of antimalarial drugs to the
population (Oduor; Kamau & Mathenge, 2009).
Burand and Koch (2010) added to the discussion the commercial and economic
character of microfranchises, addressing the need to search for financial sustainability in the
business and placing it as an opportunity for the population at the base of the pyramid, due to
the low implementation cost.
Microfranchises must focus on economic growth and efficiency to achieve the goal of
poverty reduction. This view was advocated by Kistruck et al. (2011). Such work has
deepened a debate on the need for financial sustainability in microfranchise and has brought
an analogy of this model and the conventional franchise model, since in both of them a party
acquires the rights to operate a peculiar business pattern offered by the other party under its
brand Guidance.
Melo, Borini and Carneiro-da-Cunha (2014) sought to identify whether there were
differences between microfranchises and conventional franchises in relation to the perceived
value of the franchisee on the support and brand offered by the franchisor, in order to
understand if there was a need for a differentiated management for each model. The study
concluded that the microfranchisees do not observe differences in the support offered in the
microfranchises compared to the conventional franchises. Regarding the microfranchise
brand, they considered it weaker than the conventional franchise brand, because the latter has
a greater insertion in the media and the first is still little known, or totally unknown, by the
public, but they choose it because of the lower cost of the initial investment.
The specific characteristics of the microfranchisees and their personal antecedents are
elements that deserve attention in the model of microfranchise. Once it requires an initial
investment smaller than the conventional franchises, it can attract entrepreneurs without
knowledge and experience in business management, demanding a differentiated support from
the franchisor. Regarding the brand, also because of the smaller investment value of the
model, it can be expected less investment in advertising and marketing in relation to the
conventional franchises, which may compromise the perceived value by the microfranchisee.
(Grac & Weaven, 2011; Melo; Borini & Carneiro-Da-Cunha, 2014).
2.2. Support in franchise chains
By signing the franchise contract, microfranchisees pay an entrance fee, tied royalties
and advertising fees to the franchisor. In return, they receive the right to use the franchisor
brand and a number of services provided by the franchisor, which may include legal advice,
location and real estate development consultancy, advertising campaigns and training
(Grünhagen & Dorsch, 2003).
It is expected that franchisors provide not only a control system over the franchisees
network (Lombardi et al., 2015), but also a support system to them. This microfranchise
inherent support in the franchise contract attracts small entrepreneurs to the business because
of the perceived safety and endorsement (Dant, 1995). The importance of small enterprises to
the development of nations is recognized throughout the world. The opening of a new small
EnANPAD 2017 São Paulo / SP - 01 a 04 de Outubro de 2017
4
business by microentrepreneurs, who do not always possess the numerous skills expected for
businessmanagement, brings with it risks and uncertainties to business. The adherence to the
franchise system has been an important option as it allows the franchisee to join businesses
tested and governed under the guidance and assistance of the franchisor (Chiou, Hsieh &
Yang, 2004).
The value of a franchisor to the franchisee is measured by the difference between the
overall benefit of being a franchisee and the total cost of the franchise acquisition (Grünhagen
& Dorsch, 2003). The effectiveness and intensity of the support provided by the franchisor to
the franchisee can be a determining factor for the success of the business unit and therefore
has value for the microentrepreneur (Grünhagen & Dorsch, 2003; Monroy & Alzola, 2005;
Huang; Phau & Chen, 2007).
The relationship between franchisor and franchisee in a franchise system is complex
and presents particularities, since it is not a simple buy-and-sell, supplier and customer or
employer and employee relationship. Franchise is related to partnership, in which the role of
the franchisor is not only to control and guide the partner. The established contract has mutual
rights and obligations that must be fulfilled by both parties in a good working relationship.
The success of the franchisor depends on the success of the franchisee and vice versa (Cohen
& Silva, 2000; Nijmeijer, Fabbricotti & Huijsman, 2014).
2.3. Brand in franchise chains
According to the American Marketing Association (AMA), brand may be defined as
"a name, term, sign, symbol or design, or a combination thereof, intended to identify the
goods or services of a supplier or of a group of suppliers to differentiate them from those of
other competitors" (Pinho, 1996, p.14).
The brand is one of the most valuable elements that a company has. Developing it
requires meticulous planning and a long-term commitment. Strong brands favor consumer
loyalty, which, if satisfied, repeats purchases (Aaker, 1996). The strength of the brand is a
relevant factor in gaining and maintaining franchisees (Ghantous & Jaolis, 2013), since it
minimizes the risks of investment in the business (Grace & Weaven, 2011). The added value
of the brand to a market offer - whether a product, service or a franchise package - is known
as brand equity (Aaker, 1996; Farquhar, 1989; Ghantous & Jaolis, 2013). Brand management
leads to successful brands, which in turn contributes to a high brand value (Pitt; Napoli & Van
Der Merwe, 2003).
The monitoring and management of the brand in the franchise system has a
complexity that is not found in conventional businesses, in which the entrepreneur has
unlimited management control. In franchising, all parties - franchisors and franchisees - are
co-responsible and codependent of the brand, whose firm and constant assessment is given by
the final consumer (Pitt; Napoli & Van Der Merwe, 2003).
When a microfranchisee joins a franchise, he receives from the franchisor the right to
sell goods or services with its brand as well as the franchisor support for the business (Combs;
Michael & Castrogiovanni, 2004). This is especially relevant when microfranchisee resources
are scarce and he tends to value his money more. A strong brand simplifies the process of
choosing among the various franchisors, since it reduces the risk associated with the venture
and increases the chances of success of the business (Ghantous & Jaolis, 2013). Investments
of franchisors in advertising, promotion and brand strengthening provide customer loyalty and
consequently greater financial returns to the venture (Aaker, 1996; Ghantous & Jaolis, 2013).
EnANPAD 2017 São Paulo / SP - 01 a 04 de Outubro de 2017
5
3. HYPOTHESES DEVELOPMENT
3.1. Perception of value relative to franchisor support
By signing the franchise contract, the microfranchisee undertakes to comply with a
series of pecuniary and legal obligations so that he may receive, in return, assistance and
support from the franchisor for the operation of the business. The concept of value, from the
point of view of the microfranchisee, is based on the difference between the benefits received
as a franchisee and the costs incurred to acquire the franchise. (Grünhagen & Dorsh, 2003).
The microfranchisee perceives the value received from the franchisor through its subjective
values and need for support regarding the implementation of the business, management
support, training and operations manuals (Chiou; Hsieh & Yang, 2004; Grace & Weaven,
2011).
Microfranchisees comes from different economic classes and some studies show that
the ways of being, consuming, thinking, habits, and the social and cultural values vary among
economic classes (Yaccoub, 2011). The time devoted to formal education is greater among
the wealthier socioeconomic classes, which directly affects the formation of individuals (Neri,
2010). Data from the 2010 IBGE PNAD shows that the average time devoted to education is
12 years of study in upper classes and 7 years in lower middle class. According to the same
source, the proportion of college graduates is of 47.6% in upper classes and of 10.47% in
lower middle class. This difference in the time devoted to formal education can mean better
training and preparation of upper classes for the management of business, resulting in a more
critical value perception of the higher income classes regarding the support offered by the
franchisor in the microfranchise, while the lower middle class is expected to require greater
support for business deployment and management, demanding more attention from the
franchise chain. There are studies in the literature that point out a greater need for technical
training of microentrepreneurs (Krishnan & Kamalanabhan, 2013).
When signing the franchise contract, the franchisee pays the franchisor an entrance
fee, plus royalties and advertising so that he can use the business format. In return, he must
receive the necessary support for the execution and success of the enterprise, which includes:
training; support in financial management and legal aspects; support for site selection and
installation of the franchise unit; field visits and operation manuals (Grünhagen & Dorsch,
2003; Huang; Phau & Chen, 2007; Monroy & Alzola, 2005; Chiou; Hsieh & Yang, 2004).
The reduced value of microfranchise investment, compared to conventional franchise,
means that the franchisor has a smaller budget to provide the necessary support for the
operation of the business and may result in a decrease in the quality or frequency of support
provided to microfranchisees. (Grünhagen et al., 2008; Melo; Borini & Carneiro-Da-Cunha,
2014). Hence, the following hypothesis is proposed:
H1: The higher the microfranchisee income, the lower the perception of value in relation to
the support offered by the franchisor.
3.2. Perception of value relative to the franchise brand
The franchise contract provides that the franchisee, through the payment of the
entrance fee, the royalties and advertising fees, may use the brand of the franchisor, which the
stronger and more recognized by the public, the more value adds to the business (Aaker,
1996; Combs; Michael & Castrogiovanni, 2004). The value of a brand attracts and retains
franchisees to the business and to the franchise relationships as it helps to reduce the risk of
the franchisee's investment. (Ghantous & Jaolis, 2013; Grace & Weaven, 2011). The strength
EnANPAD 2017 São Paulo / SP - 01 a 04 de Outubro de 2017
6
of the brand encourages the franchisee to enter and remain in the franchise chain because of
its power to attract and retain customers (Ghantous & Jaolis, 2013).
Because there is a maximum initial investment rate for an enterprise to be considered
as microfranchise, it can be understood that advertising and marketing funds have fewer
resources compared to a conventional franchise. This results in a weaker brand, less
recognized by the public, what may bring unfavorable repercussions to the business (Melo;
Borini & Carneiro-Da-Cunha, 2014).
Microfranchisees come from several economic classes, with socio-cultural
characteristics that are not necessarily similar. They have values, behaviors, level of education
and habits that are peculiar to the economic classes of origin (Neri, 2010; Yaccoub, 2011).
These differences are expressed in the way people consume and live and can result in
different levels of perceived value by the microfranchisee in relation to the assistance received
from the franchisor in respect of the franchise brand, expressed in advertisements and
promotion, brand strength and customer loyalty. It can be assumed that the most favored
socioeconomic classes, due to their more educated and intellectual formation, have a greater
expectation about the benefits that the brand of the franchise chain can bring to the business.
In contrast, the lower middle class accept to have a less prestigious brand because of their
different values and references (Huang; Phau & Chen, 2007; Ghantous & Jaolis, 2013).
Therefore the following hypothesis is proposed:
H2: The higher the microfranchisee income, the lower the perception of value in relation to
the brand of the franchise chain.
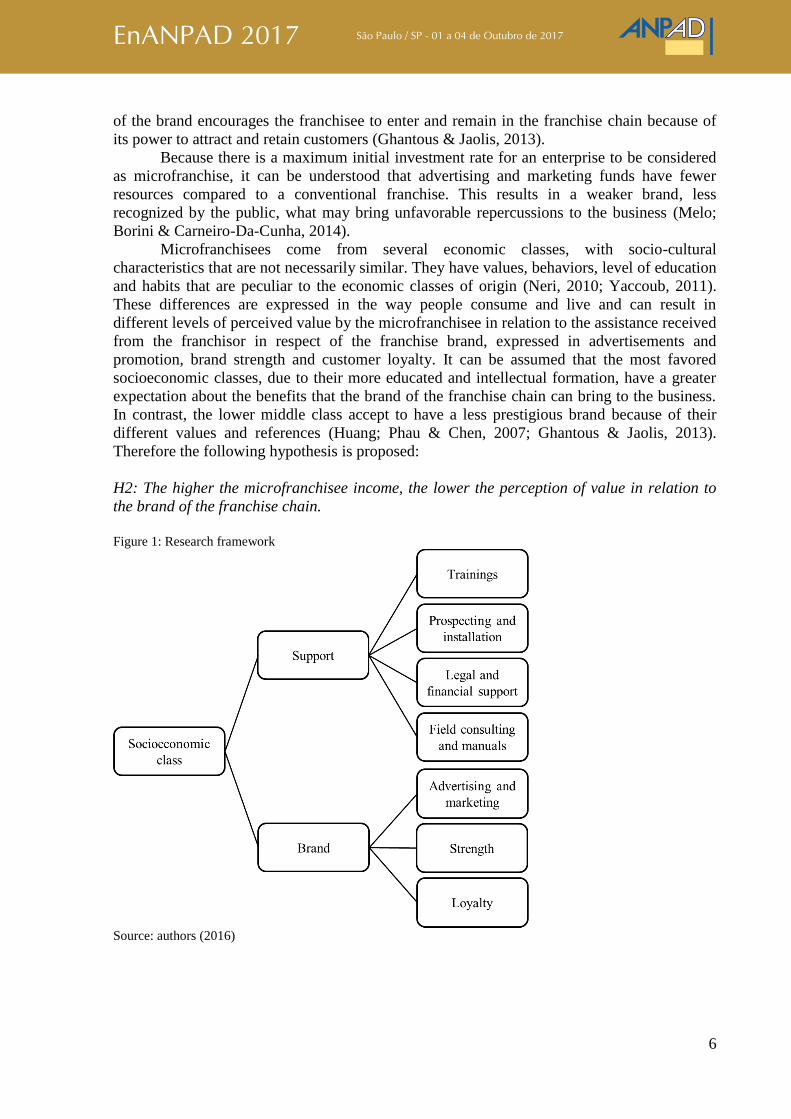
Figure 1: Research framework
Source: authors (2016)
EnANPAD 2017 São Paulo / SP - 01 a 04 de Outubro de 2017
7
4. METHODOLOGY
The sample was extracted in a non-probabilistic and intentional way, since it was
desired to interview microfranchisees based in the state of São Paulo, given its
representativeness in the national economic scenario. The questionnaires were applied in
microfranchisees. 148 microfranchisees were selected from 70 franchise chains operating in
15 different segments. The research was conducted between September and October 2015 and
face-to-face interviews were used when possible for the interviewee and by telephone when
personal contact was not possible.
Before the survey was applied to the interviewees, an approach was taken through the
initial questionnaire for stratification of the microfranchisees income, within the parameters of
Critério Brasil of the Associação Brasileira das Empresas de Pesquisa - ABEP. After that,
the survey was started, with 24 closed questions, built in the light of the theory, whose
answers are in Likert scale of 1 (one) to 5 (five). This questionnaire addresses, from the point
of view of the franchisee, the level of appropriateness of the support offered by the franchisor
in the variables: training; prospecting and installation of the franchise unit; legal and financial
support; field consulting and manuals; support received for advertisements and promotion;
and identity, strength and loyalty to the brand of the franchise.
The population of microfranchisees is restricted to 433 franchise chains that exist in
the national territory. Given the representativeness of the state of São Paulo, which has 52.6%
of the franchise chains (ABF, 2015), it was decided to select the sample in this state, due to
operational, temporal and financial limitations. However, it can be assumed that the selected
sample is potentially qualified, since it was selected 148 microfranchisees, from 70 franchise
networks, of 15 business segments, which composes 93% of the total revenue of the cataloged
business segments (ABF, 2015).
4.1. Variables development
The dependent variable is the income of the microfranchisee, since the perceptions,
needs and desires may vary according to the individual values and according to their
socioeconomic class. (Chiou; Hsieh & Yang, 2004; Souza & Lamounier, 2010).
The independent variables of hypothesis 1 are: (1) training, (2) legal and financial
support, (3) advice on choosing the franchise location and installation, and (4) field consulting
and manuals (Grünhagen & Dorsch, 2003; Huang; Phau & Chen, 2007; Monroy & Alzola,
2005; Chiou; Hsieh & Yang, 2004). In hypothesis 2 the variables are the following: (1)
advertising and promotion; (2) brand strength; And (3) loyalty (Aaker, 1996; Nyadzayo;
Matanda & Ewing, 2011; Ghantous & Jaolis, 2013; Nijmeijer; Fabbricotti & Huijsman,
2014).
5. DISCUSSION AND IMPLICATIONS
5.1. Multivariate statistical analysis
In this section we will present the Cronbach's Alpha analysis, followed by Pearson's
correlation analysis, evaluating the overall reliability of the results. The Cronbach Alpha
coefficient aims to verify the reliability of a questionnaire applied in a research. It evaluates if
the variables listed for a construct are associated with each other and it is a measure of
internal consistency. According to Peterson (1994), the values for Cronbach's alpha which are
greater than 0.700 are acceptable, and results higher than 0.900 indicate the existence of a
very high reliability.

EnANPAD 2017 São Paulo / SP - 01 a 04 de Outubro de 2017
8
The following Table shows the results for Cronbach's Alpha concerning the eleven
brand-related question. The results presented in Table 1 indicates the existence of a high
reliability since 0.956 is considered a very high value
Table 1 - Reliability statistics (Cronbach's Alpha) of brand variables in the franchise chain
Cronbach’s alpha Number of items
0,956 11
Source: Research results (2016).
In the same way, Cronbach's Alpha is evaluated regarding the thirteen questions
related to the actions of support to the franchisees. The results presented in Table 2 indicates
the existence of a high reliability, since 0.948 is considered a very high value.
Table 2: Reliability statistics (Cronbach's Alpha) of the variables related to the franchisor’s support
Cronbach’s alpha Number of items
0,948 13
Source: Research Results (2016).
As the analysis of the Cronbach's Alpha coefficients presented robust and sufficient
results, two constructs denominated Brand and Support were created. Table 3 shows the
descriptive statistics of both constructs.
Table 3 – Descriptive statistics of Brand and Support constructs
BRAND SUPPORT
N Valid 148 148
Absent 0 0
Mean 3,3348 3,0852
Median 3,5455 3,1538
Mode 4,00 4,00
Standard deviation 0,84884 0,86524
Source: Research Results (2016).
The information indicated in table 3 shows the values of the number of observations,
number of missing observations, as well as the values for the mean, median and mode, and
the standard deviation.
Analyzing closely the data in table 3 it is possible to verify that both constructs are
very close, however, it can be noticed that the value of the mean is slightly higher for the
construct Brand (3.3348), indicating a level of satisfaction slightly higher than the satisfaction
attributed to the construct Support (3.0852). This difference is more evident when one
observes the values of the median, which for the Brand presents a value of 0.3917 greater than
for the Support. The data variance is also slightly higher for the support, which has a standard
deviation of 0.0164 higher than the brand.
5.2. Correlation and regression analysis
Given the constructs, Brand and Support, this section is intended to make an analysis
of the correlations. Pearson's correlations verify how much the variables are associated. There
are three important aspects that should be observed in a correlation analysis, explained below.
The first one is the signal, whether it is positive or negative. The positive sign
indicates that a variable when altered, either up or down, will influence its correlated variable
EnANPAD 2017 São Paulo / SP - 01 a 04 de Outubro de 2017
9
in the same way. In the case of negative signal, when a variable increases the correlated
variable decreases, the inverse being also true.
Second, the value of correlation. It indicates the existence of association between the
variables and the values may indicate a weak, moderate or strong correlation. Values
greater than 0.900 indicates a very strong correlation, values between 0.700 to 0.900 are
indications of a strong correlation, values between 0.500 to 0.700 are indications of a
moderate correlation, and values below 0.500 indicates a weak correlation (Pestana &
Gageiro, 2008).
In the third place, the level of significance of the correlation is verified, that is, if that
correlation, whether positive or negative, is strong, weak or moderate and if it has statistical
significance. This occurs when the P value is less than 5% (0,05), or if it is less than 1%
(0,01) (Pestana & Gageiro, 2008).
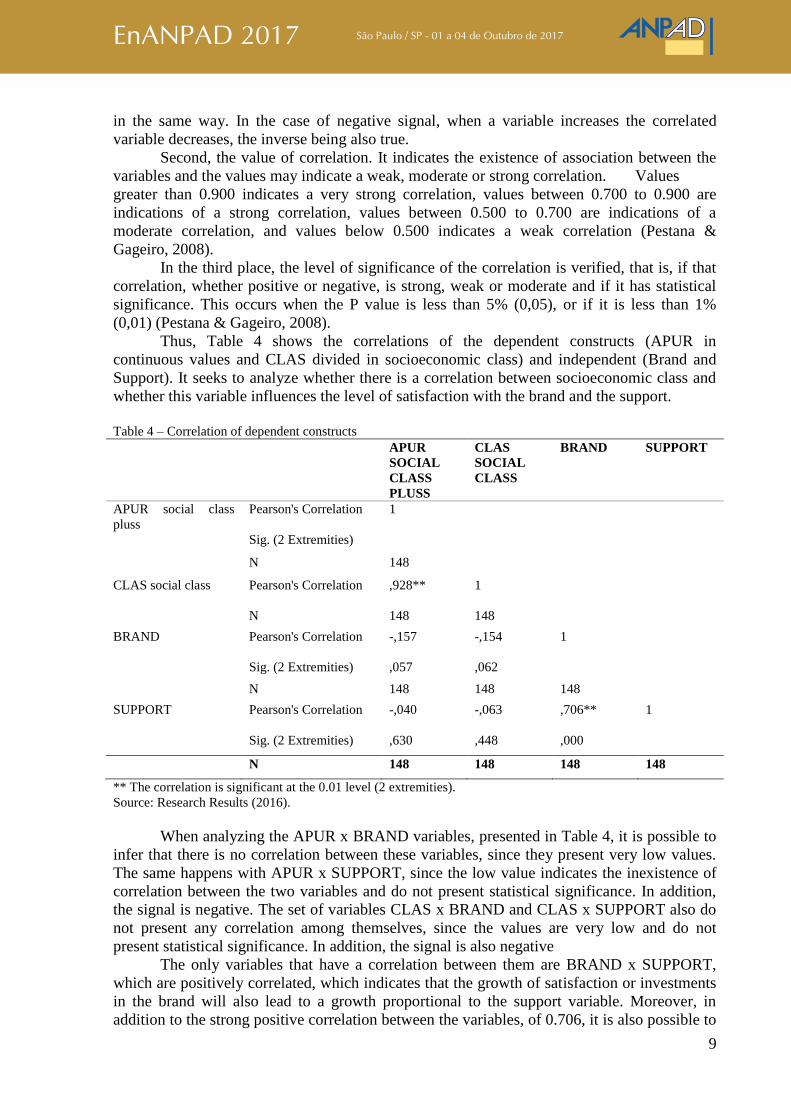
Thus, Table 4 shows the correlations of the dependent constructs (APUR in
continuous values and CLAS divided in socioeconomic class) and independent (Brand and
Support). It seeks to analyze whether there is a correlation between socioeconomic class and
whether this variable influences the level of satisfaction with the brand and the support.
Table 4 – Correlation of dependent constructs
APUR
SOCIAL
CLASS
PLUSS
CLAS
SOCIAL
CLASS
BRAND SUPPORT
APUR social class
pluss
Pearson's Correlation
1
Sig. (2 Extremities)
N 148
CLAS social class Pearson's Correlation
,928** 1
N 148 148
BRAND Pearson's Correlation
-,157 -,154 1
Sig. (2 Extremities) ,057 ,062
N 148 148 148
SUPPORT Pearson's Correlation
-,040 -,063 ,706** 1
Sig. (2 Extremities) ,630 ,448 ,000
N 148 148 148 148
** The correlation is significant at the 0.01 level (2 extremities).
Source: Research Results (2016).
When analyzing the APUR x BRAND variables, presented in Table 4, it is possible to
infer that there is no correlation between these variables, since they present very low values.
The same happens with APUR x SUPPORT, since the low value indicates the inexistence of
correlation between the two variables and do not present statistical significance. In addition,
the signal is negative. The set of variables CLAS x BRAND and CLAS x SUPPORT also do
not present any correlation among themselves, since the values are very low and do not
present statistical significance. In addition, the signal is also negative
The only variables that have a correlation between them are BRAND x SUPPORT,
which are positively correlated, which indicates that the growth of satisfaction or investments
in the brand will also lead to a growth proportional to the support variable. Moreover, in
addition to the strong positive correlation between the variables, of 0.706, it is also possible to
EnANPAD 2017 São Paulo / SP - 01 a 04 de Outubro de 2017
10
observe the existence of statistical significance at the 1% level (p <0.01), indicating that this
correlation can be considered.
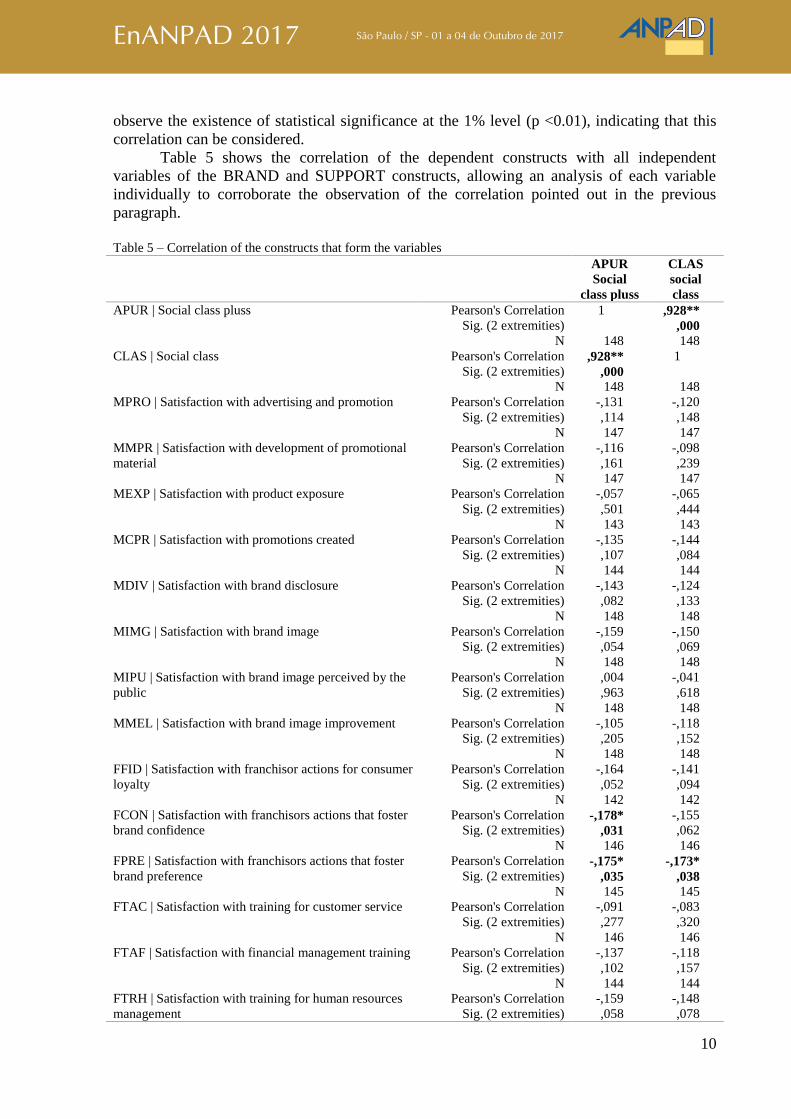
Table 5 shows the correlation of the dependent constructs with all independent
variables of the BRAND and SUPPORT constructs, allowing an analysis of each variable
individually to corroborate the observation of the correlation pointed out in the previous
paragraph.
Table 5 – Correlation of the constructs that form the variables
APUR
Social
class pluss
CLAS
social
class
APUR | Social class pluss Pearson's Correlation 1 ,928**
Sig. (2 extremities)
,000
N 148 148
CLAS | Social class Pearson's Correlation ,928** 1
Sig. (2 extremities) ,000
N 148 148
MPRO | Satisfaction with advertising and promotion
Pearson's Correlation -,131 -,120
Sig. (2 extremities) ,114 ,148
N 147 147
MMPR | Satisfaction with development of promotional
material
Pearson's Correlation -,116 -,098
Sig. (2 extremities) ,161 ,239
N 147 147
MEXP | Satisfaction with product exposure Pearson's Correlation -,057 -,065
Sig. (2 extremities) ,501 ,444
N 143 143
MCPR | Satisfaction with promotions created
Pearson's Correlation -,135 -,144
Sig. (2 extremities) ,107 ,084
N 144 144
MDIV | Satisfaction with brand disclosure
Pearson's Correlation -,143 -,124
Sig. (2 extremities) ,082 ,133
N 148 148
MIMG | Satisfaction with brand image
Pearson's Correlation -,159 -,150
Sig. (2 extremities) ,054 ,069
N 148 148
MIPU | Satisfaction with brand image perceived by the
public
Pearson's Correlation ,004 -,041
Sig. (2 extremities) ,963 ,618
N 148 148
MMEL | Satisfaction with brand image improvement
Pearson's Correlation -,105 -,118
Sig. (2 extremities) ,205 ,152
N 148 148
FFID | Satisfaction with franchisor actions for consumer
loyalty
Pearson's Correlation -,164 -,141
Sig. (2 extremities) ,052 ,094
N 142 142
FCON | Satisfaction with franchisors actions that foster
brand confidence
Pearson's Correlation -,178* -,155
Sig. (2 extremities) ,031 ,062
N 146 146
FPRE | Satisfaction with franchisors actions that foster
brand preference
Pearson's Correlation -,175* -,173*
Sig. (2 extremities) ,035 ,038
N 145 145
FTAC | Satisfaction with training for customer service Pearson's Correlation -,091 -,083
Sig. (2 extremities) ,277 ,320
N 146 146
FTAF | Satisfaction with financial management training Pearson's Correlation -,137 -,118
Sig. (2 extremities) ,102 ,157
N 144 144
FTRH | Satisfaction with training for human resources
management
Pearson's Correlation -,159 -,148
Sig. (2 extremities) ,058 ,078
EnANPAD 2017 São Paulo / SP - 01 a 04 de Outubro de 2017
11
N 143 143
FTGN | Satisfaction with training in business
management
Pearson's Correlation -,096 -,076
Sig. (2 extremities) ,250 ,362
N 145 145
FAIF | Satisfaction with support received from the
franchisor in the implementation of the franchise
Pearson's Correlation ,003 -,004
Sig. (2 extremities) ,968 ,965
N 143 143
FAEP | Satisfaction with support received from
franchisor for point of sale choice
Pearson's Correlation -,035 -,054
Sig. (2 extremities) ,706 ,561
N 118 118
FAPL | Satisfaction with support received from the
franchisor for layout planning
Pearson's Correlation -,032 -,080
Sig. (2 extremities) ,732 ,394
N 116 116
FACE | Satisfaction with support received from
franchisor to purchase equipment
Pearson's Correlation ,036 ,029
Sig. (2 extremities) ,684 ,745
N 130 130
FAIN | Satisfaction with support received from
franchisor for franchise inauguration
Pearson's Correlation ,025 ,007
Sig. (2 extremities) ,780 ,934
N 123 123
FCCC | Satisfaction with the clarity of the franchisor on
the clauses of the franchise agreement contract
Pearson's Correlation ,060 ,028
Sig. (2 extremities) ,468 ,738
N 147 147
FCFP | Satisfaction with financing and payment
conditions offered by the franchisor
Pearson's Correlation ,021 -,012
Sig. (2 extremities) ,801 ,886
N 146 146
FCCA | Satisfaction with field counseling provided by
the franchisor
Pearson's Correlation -,014 -,023
Sig. (2 extremities) ,866 ,788
N 145 145
FMOP | Satisfaction with operating manuals developed
by the franchisor
Pearson's Correlation ,007 -,022
Sig. (2 extremities) ,933 ,793
N 146 146
** The correlation is significant at the 0.01 level (2 extremities).
* The correlation is significant at the 0.05 level (2 extremities).
Source: Research Results (2016).
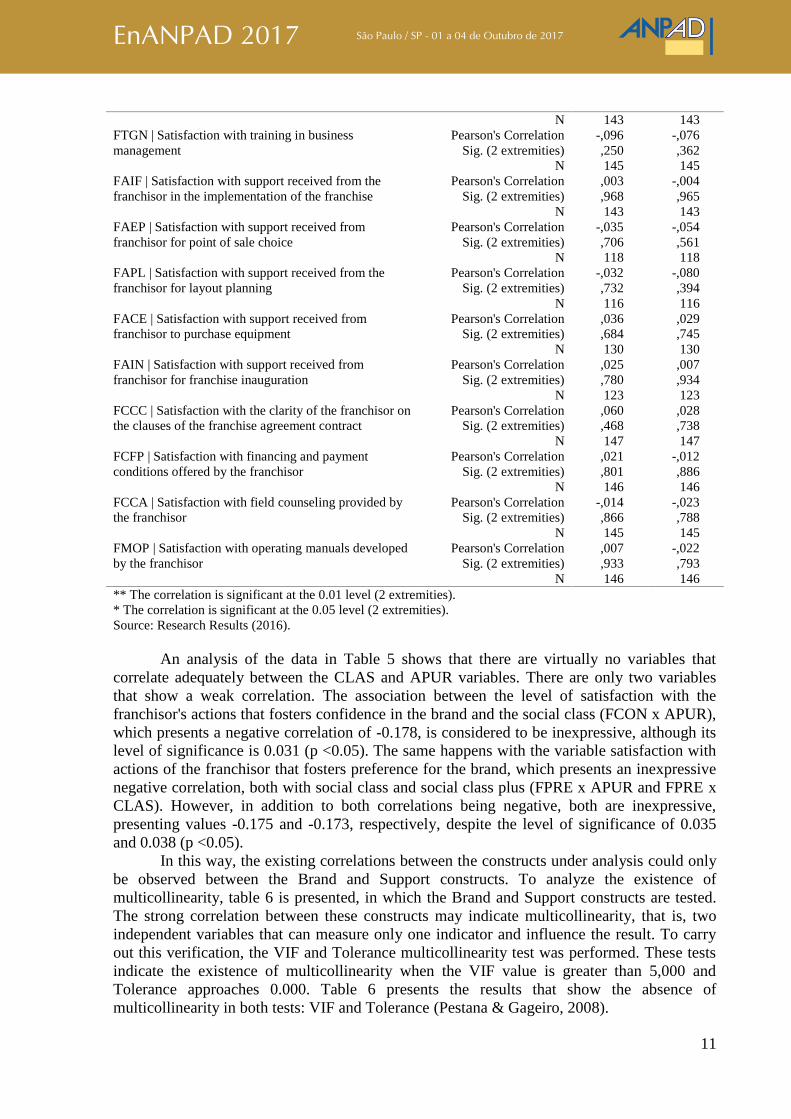
An analysis of the data in Table 5 shows that there are virtually no variables that
correlate adequately between the CLAS and APUR variables. There are only two variables
that show a weak correlation. The association between the level of satisfaction with the
franchisor's actions that fosters confidence in the brand and the social class (FCON x APUR),
which presents a negative correlation of -0.178, is considered to be inexpressive, although its
level of significance is 0.031 (p <0.05). The same happens with the variable satisfaction with
actions of the franchisor that fosters preference for the brand, which presents an inexpressive
negative correlation, both with social class and social class plus (FPRE x APUR and FPRE x
CLAS). However, in addition to both correlations being negative, both are inexpressive,
presenting values -0.175 and -0.173, respectively, despite the level of significance of 0.035
and 0.038 (p <0.05).
In this way, the existing correlations between the constructs under analysis could only
be observed between the Brand and Support constructs. To analyze the existence of
multicollinearity, table 6 is presented, in which the Brand and Support constructs are tested.
The strong correlation between these constructs may indicate multicollinearity, that is, two
independent variables that can measure only one indicator and influence the result. To carry
out this verification, the VIF and Tolerance multicollinearity test was performed. These tests
indicate the existence of multicollinearity when the VIF value is greater than 5,000 and
Tolerance approaches 0.000. Table 6 presents the results that show the absence of
multicollinearity in both tests: VIF and Tolerance (Pestana & Gageiro, 2008).
EnANPAD 2017 São Paulo / SP - 01 a 04 de Outubro de 2017
12
Table 6 – Analysis of absence of multicollinearity by the VIF test
Model
Collinearity statistics
Tolerance VIF
BRAND 0,502 1,992
SUPPORT 0,502 1,992
Source: Research Results (2016).
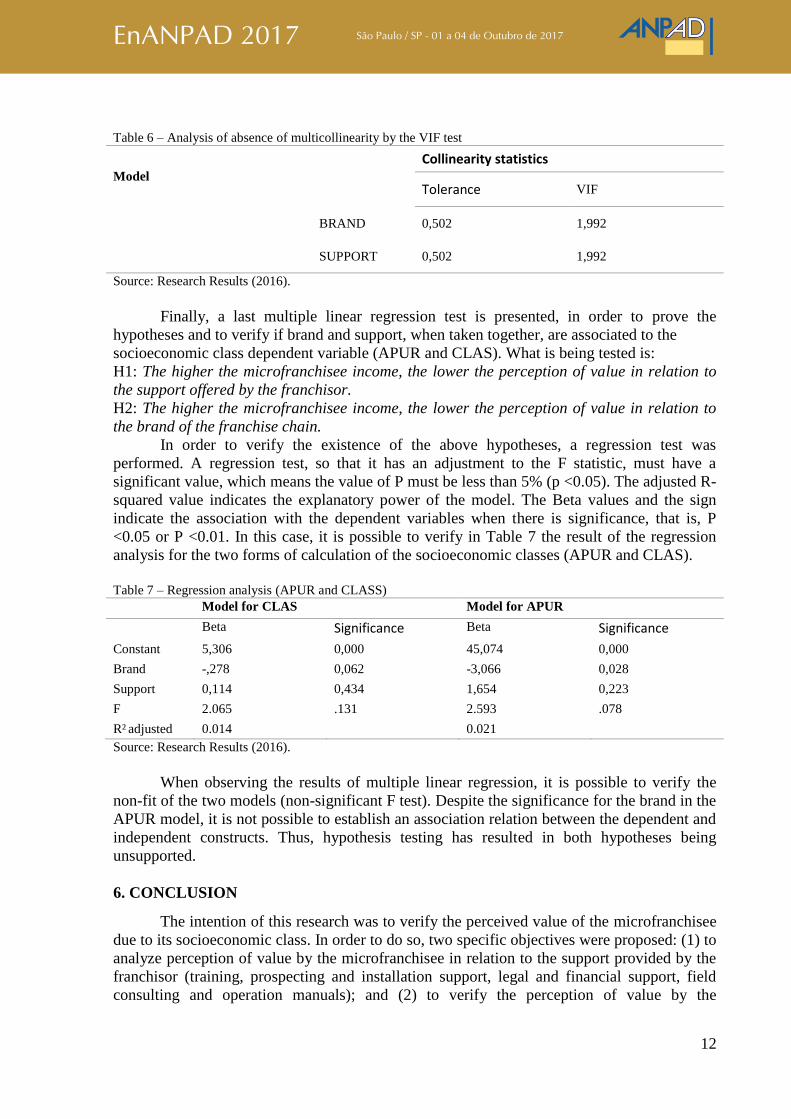
Finally, a last multiple linear regression test is presented, in order to prove the
hypotheses and to verify if brand and support, when taken together, are associated to the
socioeconomic class dependent variable (APUR and CLAS). What is being tested is:
H1: The higher the microfranchisee income, the lower the perception of value in relation to
the support offered by the franchisor.
H2: The higher the microfranchisee income, the lower the perception of value in relation to
the brand of the franchise chain.
In order to verify the existence of the above hypotheses, a regression test was
performed. A regression test, so that it has an adjustment to the F statistic, must have a
significant value, which means the value of P must be less than 5% (p <0.05). The adjusted R-
squared value indicates the explanatory power of the model. The Beta values and the sign
indicate the association with the dependent variables when there is significance, that is, P
<0.05 or P <0.01. In this case, it is possible to verify in Table 7 the result of the regression
analysis for the two forms of calculation of the socioeconomic classes (APUR and CLAS).
Table 7 – Regression analysis (APUR and CLASS)
Model for CLAS Model for APUR
Beta Significance Beta Significance
Constant 5,306 0,000 45,074 0,000
Brand -,278 0,062 -3,066 0,028
Support 0,114 0,434 1,654 0,223
F 2.065 .131 2.593 .078
R² adjusted 0.014 0.021
Source: Research Results (2016).
When observing the results of multiple linear regression, it is possible to verify the
non-fit of the two models (non-significant F test). Despite the significance for the brand in the
APUR model, it is not possible to establish an association relation between the dependent and
independent constructs. Thus, hypothesis testing has resulted in both hypotheses being
unsupported.
6. CONCLUSION
The intention of this research was to verify the perceived value of the microfranchisee
due to its socioeconomic class. In order to do so, two specific objectives were proposed: (1) to
analyze perception of value by the microfranchisee in relation to the support provided by the
franchisor (training, prospecting and installation support, legal and financial support, field
consulting and operation manuals); and (2) to verify the perception of value by the
EnANPAD 2017 São Paulo / SP - 01 a 04 de Outubro de 2017
13
microfranchisee regarding the development of the brand by the franchisor (advertising and
promotion, brand strength and loyalty).
The results of the multiple linear regression test applied in hypotheses 1 and 2 were
revealing, both were not statistically supported.
Hypothesis 1 was about the perception of value of the franchisor's support. It is
aligned with international studies that verified the importance of the positive perception of the
value by the franchisee in relation to the support received from the franchisor, to the training
offered for the execution of the business and installation of the franchise unit, to legal and
financial support, to the provision of field consulting and to appropriate operating manuals, so
that the franchisor and franchisee relationship is strengthened and lasting, resulting in the
franchisee's desire to remain in the franchise chain (Grünhagen & Dorsch, 2003; Chiou; Hsieh
& Yang, 2004; Monroy & Alzola, 2005; Grace & Weaven, 2011).
Hypothesis 2, which dealt with the franchisee's perception of the value of the franchise
chain brand, was supported by previous research showing that with the payment of the
entrance and advertising fees and royalties, the franchisee gets the right to use the Brand of
the franchisor. The stronger and more recognized the brand, through advertising and
promotions of the franchise chain and actions to strengthen the brand, the greater the loyalty
of the franchisee to the business, in addition to attracting and retaining consumers, which is
the primary function of the business (Aaker, 1996; Combs; Michael & Castrogiovanni, 2004;
Ghantous & Jaolis, 2013).
The results of the statistical tests did not confirm hypotheses 1 and 2, contrary to the
thesis defended by the authors of this research, in which there would be differences in the
perception of value by the microfranchisees due to their socioeconomic class. There were no
statistical correlations between the variables under analysis. The hypotheses were developed
with the microfranchisee income as a dependent variable, since studies state that the
perceptions, needs and desires of the individuals can vary according to the individual values
and according to their socioeconomic class. (Chiou; Hsieh & Yang, 2004; Souza &
Lamounier, 2010; Yaccoub, 2011).
Regarding support, hypothesis 1 was based on the assumption that franchisees with
lower incomes would have greater difficulty in running the business, requiring more support
from the franchisor, once they had fewer years of study and less training for management
(Neri, 2010). Therefore, they would have a greater perception of value of the received
support. Regarding the brand, contemplated in hypothesis 2, the claim was based on that
franchisees with higher income would have a lower perception of value as to the brand
attributes of the franchise chain, seeing it as less prestige and less known to the public, due to
the limitation of values for investments, which has a maximum of US$ 26,000.00 (Huang;
Phau & Chen, 2007; Ganthous & Jaolis, 2013; Nijmeijer; Fabbricotti & Huijsman, 2014).
The results shows that regarding the franchising mix - support and brand - the
perception of value by microfranchisees does not differ, even if they originate from different
socioeconomic classes. Entrepreneurs of different classes have their own socioeconomic class
values and bring them when in the performance of the microfranchisee functions, which
could, by deduction, reflect in different perceptions of value. This means that, regardless of
the socioeconomic class, the microfranchisees surveyed do not present different perception of
value as to the support and brand of the franchise chain.
The academic contribution is to add to the restricted number of national and
international publications on the management of microfranchises the point of view of
microfranchisees. (Harmon & Griffiths; 2008; Huang & Phau, 2008). In addition, no studies
were found in the international and national literature that addressed the franchising mix -
support and brand - according to the socioeconomic class of the franchisee, allowing this to be
EnANPAD 2017 São Paulo / SP - 01 a 04 de Outubro de 2017
14
a starting point for research related to the theme (Oduor, Kamau & Mathenge, 2009; Ivins,
2008; Kistruck et al, 2011).
At last, the franchisors’ decision of selecting franchisees should not consider merely
the socioeconomic characteristics as predictors of their support and brand image perception.
Socioeconomic factors could be further studied as a variable related to franchisees’ other
perceptions or other personal characteristics such as efforts towards their business
As a managerial contribution, this research brings important suggestions to the
franchise chains, which can verify the current level of microfranchisees satisfaction with the
support provided and the investments in the brand, adjusting them in order to reduce conflicts
between the parties, strengthening trust ties between the microfranchisee and the franchisor.
Research limitations include: (1) Absence in the questionnaire of an inquiry that
addressed the motivators that led the microfranchisee to join the franchise chain. With this
question, it would be possible to measure whether initial expectations were met and how
satisfied they were at the time of the survey; and (2) It was not taken into account the age
group of the interviewees, which might have made possible a deeper understanding of the
experiences and the generational values of the sample group.
Among the future research suggestions are: (1) Analyze the expectations and
motivators of microentrepreneurs when they join the franchise chain, if they have been
satisfied and at what level; (2) It is suggested to research about how long the interviewees are
microfranchisees, in order to understand if the level of satisfaction may be impacted by the
honeymoon effect due to the enthusiasm of the start of the business; and (3) Finally, we
suggest studies that focus on the age range of respondents and the perception of value in
relation to support and brand focusing on generational values.
REFERENCES
Aaker, D. A. (1996) Criando e administrando marcas de sucesso. São Paulo: Futura.
ABF – Associação Brasileira de Franchising (2014). Cenário Socioeconômico. Cenário
Brasileiro 2014. Disponível em:
<http://www.portaldofranchising.com.br/central/Content/UploadedFiles/Arquivos/Desempen
ho-Franchising-Brasileiro-2014.pdf />, acesso em: 23 jun. 2016.
ABF – Associação Brasileira de Franchising (2015). Microfranquia – Guia de Orientação-
2014. Disponível em: <http://www.portaldofranchising.com.br/franquias/microfranquias-
guiade-orientacao>, acesso em: 23 jun. 2016.
Burand, D. & Koch, D. W. (2010) ‘Microfinancing: a business approach to fighting poverty’,
Franchise LJ, Vol. 30, p. 24.
Chiou, J. S., Hsieh, C. H.; Yang, C. H. (2004) ‘The effect of franchisors' communication,
service assistance, and competitive advantage on franchisees' intentions to remain in the
franchise system’, Journal of Small Business Management, Vol. 42, No. 1, pp. 19-36.
Cohen, M. & Silva, J. F. (2000) ‘O impacto das decisões estratégicas no desempenho dos
franqueados em fast-food: o papel do relacionamento franqueador-franqueado’, Revista de
Administração Contemporânea, Vol. 4, No. 2, pp. 109-131.
Combs, J. G., Michael, S. C. & Castrogiovanni, G. J. (2004) ‘Franchising: a review and
avenues to greater theoretical diversity’, Journal of Management, Vol. 30, No. 6, pp. 907-931.
Dant, R. P. (1995) ‘Motivation for franchising: rhetoric versus reality’, International Small
Business Journal, Vol. 14, No. 1, pp. 10-32.
Fairbourne, J. S. (2006) ‘Microfranchising: a new tool for creating economic self-reliance’,
Journal of Microfinance/ESR Review, Vol. 8, No. 1, pp. 18-23.

EnANPAD 2017 São Paulo / SP - 01 a 04 de Outubro de 2017
15
Farquhar, P. H. (1989) ‘Managing brand equity’, Marketing Research, Vol. 1, No. 3, pp. 24-
33.
Ghantous, N. & Jaolis, F. (2013) ‘Conceptualizing franchisee-based brand equity - a
framework of the sources and outcomes of the brand’s added value for franchisees’,
International Business Research, Vol. 6, No. 2, pp. 112-125.
Grace, D. & Weaven, S. (2011) ‘An empirical analysis of franchisee value-in-use, investment
risk and relational satisfaction’, Journal of Retailing, Vol. 87, No. 3, pp. 366-380.
Grünhagen, M. & Dorsch, M. J. (2003) ‘Does the franchisor provide value to franchisees?
Past, current, and future value assessments of two franchisee types’, Journal of Small
Business Management, Vol. 41, No. 4, pp. 366-384.
Grünhagen, M., DiPietro, R. B., Stassen, R. E. & Frazer, L. (2008) ‘The effective delivery of
franchisor services: a comparison of US and German support practices for franchisees’,
Journal of Marketing Channels, Vol. 15, No. 4, pp. 315-335.
Harmon, T. R. & Griffiths, M. A. (2008) ‘Franchisee perceived relationship value’, Journal of
Business & Industrial Marketing, Vol. 23, No. 4, pp. 256-263.
Huang, Y. A., Phau, I. & Chen, R. W. (2007) ‘Conceptualizing the franchise system quality
(FSQ) matrix: An exploratory study’, Journal of Marketing Channels, Vol. 14, No. 4, pp. 41-
64.
Huang, Y. A. & Phau, I. (2008) ‘Mapping the profiles of franchisees: getting to know the
black sheep, rough diamonds, whingers and best buddies’, Direct Marketing: An International
Journal, Vol. 2, No. 4, pp. 221-238.
Ivins, T. Z. (2008) ‘Microfranchising Microlearning Centers: A Sustainable Model for
Expanding the Right to Education in Developing Countries?’, Journal of Asynchronous
Learning Networks, Vol. 12, No. 1, pp. 27-35.
Kistruck, G. M., Webb, J. W., Sutter, C. J. & Ireland, R. D. (2011) ‘Microfranchising in Base
of the Pyramid markets: Institutional challenges and adaptations to the franchise model’,
Entrepreneurship Theory and Practice, Vol. 35, No. 3, pp. 503-531.
Krishnan, L. & Kamalanabhan, T. (2013) ‘Entrepreneurial success and life satisfaction among
women entrepreneurs in micro enterprises’, South Asian Journal of Management, Vol. 20,
No. 2, pp. 40-63.
Lombardi, R., Caputo, A., Russo, G. & Formisano, V. (2015) ‘Management control of
contractual networks: the business network scorecard’, International Journal of Applied
Management Science, Vol. 7, No. 4, pp. 269-286.
Melo, P. L. R., Borini, F. M. & Carneiro-da-Cunha, J. A. C. (2014) ‘Percepções de valor e
elementos estruturantes das microfranquias’, Revista de Administração Contemporânea, Vol.
18, No. 3, pp. 328-350.
Melo, P. L. R., Carneiro-da-Cunha, J. A. C. & Borini, F. M. (2014) ‘Microfranqueados:
Análise dos Antecedentes do Empreendedor, Suporte e Marca da Rede’, Annals of XVIII
SemeAd, São Paulo, 17.
Monroy, M. F. & Alzola, L. M. (2005) ‘An analysis of quality management in franchise
systems’, European Journal of Marketing, Vol. 39, No. 5/6, pp. 585-605.
Neri, M. C. (2010) A nova classe média: O lado brilhante dos pobres (The New Middle
Class: The Brilliant Side of the Poor). Rio de Janeiro: Fundação Getúlio Vargas.
Nijmeijer, K. J., Fabbricotti, I. N. & Huijsman, R. (2014) ‘Making franchising work: a
framework based on a systematic review’, International Journal of Management Reviews,
Vol. 16, No. 1, pp. 62-83.
Nyadzayo, M. W., Matanda, M. J. & Ewing, M. T. (2011) ‘Brand relationships and brand
equity in franchising’, Industrial Marketing Management, Vol. 40, No. 7, pp. 1103-1115.
EnANPAD 2017 São Paulo / SP - 01 a 04 de Outubro de 2017
16
Oduor, J., Kamau, A. & Mathenge, E. (2009) ‘Evaluating the impact of microfranchising the
distribution of anti-malarial drugs in Kenya on malaria mortality and morbidity’, Journal of
Development Effectiveness, Vol. 1, No. 3, pp. 353-377.
Pestana, M. H. & Gageiro, J. N. (2008) Análise de dados para ciências sociais: a
complementaridade do SPSS. Lisboa: Edições Sílabo.
Peterson, R. A. (1994) ‘A meta-analysis of Cronbach’s coefficient alpha’, Journal of
Consumer Research, Vol. 21, No. 2, pp. 381-391.
Pinho, J. B. (1996) O poder das marcas. São Paulo: Summus Editorial.
Pitt, L., Napoli, J. & van der Merwe, R. (2003) ‘Managing the franchised brand: The
franchisees' perspective’, The Journal of Brand Management, Vol. 10, No. 6, pp. 411-420.
PNAD/IBGE (2009) Pesquisa nacional por amostra de domicílios. Available at
<http://www.ibge.gov.br/home/estatistica/pesquisas/pesquisa_resultados.php?id_pesquisa=14
9>. Accessed on Jul. 4th, 2016. .
Prahalad, C. K. (2004) The fortune at the bottom of the pyramid: eradicating poverty through
profits. Upper Saddle River: Wharton School Publishing.
Serasa Experian (2014). Dados inéditos da Serasa Experian e Data Popular revelam faces da
classe média, que movimenta 58% do crédito e injeta R$ 1 trilhão na economia. Available at:
<http://noticias.serasaexperian.com.br/dados-ineditos-da-serasa-experiane-data-popular>.
acessed on: May 7th, 2015.
Souza, A. & Lamounier, B. (2010) A classe média brasileira. São Paulo: Elsevier.
Vale, G. M. V., Corrêa, V. S. & Reis, R. F. D. (2014) ‘Motivações para o empreendedorismo:
necessidade versus oportunidade’, Revista de Administração Contemporânea, Vol. 18, No. 3,
pp. 311-327.
Yaccoub, H. (2011) ‘A chamada "nova classe média": cultura material, inclusão e distinção
social’, Horizontes Antropológicos, Vol. 17, No. 36, pp. 197-231.