emerging trends in food retailing: an empirical study on
TRANSCRIPT
www.ijird.com January, 2016 Vol 5 Issue 2
INTERNATIONAL JOURNAL OF INNOVATIVE RESEARCH & DEVELOPMENT Page 127
Emerging Trends in Food Retailing:
An Empirical Study on Customer Satisfaction
1. Introduction
“It is no longer enough to satisfy customers. You must delight them” – Philip Kotler.
In this fast growing and competitive retail market of India, retailers are embracing the trends in retailing in order to be successful and to
provide the best service to customers. The retailers are equally focused on customer retention and customer satisfaction as well as on
costs and sales as they are the ones which will succeed, because without customers, there are no sales. Any retail store that wishes to
stay in business for a long time need to establish a strong relationship with customer and their focus should be on their customers. In
order to know the customer preferences, organizations have to collect, group and analyze customer details. Yuen & Chan (2010) assert
that in today’s competitive grocery store sector, customer demands are bound to increase from time to time due to the improvement of
service quality in parallel with product variety.
Advanced information technology tools are generally seen as supportive technology tools to human activities of business actions. The
proper use these tools enables faster completion of tasks, increases reaction to market needs, lowers the time required for information
processing, supports the decision-making processes, minimizes data entry errors and improves the quality of customer service. Business
Intelligence (BI) tools are helping retailers in identifying valuable customer data, predicting future buying patterns, and buying
behaviors of customers and to gain competitive advantage.
BI tools have become an integral part of any business that wishes to establish a strong customer relationship. These advanced
information systems made possible to extract hidden information of customers’ data from large databases through data mining
techniques. By creating a database of contact information with customers, retailers can activate powerful campaigns with their
customers, ranging from promotional offers to new item updates and can intelligently identify potential customers can stay ahead of
competitors. Today both online and in-store retailers are using business intelligence (BI) tools to remain competitive in a cut-throat
consumer market and to cope with the growing overflow of customer data. Business Intelligence is an umbrella term which was coined
ISSN 2278 – 0211 (Online)
Sailaja V.
Research Scholar, Department of Management Studies, JNTUK, Kakinada, India
Suryanarayana A.
Dean, Department of Business Management, Osmania University, Hyderabad, India
Surya Narayana R.
Faculty, MIST, Hyderabad, India
Abstract:
With increased number of food and grocery retail outlets and availability of a variety of products, customers have become
accustomed to patronizing multiple retailers. Retailers have recognized this trend and are of the view that customer satisfaction
plays a role in the success of business strategies. Therefore it has become important for food and grocery retailers to try to stay
in business for a long time and need to establish a strong relationship with customer and their focus should be on the customer
satisfaction. Advance information technology tools like Business Intelligence (BI) helps retailers to identify the likings and
disliking of its customers and helps in building a strong bond with existing customers and also to attract many more new
customers.
This paper investigates the customer preferences, and tries to find the impact of trends in retailing on customer satisfaction of
food retailing in the Indian retail context. For this, an empirical study was conducted considering customers of five organized
food retailers namely, More supermarket, Reliance Fresh, Spencer’s, Big Bazar and D Mart. From the study, it is observed that
majority of the customers of five food retail outlets reported positively towards product quality, reliability of services with present
trends in retailing; while Big Bazar and D mart are providing value for money, other retailers drive customer satisfaction with
additional services. In addition, comparative analysis between these organized food retail stores is shown.
Keywords: Business Intelligence, data mining, competitive advantage, customer preferences, customer satisfaction.
www.ijird.com January, 2016 Vol 5 Issue 2
INTERNATIONAL JOURNAL OF INNOVATIVE RESEARCH & DEVELOPMENT Page 128
by Howard Dresner of the Gartner Group in 1989 to describe “concepts and methods to improve business decision making by using
fact-based support systems” (Power, 2008). Business intelligence combines “data gathering, data storage, and knowledge management
with analytical tools to present complex and competitive information to planners and decision makers” (Negash & Gray, 2008).
The conventional definition of BI refers to the consolidation and analysis of internal data, for example, transactional point of sales
(POS) data and external data e.g., consumer data for the purpose of effective decision-making. Point of sale (POS) is one of the most
important parts of the overall customer experience with a retailer, located where a financial transaction occurs. With the help of BI
tools, retailers are able to access information from customer loyalty card transactions and create advertising and marketing campaigns to
be directly targeted to the audience considered the most receptive.
The valuable customer transaction information provides retailers with:
purchases between certain dates
no purchases between certain dates
spent more or less than a particular rupee value
accrued more or less than a certain number of points
have purchased particular products
have marketing profiles such as- birthday during a particular month,
live in a certain geographical area, member of a particular group.
With BI tools and systems, most retailers find that their efficiency increases as employees are able to focus more on their customers and
their needs, providing better service, which increases their brand value. Data ware housing and data mining tools are useful in
determining information of customers’ buying habits, repeat purchases, usage of discount schemes, frequency of purchases and more
such information. These tools further help retailers in examining the performance of their retail schemes, improving their customer
relationship management (CRM) systems etc. BI tools helps managers to feed in opening and closing stock at a particular retail outlet,
which helps the head office to track stock of sold, unsold, damaged, returned products and are able to access their sales from virtually
anywhere with several stores to manage.
2. Customer Satisfaction and Retail Service Quality
Satisfaction means the contentment one feels when one has fulfilled a desire, need or expectation. Customer satisfaction can be a
measure of how happy customers are with the services and products of a supermarket. Keeping customers happy is of tremendous
benefit to retailers as satisfied customers are more likely to stay loyal, consume more and are more likely to recommend their friends.
Customer satisfaction is a powerful intangible asset similar to service quality and can be achieved through the fulfillment of customer
expectations (Oliver, 1980). Kotler (2000); Hoyer & MacInnis (2001) define satisfaction as a person’s feelings of pleasure, excitement,
delight or disappointment which results from comparing a products perceived performance to his or her expectations. Customer
satisfaction is found to be dependent on the quality of service offered to the customer and is one of the tools to increase value for
customers (Sivadas & Baker-Prewitt, 2000).
More value for customer means higher satisfaction, which can benefit the retail organization in long run (Zeithaml, Berry, &
Parasuraman, 1996); Cronin, Brady, & Hult, 2000), and generate higher revenue (Aaker and Jacobson, 1994).
Most of the earlier studies in retail sector signify the importance of CRM that maximizes customer lifetime value and minimizes excess
inventory. The studies tell us that most retailers spend the majority of their advertising to attract new customers and these retail CRM
systems keep customers coming back and when customers come to the store, they generate profits to the organizations. The increase in
population, with a multitude of demands and expectations, makes the retail sector very competitive. A long term relationship is possible
if the retailer can evaluate customer satisfaction with the quality of service experienced in a retail store. Dabholkar et.al (1996) proposed
a methodology to study service quality in a retail setting through the Retail Service Quality Scale (RSQS).
This study focuses on the customer perception towards trends in retailing and their satisfaction in food retailing, by considering RSQS
with modifications as proposed by Dabholkar et.al (1996).
3. Indian Food Retail Sector
India is a very complex retail market. Retailers not only have to contend with geographical, cultural and linguistic diversity, but manage
business complicated by tax structures which vary from state to state. A successful retailer needs not only the right products at the right
place and the right time but must also have the right price to be acceptable to the customer. In addition, the number of products managed
is very high.
The Indian retail market, currently estimated at $490 billion, is project to grow at a compounded annual growth rate of 6 per cent to
reach $865 billion by 2023. Currently India constitutes only 8% of organized retail and remaining 92% is left unorganized, which may
grow much faster than traditional retail. It is expected to gain a higher share in the growing pie of the retail market in India. The
country's traditional retail industry is expected to grow at an average annual rate of 5% over the next year, while the organized retail is
estimated to register a growth rate of around 25% by 2020. India has major formats of food retailing such as:
Specialty stores that focuses on specific consumer needs,
Department stores having a wide variety of products, organized into different departments,
Supermarkets having extremely large self-service retail outlets,
Discount stores offering discounts on the retail price through selling high volumes and reaping economies of scale,
www.ijird.com January, 2016 Vol 5 Issue 2
INTERNATIONAL JOURNAL OF INNOVATIVE RESEARCH & DEVELOPMENT Page 129
Hyper-marts, larger than a supermarket, sometimes with a warehouse appearance, generally located in quieter parts of the cities
and
Convenience stores with small self-service formats located in crowded urban areas.
4. Need for the Study
Customers like to see technologically advanced systems, and they definitely enjoy a unique shopping experience with speedy and
accurate checkout. Though Indian food retailers are adapting new modern information systems, a lot of study is required to know the
trends of these retailers and how they are implementing successfully to match the needs of Indian customers that lead to customer
satisfaction.
5. Objectives of the Study
Indian retailing though is increasing in volume; it is lagging behind the western countries in terms of proper use of modern information
systems and hence analysis of advanced information systems has become vital. The study is aimed at organized food retailers in twin
cities of Hyderabad and Secunderabad at Telangana to:
Know the customer preferences towards trends in retailing.
Study the impact of recent trends in retailing on customer satisfaction in different food retail stores.
6. Methodology
The sampling frame consisted of customers of five food and grocery retailers in the twin cities of Hyderabad and Secunderabad of
Telangana, India. The study carried out considering organized food retailers in India, namely, More, Reliance fresh, Spencer’s, Big
Bazar and D mart to determine whether recent trends in retailing leads to customer satisfaction. A total sample size of 150 customers at
these select grocery retailers was considered with convenient sampling method to conduct survey. The respondents were customers of
these retailers; the sampling technique considered is convenient sample as long as they were qualified for being customers of those
relative supermarkets.
The researchers used questionnaire as a tool for data collection because this method assists to increase response rate (Saunders et al
2000). In addition to quantitative research, qualitative research as well as the personal experience of the researchers was incorporated.
The qualitative research comprises the secondary data and the method of data collection is minimized and was kept as simple as
possible because of the complexity of the data.
7. Data Analysis
7.1. Qualitative Analysis
The benefits from advancements of technology tools being used in retailing and the expectations of customers based on secondary data
and the personal observations of the researcher are given as:
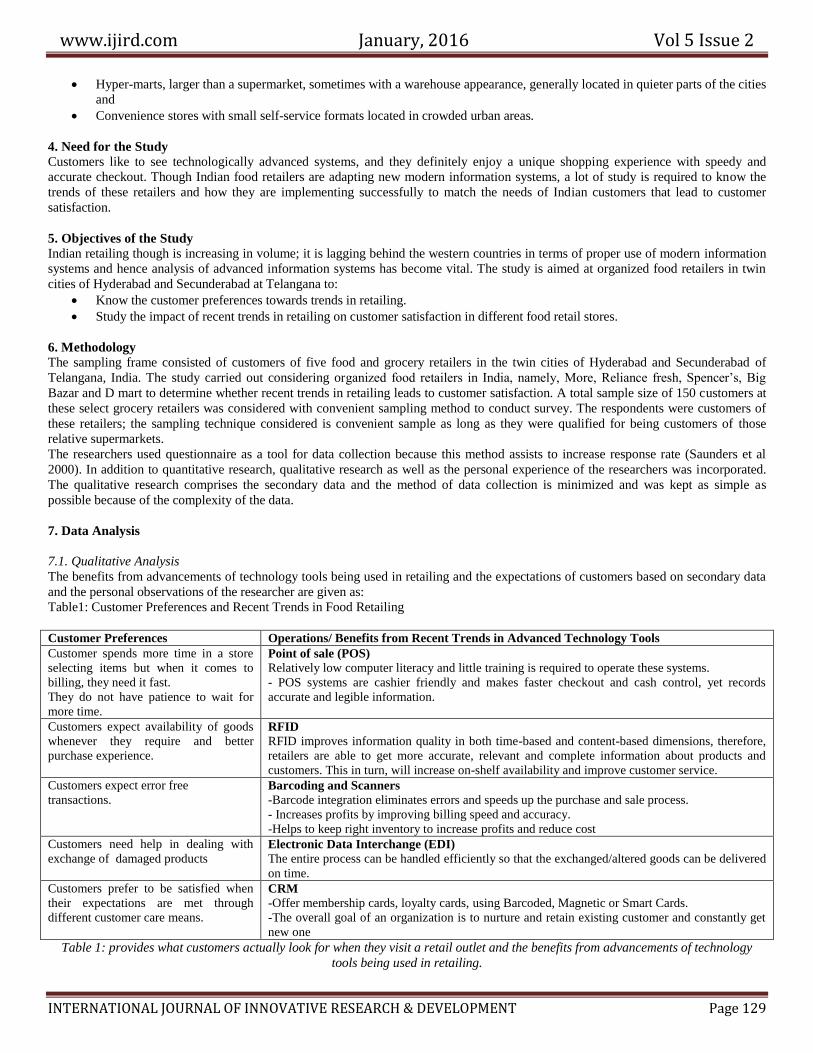
Table1: Customer Preferences and Recent Trends in Food Retailing
Customer Preferences Operations/ Benefits from Recent Trends in Advanced Technology Tools
Customer spends more time in a store
selecting items but when it comes to
billing, they need it fast.
They do not have patience to wait for
more time.
Point of sale (POS)
Relatively low computer literacy and little training is required to operate these systems.
- POS systems are cashier friendly and makes faster checkout and cash control, yet records
accurate and legible information.
Customers expect availability of goods
whenever they require and better
purchase experience.
RFID
RFID improves information quality in both time-based and content-based dimensions, therefore,
retailers are able to get more accurate, relevant and complete information about products and
customers. This in turn, will increase on-shelf availability and improve customer service.
Customers expect error free
transactions.
Barcoding and Scanners
-Barcode integration eliminates errors and speeds up the purchase and sale process.
- Increases profits by improving billing speed and accuracy.
-Helps to keep right inventory to increase profits and reduce cost
Customers need help in dealing with
exchange of damaged products
Electronic Data Interchange (EDI)
The entire process can be handled efficiently so that the exchanged/altered goods can be delivered
on time.
Customers prefer to be satisfied when
their expectations are met through
different customer care means.
CRM
-Offer membership cards, loyalty cards, using Barcoded, Magnetic or Smart Cards.
-The overall goal of an organization is to nurture and retain existing customer and constantly get
new one
Table 1: provides what customers actually look for when they visit a retail outlet and the benefits from advancements of technology
tools being used in retailing.
www.ijird.com January, 2016 Vol 5 Issue 2
INTERNATIONAL JOURNAL OF INNOVATIVE RESEARCH & DEVELOPMENT Page 130
7.2. Quantitative Analysis
The questionnaire was based on Likert scaling, which allowed for respondents to choose an option from the scale as follows: 1 =
Strongly Disagree (S.D); 2 = Disagree (D); 3 = Neutral (Neu); 4 = Agree (A); 5 = Strongly Agree (S.A)
Dabholkar et al. (1996) tested the RSQS with department store customers in the US, and later in two store units of a departmental
store involved in the first study. The model showed a fit in both the studies, and the scale was expected to be suitable for the study of
retail businesses, such as departmental or specialty stores. Later, it was tested by researchers across countries and retail formats; Kaul
(2007) tested RSQS for apparel stores in India. The Retail Service Quality Scale (RSQS) proposed by Dabholkar et al. (1996) was
adapted for five constructs of service quality (physical aspects, reliability, personal interaction, problem solving, and policy). The total
items in the RSQS scale proposed by Dabholkar et al. (1996) were 28, which included 6 for physical aspects, 5 for reliability, 9 for
personal interaction, 3 for problem solving, and 5 for policy. To measure the level of satisfaction of customers at selected
supermarkets, the questionnaire was designed based on the preliminary study; few variables each for construct was considered to
increase aptness, keeping in view the time constraints and appropriateness of the study to know the impact of trends in retailing. The
following tables (table 4 to 9) shows the modified and simple constructs of service quality.
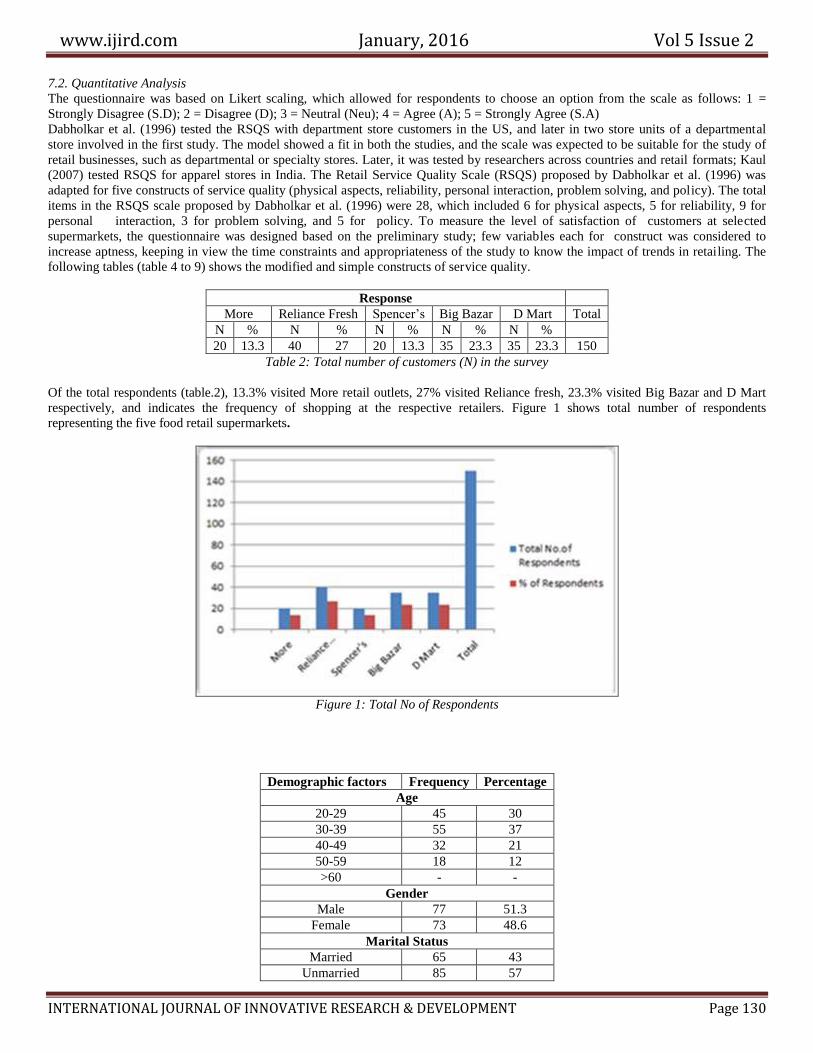
Response
More Reliance Fresh Spencer’s Big Bazar D Mart Total
N % N % N % N % N %
20 13.3 40 27 20 13.3 35 23.3 35 23.3 150
Table 2: Total number of customers (N) in the survey
Of the total respondents (table.2), 13.3% visited More retail outlets, 27% visited Reliance fresh, 23.3% visited Big Bazar and D Mart
respectively, and indicates the frequency of shopping at the respective retailers. Figure 1 shows total number of respondents
representing the five food retail supermarkets.
Figure 1: Total No of Respondents
Demographic factors Frequency Percentage
Age
20-29 45 30
30-39 55 37
40-49 32 21
50-59 18 12
>60 - -
Gender
Male 77 51.3
Female 73 48.6
Marital Status
Married 65 43
Unmarried 85 57
www.ijird.com January, 2016 Vol 5 Issue 2
INTERNATIONAL JOURNAL OF INNOVATIVE RESEARCH & DEVELOPMENT Page 131
Occupation
Student 35 23.3
Private Service 65 43.3
Government Employee 10 6.7
Business/self-employed 15 10
House wife 25 16.6
Others - -
Income*
< 15000 15 28.6
15,000-30,000 45 32
30,000-45,000 25 23.4
45,000-60,000 25 20.2
>60,000 8 15.6
Sample size 150
Table 3: Demographic Survey Sample Profile
*Out of 35 students 3 students are earning below Rs.15, 000 and the remaining did not choose income parameter, indicating they are
dependents.
From the demographic survey (table.3), we find that major customer group belongs to 30 to 39 yrs contributing to 37%, the ratio of
male to female being almost equal; major customers working in private services at 43.3% and major income group belongs to Rs.15,
000 to Rs.30, 000.
Response
Scale More Reliance
Fresh Spencer’s
Big
Bazar D Mart
S.D - - - - - -
D - - - - - -
Neu 5 15 8 15 15 58
A 15 25 12 20 20 92
S.A - - - - -
Total 20 40 20 35 35 150
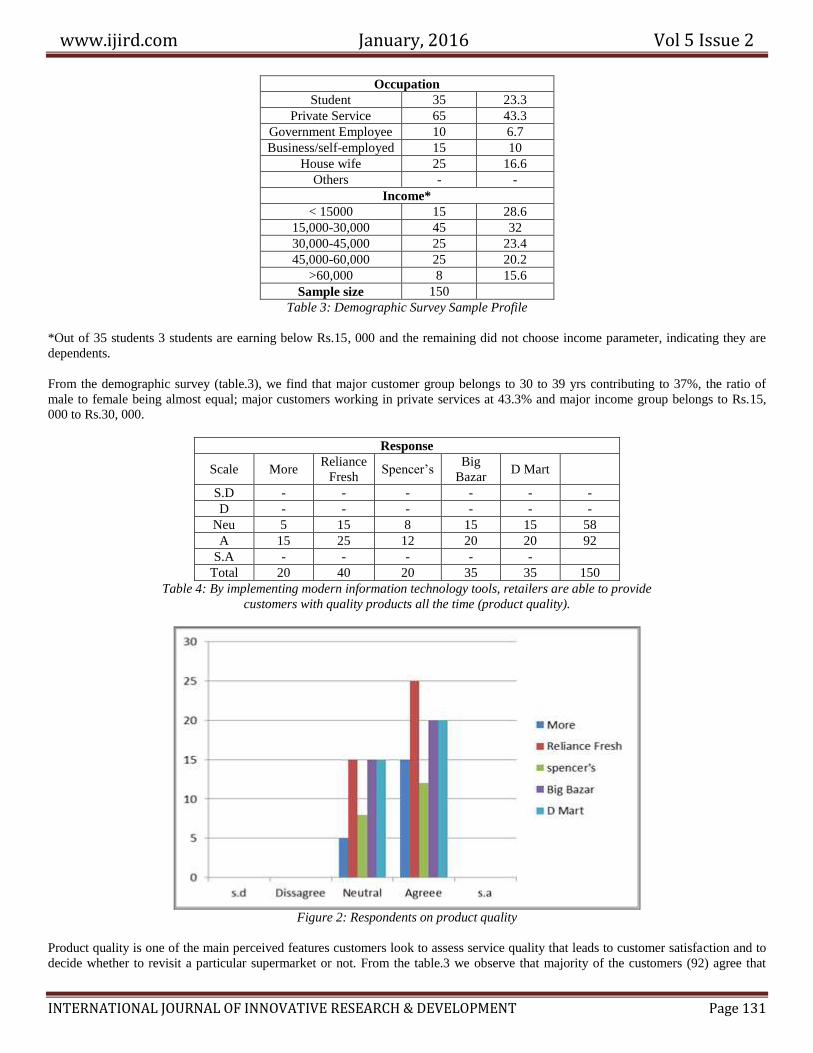
Table 4: By implementing modern information technology tools, retailers are able to provide
customers with quality products all the time (product quality).
Figure 2: Respondents on product quality
Product quality is one of the main perceived features customers look to assess service quality that leads to customer satisfaction and to
decide whether to revisit a particular supermarket or not. From the table.3 we observe that majority of the customers (92) agree that
www.ijird.com January, 2016 Vol 5 Issue 2
INTERNATIONAL JOURNAL OF INNOVATIVE RESEARCH & DEVELOPMENT Page 132
modern retailers are providing quality products whenever they visit and some remain neutral (58). Figure 2 shows responses on product
quality from the customers of the five food retail supermarkets.
Response
Scale More Reliance Fresh Spencer’s Big Bazar D Mart
S.D - - - - - -
D - - - - - -
Neu 15 15 5 30 25 90
A 5 25 10 5 10 55
S.A - - 5 - - 5
Total 20 40 20 35 35 150
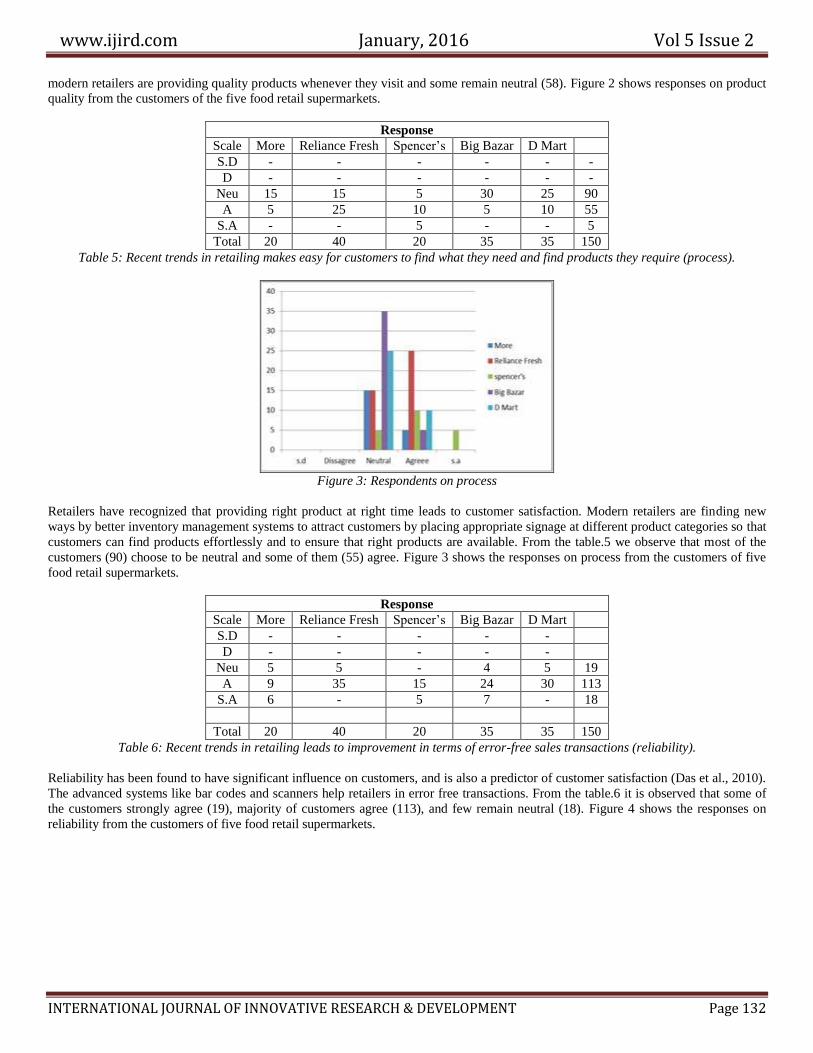
Table 5: Recent trends in retailing makes easy for customers to find what they need and find products they require (process).
Figure 3: Respondents on process
Retailers have recognized that providing right product at right time leads to customer satisfaction. Modern retailers are finding new
ways by better inventory management systems to attract customers by placing appropriate signage at different product categories so that
customers can find products effortlessly and to ensure that right products are available. From the table.5 we observe that most of the
customers (90) choose to be neutral and some of them (55) agree. Figure 3 shows the responses on process from the customers of five
food retail supermarkets.
Response
Scale More Reliance Fresh Spencer’s Big Bazar D Mart
S.D - - - - -
D - - - - -
Neu 5 5 - 4 5 19
A 9 35 15 24 30 113
S.A 6 - 5 7 - 18
Total 20 40 20 35 35 150
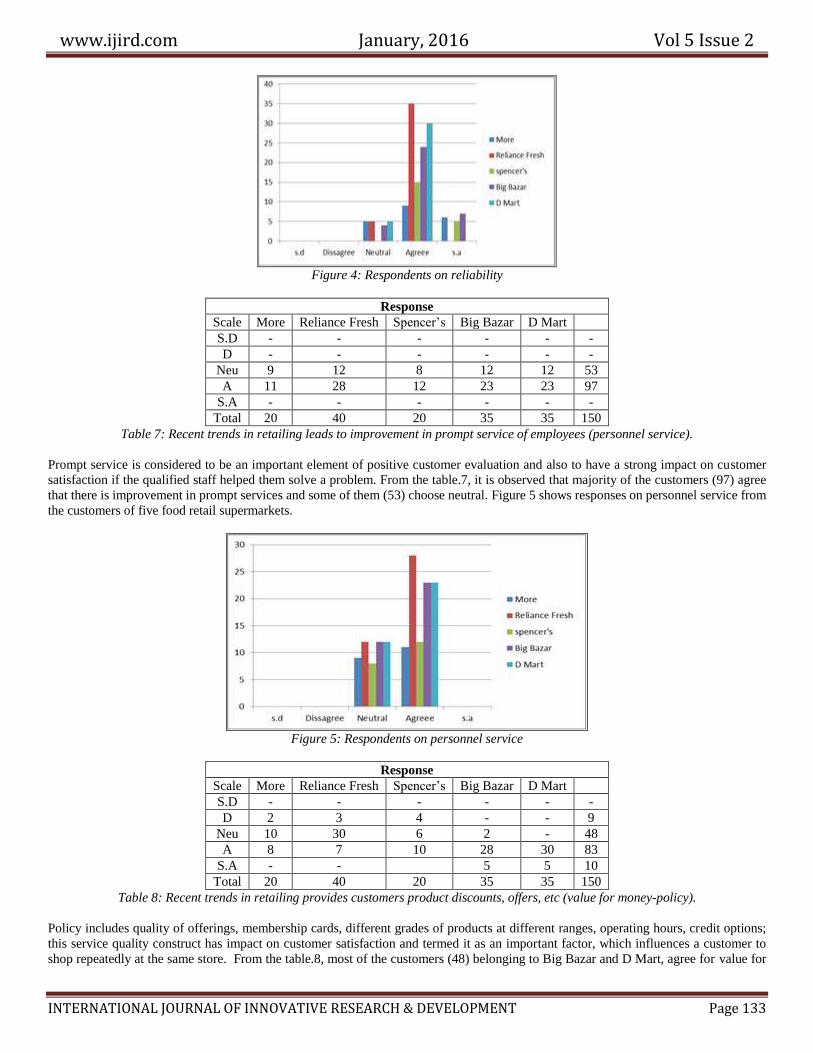
Table 6: Recent trends in retailing leads to improvement in terms of error-free sales transactions (reliability).
Reliability has been found to have significant influence on customers, and is also a predictor of customer satisfaction (Das et al., 2010).
The advanced systems like bar codes and scanners help retailers in error free transactions. From the table.6 it is observed that some of
the customers strongly agree (19), majority of customers agree (113), and few remain neutral (18). Figure 4 shows the responses on
reliability from the customers of five food retail supermarkets.
www.ijird.com January, 2016 Vol 5 Issue 2
INTERNATIONAL JOURNAL OF INNOVATIVE RESEARCH & DEVELOPMENT Page 133
Figure 4: Respondents on reliability
Response
Scale More Reliance Fresh Spencer’s Big Bazar D Mart
S.D - - - - - -
D - - - - - -
Neu 9 12 8 12 12 53
A 11 28 12 23 23 97
S.A - - - - - -
Total 20 40 20 35 35 150
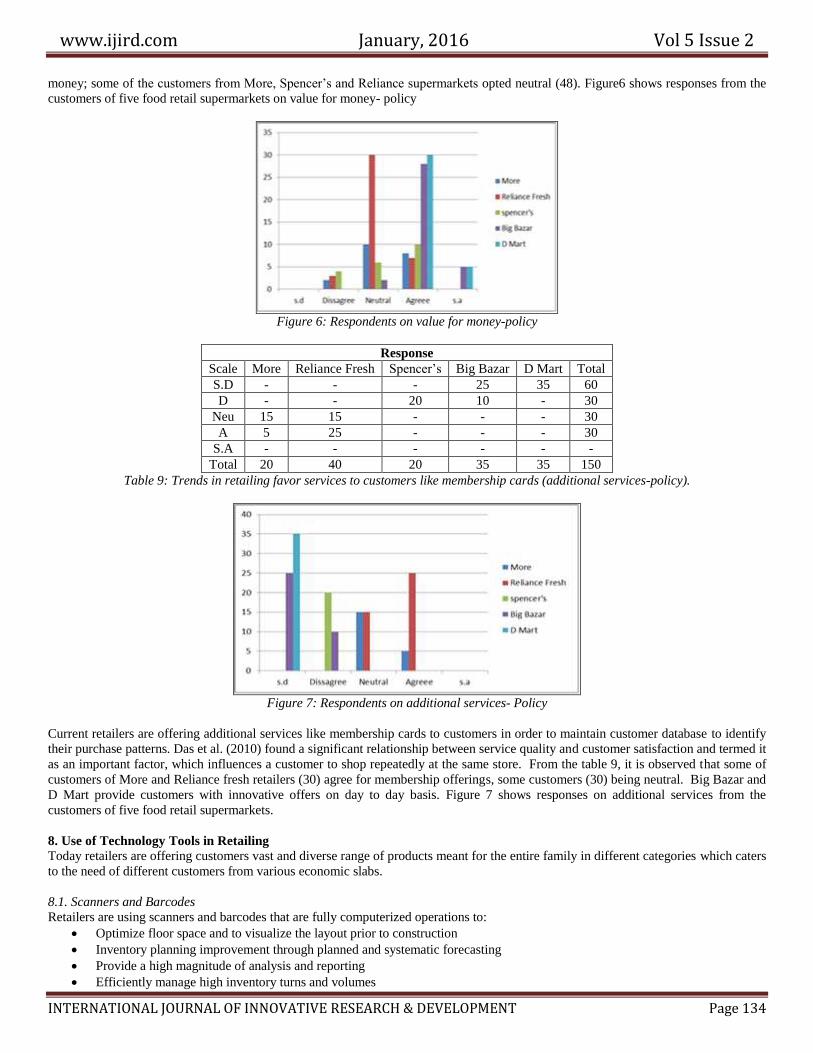
Table 7: Recent trends in retailing leads to improvement in prompt service of employees (personnel service).
Prompt service is considered to be an important element of positive customer evaluation and also to have a strong impact on customer
satisfaction if the qualified staff helped them solve a problem. From the table.7, it is observed that majority of the customers (97) agree
that there is improvement in prompt services and some of them (53) choose neutral. Figure 5 shows responses on personnel service from
the customers of five food retail supermarkets.
Figure 5: Respondents on personnel service
Response
Scale More Reliance Fresh Spencer’s Big Bazar D Mart
S.D - - - - - -
D 2 3 4 - - 9
Neu 10 30 6 2 - 48
A 8 7 10 28 30 83
S.A - - 5 5 10
Total 20 40 20 35 35 150
Table 8: Recent trends in retailing provides customers product discounts, offers, etc (value for money-policy).
Policy includes quality of offerings, membership cards, different grades of products at different ranges, operating hours, credit options;
this service quality construct has impact on customer satisfaction and termed it as an important factor, which influences a customer to
shop repeatedly at the same store. From the table.8, most of the customers (48) belonging to Big Bazar and D Mart, agree for value for
www.ijird.com January, 2016 Vol 5 Issue 2
INTERNATIONAL JOURNAL OF INNOVATIVE RESEARCH & DEVELOPMENT Page 134
money; some of the customers from More, Spencer’s and Reliance supermarkets opted neutral (48). Figure6 shows responses from the
customers of five food retail supermarkets on value for money- policy
Figure 6: Respondents on value for money-policy
Response
Scale More Reliance Fresh Spencer’s Big Bazar D Mart Total
S.D - - - 25 35 60
D - - 20 10 - 30
Neu 15 15 - - - 30
A 5 25 - - - 30
S.A - - - - - -
Total 20 40 20 35 35 150
Table 9: Trends in retailing favor services to customers like membership cards (additional services-policy).
Figure 7: Respondents on additional services- Policy
Current retailers are offering additional services like membership cards to customers in order to maintain customer database to identify
their purchase patterns. Das et al. (2010) found a significant relationship between service quality and customer satisfaction and termed it
as an important factor, which influences a customer to shop repeatedly at the same store. From the table 9, it is observed that some of
customers of More and Reliance fresh retailers (30) agree for membership offerings, some customers (30) being neutral. Big Bazar and
D Mart provide customers with innovative offers on day to day basis. Figure 7 shows responses on additional services from the
customers of five food retail supermarkets.
8. Use of Technology Tools in Retailing
Today retailers are offering customers vast and diverse range of products meant for the entire family in different categories which caters
to the need of different customers from various economic slabs.
8.1. Scanners and Barcodes
Retailers are using scanners and barcodes that are fully computerized operations to:
Optimize floor space and to visualize the layout prior to construction
Inventory planning improvement through planned and systematic forecasting
Provide a high magnitude of analysis and reporting
Efficiently manage high inventory turns and volumes
www.ijird.com January, 2016 Vol 5 Issue 2
INTERNATIONAL JOURNAL OF INNOVATIVE RESEARCH & DEVELOPMENT Page 135
Improve the management of metrics, including service and inventory levels
8.2. Point of Sale (POS)
The first POS systems were rolled out by IBM in the 1970s. It wasn’t until the beginning of the 1990s that the idea of personal
computers running software could automate the functionality of a retail store. Since the mid-1990s, the retail industry has seen some
impressive changes in the use of technology to enhance profit, with PCCD and electronic POS solutions providing invaluable data. Data
gathered at the point of sale drives a retailer’s business, not only monitoring daily financial returns but also by providing information
necessary for inventory management, merchandising planning, supply chain management, and customer care. For the past few years,
retailers have made technology investment a higher priority.
8.3. Customer Relationship Management (CRM)
Levy and Weitz define CRM as, "A business philosophy and set of strategies, programs, and systems that focuses on identifying and
building loyalty with a retailer's profitable customers." It is based on the business philosophy that all customers are not profitable in the
same way and retailers' can increase their profitability by building relationships with their better customers. The goal is to develop a
base of loyal customers who patronize the retailer frequently. A customer loyalty system is a marketing tool used more and more in
today’s competitive retail world. Not only do reward cards and loyalty systems offer incentive to customers to return to the store, they
can provide valuable information to the retailer about customer buying habits. Earlier managing customer relations would have been a
nightmare, but with the help of advanced information technology tools retailers can increase customer loyalty and repeat purchases,
communicate with the customer in a number of ways and gather customer intelligence for marketing purposes. By scanning a
customer’s loyalty card into a retail point of sale system, the retailer has the opportunity to collect information on the customer’s brand
preferences, purchasing habits and demographic information, etc.
9. Technology Applications in Retailing
Resent trends in Information Technology like BI tools are driving retail business not only to monitor relationship with customers,
financial returns daily but also provides valuable information necessary for inventory management, merchandise planning, supply
chain management, and customer care. Using BI tools retailers can keep detailed records of every shopping transaction of customers.
This enables them to better understand various customer segments, some of the retail applications include:
9.1. Market Basket Analysis
Also known as affinity analysis, basket analysis reveals which items customers tend to purchase together. This knowledge can improve
stocking, store layout strategies, and promotions.
9.2. Sales Forecasting
Examining time-based patterns helps retailers make stocking decisions. If a customer purchases an item today, when are they likely to
purchase a complementary item?
9.3. Database Marketing
Retailers can develop profiles of customers with certain behaviors, for example, those who purchase designer labels clothing or those
who attend sales. This information can be used to focus cost–effective promotions.
9.4. Merchandise Planning and Allocation
When retailers add new stores, they can improve merchandise planning and allocation by examining patterns in stores with similar
demographic characteristics. Retailers can also use data mining to determine the ideal layout for a specific store.
10. Discussion and Conclusion
Consumers are becoming more demanding, and as a result, retailers are continuing to place more focus on the consumer shopping
experience. This consumer-centric strategy, requires retailers to continually challenge the way they do business in order to differentiate
themselves in new and innovative ways. This study tried to relate impact of recent trends in retailing on customer satisfaction with
demographic factors like age, gender, marital status, occupation and income levels of customers and name of the supermarket. While
most of customers are working in private organizations, general impression shows that a good store layout and service creates a better
impression and positive attitude toward a retail store. From the study it is observed that retail customers in India had positive opinions
towards the quality of products at food retailers, and agree that discount stores like Big Bazar and D Mart provide value for money.
The study shows that the trends in retailing leads to improvement in reliability of services in terms of error free transactions
improvements in personnel services; while some customers are neutral and some of them agree for the physical facilities in terms of
product availability and assortment. Retailers like More, Reliance fresh and Spencer’s hypermarket are targeting customers offering
various discounts on certain product ranges and are discovering which service areas need to be improved in order to gain competitive
advantage and provide service quality, that results in customer satisfaction. The comparative analysis of customer satisfaction belonging
to the five food retail supermarkets is also shown in graphical presentation.
www.ijird.com January, 2016 Vol 5 Issue 2
INTERNATIONAL JOURNAL OF INNOVATIVE RESEARCH & DEVELOPMENT Page 136
11. Limitations and Guidelines for Future Research
This study has certain limitations as time constraints due to submission within the limited time frame to complete this research. The
total items in the RSQS scale proposed by Dabholkar et al. (1996) were 28, but the present study considered few items due to time
constraints. Other studies on customer satisfaction on the trends in retailing can be performed considering all the 28 items of the RSQS
scale proposed by Dabholkar et al. (1996).
The findings of the present study were applicable only to the food retailers and the target population being the customers of those super
markets, so the findings could not be generalized to the customers of other retail sectors. Further research can be applied to customers of
other retailers; comparison of the customer satisfaction of different retail markets can be done. Further research may also be performed
for the trends in retailing that leads to not only customer satisfaction but can relate to the profitability through customer loyalty and
customer retention.
12. References
i. Aaker, D. A., & Jacobson, R. (1994), “The financial information content of perceived Quality”, Journal of Marketing
Research, 31(2), 191–201 http://dx.doi.org/10.2307/3152193
ii. Cronin, J. J., Brady, M. K., & Hult, G. T. M. (2000), “Assessing the effects of quality, value, and customer satisfaction on
consumer behavioral intentions in service environments”, Journal of Retailing, 76(2), 193–218.
http://dx.doi.org/10.1016/S0022-4359(00)00028-2
iii. Dabholkar, P., Thorpe, D. I., & Rentz, J. O. (1996), “A measure of service quality for retail stores: Scale development and
validation. Journal of the Academy of Marketing Science, 24(1), 3–16, http://dx.doi.org/10.1177/009207039602400101
iv. Das, A., Kumar, V., & Saha, G. C. (2010), “Retail service quality in context of CIS Countries, International Journal of Quality
& Reliability Management, 27(6), 658–683.
http://dx.doi.org/10.1108/02656711011054542
v. Hoyer, WD & MacInnis, DJ (2001), “Consumer behavior,Houghton Boston: Mifflin Company in Singh,H 2006, “The
Importance of Customer Satisfaction in relation to customer loyalty and retention”, UCTI.WP-06-06,May 2006, Kuala
Lumpur, Malaysia.
vi. Kaul, S. (2007), “Measuring retail service quality: Examining applicability of international research perspectives in India”,
Vikalpa, 32(1), 15–26
vii. Kotler, P 2000, Marketing Management 10 (ed), New Jersey: Prentice Hall.
viii. Negash, S., & Gray, P. (2008). Business intelligence. In F. Burstein, & C. W. Holsapple (Eds.),Decision support systems
(pp.175-193). Berlin: Springer
ix. Michael Levy and Barton Weitz (2011), “Retailing Management”, McGraw-Hill Education; 8 edition (January 19, 2011),
ISBN-10: 0073530026
x. Oliver, R. L. (1980), “A cognitive model of the antecedents and consequences of satisfaction decisions”, Journal of Marketing
Research, 16, 460–469. http://dx.doi.org/10.2307/31504991
xi. Power, Daniel J. (2008) .Understanding Data-Driven Decision Support Systems, Information Systems Management, 25(2), 149
– 154
xii. Saunders, MNK, Lewis, P and Thornhil, A 2000, Research Methods for Business Students, Prentice Hall, London.
xiii. Sivadas & Baker-Prewitt (2000), www.ccsenet.org/ijms International Journal of Marketing Studies Vol. 6, No. 4; 2014
xiv. Steven Alter (1999), “Information Systems: A Management Perspective” (3rd Edition), Addison-Wesley; 3rd edition
(September 1999), ISBN-10: 0201351099
xv. Yuen, FT & Chan, SSL (2010), “The effect of retail service quality and product quality on Customer Loyalty”, Journal of data
base marketing and customer strategy management, Vol 17, 222-240.
xvi. Zeithaml, V. A., Berry, L. L., & Parasuraman, A. (1996), “The behavioral consequences of service quality. Journal of
Marketing, 60(2), 31–46 http://dx.doi.org/10.2307/1251929
xvii. Retailsystems.com
xviii. http://dare.co.in/opportunities/manufacturing/opportunity-in-pos-and-mobile-printers.htm.
xix. http://www.cxotoday.com/story/retail-it-spending-to-grow-in-india/
xx. http://www.gaoresearch.com/PDF/POS.pdf
xxi. http://www.huaat.net/download/DMtechniques.pdf
xxii. Ginnisystems.com