electromagnetic radiation reduction in 5g networks ... - arxiv
TRANSCRIPT
1
Abstract— With the massive increase in the popularity of
smartphones and mobile data applications demanding bandwidth
requiring data rates of the order of Gb/s, exploration of untapped
frequency spectrum such as mmWave has begun. Along with
providing seamless connectivity and catering to achieving high QoS
and QoE, investigations are ongoing to enhance our knowledge about
the biological safety at high frequencies. There is a need to ensure
safety and reliability for the exposed public and updating the
government policies regarding safety standards and regulations. This
article is consecrated to provide an insight into health effects
pertaining to mmWave frequencies, addressing aspects such as
thermal heating in the body tissues with temperature rise, specific
absorption rate (SAR), power density. As a solution a proposal has
been given for EM (Electromagnetic) radiation reduction for the
mobile communication system in the form of a proposed mode i.e.
“Thermal Radiation” (TR) mode endorsing its safe use, promoting
Green WCN along with increased energy efficiency and reduced
complexity for the future generations to come. The proposal also
validates reduced power density, SAR and temperature elevation
produced in the human tissue when compared to other models in the
form of simulation results obtained. It can increase the safety and
reliability of 5G and beyond i.e. 6G networks in future.
Index Terms— mmWave, Quality of service (QoS), Quality of
Experience (QoE), biological safety, thermal heating, SAR, power
density, EM radiation, TR mode, Green WCN, 5G, 6G.
I. INTRODUCTION
remarkably high growth has been observed during the last
decade in the wireless and mobile communication system
since their inception in the 1970s [1]. Growth in the count of base
stations that are being sited has severe implications due to EM
radiations on humans, plant life, animals and the entire ecosystem
at large [2]. There have been growing concerns and investigations
regarding the adverse impact that the radiation exposure has
caused on the biological safety of the beings [3-4]. Along with
increasing the base station siting, research is initiated in expanding
the spectrum band under use i.e. exploring the mmWave
frequency band and so on.
Copyright (c) 2015 IEEE. Personal use of this material is permitted. However,
permission to use this material for any other purposes must be obtained from the IEEE by sending a request to [email protected].
H. Kour, R. K. Jha, are with the Shri Mata Vaishno Devi University, J&K, India.
(E-mail: , [email protected], [email protected],).
The EM radiation exposure limits and safety standards have been
defined by the International Commission on Non-Ionising
Radiation Protection (ICNIRP) in [5] regarding the permissible
exposure up till 300 GHz exposure. Various reports by the
National Radiological Protection Board (NRPB) of UK have also
presented their guidelines for the same in [6], stating effects such
as injury, illness, thermal heating of the human tissues. These
concerns have also been highlighted in the recent events during
ITU (International Telecommunication Union) [7].
The physical quantities used to study the exposure are specific
absorption rate, Power Density (PD), electric and magnetic field.
Wireless communication networks (WCN) have major
contributions in increasing the carbon dioxide footprint in the
atmosphere. Mobile networks alone contribute to more than half
of the emissions followed by telecom devices. This figure is
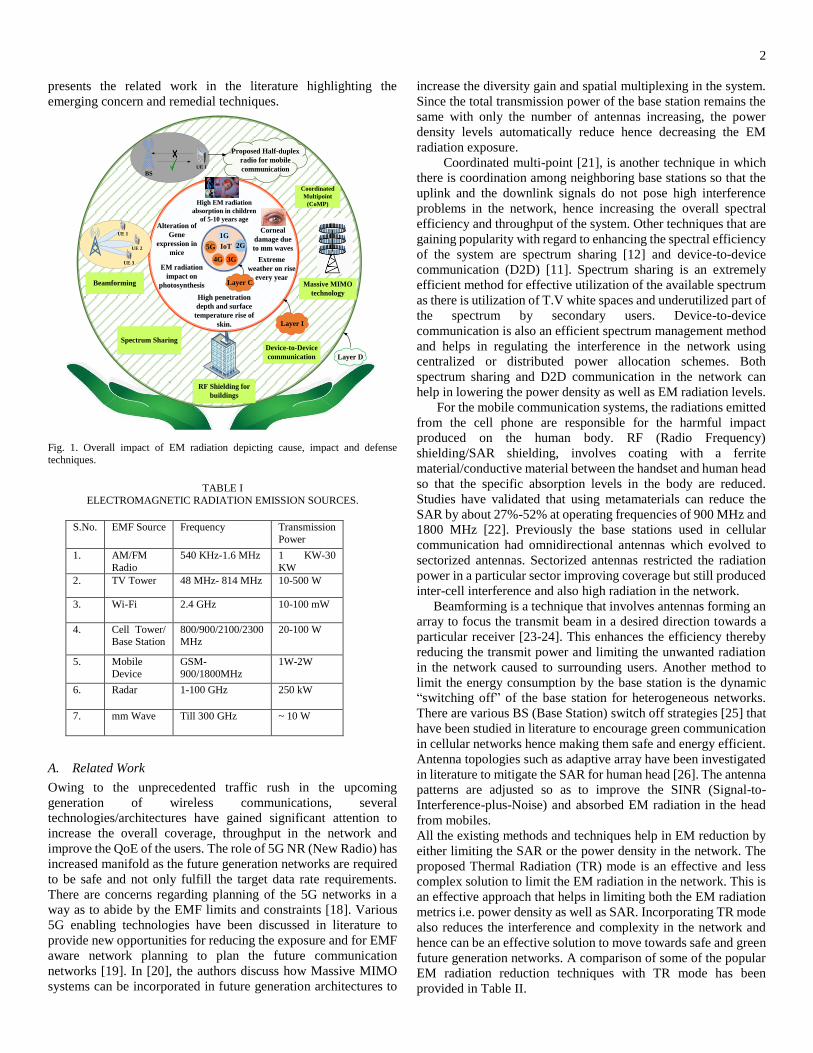
expected to rise even more in the near future [8]. Table I presents
the EM radiation emission sources along with the frequency of
operation and their transmission power. The adverse impacts from
the same are manifold. In humans the eyes, skin tissues, brain are
the most affected areas as they are under maximum exposure [9].
Radiation absorption by the eyes leads to corneal damage, the
effects on skin can be witnessed from radiation absorption by the
surface layer i.e. epidermis and by the underlying layer dermis.
This leads to heating of the tissues due to temperature rise and it
has also been validated that at high frequency of operation such as
mmWave the power density exposure to the human body is also
high [10].
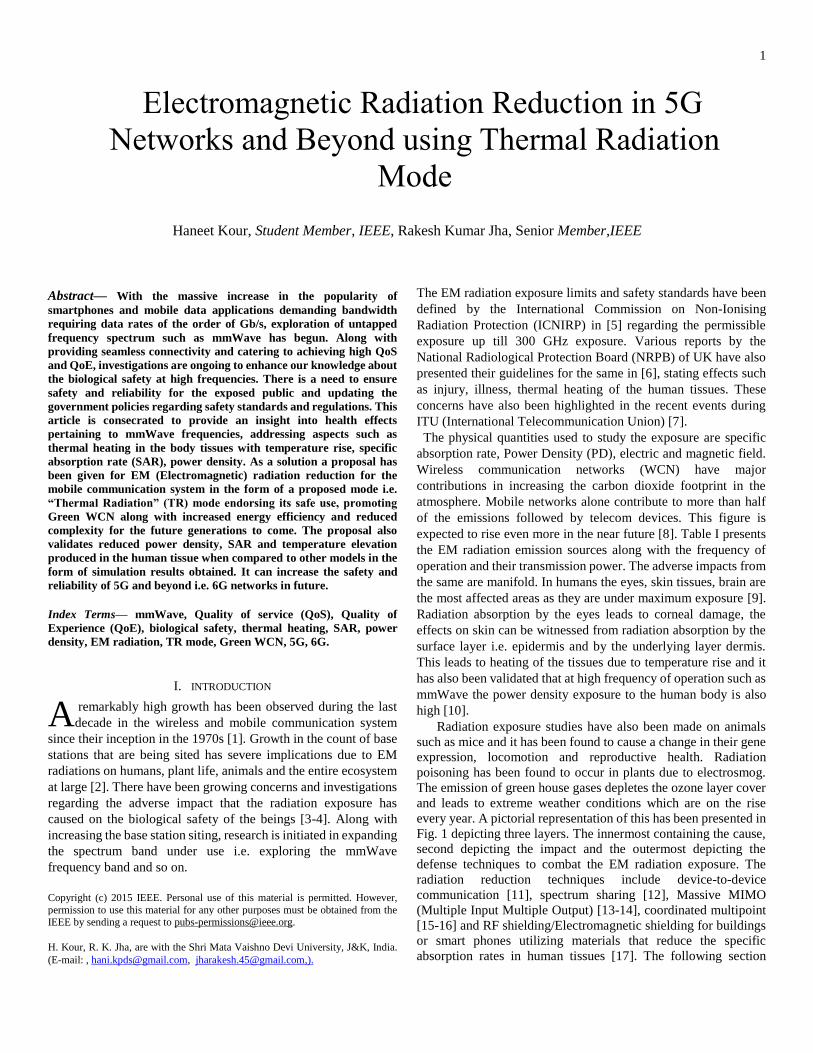
Radiation exposure studies have also been made on animals
such as mice and it has been found to cause a change in their gene
expression, locomotion and reproductive health. Radiation
poisoning has been found to occur in plants due to electrosmog.
The emission of green house gases depletes the ozone layer cover
and leads to extreme weather conditions which are on the rise
every year. A pictorial representation of this has been presented in
Fig. 1 depicting three layers. The innermost containing the cause,
second depicting the impact and the outermost depicting the
defense techniques to combat the EM radiation exposure. The
radiation reduction techniques include device-to-device
communication [11], spectrum sharing [12], Massive MIMO
(Multiple Input Multiple Output) [13-14], coordinated multipoint
[15-16] and RF shielding/Electromagnetic shielding for buildings
or smart phones utilizing materials that reduce the specific
absorption rates in human tissues [17]. The following section
Electromagnetic Radiation Reduction in 5G
Networks and Beyond using Thermal Radiation
Mode
Haneet Kour, Student Member, IEEE, Rakesh Kumar Jha, Senior Member,IEEE
A
2
presents the related work in the literature highlighting the
emerging concern and remedial techniques.
High penetration
depth and surface
temperature rise of
skin.
1G
3G
2G
4G
Corneal
damage due
to mm waves
High EM radiation
absorption in children
of 5-10 years ageAlteration of
Gene
expression in
miceExtreme
weather on rise
every year
EM radiation
impact on
photosynthesis Massive MIMO
technology
Spectrum SharingDevice-to-Device
communication
UE 1
UE 2
UE 3
Beamforming
Coordinated
Multipoint
(CoMP)
BSUE 1
Proposed Half-duplex
radio for mobile
communication
Layer C
Layer I
Layer D
IoT5G
RF Shielding for
buildings
Fig. 1. Overall impact of EM radiation depicting cause, impact and defense
techniques.
TABLE I
ELECTROMAGNETIC RADIATION EMISSION SOURCES.
S.No. EMF Source Frequency Transmission
Power
1. AM/FM
Radio
540 KHz-1.6 MHz 1 KW-30
KW
2. TV Tower 48 MHz- 814 MHz 10-500 W
3. Wi-Fi 2.4 GHz 10-100 mW
4. Cell Tower/ Base Station
800/900/2100/2300 MHz
20-100 W
5. Mobile
Device
GSM-
900/1800MHz
1W-2W
6. Radar 1-100 GHz 250 kW
7. mm Wave Till 300 GHz ~ 10 W
A. Related Work
Owing to the unprecedented traffic rush in the upcoming
generation of wireless communications, several
technologies/architectures have gained significant attention to
increase the overall coverage, throughput in the network and
improve the QoE of the users. The role of 5G NR (New Radio) has
increased manifold as the future generation networks are required
to be safe and not only fulfill the target data rate requirements.
There are concerns regarding planning of the 5G networks in a
way as to abide by the EMF limits and constraints [18]. Various
5G enabling technologies have been discussed in literature to
provide new opportunities for reducing the exposure and for EMF
aware network planning to plan the future communication
networks [19]. In [20], the authors discuss how Massive MIMO
systems can be incorporated in future generation architectures to
increase the diversity gain and spatial multiplexing in the system.
Since the total transmission power of the base station remains the
same with only the number of antennas increasing, the power
density levels automatically reduce hence decreasing the EM
radiation exposure.
Coordinated multi-point [21], is another technique in which
there is coordination among neighboring base stations so that the
uplink and the downlink signals do not pose high interference
problems in the network, hence increasing the overall spectral
efficiency and throughput of the system. Other techniques that are
gaining popularity with regard to enhancing the spectral efficiency
of the system are spectrum sharing [12] and device-to-device
communication (D2D) [11]. Spectrum sharing is an extremely
efficient method for effective utilization of the available spectrum
as there is utilization of T.V white spaces and underutilized part of
the spectrum by secondary users. Device-to-device
communication is also an efficient spectrum management method
and helps in regulating the interference in the network using
centralized or distributed power allocation schemes. Both
spectrum sharing and D2D communication in the network can
help in lowering the power density as well as EM radiation levels.
For the mobile communication systems, the radiations emitted
from the cell phone are responsible for the harmful impact
produced on the human body. RF (Radio Frequency)
shielding/SAR shielding, involves coating with a ferrite
material/conductive material between the handset and human head
so that the specific absorption levels in the body are reduced.
Studies have validated that using metamaterials can reduce the
SAR by about 27%-52% at operating frequencies of 900 MHz and
1800 MHz [22]. Previously the base stations used in cellular
communication had omnidirectional antennas which evolved to
sectorized antennas. Sectorized antennas restricted the radiation
power in a particular sector improving coverage but still produced
inter-cell interference and also high radiation in the network.
Beamforming is a technique that involves antennas forming an
array to focus the transmit beam in a desired direction towards a
particular receiver [23-24]. This enhances the efficiency thereby
reducing the transmit power and limiting the unwanted radiation
in the network caused to surrounding users. Another method to
limit the energy consumption by the base station is the dynamic
“switching off” of the base station for heterogeneous networks.
There are various BS (Base Station) switch off strategies [25] that
have been studied in literature to encourage green communication
in cellular networks hence making them safe and energy efficient.
Antenna topologies such as adaptive array have been investigated
in literature to mitigate the SAR for human head [26]. The antenna
patterns are adjusted so as to improve the SINR (Signal-to-
Interference-plus-Noise) and absorbed EM radiation in the head
from mobiles.
All the existing methods and techniques help in EM reduction by
either limiting the SAR or the power density in the network. The
proposed Thermal Radiation (TR) mode is an effective and less
complex solution to limit the EM radiation in the network. This is
an effective approach that helps in limiting both the EM radiation
metrics i.e. power density as well as SAR. Incorporating TR mode
also reduces the interference and complexity in the network and
hence can be an effective solution to move towards safe and green
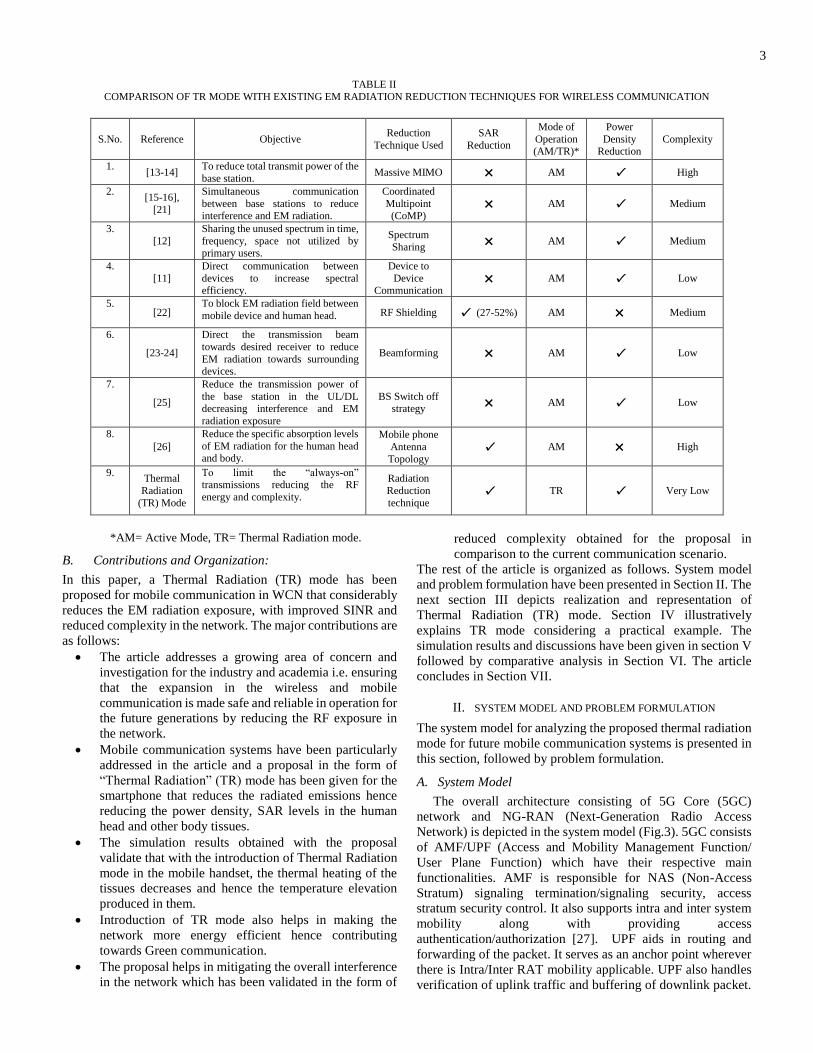
future generation networks. A comparison of some of the popular
EM radiation reduction techniques with TR mode has been
provided in Table II.
3
TABLE II
COMPARISON OF TR MODE WITH EXISTING EM RADIATION REDUCTION TECHNIQUES FOR WIRELESS COMMUNICATION
S.No. Reference Objective Reduction
Technique Used
SAR
Reduction
Mode of
Operation (AM/TR)*
Power
Density Reduction
Complexity
1. [13-14]
To reduce total transmit power of the
base station. Massive MIMO ✖ AM ✔ High
2. [15-16],
[21]
Simultaneous communication
between base stations to reduce interference and EM radiation.
Coordinated
Multipoint (CoMP)
✖ AM ✔ Medium
3.
[12]
Sharing the unused spectrum in time,
frequency, space not utilized by primary users.
Spectrum
Sharing ✖ AM ✔ Medium
4.
[11]
Direct communication between
devices to increase spectral efficiency.
Device to
Device Communication
✖ AM ✔ Low
5. [22]
To block EM radiation field between
mobile device and human head. RF Shielding ✔ (27-52%) AM ✖ Medium
6.
[23-24]
Direct the transmission beam
towards desired receiver to reduce
EM radiation towards surrounding devices.
Beamforming ✖ AM ✔ Low
7.
[25]
Reduce the transmission power of
the base station in the UL/DL decreasing interference and EM
radiation exposure
BS Switch off strategy
✖ AM ✔ Low
8.
[26]
Reduce the specific absorption levels
of EM radiation for the human head and body.
Mobile phone
Antenna
Topology ✔ AM ✖ High
9. Thermal
Radiation
(TR) Mode
To limit the “always-on” transmissions reducing the RF
energy and complexity.
Radiation
Reduction
technique ✔ TR ✔ Very Low
*AM= Active Mode, TR= Thermal Radiation mode.
B. Contributions and Organization:
In this paper, a Thermal Radiation (TR) mode has been
proposed for mobile communication in WCN that considerably
reduces the EM radiation exposure, with improved SINR and
reduced complexity in the network. The major contributions are
as follows:
The article addresses a growing area of concern and
investigation for the industry and academia i.e. ensuring
that the expansion in the wireless and mobile
communication is made safe and reliable in operation for
the future generations by reducing the RF exposure in
the network.
Mobile communication systems have been particularly
addressed in the article and a proposal in the form of
“Thermal Radiation” (TR) mode has been given for the
smartphone that reduces the radiated emissions hence
reducing the power density, SAR levels in the human
head and other body tissues.
The simulation results obtained with the proposal
validate that with the introduction of Thermal Radiation
mode in the mobile handset, the thermal heating of the
tissues decreases and hence the temperature elevation
produced in them.
Introduction of TR mode also helps in making the
network more energy efficient hence contributing
towards Green communication.
The proposal helps in mitigating the overall interference
in the network which has been validated in the form of
reduced complexity obtained for the proposal in
comparison to the current communication scenario.
The rest of the article is organized as follows. System model
and problem formulation have been presented in Section II. The
next section III depicts realization and representation of
Thermal Radiation (TR) mode. Section IV illustratively
explains TR mode considering a practical example. The
simulation results and discussions have been given in section V
followed by comparative analysis in Section VI. The article
concludes in Section VII.
II. SYSTEM MODEL AND PROBLEM FORMULATION
The system model for analyzing the proposed thermal radiation
mode for future mobile communication systems is presented in
this section, followed by problem formulation.
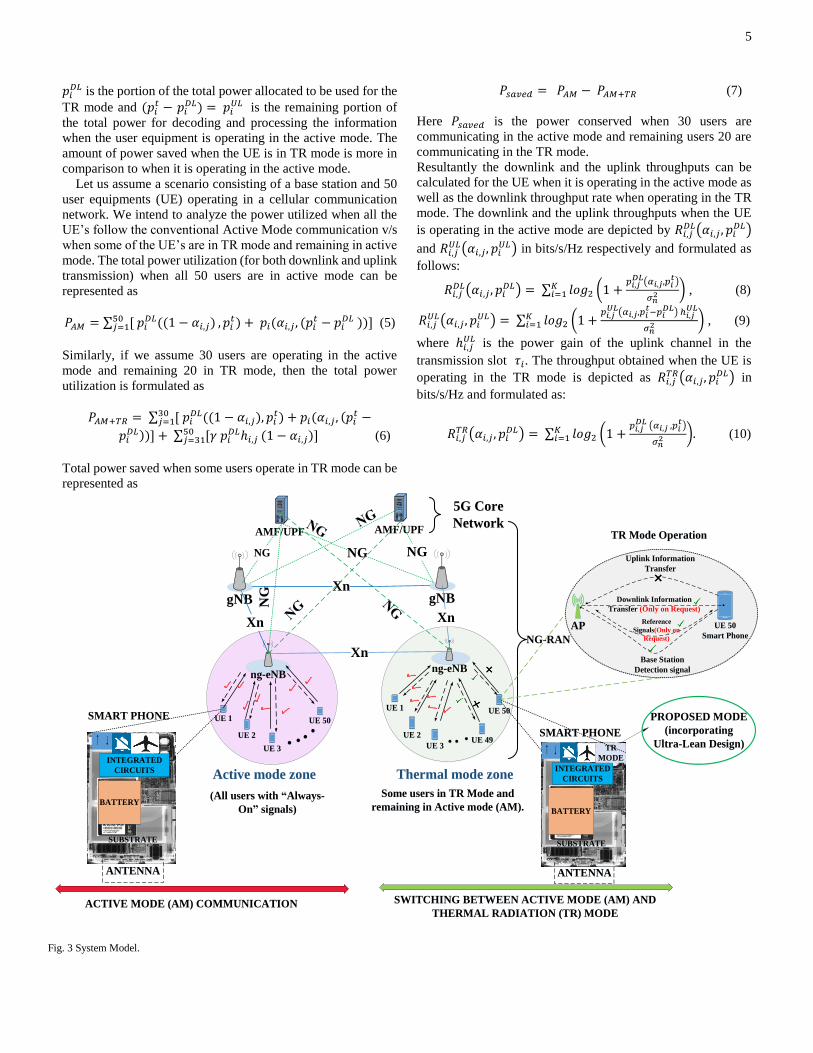
A. System Model
The overall architecture consisting of 5G Core (5GC)
network and NG-RAN (Next-Generation Radio Access
Network) is depicted in the system model (Fig.3). 5GC consists
of AMF/UPF (Access and Mobility Management Function/
User Plane Function) which have their respective main
functionalities. AMF is responsible for NAS (Non-Access
Stratum) signaling termination/signaling security, access
stratum security control. It also supports intra and inter system
mobility along with providing access
authentication/authorization [27]. UPF aids in routing and
forwarding of the packet. It serves as an anchor point wherever
there is Intra/Inter RAT mobility applicable. UPF also handles
verification of uplink traffic and buffering of downlink packet.
4
NG-RAN consists of NG-RAN nodes which is either a gNB or
an ng-eNB. A gNB provides the protocol termination of New
Radio user plane and control plane towards UE. An ng-eNB
provides the protocol termination of E-UTRA user and control
plane towards UE. Both the NG-RAN nodes are interconnected
through Xn interfaces. The NG-RAN nodes (gNB and ng-eNB)
are also connected to AMF by NG-C interface and to UPF by
NG-U interface.
Further we consider ng- eNB connected to user equipments
(UE’s) depicting two different cells. The UE’s are denoted as
(𝑈𝐸1,𝑈𝐸2, 𝑈𝐸3, , … … 𝑈𝐸50) in both the cells assuming 50 UE’s
in each cell. One of the cell consists of all the users
communicating in Active Mode (always-on links) and the other
cell consists of some users in TR mode and the remaining in
Active Mode. The cells are depicted by “Active mode zone”
and “Thermal mode zone” respectively. In the “Thermal mode
zone” we assume 30 users in AM mode and 20 users in TR
mode.
The channel statistics are assumed as Non-stationary and
wideband in nature considering Rayleigh fading distribution.
Since the received Signal-to-Noise ratio fluctuates rapidly due
to multipath, reflections, fading and so on, a non-stationary
channel assumption is made. Wideband channels are
considered to accommodate large bandwidth requiring
applications for 5G and beyond 5G communication scenario.
Wideband communication channels are suited for high
bandwidth applications with large data capacities, because
continuous data, voice and video applications have to be
transmitted and received.
Proof: The proof is given in Appendix A, Lemma 1. ∎
We consider a 5G NR transmission frame 𝑇𝑓 of 10ms
duration. The uplink transmissions take place by the user
equipments to the base station utilizing the allocated orthogonal
subcarriers. The frame is divided into subframes and further
into ʻ𝑀ʻ slots. The slots are designated as (𝜏1,𝜏2, 𝜏3, 𝜏4, … … 𝜏𝑀).
For a particular time slot the total power allocated by the base
station is depicted as 𝑝𝑖𝑡 = (𝑝𝑖,1
𝑡 , 𝑝𝑖,2𝑡 , 𝑝𝑖,3
𝑡 , … . 𝑝𝑖,𝐾𝑡 ) to ʻ𝐾ʻ user
equipments over the downlink orthogonal subcarriers using
OFDMA (Orthogonal Frequency Division Multiple Access)
scheme. The maximum power limit for each time slot is denoted
as 𝑃𝑚𝑎𝑥.
Every transmission frame 𝑇𝑓 has an average power constraint
𝑃𝑎𝑣𝑔 for each frame. The above two constraints can be depicted
as
∑ 𝑝𝑖,𝑗𝑡 𝐾
𝑗=1 ≤ 𝑃𝑚𝑎𝑥 , 𝑖 = 1,2 … … … 𝑀 (1)
∑ ∑ 𝑝𝑖,𝑗𝑡𝐾
𝑗=1𝑀𝑖=1 ≤ 𝑀𝑃𝑎𝑣𝑔 (2)
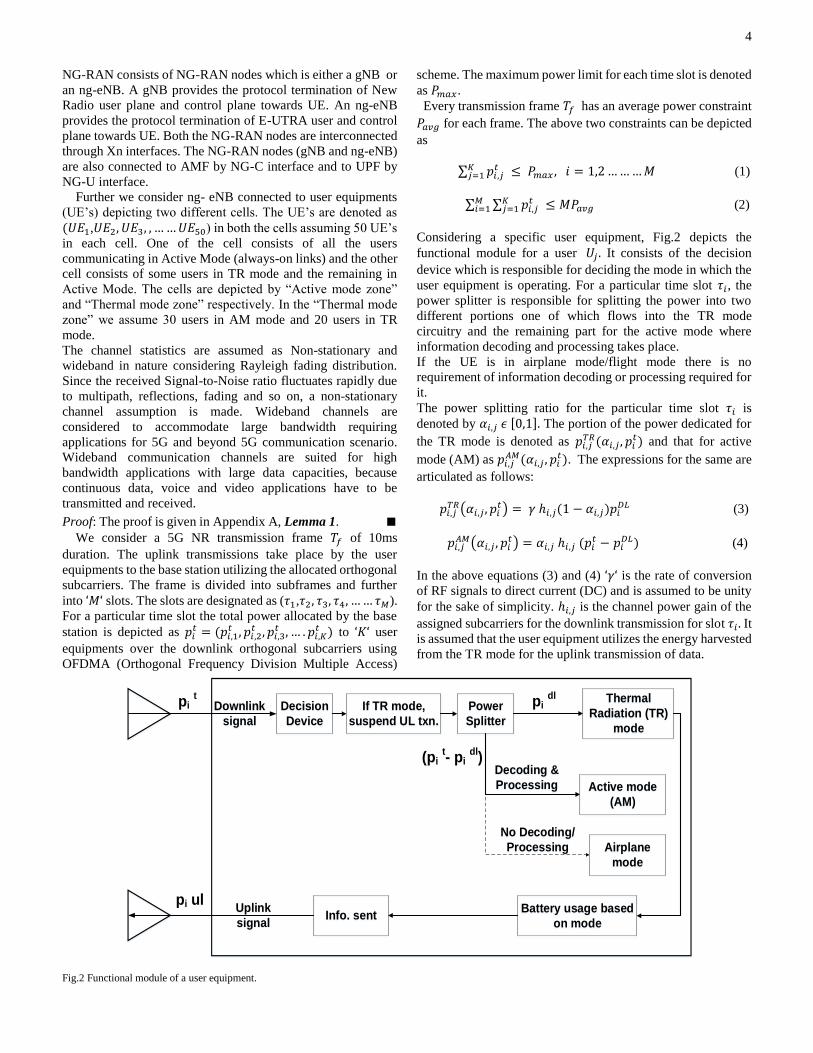
Considering a specific user equipment, Fig.2 depicts the
functional module for a user 𝑈𝑗 . It consists of the decision
device which is responsible for deciding the mode in which the
user equipment is operating. For a particular time slot 𝜏𝑖, the
power splitter is responsible for splitting the power into two
different portions one of which flows into the TR mode
circuitry and the remaining part for the active mode where
information decoding and processing takes place.
If the UE is in airplane mode/flight mode there is no
requirement of information decoding or processing required for
it.
The power splitting ratio for the particular time slot 𝜏𝑖 is
denoted by 𝛼𝑖,𝑗 𝜖 [0,1]. The portion of the power dedicated for
the TR mode is denoted as 𝑝𝑖,𝑗𝑇𝑅(𝛼𝑖,𝑗 , 𝑝𝑖
𝑡) and that for active
mode (AM) as 𝑝𝑖,𝑗𝐴𝑀(𝛼𝑖,𝑗 , 𝑝𝑖
𝑡). The expressions for the same are
articulated as follows:
𝑝𝑖,𝑗𝑇𝑅(𝛼𝑖,𝑗, 𝑝𝑖
𝑡) = 𝛾 ℎ𝑖,𝑗(1 − 𝛼𝑖,𝑗)𝑝𝑖𝐷𝐿 (3)
𝑝𝑖,𝑗𝐴𝑀(𝛼𝑖,𝑗 , 𝑝𝑖
𝑡) = 𝛼𝑖,𝑗 ℎ𝑖,𝑗 (𝑝𝑖𝑡 − 𝑝𝑖
𝐷𝐿) (4)
In the above equations (3) and (4) ʻ𝛾ʻ is the rate of conversion
of RF signals to direct current (DC) and is assumed to be unity
for the sake of simplicity. ℎ𝑖,𝑗 is the channel power gain of the
assigned subcarriers for the downlink transmission for slot 𝜏𝑖 . It is assumed that the user equipment utilizes the energy harvested
from the TR mode for the uplink transmission of data.
Decision
Device
Downlink
signal
Power
Splitter
Thermal
Radiation (TR)
mode
Active mode
(AM)
Airplane
mode
Battery usage based
on modeInfo. sent
No Decoding/
Processing
Uplink
signal
pi t pi
dl
(pi t- pi
dl)
Decoding &
Processing
If TR mode,
suspend UL txn.
pi ul
Fig.2 Functional module of a user equipment.
5
𝑝𝑖𝐷𝐿 is the portion of the total power allocated to be used for the
TR mode and (𝑝𝑖𝑡 − 𝑝𝑖
𝐷𝐿) = 𝑝𝑖𝑈𝐿 is the remaining portion of
the total power for decoding and processing the information
when the user equipment is operating in the active mode. The
amount of power saved when the UE is in TR mode is more in
comparison to when it is operating in the active mode.
Let us assume a scenario consisting of a base station and 50
user equipments (UE) operating in a cellular communication
network. We intend to analyze the power utilized when all the
UE’s follow the conventional Active Mode communication v/s
when some of the UE’s are in TR mode and remaining in active
mode. The total power utilization (for both downlink and uplink
transmission) when all 50 users are in active mode can be
represented as
𝑃𝐴𝑀 = ∑ [ 𝑝𝑖𝐷𝐿((1 − 𝛼𝑖,𝑗)50
𝑗=1 , 𝑝𝑖𝑡) + 𝑝𝑖(𝛼𝑖,𝑗 , (𝑝𝑖
𝑡 − 𝑝𝑖𝐷𝐿 ))] (5)
Similarly, if we assume 30 users are operating in the active
mode and remaining 20 in TR mode, then the total power
utilization is formulated as
𝑃𝐴𝑀+𝑇𝑅 = ∑ [ 𝑝𝑖𝐷𝐿((1 − 𝛼𝑖,𝑗
30𝑗=1 ), 𝑝𝑖
𝑡) + 𝑝𝑖(𝛼𝑖,𝑗 , (𝑝𝑖𝑡 −
𝑝𝑖𝐷𝐿))] + ∑ [𝛾 𝑝𝑖
𝐷𝐿ℎ𝑖,𝑗50𝑗=31 (1 − 𝛼𝑖,𝑗)] (6)
Total power saved when some users operate in TR mode can be
represented as
𝑃𝑠𝑎𝑣𝑒𝑑 = 𝑃𝐴𝑀 − 𝑃𝐴𝑀+𝑇𝑅 (7)
Here 𝑃𝑠𝑎𝑣𝑒𝑑 is the power conserved when 30 users are
communicating in the active mode and remaining users 20 are
communicating in the TR mode.
Resultantly the downlink and the uplink throughputs can be
calculated for the UE when it is operating in the active mode as
well as the downlink throughput rate when operating in the TR
mode. The downlink and the uplink throughputs when the UE
is operating in the active mode are depicted by 𝑅𝑖,𝑗𝐷𝐿(𝛼𝑖,𝑗 , 𝑝𝑖
𝐷𝐿)
and 𝑅𝑖,𝑗𝑈𝐿(𝛼𝑖,𝑗, 𝑝𝑖
𝑈𝐿) in bits/s/Hz respectively and formulated as
follows:
𝑅𝑖,𝑗𝐷𝐿(𝛼𝑖,𝑗 , 𝑝𝑖
𝐷𝐿) = ∑ 𝑙𝑜𝑔2𝐾𝑖=1 (1 +
𝑝𝑖,𝑗𝐷𝐿(𝛼𝑖,𝑗,𝑝𝑖
𝑡)
𝜎𝑛2 ) , (8)
𝑅𝑖,𝑗𝑈𝐿(𝛼𝑖,𝑗 , 𝑝𝑖
𝑈𝐿) = ∑ 𝑙𝑜𝑔2𝐾𝑖=1 (1 +
𝑝𝑖,𝑗𝑈𝐿(𝛼𝑖,𝑗,𝑝𝑖
𝑡−𝑝𝑖𝐷𝐿) ℎ𝑖,𝑗
𝑈𝐿
𝜎𝑛2 ) , (9)
where ℎ𝑖,𝑗𝑈𝐿 is the power gain of the uplink channel in the
transmission slot 𝜏𝑖. The throughput obtained when the UE is
operating in the TR mode is depicted as 𝑅𝑖,𝑗𝑇𝑅(𝛼𝑖,𝑗, 𝑝𝑖
𝐷𝐿) in
bits/s/Hz and formulated as:
𝑅𝑖,𝑗𝑇𝑅(𝛼𝑖,𝑗 , 𝑝𝑖
𝐷𝐿) = ∑ 𝑙𝑜𝑔2𝐾𝑖=1 (1 +
𝑝𝑖,𝑗𝐷𝐿 (𝛼𝑖,𝑗 ,𝑝𝑖
𝑡)
𝜎𝑛2 ). (10)
AMF/UPF AMF/UPF
gNB gNBXn
Xn
NG NG
UE 1
UE 2
UE 3
ng-eNB
NG
NG
(All users with Always-
On signals)
Some users in TR Mode and
remaining in Active mode (AM).
UE 50
UE 2
UE 1
ng-eNB
Xn
Xn
5G Core
Network
NG-RAN
Active mode zone Thermal mode zone
UE 50
UE 3UE 49
INTEGRATED
CIRCUITS
BATTERY
SUBSTRATE
ANTENNA
SMART PHONE
ACTIVE MODE (AM) COMMUNICATION SWITCHING BETWEEN ACTIVE MODE (AM) AND
THERMAL RADIATION (TR) MODE
INTEGRATED
CIRCUITS
BATTERY
SUBSTRATE
ANTENNA
SMART PHONE
TR
MODE
PROPOSED MODE
(incorporating
Ultra-Lean Design)
UE 50
Smart Phone
Downlink Information
Transfer (Only on Request)
Reference
Signals(Only on
Request)
Uplink Information
Transfer
Base Station
Detection signal
AP
TR Mode Operation
Fig. 3 System Model.
6
Proposition 1: The UE’s communicating in the TR mode utilize
a small portion of the total power as the uplink transmissions
are suspended. The specific absorption rate (SAR) in case of
UE’s in TR mode reduces as the body tissue is now exposed to
low radiation power. SAR for the device in TR mode can be
formulated as
𝑆𝐴𝑅𝑇𝑅 = 𝑝𝑖
𝐷𝐿
𝑀 , (11)
where 𝑝𝑖𝐷𝐿 is the radiation power to which the tissue is exposed
for a device in TR mode and 𝑀 is the mass of the tissue in Kg.
The value of 𝑆𝐴𝑅𝑇𝑅 is lower than that of a device
communicating in the Active (AM) mode, as we have both
uplink and downlink powers contributing to the total SAR
encountered i.e.
𝑆𝐴𝑅𝐴𝑀 =(𝑝𝑖
𝑡− 𝑝𝑖𝐷𝐿)
𝑀 . (12)
in case of AM mode which is a much higher value than 𝑆𝐴𝑅𝑇𝑅
as the former consists of both uplink and downlink powers
contributing to the total SAR.
Proposition 2: For the cell having all the active users
communicating in Active mode, both uplink and downlink
signals contribute to the power density levels in the atmosphere.
The devices in TR mode only have downlink signals active and
the uplink transmissions are suspended. Hence, the far-field
radiation density is lower in the cell where some users are
operating in the TR mode. The Power Density (PD) radiated at
ʻ𝑑ʻ distance from the radiating antenna can be expressed as
𝑃𝐷 = 𝐺𝑡𝑟 𝑃𝑇
4𝜋𝑑2 (13)
where 𝐺𝑡𝑟 is the gain of the transmit antenna, 𝑃𝑇 is the total
input power to the transmit antenna and ʻ𝑑ʻ is the distance from
the radiating source. In TR mode the power density (𝑃𝑇𝑅) to
which the body tissue is exposed is lower than the power
density value for the cell consisting of all users in Active mode
(𝑃𝐴𝑀).
B. Problem Formulation
The proposal aims to minimize the EM radiation exposure by
reducing the power density levels, specific absorption rate and
the temperature elevation produced in the tissues due to high
SAR maintaining high quality of service and experience of the
users. We also aim to maximize SINR and reduce the overall
complexity of the network.
The optimization problem can be formulated as follows:
Max 𝑅𝑖,𝑗𝑇𝑅(𝛼𝑖,𝑗, 𝑝𝑖
𝐷𝐿) (14)
s.t.
𝑆(𝑥) 𝑖. 𝑒 ∑ 𝑆𝐴𝑅𝐴𝑀 + ∑ 𝑆𝐴𝑅𝑇𝑅 < ∑ 𝑆𝐴𝑅𝐴𝑀50𝑗=1 50
𝑗=3130𝑗=1 (14(a))
𝑃𝐷 = ∑ 𝑃𝐷𝐴𝑀 + ∑ 𝑃𝐷𝑇𝑅50𝑗=31
30𝑗=1 < ∑ 𝑃𝐷𝐴𝑀
50𝑗=1 (14(b))
Constraint (14(a)) ensures that when all the considered users
(here 50) are operating in Active mode then the specific
absorption rate obtained collaboratively for all the active users
is higher than that obtained for the cell where some users
operate in Active mode (30) and remaining (20) in TR mode.
Constraint (14(b)) ensures that the power density values when
all the communicating users in the cell follow Active mode of
communication is much higher than that obtained in the
“thermal mode zone” where not all users are operating in AM
mode. In the TR mode due to suspension of uplink signals the
radiated power density reduces considerably when some users
operate in Active mode and some in TR mode.
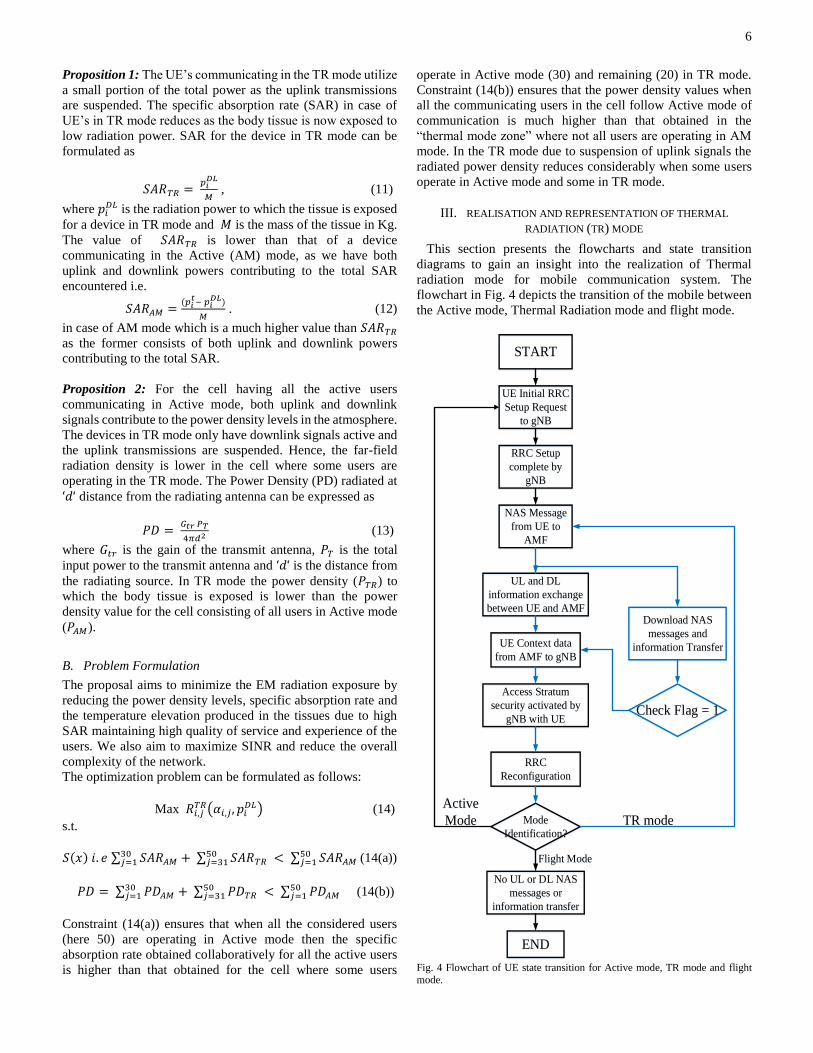
III. REALISATION AND REPRESENTATION OF THERMAL
RADIATION (TR) MODE
This section presents the flowcharts and state transition
diagrams to gain an insight into the realization of Thermal
radiation mode for mobile communication system. The
flowchart in Fig. 4 depicts the transition of the mobile between
the Active mode, Thermal Radiation mode and flight mode.
START
UE Initial RRC
Setup Request
to gNB
RRC Setup
complete by
gNB
NAS Message
from UE to
AMF
UL and DL
information exchange
between UE and AMF
UE Context data
from AMF to gNB
Access Stratum
security activated by
gNB with UE
RRC
Reconfiguration
Mode
Identification?
No UL or DL NAS
messages or
information transfer
END
Download NAS
messages and
information Transfer
Check Flag = 1
Active
Mode
Flight Mode
TR mode
Fig. 4 Flowchart of UE state transition for Active mode, TR mode and flight
mode.
7
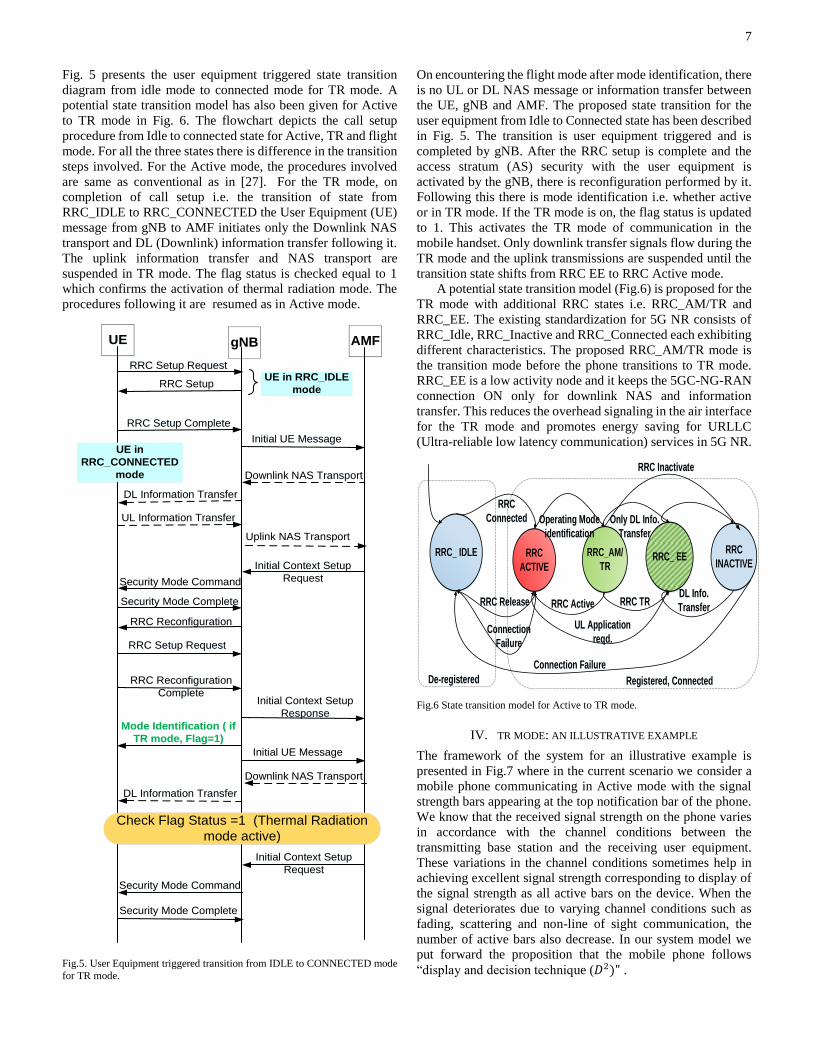
Fig. 5 presents the user equipment triggered state transition
diagram from idle mode to connected mode for TR mode. A
potential state transition model has also been given for Active
to TR mode in Fig. 6. The flowchart depicts the call setup
procedure from Idle to connected state for Active, TR and flight
mode. For all the three states there is difference in the transition
steps involved. For the Active mode, the procedures involved
are same as conventional as in [27]. For the TR mode, on
completion of call setup i.e. the transition of state from
RRC_IDLE to RRC_CONNECTED the User Equipment (UE)
message from gNB to AMF initiates only the Downlink NAS
transport and DL (Downlink) information transfer following it.
The uplink information transfer and NAS transport are
suspended in TR mode. The flag status is checked equal to 1
which confirms the activation of thermal radiation mode. The
procedures following it are resumed as in Active mode.
UE gNB AMF
RRC Setup Request
RRC Setup
RRC Setup Complete
Initial UE Message
Downlink NAS Transport
DL Information Transfer
Initial Context Setup
RequestSecurity Mode Command
Security Mode Complete
RRC Reconfiguration
RRC Reconfiguration
CompleteInitial Context Setup
Response
RRC Setup Request
Downlink NAS Transport
DL Information Transfer
Initial Context Setup
Request
Security Mode Command
Security Mode Complete
UL Information Transfer
Uplink NAS Transport
Mode Identification ( if
TR mode, Flag=1)
Initial UE Message
Check Flag Status =1 (Thermal Radiation
mode active)
UE in RRC_IDLE
mode
UE in
RRC_CONNECTED
mode
Fig.5. User Equipment triggered transition from IDLE to CONNECTED mode
for TR mode.
On encountering the flight mode after mode identification, there
is no UL or DL NAS message or information transfer between
the UE, gNB and AMF. The proposed state transition for the
user equipment from Idle to Connected state has been described
in Fig. 5. The transition is user equipment triggered and is
completed by gNB. After the RRC setup is complete and the
access stratum (AS) security with the user equipment is
activated by the gNB, there is reconfiguration performed by it.
Following this there is mode identification i.e. whether active
or in TR mode. If the TR mode is on, the flag status is updated
to 1. This activates the TR mode of communication in the
mobile handset. Only downlink transfer signals flow during the
TR mode and the uplink transmissions are suspended until the
transition state shifts from RRC EE to RRC Active mode.
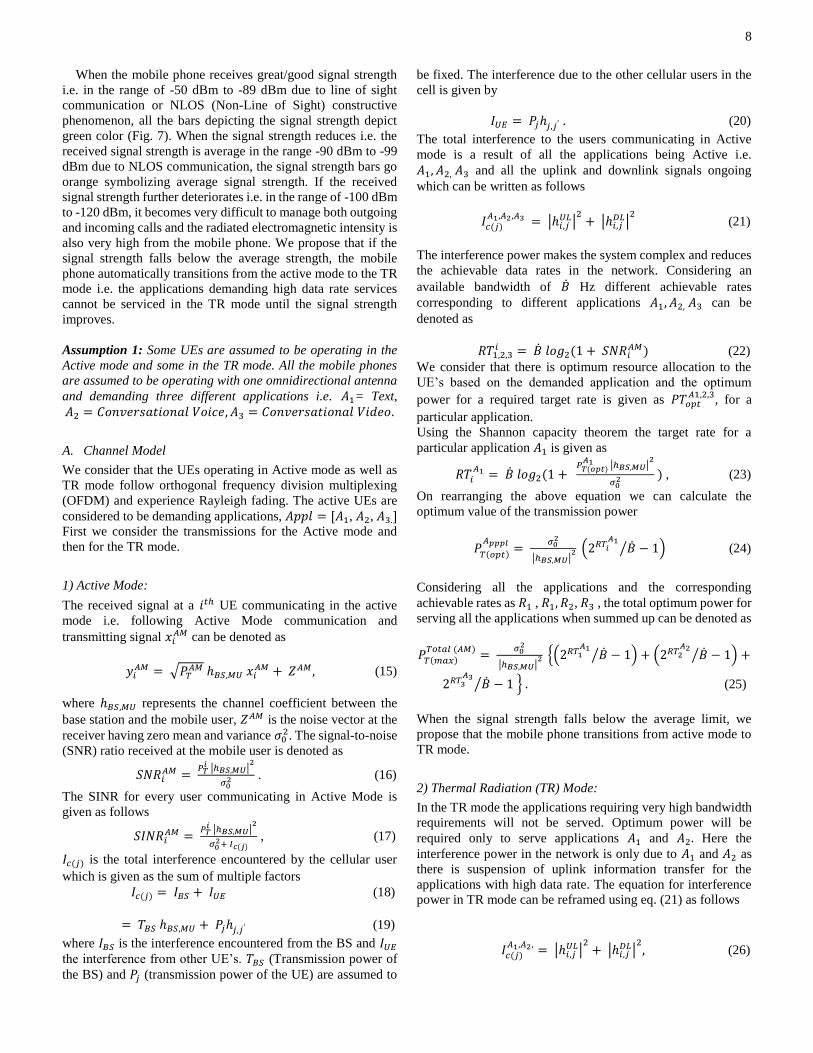
A potential state transition model (Fig.6) is proposed for the
TR mode with additional RRC states i.e. RRC_AM/TR and
RRC_EE. The existing standardization for 5G NR consists of
RRC_Idle, RRC_Inactive and RRC_Connected each exhibiting
different characteristics. The proposed RRC_AM/TR mode is
the transition mode before the phone transitions to TR mode.
RRC_EE is a low activity node and it keeps the 5GC-NG-RAN
connection ON only for downlink NAS and information
transfer. This reduces the overhead signaling in the air interface
for the TR mode and promotes energy saving for URLLC
(Ultra-reliable low latency communication) services in 5G NR.
RRC_ IDLE RRC
ACTIVERRC_ EE
RRC
INACTIVE
Connection Failure
RRC Inactivate
DL Info.
Transfer
RRC_AM/
TR
RRC
Connected
RRC Release
Connection
Failure
De-registered Registered, Connected
Only DL Info.
Transfer
UL Application
reqd.
Operating Mode
identification
RRC Active RRC TR
Fig.6 State transition model for Active to TR mode.
IV. TR MODE: AN ILLUSTRATIVE EXAMPLE
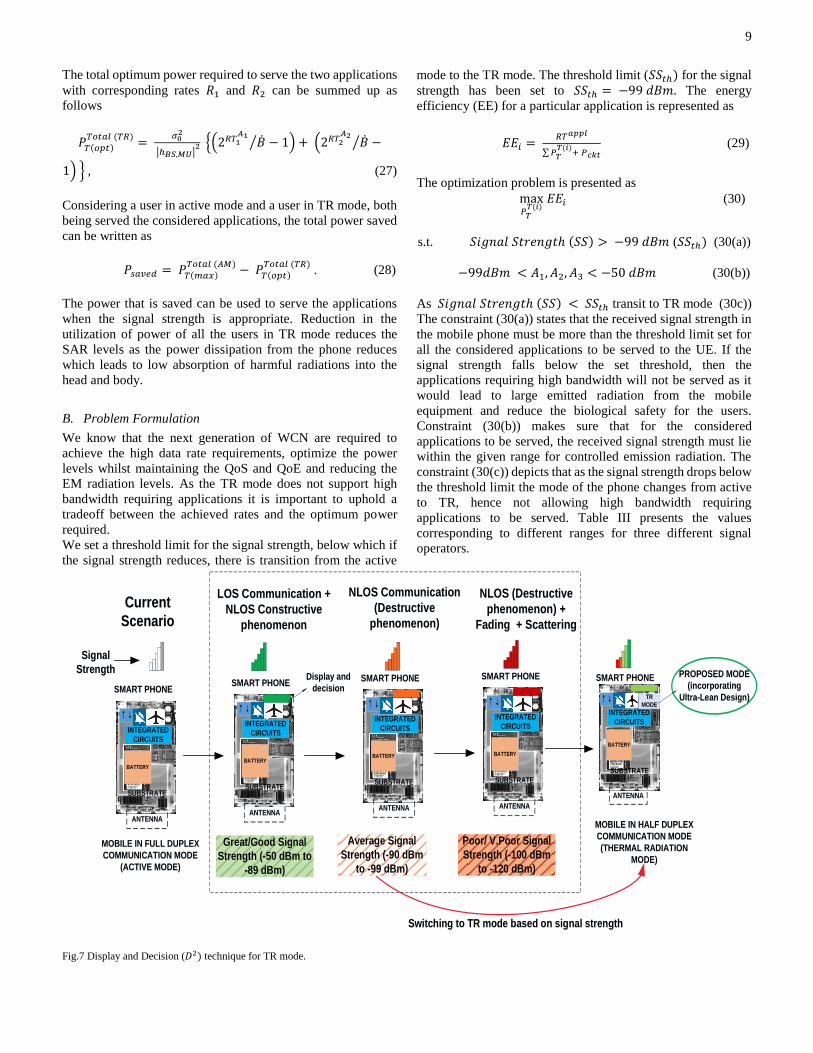
The framework of the system for an illustrative example is
presented in Fig.7 where in the current scenario we consider a
mobile phone communicating in Active mode with the signal
strength bars appearing at the top notification bar of the phone.
We know that the received signal strength on the phone varies
in accordance with the channel conditions between the
transmitting base station and the receiving user equipment.
These variations in the channel conditions sometimes help in
achieving excellent signal strength corresponding to display of
the signal strength as all active bars on the device. When the
signal deteriorates due to varying channel conditions such as
fading, scattering and non-line of sight communication, the
number of active bars also decrease. In our system model we
put forward the proposition that the mobile phone follows
“display and decision technique (𝐷2)" .
8
When the mobile phone receives great/good signal strength
i.e. in the range of -50 dBm to -89 dBm due to line of sight
communication or NLOS (Non-Line of Sight) constructive
phenomenon, all the bars depicting the signal strength depict
green color (Fig. 7). When the signal strength reduces i.e. the
received signal strength is average in the range -90 dBm to -99
dBm due to NLOS communication, the signal strength bars go
orange symbolizing average signal strength. If the received
signal strength further deteriorates i.e. in the range of -100 dBm
to -120 dBm, it becomes very difficult to manage both outgoing
and incoming calls and the radiated electromagnetic intensity is
also very high from the mobile phone. We propose that if the
signal strength falls below the average strength, the mobile
phone automatically transitions from the active mode to the TR
mode i.e. the applications demanding high data rate services
cannot be serviced in the TR mode until the signal strength
improves.
Assumption 1: Some UEs are assumed to be operating in the
Active mode and some in the TR mode. All the mobile phones
are assumed to be operating with one omnidirectional antenna
and demanding three different applications i.e. 𝐴1= Text,
𝐴2 = 𝐶𝑜𝑛𝑣𝑒𝑟𝑠𝑎𝑡𝑖𝑜𝑛𝑎𝑙 𝑉𝑜𝑖𝑐𝑒, 𝐴3 = 𝐶𝑜𝑛𝑣𝑒𝑟𝑠𝑎𝑡𝑖𝑜𝑛𝑎𝑙 𝑉𝑖𝑑𝑒𝑜.
A. Channel Model
We consider that the UEs operating in Active mode as well as
TR mode follow orthogonal frequency division multiplexing
(OFDM) and experience Rayleigh fading. The active UEs are
considered to be demanding applications, 𝐴𝑝𝑝𝑙 = [𝐴1, 𝐴2, 𝐴3.] First we consider the transmissions for the Active mode and
then for the TR mode.
1) Active Mode:
The received signal at a 𝑖𝑡ℎ UE communicating in the active
mode i.e. following Active Mode communication and
transmitting signal 𝑥𝑖𝐴𝑀 can be denoted as
𝑦𝑖𝐴𝑀 = √𝑃𝑇
𝐴𝑀 ℎ𝐵𝑆,𝑀𝑈 𝑥𝑖𝐴𝑀 + 𝑍𝐴𝑀 , (15)
where ℎ𝐵𝑆,𝑀𝑈 represents the channel coefficient between the
base station and the mobile user, 𝑍𝐴𝑀 is the noise vector at the
receiver having zero mean and variance 𝜎02. The signal-to-noise
(SNR) ratio received at the mobile user is denoted as
𝑆𝑁𝑅𝑖𝐴𝑀 =
𝑃𝑇𝑖 |ℎ𝐵𝑆,𝑀𝑈|
2
𝜎02 . (16)
The SINR for every user communicating in Active Mode is
given as follows
𝑆𝐼𝑁𝑅𝑖𝐴𝑀 =
𝑃𝑇𝑖 |ℎ𝐵𝑆,𝑀𝑈|
2
𝜎02+ 𝐼𝑐(𝑗)
, (17)
𝐼𝑐(𝑗) is the total interference encountered by the cellular user
which is given as the sum of multiple factors
𝐼𝑐(𝑗) = 𝐼𝐵𝑆 + 𝐼𝑈𝐸 (18)
= 𝑇𝐵𝑆 ℎ𝐵𝑆,𝑀𝑈 + 𝑃𝑗ℎ𝑗,𝑗ʻ (19)
where 𝐼𝐵𝑆 is the interference encountered from the BS and 𝐼𝑈𝐸
the interference from other UE’s. 𝑇𝐵𝑆 (Transmission power of
the BS) and 𝑃𝑗 (transmission power of the UE) are assumed to
be fixed. The interference due to the other cellular users in the
cell is given by
𝐼𝑈𝐸 = 𝑃𝑗ℎ𝑗,𝑗ʻ . (20)
The total interference to the users communicating in Active
mode is a result of all the applications being Active i.e.
𝐴1, 𝐴2, 𝐴3 and all the uplink and downlink signals ongoing
which can be written as follows
𝐼𝑐(𝑗)𝐴1,𝐴2,𝐴3
= |ℎ𝑖,𝑗𝑈𝐿|
2+ |ℎ𝑖,𝑗
𝐷𝐿|2
(21)
The interference power makes the system complex and reduces
the achievable data rates in the network. Considering an
available bandwidth of �̇� Hz different achievable rates
corresponding to different applications 𝐴1, 𝐴2, 𝐴3 can be
denoted as
𝑅𝑇1,2,3𝑖 = �̇� 𝑙𝑜𝑔2(1 + 𝑆𝑁𝑅𝑖
𝐴𝑀) (22)
We consider that there is optimum resource allocation to the
UE’s based on the demanded application and the optimum
power for a required target rate is given as 𝑃𝑇𝑜𝑝𝑡𝐴1,2,3
, for a
particular application.
Using the Shannon capacity theorem the target rate for a
particular application 𝐴1 is given as
𝑅𝑇𝑖𝐴1 = �̇� 𝑙𝑜𝑔2(1 +
𝑃𝑇(𝑜𝑝𝑡)𝐴1 |ℎ𝐵𝑆,𝑀𝑈|
2
𝜎02 ) , (23)
On rearranging the above equation we can calculate the
optimum value of the transmission power
𝑃𝑇(𝑜𝑝𝑡)
𝐴𝑝𝑝𝑝𝑙=
𝜎02
|ℎ𝐵𝑆,𝑀𝑈|2 (2𝑅𝑇𝑖
𝐴1�̇�⁄ − 1) (24)
Considering all the applications and the corresponding
achievable rates as 𝑅1 , 𝑅1, 𝑅2, 𝑅3 , the total optimum power for
serving all the applications when summed up can be denoted as
𝑃𝑇(𝑚𝑎𝑥)𝑇𝑜𝑡𝑎𝑙 (𝐴𝑀)
= 𝜎0
2
|ℎ𝐵𝑆,𝑀𝑈|2 {(2𝑅𝑇1
𝐴1�̇�⁄ − 1) + (2𝑅𝑇2
𝐴2�̇�⁄ − 1) +
2𝑅𝑇3𝐴3
�̇�⁄ − 1 } . (25)
When the signal strength falls below the average limit, we
propose that the mobile phone transitions from active mode to
TR mode.
2) Thermal Radiation (TR) Mode:
In the TR mode the applications requiring very high bandwidth
requirements will not be served. Optimum power will be
required only to serve applications 𝐴1 and 𝐴2. Here the
interference power in the network is only due to 𝐴1 and 𝐴2 as
there is suspension of uplink information transfer for the
applications with high data rate. The equation for interference
power in TR mode can be reframed using eq. (21) as follows
𝐼𝑐(𝑗)𝐴1,𝐴2,
= |ℎ𝑖,𝑗𝑈𝐿|
2+ |ℎ𝑖,𝑗
𝐷𝐿|2
, (26)
9
The total optimum power required to serve the two applications
with corresponding rates 𝑅1 and 𝑅2 can be summed up as
follows
𝑃𝑇(𝑜𝑝𝑡)𝑇𝑜𝑡𝑎𝑙 (𝑇𝑅)
= 𝜎0
2
|ℎ𝐵𝑆,𝑀𝑈|2 {(2𝑅𝑇1
𝐴1�̇�⁄ − 1) + (2𝑅𝑇2
𝐴2�̇�⁄ −
1) } , (27)
Considering a user in active mode and a user in TR mode, both
being served the considered applications, the total power saved
can be written as
𝑃𝑠𝑎𝑣𝑒𝑑 = 𝑃𝑇(𝑚𝑎𝑥)𝑇𝑜𝑡𝑎𝑙 (𝐴𝑀)
− 𝑃𝑇(𝑜𝑝𝑡)𝑇𝑜𝑡𝑎𝑙 (𝑇𝑅)
. (28)
The power that is saved can be used to serve the applications
when the signal strength is appropriate. Reduction in the
utilization of power of all the users in TR mode reduces the
SAR levels as the power dissipation from the phone reduces
which leads to low absorption of harmful radiations into the
head and body.
B. Problem Formulation
We know that the next generation of WCN are required to
achieve the high data rate requirements, optimize the power
levels whilst maintaining the QoS and QoE and reducing the
EM radiation levels. As the TR mode does not support high
bandwidth requiring applications it is important to uphold a
tradeoff between the achieved rates and the optimum power
required.
We set a threshold limit for the signal strength, below which if
the signal strength reduces, there is transition from the active
mode to the TR mode. The threshold limit (𝑆𝑆𝑡ℎ) for the signal
strength has been set to 𝑆𝑆𝑡ℎ = −99 𝑑𝐵𝑚. The energy
efficiency (EE) for a particular application is represented as
𝐸𝐸𝑖 = 𝑅𝑇𝑎𝑝𝑝𝑙
∑ 𝑃𝑇𝑇(𝑖)
+ 𝑃𝑐𝑘𝑡
(29)
The optimization problem is presented as
max𝑃𝑇
𝑇(𝑖) 𝐸𝐸𝑖 (30)
s.t. 𝑆𝑖𝑔𝑛𝑎𝑙 𝑆𝑡𝑟𝑒𝑛𝑔𝑡ℎ (𝑆𝑆) > −99 𝑑𝐵𝑚 (𝑆𝑆𝑡ℎ) (30(a))
−99𝑑𝐵𝑚 < 𝐴1, 𝐴2, 𝐴3 < −50 𝑑𝐵𝑚 (30(b))
As 𝑆𝑖𝑔𝑛𝑎𝑙 𝑆𝑡𝑟𝑒𝑛𝑔𝑡ℎ (𝑆𝑆) < 𝑆𝑆𝑡ℎ transit to TR mode (30c))
The constraint (30(a)) states that the received signal strength in
the mobile phone must be more than the threshold limit set for
all the considered applications to be served to the UE. If the
signal strength falls below the set threshold, then the
applications requiring high bandwidth will not be served as it
would lead to large emitted radiation from the mobile
equipment and reduce the biological safety for the users.
Constraint (30(b)) makes sure that for the considered
applications to be served, the received signal strength must lie
within the given range for controlled emission radiation. The
constraint (30(c)) depicts that as the signal strength drops below
the threshold limit the mode of the phone changes from active
to TR, hence not allowing high bandwidth requiring
applications to be served. Table III presents the values
corresponding to different ranges for three different signal
operators.
INTEGRATED
CIRCUITS
BATTERY
SUBSTRATE
ANTENNA
SMART PHONE
MOBILE IN FULL DUPLEX
COMMUNICATION MODE
(ACTIVE MODE)
MOBILE IN HALF DUPLEX
COMMUNICATION MODE
(THERMAL RADIATION
MODE)
INTEGRATED
CIRCUITS
BATTERY
SUBSTRATE
ANTENNA
SMART PHONE
TR
MODE
PROPOSED MODE
(incorporating
Ultra-Lean Design)
Switching to TR mode based on signal strength
Display and
decision
Signal
Strength
INTEGRATED
CIRCUITS
BATTERY
SUBSTRATE
ANTENNA
SMART PHONE
INTEGRATED
CIRCUITS
BATTERY
SUBSTRATE
ANTENNA
SMART PHONE
INTEGRATED
CIRCUITS
BATTERY
SUBSTRATE
ANTENNA
SMART PHONE
Great/Good Signal
Strength (-50 dBm to
-89 dBm)
Average Signal
Strength (-90 dBm
to -99 dBm)
Poor/ V.Poor Signal
Strength (-100 dBm
to -120 dBm)
Current
Scenario
LOS Communication +
NLOS Constructive
phenomenon
NLOS Communication
(Destructive
phenomenon)
NLOS (Destructive
phenomenon) +
Fading + Scattering
Fig.7 Display and Decision (𝐷2) technique for TR mode.
10
TABLE III SIGNAL STRENGTH VALUES FOR DIFFERENT NETWORK
OPERATORS
Quality of Signal
Jio (4G) BSNL (Cellone)
Airtel
Great -75 dBm -70 dBm -77dBm
Good -84 dBm -81 dBm -85dBm
Average -96 dBm -91 dBm -93dBm
Poor -106 dBm -101 dBm -104dBm
Very Poor -110 dBm -105 dBm -114dBm
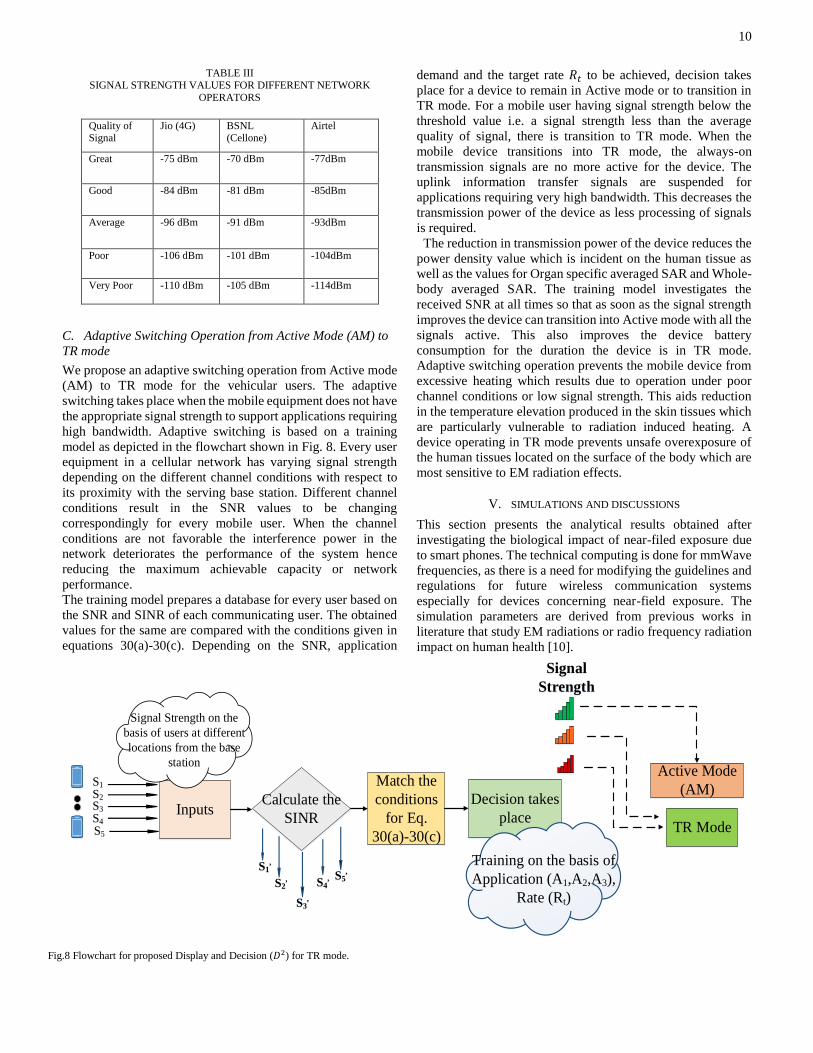
C. Adaptive Switching Operation from Active Mode (AM) to
TR mode
We propose an adaptive switching operation from Active mode
(AM) to TR mode for the vehicular users. The adaptive
switching takes place when the mobile equipment does not have
the appropriate signal strength to support applications requiring
high bandwidth. Adaptive switching is based on a training
model as depicted in the flowchart shown in Fig. 8. Every user
equipment in a cellular network has varying signal strength
depending on the different channel conditions with respect to
its proximity with the serving base station. Different channel
conditions result in the SNR values to be changing
correspondingly for every mobile user. When the channel
conditions are not favorable the interference power in the
network deteriorates the performance of the system hence
reducing the maximum achievable capacity or network
performance.
The training model prepares a database for every user based on
the SNR and SINR of each communicating user. The obtained
values for the same are compared with the conditions given in
equations 30(a)-30(c). Depending on the SNR, application
demand and the target rate 𝑅𝑡 to be achieved, decision takes
place for a device to remain in Active mode or to transition in
TR mode. For a mobile user having signal strength below the
threshold value i.e. a signal strength less than the average
quality of signal, there is transition to TR mode. When the
mobile device transitions into TR mode, the always-on
transmission signals are no more active for the device. The
uplink information transfer signals are suspended for
applications requiring very high bandwidth. This decreases the
transmission power of the device as less processing of signals
is required.
The reduction in transmission power of the device reduces the
power density value which is incident on the human tissue as
well as the values for Organ specific averaged SAR and Whole-
body averaged SAR. The training model investigates the
received SNR at all times so that as soon as the signal strength
improves the device can transition into Active mode with all the
signals active. This also improves the device battery
consumption for the duration the device is in TR mode.
Adaptive switching operation prevents the mobile device from
excessive heating which results due to operation under poor
channel conditions or low signal strength. This aids reduction
in the temperature elevation produced in the skin tissues which
are particularly vulnerable to radiation induced heating. A
device operating in TR mode prevents unsafe overexposure of
the human tissues located on the surface of the body which are
most sensitive to EM radiation effects.
V. SIMULATIONS AND DISCUSSIONS
This section presents the analytical results obtained after
investigating the biological impact of near-filed exposure due
to smart phones. The technical computing is done for mmWave
frequencies, as there is a need for modifying the guidelines and
regulations for future wireless communication systems
especially for devices concerning near-field exposure. The
simulation parameters are derived from previous works in
literature that study EM radiations or radio frequency radiation
impact on human health [10].
InputsCalculate the
SINR
Match the
conditions
for Eq.
30(a)-30(c)
Decision takes
place
Active Mode
(AM)
TR Mode
S1
S2
S3
S4
S5
Signal Strength on the
basis of users at different
locations from the base
station
S1,
S2,
S3,
S4, S5
,Training on the basis of
Application (A1,A2,A3),
Rate (Rt)
Signal
Strength
Fig.8 Flowchart for proposed Display and Decision (𝐷2) for TR mode.
11
The graphical analysis presents a comparison made between
the smart phone in “Active mode” and in “Thermal Radiation”
(TR) mode for three different applications A3, A2 and A1 as
explained in the previous sections. Along with studying the
biological impact on human tissues, a comparison has also been
made for energy efficiency and complexity of the system for
devices operating in the Active and TR mode. To study the
power density and temperature rise in the human tissues,
numerical computing techniques such as Finite difference time
domain (FDTD) has been used. The simulations have been
carried out at 30 GHz frequency and the variations in the
temperature, power density and SAR have been observed
considering the three layer model of the skin. The direct
measurements of power density for the 1-D three-layer model
of the human tissue have been made which depicts the
attenuation of power density with the increasing depth in the
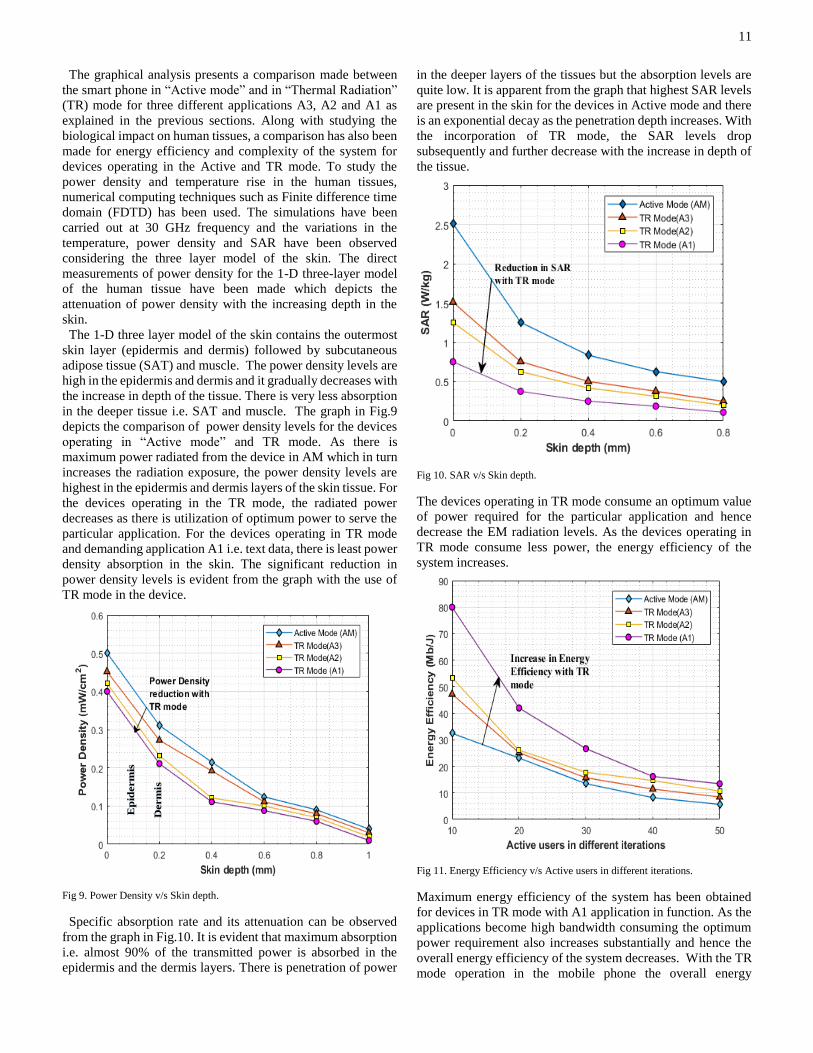
skin. The 1-D three layer model of the skin contains the outermost
skin layer (epidermis and dermis) followed by subcutaneous
adipose tissue (SAT) and muscle. The power density levels are
high in the epidermis and dermis and it gradually decreases with
the increase in depth of the tissue. There is very less absorption
in the deeper tissue i.e. SAT and muscle. The graph in Fig.9
depicts the comparison of power density levels for the devices
operating in “Active mode” and TR mode. As there is
maximum power radiated from the device in AM which in turn
increases the radiation exposure, the power density levels are
highest in the epidermis and dermis layers of the skin tissue. For
the devices operating in the TR mode, the radiated power
decreases as there is utilization of optimum power to serve the
particular application. For the devices operating in TR mode
and demanding application A1 i.e. text data, there is least power
density absorption in the skin. The significant reduction in
power density levels is evident from the graph with the use of
TR mode in the device.
Ep
iderm
is
Derm
is
Fig 9. Power Density v/s Skin depth.
Specific absorption rate and its attenuation can be observed
from the graph in Fig.10. It is evident that maximum absorption
i.e. almost 90% of the transmitted power is absorbed in the
epidermis and the dermis layers. There is penetration of power
in the deeper layers of the tissues but the absorption levels are
quite low. It is apparent from the graph that highest SAR levels
are present in the skin for the devices in Active mode and there
is an exponential decay as the penetration depth increases. With
the incorporation of TR mode, the SAR levels drop
subsequently and further decrease with the increase in depth of
the tissue.
Fig 10. SAR v/s Skin depth.
The devices operating in TR mode consume an optimum value
of power required for the particular application and hence
decrease the EM radiation levels. As the devices operating in
TR mode consume less power, the energy efficiency of the
system increases.
Fig 11. Energy Efficiency v/s Active users in different iterations.
Maximum energy efficiency of the system has been obtained
for devices in TR mode with A1 application in function. As the
applications become high bandwidth consuming the optimum
power requirement also increases substantially and hence the
overall energy efficiency of the system decreases. With the TR
mode operation in the mobile phone the overall energy
12
efficiency of the system improves considerably as can be seen
in Fig.11. Also when the devices are operating in a system, there
is interference that occurs due to adjacent channels or co-tier
interference. Interference is encountered due to the base station,
the cellular devices, devices operating in pairs and so on. Higher
the bandwidth consuming application, more is the interference
power produced due to its operation. For the devices in TR
mode, the utilized power is less and hence the radiated power
from the devices is also reduced. This results in an appreciable
reduction in complexity of the system with TR mode as is
depicted in Fig.12.
Fig. 12 Complexity v/s Active users in different iterations.
The absorption of non-ionising radiation i.e. the mmWaves in
the body is studied with respect to the thermal heating of the
tissues. The mmWaves have much smaller wavelengths and
hence do not propagate deep into the human tissues. The
heating effect is produced due to the temperature elevation that
is caused when the electromagnetic radiations are absorbed into
the body. There is a rise in temperature that has been observed
in the body tissues called as steady-state or transient
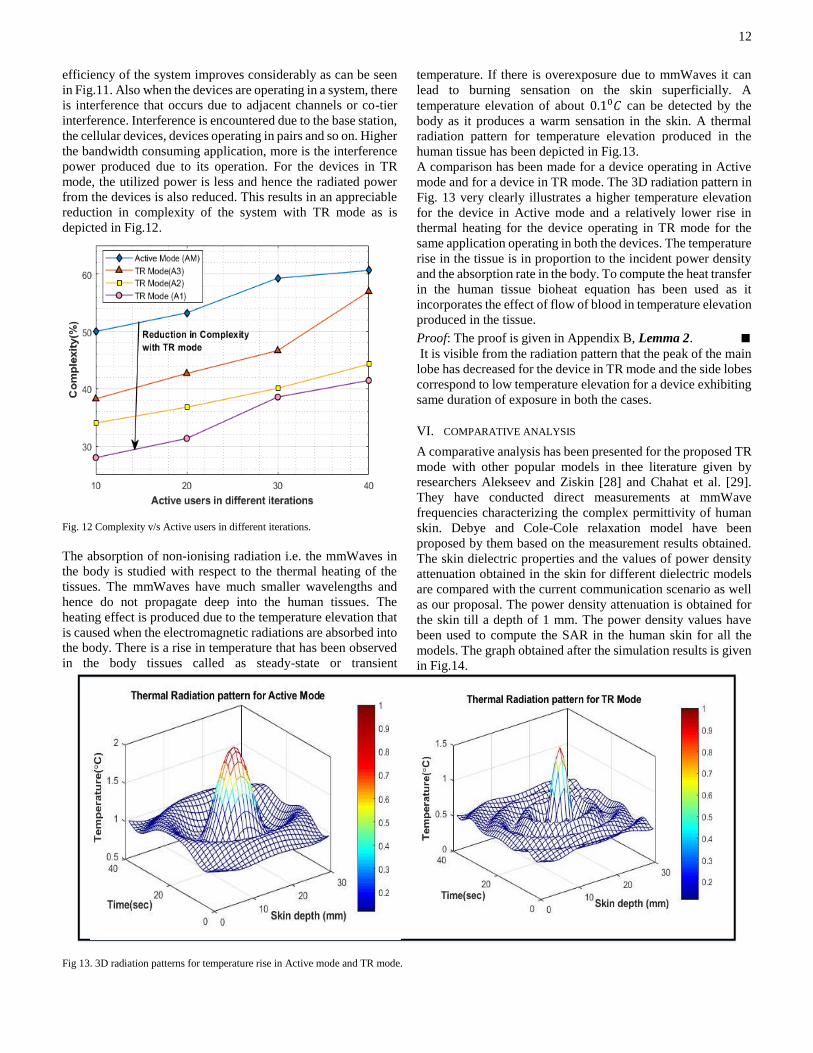
temperature. If there is overexposure due to mmWaves it can
lead to burning sensation on the skin superficially. A
temperature elevation of about 0.10𝐶 can be detected by the
body as it produces a warm sensation in the skin. A thermal
radiation pattern for temperature elevation produced in the
human tissue has been depicted in Fig.13.
A comparison has been made for a device operating in Active
mode and for a device in TR mode. The 3D radiation pattern in
Fig. 13 very clearly illustrates a higher temperature elevation
for the device in Active mode and a relatively lower rise in
thermal heating for the device operating in TR mode for the
same application operating in both the devices. The temperature
rise in the tissue is in proportion to the incident power density
and the absorption rate in the body. To compute the heat transfer
in the human tissue bioheat equation has been used as it
incorporates the effect of flow of blood in temperature elevation
produced in the tissue.
Proof: The proof is given in Appendix B, Lemma 2. ∎
It is visible from the radiation pattern that the peak of the main
lobe has decreased for the device in TR mode and the side lobes
correspond to low temperature elevation for a device exhibiting
same duration of exposure in both the cases.
VI. COMPARATIVE ANALYSIS
A comparative analysis has been presented for the proposed TR
mode with other popular models in thee literature given by
researchers Alekseev and Ziskin [28] and Chahat et al. [29].
They have conducted direct measurements at mmWave
frequencies characterizing the complex permittivity of human
skin. Debye and Cole-Cole relaxation model have been
proposed by them based on the measurement results obtained.
The skin dielectric properties and the values of power density
attenuation obtained in the skin for different dielectric models
are compared with the current communication scenario as well
as our proposal. The power density attenuation is obtained for
the skin till a depth of 1 mm. The power density values have
been used to compute the SAR in the human skin for all the
models. The graph obtained after the simulation results is given
in Fig.14.
Fig 13. 3D radiation patterns for temperature rise in Active mode and TR mode.
13
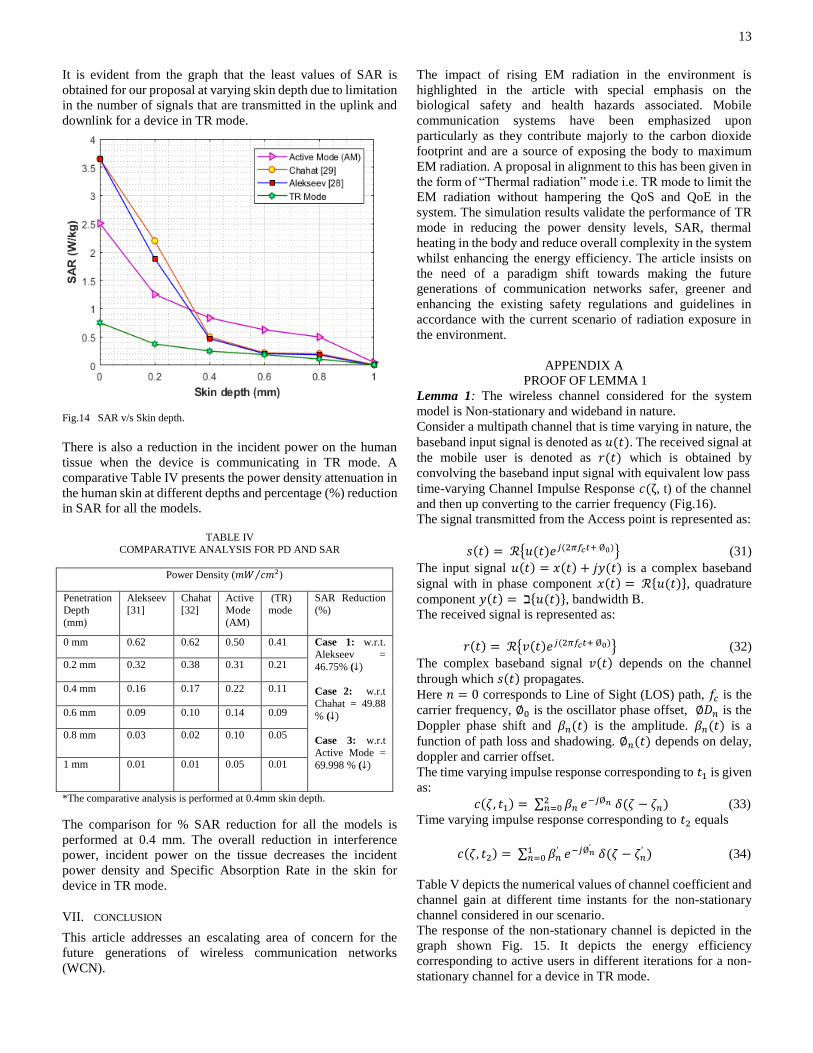
It is evident from the graph that the least values of SAR is
obtained for our proposal at varying skin depth due to limitation
in the number of signals that are transmitted in the uplink and
downlink for a device in TR mode.
Fig.14 SAR v/s Skin depth.
There is also a reduction in the incident power on the human
tissue when the device is communicating in TR mode. A
comparative Table IV presents the power density attenuation in
the human skin at different depths and percentage (%) reduction
in SAR for all the models.
TABLE IV
COMPARATIVE ANALYSIS FOR PD AND SAR
Power Density (𝑚𝑊 𝑐𝑚2⁄ )
Penetration
Depth
(mm)
Alekseev
[31]
Chahat
[32]
Active
Mode
(AM)
(TR)
mode
SAR Reduction
(%)
0 mm 0.62 0.62 0.50 0.41 Case 1: w.r.t.
Alekseev =
46.75% (↓)
Case 2: w.r.t
Chahat = 49.88
% (↓)
Case 3: w.r.t
Active Mode =
69.998 % (↓)
0.2 mm 0.32 0.38 0.31 0.21
0.4 mm 0.16 0.17 0.22 0.11
0.6 mm 0.09 0.10 0.14 0.09
0.8 mm 0.03 0.02 0.10 0.05
1 mm 0.01 0.01 0.05 0.01
*The comparative analysis is performed at 0.4mm skin depth.
The comparison for % SAR reduction for all the models is
performed at 0.4 mm. The overall reduction in interference
power, incident power on the tissue decreases the incident
power density and Specific Absorption Rate in the skin for
device in TR mode.
VII. CONCLUSION
This article addresses an escalating area of concern for the
future generations of wireless communication networks
(WCN).
The impact of rising EM radiation in the environment is
highlighted in the article with special emphasis on the
biological safety and health hazards associated. Mobile
communication systems have been emphasized upon
particularly as they contribute majorly to the carbon dioxide
footprint and are a source of exposing the body to maximum
EM radiation. A proposal in alignment to this has been given in
the form of “Thermal radiation” mode i.e. TR mode to limit the
EM radiation without hampering the QoS and QoE in the
system. The simulation results validate the performance of TR
mode in reducing the power density levels, SAR, thermal
heating in the body and reduce overall complexity in the system
whilst enhancing the energy efficiency. The article insists on
the need of a paradigm shift towards making the future
generations of communication networks safer, greener and
enhancing the existing safety regulations and guidelines in
accordance with the current scenario of radiation exposure in
the environment.
APPENDIX A
PROOF OF LEMMA 1
Lemma 1: The wireless channel considered for the system
model is Non-stationary and wideband in nature.
Consider a multipath channel that is time varying in nature, the
baseband input signal is denoted as 𝑢(𝑡). The received signal at
the mobile user is denoted as 𝑟(𝑡) which is obtained by
convolving the baseband input signal with equivalent low pass
time-varying Channel Impulse Response 𝑐(ζ, t) of the channel
and then up converting to the carrier frequency (Fig.16).
The signal transmitted from the Access point is represented as:
𝑠(𝑡) = ℛ{𝑢(𝑡)𝑒𝑗(2𝜋𝑓𝑐𝑡+ Ø0)} (31)
The input signal 𝑢(𝑡) = 𝑥(𝑡) + 𝑗𝑦(𝑡) is a complex baseband
signal with in phase component 𝑥(𝑡) = ℛ{𝑢(𝑡)}, quadrature
component 𝑦(𝑡) = ℶ{𝑢(𝑡)}, bandwidth B.
The received signal is represented as:
𝑟(𝑡) = ℛ{𝑣(𝑡)𝑒𝑗(2𝜋𝑓𝑐𝑡+ Ø0)} (32)
The complex baseband signal 𝑣(𝑡) depends on the channel
through which 𝑠(𝑡) propagates.
Here 𝑛 = 0 corresponds to Line of Sight (LOS) path, 𝑓𝑐 is the
carrier frequency, ∅0 is the oscillator phase offset, ∅𝐷𝑛 is the
Doppler phase shift and 𝛽𝑛(𝑡) is the amplitude. 𝛽𝑛(𝑡) is a
function of path loss and shadowing. ∅𝑛(𝑡) depends on delay,
doppler and carrier offset.
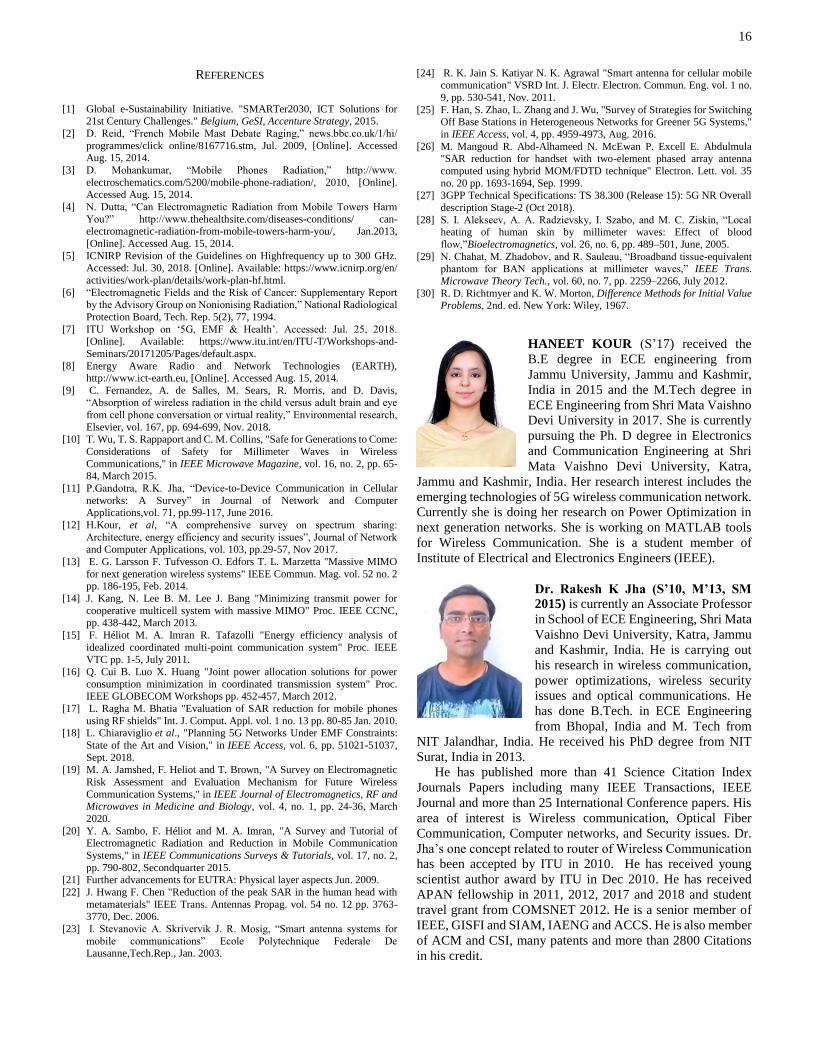
The time varying impulse response corresponding to 𝑡1 is given
as:
𝑐(𝜁, 𝑡1) = ∑ 𝛽𝑛2𝑛=0 𝑒−𝑗Ø𝑛 𝛿(𝜁 − 𝜁𝑛) (33)
Time varying impulse response corresponding to 𝑡2 equals
𝑐(𝜁, 𝑡2) = ∑ 𝛽𝑛ʻ1
𝑛=0 𝑒−𝑗Ø𝑛ʻ
𝛿(𝜁 − 𝜁𝑛ʻ ) (34)
Table V depicts the numerical values of channel coefficient and
channel gain at different time instants for the non-stationary
channel considered in our scenario.
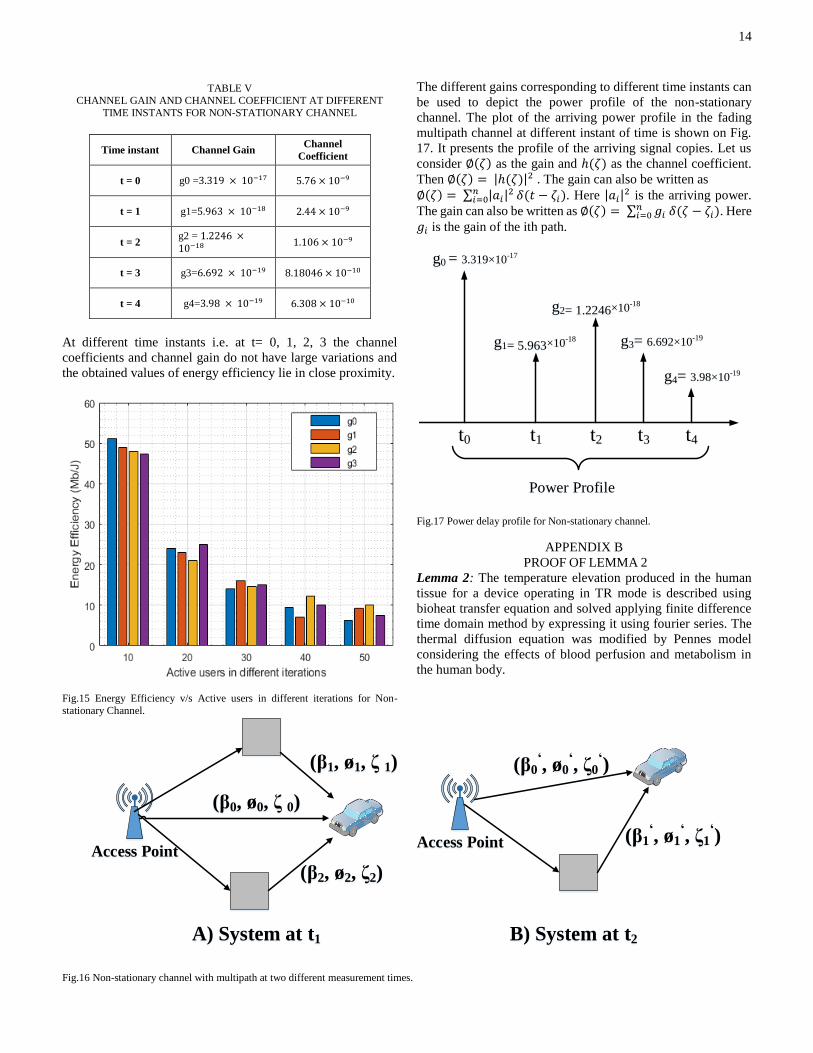
The response of the non-stationary channel is depicted in the
graph shown Fig. 15. It depicts the energy efficiency
corresponding to active users in different iterations for a non-
stationary channel for a device in TR mode.
14
TABLE V
CHANNEL GAIN AND CHANNEL COEFFICIENT AT DIFFERENT
TIME INSTANTS FOR NON-STATIONARY CHANNEL
Time instant Channel Gain Channel
Coefficient
t = 0 g0 =3.319 × 10⁻¹⁷ 5.76 × 10⁻⁹
t = 1 g1=5.963 × 10⁻¹⁸ 2.44 × 10⁻⁹
t = 2 g2 = 1.2246 ×10⁻¹⁸
1.106 × 10⁻⁹
t = 3 g3=6.692 × 10⁻¹⁹ 8.18046 × 10⁻¹⁰
t = 4 g4=3.98 × 10⁻¹⁹ 6.308 × 10⁻¹⁰
At different time instants i.e. at t= 0, 1, 2, 3 the channel
coefficients and channel gain do not have large variations and
the obtained values of energy efficiency lie in close proximity.
Fig.15 Energy Efficiency v/s Active users in different iterations for Non-
stationary Channel.
The different gains corresponding to different time instants can
be used to depict the power profile of the non-stationary
channel. The plot of the arriving power profile in the fading
multipath channel at different instant of time is shown on Fig.
17. It presents the profile of the arriving signal copies. Let us
consider ∅(𝜁) as the gain and ℎ(𝜁) as the channel coefficient.
Then ∅(𝜁) = |ℎ(𝜁)|2 . The gain can also be written as
∅(𝜁) = ∑ |𝑎𝑖|2𝑛𝑖=0 𝛿(𝑡 − 𝜁𝑖). Here |𝑎𝑖|
2 is the arriving power.
The gain can also be written as ∅(𝜁) = ∑ 𝑔𝑖 𝛿(𝜁 − 𝜁𝑖𝑛𝑖=0 ). Here
𝑔𝑖 is the gain of the ith path.
t0 t1 t2 t3
g0 = 3.319×10⁻¹⁷
g1= 5.963×10⁻¹⁸
g2= 1.2246×10⁻¹⁸
Power Profile
t4
g3= 6.692×10⁻¹⁹
g4= 3.98×10⁻¹⁹
Fig.17 Power delay profile for Non-stationary channel.
APPENDIX B
PROOF OF LEMMA 2
Lemma 2: The temperature elevation produced in the human
tissue for a device operating in TR mode is described using
bioheat transfer equation and solved applying finite difference
time domain method by expressing it using fourier series. The
thermal diffusion equation was modified by Pennes model
considering the effects of blood perfusion and metabolism in
the human body.
Access PointAccess Point
(β1, ø1, ζ 1)
(β0, ø0, ζ 0)
(β2, ø2, ζ2)
A) System at t1
(β0ʻ, ø0
ʻ, ζ0
ʻ)
(β1ʻ, ø1
ʻ, ζ1
ʻ)
B) System at t2
Fig.16 Non-stationary channel with multipath at two different measurement times.
15
The thermal diffusion equation is as follows
𝜌𝑡𝑠 𝐶𝑡𝑠 𝜕𝑇𝑡𝑠
𝜕𝑡= ∇𝑘𝑡𝑠∇ 𝑇𝑡𝑠 + 𝜌𝑏𝐶𝑏𝑊𝑏(𝑇𝑎𝑡 − 𝑇𝑡𝑠) + 𝑞ℎ (35)
𝑞 = −𝑘𝑡𝑠 ∇ 𝑇𝑡𝑠 + 𝜌𝑏 ℎ𝑏 𝑣𝑏 (36)
ℎ𝑏 = ∫ 𝐶𝑏𝑇𝑏
𝑇0(𝑇𝑏) 𝑑𝑇𝑏 +
𝑃𝑠𝑦𝑠
𝜌𝑏+ ∆𝐻𝑚 (1 − 𝜑) (37)
Energy balance equation
𝜌𝑡𝑠 𝐶𝑡𝑠 𝜕𝑇𝑡𝑠
𝜕𝑡= −∇. 𝑞 , (38)
Therefore
𝜌𝑡𝑠 𝐶𝑡𝑠 𝜕𝑇𝑡𝑠
𝜕𝑡= −∇ ∙ [−𝑘𝑡𝑠 ∇ 𝑇𝑡𝑠 + 𝜌𝑏 𝑣𝑏 ( ∫ 𝐶𝑏
𝑇𝑏
𝑇0(𝑇𝑏)𝑑𝑇𝑏 +
𝑃𝑠𝑦𝑠
𝜌𝑏+ ∆𝐻𝑓 (1 − 𝜑))] , (39)
Simplifying the above equation it can be rewritten as
𝜌𝑡𝑠 𝐶𝑡𝑠 𝜕𝑇𝑡𝑠
𝜕𝑡= 𝑘𝑡𝑠 ∇2𝑇𝑡𝑠 − 𝜌𝑏𝐶𝑏𝑣 𝑏∇ 𝑇𝑏 + 𝜌𝑏𝑣𝑏∆𝐻𝑚∇𝜑 (40)
The final form of bio-heat equation is as follows
𝜌𝑡𝑠 𝐶𝑡𝑠𝜕𝑇
𝜕𝑡= 𝑘𝑡𝑠 ∇2𝑇𝑡𝑠 − 𝜌𝑏𝐶𝑏𝑣𝑏 ∙ ∇𝑇𝑡𝑠 + 𝑞ℎ . (41)
When we discretize the bio-heat equation using Finite
difference time domain method (FDTD) to obtain SAR, the
equation obtained is as follows
𝜌𝑡𝑠 𝐶𝑡𝑠 𝜕𝑇
𝜕𝑡= 𝑘𝑡𝑠 ∇2𝑇𝑡𝑠 + 𝜌 ∙ 𝑆𝐴𝑅 − 𝐵𝑏𝑙(𝑇 − 𝑇𝑏𝑙) (42)
With respect to the boundary condition
𝑘𝑡𝑠𝜕𝑇
𝜕𝑛= −ℎ𝑡(𝑇 − 𝑇𝑎𝑚) (43)
where ʻ𝑛ʻ is the unit vector normal to the head.
On numerical analysis of the bio-heat equation with FDTD
method and expanding it using Fourier series we have
𝜌𝑡𝑠 𝐶𝑡𝑠 𝜕𝑢
𝜕𝑡= 𝑘∇2𝑢 + 𝜌𝑡𝑠 𝑆𝐴𝑅 − 𝐵𝑏𝑙 ∙ 𝑢 (44)
As we know that SAR is a ratio of the power dissipated in the
tissue to the mass of the tissue that is under exposure. Equation
(44) can be re-written as
𝜌𝑡𝑠 𝐶𝑡𝑠 𝜕𝑢
𝜕𝑡= 𝑘∇2𝑢 + 𝜌𝑡𝑠
𝑃𝑖𝑛
𝑀− 𝐵𝑏𝑙 ∙ 𝑢 , (45)
For the devices communicating in Active mode i.e. always-on
communication signals, the power utilization for a device is
computed as 𝑃𝑇(𝑚𝑎𝑥)𝑇𝑜𝑡𝑎𝑙 (𝐴𝑀)
. This is the incident power for the
exposed body tissues for a user communicating in active mode.
Substituting this value of power in equation (45), we get the
following equation
𝜌𝑡𝑠 𝐶𝑡𝑠 𝜕𝑢
𝜕𝑡= 𝑘∇2𝑢 + 𝜌𝑡𝑠
𝑃𝑇(𝑚𝑎𝑥)𝑇𝑜𝑡𝑎𝑙 (𝐴𝑀)
𝑀− 𝐵𝑏𝑙 ∙ 𝑢 . (46)
The devices communicating in TR mode consume the optimum
power 𝑃𝑇(𝑜𝑝𝑡)𝑇𝑜𝑡𝑎𝑙 (𝑇𝑅)
which is lesser than the power consumed in
the active mode. For the devices in TR mode the bio-heat
equation can be re-written as follows
𝜌𝑡𝑠 𝐶𝑡𝑠 𝜕𝑢
𝜕𝑡= 𝑘∇2𝑢 + 𝜌𝑡𝑠
𝑃𝑇(𝑜𝑝𝑡)𝑇𝑜𝑡𝑎𝑙 (𝑇𝑅)
𝑀− 𝐵𝑏𝑙 ∙ 𝑢 , (47)
The finite difference approximation of the above equation can
be written as follows
𝑢𝑖+1(𝑥, 𝑦, 𝑧) = 𝑢𝑖(𝑥, 𝑦, 𝑧) −
𝛿𝑡
𝜌(𝑥,𝑦,𝑧)𝐶𝑝(𝑥,𝑦,𝑧) 𝑏(𝑥, 𝑦, 𝑧)𝑢𝑖(𝑥, 𝑦, 𝑧) +
𝛿𝑡 𝑘𝑡𝑠(𝑥,𝑦,𝑧)
𝜌(𝑥,𝑦,𝑧)𝐶𝑝(𝑥,𝑦,𝑧)𝛿2 ∙
[𝑢𝑖(𝑥 + 1, 𝑦, 𝑧) + 𝑢𝑖(𝑥, 𝑦 + 1, 𝑧) + 𝑢𝑖(𝑥, 𝑦, 𝑧 + 1) +𝑢𝑖(𝑥 − 1, 𝑦, 𝑧) + 𝑢𝑖(𝑥, 𝑦 − 1, 𝑧) + 𝑢𝑖(𝑥, 𝑦, 𝑧 − 1) −
6𝑢𝑖(𝑥, 𝑦, 𝑧) , (48)
where 𝑖 is the iteration number. On expansion of ʻ𝑢ʻ utilizing
fourier series, we have
𝑢(𝑥, 𝑦, 𝑧, 𝑖) = ∑ ∑ ∑ 𝑈𝜆,𝜇,𝛾𝑖𝑧0−1
𝛾=0𝑦0−1𝜇=0
𝑥0−1𝜆=0 ∙ exp[ ℵ(𝑥
2𝜋
𝑥0 𝜆 +
𝑦 2𝜋
𝑦0 𝜇 + 𝑧
2𝜋
𝑧0 𝛾)] , (49)
𝑈𝜆,𝜇,𝛾𝑖 =
1
𝑥0𝑦0𝑧0 ∑ ∑ ∑ 𝑢(𝑥, 𝑦, 𝑧, 𝑖)
𝑧0−1𝑧=0
𝑦0−1𝑦=0
𝑥0−1𝑥=0 ∙
exp[− ℵ( 𝜆2𝜋
𝑥0 𝑥 + 𝜇
2𝜋
𝑦0𝑦 + 𝛾
2𝜋
𝑧0 𝑧)] , (50)
where 𝑢(𝑥, 𝑦, 𝑧, 𝑖) is assumed within the range as {𝑥} ={0,1,2, … … . 𝑥0 − 1}, {𝑦} = {0,1,2, … … 𝑦0 − 1}, {𝑧} =
{0,1,2, … … . 𝑧0 − 1}, {𝑖} = {0,1,2, … … . (𝑇𝑡
𝛿𝑡⁄ )} and ℵ =
√−1
Substituting (50) in (48) and dividing by
𝑒ℵ(𝑥(2𝜋 𝑥0) 𝜆+𝑦(
2𝜋
𝑦0)𝜇+ 𝑧(
2𝜋
𝑧0)𝛾)⁄
, one fourier component can be
expressed as
𝑈𝜆,𝜇,𝛾𝑖+1 = [1 −
𝛿𝑡 𝑏
𝜌𝑡𝑠 𝐶𝑡𝑠−
4 𝛿𝑡𝑘
𝜌𝑡𝑠 𝐶𝑡𝑠 𝛿2 {𝑆𝑖𝑛2 (𝜋
𝑥0 𝜆 + 𝑆𝑖𝑛2 (
𝜋
𝑦0 𝜇 +
𝑆𝑖𝑛2 (𝜋
𝑧0 𝛾)}] ∙ 𝑈𝜆,𝜇,𝛾
𝑖 . (51)
Considering ʻ𝑤ʻ as an incremental rate for each of the fourier
component at time step 𝛿𝑡 we can write 𝑈𝜆,𝜇,𝛾𝑖+1 = 𝑤 𝑈𝜆,𝜇,𝛾
𝑖
For obtaining a stable solution for all values of 𝑖, 𝜆, 𝜇 and 𝛾,
we consider an integer 𝑁 which fulfills the following condition
𝑤 ≤ 1 + 𝑁𝛿𝑡 (52)
The above equation (52) is known as Von Neumann’s condition
[30]. On utilizing this condition in equation (51) we get
The integer 𝑁 must always fulfill the following condition for all
values of 𝜆, 𝜇 and 𝛾
𝛿𝑡 ≤ 2 𝛿𝑡𝑠 𝐶𝑡𝑠 𝛿2
12𝑘+𝑏𝛿2 (53)
ACKNOWLEDGMENT
The authors gratefully acknowledge the support provided by 5G
and IoT Lab, SoECE, TBIC, TEQIP-III at Shri Mata Vaishno
Devi University, Katra, Jammu. This work has been patented
with the title “Thermal Radiation (TR) mode for
Electromagnetic radiation reduction in future wireless
networks”.
16
REFERENCES
[1] Global e-Sustainability Initiative. "SMARTer2030, ICT Solutions for
21st Century Challenges." Belgium, GeSI, Accenture Strategy, 2015.
[2] D. Reid, “French Mobile Mast Debate Raging,” news.bbc.co.uk/1/hi/
programmes/click online/8167716.stm, Jul. 2009, [Online]. Accessed Aug. 15, 2014.
[3] D. Mohankumar, “Mobile Phones Radiation,” http://www.
electroschematics.com/5200/mobile-phone-radiation/, 2010, [Online]. Accessed Aug. 15, 2014.
[4] N. Dutta, “Can Electromagnetic Radiation from Mobile Towers Harm
You?” http://www.thehealthsite.com/diseases-conditions/ can-electromagnetic-radiation-from-mobile-towers-harm-you/, Jan.2013,
[Online]. Accessed Aug. 15, 2014.
[5] ICNIRP Revision of the Guidelines on Highfrequency up to 300 GHz. Accessed: Jul. 30, 2018. [Online]. Available: https://www.icnirp.org/en/
activities/work-plan/details/work-plan-hf.html.
[6] “Electromagnetic Fields and the Risk of Cancer: Supplementary Report by the Advisory Group on Nonionising Radiation,” National Radiological
Protection Board, Tech. Rep. 5(2), 77, 1994.
[7] ITU Workshop on ‘5G, EMF & Health’. Accessed: Jul. 25, 2018. [Online]. Available: https://www.itu.int/en/ITU-T/Workshops-and-
Seminars/20171205/Pages/default.aspx.
[8] Energy Aware Radio and Network Technologies (EARTH), http://www.ict-earth.eu, [Online]. Accessed Aug. 15, 2014.
[9] C. Fernandez, A. de Salles, M. Sears, R. Morris, and D. Davis, “Absorption of wireless radiation in the child versus adult brain and eye
from cell phone conversation or virtual reality,” Environmental research,
Elsevier, vol. 167, pp. 694-699, Nov. 2018. [10] T. Wu, T. S. Rappaport and C. M. Collins, "Safe for Generations to Come:
Considerations of Safety for Millimeter Waves in Wireless
Communications," in IEEE Microwave Magazine, vol. 16, no. 2, pp. 65-84, March 2015.
[11] P.Gandotra, R.K. Jha, “Device-to-Device Communication in Cellular
networks: A Survey” in Journal of Network and Computer Applications,vol. 71, pp.99-117, June 2016.
[12] H.Kour, et al, “A comprehensive survey on spectrum sharing:
Architecture, energy efficiency and security issues”, Journal of Network
and Computer Applications, vol. 103, pp.29-57, Nov 2017.
[13] E. G. Larsson F. Tufvesson O. Edfors T. L. Marzetta "Massive MIMO
for next generation wireless systems" IEEE Commun. Mag. vol. 52 no. 2 pp. 186-195, Feb. 2014.
[14] J. Kang, N. Lee B. M. Lee J. Bang "Minimizing transmit power for
cooperative multicell system with massive MIMO" Proc. IEEE CCNC, pp. 438-442, March 2013.
[15] F. Héliot M. A. Imran R. Tafazolli "Energy efficiency analysis of
idealized coordinated multi-point communication system" Proc. IEEE VTC pp. 1-5, July 2011.
[16] Q. Cui B. Luo X. Huang "Joint power allocation solutions for power
consumption minimization in coordinated transmission system" Proc. IEEE GLOBECOM Workshops pp. 452-457, March 2012.
[17] L. Ragha M. Bhatia "Evaluation of SAR reduction for mobile phones
using RF shields" Int. J. Comput. Appl. vol. 1 no. 13 pp. 80-85 Jan. 2010. [18] L. Chiaraviglio et al., "Planning 5G Networks Under EMF Constraints:
State of the Art and Vision," in IEEE Access, vol. 6, pp. 51021-51037,
Sept. 2018. [19] M. A. Jamshed, F. Heliot and T. Brown, "A Survey on Electromagnetic
Risk Assessment and Evaluation Mechanism for Future Wireless
Communication Systems," in IEEE Journal of Electromagnetics, RF and Microwaves in Medicine and Biology, vol. 4, no. 1, pp. 24-36, March
2020.
[20] Y. A. Sambo, F. Héliot and M. A. Imran, "A Survey and Tutorial of Electromagnetic Radiation and Reduction in Mobile Communication
Systems," in IEEE Communications Surveys & Tutorials, vol. 17, no. 2,
pp. 790-802, Secondquarter 2015. [21] Further advancements for EUTRA: Physical layer aspects Jun. 2009.
[22] J. Hwang F. Chen "Reduction of the peak SAR in the human head with
metamaterials" IEEE Trans. Antennas Propag. vol. 54 no. 12 pp. 3763-3770, Dec. 2006.
[23] I. Stevanovic A. Skrivervik J. R. Mosig, “Smart antenna systems for
mobile communications” Ecole Polytechnique Federale De Lausanne,Tech.Rep., Jan. 2003.
[24] R. K. Jain S. Katiyar N. K. Agrawal "Smart antenna for cellular mobile communication" VSRD Int. J. Electr. Electron. Commun. Eng. vol. 1 no.
9, pp. 530-541, Nov. 2011.
[25] F. Han, S. Zhao, L. Zhang and J. Wu, "Survey of Strategies for Switching Off Base Stations in Heterogeneous Networks for Greener 5G Systems,"
in IEEE Access, vol. 4, pp. 4959-4973, Aug. 2016.
[26] M. Mangoud R. Abd-Alhameed N. McEwan P. Excell E. Abdulmula "SAR reduction for handset with two-element phased array antenna
computed using hybrid MOM/FDTD technique" Electron. Lett. vol. 35
no. 20 pp. 1693-1694, Sep. 1999. [27] 3GPP Technical Specifications: TS 38.300 (Release 15): 5G NR Overall
description Stage-2 (Oct 2018).
[28] S. I. Alekseev, A. A. Radzievsky, I. Szabo, and M. C. Ziskin, “Local heating of human skin by millimeter waves: Effect of blood
flow,”Bioelectromagnetics, vol. 26, no. 6, pp. 489–501, June, 2005.
[29] N. Chahat, M. Zhadobov, and R. Sauleau, “Broadband tissue-equivalent phantom for BAN applications at millimeter waves,” IEEE Trans.
Microwave Theory Tech., vol. 60, no. 7, pp. 2259–2266, July 2012.
[30] R. D. Richtmyer and K. W. Morton, Difference Methods for Initial Value Problems, 2nd. ed. New York: Wiley, 1967.
HANEET KOUR (S’17) received the
B.E degree in ECE engineering from
Jammu University, Jammu and Kashmir,
India in 2015 and the M.Tech degree in
ECE Engineering from Shri Mata Vaishno
Devi University in 2017. She is currently
pursuing the Ph. D degree in Electronics
and Communication Engineering at Shri
Mata Vaishno Devi University, Katra,
Jammu and Kashmir, India. Her research interest includes the
emerging technologies of 5G wireless communication network.
Currently she is doing her research on Power Optimization in
next generation networks. She is working on MATLAB tools
for Wireless Communication. She is a student member of
Institute of Electrical and Electronics Engineers (IEEE).
Dr. Rakesh K Jha (S’10, M’13, SM
2015) is currently an Associate Professor
in School of ECE Engineering, Shri Mata
Vaishno Devi University, Katra, Jammu
and Kashmir, India. He is carrying out
his research in wireless communication,
power optimizations, wireless security
issues and optical communications. He
has done B.Tech. in ECE Engineering
from Bhopal, India and M. Tech from
NIT Jalandhar, India. He received his PhD degree from NIT
Surat, India in 2013.
He has published more than 41 Science Citation Index
Journals Papers including many IEEE Transactions, IEEE
Journal and more than 25 International Conference papers. His
area of interest is Wireless communication, Optical Fiber
Communication, Computer networks, and Security issues. Dr.
Jha’s one concept related to router of Wireless Communication
has been accepted by ITU in 2010. He has received young
scientist author award by ITU in Dec 2010. He has received
APAN fellowship in 2011, 2012, 2017 and 2018 and student
travel grant from COMSNET 2012. He is a senior member of
IEEE, GISFI and SIAM, IAENG and ACCS. He is also member
of ACM and CSI, many patents and more than 2800 Citations
in his credit.