eigenfunction analysis of stochastic backscatter for aberration correction in medical ultrasound...
TRANSCRIPT

Eigenfunction analysis of stochastic backscatterfor characterization of acoustic aberration in medicalultrasound imaging
Trond Varslota) and Harald KrogstadDepartment of Mathematical Sciences, Norwegian University of Science and Technology,7491 Trondheim, Norway
Eirik Mo and Bjørn A. AngelsenDepartment of Circulation and Imaging, Norwegian University of Science and Technology,7491 Trondheim, Norway
~Received 3 September 2003; revised 20 February 2004; accepted 11 March 2004!
Presented here is a characterization of aberration in medical ultrasound imaging. Thecharacterization is optimal in the sense of maximizing the expected energy in a modifiedbeamformer output of the received acoustic backscatter. Aberration correction based on thischaracterization takes the form of an aberration correction filter. The situation considered isfrequently found in applications when imaging organs through a body wall: aberration is introducedin a layer close to the transducer, and acoustic backscatter from a scattering region behind the bodywall is measured at the transducer surface. The scattering region consists of scatterers randomlydistributed with very short correlation length compared to the acoustic wavelength of the transmitpulse. The scatterer distribution is therefore assumed to bed correlated. This paper shows howmaximizing the expected energy in a modified beamformer output signal naturally leads toeigenfunctions of a Fredholm integral operator, where the associated kernel function is a spatialcorrelation function of the received stochastic signal. Aberration characterization and aberrationcorrection are presented for simulated data constructed to mimic aberration introduced by theabdominal wall. The results compare well with what is obtainable using data from a simulated pointsource. ©2004 Acoustical Society of America.@DOI: 10.1121/1.1736274#
PACS numbers: 43.60.Tj, 43.60.Cg, 43.20.Bi@JJM# Pages: 3068–3076
itnscantee
le
lshegeu
bleculs
e-
od
iit
s.re-de
sti-l. Ifd
bell in-d inblence
tionsto-heandyer
ithtioning
ofgy
I. INTRODUCTION
An ultrasound image is formed as a map of the intensof the reflected sound pulse from different spatial locatioBy focusing the transmitted sound pulse at a specific lotion, the intensity of the transmitted field is highest arouthe focal point. The reflected signal then largely originafrom this region. A limitation is therefore imposed on thimage resolution by the size of the focal zone. The smalobtainable size is limited by diffraction.
In medical ultrasound imaging, the transmitted putypically travels through the body wall before arriving at tintended focal point. The body wall consists of a heteroneous configuration of muscular, fatty, and connective tissThe result of propagation through a medium with variaspeed of sound is degradation of the initial geometric fobeam by a widening of the focal zone. The transmitted puis then said to beaberrated. Experimental studies1–5 andsimulations6,7 show that this aberration can significantly rduce the image resolution.
Several different approaches have been suggested tduce the effect of the aberration. These are mostly baseeither a time-reversal mirror8 or a time delay filter.9 To usethe time-reversal mirror, a well-defined point scattererneeded in order to focus the signal at a point. This limitsapplicability in clinical situations. Time delay~and ampli-
a!Electronic mail: [email protected]
3068 J. Acoust. Soc. Am. 115 (6), June 2004 0001-4966/2004/
y.-
ds
st
e
-e.
se
re-on
ss
tude! filters rely on the ability to estimate filter coefficientWhen the received signal is from a single, known pointflector, this is mostly a trivial task; time delay and amplitufluctuations may be observed directly in the signal.10 Forscattering from a stochastic medium, the filter must be emated from the stochastic properties of the received signathe scattering medium isd correlated, the resulting receivesignal is approximately a Gaussian process.11 By consideringscattering from a limited depth interval, the process mayassumed to be stationary and have zero mean. Since aformation about a Gaussian process may be expresseterms of its mean and its covariance function, it is reasonato base a characterization of the aberration on the covariafunction. Various algorithms for doing this are available.12
This paper considers the characterization of aberrabased on measurements of acoustic backscatter from achastic distribution of scatterers, as depicted in Fig. 1. Taberration is introduced in a layer close to the transduceris, therefore, modeled using an infinitesimal aberrating laon the transducer surface. This layer is called ageneralizedfrequency dependent screen10,11 or simply a generalizedscreen. The received signal is scattering from a region wd correlated scatterers around the focal point. This situais found in medical imaging applications, e.g., when imagorgans like liver and spleen.
It has been shown that transmitting an eigenfunctionthe scattering operator will result in focusing the ener
115(6)/3068/9/$20.00 © 2004 Acoustical Society of America

ude
rinn
isreumrot
efethervee
tioionhhebe
ioarze
rtar
n-htioteS.
ed-
r aeen
ationla-
ian
s-l-
-
ity
h a
ion
e-nat-s-ho-
oc
within the support of a deterministic scattering object.13 Theeigenfunctions associated with high eigenvalues will focon regions with high scattering intensity. In the case ofterministic, well-separated point scatterers, each withunique scattering intensity, an eigenfunction of the scatteoperator corresponds to a diffraction-limited focusing on oof the scatterers.13 The corresponding eigenvalue will, in thcase, reflect the intensity of the respective point scatteFurthermore, it has been shown that under these circstances, an iterative application of the time-reversal mirwill converge to a diffraction limited focusing on the poinscatterer with strongest intensity.14
This paper shows how a similar analysis may be pformed on stochastic backscatter signals. The main difence from previous work done in Refs. 13 and 14 is thatfocal region does not contain any distinguished scatterHowever, the initially transmitted aberrated pulse will hahigher amplitude in certain regions, partly due to the geomric focusing and partly due to the aberration. The aberracorrection method presented is shown to focus on regwhere the initially transmitted pulse has high amplitude. Tlocation of the focal point is, therefore, determined by taberration. The size of the focal region, however, willclose to that of an unaberrated, diffraction limited transmbeam.
The starting point for the aberration characterizationthe intuitive notion of adjusting the receive signal so that,average, it is as coherent as possible. This leads to a chterization of the aberration consistent with the generaliscreen model.
The paper is organized in the following way. A shoreview of first-order scattering is given in Sec. II A. Thenmodel for the stochastic signal received at the transducediscussed in Sec. II B. A formulation for maximizing the eergy in the received signal is developed in Sec. II B 1. Tconnection between this energy formulation and aberracharacterization is discussed in Sec. II B 2. The simuladata are described in Sec. III. Results are presented inIV. Discussion and concluding remarks are given in Secsand VI, respectively.
II. THEORY
A. First-order scattering
The theory of first-order scattering is thoroughly coverin the literature,11,15 and is briefly included here for completeness and to set the notation.
FIG. 1. Situation of interest. The presented simulation results use a fdepth F of 6 cm, body wall thicknessw of 2 cm, and scattering regionextending 1.5 cm to either side of the focal point (d53 cm).
J. Acoust. Soc. Am., Vol. 115, No. 6, June 2004 Varslot
s-age
r.-
r
r-r-es.
t-ns
e
it
snac-d
is
endec.V
Lagrangian coordinates are particularly well suited fodescription of the propagation of an ultrasonic pulse as sin medical ultrasound imaging.16 For simplicity, both nonlin-ear and dissipative terms have been neglected. Conservof mass, conservation of inertia, and a compressibility retion produce a linear wave equation for the Lagrangpressure,17
div S 1
r¹pD 2k
]2p
]t250.
Here,r(r ) andk(r ) are the material density and compresibility at equilibrium, i.e., they are not time dependent. Folowing Ref. 18, introduction of an adjusted pressurep5p/Ar simplifies the following:
¹2p21
c2
]2p
]t25F p, ~1!
whereF5Ar¹2(1/Ar). In the following, the adjusted pressure will be denotedp.
In soft tissue, e.g., muscle, fat, and blood, the densand compressibility ranges from 950 to 1070 kg/m3 and 350to 500310212Pa21 respectively.16 It is therefore appropriateto express the material parametersr andk as
r~r !5r01gr1~r !,
k~r !5k01gk1~r !,
wherer0 andk0 are constant background values, andr1 andk1 represent deviation from these background values witsmall nondimensional factorg. A reasonable value forg inthis case is 0.1. This suggests looking for a perturbatsolution19 of Eq. ~1! of the form
p~r ,t !5p0~r ,t !1gp1~r ,t !1O~g2!.
Let c1(r ) be given from
1
c25
1
c022g
2c1
c03
,
where 1/c025r0k0 . Using this definitionc(r )5c01gc1(r )
1O(g2). Note also thatF will be O(g). Let thereforeF(r )5gF1(r ). Using these definitions, Eq.~1! may bewritten as
¹2p21
c02
]2p
]t25gS 22
c1
c03
]2p
]t21F1pD ~2!
to first order ing. A perturbation solution is found from
¹2p021
c02
]2p0
]t250,
¹2p121
c02
]2p1
]t2522
c1
c03
]2p0
]t21F1p0 .
Now p0 is the solution of the wave equation in a homogneous medium, andp1 represents a first-order correctioterm introduced by the inhomogeneities, i.e., first-order sctering. When transmitting an initial pulse from the tranducer, and receiving the acoustic backscatter from an in
al
3069et al.: Eigenfunction analysis of acoustic aberration correction

te
ed
t
eer
ioe
oc-
urabid
ty,ac
eaowth-a
g at-
edatesee-
c-aleallaer-
l-
r-ise
mit-
e
ms-re,
iercer
nal
-er
mogeneous medium, the backscatter will be approximap1 . This is known as theBorn approximationof the scatteredsignal.
In the frequency domain, the problem will be formulatas
¹2p01S v
c0D 2
p050,
¹2p11S v
c0D 2
p15C p0 .
Here
C~r ,v!52c1~r !
c0S v
c0D 2
1F1~r !. ~3!
Thus,p1 on the transducer is found fromp0 by means of theappropriate Green’s function20 g,
p1~j,v!5E g~j2r ,v!C~r ,v! p0~r ,v!dr. ~4!
Calculations presented in this paper are obtained usingGreen’s function for the Helmholtz equation inR3,
g~r ,v!5e2 ivur u/c0
4pur u.
Throughout this paper,r denotes a coordinate in thscattering region, andj is a coordinate on the transducsurface.
B. Modeling of the received scattered signal
The situation studied here is one where all aberrattakes place in a region close to the transducer, while all msured scattering emerges from a region close to the fpoint. This is a situation typical for medical ultrasound imaging. The body wall, consisting of a heterogeneous mixtof fat, muscle, and connective tissue, produces considerdistortion of the propagating pulse, while the organs insthe body have very little impact to this effect.11
Instead of dealing withr1 , k1 , andc1 directly, letC bean appropriate scattering distribution. For simpliciC(r ,v) is assumed to be a spatial point process for efrequencyv, such that the ‘‘covariance function’’RC is pro-portional to the Diracd function,
RC~r 22r 1 ,v!5E@C~r 1 ,v!C~r 2 ,v!#
5H sv2 d~ ur 22r 1u!, r 1 ,r 2PV
0 otherwise.
Here E@•# is the expectation operator,sv2 is the intensity of
the point process21 at frequencyv, and V is the scatteringregion.
A common assumption is that the aberration introducby the body wall is the same for all locations within the foczone. This is valid as long as the focal zone is narrenough, i.e., located within what is referred to asisoplanatic patch or region.11 Using this assumption, propagation through the body wall may be modeled by propag
3070 J. Acoust. Soc. Am., Vol. 115, No. 6, June 2004
ly
he
na-al
ele
e
h
dl
e
t-
ing through a homogeneous medium and then applyinfilter. The received signalpr is thus obtained from the scatered signalp1 as
pr~j,v!5s~j,v! p1~j,v!.
The functions, which accounts for the aberration, is denotgeneralized screen. The time-reversal argument implies thtransmitting a pulsep(j,v) through the aberrating layer, thbeam pattern in the focal zone will be as if the puls(j,v) p(j,v) was transmitted through a homogeneous mdium.
As the aberration is mainly introduced by tissue strutures in the body wall, it does not change over the time scof the imaging process. Therefore, keeping the body wfixed relative to the transducer, scattering from withingiven isoplanatic region will have undergone the same abration. The functions(j) is therefore the same for all reaizations.
In the rest of this paper, all computations will be peformed in the temporal frequency domain, unless otherwstated. Explicit dependence ofv in quantities like pressurepulses, screens, and scatterer distributions is therefore oted. Hence, the fieldp0(r ), for a transmitted pulsep, geo-metrically focused atr f , is given as
p0~r !5 pETL~j!
e2 i ~v/c0!~ ur 2ju1ur f2ju2ur f u!
4pur 2judj,
whereL(j)5s(j) l (j), and l (j) is the apodization functionused on transmit. HereT indicates that integration is donover the transducer surface.
Applying the Fraunhofer approximation, valid for largefnumbers, the transmitted field is given by
p0~r !5 pe2 ivur u/c0
4pur uLS v
c0er D , ~5!
whereer5r /ur u and L denotes the spatial Fourier transforof L obtained whenL is extended by zero outside the tranducer aperture. The pressure in the far field is, therefoapproximately a spherical wave modified by the Fourtransform of the product of the screen and the transduapodization.
The scattered pressure fieldp1 at a coordinatej on thetransducer is now calculated using Eq.~4! as
p1~j!5EV
eivuj2r u/c0
4puj2r uC~r !p0~r !dr. ~6!
The Fraunhofer approximation then gives the received sigat the transducer surface as
pr~j!5s~j!eivuj2r f u/c0
4pur f u
3EV
expS iv
c0
j•r
ur f uDC~r ! p0~r !dr.
The term expivuj2r fu/c0/4pur f u represents geometric curvature of this signal, and is customarily removed before furthprocessing. The measured signal is thus defined as
Varslot et al.: Eigenfunction analysis of acoustic aberration correction

-
is-h
t c
th
io
or
e
re
am
-n
ue
e
onsval-en-
n-
rans-
hesed
ncy.
ithcy-
cer
t
there-
pm~j!5s~j!EV
expS iv
c0
j•r
ur f uDC~r ! p0~r !dr.
The corresponding~spatial! covariance function for a frequencyv is given as
Rpm~j1 ,j2!5E@ pm~j1!pm~j2!#
5s~j1!s~j2!s2EV
expS iv
c0
~j12j2!•r
ur f uD
3u p0~r !u2dr. ~7!
Here use has been made of the fact that the scatterer dbution is d correlated. Strictly speaking, it is the timedependent received signal at each transducer element wis a zero-mean Gaussian stochastic process. Thus, Eq.~7! isreally the cross spectrum between the received signal aordinatesj1 and j2 as a function ofv. However, for thepurpose of this paper, it is more convenient to considercross spectrum as a function ofj1 and j2 for a fixed fre-quencyv. This is therefore denoted the covariance functfor the received signal at frequencyv.
1. Eigenfunction formulation for random signals
Let pm(j) be the measured signal at locationj on thetransducer surface. This is now assumed to be a second-random field~as a function of space for each frequency!. Letx be a complexL2 function with norm 1, and define thstochastic linear functionalLx as
Lxpm5^ pm ,x&5ETpm~j!x~j!dj,
where T indicates integration over the transducer apertuThen
iLxpmi2[E@LxpmLxpm#
5ET2
x~j1!x~j2!E@ pm~j1!pm~j2!#dj1 dj2
5ET2
x~j1!x~j2!Rpm~j1 ,j2!dj1 dj2 .
Physically, Lxpm may be interpreted as amodified beam-former output signal. The quantityiLxpmi2 is the variance ofthe signal, i.e., the expected energy of the modified beformer output.
Define the positive semidefinite linear operatorA as
Ax~j!5ETRpm
~j,j2!x~j2!dj2 . ~8!
Now
iLxpmi25E@ uLxpmu2#5^Ax,x&.
The operatorA is Hermitian and compact with kernel function Rpm
. Therefore, all eigenvalues are real and nonegative, eigenfunctions belonging to distinct eigenvalare orthogonal and there exists a largest eigenvalue.22 It fol-lows that the expected energy of the modified beamformoutput signal is maximized whenx is an eigenfunction ofAassociated with the largest eigenvalue.
J. Acoust. Soc. Am., Vol. 115, No. 6, June 2004 Varslot
tri-
ich
o-
e
n
der
.
-
-s
r
The eigenvalues and their corresponding eigenfunctimay be ordered according to the magnitude of the eigenues. The eigenfunction associated with the largest eigvalue, denotedl1 , is then referred to asx1 and so on.
2. Focusing properties
In order to investigate further the properties of the eigefunctions of the operatorA defined in Eq.~8!, consider
^Ax,x&5ET2
Rpm~j1 ,j2!x~j2!x~j1!dj2 dj1 .
Using Rpmfrom Eq. ~7! and defininga(r ) to be
a~r !5ETs~j!x~j! expS i
v
c0
j•r
ur f uDdj, ~9!
this may be expressed as
^Ax,x&5s2EV
u p0~r !u2ua~r !u2dr. ~10!
Furthermore, transmitting the pulsex(j) p, geometrically fo-cused atr f , will have the far-field approximation
pcor~r !5 pe2 ivur u/c0
4pur ua~r !. ~11!
This expression assumes that no apodization is used on tmit for the corrected pulse, i.e.,l (j)51 when compared toEq. ~5!. Thus, correcting the transmitted pulse using teigenfunctionx1 as an aberration correction filter, will focuthe transmitted energy according to the initially transmittfield p0 , in order to maximize Eq.~10!. Note that there is aseparate eigenvalue problem to be solved for each freque
Consider first the extreme case whenu p0(r )u51, i.e., thetransmitted field insonifies the whole scattering region wequal intensity. Assume also that the scattering region islindrical with heightd and radiusR ~see Fig. 1!. Noting thata(r ) is independent of the distance from the transdualong the focal axis, then
^Ax,x&5s2EV
ua~r !u2 dr
5s2ET2
s~j1!s~j2!x~j2!x~j2!L dj1 dj2 ,
where
L5dRJ1~Rvuj12j2u/c0ur f u!
vuj12j2u/c0ur f u,
and J1 is the Bessel function of first kind. In the currensituation v/c0ur f u;105. As a consequence of this,L;d(uj12j2u). The largest possible value^Ax,x& is thereforeobtained ifuxu2 is proportional tousu2. The amplitude of theeigenfunctionx1 thus matches that ofs. A shift of the cor-rected focus will not influence the eigenvalue, as long asfocus is kept within the scattering region. The phase is thefore not determined.
3071et al.: Eigenfunction analysis of acoustic aberration correction

ee-
l in
sit
he
eethicha
a
,
to
t-
nt
gom
nt
dis-
edea
nally,
nt,sig-atic
ated-
re
ped
In the other extreme case, whenp0(r )5d(ur 2r f u) is theDirac d function, then
^Ax,x&5s2ua~r f !u25s2U ETs~j!x~j!djU2
.
The maximum for this expression is obtained ifx is propor-tional tos. Thus, the eigenfunctionx1 will be proportional tothe screen.
In the general case, which lies somewhere between thtwo extremes, it is difficult to find a direct relationship btween the screenx1 and s. Let 1/ur u be approximated by1/ur f u in the region wherep0(r ) is significantly differentfrom zero, i.e., the region which contributes to the integraEq. ~10!. Combining Eqs.~10! and ~11! yields
^Ax,x&S u pu4pur f u
D 2
5s2EV
u p0~r !u2u pcor~r !u2 dr.
The intensity of the transmit signal usingx1 as a correctionfilter will, therefore, be focused into areas where the intenof p0(r ) was high.
It is worth noting that there is an upper bound for tlargest eigenvalue since
S u pu4pur f u
D 2
^Ax,x&<s2i p0i42i pcori4
2. ~12!
Furthermore,
i pcori44;E
T4b~j1!b~j2!b~j3!b~j4!L
3dj1 dj2 dj3 dj4 , ~13!
where
b~j!5s~j!x~j!,
L5dRJ1~Rvuj12j21j32j4u/c0ur f u!
~vuj12j22j31j4u/c0ur f u!.
Again, sinceL;d(uj12j21j32j4u),
i pcori44;E
T3b~j1!b~j2!b~j3!b~j12j21j3!
3dj1 dj2 dj3 .
Maximum for i pcori42 is attained when the phase ofb is zero,
i.e., the phase ofx is equal to that ofs. Inequality ~12! is,however, an equality ifu pcor(r )u is proportional tou p0(r )u.An iterative correction process is therefore suggested, whthe eigenfunction associated with the largest eigenvaluused to transmit a corrected pulse. The scattering ofcorrected transmit pulse has a correlation function whthen is used to find a new eigenfunction. By repeating tprocess, no further improvement is possible only if inequity ~12! is satisfied as an equality, andi pcori4
2 attains itsmaximum.
A net prism effect of the body wall manifests itself asshift of the actual focal point from the intended location ofr f
to the locationr 0 ~see Fig. 2!. However, due to reciprocityscattering fromr 0 will appear as if emerging fromr f , whenobserved at the transducer.11 Therefore, scattering from a
3072 J. Acoust. Soc. Am., Vol. 115, No. 6, June 2004
se
y
reisishisl-
uniform distribution of scattering will always appearemerge from a location aroundr f . A consequence of this isthat observations of the screens based on such random scatering data do not contain information about the shift fromr f
to r 0 , i.e., what is observed is nots(j) but a different screens(j). The phase ofs(j) does not contain a linear componeas a function ofj,
ET
arg$s~j!%j dj5ET
argH s~j!expS 2 iv
c0
r 0•j
ur f uD J j dj50.
Now, usings(j) as a correction filter, but adding a steerinangle to the transmit beam in order to move the focus frr f to r f8 , will in fact move the focus of the transmit beamfrom r 0 to r 08 , wherer f82r f5r 082r 0 ,
s~j!expS iv
c0
~r f82r f !•j
ur f uD 5s~j!expS i
v
c0
~r f82r f2r 0!•j
ur f uD .
Therefore, a linear term~as a function ofj! in the phase ofthe correction filter is related to a shift of the focal poiaway fromr 0 . As there is no way to identify a shift fromr 0
to r f based on the available random scattering data, notinction will be made here betweens and s.
Thus far, most of the calculations have been performassuming everything is within an isoplanatic region. The idof maximizing the expected energy of the received sigmakes physical sense without this assumption. Intuitivemaximizing the energy will align the aberrated wave frothus countering the aberration experienced in the receivenal. Furthermore, studies have concluded that the isoplanassumption is justified in practical situations of interest.23
III. METHOD
The simulated ultrasound measurements were creusingABERSIM, a simulation package with routines for simulating forward propagation of an acoustic wave field24 andaberration of the ultrasonic pulse.10 In this study, only lineareffects without absorption were studied. All simulations weconducted in two dimensions~2D!. This does not alter thefundamental results, as a similar theory may be develo
FIG. 2. The actual focal point is shifted from the intended locationr f to r 0
by a net prism effect in the body wall. Thus, steering the beam towardr f8will in reality steer the beam towardr 08 .
Varslot et al.: Eigenfunction analysis of acoustic aberration correction

onon
dte
ron
exga
reterit
eronpth
ati
oca
rgm
imiouaonata
orla
byis
tothtr
t
ngin
ngt
gean
ree
husntab-onshar-udee 375,
eryn isam
nc-li-the
ber-the
ithitit
ionnd
thistheint.cor-
is
hree
char-the
m
ear
using the 2D Green’s function for the Helmholtz equatiinstead of the three-dimensional Green’s function as dhere.
A transmit pulse with center frequency of 2.5 MHz ana geometric focal point at a depth of 6.0 cm was transmitfrom a 2.0-cm-wide transducer. Thef number of the simula-tions is therefore approximately 3.0. Aberration was intduced in a 2.0-cm-thick aberrating layer close to the traducer. The acoustic scattering was produced by ad53.0-cm-thick scattering region. The scattering regiontended symmetrically about the focal plane; between ran4.5 and 7.5 cm from the transducer. The width of the sctering region wasR55 cm to either side ofr f ~see Fig. 1!. Itconsisted of a spatially uniform distribution of point scatteers, approximately 1600 scatterers per square centimEach point scatterer was independently assigned a scattintensity from a Gaussian distribution. In accordance wEq. ~3!, the scattering was simulated as proportional tov2.
Uncorrelated realizations of the backscatter signal wobtained by replacing the set of point scatterers fromsimulation to the next. In order to estimate the required stial correlation functions, 20 uncorrelated realizations ofacoustic backscatter were used.
Two different aberrators were utilized in this study;weak aberrator, and a strong aberrator. A detailed descripof them is given by Ma˚søyet al.,10 where they are referred tas w6 and s6, respectively. The weak aberrator produarrival time fluctuations with a rms value of 49.8 ns andcorrelation length of 6.4 mm. The corresponding enelevel fluctuations had a rms value of 3.1 dB with a 3.6 mcorrelation length. The strong aberrator produced arrival tfluctuations with a rms value of 53.7 ns and a correlatlength of 5.8 mm. The corresponding energy level flucttions had a rms value of 4.1 dB with 1.4 mm correlatilength. These aberrators were created to produce aberrexhibiting similar characteristics to that of published mesurements. Ma˚søy showed that almost ideal aberration crection was obtained for both aberrators using a time deand amplitude correction filter. This filter was obtainedidentifying the wave front from a known point source, andan approximation of the screens by making the phase alinear function of frequency.
The fact that a point source correction filter was foundwork well, motivates the use of this as a reference incurrent study. However, in order for this to be comparablea correction filter based random scattering, the point souwas placed in the real focal point of the transmit beamr 0 ,and not in the intended focal pointr f ~see the discussion athe end of Sec. II B 2!. It further motivates looking for a timedelay and amplitude correction filter only, instead of solvithe eigenvalue problems for each frequency and performaberration correction using a general filter.
IV. RESULTS
In the following, eigenvalues and their correspondieigenfunctions are ordered according to the magnitude ofeigenvalues. The eigenfunction associated with the lareigenvalue is then referred to as the first eigenfunction,so on.
J. Acoust. Soc. Am., Vol. 115, No. 6, June 2004 Varslot
e
d
-s-
-est-
-er.ingh
ee
a-e
on
ed
y
en-
ion--y
eoce
g
hestd
A transmit pulse was created being the sum of thpulsesu1 , u2 , andu3 . These pulses had focal pointsr f , 0.4mm to the left ofr f , and 0.4 mm to the right ofr f , respec-tively. No aberration was used for the transmitted beam, tp0 consisted of three diffraction-limited lobes with differepeak values. Aberration was introduced using the weakerrator for the scattered signal. The three first eigenfunctiwere then used to compute time delay and amplitude cacterizations of the aberration. The time delay and amplitscreens were used to correct the transmit signal. Figurshows the result with relative transmit amplitudes 1.0, 0.and 0.5 foru1 , u2 , and u3 , respectively. Time delay andamplitude estimates from the first eigenfunction are vsimilar to the reference, although an additional apodizatioincluded in the estimate. The corresponding corrected beprofiles are shown in Fig. 4. It is evident that each eigenfution focuses on a location with high initial transmit amptude. The strength of these maxima is associated withrespective eigenvalue.
A transmit pulse with a single focal pointr f was thentransmitted through the weak aberrator, producing an arated beam profile. Figure 5 displays the results usingfirst eigenfunction for correction. Again, in agreement wEq. ~10!, using the first eigenfunction focuses the transmsignal onto maxima for the amplitude of the initial transmsignal.
Figures 6 and 7 display the estimation and correctresults using a transmit pulse with a single focal point athe strong aberrator on both transmit and receive. Incase, the first eigenfunction does a good job of gatheringbeam in a narrow focus, but causes a shifted focal poHowever, using the second eigenfunction recovers therect focal point. Note that the linear term in the phase
FIG. 3. Characterizations of the aberration. The transmit pulse had tdistinct, diffraction limited focal points~not aberrated!. The acoustic back-scatter was aberrated by the weak aberrator. Time delay and amplitudeacterization was obtained from the covariance function estimated atcenter frequency~solid line! and compared to a reference obtained fropoint source simulations~dash-dot line!. Top: time delays estimated fromthe first, second, and third eigenfunctions~left to right!. Bottom: amplitudefluctuations estimated from the first, second, and third eigenfunctions~left toright!. Relative magnitude of the eigenvalues were: 1, 0.8, and 0.5. A linterm corresponding to a steering of21.4°, 216.5°, and 4.9°~left to right!was removed from the time delays before presentation.
3073et al.: Eigenfunction analysis of acoustic aberration correction

en
ogeothith
ilerachatlle
ted
en-them-
mitillit
, re-bleis
s ant inlsegetwo
pli-oodingthetheiza-nlyden-ver,d ofe adingereuffi-on
cit
lanofi
smsuTo
ngleronge of5.9°
larger for the first eigenfunction than for the second eigfunction.
In accordance with the theory, these simulations shthat eigenfunctions associated with a reasonably large eivalue have focusing properties. Furthermore, the linear ctribution to the eigenfunction phase is related to a shift offocal point relative to the focal point of a transmit beam wideal correction.
In order to improve the tightness of the focus whminimizing the shift of the focal point caused by the abertion correction, a modification of the iterative approawould be to choose among the eigenfunctions associwith reasonably large eigenvalues, the one with the sma
FIG. 4. Corrected beam profiles. The amplitude and delay screen charaization of the weak aberrator, presented in Fig. 3, was used to transmcorrected signal through the aberrator. Top: beam profiles in the focal pBottom: corrected beam profiles as a function of depth. The corrected pr~solid line! is plotted with the initial transmit pulse beam profile~dottedline!, and the ideally corrected transmit pulse~dash-dot line!.
FIG. 5. Aberration correction for the weak aberrator. An aberrated tranpulse with a single focal point was scattered, and again aberrated. Reare shown for aberration characterization from the first eigenfunction.left: estimated time delay~solid line!, reference~dash-dot line!. Top right:estimated amplitude~solid line!, reference~dash-dot line!. Bottom left:beam profiles in the focal plane, corrected using estimate~solid line!, aber-rated~dotted line!, corrected using reference~dash-dot line!.
3074 J. Acoust. Soc. Am., Vol. 115, No. 6, June 2004
-
wn-
n-e
-
edst
linear contribution to the phase. Iteration should be repeauntil one eigenvalue is dominant.
Figure 8 shows how consistently choosing the eigfunction associated with a large eigenvalue but withsmallest linear term in the screen phase will result in iproved focusing.
V. DISCUSSION
The beam profiles obtained from corrected transpulses in Fig. 4 show that the first two eigenfunctions wfocus the transmit pulse at maxima for the initial transmpulse. The corresponding eigenvalues are 1.0 and 0.8spectively. Therefore they will both result in a reasonafocusing, but at different locations. The third eigenfunctionassociated with a smaller eigenvalue~0.5!, and hence doesnot produce the same degree of focusing when used aaberration correction filter. The same trend is also apparenFig. 7 for the strong aberration. However, the corrected puhere shows a more marked split into two relatively larlobes. This is due to the severe aberration also havingmore or less equal lobes.
When comparing the estimated time delays and amtudes to their respective references, there is relatively gagreement for the first eigenfunction in the simulations usthe weak aberrator and for the second eigenfunction insimulations using the strong aberrator. The amplitude ofeigenfunction does, however, include an additional apodtion compared to the reference. Apodization is commoused to reduce the sidelobe levels at the expense of broaing the main lobe. In the presence of aberration, howeapodization may well produce increased aberration insteareduced sidelobe levels. As the eigenfunction will produccorrected transmit pulse which focuses the energy accorto Eq. ~10!, the appropriate apodization will be part of theigenfunction itself. No additional apodization is therefonecessary, and may indeed alter the transmit pulse sciently for the eigenfunction not to be a good correctifilter.
ter-ae.le
itltsp
FIG. 6. Characterizations of the aberration. The transmit pulse with a sifocal point was aberrated both on transmit and receive using the staberrator. The panel layout is the same as in Fig. 3. Relative magnitudthe eigenvalues were: 1, 0.7, and 0.4. A linear slope of 7.9°, 5.8°, and~left to right! was removed from the time delays before presentation.
Varslot et al.: Eigenfunction analysis of acoustic aberration correction
e-ol
is
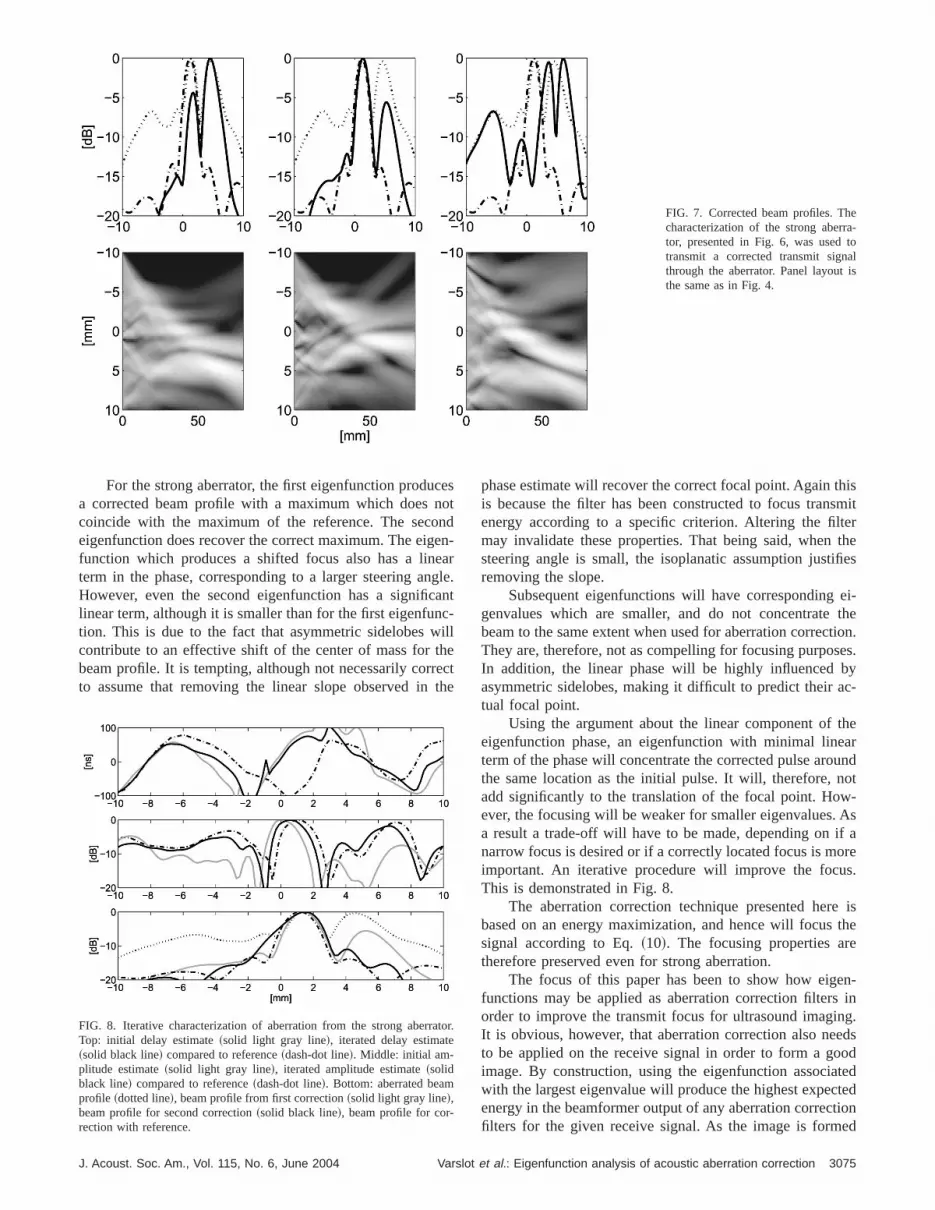
FIG. 7. Corrected beam profiles. Thcharacterization of the strong aberrator, presented in Fig. 6, was used ttransmit a corrected transmit signathrough the aberrator. Panel layoutthe same as in Fig. 4.
cenoneeagaci
thecth
hissmiterthefies
ei-the
tion.es.yc-
thearundot-
Asif aores.
e isthe
e
en-ing.
edsodtedtedtioned
to
For the strong aberrator, the first eigenfunction produa corrected beam profile with a maximum which doescoincide with the maximum of the reference. The secoeigenfunction does recover the correct maximum. The eigfunction which produces a shifted focus also has a linterm in the phase, corresponding to a larger steering anHowever, even the second eigenfunction has a significlinear term, although it is smaller than for the first eigenfuntion. This is due to the fact that asymmetric sidelobes wcontribute to an effective shift of the center of mass forbeam profile. It is tempting, although not necessarily corrto assume that removing the linear slope observed in
FIG. 8. Iterative characterization of aberration from the strong aberraTop: initial delay estimate~solid light gray line!, iterated delay estimate~solid black line! compared to reference~dash-dot line!. Middle: initial am-plitude estimate~solid light gray line!, iterated amplitude estimate~solidblack line! compared to reference~dash-dot line!. Bottom: aberrated beamprofile ~dotted line!, beam profile from first correction~solid light gray line!,beam profile for second correction~solid black line!, beam profile for cor-rection with reference.
J. Acoust. Soc. Am., Vol. 115, No. 6, June 2004 Varslot
stdn-r
le.nt-llete
phase estimate will recover the correct focal point. Again tis because the filter has been constructed to focus tranenergy according to a specific criterion. Altering the filtmay invalidate these properties. That being said, whensteering angle is small, the isoplanatic assumption justiremoving the slope.
Subsequent eigenfunctions will have correspondinggenvalues which are smaller, and do not concentratebeam to the same extent when used for aberration correcThey are, therefore, not as compelling for focusing purposIn addition, the linear phase will be highly influenced basymmetric sidelobes, making it difficult to predict their atual focal point.
Using the argument about the linear component ofeigenfunction phase, an eigenfunction with minimal lineterm of the phase will concentrate the corrected pulse arothe same location as the initial pulse. It will, therefore, nadd significantly to the translation of the focal point. However, the focusing will be weaker for smaller eigenvalues.a result a trade-off will have to be made, depending onnarrow focus is desired or if a correctly located focus is mimportant. An iterative procedure will improve the focuThis is demonstrated in Fig. 8.
The aberration correction technique presented herbased on an energy maximization, and hence will focussignal according to Eq.~10!. The focusing properties artherefore preserved even for strong aberration.
The focus of this paper has been to show how eigfunctions may be applied as aberration correction filtersorder to improve the transmit focus for ultrasound imaginIt is obvious, however, that aberration correction also neto be applied on the receive signal in order to form a goimage. By construction, using the eigenfunction associawith the largest eigenvalue will produce the highest expecenergy in the beamformer output of any aberration correcfilters for the given receive signal. As the image is form
r.
3075et al.: Eigenfunction analysis of acoustic aberration correction

re
gthmrath
ageirticeineiidse
ranet
teedremnshieathth
tea
heia
alan
ckan
ts
by
fre-
oIm-
a-J.
-,’’
alsns.
nicoc.
ss-
ra-n,’’
ing
ro-
lin-
g,ue,’’
e-per-
mu-orb-
rnson.
ionEE
from the envelope of this beamformer output, the filter thefore maximizes what has been referred to asspecklebrightness.25 Zhao and Trahey26 have suggested usinspeckle brightness as an image quality factor. Usingmeasure, the eigenfunction will not only produce an iproved transmit focus, but also result in an optimal ultsound image, when applied for aberration correction onreceived signal.
VI. CONCLUSION
Theoretical considerations of the far-field scattering ptern suggest that eigenfunctions associated with large eivalues of a Fredholm integral operator possess the desfocusing properties when used as an aberration correcfilter. The kernel function of this operator is the covarianfunction of the received stochastic backscatter. In the liming case, where the transmitted pulse is reflected from othe focal point, the operator will have only one nonzerogenvalue, and the corresponding eigenfunction will coincwith the generalized screen model for the aberration. Thianalogous to the focusing properties of eigenfunctions invtigated in Refs. 13 and 14.
Scattering simulations have been presented to illustthis property. The degree of aberration correction obtaidepends on the size of the corresponding eigenvalue relato the others.
A linear term in the phase of the eigenfunction indicathat the focal point of the corrected pulse will be shiftrelative to the initially transmitted pulse. This will therefocontribute to a shift of the corrected focal point away frothe intended focal point. Allowing the use of eigenfunctiowith a lower eigenvalue makes it possible to reduce tmovement by selecting an eigenfunction with a small linterm. This comes at the expense of the focus quality ofcorrected transmit pulse. An iterative approach whereeigenfunction with smallest linear term is used in each swill recover the lost degree of focusing, and thus giveoptimal focus recovery.
ACKNOWLEDGMENTS
This work was financed, in part, by a grant from tNorwegian Research Council, and partly by the NorwegUniversity of Science and Technology.
1M. O’Donnell and S. W. Flax, ‘‘Phase-aberration correction using signfrom point reflectors and diffuse scatterers: Measurements,’’ IEEE TrUltrason. Ferroelectr. Freq. Control35, 768–774~1988!.
2U. Haberkorn, G. Layer, V. Rudat, I. Zuna, A. Lorenz, and G. van Kai‘‘Ultrasound image properties influenced by abdominal wall thicknesscomposition,’’ J. Clin. Ultrasound21, 423–429~1993!.
3L. Hinkelman, D.-L. Liu, L. A. Metlay, and R. C. Waag, ‘‘Measuremen
3076 J. Acoust. Soc. Am., Vol. 115, No. 6, June 2004
-
is--e
t-n-edon
t-ly-eiss-
ted
ive
s
sree
p,n
n
ss.
,d
of ultrasonic pulse arrival time and energy level variations producedpropagation through abdominal wall,’’ J. Acoust. Soc. Am.95, 530–541~1994!.
4L. Hinkelman, T. D. Mast, L. Metlay, and R. C. Waag, ‘‘The effect oabdominal wall morphology on ultrasonic pulse distortion. I. Measuments,’’ J. Acoust. Soc. Am.104, 3635–3649~1998!.
5G. E. Trahey, P. D. Freiburger, L. F. Nock, and D. C. Sullivan, ‘‘In-vivmeasurements of ultrasonic beam distortion in the breast,’’ Ultrason.aging13, 71–90~1991!.
6T. D. Mast, L. Hinkelman, M. O. V. Sparrow, and R. C. Waag, ‘‘Simultion of ultrasonic pulse propagation through the abdominal wall,’’Acoust. Soc. Am.102, 1177–1190~1997!.
7T. D. Mast, L. Hinkelman, M. Orr, and R. C. Waag, ‘‘The effect of abdominal wall morphology on ultrasonic pulse distortion. II. SimulationsJ. Acoust. Soc. Am.104, 3651–3664~1998!.
8M. Fink, ‘‘Time reversal of ultrasonic fields. I. Basic prinsiples,’’ IEEETrans. Ultrason. Ferroelectr. Freq. Control39, 555–567~1992!.
9S. W. Flax and M. O’Donnell, ‘‘Phase-aberration correction using signfrom point reflectors and diffuse scatterers: Basic prinsiples,’’ IEEE TraUltrason. Ferroelectr. Freq. Control35, 758–767~1988!.
10S. E. Masøy, T. F. Johansen, and B. Angelsen, ‘‘Correction of ultrasowave aberration with a time delay and amplitude filter,’’ J. Acoust. SAm. 113, 2009–2020~2003!.
11B. A. Angelsen,Ultrasound Imaging. Waves, Signals and Signal Proceing ~Trondheim, Norway, Emantec, 2000!, Vol. 2, http://www.ultrasoundbook.com
12G. C. Ng, S. S. Worrell, P. D. Freiburger, and G. E. Trahey, ‘‘A compative evaluation of several algorithms for phase aberration correctioIEEE Trans. Ultrason. Ferroelectr. Freq. Control41, 631–643~1994!.
13T. D. Mast, A. I. Nachman, and R. C. Waag, ‘‘Focusing and imaging useigenfunctions of the scattering operator,’’ J. Acoust. Soc. Am.102, 715–725 ~1997!.
14C. Prada, J. L. Thomas, and M. Fink, ‘‘The iterative time reversal pcess,’’ J. Acoust. Soc. Am.97, 62–71~1995!.
15M. F. Hamilton and D. T. Blackstock,Nonlinear Acoustics~Academic,San Diego, 1997!.
16B. A. Angelsen, in Ref. 11, Vol. 1.17G. Taraldsen, ‘‘Derivation of a generalized westervelt equation for non
ear medical ultrasound,’’ J. Acoust. Soc. Am.109, 1329–1333~2001!.18T. D. Mast, L. Sourian, D.-L. Liu, M. Tabei, A. Nachman, and R. C. Waa
‘‘A k-space method for large-scale models of wave propagation in tissIEEE Trans. Ultrason. Ferroelectr. Freq. Control48, 341–354~2001!.
19L. A. Segel,Mathematics Applied to Continuum Mechanics~Dover, NewYork, 1987!.
20R. McOwen,Partial Differential Equations~Prentice–Hall, EnglewoodCliffs, NJ, 1996!.
21D. L. Snyder,Random Point Processes~New York, Wiley, 1975!.22E. Kreyszig,Introductory Functional Analysis~Wiley, New York, 1989!.23D. L. Liu and R. C. Waag, ‘‘Estimation and correction of ultrasonic wav
front distortion using pulse-echo data received in a two-dimensional ature,’’ IEEE Trans. Ultrason. Ferroelectr. Freq. Control45, 473–489~1988!.
24T. Varslot, G. Taraldsen, T. Johansen, and B. Angelsen, ‘‘Computer silation of forward wave propagation in non-linear, heterogeneous, absing tissue,’’ in2001 IEEE Ultrasonics Symposium Proceedings, 2001~un-published!, pp. 1193–1196.
25G. E. Trahey and S. W. Smith, ‘‘Properties of acoustical speckle pattein the presence of phase aberration. I. First order statistics,’’ UltrasImaging6, 12–28~1988!.
26D. Zhao and G. E. Trahey, ‘‘A statistical analysis of phase aberratcorrection using image quality facros in coherent imaging systems,’’ IETrans. Med. Imaging11, 446–452~1992!.
Varslot et al.: Eigenfunction analysis of acoustic aberration correction