effects of temperature, hypoxia and activity on the metabolism of atlantic cod, gadus morhua
TRANSCRIPT

Journal of Fish Biology (1997) 50, 1166–1180
Effects of temperature, hypoxia and activity on themetabolism of juvenile Atlantic cod
H. S* J. F. S
Marine Biological Laboratory, University of Copenhagen, Strandpromenaden 5,DK-3000 Helsingør, Denmark
(Received 31 March 1995, Accepted 2 January 1997)
Standard metabolic rate (SMR), active metabolic rate (AMR) and critical oxygen saturation(Scrit) were measured in Atlantic cod Gadus morhua at 5, 10 and 15) C. The SMR was 35·5, 57·0and 78·2 mg O2 kg
"1 h"1 and Scrit was 16·5, 23·2 and 30·3%, at 5, 10 and 15) C, respectively.Previously reported SMR for Atlantic cod from arctic waters at 4) C was twice that measuredat 5) C in the present study. A possible intraspecific latitudinal difference in the SMR isdiscussed. The AMR was 146·6, 197·9 and 200·4 mg O2 kg
"1 h"1 and the critical swimmingspeed (Ucrit) was 1·6, 1·7 and 1·9 at 5, 10 and 15) C, respectively. The maximum oxygenconsumption was found to be associated with exercise, rather than recovery from exercise aspreviously reported in another study of cod metabolism.? 1997 The Fisheries Society of the British Isles
Key words: metabolism; hypoxia; Pcrit; exercise; cost of ventilation; Atlantic cod; Ucrit; Gadusmorhua.
INTRODUCTION
The oxygen consumption (MO2) of fish can be separated into standard, routine
and active metabolic rate (Fry, 1971). The standard metabolic rate (SMR)corresponds to the minimum maintenance metabolism of a resting fish in a postabsorptive state. The routine metabolic rate describes a fish that is feeding,growing, producing sexual products or any other activities that elevate thestandard metabolic rate. Active metabolic rate (AMR) is the metabolic ratemeasured during swimming at maximum sustained speed (Fry, 1971; Brett 1972;Brett & Groves, 1979). In some cases MO2
can be higher than AMR, if forexample fish are forced to swim at speeds exceeding the maximum sustainableswimming speed for a limited period of time. This is termed the maximummetabolic rate (MMR) (Bushnell et al. 1994).The MO2
of resting, post-absorptive fish depends among other things ontemperature and ambient water oxygen availability. In the aquatic environment,fluctuations in the oxygen saturation often occur. Most, and maybe all teleostfishes are adapted to cope with such fluctuations and are referred to as oxygenregulators (Hughes, 1973; Rantin & Johansen, 1984), in that they maintain aconstant metabolic rate despite a decrease in ambient oxygen saturation. This isachieved mainly by increasing the respiratory volume (Randall, 1982). Withdecreasing ambient oxygen saturation, a level is reached where SMR can bemaintained no longer and this is termed the critical oxygen saturation (Scrit).Below this level, MO2
decreases linearly with decreasing oxygen saturation and
*Present address CNRS/IFREMER, Centre de Recherche en Ecologie Marine et Aquaculture, Place duSéminaire, BP 5, 17137 L’Houmeau, France.
1166
0022–1112/97/061166+15 $25.00/0/jb970387 ? 1997 The Fisheries Society of the British Isles

1167
the fish are referred to as oxygen conformers. Below Scrit, fish cannot satisfytheir oxygen needs and will eventually die. Since Scrit has been reported toincrease with increasing temperature (Fry & Hart, 1948; Fernandes & Rantin,1989), be independent of temperature (Ott et al., 1980) and to decrease withincreasing temperature (Ultsch et al., 1978), Scrit of Atlantic cod Gadus morhuaL., was determined at three temperatures to elucidate these contradictions.The metabolic scope (AMR SMR"1) of fish varies between species. The
metabolic scope of cod is reported to be low compared to that of other fishgroups like the salmonids, which may be attributed to their relatively smallamount of aerobic red muscles (Soofiani & Priede, 1985). Furthermore, theMMR of cod after feeding exceeds the MMR during exercise at both 10 and15) C and the term visceral metabolism has been proposed for this phenomenon(Priede, 1985). In cod, MMR has been reported also to be associated withrecovery from exhaustive exercise rather than with the exercise itself (Soofiani &Priede, 1985; Bushnell et al., 1994). This is unlike the majority of other fishspecies and the cod has therefore been presented as a metabolically different kindof fish (Priede, 1985). Recently, a study by Tang et al. (1994) questioned thisrelationship. They swam cod at 5) C and found no indications of a maximumMO2
in the recovery period after exercise.On the basis of the above, the oxygen consumption of cod swimming at 5, 10
and 15) C was measured to elucidate if the cod really is different from ametabolic viewpoint.
MATERIALS AND METHODS
THE FISHAtlantic cod were caught by trawl in Øresund in the vicinity of the laboratory in
Helsingør. A total of 64 fish (body mass 79–473 g and tail length 21–39 cm) was used inthis experiment. The smaller fish were used to measure SMR while the larger fish wereused to measure AMR. Fish were held in three tanks with recirculating sea water (30‰),at temperatures of 5, 10 and 15) C for several months before the experiments. They werefed commercial trout pellets and frozen mussels, and were all in good condition.The experiments of SMR were carried out during the months of September and
October 1992 and the swimming experiments were carried out from April to June 1993.The experimental room was exposed to natural light (56) N) and the photoperiod wasthus changing. In both experiments the photoperiod was between 12 and 16 h.
RESTING AND SWIMMING RESPIROMETERSSMR was measured in tubular plexiglass respirometers (7·2 cm diameter and 33 cm
long) with a volume of 1·53 l.The swimming metabolism of the cod was measured in two different sized swimming
respirometers. The length, width and height of the swimming section of the smaller was30·0#11·1#9·1 cm while the larger measured 54·5#14·9#14·3 cm. The total watercontent of the smaller swimming respirometer was 9·1 l and the content of the larger was31·5 l.The water flow was generated by a propeller and could be regulated via the power
supplied to the motor driving the propeller. Motor speed was calibrated against velocityof the water by using a water flow probe (TAD digital anemometer). Fish swimmingvelocity was corrected for the solid blocking effects according to Bell & Terhune (1970).The respirometers were submerged in water and the water temperature of the system
was kept constant (&0·1) C) by recirculating water through a cooling device (HetoFrig)equipped with a heater (Lauda) (Fig. 1).

1168 . . .
MEASUREMENT OF OXYGEN IN THE RESPIROMETEROxygen saturation (Osat) was measured with an oxygen electrode (Radiometer, E
5046), housed in a glass cuvette (Radiometer, D-616). A continuous flow of water (3·5 mlmin"1) was sucked from the respirometer past the oxygen electrode and back into therespirometer through gas-tight tygon tubes by a peristaltic roller pump (Ismatec). Thewater from the respirometer was heated to 30) C as it passed the cuvette, to obtain afaster response time from the oxygen electrode. Since the tygon tubes are impermeable togases, the heating did not result in any loss of oxygen: even the water was supersaturatedwith respect to oxygen when it passed the electrode. The electrode was calibrated withzero solution and air saturated water at the experimental temperature at least once eachday. In the experiment concerning resting metabolism an additional oxygen electrode wasused to measure and control the ambient oxygen saturation (Fig. 1).
DETERMINATION OF OXYGEN CONSUMPTIONThe method used to measure oxygen consumption was the same for resting and
swimming fish and was described in detail by Steffensen et al. (1984). The total periodused for one determination of the oxygen consumption was 10 min. At the start of theperiod, the respirometer was flushed with ambient water for 4 min after which the flushpump was turned off and the recirculation pump started. The respirometer was nowclosed for the next 6 min and the water inside was mixed by the recirculation pump or bythe propeller (in the swimming experiments). After a delay period of 1 min, which
Oxygen analyser Amplifier Computer
PrinterPower
box
ThermometerTygon tube
Oxygenelectrodes
and cuvettes
Thermostat bath
RespirometerFlushpump
Recirculation pumpMixing pump
Airstone
Nitrogen or air supply
Thermostat bath
Solenoid
153.0
140.0
30.0
10.0
F. 1. The equipment used to measure the metabolic rate of resting cod. The respirometer was flushedand closed alternately. During the flush period (4 min), the water in the respirometer wasexchanged with water from the surrounding tank. At the end of the flush period, the flush pumpwas stopped and the recirculating pump was started. Following a delay period of 1 min thatallowed the water in the respirometer to mix, the computer began collection of data fromthe oxygen electrode connected to the respirometer. This continued for 5 min after which therecirculation pump was stopped and the procedure restarted. The oxygen saturation of theambient water was measured with a second oxygen electrode, and regulated via the computer bybubbling either air or nitrogen into the water. The water temperature was regulated byrecirculating the water in the tank through a thermostatted water bath. The oxygen electrodes werehoused in glass cuvettes and, in order to generate a fast response, they were thermostatted to 30) C.See text for further details.
1169
allowed mixing of the water in the respirometer, the computer collected oxygensaturation data from the respirometer every second for the last 5 min of the period. Atthe end of the 5-min measuring period the recirculation pump was turned off and theflush pump restarted. A linear regression through the resulting 300 measurements wasused to calculate a slope (ÄOsat Ät"1) which was used to determine MO2
using thestandard formula:
MO2=aVrespáw
"1
where MO2is oxygen consumption (mg O2 kg
"1 h"1), a is the slope, Vresp is the volumeof the respirometer minus the volume of the fish (l), á is the solubility of oxygen in thewater (mg O2% Osat
"1 l"1), and w is the body weight of the fish (kg). The precisionof the MO2
determination was reflected in the regression coefficient of the slope. Themore constantly the fish was consuming oxygen during the measuring period, the closerthe regression coefficient was to 1. Smaller regression coefficients could be the result of:(1) activity during part of the measuring period which would result in an increasedMO2
and a decrease in the regression coefficient because the slope would increase whilethe fish was active; (2) a slope close to zero mainly at low temperatures where themetabolism is low.
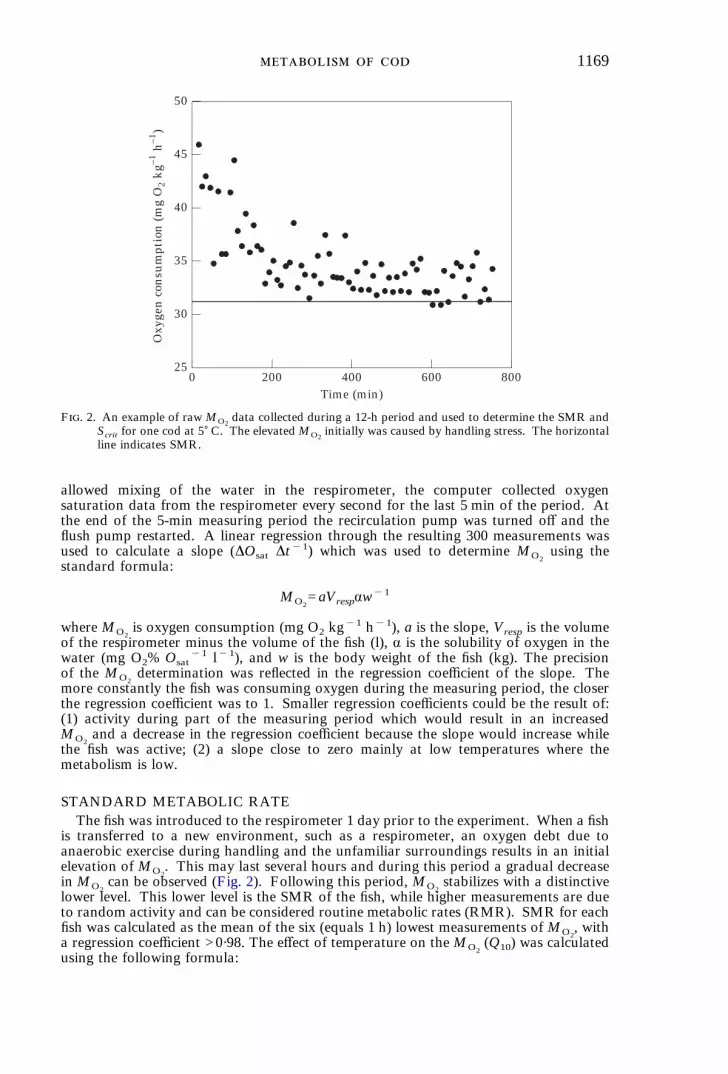
STANDARD METABOLIC RATEThe fish was introduced to the respirometer 1 day prior to the experiment. When a fish
is transferred to a new environment, such as a respirometer, an oxygen debt due toanaerobic exercise during handling and the unfamiliar surroundings results in an initialelevation of MO2
. This may last several hours and during this period a gradual decreasein MO2
can be observed (Fig. 2). Following this period, MO2stabilizes with a distinctive
lower level. This lower level is the SMR of the fish, while higher measurements are dueto random activity and can be considered routine metabolic rates (RMR). SMR for eachfish was calculated as the mean of the six (equals 1 h) lowest measurements ofMO2
, witha regression coefficient >0·98. The effect of temperature on theMO2
(Q10) was calculatedusing the following formula:
800
50
250
Time (min)
Oxy
gen
con
sum
ptio
n (
mg
O2
kg–1
h–1
)45
35
40
30
200 400 600
F. 2. An example of rawMO2data collected during a 12-h period and used to determine the SMR and
Scrit for one cod at 5) C. The elevatedMO2initially was caused by handling stress. The horizontal
line indicates SMR.

1170 . . .
where R1 and R2 are the oxygen consumption at temperatures t1 and t2, respectively.
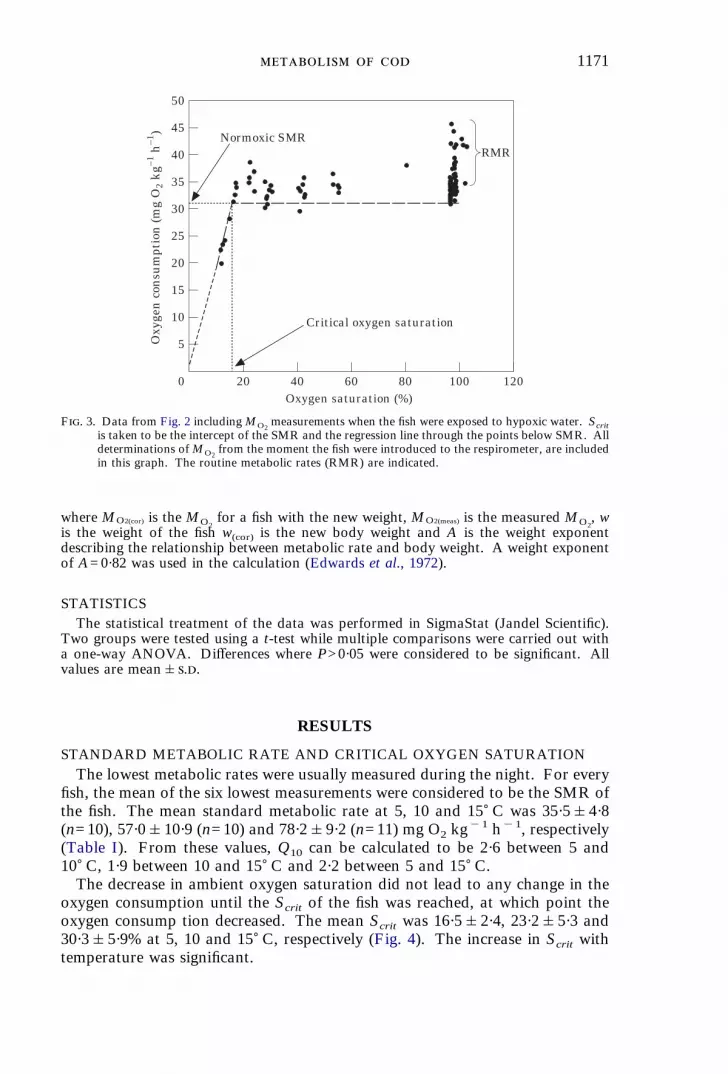
CRITICAL OXYGEN SATURATIONFollowing the determination of SMR, critical oxygen saturation (Scrit) was determined
by initiating a stepwise decrease in ambient oxygen saturation, by bubbling nitrogen inthe surrounding water-bath. Thus, a lower oxygen saturation in the respirome ter wasintroduced during the flush period. The steps were from normoxia to 60, 45, 30, 25, 20,and eventually 13% oxygen saturation. Each of these oxygen saturations was maintainedfor 30–60 min allowing three to six determinations of MO2
. At the low oxygensaturations, MO2
decreased below the SMR determined for the particular fish. Thesepoints were collected and a linear regression ofMO2
on oxygen saturation, forced throughthe origin was performed. The critical oxygen saturation was determined as the interceptbetween this regression line and the horizontal line of the SMR at normoxia (Fig. 3).
SWIMMING METABOLISMThe fish (length L) was introduced to the swimming respirometer 1 day prior to the
experiment and the water flow was maintained at a speed of 0·35–0·5 L s"1 duringthis period. An experiment was started by increasing the swimming speed in steps of0·5 L s"1 every 30 min. If the fish did not manage to swim against the current but fellback against the grid at the rear of the swimming section, the speed was briefly (<15 s)lowered to allow the fish to regain its position in the tube before the speed wasre-established. If the fish failed again, the speed was decreased by 0·25 L s"1 to obtaina possible determination of the oxygen consumption at a lower speed. The highest speedat which the fish swam for 30 min was considered to be the maximal aerobic swimmingspeed of the fish and the averageMO2
of these 30 min was used as a measure of AMR. Athigher swimming speeds,MO2
was usually higher but the fish would only sustain this fora limited time. The maximum MO2
measured (in 10-min periods) throughout theexperiment and in the recovery period was designated MMR. The critical swimmingspeed (Ucrit) of the cod was defined by the proportion of time endured at the finalswimming speed as described by Brett (1964):
where ui is the highest velocity maintained for the entire swimming period (L s"1), ti is the
amount of time spent at the exhaustion velocity (min), tii is the prescribed swimmingperiod (min) and uii is the velocity increment (L s
"1).For each cod, a plot of the average log MO2
v. swimming speed was produced. Fromthis plot, a linear regression analysis of log MO2
in relation to swimming speed wasperformed. The results could then be described in the form:
log MO2=aU+b
where MO2is the oxygen consumption (mg O2 kg
"1 h"1), U is the swimming speed(L s"1), a is the slope of the line and b is the intercept with the y-axis indicating the SMR.To compare the SMR measured and the SMR estimated from the swimming
experiment, the data of the measured SMR’s were corrected to the mean body weight ofthe swimming fish using the equation:
1171
where MO2(cor) is the MO2for a fish with the new weight, MO2(meas) is the measured MO2
, wis the weight of the fish w(cor) is the new body weight and A is the weight exponentdescribing the relationship between metabolic rate and body weight. A weight exponentof A=0·82 was used in the calculation (Edwards et al., 1972).
STATISTICSThe statistical treatment of the data was performed in SigmaStat (Jandel Scientific).
Two groups were tested using a t-test while multiple comparisons were carried out witha one-way ANOVA. Differences where P>0·05 were considered to be significant. Allvalues are mean&..
RESULTS
STANDARD METABOLIC RATE AND CRITICAL OXYGEN SATURATIONThe lowest metabolic rates were usually measured during the night. For every
fish, the mean of the six lowest measurements were considered to be the SMR ofthe fish. The mean standard metabolic rate at 5, 10 and 15) C was 35·5&4·8(n=10), 57·0&10·9 (n=10) and 78·2&9·2 (n=11) mg O2 kg
"1 h"1, respectively(Table I). From these values, Q10 can be calculated to be 2·6 between 5 and10) C, 1·9 between 10 and 15) C and 2·2 between 5 and 15) C.The decrease in ambient oxygen saturation did not lead to any change in the
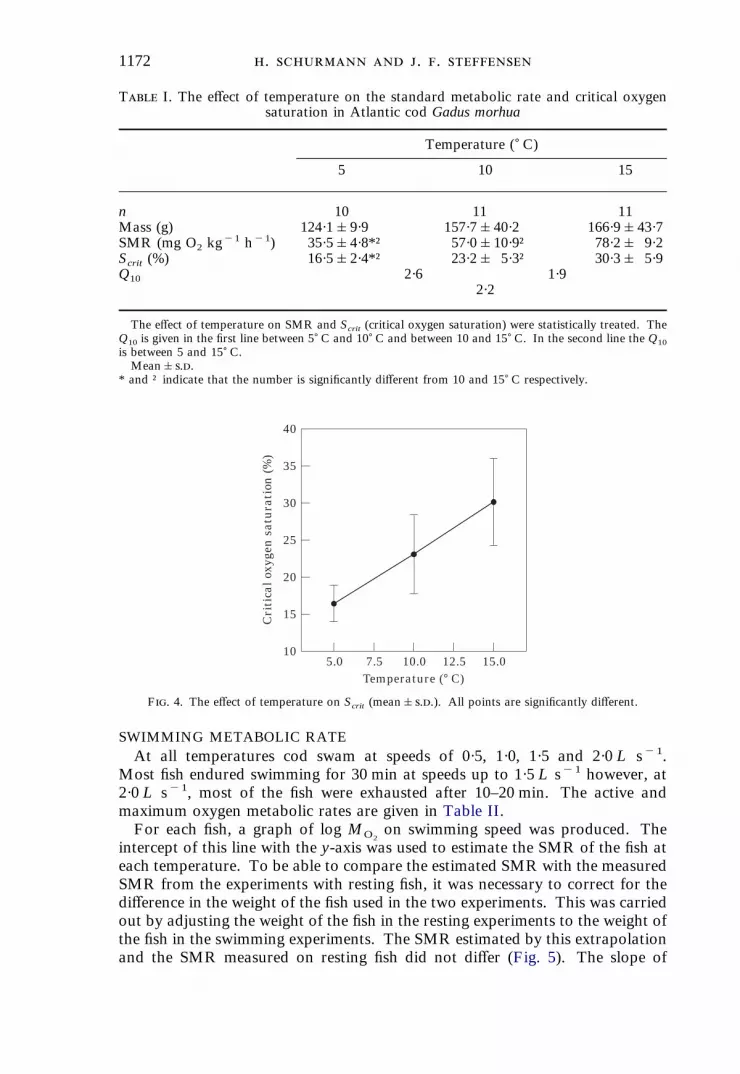
oxygen consumption until the Scrit of the fish was reached, at which point theoxygen consump tion decreased. The mean Scrit was 16·5&2·4, 23·2&5·3 and30·3&5·9% at 5, 10 and 15) C, respectively (Fig. 4). The increase in Scrit withtemperature was significant.
120
50
0Oxygen saturation (%)
Oxy
gen
con
sum
ptio
n (
mg
O2
kg–1
h–1
)40
20
30
10
20 40 60 80 100
45
35
15
25
5
Critical oxygen saturation
Normoxic SMRRMR
F. 3. Data from Fig. 2 includingMO2measurements when the fish were exposed to hypoxic water. Scrit
is taken to be the intercept of the SMR and the regression line through the points below SMR. Alldeterminations ofMO2
from the moment the fish were introduced to the respirometer, are includedin this graph. The routine metabolic rates (RMR) are indicated.
1172 . . .
SWIMMING METABOLIC RATEAt all temperatures cod swam at speeds of 0·5, 1·0, 1·5 and 2·0 L s"1.
Most fish endured swimming for 30 min at speeds up to 1·5 L s"1 however, at2·0 L s"1, most of the fish were exhausted after 10–20 min. The active andmaximum oxygen metabolic rates are given in Table II.For each fish, a graph of log MO2
on swimming speed was produced. Theintercept of this line with the y-axis was used to estimate the SMR of the fish ateach temperature. To be able to compare the estimated SMR with the measuredSMR from the experiments with resting fish, it was necessary to correct for thedifference in the weight of the fish used in the two experiments. This was carriedout by adjusting the weight of the fish in the resting experiments to the weight ofthe fish in the swimming experiments. The SMR estimated by this extrapolationand the SMR measured on resting fish did not differ (Fig. 5). The slope of
40
10
Temperature (° C)
Cri
tica
l oxy
gen
sat
ura
tion
(%
)
30
20
5.0 7.5 10.0 12.5 15.0
25
35
15
F. 4. The effect of temperature on Scrit (mean&..). All points are significantly different.
T I. The effect of temperature on the standard metabolic rate and critical oxygensaturation in Atlantic cod Gadus morhua
Temperature () C)
5 10 15
n 10 11 11Mass (g) 124·1&9·9 157·7&40·2 166·9&43·7SMR (mg O2 kg
"1 h"1) 35·5&4·8*† 57·0&10·9† 78·2& 9·2Scrit (%) 16·5&2·4*† 23·2& 5·3† 30·3& 5·9Q10 2·6 1·9
2·2
The effect of temperature on SMR and Scrit (critical oxygen saturation) were statistically treated. TheQ10 is given in the first line between 5) C and 10) C and between 10 and 15) C. In the second line the Q10is between 5 and 15) C.Mean&..
* and † indicate that the number is significantly different from 10 and 15) C respectively.

1173
200
20
Swimming speed (L s–1)
Oxy
gen
con
sum
ptio
n (
mg
O2
kg–1
h–1
)
120
90
0.0 0.5 1.0 1.5 2.0
100
160
807060
50
40
30
(n = 7)(n = 2)
F. 5. Mean MO2as a function of swimming speed at 5 (-), 10 (/) and 15) C (4). Unless otherwise
indicated, n is 9, 12 and 11 at temperatures of 5, 10 and 15) C, respectively. On the left side of thefigure the extrapolated SMR from the swimming experiments can be compared with the measuredSMR, adjusted to the weight of the swimming fish using a weight coefficient of 0·82. The error barsaround SMR predicted by the swimming experiment were obtained by extrapolating the MO2
forevery fish back to zero. There were no statistical differences between the measured SMR and theextrapolated SMR at any of the temperatures.
T II. The effect of temperature on swimming metabolic rate and performance inAtlantic cod Gadus morhua
Temperature () C)
5 10 15
n 9 12 11Mass (g) 243·3 &91·6 371·1 &124·2 298·4 &96·1SMR (mg O2 kg
"1 h"1) 47·5 &10·8 62·4 & 10·6 74·3 &20·4AMR (mg O2 kg
"1 h"1) 146·6 &32·9*† 197·9 & 34·4 206·4 &33·0MMR (mg O2 kg
"1 h"1) 178·3 &32·1*† 227·4 & 46·4 248·5 &36·6Slope of power–performance curve 0·36& 0·14 0·35& 0·09 0·28& 0·07Ucrit (L s
"1) 1·6 & 0·2† 1·7 & 0·2 1·9 & 0·2Aerobic scope (AMR SMR"1) 3·1 3·2 2·8Metabolic scope (MMR SMR"1) 3·8 3·6 3·3
Values are means&..The SMR is estimated by extrapolating the power–performance curve to zero swimming speed for each
fish. The AMR is the maximum aerobic oxygen consumption. The MMR is the maximum oxygenconsumption observed.The effect of temperature on AMR, MMR, slope of the power-performance curve and Ucrit were
statistically tested. * and † indicate that the number is significantly different from 10 and 15) Crespectively.
1174 . . .
the curve and the intercept are shown in Table II. There was no effect oftemperature on the slope.The Ucrit at 15) C was significantly higher than that at 5) C (Table II)
DISCUSSION
STANDARD METABOLIC RATEThe SMR of Atlantic cod found in the present investigation is low compared
with other published values for this species, at all temperatures (Table III). Forexample, Saunders (1963) measured the MO2
of cod of a similar size to those inthe present investigation at 15) C and found values of 130 mg O2 kg
"1 h"1
compared to 78 mg O2 kg"1 h"1 measured in the present investigation. Because
of the wide span of fish weights used in the investigations listed in Table III, thedifferences appear most clearly when looking at SMR corrected for weight.Some of the differences in MO2
may be explained on methodological grounds.Most of the MO2
measurements in Table III were made with flow throughrespirometers which, due to a lag time produced by the wash-out effect, tend tooverestimate the SMR (Steffensen, 1989) if the fish has periods of routinemetabolism. For example, if the measurements shown in Fig. 3 were carried outwith flow through respirometry, the resulting estimated SMR would be higherthan the actual SMR due to the spontaneous activity throughout the measuringperiod. It is interesting to note, however, that the SMR of 61 mg O2 kg
"1 h"1
measured at 4) C by Steffensen et al. (1994) was carried out with the same
300
Swimming speed (L s–1)
Oxy
gen
con
sum
ptio
n (
mg
O2
kg–1
h–1
)
0.0 0.5 1.0 1.5 2.5
200
150
100
60
40
2.0
4
51 2
7
8936
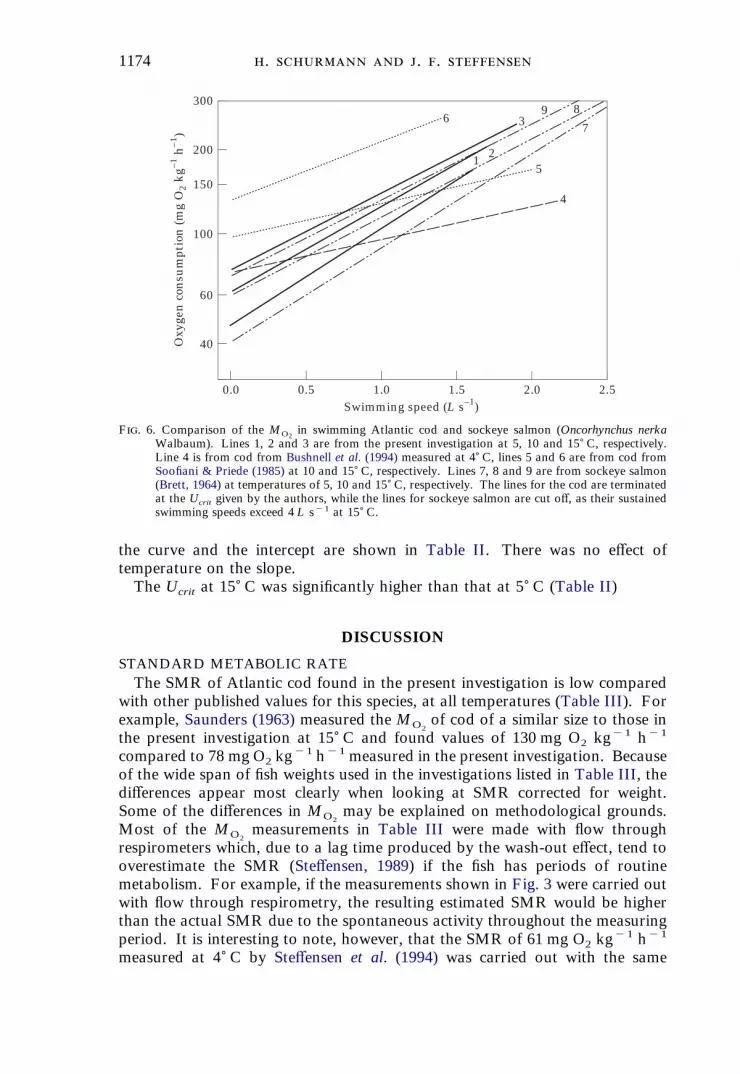
F. 6. Comparison of the MO2in swimming Atlantic cod and sockeye salmon (Oncorhynchus nerka
Walbaum). Lines 1, 2 and 3 are from the present investigation at 5, 10 and 15) C, respectively.Line 4 is from cod from Bushnell et al. (1994) measured at 4) C, lines 5 and 6 are from cod fromSoofiani & Priede (1985) at 10 and 15) C, respectively. Lines 7, 8 and 9 are from sockeye salmon(Brett, 1964) at temperatures of 5, 10 and 15) C, respectively. The lines for the cod are terminatedat the Ucrit given by the authors, while the lines for sockeye salmon are cut off, as their sustainedswimming speeds exceed 4 L s"1 at 15) C.
1175
method and equipment as used in the present investigation but their values werenearly twice as high as the SMR measured at 5) C in the present investigation. Inother words, a SMR of 61 mg O2 kg
"1 h"1 would be expected, from the presentresults, at ambient water temperatures between 10 and 15) C (Table I). Theremay be a difference, reflected in the metabolism, in the way ectothermic animalsadapt to the environment in which they live that cannot be produced by thermalacclimation alone. Factors such as season and latitude could be of importance.For example, Roberts (1964) found complete metabolic compensation (Precht,1958) of pumpkinseed sunfish Lepomis gibbosus (L.) at temperatures between 10and 17·5) C, as he found no change in the MO2
over this temperature interval.The temperature-independent MO2
plateau, however, was dependent on the daylength. Thus, within this temperature interval, the MO2
of fish acclimated to aphotoperiod of 9 h was approximately 1·5 times higher than fish acclimated to a15-h photoperiod (Roberts, 1964). The experiment of Steffensen et al., (1994)and the present one were carried out at different seasons and latitudes. Theexperiments by Steffensen et al., (1994) were carried out in constant light(midnight sun) in Greenland (69·15) N) while the present experiments werecarried out in the autumn in Denmark (56·02)N) with a photoperiod of 12–16 h.Differences in season and day length between the two experiments might explaindifferences in the SMR, but they contradict Roberts (1964) who reported thelowest MO2
at the longest photoperiod. Latitudinal differences may play a roleas Vernberg & Costlow (1966) reported that the MO2
of the fiddler crab Ucapugilator was higher in animals collected at high latitudes compared with animalsfrom lower latitudes at the same temperature. Finally, recent work by Nelsonet al., (1994) suggests that different populations of cod, living within the samegeographical range but in different environments, differ with respect to respirat-ory physiology. Environmental and latitudinal effects on intraspecific MO2
infish seems to be poorly investigated and more work is needed in this area toexplain the discrepancy in SMR of Atlantic cod observed by Steffensen et al.,(1994) and in the present investigation.
CRITICAL OXYGEN SATURATIONThe critical oxygen saturation has been reported for several species of fish.
The majority of fish can be categorized as oxygen regulators, as they are able tomaintain a constantMO2
over a range of ambient oxygen saturations. In the faceof falling oxygen availability,MO2
is maintained by increasing the ventilation ofthe gills, mainly by increasing the stroke volume (Randall, 1982).The literature on the effect of temperature on Scrit is controversial. For
example, Scrit of four out of six darters (Etheostoma) was lower at 20 than 10) C(Ultsch et al., 1978). On the other hand, Ott et al. (1980) found Pcrit for carpCyprinus carpio L., at 5) C to be 11 mmHg, and approximately 20 mmHg at 10,15 and 25) C. In the same investigation, Pcrit for rainbow trout Oncorhynchusmykiss (Walbaum) at 10, 15 and 20) C was 21, 22 and 27 mmHg, respectively. Inthe ciclid Oreochromis niloticus L., Fernandes & Rantin (1989) found Pcrit to besimilar at 20 and 25) C (19·1 and 18·0, respectively) and higher at temperaturesof 30 and 35) C (29·7 and 30·2, respectively).The present investigation shows that Scrit increases with temperature (Fig. 4)
which could be expected for a number of reasons. At higher temperatures MO2
1176 . . .
increases while oxygen solubility decreases. Consequently, at a given oxygensaturation, cold water contains more oxygen than warm water and a fish mustpump more warm than cold water, over the gills to obtain the same amount ofoxygen. In this investigation, cod at 5) C had anMO2
of 35·5 mg kg"1 h"1 and78·2 mg kg"1 h"1 at 15) C (Table I). The solubility of oxygen in 30‰ sea waterat 5 and 15) C is, respectively, 0·1033 and 0·0835 mg O2 l
"1 %"1. If the ambientoxygen saturation is 35% and it is assumed that the cod extracts 30% of theoxygen as the water passes the gills at both temperatures, the amount of waterthe fish needs to pump over the gills to maintain SMR can be calculated to be32·7 l kg"1 h"1 at 5) C and 89·2 l kg"1 h"1 at 15) C. In other words, thedecrease in oxygen solubility with increasing temperature yields a Q10 forventilation of 2·7 while Q10 for MO2
is only 2·2. A second factor that mightfurther increase Vg in warm water is the decrease in oxygen extraction withincreasing temperature. For example, Fernandes & Rantin (1989) found thatOreochromis niloticus extracted 75–80% of the oxygen at temperatures of 20 and35) C in normoxic water while it extracted 53% at 20) C, but only 35% at 35) Cin hypoxic water. As the amount of water a fish can pump over its gills is limitedby the branchial pump capacity (Farrell & Steffensen, 1987), the higher Vgneeded to maintain SMR at the higher temperatures probably explains theobservation that Scrit increase with temperature.
SWIMMING METABOLISMThe rate of increase inMO2
with increasing swimming speed is indicated by theslope in Table II. Slopes vary from 0·28 to 0·36 which is similar to valuesreported for many other species (Beamish, 1978). However, quite low and evenno (Tytler, 1978) slopes have previously been reported for Atlantic cod. Soofiani& Priede (1985) reported the slope to be 0·12 at 10) C and 0·22 at 15) C, andBushnell et al. (1994) found the slope to be 0·12 at 4) C. These differences areillustrated in Fig. 6. Low slopes can result from spontaneous activity or stress atlow swimming speeds which would tend to increaseMO2
which would result in aline with a small slope and a high y-intercept (=SMR) (Brett, 1964). SMRestimates based on extrapolation to zero swimming speed by Bushnell et al.(1994), however, were in close agreement with SMR experiments performedconcurrently by Steffensen et al. (1994) (Table III).Another explanation could be an increase in the fraction of anaerobic
metabolism accompanying an increase in swimming speed. There may be agradual increase in the recruitment of anaerobically active white muscle fibreswith increasing swimming speed in gadoid fishes (Johnston & Goldspink, 1973;Nelson et al., 1994), and this would tend to reduce the slope (Brett, 1964). Thiswould have only a minor influence on the intercept because the anaerobicmetabolism is low or absent at low swimming speeds.Finally, as previously mentioned, there may be an intraspecific effect of the
latitude on SMR. If the SMR for populations at high latitudes is high and theAMR is unchanged (compare lines 1 and 4 in Fig. 6) the slope of high latitudefish from Greenland (Bushnell et al., 1994) would be much less than the slopereported in the present study. This, however, indicates that it should beenergetically cheaper for a high latitude fish to swim at a given speed, which isunlikely.
1177
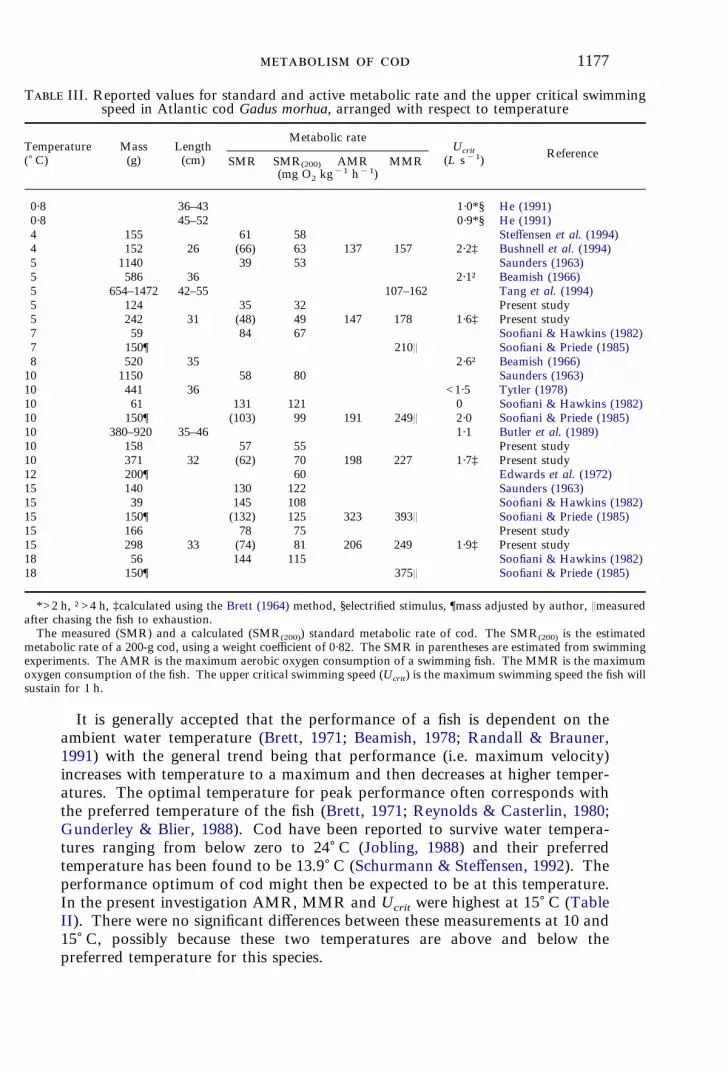
It is generally accepted that the performance of a fish is dependent on theambient water temperature (Brett, 1971; Beamish, 1978; Randall & Brauner,1991) with the general trend being that performance (i.e. maximum velocity)increases with temperature to a maximum and then decreases at higher temper-atures. The optimal temperature for peak performance often corresponds withthe preferred temperature of the fish (Brett, 1971; Reynolds & Casterlin, 1980;Gunderley & Blier, 1988). Cod have been reported to survive water tempera-tures ranging from below zero to 24) C (Jobling, 1988) and their preferredtemperature has been found to be 13.9) C (Schurmann & Steffensen, 1992). Theperformance optimum of cod might then be expected to be at this temperature.In the present investigation AMR, MMR and Ucrit were highest at 15) C (TableII). There were no significant differences between these measurements at 10 and15) C, possibly because these two temperatures are above and below thepreferred temperature for this species.
T III. Reported values for standard and active metabolic rate and the upper critical swimmingspeed in Atlantic cod Gadus morhua, arranged with respect to temperature
Temperature() C)
Mass(g)
Length(cm)
Metabolic rateUcrit
(L s"1) ReferenceSMR SMR(200) AMR MMR
(mg O2 kg"1 h"1)
0·8 36–43 1·0*§ He (1991)0·8 45–52 0·9*§ He (1991)4 155 61 58 Steffensen et al. (1994)4 152 26 (66) 63 137 157 2·2‡ Bushnell et al. (1994)5 1140 39 53 Saunders (1963)5 586 36 2·1† Beamish (1966)5 654–1472 42–55 107–162 Tang et al. (1994)5 124 35 32 Present study5 242 31 (48) 49 147 178 1·6‡ Present study7 59 84 67 Soofiani & Hawkins (1982)7 150¶ 210Q Soofiani & Priede (1985)8 520 35 2·6† Beamish (1966)10 1150 58 80 Saunders (1963)10 441 36 <1·5 Tytler (1978)10 61 131 121 0 Soofiani & Hawkins (1982)10 150¶ (103) 99 191 249Q 2·0 Soofiani & Priede (1985)10 380–920 35–46 1·1 Butler et al. (1989)10 158 57 55 Present study10 371 32 (62) 70 198 227 1·7‡ Present study12 200¶ 60 Edwards et al. (1972)15 140 130 122 Saunders (1963)15 39 145 108 Soofiani & Hawkins (1982)15 150¶ (132) 125 323 393Q Soofiani & Priede (1985)15 166 78 75 Present study15 298 33 (74) 81 206 249 1·9‡ Present study18 56 144 115 Soofiani & Hawkins (1982)18 150¶ 375Q Soofiani & Priede (1985)
*>2 h, †>4 h, ‡calculated using the Brett (1964) method, §electrified stimulus, ¶mass adjusted by author, Qmeasuredafter chasing the fish to exhaustion.The measured (SMR) and a calculated (SMR(200)) standard metabolic rate of cod. The SMR(200) is the estimated
metabolic rate of a 200-g cod, using a weight coefficient of 0·82. The SMR in parentheses are estimated from swimmingexperiments. The AMR is the maximum aerobic oxygen consumption of a swimming fish. The MMR is the maximumoxygen consumption of the fish. The upper critical swimming speed (Ucrit) is the maximum swimming speed the fish willsustain for 1 h.
1178 . . .
As can be seen in this and other studies (Table III), both AMR and MMR forAtlantic cod increase with temperature. There seems, however, to be only asmall effect of temperature on the magnitude of Ucrit. Conclusions regardingUcrit from this table should be made with caution as the size of fish and methodsused span considerably.Based on a study of metabolic scope of cod by Soofiani & Priede (1985) it was
concluded that maximum MO2occurred during recovery from exhaustive exer-
cise rather than during the exercise. Soofiani & Priede (1985) chased fish in atank until exhaus tion, then placed them in a respirometer and measured peakMO2
1–2 h after exercise. The peak value measured in this manner was 40%higher than the maximum MO2
obtained in a swim tunnel at the sametemperature. More recently this finding has been supported by Bushnell et al.(1994) who recorded a maximum MO2
during the first 10 min of recovery whichwas 15% higher than during swimming at Ucrit for both Atlantic cod andGreenland cod Gadus ogac Richardson. Differences in time when maximumMO2
was recorded in these two studies can be explained by the different methods usedto measureMO2
. Soofiani & Priede (1985) exhausted their fish by chasing it in atank and then transferred it to a flow-through respirometer. They describe thatthey were able to transfer the fish with a net without struggling. After thistreatment it could only be expected that the maximum oxygen consumptionwould occur after some time. Furthermore, the method of flow-throughrespirometry introduces a lag time due to the wash-out effect (Steffensen, 1989).In the experiment of Bushnell et al. (1994) no lag time occurred since the methodused was the same intermittent flow respirometry as used in the present study. Inthe present study, the oxygen consumption was followed for 2 h after exerciseceased and maximum oxygen consumption was always measured during theperiod of exercise. This is in accordance with the study on Atlantic cod by Tanget al. (1994) and thus supports their view that the respiratory physiology ofAtlantic cod is not unlike that of other fishes.
Financial support from the University of Copenhagen, the Carlsberg Foundation andthe Danish Natural Science Research Foundation is gratefully acknowledged. Specialthanks are given to M. Allerup and P. Dumitriu for their assistance with the experiments.
References
Beamish, F. W. H. (1966). Swimming endurance of some northwest Atlantic fishes.Journal of the Fisheries Research Board of Canada 23, 341–347.
Beamish, F. W. H. (1978). Swimming capacity. In Fish Physiology, Vol. 7 (Hoar, W. S.& Randall, D. J., eds), pp. 101–187. New York: Academic Press.
Bell, W. H. & Terhune, L. D. B. (1970). Water tunnel design for fisheries research.Fisheries Research Board of Canada Technical Reports 195, 1–69.
Brett, J. R. (1964). The respiratory metabolism and swimming performance of youngsockeye salmon. Journal of the Fisheries Research Board of Canada 21, 1183–1226.
Brett, J. R. (1971). Energetic responses of salmon to temperature. A study of somethermal relations in the physiology and freshwater ecology of sockeye salmon(Oncorhynchus nerka). American Zoologist 11, 99–113.
Brett, J. R. (1972). The metabolic demand for oxygen in fish, particularly salmonids, anda comparison with other vertebrates. Respiration Physiology 14, 151–170.
1179
Brett, J. R. & Groves, T. D. D. (1979). Physiological energetics. In Fish Physiology, Vol.8 (Hoar, W. S., Randall, D. J. & Brett, J. R., eds), pp. 279–352. New York:Academic Prerss.
Bushell, P. G., Steffensen, J. F., Schurmann, H. & Jones, D. R. (1994). Exercisemetabolism in two species of cod in arctic waters. Polar Biology 14, 43–48.
Butler, P. J., Axelsson, M., Ehrenström, F., Metcalfe, J. D. & Nilsson, S. (1989).Circulating catecholamines and swimming performance in the Atlantic cod, Gadusmorhua. Journal of Experimental Biology 141, 377–387.
Edwards, R. R. C., Finlayson, D. M. & Steele, J. H. (1972). An experimental study of theoxygen consumption, growth, and metabolism of the cod (Gadus morhua L.).Journal of Experimental Marine Biology and Ecology 8, 299–309.
Farrell, A. P. & Steffensen, J. F. (1987). An analysis of the energetic cost of the branchialand cardiac pumps during sustained swimming in trout. Fish Physiology andBiochemistry 4, 73–79.
Fernandes, M. N. & Rantin, F. T. (1989). Respiratory responses of Oreochromis niloticus(Pisces, Cichlidae) to environmental hypoxia under different thermal conditions.Journal of Fish Biology 35, 509–519.
Fry, F. E. J. (1971). The effect of environmental factors on the physiology of fish. In FishPhysiology, Vol. 6 (Hoar, W. S. & Randall, D. J., eds), pp. 1–98. New York:Academic Press.
Fry, F. E. J. & Hart, J. S. (1948). The relation of temperature to oxygen consumption inthe goldfish. Biological Bulletin 94, 66–77.
Gunderley, H. & Blier, P. (1988). Thermal acclimation in fish: conservative and labileproperties of swimming muscle. Canadian Journal of Zoology 66, 1105–1115.
He, P. (1991). Swimming endurance of the Atlantic cod, Gadus morhua L., at lowtemperatures. Fisheries Research 12, 65–73.
Holeton, G. F. (1980). Oxygen as an environmental factor of fishes. In EnvironmentalPhysiology of fishes (Ali, M. A., ed.), pp. 7–32. London: Plenum Press.
Hughes, G. M. (1973). Respiratory responses to hypoxia in fish. American Zoologist 13,475–489.
Jobling, M. (1988). A review of the physiological and nutritional energetics of cod, Gadusmorhua L., with particular reference to growth under farmed conditions.Aquaculture 70, 1–19.
Johnston, I. A. & Goldspink, G. (1973). A study of glycogen and lactate in the myotomalmuscles and liver of the coalfish (Gadus virens L.) during sustained swimming.Journal of the Marine Biological Association of the United Kingdom 53, 17–26.
Nelson, J. A., Tang, Y. & Boutilier, R. G. (1994). Differences in exercise physiologybetween two Atlantic cod (Gadus morhua) populations from different environ-ments. Physiological Zoology 67, 230–254.
Ott, M. E., Heisler, N. & Ultsch, G. R. (1980). A re-evaluation of the relationshipbetween temperature and the critical oxygen tension in freshwater fishes. Com-parative Biochemistry and Physiology 67A, 337–340.
Precht, H. (1958). Concepts of the temperature adaptation of unchanging reactionsystems of cold-blooded animals. In Physiological Adaptations (Prosser, C. L.,ed.), pp. 50–78. Washington DC: American Association for the Advancement ofScience.
Priede, I. G. (1985). Metabolic scope in fishes. In Fish Energetics New Perspectives(Tytler, P. & Calow, P., eds), pp. 33–64. London: Croom Helm.
Randall, D. (1982). The control of respiration and circulation in fish during exercise andhypoxia. Journal of Experimental Biology 100, 275–288.
Randall, D. & Brauner, C. (1991). Effects of environmental factors on exercise in fish.Journal of Experimental Biology 160, 113–126.
Rantin, F. T. & Johansen, K. (1984). Responses of the teleost Hoplias malabaricus tohypoxia. Environmental Biology of Fishes 11, 221–228.
Rantin, F. T., Kalinin, A. L., Glass, M. L. & Fernandes, M. N. (1992). Respiratoryresponses to hypoxia in relation to mode of life of two erythrinid species (Hopliasmalabaricus and Hoplias lacerdae). Journal of Fish Biology 41, 805–812.
1180 . . .
Reynolds, W. W. & Casterlin, M. E. (1980). The role of temperature in the environ-mental physiology of fishes. In Environmental Physiology of Fishes (Ali, M. A.,ed.), pp. 497–518. New York: Plenum Press.
Roberts, J. L. (1964). Metabolic responses of freshwater sunfish to seasonal photo-periods and temperatures. Helgoländer Wissenschaftliche Meeresuntersuchungen9, 459–473.
Saunders, R. L. (1963). Respiration of the Atlantic cod. Journal of the Fisheries ResearchBoard of Canada 20, 373–386.
Scheid, P. (1987). Cost of breathing in water- and air-breathers. In ComparativePhysiology: Life in Water and on Land (Dejours, P., Bolis, L., Taylor, C. R. &Weibel, E. A., eds), pp. 83–92. Fidia Research Series, Padova: IX-Liviana press.
Schurmann, H. & Steffensen, J. F. (1992). Lethal oxygen levels at different temperaturesand the preferred temperature during hypoxia of the Atlantic cod, Gadus morhuaL. Journal of Fish Biology 41, 927–934.
Schurmann, H. & Steffensen, J. F. (1994). Spontaneous swimming activity of Atlanticcod, Gadus morhua exposed to graded hypoxia at three temperatures. Journal ofExperimental Biology 197, 129–142.
Soofiani, N. M. & Hawkins, A. D. (1982). Energetic costs at different levels of feeding injuvenile cod, Gadus morhua L. Journal of Fish Biology 21, 577–592.
Soofiani, N. M. & Priede, I. G. (1985). Aerobic metabolic scope and swimmingperformance in juvenile cod, Gadus morhua L. Journal of Fish Biology 26,127–138.
Steffensen, J. F. (1989). Some errors in respirometry of aquatic breathers: how to avoidand correct for them. Fish Physiology and Biochemistry 6, 49–59.
Steffensen, J. F. & Lomholt, J. P. (1983). Energetic cost of active branchial ventilationin the sharksucker, Echeneis naucratus. Journal of Experimental Biology 103,185–192.
Steffensen, J. F., Johansen, K. & Bushnell, P. G. (1984). An automated swimmingrespirometer. Comparative Biochemistry and Physiology 79A, 437–440.
Steffensen, J. F., Bushnell, P. G. & Schurmann, H. (1994). Oxygen consumption in fourspecies of teleosts from Greenland: no evidence of metabolic cold adaptation.Polar Biology 14, 49–54.
Tang, Y., Nelson, J. A., Reidy, S. P., Kerr, S. R. & Boutilier, R. G. (1994). A reappraisalof activity metabolism in Atlantic cod (Gadus morhua). Journal of Fish Biology 44,1–10.
Tytler, P. (1978). The influence of swimming performance on the metabolic rate ofgadoid fish. In Physiology and Behaviour of Marine Organisms (McLusky, D. S. &Berry, A. J., eds), pp. 82–93. Oxford: Pergamon Press.
Ultsch, G. R., Boschung, H. & Ross, M. J. (1978). Metabolism, critical oxygen tension,and habitat selection in darters (Etheostoma). Ecology 59, 99–107.
Vernberg, F. J. & Costlow, J. D. Jr (1966). Studies on the physiological variationbetween tropical and temperate zone fiddler crabs of genus Uca. IV. Oxygenconsumption of larvae and young crabs reared in the laboratory. PhysiologicalZoology 39, 36–52.