haemoglobin genotypes in cod (gadus morhua l): their geographic distribution and physiological...
TRANSCRIPT
Comparative Biochemistry and Physiology, Part A 166 (2013) 158–168
Contents lists available at SciVerse ScienceDirect
Comparative Biochemistry and Physiology, Part A
j ourna l homepage: www.e lsev ie r .com/ locate /cbpa
Review
Haemoglobin genotypes in cod (Gadus morhua L): Their geographicdistribution and physiological significance
Stine D. Ross a,⁎, Jane W. Behrens a, Keith Brander a, Caroline Methling b, Jarle Mork c
a Technical University of Denmark, National Institute of Aquatic Resources, Charlottenlund Castle, 2920 Charlottenlund, Denmarkb Marine Biological Section, Department of Biology, University of Copenhagen, Strandpromenaden 5, 3000 Helsingør, Denmarkc Department of Biology, Norwegian University of Science and Technology, Høgskoleringen 5, 7491 Trondheim, Norway
⁎ Corresponding author. Tel.: +45 22393816.E-mail address: [email protected] (S.D. Ross).
1095-6433/$ – see front matter © 2013 Elsevier Inc. Allhttp://dx.doi.org/10.1016/j.cbpa.2013.05.025
a b s t r a c t
a r t i c l e i n f oArticle history:Received 27 March 2013Received in revised form 21 May 2013Accepted 24 May 2013Available online 30 May 2013
Keywords:CodDistributionGadus morhuaGrowthHaemoglobinPhysiology
Haemoglobin polymorphism in cod (Gadus morhua L) has been investigated throughout the last 50 years.Field studies have shed light on the geographic distribution of the two common alleles (HbI1 and HbI2),and laboratory studies have shown effects of genotype on physiological traits such as growth, reproductionand hypoxia tolerance. The geographic distribution of alleles shows a correlation with temperature, with in-creasing frequency of HbI1 in warmer areas. This is likely due to temperature-related differences in oxygenaffinity of the three genotypes. We provide a general ecological introduction to cod haemoglobin polymor-phism and a detailed discussion of physiological studies, particularly laboratory growth studies. Although dif-ferences in oxygen uptake are almost certainly a contributory mechanism to observed differences in traitssuch as growth rate, many other environmental, behavioural and social factors may also contribute, makingit difficult to quantify the effect of HbI either experimentally or in the field.
© 2013 Elsevier Inc. All rights reserved.
Contents
1. Introduction . . . . . . . . . . . . . . . . . . . . . . . . . . . . . . . . . . . . . . . . . . . . . . . . . . . . . . . . . . . . . . 1582. Distribution . . . . . . . . . . . . . . . . . . . . . . . . . . . . . . . . . . . . . . . . . . . . . . . . . . . . . . . . . . . . . . 1603. Physiological performance. . . . . . . . . . . . . . . . . . . . . . . . . . . . . . . . . . . . . . . . . . . . . . . . . . . . . . . . 161
3.1. Temperature preference . . . . . . . . . . . . . . . . . . . . . . . . . . . . . . . . . . . . . . . . . . . . . . . . . . . . . 1613.2. Oxygen transport . . . . . . . . . . . . . . . . . . . . . . . . . . . . . . . . . . . . . . . . . . . . . . . . . . . . . . . . 1623.3. Hypoxia tolerance . . . . . . . . . . . . . . . . . . . . . . . . . . . . . . . . . . . . . . . . . . . . . . . . . . . . . . . . 1633.4. Growth . . . . . . . . . . . . . . . . . . . . . . . . . . . . . . . . . . . . . . . . . . . . . . . . . . . . . . . . . . . . . 163
4. Discussion and conclusion . . . . . . . . . . . . . . . . . . . . . . . . . . . . . . . . . . . . . . . . . . . . . . . . . . . . . . . . 166Acknowledgement . . . . . . . . . . . . . . . . . . . . . . . . . . . . . . . . . . . . . . . . . . . . . . . . . . . . . . . . . . . . . . 167References . . . . . . . . . . . . . . . . . . . . . . . . . . . . . . . . . . . . . . . . . . . . . . . . . . . . . . . . . . . . . . . . . 167
1. Introduction
Haemoglobin (Hb) polymorphisms are common in many fishspecies such as salmon (Oncorhynchus tshawytscha), rainbow trout(Oncorhynchus mykiss) and carp (Cyprinus carpio) (Buhler and Shanks,1959). In the early 1960s, the Danish geneticist Knud Sick was thefirst to describe Hb polymorphism in whiting (Merlangius merlangus)and Atlantic cod (Gadus morhua) (Sick, 1961). In cod, two haemoglobinloci were distinguished using agar gel electrophoresis; HbI and HbII.
rights reserved.
Gene products of HbI, predominating in adult cod, were polymorphic.Sick (1961) described a simple polymorphism at this locus with twoalleles (HbI1 andHbI2) segregating into three easily distinguished geno-types; the two homozygotes HbI-1/1 and HbI-2/2, and the heterozygoteHbI-1/2.
HbI1 and HbI2 are predominant throughout the species' range, butadditional alleles exist (Frydenberg et al., 1965; Sick, 1965a,b; Husebøet al., 2004; Verde et al., 2006; Borza et al., 2009; Halldórsdóttir andÁrnason, 2009a,b; Andersen, 2012). Furthermore, studies usinghigh-resolution techniques like IF (Isoelectric Focusing) havereported a previously undetected banding variability that probablyrepresents both different alleles at HbI as well as other loci (Fyhn et
Table 1HbI1 frequencies for different geographical areas. Tabulated HbI1 values are averages fora given period and area. The data are aggregated in the most suitable way to reduce thenumber of samples, thus the exact same values may not be found in the original source.The latitude and longitude correspond to the approximate midpoint of each area.Bottom temperatures are averages for the period 1960–2010 taken from ICES.
Year Month HbI1
freq.Latitude Longitude Bottom
temperatureSource
North America1967–81 – 0.05 54 −57 0 Jamieson and
Birley, 19891967–81 – 0.06 49 −56 0 Jamieson and
Birley, 19891962 6 0.04 47 −52 0 Sick, 1965b1967–81 – 0.1 47 −60 1.75 Jamieson and
Birley, 19891967–81 – 0.07 42 −68 8 Jamieson and
Birley, 19891963 1 0.07 39 −75 8 Sick, 1965b1962 3 0.08 41 −70 8 Sick, 1965b
Greenland1969–74 3–7 0.09 74 −26 2 Jamieson and
Birley, 19891961/63 9 0.01 66.5 −50.5 2 Sick, 1965b
Barents Sea1993 1 0.14 68 41 4 Fyhn et al., 19941993 1 0.08 70 40 4 Jørstad and
Nævdal, 19941964–67 1/11 0.11 72 26.5 4 Møller, 1968
White Sea1974–80 6–8 0.16 65 35.5 2 Karpov et al., 19841974–80 9–11 0.16 65 35.5 2 Karpov et al., 1984
Baltic Sea1962 5 0.04 63 18 3 Sick, 1965a1962 10 0.01 63 18 3 Sick, 1965a1962 5 0.01 60 19 4 Sick, 1965a1999 4 0.01 54.5 18.5 5 Pörtner et al., 20011999 4 0.1 54 14.5 5 Pörtner et al., 20011999 4 0.61 54 10.5 5 Pörtner et al., 20011968 4/7/8 0.27 54.5 14.5 5 Jamieson and
Otterlind, 19711968 8 0.15 57 18.5 5 Jamieson and
Otterlind, 19711968 12 0.43 55 14.5 5 Jamieson and
Otterlind, 19711961–62 2–8 0.21 54.5 14 5 Sick, 1965a1968 7–8 0.34 54.5 13.5 5 Jamieson and
Birley, 19891962 3 0.03 55 19 5 Sick, 1965a1961 11 0.04 56 18.5 5 Sick, 1965a1961 10 0.03 59 21 5 Sick, 1965a1968 10–12 0.51 57 18.5 5 Jamieson and
Otterlind, 19711961–63 10–11 0.3 54.5 14 5 Sick, 1965a1968 9–12 0.44 54.5 13.5 5 Jamieson and
Birley, 1989
Iceland1968 12 0.4 66.5 −17 5.8 Jamieson and
Jónssen, 19711969–74 2–12 0.19 66.5 −22.5 5.8 Jamieson and
Birley, 19891969–74 2–12 0.11 66 −23 5.8 Jamieson and
Birley, 19891969–74 2–12 0.32 66.5 −20 5.8 Jamieson and
Birley, 19891969–74 2–12 0.3 66.5 −15.5 5.8 Jamieson and
Birley, 19891969–74 2–12 0.61 63.5 −20 5.8 Jamieson and
Birley, 19891969–74 2–12 0.09 63 −22 5.8 Jamieson and
Birley, 19891969–74 2–12 0.1 64 −13 5.8 Jamieson and
Birley, 1989
Table 1 (continued)
Year Month HbI1
freq.Latitude Longitude Bottom
temperatureSource
1968–69 3/4/6 0.16 64.5 −21.5 5.8 Jamieson andJónssen, 1971
Danish waters1961 8 0.63 57 11 7 Sick, 1965a1968 12 0.62 55 12 7 Jamieson and
Otterlind, 19711961 2/4/8 0.61 55.5 11 7 Sick, 1965a1993 6 0.59 58 8 7 Fyhn et al., 19941961 6–8 0.66 57 9 7 Sick, 1965a1961–62 3/8 0.62 54.5 11 7 Sick, 1965a1961 5 0.62 55.5 12 7 Jamieson and
Birley, 19891961 11 0.58 55.5 11 7 Sick, 1965a1961 11 0.62 55 12 7 Sick, 1965a1994 10 0.59 55 10 7 Husebø et al., 20041994 10 0.67 55 12 7 Husebø et al., 2004
Norwegian coast1985–90 – 0.25 68.5 17.5 7.13 Dahle and Jørstad,
19932002 4 0.36 68 16 7.13 DahleandJørstad,19931992 4 0.22 62 5 7.13 Fyhn et al., 19941994 4 0.39 63 5.5 7.13 Husebø et al., 20041965–67 2–4 0.17 67.5 14.5 7.13 Møller, 19681962 2–3 0.52 59 5 7.13 Frydenberg et al.,
19651961–62 2–3 0.63 58 7 7.13 Frydenberg et al.,
19651962 2–3 0.12 67.5 13.5 7.13 Frydenberg et al.,
19651962 3 0.49 63.5 11.3 7.13 Frydenberg et al.,
19651963 3 0.1 70.5 31.5 7.13 Frydenberg et al.,
19651994 3 0.22 68.5 16.5 7.13 Husebø et al., 20041965–66 3 0.14 67 10.5 7.13 Møller, 19681965–66 3 0.23 69.5 17.5 7.13 Møller, 19681965–66 3 0.24 70.5 24.5 7.13 Møller, 19681987–90 3–4 0.21 67.5 14 7.13 Dahle and Jørstad,
19932002 3–4 0.23 71 27 7.13 Dahle and Jørstad,
19931992 3–4 0.12 67 12 7.13 Fyhn et al., 19941994 3–4 0.6 60 4 7.13 Husebø et al., 20041978/84 3–4 0.47 63.5 11 7.13 Mork and
Sundnes, 19851966–67 3–4 0.27 62.5 6 7.13 Møller, 19681995–97 3–4 0.23 67.5 13.5 7.13 Nordeide and
Båmstedt, 19982002–03 3–4 0.2 68 13.5 7.13 Wennevik et al.,
20081992–93 4–5 0.57 60 6 7.13 Fyhn et al., 19941962 1 0.5 62 5 7.13 Frydenberg et al.,
19651962 1 0.64 58.5 9 7.13 Frydenberg et al.,
19652002 3–5 0.63 60 4 7.13 Dahle and Jørstad,
19931994 5 0.6 58.5 9 7.13 Husebø et al., 20041989–91 5–8 0.61 59 9.5 7.13 Gjøsæter et al., 19921977–83 10 0.5 63.5 11 7.13 Mork and
Sundnes, 19851962 9 0.42 65 11 7.13 Frydenberg et al.,
19651961–62 9 0.44 62.5 7 7.13 Frydenberg et al.,
19651994 9 0.58 58.5 9 7.13 Husebø et al., 20041986–90 9–1 0.6 59 9.5 7.13 Gjøsæter et al.,
19922001 9–11 0.43 67 13 7.13 Dahle et al., 2006
Faeroe Waters1961/63 4 0.07 61.5 −6 7.4 Sick, 1965b1992 1 0.08 62 −7 7.4 Fyhn et al., 1994
(continued on next page)
159S.D. Ross et al. / Comparative Biochemistry and Physiology, Part A 166 (2013) 158–168
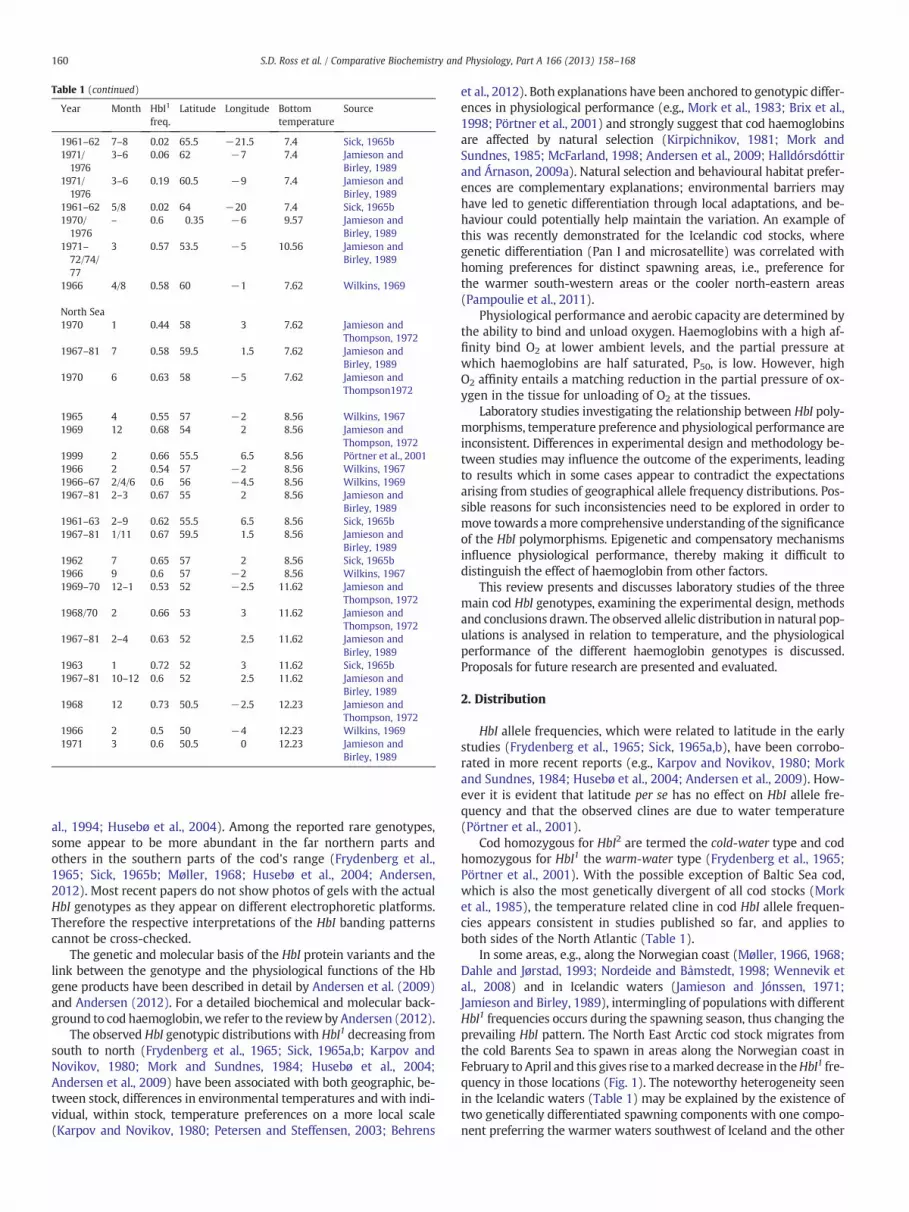
Table 1 (continued)
Year Month HbI1
freq.Latitude Longitude Bottom
temperatureSource
1961–62 7–8 0.02 65.5 −21.5 7.4 Sick, 1965b1971/1976
3–6 0.06 62 −7 7.4 Jamieson andBirley, 1989
1971/1976
3–6 0.19 60.5 −9 7.4 Jamieson andBirley, 1989
1961–62 5/8 0.02 64 −20 7.4 Sick, 1965b1970/1976
– 0.6 0.35 −6 9.57 Jamieson andBirley, 1989
1971–72/74/77
3 0.57 53.5 −5 10.56 Jamieson andBirley, 1989
1966 4/8 0.58 60 −1 7.62 Wilkins, 1969
North Sea1970 1 0.44 58 3 7.62 Jamieson and
Thompson, 19721967–81 7 0.58 59.5 1.5 7.62 Jamieson and
Birley, 19891970 6 0.63 58 −5 7.62 Jamieson and
Thompson1972
1965 4 0.55 57 −2 8.56 Wilkins, 19671969 12 0.68 54 2 8.56 Jamieson and
Thompson, 19721999 2 0.66 55.5 6.5 8.56 Pörtner et al., 20011966 2 0.54 57 −2 8.56 Wilkins, 19671966–67 2/4/6 0.6 56 −4.5 8.56 Wilkins, 19691967–81 2–3 0.67 55 2 8.56 Jamieson and
Birley, 19891961–63 2–9 0.62 55.5 6.5 8.56 Sick, 1965b1967–81 1/11 0.67 59.5 1.5 8.56 Jamieson and
Birley, 19891962 7 0.65 57 2 8.56 Sick, 1965b1966 9 0.6 57 −2 8.56 Wilkins, 19671969–70 12–1 0.53 52 −2.5 11.62 Jamieson and
Thompson, 19721968/70 2 0.66 53 3 11.62 Jamieson and
Thompson, 19721967–81 2–4 0.63 52 2.5 11.62 Jamieson and
Birley, 19891963 1 0.72 52 3 11.62 Sick, 1965b1967–81 10–12 0.6 52 2.5 11.62 Jamieson and
Birley, 19891968 12 0.73 50.5 −2.5 12.23 Jamieson and
Thompson, 19721966 2 0.5 50 −4 12.23 Wilkins, 19691971 3 0.6 50.5 0 12.23 Jamieson and
Birley, 1989
160 S.D. Ross et al. / Comparative Biochemistry and Physiology, Part A 166 (2013) 158–168
al., 1994; Husebø et al., 2004). Among the reported rare genotypes,some appear to be more abundant in the far northern parts andothers in the southern parts of the cod's range (Frydenberg et al.,1965; Sick, 1965b; Møller, 1968; Husebø et al., 2004; Andersen,2012). Most recent papers do not show photos of gels with the actualHbI genotypes as they appear on different electrophoretic platforms.Therefore the respective interpretations of the HbI banding patternscannot be cross-checked.
The genetic and molecular basis of the HbI protein variants and thelink between the genotype and the physiological functions of the Hbgene products have been described in detail by Andersen et al. (2009)and Andersen (2012). For a detailed biochemical and molecular back-ground to cod haemoglobin,we refer to the reviewby Andersen (2012).
The observed HbI genotypic distributions with HbI1 decreasing fromsouth to north (Frydenberg et al., 1965; Sick, 1965a,b; Karpov andNovikov, 1980; Mork and Sundnes, 1984; Husebø et al., 2004;Andersen et al., 2009) have been associated with both geographic, be-tween stock, differences in environmental temperatures and with indi-vidual, within stock, temperature preferences on a more local scale(Karpov and Novikov, 1980; Petersen and Steffensen, 2003; Behrens
et al., 2012). Both explanations have been anchored to genotypic differ-ences in physiological performance (e.g., Mork et al., 1983; Brix et al.,1998; Pörtner et al., 2001) and strongly suggest that cod haemoglobinsare affected by natural selection (Kirpichnikov, 1981; Mork andSundnes, 1985; McFarland, 1998; Andersen et al., 2009; Halldórsdóttirand Árnason, 2009a). Natural selection and behavioural habitat prefer-ences are complementary explanations; environmental barriers mayhave led to genetic differentiation through local adaptations, and be-haviour could potentially help maintain the variation. An example ofthis was recently demonstrated for the Icelandic cod stocks, wheregenetic differentiation (Pan I and microsatellite) was correlated withhoming preferences for distinct spawning areas, i.e., preference forthe warmer south-western areas or the cooler north-eastern areas(Pampoulie et al., 2011).
Physiological performance and aerobic capacity are determined bythe ability to bind and unload oxygen. Haemoglobins with a high af-finity bind O2 at lower ambient levels, and the partial pressure atwhich haemoglobins are half saturated, P50, is low. However, highO2 affinity entails a matching reduction in the partial pressure of ox-ygen in the tissue for unloading of O2 at the tissues.
Laboratory studies investigating the relationship between HbI poly-morphisms, temperature preference and physiological performance areinconsistent. Differences in experimental design and methodology be-tween studies may influence the outcome of the experiments, leadingto results which in some cases appear to contradict the expectationsarising from studies of geographical allele frequency distributions. Pos-sible reasons for such inconsistencies need to be explored in order tomove towards amore comprehensive understanding of the significanceof the HbI polymorphisms. Epigenetic and compensatory mechanismsinfluence physiological performance, thereby making it difficult todistinguish the effect of haemoglobin from other factors.
This review presents and discusses laboratory studies of the threemain cod HbI genotypes, examining the experimental design, methodsand conclusions drawn. The observed allelic distribution in natural pop-ulations is analysed in relation to temperature, and the physiologicalperformance of the different haemoglobin genotypes is discussed.Proposals for future research are presented and evaluated.
2. Distribution
HbI allele frequencies, which were related to latitude in the earlystudies (Frydenberg et al., 1965; Sick, 1965a,b), have been corrobo-rated in more recent reports (e.g., Karpov and Novikov, 1980; Morkand Sundnes, 1984; Husebø et al., 2004; Andersen et al., 2009). How-ever it is evident that latitude per se has no effect on HbI allele fre-quency and that the observed clines are due to water temperature(Pörtner et al., 2001).
Cod homozygous for HbI2 are termed the cold-water type and codhomozygous for HbI1 the warm-water type (Frydenberg et al., 1965;Pörtner et al., 2001). With the possible exception of Baltic Sea cod,which is also the most genetically divergent of all cod stocks (Morket al., 1985), the temperature related cline in cod HbI allele frequen-cies appears consistent in studies published so far, and applies toboth sides of the North Atlantic (Table 1).
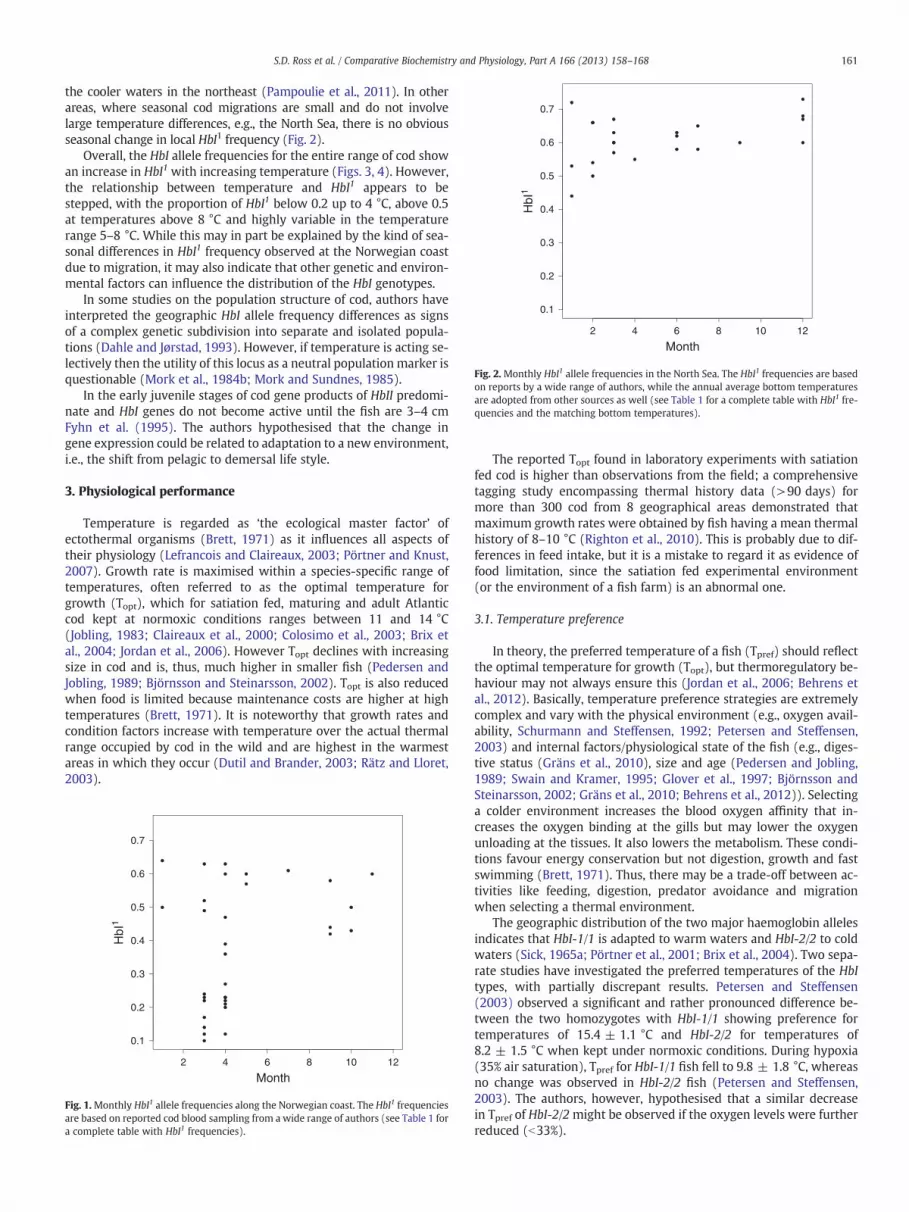
In some areas, e.g., along the Norwegian coast (Møller, 1966, 1968;Dahle and Jørstad, 1993; Nordeide and Båmstedt, 1998; Wennevik etal., 2008) and in Icelandic waters (Jamieson and Jónssen, 1971;Jamieson and Birley, 1989), intermingling of populations with differentHbI1 frequencies occurs during the spawning season, thus changing theprevailing HbI pattern. The North East Arctic cod stock migrates fromthe cold Barents Sea to spawn in areas along the Norwegian coast inFebruary to April and this gives rise to amarked decrease in theHbI1 fre-quency in those locations (Fig. 1). The noteworthy heterogeneity seenin the Icelandic waters (Table 1) may be explained by the existence oftwo genetically differentiated spawning components with one compo-nent preferring the warmer waters southwest of Iceland and the other
2 4 6 8 10 12
0.1
0.2
0.3
0.4
0.5
0.6
0.7
Month
HbI
1
Fig. 2.Monthly HbI1 allele frequencies in the North Sea. The HbI1 frequencies are basedon reports by a wide range of authors, while the annual average bottom temperaturesare adopted from other sources as well (see Table 1 for a complete table with HbI1 fre-quencies and the matching bottom temperatures).
161S.D. Ross et al. / Comparative Biochemistry and Physiology, Part A 166 (2013) 158–168
the cooler waters in the northeast (Pampoulie et al., 2011). In otherareas, where seasonal cod migrations are small and do not involvelarge temperature differences, e.g., the North Sea, there is no obviousseasonal change in local HbI1 frequency (Fig. 2).
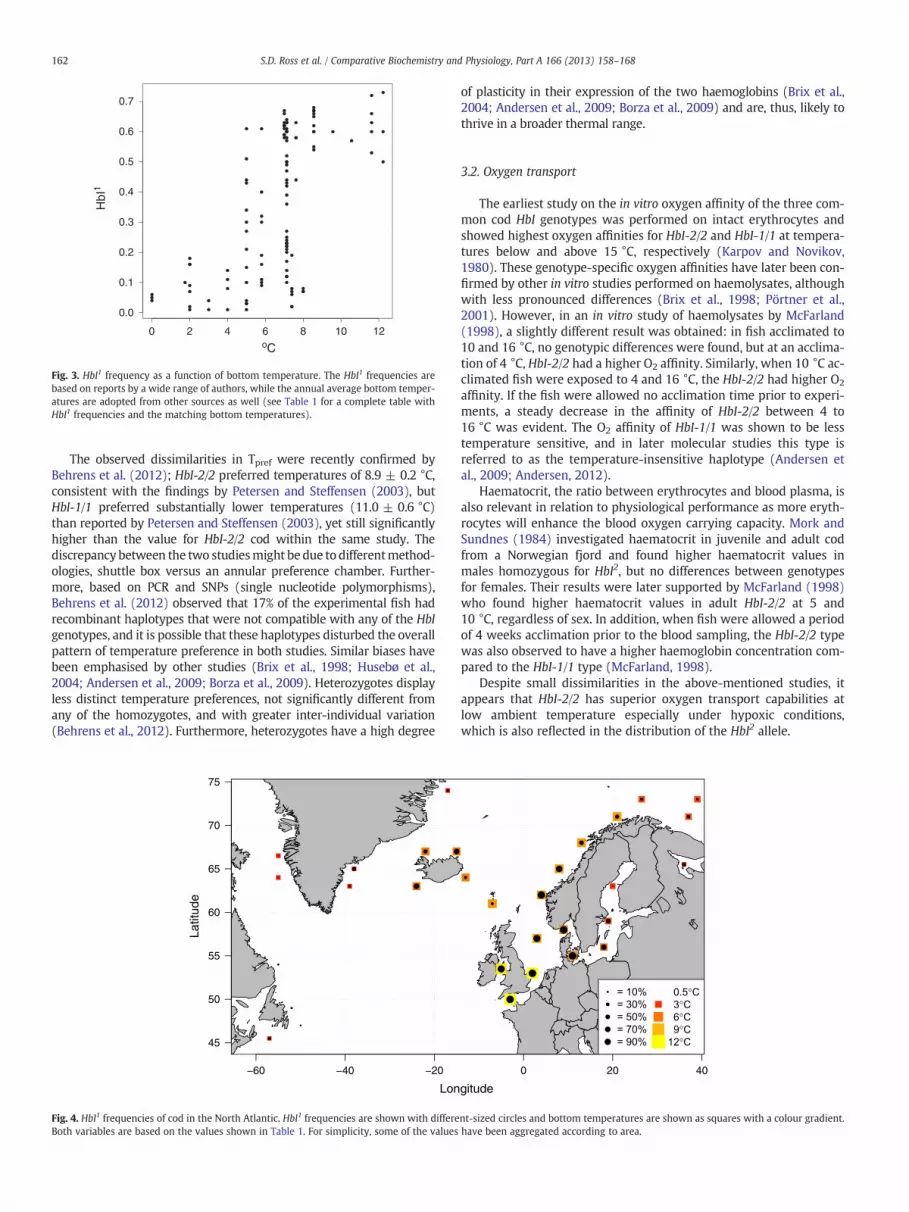
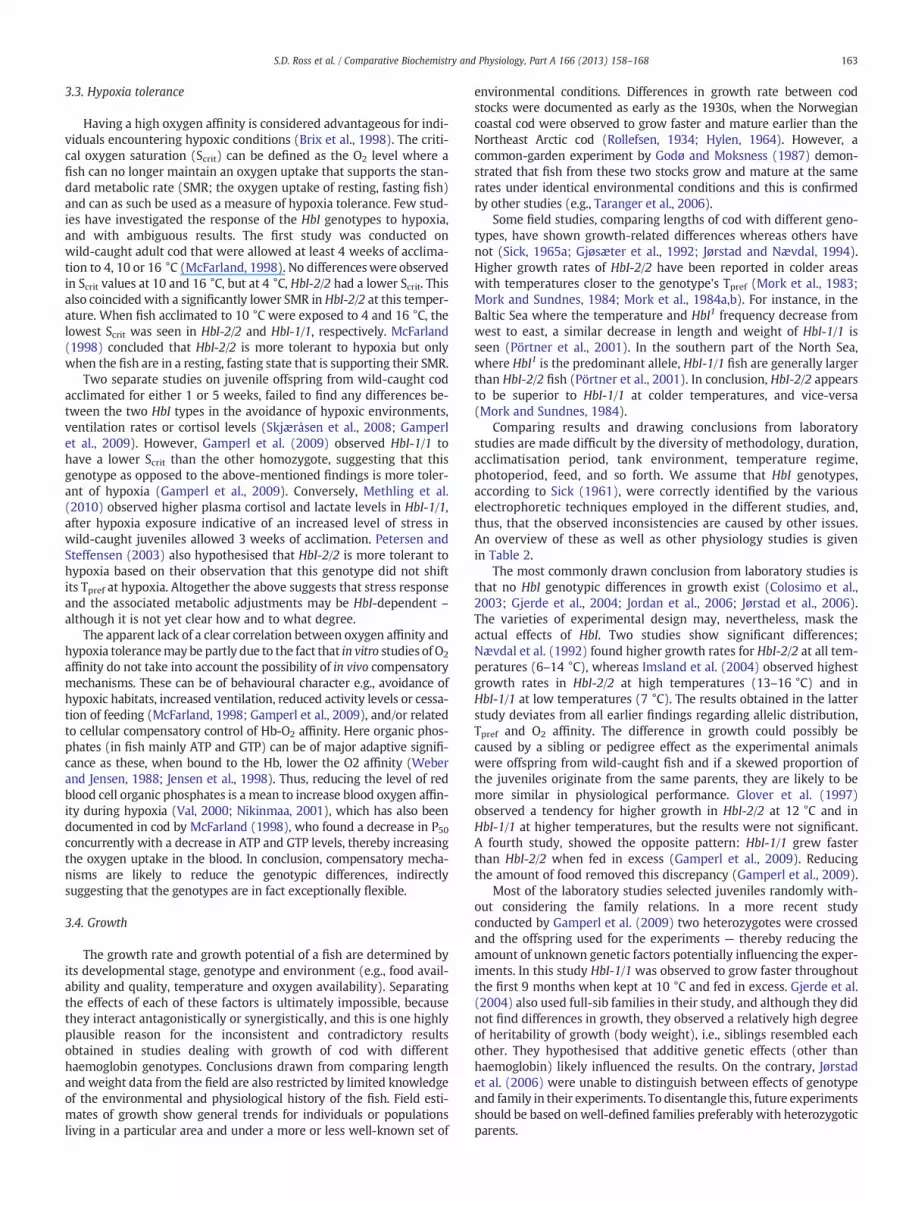
Overall, the HbI allele frequencies for the entire range of cod showan increase in HbI1 with increasing temperature (Figs. 3, 4). However,the relationship between temperature and HbI1 appears to bestepped, with the proportion of HbI1 below 0.2 up to 4 °C, above 0.5at temperatures above 8 °C and highly variable in the temperaturerange 5–8 °C. While this may in part be explained by the kind of sea-sonal differences in HbI1 frequency observed at the Norwegian coastdue to migration, it may also indicate that other genetic and environ-mental factors can influence the distribution of the HbI genotypes.
In some studies on the population structure of cod, authors haveinterpreted the geographic HbI allele frequency differences as signsof a complex genetic subdivision into separate and isolated popula-tions (Dahle and Jørstad, 1993). However, if temperature is acting se-lectively then the utility of this locus as a neutral population marker isquestionable (Mork et al., 1984b; Mork and Sundnes, 1985).
In the early juvenile stages of cod gene products of HbII predomi-nate and HbI genes do not become active until the fish are 3–4 cmFyhn et al. (1995). The authors hypothesised that the change ingene expression could be related to adaptation to a new environment,i.e., the shift from pelagic to demersal life style.
3. Physiological performance
Temperature is regarded as ‘the ecological master factor’ ofectothermal organisms (Brett, 1971) as it influences all aspects oftheir physiology (Lefrancois and Claireaux, 2003; Pörtner and Knust,2007). Growth rate is maximised within a species-specific range oftemperatures, often referred to as the optimal temperature forgrowth (Topt), which for satiation fed, maturing and adult Atlanticcod kept at normoxic conditions ranges between 11 and 14 °C(Jobling, 1983; Claireaux et al., 2000; Colosimo et al., 2003; Brix etal., 2004; Jordan et al., 2006). However Topt declines with increasingsize in cod and is, thus, much higher in smaller fish (Pedersen andJobling, 1989; Björnsson and Steinarsson, 2002). Topt is also reducedwhen food is limited because maintenance costs are higher at hightemperatures (Brett, 1971). It is noteworthy that growth rates andcondition factors increase with temperature over the actual thermalrange occupied by cod in the wild and are highest in the warmestareas in which they occur (Dutil and Brander, 2003; Rätz and Lloret,2003).
2 4 6 8 10 12
0.1
0.2
0.3
0.4
0.5
0.6
0.7
Month
HbI
1
Fig. 1.Monthly HbI1 allele frequencies along the Norwegian coast. The HbI1 frequenciesare based on reported cod blood sampling from a wide range of authors (see Table 1 fora complete table with HbI1 frequencies).
The reported Topt found in laboratory experiments with satiationfed cod is higher than observations from the field; a comprehensivetagging study encompassing thermal history data (>90 days) formore than 300 cod from 8 geographical areas demonstrated thatmaximum growth rates were obtained by fish having a mean thermalhistory of 8–10 °C (Righton et al., 2010). This is probably due to dif-ferences in feed intake, but it is a mistake to regard it as evidence offood limitation, since the satiation fed experimental environment(or the environment of a fish farm) is an abnormal one.
3.1. Temperature preference
In theory, the preferred temperature of a fish (Tpref) should reflectthe optimal temperature for growth (Topt), but thermoregulatory be-haviour may not always ensure this (Jordan et al., 2006; Behrens etal., 2012). Basically, temperature preference strategies are extremelycomplex and vary with the physical environment (e.g., oxygen avail-ability, Schurmann and Steffensen, 1992; Petersen and Steffensen,2003) and internal factors/physiological state of the fish (e.g., diges-tive status (Gräns et al., 2010), size and age (Pedersen and Jobling,1989; Swain and Kramer, 1995; Glover et al., 1997; Björnsson andSteinarsson, 2002; Gräns et al., 2010; Behrens et al., 2012)). Selectinga colder environment increases the blood oxygen affinity that in-creases the oxygen binding at the gills but may lower the oxygenunloading at the tissues. It also lowers the metabolism. These condi-tions favour energy conservation but not digestion, growth and fastswimming (Brett, 1971). Thus, there may be a trade-off between ac-tivities like feeding, digestion, predator avoidance and migrationwhen selecting a thermal environment.
The geographic distribution of the two major haemoglobin allelesindicates that HbI-1/1 is adapted to warm waters and HbI-2/2 to coldwaters (Sick, 1965a; Pörtner et al., 2001; Brix et al., 2004). Two sepa-rate studies have investigated the preferred temperatures of the HbItypes, with partially discrepant results. Petersen and Steffensen(2003) observed a significant and rather pronounced difference be-tween the two homozygotes with HbI-1/1 showing preference fortemperatures of 15.4 ± 1.1 °C and HbI-2/2 for temperatures of8.2 ± 1.5 °C when kept under normoxic conditions. During hypoxia(35% air saturation), Tpref for HbI-1/1 fish fell to 9.8 ± 1.8 °C, whereasno change was observed in HbI-2/2 fish (Petersen and Steffensen,2003). The authors, however, hypothesised that a similar decreasein Tpref of HbI-2/2might be observed if the oxygen levels were furtherreduced (b33%).
20 4 6 8 10 12
0.1
0.0
0.2
0.3
0.4
0.5
0.6
0.7
oC
HbI
1
Fig. 3. HbI1 frequency as a function of bottom temperature. The HbI1 frequencies arebased on reports by a wide range of authors, while the annual average bottom temper-atures are adopted from other sources as well (see Table 1 for a complete table withHbI1 frequencies and the matching bottom temperatures).
162 S.D. Ross et al. / Comparative Biochemistry and Physiology, Part A 166 (2013) 158–168
The observed dissimilarities in Tpref were recently confirmed byBehrens et al. (2012); HbI-2/2 preferred temperatures of 8.9 ± 0.2 °C,consistent with the findings by Petersen and Steffensen (2003), butHbI-1/1 preferred substantially lower temperatures (11.0 ± 0.6 °C)than reported by Petersen and Steffensen (2003), yet still significantlyhigher than the value for HbI-2/2 cod within the same study. Thediscrepancy between the two studiesmight be due to differentmethod-ologies, shuttle box versus an annular preference chamber. Further-more, based on PCR and SNPs (single nucleotide polymorphisms),Behrens et al. (2012) observed that 17% of the experimental fish hadrecombinant haplotypes that were not compatible with any of the HbIgenotypes, and it is possible that these haplotypes disturbed the overallpattern of temperature preference in both studies. Similar biases havebeen emphasised by other studies (Brix et al., 1998; Husebø et al.,2004; Andersen et al., 2009; Borza et al., 2009). Heterozygotes displayless distinct temperature preferences, not significantly different fromany of the homozygotes, and with greater inter-individual variation(Behrens et al., 2012). Furthermore, heterozygotes have a high degree
−60 −40 −20
45
50
55
60
65
70
75
Lon
Latit
ude
Fig. 4. HbI1 frequencies of cod in the North Atlantic. HbI1 frequencies are shown with differeBoth variables are based on the values shown in Table 1. For simplicity, some of the values
of plasticity in their expression of the two haemoglobins (Brix et al.,2004; Andersen et al., 2009; Borza et al., 2009) and are, thus, likely tothrive in a broader thermal range.
3.2. Oxygen transport
The earliest study on the in vitro oxygen affinity of the three com-mon cod HbI genotypes was performed on intact erythrocytes andshowed highest oxygen affinities for HbI-2/2 and HbI-1/1 at tempera-tures below and above 15 °C, respectively (Karpov and Novikov,1980). These genotype-specific oxygen affinities have later been con-firmed by other in vitro studies performed on haemolysates, althoughwith less pronounced differences (Brix et al., 1998; Pörtner et al.,2001). However, in an in vitro study of haemolysates by McFarland(1998), a slightly different result was obtained: in fish acclimated to10 and 16 °C, no genotypic differences were found, but at an acclima-tion of 4 °C, HbI-2/2 had a higher O2 affinity. Similarly, when 10 °C ac-climated fish were exposed to 4 and 16 °C, the HbI-2/2 had higher O2
affinity. If the fish were allowed no acclimation time prior to experi-ments, a steady decrease in the affinity of HbI-2/2 between 4 to16 °C was evident. The O2 affinity of HbI-1/1 was shown to be lesstemperature sensitive, and in later molecular studies this type isreferred to as the temperature-insensitive haplotype (Andersen etal., 2009; Andersen, 2012).
Haematocrit, the ratio between erythrocytes and blood plasma, isalso relevant in relation to physiological performance as more eryth-rocytes will enhance the blood oxygen carrying capacity. Mork andSundnes (1984) investigated haematocrit in juvenile and adult codfrom a Norwegian fjord and found higher haematocrit values inmales homozygous for HbI2, but no differences between genotypesfor females. Their results were later supported by McFarland (1998)who found higher haematocrit values in adult HbI-2/2 at 5 and10 °C, regardless of sex. In addition, when fish were allowed a periodof 4 weeks acclimation prior to the blood sampling, the HbI-2/2 typewas also observed to have a higher haemoglobin concentration com-pared to the HbI-1/1 type (McFarland, 1998).
Despite small dissimilarities in the above-mentioned studies, itappears that HbI-2/2 has superior oxygen transport capabilities atlow ambient temperature especially under hypoxic conditions,which is also reflected in the distribution of the HbI2 allele.
0 20 40
gitude
nt-sized circles and bottom temperatures are shown as squares with a colour gradient.have been aggregated according to area.
163S.D. Ross et al. / Comparative Biochemistry and Physiology, Part A 166 (2013) 158–168
3.3. Hypoxia tolerance
Having a high oxygen affinity is considered advantageous for indi-viduals encountering hypoxic conditions (Brix et al., 1998). The criti-cal oxygen saturation (Scrit) can be defined as the O2 level where afish can no longer maintain an oxygen uptake that supports the stan-dard metabolic rate (SMR; the oxygen uptake of resting, fasting fish)and can as such be used as a measure of hypoxia tolerance. Few stud-ies have investigated the response of the HbI genotypes to hypoxia,and with ambiguous results. The first study was conducted onwild-caught adult cod that were allowed at least 4 weeks of acclima-tion to 4, 10 or 16 °C (McFarland, 1998). No differenceswere observedin Scrit values at 10 and 16 °C, but at 4 °C, HbI-2/2 had a lower Scrit. Thisalso coincidedwith a significantly lower SMR in HbI-2/2 at this temper-ature. When fish acclimated to 10 °C were exposed to 4 and 16 °C, thelowest Scrit was seen in HbI-2/2 and HbI-1/1, respectively. McFarland(1998) concluded that HbI-2/2 is more tolerant to hypoxia but onlywhen the fish are in a resting, fasting state that is supporting their SMR.
Two separate studies on juvenile offspring from wild-caught codacclimated for either 1 or 5 weeks, failed to find any differences be-tween the two HbI types in the avoidance of hypoxic environments,ventilation rates or cortisol levels (Skjæråsen et al., 2008; Gamperlet al., 2009). However, Gamperl et al. (2009) observed HbI-1/1 tohave a lower Scrit than the other homozygote, suggesting that thisgenotype as opposed to the above-mentioned findings is more toler-ant of hypoxia (Gamperl et al., 2009). Conversely, Methling et al.(2010) observed higher plasma cortisol and lactate levels in HbI-1/1,after hypoxia exposure indicative of an increased level of stress inwild-caught juveniles allowed 3 weeks of acclimation. Petersen andSteffensen (2003) also hypothesised that HbI-2/2 is more tolerant tohypoxia based on their observation that this genotype did not shiftits Tpref at hypoxia. Altogether the above suggests that stress responseand the associated metabolic adjustments may be HbI-dependent –although it is not yet clear how and to what degree.
The apparent lack of a clear correlation between oxygen affinity andhypoxia tolerancemay be partly due to the fact that in vitro studies of O2
affinity do not take into account the possibility of in vivo compensatorymechanisms. These can be of behavioural character e.g., avoidance ofhypoxic habitats, increased ventilation, reduced activity levels or cessa-tion of feeding (McFarland, 1998; Gamperl et al., 2009), and/or relatedto cellular compensatory control of Hb-O2 affinity. Here organic phos-phates (in fish mainly ATP and GTP) can be of major adaptive signifi-cance as these, when bound to the Hb, lower the O2 affinity (Weberand Jensen, 1988; Jensen et al., 1998). Thus, reducing the level of redblood cell organic phosphates is a mean to increase blood oxygen affin-ity during hypoxia (Val, 2000; Nikinmaa, 2001), which has also beendocumented in cod by McFarland (1998), who found a decrease in P50concurrently with a decrease in ATP and GTP levels, thereby increasingthe oxygen uptake in the blood. In conclusion, compensatory mecha-nisms are likely to reduce the genotypic differences, indirectlysuggesting that the genotypes are in fact exceptionally flexible.
3.4. Growth
The growth rate and growth potential of a fish are determined byits developmental stage, genotype and environment (e.g., food avail-ability and quality, temperature and oxygen availability). Separatingthe effects of each of these factors is ultimately impossible, becausethey interact antagonistically or synergistically, and this is one highlyplausible reason for the inconsistent and contradictory resultsobtained in studies dealing with growth of cod with differenthaemoglobin genotypes. Conclusions drawn from comparing lengthand weight data from the field are also restricted by limited knowledgeof the environmental and physiological history of the fish. Field esti-mates of growth show general trends for individuals or populationsliving in a particular area and under a more or less well-known set of
environmental conditions. Differences in growth rate between codstocks were documented as early as the 1930s, when the Norwegiancoastal cod were observed to grow faster and mature earlier than theNortheast Arctic cod (Rollefsen, 1934; Hylen, 1964). However, acommon-garden experiment by Godø and Moksness (1987) demon-strated that fish from these two stocks grow and mature at the samerates under identical environmental conditions and this is confirmedby other studies (e.g., Taranger et al., 2006).
Some field studies, comparing lengths of cod with different geno-types, have shown growth-related differences whereas others havenot (Sick, 1965a; Gjøsæter et al., 1992; Jørstad and Nævdal, 1994).Higher growth rates of HbI-2/2 have been reported in colder areaswith temperatures closer to the genotype's Tpref (Mork et al., 1983;Mork and Sundnes, 1984; Mork et al., 1984a,b). For instance, in theBaltic Sea where the temperature and HbI1 frequency decrease fromwest to east, a similar decrease in length and weight of HbI-1/1 isseen (Pörtner et al., 2001). In the southern part of the North Sea,where HbI1 is the predominant allele, HbI-1/1 fish are generally largerthan HbI-2/2 fish (Pörtner et al., 2001). In conclusion, HbI-2/2 appearsto be superior to HbI-1/1 at colder temperatures, and vice-versa(Mork and Sundnes, 1984).
Comparing results and drawing conclusions from laboratorystudies are made difficult by the diversity of methodology, duration,acclimatisation period, tank environment, temperature regime,photoperiod, feed, and so forth. We assume that HbI genotypes,according to Sick (1961), were correctly identified by the variouselectrophoretic techniques employed in the different studies, and,thus, that the observed inconsistencies are caused by other issues.An overview of these as well as other physiology studies is givenin Table 2.
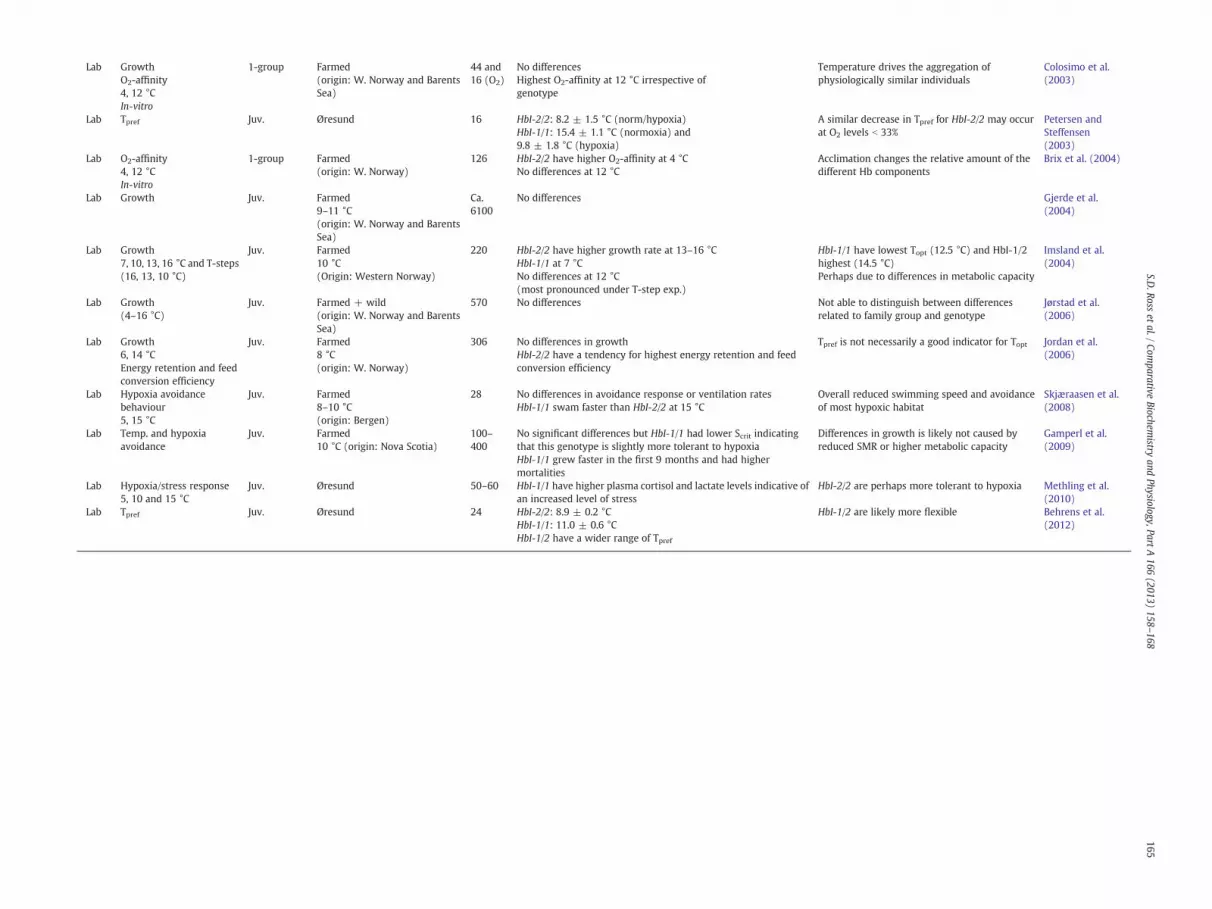
The most commonly drawn conclusion from laboratory studies isthat no HbI genotypic differences in growth exist (Colosimo et al.,2003; Gjerde et al., 2004; Jordan et al., 2006; Jørstad et al., 2006).The varieties of experimental design may, nevertheless, mask theactual effects of HbI. Two studies show significant differences;Nævdal et al. (1992) found higher growth rates for HbI-2/2 at all tem-peratures (6–14 °C), whereas Imsland et al. (2004) observed highestgrowth rates in HbI-2/2 at high temperatures (13–16 °C) and inHbI-1/1 at low temperatures (7 °C). The results obtained in the latterstudy deviates from all earlier findings regarding allelic distribution,Tpref and O2 affinity. The difference in growth could possibly becaused by a sibling or pedigree effect as the experimental animalswere offspring from wild-caught fish and if a skewed proportion ofthe juveniles originate from the same parents, they are likely to bemore similar in physiological performance. Glover et al. (1997)observed a tendency for higher growth in HbI-2/2 at 12 °C and inHbI-1/1 at higher temperatures, but the results were not significant.A fourth study, showed the opposite pattern: HbI-1/1 grew fasterthan HbI-2/2 when fed in excess (Gamperl et al., 2009). Reducingthe amount of food removed this discrepancy (Gamperl et al., 2009).
Most of the laboratory studies selected juveniles randomly with-out considering the family relations. In a more recent studyconducted by Gamperl et al. (2009) two heterozygotes were crossedand the offspring used for the experiments — thereby reducing theamount of unknown genetic factors potentially influencing the exper-iments. In this study HbI-1/1 was observed to grow faster throughoutthe first 9 months when kept at 10 °C and fed in excess. Gjerde et al.(2004) also used full-sib families in their study, and although they didnot find differences in growth, they observed a relatively high degreeof heritability of growth (body weight), i.e., siblings resembled eachother. They hypothesised that additive genetic effects (other thanhaemoglobin) likely influenced the results. On the contrary, Jørstadet al. (2006) were unable to distinguish between effects of genotypeand family in their experiments. To disentangle this, future experimentsshould be based onwell-defined families preferably with heterozygoticparents.
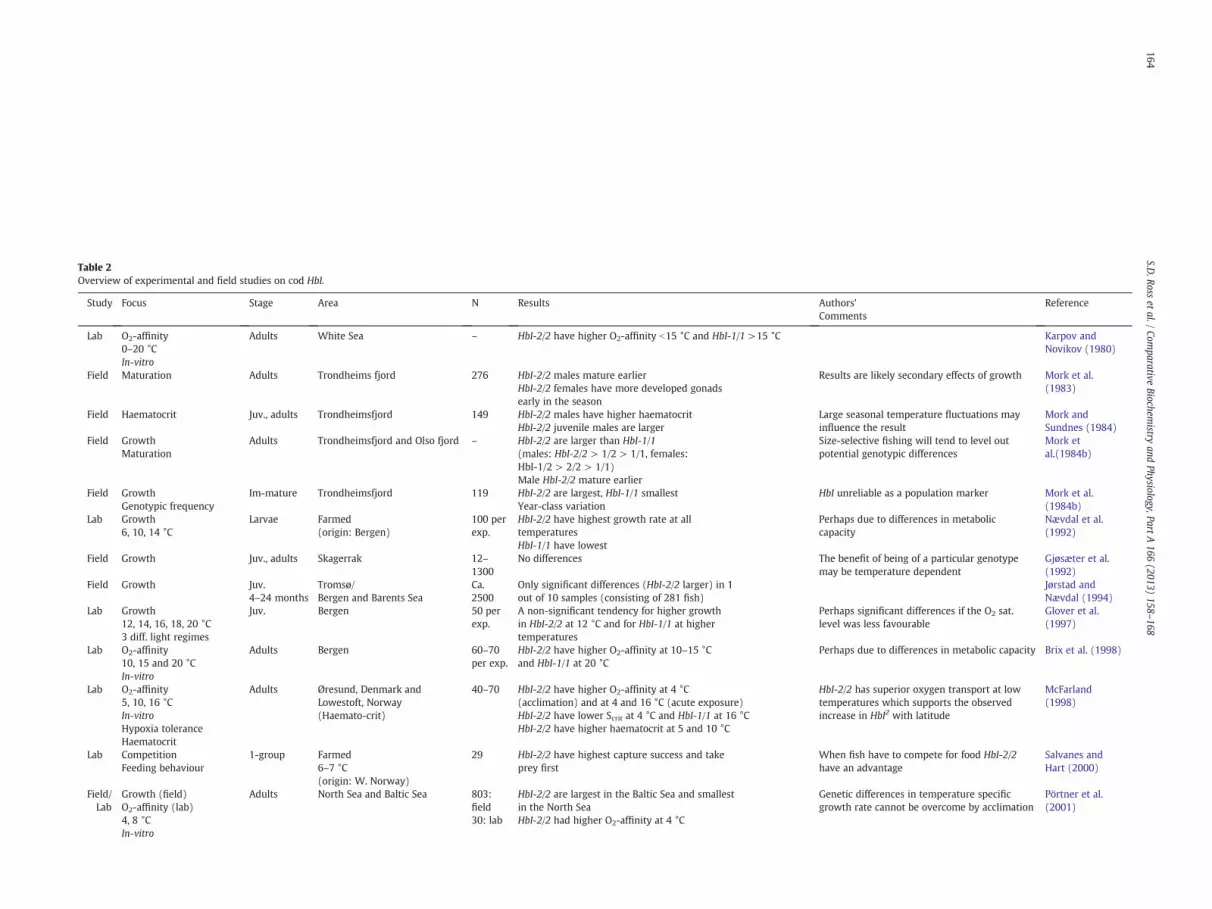
Table 2Overview of experimental and field studies on cod HbI.
Study Focus Stage Area N Results Authors’Comments
Reference
Lab O2-affinity0–20 °CIn-vitro
Adults White Sea – HbI-2/2 have higher O2-affinity b15 °C and HbI-1/1 >15 °C Karpov andNovikov (1980)
Field Maturation Adults Trondheims fjord 276 HbI-2/2 males mature earlierHbI-2/2 females have more developed gonadsearly in the season
Results are likely secondary effects of growth Mork et al.(1983)
Field Haematocrit Juv., adults Trondheimsfjord 149 HbI-2/2 males have higher haematocritHbI-2/2 juvenile males are larger
Large seasonal temperature fluctuations mayinfluence the result
Mork andSundnes (1984)
Field GrowthMaturation
Adults Trondheimsfjord and Olso fjord – HbI-2/2 are larger than HbI-1/1(males: HbI-2/2 > 1/2 > 1/1, females:HbI-1/2 > 2/2 > 1/1)Male HbI-2/2 mature earlier
Size-selective fishing will tend to level outpotential genotypic differences
Mork etal.(1984b)
Field GrowthGenotypic frequency
Im-mature Trondheimsfjord 119 HbI-2/2 are largest, HbI-1/1 smallestYear-class variation
HbI unreliable as a population marker Mork et al.(1984b)
Lab Growth6, 10, 14 °C
Larvae Farmed(origin: Bergen)
100 perexp.
HbI-2/2 have highest growth rate at alltemperaturesHbI-1/1 have lowest
Perhaps due to differences in metaboliccapacity
Nævdal et al.(1992)
Field Growth Juv., adults Skagerrak 12–1300
No differences The benefit of being of a particular genotypemay be temperature dependent
Gjøsæter et al.(1992)
Field Growth Juv.4–24 months
Tromsø/Bergen and Barents Sea
Ca.2500
Only significant differences (HbI-2/2 larger) in 1out of 10 samples (consisting of 281 fish)
Jørstad andNævdal (1994)
Lab Growth12, 14, 16, 18, 20 °C3 diff. light regimes
Juv. Bergen 50 perexp.
A non-significant tendency for higher growthin HbI-2/2 at 12 °C and for HbI-1/1 at highertemperatures
Perhaps significant differences if the O2 sat.level was less favourable
Glover et al.(1997)
Lab O2-affinity10, 15 and 20 °CIn-vitro
Adults Bergen 60–70per exp.
HbI-2/2 have higher O2-affinity at 10–15 °Cand HbI-1/1 at 20 °C
Perhaps due to differences in metabolic capacity Brix et al. (1998)
Lab O2-affinity5, 10, 16 °CIn-vitroHypoxia toleranceHaematocrit
Adults Øresund, Denmark andLowestoft, Norway(Haemato-crit)
40–70 HbI-2/2 have higher O2-affinity at 4 °C(acclimation) and at 4 and 16 °C (acute exposure)HbI-2/2 have lower Scrit at 4 °C and HbI-1/1 at 16 °CHbI-2/2 have higher haematocrit at 5 and 10 °C
HbI-2/2 has superior oxygen transport at lowtemperatures which supports the observedincrease in HbI2 with latitude
McFarland(1998)
Lab CompetitionFeeding behaviour
1-group Farmed6–7 °C(origin: W. Norway)
29 HbI-2/2 have highest capture success and takeprey first
When fish have to compete for food HbI-2/2have an advantage
Salvanes andHart (2000)
Field/Lab
Growth (field)O2-affinity (lab)4, 8 °CIn-vitro
Adults North Sea and Baltic Sea 803:field30: lab
HbI-2/2 are largest in the Baltic Sea and smallestin the North SeaHbI-2/2 had higher O2-affinity at 4 °C
Genetic differences in temperature specificgrowth rate cannot be overcome by acclimation
Pörtner et al.(2001)
164S.D
.Rosset
al./Com
parativeBiochem
istryand
Physiology,PartA166
(2013)158
–168
Study
Focus Stage Area N Results Authors’Comments
Reference
Lab GrowthO2-affinity4, 12 °CIn-vitro
1-group Farmed(origin: W. Norway and BarentsSea)
44 and16 (O2)
No differencesHighest O2-affinity at 12 °C irrespective ofgenotype
Temperature drives the aggregation ofphysiologically similar individuals
Colosimo et al.(2003)
Lab Tpref Juv. Øresund 16 HbI-2/2: 8.2 ± 1.5 °C (norm/hypoxia)HbI-1/1: 15.4 ± 1.1 °C (normoxia) and9.8 ± 1.8 °C (hypoxia)
A similar decrease in Tpref for HbI-2/2 may occurat O2 levels b 33%
Petersen andSteffensen(2003)
Lab O2-affinity4, 12 °CIn-vitro
1-group Farmed(origin: W. Norway)
126 HbI-2/2 have higher O2-affinity at 4 °CNo differences at 12 °C
Acclimation changes the relative amount of thedifferent Hb components
Brix et al. (2004)
Lab Growth Juv. Farmed9–11 °C(origin: W. Norway and BarentsSea)
Ca.6100
No differences Gjerde et al.(2004)
Lab Growth7, 10, 13, 16 °C and T-steps(16, 13, 10 °C)
Juv. Farmed10 °C(Origin: Western Norway)
220 HbI-2/2 have higher growth rate at 13–16 °CHbI-1/1 at 7 °CNo differences at 12 °C(most pronounced under T-step exp.)
HbI-1/1 have lowest Topt (12.5 °C) and HbI-1/2highest (14.5 °C)Perhaps due to differences in metabolic capacity
Imsland et al.(2004)
Lab Growth(4–16 °C)
Juv. Farmed + wild(origin: W. Norway and BarentsSea)
570 No differences Not able to distinguish between differencesrelated to family group and genotype
Jørstad et al.(2006)
Lab Growth6, 14 °CEnergy retention and feedconversion efficiency
Juv. Farmed8 °C(origin: W. Norway)
306 No differences in growthHbI-2/2 have a tendency for highest energy retention and feedconversion efficiency
Tpref is not necessarily a good indicator for Topt Jordan et al.(2006)
Lab Hypoxia avoidancebehaviour5, 15 °C
Juv. Farmed8–10 °C(origin: Bergen)
28 No differences in avoidance response or ventilation ratesHbI-1/1 swam faster than HbI-2/2 at 15 °C
Overall reduced swimming speed and avoidanceof most hypoxic habitat
Skjæraasen et al.(2008)
Lab Temp. and hypoxiaavoidance
Juv. Farmed10 °C (origin: Nova Scotia)
100–400
No significant differences but HbI-1/1 had lower Scrit indicatingthat this genotype is slightly more tolerant to hypoxiaHbI-1/1 grew faster in the first 9 months and had highermortalities
Differences in growth is likely not caused byreduced SMR or higher metabolic capacity
Gamperl et al.(2009)
Lab Hypoxia/stress response5, 10 and 15 °C
Juv. Øresund 50–60 HbI-1/1 have higher plasma cortisol and lactate levels indicative ofan increased level of stress
HbI-2/2 are perhaps more tolerant to hypoxia Methling et al.(2010)
Lab Tpref Juv. Øresund 24 HbI-2/2: 8.9 ± 0.2 °CHbI-1/1: 11.0 ± 0.6 °CHbI-1/2 have a wider range of Tpref
HbI-1/2 are likely more flexible Behrens et al.(2012)
165S.D
.Rosset
al./Com
parativeBiochem
istryand
Physiology,PartA166
(2013)158
–168
166 S.D. Ross et al. / Comparative Biochemistry and Physiology, Part A 166 (2013) 158–168
In most growth studies fish are fed ad libitum, simulating commer-cial fish farm conditions. However, acknowledging that food is rarelyfound in excess in nature and further that fish behave differentlyaccording to their personality (Adriaenssens and Johnsson, 2011),keeping experimental animals under such artificial conditions maylikely produce results not comparable to what is observed in thewild. Salvanes and Hart (2000) investigated feeding behaviour incod with different haemoglobin genotypes and found that HbI-2/2had the highest prey capture success and were generally the first totake prey. It was, hence, concluded that in situations where fishhave to compete for food, cod homozygous for HbI2 have an advan-tage. Exposing experimental animals to more natural feeding condi-tions would presumably result in more pronounced behaviouraldifferences, mimicking those seen in nature.
Another issue in relation to behaviour is that genotypes are oftenheld together randomly with no consideration of haemoglobin com-position. If a tank is dominated by fish homozygous for HbI2, thatare known to be more competitive, this is likely to influence the re-sults. Salvanes and Hart (2000) used two types of experimentalsetup; one in which three fish (one of each genotype) where held to-gether and another in which four fish were chosen at random. The“group” factor was shown to have a significant effect on feeding be-haviour, emphasizing the importance of knowing and if necessarymanipulating the haemoglobin composition in tanks. Additionally,the experiments should be replicated to control for “tank effects”. Inthis study HbI-2/2 was shown to be superior, however other combi-nations of haemoglobin genotypes may result in a shift in competitivesuperiority (Salvanes and Hart, 2000). In nature, cod of different ge-notypes usually co-exist, and it would, thus, be interesting to testfor competitive performance within different groupings. Only in oneof the growth studies were the genotypes reared separately (Jørstadet al., 2006) and the results did not show any differences in growth.
Considering that cod show plasticity in their expression of the dif-ferent haemoglobin components (Brix et al., 2004; Andersen et al.,2009; Borza et al., 2009), an acclimation period prior to temperatureexperiments will likely influence the growth rate and perhaps im-pede the actual haemoglobin effects. In addition to this, epigeneticcompensation mechanisms controlled by other loci may disguisethese effects further (Stearns, 1992; Donelson et al., 2012). The lengthof the acclimation period varies significantly between studies; from afew days (Jordan et al., 2006; Gamperl et al., 2009) up to severalmonths (Nævdal et al., 1992; Imsland et al., 2004). A long acclimationperiod seem to reduce the differences between the genotypes, accli-mation time should be kept at a minimum. However, this raises theproblem that stressed fish most likely will not feed voluntarily,which consequently influences the results. A short acclimation periodmay, in theory, favour the more stress-resistant HbI type.
In most of the experimental studies, 2nd generation cod i.e., off-spring from wild-caught fish, were used. Collection of the parentalfish from the wild differed between the studies both with regard tothe time of year and fishing method (trawl, long line, etc.). This mayhave had large impacts on the experiments described previouslydue to differences in the environment inhabited by the parent fish.Seasonal changes such as migration to and from spawning/feedingareas as well as gear type will influence the “selection of fish”, likelybiasing the sampling in a particular, however, largely unknown direc-tion. The conditions experienced in captivity are far from natural,despite attempts to make them so i.e., matching the photoperiodand temperature experienced by the fish in the wild. Lack of preda-tors, limited space for movement and constant feeding regimes con-stitute some of the main differences. These will inevitably result insome degree of acclimatisation, and this phenotypic plasticity maybe reflected in the offspring. Studies, in which offspring from farmedfish have been used, may also be a source of variation as these fish arelikely to have adapted to the farmed conditions through severalgenerations.
4. Discussion and conclusion
The observed latitudinal cline in HbI1 frequency is widely believedto be the result of selection with cod homozygous for HbI1 and HbI2
preferring warmer and colder waters, respectively. This relationshipis also reflected in the oxygen affinity, which is highest for HbI-2/2at lower temperatures and vice versa for HbI-1/1. The heterozygoteis somewhere in-between and is likely to be the most flexible of thethree common genotypes as it possesses both haemoglobins inequal quantities.
Despite the clear association between the haemoglobin genotypeand the preferred temperature and oxygen affinity, correlationswith other physiological traits such as thermal tolerance and growthare less obvious. This may be due to both the difficulty of estimatingthe influence of a single factor (HbI) when a number of factors inter-act, and also to limitations of experimental designs.
Fish growth is affected by multiple environmental and geneticfactors. Laboratory experiments allow for a certain amount of controland reduce some of the influential factors but, nevertheless, introducenew problems such as tank and sibling effects. Experimenters alsohave to deal with fish personality (competition, aggression, and coop-erative behaviour), acclimation time and feeding regime which are alllikely to affect the outcome, although often in unpredictable ways.
Having emphasised all the problems and pitfalls with differentexperimental setups, it seems appropriate to outline what a goodapproach to study HbI genotypic growth rates is. Experiments shouldbe performed on full-siblings by crossing of two wild-caught hetero-zygotes. Several families should be included in the study allowing fordifferences in phenotypic plasticity due to variation in the environ-ment inhabited by the families (northern/southern latitudes, differ-ent depth regimes, coastal/offshore, etc.). Full-siblings within eachfamily should be exposed to different temperature regimes and oxy-gen saturation levels, and if possible also different feeding regimes(ad libitum/minimum). The tanks should ideally be deep, allowingfor vertical migrations, and the haemoglobin composition shouldeither be balanced or differ between tanks to test for effects of com-petition (and fish behaviour in general). Acclimation periods shouldbe kept at a minimum, yet enabling all the fish to fully recover fromstress, to allow for the actual HbI genotypic variation to manifestitself. Fish farm facilities would probably be the most suitable forsuch a large-scale experiment which is, of course, very labour- andcosts consuming.
An enhanced understanding of cod haemoglobins and their influ-ence on various physiological traits will help both in understandinggenome–environment interactions in natural cod populations, andbe beneficial for optimizing the conditions for cod rearing in aquacul-ture. The knowledge will give better insight into processes affected byclimate change, making prediction of the response of cod with differ-ent haemoglobin genotypes more reliable. In aquaculture, the knowl-edge can be used to improve facility settings to fit a particular HbIgenotype, potentially maximizing the yield.
The candidate gene approach (single nucleotide polymorphisms,SNPs) may offer some promising prospects in relation to our under-standing of natural selection working on specific genes and resultingin certain life-history traits and strategies (Hemmer-Hansen et al.,2011). Polymorphic candidate genes of known function can linkgenetic variation with individual differences in physiological func-tions (Hemmer-Hansen et al., 2011). For example, an associationbetween particular SNPs and growth has been demonstrated in Arc-tic charr (Salvelinus alpinus) (Tao and Boulding, 2003). Efforts to re-late genetic variation with physiological traits using SNPs have alsobeen made for Atlantic cod (Moen et al., 2008; Nielsen et al., 2009;Hubert et al., 2010). However, whether the candidate gene ap-proach can shed light on the effects of different haemoglobins andpotential cooperation between haemoglobin loci is yet to beinvestigated.
167S.D. Ross et al. / Comparative Biochemistry and Physiology, Part A 166 (2013) 158–168
In conclusion, it is important to keep in mind that haemoglobin isnot the only factor influencing the physiology of cod— epistatic inter-actions as well as pleiotrophic effects are likely to be involved inshaping the various phenotypes observed in different experimentalsituations. To establish an experimental design, which can disentan-gle the various genetic sources of variation and their interactions isa very challenging goal, thus the underlying complexities must bekept in mind when interpreting experimental results.
Acknowledgement
We would like to thank the anonymous referees for their relevantcomments and suggestions for changes, which have greatly improvedthe manuscript.
References
Adriaenssens, B., Johnsson, J.I., 2011. Shy trout grow faster: exploring links betweenpersonality and fitness-related traits in the wild. Behav. Ecol. 22 (1), 135–143.
Andersen, Ø., 2012. Hemoglobin polymorphisms in Atlantic cod — a review of 50 yearsof study. Mar. Genomics 8, 59–65.
Andersen, Ø., Wetten, O.F., De Rosa, M.C., Andre, C., Alinovi, C.C., Colafranceschi, M.,Brix, O., Coloismo, A., 2009. Haemoglobin polymorphisms affect the oxygen-binding properties in Atlantic cod populations. Proc. R. Soc. B Biol. Sci. 276,833–841.
Behrens, J., Gräns, A., Therkildsen, N.O., Neuenfeldt, S., Axelsson, M., 2012. Correlationsbetween haemoglobin type and temperature preference of juvenile Atlantic codGadus morhua. J. Exp. Mar. Biol. Ecol. 413, 71–77.
Björnsson, B., Steinarsson, A., 2002. The food-unlimited growth rate of Atlantic cod(Gadus morhua). Can. J. Fish. Aquat. Sci. 59, 494–502.
Borza, T., Stone, C., Gamperl, A.K., Bowman, S., 2009. Atlantic cod (Gadus morhua) he-moglobin genes: multiplicity and polymorphism. BMC Genet. 10, 51.
Brett, J.R., 1971. Energetic responses of salmon to temperature. A study of somethermal regulations in the physiology and freshwater ecology of sockeye salmon(Oncorhynchus nerka). Am. Zool. 11, 99–113.
Brix, O., Forås, E., Strand, I., 1998. Genetic variation and functional properties of Atlanticcod hemoglobins: introducing a modified tonometric method for studying fragilehemoglobins. Comp. Biochem. Physiol. A 119, 575–583.
Brix, O., Thorkildsen, S., Colosimo, A., 2004. Temperature acclimation modulates theoxygen binding properties of the Atlantic cod (Gadus morhua L.) genotypesHbI*1/1, HbI*1/2, and HbI*2/2 by changing the concentrations of their major he-moglobin components (results from growth studies at different temperatures).Comp. Biochem. Physiol. A 138, 241–251.
Buhler, D.R., Shanks, W.E., 1959. Multiple hemoglobins in fishes. Science 129 (3353),899–900.
Claireaux, G., Webber, D.M., Lagardere, J.P., Kerr, S.R., 2000. Influence of water temper-ature and oxygenation on the aerobic metabolic scope of Atlantic cod (Gadusmorhua). J. Sea Res. 44, 257–265.
Colosimo, A., Giuliani, A., Maranghi, F., Brix, O., Thorkildsen, S., Fischer, T., Knust, R.,Pörtner, H.O., 2003. Physiological and genetical adaptation to temperature in fishpopulations. Cont. Shelf Res. 23, 1919–1928.
Dahle, G., Jørstad, K.E., 1993. Haemoglobin variation in cod — a reliable marker for Arc-tic cod (Gadus morhua L). Fish. Res. 16, 301–311.
Dahle, G., Jørstad, K.E., Rusaas, H.E., Otterå, H., 2006. Genetic characteristics ofbroodstock collected from four Norwegian coastal cod (Gadus morhua) popula-tions. ICES J. Mar. Sci. 63, 209–215.
Donelson, J.M., Munday, P.L., McCormick, M.I., Pitcher, C.R., 2012. Rapid transgenerationalacclimation of a tropical reef fish to climate change. Nat. Clim. Chang. 2, 30–32.
Dutil, J.D., Brander, K.M., 2003. Comparing productivity of North Atlantic cod (Gadusmorhua) stocks and limits to growth production. Fish. Oceanogr. 12, 502–512.
Frydenberg, O., Møller, D., Nævdal, G., Sick, K., 1965. Haemoglobin polymorphism inNorwegian cod populations. Hereditas-Genetisk A. 53, 257–271.
Fyhn, U.E.H., Brix, O., Nævdal, G., Johansen, T., 1994. New variants of the haemoglobinsof Atlantic cod — a tool for discriminating between coastal and Arctic cod popula-tions. Int. Co. Explor. Sea, Copenhagen K.
Fyhn, U.E.H., Johansen, T., Nævdal, G., Thorkildsen, S., 1995. Ontogeny of haemoglobinpolymorphism in cod. J. Fish Biol. 47, 56–60.
Gamperl, A.K., Busby, C.D., Hori, T.S.F., Afonso, L.O.B., Hall, J.R., 2009. Hemoglobin geno-type has minimal influence on the physiological response of juvenile Atlantic cod(Gadus morhua) to environmental challenges. Physiol. Biochem. Zool. 82, 483–494.
Gjerde, B., Terjesen, B.F., Barr, Y., Lein, I., Thorland, I., 2004. Genetic variation for juve-nile growth and survival in Atlantic cod (Gadus morhua). Aquaculture 236,167–177.
Gjøsæter, J., Jørstad, K., Nævdal, G., Thorkildsen, S., 1992. Genotype distributions of codfrom the Norwegian Skagerrak coast. Sarsia 76, 255–259.
Glover, K., Nyhammer, G., Nævdal, G., Otterlei, E., Thorkildsen, S., 1997. Studies ongenotype dependent growth in juvenile cod (Gadus morhua) reared at differenttemperatures and light regimes. Report Series, 1997 (8). Department of Fisheriesand Marine Biology, University of Bergen, Norway (13 pp.).
Godø, O.R., Moksness, E., 1987. Growth and maturation of Norwegian coastal cod andNortheast Arctic cod under different conditions. Fish. Res. 5 (2–3), 235–242.
Gräns, A., Olsson, C., Pitsillides, K., Nelson, K.H.E., Cech Jr., J.J., Axelsson, M., 2010. Effectsof feeding on thermoregulatory behviours and gut blood flow in white sturgeon(Acipenser transmontanus) using biotelemetry in combination with standard tech-niques. J. Exp. Biol. 213, 3198–3206.
Halldórsdóttir, K., Árnason, E., 2009a. Multiple linked β and α globin genes in Atlanticcod: a PCR based strategy of genomic exploration. Mar. Genomics 2, 169–181.
Halldórsdóttir, K., Árnason, E., 2009b. Organization of a β and α globin gene set in theteleost Atlantic cod, Gadus morhua. Biochem. Genet. 47, 817–830.
Hemmer-Hansen, J., Nielsen, E.E., Meldrup, D., Mittelholzer, C., 2011. Identification ofsingle nucleotide polymorphisms in candidate genes for growth and reproductionin a nonmodel organism: the Atlantic cod Gadus morhua. Mol. Ecol. Resour. 11(Suppl. 1), 71–80.
Hubert, S., Higgins, B., Borza, T., Bowman, S., 2010. Development of a SNP resource anda genetic linkage map for Atlantic cod (Gadus morhua). BMC Genomics 11, 191.
Husebø, A., Imsland, A.K., Nævdal, G., 2004. Haemoglobin variation in cod: a descrip-tion of new variants and their geographical distribution. Sarsia 89, 369–378.
Hylen, A., 1964. Coastal cod and skrei in the Lofoten area. FiskDir. Skr. Ser. HavUnders.13, 27–42.
ICES, a. www.ices.dk.Imsland, A.K., Foss, A., Nævdal, G., Johansen, T., Folkvord, A., Stefansson, S.O., Jonassen,
T.M., 2004. Variations in growth in haemoglobin genotypes of Atlantic cod. FishPhysiol. Biochem. 30, 47–55.
Jamieson, A., Birley, A.J., 1989. The demography of a haemoglobin polymorphism in theAtlantic cod, Gadus morhua L. J. Fish Biol. 35 (Suppl. A), 193–204.
Jamieson, A., Jónssen, J., 1971. The Greenland component of spawning cod at Iceland.Rapports et Procés-Verbaux des Réunions. Cons. Int. Explor. Mer 161, 65–72.
Jamieson, A., Otterlind, G., 1971. The use of cod blood protein polymorphisms in theBelt Sea, the Sound and the Baltic Sea. Rapports et Procés-Verbaux des Réunions.Cons. Int. Explor. Mer. 161, 55–59.
Jamieson, A., Thompson, D., 1972. Blood proteins in North Sea cod (Gadus morhua L.).XIIth European Conference on Animal Blood Groups Biochemical Polymorphism,Bp. 585–591.
Jensen, F.B., Fago, A., Weber, R.E., 1998. Hemoglobin structure and function. Fish Physiol.17, 1–40.
Jobling, M., 1983. Growth-studies with fish — overcoming the problems of size varia-tion. J. Fish Biol. 22, 153–157.
Jordan, A.D., Lampe, J.F., Grisdale-Helland, B., Helland, S.J., Shearer, K.D., Steffensen, J.F.,2006. Growth of Atlantic cod (Gadus morhua L.) with different haemoglobin sub-types when kept near their temperature preferenda. Aquaculture 257, 44–52.
Jørstad, K.E., Nævdal, G., 1994. Studies on associations between genotypes and growthrate in juvenile cod. ICES Mar. Sci. 198, 671–675.
Jørstad, K.E., Karlsen, O., Svasand, T., Otterå, H., 2006. Comparison of growth rateamong different protein genotypes in Atlantic cod, Gadus morhua, under farmedconditions. ICES J. Mar. Sci. 63 (2), 235–245.
Karpov, A.K., Novikov, G.G., 1980. Hemoglobin alloforms in the cod Gadus morhua,gadiformes Gadidae. Their functional features and distribution in populations. J.Ichthyol. 20 (6), 45–49.
Karpov, A.K., Osinov, A.G., Novikov, G.G., 1984. Protein polymorphism in Atlantic cod,Gadus morhua (Gadidae), of the White Sea. J. Ichthyol. 24, 71–79.
Kirpichnikov, V.S., 1981. Genetic Bases of Fish Selection. Springer-Verlag, Berlin (410 pp.).Lefrancois, C., Claireaux, G., 2003. Influence of ambient oxygenation and temperature
on metabolic scope and scope for heart rate in the common sole Solea solea. Mar.Ecol. Prog. Ser. 259, 273–284.
McFarland, S., 1998. Biochemical and Physiological Adaptations of Haemoglobin-I Geno-types of Atlantic Cod, Gadus morhua L. The University of Birmingham (PhD thesis).
Methling, C., Aluru, N., Vijayan, M.M., Steffensen, J.F., 2010. Effect of moderate hypoxiaat three acclimation temperatures on stress responses in Atlantic cod with differ-ent haemoglobin types. Comp. Biochem. Physiol. A 156, 485–490.
Moen, T., Hayes, B., Nilsen, F., Delghandi, M., Fjalestad, K.T., Fevolden, S.E., Berg, P.R.,Lien, S., 2008. Identification and characterisation of novel SNP markers in Atlanticcod: evidence for directional selection. BMC Genet. 9, 18.
Møller, D., 1966. Genetic differences between cod groups in the Lofoten area. Nature19, 824.
Møller, D., 1968. Genetic diversity in spawning coda long the Norwegian coast. Hereditas60, 1–32.
Mork, J., Sundnes, G., 1984. Hemoglobin polymorphism in Gadus Morhua: genotypicdifferences in hematocrit. Helgol. Meeresunt. 38, 201–206.
Mork, J., Sundnes, G., 1985. Hemoglobin polymorphism in Atlantic cod (Gadusmorhua): allele frequency variation between year classes in a Norwegian fjordstock. Helgol. Meeresunt. 39, 55–62.
Mork, J., Giskeødegaard, R., Sundnes, G., 1983. The haemoglobin polymorphism inGadus morhua: genotypic differences in maturing age and within-season gonadmaturation. Helgol. Meeresunt. 36, 313–322.
Mork, J., Giskeødegaard, R., Sundnes, G., 1984a. The haemoglobin polymorphism in At-lantic cod (Gadus morhua L.); genotypic differences in somatic growth and in ma-turing age in natural populations. Flödevigen Rapportserie 1, 721–732.
Mork, J., Giskeødegaard, R., Sundnes, G., 1984b. Population genetic studies in cod(Gadus morhua L.) by means of the haemoglobin polymorphism: observations ina Norwegian coastal population. FiskDir. Skr.(Havundersøgelser) 17, 449–471.
Mork, J., Ryman, N., Ståhl, G., Utter, F., Sundnes, G., 1985. Genetic variation inAtlantic cod (Gadus morhua) throughout its range. Can. J. Fish. Aquat. Sci. 42,1580–1587.
Nævdal, G., Folkvord, A., Otterlei, E., Thorkildsen, S., 1992. Growth-rate related to geno-type of 0-group cod at 3 environmental temperatures. Sarsia 77, 71–73.
Nielsen, E.E., Hemmer-Hansen, J., Poulsen, N.A., Loeschcke, V., Moen, T., Johansen, T.,Mittelholzer, C., Taranger, G.L., Ogden, R., Carvalho, G.R., 2009. Genomic signatures
168 S.D. Ross et al. / Comparative Biochemistry and Physiology, Part A 166 (2013) 158–168
of local directional selection in a high gene flow marine organism; the Atlantic cod(Gadus morhua). BMC Evol. Biol. 9, 276.
Nikinmaa, M., 2001. Haemoglobin function in vertebrates: evolutionary changes incellular regulation in hypoxia. Resp. Physiol. 128 (3), 317–329.
Nordeide, J.T., Båmstedt, U., 1998. Coastal cod and north-east Arctic cod — do theymingle at the spawning grounds in Lofoten? Sarsia 83 (5), 373–379.
Pampoulie, C., Ruzzante, D.E., Chosson, V., Jörundsdóttir, T.D., Taylor, L., Thorsteinsson,V., Daníelsdóttir, A.K., Marteinsdóttir, G., 2011. The genetic structure of Atlantic cod(Gadus morhua) around Iceland: insight from microsatellites, the Pan I locus, andtagging experiments. Can. J. Fish. Aquat. Sci. 63 (12), 2660–2674.
Pedersen, T., Jobling, M., 1989. Growth rates of large, sexually mature cod, Gadusmorhua, in relation to condition and temperature during an annual cycle. Aquacul-ture 81, 161–168.
Petersen, M.F., Steffensen, J.F., 2003. Preferred temperature of juvenile Atlantic codGadus morhua with different haemoglobin genotypes at normoxia and moderatehypoxia. J. Exp. Biol. 206, 359–364.
Pörtner, H.O., Knust, R., 2007. Climate change affects marine fishes through the oxygenlimitation of thermal tolerance. Science 315, 95–97.
Pörtner, H.O., Berdal, B., Blust, R., Brix, O., Colosimo, A., De Wachter, B., Giuliani, A.,Johansen, T., Fischer, T., Knust, R., Lannig, G., Naevdal, G., Nedenes, A., Nyhammer,G., Sartorisa, F.J., Serendero, I., Sirabella, P., Thorkildsen, S., Zakhartsev, M., 2001. Cli-mate induced temperature effects on growth performance, fecundity and recruitmentin marine fish: developing a hypothesis for cause and effect relationships in Atlanticcod (Gadus morhua) and common eelpout (Zoarces viviparus). Cont. Shelf Res. 21,1975–1997.
Rätz, H.J., Lloret, J., 2003. Variation in fish condition between Atlantic cod (Gadus morhua)stocks, the effect on their productivity and management implications. Fish. Res. 60,369–380.
Righton, D.A., Andersen, K.H., Neat, F., Thorsteinsson, P.S., Svedäng, H., Michalsen, K.,Hinrichsen, H.H., Bendall, V., Neuenfeldt, S., Wright, P., Jonsson, P., Huse, G., vander Kooij, J., Mosegaard, H., Hüssy, K., Metcalfe, J., 2010. Thermal niche of Atlanticcod Gadus morhua: limits, tolerance and optima. Mar. Ecol. Prog. Ser. 420, 1–13.
Rollefsen, G., 1934. The cod otolith as a guide to race, sexual development andmortality.Rapp. P.V. Reun. Cons. Int. Explor. Mer. 88, 1–15.
Salvanes, A.G.V., Hart, P.J.B., 2000. Is individual variation in competitive performance ofreared juvenile cod influenced by haemoglobin genotype? Sarsia 85, 265–274.
Schurmann, H., Steffensen, J.F., 1992. Lethal oxygen levels at different temperaturesand the preferred temperature during hypoxia of the Atlantic cod Gadus morhuaL. J. Fish Biol. 41, 927–934.
Sick, K., 1961. Haemoglobin polymorphism in fishes. Nature 192, 894–896.Sick, K., 1965a. Haemoglobin polymorphism of cod in Baltic and Danish Belt Sea.
Hereditas-Genetisk A. 54, 19–48.Sick, K., 1965b. Haemoglobin polymorphism of cod in North Sea and North Atlantic
Ocean. Hereditas-Genetisk A. 54, 49–69.Skjæraasen, J.E., Nilsen, T., Meager, J.J., Herbert, N.A., Moberg, O., Tronci, V., Johansen, T.,
Salvanes, A.G.V., 2008. Hypoxic avoidance behaviour in cod (Gadus morhua L.): theeffect of temperature and haemoglobin genotype. J. Exp. Mar. Biol. Ecol. 358, 70–77.
Stearns, S.C., 1992. The Evolution of Life Histories. University Press, Oxford (248 p.).Swain, D.P., Kramer, D.L., 1995. Annual variation in temperature selection by Atlantic
cod Gadus morhua in the southern Gulf of St. Lawrence, Canada, and its relationto population size. Mar. Ecol. Prog. Ser. 116, 11–23.
Tao, W.J., Boulding, E.G., 2003. Associations between single nucleotide polymorphismsin candidate genes and growth rate in Arctic charr (Salvelinus alpinus L). Heredity91 (1), 60–69.
Taranger, G.L., Aardal, L., Hansen, T., Kjesbu, O.S., 2006. Continuous light delays sexualmaturation and increases growth of Atlantic cod (Gadus morhua L.) in sea cages.ICES J. Mar. Sci 63 (2), 365–375.
Val, A.L., 2000. Organic phosphates in the red blood cells of fish. Comp. Biochem. Physiol.A 125, 417–435.
Verde, C., Balestrieri, M., Pascale, D.M., Pagnozzi, D., Lecointre, G., Prisco, G., 2006. Theoxygen transport system in three species of the boreal fish family Gadidae. J. Biol.Chem. 28, 22073–22084.
Weber, R.E., Jensen, F.B., 1988. Functional adaptations in hemoglobins from ectothermicanimals. Annu. Rev. Physiol. 50, 161–179.
Wennevik, V., Jørstad, K.E., Dahle, G., Fevolden, S.-E., 2008. Mixed stock analysis andthe power of different classes of molecular markers in discriminating coastal andoceanic Atlantic cod (Gadus morhua L.) on the Lofoten spawning grounds, NorthernNorway. Hydrobiologia 606, 7–25.
Wilkins, N.P., 1967. Polymorphism of whole blood proteins in the cod (Gadus morhuaL). Cons. Perm. Int. Expl. Mer. 31 (1), 77–88.
Wilkins, N.P., 1969. Haemoglobin polymorphism in cod, whiting and Pollack in Scottishwaters. Cons. Perm. Int. Explor. Mer. 161, 60–63.