effects of skylights refurbishment on the indoor hygrothermal environment of a gallery space in a...
TRANSCRIPT
1 Copyright © 20xx by WEENTech
Proceedings of the Global Conference on Energy and Sustainable Development GCESD2015
February 24-26, 2015, Technology Park, Coventry University Coventry, UK
GCESD4015
EFFECTS OF SKYLIGHTS REFURBISHMENT ON THE INDOOR HYGROTHERMAL ENVIRONMENT OF A GALLERY SPACE IN A HISTORICAL BUILDING OF
CULTURAL SIGNIFICANCE
Fan Wang*, Yinqi Zhang, Shashwat Ganguly
Royal Academy of Engineering Centre of Excellence
in Sustainable Development Building Design
Heriot-Watt University
Michael Browne
Operations Department
National Galleries of Scotland
ABSTRACT
This paper reports a systematic study on an assessment of the
effects of skylights refurbishment on the indoor hygrothermal
environment of a gallery space in a national gallery building
housed in a historical building of architectural significance. A
CFD model was developed and validated by two sets of
measured data: one collected before the refurbishment and
the other after. The model was used to simulate six
representative scenarios of normal operation of the gallery for
both before and after the refurbishment. In parallel, a
quantitative assessment was developed to analysis the
modelling data and assess the impacts of the refurbishment
and quality of the indoor hygrothermal conditions. The
modeling results were plotted to show the daily fluctuation
and vertical gradient for the key environmental variables
before and after the refurbishment. This would allow designers
and gallery curators to determine the suitable height for
displaying the humidity sensitive paintings according to the
quality of skylights and the degree of tightness of
hygrothermal control. As a part of a three-year project of
renovation of the gallery building, this work is expected to
produce some guidance for developing renovation solutions
for historical buildings as a part of the campaign of carbon
reduction and building conservation and quantitative methods
for post-refurbishment assessment.
Keywords: hygrothermal control, modelling, CFD, assessment,
daily fluctuation, spatial gradient, refurbishment, skylights
INTRODUCTION
Built in mid-19th century, The National Gallery Scotland is a
stone-built classical building. The external walls are made of
sandstone over 1 meter thick and with no fenestration leading
to the display spaces and the roof structures are un-insulated.
A large skylight at roof level provides the natural lighting for
one of the display space and the skylights were single-glazed,
poor-quality work of the 1960s.
Skylights play a crucial role in galleries, museums and libraries,
as they provide natural lighting to the interior spaces of these
buildings. But on the thermal side, they present some
problems due to their high U-values, such as excessive heat
loses, low surface temperature that increases risk of
condensation. Among them, the most problematic one is the
diurnal fluctuation of the indoor air temperature and relative
humidity, especially to gallery spaces that require stable
hygrothermal condition for conservation purpose of the
artefacts on display. This increases both the risk of damage to
the artefacts and the energy consumed by the Heating
Ventilation Air Conditioning (HVAC) system when a tight
control is applied.
A refurbishment, including replacing the skylights with
high performance glazing panels and adaptable control band,
was carried out to reduce the excessive energy bill and
improve thermal performance(Wang et al 2013).
Aim & Objectives
The aim of this study is to assess the effects of the skylight
refurbishment on the quality of the hygrothermal condition in
one of the typical gallery space and energy consumption.
METHDOLOGY
To achieve the aim, the following objectives were made:
*correspondent author: [email protected]
2 Copyright © 20xx by WEENTech
1) To conduct a monitoring measurement to collect data
before and after the refurbishment for validation of a CFD
model for a modeling study.
2) To develop a CFD model to carry out detailed comparison
of before and after the refurbishment under a number of
typical operation conditions
3) To design typical cases and validate the model to ensure its
robustness
4) To design operation scenarios for comparison
5) To develop an assessment criteria with identified variables
for the simulation result
6) To compare the result of before/after refurbishment using
the assessment criteria
7) To conclude the impacts of the skylight refurbishment on
the indoor hygrothermal conditions of a gallery space
Monitoring measurement
Due to the scale of the project, only one space, Gallery 11 was
examined. This was also because there was some
refurbishment, which was carried out in stages to allow the
most parts of the gallery remaining open to public
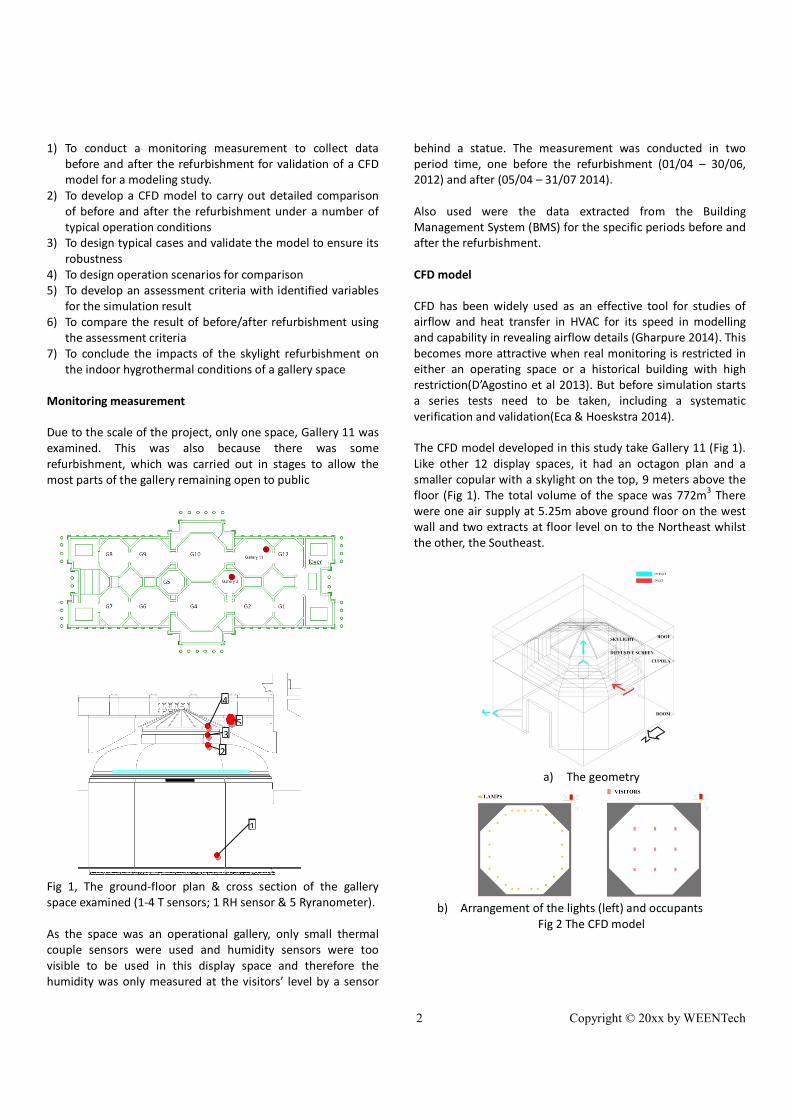
Fig 1, The ground-floor plan & cross section of the gallery
space examined (1-4 T sensors; 1 RH sensor & 5 Ryranometer).
As the space was an operational gallery, only small thermal
couple sensors were used and humidity sensors were too
visible to be used in this display space and therefore the
humidity was only measured at the visitors’ level by a sensor
behind a statue. The measurement was conducted in two
period time, one before the refurbishment (01/04 – 30/06,
2012) and after (05/04 – 31/07 2014).
Also used were the data extracted from the Building
Management System (BMS) for the specific periods before and
after the refurbishment.
CFD model
CFD has been widely used as an effective tool for studies of
airflow and heat transfer in HVAC for its speed in modelling
and capability in revealing airflow details (Gharpure 2014). This
becomes more attractive when real monitoring is restricted in
either an operating space or a historical building with high
restriction(D’Agostino et al 2013). But before simulation starts
a series tests need to be taken, including a systematic
verification and validation(Eca & Hoeskstra 2014).
The CFD model developed in this study take Gallery 11 (Fig 1).
Like other 12 display spaces, it had an octagon plan and a
smaller copular with a skylight on the top, 9 meters above the
floor (Fig 1). The total volume of the space was 772m3 There
were one air supply at 5.25m above ground floor on the west
wall and two extracts at floor level on to the Northeast whilst
the other, the Southeast.
a) The geometry
b) Arrangement of the lights (left) and occupants
Fig 2 The CFD model
1
4
3
5
2
3 Copyright © 20xx by WEENTech
There are two large openings linking the neighboring galleries
which were maintained at the same conditions, hence the
disturbance from these two neighbours was ignored.
Heat loads calculation & boundary conditions
The loads calculation to specify the model was based on CIBSE
Guide A (2006).
The casual gains include lighting and occupants. The lighting
heat gains, both before and after the refurbishment, were
obtained from the Estate Management Team in the Gallery
(Table 1). The value after refurbishment was significantly
reduced, as one of the measures in the refurbishment is to
reduce energy consumption. The occupant numbers, before
and after were about the same, hence one figure was used for
modeling and it was derived from the weekly counts and
assumption of one hour stay for each visitor. More details can
be found in Zhang (2014)
Validation
Selected for the model validation were four cases. Each one
was characterized with large diurnal changes in the
temperature, relative humidity and solar radiations, all of
which contributed to large change in the loads of the gallery
space during one day cause, and consequently, required
heating, cooling, humidifying and dehumidifying. The first two
cases were on cold date, 1st
of April 2012, morning and
afternoon and the third was on 1st
June afternoon, 2012,
where there was a strong solar penetration. The forth one was
on the 13th
of May 21st
June, also with high solar radiation.
Such selection allowed the model to be set to a widest range
of variables for the testing.
Table 1: Four designed cases for validation and their input (#1
NGS; #2 CIBSE calculation; #3 BMS; #4 BMS+calculation)
Case 1 Case 2 Case 3 Case 4
Heat gains (kW) & ventilation
01/04/12 07:00
01/04/12 16:00
01/06/12 16:00
13/05/14 16:00
light (W/lamp) #1 0 23.05 23.05 4.61 Occupants (W/person) #1 0 75 75 75
Occupants vapor(g/s) #1 0 0.05 0.08 0.05
Skylight gains (kW) #2 -2.72 -0.58 0.24 -0.19
Roof gains (kW) #2 -1.61 -0.34 0.14 -0.28
Infiltration (kW) #2 -3.11 -1.12 -0.75 -1.00
Solar penetration (kW) #2 1.21 3.06 4.59 3.33
Outdoor air T (°C) #4 2.8 15.52 17.74 16.33
Room control T (°C) #3 21.66 22.29 22.28 22.4
Room control RH (%) #3 45-60 45-60 58 47
Supply air T (°C) #4 28.05 20.3 19.6 20.8
Supply air RH (%) #4 35 41 61 51
Supply flow rate (kg/s) #4 0.96 1.08 1.97 1.86
Designing the scenarios & assessment criterion
To assess the effects of skylights replacement, six scenarios
were designed to compare before and after the replacement
(Table 2 is a summary and Appendix for details). Each of the
scenarios was simulated by the CFD model and results are
arranged in pairs to show the difference before and after the
refurbishment, for example: results of BWA and AWA are
plotted into one chart to show a winter AM before and after
the skylights replacement.
Table 2: 12 scenarios designed and simulated for comparison Before refurbishment After refurbishment
winter mild summer winter mild summer
am pm am pm am pm am pm Am pm am pm
scenarios BWA BWP BMA BMP BSA BSP AWA AWP AMA AMP ASA ASP
The management team in the gallery were aware that the
indoor environment control was tight for the gallery space,
maintained at 16~19 ± 1°C for air temperature and 45 ~ 60 ±
5% for relative humidity (BS 5454) and regarded this as the
major causes for high services cost. An adaptable control was
suggested (Harley Haddow, 2012) and examined using
computer modelling (Wang et al, 2013). Based on these
studies, control of three bands – for winter, mild seasons and
summer time was applied in this study (Table 3).
Table 3: Adaptable control bands Period T, °C RH, %
Dec – Feb 18.5-21 41-55
Mar-May & Sept – Nov 19-22 45-60
Jun- Aug 19.5-22.5 47-63
The predicted results were arranged to show the daily
fluctuation and vertical spatial gradient for the air temperature
and relative humidity to assess the indoor hygrothermal
stability and uniformity, the two extra aspects that are
suggested by art conservationists (Camuffo 2014).
Furthermore, the assessment was made by comparing the
heat loses through skylight before and after the refurbishment.
A more detailed comparison is reported in a parallel study
(Sheng, 2014)
RESULTS AND DISCUSSIONS
Verification and validation
The final model had 573,852 cells, which is equivalent of 740
cells per m3 of the flow domain and all cases took around 4
hours to complete 1000 iterations to reach convergence on a
PC with a Core™ i7-4710MQ Processor.
All cases show good agreement between the measured and
modelled for both the temperature over 4 heights and relative
humidity (Fig 4). Although the CFD model appears
underestimated the spatial temperature gradient in the space
and relative deviation, ΔT/T is always less than 15%. The
4 Copyright © 20xx by WEENTech
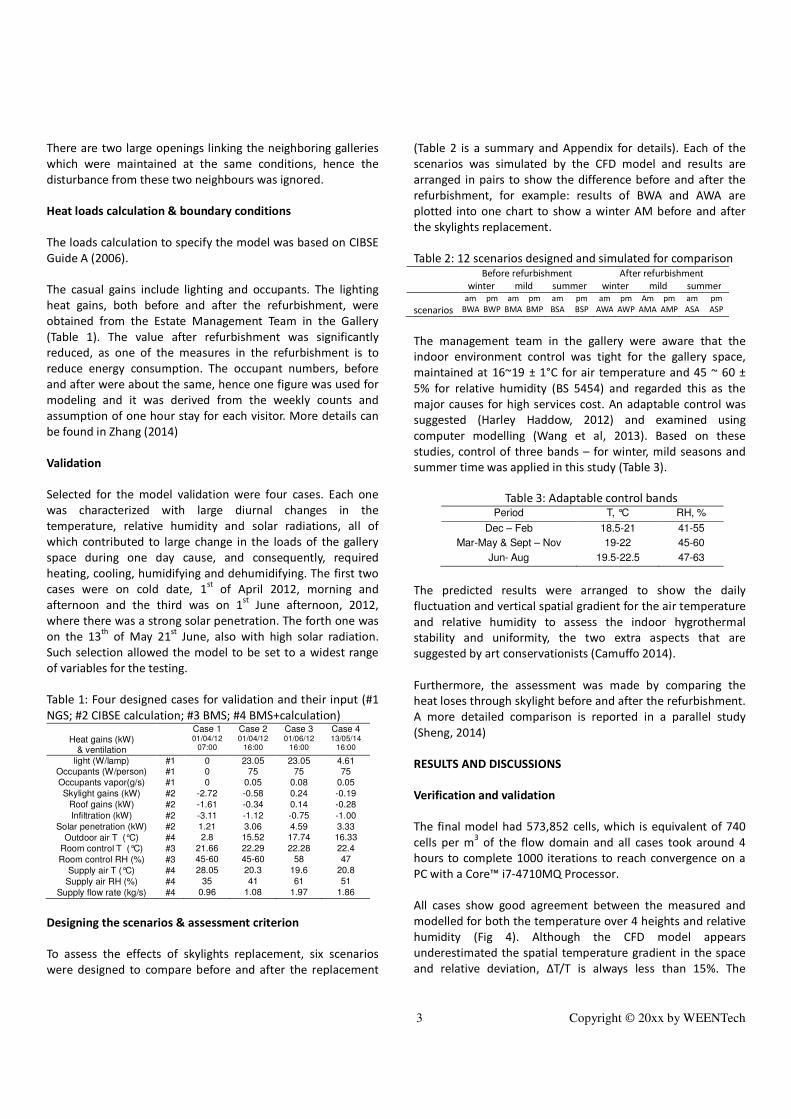
highest happened close to the top, which far above display
space. The ΔRH/RH is even smaller, less than 10% (Fig 5).
a) Early morning on the cold day in 2012
b) Later afternoon on the cold day in 2012
c) Later afternoon on the warm day in 2012
d) Later afternoon on the warm day in 2014
Fig 3. The measured and modelled (left) and the relative
difference (right) of the four selected cases for model validation
Figure 5. Comparison of RT for all four cases
Indoor hygrothermal conditions
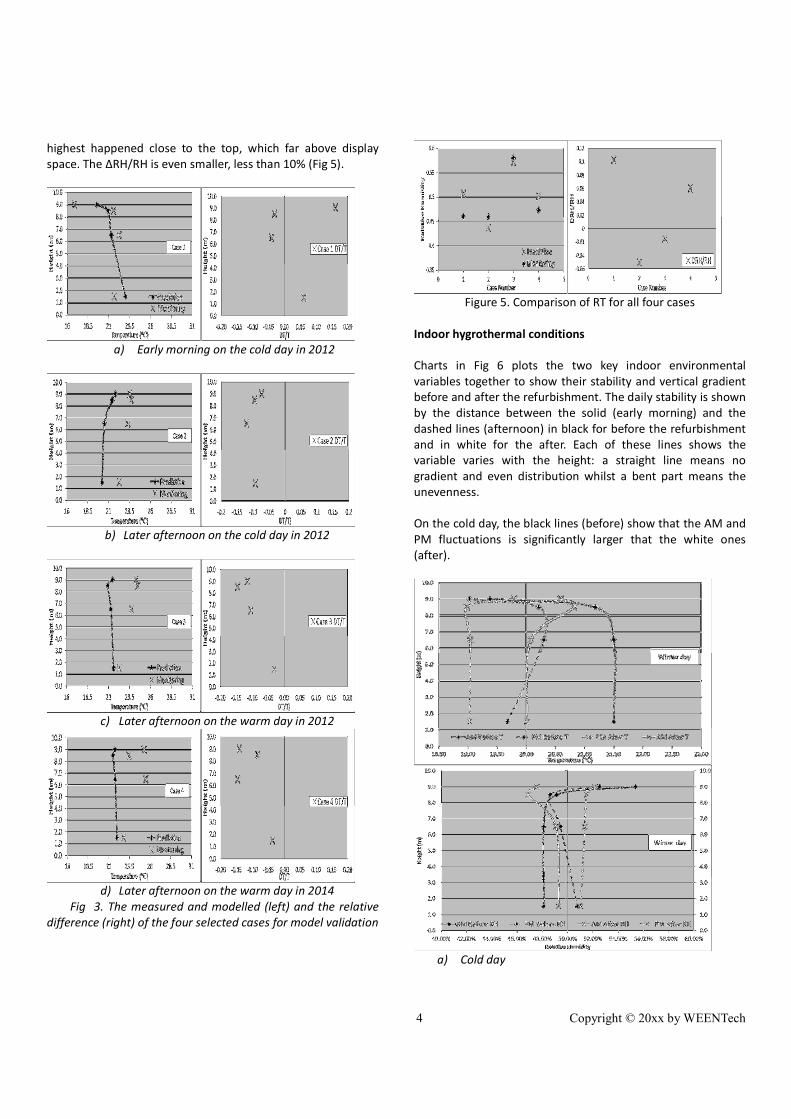
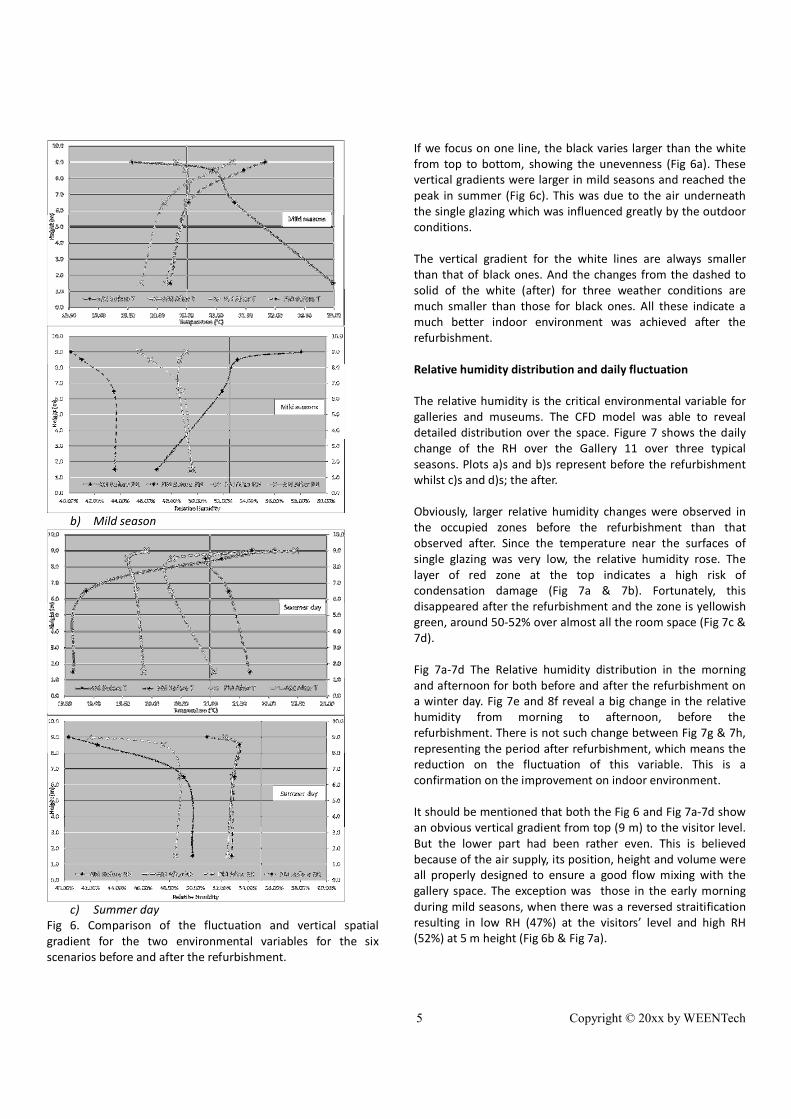
Charts in Fig 6 plots the two key indoor environmental
variables together to show their stability and vertical gradient
before and after the refurbishment. The daily stability is shown
by the distance between the solid (early morning) and the
dashed lines (afternoon) in black for before the refurbishment
and in white for the after. Each of these lines shows the
variable varies with the height: a straight line means no
gradient and even distribution whilst a bent part means the
unevenness.
On the cold day, the black lines (before) show that the AM and
PM fluctuations is significantly larger that the white ones
(after).
a) Cold day
5 Copyright © 20xx by WEENTech
b) Mild season
c) Summer day
Fig 6. Comparison of the fluctuation and vertical spatial
gradient for the two environmental variables for the six
scenarios before and after the refurbishment.
If we focus on one line, the black varies larger than the white
from top to bottom, showing the unevenness (Fig 6a). These
vertical gradients were larger in mild seasons and reached the
peak in summer (Fig 6c). This was due to the air underneath
the single glazing which was influenced greatly by the outdoor
conditions.
The vertical gradient for the white lines are always smaller
than that of black ones. And the changes from the dashed to
solid of the white (after) for three weather conditions are
much smaller than those for black ones. All these indicate a
much better indoor environment was achieved after the
refurbishment.
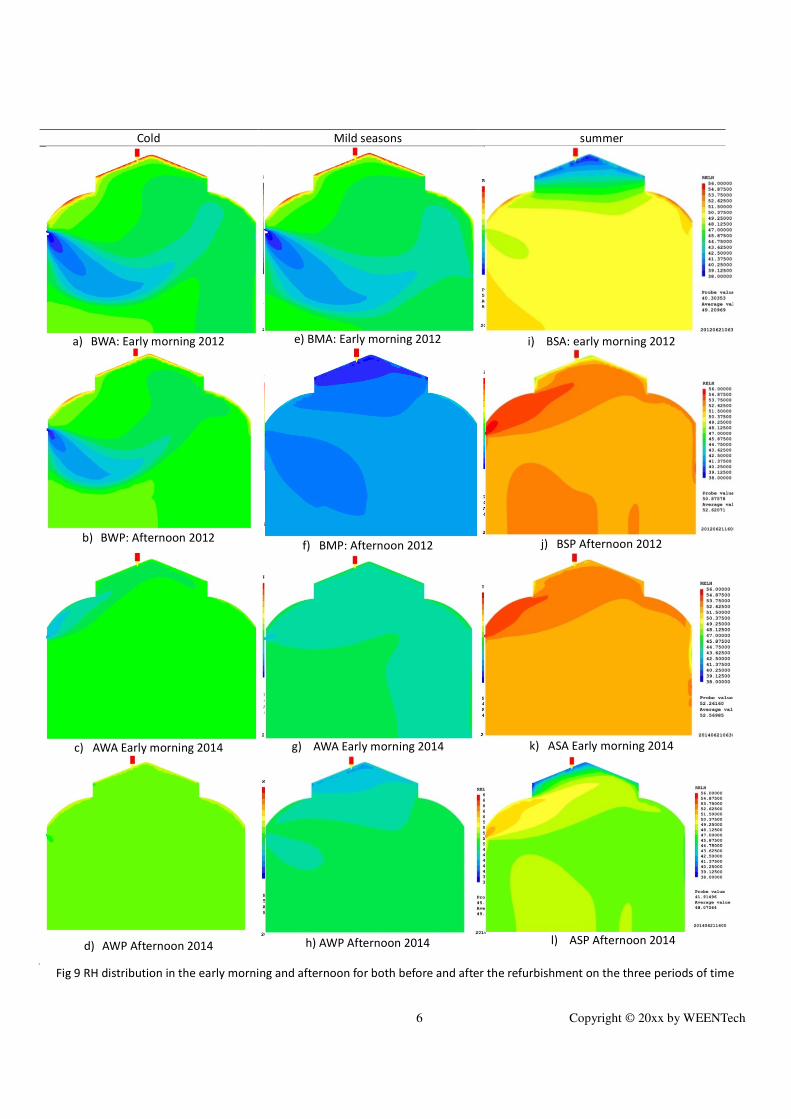
Relative humidity distribution and daily fluctuation
The relative humidity is the critical environmental variable for
galleries and museums. The CFD model was able to reveal
detailed distribution over the space. Figure 7 shows the daily
change of the RH over the Gallery 11 over three typical
seasons. Plots a)s and b)s represent before the refurbishment
whilst c)s and d)s; the after.
Obviously, larger relative humidity changes were observed in
the occupied zones before the refurbishment than that
observed after. Since the temperature near the surfaces of
single glazing was very low, the relative humidity rose. The
layer of red zone at the top indicates a high risk of
condensation damage (Fig 7a & 7b). Fortunately, this
disappeared after the refurbishment and the zone is yellowish
green, around 50-52% over almost all the room space (Fig 7c &
7d).
Fig 7a-7d The Relative humidity distribution in the morning
and afternoon for both before and after the refurbishment on
a winter day. Fig 7e and 8f reveal a big change in the relative
humidity from morning to afternoon, before the
refurbishment. There is not such change between Fig 7g & 7h,
representing the period after refurbishment, which means the
reduction on the fluctuation of this variable. This is a
confirmation on the improvement on indoor environment.
It should be mentioned that both the Fig 6 and Fig 7a-7d show
an obvious vertical gradient from top (9 m) to the visitor level.
But the lower part had been rather even. This is believed
because of the air supply, its position, height and volume were
all properly designed to ensure a good flow mixing with the
gallery space. The exception was those in the early morning
during mild seasons, when there was a reversed straitification
resulting in low RH (47%) at the visitors’ level and high RH
(52%) at 5 m height (Fig 6b & Fig 7a).
6 Copyright © 20xx by WEENTech
Cold Mild seasons summer
a) BWA: Early morning 2012 e) BMA: Early morning 2012 i) BSA: early morning 2012
b) BWP: Afternoon 2012 f) BMP: Afternoon 2012 j) BSP Afternoon 2012
c) AWA Early morning 2014 g) AWA Early morning 2014 k) ASA Early morning 2014
d) AWP Afternoon 2014 h) AWP Afternoon 2014 l) ASP Afternoon 2014
Fig 9 RH distribution in the early morning and afternoon for both before and after the refurbishment on the three periods of time
7 Copyright © 20xx by WEENTech
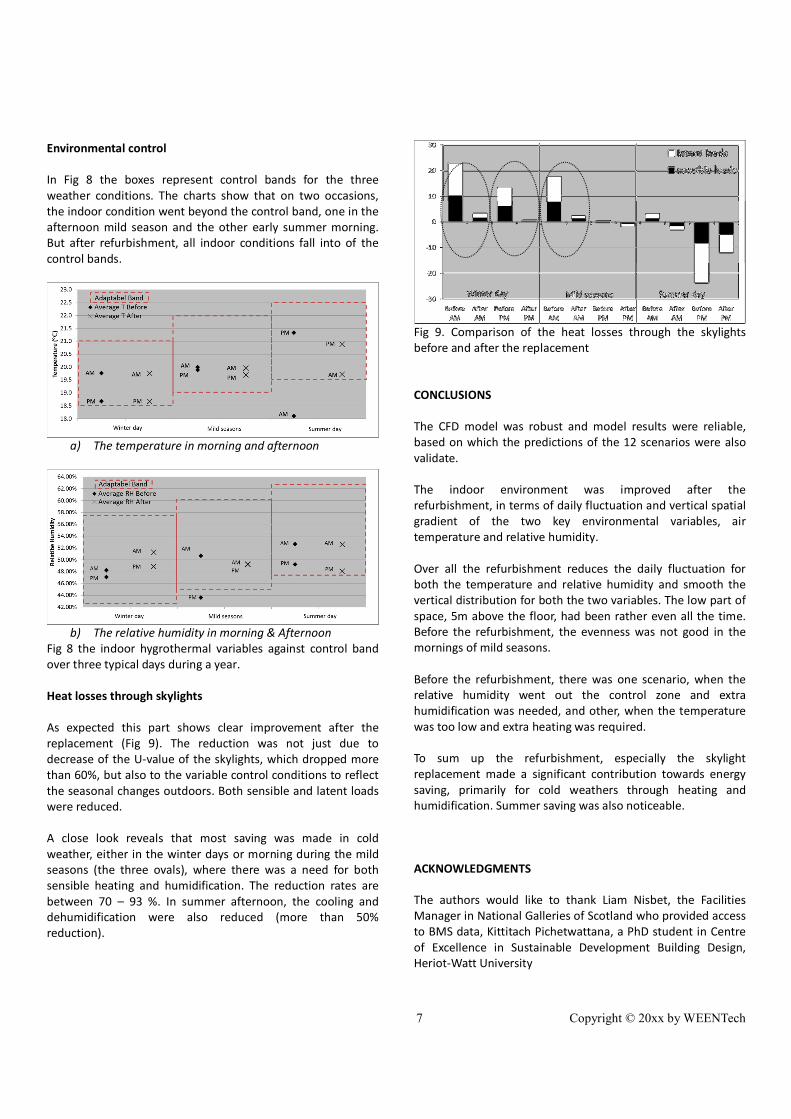
Environmental control
In Fig 8 the boxes represent control bands for the three
weather conditions. The charts show that on two occasions,
the indoor condition went beyond the control band, one in the
afternoon mild season and the other early summer morning.
But after refurbishment, all indoor conditions fall into of the
control bands.
a) The temperature in morning and afternoon
b) The relative humidity in morning & Afternoon
Fig 8 the indoor hygrothermal variables against control band
over three typical days during a year.
Heat losses through skylights
As expected this part shows clear improvement after the
replacement (Fig 9). The reduction was not just due to
decrease of the U-value of the skylights, which dropped more
than 60%, but also to the variable control conditions to reflect
the seasonal changes outdoors. Both sensible and latent loads
were reduced.
A close look reveals that most saving was made in cold
weather, either in the winter days or morning during the mild
seasons (the three ovals), where there was a need for both
sensible heating and humidification. The reduction rates are
between 70 – 93 %. In summer afternoon, the cooling and
dehumidification were also reduced (more than 50%
reduction).
Fig 9. Comparison of the heat losses through the skylights
before and after the replacement
CONCLUSIONS
The CFD model was robust and model results were reliable,
based on which the predictions of the 12 scenarios were also
validate.
The indoor environment was improved after the
refurbishment, in terms of daily fluctuation and vertical spatial
gradient of the two key environmental variables, air
temperature and relative humidity.
Over all the refurbishment reduces the daily fluctuation for
both the temperature and relative humidity and smooth the
vertical distribution for both the two variables. The low part of
space, 5m above the floor, had been rather even all the time.
Before the refurbishment, the evenness was not good in the
mornings of mild seasons.
Before the refurbishment, there was one scenario, when the
relative humidity went out the control zone and extra
humidification was needed, and other, when the temperature
was too low and extra heating was required.
To sum up the refurbishment, especially the skylight
replacement made a significant contribution towards energy
saving, primarily for cold weathers through heating and
humidification. Summer saving was also noticeable.
ACKNOWLEDGMENTS
The authors would like to thank Liam Nisbet, the Facilities
Manager in National Galleries of Scotland who provided access
to BMS data, Kittitach Pichetwattana, a PhD student in Centre
of Excellence in Sustainable Development Building Design,
Heriot-Watt University
8 Copyright © 20xx by WEENTech
REFERENCES
ASHRAE, H. (2007). Temperature and Relative Humidity
Specifications for Museum, Gallery, Library, and Archival
Collections Atlanta, United States, Heating, Ventilating, and
Air-conditioning Applications, American Society of Heating,
Refrigerating and Air-Conditioning Engineers (ASHRAE):
Chapter 21.13.
British Standard, B. (2000). Recommendations for the Storage
and Exhibition of Archival Documents BS 5454:2000
D’Agostino, D., Congedo, P. and Cataldo, R. (2013).
Computational fluid dynamics (CFD) modeling of microclimate
for salts crystallization control and artworks conservation.
Journal of Cultural Heritage.
D'Agostino, D. and Congedo, P. (2014). CFD modeling and
moisture dynamics implications of ventilation scenarios in
historical buildings. Building and Environment, 79, pp.181—
193
Eca, L. and Hoekstra, M. (2014). A procedure for the
estimation of the numerical uncertainty of CFD calculations
based on grid refinement studies. Journal of Computational
Physics, 262, pp.104—130
Harley Haddow, National Gallery Building Environmental Plant
& Control Review, Internal Report, 2011.
Sheng, M. W. (2014) Effects of renovation solutions on Energy
Saving and Indoor Environmental Quality in a historical
building, MSc dissertation, Royal Academy of Engineering
Centre of Excellence in Sustainable Development Building
Design, Heriot-Watt University.
Camuffo D, (2014) Chapter 2B – Humidity and Conservation
P77-118, Microclimate for Cultural Heritage, 2nd edition,
Wang, F., Pichetwattana, K., Hendry, R. and Galbraith, R.
(2014). Thermal performance of a gallery and refurbishment
solutions. Energy and Buildings, 71, pp.38--52.
Zhang, Y. (2014). CFD study of Skylights Refurbishment on the
indoor hygrothermal environment of a gallery space in a
historical building of cultural significance. MSc Dissertation,
Royal Academy of Engineering Centre of Excellence in
Sustainable Development Building Design, Heriot Watt
University.
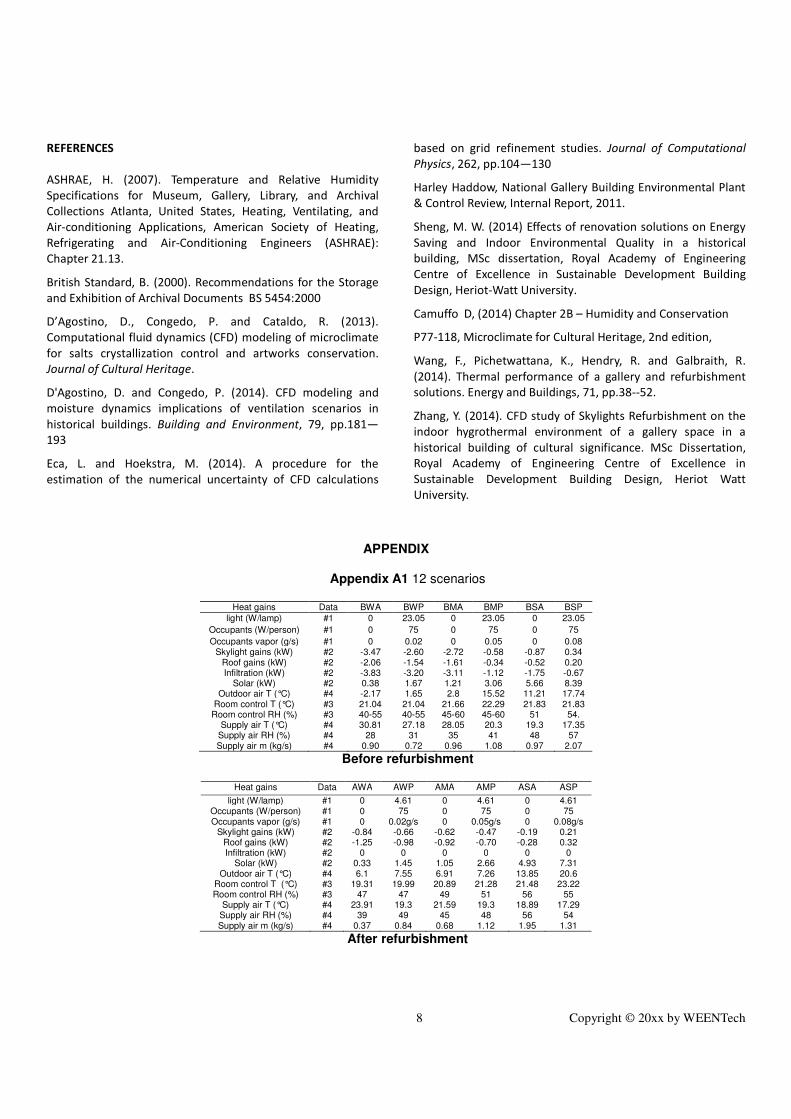
APPENDIX
Appendix A1 12 scenarios
Heat gains Data BWA BWP BMA BMP BSA BSP
light (W/lamp) #1 0 23.05 0 23.05 0 23.05
Occupants (W/person) #1 0 75 0 75 0 75
Occupants vapor (g/s) #1 0 0.02 0 0.05 0 0.08 Skylight gains (kW) #2 -3.47 -2.60 -2.72 -0.58 -0.87 0.34
Roof gains (kW) #2 -2.06 -1.54 -1.61 -0.34 -0.52 0.20 Infiltration (kW) #2 -3.83 -3.20 -3.11 -1.12 -1.75 -0.67
Solar (kW) #2 0.38 1.67 1.21 3.06 5.66 8.39 Outdoor air T (°C) #4 -2.17 1.65 2.8 15.52 11.21 17.74
Room control T (°C) #3 21.04 21.04 21.66 22.29 21.83 21.83 Room control RH (%) #3 40-55 40-55 45-60 45-60 51 54.
Supply air T (°C) #4 30.81 27.18 28.05 20.3 19.3 17.35 Supply air RH (%) #4 28 31 35 41 48 57 Supply air m (kg/s) #4 0.90 0.72 0.96 1.08 0.97 2.07
Before refurbishment
Heat gains Data AWA AWP AMA AMP ASA ASP
light (W/lamp) #1 0 4.61 0 4.61 0 4.61 Occupants (W/person) #1 0 75 0 75 0 75 Occupants vapor (g/s) #1 0 0.02g/s 0 0.05g/s 0 0.08g/s
Skylight gains (kW) #2 -0.84 -0.66 -0.62 -0.47 -0.19 0.21 Roof gains (kW) #2 -1.25 -0.98 -0.92 -0.70 -0.28 0.32 Infiltration (kW) #2 0 0 0 0 0 0
Solar (kW) #2 0.33 1.45 1.05 2.66 4.93 7.31 Outdoor air T (°C) #4 6.1 7.55 6.91 7.26 13.85 20.6
Room control T (°C) #3 19.31 19.99 20.89 21.28 21.48 23.22 Room control RH (%) #3 47 47 49 51 56 55
Supply air T (°C) #4 23.91 19.3 21.59 19.3 18.89 17.29 Supply air RH (%) #4 39 49 45 48 56 54 Supply air m (kg/s) #4 0.37 0.84 0.68 1.12 1.95 1.31
After refurbishment

9 Copyright © 20xx by WEENTech

10 Copyright © 20xx by WEENTech