effects of plyometric training on maximal power output and jumping ability
TRANSCRIPT

1
HUMAN MOVEMENT
vol. 11, number 1, 2010
MOVEMENT
HUMAN
University School of Physical Edu ca tion in Wroclaw
University School of Physical Edu ca tion in Poznan
University School of Physical Edu ca tion in Krakow
l
’
’

Akademia Wychowania Fizycznego we Wrocławiu (University School of Physical Education in Wrocław)
Akademia Wychowania Fizycznego im. Eugeniusza Piaseckiego w Poznaniu (University School of Physical Education in Poznań)Akademia Wychowania Fizycznego im. Bronisława Czecha w Krakowie (University School of Physical Education in Kraków)
HUMAN MOVEMENT
formerly Człowiek i Ruch (Human Movement)vol. 11, number 1, 2010, pp. 1–108
Editor-in-Chief Alicja Rutkowska-Kucharska
University School of Physical Education, Wrocław, Poland
Associate Editor Wiesław Osiński
University School of Physical Education, Poznań, Poland Andrzej Klimek
University School of Physical Education, Kraków, Poland
Editorial Board
Tadeusz Bober University School of Physical Education, Wrocław, PolandJan Celichowski University School of Physical Education, Poznań, PolandLechosław B. Dworak University School of Physical Education, Poznań, PolandEwa Kałamacka University School of Physical Education, Kraków, PolandTadeusz Koszczyc University School of Physical Education, Wrocław, PolandStanisław Kowalik University School of Physical Education, Poznań, PolandJuliusz Migasiewicz University School of Physical Education, Wrocław, PolandEdward Mleczko University School of Physical Education, Kraków, PolandŁucja Pilaczyńska-Szcześniak University School of Physical Education, Poznań, PolandZbigniew Szyguła University School of Physical Education, Kraków, PolandAleksander Tyka University School of Physical Education, Kraków, PolandMarek Zatoń University School of Physical Education, Wrocław, Poland
Advisory Board
Wojtek J. Chodzko-Zajko University of Illinois, Urbana, Illinois, USACharles B. Corbin Arizona State University, East Mesa, Arizona, USAGudrun Doll-Tepper Free University, Berlin, GermanyJózef Drabik University School of Physical Education and Sport, Gdańsk, PolandKenneth Hardman University of Worcester, Worcester, United KingdomAndrew Hills Queensland University of Technology, Queensland, AustraliaZofi a Ignasiak University School of Physical Education, Wrocław, PolandSlobodan Jaric University of Delaware, Newark, Delaware, USAToivo Jurimae University of Tartu, Tartu, EstoniaHan C.G. Kemper Vrije University, Amsterdam, The NetherlandsWojciech Lipoński University School of Physical Education, Poznań, PolandGabriel Łasiński University School of Physical Education, Wrocław, PolandRobert M. Malina University of Texas, Austin, Texas, USAMelinda M. Manore Oregon State University, Corvallis, Oregon, USAPhilip E. Martin Iowa State University, Ames, Iowa, USAJoachim Mester German Sport University, Cologne, GermanyToshio Moritani Kyoto University, Kyoto, JapanAndrzej Pawłucki University School of Physical Education, Wrocław, PolandJohn S. Raglin Indiana University, Bloomington, Indiana, USARoland Renson Catholic University, Leuven, BelgiumTadeusz Rychlewski University School of Physical Education, Poznań, PolandJames F. Sallis San Diego State University, San Diego, California, USAJames S. Skinner Indiana University, Bloomington, Indiana, USAJerry R. Thomas University of North Texas, Denton, Texas, USAKarl Weber German Sport University, Cologne, GermanyPeter Weinberg Hamburg University, Hamburg, GermanyMarek Woźniewski University School of Physical Education, Wrocław, PolandGuang Yue Cleveland Clinic Foundation, Cleveland, Ohio, USAWladimir M. Zatsiorsky Pennsylvania State University, State College, Pennsylvania, USAJerzy Żołądź University School of Physical Education, Kraków, Poland
Translation: Tomasz Skirecki, Agnieszka Piasecka-CeccatoDesign: Agnieszka Nyklasz
Copy editor: Typoscript: Anna Noga-GrocholaProofreading: Halina Marciniak
Indexed in: SPORTDiscus, Index Copernicus, Altis, Sponet, Scopus
© Copyright 2010 by Wydawnictwo AWF we Wrocławiu
ISSN 1732-3991
http://www.awf.wroc.pl/hum_mov
Editorial Offi ceSecretary: Dominika Niedźwiedź
51-684 Wrocław, ul. Mickiewicza 98, Poland, tel. 71 347 30 [email protected]
Circulation: 200

HUMAN MOVEMENT
3
Editorial . . . . . . . . . . . . . . . . . . . . . . . . . . . . . . . . . . . . . . . . . . . . . . . . . . . . . . . . . . . . . . . . . . . . . . . . . . . . . . . . . . . . . . . . . . . . . . . 4
Beat Knechtle, Barbara Baumann, Patrizia Knechtle, Thomas Rosemann
What influences race performance in male open-water ultra-endurance swimmers: anthropometry or training? . . . . 5
Mateusz Rynkiewicz, Tadeusz Rynkiewicz
Bioelectrical impedance analysis of body composition and muscle mass distribution in advanced kayakers . . . . . . . . . . 11
Hubert Makaruk, Tomasz Sacewicz
Effects of plyometric training on maximal power output and jumping ability . . . . . . . . . . . . . . . . . . . . . . . . . . . . . . . . . . . 17
Marek Strzała, Piotr Krężałek
The body angle of attack in front crawl performance in young swimmers . . . . . . . . . . . . . . . . . . . . . . . . . . . . . . . . . . . . . . . 23
Natalia Morgulec-Adamowicz, Andrzej Kosmol, Magdalena Bogdan, Bartosz Molik, Izabela Rutkowska, Grzegorz Bednarczuk
Game efficiency of wheelchair rugby athletes at the 2008 Paralympic Games with regard to player classification . . . . 29
Paweł F. Nowak
Ultra distance running in view of health and amateur sport . . . . . . . . . . . . . . . . . . . . . . . . . . . . . . . . . . . . . . . . . . . . . . . . . . 37
Hans-Volkhart Ulmer
“Objective measurements” and “non-objective observations” as methods for assessment of athletic fitness and health . . . 42
Maria Fátima Glaner, William Alves Lima, Zbigniew Borysiuk
Body fat deposition and risk factors of cardiovascular diseases in men . . . . . . . . . . . . . . . . . . . . . . . . . . . . . . . . . . . . . . . . . 45
Andreia Pelegrini, Edio Luiz Petroski
The association between body dissatisfaction and nutritional status in adolescents . . . . . . . . . . . . . . . . . . . . . . . . . . . . . . . 51
Panagiotis V. Tsaklis
Presentation of acoustic waves propagation and their effects through human body tissues . . . . . . . . . . . . . . . . . . . . . . . . . 58
Daniel Puciato
Morpho-functional development of children and adolescents from Jedlina-Zdrój with regard to objective quality
of life of their families . . . . . . . . . . . . . . . . . . . . . . . . . . . . . . . . . . . . . . . . . . . . . . . . . . . . . . . . . . . . . . . . . . . . . . . . . . . . . . . . . . . 66
Joanna Malinowska
Health education in the teacher training perspective – the areas of changes . . . . . . . . . . . . . . . . . . . . . . . . . . . . . . . . . . . . . 71
Barbara Wolny
A physical education teacher as a part of school health education . . . . . . . . . . . . . . . . . . . . . . . . . . . . . . . . . . . . . . . . . . . . . . 81
Władysław Mynarski, Bożena Królikowska, Bogusława Graczykowska
Medieval re-enactment groups as a new form of recreation . . . . . . . . . . . . . . . . . . . . . . . . . . . . . . . . . . . . . . . . . . . . . . . . . . . 89
Michael J. Duncan, Victoria Staples
The impact of a school-based active video game play intervention on children’s physical activity during recess . . . . . . 95
Retraction notice . . . . . . . . . . . . . . . . . . . . . . . . . . . . . . . . . . . . . . . . . . . . . . . . . . . . . . . . . . . . . . . . . . . . . . . . . . . . . . . . . . . . . . . . 100
Conference reports
III Central European Congress on Osteoporosis and Osteoarthritis, Kraków, September 24–26, 2009 . . . . . . . . . . . . . . 101
Competition of research papers on Physical Education Teaching for Prof. Bogdan Czabański’s Award . . . . . . . . . . . . . . . . . . . 103
Regulamin publikowania prac – Instructions for Authors . . . . . . . . . . . . . . . . . . . . . . . . . . . . . . . . . . . . . . . . . . . . . . . . . . . . . . . . 104
Zasady prenumeraty czasopisma Human Movement – The rules of subscribing the Human Movement journal . . . . . . . . . . . . . 108
CONTENTS
2010, vol. 11 (1)

HUMAN MOVEMENT
4
EDITORIAL
The 10th Anniversary of Human Movement
Ten years ago the Senate of the University School of
Physical Education in Wrocław decided to launch
a scientific journal Człowiek i Ruch. According to its
first Editor-in-Chief, Dr hab. nauk med. Jan Łazowski,
its main objective was to “publish original papers meet-
ing the highest scientific standards, review papers,
meta-analyses and conceptual reports” in the area of
physical culture sciences. The first article published in
Człowiek i Ruch was a review paper entitled “Co ma
wspólnego kultura fizyczna z kulturą?” (“What does
physical culture have in common with culture?”) by
Professor Henryk Grabowski.
The subsequent Editor-in-Chief, Prof. dr hab. Artur
Jaskólski invited a great number of renowned scholars
and scientists from all over the world to join the expan-
ding journal’s Advisory Board. Many of them are still
working with us. Under Prof. Jaskólski’s editorship the
journal started to be published in English under the title
of Human Movement.
Between 2006 and 2008 the Human Movement Edi-
tor-in-Chief was Prof. dr hab. Ryszard Panfil. During
his tenure the journal entered an agreement with Versita
to publish online on a MetaPress platform.
At present Human Movement is published jointly by
the University School of Physical Education in Wrocław,
University School of Physical Education in Poznań and
University School of Physical Education in Kraków. In
recent years there has been a growing interest in our
journal from many contributors from Poland and abroad.
The journal has received 6 points in the Polish Ministry
of Science and Higher Education (MNiSzW) scoring for
edition in 2010. From 2011 on we intend to publish
Human Movement on a quarterly basis.
On behalf of the Editorial Board I would like to
express my sincere thanks to all those who have been
working with Human Movement from the very begin-
ning, members of the Editorial Board and Advisory
Board, translators, editors and – first and foremost – re-
viewers and contributors. I hope Human Movement will
maintain its position as a top-level journal of exchange
of ideas among physical culture scientists and scholars.
New member of the Advisory Board
It is our great pleasure to welcome Prof. dr hab. An-
drzej Pawłucki as a new member of the Human Move-
ment Advisory Board. His scholarly achievements,
extensive professional knowledge and relations with the
international scientific community constitute a great
endorsement to our journal and will surely increase its
scientific quality.
Retraction notice
We regret to inform that the article “The study of lung
flow limitations in aerobically trained children” by Moh-
sen Ghanbarzadeh, Abdolhamid Habibi, Masoud Nikba-
khat, Gholamhosain Ebadi, Hossein Poursoltani publi-
shed in the last volume of Human Movement, 2009, 10
(2), 96–108, is a case of plagiarism. The above-mentioned
authors gave their names to the article “Exercise flow-vo-
lume loops in prepubescent aerobically trained children”
by Cedric Nourry, Fabien Deruelle, Claudine Fabre, Geo-
rges Baquet, Frederic Bart, Jean-Marie Grosbois, Serge
Berthoin, and Patrick Mucci published in Journal of Ap-
plied Physiology, 2005, 99, 1912–1921. This is an unethi-
cal act in disregard of the principles of authorship as well
as a breach of copyright and the Berne Convention for the
Protection of Literary and Artistic Works.
Despite all our procedures (authors submitting ma-
nuscripts for publication in Human Movement should
include a written statement that the work has not been
published previously or submitted elsewhere for review)
we failed to disclose this reprehensible misdeed in the
editorial process. We apologize to the authors of the ori-
ginal article, publishers of Journal of Applied Physiology
and readers of both journals.
The article has been retracted at the request of the
authors and the American Physiological Society (APS)
which drew the matter to our attention.
2010, vol. 11 (1)

HUMAN MOVEMENT
5
Introduction
Different factors are known to have an influence on
endurance performance. Apart from several physiologi-
cal parameters, a variety of anthropometric variables
show a relationship with endurance performance. Body
height [1], body fat [2, 3], upper extremity length [4],
and skin-fold thickness [5] have been shown to be relat-
ed to performance in competitive swimmers.
Apart from anthropometry, training variables [5–11]
are also of importance. In competitive swimmers, An-
derson et al. [5] could demonstrate that a combination of
fitness and technique factors were important for com-
petitive performance. According to Costill et al. [7],
training intensity might be of greater importance than
training volume in swimmers. In contrast, Stewart and
Hopkins [8] found that better performance in swimmers
over 50 m to 400 m was significantly associated with
greater weekly training mileage. In a very recent study,
Faude et al. [9] demonstrated that high-training volumes
had no advantage in performance when compared to
high-intensity training of lower volume. However, too
intensive a training is counter productive. Raglin et al.
[10] found in a training study of swimmers that peak
training of 8.3 km per day led to a reduction in anaero-
bic swimming power.
Regarding open-water swimmers, Van Heest et al.
[11] reported that elite open-water swimmers were
smaller and lighter than competitive pool swimmers. It
is probable that swimmers with more body fat are able
to endure longer time periods in cold water [12] since
swimmers with less subcutaneous fat get out of the wa-
ter after significantly less time during a swim in water
of 9.4°C compared to 11.0°C [13]. However, in a study
of male pool-swimmers in a 12 hour swim, no correla-
tion of anthropometric variables such as body fat to race
performance was found [14].
The aim of the study was to investigate the relation-
ship of anthropometric and training variables with total
race time in male open-water ultra-endurance swim-
mers. The variables we included as potential anthropo-
metric predictors were body mass, percent body fat,
thickness of 7 skin folds, body height and length of arm
and leg, while training factors included average speed
in training and average weekly training volume. These
variables are considered to be related to performance in
DOI: 10.2478/v10038-009-0021-3
Beat Knechtle1, 2*, Barbara Baumann1, Patrizia Knechtle1, Thomas Rosemann2
1 Gesundheitszentrum St. Gallen, St. Gallen, Switzerland
2 Institute of General Practice and for Health Services Research, University of Zurich, Zurich, Switzerland
ABSTRACT
Purpose. We investigated the relationship between selected variables of anthropometry and training with race performance during
a 26.4 km open-water ultra-endurance swim at 23oC in male master ultra-swimmers. Basic procedures. Fifteen non-professional
male open-water ultra-endurance swimmers who were (mean ± SD) 40.0 (8.2) years of age with 83.7 (10.3) kg body mass, 1.80
(0.08) m body height and a BMI of 25.5 (2.5) kg/m2 finished the race within the time limit. Body mass, percent body fat, thickness of
7 skin folds, body height, length of arm, and length of leg were measured prior to race. The number of years as active swimmer,
average weekly training volume in hours and kilometres and average speed in training were recorded. The variables were then
correlated to total race time. Main findings. Study participants had mean finish times of 551 (100) min and an average speed of 3.0
(0.5) km/h. Speed in swimming during training was the only variable related to total race time (r = –0.66, p = 0.0037) whereas none
of the other investigated variables showed an association. Conclusions. We conclude that anthropometry was not related to race
performance in these male ultra-endurance swimmers whereas speed in training showed a moderate association with total race
time.
Keywords: ultra-endurance, skin-fold thickness, anthropometry, percent body fat
WHAT INFLUENCES RACE PERFORMANCE IN MALE OPEN-WATER ULTRA-ENDURANCE SWIMMERS: ANTHROPOMETRY OR TRAINING?
2010, vol. 11 (1), 5–10
* Corresponding author.

HUMAN MOVEMENT
6
B. Knechtle et al., Performance in ultra-swimmers
short-distance pool-swimmers. Since open-water swim-
mers, in contrast to pool-swimmers, have to swim in
rather cold water [12], we expected that body fat would
show an association with race performance. Our work-
ing hypothesis was that ultra-swimmers with a high
percentage of body fat would be faster than swimmers
with a low percentage.
Material and methods
Subjects
The organiser of the ‘Marathon Swim’ in Lake Zu-
rich 2008 contacted all participants upon inscription to
the race by a separate newsletter and informed them
about the planned investigation. A total of 26 male solo
swimmers started in the race. Fifteen male swimmers
participated in our study. The study was approved by
the Institutional Review Board of St. Gallen, Switzer-
land, for use of human subjects and the athletes gave
their informed written consent. The anthropometric
data and training variables of the athletes are presented
in Tab. 1. All the swimmers were trained and experi-
enced open-water swimmers. Three of the swimmers
had already swum across the English Channel between
Dover (England) and Calais (France).
The race
The 21st edition of the ‘Marathon Swim’ in Lake Zu-
rich, Switzerland, took place on 3 August 2008. Ultra-
swimmers from all over the world started in this race,
the longest open-water ultra-swimming contest in Eu-
rope. The idea of this race with its first edition in 1977
was the opportunity for open-water swimmers to pre-
pare for the Channel swim. Several swimmers prepar-
ing to cross the Channel from Dover to Calais were us-
ing this competition as practice. The swimmers started
in the morning at 07:00 a.m. in Rapperswil and had to
swim to Zurich; covering a total distance of 26.4 km
within a time limit of 14 h (840 min). Athletes were fol-
lowed by a personal support boat with a crew providing
nutrition and fluids. The weather was moderate during
the whole day, for details see Tab. 2.
Measurements and calculations
Before the start of the race, body mass, length of ex-
tremities, body height and skin-fold thicknesses at 7 sites
were measured. Body mass was determined using a com-
mercial scale (Beurer BF 15, Beurer GmbH, Ulm, Ger-
many) to the nearest 0.1 kg. Body height was measured
using a stadiometer to the nearest 1 cm. Percentage of
Table 1. The association of anthropometric and training variables for the 15 swimmers with race time
Variable r p
Body mass (kg) 83.7 (10.3) –0.07 n.s.
Body height (m) 1.80 (0.08) –0.29 n.s.
BMI (kg/m2) 25.5 (2.5) 0.40 n.s.
Length of arm (cm) 81.1 (3.0) 0.34 n.s.
Length of leg (cm) 86.2 (4.7) –0.42 n.s.
Percent body fat (%) 17.9 (4.8) 0.28 n.s.
Sum of 7 skin folds (mm) 90.0 (36.4) –0.30 n.s.
Number of years as active swimmer 17.6 (16.1) 0.33 n.s.
Average number of kilometres swum per week 15.8 (6.9) 0.01 n.s.
Average number of hours swum per week 6.7 (3.8) 0.27 n.s.
Average speed in training (km/h) 3.4 (0.5) –0.66 0.0037
p-value is shown after Bonferroni correction
Table 2. General weather conditions during the race
Start at 07:00 12:00 Finish at 19:00
Air temperature (°C) 20.4 24.5 28.1
Water temperature (°C) 23.1 23.3 24.1
Relative humidity (%) 73 55 42
Wind (m/s) 3.1 5.5 4.7
Direction of the wind (°) 178 281 292
Data were generously provided by the Sea Police Zurich

HUMAN MOVEMENT
7
B. Knechtle et al., Performance in ultra-swimmers
Figure 1. Speed in training was significantly associated with
total race time (r = –0.66, p = 0.0037) for the 15 swimmers.
Three athletes finished the race within the same minute,
and 2 of them had an identical speed in training,
we therefore see only 14 dots
Speed in swimming during training (km/h)
2.5
800
700
600
500
400
300
200
100
Ra
ce tim
e (
min
)
body fat was calculated using the following anthropomet-
ric formula: Percent body fat = 0.465 + 0.180(Σ7SF) –
0.0002406(Σ7SF)2 + 0.0661(age), where Σ7SF = sum of
skin-fold thickness of chest, midaxillary, triceps, sub-
scapular, abdomen, suprailiac and thigh mean, according
to Ball et al. [15]. This formula was evaluated using 160
men aged 18–62 years and cross-validated using DXA
(dual energy X-ray absorptiometry). The mean differ-
ences between DXA percent body fat and calculated per-
cent body fat ranged from 3.0% to 3.2%. Significant
(p < 0.01) and high (r > 0.90) correlations existed between
the anthropometric prediction equations and DXA. Skin-
fold data were obtained using a skin-fold calliper (GPM-
Hautfaltenmessgerät, Siber & Hegner, Zurich, Switzer-
land) and recorded to the nearest 0.2 mm. One trained
investigator took all measurements since inter-tester vari-
ability is a major source of error in skin-fold measure-
ments. An intra-tester reliability check was conducted
prior to this testing on 27 male runners. No significant
difference between the 2 trials, measuring the sum of
7 skin folds, was observed (p > 0.05). The intra-class cor-
relation was high at r = 0.99. The same investigator was
also compared to another trained investigator to deter-
mine objectivity. No significant difference existed be-
tween testers (p > 0.05). The skin-fold measurements
were taken once for the entire 7 skin folds and then re-
peated 2 times by the same investigator; the mean of the
3 times was then used for the analyses. The timing of
taking the skin-fold measurements was standardised to
ensure reliability. According to Becque et al. [16], read-
ings were performed 4 s after applying the calliper. The
length of the right arm was measured from acromion to
the tip of the third finger; the length of the right leg from
trochanter major to malleolus lateralis. In addition to the
determination of the anthropometric variables, athletes
were asked about their average weekly training volume
in hours, plus the kilometres swum, in preparation for the
race. Each athlete maintained a comprehensive training
diary consisting of daily workouts showing distance and
duration. The training diary started upon inscription to
the race. The average value in volume (kilometres and
hours) and intensity (km/h) were calculated. The number
of years as active and competitive swimmer was also ob-
tained. Three participants were competitive triathletes.
Statistical analysis
Results are presented as mean (SD). The coefficient
of variation (CV% = 100 × SD/mean) of total race time
was calculated. The Pearson correlation analysis was
applied to the variables body mass, body height, BMI,
length of arm, length of leg, percent body fat, sum of
7 skin folds, years as active swimmer, average number
of kilometres and hours swum per week and average
speed in training. The Spearman correlation analysis was
applied when the data were non-normally distributed.
Bonferroni corrections were applied and a statistical sig-
nificance was reported with p < 0.0045 (11 variables).
Results
The 26 athletes of the field finished the 26.4 km in
a mean time of 551.5 (91.3) min. The fastest swimmer
arrived after 377 min, setting a new course record in the
master category. The slowest competitor finished after
710 min. All 15 study participants finished the race on
average in 550.9 (99.5) min (CV% = 18) swimming at
an average speed of 3.0 (0.5) km/h. None of the anthro-
pometric variables investigated were associated with
race performance (Tab. 1), whereas speed in swimming
during training was significantly related to total race
time (r = –0.66, p = 0.0037) (Fig. 1).
3 3.5 4 4.5 5
Discussion
In contrast to the literature regarding short distance
swimmers, we found no association between perform-
ance and known anthropometric factors in swimmers

HUMAN MOVEMENT
8
B. Knechtle et al., Performance in ultra-swimmers
such as fat mass [3], upper extremity length [4] and
body height [4, 6] in this group of male open-water ul-
tra-endurance swimmers.
Training intensity
In contrast to our presumption that body fat would
be related to performance, we found that average speed
in training was significantly associated with total race
time (Fig. 1). It seems that athletes with a high training
pace performed better in this ultra-endurance swim.
In the literature, neither high volume nor high intensi-
ty seem to be related to swimming performance in pool
swimmers. Costill et al. [7] found in a training study of
male swimmers that a high training volume did not en-
hance swim performance. In contrast, after a taper peri-
od, performance was improved. In another training study
of competitive swimmers, a 4-week training period of
both high volume and low intensity, or low volume and
high intensity led to an improvement in performance [9].
Probably the incorporation of resistance training into a
training programme enhances swim performance. Girold
et al. [17] found in a training study of swimmers that pro-
grammes either combining swimming with dry-land
strength training or with in-water resistance- and assist-
ed-sprint exercise led to a similar gain in sprint perform-
ance, which was better than traditional training methods.
Training volume
Because of the low training volume we assumed that
our subjects cannot be considered as successful athletes,
but when observing the fact that they all finished the
race within the time limit we cannot deduce that these
athletes are not serious swimmers.
The swimmers in this sample trained, on average,
a total distance of 15.8 km per week. This is very little,
and suggests that these swimmers were not serious ath-
letes, particularly for an aerobically demanding, high-en-
durance sport such as marathon-swimming. This point is
also reflected in the average number of 6.7 hours of train-
ing per week. In comparison, the average elite competi-
tive swimmer easily trains 3 to 4 times this distance each
week. For comparison, athletes in the study of Van Heest
et al. [11] swam on average just over 12 km per day dur-
ing a 1 week training camp. This daily distance is almost
equivalent to the average total distance swum by the par-
ticipants in this study in an entire week. Swimming 26.4
km without a break at an average speed of 3 km per hour
requires trained athletes. Since the average age of those
swimmers is 40 years, and competitive swimmers are
about 20 years younger [18, 19], we might assume that
those swimmers had a long story of competitive swim-
ming. This is reflected by the fact that these athletes had
been training for 17.6 (16.1) years varying between 2 to
46 years. In addition, at least 2 athletes were former com-
petitive swimmers at the national level in their country
and at least 3 athletes were elite long-distance triathletes
investing more time in cycling and running training than
swimming. Presumably an older or senior competitive
swimmer is able to maintain a high speed during training
at low volumes for years and is therefore able to compete
fast in ultra-endurance swimming.
Body height and length of extremities
We found no association between any of the anthro-
pometric variables investigated and total race time. In
contrast to our findings, in studies of pool swimmers,
body mass, length of extremities and body height
showed a relationship with swim performance.
Geladas et al. [4] could demonstrate in boys and
girls aged 12 to 14 years that upper extremity length
was, in addition to horizontal jump and grip strength,
a significant predictor variable of 100 m freestyle per-
formance in boys. In girls, body height, upper extremity
and hand length were significantly related to 100 m
freestyle times. Jagomagi and Jurimae [6] found in 125
female breaststroke swimmers that body height was the
most important anthropometrical parameter, explaining
11.1% of the 100 m breaststroke results. The association
of body weight with swim performance is probably re-
lated to gender. Sekulić et al. [20] could demonstrate
that body height was related to performance in male
swimmers over 50 m freestyle. Probably the length of
the swim distance was the reason that we could not de-
tect a correlation with total race time. We also found no
relationship of body height to race performance, as Jag-
omagi and Jurimae [6] did.
Body mass and body fat
Sekulić et al. [20] showed that body mass was related
to swim performance in female swimmers over 400 m
freestyle and Siders et al. [2] found in female swimmers
that body mass was correlated to swimming perform-
ance. Our athletes with a race distance of 26.4 km had
to swim a considerably longer distance compared to

HUMAN MOVEMENT
9
B. Knechtle et al., Performance in ultra-swimmers
pool swimmers. We expected that high body fat would
be beneficial for race performance in an open-water
swim; however, fat mass showed no association with
total race time. Swimmers crossing the English Chan-
nel face temperatures of about 15°C [12]. For ultra-
swimmers in open-water competitions, such as the
Channel, fat is a better insulator than human muscle
[21]. Keatinge et al. [13] could show that swimmers with
less thick subcutaneous fat made significantly shorter
swims than those with thicker fat layers in water of
9.4°C to 11°C. The water temperature in Lake Zurich
was constant at 23°C, so that the water temperature ob-
viously was not a problem for those swimmers. They all
finished successfully within the time limit.
In the Channel between Dover and Calais of over
32.2 km, swimmers commonly need about 12 hours,
but some up to 20 hours [12] depending upon the cir-
cumstances. The finding that high fat mass seems to be
advantageous for swimming performance is probably
again dependent on the gender. However, also in female
swimmers, a high fat mass may impair swim perform-
ance. Tuuri et al. [3] showed in female swimmers that
greater fat mass is strongly related to lower levels of ex-
ercise. Siders et al. [2] could demonstrate that percent
body fat was correlated to swimming performance over
100 yards in females.
Gender
Probably gender was the reason that we could not
find a relationship between anthropometric variables
and race performance. According to Siders et al. [2], the
anthropometric variables: body height, body mass, per-
cent body fat and fat-free mass have an effect on swim-
ming performance in female swimmers, but not in
males. Over a 100-yard swim of each swimmer’s major
competitive stroke, these 4 parameters showed an effect
on performance. Interestingly, these 4 variables only
showed an effect on performance in the female compet-
itive swimmers, and not in the men. In contrast to these
results, Geladas et al. [4] found that upper extremity
length, hand length, and body height were significantly
related to 100 m freestyle time, but the degree of asso-
ciation was markedly lower in girls than in boys.
Conclusions
This investigation suggests that anthropometric vari-
ables such as body fat, body height and length of ex-
tremities show no relationship to race time in male ul-
tra-endurance swimmers in an open-water ultra-swim-
ming contest as has been shown in pool-swimmers over
shorter distances. In this group of ultra-swimmers,
speed in training appears to have a modest association
with race performance in a 26.4 km open-water ultra-
swim. Further investigation is warranted in a larger
sample of athletes to clarify why speed in training is
important for performance in open-water ultra-endur-
ance swimmers and not body fat. Especially the inten-
sity of training should be determined using parameters
such as heart rate or blood lactate. Furthermore, differ-
ences between genders should be investigated.
Acknowledgements
We thank the crew of ‘Sri Chinmoy Marathon Team Switzer-
land’ for their generous support and the athletes for their
promptitude in enabling the collection of data before the
race. For their help in translation, we thank Matthias Knech-
tle, Lausanne, Switzerland and Mary Miller from Stockton-
on-Tees, Cleveland in England, member of an ultra-endur-
ance support crew.
References
1. Zampagni M.L., Casino D., Benelli P., Visani A., Marcacci M.,
De Vito G., Anthropometric and strength variables to predict
freestyle performance times in elite master swimmers. J
Strength Cond Res, 2008, 22 (4), 1298–1307. DOI: 10.1519/
JSC.0b013e31816a597b.
2. Siders W.A., Lukaski H.C., Bolonchuk W.W., Relationships
among swimming performance, body composition and somato-
type in competitive collegiate swimmers. J Sports Med Phys
Fitness, 1993, 33 (2), 166–171.
3. Tuuri G., Loftin M., Oescher J., Association of swim distance
and age with body composition in adult female swimmers. Med
Sci Sports Exerc, 2002, 34 (12), 2110–2114.
4. Geladas N.D., Nassis G.P., Pavlicevic S., Somatic and physical
traits affecting sprint swimming performance in young swim-
mers. Int J Sports Med, 2005, 26 (2), 139–144. DOI: 10.1055/s-
2004-817862.
5. Anderson M., Hopkins W., Roberts A., Pyne D., Ability of test
measures to predict competitive performance in elite swim-
mers. J Sports Sci, 2008, 26 (2), 123–130. DOI: 10.1080/
02640410701348669.
6. Jagomagi G., Jurimae T., The influence of anthropometrical
and flexibility parameters on the results of breaststroke swim-
ming. Anthropol Anz, 2005, 63 (2), 213–219.
7. Costill D.L., Thomas R., Robergs R.A., Pascoe D., Lambert C.,
Barr S. et al., Adaptations to swimming training: influence of
training volume. Med Sci Sports Exerc, 1991, 23 (3), 371–377.
8. Stewart A.M., Hopkins W.G., Seasonal training and perform-
ance of competitive swimmers. J Sports Sci, 2000, 18 (11),
873–884. DOI: 10.1080/026404100750017805.
9. Faude O., Meyer T., Scharhag J., Weins F., Urhausen A., Kin-
dermann W., Volume vs. intensity in the training of competitive
swimmers. Int J Sports Med, 2008, 29 (11), 906–912. DOI:
10.1055/s-2008-1038377.

HUMAN MOVEMENT
10
B. Knechtle et al., Performance in ultra-swimmers
10. Raglin J.S., Koceja D.M., Stager J.M., Harms C.A., Mood, neu-
romuscular function, and performance during training in fe-
male swimmers. Med Sci Sports Exerc, 1996, 28 (3), 372–377.
11. VanHeest J.L., Mahoney C.E., Herr L., Characteristics of elite
open-water swimmers. J Strength Cond Res, 2004, 18 (2),
302–305.
12. Pugh L.G.C., Edholm O.G., The physiology of channel swim-
mers. Lancet, 1955, 266 (6893), 761–768. DOI: 10.1016/S0140-
6736(55)92454-5.
13. Keatinge W.R., Khartchenko M., Lando N., Lioutov V., Hypo-
thermia during sports swimming in water below 11 degrees
C. Br J Sports Med, 2001, 35 (5), 352–353. DOI:10.1136/
bjsm.35.5.352.
14. Knechtle B., Knechtle P., Kohler G., No correlation of anthro-
pometry and race performance in ultra-endurance swimmers at
a 12-hours swim. Anthropol Anz, 2008, 66 (1), 73–79.
15. Ball S.D., Altena T.S., Swan P.D., Comparison of anthropome-
try to DXA: a new prediction equation for men. Eur J Clin Nutr,
2004, 58 (11), 1525–1531. DOI: 10.1038/sj.ejcn.1602003.
16. Becque M.D., Katch V.L., Moffatt R.J., Time course of skin-
plus-fat compression in males and females. Hum Biol, 1986, 58
(1), 33–42.
17. Girold S., Maurin D., Dugué B., Chatard J.C., Millet G., Effects
of dry-land vs. resisted- and assisted-sprint exercises on swim-
ming sprint performances. J Strength Cond Res, 2007, 21 (2),
599–605.
18. Trewin C.B., Hopkins W.G., Pyne D.B., Relationship between
world-ranking and Olympic performance of swimmers.
J Sports Sci, 2004, 22 (4), 339–345. DOI: 10.1080/026404103
10001641610.
19. Wallace L.K., Slattery K.M., Coutts A.J., The ecological valid-
ity and application of the session-RPE method for quantifying
training loads in swimming. J Strength Cond Res, 2009, 23 (1),
33–38. DOI: 10.1519/JSC.0b013e3181874512.
20. Sekulić D., Zenić N., Zubcević N.G., Non linear anthropomet-
ric predictors in swimming. Coll Antropol, 2007, 31 (3),
803–809.
21. Hatfield H.S., Pugh L.G.C., Thermal conductivity of human fat
and muscle. Nature, 1951, 168 (4282), 918–919. DOI: 10.1038/
168918a0.
Paper received by the Editors: April 23, 2009.
Paper accepted for publication: September 3, 2009.
Address for correspondence
PD Dr. med. Beat Knechtle
Facharzt FMH für Allgemeinmedizin
Gesundheitszentrum
Vadianstrasse 26
9001 St. Gallen, Switzerland
e-mail: [email protected]

HUMAN MOVEMENT
11
Introduction
The body build of athletes is one of the key subjects
of physical education and sport sciences. On the basis of
the body build profile of athletes the most desirable
body parameters for a particular sport can be deter-
mined that would ensure attainment of the highest
sports results.
Numerous studies [1–7] have isolated the most signif-
icant morphological traits characteristic of kayakers.
These traits include large body mass, strong muscles and
solid skeleton. The upper body build in kayakers is com-
monly recognized as one of the most important parame-
ters affecting their sports results [2, 7, 8]. They should
also be taller than average. Both male and female kayak
paddlers have a low percentage of adipose tissue: 13% ±
2.5 and 22.2% ± 4.6, respectively [9]. Similar observa-
tions were made by Van Someren and Palmer [10] in
their study of U.S. Olympic kayakers and Akca and Mu-
niroglu [11] in their study of the Turkish Olympic team.
A similar body build profile was noted in boy and girl
kayak paddlers at all training and competition stages [7].
Body build parameters indicative of training effec-
tiveness and athlete selection in kayaking include body
composition and muscle mass distribution. There have
been a number studies examining somatotypes and
basic anthropometric profiles in elite kayakers [2, 7,
10–13]. However, no results of muscle mass measure-
ment using bioelectrical impedance analysis (BIA) or
segmental analysis have been published so far. Neither
data on changes in body components or assessment of
regional body composition are available.
The present study was aimed to assess the basic
body components of kayakers with the use of BIA and
profiles of regional muscle mass distribution. In par-
ticular, the study focused on the assessment of the age-
related range and direction of changes in somatic build
and muscle mass distribution in kayak paddlers.
It was assumed that changes in kayakers’ body build
are indicative of the athletes’ proper adaptation to kay-
aking-specific training loads. The following research
hypotheses were formulated:
1. Kayakers feature large muscle mass and lower adi-
posity in comparison with athletes representing other
sports.
2. Kayakers’ muscle mass and its percentage in the to-
tal body mass increase with age.
3. The most considerable gain in muscle mass can be
observed in kayakers’ trunk muscles.
Material and methods
The study sample consisted of 26 young competitive
kayakers from the Wałcz Sports School and AZS–AWF
DOI: 10.2478/v10038-010-0008-0
Mateusz Rynkiewicz*, Tadeusz Rynkiewicz
Branch Faculty of Physical Culture in Gorzów Wielkopolski, Gorzów Wielkopolski, Poland
ABSTRACT
Purpose. The study aims at assessment of body composition and muscle mass distribution in advanced kayakers. Kayak paddlers
should be characterized by large body mass with a significant percentage of muscle mass, especially in the trunk region. Basic procedures. The sample consisted of 26 kayakers. The body composition and muscle mass distribution were determined based on
bioelectrical impedance analysis. Main findings. The subjects had large muscle mass and average fat mass. The percentage of body
fat mass in the kayakers was observed to increase with age, whereas the muscle mass percentage decreased, with the exception of
the limbs. Conclusions. BIA of body composition and distribution of muscle mass should be a standard diagnostic method to collect
data on proper adaptation of kayakers to their training programs.
Key words: body composition, anthropometry, muscle mass, kayak, bioelectric impedance
BIOELECTRICAL IMPEDANCE ANALYSIS OF BODY COMPOSITION AND MUSCLE MASS DISTRIBUTION IN ADVANCED KAYAKERS
2010, vol. 11 (1), 11–16
* Corresponding author.
HUMAN MOVEMENT
12
M. Rynkiewicz, T. Rynkiewicz, BIA of body composition and muscle mass distribution in kayakers
Sports Club in Gorzów Wielkopolski, Poland. With re-
gard to their sports level the subjects represented four
kayaking sports classes (sports class II, sports class I,
championship sports class, international championships
sports class) (Tab. 1). For the purpose of the study all the
subjects were divided into two age groups: seniors and
juniors. The mean age for senior kayakers was 20.3 ± 1.41,
and for junior kayakers 16.5 ± 1.01 (Tab. 2). The senior
kayakers in the sample included six members of the Jun-
ior Polish National Team and one member of the Senior
Polish National Team. In the group of juniors one kay-
aker was a member of the Junior Polish National Team.
The study was approved by the Bioethical Commit-
tee of the Karol Marcinkowski University of Medical
Sciences in Poznań, Poland.
The subjects’ body weight and body height were
measured using standard anthropometric procedures
and instruments.
The kayakers’ body composition was assessed using
bioelectrical impedance analysis with the BIA 101 ana-
lyzer (Akern, Italy) [14]. BIA is a highly accurate as-
sessment method which uses the measurements of reac-
tance and resistance of the human tissue [14, 15]. The
resistance was measured by a non-susceptible current
(800 µA, 50 Hz).
The obtained reactance and resistance values as well
as data on subjects’ age, sex, body height and body
weight were entered into the analyzer software for body
composition analysis. The following body components
were determined: FFM – fat-free mass (kg), FFMpct –
fat-free mass percentage (%), FM – fat mass (kg), FMpct
– fat mass percentage (%), MM – muscle mass (kg),
MMpct – muscle mass percentage (%).
The human body reactance and resistance were also
measured using the segmental analysis, which allowed
calculation of muscle mass distribution in different re-
gions of the body (in kg and %): RB – right side of the
body, LB – left side of the body, LwB – lower body,
UpB – upper body, RA – right arm, LA – left arm, RL
– right leg, LL – left leg, TR – trunk.
Statistical analysis
The Statistica 8.0 software package (StatSoft, Inc.
1984–2008) was used for statistical analysis. Arithmetic
means, medians and standard deviations were calculated.
The level of statistical significance was set at p < 0.05.
The distribution of variables was first checked with the
Shapiro-Wilk test and the Lilliefors test. If any of these
tests yielded a statistically significant result in one of
the groups of subjects, the Mann–Whitney U test was
applied to check for statistical significance of differ-
ences of a particular variable. Otherwise Student’s t-test
was used provided the equality of group variances was
present which was checked with the Brown–Forsythe
test. If the latter’s result was statistically significant the
significance of differences was measured with the Co-
chran and Cox test.
Results
Body composition analysis
Table 3 presents the results of measurement of the
kayakers’ body weight and body height as well as of
their particular body components.
The subjects’ body height amounted to 182.1 ± 5.31
cm for the juniors and 184.8 ± 6.7 cm for the seniors.
These results are similar to those of Olympic sprint kayak
paddlers from Sydney in 2000 [7]. The body weight in
Table 1. Sports levels of kayakers corresponding to the assigned sports classes: juniors (n = 17) and seniors (n = 9)
Kayaking sports class Juniors Seniors Total
Sports class II 2 0 2
Sports class I 10 3 13
Championship sports class 5 5 10
International championship sports class 0 1 1
Table 2. Basic somatic parameters of junior (n = 17) and senior (n = 9) kayakers
Juniors Seniors
n M Med Min Max SD n M Med Min Max SD
Age (years) 17 16.5 17.0 15.0 18.0 1.01 9 20.3 20.0 19.0 22.0 1.41
Body height (cm) 17 182.1 181.0 175.0 195.0 5.31 9 184.8 186.0 174.0 194.0 6.70
Body weight (kg) 17 79.0 78.0 70.0 90.0 5.85 9 84.6 86.0 71.0 97.0 8.41

HUMAN MOVEMENT
13
M. Rynkiewicz, T. Rynkiewicz, BIA of body composition and muscle mass distribution in kayakers
the senior kayakers was similar to the values attained by
Ackland et al. [7] and amounted to 84.6 ± 8.41 kg. The
junior kayakers had lower body weight than their senior
counterparts (79 ± 5.85 kg), and the Student’s t-test re-
sults pointed to a statistically significant difference. The
Student’s t-test results of the muscle mass (MM) assess-
ment (45.6 ± 3.21 kg for juniors; 50.1 ± 5.41 kg for sen-
iors) revealed a statistically significant difference with
the subjects’ age. Also a significant increase in fat mass
(FM) was noted in the younger kayakers (12.35 ± 2.81 kg
for juniors; and 15.6 ± 3.81 kg for seniors). In terms of
percentage of particular body components, FMpct
amounted to 15.6 ± 3% for juniors, and 18.4 ± 4% for
seniors. These values are higher than the ones noted by
Ackland et al. [7]; however, the body fat percentage in
that study was assessed with skinfold tests. The BIA al-
lows a more accurate measurement of total body fat
than the skinfold methods [15], thus the results in the
present study are higher than in Ackland et al. [7]. The
U test revealed a significant difference in the percent-
age of body fat between the two groups of subjects.
Also larger fat-free mass (FFMpct) was noted in the
junior kayakers (84.4 ± 3% as opposed to 81.6 ± 4% in
the seniors). The difference was statistically significant.
The differences in the percentage of muscle mass
(MMpct) were statistically non-significant, and the
mean MMpct values were 57.8 ± 3.2% for the juniors
and 59.3 ± 3.46% for the seniors, respectively.
Table 3. Mean values of body build components of junior (n = 17) and senior (n = 9) kayakers
Juniors Seniors
M Med Min Max SD M Med Min Max SD
Body height (cm) 182.12 181 175 195 5.31 184.8 186.0 174.0 194.0 6.70
Body weight (kg)* 79.00 78 70 90 5.85 84.6 86.0 71.0 97.0 8.41
FFM (kg) 66.65 65.2 59.6 74.3 4.59 68.9 71.9 58.6 78.3 7.13
FM (kg)* 12.35 12.2 7.7 16.8 2.81 15.6 16.6 9.2 18.9 3.81
FMpct (%)* 15.6 16.3 10.5 19.8 3.0 18.4 20.1 11.1 22.3 4.00
FFMpct (%)* 84.4 83.7 80.2 89.5 3.0 81.6 79.9 77.7 88.9 4.00
MM (kg)* 45.61 45.1 36.8 51.5 3.21 50.1 50.1 42.2 57.1 5.41
MMpct (%) 57.8 57.2 52.5 64.5 3.2 59.3 58.8 54.5 64.8 3.46
FFM – fat-free mass, FM – fat mass, FMpct – fat mass percentage, FFMpct – fat-free mass percentage, MM – muscle mass (kg),
MMpct – muscle mass percentage, *statistically significant difference at p < 0.05
Table 4. Mean values of muscle mass distribution in junior (n = 17) and senior (n = 9) kayakers
Juniors Seniors
M Med Min Max SD M Med Min Max SD
RB (kg)* 20.6 21.4 15.7 23.6 2.4 23.3 23.5 21.3 26.4 1.6
LB (kg)* 20.4 20.8 14.7 24.4 2.2 23.3 23.1 20.4 26.7 2.2
LwB (kg) 19.6 19.9 14.2 24.6 2.5 22.3 22.8 19.8 24.7 1.7
UpB (kg) 21.4 22.2 16.2 25.6 2.6 24.3 24.1 21.6 28.4 2.6
RA (kg)* 1.3 1.2 0.2 3.2 0.9 2.8 3.0 1.9 3.7 0.8
LA (kg)* 1.3 1.2 0.4 2.8 0.7 2.2 2.6 1.1 3.1 0.8
RL (kg)* 4.0 3.9 1.7 6.8 1.3 5.4 5.3 3.8 7.3 1.4
LL (kg)* 3.2 2.9 1.1 7.5 1.8 6.3 5.9 4.2 8.7 1.5
TR (kg) 31.2 32.1 26.6 35.9 2.9 29.9 29.7 26.8 35.5 2.6
RB (%) 50.2 50.2 47.8 52.7 1.3 50.1 50.0 48.3 52.1 1.4
LB (%) 49.8 49.8 47.3 52.2 1.3 49.9 50.0 47.9 51.7 1.4
LwB (%) 47.6 47.8 42.9 53.1 3.1 47.9 47.4 43.5 51.3 2.6
UpB (%) 52.2 52.3 46.9 57.1 3.1 52.1 52.6 48.7 56.5 2.6
RA (%)* 3.0 2.7 0.6 7.2 2.0 5.9 6.3 4.5 7.5 1.3
LA (%)* 3.1 2.8 1.3 5.9 1.5 4.7 4.9 2.7 6.3 1.5
RL (%)* 9.4 9.7 5.2 14.5 2.4 11.5 10.8 9.0 14.9 2.3
LL (%)* 7.5 7.1 3.0 16.1 3.7 13.4 12.5 10.0 17.6 2.6
TR (%)* 76.9 78.2 56.8 88.2 9.2 64.5 66.8 54.5 73.7 7.0
RB – right side of the body, LB – left side of the body, LwB – lower body, UpB – upper body, RA – right arm, LA – left arm,
RL – right leg, LL – left leg, TR – trunk, *statistically significant difference at p < 0.05
HUMAN MOVEMENT
14
M. Rynkiewicz, T. Rynkiewicz, BIA of body composition and muscle mass distribution in kayakers
Table 4 presents the results of muscle mass distribu-
tion analysis in the kayakers. A statistically significant
difference was found for the right side of the body (RB)
and the left side of the body (LB): 20.6 ± 2.4 kg and
20.4 ± 2.2 kg for juniors, and 23.3 ± 1.6 kg and 23.3 ± 2.2
kg, respectively, which was related to the proportional
increase in muscle mass on both sides of the body. An
increase in the lower body muscle mass (LwB) was also
noted (19.6 ± 2.5 kg in juniors, and 22.3 ± 1.7 kg in se-
niors, respectively) as well as a significant muscle mass
increase in the limbs. In the case of arms the muscle
mass value amounted to 1.3 ± 0.9 kg (RA) and 1.3 ± 0.7
kg (LA) in junior kayakers, and 2.8 ± 0.8 kg (RA) and
2.2 ± 0.8 kg (LA) in senior kayakers. A lower trunk
muscle mass (TR) was also noted in the seniors as op-
posed to the juniors, but the difference was statistically
non-significant.
The analysis of muscle mass distribution revealed
a slight, non-significant difference between the two groups
of kayakers in the percentage of the lower body muscle
mass (LwB) (47.6 ± 3.1% in juniors, 47.9 ± 2.6% in seniors)
and upper body muscle mass (UpB) (52.2 ± 3.1% in jun-
iors, 52.1 ± 2.6% in seniors).
A significant difference in the percentage of mus-
cle mass of the arms was found: 3.0 ± 2.0% (RA) and
3.1 ± 1.5% (LA) for juniors, and 5.9 ± 1.3% (RA) and
4.7 ± 1.5% (LA) for seniors. Statistical differences were
also found in the percentage of muscle mass of the kay-
akers’ legs. The juniors had a significantly lower per-
centage of muscle mass in the legs than their senior
counterparts: 9.4 ± 2.4% (RL) and 7.5 ± 3.7% (LL) in
juniors; and 11.5 ± 2.3% (RL) and 13.4 ± 2.6% (LL)
in seniors. The analysis of the percentage of trunk
muscle mass (TR) revealed a higher value of this pa-
rameter in the juniors (76.9 ± 9.2%) than in the sen-
iors (64.5 ± 7.0%).
Discussion
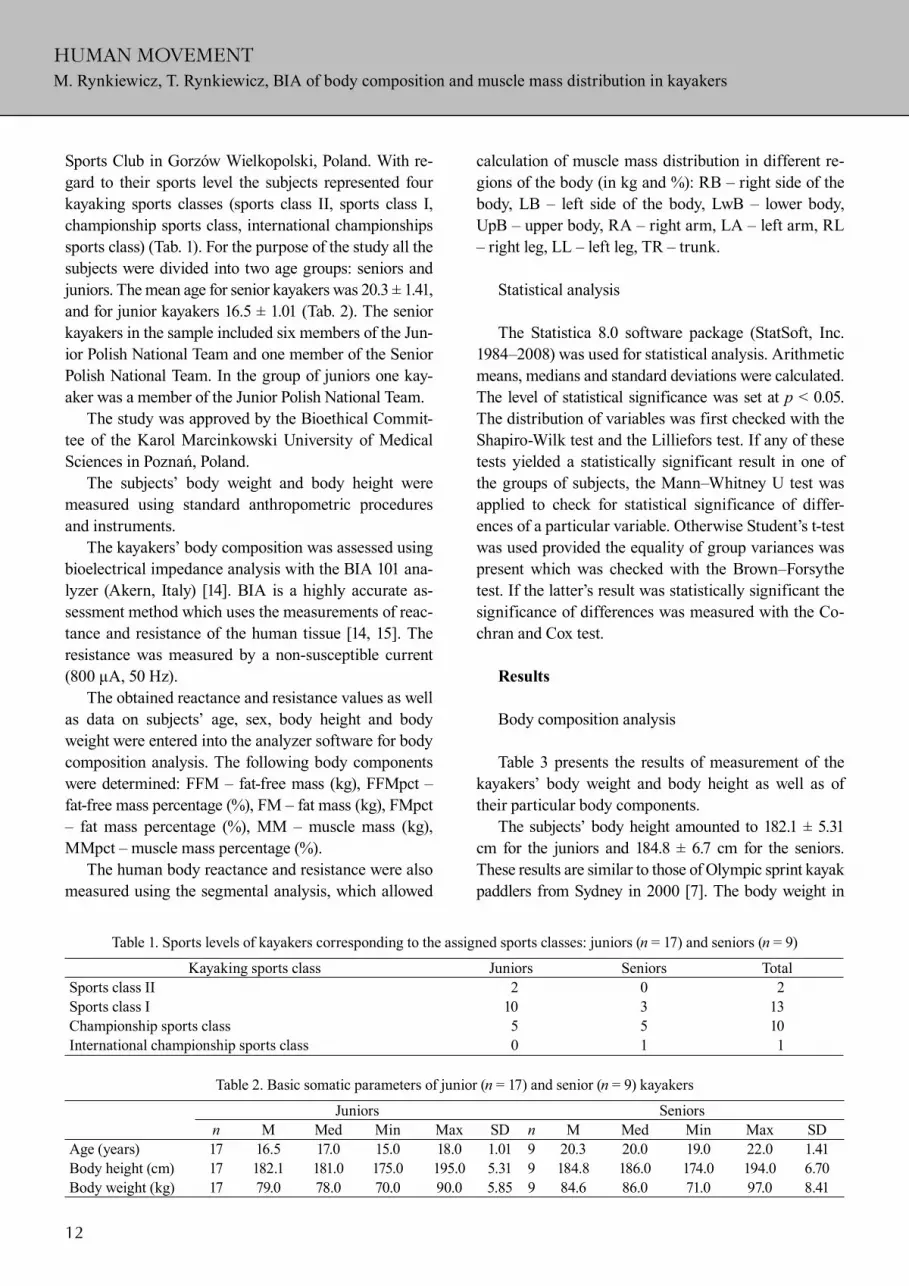
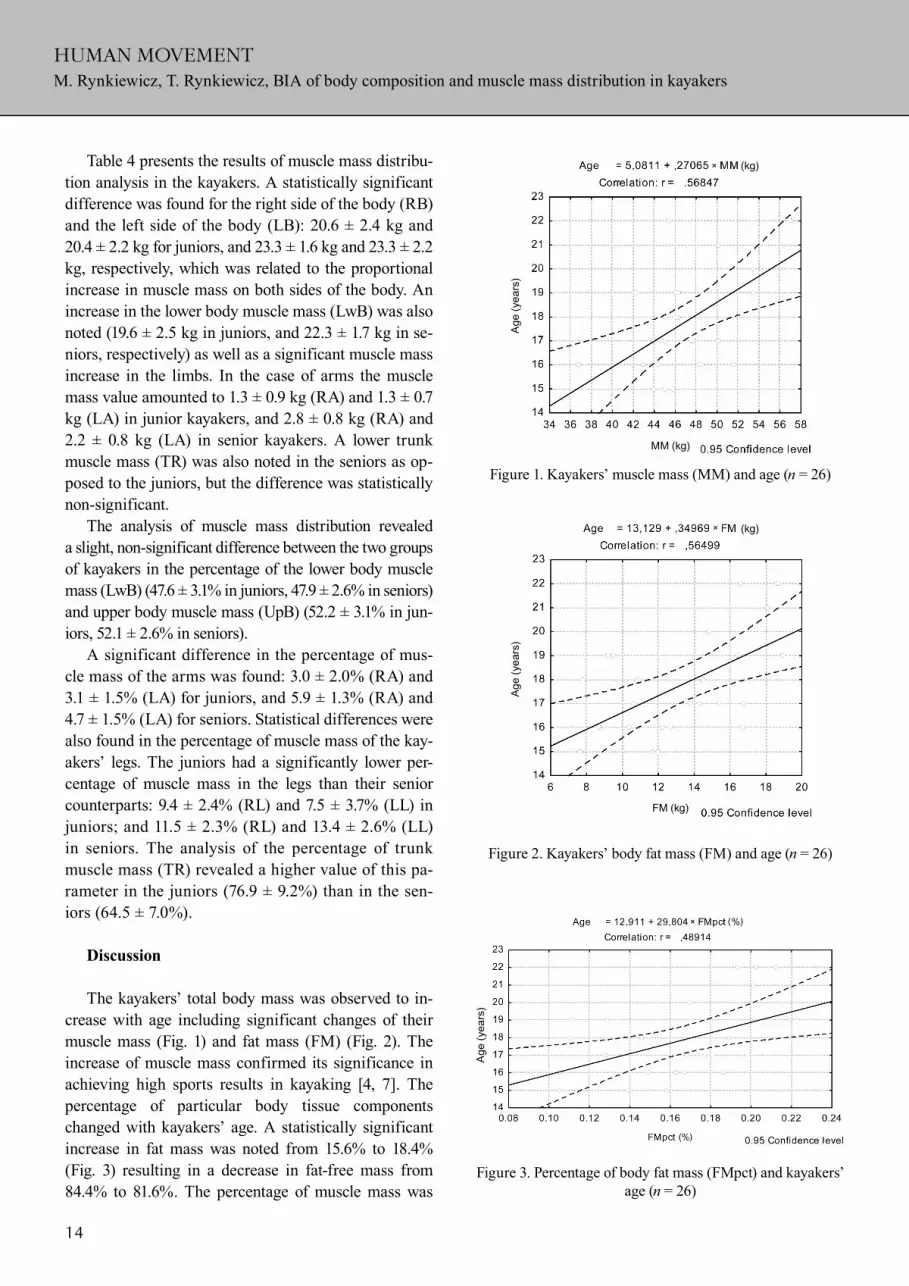
The kayakers’ total body mass was observed to in-
crease with age including significant changes of their
muscle mass (Fig. 1) and fat mass (FM) (Fig. 2). The
increase of muscle mass confirmed its significance in
achieving high sports results in kayaking [4, 7]. The
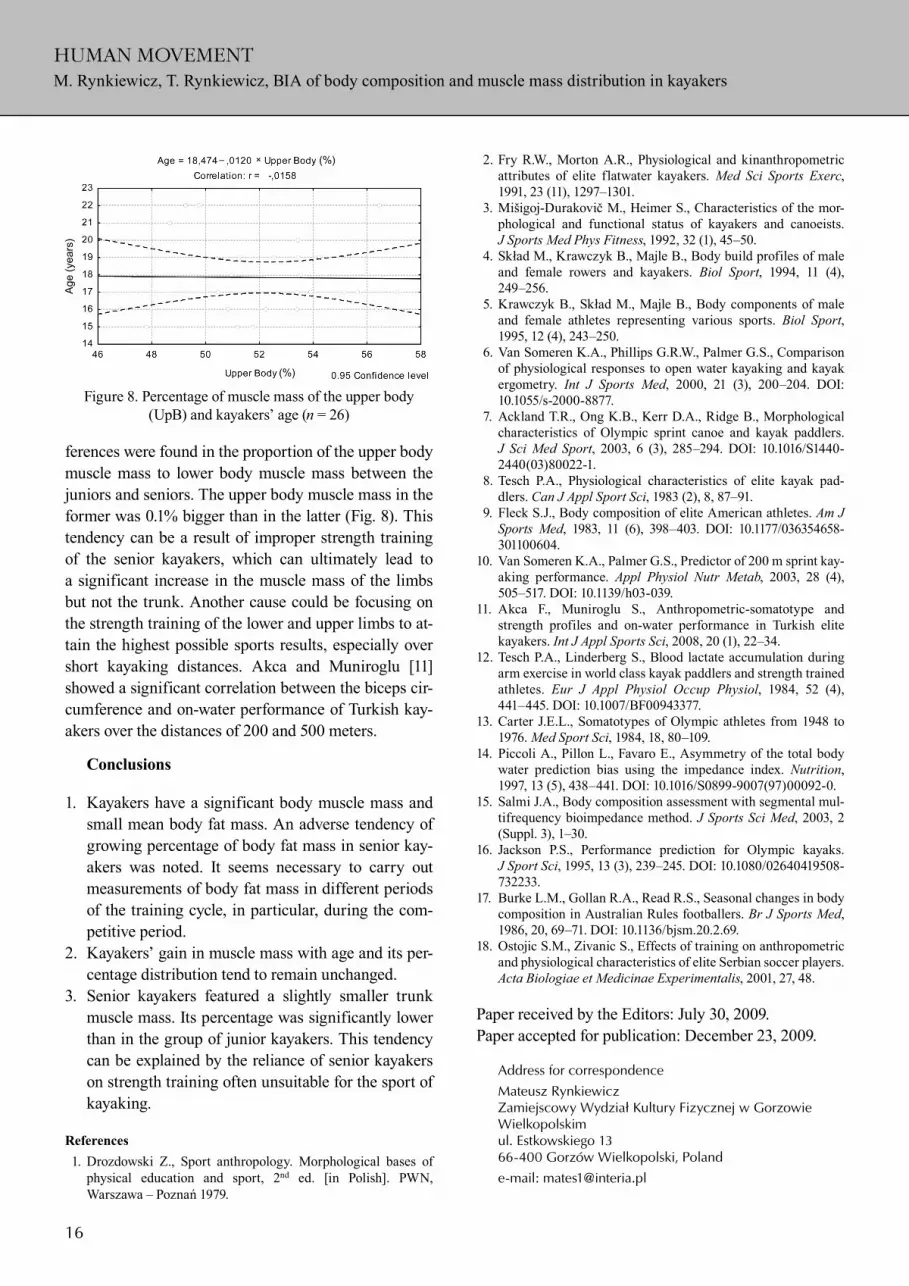
percentage of particular body tissue components
changed with kayakers’ age. A statistically significant
increase in fat mass was noted from 15.6% to 18.4%
(Fig. 3) resulting in a decrease in fat-free mass from
84.4% to 81.6%. The percentage of muscle mass was
Figure 1. Kayakers’ muscle mass (MM) and age (n = 26)
Figure 2. Kayakers’ body fat mass (FM) and age (n = 26)
Figure 3. Percentage of body fat mass (FMpct) and kayakers’
age (n = 26)
×
×
× ( )
( )
(kg)
MM (kg)
FM (kg)
(kg)
Ag
e (
yea
rs)
Ag
e (
yea
rs)
Ag
e (
yea
rs)

HUMAN MOVEMENT
15
M. Rynkiewicz, T. Rynkiewicz, BIA of body composition and muscle mass distribution in kayakers
not changed significantly. The noted significant in-
crease in the kayakers’ fat mass influencing the total
body mass has an adverse effect on paddling speed [16].
The rapid increase in muscle mass (kg) caused by exces-
sive amount of strength training and improper diet can
also trigger larger accumulation of fat, which is highly
undesirable in kayaking training. One should remember
that the subjects were during the pre-season training
stage during the measurements. Burke et al. [17] in their
study of Australian Rules footballers revealed fat accu-
mulation during the post-season and a significant in-
crease in body fat in the pre-season period. On the other
hand, Ostojic and Zivanic [18] observed a significant
drop in fat mass only in the competitive period. Further
studies into kayakers’ body composition during different
periods of their annual training cycle would definitely
contribute to a more complete analysis of the changing
percentage of particular body components.
The gain in muscle mass in the senior kayak pad-
dlers was observed in their arms and legs (Fig. 4, 5). No
statistically significant differences in the trunk muscle
mass were found (Fig. 6). The juniors featured slightly
higher results of measurement of this parameter than
the seniors. According to Tesch [8], Fry and Morton [2],
and Ackland et al. [7] the trunk muscle mass is one of
the significant factors affecting sports results. Top level
athletes are characterized by higher than average mus-
cle mass of the trunk. The proportions in the study sam-
ple were not correct since the percentage of trunk mus-
cle mass out of the total body mass in the senior kayakers
was lower for over 13% (Fig. 7). Also insignificant dif-
Figure 4. Percentage of muscle mass in the right arm (RA)
and left arm (LA) and kayakers’ age (n = 26)
Figure 5. Percentage of muscle mass in the right leg (RL)
and left leg (LL) and kayakers’ age (n = 26)
Figure 6. Trunk muscle mass (TR) and kayakers’ age (n = 26)
Figure 7. Percentage of muscle mass in the trunk (TR) and
kayakers’ age (n = 26)
×
(%)
(%)
× (%)
× (kg)
(%)
(kg)
× (%)
(%)
Ag
e (
yea
rs)
Ag
e (
yea
rs)
Ag
e (
yea
rs)
Ag
e (
yea
rs)
–
–
HUMAN MOVEMENT
16
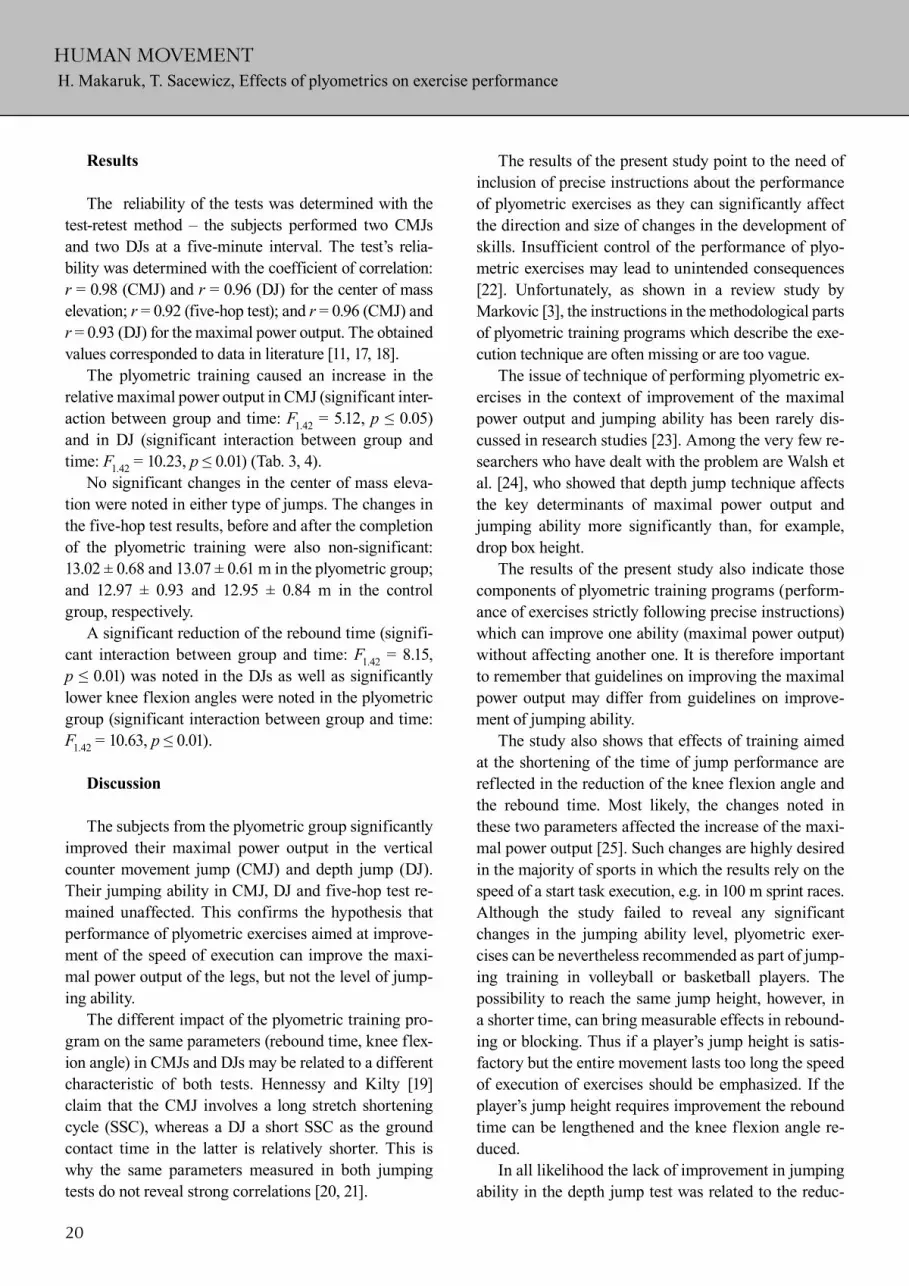
M. Rynkiewicz, T. Rynkiewicz, BIA of body composition and muscle mass distribution in kayakers
ferences were found in the proportion of the upper body
muscle mass to lower body muscle mass between the
juniors and seniors. The upper body muscle mass in the
former was 0.1% bigger than in the latter (Fig. 8). This
tendency can be a result of improper strength training
of the senior kayakers, which can ultimately lead to
a significant increase in the muscle mass of the limbs
but not the trunk. Another cause could be focusing on
the strength training of the lower and upper limbs to at-
tain the highest possible sports results, especially over
short kayaking distances. Akca and Muniroglu [11]
showed a significant correlation between the biceps cir-
cumference and on-water performance of Turkish kay-
akers over the distances of 200 and 500 meters.
Conclusions
1. Kayakers have a significant body muscle mass and
small mean body fat mass. An adverse tendency of
growing percentage of body fat mass in senior kay-
akers was noted. It seems necessary to carry out
measurements of body fat mass in different periods
of the training cycle, in particular, during the com-
petitive period.
2. Kayakers’ gain in muscle mass with age and its per-
centage distribution tend to remain unchanged.
3. Senior kayakers featured a slightly smaller trunk
muscle mass. Its percentage was significantly lower
than in the group of junior kayakers. This tendency
can be explained by the reliance of senior kayakers
on strength training often unsuitable for the sport of
kayaking.
References
1. Drozdowski Z., Sport anthropology. Morphological bases of
physical education and sport, 2nd ed. [in Polish]. PWN,
Warszawa – Poznań 1979.
2. Fry R.W., Morton A.R., Physiological and kinanthropometric
attributes of elite flatwater kayakers. Med Sci Sports Exerc,
1991, 23 (11), 1297–1301.
3. Mišigoj-Durakovič M., Heimer S., Characteristics of the mor-
phological and functional status of kayakers and canoeists.
J Sports Med Phys Fitness, 1992, 32 (1), 45–50.
4. Skład M., Krawczyk B., Majle B., Body build profiles of male
and female rowers and kayakers. Biol Sport, 1994, 11 (4),
249–256.
5. Krawczyk B., Skład M., Majle B., Body components of male
and female athletes representing various sports. Biol Sport,
1995, 12 (4), 243–250.
6. Van Someren K.A., Phillips G.R.W., Palmer G.S., Comparison
of physiological responses to open water kayaking and kayak
ergometry. Int J Sports Med, 2000, 21 (3), 200–204. DOI:
10.1055/s-2000-8877.
7. Ackland T.R., Ong K.B., Kerr D.A., Ridge B., Morphological
characteristics of Olympic sprint canoe and kayak paddlers.
J Sci Med Sport, 2003, 6 (3), 285–294. DOI: 10.1016/S1440-
2440(03)80022-1.
8. Tesch P.A., Physiological characteristics of elite kayak pad-
dlers. Can J Appl Sport Sci, 1983 (2), 8, 87–91.
9. Fleck S.J., Body composition of elite American athletes. Am J
Sports Med, 1983, 11 (6), 398–403. DOI: 10.1177/036354658-
301100604.
10. Van Someren K.A., Palmer G.S., Predictor of 200 m sprint kay-
aking performance. Appl Physiol Nutr Metab, 2003, 28 (4),
505–517. DOI: 10.1139/h03-039.
11. Akca F., Muniroglu S., Anthropometric-somatotype and
strength profiles and on-water performance in Turkish elite
kayakers. Int J Appl Sports Sci, 2008, 20 (1), 22–34.
12. Tesch P.A., Linderberg S., Blood lactate accumulation during
arm exercise in world class kayak paddlers and strength trained
athletes. Eur J Appl Physiol Occup Physiol, 1984, 52 (4),
441–445. DOI: 10.1007/BF00943377.
13. Carter J.E.L., Somatotypes of Olympic athletes from 1948 to
1976. Med Sport Sci, 1984, 18, 80–109.
14. Piccoli A., Pillon L., Favaro E., Asymmetry of the total body
water prediction bias using the impedance index. Nutrition,
1997, 13 (5), 438–441. DOI: 10.1016/S0899-9007(97)00092-0.
15. Salmi J.A., Body composition assessment with segmental mul-
tifrequency bioimpedance method. J Sports Sci Med, 2003, 2
(Suppl. 3), 1–30.
16. Jackson P.S., Performance prediction for Olympic kayaks.
J Sport Sci, 1995, 13 (3), 239–245. DOI: 10.1080/02640419508-
732233.
17. Burke L.M., Gollan R.A., Read R.S., Seasonal changes in body
composition in Australian Rules footballers. Br J Sports Med,
1986, 20, 69–71. DOI: 10.1136/bjsm.20.2.69.
18. Ostojic S.M., Zivanic S., Effects of training on anthropometric
and physiological characteristics of elite Serbian soccer players.
Acta Biologiae et Medicinae Experimentalis, 2001, 27, 48.
Paper received by the Editors: July 30, 2009.
Paper accepted for publication: December 23, 2009.
Address for correspondence
Mateusz Rynkiewicz
Zamiejscowy Wydział Kultury Fizycznej w Gorzowie
Wielkopolskim
ul. Estkowskiego 13
66-400 Gorzów Wielkopolski, Poland
e-mail: [email protected]
Figure 8. Percentage of muscle mass of the upper body
(UpB) and kayakers’ age (n = 26)
× (%)
(%)
Ag
e (
yea
rs)
–

HUMAN MOVEMENT
17
Introduction
Plyometric exercises are used primarily to increase
the maximal power output [1, 2] and jumping ability [3].
They are characterized by a specific muscle action se-
quence: a rapid muscle lengthening movement, i.e. ec-
centric phase, is followed by an immediate explosive
muscle contraction, which has greater strength and
power than a contraction without the eccentric phase
[4]. The greater force produced by the muscle during
plyometric training is related to the storage of elastic
energy during muscle stretch (eccentric contraction)
and its rapid release during the shortening movement
(concentric contraction). It also engages the myotatic
reflex and tendon reflex. This process is often referred
to as the stretch-shortening cycle (SSC) [5].
Different authors point to the possibility of simulta-
neous development of maximal muscle power output
and jumping ability through plyometric training [6, 7].
On the other hand, some authors prove these two abili-
ties cannot be shaped identically [8, 9]. To increase the
maximal power output the movement should be per-
formed rapidly, while in regular jumping training the
movement performance does not have to be that fast, i.e.
exercise performance time is an individual parameter.
In some studies subjects achieved the maximum jump
height with the widest range of counter movement, and
their performance time was often longer than that when
they generated the maximal power output [10]. Thus it
can be assumed that the performance of exercise can
significantly determine the plyometric training effects.
Plyometric training programs account for training loads
(drop box height), number of rebounds, and length of
intervals between sets of exercises, but they often lack
precise instructions about the way the exercises should
be performed, i.e. speed and range of movement, posi-
tion of individual body parts during push-off, etc. The
precise performance instructions are crucial in plyo-
metric training since incorrect performance of such ex-
ercises may not only fail to bring the expected results
but also lead to injuries.
The aim of the study was to assess the effects of
plyometric exercises performed with the minimum
ground contact time on the maximal power output of
the legs and jumping ability. The following research
hypothesis was formulated: plyometric training with
DOI: 10.2478/v10038-010-0007-1
Hubert Makaruk*, Tomasz Sacewicz
Branch Faculty of Physical Education in Biała Podlaska, Józef Piłsudski University of Physical Education, Warsaw, Poland
ABSTRACT
Purpose. The study aims to determine the effect of plyometric exercises performed with minimum ground contact time on the
maximal power output of the legs and jumping ability. Basic procedures. This study sample comprised 44 non-training students of
physical education. Following randomization, the experimental group performed plyometric exercises for six weeks, whereas the
control group participated only in lectures. The subjects performed counter movement jumps (CMJ), depth jumps (DJ) and a five-hop
test. Main findings. After the completion of plyometric training, an increase in the relative maximal power output (p � 0.001) in CMJ
and DJ was observed, whereas the center of mass elevation and the five-hop test distance length did not change significantly
(p > 0.05). Additionally, the rebound time in DJ was significantly shorter and the range of counter movement in the knee decreased
(p ��0.01). Conclusions. Depending on the aim of programme, plyometric training should determine the ways of performing exercises.
Methodological guidelines in plyometric training aimed at increasing the maximal power output may be different from indications
concerning jumping ability.
Key words: jumps, depth jumps, biomechanics, training, legs, measurements
EFFECTS OF PLYOMETRIC TRAINING ON MAXIMAL POWER OUTPUT AND JUMPING ABILITY
2010, vol. 11 (1), 17–22
* Corresponding author.

HUMAN MOVEMENT
18
H. Makaruk, T. Sacewicz, Effects of plyometrics on exercise performance
minimum ground contact time improves the maximal
power output but does not affect jumping ability.
Material and methods
The subjects were 44 non-training second-year full
time university students of physical education. The sam-
ple was randomly divided into two groups; plyometric
(experimental) and control (Tab. 1). The subjects were
informed about the research aims and procedure and
a pilot study was carried out. The study was approved by
the Research Ethics Committee of the Józef Piłsudski
University of Physical Education in Warsaw.
Plyometric training program
The experimental group performed plyometric exer-
cises on Mondays and Thursdays for six weeks. Each
plyometric training session commenced with a 5-min run
of low intensity, followed by five minutes of stretching
exercises (Tab. 2). During each session the subjects were
instructed to perform jumps as quickly as possible with
the minimum ground contact time. After each rebound
the legs were to be straightened in the hip, knee and an-
kle joints. The feet during jumps were set slightly out-
wards and the jumps were performed on a synthetic sur-
face. During the exercises no subject complained of
muscle or joint pains. The control group did not take part
in the exercise program but, like the plyometric group, in
regular classes of gymnastics, swimming and football.
Measurements
Vertical jumps
The measurement station consisted of a force plat-
form (Kistler, Switzerland) with the sampling frequency
of 1000 Hz, amplifier, analog-to-digital converter and
the BioWare 3.24 software package. Two types of verti-
cal jumps were measured: counter movement jump
(CMJ) and depth jump (DJ) with the drop box height of
0.31 m [11]. The subjects were to achieve the maximum
height in CMJs and in DJs after a rebound. The arms
swung first backwards and then high upwards. The knee
flexion angle was not specified. Each subject performed
three CMJ and DJ attempts. The best results out of three
(the highest results of center of mass displacement) were
analyzed. Before each set of exercises the subjects were
shown a presentation of correct performance of the
jumps. The following parameters were calculated:
• Pz – maximal power output (concentric phase)
[12]
where: Fz – vertical force, v
z – velocity;
Table 1. Parameters of study groups before the commence-
ment of plyometric training
Parameter Plyometric group
(n = 22)
Control group
(n = 22)
Age (years) 20.3 ± 0.5 20.6 ± 0.5
Body height (m) 1.81 ± 0.06 1.80 ± 0.06
Body mass (kg)* 73.2 ± 6.9 73.9 ± 6.7
* body mass did not change significantly after plyometric
training (p > 0.05)
Table 2. Plyometric training program
WeekPlyometric training program
number of sets × number of rebounds
1–2
Standing vertical hops 2 × 10
Single foot hops 4 × 8
Multiple two-foot hurdle jumps (hurdle height 0.55 m) 6 × 6
Counter movement jumps 3 × 5
Depth jumps (drop box height 0.20 m) 3 × 6
3–4
Lateral two-foot jumps 2 × 10
Two-foot jumps 4 × 8
Counter movement jumps 3 × 5
Multiple two-foot hurdle jumps (hurdle height 0.65 m) 6 × 6
Depth jumps (drop box height 0.30 m) 3 × 6
5–6
Two-foot jumps forward and backward: 2 × 10
Single foot jumps 2 × 8 on each foot
Counter movement jumps 3 × 5
Multiple two-foot hurdle jumps (hurdle height 0.76 m) 6 × 6
Depth jumps (drop box height 0.40 m) 3 × 6

HUMAN MOVEMENT
19
H. Makaruk, T. Sacewicz, Effects of plyometrics on exercise performance
• to – rebound time:
calculated for CMJs and DJs as the time between the
moment of the lowest position of the body center of
mass and the zero ground reaction force;
• Hmax
– maximal jump height:
where: g – gravitational acceleration (9.81 m/s2),
vo – rebound velocity.
The momentary velocity (v) of the center of mass
was calculated by way of integration of momentary ac-
celeration (a), i.e. force (F) exerted on the platform mi-
nus body weight (BW) divided by body mass (BM) [13,
14]. The knee flexion angle was determined by video
motion analysis. Three markers were placed on the right-
-hand side of the subject’s body at the greater trochanter,
lateral condyle of the tibia, and lateral malleolus of the
fibula [15]. The knee flexion angle was calculated as
the difference between the angle at the moment of con-
tact of the foot with the ground (αmax
) and the lowest
flexion value (αmin
) [16]. The jumps were recorded with
a digital vision camera (Basler piA640-210gc, Ger-
many) with the sampling frequency of 100 Hz. The
two-dimensional video motion analysis was carried out
using the System APAS XP software package (USA).
The footage was flat calibrated.
Five-hop test
The five-hop test was carried out at a track and field
jumping facility. Before the test the subject stood on
a take off line on the runway 10–11 meters before the
sandpit. The aim of the test was to jump the maximum
distance possible. Each subject performed five consecu-
tive jumps: a two-foot push off, four consecutive single
alternate leg jumps and two-foot landing in the sandpit.
The best result (longest distance) out of three attempts
was taken into consideration. The jump length was
measured with a tape measure from the take off line to
the nearest mark made in the sand by the jumper.
Each test was preceded with a warm up. The meas-
urements were taken twice: three days before the plyo-
metric training program and three days after its comple-
tion.
The parameters were expressed as means and stand-
ard deviations (± SD). The normal distribution was as-
sessed with the Shapiro-Wilk test. The statistical sig-
nificance of differences was determined with a two-way
analysis of variance (ANOVA): 2 (plyometric group,
control group) × 2 (test: before and after). At p < 0.05
Tukey’s test was used. The correlations between the
measured parameters as well as the reliability of the
tests were estimated with the Pearson correlation coef-
ficient. All statistical calculations were made with the
use of the Statistica v. 5.1 PL software package.
Table 4. Mean values (± SD) of maximal power output, center of mass elevation, rebound time and knee flexion angle in DJ
Parameter Plyometric group Control group
Before After Before After
Maximal power output (W/kg) 52.2 ± 11.6 59.0 ± 10.6** 53.0 ± 9.6 53.8 ± 9.4
Center of mass elevation (m) 0.40 ± 0.07 0.42 ± 0.06 0.40 ± 0.07 0.41 ± 0.08
Rebound time (ms) 283 ± 31 228 ± 25* 292 ± 34 281 ± 33
Knee flexion angle (degrees) 92 ± 8 86 ± 7* 91 ± 8 90 ± 7
* p ≤ 0.01, ** p ≤ 0.001 for differences between measurements before and after the plyometric training program
Table 3. Mean values (± SD) of maximal power output, center of mass elevation, rebound time and knee flexion angle in CMJ
ParameterPlyometric group Control group
Before After Before After
Maximal power output (W/kg) 37.2 ± 7.3 43.8 ± 7.7* 37.8 ± 9.8 39.2 ± 5.7
Center of mass elevation (m) 0.41 ± 0.08 0.42 ± 0.07 0.41 ± 0.07 0.39 ± 0.06
Rebound time (ms) 314 ± 32 307 ± 28 319 ± 39 315 ± 37
Knee flexion angle (degrees) 96 ± 8 95 ± 8 95 ± 8 96 ± 7
*p ≤ 0.001 for differences between measurements before and after the plyometric training program
HUMAN MOVEMENT
20
H. Makaruk, T. Sacewicz, Effects of plyometrics on exercise performance
Results
The reliability of the tests was determined with the
test-retest method – the subjects performed two CMJs
and two DJs at a five-minute interval. The test’s relia-
bility was determined with the coefficient of correlation:
r = 0.98 (CMJ) and r = 0.96 (DJ) for the center of mass
elevation; r = 0.92 (five-hop test); and r = 0.96 (CMJ) and
r = 0.93 (DJ) for the maximal power output. The obtained
values corresponded to data in literature [11, 17, 18].
The plyometric training caused an increase in the
relative maximal power output in CMJ (significant inter-
action between group and time: F1.42
= 5.12, p ≤ 0.05)
and in DJ (significant interaction between group and
time: F1.42
= 10.23, p ≤ 0.01) (Tab. 3, 4).
No significant changes in the center of mass eleva-
tion were noted in either type of jumps. The changes in
the five-hop test results, before and after the completion
of the plyometric training were also non-significant:
13.02 ± 0.68 and 13.07 ± 0.61 m in the plyometric group;
and 12.97 ± 0.93 and 12.95 ± 0.84 m in the control
group, respectively.
A significant reduction of the rebound time (signifi-
cant interaction between group and time: F1.42
= 8.15,
p ≤ 0.01) was noted in the DJs as well as significantly
lower knee flexion angles were noted in the plyometric
group (significant interaction between group and time:
F1.42
= 10.63, p ≤ 0.01).
Discussion
The subjects from the plyometric group significantly
improved their maximal power output in the vertical
counter movement jump (CMJ) and depth jump (DJ).
Their jumping ability in CMJ, DJ and five-hop test re-
mained unaffected. This confirms the hypothesis that
performance of plyometric exercises aimed at improve-
ment of the speed of execution can improve the maxi-
mal power output of the legs, but not the level of jump-
ing ability.
The different impact of the plyometric training pro-
gram on the same parameters (rebound time, knee flex-
ion angle) in CMJs and DJs may be related to a different
characteristic of both tests. Hennessy and Kilty [19]
claim that the CMJ involves a long stretch shortening
cycle (SSC), whereas a DJ a short SSC as the ground
contact time in the latter is relatively shorter. This is
why the same parameters measured in both jumping
tests do not reveal strong correlations [20, 21].
The results of the present study point to the need of
inclusion of precise instructions about the performance
of plyometric exercises as they can significantly affect
the direction and size of changes in the development of
skills. Insufficient control of the performance of plyo-
metric exercises may lead to unintended consequences
[22]. Unfortunately, as shown in a review study by
Markovic [3], the instructions in the methodological parts
of plyometric training programs which describe the exe-
cution technique are often missing or are too vague.
The issue of technique of performing plyometric ex-
ercises in the context of improvement of the maximal
power output and jumping ability has been rarely dis-
cussed in research studies [23]. Among the very few re-
searchers who have dealt with the problem are Walsh et
al. [24], who showed that depth jump technique affects
the key determinants of maximal power output and
jumping ability more significantly than, for example,
drop box height.
The results of the present study also indicate those
components of plyometric training programs (perform-
ance of exercises strictly following precise instructions)
which can improve one ability (maximal power output)
without affecting another one. It is therefore important
to remember that guidelines on improving the maximal
power output may differ from guidelines on improve-
ment of jumping ability.
The study also shows that effects of training aimed
at the shortening of the time of jump performance are
reflected in the reduction of the knee flexion angle and
the rebound time. Most likely, the changes noted in
these two parameters affected the increase of the maxi-
mal power output [25]. Such changes are highly desired
in the majority of sports in which the results rely on the
speed of a start task execution, e.g. in 100 m sprint races.
Although the study failed to reveal any significant
changes in the jumping ability level, plyometric exer-
cises can be nevertheless recommended as part of jump-
ing training in volleyball or basketball players. The
possibility to reach the same jump height, however, in
a shorter time, can bring measurable effects in rebound-
ing or blocking. Thus if a player’s jump height is satis-
factory but the entire movement lasts too long the speed
of execution of exercises should be emphasized. If the
player’s jump height requires improvement the rebound
time can be lengthened and the knee flexion angle re-
duced.
In all likelihood the lack of improvement in jumping
ability in the depth jump test was related to the reduc-

HUMAN MOVEMENT
21
H. Makaruk, T. Sacewicz, Effects of plyometrics on exercise performance
tion of time of force release (smaller knee flexion angle,
shorter rebound time) and thus a lower force impulse,
which determines jumping ability to a large extent [10].
According to Trzaskoma et al. [26] a significant im-
provement of jumping ability without strength training
is rather difficult to achieve. Trzaskoma and Trzaskoma
[27] revealed that when strength in the legs was not
changed significantly, a significant increase in the
maximal power output was noted with a decrease in the
level of jumping ability. The effect of plyometric train-
ing on strength has not been precisely determined as
yet. Some authors observed an increase in strength after
plyometric training [28, 29], and some found no changes
[30, 31].
The present study shows that performing jumps
with the fastest possible rebound and the shortest
ground contact time improves the maximal power out-
put with no effects on jumping ability. The question
remains whether it is possible to improve jumping
ability without improving the maximal power output.
The results of the present study confirm this indirectly
[31]. However, the precise instructions of training
aimed at the improvement of jumping ability are diffi-
cult to formulate since – as stated before – the highest
jumps were achieved with fairly diverse kinematic pa-
rameters [10].
Conclusions
The results obtained show that each plyometric
training program should include precise instructions of
performance of exercises. Methodological guidelines in
plyometric training concerning the improvement of the
maximal power output can differ from the guidelines
aimed at the improvement of jumping ability.
Acknowledgements
The study was part of the BW. III/26 research project carried
out in the Józef Piłsudski University of Physical Education in
Warsaw financed by the Polish Ministry of Science and
Higher Education.
References
1. Luebbers P.E., Potteiger J.A., Hulver M.W., Thyfault J.P., Carp-
er M.J., Lockwood R.H., Effect of plyometric training and re-
covery on vertical jump performance and anaerobic power.
J Strength Cond Res, 2003, 17(4), 704–709.
2. Potteiger J.A., Lockwood R.H., Haub M.D., Dolezal B.A., Al-
muzaini K.S., Schroeder J.M. et al., Muscle power and fiber
characteristics following 8 weeks of plyometric training.
J Strength Cond Res, 1999, 13 (4), 275–279.
3. Markovic G., Does plyometric training improve vertical jump
height? A meta-analytical review. Br J Sports Med, 2007, 41
(6), 349–355. DOI :10.1136/bjsm.2007.035113.
4. Malisoux L., Francaux M., Nielens H., Theisen D., Stretch-
shortening cycle exercises: an effective training paradigm to
enhance power output of human single muscle fibers. J Appl
Physiol, 2006, 100 (3), 771–779. DOI: 10.1152/japplphysiol.
01027.2005.
5. Komi P.V., Stretch-shortening cycle: a powerful model to study
normal and fatigued muscle. J Biomech, 2000, 33 (10), 1197–1206.
DOI: 10.1016/S0021-9290(00)00064-6.
6. Diallo O., Dore E., Duche P., Van Praagh E., Effects of plyo-
metric training followed by a reduced training programme on
physical performance in prepubescent soccer players. J Sports
Med Phys Fitness, 2001, 41 (3), 342–348.
7. Fatourous I.G., Jamurtas A.Z., Leontsini D., Taxildaris K.,
Aggelousis N., Kostopoulos N. et al., Evaluation of plyometric
exercise training, weight training, and their combination on
vertical jump and leg strength. J Strength Cond Res, 2000, 14
(4), 470–476.
8. Aragon-Vargas L.F., Gross M.M., Kinesiological factors in ver-
tical jump performance: differences among individuals. J Appl
Biomech, 1997, 13 (1), 24–44.
9. Bartosiewicz G., Wit A., Jumping ability or power? [in Polish].
Sport Wyczynowy, 1985, 6, 7–14.
10. Bartosiewicz G., Biomechanical analysis of strength-speed
abilities of the lower extremities and the trunk [in Polish]. Doc-
toral dissertation. AWF, Warszawa 1989.
11. Ford K.R., Myer G.D., Smith R.L., Byrnes R.N., Dopirak S.E.,
Hewett T.E., Use of an overhead goal alters vertical jump per-
formance and biomechanics. J Strength Cond Res, 2005, 19 (2),
394–399.
12. Driss T., Vandewalle H., Quievre J., Miller C., Monod H., Ef-
fects of external loading on power output in a squat jump on a
force platform: A comparison between strength and power ath-
letes and sedentary individuals. J Sports Sci, 2001, 19 (2), 99–
105. DOI: 10.1080/026404101300036271.
13. Dziewiecki K., Dziewiecka T., Estimation of muscle power in
vertical jump on a dynamometric platform. Biol Sport, 1998,
15, 77–80.
14. Winiarski S., Rutkowska-Kucharska A., Estimated ground re-
action force in normal and pathological gait. Acta Bioeng Bio-
mech, 2009, 11 (1), 53–60.
15. Czaplicki A., Optimization solutions depend on the choice of
coordinate system. Acta Bioeng Biomech, 2008, 10 (2), 75–79.
16. Rostkowska E., Benz P., Dworak L.B., AVIImage – video mo-
tion analysis software for tests of biomechanical movement
characteristics. Acta Bioeng Biomech, 2006, 8 (1), 13–25.
17. Bartosiewicz G., Eliasz J., Viitasalo J., Wit A., Power output of
the legs and trunk and elevation of the body center of mass dur-
ing a standing vertical jump. In: Wit A. (ed.), Biomechanical
assessment of athlete’s motor system [in Polish]. Instytut Spor-
tu, Warszawa 1992, 75–92.
18. Newton R.U., Gerber A., Nimphius S., Shim J.K., Doan B.K.,
Robertson M. et al., Determination of functional strength im-
balance of the lower extremities. J Strength Cond Res, 2006, 20
(4), 971–977.
19. Hennessy L., Kilty J., Relationship of the stretch-shortening cy-
cle to sprint performance in trained female athletes. J Strength
Cond Res, 2001, 15 (3), 326–331.
20. Hennessy L., Caulfield D., Kilty J., The relationship between
stretch-shortening cycle performance tests and sprinting. In:
Hakkinen K. (ed.), International Conference on Weightlifting

HUMAN MOVEMENT
22
H. Makaruk, T. Sacewicz, Effects of plyometrics on exercise performance
and Strength Training. Gummerus Printing, Lahti, Finland
1998, 292–294.
21. Schmidtbleicher D., Training for power events. In: Komi P.V.
(ed.), Strength and power in sport. Blackwell Scientific, Lon-
don 1994, 381–395.
22. Bobbert M.F., Drop jumping as a training method for jumping
ability. Sports Med, 1990, 9 (1), 7–22.
23. Bobbert M.F., Huijing P.A., Van Ingen Schenau G.J., Drop
jumping. I. The influence of jumping technique on the biome-
chanics of jumping. Med Sci Sports Exerc, 1987, 19 (4), 332–338.
24. Walsh M., Arampatzis A., Schade F., Brüggeman G.P., The ef-
fect of drop jump starting height and contact time on power,
work performed and moment of force. J Strength Cond Res,
2004, 18 (3), 561–566.
25. Gajewski J., Janiak J., Eliasz J., Krawczyk B., Wit A., Evalua-
tion of impact of selected parameters on maximal power output
during a standing vertical jump. In: Dworak L.B. (ed.) The 13th
School of Mechanics materials [in Polish]. AWF, Poznań 1996,
330, 190–195.
26. Trzaskoma Z., Trzaskoma Ł., Complex improvement of ath-
letes’ muscle strength [in Polish]. COS, Warszawa 2001.
27. Trzaskoma Z., Trzaskoma Ł., The effect of plyometric and
weight training on leg strength and vertical jump performance.
In: Lee C.P. (ed.), Proceedings of the 2nd International Confer-
ence on Weightlifting and Strength. Ipoh, Malaysia 2000, 101.
28. Meyer G.D., Ford K.R., Brent J.L., Hewett T.E., The effects of
plyometric vs. dynamic stabilization and balance training on
power, balance, and landing force in female athletes. J Strength
Cond Res, 2006, 20 (2), 345–353.
29. Robinson L.E., Devor S.T., Merrick M.A., Buckworth J., The
effects of land vs. aquatic plyometrics on power, torque, veloci-
ty, and muscle soreness in women. J Strength Cond Res, 2004,
18 (1), 84–91.
30. Herrero J.A., Izquierdo M., Maffiuletti N.A., Garcia-Lopez J.,
Electromyostimulation and plyometric training effects on
jumping and sprint time. Int J Sport Med, 2006, 27 (7), 533–539.
DOI: 10.1055/s-2005-865845.
31. Markovic G., Jukic I., Milanovic D., Metikos D., Effects of
sprint and plyometric training on muscle function and athletic
performance. J Strength Cond Res, 2007, 21 (2), 543–549.
Paper received by the Editors: August 27, 2008.
Paper accepted for publication: October 27, 2009.
Address for correspondence
Hubert Makaruk
ul. Akademicka 2
21-500 Biała Podlaska,
e-mail: [email protected]

HUMAN MOVEMENT
23
Introduction
Parameters which can be modified and thus enable
improvement of sports results have been sought in
a number of sports including competitive swimming.
Proper swimming training should be aimed at the devel-
opment of swimmer’s physical fitness and mental and
tactical preparation. It should also concentrate to a great
extent on the optimization of swimming technique and
improvement of swimmer’s hydrodynamic parameters.
Rumyantsev [1] in his study of hydrodynamic resist-
ance during passive towing at a velocity of 2.0 m/s–1
calculated the total hydrodynamic resistance according
to the formula:
F total
= F friction
+ F wave-making
+ F form
The total hydrodynamic resistance amounted to
98.55 N, and the values of its particular components
were: F form
= 93.5 N, F wave-making
= 5 N, and F friction
=
0.05 N, respectively.
Despite the very small share of friction resistance in
the total hydrodynamic resistance, its reduction is often
emphasized in swimming training, mostly by designing
swim suits enhancing laminar flow. The use of proper
swim suits reduces the friction of water particles against
the swimmer’s body and shortens the time necessary
to cover a given swimming distance [2–5]. Wave drag
can be minimized by swimming underwater [6];
however, the length of the swimming distance under-
water is strictly regulated by the International Swim-
ming Federation (Federation Internationale de Natation
de Amateur, FINA) and restrained by swimmers’ ability
to perform exercises with limited pulmonary gas ex-
change capacity.
Form (frontal) resistance is the largest component of
the total hydrodynamic resistance. Frontal drag is ex-
erted by the swimmer’s body, which according to Ber-
noulli’s principle, while moving in the water generates
higher pressure in the front and lower pressure in the
back. The difference between these pressure areas de-
termines the value of frontal drag, but it also depends
on the length of the body’s transverse section and swim-
mer’s speed in the water. These factors point to the need
of seeking an ever more streamlined silhouette under-
water (at the start and the turns) but also during per-
DOI: 10.2478/v10038-010-0003-5
Marek Strzała1*, Piotr Krężałek2
1 Department of Theory and Methodology of Water Sports, University School of Physical Education, Cracow, Poland
2 Department of Biomechanics, University School of Physical Education, Cracow, Poland
ABSTARCT
Among factors influencing frontal (form) resistance in swimming the angle between the swimmer’s body and the line of his/her
horizontal movement is particularly important. The measurement of this angle called the angle of attack (α) represents indirectly
active torque (τa) during swimmer’s body movement. Purpose. The aim of the study was to measure the angle of attack in front crawl
swimming in young swimmers at long (2000 m), medium (400 m) and short (25 m) distances and to examine the correlation between
the angle and swimming speed at those distances. Basic procedures. Swimmers’ angles of attack formed between the line of
swimmer’s movement direction (horizontal direction) and (a) the line connecting the swimmer’s hips and goggles (αH–G), and (b) the
line connecting the swimmer’s hips and shoulders (αH–S) were measured. Main findings. The body angle of attack in front crawl
swimming was negatively correlated with swimming speed. In the analysis of αH–G (7.3 ± 2.74o) with swimming velocity at 2000 m
the correlation was on the verge of statistical significance (–0.38, p < 0.06). Conclusions. The angle of attack index in controlled
front crawl swimming races at the distances of 2000, 400 and 25 m was negatively correlated with swimming speed only at 2000 m,
and it was smaller in older, more experienced swimmers.
Key words: swimming, body angle, stroke parameters
THE BODY ANGLE OF ATTACK IN FRONT CRAWL PERFORMANCE IN YOUNG SWIMMERS
2010, vol. 11 (1), 23–28
* Corresponding author.

HUMAN MOVEMENT
24
M. Strzała, P. Krężałek, Body angle of attack in front crawl
forming propelling strokes breaking the surface of the
water. According to Vorontsov et al. [7] and Toussaint
[8] a long body is more streamlined because the zone
separating the boundary layers of high and low pressure
is located further to the back than in a short body and
thus it causes a lower turbulence wake [8]. In fact, the
fastest front crawl swimmers feature high body height
and slenderness indices [9].
Among the factors affecting pressure (frontal) resist-
ance in swimming De Groot et al. [10] emphasizes the
angle between the swimmer’s body and his/her hori-
zontal movement direction, known as the angle of at-
tack (α) which is strictly correlated with the resultant
active torque (τa) during swimming [11]. The compo-
nent forces of active torque are exerted on the self-pro-
pelling swimmer’s body in the sagittal plane. Active
torque (τa) is the result of the buoyant force and the
gravitational force acting on the body as well as the pro-
pulsion forces of swimmer’s extremities and their align-
ment to the body’s center of mass. Active torque is gen-
erated in front crawl by the arms performing the strokes
causing the rotation of the body on its transverse axis,
i.e. sinking of the legs. The moving legs generate active
torque which lifts the swimmer’s lower body. An inha-
lation also increases the buoyancy of the upper body
causing the legs to sink. Yanai [12] noted that the gen-
eration of active torque (τa) is also affected by moving
the arms above water and the swimmer’s head breaking
the surface of the water, all of which shifts the center of
buoyancy towards the legs causing torque to lift them.
The aim of the study was to find a correlation be-
tween the angle of attack in front crawl swimming in
young swimmers at long (2000 m), medium (400 m) and
short distances (25 m), and the mean value of the hori-
zontal component of the vector of swimmers’ velocity
(Vx) at these distances. The angles of attack were defined
as: (a) αH–G, i.e. the angle between the movement direc-
tion (horizontal direction) and the swimmer’s hips–gog-
gles line; and (b) αH–S, i.e. the angle between the move-
ment direction and the swimmer’s hips–shoulders line.
The study also attempted to establish correlations
between swimming technique parameters and the
body’s angle of attack at selected swimming distances.
Material and methods
The study sample comprised 26 high-level competi-
tive swimmers aged 16.0 ± 1.09 years (from 15 to 18
years of age), with the body height of 177.5 ± 8.07 cm
and body mass of 65.4 ± 9.40 kg. The subjects trained
swimming in two groups in a sports school. Only one
subject specialized in sprint swimming over the dis-
tance of 50–100 m; none of the subjects was a breast-
stroke swimmer. All subjects consented in writing to
take part in the study.
The anthropometric data gathered allowed determi-
nation of the swimmers’ somatotypes according to
Carter–Heath [13] and lean body mass (LBM – 58.7 ±
8.05 kg) following Slaughter et al. [14]. Within the sam-
ple 11 swimmers represented the ectomorphic somato-
type and 15 the mesomorphic somatotype. The meas-
urements were taken with a set of precision instruments
by Sieber Hegner Maschinen AG (Switzerland) and the
Harpenden-type skinfold caliper with constant pressure
of 10 g/cm–2. The percentage of body fat amounted to
10.21 ± 2.41%.
The swimming tests at the distances of 25, 400 and
2000 m were carried out in a 50 m pool with the start
from the water. Swimmers’ body movements were re-
corded with a rapid shutter speed GRV 9800 JVC video
cam (Japan) at a frequency of 50 frames per second.
The recordings were executed from a side view about
1 m below the water surface and 6 m from the swimmer’s
lane.
The recording analysis allowed identification of
characteristic cyclic elements of arms movements in
front crawl: stroke rate (SR), index of coordination
(IdC) and arms movement phases according to Chollet
et al. [15]. The parameters mentioned were calculated
from three full arm movement cycles over the distance
of 25 m, and two cycles over the distances of 400 and
2000 m. The stroke length (SL) at the respective dis-
tances was calculated as the ratio between the SR and
average swimming velocity (Vx) at a 20 m distance
without the 5-meter zone before the turn. The total
(∆tglob
) times of covering individual lengths of the
pool (∆ti) were measured with a stopwatch with the
accuracy of 0.01 s. The parameters for assessing front
crawl technique were measured at the 8th, 18th, 28th and
38th 20 m long swim segment for the 2000 m distance;
and at the 2nd, 4th, 6th and 8th segments for the distance
of 400 m.
The following parameters were used to assess swim-
ming technique during each segment analyzed (i = 1, 2,
3, 4):
• mean swimming velocity Vi = 20 m/∆t
i,
• stroke rate (SRi) calculated as the reciprocal of the
arithmetic mean of duration of two (at 2000 m and

HUMAN MOVEMENT
25
M. Strzała, P. Krężałek, Body angle of attack in front crawl
Table 1. Basic parameters of front crawl technique and swimming velocity (Vx) at 2000, 400 and 25 m
n = 26, ± SD 2000 m 400 m 25 m
Vx (m/s–1) 1.35 ± 0.07 1.42 ± 0.07 1.73 ± 0.12
SR (cycles per min–1) 37.4 ± 4.62 39.6 ± 3.95 55.0 ± 4.87
SL (m) 2.16 ± 0.29 2.13 ± 0.32 1.90 ± 0.16
LQ (beats per cycle–1) 3.7 ± 1.61 3.8 ± 1.73 4.8 ± 1.61
IdC (%) –7.9 ± 7.17 –5.9 ± 6.55 3.3 ± 5.91
Vx – mean swimming velocity, SR – stroke rate, SL – stroke length, LQ – legs movement quantity, IdC – index of coordination
400 m) or three (at 100 m and 25 m) swimming cy-
cles analyzed: SRi = 1/T
i,
• stroke length (SLi), calculated as the average velocity
(Vx) to SR
i ratio: SL
i = V
i /SR
i.
To assess the cooperation of the arms in body propul-
sion the index of coordination (IdCi) was used, which was
expressed as percentage of the arms movement cycle du-
ration [15, 16]. Legs movement quantity (LQi) was count-
ed from the same shots as arms movements. The legs
movements were qualified as six-beat kicks, correspond-
ing to six complete alternating immersion and/or emer-
sion movements in one movement cycle of the arms, and
four- and two-beat kick, for four and two leg movements
in one arm movement cycle, respectively.
The angles of attack: αH–G and αH–S were deter-
mined when the line connecting the shoulder joints was
in a horizontal position. The calculations were made us-
ing software package for analysis of kinematic informa-
tion: KAVideo and KA2D [17].
Means and standard deviations were used in statisti-
cal analysis. The Pearson correlation coefficient was
calculated between the angles of attack αH–G and
αH–S at 2000 m, 400 m and 25 m as well as swimming
velocity (Vx) at these distances. The correlations between
the angles of attack (α) at particular swimming distanc-
es were also calculated as well as between the
αH–G, αH–S, swimmers’ calendar age and swimming
parameters at 2000 m. Analysis of variance for repeated
measures was used to examine the changes in the an-
gles of attack at 2000 m, 400 m and 25 m. Normal data
distribution was tested to confirm their formation simi-
lar to normal Gauss–Laplace curve. The level of statisti-
cal significance was set at p < 0.05. All calculations
were made with the use of Statistica 6.1 software
(Statsoft, Inc).
Results
Figure 1 and Table 2 present the calculations of the
angle of attack in front crawl.
The calculated parameters revealed a negative cor-
relation between Vx and the angle of attack in front
crawl. The correlation between the αH–G and V2000
was
on the verge of statistical significance (Tab. 2). The
α H–G in consecutive 500 m segments of the 2000 m
distance ranged from 7.2o to 7.5o.
14
12
10
8
6
4
2
0
an
gle
of a
tta
ck (
o)
distance (m)
0 500 1000 1500 2000 2500
α H–G α H–S
Table 2. Coefficients of correlation of the angle of attack and Vx at 2000 m, 400 m and 25 m
n = 26 2000 m 400 m 25 m
αH–G (°), ± SD 7.3 ± 2.74 7.2 ± 3.41 5.2 ± 3.53
correlation with V (m/s–1) –0.38 –0.20 –0.31
αH–S (°), ± SD 6.4 ± 2.71 7.6 ± 2.76 7.8 ± 4.34
Correlation with V (m/s–1) –0.30 –0.02 –0.02
αH–G – angle of attack between movement direction and swimmer’s hips–goggles line; αH–S – angle between movement
direction and swimmer’s hips–shoulders line; correlations on the verge of statistical significance p < 0.06 in bold
Figure 1. Correlations between the body’s angle of attack
(αH–G and αH–S) and the swimming distance
(2000, 400 and 25 m)

HUMAN MOVEMENT
26
M. Strzała, P. Krężałek, Body angle of attack in front crawl
The angle of attack values revealed strong statistical-
ly significant correlations at 2000 m and 400 m, and also
medium and statistically significant correlations were
found between αH–S at 25 m and at 400 m (Tab. 3).
Table 3. Coefficients of correlation between angles of attack
at 2000 and 400 m and at 400 and 25 m
2000 mCorrela-
tion400 m
Correla-
tion25 m
αB–O (°) 0.78** αB–O (°) 0.3 αB–O (°)
αB–R (°) 0.68** αB–R (°) 0.42* αB–R (°)
αH–G – angle of attack between movement direction and
swimmer’s hips–goggles line; αH–S – angle between
movement direction and swimmer’s hips–shoulders line;
*p < 0.05, **p < 0.01
The correlations between the angle of attack (αH–G)
and mean swimming velocity at 2000 m (V2000
) were
medium and on the verge of statistical significance.
Table 4 lists the parameters determining mean velocity
in front crawl swimming (Vx) at a distance of 2000 m.
Table 4. Coefficients of correlation between αH–G and
αH–S and swimming technique parameters at a distance
of 2000 m
2000 m
SR
(cycles per
min–1)
SL
(m)
LQ
(beats per
cycle–1)
IdC
(%)
αH–G (°) 0.37 –0.62** –0.05 0.24
αH–S (°) 0.35 –0.46* –0.06 0.34
SR – stroke rate, SL – stroke length, LQ – legs movement
quantity, IdC – index of coordination; *p < 0.05, **p < 0.01;
correlations on the verge of statistical significance (p ≤ 0.08)
in bold
The values of angles of attack at 2000 m were also
correlated with subjects’ calendar age. The correlations
were medium. The correlation between αH–G and
swimmers’ age was close to the level of statistical sig-
nificance (r = –0.36, p = 0.07); while the correlation be-
tween αH–S and swimmers’ age was statistically non-
significant (r = –0.31, n.s.).
Discussion
The obtained values of the angle of attack in front
crawl swimming at the distances studied were correlat-
ed with swimming velocity on the verge of statistical
significance only in the case of αH–G with V2000
. The
αH–G decreased significantly along with increasing
swimming velocity and shortening of the swimming
distance (F = 201.73, df = 1.25, p < 0.01). These results
are contrary to those of Kjendlie et al. [11], where the
angle of attack, measured between the waterline and the
swimmer’s iliac spine–goggles line, increased in adult
swimmers with increasing swimming velocity, similar
to the αH–S in the present study (F = 190.32, df = 1.25,
p < 0.01). However, the testing conditions in the studies
were aforementioned aforementioned different from
those in middle- and long-distance swimming tests
which involve the swimmer’s respiratory system to
a greater extent. The authors mentioned had examined
swimmers at a distance of 4 × 25 m, moving at submaxi-
mal speed. Such conditions eliminate the fatigue effect,
require lower pulmonary ventilation and fewer head and
trunk movements during inhaling, and thus allow lower
positioning of the upper body in the water. The more
frequent inhaling movements performed by swimmers
at middle and long distances (400 and 2000 m) made the
αH–G increase as compared with the 25 m distance
(Tab. 2, 3).
The observed negative correlation between αH–G at
2000 m and subjects’ age may be indicative of more
experienced swimmers’ better mastery of hydrody-
namic positioning of the body in the water. A similar
relationship between front crawl swimming and sub-
maximal swimming velocity was also noted by Kjend-
lie et al. [11, 18] in swimming adults and children. Ac-
cording to Kjendlie et al. [11, 18], but also Yanai [12]
more experienced adult swimmers develop more effec-
tive front crawl technique relying on more efficient leg
work (higher frequency of movements) and the gener-
ated force, which decreases the angle of attack and thus
reducing drag. In the present study the correlation be-
tween the number of leg movements per one arms
movement cycle and swimmers’ age was statistically
non-significant (r = 0.30, n.s.); however, the force gen-
erated by leg movements could be greater in older
swimmers. Furthermore, the noted correlation on the
verge of statistical significance between αH–G and
swimmers’ age is similar to the results in the aforemen-
tioned studies.
Zamparo et al. [19], who assessed passive underwa-
ter torque (τp) and its impact on the energy cost of front-
crawl swimming (CS) at the speed of 1.2, 1.4 and 1.6 m/
s–1 noted a statistically significant correlation between
CS and τ
p only at V
x of 1.2 m/s–1. In another study
Zamparo et al. [20] noted a linear correlation between
the energy cost of front-crawl swimming (CS) at 1.0 and
1.23 m/s–1 and torque modified by extra loading of the

HUMAN MOVEMENT
27
M. Strzała, P. Krężałek, Body angle of attack in front crawl
swimmer’s trunk. On the other hand, Kjendlie et al. [18]
found a negative and statistically significant correlation
between the angle of attack and the energy cost of
swimming at 1.0 m/s–1 only; however, these results were
obtained only in one group of adults and children. It
shows that the energy cost was influenced by the body
mass and the distance between the center of mass and the
point of application of the buoyant force, which were
greater in adult swimmers despite their smaller α during
the swimming tests. A greater energy cost of a swimmer
with greater body length parameters, who swims at Vx
of 1.0 m/s–1, can be explained by the greater torque
causing the legs to sink in static conditions [21].
In the present study the αH–S was correlated with Vx
more weakly than αH–G; it can thus be assumed that
the position of head affects drag to a greater extent than
the inclination angle of the trunk. Vorontsov et al. [7]
following Onoprienko [22] and Miyashita and Tsunoda
[23] showed that lifting the head at Vx below 1.45 m/s–1
may increase drag by about 20%. At higher swimming
speeds, it can increase drag from 2% to 40%. In ad-
vanced swimmers the arching of the body backwards
and the ensuing greater buoyancy and lift of the body
decrease the generation of drag.
In the present study the αH–G was correlated with
the stroke rate (on the verge of statistical significance
r = 0.37) – one of the factors determining swimmers’
performance at a distance of 2000 m. In the group un-
der study the SR level should not be reduced to decrease
the αH–G. For example, the SR was 91% of the value of
the αH–G index in swimmers at the 2007 European
Championship Finals in Antwerp at 1500 m; whereas
the stroke length amounted to 95.2% in the study group
in comparison with European Championship finalists.
The measurements of the angle of attack in front-crawl
swimming at 2000 m, 400 m and 25 m revealed a nega-
tive correlation (r = –0.38) on the verge of statistical
significance between the αH–G with swimming veloci-
ty Vx at 2000 m. The correlation of the αH–G on the
verge of statistical significance with subjects’ age shows
that older and more experienced and skilled swimmers
are able to effectively reduce the angle of attack in front
crawl swimming.
Conclusions
The angle of attack in front-crawl swimming (αΗ–G)
decreases significantly with increasing swimming ve-
locity Vx and reducing the swimming distance. The an-
gle of attack was negatively correlated with Vx at 2000
m (on the verge of statistical significance). In sport
practice the reduction of the angle of attack in front
crawl swimming improves the swimmer’s hydrody-
namic parameters and sports results. It is confirmed by
the results of young swimmers at a distance of 2000 m
discussed in the present study.
References
1. Rumyantsev V.A., Biomechanics of sport swimming. Central
State Institute of Physical Culture, Moscow 1981.
2. Chatard J.C., Wilson B., Effect of fastskin suits on performance
drag and energy cost of swimming. Med Sci Sports Exerc,
2008, 40 (6), 1149–1154. DOI: 10.1249/MSS.0b013e318169387b.
3. Mollendorf J.C., Termin A.C., Oppenheim E., Pendergast D.R.,
Effect of swim suit design on passive drag. Med Sci Sports
Exerc, 2004, 36 (6), 1029–1035.
4. Roberts B.S., Kamel K.S., Hedrick C.E., McLean S.P., Sharp
R.L., Effect of FastskinTM suit on submaximal freestyle swim-
ming. Med Sci Sports Exerc, 2003, 35 (3), 519–524.
5. Starling R.D., Costill D.L., Trappe T.A., Jozsi A.C., Trappe
S.W., Goodpaster B.H., Effect of swimming suit design on the
energy demands of swimming. Med Sci Sports Exerc, 1995, 27
(7), 1086–1089.
6. Vennell R., Pease D., Wilson B., Wave drag on human swim-
mers. J Biomech, 2006, 39 (4), 664–671. DOI: 10.1016/
j.jbiomech.2005.01.023.
7. Vorontsov A.R., Rumyantsev V.A., Resistive forces in swim-
ming. In: Zatsiorsky V. (eds), Biomechanics in Sports: Per-
formance Enhancement and Injury Prevention. Vol. IX Ency-
clopaedia of Sports Medicine. Blackwell Science, London
2000, 194, 195.
8. Toussaint H.M., Truijens M., Biomechanical aspects of peak
performance in human swimming. Animal Biology, 2005, 55,
17–40. DOI: 10.1163/1570756053276907.
9. Kosmol A. Swimming at the Olympic Games in Atlanta and
Barcelona. [in Polish] Sport Wyczynowy, 1997, 7–8, 391–392.
10. De Groot G., Van Ingen Schenau G.J., Fundamental mechanics
applied to swimming: technique and propelling efficiency. In:
Ungerechts B, Wilke K, Reischle K. (eds), Swimming Science
V. Human Kinetics, Champaign 1998, 17–29.
11. Kjendlie P.L., Stallman R.K., Stray-Gundersen J., Passive and
active floating torque during swimming. Eur J Appl Physiol,
2004, 93 (1–2), 75–81. DOI: 10.1007/s00421-004-1165-7.
12. Yanai T., Rotational effect of buoyancy in front crawl: Does it
really cause the legs to sink? J Biomech, 2001, 34 (2), 235–243.
13. Carter J.E., Heath B.H., Somatotyping – development and ap-
plications. Cambridge University Press, New York 1990.
14. Slaughter M.H., Lohman T.G., Boileau R.A., Horswill C.A.,
Stillman R.J., Van Loan D. et al., Skinfold equations for estima-
tion of body fatness in children and youth. Hum Biol, 1988, 60
(5), 709–723.
15. Chollet D., Chalies S., Chatard J.C., A new index of coordina-
tion for the crawl: description and usefulness. Int J Sports Med,
2000, 21 (1), 54–59. DOI: 10.1055/s-2000-8855.
16. Strzała M., Tyka A., Krężałek P., Physical endurance and
swimming technique in 400 meter front crawl race. J Human
Kinetics, 2007, 18, 73–86.
17. Schleihauf R., Kinematic Analysis Software (Version 5.91) Bi-
omechanics Software: San Francisco State University 2006.

HUMAN MOVEMENT
28
M. Strzała, P. Krężałek, Body angle of attack in front crawl
18. Kjendlie P.L., Ingjer F., Stallman R.K., Stray-Gundersen J.,
Factors affecting swimming economy in children and adults.
Eur J Appl Physiol, 2004, 93 (1–2), 65–74. DOI: 10.1007/
s00421-004-1164-8.
19. Zamparo P., Capelli C., Cautero A., Di Nino A., Energy cost of
front-crawl swimming at supra-maximal speeds and underwa-
ter torque in young swimmers. Eur J Appl Physiol, 2000, 83
(6), 487–491. DOI: 10.1007/s004210000318.
20. Zamparo P., Capelli C., Termin B., Pendergast D.R., di Pram-
pero P.E., Effect of the underwater torque on the energy cost,
drag and efficiency of front crawl swimming. Eur J Appl Physiol
Occup Physiol, 1996, 73 (3–4), 195–201. DOI: 10.1007/
BF02425476.
21. Zamparo P., Antonutto G., Capelli C., Francescato M.P., Girar-
dis M., Sangoi R. et al., Effects of body size, body density, gen-
der and growth on underwater torque. Scand J Med Sci Sports,
1996, 6 (5), 273–280. DOI: 10.1111/j.1600-0838.1996.tb00470.x.
22. Onoprienko B.I., Relationship of hydrodynamic drag and swim-
mer’s body position. Theory and Practice of Physical Culture,
1968, 9, 12–15.
23. Miyashita M., Tsunoda R., Water resistance in relation to body
size. In: Eriksson B., Furberg B. (eds.), Swimming Medicine IV.
University Park Press, Baltimore 1978, 395–401.
Paper received by the Editors: January 6, 2009.
Paper accepted for publication: October 15, 2009.
Address for correspondence
Marek Strzała
ul. Rogozińskiego 12
31-559 Kraków, Poland
e-mail: [email protected]

HUMAN MOVEMENT
29
Introduction
Classification systems are used in various sports.
They are particularly useful in sports for persons with
various disabilities and impairments of physical func-
tion, who are classified according to their age, body
weight and disability type [1]. Differences between
sports results achieved by athletes within given classes
are smaller than they would be between non-classified
athletes, which greatly encourages the individuals with
disability to participate in various sports [2]. Originally,
sports for the individuals with disability were mainly
propagated by physicians and physiotherapists, and the
early classification systems were based on anatomic and
medical criteria such as assessment of muscle strength,
range of motion, length of limb stump, level of the spi-
nal cord injury or spasticity [3].
In the 1970s wheelchair rugby1 was played only by
tetraplegics, and the wheelchair rugby athlete classifica-
tion was based on a system developed by the Interna-
tional Stoke Mandeville Games Federation (ISMGF) in
which the classes were largely determined by the level
of the athletes’ spinal cord injury [4]. Later on it was
noted that the level of attained compensation in disabled
DOI: 10.2478/v10038-010-0002-6
Natalia Morgulec-Adamowicz1*, Andrzej Kosmol2, Magdalena Bogdan3, Bartosz Molik2,
Izabela Rutkowska1, Grzegorz Bednarczuk1
1 Department of Adapted Physical Activity, Józef Piłsudski University of Physical Education, Warsaw, Poland
2 Department of Sports for Individuals with Disability, Józef Piłsudski University of Physical Education, Warsaw, Poland
3 Foundation for Active Rehabilitation (FAR)
ABSTRACT
Purpose. The purpose of the study was to examine game efficiency of elite wheelchair rugby players in consideration of International
Wheelchair Rugby Federation (IWRF) classification during the 2008 Paralympic Games played according to the old wheelchair rugby
rules. Basic procedures. A group of 77 athletes representing 8 national teams participated in the study. Each team played 5 games for
32 min each. Athletes who played for more than 8 min in total at the 2008 Paralympics qualified for the study. The seven IWRF player
point classes were collapsed into four groups. The game efficiency analysis was based on the IWRF Statistical Reports. The following
six game efficiency parameters were analyzed: played time (T), sum of all points scored (PT), assist passes (AS), assist blocks (AB),
turnovers (TO) and steals (ST). Main findings. The major finding of the study was that most differences in PT, AS, AB, TO and ST were
found among all the examined groups (I–IV), except groups I and II. The played time (T) was not sensitive enough to identify
significant differences among all the groups. This indicates that played time in the context of substitutions limited by classification
point requirements does not reflect the differences between player classes. Conclusions. Generally, there was a tendency for high-
point class players to perform better. The study findings point to the importance of analysis of game efficiency of elite wheelchair
rugby players with regard to their IWRF classification during tournaments played according to the new wheelchair rugby rules.
Key words: disability sport, game efficiency, classification, wheelchair rugby
GAME EFFICIENCY OF WHEELCHAIR RUGBY ATHLETES AT THE 2008 PARALYMPIC GAMES WITH REGARD TO PLAYER CLASSIFICATION
2010, vol. 11 (1), 29–36
1 Wheelchair rugby is a team sport for athletes with disability deve-
loped in Canada in the 1970s [5]. In 2000 wheelchair rugby became
a Paralympic sport [6]. There are currently 29 active countries
playing wheelchair rugby at different international competition le-
vels. The athletes play wheelchair rugby in custom-made sports
wheelchairs. The rugby ball is identical to a regulation volleyball
and the game is played on a hardwood basketball court [7]. The aim
of the game is to advance the ball from the team’s own back court
within 15 seconds and score a goal by crossing the opposing team’s
goal line [5]. A goal is scored when two wheels of the ball carrier’s
wheelchair cross the goal line marked with two cones [4]. The team
with a higher number of points at the end of regulation play wins.
Wheelchair rugby is a contact sport involving such technical and
tactical elements as picking and blocking. It requires speed,
strength, endurance, coordination and effective wheelchair maneu-
verability skills.* Corresponding author.

HUMAN MOVEMENT
30
N. Morgulec-Adamowicz et al., Game efficiency in wheelchair rugby
persons was better reflected by their functional abili-
ties, which could affect their sports successes to a much
greater extent than their anatomical and medical assess-
ments. Gradually, functional classification systems spe-
cific to the unique functional demands of particular
sports superseded medical classifications. Functional
classification is based on the athlete’s functional abili-
ties specific to the physical demands of each unique
sport and it ensures that athletes with different kinds
and levels of disabilities have an opportunity to com-
pete in the same sport. One of the reasons for the chang-
es in classification system in wheelchair rugby was the
need to include athletes with disabilities other than spi-
nal cord injuries with impairments similar to tetraplegia
(e.g. muscular dystrophy, cerebral palsy, neuromuscular
disorders). At present, wheelchair rugby athletes are in-
dividuals with neurological disorders (of the central or
peripheral nervous systems) or non-neurological disa-
bilities, with impaired or absent upper and lower limbs
movement. The functional classification allows com-
parison of potential athletes’ functional abilities with
the accepted classification criteria [8]. The current
wheelchair rugby medical-functional classification sys-
tem was developed in 1991. The classification process
comprises three components: (1) physical assessment
consisting of manual muscle tests [9] and trunk tests;
(2) functional skills tests (wheelchair skills: pushing
forward and backward, starting, stopping, turning,
changing direction; ball handling skills: one-hand and
two-hand passes, catching, retrieving the ball from the
floor, dribbling; blocking and picking); and (3) observa-
tion assessment of athletes during warm-up, training,
practice and competition (e.g. transfers to and from the
wheelchair, putting on gloves, straps and binders) [8].
Following the assessments each athlete is allocated one
of seven sports classes (numerical categories) ranging
from 0.5 to 3.5 points. The 0.5 class includes athletes
with the most disability, and the 3.5 class athletes with
the least disability eligible for the sport of wheelchair
rugby. In wheelchair rugby the total number of points of
all four athletes in a team on court at any time cannot
exceed 8.0 points. The introduction of the point limit is
aimed to equalize the medical and functional potential
of the competing teams.
The wheelchair rugby classification system has been
constantly verified to improve game efficiency of indi-
vidual athletes and teams [4, 6, 10, 11]. The growing
significance of functional assessment in the classifica-
tion process has made a number of researchers examine
relationships between wheelchair rugby specific fitness
tests and player classification. Morgulec and Lencse-
Mucha [7] revealed statistically significant correlations
between the classification of Polish National Team
wheelchair rugby players and the results of Beck Bat-
tery tests carried out twice – in 2001 and 2003. Similar
observations were made by Malone et al. [10], who
found a significant correlation between player classifi-
cation and five wheelchair rugby specific fitness tests
(20 m sprint, endurance sprint, up and back, passing,
and slalom). The correlations observed indicated a cer-
tain tendency, while analysis of statistically significant
differences between particular classes of players may
yield some more detailed data about the accuracy of
a classification system [13]. Morgulec et al. [12] in their
study with the use of the Beck Battery revealed no sig-
nificant differences between players from most IWRF
classes, but only between the 0.5 class players and the
remaining classes.
Wheelchair rugby combines short intense bouts of
full effort exercise, thus it requires anaerobic capacity.
Morgulec et al. [14] used the Wingate test to examine
differences between individual classes of wheelchair
rugby athletes and only noted significant differences
between the 0.5 and 2.0–2.5 and 3.0–3.5 class players.
In team games, apart from the players’ functional
abilities necessary for development of skills and habits,
also the praxeological assessment of individual players
and the team as a whole are highly significant for at-
tainment of good sports results. The praxeological eval-
uation is usually carried out using such criteria as ra-
tionality, efficiency, economy and profitability [15, 16].
The most basic and common praxeological criterion,
measured with the level of conformity between the
sport result and the goal is efficiency. An action is effi-
cient if it achieves a specified goal, but also when it ena-
bles or enhances its achievement [15].
Very few studies concerning disability team sports,
including relatively new wheelchair rugby, have been
devoted to the assessment of game efficiency of players
and teams. One of them is a study by Molik et al. [11]
which used a modified game efficiency sheet from
wheelchair basketball. The study was conducted on
a sample of 105 wheelchair rugby players during the
European Championships in 2005. Statistically signifi-
cant differences in game efficiency were only noted be-
tween the 0.5–1.5 and 2.0–3.5 class players.
Vanlandewijck et al. [17] observed that differences
between players at the national level can be determined

HUMAN MOVEMENT
31
N. Morgulec-Adamowicz et al., Game efficiency in wheelchair rugby
to a great extent by such extra factors as previous sport
experience, training methods, creativity, talent as well
as physical, psychical, technical and tactical potential.
Thus the total of these factors and the player’s function-
al abilities may not reflect the classification points as-
signed to the player on the basis of his functional abili-
ties only. However, at the international level (world
championships, the Paralympics) the extra factors de-
termining the players’ sports levels are comparable be-
tween individual players and therefore reflect better the
assigned classification points alongside the assessment
of functional abilities. This assumption may seem
doubtful as the players’ various intellectual skills may
also be decisive in achieving the ultimate sports suc-
cesses. An analysis of game efficiency of players with
different levels of functional abilities can greatly con-
tribute to the improvement of accuracy of the classifica-
tion system. The aim of the present study was to assess
game efficiency of wheelchair rugby players represent-
ing different IWRF classes.
It was assumed that an analysis of wheelchair rugby
players on the highest sports level (Paralympic games
athletes) would permit an objective comparison of se-
lected parameters of game efficiency between athletes
with disability representing different classes. It was also
assumed that the level of game efficiency would be de-
pendent on player classification, i.e. high-point class
players (with greater functional abilities) would repre-
sent a higher level of game efficiency.
The confirmation of this assumption may contribute
to the improvement of player and team sports training,
in particular, to the process of optimal selection of play-
ers with regard to their classification.
The main research question was whether game effi-
ciency was a factor discriminating between top level
wheelchair rugby players?
Material and methods
The study sample included wheelchair rugby players
from the world top teams: Australia, China, Japan,
Canada, Germany, New Zealand, the United States and
Great Britain. Only players who spent at least one quar-
ter of the game played time on the court (8 min) were
taken into consideration. Out of 88 players who took
part in the Beijing Paralympics (September 6–17, 2008)
77 qualified for the study. Each Paralympic team played
five matches during the tournament. The players re-
presented all seven IWRF classes: 0.5 points (n = 9),
1.0 point (n = 11), 1.5 points (n = 7), 2.0 points (n = 23),
2.5 points (n = 10), 3.0 (n = 13) and 3.5 points (n = 4).
Their percentage distribution at the 2008 Paralympic
wheelchair rugby tournament is shown in Figure 1.
Figure 1. Percentage distribution of wheelchair rugby players
from different IWRF classes at the Beijing 2008 Paralympics
The subjects (n = 77) were divided into four groups
(I–IV) encompassing the respective IWRF classes.
Table 1. Profiles of the study groups of wheelchair rugby
players
GroupIWRF
classes (pts)n
Age (years)
mean (SD) min-max
I 0.5 9 33.9 (6.4) 26–47
II 1.0–1.5 18 31.2 (5.8) 20–42
III 2.0–2.5 33 31.8 (5.2) 23–43
IV 3.0–3.5 17 30.1 (6.6) 19–40
I–IV 0.5–3.5 77 31.8 (6.0) 19–47
On the basis of the tournament match statistics (20
matches) the following six game efficiency parameters
were analyzed for each subject: played time (T), sum of
all points scored (PT), assist passes (AS), assist blocks
(AB), turnovers (TO) and steals (ST). An assist pass
(AS) is the last pass to a player who scores a point (only
one assist pass can be assigned to each scored point).
An assist block (AB) is blocking of an opponent’s
wheelchair by a player without possession of the ball
resulting in the ball carrier’s crossing the opposing
team’s goal line and scoring a point (only one assist
block can be assigned to each scored point). A turnover
(TO) is the loss of possession of the ball. A steal (ST) is
an interception of the ball resulting from a defending
player’s intended action [11]. Played time (T) was calcu-
lated as a player’s averaged time played in all matches
of the competition (no shorter than 8 min) over 32 min
(total match time). The other parameters (PT, AS, AB,
TO, ST) were averaged out over played time (T).
The Statistica 5.1 software package (StatSoft, Poland)
was used for statistical analysis. In order to determine
the differences in particular game efficiency parameters
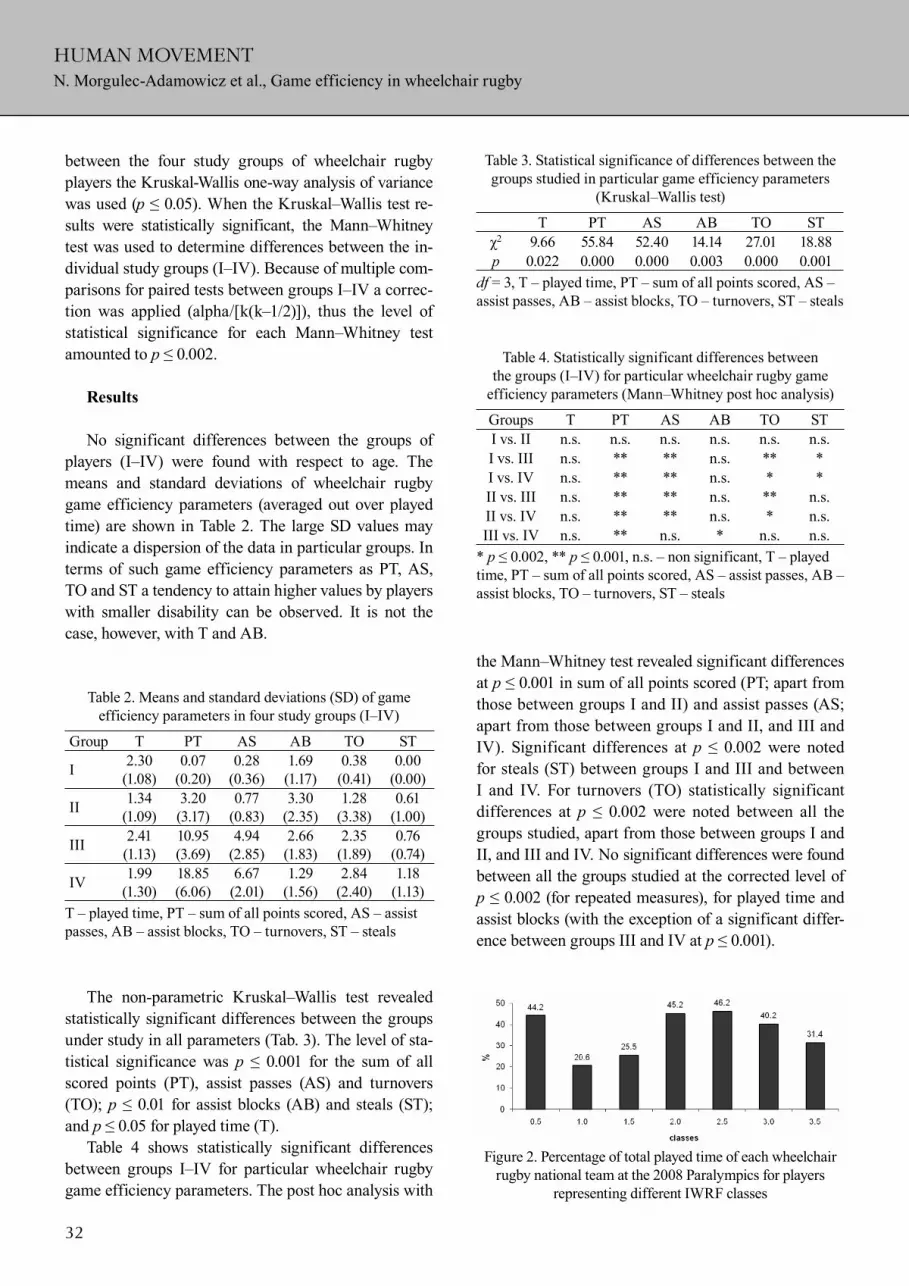
HUMAN MOVEMENT
32
N. Morgulec-Adamowicz et al., Game efficiency in wheelchair rugby
between the four study groups of wheelchair rugby
players the Kruskal-Wallis one-way analysis of variance
was used (p ≤ 0.05). When the Kruskal–Wallis test re-
sults were statistically significant, the Mann–Whitney
test was used to determine differences between the in-
dividual study groups (I–IV). Because of multiple com-
parisons for paired tests between groups I–IV a correc-
tion was applied (alpha/[k(k–1/2)]), thus the level of
statistical significance for each Mann–Whitney test
amounted to p ≤ 0.002.
Results
No significant differences between the groups of
players (I–IV) were found with respect to age. The
means and standard deviations of wheelchair rugby
game efficiency parameters (averaged out over played
time) are shown in Table 2. The large SD values may
indicate a dispersion of the data in particular groups. In
terms of such game efficiency parameters as PT, AS,
TO and ST a tendency to attain higher values by players
with smaller disability can be observed. It is not the
case, however, with T and AB.
the Mann–Whitney test revealed significant differences
at p ≤ 0.001 in sum of all points scored (PT; apart from
those between groups I and II) and assist passes (AS;
apart from those between groups I and II, and III and
IV). Significant differences at p ≤ 0.002 were noted
for steals (ST) between groups I and III and between
I and IV. For turnovers (TO) statistically significant
differences at p ≤ 0.002 were noted between all the
groups studied, apart from those between groups I and
II, and III and IV. No significant differences were found
between all the groups studied at the corrected level of
p ≤ 0.002 (for repeated measures), for played time and
assist blocks (with the exception of a significant differ-
ence between groups III and IV at p ≤ 0.001).
Table 2. Means and standard deviations (SD) of game
efficiency parameters in four study groups (I–IV)
Group T PT AS AB TO ST
I2.30
(1.08)
0.07
(0.20)
0.28
(0.36)
1.69
(1.17)
0.38
(0.41)
0.00
(0.00)
II1.34
(1.09)
3.20
(3.17)
0.77
(0.83)
3.30
(2.35)
1.28
(3.38)
0.61
(1.00)
III2.41
(1.13)
10.95
(3.69)
4.94
(2.85)
2.66
(1.83)
2.35
(1.89)
0.76
(0.74)
IV1.99
(1.30)
18.85
(6.06)
6.67
(2.01)
1.29
(1.56)
2.84
(2.40)
1.18
(1.13)
T – played time, PT – sum of all points scored, AS – assist
passes, AB – assist blocks, TO – turnovers, ST – steals
The non-parametric Kruskal–Wallis test revealed
statistically significant differences between the groups
under study in all parameters (Tab. 3). The level of sta-
tistical significance was p ≤ 0.001 for the sum of all
scored points (PT), assist passes (AS) and turnovers
(TO); p ≤ 0.01 for assist blocks (AB) and steals (ST);
and p ≤ 0.05 for played time (T).
Table 4 shows statistically significant differences
between groups I–IV for particular wheelchair rugby
game efficiency parameters. The post hoc analysis with
Table 3. Statistical significance of differences between the
groups studied in particular game efficiency parameters
(Kruskal–Wallis test)
T PT AS AB TO ST
χ2 9.66 55.84 52.40 14.14 27.01 18.88
p 0.022 0.000 0.000 0.003 0.000 0.001
df = 3, T – played time, PT – sum of all points scored, AS –
assist passes, AB – assist blocks, TO – turnovers, ST – steals
Table 4. Statistically significant differences between
the groups (I–IV) for particular wheelchair rugby game
efficiency parameters (Mann–Whitney post hoc analysis)
Groups T PT AS AB TO ST
I vs. II n.s. n.s. n.s. n.s. n.s. n.s.
I vs. III n.s. ** ** n.s. ** *
I vs. IV n.s. ** ** n.s. * *
II vs. III n.s. ** ** n.s. ** n.s.
II vs. IV n.s. ** ** n.s. * n.s.
III vs. IV n.s. ** n.s. * n.s. n.s.
* p ≤ 0.002, ** p ≤ 0.001, n.s. – non significant, T – played
time, PT – sum of all points scored, AS – assist passes, AB –
assist blocks, TO – turnovers, ST – steals
Figure 2. Percentage of total played time of each wheelchair
rugby national team at the 2008 Paralympics for players
representing different IWRF classes

HUMAN MOVEMENT
33
N. Morgulec-Adamowicz et al., Game efficiency in wheelchair rugby
chair rugby coaches tend to select players from classes
2.0–2.5, which is most beneficial for the most optimal
team tactics, with only a slight limitation of the team
functional potential and without exceeding the allowed
total classification points of all players on the court for
a team.
In terms of sum of all points scored (PT) all the study
groups differed significantly, apart from differences be-
tween groups I and II. It comes as no surprise since 0.5,
1.0 and 1.5 class athletes usually fulfill the role of block-
ers during offensive parts of the game. Due to their con-
siderable limitation of hand function the low-pointers
(0.5–1.5 points) are not major ball handlers and rather as-
sist their high-point class teammates (2–3.5 points). Thus
the statistically significant differences between 0.5, 1.0
and 1.5 class players and 2.0, 2.5, and 3.0 and 3.5 class
players seem to be justified. The noted significant differ-
ence between players from group III (2.0 and 2.5 points)
and IV (3.0 and 3.5 points) may derive from the coaches’
tactical suppositions that the players from classes 3.0 and
3.5 are more likely to score points than their teammates
from classes 2.0 and 2.5. On the other hand, the differ-
ence in the sum of scored points seems to confirm that
functional differences between the IWRF point classes
are reflected in game efficiency. The present research
findings do not support the study results of Molik et al.
[11], who failed to show statistically significant differ-
ences in the sum of scored points between 1.5 class play-
ers and 2.0, 2.5, 3.0 and 3.5 class players as well as be-
tween 2.0 and 2.5 class players and 3.0 and 3.5 class
players. In the present study the 1.5 class players formed
the same study group with the 1.0 class players. Perhaps
two separate study groups might have confirmed certain
similarities in game efficiency between the 1.5 class play-
ers and higher class athletes. The observed discrepancies
between our results and those of Molik et al. [11] are hard
to explain. Perhaps, the selection of world top players
rather than European elite players only can serve as an
explanation. One should not exclude either the impact of
the dynamic development of wheelchair rugby over the
last three years resulting in certain specializations of ath-
letes. Also the expanded range of disability types of top
world wheelchair rugby players might have affected the
research results. There has been an observable increase
in the number of wheelchair rugby athletes with tetra-
equivalent function (e.g. four limbs amputations, cerebral
palsy) usually assigned high-point classes. For instance,
each athlete with tetraplegia experiences problems with
trunk stability while sitting, which is not usually the case
with amputees or athletes with cerebral palsy.
Figure 2 shows the percentage distribution of total
played time (5 matches, 160 min) of each wheelchair
rugby national team at the 2008 Paralympics for players
representing different IWRF classes (0.5–3.5).
Discussion
Classification is an additional factor that affects
player efficiency in team games for individuals with dis-
ability. It can also make the assessment of game efficien-
cy more difficult and complicated. Wheelchair rugby as
a relatively young game without any equivalent among
team games for the able-bodied, has limited possibilities
of reliance on any commonly applied game efficiency as-
sessment tools. So far the only attempt at evaluation of
wheelchair rugby game efficiency has been a study by
Molik et al. [11]. The present research confirms the prob-
lem of appropriate choice of assessment tools in sports
for individuals with disability, which has been earlier dis-
cussed in the cases of some more developed team games
for individuals with disability [17–24]. Objective methods
of assessment of player and team behavior during the
game are still being sought in wheelchair basketball
[17–20], standing volleyball [21] and sitting volleyball
[22–24]. They are to determine the level of game effi-
ciency in relation to players’ functional levels, which in
consequence should contribute to the improvement of
sport proficiency of these Paralympic sport events.
In the present study the assessment of game efficiency
in wheelchair rugby focused on an analysis of six param-
eters (played time, sum of all points scored, assist passes,
assist blocks, turnovers and steals). Played time (T) was
not a statistically significant parameter discriminating
between players from the groups studied (Tab. 2). The
longest time on the court was spent by 2.5 and 2.0 class
players, followed by 0.5, 3.0 and 3.5 class players, and 1.5
and 1.0 class players (Fig. 2). At the top sports level such
results are not surprising. Taking into consideration the
possibilities of substitutions, the players from group III
(n = 33) played for the longest time. Thus their long
played time cannot be attributed to the limited number of
players in that group, as opposed to the less numerous
group I (n = 9). This case illustrates the difficulties in
assessment of an athlete’s playing time in wheelchair
rugby, without precise data on substitution possibilities
within a team and on the coach’s tactical plans related to
choice of four players on the court. The obtained research
data show that the players from group III (2.0–2.5 points)
achieved the closest results to the athletes of the highest
functional classes (3.0–3.5 points). In practice, wheel-

HUMAN MOVEMENT
34
N. Morgulec-Adamowicz et al., Game efficiency in wheelchair rugby
The analysis of assist passes (AS) revealed statisti-
cally significant differences between all the study
groups, apart from those between groups I and II, and III
and IV. Like in the sum of scored points, the lack of dif-
ferences between players fulfilling the roles of blockers
(0.5, 1.0 and 1.5 points) seems justified. The lack of sta-
tistically significant differences between groups III and
IV can be explained by the limitations related to the ap-
plied statistical methods requiring correction of the level
of statistical significance. Although the difference in as-
sist passes between groups III and IV was not significant
at p ≤ 0.002, it amounted to p = 0.009. On the other hand,
the lack of differences between high-pointers was con-
firmed in Molik et al. [11]. Moreover, both studies also
revealed significant differences in the number of assist
passes between players from classes 0.5 and 2.0; 2.5, 0.5
and 3.0 and 3.5; 1.0, 1.5 and 2.0, 2.5; and between 1.0, 1.5
and 3.0, 3.5. An analysis of the number of assist passes
from the 2005 European Championships revealed a sig-
nificant difference between the 0.5 and 1.0 class players.
It is a curious observation taking into account the func-
tional ability and the predominantly defensive role of
these class players on the court. The noted difference
could have resulted from the large differentiation of re-
sults in 0.5 and 1.0 players studied by Molik et al. [11] as
confirmed by the means and standard deviation values
obtained (x = 0.06, SD = 0.13 and x = 1.11, SD = 1.02,
respectively). The lack of significant differences in the
number of assist passes between groups III and IV is
most certainly due to the specific nature of wheelchair
rugby. The players from these two groups usually serve
as ball handlers on the court, as opposed to their team-
mates whose functional limitations may involve a seri-
ous risk of losing the ball. It should be noted that in
combination with the sum of scored points the athletes
from classes 2.0–2.5 concentrate on handling the ball,
by – for instance – making the final pass before scoring
a goal. The functional limitations on the other hand (e.g.
slower wheelchair pushing) affect negatively the sum of
scored points. The 3.0–3.5 class rugby players with
much stronger upper body muscles are usually much
faster ball handlers and playmakers.
Assist block (AB) is a parameter determining the ef-
ficiency of offensive play without the ball. An assist
block is attributed to a player who blocks an opponent
with his wheelchair, in a way that leads to scoring a goal
by his teammate (for a goal to count, two wheels of the
player’s wheelchair must cross the line while the player
has possession of the ball). The statistically significant
differences in the number of assist blocks were only
found between players from groups III and IV. The
analysis of mean values revealed a large, but non-sig-
nificant difference between the results from groups II
and IV (p = 0.003). The lowest results attained by the
most functionally able athletes confirm that their role in
offensive play is ball handling allowing crossing the op-
posing team’s goal line and scoring a point. On the other
hand the low-pointers, due to their functional limita-
tions, are almost as active as high-point counterparts
(2.0–2.5 points) playing without the ball. Assist block
seems to be an important parameter, which can contrib-
ute to further defining of parameters determining game
efficiency of 0.5–1.5 class players. Molik et al. [11] did
not analyze the number of assist blocks as they were not
considered to be a reliable parameter.
In terms of the number of turnovers (TO) significant
differences were found between all the study groups
apart from those between I and II, and III and IV. The
obtained results are confirmed by earlier studies show-
ing that the 0.5, 1.0 and 1.5 class wheelchair rugby play-
ers are usually blockers on the court, whereas players
representing classes 2.0, 2.5 and 3.0 and 3.5 are mostly
ball handlers and equally risk loss of ball possession.
Molik et al. [11] did not find any statistically significant
differences between the 1.5 (constituting a single group
of subjects with 1.0 players in the present study) and
2.0–2.5 class players.
The numbers of steals (ST), i.e. ball interceptions,
differed significantly only between players from group
I and players from groups III and IV. The high-pointers
are generally more predisposed to perform successful
steals on the court owing to their better functional grip
and trunk control. The surprising lack of differences
between the players from group II and players from
groups III and IV can be due to large differences in re-
sults in group II (x = 0.61, SD = 1.00). However, steals
tend to be more successful if performed by high-point
class wheelchair rugby players. Similar results were re-
ported by Molik et al. [11] in their analysis of steals.
It was also assumed that the level of game efficiency
would be determinate by player classification, i.e. high-
pointers (with greater functional abilities) would repre-
sent a higher level of game efficiency. The total analysis
of six parameters of game efficiency revealed a signifi-
cant impact of functional abilities on the efficiency of
players of all classes (with the exception of classes
0.5–1.5). A similar game efficiency level between the
low-point class players was not, however, significantly

HUMAN MOVEMENT
35
N. Morgulec-Adamowicz et al., Game efficiency in wheelchair rugby
correlated with their functional abilities. On the other
hand, the research results obtained should constitute an
important guideline to team coaches, who should use
similar training loads and tasks with the wheelchair
rugby players of classes 0.5–1.5. The study results reveal
a significant impact of functional abilities on game effi-
ciency of players of the other IWRF classes. The diverse
levels of game efficiency should be an indication to
wheelchair rugby coaches to continue further specializa-
tion of their players. It can be observed that three game
efficiency parameters (AS, PT, ST) show that high-
pointers tend to achieve a higher level of game efficien-
cy; however, some of the noted differences were not
confirmed statistically. The higher number of turnovers
(TO) points leads up rather to a higher activity level of
high-pointers as ball handlers than to a lower level of
game efficiency. The number of assist blocks (AB)
seems, in turn, to confirm a certain specialization of
low-point class players as blockers. The above analysis
of game efficiency parameters shows a similar number
of scored points and assist passes among the participants
in the European Championships and Paralympic Games.
The results in particular groups (based on players’ func-
tional abilities) were also similar. On the other hand,
high-point class wheelchair rugby athletes taking part in
the European Championships achieved more turnovers
and steals per game (1.75–2.94 and 3.05–5.01, respec-
tively) than the participants of the Paralympic wheelchair
rugby competition (0.76–1.18 and 2.35–2.84, respective-
ly). An unambiguous interpretation of these results is
rather difficult. The higher numbers of steals and turno-
vers at the European Championships can result from of-
fensive players’ own mistakes (e.g. wheelchair and ball
mishandling), which can be confirmed by the lower level
of training of European rugby wheelchair players. But it
can also be indicative of effective defense play of Euro-
pean athletes, whose active and creative play as well as
anticipatory skills make their opponents lose ball pos-
session more often on the court. This way it could also
be a confirmation of a higher level of game efficiency of
European wheelchair rugby players. In other words,
a clear and objective assessment of differences in game
efficiency, using the existing methods is not possible.
It should be kept in mind that following the statisti-
cal requirements for paired tests between groups I–IV
in post hoc analysis the level of statistical significance
for each Mann–Whitney test was set at p ≤ 0.002. It
then decreased the number of statistically significant
differences between the studied groups. At the same
time large standard deviations were noted for many pa-
rameters, which was indicative of a large differentiation
between results in particular groups (I–IV).
Conclusions
The above analysis of game efficiency of wheelchair
rugby players from different IWRF classes seems partic-
ularly important with regard to changes in the wheelchair
rugby rules introduced after the Beijing 2008 Paralym-
pics [25]. According to the new regulations, a team has
12 seconds to advance the ball from their back court into
the front court (15 seconds according to the old rules).
Also a team in possession of the ball has a total of 40 sec-
onds to score a point or concede possession (there are no
such stipulations in the old regulations). The new changes
are controversial since there is a certain risk that low-
point class players (0.5 and 1.0 points) might not be able
to take active part in offensive play within the designated
limit of 40 seconds and to maintain the dynamic pace
of the game. It may – in a sense – lead to some coaches’
“discrimination” against the low-pointers, for whom
a more optimal team on the court will comprise players
from classes 1.5–3.5. The new regulations can most likely
contribute to an increase in popularity of wheelchair
rugby low-point tournaments (classes 0.5–1.5), in which
the total classification value of all players on the court for
a team at one time cannot exceed three and half points. In
the long term it can lead to a split in the sport of wheel-
chair rugby. The new rules are also highly controversial
from the standpoint of the main principle of sports for
individuals with disability which should guarantee a
chance to participate in sports for athletes with different
types and severity of disability on equal terms. It should
also be remembered that wheelchair rugby was devel-
oped by athletes with cervical spinal cord injuries for
whom the pace of wheelchair basketball was too fast. The
increase in the attractiveness and dynamics of wheelchair
rugby resulting from the new rules could be made at the
expense of those for whom the game was originally de-
veloped. The game efficiency analysis of wheelchair
rugby athletes playing according to the new rules should
be an implication to undertake further research. Future
studies into game efficiency of athletes taking part in the
World Championships in Vancouver in 2010 and Paral-
ympics in London in 2012 according to the new rules
may bring some interesting results.
Another area of studies is assessment of team game
efficiency and determination of the most decisive pa-

HUMAN MOVEMENT
36
N. Morgulec-Adamowicz et al., Game efficiency in wheelchair rugby
rameters of sport success in present-day wheelchair
rugby at different competition levels. Differentiation of
certain technical and tactical actions seems necessary
as well. For example, a loss of ball possession can be
a result of player’s error or the opponent’s effective de-
fensive play. The solution to these problems, however,
requires further research allowing designing objective
game parameters involving praxeological criteria (effi-
ciency, reliability or economy) and expert opinions.
Acknowledgements
The study was supported by grant DS-127 from the Polish
Ministry of Science and Higher Education.
References
1. Maniak M., Evolution of classification systems [in Polish].
Sport niepełnosprawnych, 2002, 3, 20–23.
2. Skupniewski M., Groups and classes in disability sport [in
Polish]. Cross, 1997, 7–8, 25–28.
3. Paralympic Spirit, CD-ROM copyright by the Atlanta Paralym-
pic Organizing Committee and S.E.A Multimedia, 1996.
4. Morgulec N., Kosmol A., Physical activity in the rehabilitation
process of individuals with spinal cord injuries in the cervical
segments [in Polish]. AWF, Warszawa 2007, 129–130.
5. Dimsdale A., Beck A., Reserved for quads: The first U.S. quad
rugby championship. Sports’n Spokes, 1988, 14, 28–29.
6. Morgulec N., Skrzypczyk R., Development of wheelchair rug-
by and its influence on the functional abilities of quadriplegics.
Physical Education and Sport, 2003, 47 (4), 535–543.
7. Morgulec N., Lencse-Mucha J., Assessment of the sport spe-
cific skills of Polish National Team wheelchair rugby players in
2001 and 2003. In: Kuder A., Perkowski K., Śledziewski D.
(eds.), Process of training excellence and sport fight [in Polish].
AWF, Warszawa 2004, 277–282.
8. International Wheelchair Rugby Federation, IWRF Classifica-
tion Manual. Third edition, August 2008. Available from URL:
http://iwrf.com/classification.html.
9. Hislop H.J., Montgomery J., Daniels and Worthingham’s Mus-
cle Testing: Techniques of Manual Examination. WB Saunders,
Philadelphia 2007.
10. Malone L.A., Collins J.M., Orr K., Correlation between player
classification and skill performance in rugby. In: IPC (eds.),
Proceedings of the Vista Conference “Classification: Solution
for the Future”. May 6–7, 2006, Bonn, Germany, 26–27.
11. Molik B., Lubelska E., Kosmol A., Bogdan M., Yilla A., Hyla
E., An examination of the International Wheelchair Rugby
Federation Classification system utilizing parameters of offen-
sive game efficiency. Adapted Physical Activity Quarterly,
2008, 25 (4), 335–351.
12. Morgulec N., Kosmol A., Molik B., Sport special skills versus
classification system in wheelchair rugby. In: Żak S., Spieszny
M., Klocek T. (eds.), Team games in physical education and
sport [in Polish]. Studia i monografie, AWF, Kraków 2005, 33,
335–337.
13. Higgs C., Babstock P., Buck J., Parsons C., Brewer J., Wheel-
chair classification for track and field events: a performance
approach. Adapted Physical Activity Quarterly, 1990, 7 (1),
22–40.
14. Morgulec N., Kosmol A., Hübner-Woźniak E., Molik B.,
Rutkowska I., Anaerobic performance of upper limbs versus
classification system in wheelchair rugby. In: Kuder A.,
Perkowski K., Śledziewski D. (eds.), Process of training ex-
cellence and sport fight [in Polish]. AWF, Warszawa 2007,
219–222.
15. Pszczołowski T., Concise encyclopedia of practice and theory
of organization [in Polish]. PWN, Warszawa 1978, 219–220.
16. Panfil R., Praxeology of sports games. [in Polish] AWF,
Wrocław 2006, 138–148.
17. Vanlandewijck Y.C., Evaggelinou C., Daly D.D., Van Houtte S.,
Verellen J., Aspeslagh V. et al., Proportionality in wheelchair
basketball classification. Adapted Physical Activity Quarterly,
2003, 20 (4), 369–380.
18. Molik B., Kosmol A., In search of objective criteria in wheel-
chair basketball player classification. In: Doll-Tepper G., Krön-
er M., Sonnenschein W. (eds.), Vista ’99 – New horizons in
sport for athletes with a disability. Proceedings of the Vista ’99
International Conference, Köln, Germany. Meyer & Meyer
Sport, 2001, 355–368.
19. Vanlandewijck Y.C., Spaepen A.J., Lysens R.J., Relationship
between the level of physical impairment and sports perform-
ance in elite wheelchair basketball athletes. Adapted Physical
Activity Quarterly, 1995, 12 (2), 139–150.
20. Vanlandewijck Y.C., Evaggelinou Ch., Daly D.J., Verellen J.,
Van Houtte S., Aspeslagh V. et al., The relationship between
functional potential and field performance in elite female
wheelchair basketball players. Journal of Sports Sciences,
2004, 22 (7), 668–675. DOI: 10.1080/02640410310001655750.
21. Kuder A., Kosmol A., Pszczoła T., Morgulec N., Evaluation of
topography and attack effectiveness in volleyball for the disa-
bled. In: Sozański H., Perkowski K., Śledziewski D. (eds.), Ef-
fectiveness of training systems in different sports [in Polish].
AWF, Warszawa 2000, 222–225.
22. Jadczak Ł., Kosmol A., Śliwowski R., Wieczorek A., Wiec-
zorek J., Game efficiency of sitting volleyball athletes at Euro
Cup 2005. In: Kuder A., Perkowski K., Śledziewski D. (eds.),
Process of training excellence and sport fight [in Polish]. AWF,
Warszawa 2007, 231–234.
23. Morres I., Mustafin P., Katsis Ch., Koutsi E., Milanese Ch., Pa-
paioannou G. Sitting volleyball medical classification system.
Contradictions and recommendations towards the sport-specif-
ic classification principles. In: IPC (eds.), Proceedings of the
Vista Conference “Classification: Solution for the Future”. May
6–7, 2006, Bonn, Germany, 17–18.
24. Vute R., Scoring skills performances of the top international
men’s sitting volleyball teams. Gymnica, 1999, 29(2), 55–62.
25. International Wheelchair Rugby Federation, International Rules
for the Sport of Wheelchair Rugby. October 2008. Available
from URL: http://iwrf.com/rules.htm.
Paper received by the Editors: December 3, 2008.
Paper accepted for publication: May 28, 2009.
Address for correspondence
Natalia Morgulec-Adamowicz
Zakład Adaptowanej Aktywności Fizycznej
Wydział Rehabilitacji
Akademia Wychowania Fizycznego
ul. Marymoncka 34
00-968 Warszawa 45, Poland
e-mail: [email protected]
HUMAN MOVEMENT
37
Introduction
Running is one of the simplest forms of human
movement and the most natural way of experiencing
psycho-physical fatigue. During the last few decades
running has been commonly recognized as an effective
preventive measure against civilization diseases. For
many, running constitutes a permanent component of
a healthy lifestyle; for others, it is a way of life and satis-
factory leisure. Running is also a competitive sport. The
marathon races are now popular all over the world and
for the last few years they have been undergoing
a unique revival. The races are held in different loca-
tions, in rugged terrain or inclement weather (desert,
polar circle) and often arouse emotions hard to find at a
track and field stadium. The present-day marathons are
huge commercial sport and recreational spectacles in
which any healthy adult can take active part. Several
thousand people can participate at one time in a modern
marathon race. The attendance size determines the
prestige of each race. Marathon participants include
professional athletes and amateur joggers, the able-bodied
and the disabled, and the old and the young, all forming
together a diverse and colorful crowd [1].
The marathon is a foot race with an official distance
of 42 km 195 m. It is an intensive modern Olympic event
lasting a few hours. An ultramarathon is a sporting
event over the distance of 100 km. At present the Polish,
European and world ultranunning championships are
organized. The Poland’s National Athletics Federation
is the body which assigns sports classes to individual
runners for their results achieved at attested courses at
a 100 km distance.
Different types and forms of motor activity can af-
fect one’s health to a different degree. The healthiest
motor stimuli are endurance exercises of moderate in-
tensity, for example, jogging. An endurance exercise
imposes heavy demands on human organs and systems,
which determine one’s physical fitness [2] and health.
A high fitness level greatly facilitates one’s health po-
tential [3, 4]. Although most health training recommen-
dations focus on endurance exercises, their recom-
mended intensity is usually average or moderate [5].
There are no explicit data confirming a negative impact
of intensive training on the human body [6].
During foot races over distances longer than the tra-
ditional marathon length, the experience of competing
with one’s self, the weather or the distance surpasses the
experience of competing against the opponents. In ul-
tramarthon races the best runners can cover a 100 km
distance in 7 hours, while novice competitors may run it
for over 20 hours. Often the event organizers impose
DOI: 10.2478/v10038-010-0004-4
Paweł F. Nowak
Faculty of Physical Education and Physiotherapy, Opole University of Technology, Opole, Poland
ABSTRACT
Purpose. The aim of the study was to examine opinions of runners regarding the effects of ultra distance running on their health.
Basic procedures. The study sample was a group of 54 runners, participants of the Polish Supermarathon Championships in Kalisz.
The method of diagnostic poll was applied using author’s own questionnaire. Main findings. The majority of extreme distance
runners stated they experienced no health problems; keeping fit was their main motivation to run long distances and since taking up
running their health had improved. At the same time 36% of the interviewees admitted that running longer distances than the
marathon length may have a negative impact on their health. Conclusions. Proper understanding of the principles of amateur and
professional sport is the basis of safe physical activity. Amateur sport activity is correlated with a healthy lifestyle and positively
affects the physical and psychosocial aspects of health. Simple forms of motor activity should be popularized in Poland as well as
professional sport.
Key words: ultramarathon, running, amateur sport
ULTRA DISTANCE RUNNING IN VIEW OF HEALTH AND AMATEUR SPORT
2010, vol. 11 (1), 37–41

HUMAN MOVEMENT
38
P.F. Nowak, Ultrarunning in view of health and amateur sport
a 24-hour time limit (with the winner covering the most
distance in that time).
Long distance and marathon races are of profession-
al and – at the same time – amateur and recreational
character. The preparation of the runner’s body for such
an event is definitely a type of sport training rather than
health training. It is not clear whether an ultramarathon
can be explicitly classified as a competitive sport event
or extreme recreation. In the case of ultramarathon its
classification relies not so much on the type of activity
(sport or recreation) but rather on its psychosocial con-
text. Ultra runners display a variety of attitudes towards
their competition as well as different aims and motiva-
tions. The egalitarianism of long-distance running
events points to the mixed sport and recreational char-
acter of the contemporary, highly commercialized mass
foot races. According to Naglak, the marathons and
other long-distance races are non-classified. He defines
them as “activities aimed at perfecting one’s personality,
improving one’s health and physical fitness through ex-
ercise and competition. The effectiveness of these ac-
tivities depends on the durability of one’s psychical,
physical and motor dispositions. These activities consti-
tute a sport variety, whose growing popularity can
greatly contribute to physical activity becoming an in-
separable component of the way of life and physical
culture of the whole society” [7, p. 5]. In non-classified
sports the achieved results are of the athlete’s concern
only, and that is why these competitions lack all other
implications related to professional sport, e.g. financial.
What really counts is sheer participation in a race, over-
coming one’s weaknesses, and self-improvement. These
aspects are inherent in the Olympic idea.
The aim of the study was an analysis of opinions of
ultra runners concerning the health aspects of ultra dis-
tance running.
Material and methods
The study sample comprised a group of 54 male par-
ticipants of the 2001 Polish Supermarathon Champion-
ships in Kalisz held over the distance of 100 km. The
method of diagnostic poll was applied using the author’s
questionnaire. The subjects were asked about their
training experience, participation in ultra running races
and the effects of these races on their health (in their
subjective opinion). They were also asked whether run-
ning ultra long distances might, in their opinion, have
any negative effects on their health.
Results
Ultramarathons are egalitarian sports events open
to everyone. They do not require any expensive sports
equipment or special athletic skills. Each participant
must be over 18 years of age and is required to provide
his or her medical checkup results or a written state-
ment of consent and pay the registration fee. The
youngest participant was 23 years; the oldest 68 years
of age. Altogether 5 women and 54 men took part in
the Kalisz Supermarathon. In Poland, ultra distance
and marathon female runners are in minority (about
5–10% of all participants). The ultra runners compete
in different age categories (10-year ranges) set by the
Polish Running Association. Figure 1 presents the age
categories of the participants. The largest group (35%)
comprised male runners aged 40–49 years; the small-
est group consisted of competitors over 60 years of age
(4%). The youngest age category (18–29 years) com-
prised 13% of participants, i.e. fewer than in the cate-
gories of 30–39 and 50–59 years.
40
35
30
25
20
15
10
5
0
18–29 years
pe
rce
nt o
f pa
rtic
ipa
nts
(%
)
Figure 1. Age categories of participants of the Polish
Supermarathon Championships in Kalisz
30–39 years
40–49 years
50–59 years
60 yearsand more
age categories
Participation in ultra running events requires long-
term, systematic, daily training mostly aimed at the de-
velopment of the body’s aerobic capacity, i.e. running a
great many kilometers on a weekly, monthly and yearly
basis. In the study sample 39% of runners had been
training systematically for several years; 24% for over
20 years, and 7% for over 30 years (Figure 2). Only
4 participants had trained for 2 years, two of whom had
already participated in 100 km events, and for the other
two the Kalisz competition was the first ultra running
event in their life.
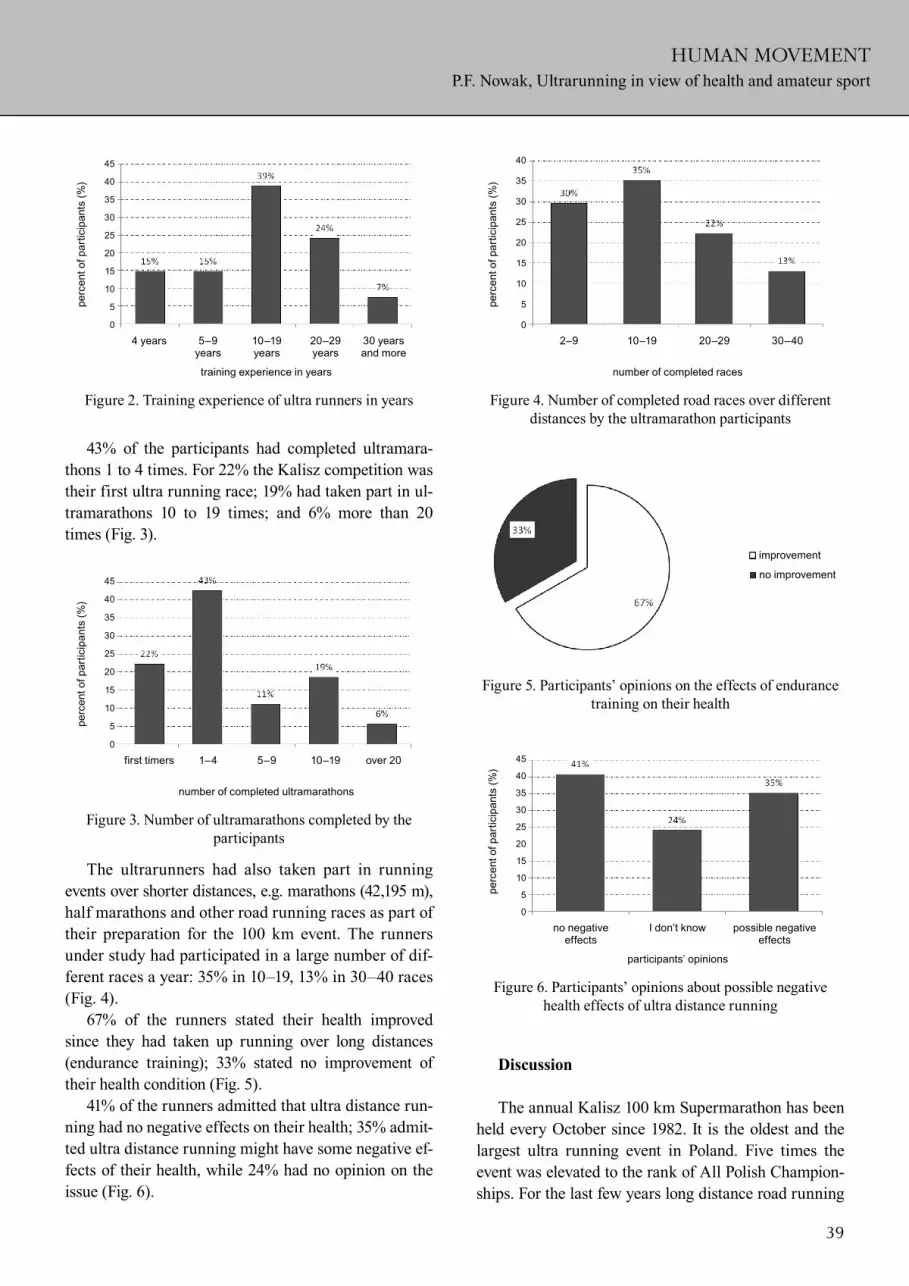
HUMAN MOVEMENT
39
P.F. Nowak, Ultrarunning in view of health and amateur sport
43% of the participants had completed ultramara-
thons 1 to 4 times. For 22% the Kalisz competition was
their first ultra running race; 19% had taken part in ul-
tramarathons 10 to 19 times; and 6% more than 20
times (Fig. 3).
Discussion
The annual Kalisz 100 km Supermarathon has been
held every October since 1982. It is the oldest and the
largest ultra running event in Poland. Five times the
event was elevated to the rank of All Polish Champion-
ships. For the last few years long distance road running
45
40
35
30
25
20
15
10
5
0
4 years
pe
rce
nt o
f pa
rtic
ipa
nts
(%
)
Figure 2. Training experience of ultra runners in years
5–9 years
10–19 years
20–29 years
30 yearsand more
training experience in years
45
40
35
30
25
20
15
10
5
0
first timers
pe
rce
nt o
f pa
rtic
ipa
nts
(%
)
Figure 3. Number of ultramarathons completed by the
participants
1–4 5–9 10–19 over 20
number of completed ultramarathons
The ultrarunners had also taken part in running
events over shorter distances, e.g. marathons (42,195 m),
half marathons and other road running races as part of
their preparation for the 100 km event. The runners
under study had participated in a large number of dif-
ferent races a year: 35% in 10–19, 13% in 30–40 races
(Fig. 4).
67% of the runners stated their health improved
since they had taken up running over long distances
(endurance training); 33% stated no improvement of
their health condition (Fig. 5).
41% of the runners admitted that ultra distance run-
ning had no negative effects on their health; 35% admit-
ted ultra distance running might have some negative ef-
fects of their health, while 24% had no opinion on the
issue (Fig. 6).
40
35
30
25
20
15
10
5
0
pe
rce
nt o
f pa
rtic
ipa
nts
(%
)
Figure 4. Number of completed road races over different
distances by the ultramarathon participants
2–9 10–19 20–29 30–40
number of completed races
Figure 5. Participants’ opinions on the effects of endurance
training on their health
improvement
no improvement
45
40
35
30
25
20
15
10
5
0
pe
rce
nt o
f pa
rtic
ipa
nts
(%
)
Figure 6. Participants’ opinions about possible negative
health effects of ultra distance running
no negative effects
I don’t know possible negative effects
participants’ opinions

HUMAN MOVEMENT
40
P.F. Nowak, Ultrarunning in view of health and amateur sport
events have become immensely popular in Poland,
mostly due to the rapid development of the Internet so-
cial networking services, which serve as invaluable
sources of information about runners, races and train-
ing methods.
The number of marathon runners in Poland has
been steadily on the rise. Each year the record number
of runners take part in marathon races in Polish cities,
e.g. 3,000 participants in the Warsaw and Poznań
marathons. A number of timed road running events
(12-hour and 24-hour races) is also organized every
year in Poland. The participants in 30, 40 and 50 km
road races are mostly men aged 35–50 years. The
completion of a 100 km race is regarded as a sports
victory and all successful participants are awarded
with commemorative medals. For many such a race is
an immense challenge and opportunity to test one’s
own body in extreme conditions. Top Polish ultra run-
ners cover the distance of 100 km under 7 hours (the
Polish record is currently 6 hours, 22 min and 33 sec).
Some need more than ten hours to finish a race. The
ultrarunners are usually former long-distance or mara-
thon runners who wish to prolong their sport career or
simply prove themselves over an ultra long distance.
With their experience and physical and psychical en-
durance training they willingly accept the ultra run-
ning challenge. The opportunity to accomplish an ex-
traordinary feat increases their satisfaction and is
a boost to their self-esteem. It is rather difficult to an-
swer the question why people are ready to undertake
the tremendous burden of intensive endurance training
in inclement weather and over a distance of 100 km.
Even the most experienced ultra runners, who devote
all their time and effort to the races and training, fail
to deliver a straight answer.
Is it then possible at all to discuss health aspects in the
context of ultra running? One can definitely point to the
aspect of a healthy lifestyle, but the question remains
whether ultra running endurance training can be consid-
ered health training? Ultra distance running is a dynamic
endurance exercise, with a cyclical structure of move-
ment involving large muscle groups. In health-related
physical activity the intensity of exercise should not ex-
ceed 85% of HR max. Participation in an ultra running
race involves huge energy expenditure and constitutes
a serious overload to the human motor system [8].
The marathons and ultramarathons are sports events
featuring a great variability of time results achieved by
athlete with relatively constant levels of physical fitness.
Improvement of these results is relatively easy even at
a later age. The result is not only determined by the
quality of the runner’s physical, psychical and coordina-
tion preparation but also by the race environment (sea-
son of the year, air temperature and humidity, atmos-
pheric pressure, course surface and obstacles, strength
tactics, consumption of fluids, strategies for completing
the race, etc.). The unique aspect of ultra distance races
is their organization outside the track and field stadium.
The course of the race often leads through several
towns in changing weather conditions, and the race it-
self may be several hours long.
The present study shows that the ultra runners have
been training systematically for many years and have
participated in a great number of racing events every
year. The majority of the participants state their health
has improved since they took up ultra running. Based
on their own experience and knowledge the majority of
the participants are of the opinion that ultrarunning has
not caused any harm to their health, however, some of
them have no opinion about this issue.
Different authors [2, 6] have noted that while strength,
coordination or speed training improves the function of
the neuromuscular system, endurance exercises mostly
enhance the function of the cardiovascular system, respi-
ratory system and cell and tissue metabolism.
As participation in ultrarunning races constitutes
a heavy load to the human body, it also involves a risk
of injuries and health deterioration. Certainly, a healthy
lifestyle and properly carried out systematic endurance
training do have a positive influence on one’s health
potential in its physical and psychosocial dimensions.
Regular physical activity (training) usually brings
about positive changes to one’s lifestyle. Health-oriented
behaviors constituting a healthy lifestyle, i.e. proper nu-
trition, avoidance of stimulants, good sleep, periodic
health examinations, are more frequently observed in
physically active persons [9].
The propagation of mass sports events, e.g. road
running events, seems an appropriate measure from the
standpoint of public health. The development of proper
(cautious) attitudes towards sports rivalry should be
supported in order to promote such principles of physi-
cal recreation as fun, discretion and disinterestedness.
Conclusions
1. The majority of ultra runners – participants in ex-
treme endurance races – stated they experienced no

HUMAN MOVEMENT
41
P.F. Nowak, Ultrarunning in view of health and amateur sport
health problems related to their activity. Their moti-
vation is maintaining good health, and since they
took up running their health has improved. 35% of
the participants under study expressed an opinion
that ultrarunning might have a negative impact on
one’s health.
2. The proper understanding of the principles of ama-
teur and professional sport is the basis of safe physi-
cal activity.
3. Participating in amateur sport and recreation events
is closely correlated with a healthy lifestyle, which
can exert a positive impact on one’s physical and
psychical health.
4. In Poland record-seeking sports as well as mass am-
ateur sports and different forms of health training
should be widely propagated.
References
1. Maciantowicz J., Nowak P., Running – an idea for a healthy life
[in Polish]. AWF, Wrocław 2002.
2. Kozłowski S., The limits of accommodation [in Polish]. PWN,
Warszawa 1986.
3. Drabik J., Physical activity of adults [in Polish]. AWF, Gdańsk
1996.
4. Drabik J., Physical activity, fitness and efficiency as health in-
dices [in Polish]. AWF, Gdańsk 1997.
5. Kuński H., Health training of adults [in Polish]. MEDSPORT-
PRESS, Warszawa 2003.
6. Jaskólski A., Motor activity as a determinant of health. In: Jas-
kólski A. (ed.), The rudiments of a physical exertion physiology
and outline of human physiology [in Polish]. AWF, Wrocław
2002, 340–358.
7. Naglak Z., The methodology of athlete training [in Polish].
AWF, Wrocław 1999.
8. Prus G., Cross-country, mountain, road and marathon races
training [in Polish]. BK, Katowice 2005.
9. Nowak P.F., Health training of women in the context of modern
lifestyle [in Polish]. PWSZ, Racibórz 2007.
Paper received by the Editors: April 23, 2009.
Paper accepted for publication: December 1, 2009.
Address for correspondence
Paweł F. Nowak
Katedra Metodyki Wychowania Fizycznego
Politechnika Opolska
ul. Prószkowska 76
45-758 Opole, Poland
e-mail: [email protected]
HUMAN MOVEMENT
42
2010, vol. 11 (1), 42–44
Introduction
“The objective of science is to measure what is
measurable, and make measurable what is not so” –
this programmatic postulate is assigned to Galileo
Galilei (1564–1642) and is almost generally accepted
in the scientific community [1]. Sanctuarius of Padua
(1561–1636) constructed a metabolism balance [2]. He
was named Iatrophysicist and he described metabo-
lism as a sign of life and underlined by this the impor-
tance of its measurement. Later Lavoisier (1743–1794)
measured metabolism of animals [3] by physical meth-
ods, and Carl Ludwig (1816–1895) invented in 1846
the Kymographion for recording and documenting
physiological processes [4, 5]. It was still used in 1968
in the author’s practical instructions for students of
physiology. Stemmler et al. [6] wrote on the front-page
of a textbook of statistics what Karl Marx (1818–1883)
had stated: “A science can only be regarded as fully
developed when it has reached the point where it can
make use of mathematics”. Altogether; objective
measurements and calculations are seen as a funda-
mental criterion of science.
But two central questions have not been answered:
1. What does “measure” mean? Only the determina-
tion of objective physical or chemical parameters
(for obtaining hard data) like Galilei’s experiments
about the law of gravity?
2. What do we do with those aspects which remain im-
measurable?
Searching for answers
Athletic fitness and health are very complex phe-
nomena, based on multiple personality traits. Some of
those are measurable with objective physical or chemical
methods. The followers of Galilei and others concentrate
their activities on such “objective” measurements and
tests, neglecting all other qualities which are immeasur-
able by their methods. This must lead to reductionism,
as described, e.g. by Yates [7]: “Biological systems are
complex by any definition of the term. Physics is
a strongly reductionist science, and has prospered in that
style; but conceptual biological sciences now suffer from
permeation by a mechanistic reductionism …”. There-
fore objective measurements and tests only lead to a fic-
titious validity of the “objective” results [8].
DOI: 10.2478/v10038-009-0024-0
Hans-Volkhart Ulmer
Institute of Sports Science, Johannes Gutenberg-University, Mainz, Germany
ABSTRACT
The sentence “measure what is measurable, and make measurable what is not so” (Galilei) can be seen as a postulate for using only
objective physical or chemical methods in science to obtain hard data. Athletic fitness and health are complex states, however,
including more than objective personality traits, described by hard data. Therefore, in the context of assessment of athletic fitness
and health the questions arose: What does “measure” mean and how important are data that are immeasurable? Hard data are
necessary, but not sufficient for assessment of all personality traits relevant for athletic fitness and health. Soft data are important as
well. “Measure” in the context of athletic fitness and health should not only be restricted to physical or chemical methods, but should
also include soft data, obtained by all systematic inside- and outside-observations using rating methods or only descriptions of
qualitative items. For interpretation of both hard and soft data experience is necessary: this step of scientific work includes subjectivity
in all cases. In order to gain experience, subjective methods must be trained, and this requires estimation of soft data and their
appertaining methods, too. In conclusion, “measure” in the context of athletic fitness and health should include all objective and
subjective methods for description of relevant personality traits.
Key words: assessment of athletic fitness, Galilei, objective data, subjective data, tests and reductionism, objectivity and validity
“OBJECTIVE MEASUREMENTS” AND “NON-OBJECTIVE OBSERVATIONS” AS METHODS FOR ASSESSMENT OF ATHLETIC FITNESS AND HEALTH
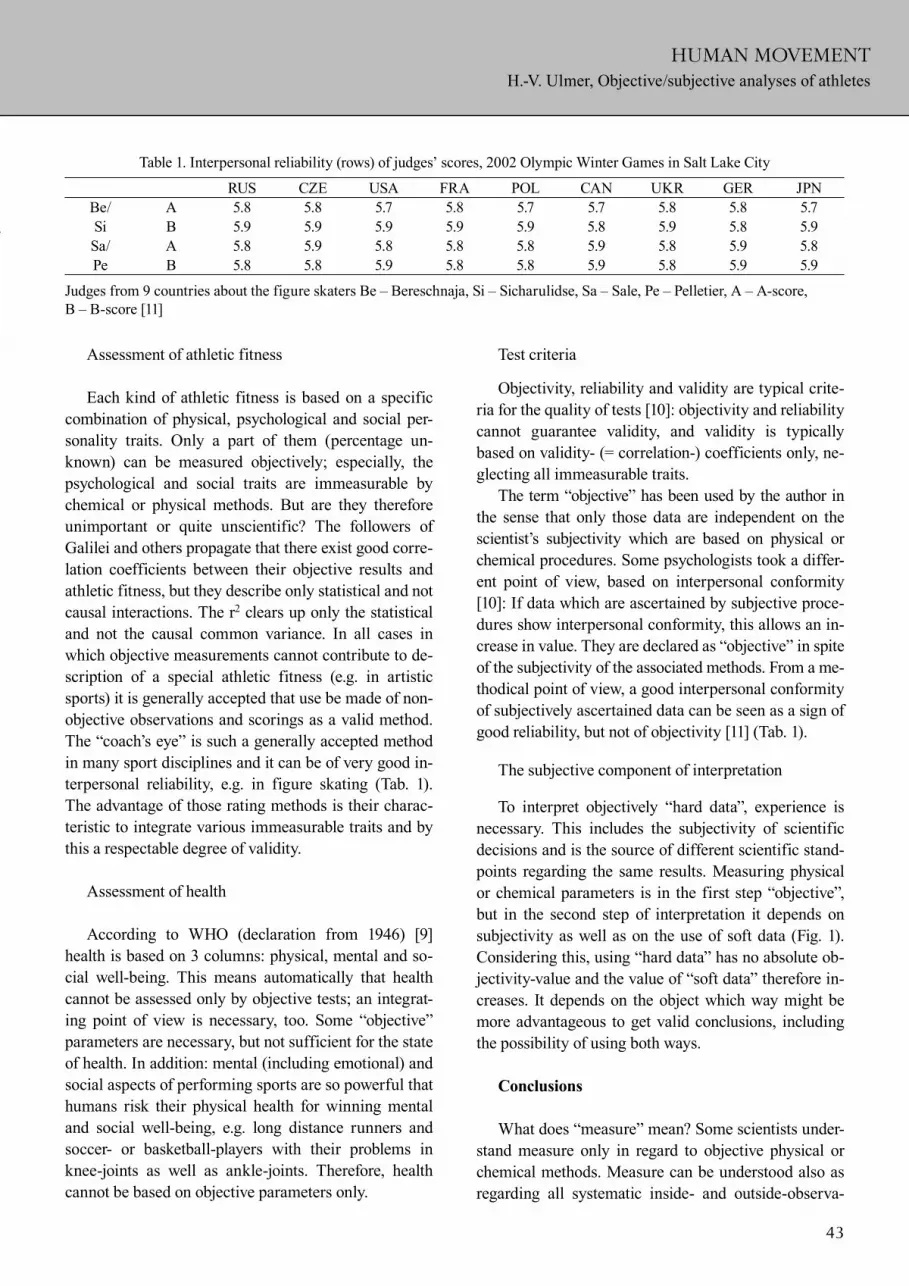
HUMAN MOVEMENT
43
H.-V. Ulmer, Objective/subjective analyses of athletes
Assessment of athletic fitness
Each kind of athletic fitness is based on a specific
combination of physical, psychological and social per-
sonality traits. Only a part of them (percentage un-
known) can be measured objectively; especially, the
psychological and social traits are immeasurable by
chemical or physical methods. But are they therefore
unimportant or quite unscientific? The followers of
Galilei and others propagate that there exist good corre-
lation coefficients between their objective results and
athletic fitness, but they describe only statistical and not
causal interactions. The r2 clears up only the statistical
and not the causal common variance. In all cases in
which objective measurements cannot contribute to de-
scription of a special athletic fitness (e.g. in artistic
sports) it is generally accepted that use be made of non-
objective observations and scorings as a valid method.
The “coach’s eye” is such a generally accepted method
in many sport disciplines and it can be of very good in-
terpersonal reliability, e.g. in figure skating (Tab. 1).
The advantage of those rating methods is their charac-
teristic to integrate various immeasurable traits and by
this a respectable degree of validity.
Assessment of health
According to WHO (declaration from 1946) [9]
health is based on 3 columns: physical, mental and so-
cial well-being. This means automatically that health
cannot be assessed only by objective tests; an integrat-
ing point of view is necessary, too. Some “objective”
parameters are necessary, but not sufficient for the state
of health. In addition: mental (including emotional) and
social aspects of performing sports are so powerful that
humans risk their physical health for winning mental
and social well-being, e.g. long distance runners and
soccer- or basketball-players with their problems in
knee-joints as well as ankle-joints. Therefore, health
cannot be based on objective parameters only.
Test criteria
Objectivity, reliability and validity are typical crite-
ria for the quality of tests [10]: objectivity and reliability
cannot guarantee validity, and validity is typically
based on validity- (= correlation-) coefficients only, ne-
glecting all immeasurable traits.
The term “objective” has been used by the author in
the sense that only those data are independent on the
scientist’s subjectivity which are based on physical or
chemical procedures. Some psychologists took a differ-
ent point of view, based on interpersonal conformity
[10]: If data which are ascertained by subjective proce-
dures show interpersonal conformity, this allows an in-
crease in value. They are declared as “objective” in spite
of the subjectivity of the associated methods. From a me-
thodical point of view, a good interpersonal conformity
of subjectively ascertained data can be seen as a sign of
good reliability, but not of objectivity [11] (Tab. 1).
The subjective component of interpretation
To interpret objectively “hard data”, experience is
necessary. This includes the subjectivity of scientific
decisions and is the source of different scientific stand-
points regarding the same results. Measuring physical
or chemical parameters is in the first step “objective”,
but in the second step of interpretation it depends on
subjectivity as well as on the use of soft data (Fig. 1).
Considering this, using “hard data” has no absolute ob-
jectivity-value and the value of “soft data” therefore in-
creases. It depends on the object which way might be
more advantageous to get valid conclusions, including
the possibility of using both ways.
Conclusions
What does “measure” mean? Some scientists under-
stand measure only in regard to objective physical or
chemical methods. Measure can be understood also as
regarding all systematic inside- and outside-observa-
Table 1. Interpersonal reliability (rows) of judges’ scores, 2002 Olympic Winter Games in Salt Lake City
RUS CZE USA FRA POL CAN UKR GER JPN
Be/ A 5.8 5.8 5.7 5.8 5.7 5.7 5.8 5.8 5.7
Si B 5.9 5.9 5.9 5.9 5.9 5.8 5.9 5.8 5.9
Sa/ A 5.8 5.9 5.8 5.8 5.8 5.9 5.8 5.9 5.8
Pe B 5.8 5.8 5.9 5.8 5.8 5.9 5.8 5.9 5.9
Judges from 9 countries about the figure skaters Be – Bereschnaja, Si – Sicharulidse, Sa – Sale, Pe – Pelletier, A – A-score,
B – B-score [11]

HUMAN MOVEMENT
44
H.-V. Ulmer, Objective/subjective analyses of athletes
Figure 1. The two possibilities of getting conclusions about
an object or situation. Left: using methods for soft data,
right: using methods for hard data. In both cases subjectivity
is included
OBJECT/SITUATION
Conclusion
INTERVIEW/
OBSERVATION
subjective
qualitative
integrating
��������� �
��� ���������
MEASUREMENT
objective
quantitative
reducing
��������������subjective subjective
tions using rating methods or only descriptions of quali-
tative items.
What do we do with those personality traits which
remain immeasurable by physical or chemical methods?
Both objective (“hard”) data and subjective (“soft”)
data may help to assess special athletic fitness and state
of health as well. But objective data reflect only those
traits which are measurable in a strict sense, whereas
a remarkable part of relevant traits are immeasurable by
physical or chemical methods and this includes a reduc-
tionist way, if only hard data are interpreted. Subjective
(“soft”) data can include immeasurable, relevant traits
with high reliability and validity if the experience of the
observer is sufficient. In consequence, each sport scien-
tist should not only appreciate objective “hard” data, but
also the subjective “soft” data: no blind confidence in
objective data!
These considerations are conceived as a pleading to
appreciate the integrating aspect of subjective data, if ex-
perience of the observer is sufficient. Therefore, it is ne-
cessary to train these subjective methods and to accept
their results as well as those from objective methods.
Trickery is possible with objective methods as well
as with subjective methods, the subjectivity of soft data
cannot be declared as a disadvantage in principle.
Therefore, “measure” in the context of a special ath-
letic fitness and health should not be restricted on objec-
tively measurable, i.e. by physical or chemical methods,
personality traits. “Non-objectively” ascertained traits
are relevant, too. Assessment of a special athletic fitness
should include all objective and subjective methods for
the description of relevant personality traits.
References
1. Riuz Mariscal A.M., To measure what information is measura-
ble, 2005. Available from: URL: http://www.mdpi.org/fis2005/
F.55.paper.pdf (20.1.2009).
2. Brunner P.H., Rechberger H., Practical Handbook of Material
Flow Analysis. CRC Press, London 2003. Available from:
URL: http://books.google.de/books?id=LSiVFMTgvLgC&pg
=PA1&source=gbs_toc_r&cad=0_0#PPA6,M1 (20.1.2009).
3 Weisstein E.W., Lavoisier Antoine (1743–1794), From Eric
Weisstein’s World of Scientific Biography, 1996–2007. Availa-
ble from: URL: http://scienceworld.wolfram.com/biography/
Lavoisier.html (20.1.2009).
4. Reiser S.J., Medicine and the Reign of Technology. Cambridge
University Press, 100-101, 1981. Excerpt available from: URL:
http://books.google.de/books?id=hwz_eQvn7PMC&pg=PA10
0&lpg=PA100&dq=Carl+Ludwig+Kymographion&source=bl
&ots=ANf-TeWbrW&sig=1S1uZteuHvrWMRQjQTL3UyPw13
o&hl=de&sa=X&oi=book_result&resnum=6&ct=result#PPA
100,M1 (20.1.2009).
5. Ulmer H.-V., The 150 anniversary of the Kymographion: how
to handle hard and soft data [in German] 1996. Available from:
URL: http://www.uni-mainz.de/FB/Sport/physio/pdffiles/281ky-
mograph.pdf (20.1.2009).
6. Stemmler R., Decher H., Reichstein G., Steglich W., Statistical
methods in sports [in German]. Sportverlag, Berlin 1980.
7. Yates F.E., Self-organizing systems. In: Boyd C.A.R., Noble D.
(eds.), The Logic of Life. Oxford University Press, Oxford
1993, 189–218.
8. Ulmer H.-V., Complexity of athletic fitness with regard to se-
lection and talent prognosis by a physiological viewpoint. Med
Sportiva 2004, 8, 45–51. Available from: URL: http://www.uni-
mainz.de/FB/Sport/physio/376auswahl.html (20.1.2009).
9. WHO – World Health Organization, Constitution of the World
Health Organization. Basic Documents. Forty-fifth edition,
Supplement, 2006. Available from: URL: http://www.who.int/
governance/eb/who_constitution_en.pdf.
10. Lienert G.A., Raatz U., Testconstruction and testanalysis [in
German]. Beltz – Psychologie Verlags Union, Weinheim 1998.
11. Kimminus K., Berwanger A., Ulmer H.-V., About the interper-
sonal conformity of A- and B-score (figure skating) in an ex-
perimental situation [in German]. Sportwissenschaft, 2002, 32,
439–444. Available from: URL: http://www.uni-mainz.de/
FB/Sport/physio/pdffiles/353KIMMINUS_AB-Note02.pdf
(20.1.2009).
Paper received by the Editors: February 11, 2009.
Paper accepted for publication: July 24, 2009.
Address for correspondence
Prof. Dr. med. Hans Volkhart Ulmer
Institute of Sports Science
Johannes Gutenberg-University Mainz
Saarstraße 21, D 55099 Mainz, Germany
e-mail: [email protected]

HUMAN MOVEMENT
45
Introduction
Worldwide, more than one billion adults present ex-
cess body fat and at least 300 million of them are obese
[1]. In Brazil, about 43% of the adult population is esti-
mated to present some degree of excess body fat, with
11% of severe cases [2]. Excess body fat contributes to
the development of different risk factors related to car-
diovascular diseases. In addition, excess body fat repre-
sents a constant overload which puts an extra workload
on the heart [3].
Studies have indicated that men with a relative body
fat (%BF) above 19% are at a higher risk for the develop-
ment of nontransmissible chronic diseases such as heart
diseases, strokes [4–6], hypertension [7], dyslipidemias,
diabetes mellitus, atherosclerosis [8–10], gallstones, neo-
plasms, and liver diseases, among others [11]. Thus, the
following important factors should be monitored for the
evaluation of the development of these diseases: a rise in
systolic and diastolic blood pressure, fasting glycemia,
total cholesterol (TC), low-density lipoprotein (LDL),
triglycerides (TG), atherogenic index (AI) and athero-
genic cholesterol, in addition to a decrease in high-densi-
ty lipoprotein (HDL) concentrations.
Individuals presenting some degree of obesity (%BF
>30) and an android profile of body fat distribution (to-
pography) characterized by greater fat deposition in the
central region of the body are at a higher risk of develop-
ing cardiovascular diseases [6, 12]. To classify these car-
diovascular risks resulting from excess body fat, some
studies have used indicators such as body mass index
(BMI), waist-to-hip ratio (WHR), body circumference
[8, 12–14] and body fat topography [4, 6, 10]. However, it
remains to be determined whether variations in these risk
factors indeed exist with increasing %BF stores (%BF ≤
19: healthy; %BF > 19 and %BF < 30: overweight, and
%BF ≥ 30: obesity). This %BF classification is based on
conclusions reported in different studies [2, 5, 8, 11, 13].
Therefore, the objective of the present study was to
determine whether risk factors for cardiovascular dis-
DOI: 10.2478/v10038-009-0022-2
Maria Fátima Glaner1*, William Alves Lima1, Zbigniew Borysiuk2 1 Post-Graduate Physical Education Program, Catholic University of Brasília, Brasília, DF, Brazil
2 Faculty of Physical Education and Physiotherapy, Opole University of Technology, Opole, Poland
ABSTRACT
Purpose. To determine whether risk factors for cardiovascular diseases (anthropometry, blood pressure, blood lipid profile) differ
between men classified into the three relative body fat %BF categories (%BF � 19: healthy; %BF > 19 and %BF < 30: overweight, and
%BF � 30: obesity). Basic procedures. A total of 112 volunteers from Brasília, Brazil, were submitted to the measurement of body
weight, height and waist, abdominal and hip circumference. The body mass index (BMI) and waist-to-hip ratio (WHR) were
calculated. %BF and body fat topography (arm, leg and trunk %BF) were estimated by dual-energy X-ray absorptiometry (DXA).
Blood pressure was measured by auscultation and blood variables were determined by an enzymatic method. Univariate analysis of
variance, one-way analysis of variance and the Scheffé post hoc test were used for statistical analysis (p < 0.05). Main findings. The
three %BF groups differed significantly in terms of body weight and body circumference measures, with higher mean values being
observed the higher the %BF. Fasting glycemia and high-density lipoprotein did not differ between groups, indicating the interference
of other factors. BMI, WHR, blood pressure, total cholesterol, low-density lipoprotein, triglycerides, atherogenic index and
atherogenic cholesterol were statistically similar in the overweight and obese groups and differed significantly from the healthy
group. Conclusions. Abdominal, waist, hip circumference and body fat topography (arm, leg and trunk %BF) differ between the three
%BF groups. None of the blood variables differed significantly between the overweight and obese groups. The cutoff %BF > 19
(measured by DXA) seems to be a good parameter to indicate cardiovascular risk factors in men.
Key words: anthropometry, body fat, coronary disease, DXA, HDL, LDL
BODY FAT DEPOSITION AND RISK FACTORS OF CARDIOVASCULAR DISEASES IN MEN
2010, vol. 11 (1), 45–50
* Corresponding author.

HUMAN MOVEMENT
46
M.F. Glaner, W.A. Lima, Z. Borysiuk, Body fat and cardiovascular risk
eases (anthropometry, blood pressure, blood lipid pro-
file) differ between men classified into the three %BF
categories (healthy, overweight and obese).
Material and methods
Subjects
The sample consisted of 112 adult men living in
Brasília, DF, Brazil. All participants were employees of
the same metallurgy company but performed different
functions (workers and administrators). The study was
approved by the Ethics Committee of the Catholic Uni-
versity of Brasília. The volunteers signed a free in-
formed consent form containing detailed information
regarding the type, conditions and place of data collec-
tion and an authorization for the use of their data in sci-
entific publications.
Variables
The following variables were measured on the first
day of data collection: body weight, height, waist cir-
cumference (WC) 2.5 cm above the umbilical scar, ab-
dominal circumference over the umbilical scar and hip
circumference (HC) in the most prominent portion of
the greater trochanters. BMI and WHR were calculated
using the following formulas: BMI = weight (kg) /
height2 (m) and WHR = WC / HC (cm).
Whole body fat and body fat topography (arm, leg
and trunk %BF) were estimated by dual-energy X-ray
absorptiometry (DXA). A whole-body scan was per-
formed with a Lunar DPX-IQ apparatus (software ver-
sion 4.7e) according to manufacturer’s instructions.
After the end of this procedure, the volunteers re-
mained in the supine position for the measurement of
systolic and diastolic blood pressure in the left arm by
auscultation using a stethoscope and an aneroid sphyg-
momanometer.
On the second day, a venous blood sample was col-
lected between 6:00 and 8:00 am after a minimum fast-
ing period of 12 h for the quantification of plasma glyc-
emia, TC, HDL, and TG. These variables were meas-
ured by a colorimetric enzymatic method using Doles
kits in a semiautomatic BIO-2000 spectrophotometer
(Bioplus®). LDL was estimated using the formula of
Friedewald et al. [15]: LDL = ((TG / 5) + HDL) – TC).
In addition, the AI was estimated using the formula AI
= TC / HDL [9, 13]. The higher the amount of LDL and
very low-density lipoprotein (VLDL) in relation to
HDL, the higher the chances of developing atheroscle-
rotic disease [13]. The concentration of atherogenic
cholesterol (AC) was calculated by the formula AC =
TC – HDL, since TC corresponds to the sum of HDL +
LDL + VLDL [16, 17].
After data collection, the sample was divided into
groups by %BF and age: %BF ≤ 19 (n = 53) classified
as healthy and characterized as subjects at a lower risk
for cardiovascular diseases, %BF > 19 and %BF < 30
(n = 44) classified as overweight, %BF ≥ 30 (n = 15)
classified as obesity; age 40 years old, and age > 40
years old.
Statistical analysis
Descriptive variables are reported as mean, standard
deviation and range. With %BF as the dependent varia-
ble, was performed a univariate analysis of variance on
the independent variables %BF groups and age groups.
The results in terms of main effects showed that there is
no interaction between %BF groups and age groups.
Therefore, the one-way analysis of variance was used to
compare %BF groups. The post hoc Scheffé test was
adopted to localize possible differences (p < .05).
Results
A wide variation in minimum and maximum values
was observed for age, body weight, height, BMI, body
circumference measures and %BF, characterizing the
heterogeneity of the sample (Tab. 1).
The age has no significant effect on %BF and there
was no interaction between %BF groups and age groups
(Tab. 2).
The anthropometric variables according to the accu-
mulation of %BF are presented in Tab. 3. Height was
Table 1. Descriptive characteristics of the 112 adult men
participating in the study
Variables Mean ± SD Range
Age (years) 34.1 ± 9.0 20–55
Body weight (kg) 71.7 ± 10.2 51.7–95.0
Height (cm) 168.4 ± 7.0 152.0–189.0
Body mass index (kg/m2) 25.3 ± 3.1 17.8–33.6
Waist circumference (cm) 85.6 ± 9.1 67.5–103.0
Abdominal circumference (cm) 86.9 ± 9.5 54.7–106.0
Hip circumference (cm) 93.5 ± 6.2 77.0–109.3
Relative body fat 20.0 ± 8.3 6.0–31.7
SD – standard deviation

HUMAN MOVEMENT
47
M.F. Glaner, W.A. Lima, Z. Borysiuk, Body fat and cardiovascular risk
Table 2. Relative body fat (%BF) in the two age groups
%BF group Age group Mean ± SD
%BF ≤ 19 ≤ 40 years (n = 46) 12.3 ± 3.9
> 40 years (n = 7) 13.9 ± 3.4
Total (n = 53) 12.5 ± 3.8
%BF > 19 and %BF < 30 ≤ 40 years (n = 26) 24.1 ± 3.1
> 40 years (n = 18) 26.2 ± 2.2
Total (n = 44) 24.9 ± 3.0
%BF ≥ 30 ≤ 40 years (n = 13) 32.5 ± 2.0
> 40 years (n = 2) 31.8 ± 1.4
Total (n = 15) 32.4 ± 1.9
Total ≤ 40 years (n = 85) 19.0 ± 8.5
> 40 years (n = 27) 23.4 ± 6.4
Total (n = 112) 20.0 ± 8.3
SD – standard deviation
%BF group: F test = 145.4 (p = 0.000), observed power = 1
Age group: F test = 1.1 (p = 0.304), observed power = 0.176
Interaction %BF group × age group: F test = 0.611 (p = 0.545), observed power = 0.150
Table 5. Blood variables in the three relative body fat (%BF) groups
Variables %BF ≤ 19 %BF > 19 and %BF < 30 %BF ≥ 30
Fasting glycemia (mg/dL) 91.2a ± 10.0 96.8a ± 21.3 94.5a ± 6.7
Total cholesterol (mg/dL) 147.3a ± 28.4 174.7b ± 40.9 188.4b ± 29.8
High-density lipoprotein (mg/dL) 41.9a ± 12.5 36.5a ± 8.6 36.1a ± 7.8
Low-density lipoprotein (mg/dL) 84.1a ± 26.7 105.0b ± 41.1 120.2b ± 26.6
Triglycerides (mg/dL) 109.8a ± 71.0 168.4b ± 91.6 164.3b ± 72.4
Atherogenic index 3.8a ± 1.5 5.1b ± 1.8 5.4b ± 1.3
Atherogenic cholesterol (mg/dL) 109.1a ± 35.8 143.5b ± 49.2 153.1b ± 29.2
Data are reported as mean ± standard deviation
Means followed by the same letter did not differ significantly (p > .05)
Table 3. Anthropometric variables in the three relative body fat (%BF) groups
Variables %BF ≤ 19 %BF > 19 and %BF < 30 %BF ≥30
Body weight (kg) 65.2a ± 8.5 75.9b ± 7.5 82.2c ± 6.1
Height (cm) 168.7a ± 6.8 167.1a ± 7.2 171.0a ± 6.4
Body mass index (kg/m2) 22.9a ± 2.2 27.3b ± 2.0 28.1b ± 2.2
Waist circumference (cm) 77.9a ± 5.6 91.5b ± 5.3 95.2c ± 3.6
Abdominal circumference (cm) 79.1a ± 6.6 92.6b ± 5.6 97.4c ± 3.5
Hip circumference (cm) 89.6a ± 4.8 96.0b ± 5.1 100.1c ± 3.7
Waist-hip ratio 0.88a ± 0.06 0.97b ± 0.04 0.97b ± 0.04
Data are reported as mean ± standard deviation
Means followed by the same letter did not differ significantly (p > .05)
Table 4. Blood pressure and body fat topography in the three relative body fat (%BF) groups
Variables %BF ≤ 19 %BF > 19 and %BF < 30 %BF ≥ 30
SBP (mmHg) 124.0a ± 11.2 133.6b ± 17.3 141.0b ± 20.0
DBP (mmHg) 78.4a ± 11.0 90.0b ± 12.8 93.3b ± 13.3
% Arm fat 6.7a ± 2.4 15.4b ± 3.6 19.4c ± 3.2
% Leg fat 12.6a ± 3.8 23.6b ± 4.0 32.3c ± 4.0
% Trunk fat 14.0a ± 4.8 28.0b ± 4.7 36.4c ± 1.9
%BF 12.5a ± 3.8 24.9b ± 3.0 32.4c ± 1.9
SBP – systolic blood pressure, DBP – diastolic blood pressure
Data are reported as mean ± standard deviation
Means followed by the same letter did not differ significantly (p > .05)

HUMAN MOVEMENT
48
M.F. Glaner, W.A. Lima, Z. Borysiuk, Body fat and cardiovascular risk
similar in the three groups. Body weight and the body
circumference parameters differed significantly be-
tween the three groups. In contrast, BMI and WHR
were statistically similar in the overweight and obese
groups and differed significantly from the healthy
group. The overweight and obese groups were also
similar in terms of systolic and diastolic blood pressure.
Body fat topography and %BF differed significantly
between the three groups (Tab. 4).
With respect to the blood variables, fasting glycemia
and HDL did not differ significantly between the three
%BF groups. Atherogenic cholesterol, TC, LDL, TG
and AI were statistically similar in the overweight and
obese groups and differed significantly from the healthy
group (Tab. 5).
Discussion
Several lines of evidence indicate that excess body
fat promotes the development of non-transmissible
chronic diseases and risk factors for cardiovascular dis-
eases [1, 2, 6–8, 10], and that %BF is affected by age,
sex, body build and level of physical fitness [18]. In this
study, it was shown that there is no interaction between
%BF groups and age groups, and that age has no sig-
nificant effect on %BF. This can be explained by the
rise in worldwide obesity and/or overweight [1, 2] and
in Brazilian children and adolescents [19, 20]. Thus, in
view of the practicality of BMI for the classification of
subjects into underweight, healthy weight, overweight
or obesity, this parameter has become one of the indices
most often used worldwide for this purpose [12, 13].
However, its main utility is to facilitate the comparison
and interpretation of body weight estimates standard-
ized for height based on the assumption that excess
body weight corresponds to large amounts of stored
body fat [21]. However, it should be emphasized that
BMI does not distinguish between body mass compo-
nents (fat, muscle and bone mass), a fact requiring
greater care when using this index as an indicator of
adiposity. Although not discriminatory for true amounts
of body fat, BMI can be a good epidemiological marker
[22]. This affirmation seems to agree with the present
results since BMI did not differ significantly between
overweight and obese subjects (Tab. 3), indicating an
important classification error that might assign obese
individuals to a less worrisome condition and thus delay
appropriate treatment.
With respect to the lack of a significant difference in
the WHR between the overweight and obese groups, one
may speculate that, although the mean difference in waist
and hip circumference between the two groups was ap-
proximately 6 and 5 cm, respectively (Tab. 3), the mathe-
matical equation adopted masked this difference. Since
the ratio of these measures generates values close to 1.0,
very close results are obtained and no statistical diffe-
rence might be observed. Thus, waist and/or abdominal
circumference analyzed separately might be better pre-
dictors of the risk for cardiovascular diseases since in the
present sample these measures differed between the three
%BF groups. In this respect, the WHR loses its expres-
siveness for overweight or obese individuals (Tab. 3).
This conclusion agrees with the results reported in other
studies which also emphasized that waist and abdominal
circumference alone are better indicators of the develop-
ment of cardiovascular risk [12, 13, 18, 23]. Although
these measures are not related to height, they are still
a better parameter of excess fat in the abdominal region.
Analysis of body fat topography showed that fat ac-
cumulated in the trunk and body segments increased
concomitantly with increasing %BF. In addition, the
amount of trunk fat predominated compared to the oth-
er body fat deposits, a fact emphasizing the android pat-
tern of body fat distribution, irrespective of %BF clas-
sification (Tab. 4). Greater trunk-fat mass was associat-
ed with unfavorable values of most cardiovascular
disease risk [24].
No difference in systolic or diastolic blood pressure
was observed between the overweight and obese groups,
in agreement with other studies [7, 25]. This finding
may indicate that the simple state of overweight is suf-
ficient for a blood pressure rise. As a result of physio-
logical adaptations of an organism, the process of blood
pressure increases and then becomes slower and is sub-
ject to lifestyle, dietary habits and the use of pharmaco-
logical drugs [11, 21].
Despite discussions regarding the existence of
a strong positive association between arterial hyperten-
sion and obesity [7, 25], the present results (Tab. 4)
show that a state of overweight is already an aggravat-
ing factor for high blood pressure. The state of obesity,
however, will render the process of weight loss more
time consuming and difficult, with a consequent in-
crease in the duration of installed hypertension. This
fact, together with an increase in the concentrations of
blood risk factors, may accelerate the development of
cardiovascular diseases.

HUMAN MOVEMENT
49
M.F. Glaner, W.A. Lima, Z. Borysiuk, Body fat and cardiovascular risk
Among the blood variables studied, fasting glycemia
did not differ significantly between the three groups,
demonstrating that, on average, the volunteers presented
no problems of decompensation, irrespective of the
amount of %BF. Changes in fasting glycemia generally
tend to occur with a concomitant increase of lipid blood
variables (TC, LDL and TG) above reference values [10,
13], a fact generally not observed in the present sample.
High total fat mass and lower trunk-fat mass cannot be
explained by insulin sensitivity [24] and, fasting glyce-
mia was not predicted by total or regional %BF [4].
On average, TC and LDL did not exceed the border-
line reference values (200 mg/dL and 130 mg/dL, re-
spectively) for the desired fasting concentration [13].
However, overweight and obese subjects were statisti-
cally similar but differed significantly from the healthy
group. Higher TC and LDL concentrations are observed
during the period of installation of the state of over-
weight or obesity. This condition may stabilize over
time and the organism tends to potentiate the uptake of
LDL into adipose tissue by an increase in the number of
receptors, consequently reducing TC [26]. This fact
would explain the lack of difference between over-
weight and obese subjects.
In view of the cross-sectional character of the
present study, we do not know for how long the subjects
were sustaining the current amounts of %BF. A longitu-
dinal follow-up of the sample would be necessary for
further conclusions as done by Mansur et al. [27], who
emphasized that the longer the time a subject is obese,
the greater the chances of developing atheroma plaques
because of the subsequent inability to remove choles-
terol and TG from blood.
In the present study, on average, the healthy group
did not exceed the desired TG concentration of 150 mg/
dL, in contrast to overweight and obese subjects. The
lack of difference in TG between the last two groups
might be explained by the fact that this parameter is
only partially influenced by %BF and is better ex-
plained by genetic factors, dietary habits and level of
physical activity, among others [8]. Similarly, HDL con-
centration highly depends on genetic factors and the
level of physical activity and is poorly influenced by the
accumulation of body fat [16, 17]. Therefore, this varia-
ble probably did not show significant differences be-
tween the three %BF groups.
In contrast to the healthy group, overweight and
obese volunteers presented an AI above the reference
value: > 4.5 [9, 13], but did not differ from one another.
This finding indicates that the presence of excess body
fat was sufficient to increase the AI in this sample. One
of the main consequences of an increased AI is the fa-
cilitation of the formation of atheroma plaques due to
excess circulating LDL compared to HDL. This fact
also indicates that, although TC and LDL did not exceed
their tolerable borderline values, the balance between
LDL and HDL was not acceptable, demonstrating the
need for interventions to regulate these concentrations.
In this case, nonpharmacological treatment should in-
clude a specific diet and regular systematic physical
exer cise adapted to the needs of each individual [11].
Although, on average, atherogenic cholesterol (Tab. 5)
did not exceed the borderline reference value (<160 mg/
dL) [16, 17], a significant increase in this parameter was
observed for overweight and obese subjects compared
to individuals with healthy %BF. These two groups
were also found to be highly heterogenous, indicating
the presence of subjects in whom atherogenic cholester-
ol exceeded the reference value, in partial agreement
with other studies [16, 17]. It should be emphasized that,
even when LDL concentrations are within acceptable
limits, they might be high in relation to HDL which, ac-
cording to lifestyle, may result in the future formation
of atheroma plaques. This applies to both atherogenic
cholesterol and AI. Thus, the ideal would be to increase
HDL concentrations and to reduce LDL levels. Accord-
ing to some studies [16, 17], the best way to achieve this
goal is the implementation of a systematic aerobic train-
ing program.
Limitations of the present study were its cross-sec-
tional character (which does not permit the determi-
nation of how long the volunteer was sustaining the
current %BF) and the use of a semiautomatic spectro-
photometer (which is less accurate than an automatic
one). However, various medium- and small-size labora-
tories in Brazil use this instrument for the diagnosis of
biochemical factors such as those studied here. Another
limitation is the fact that we did not evaluate the life-
style of the volunteers in order to identify subjects pre-
senting greater risk behaviors for the development of
cardiovascular diseases.
Conclusions
In conclusion, among the anthropometric variables,
abdominal, waist, hip circumference and body fat topog-
raphy (arm, leg and trunk %BF) differs between the
three %BF groups. None of the blood variables differed

HUMAN MOVEMENT
50
M.F. Glaner, W.A. Lima, Z. Borysiuk, Body fat and cardiovascular risk
significantly between the overweight and obese groups,
demonstrating that an increase of %BF itself above
healthy levels is a source of concern that should be taken
into account even before the onset of obesity. The cutoff
%BF > 19 (measured by DXA) seems to be a good pa-
rameter to indicate cardiovascular risk factors in men.
References
1. World Health Organization. Obesity and overweight. Global
strategy on diet, physical activity and health, 2003. Available
from: URL: http://www.who.int/hpr/NPH/docs/gs_obesity.pdf.
2. Brazilian Ministry of Health. Vigitel Brazil 2006: Surveillance
of risk factors and protection for chronic diseases for phone in-
quiry [in Portuguese], 2007. Available from: URL: http://
portal.saude.gov.br/portal/arquivos/pdf/relatorio_vigitel_2006_
marco_2007.pdf.
3. Eckel R.H., York D.A., Rössner S., Hubbard V., Caterson I.,
Jeor S.T.S. et al., Prevention Conference VII: Obesity, a world-
wide epidemic related to heart disease and stroke: Executive
summary. Circulation, 2004, 110 (18), 2968-2975. DOI: 10.1161/
01.CIR.0000140086.88453.9A.
4. Lima W.A., Glaner M.F., Body fat topography as a predictor of
an increase in blood lipids. RBM Rev Bras Med, 2009, 66 (1),
3–9.
5. Caterson I.A., Hubbard V., Bray G.A., Grunstein R., Hansen
B.C., Hong Y. et al., Prevention Conference VII: Obesity, a
worldwide epidemic related to heart disease and stroke: Group
III: Worldwide comorbidities of obesity. Circulation, 2004, 110
(18), e476–e483. DOI: 10.1161/01.CIR.0000140114.83145.59.
6. Shen W., Punyanitya M., Chen J., Gallagher D., Albu J., Pi-
Sunyer X. et al., Waist circumference correlates with metabolic
syndrome indicators better than percentage fat. Obesity, 2006,
14 (4), 727–736. DOI: 10.1038/oby.2006.83.
7. Rahmouni K., Correia M.L.G., Haynes W.G., Mark A.L. Obes-
ity-associated hypertension: new insights into mechanisms.
Hypertension, 2005, 45 (1), 9–14. DOI: 10.1161/01.HYP.000015
1325.83008.b4.
8. Hu D., Hannah J., Gray R.S., Jablonski K.A., Henderson J.A.,
Robbins D.C. et al., Effects of obesity and body fat distribution
on lipids and lipoproteins in nondiabetic American Indians: the
strong heart study. Obes Res, 2000, 8 (6), 411–421. DOI:
10.1038/oby.2000.51.
9. Chang C.J., Wu C.H., Lu F.H., Wu J.S., Chiu N.T., Yao W.J.,
Discriminating glucose tolerance status by regions of interest
of dual-energy X-ray absorptiometry. Clinical implications of
body fat distribution. Diabetes Care, 1999, 22 (12), 1938–1943.
DOI: 10.2337/diacare.22.12.1938.
10. Thomas G.N., Ho S-Y, Lam K.S.L., Janus E.D., Hedley A.J.,
Lam T.H. et al., Impact of obesity and body fat distribution on
cardiovascular risk factors in Hong Kong Chinese. Obes Res,
2004, 12 (11), 1805–1813. DOI: 10.1038/oby.2004.224.
11. World Health Organization. Obesity: preventing and managing
the global epidemic (WHO technical report series v. 849).
WHO, Geneva 2000.
12. Hu G., Tuomilehto J., Silventoinen K., Barengo N., Jousilahti P.,
Joint effects of physical activity, body mass index, waist circum-
ference and waist-to-hip ratio with the risk of cardiovascular dis-
ease among middle-aged Finnish men and women. Eur Heart J,
2004, 25 (24), 2212–2219. DOI: 10.1016/j.ehj.2004.10.020.
13. Goh V.H.H., Tain C.F., Tong T.Y.Y., Mok H.P.P., Wong M.T.,
Are BMI and other anthropometric measures appropriate as
indices for obesity? A study in an Asian population. J Lipid
Res, 2004, 45 (10), 1892–1898. DOI: 10.1194/jlr.M400159-
JLR200.
14. Lean M.E.J., Han T.S., Seidell J.C., Impairment of health and
quality of life in people with large waist circumference. Lancet,
1998, 351 (9106), 853–856. DOI: 10.1016/S0140-6736(97)10004-6.
15. Friedewald W.T., Levy R.I., Fredrickson D.S., Estimation of the
concentration of low-density lipoprotein cholesterol in plasma
without use of preparative ultracentrifuge. Clin Chem, 1972, 18
(6), 499–502.
16. Lu W., Resnick H.E., Jablonski K.A., Jones K.L., Jain A.K.,
Howard W.J. et al., Non-HDL cholesterol as a predictor of cardio-
vascular disease in type 2 diabetes. The strong heart study Dia-
betes Care, 2003, 26 (1), 16–23. DOI: 10.2337/diacare.26.1.16.
17. Tuomilehto J., Marti B., Kartovaara L., Korhonen H.J., Pietnen
P., Body fat distribution, serum lipoproteins and blood pressure
in middle-aged Finnish men and women. Rev Epidemiol Sante
Publique, 1990, 38, 507–515.
18. Ricciardi R., Metter E.J., Cavanaugh E.W., Ghambaryan A.,
Talbot L.A., Predicting cardiovascular risk using measures of
regional and total body fat. Appl Nurs Res, 2009, 22 (1), 2–9.
DOI: 10.1016/j.apnr.2007.01.011.
19. Glaner M.F., Secular trend of physical growth and body mass
index in schoolchildren [in Portuguese]. Rev Min Educ Fis,
1998, 6, 59–69.
20. Glaner M.F. Health-related physical fitness of rural and urban
adolescents in relation to the reference criteria [in Portuguese].
Rev Bras Educ Fís Esp, 2005, 16, 13–24.
21. Sandowski S.A., What is the ideal body weight? Family Prac-
tice, 2000, 17 (4), 348–351. DOI: 10.1093/fampra/17.4.348.
22. Gallagher D., Visser M., Sepúlveda D., Pierson R.N., Harris T.,
Heymsfield S.B., How useful is body mass index for compari-
son of body fatness across age, sex, and ethnic groups? Am J
Epidemiol, 1996, 143 (3), 228–239.
23. Zhu S., Heshka S., Wang Z., Shen W., Allison D.B., Ross R. et
al., Combination of BMI and waist circumference for identify-
ing cardiovascular risk factors in whites. Obes Res, 2004, 12
(4), 633–645. DOI: 10.1038/oby.2004.73.
24. Boorsma W., Snijder M.B., Nijpels G., Guidone C., Favuzzi
A.M.R., Mingrone G. et al., Body composition, insulin sensi-
tivity, and cardiovascular disease profile in healthy Europeans.
Obesity, 2008, 16 (12), 2696–2701. DOI:10.1038/oby.2008.433.
25. Sironi A.M., Gastaldelli A., Mari A., Ciociaro D., Postano V.,
Buzzigoli E. et al., Visceral fat in hypertension: influence on
insulin resistance and beta-cell function. Hypertension, 2004,
44 (2), 127–133. DOI: 10.1161/01.HYP.0000137982.10191.0a.
26. Després J.P., Cardiovascular disease under the influence of ex-
cess visceral fat. Crit Pathw Cardiol, 2007, 6 (2), 51–59. DOI:
10.1097/HPC.0b013e318057d4c9.
27. Mansur A.P., Favarato D., Souza M.F.M., Avakian S.D., Ald-
righi J.M., César L.A.M. et al., Trends in death for circulatory
diseases in Brazil between 1979 and 1996. Arq Bras Cardiol,
2001, 76 (6), 504–510. DOI: 10.1590/S0066-782X2001000600007.
Paper received by the Editors: February 25, 2009.
Paper accepted for publication: October 6, 2009.
Address for correspondence
Maria Fátima Glaner
Quadra 201, Lote 6, Bloco B – apt. 803
Águas Claras
ZIP-Code 71937-540
Brasília, DF, Brazil
e-mail: [email protected]

HUMAN MOVEMENT
51
Introduction
Body image is a complex phenomenon that is multi-
dimensional in nature [1] and can involve perceptual,
affective, cognitive or behavioral disturbances.
Body dissatisfaction is highly prevalent during ado-
lescence [2, 3]. A study carried out with schoolchildren
(8 to 11 years) in Porto Alegre, Brazil, revealed that
82% of them were dissatisfied with their own body im-
age [4]. Research indicates that girls tend to exhibit
greater body dissatisfaction than boys [5–7].
While body dissatisfaction is related with the desire
to be thinner among females [4], among male adoles-
cents body dissatisfaction is associated with the desire
to gain weight, to achieve an athletic build [2, 4, 8].
Body dissatisfaction has often been associated with
discrepancies between real and ideal silhouettes [9, 10].
Although it is a complex subject for investigations, there
is evidence that social and sociocultural aspects have an
influence on distorting body image [11].
A series of nutritional status disorders can be ob-
served in adolescents today, characterized both by nu-
tritional excesses and deficits [12, 13]. During recent
years, overweight and obesity have been observed to
increase in all age groups [13], and as a result over-
weight adolescents suffer from problems related to ac-
ceptance of their self-image and valuation of their own
bodies.
There has not been found any Brazilian research that
would verify the association between nutritional status
and body dissatisfaction in adolescents, thus the objec-
tive of this study was to analyze this association.
Material and methods
Participants
The association between body dissatisfaction and
nutritional status in adolescents was investigated by
means of a cross-sectional study “Levels of physical ac-
tivity, physical fitness and health-related social behavior
in schoolchildren from Florianópolis, SC”. This study
was carried out during the second half of 2007 with
a representative sample of adolescents from the public
secondary education system of Florianópolis, SC, in the
southern region of Brazil.
DOI: 10.2478/v10038-010-0001-7
Andreia Pelegrini1, 2*, Edio Luiz Petroski1
1 Postgraduate Program in Physical Education, Federal University of Santa Catarina, Research Center of Physical Education
in Kinanthropometry and Human Performance, Florianópolis, SC, Brazil
2 Capes grant recipient
ABSTRACT
Purpose. This study analyzes the association between body dissatisfaction and nutritional status in adolescents. Basic Procedures. The study enrolled 234 boys and 442 girls. Information was collected on body image and anthropometry performed. Nutritional
status was stratified into two categories: healthy (BMI: 18.5–25.0 kg/m2) and unhealthy (BMI: <18.5 and >25.0 kg/m2). Body image
was coded as satisfied and dissatisfied. Main findings. It was found that 65.5% of adolescents were dissatisfied with their body
image. While the girls wished to reduce their body silhouettes (48.4%), the boys wished to increase in size (51.3%). Unhealthy
nutritional status was only associated with body dissatisfaction among the girls (95%CI = 1.35–3.43). Overweight girls were 11 times
more likely to be dissatisfied with their bodies than normal weight girls. Conclusions. Nutritional status was a determinant factor for
body dissatisfaction, primarily among female adolescents, since those whose nutritional status was unhealthy had different levels of
dissatisfaction from those with healthy BMI.
Key words: adolescents, anthropometry, nutritional status, body image, body dissatisfaction
THE ASSOCIATION BETWEEN BODY DISSATISFACTION AND NUTRITIONAL STATUS IN ADOLESCENTS
2010, vol. 11 (1), 51–57
* Corresponding author.

HUMAN MOVEMENT
52
A. Pelegrini, E.L. Petroski, Body dissatisfaction and nutritional status
Sample selection
The sample selection was carried out in two stages:
(1) stratification by geographic region and (2) school
classes as clusters. Initially the municipality of Flori-
anópolis was divided into five regions: Center, Conti-
nent, East, North and South. Next, the largest schools in
each region were selected and from each school the
number of classes necessary to achieve representative-
ness of its geographic area was determined. All adoles-
cents who attended school classes on the day of data
collection were invited to take part.
The sample size was determined using procedures
suggested by Luiz and Magnanini [14] for a finite popu-
lation, assuming a prevalence of 50% (body dissatisfac-
tion), 95% confidence interval (95%CI), estimated error
of 4 percentage points and an additional 15% for possi-
ble losses from the sample. Based on these parameters it
appeared necessary to collect data from 659 adoles-
cents. Considering the characteristics of the sampling
process which involves all individuals belonging to each
cluster, the final sample contained 892 adolescents.
Adolescents above 18 years of age were excluded
(n = 33). Adolescents who did not complete their body
image questionnaire were considered as lost to the sam-
ple (n = 182). The final sample comprised 676 adoles-
cents (234 boys and 442 girls), aged 14 to 18 years
(mean = 16.06 ± 1.01).
Procedures
This research was approved by the Research Ethics
Committee at the Universidade Federal de Santa Cata-
rina (Hearing number 372/2006).
In each case, school management was contacted in
order to explain the research objectives and methods.
Parental consent was obtained before initiating data col-
lection. The adolescents were informed that participa-
tion was voluntary.
Measurements
Body image
Information related to body image was obtained us-
ing a scale of nine body silhouettes proposed by Stunk-
ard, Sorenson and Schlusinger [15]. All of the silhouettes
were shown to the adolescents and they replied to the
following two questions: Which silhouette best repre-
sents your body’s current appearance (real)? Which
body silhouette would you like to have (ideal)? Body im-
age was evaluated by subtracting the real silhouette from
the ideal silhouettes. When the difference was equal to
zero, the adolescent was classified as satisfied and if dif-
ferent from zero as dissatisfied. If the difference was
positive, dissatisfaction was due to a desire for a smaller
silhouette and if the difference was negative the dissatis-
faction was caused by a desire to increase in size.
Weight and height
Body weight and height were measured according to
recognized procedures [16]. Body weight was measured
using a digital balance, PLENNA® brand, with 150 kg
capacity and 0.1 kg sensitivity and automatic shutdown.
Height was measured using a flexible steel stadiometer
fixed to the wall. Body mass index [body weight (kg) /
height (m2)] was used as the indicator of nutritional sta-
tus [17, 18]. Adolescents with BMI below 18.5 kg/m2
[18] and above 25.0 kg/m2 [17] were considered to have
nutritional status disorders. The expression overweight
was adopted to define both overweight and obesity. The
international cut-off values used for the classification of
nutritional status according to gender and age are shown
in Tab. 1.
Data analysis
When comparing two proportions, the test of signifi-
cance for differences between proportions was applied.
Differences in frequency between variables were veri-
fied using the chi-square test. The association between
body dissatisfaction and nutritional status was analyzed
by means of logistic regression, with a 95% confidence
interval. Data were analyzed using the statistical pro-
grams SPSS 13.0 and MedCalc 9.3.3.0.
Results
The distribution of the adolescents by gender and
satisfaction with body image is illustrated in Fig. 1. It
was observed that 65.5% of the adolescents were dissat-
isfied with their body image, being significantly higher
among male adolescents (72.6%) than females (61.8%)
(Fig. 1a). When the subset of dissatisfied adolescents
was stratified by desire to change body silhouette (Fig.
1b), it was observed that females wished to reduce their
silhouette (48.4%), while males wished to increase it
(51.3%).
Figure 2 illustrates the degree of body dissatisfac-
tion according to nutritional status. It was found that

HUMAN MOVEMENT
53
A. Pelegrini, E.L. Petroski, Body dissatisfaction and nutritional status
Figure 1. Distribution of adolescents according to perceived body image and gender (Florianópolis, Brazil 2007)
Satisfied
Male
Table 1. International cut off points for body mass index for thinness, overweight and obesity between 14 and 18 years of age
Age (years)
Male
BMI (kg/m2)
16 17 18.5 25 30
14 14.09 15.01 16.41 22.62 27.63
15 14.60 15.55 16.98 23.29 28.30
16 15.12 16.08 17.54 23.90 28.8
17 15.60 16.58 18.05 24.46 29.41
18 16.00 17.00 18.50 25.00 30.00
Age (years)
Female
BMI (kg/m2)
16 17 18.5 25 30
14 14.48 15.43 16.88 23.34 28.57
15 15.01 15.98 17.45 23.94 29.11
16 15.46 16.44 17.91 24.37 29.43
17 15.78 16.77 18.25 24.70 29.69
18 16.00 17.00 18.50 25.00 30.00
Female
Dissatisfied Wishes to reduce Wishes to increase
100
80
60
40
20
0
100
80
60
40
20
0
aB
* p < 0.05
bB
Figure 2. Adolescents’ perception of body image, according to nutritional status (Florianópolis, Brazil 2007)
Healthy
Satisfied
Unhealthy
100
80
60
40
20
0
aB
(%)
(%)
Dissatisfied
(%)
Nutritional status
Healthy
Wishes to increase
Unhealthy
100
80
60
40
20
0
b
Wishes to reduce
(%)
Nutritional status
* p < 0.05
77.0% of the adolescents with nutritional status disor-
ders were dissatisfied with their body image (Fig. 2a),
46.7% wished to reduce and 30.3% to increase their
silhouette (Fig. 2b). With relation to the adolescents
classified as having healthy BMI, it was observed that
61.8% were dissatisfied (Fig. 2a), with 36.6% and
25.2% desiring smaller and larger silhouettes, respec-
tively (Fig. 2b).

HUMAN MOVEMENT
54
A. Pelegrini, E.L. Petroski, Body dissatisfaction and nutritional status
When body image perception was stratified by gen-
der (Fig. 3), the results revealed that male adolescents
with unhealthy nutritional status exhibited more dissat-
isfaction (84.4%) than females (74.2%) (Fig. 3a). While
42.2% of the male adolescents with unhealthy nutri-
tional status wished to increase their body silhouette,
just 25.8% of the females expressed this wish. The pre-
dominant desire among female adolescents was to re-
duce the size of their body silhouette (48.3%) (Fig. 3b).
Figure 4 illustrates the degree of body dissatisfac-
tion according to underweight, normal weight and over-
weight. The results revealed that 61.0%, 61.8% and
90.9% of underweight, normal weight and overweight
adolescents were dissatisfied. While the underweight
adolescents (59.7%) wanted to increase their body sil-
houette, the obese ones wanted to reduce it (86.4%).
Table 2 shows the association between body dissatis-
faction and nutritional status. It was found that un-
Figure 3. Adolescents’ perception of body image, according to nutritional status and gender (Florianópolis, Brazil 2007)
Healthy
Satisfied
Unhealthy
100
80
60
40
20
0
aB
Dissatisfied
(%)
Nutritional status
Male
Healthy Unhealthy
Female
Healthy
Wishes to increase
Unhealthy
100
80
60
40
20
0
b
Wishes to reduce
(%)
Nutritional status
Male
Healthy Unhealthy
Female
Figure 4. Adolescents’ perception of body image, according to underweight, normal weight and overweight
(Florianópolis, Brazil 2007)
Satisfied
100
80
60
40
20
0
aB
Dissatisfied
(%)
Nutritional status
Underweight Normal weight Overweight
Wishes to increase
100
80
60
40
20
0
b
Wishes to reduce
(%)
Nutritional status
Underweight Normal weight Overweight
Table 2. Odds ratios for body dissatisfaction in adolescents according to nutritional parameters (Florianópolis, Brazil 2007)
Males Females
OR (95%CI) OR (95%CI)
BMI
Healthy 1.00 1.00
Unhealthy 2.34 (0.99–5.56) 2.15 (1.35–3.43)
Nutritional status
NW 1.00 1.00
UW 2.16 (0.60–7.75) 0.89 (0.50–1.55)
OW/OB 2.48 (0.82–7.51) 10.69 (3.78–30.16)
OR – odds ratio, 95%CI – confidence interval, BMI – body mass index, NW – normal weight, UW – underweight, OW/OB –
overweight

HUMAN MOVEMENT
55
A. Pelegrini, E.L. Petroski, Body dissatisfaction and nutritional status
healthy nutritional status was only associated with body
dissatisfaction among females (95%CI = 1.35–3.43).
When BMI was stratified as normal weight (reference
category), underweight and overweight, the association
only appeared among the females, indicating that the
chance of showing body dissatisfaction is 11 times
greater in overweight female adolescents than in adoles-
cents with normal weight.
Discussion
Analyzing perceived body image, it was observed
that a large number of adolescents were dissatisfied
with their body shapes and sizes. A study comprising
schoolchildren of secondary education in greater Flori-
anópolis, SC, revealed that 48.2% of these schoolchil-
dren were dissatisfied with their body weight [19]. Body
dissatisfaction is even observed among pre-adolescents
in small towns (63.9%) [6]. Brazilian studies have found
that body dissatisfaction varies from 64% to 82% in
schoolchildren [4, 6]. In a population study carried out
with Chinese children and adolescents (3 to 15 years), it
was observed that approximately 60% were dissatisfied
with their body image [3]. In Poland, the body dissatis-
faction in adolescents (40.0%) tends to be smaller than
found in Brazilian ones [20].
Body dissatisfaction has been observed in both
gender [21], but greater proportions are found among
female adolescents, as demonstrated by studies under-
taken in Brazil [5, 6] and other countries [7, 20, 22]. In
contrast to what can be found in the literature, the
findings of this study revealed that male adolescents
exhibited greater body dissatisfaction than female ado-
lescents. This can be related the pressure exercised by
the society, mainly the influence exerted by media
[23], promoting muscle and athletic bodies in male
adolescents. Results from another clinical study dem-
onstrated that across all stages of development, girls
were more likely to adopt strategies to lose weight,
whereas boys were more likely to adopt strategies to
increase muscle [24].
Excessive concern with the body and the disorders
related with body image problems have until recently
appeared to almost exclusively affect females, however,
these problems have been reported in males with grow-
ing frequency [25, 26].
With relation to the type of body dissatisfaction, it
was observed that the girls in general wished to reduce
the size of their body silhouette, while the boys desired
larger silhouettes. These results are similar to what was
observed by Branco, Hilário and Cintra [5], demonstrat-
ing the same tendency in a sample of adolescent school-
children in the city of São Paulo, Brazil. In the same
manner, the findings of this study confirm what was
observed in Chinese children and adolescents, where
the preference among females was for smaller body sil-
houettes and for larger silhouettes among males [3].
In contrast with females, who desire slimmer fig-
ures, male individuals are concerned with becoming
stronger and more muscular. Very often, standards of
beauty are influenced by media which create desires
and reinforce images, standardizing bodies, so that
those individuals who see themselves as outsized feel
pressure and dissatisfaction.
It was observed that while the adolescents with un-
derweight wanted to increase the body silhouette, the
obese ones wanted to reduce. In parts, those results
were also proven for the univariate analysis detecting an
association between body dissatisfaction and nutritional
status. However, this association was only present
among females, in girls with nutritional status disorders
having twice the chances of dissatisfaction with their
own body image, in relation to normal weight adoles-
cents. Another association detected was between body
dissatisfaction and being overweight. Overweight ado-
lescent girls were eleven times more likely to be dissat-
isfied when compared with normal weight female ado-
lescents.
In São Paulo, Brazil, female adolescents exhibited
a self-perception of their body image that was not com-
patible with their true nutritional status [5], whereas, in
a study carried out in two cities in the state of Rio
Grande do Sul, Brazil, it was found that nutritional sta-
tus was the factor most strongly associated with body
dissatisfaction, since children with obesity, risk of obes-
ity and those below the 15th percentile, were dissatis-
fied [6]. In the same manner, in Santo André, Brazil, it
was found that overweight adolescents were more dis-
satisfied with their body image [11]. In Norway, body
dissatisfaction in adolescents (13–19 years) was ob-
served to increase in line with increasing BMI [27]. In
Poland, body dissatisfaction was more prevalent in
obese adolescents (77.6%) than non-obese ones (36.2%)
[20].
This study suffers from the limitations inherent to
all cross-sectional studies, i.e., it estimates relationships
between variables at a time and does not allow cause
and effect relationships to be identified. The measure

HUMAN MOVEMENT
56
A. Pelegrini, E.L. Petroski, Body dissatisfaction and nutritional status
used to assess body image provides very limited infor-
mation and may not adequately assess boy s body image
given their concerns with muscles and an athletic body.
Although the nine-silhouette scale was initially pro-
posed for adults, it has been widely applied to adoles-
cents [21, 28, 29]. One of the advantages of this study is
the representative number of adolescents of both gender
enrolled in secondary education in Florianópolis. Fur-
thermore, this is the first Brazilian study carried out in
adolescents of this age group with the objective to iden-
tify the association between body dissatisfaction and
nutritional status.
Conclusions
Body dissatisfaction proved to be a highly frequent
phenomenon in adolescents of both gender. Therefore,
the data generated by this research should be sufficient
to warn parents, educators and health professionals of
the prevalence of body dissatisfaction in adolescents.
Given that obesity is agreed as a global public health
problem, finding that obese adolescents are dissatisfied
with their body shape should signal that they are ready
and motivated to act and try to lose body weight. This
can lead, in part, to unhealthy behavior such as anorex-
ia, bulimia, muscle dysmorphia and inappropriate diet-
ing [24]. According to the analysis carried out, the find-
ings suggest that nutritional status, primarily over-
weight, determines body dissatisfaction, particularly for
female adolescents. In spite of the body dissatisfaction
to be more prevalent in male adolescents, they tended to
accept their body image more, even those with un-
healthy nutritional status.
Therefore, it is suggested that studies of nutritional
interventions and physical exercise be carried out in or-
der to contribute to reducing the prevalence of over-
weight and obesity and, consequently, improving the
self-esteem of these adolescents. Further cross-sectional
investigations considering distinct social classes and
different age groups are also needed to improve under-
standing of the relationship between body image and
nutritional status.
References
1. Banfield S., McCabe M.P., An evaluation and clinical implica-
tions of the construct of body image. Adolescence, 2002, 37,
373–394.
2. Ricciardelli L.A., McCabe M.P., Children’s body image con-
cerns and eating disturbance: a review of the literature. Clin
Psychol Rev, 2001, 21 (3), 325–344. DOI: 10.1016/S0272-
7358(99)00051-3.
3. Li Y., Hu X., Ma W., Wu J., Ma G., Body image perceptions
among Chinese children and adolescents. Body Image, 2005,
2(2), 91–103. DOI: 10.1016/j.bodyim.2005.04.001.
4. Pinheiro A.P., Giugliani E.R.J., Body dissatisfaction in Brazil-
ian schoolchildren: prevalence and associated factors. Rev Sau-
de Publica, 2006, 40 (3), 489–496.
5. Branco L.M., Hilário M.O.E., Cintra I.P., Perception and satis-
faction with body image in adolescents and correlations with
nutrition status [in Portuguese]. Rev Psiquiatr Clín, 2006, 33
(6), 292–296. DOI: 10.1590/S0101-60832006000600001.
6. Triches R.M., Giugliani E.R.J., Body dissatisfaction in school
children from two cities in the South of Brazil [in Portu-
guese]. Rev Nutr, 2007, 20, 119–128. DOI: 10.1590/S1415-
52732007000200001.
7. Eisenberg M.E., Neumark-Sztainer D., Paxton S.J., Five year
change in body satisfaction among adolescents. J Psychosom
Res, 2006, 61 (4), 521–527. DOI: 10.1016/j.jpsychores.2006.05.007.
8. Smolak L., Stein J.A., The relationship of drive for muscularity
to sociocultural factors, self-esteem, physical attributes gender
role, and social comparison in middle school boys. Body Image,
2006, 3 (2), 121–129. DOI: 10.1016/j.bodyim.2006.03.002.
9. Almeida G.A.N., Santos J.E., Pasian S.R., Loureiro S.R., Per-
ceptions of body shape and size in women: an exploratory study
[in Portuguese]. Psicologia em Estudo, 2005, 10 (1), 27–35.
DOI: 10.1590/S1413-73722005000100005.
10. Durkin S.J., Paxton S.J., Predictors of vulnerability to reduced
body image satisfaction and psychological wellbeing in re-
sponse to exposure to idealized female media images in adoles-
cent girls. J Psychosom Res, 2002, 53 (5), 995–1005. DOI:
10.1016/S0022-3999(02)00489-0.
11. Conti M.A., Frutuoso M.F.P., Gambardella A.M.D., Obesity and
body dissatisfaction amongst adolescents [in Portuguese].
Rev Nutr, 2005, 18 (4), 491–497. DOI: 10.1590/S1415-
52732005000400005.
12. World Health Organization. Physical status: use and interpreta-
tion of anthropometry. WHO, Geneva 1995.
13. Wang G., Dietz W.H., Economic burden of obesity in youths
aged 6 to 17 years: 1979–1999. Pediatrics, 2002, 109 (5), e81–86.
14. Luiz R.R., Magnanini M.M.F., The logic of sample size deter-
mination in epidemiological research [in Portuguese]. Cad
Saúde Coletiva, 2000, 8 (2), 9–28.
15. Stunkard A.J., Sorenson T., Schlusinger F., Use of the Danish
Adoption Register for the study of obesity and thinness. In:
Kety S.S., Rowland L.P., Sidman R.L., Matthysse S.W. (eds.),
The genetics of neurological and psychiatric disorders. Raven
Press, New York 1983, 115–120.
16. Canadian Society for Exercise Physiology. The Canadian Phys-
ical Activity, Fitness and Lifestyle Appraisal: CSEP’s guide to
health active living. 3rd ed. CSEF, Ottawa 2004.
17. Cole T.J., Bellizzi M.C., Flegal K.M., Dietz W.H., Establishing
a standard definition for child overweight and obesity world-
wide: international survey. BMJ, 2000, 320 (7244), 1240. DOI:
10.1136/bmj.320.7244.1240.
18. Cole T.J., Flegal K.M., Nicholls D., Jackson A.A., Body mass
index cut offs to define thinness in children and adolescents:
international survey. BMJ, 2007, 335 (7612), 194. DOI: 10.1136/
bmj.39238.399444.55.
19. Petroski E.L., Velho N.M., De Bem M.F.L., Menarche age and
satisfaction with body weight [in Portuguese]. Rev Bras Cine-
antropom Desempenho Hum, 1999, 1 (1), 30–36.
20. Al Sabbah H., Vereecken C.A., Elgar F.J., Nansel T., Aasvee K.,
Abdeen Z. et al., Body weight dissatisfaction and communica-
tion with parents among adolescents in 24 countries: interna-

HUMAN MOVEMENT
57
A. Pelegrini, E.L. Petroski, Body dissatisfaction and nutritional status
tional cross-sectional survey. BMC Public Health, 2009, 9, 52.
DOI: 10.1186/1471-2458-9-52.
21. Kostanski M., Fisher A., Gullone E., Current conceptualization
of body image dissatisfaction: have we got it wrong? J Child
Psychol Psychiatry, 2004, 45 (7), 1317–1325. DOI: 10.1111/
j.1469-7610.2004.00315.x.
22. Barker E.T., Galambos N.L., Body dissatisfaction of adolescent
girls and boys: Risk and resource factors. J Early Adolesc,
2003, 23 (2), 141–165. DOI: 10.1177/0272431603023002002.
23. Lawrie Z., Sullivan E.A., Davies P.S.W., Hill R.J., Media influ-
ence on the body image of children and adolescents. Eat Disord,
2006, 14 (5), 355–364.
24. McCabe M.P., Ricciardelli L.A., Body image dissatisfaction
among males across the lifespan: a review of past literature.
J Psychosom Res, 2004, 56 (6), 675–685. DOI: 10.1016/S0022-
3999(03)00129-6
25. Pope H.G. Jr., Gruber A.J., Mangweth B., Bureau B., deCol C.,
Jouvent R. et al., Body image perception among men in three
countries. Am J Psychiatry, 2000, 157, 1297–1301.
26. Cohane G.H., Pope H.G. Jr., Body image in boys: a review of
the literature. Int J Eat Disord, 2001, 29 (4), 373–379. DOI:
10.1002/eat.1033.
27. Storvoll E.E., Strandbu A., Wichstrom L., A cross-sectional
study of changes in Norwegian adolescents’ body image from
1992 to 2002. Body Image, 2005, 2 (1), 5–18. DOI: 10.1016/
j.bodyim.2005.01.001.
28. Lynch W.C., Heil D.P., Wagner E., Havens M.D., Ethnic differ-
ences in BMI, weight concerns, and eating behaviors: Compar-
ison of Native American, White, and Hispanic adolescents.
Body Image, 2007, 4 (2), 179–190. DOI: 10.1016/j.bodyim.2007.
01.001.
29. Markland D., Ingledew D.K., The relationships between body
mass and body image and relative autonomy for exercise among
adolescent males and females. Psychol Sport Exerc, 2007, 8 (5),
836–853. DOI: 10.1016/j.psychsport.2006.11.002.
Paper received by the Editors: February 19, 2009.
Paper accepted for publication: November 16, 2009.
Address for correspondence
Edio Luiz Petroski
Universidade Federal de Santa Catarina, Núcleo de
Pesquisa em Cineantropometria e
Desempenho Humano – UFSC/CDS/NuCIDH
Campus Universitário – Trindade, Caixa Postal 476
CEP 88, 040-900
Florianópolis, SC, Brazil
e-mail: [email protected]

HUMAN MOVEMENT
58
2010, vol. 11 (1), 58–65
Introduction
The effects of acoustic waves on a variety of tissues
is under continual investigation. Some of the effects are
more widely accepted by the medical community than
others; for example the effect of extracorporeal shock-
waves for lithotripsy. Here, a brief synopsis is provided
of the reported effects of acoustic waves (Extracorpore-
al Shock Waves, Pressure Waves, Ultrasound) on bone,
skin, muscle, and vasculature.
Although it is not fully clarified what the specific
universal mechanism is that leads to the clinical benefits
of acoustic waves, it is believed to result from direct
mechanical effects on the cells to increase porosity [1];
a mechanotransduction type effect from the acoustic
differences between cells and the surrounding extracel-
lular matrix, which results in a shear stress on the cell
[2, 3]; the violent collapse of cavitation bubbles and
their effects on cells [4–8] and on a tissue level due to
increased angiogenesis [8, 2]. Whether the effect is di-
rect or indirect the release of growth factors and the up-
regulation of cell activity is responsible for the histeo-
genesis and repair processes.
Extracorporeal Shock Wave Therapy (ESWT)
Extracorporeal shock waves were first used for kid-
ney and ureteral stones fragmentation in 1980 and after-
wards, they became the method of choice. More than 10
years later, shock waves were introduced as therapy for
a number of orthopaedic pathologies such as bone non-
unions, tendinopathies and chronic tissue inflammations.
Shock waves are acoustic waves that are character-
ized by high pressure amplitudes and an abrupt increase
in pressure in comparison with the ambient pressure.
As mechanical waves, they can pass through the surface
of a body without injury and may act therapeutically in
predetermined areas within the body [1].
There occurs pressure disturbance that propagates
rapidly through a medium. The wave shows an acute
DOI: 10.2478/v10038-009-0025-z
Panagiotis V. Tsaklis1, 2
1 Department of Physiotherapy, Laboratory of Biomechanics, ATEI-Thessaloniki, Greece
2 Department of Mechanical Engineering, Tissues and Polymers Laboratory, Massachusetts Institute of Technology, Cambridge,
USA
ABSTRACT
Three types of acoustic waves are mainly used in the medical field, Extracorporeal Shock Waves (ESWs), Pressure Waves (PWs) and
Ultrasound (US). Shock waves are acoustic waves that are characterized by high pressure amplitudes and an abrupt increase in
pressure that propagates rapidly through a medium. The energy distribution in the treatment area differs from being wide over a large
area, or concentrated in a narrow treatment zone, and as such influences the therapeutic and biological effect of the shock wave.
Pressure waves are usually generated by the collision of solid bodies with an impact speed of a few metres per second, far below the
speed the shock wave travels. There are major differences between PWs and ESWs, concerning not only their physical characteristics
and the technique used for generating them, but also the order of the parameters normally used. The simulation effects and
therapeutic mechanisms seem to be similar, despite the physical differences and the resulting different application areas (on the
surface and in depth respectively). Ultrasound therapy is one of the modalities of physical medicine used for pain management and
for increasing blood flow and mobility. Ultrasound and ESWs – PWs differ, despite their acoustic relationship, basically because
ESWs – PWs show large pressure amplitudes with direct mechanical effects and US propagates within periodic oscillations within
a limited bandwidth, and mainly direct thermal effects. Acoustic waves have direct mechanical and mechanotransduction effects on
the cells and ECM increasing porosity, angiogenesis, releasing growth factors, enhancing proteosynthesis and viscoelastisity and
inducing histeogenesis and repair processes.
Key words: acoustic waves, shock waves, pressure waves, ultrasound, tissues
PRESENTATION OF ACOUSTIC WAVES PROPAGATION AND THEIR EFFECTS THROUGH HUMAN BODY TISSUES

HUMAN MOVEMENT
59
P.V. Tsaklis, Acoustic waves propagation
rise in pressure amplitude (representing the time be-
tween 10 and 90% of the total initial rise time) at the
wave front of less than 10 nsec (∆t), a low tensile ampli-
tude, a short life-cycle (less than 10 msec), a broad fre-
quency spectrum (16 MHz to 20 MHz) and a variable
negative pressure at the end [8] (Fig. 1). At the boundary
between two media, a shockwave will be partially re-
flected, and partially transmitted. Attenuation of the
shockwave is dependent on the medium through which
the shockwave is travelling. In air, the shockwave weak-
ens quickly. In water, however, attenuation occurs ap-
proximately 1000 times less than that which occurs in
air [8]. Medically applicable shockwaves are conven-
tionally propagated through a water medium and a cou-
pling gel before penetrating tissue [9].
a narrow treatment zone, and as such influences the
therapeutic and biological effect of the shock wave.
The energy concentration is obtained by calculating
the energy per area (E/A): E/A = 1/ ρc ∫p(t)dt = ED
(energy flux density), mJ/mm2.
Figure 1. Characteristics of shock waves
Pre
ssu
re
Pmax
∆t
TimePr
Pmax – pressure maximum, Pr – negative peak pressure, ∆t – pressure rise time
ESW Energy (E)
An important parameter is the energy of the applied
shock wave and this may have an effect on the tissue
only when succeeding to overpass certain energy
thresholds.
The equation for energy generation from a shock
wave is E = A/ρc ∫p(t)dt, where ρ is the propagation
medium density (kgm–3) and c is the sound velocity
(ms–1) (both acoustical parameters), p(t) is the time
curve of the shock wave (µs) and A represents the sur-
face (mm2), (see also Tab. 3). The acoustical energy of
a shock wave pulse is given in millijoules (mJ) and
this must be multiplied by the total number of shock
wave pulses emitted per treatment (protocol) and thus
we shall have the total emitted energy.
Energy flux density (ED)
The energy distribution in the treatment area differs
from being wide over a large area, or concentrated in
Table 1. Categorization of ESWaves due to Energy Flux
Density
Energy category Range of energy density
(mJ/mm2)
Low < 0.08
Medium 0.08–0.28
High > 0.6
Shock wave generation makes use of three different
principles: electrohydraulic, piezoelectric and electro-
magnetic. They are focused using spherical arrange-
ments, acoustical lenses or reflectors [1].
Among shock wave generation techniques developed
and used until now in clinical applications, electrohy-
draulic (EH) and electromagnetic (EM) waves have
been found to be the most suitable for orthopaedic treat-
ment [8]. The EH device generates a SW by a high-volt-
age discharge applied across the electrode tips to the
first focal point within a water-filled ellipsoid reflector.
The EM device generates a SW by inducing a magnetic
field in a metal membrane, which is forced away rapidly,
and as a result compresses the surrounding fluid medi-
um. The EM acoustic wave is then focused by a lens onto
the focal therapeutic point [3].
Piezoelectric systems (PE) have a high accuracy of
repetition and are easy to control even in low energy
ranges. They can provide focussing on very small
spots with pressures of up to 150 MPa (1500 bar).
They work using a large number of piezoelectric ele-
ments arranged on a spherical shape, which can be
displaced in the direction of the centre of the spherical
shape by synchronous excitation. Eventually, a conver-
gent spherical wave spreads out and increases its pres-
sure amplitude to therapeutically effective values on
its way to the centre [1].
Pressure Waves Therapy (PWT)
In addition to the shock waves described above,
also pressure waves with different features are used in
medicine. Whereas shock waves typically travel with
the propagation speed of the medium (approx. 1500
m/s for soft tissue), pressure waves are usually gener-

HUMAN MOVEMENT
60
P.V. Tsaklis, Acoustic waves propagation
ated by the collision of solid bodies with an impact
speed of a few metres per second, far below the sound
velocity [1]. First, a projectile is accelerated, e.g. with
compressed air (similarly to an air gun), to a speed of
several metres per second and then abruptly slowed
down by hitting an impact body. This is the reason
why pressure waves are also called Balistic or Pneu-
matic waves. The elastically suspended impact body is
brought into immediate contact with the surface of the
patient above the area to be treated, using ultrasound
coupling gel, if necessary. When the projectile collides
with the impact body, part of its kinetic energy is
transferred to the impact body, which also makes
a translational movement over a short distance (typi-
cally < 1 mm) at a speed of around one metre per sec-
ond (typically < 1 m/s) until the coupled tissue or the
applicator decelerates the movement of the impact
body [1]. Then a pressure wave is propagated by trans-
fering the motion of the impact body to the tissue at
the point of contact.
There are major differences between Shock and pres-
sure waves, concerning not only their physical character-
istics and the technique used for generating them, but
also the order of the parameters normally used. The dif-
ferences between the most important parameters listed in
Tab. 2 are approx. 1–3 orders of magnitude.
The simulation effects and therapeutic mechanisms
seem to be similar, despite the physical differences
and the resulting different application areas (on the
surface and in depth, respectively). However, the pres-
sure waves are not able to fragment hard concrements
such, as e.g. kidney stones, deeper in the body (> 1 cm).
Nevertheless, unfocused pressure waves seem to be
well suited for orthopaedic indications near the surface
as well as, e.g. trigger point therapy [10].
Tissue effects of ESWT and PWT
Bone tissue
Although it is still being debated by the research
community, there is evidence that extracorporeal shock-
waves act to increase the volume of laminar bone and
the density of trabecular bone (Fig. 2A, B). In one
model an uninjured rabbit femur was given a dose of
shock wave therapy and after intial short term micro-
damage, extensive cortical thickening and minor
trabecular bone remodelling was observed [11]. ESWT
has also been found both to increase repair in non-un-
ions in an animal model (dog radius) [12] and have
clinically significant results in the human long bones
[13–15]. Another area of potential application for ESWT
in osseous tissue is osteonecrosis, specifically of the
femoral head [16, 17]. In one of these clinical studies of
osteonecrosis of the femoral head, ESWT was found
more effective than the current treatments of core de-
compression and nonvascularized fibular grafting [17].
As with many of the beneficial effects witnessed by
ESWT, the mechanism of its altering on osseous tissue
is still not fully comprehended. Some of the effects can
be espoused from various animal models, in vitro mod-
els and interpretation of human studies. One mecha-
nism that has been espoused is that microfracture and
microdisruption of the vasculature induce angiogenesis
[8, 18]. In vitro cell models and animal studies revealed
the upregulation of osteogenic cell proliferation, the ex-
pression of osteogenetic growth factors and differentia-
tion of mesenchymal stem cells [2, 3]. One factor that is
gaining increasing support is the idea of angiogenesis
resulting from the application of ESWT due to an over-
expression of vascular growth factors including εNOS
and VEGF [2, 19]. The positive finding for the applica-
tion of ESWT as a treatment for osteonecrosis is con-
Table 2. Physical and technical characteristics and differences of shock and pressure waves
Shock waves
(focused)
Pressure waves
(unfocused)Difference
Focus Yes No
Propagation Non-linear Linear
Steepening Yes No
Rise time Typically 0.01 µs Typically 50 µs Approx. 1:1000
Compression pulse duration Approx. 0.3 µs Approx. 200 – 2000 µs Approx. 1:1000
Positive peak pressure 0–100 MPa 0–10 MPa 10:1 – 100:1
Energy flux density 0–3 mJ/mm2 0–0.3 mJ/mm2 Approx. 10:1

HUMAN MOVEMENT
61
P.V. Tsaklis, Acoustic waves propagation
sistent with the idea of neovascularization; the neogen-
esis helps supply nutrients to the area where the tissue
had died [16, 17].
Skin
ESWT is increasingly being recognized to have
a positive effect on the healing of skin wounds, particu-
larly in the case of severe wounds where the prognosis
is poor. It has been less rigorously studied than some of
the other models but clinical reports on ulcers and other
lesions have been published that are promising [20–23].
An animal model that studies the effect of ESWT on
a skin flap survival model in rats showed significant
increase over the controls [24].
The exact mechanism leading to an improved skin
lesion repair is still under investigation but as with most
of the tissues, it is believed to result from the increased
vascularity and upregulation of cell activity [24]. A sec-
ond mechanism that is postulated to have an effect, is
the antibactericidal effect that has been reported in an
in vitro study [25].
Muscle tissue
To the best of the author’s knowledge, no adverse ef-
fects of ESWT on muscle have been reported. On the
contrary, ESWT appeared to be promising in treating pa-
tients with hypertonia by reducing muscle tone [26, 27].
The mechanism leading to the muscle relaxation is
believed to result from the release of nitric oxide (NO),
which acts as a muscle relaxant [27]. Direct mechanical
effect of the ESWT on the muscle fibers is also pro-
posed; and it is not believed to result from denervation
as none was deemed to have taken place [27].
Vasculature
It has been previously stated several times that in-
creased angiogenesis occurs after application of ESWT
due to the overexpression of angiongenic growth fac-
tors. A second effect that results in increased blood flow
is the release of NO which acts as a vasodilator due to
the reduction in muscle tone of smooth muscles, [26].
One exciting effect of ESWT is its potential for ang-
iogenesis in ischemic myocardial tissue [28]. Recent re-
ports have shown an increase in blood supply to
ischemic cardiac tissue both in an animal model and in
a preliminary clinical trial [28, 29].
Ultrasound Therapy (US)
Ultrasound therapy is one of the modalities of physi-
cal medicine which is used by specialists for pain man-
agement and for increasing blood flow and mobility.
Ultrasound and shock waves differ, despite their
acoustic relationship, basically because shock waves
show large pressure amplitudes. Another difference is
that ultrasound usually consists of periodic oscillations
within a limited bandwidth (Fig. 3), whereas shock
waves are represented by a single, mainly positive pres-
sure pulse that is followed by comparatively small ten-
sile (negative) wave.
For this reason, steepening effects due to nonlineari-
ties in the propagation medium (water, human tissue)
have to be taken into consideration [1].
Ultrasound has a frequency above the range of 20
kHz. The ultrasound generates high-frequency mechani-
cal vibrations created when electrical energy is converted
to acoustic energy through mechanical deformation of
a piezoelectric crystal located within the transducer.
Figure 2 A, B. Osteogenetic response after ESWT, protocol (Tsaklis, preliminary data)
A B

HUMAN MOVEMENT
62
P.V. Tsaklis, Acoustic waves propagation
Therapeutic ultrasound has a frequency range of
0.75 MHz (referred to as lower frequency) up to 3 MHz
(referred to as higher frequency), with most machines
set at a frequency of 1 MHz or 3 MHz. Using Low-fre-
quency ultrasound, waves have greater depth of pene-
tration but are less focused. Ultrasound at a frequency
of 1 MHz is absorbed primarily by tissues at a depth of
3–5 cm [30] and is therefore recommended for deeper
injuries and in patients with more subcutaneous fat.
A frequency of 3 MHz is recommended for more super-
ficial lesions at depths of 1–2 cm [30, 31].
Tissues can be characterized by their acoustic imped-
ance, the product of their density and the speed at which
sound will travel through them [32, 33] (Table 3).
US stimuli effect
When using US therapy, two phenomena can occur
on the underlying tissues. These are: the tissue
heating and the cavitation phenomenon. During the
ultrasound therapy, it is possible to create tissue le-
sions through tissue heating due to ultrasound absorp-
tion, especially when the application is prolonged in
the same area and the US wave has a constant emis-
sion mode [6]. This phenomenon can be avoided when
we constantly move the US transducer head in the
treatment area, or/and use intermittent emission mode
[5].
The acoustic cavitation phenomenon which occurs
during the US emission, refers to the activity of bub-
bles or micro-bubbles of gas undergoing movement
due to an acoustic field, into the tissue [7]. Every liv-
ing medium contains certain amount of dissolved gas
present in the form of bubble micronuclei. Under the
effect of an ultrasound field, the nuclei expand through
a physical phenomenon known as rectified diffusion
to reach a critical size known as the Blake threshold.
Cavitation phenomena become even more accentuated
as acoustic intensity increases. Bubbles expand up to
their resonant size, and then implode violently. The
energy accumulated by the bubbles is simultaneously
released in the form of a shock wave, with intense heat
(generally from 1.000 K to 20.000 K, or 726.85°C to
19.726°C) and microjets that can introduce speeds of
100 m/s up to 250 m/s through the water medium. All
this leads to the creation of free radicals and mechani-
cal destruction of surrounding tissue.
Thus, there are two types of cavitation: stable cavi-
tation where the walls of the bubbles are oscillating at
the frequency of the ultrasound field without too great
a consequence for the surrounding cells and can appear
at very low pressure levels as soon as bubbles are
present in the medium. Stable (regular) cavitation is
considered to be beneficial to injured tissue. The other
form is the transient cavitation where bubbles expand
up to their resonant size, and then implode violently and
cause tissue damage, [4].
Figure 3. Ultrasound wave characteristics
Amplitude
Propagation
Rarefaction CompressionPressuremaximum
zero
Pressureminimum
1 cycleWavelength
Table 3. Acoustic impedance of different tissues in relation to density and sound propagation. Modified from Wolbarst [33]
MaterialDensity
ρ (kgm–3)
Speed
c (ms–1)
Characteristic
impedance Z
(kgm–2s–1) × 106
Absorption
coefficient α (dB cm–1)
at 1 MHz
Water 1000 1480 1.5 0.0022
Blood 1060 1570 1.62 (0.15)
Bone 1380–1810 4080 3.75-7.38 (14.2–25.2)
Brain 1030 1558 1.55–1.66 (0.75)
Fat 920 1450 1.35 (0.63)
Kidney 1040 1560 1.62 –
Liver 1060 1570 1.64–1.68 (1.2)
Lung 400 650 0.26 (40)
Muscle 1070 1584 1.65–1.74 (0.96–1.4)
Spleen 1060 1566 1.65–1.67 –

HUMAN MOVEMENT
63
P.V. Tsaklis, Acoustic waves propagation
The stimulation effects of US on specific tissues
such as the skin, bone, muscle and vascular, are depend-
ent on the phenomena of heating and cavitation de-
scribed above.
Different intensities of pulsed ultrasound have dis-
tinct biological effects on bone mineralization in the
process of bone fracture repair, even across a narrow
range (e.g. 30–120 mW/cm2), [32]. During high-intensi-
ty focused US administering on or near the skeletal
system care should be taken because thermal damage
can cause osteocyte damage and necrosis, characterized
by pyknotic cells and empty lacunae not just at the bone
surface, but more deeply within the bone [32].
The stimulating effect on bone tissue gives evidence
that low intensity (30 mW/cm2), but not high-intensity
(120 mW/cm2), pulsed ultrasound may accelerate the
formation of the molecular packing of collagen fibers
conducive to mineralization. There is an increased Cy-
clooxygenase COX-2 mRNA expression and PGE2 pro-
duction by osteoblasts in an ultrasound, intensity-de-
pendent manner. This high dose of Prostaglandin E2
(PGE2) induced by high-intensity ultrasound may be
detrimental to the physiological cross-link formation re-
quired for initiation of the mineralization process [32].
Concerning the skin tissue wounds, ultrasound
seems to interact with one or more components of in-
flammation, and earlier resolution of inflammation [34].
In vitro founded an accelerated fibrinolysis and a stimu-
lation of macrophage-derived fibroblast mitogenic fac-
tors. This also leads to a heightened fibroblast recruit-
ment and an accelerated angiogenesis, followed by an
increased matrix synthesis. The collagen fibrils are
more dense and the tissue shows increased tensile
strength [31].
The stimulation effect on the vasculature tissue
points that the ultrasound can be effective during the
early inflammatory phase, after a wound. In the later
phase of repair the ultrasound treatment does not appear
to have any further significant effect on angiogenesis.
In this early phase, the macrophage, which are present
in large numbers in the wound bed and contain factors
which stimulate angiogenesis, are a possible target of
the US. Ultrasound at a low frequency, i.e. 0.75 MHz,
can cause a greater effect on angiogenesis than higher
frequency, i.e. 3.0 MHz, which suggests that there may
be a nonthermal component of the ultrasound involved
in the stimulatory process [35].
The intramuscular effect of the US is associated
mainly with the heating phenomenon and the resultant
increase of blood supply, proteosynthesis and viscoelas-
tisity of the tissue.
Research has established that both 1 and 3 MHz con-
tinuous ultrasound can produce subcutaneous tissue tem-
perature increases of 4°C or greater when the appropriate
ultrasound treatment parameters are selected, including
a treatment area no greater than 2 times the effective
radiating area (ERA) of the ultrasound applicator, [36].
Further research showed that pulsed ultrasound
(3 MHz, 1.0 W/cm2, 50% duty cycle, for 10 minutes) pro-
duced similar intramuscular temperature increases to
continuous ultrasound (3 MHz, 0.5 W/cm2, for 10 min-
utes) at a depth of 2 cm in the human gastrocnemius, as-
suming that pulsing ultrasound precludes the develop-
ment of a heating response in human tissue, as well [37].
Conclusions
Acoustic wave therapy includes extracorporeal
shock waves, pressure waves and Ultrasound waves.
There are distinct differences between these three types
of waves. These mainly refer to the technical way each
type of wave is produced, as well as the physical-me-
chanical characteristics of each modality. The extracor-
poreal shock waves and the pressure waves show typi-
cally the same mechanical characteristics, concerning
the way the wave propagates with big differences in the
amplitude – energy flux and focussing in the treatment
area. Thus, the ESW, are more intense and focused than
the pressure waves, with more mechanical energy re-
leased and consequent biological effects. On the other
hand, the mechanical characteristics of the periodical
Table 4. The biological and resultant effects of therapeutic
ultrasound
Type of effect Result
Thermal Increase in tissue extensibility
Increase in blood flow
Modulation of pain
Mild inflammatory response
Reduction in joint stiffness
Reduction of muscle spasm
Non-thermal Cavitation
Acoustic microstreaming
In combination may result in
stimulation of fibroblast activity,
increase in protein synthesis increased
blood flow, tissue regeneration
and bone healing

HUMAN MOVEMENT
64
P.V. Tsaklis, Acoustic waves propagation
oscillations of the ultrasounds make them differ from
the other two types of waves and the dominant phenom-
enon here is the production of heating energy. All three
types of waves appear to influence and propagate a bio-
logical response from different tissues in the body. This
depends of the protocol (parameters of intensity – time
– energy flux, etc.), the anatomical location and the na-
ture of the tissue itself. Eventually, acoustic waves com-
prise a very useful therapeutic modality with the reser-
vation that the therapist must be familiarized and well
educated on their use and consequent effects.
References
1. Wess O., Physics and technology of shock wave and pressure
wave therapy. ISMST Newsletter, 2006, 2 (1), 2–12. Avaliable
from URL http://www.ismst.com/pdf/ISMST_Newsletter_
2007-01_No2.pdf.
2. Wang C.J., Wang F.S., Yang K.D., Weng LH., Hsu C.C.,
Huang C.S. et al., Shock wave therapy induces neovasculari-
zation at the tendon–bone junction. A study in rabbits. J Or-
thop Res, 2003, 21 (6), 984–989. DOI: 10.1016/S0736-
0266(03)00104-9.
3. Martini L., Giavaresi G., Fini M., Borsari V., Torricelli P., Gia-
rdino R., Early effects of extracorporeal shock wave treatment
on osteoblast-like cells: a comparative study between electro-
magnetic and electrohydraulic devices. J Trauma, 2006, 61 (5),
1198–1206. DOI: 10.1097/01.ta.0000203575.96896.34.
4. Wells P.N.T., Biomedical ultrasonics. Academic Press, London
1977.
5. Dyson M., Mechanisms involved in therapeutic ultrasound.
Physiotherapy,1987, 73, 116–120.
6. Prentice W.E., Therapeutic modalities in sports medicine. 3rd
ed. Mosby, St Louis 1994.
7. Jozsa L., Kannus P., Human tendons. Anatomy, physiology and
pathology. Human Kinetics, Champaign 1997.
8. Odgen J.A., Tóth-Kischkat A., Schultheiss R., Principles of
shock wave therapy. Clin Orthop Relat Res, 2001, 387, 8–17.
DOI: 10.1097/ 00003086-200106000-00003.
9. Chung B., Wiley J.P., Extracorporeal shockwave therapy: a re-
view. Sports Med, 2002, 32 (13), 851–865.
10. Gleitz M., The meaning of the trigger of shock wave therapy
in the treatment of radical cervicalbrachialgia [in German]. In:
53rd Annual Conference of the Southern German Orthopedic
Association e.V. April, 2005, Baden-Baden, abstract, nr. 328.
11. Delius M., Draenert K., Diek Y.A., Draenert Y., Biological ef-
fects of shock waves: in vivo effect of high energy pulses on
rabbit bone. Ultrasound Med Biol, 1995, 21 (9), 1219–1225.
12. Johannes E.J., Kaulesar Sukul D.M.K.S., Matura E., High-en-
ergy shock waves for the treatment of nonunions: an experi-
ment on dogs. J Surg Res, 1994, 57 (2), 246–252. DOI: 10.1006/
jsre.1994.1139.
13. Rompe J.D., Rosendahl T., Schöllner C., Theis C., High-energy
extracorporeal shock wave treatment of nonunions. Clin Or-
thop Relat Res, 2001, 387, 102–111.
14. Schaden W., Fischer A., Sailler A., Extracorporeal shock wave
therapy of nonunion or delayed osseous union. Clin Orthop
Relat Res, 2001, 387, 90–94.
15. Wang C.J., Chen H.S., Chen C.E., Yang K.D., Treatment of
nonunions of long bone fractures with shock waves. Clin Or-
thop Relat Res, 2001, 387, 95–101.
16. Ludwig J., Lauber S., Lauber H.J., Dreisilker U., Raedel R.,
Hotzinger H., High-energy shock wave treatment of femoral
head necrosis in adults. Clin Orthop Relat Res, 2001, 387,
119–126.
17. Wang C.J., Wang F.S., Yang K.D., Biological mechanism of
musculoskeletal shockwaves. ISMST Newsletter, 2006, 1 (l), 5–
11. Avaliable from URL http://www.ismst.com/pdf/ISMST_
Newsletter_2006-03_No1.pdf.
18. Thiel M., Application of shock waves in medicine. Clin Orthop
Relat Res, 2001, 387, 18-21.
19. Wang C.J., Wang F.S., Huang C.C., Yang K.D., Weng L.H.,
Huang H.Y., Treatment of osteonecrosis of the femoral head:
Comparison of extracorporeal shock waves with core decom-
pression and bone-grafting. J Bone Joint Surg Am, 2005, 87
(11), 2380–2387. DOI: 10.2106/JBJS.E.00174.
20. Sparsa A., Lesaux N., Kessler E., Bonnetblanc J.M., Blaise S.,
Lebrun-Ly V. et al., Treatment of cutaneous calcinosis in
CREST syndrome by extracorporeal shock wave lithotripsy.
J Am Acad Dermatol, 2005, 53 (5), Suppl., S263–S265. DOI:
10.1016/j.jaad.2005.04.010.
21. Schaden W., Thiele R., Kolpl C., Pusch A., Extracorporeal
shock wave therapy (ESWT) in skin lesions. ISMST Newsletter,
2006, 2 (1), 13–14. Avaliable from URL http://www.ismst.com/
pdf/ISMST_Newsletter_2007-01_No2.pdf.
22. Meirer R., Kamelger F.S., Huemer G.M., Wanner S., Piza-
Katzer H., Extracorporal shock wave may enhance skin flap
survival in an animal model. Br J Plast Surg, 2005, 58 (1),
53–57. DOI: 10.1016/j.bjps.2004.04.027.
23. Gerdesmeyer L., von Eiff C., Horn C., Henne M., Roessner M.,
Diehl P. et al., Antibacterial effects of extracorporeal shock
waves. Ultrasound Med Biol, 2005, 31 (1), 115–119. DOI:
10.1016/j.ultrasmedbio.2004.08.022.
24. Loshe-Busch H., Kraemer M., Reime U., The use of extracor-
poreal shock wave fronts for treatment of muscle dysfunction of
various etiologies: an overview of first results. In: Siebert W.,
Buch M. (eds.), Extracorporeal shock saves in orthopaedics.
Springer, Berlin 1997, 215–230.
25. Manganotti P., Amelio E., Long-term effect of shock wave
therapy on upper limb hypertonia in patients affected by stroke.
Stroke, 2005, 36 (9), 1967–1971. DOI: 10.1161/01.STR.0000177
880.06663.5c.
26. Fukumoto Y., Ito A., Uwatoku T., Matoba T., Kishi T., Tanaka
H. et al., Extracorporeal cardiac shockwave therapy amelio-
rates myocardial ischemia in patients with severe coronary ar-
tery disease. Coron Artery Dis, 2006, 17 (1), 63–70.
27. Nishida T., Shimokawa H., Oi K., Tatewaki H., Uwatoku T.,
Abe K. et al., Extracorporeal cardiac shock wave therapy mark-
edly ameliorates ischemia-induced myocardial dysfunction in
pigs in vivo. Circulation, 2004, 110 (19), 3055–3061. DOI:
10.1161/01.CIR.0000148849.51177.97.
28. Gann N., Ultrasound: current concepts. Clin Manage, 1991, 11
(4), 64–69.
29. Ziskin M., McDiarmid T., Michlovitz S.L., Therapeutic ultra-
sound. In: Michlovitz S.L. (ed.), Thermal agents in rehabilita-
tion. F.A. Davis Co., Philadelphia 1990, 153–156.
30. Speed C.A., Therapeutic ultrasound in soft tissue lesions – re-
view. Rheumatology, 2001, 40 (12), 1331–1336. DOI: 10.1093/
rheumatology/40.12.1331.
31. Saito M., Fujii K., Tanaka T., Soshi S., Effect of low- and high-
intensity pulsed ultrasound on collagen post-translational mod-
ifications in MC3T3-E1 osteoblasts. Calcif Tissue Int, 2004, 75
(5), 384–395. DOI: 10.1007/s00223-004-0292-9.
32. Smith N.B., Temkin J.M., Shapiro F., Hynynen K., Thermal ef-
fects of focused ultrasound energy on bone tissue. Ultrasound
Med Biol, 2001, 27 (10), 1427–1433.

HUMAN MOVEMENT
65
P.V. Tsaklis, Acoustic waves propagation
33. Wolbarst A.B., Physics of Radiology. Appleton & Lange, Nor-
wark 1993.
34. Young S.R., Dyson M., Effect of therapeutic ultrasound on the
healing of full-thickness excised skin lesions. Ultrasonics,
1990, 28 (3), 175–180. DOI: 10.1016/0041-624X(90)90082-Y.
35. Young S.R., Dyson M., The effect of therapeutic ultrasound on
angiogenesis. Ultrasound Med Biol, 1990, 16 (3), 261–269.
36. Draper D.O., Castel J.C., Castel D., Rate of temperature in-
crease in human muscle during 1 MHz and 3 MHz continuous
ultrasound. J Orthop Sports Phys Ther, 1995, 22 (4), 142–150.
37. Gallo J.A., Draper D.O., Brody L.T., Fellingham G.W., A com-
parison of human muscle temperature increases during 3-MHz
continuous and pulsed ultrasound with equivalent temporal av-
erage intensities. J Orthop Sports Phys Ther, 2004, 34 (7),
395–401. DOI: 10.2519/jospt.2004.1363.
Paper received by the Editors: March 4, 2009.
Paper accepted for publication: June 15, 2009.
Address for correspondence
Panagiotis V. Tsaklis
Anthokipon 19
564 29 Nea Efkarpia
Thessaloniki, Greece
e-mail: [email protected]

HUMAN MOVEMENT
66
2010, vol. 11 (1), 66–70
Introduction
Research shows that child’s development is affected
by such socio-economic factors as parents’ education
and occupation, income and expenditure, financial situ-
ation of the family, number of children in the family,
etc. [1–3]. All these variables affect indirectly children’s
morpho-functional development as elements of ways of
life having a direct effect on the human body. The latter
include dietary habits, incidence of diseases and access
to medical care, amount of physical work, unhealthy
habits and psychical and nervous stress [4, 5]. One of
the categories used to describe the socio-economic sta-
tus is objective quality of life that is the total of goods,
states and situations constituting the general well-being
of individuals [6]. Quality of life is based on statistical
measurements of variables, e.g. income, education level
or number of children in a family, or uses life quality
indices constructed on the basis of these measurements.
Despite extensive research the socio-economic parame-
ters of children’s development remain partially un-
known, especially with regard to children’s functional
traits. There are no studies attempting to rank socio-
economic factors as elements of a synthetic index of
objective quality of life. According to Bielicki et al. [7],
the application of such an index would allow involve-
ment of a larger number of ranked variables in the ana-
lysis of quality of life. Strong correlations between vari-
ables would make it possible to carry out a proper ana-
lysis of variance if all the variables are treated as
factors.
The aim of the study was to examine relationships
between somatic build and motor fitness of children and
adolescents from Jedlina-Zdrój, and objective quality of
life of their families.
Material and methods
The study examined anthropometric measurement
results obtained from primary and middle school stu-
dents from Jedlina-Zdrój in Poland from September to
December 2004. In total 524 school students (277 boys
and 247 girls) aged 8 to 16 years took part in the study
(Tab. 1). The examination was cross-sectional and cov-
ered all students present at school on the days of exami-
nation, i.e. 95% of all students from both schools. All
DOI: 10.2478/v10038-010-0005-3
Daniel Puciato
Chair of Tourism Geography and Economics of Tourism, Opole University of Technology, Opole, Poland
ABSTRACT
Purpose. The purpose of this study was to determine relationships between the somatic build and motor abilities of children and
adolescents from Jedlina-Zdrój and objective quality of life of their families. Basic procedures. 524 children aged 8 to 16 years were
examined. Body height, body mass and three skinfold thickness measurements were taken as well as BMI and LBM were calculated.
The subjects performed the following fitness tests: plate tapping, 10 × 5 m shuttle run, standing broad jump, sit-ups, 1 kg medicine
ball throw and sit and reach. Maximum anaerobic power (MAP) was calculated. The study was completed with a survey questionnaire
of parents on quality of life of their families. Main findings. Mean values of somatic parameters in boys examined represent an
increasing gradient in relation to increasing objective quality of life. In girls the social-economic status of their families affected only
their body height and body mass. In boys the average values of locomotive speed, lower limb explosive strength and maximum
anaerobic ability test results increase along with improving social-economic status of their families. In girls the objective quality of life
has a significant impact only on the upper limb movement speed. Conclusions. The objective quality of life differentiates the somatic
growth of children examined. The social-economic status of children’s families affects subjects’ motor ability, but the correlations are
lower and more multidirectional than in the case of somatic parameters.
Key words: somatic growth, motor ability, objective quality of life
MORPHO-FUNCTIONAL DEVELOPMENT OF CHILDREN AND ADOLESCENTS FROM JEDLINA-ZDRÓJ WITH REGARD TO OBJECTIVE QUALITY OF LIFE OF THEIR FAMILIES

HUMAN MOVEMENT
67
D. Puciato, Morpho-functional development and quality of life
measurements took place in the morning hours, at the
same time each day, on the school premises. The sub-
jects wore sports outfits and had been informed about
the aim and procedures of the experiment.
The subjects’ body height was measured with an an-
thropometer, body mass with a scales and skinfold
thickness with skinfold calipers in three locations: ab-
domen (between the umbilicus and the anterior superior
iliac spine), subscapula (beneath the edge of the shoul-
der blade) and triceps (posterior midline of the upper
arm). The body mass index (BMI) was then calculated
as the individual’s body mass divided by the square of
his or her body height:
BMI =
The subjects’ lean body mass (LBM) was estimated
through known equations with the use of regression co-
efficients [8]. The following physical fitness tests were
carried out: plate tapping, 10 × 5 m shuttle run, standing
broad jump, sit-ups and sit and reach [9]. Also the maxi-
mal anaerobic power (MAP) was estimated according
to the following formula [10]:
MAP = body mass × standing broad jump result
× 9.81 (kg × m2 × s–2 = J)
The examination of children was completed with
a questionnaire survey of the parents on the quality of
life of their families. A modified version of the quality
of life questionnaire for students was used [11]. A pilot
study was conducted on a small group of subjects before
the main questionnaire survey. The survey reliability
index was 0.884. An objective quality of life index was
constructed on the basis of survey data such as number
of children in a family, parents’ education, parents’ oc-
cupation, family type and child’s ways of spending va-
cation using multivariate comparative analysis (MCA)
[13]. The mean values and standard deviations were cal-
culated for individual somatic parameters and fitness
test results in particular age groups. The total sample
was divided into series according to the objective quali-
ty of life index values. The subjects were divided into
three equal-size groups (tertiles), at a low, medium
and high objective quality of life level, respectively.
The statistical significance of differences between the
means of somatic parameters and fitness test results
were determined using ANOVA for independent vari-
ables at p < 0.05. The significance of differences be-
tween the means was also assessed with the least sig-
nificant difference test (LSD).
Results
Objective quality of life significantly differentiated
somatic parameters in boys under study. The mean
body height and body mass, BMI, total skinfold thick-
ness (from three locations) and LBM represented an in-
creasing gradient corresponding to the increasing ob-
jective quality of life index. The statistically significant
differences were found between the groups of boys
from families with the low and medium levels of quality
of life, and medium and high levels of quality of life. No
significant differences between somatic parameters of
boys from families with an average and high socio-eco-
nomic status were found (Fig. 1).
The correlations between objective quality of life
and somatic parameters were less significant in girls.
The socio-economic status of the girls’ families was
a differentiating factor only with regard to their body
height and body mass. The highest values of the param-
eters examined were noted in girls from families with
an average objective quality of life index. The differ-
ences between the groups of girls from families with
low and high quality of life indices were statistically
significant (Fig. 1).
The socio-economic status also affected the locomo-
tive speed and explosive strength of the legs and the
calculated maximal anaerobic power (MAP) in boys.
The mean results of these tests increased monotonically
along the improving socio-economic status of the fami-
lies. However, differences between the groups of boys
Table 1. Subjects’ sex and age
Sex Age (years)
8 9 10 11 12 13 14 15 16
Boys 29 32 41 20 32 31 37 29 26
Girls 35 36 28 22 29 25 23 27 22
Total 64 68 69 42 61 56 60 56 48
body height2
body mass
m2
kg( )

HUMAN MOVEMENT
68
D. Puciato, Morpho-functional development and quality of life
chłopcy
niska średnia wysoka
dziewczęta
niska średnia wysoka
wiek wysokość masa BMI suma fałdów LBM
obiektywna jakość życia
Figure 1. Normalized somatic parameters and objective quality of life in boys and girls
age body height body mass BMI total skinfold thickness LBM
low medium high low medium high
objective quality of life index
girlsboys
0.6
0.4
0.2
0.0
–0.2
–0.4
–0.6
–0.8
chłopcy
niska średnia wysoka
dziewczęta
niska średnia wysoka
krążki skłon skok siady rzut bieg MPA
obiektywna jakość życia
Figure 2. Normalized fitness test results and objective quality of life in boys and girls
plate tapping
low medium high low medium high
objective quality of life index
girlsboys
0.8
0.6
0.4
0.2
0.0
–0.2
–0.4
–0.6
–0.8
sit and reach
standing broad jump
sit-ups medicine ball throw
shuttle run
MAP

HUMAN MOVEMENT
69
D. Puciato, Morpho-functional development and quality of life
with average and high quality of life indices of their
families are not statistically significant (Fig. 2).
Also objective quality of life is a differentiating fac-
tor with regard to the motor test results to a lesser de-
gree in girls than in boys. Only the plate tapping test
results were significantly affected by the objective qual-
ity of life index. The highest locomotive speed results
were obtained by girls from families with the highest
socio-economic status and the lowest results by those
from families with the lowest socio-economic condi-
tions. No significant differences were observed between
girls from families with low and average objective qual-
ity of life indices, which is indicative of the impact of
high quality of life on the development of the locomo-
tive speed (Fig. 2).
Discussion
Individual differences in human morpho-functional
development result from a number of conditions. First
of all, they can be determined by different living condi-
tions of particular individuals in their childhood and
adolescence. On the other hand, these differences can
result from individual genetic predispositions determin-
ing the pace and level of morpho-functional develop-
ment. An important role is also played by interactions
and correlations between the genotype and the environ-
ment [13]. Indirectly the morpho-functional develop-
ment is also affected by socio-economic factors repre-
sented in the present study by a synthetic objective
quality of life index. Certainly, parents’ education or
income level have no direct effect on child’s develop-
ment but rather on the living conditions created for chil-
dren by their parents who have a good education or high
income. Thanks to the good living conditions children
are assured proper accommodation, food and clothes.
Parents’ education affects the child’s hierarchy of val-
ues, increases parental awareness of proper upbringing,
nutrition, leisure pursuits and standards of hygiene [1].
Children from families with a higher socio-economic
status are taller, healthier and enter the pubertal growth
spurt earlier [13]. The environmental impact on the
child is different during particular stages of its ontoge-
netic development. The impact is greater when the de-
velopmental processes are faster. It reaches the highest
level in childhood and pubescence, i.e. two periods of
development studied in the present work [14].
The analysis of biological development of children
and adolescents from Jedlina-Zdrój confirms the exist-
ence of developmental differences between groups of
subjects functioning in different socio-economic condi-
tions. In the groups of boys the somatic traits studied
revealed a monotonic correlation with the objective
quality of life level. Among the girls under study the
highest somatic parameters were found in the group of
subjects from families with an average socio-economic
status. It can be concluded that even average living con-
ditions have a beneficial effect on child’s development.
The lower mean values of body mass and skinfold
thickness in girls from families with a higher socio-eco-
nomic status are indicative of a higher awareness of the
impact of proper dietary habits and physical activity on
health. These results have also a cultural dimension as
they illustrate a common tendency to maintain a slim
figure among teenage girls, especially those from fami-
lies with a high socio-economic status.
Physical fitness consists of somatic, motor, behavio-
ral and genetic components [15]. The correlations be-
tween these intrinsic fitness properties and environ-
mental factors as well as lifestyle point to somewhat
less explicit relationships between children’s motor de-
velopment and the socio-economic status of their fami-
lies. The parents’ socio-economic status has a second-
ary effect on the level of their children’s motor develop-
ment determining their interests, hierarchy of values,
habits and lifestyles. It triggers a transformation of cul-
tural factors (customs, axiological system) into biologi-
cal mechanisms effecting changes in physical fitness.
This can be compared to a conjunction of cultural, so-
cio-economic and biological influences [16]. Parents
who are well-off can enhance their children’s develop-
ment by providing higher living standards, better ways
of spending free time and proper nutrition [17].
The present study revealed a smaller, however sig-
nificant, impact of environmental factors on different
aspects of human motor function. In the groups of boys
the objective quality of life index was a differentiating
factor in relation to the explosive strength of the legs,
maximal anaerobic power (MAP) and locomotive
speed. The boys from families with the highest objec-
tive quality of life achieved the best results of those fit-
ness tests which examined these aspects of human mo-
tor function. Similar monotonic correlations between
socio-economic factors and the level of motor develop-
ment were also noted in other studies, particularly with
regard to results of dynamic tests [16]. In girls the ob-
jective quality of life significantly affected only the
speed of movement of the arms. Although the plate tap-

HUMAN MOVEMENT
70
D. Puciato, Morpho-functional development and quality of life
ping test is designed to examine one’s speed abilities, it
also allows diagnosis of one’s coordination predisposi-
tions resulting from the functioning of the nervous sys-
tem and sense organs as well as from the development
of cognitive processes and intelligence level [18]. It is
hardly surprising that girls from families with the high-
est socio-economic level, who have the best education,
achieved the best plate tapping test results. These obser-
vations were also confirmed in studies by Sławinska
[19] and Szopa [20].
The complexity of developmental processes and the
multitude of factors affecting them point to the necessi-
ty to conduct further research into the environmental
conditions of children’s and adolescents’ somatic devel-
opment. Such studies should not be confined to local or
regional communities but also cover much larger popu-
lations.
Conclusions
1. Objective quality of life is a differentiating factor
with regard to children’s level of somatic develop-
ment. Children from families with average or high
quality of life indices feature the highest values of
morphological parameters examined.
2. The socio-economic status of families also affects
children’s motor fitness; however, the revealed cor-
relations are lower and more multidirectional than
the correlations with the somatic parameters.
References
1. Bielicki T., Welon Z., Żukowski W., Problems of biological in-
equalities within social classes [in Polish]. Materiały i Prace
Antropologiczne, 1988, 109, 123–140.
2. Ignasiak Z., Sławińska T., The age of menarcha in country girls
from Lower Silesia in 1991 [in Polish]. Studia i Monografie
AWF, Wrocław 1993, 36, 75–79.
3. Szopa J., Sakowicz B., Differentation of the relative level of
physical ability in Cracow girls and boys aged 8–18 years de-
pending on selected social and family indices [in Polish]. Wy-
chowanie Fizyczne i Sport, 1987, 1, 17–45.
4. Bielicki T., Welon Z., Growth data as indicator of social ine-
qualities: The case of Poland. Yearbook of Physical Anthro-
pology, 1982, 25, 153–167.
5. Hulanicka B., Biological state of the Polish population from the
anthropologist’s point of view. In: Hulanicka B., Tyczyński J.
(eds.), The Poles’ state of health [in Polish]. Monografie
Zakładu Antropologii PAN, Wrocław 1996, 15, 43–66.
6. Dmoch T., Rutkowski J., Analysis of living standards and
quality of life [in Polish]. Wiadomości Statystyczne, 1985, 10,
27–31.
7. Bielicki T., Szklarska A., Kozieł S., Welon Z., Transformation
in the political system in Poland in the light of anthropological
studies among 19-year-old men [in Polish]. Monografie
Zakładu Antropologii PAN, Wrocław 2003, 23.
8. Żak S., Coordinative abilities of children and young adults
from urban populations and their selected somatic parameters
and physical activity [in Polish]. AWF, Kraków 1991, 43.
9. Grabowski H., Szopa J., Eurofit. European Fitness Test [in
Polish], AWF, Kraków 1988, 103.
10. Januszewski J., Ontogenetic variability of maximum anaerobic
work – results of comparative studies [in Polish]. Antropomoto-
ryka, 1992, 8, 75–87.
11. Rusnak Z., Kozyra C., Example of survey research of the stu-
dents’ quality of life [in Polish]. Przegląd Statystyczny Śląska
Dolnego i Opolskiego, 2001, 6, 7–16.
12. Dziechciarz J., Econometrics. Methods, examples, tasks [in
Polish]. Wydawnictwo Akademii Ekonomicznej, Wrocław
2003.
13. Bielicki T., Szklarska A., Welon Z., Brajczewski C., Social ine-
qualities in Poland: anthropological research of recruits, 1965–
1995 [in Polish]. Monografie Zakładu Antropologii PAN,
Wrocław 1997, 16.
14. Tanner J., Education and physical growth. International Uni-
versities Press, New York 1978.
15. Pytel A., Kołodziej H., Charzewski J., Przewęda R., Environ-
mental modificators of body height and physical ability in boys
[in Polish]. Wychowanie Fizyczne i Sport, 1995, 3, 29–32.
16. Charzewski J., Przewęda R., Selected social conditions of
physical growth and ability of Polish children. In: Pilicz S.
(ed.), Development of physical ability and efficiency of children
and young people [in Polish]. AWF, Warszawa 1988, 36–58.
17. Przewęda R., Environmental conditions of human motor func-
tion. In: Osiński W. (ed.), Human motor function – its structure,
variability and conditions [in Polish]. AWF, Poznań 1993, 310,
161–174.
18. Ljach W., Starosta W., Influence of inborn and environmental
conditions on changeability of human coordination abilities [in
Polish]. Wychowanie Fizyczne i Sport, 2002, 4, 497–510.
19. Sławińska T., Environmental conditions in motor development
of rural children [in Polish]. Prace habilitacyjne AWF, Wrocław
2000.
20. Szopa J., Searching for motor structure: factor analysis of so-
matic, functional features and physical ability tests in boys and
girls aged 8–19 years. AWF, Kraków 1988, 35.
Paper received by the Editors: April 23, 2009.
Paper accepted for publication: November 17, 2009.
Address for correspondence
Daniel Puciato
Katedra Geografii i Ekonomiki Turystyki
Politechnika Opolska
ul. Prószkowska 76
45-758 Opole, Poland
e-mail: [email protected]

HUMAN MOVEMENT
71
Introduction
This work is a voice in the ongoing discussion about
how to educate a teacher–health educator. Everybody
agrees that it is necessary to work out such an approach
which would guarantee an efficient implementation of
the theoretical assumptions of goals and tasks in the
contemporary model of health education. A lot of
factors indicate that a role of health educators should be
assumed by teachers of physical education.
Speaking about a contemporary teacher I use the
terms profession, professionalism to make distinction
from vocation. Professionalism requires a constant buil-
ding up of processual knowledge based on university
education, which enables the teacher to gain the level of
competence indispensable for efficient functioning in
open educational situations. The term vocation indicates
just learning a set of closed and predefined skills, which
can be acquired by modeling and repeating. The skills
assume behavioral patterns in school situations, also
seen in a schematical way, which reduces a possibility
of modifying actions.
If one wants to know if it is possible to introduce the
Education for change model in the reality of today’s
school, they had better asked about the teacher’s
professionalism and his ability to introduce changes.
In this work the emphasis is not put on the teacher’s
professional preparation (though it is necessary to
discuss the contents related to health issues in the
teacher training curricula), which is essential, but on its
credibility in the pupil’s eyes. My deliberations regard
the teacher’s competence in his professional knowledge
which makes realization of the goals and tasks in health
education (im)possible. Contemporary theoreticians
underline the fact that one of the goals of school health
education related to physical health is an improvement
of the individual’s empowerment understood as an
ability, power and competence to control his own health
and to make the right choice concerning his and others’
health. Empowerment means taking actions consciously
based on full comprehension and inner conviction about
their value. Such an assumption requires that the teacher
should create a possibility for young people to search,
for their own forms of physical activity, to develop the
DOI: 10.2478/v10038-010-0010-6
Joanna Malinowska
Institute of Pedagogy, University of Wrocław, Wrocław, Poland
ABSTRACT
Purpose. To question the possibility of following the Education for change model in contemporary schools is, in fact, to question the
teachers’ professionalism and readiness to introduce changes. Professionalism involves a constant building up of processual
knowledge based on academic education. It allows the teacher to build up the necessary competence to function effectively in open
educational situations. The term vocation is limited to a set of closed, predefined skills which one can acquire by modeling and
repetition. These are patterns of behavior in schematically perceived school situations. This view of the teacher’s role limits the
possibilities for the modification of those patterns. Basic procedures. I discuss the readiness of teachers in terms of their professional
knowledge as well as in the context of the (im)possibility of realizing the tasks and goals of health education. I focus on the structure
of this general, professional and normative knowledge. Due to its quality changes can be introduced in the educational process. This
is connected to the question of understanding, and forms the basis for the teacher’s conscious decisions. Results. The issues which
the teacher has to confront with his or her professional knowledge are subjective in character. They relate to the creation of good
relations between the teacher and the pupil. They are connected to the learning environment which, in turn, conditions the pupil’s
own level of activity and involvement. In this article I also discuss the conditions related to the building up of the pupil’s senses of
subjectivity and competence. Conclusions. Based on the above, I point out three complementary areas for the necessary changes in
the preparation of health educators. The change goes from the perception of oneself as an object steered from the outside to the
perception of oneself as an active subject of the occurring changes.
Key words: teacher’s professionalism, professional knowledge, sense of subjectivity, sense of competence
HEALTH EDUCATION IN THE TEACHER TRAINING PERSPECTIVE – THE AREAS OF CHANGES
2010, vol. 11 (1), 71–80

HUMAN MOVEMENT
72
J. Malinowska, Training teachers for the Education for change
need for exercise and, in consequence, their empower-
ment becomes stronger.
The difference consists in a shift:
• from teaching to learning,
• from steering (compulsion, imposing) to offering
(freedom of decision, freedom of choice),
• from the pupil as an object of the teacher’s influence
to the pupil as a co-participant in the process of edu-
cation,
• from a strategy of rivalry to a strategy of coopera-
tion.
Literature on teacher training calls for a change,
which implies abandoning training (i.e. vocational
preparation) for teacher education (professionalism) [1,
pp. 309–310]. The expected effect of the change would
be the interpretative openness of health educators to the
pupils’ multiple worlds of meanings, reflection on ac-
tions and a constant redefining of events which would
replace the pedagogical routine based on one variant of
activity. It is difficult to introduce changes without tak-
ing into consideration the kind, structure and quality of
the teacher’s professional knowledge.
Material and methods
The teacher’s professional knowledge consists of
three kinds of knowledge: general, specialist and nor-
mative. Each kind of knowledge has two layers: an in-
formation layer, which answers the question “what are
the things like” (it is a basis for declarative knowledge
of the type ”I know that ...”, which can only describe the
educational world and assumes the character of techni-
cal, statistical knowledge comprising a set of skills
learned by repetition), and a scientific layer – “why are
the things like this” and “I know how to make use of
this” (explanatory and interpretative knowledge). The
latter layer of knowledge allows making changes during
the pedagogical activity, because it is related to compre-
hension, as well as it is “the basis for the teacher’s con-
scious decisions” and “the source of empowerment” of
his actions [2, p. 53]. The specialist knowledge about
the pupil and the ways of interaction in the interpersonal
and task-oriented spheres, about the reasons why
various social groups are established also comprises the
knowledge about oneself. The specialist knowledge is
not only identified with the set of certain facts, but also
with the structure of the facts which are important for
the course of the educational process. The specialist
knowledge is the basis for improvement of pedagogical
skills in arranging a social environment of the class, in
providing support and help to pupils, in overcoming the
distance, in learning to listen, in solving problems, in
setting in motion group processes which will help pupils
cooperate in setting norms and to assume responsibility
for the process of learning.
The normative knowledge [3, pp. 110–113] concerns
openness to the other people’s worlds of meanings and
helps to keep a balance in relationships: me – teacher and
you – pupil. It is essential because it refers to what the
teacher thinks to know or what he believes in owing to
the values accepted by the teacher. The knowledge is fun-
damental to unite three words: me – you – us [4, p. 193].
It is connected to the teacher’s responsibility, as a mem-
ber of the community, for what he says. Due to it the pu-
pil learns how to interpret and understand others’ inten-
tions, as well as he develops an ability to interpret. In this
way, meanings flow between the worlds Me and You cre-
ating a common understanding of terms; that is the world
Us. The process of achieving the common understanding
of meanings and values proceeds with a mutual respect
to either of the worlds.
The values which the teacher appreciates have an
influence on his pedagogical activity in different ways.
As a rule, they determine his decisions taken during the
educational process. His beliefs, based on the system
of values adopted by him, cause a rejection of certain
solutions in school situations on a priori grounds, so
he can choose only from among a few (even if he does
not express explicitly his principles).
The system of knowledge understood in this way is
close to Kwaśnica’s concept [5, pp. 16–17]; according to
him there are two types of knowledge: practical-moral
and technical, which are fundamental to acquire two
groups of competence. The first group comprises practi-
cal and moral competence and the second technical com-
petence [5, pp. 17–20]. The practical and moral knowl-
edge (desirable by the modern model of health education)
is acquired by the teacher in a practical communicative
activity; it allows him to ask “about the conditions which
enable communication by dialogue” [5, p. 17]. The struc-
ture of the competences is built by ability to empathize
with another person and accept him unconditionally,
ability to criticize as a means of search for hidden beliefs
and conducts, a non-directive attitude, a personal point
of view as one of the possible answers.
The quality of the teacher’s professional knowledge
is important for the effectiveness in handling various
school situations. Problems the teacher has to confront

HUMAN MOVEMENT
73
J. Malinowska, Training teachers for the Education for change
his professional knowledge with are of a subjective
character; they concern the ability to create good rela-
tionships between the teacher and the pupil, as well as
favorable conditions for the pupil’s own activity, that is
a sense of subjectivity and a sense of competence.
People develop a sense of subjectivity and an inter-
dependent on it sense of responsibility during school
experience. An assessment of themselves and others is
a consequence of the knowledge resulting from their
own reasoning and the belief that their conduct is right,
which has a positive influence on the self-esteem. In
order to favor the development of subjectivity, some
definite conditions have to be fulfilled; among others,
Straś-Romanowska indicates two principle ones. The
first condition consists in giving the pupil a possibility
of knowing himself genuinely and recognizing his di-
stinct identity by discovering his interests and preferen-
ces. That is possible due to the teacher’s non-restrictive
requirements, acceptance of individuality of each parti-
cipant in the educational process, encouragement to
make use of subjective experience, thoughts and feel-
ings. The second condition consists in encouraging the
pupil to articulate and review his own beliefs, and to
consider them while taking a decision. Due to such an
attitude the pupil tends to have a sense of psychological
integration, because a conviction of doing right raises
the sense of self-esteem [6, p. 24]. It is necessary to
create an atmosphere of psychological security (sense of
acceptance) and to offer the pupil opportunities to expe-
rience positive relations between his activity, effort,
action and the result achieved (sense of causation).
If the teacher’s professional knowledge and compe-
tence are reduced to the level of practical teaching
skills, it will mostly lead to teaching by imparting
the knowledge, instructing the pupil, which creates a dan-
ger of associating the process of learning with school
activity and, in consequence, will not have any influen-
ce on his life outside school. In extreme cases, it may
encourage the teacher to take up manipulative actions,
where the pupil is treated as an object (when in a given
time it is necessary to achieve complex goals, known
only to the teacher). The pupil brings with himself the
experience gained at home, within his peer group and
often has knowledge based on commercial messages.
This is the child’s first-hand knowledge, therfore he
refers to it while acting. If the new knowledge presented
to the pupil at school is too much different and distant
from his experience, it will be perceived as too the-
oretical, i.e. useless in practice. The best way to check
“the truth of the knowledge” is to verify if it is useful
in practice. Therefore, the knowledge possessed by
the pupil and his current beliefs can become an
“epistemological obstacle” in forming and reforming
his knowledge and attitudes, and contribute to the
educational results far from the expectations.
The teacher can avoid the threat by treating the pupil
as a subject, reflecting on the pupil’s real needs and
rights as well as on a sense of mutual relationships,
which should favor development and realization of the
pupils’ constructive capacities. However, this is both es-
sential and hard to achieve, because in spite of numer-
ous fixed elements, educational situations are unique
and open as the participants are different entities. An
important role in helping the pupil be perceived as
a subject is played by interactions constructed on the
principle: mutual giving and receiving, as well as
changing roles played in the interactive system. They
indicate the man’s real causation and determine the
level of his subjective activity [7, p. 47]. The teacher in-
teracts with many subjects, each with a separate per-
sonality; therefore, every situation requires openness to
many worlds of meanings. The goal of the interactions
teacher–pupil, pupil–teacher is an intention of reaching
a point where both parts agree to work on a common
world interpretation [5, p. 18]. Interaction is a technique
used in achieving an agreement during mutual negotia-
tions. It becomes even more important when the school
and the teacher are not the only source of information,
so the teacher has to stand up to the knowledge already
acquired by the pupil and the meanings fixed in his
mind [8, p. 73].
The teacher influences the pupil not only by words,
gestures, conducts and interpretation of the world. In
this context, it is not indifferent what philosophy he re-
fers to. It is worth asking a question if the pupil is per-
ceived by the teacher in the educational process as free
and internally controlled human being or if he is a pre-
determined one. The paradigm of the subject-oriented
education assumes a creative development of personal-
ity and shaping individuality of the pupil by making
him participate in various forms of activities [9, p. 58].
Results
Education for change is geared to help both the tea-
cher and the pupil discover and realize their own sub-
jectivity; it is particularly directed to free the pupil from
the relationship of domination and the mechanism of

HUMAN MOVEMENT
74
J. Malinowska, Training teachers for the Education for change
selection prevailing in the school. To favor a change for
better, it is advisable, among others, to ask crtitcal que-
stions about the goals and contents of education. The
process of subjecting is possible if a subject assessment
standard is accepted, whereas it is impossible in case of
an object assessment standard. Therefore, it is important
in which assessment standard the teacher works, what
experience he has had in building up his own subjectivity
in the course of education. The two standards are in con-
trast. Accepting Obuchowski’s approach [10, pp. 3–15] to
the subject assessment standard, the teacher sees himself
as a source of his behavior; the personal goals as a subject
of his intentions, and the world around as an opportunity
for his abilities. Due to such an approach all choices are
the effect of reflection on himself. The object assessment
standard manifests itself in a form of certain predefined
stereotypes and due to that the teacher sees himself as
somebody who fulfills the criteria of the assigned social
and professional role; the goals are identified with duties,
and the world around is seen as an area of duties to fulfill.
As a result, the teacher doing tasks ascribed to his “role”
evades responsibilities for the actions.
Balicki broadens this approach by adding a mixed
assessment standard, which is characterized by an am-
bivalent judgment of oneself, duality of goals (on the
one hand they are imposed, official ones, on the other,
personal, private goals) and the vision of the world as an
area both of obligation and an opportunity for self-reali-
zation [11, pp. 59–60]. According to Puślecki in the Po-
lish school prevails the object assessment standard. It is
so because of the system of rigid and complex behavio-
ral patterns, which often do not allow individuals to
choose between their desires and the external demands;
as a result, they lead to passivity and lack of reflection
[12, p. 17]. Subordination to the assigned role eliminates
conscious direction of one’s destiny. Kwiatkowska pre-
sents the teacher who works in that standard as the one
who does not tolerate doubts and, in consequence, does
his best to eliminate them, mostly by categorizing and
standardizing the situations [13, p. 119]. This is the tea-
cher who expects obedience, who does not support op-
position, who identifies goals with duties, who thinks in
terms of stereotypes, who gives marks arbitrarily – good
or bad. Due to that the atmosphere created in the class
does not favor an involvement of individuals, because
the teacher does not accept the pupil who has doubts
and opinions different from his.
The teacher who adopts the subject assessment
standard allows the pupil to express his individuality.
Thanks to it the teacher creates situations favorable for
individuals to get involved, check their capacities, take
decisions and predict effects of their choices, in other
words, they are given an opportunity to be subjects.
The teacher’s convictions, in practice, are expressed
by the adopted style of managing a class of pupils,
which is an effect of the mix of professional knowl-
edge, accepted educational philosophy, personal pro-
fessional and life experience and personal qualities.
The views on various ways of learning, individualiza-
tion of education, treatment of oneself and the other
participants in the educational process as subjects have
an influence, to a great extent, on the style; all of them
create a social climate in the class and enable us to set
the conditions, mentioned above, necessary to develop
a sense of subjectivity. American literature on the sub-
ject presents seven styles of managing a group of pu-
pils [14, pp. 62–65]:
• the assertive style when the teacher gives support
and warmth to all the pupils; it requires formulation
of clear expectations defined by the teacher in the
form of rules to observe by all the participants in the
educational process, the teacher included; pupils are
aware that the teacher expects them to behave in
a defined way and that they are responsible for their
conduct; knowing the binding rules pupils can as-
sess their conduct by themselves;
• the style which focuses on school achievements also
requires clear communication; work organization
and feedback information given to pupils during les-
sons are always subordinated to their achievements
of a high level of competence; the teacher is required
to apply different ways of knowledge acquisition and
to know motivating techniques;
• in the style geared to modify pupils’ conducts, the
teacher is an endless source of rewards and punish-
ments; he disciplines, corrects pupils’ conducts by
giving them frequent feedback information; the
teacher decides about the reward or punishment,
therefore all his conscious and unconscious con-
ducts, verbal and non-verbal, become a source of re-
inforcement;
• the style geared to manage a group; it puts emphasis
on an immediate reaction to the group’s conduct in
order to avoid serious problems; pupils are expected
to fulfill well their school duties resulting from the
fact that they are school-goers; the teacher should
communicate clearly what is desirable and what is
not; the teacher’s goals are strictly related to his role;

HUMAN MOVEMENT
75
J. Malinowska, Training teachers for the Education for change
the style develops in pupils a feeling of making
progress and provides them with challenging tasks;
• the style geared to manage with the help of the
group; the teacher is required to know and under-
stand the needs and interests of the group in order to
have a better influence on its conducts; without this
knowledge, in aspiration to make changes in an indi-
vidual’s conduct, the teacher may cause improper
relationships among pupils; must be aware that his
conduct has an influence on the group;
• the style focused on pupils’ achievements; it gives
them possibility of making choices in accordance
with their own predictions about the positive or neg-
ative results; to experience a sense of high self-es-
teem and success is the determining factor in mak-
ing good decisions; as a result, the pupils’ sense of
responsibility rises; the teacher only suggests and
gives hints, has a role of an assistant offering help;
• the style geared to give acceptance; it is based on the
assumption that people have an inborn need for ac-
ceptance; the teacher claims that for pupils it is more
important to feel a member of the group than to
learn; the teacher encourages and supports pupils in
their efforts, does his best so that pupils could expe-
rience immediately the consequences of improper
conducts, which favors self-discipline; underlines
the pupils’ strong points, does not allow the applica-
tion of a trial-and-error method, uses an error-and-
correction method, instead.
From the above presentation it results that the styles
differ in proportions of preventive actions and interven-
tions, a degree of control and supervision on behalf of the
teacher as well as an orientation towards the task or the
pupil. A method of realization of the adopted style can
limit or support the process of forming the pupil’s subjec-
tivity, which depends on the teacher’s competence.
There are also examples where subjectivity is treated
as a demand for education. They function in a form of
tasks assigned to school and the teacher. Among the
general educational and didactic demands presented by
Puślecki, there are a lot of hints for teachers (the total
number is 140) about how to create the climate of free-
dom [12, pp. 77–84]. His list is so detailed because he
realizes that teachers accept the idea of subjectivity, but,
in practice, are not able to apply pedagogical actions
which determine the real subjectivity. That is why it ex-
ists only in declarations. The pupil, during traditional
sports lessons, has a limited possibility of creating
a positive image of himself and to experience a sense of
being a subject, mostly due to the teacher’s “instructive”
approach to education. Even the teacher who agrees
with the idea of subjectivity, but who applies routine
educational solutions, e.g. verbal, may treat the pupil as
an object by creating difficult situations (e.g. marks in
physical education), where the pupil is considered week,
clumsy, which will result in a fall in self-esteem. When
the pupil experiences such an interaction with the teach-
er, his sense of causation and the subject-oriented devel-
opment are at risk.
It is possible to find internal and external sources of
attitudes towards subjectivity. The internal source is
a human aspiration to ideals resulting from the personal
vision of the world and the image of oneself. School and
the teacher are an exteranal source; they can increase
the probability that the pupil feels as the subject or re-
duce his chance in this matter.
Another, equally important, factor which determines
the building up of an active attitude towards health is
a sense of competence. It is the teacher’s duty to help
the pupil to build up a feeling that there is a sense in his
activity and to experience relations between decisions
and his and others’ well-being, between health and a life-
style. This goal is usually reached by engaging the
pupil’s personal resources and skills, by motivating him
to make an effort. Therefore, help should include an or-
ganization of a situation favorable for mutual learning
(peer tutoring), so that the pupil can make use of va-
rious experiences and competence of all the participants
in the educational process (learning based on coopera-
tion strategy). It is necessary to create educational situa-
tions based on the pupil’s real development needs, his
knowledge and opinions included.
Erikson places pupils aged between 12 and 16 in the
phase which is the most important for the development
of the man’s identity [15, p. 139]. A child gets to know
the world and the teacher becomes his intermediary in
gaining experience and creating a vision of the world,
because the main form of activity is learning subordina-
ted to the school system, which becomes the source of
successes or failures. Pupils ask penetrating questions.
Looking for the answers involves criticism, often rejec-
tion of the current authorities. They assume a wait-and-
see attitude towards the teacher, though they can be per-
sistent if they really care about something [16, p. 335]. At
this age individuals can manifest both childish “me”
conducts (expressed by e.g. excessive demands or irre-
sponsible actions) and highly responsible and mature
conducts.

HUMAN MOVEMENT
76
J. Malinowska, Training teachers for the Education for change
Growing up, young people are becoming aware that
not all problems are simple and easy to solve. They
know their minds are inmature, so they do not give their
opinions hastily. Sometimes, the hesitation is so intense
that even simple situations seem complicated to them
and they leave adults to make judgements about the
things. At this age they are already able to analyze their
brains’ activities, which favors the creation of a concep-
tion about themselves. Pupils are capable to set up long-
term objectives, therefore their activities take on an or-
ganized and planned character. The direction of activi-
tiy changes: from the natural and material world to the
inner world. A need to perform deeds or even feats be-
comes evident [17, p. 180]. Activity also takes on a group
form. It is the period when cooperation with peers creates
an inner need to treat other people in the way they
would like to be treated.
At this stage of development a child is character-
ized by increased emotional excitement, irresoluteness
and ambivalence of feelings. The fear of social expo-
sure and failure becomes more intense. The lack of
self-confidence and the embarrassment in various every-
day situations are typical symptoms. In this period it
can be observed that some teenagers tend to treat their
own experiences excessively as if they were unique.
They are more interested in peer relationships, at first,
single-sex. It is time when a sense of community is
born: “we” against “them” (adults, teachers). Growing
up, they become more and more self-contained, they
feel a need for more freedom and they change their at-
titudes towards adults, from blind acceptance to criti-
cism, and even contrariness. Criticism is uncom-
promising; they notice, first of all, faults omitting
achievements. They point out an evident discrepancy
between the theory and the practice in the everyday
life, especially in adults’ conducts. They can clearly
see injustice and every sort of social discrimination.
On the other hand, it is a period when children develop
and maintain positive indentification with those who
are competent. Then, they aspire to and acquire per-
sonal independence. The aspiration is manifested in
various forms, often by opposing the authorities of the
adult world.
The phase of adolescence is an important period for
search of a personal identity. It is expressed by taking
up various trials to find and manifest their own unique-
ness. Since the task is still too difficult, at this stage
teenagers identify with many TV celebrities, sports
idols and members of youth organizations. Faithfulness
to the idols is a source of a growth in self-esteem and
self-confidence.
Children, constantly judged by teachers and other
adults, begin to compare with each other. The point of
reference is a peer group. At the same time, they become
more realistic in judging themselves, especially girls’
self-assessments are appropriate to the reality. A self-
assessment is built both by positive and negative infor-
mation. Due to them children know their good and bad
sides. Therefore, the image of oneself is a structure in
active and constant development. A psychological self-
portrait created by a child is based on “reflected perso-
nality” – he adopts the point of view of other people; in
consequence, he cares about other people’s opinions
about himself. He is also able to judge the efficiency of
his actions [18, p. 521]. At the same time the growing
self-consciousness results in a fall in self-acceptance.
The main factor having an impact on the way one per-
ceives oneself as a pupil is the information received
from the teacher. The processes of extending the range
of perfomed roles and broadening “the radius of social
interactions” condition the psychosocial development of
a child [15, p. 144]. They allow him to be an organizer,
observer, performer, and from that perspective to build
up the vision of himself. It is a long lasting process.
When the offer of roles is not attractive enough or when
the range is limited, some undesirable phenomena may
occur, for example, identification with the values coun-
ter to those socially accepted, manifestation of being
“nobody” in the world of authorities.
According to Erikson, a child demands a confirma-
tion of his own consonance with the social expectations
as to competence, perfection and actions according to
the defined rules. The point of reference for a sense of
consonance is its accordance with the requirements of
the adult world. Recognition in the adults’ eyes rein-
forces a self-esteem, “a sense of competence”; lack of
recognition causes a sense of unsatisfied expectations
and a feeling of being worse than others. However, in
extreme cases an increase in competence may lead to an
excess of consonance, as was defined by Erikson. Thus,
a child may be in a situation where an excessive sense of
duty will cause him to behave exclusively to satisfy the
social expectations denoted by the role performed.
Erikson claims that in no other period of life a child is
so disposed and ready to learn quickly and to take full
advantage of the relation with the teacher. The child’s
activity and aspirations to “setting in motion” under-
lined by psychologists [15, s. 140], and readiness to

HUMAN MOVEMENT
77
J. Malinowska, Training teachers for the Education for change
achieve satisfaction resulting from the determined per-
sonal relationships make up the readiness to confirm
his competence. This potential of pupils must not be
neglected. They should be trusted and given a sense “of
being together with them on their side”.
Discussion
Looking from this perspective at the development
potential of children, one may expect that with the help
of the teacher they are able to build up a proper attitude
towards their activity and high competence, which will
allow them to take independent decisions and responsi-
bility for them, to assess critically, to cooperate with
others and be creative. Health education conveys this
message: ability to create attitudes favorable for lifelong
physical activity is a basis for the quality of human life.
The teacher’s educational activity consists in helping
the pupil wrestle with the world so that when he com-
pletes his education and he does not have to go to school
any more and there is no teacher educating him, still he
will want to be active in all his life. Helping is always an
interference in another person’s world and it is connect-
ed with the danger of overstepping the boundries of the
pupil’s world. In educational practice there are two ways
to help pupils: assisting as steering and assisting as of-
fering. Accepting one or the other method results in dif-
ferent effects. Each method of assisting has its own out-
look on the world and different values [19, pp. 8–9]. The
teacher and the chosen method of assisting pupils are
means of conveying values. Looking at the teacher’s at-
titude and the way he helps them, pupils will compre-
hend what is valuable, which is the right way to live and
to treat other people, what attitude and what sort of ac-
tivity is socially desirable. What pupils will learn – pas-
sive acceptance or active criticism, repeating informa-
tion or making use of it, giving the Only Right Answer
or searching for other possible ones, rivalry or coopera-
tion, obedience or also reflection – depends, to a great
extent, on the way of acting that the teacher applies.
From the point of view of a possibility of building up
a sense of competence, such help becomes less effective
if the pupil’s right to decide about his actions is limited.
A situation in which the pupil has to take a decision pro-
vokes in him certain anxiety, hestation, doubt. However,
this is a desirable state, because it requires critical
thinking, considering consequences of the chosen solu-
tion, so it plays an important part in learning, aspiring
to independent discoveries of his desires and preferenc-
es. In this way, the pupil becomes a researcher of the
reality around, who tries to comprehend phenomena.
Such an attitude helps him not only to discover interela-
tions among the phenomena, but also to understand his
own actions; in consequence, it leads to ability to make
use of experience in situations in real life. The pupil
bases his intentions on a strong conviction that he can
influence events, which helps him to gain confidence in
his capacities.
What consequences can result from the form of as-
sistance to the pupil adopted by the teacher? In the case
of steering, the teacher’s assistance consists in indicating
pupils the right – in the teacher’s opinion – way to solve
the problem. Such help often means providing a pattern
or algorithm of the answer, whereas pupils are required
to follow faithfully the track, the teacher’s way of think-
ing. In educational practice this way of help is expressed
by an application and object-oriented method of activity,
characterized by the teacher’s narration, monologue of
meanings, “dogmatism, fundamentalism, and replacing
thinking by confessing” [20, p. 110]. The axiological
base for this form of help is the assumption that the
teacher understands the world better and, for pupils’
sake, has the right to demand that pupils follow his rec-
ommendations; since he knows what is good for pupils,
the teacher is obliged to give the right directions other-
wise pupils will make mistakes. In other words, it is an
arbitrary statement what is good and right. Therefore,
pupils know only one solution provided by the teacher.
They are also given information that they cannot achieve
anything on their own, which results in the syndrome of
“learned helplessness”, as pupils learn not to take up any
action and to wait for help passively. For pupils’ sake, the
teacher controls their way of thinking and acting. From
the perspective of communication the teacher’s steering
becomes of manipulation-like pattern. In this pattern the
teacher makes use of pupils’ emotions and needs in or-
der to urge them to take actions in accordance with his
expectations and at the same time makes them think that
they do it on their own initiative. There is another aspect
of this form of help. If, in fact, it is the teacher who takes
decisions instead of pupils and imposes them his way of
acting, is he prepared to take responsibility for the con-
sequences of the actions (not)taken by pupils? Can the
teacher be brought to justice?
The axiomatic base for the other form of help is
completely different; it is offering. The fundamental as-
sumption is that every man, the pupil included, is creat-
ing his own knowledge in the process of constant inter-

HUMAN MOVEMENT
78
J. Malinowska, Training teachers for the Education for change
pretation of the arriving information. In this way, the
pupil reaches his own comprehension of the world.
Therefore, if the pupil needs help, it should consist in
giving him possibility to search, creating the conditions
which would contribute to broaden his knowledge. Such
an approach accepts a right to make mistakes, to learn
by a “repeated trials-and-search” method, to correct
own mistakes, so that the pupil would not acquire a “ra-
dar orientation”, i.e. guessing “what the teacher means”
[21, p. 33]. Help does not consist in imposing ready
made solutions and interpretations as the only right
ones. The offering teacher presents his point of view or
solution as one of the possible ones. It is typical of criti-
cal and reflexive way of teacher’s activity, related to the
interactive and problem education. Offering means
multiplication of alternatives which can be used by the
pupil. It is always an offer to choose from. To help pu-
pils the teacher should share his experience with them,
to start a dialogue of meanings, to encourage an ex-
change of opinions and experiences, to make them cre-
ate their ideas; in order to make the prediction of conse-
quences of the selected solutions easier for them, they
should be encouraged to be critical about themselves;
anyway, a decision must be left to pupils.
It should be added that the man is fully active only
when he acts fully convinced, when accepts the solu-
tions and rules. He will not accept them under an obli-
gation and control. In order to educate an active man of
a “health caring personality”, one should propagate so-
cial norms in an offering form, so that the pupil could
have an opportunity to interpret them personally and
accept. The recognition of norms and values by the pu-
pil as his is possible when the relationships teacher – pu-
pil is based on partnership. They will have sense if they
are established in action.
Based on these assumptions an offering teacher in-
troduces didactic and educational principles of his ac-
tivity. The first ones include the principle of avoidance
of imposing ready made interpretations on the pupil and
the principle of making use of after school sources of
knowledge. The principles of trust and respect for the
pupil’s rights are included in the educational principles.
Undoubtedly, the pupil needs assistence, but not by
means of taking decisions for him, rather by creating
favorable conditions for his own search. Being a helpful
and responsible teacher consists in such acting that ena-
bles the pupil to act.
An important element supporting reinforcement of
a sense of competence is an application of a learning-
by-cooperating strategy. It should replace competition
and rivalry, so deep-rooted in Polish schools. Educa-
tion for rivalry does not have any social justification; it
encourages egoistical attitudes, stigmatization of less
able people, hierarchization, entrust. For the people
who experience to be “out of the podium” there are
created anti-conditions to work on their self-esteem,
a sense of competence or a sense of security. Achieving
objectives of health education is a complex operation,
it demands commitment and cooperation of many sub-
jects, which have to say in unison, so that pupils per-
ceive the coherence of their actions. Cooperation is
one of the strategies of solving complex health prob-
lems, where trust is the key to success. It is also an es-
sential skill in life, indispensible at different levels of
activity:
• macrosocial – international cooperation, taking ad-
vantage of experience of other countries,
• mesosocial – acquiring/developing skills practical in
life requires cooperation between specialists in vari-
ous fields, teachers of various subjects, between
school and the family environment, community and
mass media,
• microsocial – taking advantage of the potential of
the group, learning from each other, preparing and
implementing sports projects, promoting healthy
lifestyle – all of them require a cooperation of pupils
with each other and with teachers.
Sports activity carried out in groups offers a lot of
natural situations favorable to emphasize the values of
cooperation. In the groups which are united by the com-
mon goal and the will to solve the same problem, the
ties of interrelationships, positive relations, are devel-
oped, which increases the motivation to complete the
common task. A well-organized team work creates
strong relations of friendship, trust, which favor an at-
mosphere of learning. In the conditions of cooperation
all pupils act as subjects. Such a strategy is good to
build up a confidence in oneself and to take a decision
to change the attitude; it has a value, because in the
shared activity – real and not fictitious – a positive atti-
tude to changes is formed.
Conclusions
At the end a question arises: during the studies
will the future health educators acquire the profes-
sional knowledge which can be a reference for them
while establishing their own procedures of pedagogi-

HUMAN MOVEMENT
79
J. Malinowska, Training teachers for the Education for change
cal behavior in creating the conditions for pupils
to experience the senses of subjectivity and compe-
tence?
The research carried out on the knowledge being
built up by the teacher shows that in an educational
practice the teacher makes use mostly of the knowl-
edge based on experience, which is the most important
for him [22, pp. 130–164; 23, p. 38]. The teacher dis-
covers the meaning of knowledge by experiencing
personally its usefulness. If the teacher does not have
personal experience, he adopts the patterns transferred
from his experience as a student, thus copying the rou-
tine procedures of establishing relations between the
subjects of the education process; the procedures
which were established in different from today’s social
and economic conditions. In aspiration to profession-
alism, the educator can be restricted by the past expe-
rience and his personality as well as by extra-didactic
measures of the educational activity. The acquired ex-
perience, beliefs and personal history derive from the
past when the normative knowledge and the expecta-
tions for oneself were established. While interpreting
school events, both the teacher and the teacher trainee
refer to their own systems of values. The key category
in the process is comprehension, a basis for planning
future actions, which determines the ability to act. The
activity can be understood as implementation of the
plan based on the comprehension of the situation
which constitutes a part of the environment interpreted
by the teacher. The teacher takes up different kinds of
actions; among them, according to Weber’s classifica-
tion, are the following [24, p. 19–20]:
• actions of traditional origin, deep-rooted in the past,
which are present in the school practice in the form
of “methodological ethnocentrism” – term intro-
duced by Klus-Stańska – whose sense lies in the as-
sumption that this is the way we have been doing it
“since time immemorial” [20, p. 112];
• actions based on emotions, which are characterized
by the ability to direct emotions to reach the goal; an
affective action can arrive at the limit of rationality
if under the influence of strong emotions, it leads to
less rational actions or even to a loss of the situation
control;
• actions based on the values and rationalism; related
to the external goals and in strict correlation with the
values cherished by the teacher; he gives a rational
meaning to the behavior and not to the values which
generate the behavior;
• practical actions (based on the goal and rationalism)
oriented to the achievement of concrete and real
goals in everyday activities.
The discussion presented to date excludes the as-
sumption that for health educators it is enough to have
technical, professional and closed knowledge which
they acquire in the course of traditional education. No
kind of studies make candidates for teachers really
good professionals. It seems necessary to reconstruct
the model of teacher training. A desirable educator is
a professional who searches for his own procedures to
reach a goal, who reflects on his activity, who is open
to different interpretations, to the school microcosm
and to the pupil’s development needs. Such a teacher
perceives his educational activity as an obligation to-
wards pupils, which is expressed by the need to bring
their capacities to full development. In order to be able
to do it, the educator has to work on his professional
development, that is to make a shift from perceiving
himself as a reactive object controlled externally to
perceiving himself as an active subject of the occurring
changes. Only this kind of teacher can be a guide for
pupils in search of their own lifestyles, for whom activ-
ity can be a desirable value.
Since the above mentioned premises are accepted, it
is time to indicate three complementary areas which
call for necessary changes in the professional prepara-
tion for health educators:
• the first area assumes that knowledge is not static,
but is characterized by constructiveness and subjec-
tivity; so a change regards the teacher’s reflexive-
ness, capacity to shift from “I know” to “I think”;
• the second area concerns the process of becoming
a teacher; a change should occur already during the
studies by giving students possibility of reflective
practicing and by shifting from practice of dominat-
ing students’ thinking to practice supporting their
thinking;
• the third area refers to the curriculum of teacher ed-
ucation; so far it has been understood as a set of is-
sues to present, which must be rejected, and replaced
by a set of pedagogical problems to solve; the source
of the problems should be school practice.
According to the author, the issues listed above are
important points of orientation on the map of theoretical
and practical problems in educating teachers – health
educators. It would be a mistake to assume it is a closed
list of the proposals for the discussion on changes in the
quality of health education in Polish schools.

HUMAN MOVEMENT
80
J. Malinowska, Training teachers for the Education for change
References
1. Elliot J., A model of professionalism and its implications for
teacher education. Br Educ Res J, 1991, 17 (4), 309–318.
2. Kwiatkowska H., Sources of inspiration for the modern think-
ing about teacher education. In: Kwiatkowska H., Lewowicki T.
(eds.), Sources of inspiration for the contemporary teacher edu-
cation [in Polish]. WSiP, Warszawa 1997, 41–57.
3. Pearson T., The teacher. Theory and practice in teacher educa-
tion [in Polish]. WSiP, Warszawa 1994.
4. Koć-Seniuch G., Teacher’s dialogical education. In: Kotusie-
wicz A., Koć-Seniuch G., Niemiec J. (eds.), Pseudological
thought and teacher’s activity [in Polish]. Żak, Warszawa-
-Białystok 1997, 187–195.
5. Kwaśnica R., Introduction to the idea of supporting teacher’s
development [in Polish]. Wrocławska Oficyna Nauczycielska,
Wrocław 1994.
6. Straś-Romanowska M., The issue of subjectivity in education
in the context of personalistic vision of a human being [in
Polish]. Człowiek–Kultura–Edukacja, 1994, 1, 15–26.
7. Czerepaniak-Walczak M., Teacher’s competence in the context
of emancipation pedagogy. In: Dudzikowa M., Kotusiewicz A.
(ed.), The borders of ideas and educational practice [in Polish].
UW, Białystok 1994, 47–64.
8. Dylak S., Teacher-pupil communication. In: Kwiatkowska H.,
Szybisz M. (eds.), Teachers’ professional communication com-
petences [in Polish]. Komitet Nauk Pedagogicznych, Warszawa
1997, 71–81.
9. Lewowicki T., Changes in education [in Polish]. Żak, Warszawa
1997.
10. Obuchowski H., Intentional human [in Polish]. PWN,
Warszawa 1993.
11. Balicki M., New assessment models and teacher education in
the society of information technology. In: Prokopiuk W. (ed.),
Teacher’s development in the time of transformation [in Polish].
Trans Humana, Białystok 1998, 58–62.
12. Puślecki W., Early-school triggering education [in Polish]. Im-
puls, Kraków 1996.
13. Kwiatkowska H., Certainty and doubts in pedagogic activity.
In: Pacławska K. (ed.), Tradition and challenges [in Polish].
Universitas, Kraków 1996, 115–120.
14. Ornstein A.C., Strategies for effective teaching. Harper/Collins
Publishers Inc., New York 1990.
15. Witkowski L., Development and identity in life cycle. The
study of Erik H. Erikson’s concept [in Polish]. UMK, Toruń
1989.
16. Szuman S., Studies upon the child’s psychological development
[in Polish]. WSiP, Warszawa 1985, 1.
17. Harwas-Napierała B., Trempała J. (ed.), Psychology of a hu-
man’s development [in Polish]. PWN, Warszawa 2000, 2.
18. Vasta R., Haith M.M., Miller S.A., Child psychology [in
Polish]. WSiP, Warszawa 1995.
19. Kwaśnica R., Helping the teacher – alternative communication
[in Polish]. Wrocławska Oficyna Nauczycielska, Wrocław
1994.
20. Klus-Stańska D., Breaking the school monologue of meanings
– barriers and chances. In: Bauman T. (ed.), Learning as a life-
long venture [in Polish]. Impuls, Kraków 2005, 105–128.
21. Brzezińska A., What an active participation of the pupil and the
teacher can be. In: Lutomski G. (ed.), Teaching differently [in
Polish]. Humaniora, Poznań 1994, 31–40.
22. Palka S., Pedagogic theory and teachers’ practical experience
[in Polish]. WSiP, Warszawa 1989.
23. Polak K., Individual teacher’s theories. Origin, research, devel-
opment [in Polish]. UJ, Kraków 1999.
24. Weber M., Economy and society [in Polish]. PWN, Warszawa
2002.
Paper received by the Editors: October 26, 2009.
Paper accepted for publication: January 14, 2010.
Address for correspondence
Joanna Malinowska
ul. Zachodnia 20/47
53-644 Wrocław, Poland
e-mail: [email protected]

HUMAN MOVEMENT
81
“The teacher’s mission, according to a centuries-old
tradition,
originates from vocation. It demands particular
personal predispositions,
a thorough preparation for the job, constant
deepening of the competence,
and a cultivation of the mind, will and heart. Since
it is a service rendered to
another man. And that is why, it is connected to an
exceptional responsibility”.
M. Rusiecki
Introduction
Anthropological and axiological reflections on what
is important in bringing up a man...
Educating is a service rendered by a man to another
man, a service based on mutual relation. In educating
somebody it is necessary to assume an appropriate atti-
tude towards the effects of the relation: to recognize and
respect the pupil, to listen to his needs, to strengthen his
will, to indicate the way of the truth which will lead him
to goodness. One should treat the pupil with kindness,
openness and trust, become an authority for him, some-
body who will always say what is right, good and true
[1, p. 169].
In the comprehensive education of a man, which is
the aim of the school education, all fields of education
are important. Therefore, one should not neglect either
physical education or health education when it comes to
the integrated education of a man.
Searching for a proper perspective of education (in-
cluding physical and health education), one should as-
sume that “educating is a constant process of supporting
human efforts in development of his humanity” [2, p. 12].
Kowalczyk points out that the right perspective of
education should resemble “multidimensional realism”
which includes living, cognitive, psychological, axio-
logical, ethic, and existential dimensions [2, p. 12]. The
aim of such education is to create favourable conditions
to become more and more human, that is to “humanize”
the human being (to mould the pupil) [3, pp. 269–270; 4,
p. 119]. Education is not, and cannot become, only
a spontanous growth and development of bios (the drive
for life). It is not only the influence of institutions
(ethos), but it is also a deliberate moulding of the pupil
by the educator’s actions (agos) together with the in-
fluence of destiny, which is of great significance in
education [5, p. 18]. Destiny imposes parents, teachers
(...), equips with hereditariness, arranges vicissitudes of
one’s life as a fortunate lot or one full of adversities,
thus, prepares the pupil for different situations in his life
[6, p. 25].
DOI: 10.2478/v10038-010-0009-z
Barbara Wolny
The John Paul II Catholic University of Lublin, Off-Campus Faculty of Social Sciences in Stalowa Wola, Poland
ABSTRACT
The article discusses the changes in carrying out health education introduced by the school curricular reform. The new podstawa
programowa (curricular basis) introduces some important changes in health education by choosing Physical Education as the most
suitable subject to deal with health education. Therefore, a physical education teacher becomes a person responsible for carrying out
health education at school (a coordinator of activity). The article demonstrates the new role of the physical education teacher which
requires the adequate students’ preparation for their future careers as well as the appropriate training of the physical education
teacher, in the scope of their knowledge, skills and attitude. The teacher’s responsibility, genuineness and reliability are also
emphasized, since, due to the new tasks, the teacher becomes a creator of healthy lifestyle at school.
Key words: a physical education teacher, health education, a school curricular reform
A PHYSICAL EDUCATION TEACHER AS A PART OF SCHOOL HEALTH EDUCATION
2010, vol. 11 (1), 81–88

HUMAN MOVEMENT
82
B. Wolny, P.E. teacher in school health education
Education assumes “a dynamic structure of a man,
which underlines a process of becoming a man, chang-
ing for better” [7, p. 19]. This is a “deliberate action of
adults (educators) orientated mostly towards children
and young people (pupils) in order to shape in them
certain notions, feelings, attitudes and aspirations”
[5, p. 19].
Looking for the right conception of education, one
should underline that the conception of the integrated
education is particularly useful; it assumes a full and
dynamic formation of the pupil. However, education is
not only moulding the pupil, but also opening to the
values offered in education. Education as an action
which forms the pupil is a personal action; it means
meeting persons (the pupil and the educator) in differ-
ent relations, intended and unintended actions, whose
objective is always a comprehensive development of
the pupil [3, p. 173].
If education is understood in this way, educational
actions should comprise: custody, entertainment and
culture, physical, health, mental, moral, social and
esthetic education as well as teaching, training, prepa-
ring for various tasks (to take up different roles in the
adult life) [5, p. 23].
From this assumption there results a set of detailed edu-
cational tasks for the contemporary school and teachers.
The 21st century school should be the place where
people from different social backgrounds can meet,
where education (educating, teaching and bringing up)
takes place while the educator and the pupil are speaking
to each other. This is a school where young people find
directions (humanistic values giving a sense to their
lives), which rooted in the past are “a solid rock, founda-
tion, to build the future on” [7, p. 18]. In such school it is
the pupil who plays an important part (as a subject of the
implemented education), but the teacher is equally im-
portant. Educating can be compared to a meeting of the
pupil and the teacher. A lesson is a basic form of school
activity, which should become a kind of interaction be-
tween a teacher and his pupils. The effects of teaching
and other educational processes depend, to a great extent,
on the interaction (if it is created and consolidated).
A friendly, but demanding school – at the begin-
ning of the new reform ...
The Polish school has to face another important
change which was introduced on 1st September 2009 by
the new curricular basis. The Ministry of Education in-
dicates a few important reasons which triggered off the
need for change:
1. giving equal opportunities in education by providing
a better access of the youngest to education (reduc-
ing the age of the first class pupils);
2. keeping cohesion of curricula – an educational proc-
ess must be coherent in the curriculum and organi-
zation, described from the point of view of educa-
tional effects, adapted to the pupil’s capacities, tak-
ing into consideration rising educational aspirations
of young people, offering equal educational oppor-
tunities, fitting well in-between the pre-school edu-
cation (kindergartens) and the university school sys-
tem;
3. raising the level of education, thus increasing the
competitiveness on the labour market [8].
The changes approved and proposed by the Ministry
of Education have as a principal objective quality and
trust [8], efficiency (in accordance with the praxeologi-
cal educational model); it must be pupil, teacher and
parent friendly (a new paragraph which indicates the
triple subjectivity of the educational process), modern
(properly equipped classrooms which enable pupils to
gain knowledge from different sources and developing
abilities to use the acquired knowledge in everyday situ-
ations). School which not only educates, but also orien-
tates the pupil to knowledge, develops his ability to
learn as a way to satisfy a natural curiosity of the world
and discover his interests, and it also prepares for fur-
ther education [9].
One of the important changes in the curricular basis
is the rejection of the educational paths, “a health educa-
tion path” included, which were introduced to the Polish
school in 1999. Health education, however, does not dis-
appear from the school reality; the form and the way
lessons are organized change, but health education re-
mains systematic (it is present at all the levels of school
education).
Appreciation of the importance of health
education
In the preamble to the curricular basis for all the
three school levels of compulsory education, there is
a regulation on health education which indicates a need
to raise its status in the comprehensive education of
children and young people: “Another important school
task is health education, whose aim is to form the pu-
pil’s habit to take care of his and others’ health, as well

HUMAN MOVEMENT
83
B. Wolny, P.E. teacher in school health education
as an ability to create a health friendly environment”
[9]. The regulation underlines the importance and status
of health education among the school tasks. As a result,
health education becomes a part of the school curricu-
lum: didactic, educational and preventive.
The previous solutions (health education in the form
of an educational path) imposed on every teacher an
obligation to include health issues while teaching their
subjects or conducting other activities [10, 11]. Teachers
could choose the way to do it: in-between subject or af-
ter school. Such an assumption meant that health educa-
tion was a duty of every teacher [12, p. 42]. The obser-
vations of the school reality revealed that the task was
carried out by means of various (often improper and in-
sufficient) actions based on haphazardness, pretence
and improvisation. The school practice proved that if all
the teachers are responsible, in reality, nobody is.
Therefore, it was necessary to make changes in order to
find a subject and a person (teacher) coordinating all
these activities.
Physical education, a priority subject in provid-
ing health education
In the new solution physical education was recog-
nized as the most suitable subject to carry out health
education (it is a subject saturated with health education
issues: similar approach, coincident objectives). Due to
this solution, the holistic (comprehensive) conception of
the approach to health can be implemented, because the
physical education curriculum comprises actions which
concern moulding and developing physical health
(physical movement – its various forms condition
health, not only physical), as well as the influence of
physical movement on well-being (mental health). Inter-
personal relations (e.g. participation in team games) re-
sult in the formation of friendship bonds, which have
a favourable impact on social health. Moreover, sport
evokes a sense of fulfillment, provides positive feelings
(spiritual health).
The new curricular basis (worked out to make the
requirements uniform, and to define the effects) is the
so-called educational pattern; it is a civilizational and
educational standard common for both physical and
health education, which tells the teacher “what to teach”
(knowledge, skills, attitude) [9].
A connection between health education and phy-
sical education – health education at all the levels of
school education
The new approach includes health education within
physical education, thus placing it at all the levels of
school education. It has been assumed that health edu-
cation spread systematically throughout the whole edu-
cational process has a positive influence on the effec-
tiveness of the actions undertaken. However, it is worth-
while to remember that the effectiveness of health
education is particularly difficult to evaluate, as its ef-
fects are visible years after [13, p. 56]. Stretching ac-
tions over time (including health education in the over-
all curriculum of education, at all the levels of school
education, that is treating health education as a process)
allows a regular shaping of the pro-health attitude (by
imparting knowledge, developing abilities and forming
the pupil’s attitude). It coincides with the assumptions
of the modern concept of health education based on
regularity, continuity of effects and introduction to
health issues as early as possible [12, pp. 23–24; 14, pp.
30–32; 15, pp. 38–39; 16, p. 28].
In the new curricular solution, physical education
and health education appear already in the curriculum
of pre-school education in the area entitled: “Health ed-
ucation and shaping physical fitness of children” [8].
Pre-school health education introduces the child in
some issues of health, physical fitness and security, it
prepares the child for the school education. Further con-
tents of health education can be found in the regulations
of the curricular basis for all the levels of school educa-
tion system [9].
School education has a constant character; each ear-
lier stage of school education is the base for the next
one, and so it is in the case of physical and health educa-
tion. Following the modern concept of health education
orientated towards the holistic approach to health, the
teacher gradually introduces pupils to the perception of
health as a whole; from the one-dimensional approach:
physical health (stage I: classes I–III of primary school),
through the three-dimensional one: physical, mental
and social health (stage II: classes IV–VI of primary
school, and stage III: gymnasium, a three-year uniform
comprehensive secondary school), to the multi-faceted
one: physical, mental, social and spiritual health (stage
IV: three-year high schools of various types).
The new solution approved by the Ministry of Educa-
tion assumes that at stage I (early school education) physi-
HUMAN MOVEMENT
84
B. Wolny, P.E. teacher in school health education
cal and health education is provided by the teacher of
primary education, who was recognized as the most
competent person to work with children aged 6–12 (due
to his factual and methodological preparation), though
there is a possibility (headmaster’s opinion) of holding
this subject by a specialist, i.e. physical education teacher
[8]. At this stage, health education is incorporated in
sports lessons and has an introductory character. Les-
sons are especially recommended to be held in open
space, the so-called green gyms (sports field, park, for-
est, meadow). The requirements in health education
were placed in theme blocks of physical education:
physical fitness, sports exercises, lifelong sports, relax,
security and health education [9].
From stage II it is the teacher of physical education
who is responsible for conducting health education and
its coordination at school. Health education is held in
the class-and-lesson system and facultative activities,
“recreation and health” ones included, which “should
enable pupils to take up physical activity useful for
health” [8]. The requirements in health education have
been incorporated in the theme blocks of physical edu-
cation, such as: diagnosis of fitness and physical activi-
ty, sports training, lifelong sports, safe physical activity,
hygiene, sport and dance, which are also present in
stages III and IV [9].
The physical education teacher has to face a more
complex assignment in the gymnasium (extended stage)
and the high school (self-improvement stage). At these
stages, apart from holding health education in the class-
and-lesson system and in the form of facultative activi-
ties (theme blocks of physical education), a “health edu-
cation” block is introduced. The requirements concern-
ing health education included in the theme blocks of
physical education constitute five areas of pro-health
activities: (1) physical activity, work and rest, nutrition;
(2) physical development in adolescence and youth; (3)
body care, security, diseases; (4) health and health care;
(5) mental and social health, and abilities useful in
every day life [8]. The “health education” block should
be held regularly by the teacher as a course or work-
shop, thus reinforcing the teacher’s actions in forming
a pro-health attitude in the pupil [8].
The regulation on the leading role of physical educa-
tion in health education obliges the teacher of physical
education to coordinate its teaching at school and coop-
erate with other teachers. The teacher of physical educa-
tion is seen, after an appropriate training course, as best
prepared to take the new role [8].
It is necessary to improve (by more teacher training)
physical education teachers, because, as it was noticed
e.g. by Pawłucki, “the teacher of physical education
is not always aware of being a ‘health teacher’, though
he often uses another, also much promising, term of
a physical culture teacher. In this case the teacher does
not know (may not always realize – B.W.) that the defi-
nition itself of the name comprises a role of a guide to
the health culture (...). In his work style, however, the
teacher resembles more an organizer of ‘some fun in the
corridor’ as well as he shows a tendency towards les-
sons of pure sport” [17, p. 69; 18, pp. 345–348].
To make the teacher more interested in including
health education in his lessons, it is important to follow
the evolution model of the physical education teacher
suggested by Pawłucki. It indicates the need of a shift
from “an instructor of body exercises (object-orienta-
ted approach, no reflection, basic tool – a whistle),
through a bio-teacher (excessive belief in educational
effectiveness of body exercises) to an axioteacher (abi-
lity to explain to pupils the sense of body’s value in
the context of the social standards of conducts and the
system of values accepted in the given culture)” [19,
pp. 152–153].
Therefore, Krawański is right to notice that it is ne-
cessary to change the way of thinking of physical edu-
cation students and graduates; they have to reject the
conviction that their aim is to teach movement and or-
ganize sports events at school; they must accept the new
approach to physical education whose aim is to change
the way of pupils’ thinking, to make them perceive
sport and sports activities as important elements of hu-
man education which take an important part in the in-
tellectual, professional and social developments (health
one included) [18, p. 338].
Physical education teacher – the key person in
school health education
In the new approach to health education held within
lessons of physical education, the role of a teacher be-
comes particularly important, as he is the person re-
sponsible for the process of school health education,
who accomplishes its main objective, i.e. moulding
a personality that takes care of health [18, p. 351].
Woynarowska underlines the fact that “the teacher is
the key person in school pro-health education” [14,
p. 16]. His role and tasks in moulding the pupil’s pro-
health attitude are indispensable, which is strongly em-

HUMAN MOVEMENT
85
B. Wolny, P.E. teacher in school health education
phasized by Demel, the author of the theory of health
pedagogy: “the teacher keeps together” the whole edu-
cation [20, p. 108].
The reform presently taking place in the school sy-
stem and the new approach to health education imple-
mented in its framework [12, pp. 27–32] assign a new
role to the physical education teacher as the most com-
petent person to conduct actions in this matter. The
teacher becomes the pupil’s guide and advisor, an ani-
mator of actions and not “an omniscient expert”. Ac-
cording to the curricular assumptions the physical edu-
cation teacher should take up regular efforts to raise the
level of his competence in order to be able to assume
not only the role of a teacher, but also that of an educa-
tor. “The curricular basis for comprehensive education”
indicates obligations and tasks of the teacher–educator.
In the reformed school every teacher is responsible for
teaching and bringing up, which is an integral part of
the entire educational process [10]. It is especially im-
portant in the case of the new approach to health educa-
tion. Including health education in lessons of physical
education (and some other subjects like: nature, biology,
education for security) [8] oblige school to conduct the
actions in this matter integrated in a systematic way
with the entire educational process.
Health education has been enhanced and included in
the process of teaching and bringing up; it has become
an element of human education. It demands an appro-
priate preparation from the physical education teacher
who deals with this matter. Demel, already in the ‘60s
of the previous century, underlined that “the educational
and health effectiveness of the teacher’s work depends
on the following factors:
• the way he was brought up himself and what role
model he represents for pupils;
• his hygienic and pedagogical knowledge, particularly
about the developmental needs of young people;
• an interest and vocation for this kind of activity” [20,
p. 108].
The author also indicated a need for an appropriate
preparation of the teacher in the teacher training cent-
ers. Since then, the situation has not changed, the teach-
er who deals with health education has to be well pre-
pared. Therefore, a demand for changes (uniforming
health education curricula) has been made: lectures and
classes preparing students (the future teachers) to con-
duct health education should be included in the curricu-
lum of the physical education studies.
Physical education teacher’s competence useful
in health education
Currently, the problem of a versatile preparation of
the teacher for health education has been discussed,
among others, by Woynarowska. She points out to the
teacher’s competences, which are important in the di-
dactic and educational process. The competences
should be acquired during the university studies leading
to the bachelor’s degree and other pre-master courses
for future teachers and educationalists, as well as during
teacher training courses held for already working tea-
chers [21, p. 17]. According to the author, the teacher
should have: knowledge about health and health educa-
tion, but also abilities to organize and conduct health
education (diagnosing, planning, conducting, monito-
ring and evaluating) and an atittude (e.g. convinction of
health’s significance, recognition of health as a value,
readiness to perfect one’s health, openness, creating
a healthy environment) [21, p. 17]. Also Krawański
underlines the significance of professional competence
of the physical education teacher related to the health
education, and he distinguishes its three layers:
1. Social (cultural):
• contributing to the formation of pro-social attitudes
and abilities of the man by means of physical cul-
ture, as sport generates culture,
• active participation of local communities in the
health education process, especially in promotion of
human physical activity.
2. Utilitarian (educational)
• development of everyday life abilities by means of
physical education,
• forming a habit of moving and of other healthy be-
haviours as a fundamental element of the human
lifestyle.
3. Existential:
• stimulation of development and physical fitness of
an organism,
• formation of a personality that cares about the body
based on the pro-health reflections [18, p. 361].
The above mentioned competences show that there
is a need to prepare students of physical education (still
during the university studies), as well as to train teachers
(already working) by providing them with knowledge
and skills in the form of constant training courses and
self-education.

HUMAN MOVEMENT
86
B. Wolny, P.E. teacher in school health education
Health education as a challenge for the physical
education teacher
The new solution to the implementation of health
education approved by the Ministry of Education
enhances the status of the physical education teacher,
whose role in this scope is fundamental and at the same
time it makes him responsible for the school health
education process.
The new curricular basis indicates clearly the scope
of the educational responsibility.
According to the contents of the document the physi-
cal education teacher at school:
• is a coordinator and the main organizer and director
of health education;
• cooperates with other teachers, parents and other
people (institutions): e.g. hygienist, nurse, physician;
• holds lessons of health education in the classroom
making use of activating and interactive methods,
using a learning by experience cycle, arranges the
learning orientated teaching process;
• draws up his own curriculum;
• is a guide (leader) of healthy lifestyle [8].
The tasks included in the curricular basis are a chal-
lange for the physical education teacher, as he is the
person responsabile for the implementation of health
education.
Responsibility – a basis for effectiveness of edu-
cational work
The teacher, due to the character of the profession,
should be a credible undisputable model for his pupils.
Certain priorities, such as: dignity, authority, high so-
cial status are ascribed to the profession of a teacher.
The right attitude of the teacher is the key to success in
moulding a pro-health attitude of pupils. The ethic and
moral area is an important element of the teacher’s at-
titude, as it is related to responsibility. As Rusiecki says
“responsibility is a core of the moral experience, an
important ethic category of a practical character (...),
which is an ‘indicator of the human’s maturity’. It indi-
cates readiness, obligation, and even the necessity of
taking responsibility for his own thinking, desires,
words, attitudes and actions” [22, p. 4]. While estab-
lishing various interactions with pupils, the teacher
must be aware of the responsibility for himself, his ac-
tions, but also for others (pupils). The teacher is “an
active responsible subject to be trusted and believed in,
who is aware of the binding norms and the effects re-
sulting from the assumed obligations, who takes ac-
tions freely; he is responsible, i.e. establishes the moral
(and legal) relations with the people and tasks entrusted
to him” [22, p. 4].
Karol Wojtyła, John Paul II, paid attention to the
importance of responsibility in the process of bringing
up the man. Discussing the anthropological issues, the
author underlined the significance of responsibility in
the human life. According to Wojtyła responsibility is
“characteristic of accepting and realizing vital values”
[23, p. 34], which is especially important in reference to
health education. The pupil is to be responsible and take
responsibility for such values as: health, physical fitness
or beauty of his own body.
The man is his own master, uses the brain and is sen-
sitive to the values which do not determine him, but are
chosen by him in a free and responsible way [23, p. 34].
The teacher of physical education – creator of
healthy lifestyle
In order to make the pupil take responsibility for the
above mentioned values, he must get interested in the
programme offered by the teacher. Therefore, the physi-
cal education teacher should become a creator of pupils’
healthy lifestyle, i.e. a person who has an effect on oth-
ers, who cares about other people, transmits the values
(he embodies the values, follows them and realizes
them), is able to make pupils follow him, who inspires
and spurs them to work on themselves.
When can the teacher become a creator of the
healthy lifestyle?
When he expresses readiness to carry out the under-
taken tasks, but also when he is actually well prepared
for them. Rusiecki says “on the position as highly expo-
sed as the mission of the teacher it is out of the question
not to know the curricular contents, principles of good
behaviour, moral norms, or didactic and educational
principles” [22, p. 34].
In the health education presently implemented, the
teacher’s attitude and coherence of the imparted
knowledge with the preferred healthy behaviours be-
come particularly important. It is not enough to impart
the knowledge about health and healthy behaviours. If
the teacher is not genuine, i.e. he says one thing, but he
behaves in another way, the entire knowledge imparted
HUMAN MOVEMENT
87
B. Wolny, P.E. teacher in school health education
to pupils is useless and does not provide support for
everyday actions.
Jeleńska notices and underlines that “in the process
of bringing up we have to create situations which will
result in making relations with what is true and good
(...) such conducts only can mould an ‘internally harmo-
nized’ man” [24, p. 17]. The man who will possess in-
side himself the values allowing him to live in accord-
ance with his own “inside”, will not be a man “control-
led externally”, submissive to others’ influences. It is
especially important while speaking about health care.
The “internally harmonized” man is able to refuse, is
aware of his responsibility for health [24, pp. 17–19]. He
can be guided by the freedom understood properly,
which is based on choices and decisions.
Therefore, the teacher should be credible in the pu-
pil’s eyes, only then he will be the role model and “will
be followed by his pupils”. However, if his behaviour
does not reflect the knowledge he imparts, e.g. speaking
about the harmfulness of smoking though he smokes,
he is not a model to follow.
It is necessary to note that the efficiency and effecti-
veness of health education carried out at school depend
on many factors; one of them is the teacher’s atittude,
the so-called role model of the educator, which is essen-
tial and has a direct influence on the pupil’s behaviour.
The genuity of the teacher’s atittude was pointed out,
among others, by Zamoyska, who underlined that “if we
require certain conducts from a child, we must behave
impeccably” [25, p. 172]. The teacher must bear testi-
mony to the truth, good and beauty, and as Gogacz says
“by means of good images you must evoke good feel-
ings in the pupil” [26, p. 37].
Health education, as it is noticed by Demel, “does
not have to be boring, it can be connected to the deepest
motivations of behaviour, because it participates in the
achievement of the overall educational objectives aimed
at learning and understanding oneself as well as master-
ing the most difficult art, the art of living” [20, p. 115].
Therefore, it is necessary to convince pupils that healthy
conducts are attractive, to point out the advantages re-
sulting from leading the healthy life.
Observing the school reality, one notices that young
people are attracted by good examples from life. Practi-
cal reference to the imparted knowledge can be best
familiarized by the teacher-educator if he is able to
attract and interest pupils. Youth (especially adolescence)
is a very difficult period and requires from the teacher to
be both delicate and consistent in actions. A young man
(especially aged 12–15) wants to impress others and if he
is not brought up well, he often chooses such conducts
which do not favour health but damage it. Joining va-
rious informal peer groups, he yields under pressure
exerted by others and starts using addictive substances,
e.g. cigarettes, alcohol, drugs. Left alone, he gets ad-
dicted quickly and starts enhancing improper beha-
viours, i.e. unhealthy. If the teacher (who is close to his
pupils) notices the problem and is able to help, for exam-
ple, by involving the pupil in a chosen form of sports ac-
tivity, the pupil can get back on the straight and narrow.
Such situations, i.e. the teacher’s influence and help, are
a frequent method of educational work in Polish schools.
Young people, as John Paul II used to underline,
need an example and model of behaviour, they are look-
ing for directions, landmarks in their lives, they need
help and support from parents and teachers. According
to the Pope, bringing up a man is both a challenge and
a responsible task; young people need examples and
models of behaviours and they are looking for them in
adults [27, p. 6]. It is good when they can find them in
their parents’ and teachers’ behaviours, the persons who
are significant in the up-bringing.
That is why, it is important for the teacher “to be”
and “to want to be” an important person for his pupils,
and to treat his educational work as a challange and not
only a job. He should remember that the highest value
for him is the child’s good, where the development of
his personality and not his knowledge comes first. While
teaching and bringing up, the teacher provokes some
intended changes and in this way, he helps parents. To-
gether with them he is responsible for the pupil’s health,
hygiene and overall personal development. He must not
only be an expert in the knowledge he imparts, but also
help pupils discover in a wise manner the sense of life,
a great adventure and a unique opportunity to become
a real human [28, p. 11].
Conclusions
The above discussion raises a question: is / will / or
can the physical education teacher be a creator of the
healthy lifestyle? Certainly this is possible, however it is
important for him to be not only a good trainer, but first
of all, an animator, the model to follow for his pupils,
somebody who will help to find the right track in life
based on healthy choices.
Another question is: what does a success of health
education in the reformed school depend on? To a great

HUMAN MOVEMENT
88
B. Wolny, P.E. teacher in school health education
extent on the teacher himself. In the health education
carried out presently, the teacher’s attitude is extremely
important; “the teacher’s personality teaches”, therefore
he has to be genuine and his principles must be reflected
in his behaviour. Due to such attitude he becomes
a creator of the healthy lifestyle and influences others’
behaviours.
At the end, another question must be answered:
what is the basis for the effectiveness of the health ed-
ucation carried out presently? It is the awareness that
“I – teacher” am responsible for moulding the pupil’s
attitude. A creative teacher of physical education is
the guarantee of the effectiveness of health educa-
tion. As Nowak notices. “teachers, beside parents,
take responsibility for bringing up children and young
people, therefore they have to be characterized by ma-
turity, openness to work with pupils; they should take
care of all their pupils, because they take social re-
sponsibility for their education” [3, p. 476].
References
1. Wolny B., Physical education in the reformed school. The sta-
tus and position of physical education in Polish school [in
Polish]. KUL, Lublin 2006.
2. Kowalczyk S., The principles of Christian personalism. In:
Barlak M. (ed.), Personalistic vision of sport [in Polish].
Wydawnictwo Salezjańskie, Warszawa 1994, 17–19.
3. Nowak M., Basics of open pedagogy [in Polish]. RW KUL, Lu-
blin 2000.
4. Maritain J., Integral humanism: Temporal and Spiritual Prob-
lems of a New Christendom. Katolicki Ośrodek “Veritas”, Lon-
don 1960.
5. Kunowski S., Foundations of modern pedagogy [in Polish].
Wydawnictwo Salezjańskie, Warszawa 1993.
6. Kunowski S., Educational process and its structures [in Polish].
Instytut Pracy Nauczycielskiej, Lublin 1946.
7. Furmanek W., Basic tasks of the school reform [in Polish].
Oświata Podkarpacka, 2000, 4, 18–24.
8. The school program reform. Available from: http://www.refor
maprogramowa.men.gov.pl.
9. The Regulation of Ministry of Education from 23 December
2008 on the curricular basis of pre-school education (kinder-
gartens) and overall education in each type of school. (Dz. U.
Nr 4, póz. 17 w dniu 15 stycznia 2009 r.). Available from: http:/
/www.men.gov.pl.
10. The Regulation of The Sport and Education Minister from 26
February 2002 on the curricular basis of pre-school education
(kindergartens) and overall education in each type of school (Dz.
U. Nr 51, poz.458). Available from: http://www- men.gov.pl.
11. The Regulation of The Minister of Education from 23 August
2007 changing the regulation on the curricular basis of pre-
school education (kindergartens) and overall education in each
type of school (DZ.U. z dnia 31 sierpnia 2007 r. Nr 157, póz.
1100). Available from: http://www.men.gov.pl.
12. Wolny B., Health education in the school. The guide for teach-
ers implementing health education. Wydanie II rozszerzone [in
Polish]. Campus, Stalowa Wola 2008.
13. Lewicki Cz., Difficulties and limitations in the area of health
promotion, their visible signs, causes and consequences. In:
Wolicki M., Wolny B., Pańczyk W. (eds.), Health education the
chance to improve a quality of life [in Polish]. Campus, Stalowa
Wola 2009, 56–63.
14. Woynarowska B., Health education [in Polish]. PWN,
Warszawa 2007.
15. Kowalski M., Gaweł A., Health, value, education [in Polish].
Impuls, Kraków 2006.
16. Zawadzka B., Growing youth versus their health problem [in
Polish] AWF, Kraków 2007.
17. Pawłucki A., Teacher versus the health value – critical work [in
Polish]. AWF, Gdańsk 1997.
18. Krawański A., The body and human health. In the modern
physical education system [in Polish]. AWF, Poznań 2003.
19. Pawłucki A., Pedagogy of the body value [in Polish]. AWF,
Gdańsk 1996.
20. Demel M., On health education [in Polish]. PZWS, Warszawa
1968.
21. Woynarowska B., Sokołowska M., Educational path – health
education and promotion in the school [in Polish]. KOWEZ,
Warszawa 2001.
22. Rusiecki M., The Card of teacher’s responsibilities and duties
[in Polish]. Uniwersytet Humanistyczno-Przyrodniczy, Kielce
2004.
23. Wojtyła K., The person, action and other anthropology studies
[in Polish]. TN KUL, Lublin 1994.
24. Jeleńska L., Mastery of education [in Polish]. Nasza Księgarnia,
Warszawa 1932.
25. Zamoyska J., On education [in Polish]. Naczelny Instytut Akcji
Katolickiej, Poznań 1937.
26. Gogacz M., Basics of education [in Polish]. Wydawnictwo
Franciszkanów, Niepokalanów 1993.
27. John Paul II, Homily in Łowicz, 14th June 1999. In. Z. Dziubiński
(ed.), Aksjology of sport [in Polish]. Wydawnictwo Salezjańskie,
Warszawa 2001, 6-7.
28. Rusiecki M., The code of teacher’s ethics [in Polish]. PTN,
Warszawa 1997.
Paper received by the Editors: October 23, 2009.
Paper accepted for publication: January 14, 2010.
Address for correspondence
Barbara Wolny
ul. Obrońców. Pokoju 106 a
36-100 Kolbuszowa, Poland
e- mail: [email protected]

HUMAN MOVEMENT
89
Introduction
Modern man frequently experiences maladjust-
ments, lack of contact with nature and close and infor-
mal interpersonal relations and shortage of physical
movement. An effective remedy to these problems can
be physical recreation, which by stimulating physical
development can improve one’s quality of life and func-
tioning in society [1–4]. Active physical recreation is
more and more often perceived not only as a desired
model of leisure pursuit but also as a way of life. This
perception involves the benefits of all types of sports,
tourism, movement games and other physical exercises
as means of creative self-fulfillment and health im-
provement.
One of original and alternative forms of physical
recreation are medieval re-enactment groups or modern
knight societies, which have been enjoying a great pop-
ularity in Poland in recent years.
The modern revival of knight societies is deeply
rooted in the Polish awareness of medieval culture. The
popularity of such groups is additionally facilitated by
the mythologization of the knightly ethos in Polish lit-
erature and songs, so much admired by the Poles [5].
The first medieval re-enactment groups appeared
in Poland at the end of the 20th century (Fig. 1). There
were only two such groups between 1986 and 1990. In
1998 Poland had twenty-four modern knight societies
[6].
The medieval re-enactment groups form associa-
tions and are mostly active in Polish cities and towns
with medieval traditions (castles, historical monuments,
etc.). They take part in various recreational events in-
spired by medieval knight tournaments [7].
The present-day revival of the “knight movement”
is a fairly recent phenomenon which has not yet been
subject to any extensive research, unlike the Polish
medieval knightly culture which can boast a rich his-
toriography regarding the knightly ethos and code of
honor [8–10]. Despite numerous differences between
particular medieval re-enactment groups their main
DOI: 10.2478/v10038-010-0006-2
Władysław Mynarski1, 2*, Bożena Królikowska1, Bogusława Graczykowska1
1 Faculty of Physical Education and Physiotherapy, Opole University of Technology, Opole, Poland
2 The Jerzy Kukuczka Academy of Physical Education, Katowice, Poland
ABSTRACT
Purpose. Medieval re-enactment groups known also as modern knight societies or fraternities have been developing rapidly in
Poland and all over the world, in particular, for the last decade. The following study aims to show that membership in medieval re-
enactment groups can be regarded as a novel form of physical recreation. The study focuses on various dimensions of membership,
members’ motivations, and benefits of participation in such groups. Basic procedures. The study was conducted in 2006 with
members of two modern knight societies: “Opole” and “Chorągiew Ziemi Lwowskiej Księcia Władysława II Opolczyka” from
Poland. All in all, 63 subjects (44 men and 19 women) aged 14–52 years, with different levels of education took part in the study.
Main findings. The results obtained showed that the main reason for joining medieval re-enactment groups for the majority of
subjects was to pursue their hobbies. The main expectation concerning membership in such groups is having fun, which was
declared by over 50% of subjects. Moreover, over 50% of subjects expected to improve their frame of mind and experience diversity
in their daily life as side effects of their membership in modern knight societies. Additionally, 61% of members who specialized in
medieval combat re-enactment noted an improvement of their fitness level. Conclusions. Participation in medieval re-enactment
groups can be regarded as a new and attractive form of physical recreation as well as an intellectual activity.
Key words: free time, physical recreation, medieval re-enactment, knight society, questionnaire study
MEDIEVAL RE-ENACTMENT GROUPS AS A NEW FORM OF RECREATION
2010, vol. 11 (1), 89–94
* Corresponding author.

HUMAN MOVEMENT
90
W. Mynarski, B. Królikowska, B. Graczykowska, Medieval re-enactment groups
aims and ideas remain the same. They are known by
different names, e.g. knight brotherhoods, knight com-
panies or knight movement and concentrate on medie-
val combat re-enactment or “living history” activities
pursuing the knightly ideals, values and customs. The
members of these groups share their interests in histo-
ry and active (physical and intellectual) leisure pur-
suits. These communities are hobby, artistic and rec-
reational groups in one [7, 8].
Recreational activities are of autotelic character. Par-
ticipants in recreation pursue their own interests but also
engage in activities as means of care of their health and
physical fitness [11]. The activities of medieval re-enact-
ment groups combine these two aspects. One of the most
significant dimensions of these activities is the diversity
of roles played by the group members. They are engaged
in medieval combat tournaments, dances, archery or arts
and crafts. The ludic and entertainment aspects of such
activities are particularly emphasized, rather than attain-
ment of set goals. The members learn from one another,
preserve knightly values and pursue the ideals of fair play
rather than achieving victory at all costs.
The present study aims to confirm empirically that
different activities of medieval re-enactment groups as
well as motivations to participate in such groups can be
regarded as novel forms of physical recreation. The
study attempts to identify the motives of participation in
medieval re-enactment groups by examining their
members’ opinions about the benefits of participation in
such activities. The following research questions were
formulated:
1. What are the members’ motivations and expecta-
tions before joining medieval re-enactment groups?
2. What, in the members’ opinion, are the benefits of
their participation in activities of medieval re-enact-
ment groups?
3. What characteristics of physical recreation can be
found in the activities of modern knight societies?
The adopted research hypothesis is that membership
in a medieval re-enectment group meets the basic criteria
of participation in physical recreation in terms of forms
of activity and motives of participation in such groups.
Material and methods
The study was carried out between January and Feb-
ruary 2006. The subjects were members of the Opolskie
Bractwo Rycerskie (Opole Knight Brotherhood) and
Chorągiew Ziemi Lwowskiej Księcia Władysława II
Opolczyka (Company of the Lvov Land of Duke Vladis-
lav II of Opole) from Poland. The subjects had been
members of the groups for at least six months. They in-
cluded 44 men and 19 women, aged from 14 to 52 years
who expressed their consent to participate in the study.
Such an age span is typical of medieval re-enactment
groups which are composed of members of different
generations.
The sample was divided into two study groups with
regard to the members’ preferred forms of activities:
• combat group (30 men, 1 woman) consisting of
members for whom the main field of activity was
medieval combat re-enactment involving intensive
physical training;
• non-combat group (14 men, 18 women) consisting of
members whose main activities included medieval
archery, dancing, jugglery, and arts and crafts.
80
70
60
50
40
30
20
10
0
Figure 1. The growth of medieval re-enactment groups in Poland 1986–2000 [6]

HUMAN MOVEMENT
91
W. Mynarski, B. Królikowska, B. Graczykowska, Medieval re-enactment groups
0
20
40
60
80
100
������ ����� � �� � ����
Combat members Non-combat members
The method of questionnaire survey was used in the
study. As the subjects could choose from one to three
answers to each questionnaire item, in some cases the
total of answers exceeded 100 percent.
Results
Determinants of physical recreation include devel-
opment of interests and different preferences of move-
ment activities. Within each medieval re-enactment
group its members can specialize in different activities.
In the present study 49.2% of subjects chose medieval
combat as their main interest, while 50.8% were en-
gaged in other non-combat activities. Among the com-
bat members 19.3% combined medieval combat re-en-
actment with dancing, 3.2% with arts and crafts and
with archery. In the non-combat group 56.2% subjects
specialized in dancing and archery. More than one-
fourth of subjects were also involved in arts and crafts
and dancing (Fig. 2).
An important determinant of membership in a medi-
eval re-enactment group is motivation which is related
to the awareness of reasons for joining such groups and
participating in their activities (Fig. 3).
The results obtained show that the main motivation
to join a modern knight society for more than two-thirds
of its members is indulging passions (pursuing hob-
bies). The distribution of other motives for joining was
different in the combat and non-combat members. For
54.8% of the former learning new forms of activity was
most significant, whereas for 50% of the latter it was
making new acquaintances. For both groups of mem-
bers fitness improvement was a fairly insignificant mo-
tive: 9.7% for the combat members and 6.2% for the
non-combat members.
Motivations for undertaking activity are identified
with one’s expectations, and the knowledge of one’s mo-
tivations for undertaking a new form of recreation can
be helpful in estimation of fulfillment of one’s expecta-
tions. Creating an opportunity in which at least a few
0
20
40
60
80
Indulging passions Making new
acquaintances
Learning new forms
of activity
Improving fitness Other
Combat members Non-combat members
Combat members Non-combat members
Figure 2. Preferred forms of activity of members of medieval re-enactment groups
Combat members Non-combat members
Figure 3. Reasons for joining a medieval re-enactment group
100
19.3
56.2
3.2
56.2
3.2
25.0
67.7 65.6
35.5
50.0 54.8
34.4
9.7 6.2 6.4
25.0
(%)
(%)
Combat Dancing Archery Other
Indulging passions Making newacquaintances
Learning new formsof activity
Improving fitness Other

HUMAN MOVEMENT
92
W. Mynarski, B. Królikowska, B. Graczykowska, Medieval re-enactment groups
expectations are realized can be translated into satisfac-
tion and continuation of this form of recreational activi-
ty (Fig. 4).
On joining their group the largest number of subjects
(64.5% of combat members and 78.1% of non-combat
members) expected good fun out of their participation
in physical recreation. The second most important ex-
pectation in both groups of subjects was getting to know
new people and seeing new places (58.1% of combat
members and 71.9% of non-combat members, respec-
tively) followed by broadening their knowledge of his-
tory (34.4% of combat members and 41.9% of non-com-
bat members, respectively). In fact, propagation of the
knowledge of history had been the primary goal of the
founders of modern knight movement. Among the com-
bat members only 41.9% mentioned fitness improve-
ment as their expectation (6.2% in the non-combat
group). Only one member expected financial profits
from his/her membership in the group, which goes
against the very idea of recreation.
A large part of subjects (64.4% of combat members
and 53.0% of non-combat members) had practiced dif-
ferent forms of physical activity, e.g. team games,
swimming, jogging, horse riding, etc., before they joined
their knight societies. Many of them were active ath-
letes and medieval re-enactors at the same time. This is
an indication of a positive relationship between mem-
bership in medieval re-enactment groups and physical
exercise, which is effective if practiced at the appropri-
ate level of intensity.
Physical exercises in a knight society include pre-
paratory training before tournaments and participation
in combat shows. Figure 5 presents the frequency of
members’ participation in physical exercises in the two
knight societies under study.
More than one half of subjects (50% of non-combat
members, 54.8% of combat members) take part in
physical exercises 2–3 times a week; 29.1% of combat
members and 18.7% of non-combat members 3–4 times
a week. 25% of the non-combat members and 12.9% of
combat members engage in physical exercises only once
a week. Only 4.76% of all subjects (3.2% of combat
members and 6.3% of non-combat members) admitted
they were taking part in physical exercises less than
once a week.
The subjects were also asked how their membership
in a medieval re-enactment group affected their current
physical activity. The vast majority of society members
noted an increase in their physical activity after joining
the group (80% of combat members and 75% on non-
combat members, respectively). 19.3% of combat mem-
bers and 21.9% of non-combat members saw no change
0
20
40
60
80
100
Fun Broadening
knowledge of history
Improving fitness Seeing new places
and meeting new
people
Financial profits
�
��
��
��
�������������� ������������� ���������� ���������������
����
64.578.1
29.118.7
Combat members Non-combat members
41.9 34.4 41.958.1
71.9
3.1
Combat members Non-combat members
Figure 4. Subjects’ expectations before joining a medieval re-enactment group
Combat members Non-combat members
54.8 50.0
12.925.0
3.2 6.3
Combat members Non-combat members
Figure 5. Frequency of members’ participation in physical exercises
(%)
(%)
Fun Broadeningknowledge of history
Improving fitness Seeing new placesand meeting new
people
Financial profits
3-4 times a week 2-3 times a week Once a week Fewer than once a week

HUMAN MOVEMENT
93
W. Mynarski, B. Królikowska, B. Graczykowska, Medieval re-enactment groups
Co bat e be s No co bat e be s
in their level of physical activity after joining their
group. Only one non-combat member declared a de-
crease in his level of physical activity after joining the
modern knight society.
Physical exercises which are of appropriate intensity,
duration and frequency fulfill the crucial needs of the
human body and can stimulate further physical activity
by providing satisfaction and developing active life-
styles [12]. If there are no expected results, however,
a chosen form of physical activity can be changed or
abandoned.
In the assessment of benefits from membership in
medieval re-enactment groups the largest number of
members declared improvement of their frame of mind
as the most important benefit (Fig. 6; 84.4% of the non-
combat members, 67.7% of combat members). More
than 50% of all subjects stated diversity in their every-
day life as the main benefit of their membership. 61.3%
of combat members and 37.5% of non-combat members
noted an improvement in their physical fitness; while
56.2% of non-combat members and 45.2% of combat
members stressed the broadening of the knowledge of
history. Other benefits, e.g. looking better, improving
interpersonal relations, were indicated by 35.5% of
combat members and almost 21.9% of non-combat
members.
Discussion
Determinants (attributes) of physical recreation in-
clude activeness – active and creative attitude towards
activities which provide enjoyment, satisfaction and
good feelings; voluntariness – freedom of choice and
pursuing one’s own interests and passions; retreat from
everyday life and social and professional roles; disinter-
estedness, i.e. lack of financial motives to undertake
recreational activities; and fun and entertainment [13,
14]. The study results obtained can be used to validate
the assumed hypothesis that the membership in a medi-
eval re-enactment group meets the basic criteria of par-
ticipation in physical recreation. The forms of activity
within such groups are new and specific forms of active
leisure.
The analysis of the questionnaire responses related
to the forms of activity preferred by the members of
medieval re-enactment groups reveals certain differ-
ences. The group members who are combat re-enactors
are also engaged in dancing or, more seldom, archery,
or tend to choose arts and crafts. This can be related to
the specificity of knight tournament organization. Me-
lee combat and archery contests are usually held at the
same time, thus harmonization of both pursuits is im-
possible. The combat members prefer dancing as it is
often part of festivities after tournaments. Medieval
show performances such as juggling with fire and arts
and crafts are immensely popular among the non-com-
bat members. They demand however, great strength and
endurance, coordination and courage.
Among the reasons for joining a medieval re-enact-
ment group the least significant was the motive of
physical fitness improvement; however, almost one half
of combat re-enactors and only 6.2% of non-combat
members indicated it as one of their most important ex-
pectations. The latter’s expectations include first of all
fun and making new acquaintances.
The study results obtained point to a diversity within
the group. The combat members devoted more time to
movement activities which is, of course, related to the
specificity of combat re-enactment which requires great
physical fitness and endurance. Most of the combat
members are men, and almost half of them noted an im-
provement in their physical fitness level thanks to their
membership in the group. It was not, however, their main
motivation to join the group in the first place.
�
��
��
��
��
���
����� �����
����
����������
����� ������
������
���������
�� ���������
������������
�����
���
67.784.4
Combat members Non-combat members
Figure 6. Benefits from membership in a medieval re-enactment group in subjects’ opinion
50.0 53.1 61.337.5 45.2
56.235.5
21.9
(%)
Better frame ofmind
Diversity ineveryday life
Fitnessimprovement
Broadening theknowledge of
history
Other

HUMAN MOVEMENT
94
W. Mynarski, B. Królikowska, B. Graczykowska, Medieval re-enactment groups
Conclusions
1. For the vast majority of 63 members of medieval re-
enactment groups from Opole their motivation to
join the group was pursuit of interests (hobbies).
Among the members involved in medieval combat
over one half were motivated by the opportunity to
learn new forms of physical activity; among the non-
combat members the main motivation was to make
new acquaintances.
2. The most frequent expectation related to the mem-
bership in a medieval re-enactment group was good
fun. Important expectations also included the oppor-
tunity to see new places and meet new people, and
improvement of physical fitness among the combat
re-enactors.
3. In the opinion of more than a half of subjects mem-
bership in a medieval re-enactment group offered
the following benefits: better frame of mind and di-
versity in one’s everyday life. In the group of combat
re-enactors over one half of them indicated improve-
ment of physical fitness as an important benefit.
4. Present-day medieval re-enactment groups offer
their members a choice of various forms of activity,
stimulate them to follow active leisure pursuits and
are a great retreat from daily chores through organ-
ized fun and entertainment. Therefore they possess
many characteristics of physical recreation.
5. Medieval re-enactment groups are novel and attrac-
tive forms of physical recreation with elements of
intellectual recreation.
References
1. Astrand P. O., Why exercise? Med Sci Sport Exer, 1992, 24 (2),
153–162.
2. Corbin C.B., Welk G.J., Corbin W.R., Welk K.A., Fitness and
Wellness. Physical condition, fitness, health [in Polish]. Zysk
i S-ka, Poznań 2007.
3. Szeklicki R., Habitual physical activity of men over 60 years of
age: morphological and metabolic consequences and social de-
terminants [in Polish]. AWF, Poznań 2007.
4. Oja P., Recipe for health: physical exercise intensity In:
Wolańska T. (ed.), Physical activity and health [in Polish].
PTNKF, Warszawa 1995, 5–15.
5. Ossowska M., The knightly ethos and its varieties [in Polish].
PWN, Warszawa 1986.
6. The Grand Register of Robert Bagrit. Avaliable at http://
www.bagritt.pl/ 10.12.2007.
7. Barber R., Knights and knighthood [in Polish]. Bellona,
Warszawa 2002.
8. Bartnicka K., Szybiak I., An outline history of education [in
Polish]. Żak, Warszawa 2001.
9. Ponczek M., The attitude of the Roman Catholic Church to-
wards physical culture and martial arts in late antiquity and the
middle ages [in Polish]. In: Cynarski W.J., Obodyński K. (eds.),
The humanistic theory of sports and martial arts [in Polish].
Uniwersytet Rzeszowski, Rzeszów 2003, 43–49.
10. Ponczek M., Physical culture and the Roman Catholic Church
from antiquity to the 20th century. Resources for PE classes
and seminars [in Polish]. Politechnika Czestochowska,
Częstochowa 2004.
11. Kiełbasiewicz-Drozdowska I., Outline of theoretical reflection
on recreation problems. In: Kiełbasiewicz-Drozdowska I.,
Siwiński W. (eds.), The basics of theory and methodology of
recreation (Basic issues) [in Polish]. AWF, Poznań 2001, 9–25.
12. Drabik J., How much movement is enough? In: Mieczkowski T.
(ed.), Movement as a medicine: ineffective if too little, harmful
if too much [in Polish]. Uniwersytet Szczeciński, Szczecin
1999, 41–45.
13. Pilawska A., Pilawski A., Pertyński W., Outline of theory and
methodology of physical recreation [in Polish]. GWSH, Kato-
wice 2003.
14. Winiarski R., Psychosocial dimensions of physical recreation.
In: Piotrowska H. (ed.), Sport for all, recreation for everyone.
Part II [in Polish]. TKKF, Warszawa 1995, 6–16.
Paper received by the Editors: July 17, 2009.
Paper accepted for publication: November 18, 2009.
Address for correspondence
Władysław Mynarski
Akademia Wychowania Fizycznego
im. Jerzego Kukuczki
ul. Mikołowska 72a
40-065 Katowice, Poland
e-mail: [email protected]

HUMAN MOVEMENT
95
Introduction
It has been accepted by scientists and health practi-
tioners alike that media-based sedentary behaviours
such as TV viewing and leisure time computer use com-
pete for time that might otherwise be spent in physical
activity, which might lead to obesity [1, 2]. One particu-
lar influence on children’s health related behaviour that
has received substantial media attention is computer and
video game play. Moreover, children today have not only
been described as fatter than previous generations, but
also less active, less athletically skilled, less interested in
physical activity, less self-disciplined (and therefore
more likely to choose the ‘easy’ or ‘soft’ option, be it
with respect to physical activity or food) and more ad-
dicted to technology [3]. This has subsequently led re-
searchers to suggest that children’s computer/video game
behaviour should be the subject of further scrutiny when
examining health behaviours [2].
Recently, technological advances have led to the de-
velopment of active video gaming such as the Nintendo
Wii, partly in an attempt to convert sedentary screen
time to active screen time and to promote children’s
physical activity. However, evidence supporting this
idea is scant and that which is available has tended to be
laboratory based. Lannigham-Foster et al. [4] reported
that active video game play was associated with in-
creased energy expenditure (EE) compared to resting
energy expenditure (REE) and EE during seated gam-
ing. Active gaming, using the Sony eye toy, increased
EE by 273 kj/h above REE whereas active gaming us-
ing a dance mat game increased EE 382 kj/h above REE
in 25, 9 year old children. They concluded that activity
promoting video games more than doubled the energy
expenditure compared with chair-based equivalents and
offer a potential approach for reversing sedintariness
and reducing pediatric obesity. Likewise, a further labo-
ratory study by Graves et al. [5] examined energy ex-
penditure during active and sedentary game play in 11,
13–15 year old adolescents. They concluded, similar to
Lannigham-Foster et al. [4] that, active video games use
significantly greater energy than sedentary game play
but are not of sufficient intensity to contribute towards
the recommended daily amount of exercise in children.
However, both these studies were laboratory based and
examined the acute impact of active video game play on
DOI: 10.2478/v10038-009-0023-1
Michael J. Duncan1*, Victoria Staples2
1 Department of Bimolecular and Sports Science, Coventry University, Coventry, United Kingdom
2 Department of Psychology, University of Derby, Derby, United Kingdom
ABSTRACT
Purpose. To assess physical activity levels during active video game play over time and compare this to ‘free play’ associated with
recess activity in a sample of British primary school children over a 6-week period. Basic procedures. Thirty children (ages 10–11, 12
boys, 18 girls) from central England were randomly selected to participate in a 6 week, recess based, active video gaming intervention
(n = 15) or act as controls (n = 15). Repeated measures analysis of covariance (controlling for body fatness) was used to examine any
differences in physical activity, determined by pedometry and heart rate monitoring over time and between intervention and control
groups. Main Findings. Children in the intervention accumulated significantly greater steps/day than the control group during the first
week of the intervention. This pattern was reversed at the mid and end points of the intervention (p = .03). Irrespective of time point,
children engaging in active video game play spent a lesser percentage of time engaged in MVPA than the controls undertaking
‘traditional’ recess activity (p = .0001). Conclusions. Active video game play does not appear to be a sustainable means to enhance
children’s physical activity. Although physical activity (steps/min) was greater on initial presentation of active video games compared
to ‘traditional’ recess activity, this appears to be an acute effect.
Key words: pedometer, heart rate monitoring, recess, steps, exergaming
THE IMPACT OF A SCHOOL-BASED ACTIVE VIDEO GAME PLAY INTERVENTION ON CHILDREN’S PHYSICAL ACTIVITY DURING RECESS
2010, vol. 11 (1), 95–99
* Corresponding author.

HUMAN MOVEMENT
96
M.J. Duncan, V. Staples, Active video games
physical activity. Both authors have highlighted further
research examining this issue in other settings and with
varied age ranges as a priority.
More recently, McDougall and Duncan [6] reported
that, in a sample of 12, 8–11 year old children who en-
gaged in active video game play during school recess
over one week, children accumulated approximately
10% of the recommended number of steps/day for
health. They however, highlighted the short duration of
their study as a limitation and suggested that future re-
search examine the potential of active video game play
as a means to enhance children’s physical activity at re-
cess over a longer period. Therefore, the purpose of this
study was to assess physical activity levels during ac-
tive video game play over time and compare this to
‘free play’ associated with recess activity in a sample of
British primary school children over a 6-week period.
Material and methods
Participants
Following ethics approval and parental informed
consent, 30 children (12 boys, 18 girls) from 2 primary
schools in central England were randomly selected to
participate in a 6 week, recess based, active video gam-
ing intervention. Children were from school year 6
(ages 10–11) and the mean age (SD) of the children was
10.4 (0.5) years. Fifteen children from each school un-
dertook twice weekly sessions of active video gaming
during school lunch breaks with 15 children acting as
controls. There was an equal gender split between
groups and across schools with 6 boys and 9 girls in
both the intervention and control groups. The schools
were located in the same geographical area of England
and did not differ in regard to indices of deprivation.
Procedures
The intervention group undertook twice weekly ac-
tive video game play sessions instead of their regular
recess activity for 6 weeks. The control group took part
in their normal recess activity only. Active video game
play sessions used the Nintendo Wii console and em-
ployed 3 game titles, Wii Sports (Tennis), Sonic and
Mario at the Olympics (100 m, 110 m hurdles) and Ce-
lebrity Sports Showdown (Horse Racing). Game titles
were rotated during each session in order to avoid chil-
dren becoming bored by playing the same game. This
ensured that the children played all of the active video
games during each active game play session. The play-
ground provision across both schools that participated
in the study was similar in terms of area and equipment
provided during recess (p < .05). In addition, the dura-
tion of school recess periods was identical across
schools.
Physical activity was assessed at recess during the
first, third and sixth weeks of the 6-week period for
both groups using pedometry and heart rate monitoring.
Physical activity was assessed using a sealed, piezo-
electric pedometer (New Lifestyles, NL2000, Montana,
USA) which was worn throughout the game play and
recess periods. The physical activity monitoring/game
play periods were set at 30 minutes across schools and
across intervention and control groups. However, step
counts were converted to steps/min in order to account
for minor variations in the time engaged in recess activ-
ity between groups across the monitoring period and in
accordance with recommended guidelines [7]. In addi-
tion, heart rate data was collected using Polar RS400
heart rate monitors (Polar Electro, OY, Finland), cov-
ered with a purpose built shield to prevent children
gaining feedback during recess periods. Heart rate was
recorded every 5 s. Resting heart rate was determined
a priori by averaging the 5 lowest heart rate values re-
corded for each child [8] lying supine for a 10 minute
period in a darkened room. These were determined 24
hours prior to the intervention beginning but following
familiarisation sessions described below. Heart rate re-
serve (HRR) values of 50 (HRR50
) and 75 (HRR75
) per-
cent were used as threshold values to represent moder-
ate-to-vigorous physical activity (MVPA) and in agree-
ment with prior studies of children’s recess based
activity [9]. In all cases monitors/pedometers were
placed on the children prior to the start of their lunch
recess period and the children consumed their lunches
at the end of the recess period in order to ensure that
heart rate measurements were not affected by dietary
induced thermogenesis following lunch.
Prior to commencing the intervention or control pe-
riods measurement of stature (to the nearest 0.1 cm) was
recorded using a Leicester Height Measure (Seca Ltd.,
Birmingham, UK). Body mass was assessed using cali-
brated scales (Seca Ltd., Birmingham, UK) and percent
body fatness was determined using bioelectrical imped-
ance analysis (Tanita BF305, Tanita Inc, Japan). This
form of bioelectrical impedance analysis has previously
been validated with pediatric populations and shows

HUMAN MOVEMENT
97
M.J. Duncan, V. Staples, Active video games
Figure 1. Mean (SD) of steps/min between intervention
and control group during the first, third and final week
of the intervention period
Steps/Min Week 1
40
35
30
25
20
15
10
5
0
Ste
ps/
Min
good reliability and validity [10, 11]. The mean (SD)
values for the children’s anthropometric characteristics
are shown in Tab. 1. In addition, children were familiar-
ised with the physical activity monitoring equipment to
be used in the study. The children undertaking the ac-
tive video game play sessions were also familiarised
with the Nintendo system to be used as part of the study.
Brief focus group interviews (n = 6 approx per group)
were also employed prior to any physical activity
assessment/video game sessions in order to ascertain
children’s prior experience with video games in general
and the Nintendo Wii specifically. These indicated that
all the children possessed at least 1 video game console,
60% owned the same console that was used in the cur-
rent study and 100% had experience of using/playing
the same console that was used in the current study.
Children who missed 2 scheduled sessions or more of
the monitoring period were excluded from the data set.
This resulted in 2 exclusions, both of whom were boys.
Statistical Analysis
Any differences in physical activity across the 6-week
period and between intervention and control groups were
examined using 3 (measurement period) by 2 (group) re-
peated measures Analysis of Covariance (ANCOVA)
controlling for body fatness. The dependent variables
were the percentage of time spent in MVPA and the
steps/min taken at each measurement point. The statisti-
cal package for social sciences (Version 16) was used for
all analysis and the alpha level was set at p < 0.05.
Results
In regard to pedometer data, repeated measures AN-
COVA indicated significant steps by group interaction
(F 2, 54
= 3.74, p = .03) with number of steps/min being
greater for the intervention group in the first week of the
intervention period but lower than the control group at
the mid and end points of the 6-week period (see Fig. 1).
Bonferroni post hoc pairwise comparisons indicated no
significant differences between steps/min across tie pe-
riods for the control group (all p < .05) but significant
differences between steps/min taken in the first week of
the intervention and the mid point of the intervention
(Mean Diff = 9.95, p = .01) and between the first week
of the intervention and the last week of the intervention
(Mean Diff = 9.56, p = .01). In regard to heart rate,
a significant main effect for the percentage of time
spent in MVPA (F 1, 28
= 15.6, p = .0001) was evident
and indicated that the percentage of time spent in
MVPA was significantly lower in the intervention
group, compared to the control group, across the inter-
vention period. There were no other significant interac-
tions or main effects (all p < .05). Mean (SD) of steps/
Table 1. Mean (SD) of children’s anthropometric characteristics
Age (years) Body Mass (kg) Stature (m) Body Fatness (%)
Group (n = 30) 10.4 (.50) 38.6 (8.2) 1.44 (.06) 20.1 (4.3)
Intervention (n = 15) 10.4 (.50) 38.7 (7.8) 1.44 (.07) 20.2 (4.6)
Control (n = 15) 10.4 (.51) 38.5 (8.9) 1.43 (.06) 19.9 (4.2)
Table 2. Mean (SD) of steps/min and percentage of recess time spent in MVPA across the monitoring period
Steps/Min
Week 1
Steps/Min
Week 3
Steps/Min
Week 6
MVPA
Week 1
(% recess time)
MVPA
Week 6
(% recess time)
Intervention (n = 15) 28.9 (8.6) 18.9 (8.5) 19.3 (5.6) 15.9 (8.3) 12.1 (6.0)
Control (n = 15) 27.0 (4.2) 25.1 (6.9) 25.1 (3.7) 23.1 (8.9) 25.2 (11.2)
Steps/Min Week 6Steps/Min Week 3
InterventionControl

HUMAN MOVEMENT
98
M.J. Duncan, V. Staples, Active video games
day and percentage of recess time spent in MVPA for
both groups and across the intervention period are pre-
sented in Tab. 2. Analysis also indicated that there were
no significant differences in variables across the two
schools that participated in the study (all p < .05), con-
firming the similarity of recess conditions across the
two participating schools.
Discussion
The purpose of this study was to assess physical
activity levels during active video game play over
a 6-week period and to compare this to ‘free play’ asso-
ciated with recess activity in a sample of British prima-
ry school children. The results from this exploratory
study suggest that there is an acute effect of participat-
ing in active video game play whereby physical activity
(steps/min) during recess was greater for children en-
gaging in active video game play compared to those en-
gaging in regular recess. However, this was not sus-
tained and physical activity at weeks 3 and 6 was lower
for the video game group compared to the control
group. Heart rate data also support these assertions as
the percentage of time spent in MVPA during tradi-
tional recess was greater than the percentage of time
spent in MVPA when playing active video games.
These results are novel but add support to laboratory
based research which has suggested that active video
game play may not be sufficient to contribute to chil-
dren’s recommended daily levels of physical activity
[5]. Prior authors have also suggested that active video
game play might provide a stimulus for obesity treat-
ment and prevention due to increases in energy expend-
iture measured in comparison to sedentary game play
[4]. Certainly, active video game play results in greater
energy expenditure than sedentary game play but, in the
context of this study and school recess, traditional re-
cess activities appear to offer a more sustainable way
for children to meet physical activity targets or recom-
mendations during school time.
As this study was school-based, recess physical ac-
tivity was employed in order to provide a comparison
for the physical activity undertaken during active video
game play sessions. Prior research has reported that
children can accumulate substantial portions of their
daily-recommended physical activity levels during the
free-play associated with recess periods [12] and clearly,
the benefit of traditional recess free play in terms of en-
couraging physical activity make this a particularly op-
portune period where children can be physically active.
The current study was only 6 weeks in duration and
suggests that there is an acute impact of active video
games when used as a substitute for traditional school
recess. This may be a form of novelty effect and physi-
cal activity levels decline after initial presentation with
this mode of physical activity. In this context the intro-
duction of active video game play may have actually
suppressed children’s physical activity levels rather than
enhanced them.
Additionally, prior research conducted by McDou-
gall and Duncan [6] also suggested that active video
game play during school recess could provide a stimu-
lus to increase children’s physical activity and reported
that a substantial part of the recommended level of chil-
dren’s physical activity could be achieved through re-
cess based game play. However, this study was con-
ducted over a 1 week period and used a limited number
of participants and, although the authors noted this as
a limitation and suggested further research was needed
to verify their results, clearly the duration of their study
has limited the conclusions they could make to the acute
effects of a school based active video game interven-
tion. This study has attempted to fill the gap in some of
the previously published studies examining this topic by
exploring active video game play outside the laboratory
environment, by comparing this to a control group and
by assessing children over a longer period than the ma-
jority of prior studies.
Despite this, the current study is not without its limi-
tations. Active video game play was engaged in twice
weekly as this was considered to be a realistic frequency
for this form of activity in schools. It is possible that dif-
ferent weekly frequencies of game play may have pro-
vided different results. Expertise may also be an issue
that future research needs to consider. Practice of using
the Nintendo Wii games and controllers may change the
level of energy expenditure required to be successful
within these games. Prior studies have noted this to be
an important consideration [13]. It is possible that the
reductions in physical activity seen as the children pro-
gressed through the 6-week intervention may have aris-
en because they actually become more successful at the
games they were playing. Anecdotally, in order to be
successful in many of the active video games used in
the present study dynamic, gross movements are not al-
ways required. To some extent this may then negate the
premise on which these gaming platforms are based but
further research is needed to verify this suggestion.

HUMAN MOVEMENT
99
M.J. Duncan, V. Staples, Active video games
Sample size is also an issue, these results are based on
a relatively small sample of participants and further
large scale studies are needed to verify these findings.
Furthermore, as children were selected from one school
year, resulting in a possible age difference between any
two children in the study being 12 months. As prior au-
thors [14] have reported that although children may be
the same age chronologically, they may be a different
age biologically which can then manifest itself in per-
formance differences, this may be an issue future au-
thors need to consider when examining physical activity
in the school setting. The authors of the current study
also acknowledge that the use of pedometry and heart
rate monitoring to quantify physical activity in the cur-
rent study may also be a limitation. In some cases, lower
limb movement during the active video game play is not
always needed but upper body movement is and there-
fore differences in pedometer counts between interven-
tion and control groups may be a result of the games se-
lected as part of the intervention. Accelerometers were
not available for use in the current study but future re-
searchers interested in this area may benefit from the
use of accelerometry as a tool to quantify movement
during active video gaming.
Conclusions
This study has added further data on children’s
physical activity responses to active video games. No
study to date has examined the potential for active vid-
eogames to contribute to enhanced physical activity in
the school setting. This study is novel in that it is the
first to provide heart rate and step count data comparing
a sustained period of active video game play to tradi-
tional recess physical activity in an ecologically valid
setting (i.e. the school). In this case, physical activity
was greater for active video games played during school
recess compared to traditional recess during the first
week of a 6-week intervention period. Thereafter, physi-
cal activity during active game play was significantly
lower than physical activity during traditional recess.
This suggests that although the premise of active video
games has potential to enhance children’s physical ac-
tivity, this does not appear to be the case when applied
to school recess over a 6-week period.
Acknowledgements
This research was supported by a research grant from the
Tanita Healthy Weight Trust.
References
1. Andersen R.E., Crespo C.J., Bartlett S.J., Cheskin L.J., Pratt
M., Relationship of physical activity and television watching
with body weight and level of fatness among children. JAMA,
1998, 279 (12), 938–942.
2. Mota J., Ribeiro J.C., Santos P.M., Gomes H., Obesity, physical
activity, computer use and TV viewing in Portuguese adoles-
cents. Ped Exer Sci, 2006, 18 (1), 113–121.
3. Gard M., Wright J., The Obesity Epidemic, Science, Morality
and Ideology. Routledge, London 2005.
4. Lanningham-Foster L., Jensen T.B., Foster R.C., Redmond
A.B., Walker B.A., Heinz D. et al., Energy Expenditure of sed-
entary screen time compared with active screen time for chil-
dren. Pediatrics, 2006,118 (6), e1831–e1835. DOI: 10.1542/peds.
2006-1087.
5. Graves L., Stratton G., Ridgers N.D., Cable N.T., Comparison
of energy expenditure in adolescents when playing new
generation and sedentary computer games: cross sectional
study. BMJ, 2007, 335 (7633), 1282–1284. DOI: 10.1136/
bmj.39415.632951.80.
6. McDougall J., Duncan M.J., Children, Videogames and Physi-
cal Activity: An exploratory Study. Int J Disability Hum Dev,
2008, 7 (1), 89–94.
7. Jago R., Watson K., Baranowski T., Zakeri I., Yoo S., Bar-
anowski J. et al., Pedometer reliability, validity and daily activ-
ity targets among 10- to 15-year-old boys. J. Sports Sci, 2006,
24, 241–251. DOI: 10.1080/02640410500141661.
8. Janz K.F., Use of heart rate monitors to assess physical activity.
In: Welk G.J. (ed.), Physical Activity Assessments for Health-Re-
lated Research. Human Kinetics, Champaign 2002, 143–161.
9. Ridgers N.D., Stratton G., Clark E., Fairclough S.J., Richardson
D.J., Day-to-day and seasonal variability of physical activity
during school recess. Prev Med, 2006, 42 (5), 372–374. DOI:
10.1016/j.ypmed.2006.01.017.
10. Jartti L., Hakanen M., Paakkunainen U., Raittinen P., Rönne-
maa T., Comparison of hand-to-leg and leg-to-leg bioelectric
impedance devices in the assessment of body adiposity in pre-
pubertal children. The STRIP study. Acta Paed, 2000, 89 (7),
781–786. DOI: 10.1111/j.1651-2227.2000.tb00385.x.
11. Goss F., Robertson R., Williams A., Sward K., Abt K., Ladewig
M. et al., A comparison of skinfolds and leg-to-leg bioelectrical
impedance for the assessment of body composition in children.
Dyn Med, 2003, 2, 5. DOI: 10.1186/1476-5918-2-5.
12. Verstraete S.J.M., Cardon G.M., De Clercq D.L.R., De Bour-
deaudhuij I.M.M., Increasing children’s physical activity levels
during recess periods in elementary schools: The effects of
providing game equipment. Eur J Pub Health, 2006, 16 (4),
415–419. DOI: 10.1093/eurpub/ckl008.
13. Sell K., Lillie T., Taylor J., Energy expenditure during physi-
cally interactive video game playing in male college students
with different playing experience. J Am Coll Health, 2008, 56
(5), 505–511. DOI: 10.3200/JACH.56.5.505-512.
14. Gladwell M., Outliers: The Story of Success. Penguin, London
2009.
Paper received by the Editors: May 28, 2009.
Paper accepted for publication: November 17, 2009.
Address for correspondence
Michael Duncan
Department of Bimolecular and Sports Science
James Starley Building
Coventry University, United Kingdom
e-mail: [email protected]

HUMAN MOVEMENT
100
RETRACTION NOTICE
Refers to: RETRACTED “The study of lung flow limitations in aerobically trained children” Human
Movement, Volume 10, Number 2, 2009, pages 96–108
The following article from Human Movement 2009, 10(2), 96–108, “The study of lung flow limitations in aerobi-
cally trained children” by Mohsen Ghanbarzadeh, Abdolhamid Habibi, Masoud Nikbakhat, Gholamhosain Ebadi,
Hossein Poursoltani has been retracted at the request of authors and the American Physiological Society (APS).
Reason: The author has plagiarized a paper that had already appeared in Journal of Applied Physiology 2005, 99,
1912–1921, doi:10.1152/japplphysiol.00323.2005, “Exercise flow-volume loops in prepubescent aerobically trained chil-
dren” by Cedric Nourry, Fabien Deruelle, Claudine Fabre, Georges Baquet, Frederic Bart, Jean-Marie Grosbois, Serge
Berthoin, and Patrick Mucci. One of the conditions of submission of a paper for publication is that authors declare ex-
plicitly that their work is original and has not appeared in a publication elsewhere. As such, this article represents a se-
vere abuse of the scientific publishing system. We apologize to the authors of the original article and editors of the
Journal of Applied Physiology for this unfortunate occurrence, and thank the American Physiological Society for
drawing the matter to our attention. We apologize also to readers of both journals that this was not detected earlier dur-
ing the submission process and deeply regret any inconvenience caused due to this incident.
THE STUDY OF LUNG FLOW LIMITATIONS IN AEROBICALLY TRAINED CHILDREN
DOI: 10.2478/v10038-009-0019-x
Mohsen Ghanbarzadeh1*, Abdolhamid Habibi1, Masoud Nikbakhat1, Gholamhosain Ebadi2,
Hossein Poursoltani3
1 Faculty of Physical Education and Sports Science, Shahid Chamran University, Ahwaz, Iran
2 Education Organization of Khuzestan Province, Ahwaz, Iran
3 Sport Science Research Center of Ministry Science Research and Technology, Ahwaz, Iran
RETRACTION NOTICE
2010, vol. 11 (1), 100

HUMAN MOVEMENT
101
2010, vol. 11 (1), 101–102
CONFERENCE REPORTS
III CENTRAL EUROPEAN CONGRESS
ON OSTEOPOROSIS AND OSTEOARTHRITIS
Kraków, September 24–26, 2009
REPORT
III Central European Congress on Osteoporosis and
Osteoarthritis was held in Kraków on 24–26 September
2009. The Congress was organized under the auspices
of the International Osteoporosis Foundation. The Hon-
orary Patron was Ewa Kopacz, the Minister of Health of
the Republic of Poland. The Congress was officially
opened by Prof. J.A. Kanis, the President of the Interna-
tional Osteoporosis Foundation.
750 doctors, including 80 from abroad, participated
in the Congress, the biggest scientific event in this field
in Central Europe. During 3 days of debates 55 lectures
and 70 posters were presented. Lectures were simulta-
neously translated into English and Polish. Traditionally,
abstracts of all presentations were published in a Polish
journal Ortopedia Traumatologia Rehabilitacja vol. 11.
suppl. 2, 2009.
The Congress forms an international platform where
doctors and scientists from various fields of medicine
can exchange experience. Osteoporosis and osteoarthri-
tis were recognized as the most common illnesses of the
contemporary society. Recent scientific achievements
in the diagnosis and treatment of osteoporosis were pre-
sented, consistent with the WHO guidelines. Prominent
scientists from Poland and abroad held presentations,
among others.: Prof./Prof. P. Burckhardt, S. Epstein, G.
Holzer, H. Johansson, J.A. Kanis, S. Kutilek, G. Maal-
ouf, E. McCloskey, S.E. Papapoulos, J-Y. Reginster, F.J.
Ring, R. Rizzoli, H. Resch, J. Stepan.
Opening lectures were presented by world recog-
nized authorities in the field of osteoporosis, Prof. J.A.
Kanis (United Kingdom): Use of FRAX® in identifica-
tion of persons who are at high fracture risk, and Prof.
S.E. Papapoulos (the Netherlands): Treating osteoporo-
sis beyond five years.
One of the main Congress topics was developing
guidelines for the diagnosis of osteoporosis. It was
agreed on without all doubt that therapeutic decisions
should be taken based on the assessment of fracture
risk. It can be determined on the basis of the body mass
index (BMI) and clinical fracture risk factors. The cur-
rent WHO standard for calculation is the FRAX®
method, presented by Prof. J.A. Kanis. The FRAX®
calculator is available online at www.shef.ac.uk/FRAX.
Being familiar with the realities of the work of a doctor
in Polish clinics, Prof. E. Czerwiński with his Team,
and in cooperation with Prof. J.A. Kanis, developed
a hand held FRAX® calculator. It can be used to calcu-
late fracture risk with or without BMD. The calculator
was presented to all Congress participants. Reliability
of fracture risk evaluation using FRAX® was docu-
mented on the basis of 11-year observation of patients
from the Kraków region. Implementation of FRAX®
was also discussed by Prof. J.E. Badurski, Prof. E. Mc-
Closkey (United Kingdom) and H. Johansson (Sweden).
A round table discussion summarized a number of in-
teresting presentations related to FRAX®. The mini-
mum fracture threshold, which should initiate therapy
and its refunding, was discussed.
It was pointed out in sessions devoted to the treat-
ment of osteoporosis that Poland, resulting from its cur-
rent refunding system, is the only country in Europe
where only one medication is available – alendronate.
The efficacy and safety of therapy with ibandronate,
zolendronate and PTH was discussed in particular ses-
sions. Prof. S. Epstein (USA) presented beneficial re-
sults of long-term treatment with ibandronate orally
once monthly and intravenously once in 3 months. Prof.
J-Y. Reginster (Belgium) summarized many year obser-
vation of the efficacy of strontium in the prevention of
fractures, stressing that people treated with strontium
had higher bone biomechanical parameters than pa-
tients treated with alendronate. The advantage of ana-
bolic therapy, at present available in the form of PTH,
was indicated in many discussions. This medication is
used not only in the most serious stages of osteoporosis,
but also in corticosteroid-induced osteoporosis.
Much hope arouses due to the awaited introduction
of denosumabe administered subcutaneously once in

HUMAN MOVEMENT
102
Conference reports
6 months to treatment in Poland. Prof. R. Rizzoli
(Switzerland) and Prof. S. Kutilek (Czech Republic)
showed the results of clinical trials of this medication
documenting the antifracture efficacy and safety of
therapy.
No explicit answer to the question about the sequen-
tial therapy or prolonged treatment with bisphospho-
nates above 5 years was given in the discussions.
Sessions on causes and results of osteoporotic frac-
tures as well as prevention and clinical results of falls
also met with much interest. Among the novelties were
training sessions of Nordic Walking and Tai-Chi. Con-
gress participants had opportunity to get familiar with
these increasingly popular forms of physical activity,
recommended in falls prevention programmes. Infor-
mation materials were distributed as part of the “Don’t
Break” campaign.
Among main Congress topics there were mecha-
nisms of bone regulation and turnover, osteoporosis in
men, children and adolescents, and secondary oste-
oporosis. Prof. P. Burckhardt (Switzerland) convinced
that the currently used supplementation of vitamin D is
on a too low a level and 2000 jm. is recommended in
persons not exposed to sun.
Standards of treatment were discussed in the session
devoted to osteoarthritis. However, no progress was
noted in the pharmacotherapy of osteoarthritis.
Members of the Scientific Committee as well as par-
ticipants stressed the high scientific level of the Con-
gress, recognizing it as the highest among congresses
organized so far.
The general Assembly of the Polish Osteoarthrology
Society decided that the forthcoming IV Central Euro-
pean Congress on Osteoporosis and Osteoarthritis will
be held in Kraków on 29.09–01.10.2011.
All publications related to the last and previous con-
gresses (organized since 1994) along with the photo-
graphic documentation are available on the Polish Portal
of Osteoporosis (www.osteoporoza.pl). Materials from
the “Don’t Break” campaign as well as many other pub-
lications are also available on the portal.
On behalf of the Scientific Committee
Prof. med. Edward CzerwińskiPresident of the Organizing Committee
Head of Department of Bone and Joint Diseases
Medical College Jagiellonian University
Kraków, October 2009

HUMAN MOVEMENT
103
COMPETITION
COMPETITION OF RESEARCH PAPERS
onPHYSICAL EDUCATION TEACHING
for Prof. Bogdan Czabański’s Award
Submission requirements:
• Only papers published in the year prior to the date of competition may be submitted
• Papers (offprints) must be sent before the end of March of each year to the Organizers’ address:
Akademia Wychowania Fizycznego
Katedra Dydaktyki Wychowania Fizycznego
ul. Witelona 25, 51-617 Wrocław, Poland
tel. 0 (prefix) 71 347-31-69, fax 348-25-27
www.awf.wroc.pl/czabanski
e-mail: [email protected]
• Independent academics must not take part in the competition
• Former award winners must not take part in the competition
• A research paper can be a team work effort, but the team of authors must not include an independent academic
Evaluation criteria:
• Submitted papers must be research papers • All papers must be on the subject of physical educa-
tion teaching
Jury:
Three independent academics, Professors of the Univer-sity School of Physical Education in Wrocław, Poland:
• Prorector for Research• Head of Chair of Physical Education Didactics • Head of Chair of Swimming
The jury convenes annually on April 24. The jury’s final decision will be made available to all participants. Only one paper is awarded with the prize (diploma of merit and 1.000 PLN). The award is presented each year during the inaugura-tion ceremony of the academic year at the University School of Physical Education in Wrocław, Poland.
2010, vol. 11 (1), 103

HUMAN MOVEMENT
104
2010, vol. 11 (1), 104–108
Redakcja półrocznika Human Movement przyjmuje do
publikacji oryginalne prace empiryczne oraz przeglądowe
dotyczące ruchu człowieka z różnych dziedzin nauki (m.in.
medycyny sportu, fizjologii wysiłku fizycznego, biome-
chaniki, antropomotoryki, socjologii, psychologii, pedago-
giki) w zakresie wychowania fizycznego, zdrowotnego, re-
kreacji i turystyki, rehabilitacji, fizjoterapii. Przyjmowane
są również listy do Redakcji, sprawozdania z konferencji
naukowych i recenzje książek. Prace mogą być napisane
w języku polskim lub angielskim. Teksty polskie po uzy-
skaniu pozytywnej recenzji są tłumaczone na język angiel-
ski przez Redakcję. Autorzy nie otrzymują honorarium.
Warunkiem rozpoczęcia prac redakcyjnych nad artyku-
łem jest dostarczenie do Redakcji trzech kopii maszynopisu
(wydruku komputerowego) przygotowanego zgodnie z ni-
niejszym regulaminem oraz dyskietki (3 1/2” w formacie
IBM) lub dysku CD-ROM zawierających komplet materia-
łów. Na etykiecie dyskietki (CD-ROM-u) należy podać ty-
tuł pracy oraz numery wersji użytych edytorów i progra-
mów graficznych. Praca może być wysłana pocztą elektro-
niczną (por. Poczta elektroniczna).
List przewodni i oświadczenie
Do maszynopisu (wydruku komputerowego) autor po-
winien dołączyć list przewodni oraz oświadczenie, że treść
artykułu nie była i nie będzie publikowana w tej formie
w innych wydawnictwach bez zgody Redakcji czasopisma
Human Movement oraz że zgadza się na ogłoszenie jej
w tym półroczniku. W przypadku prac zespołowych
oświadczenie może złożyć w imieniu wszystkich współau-
torów autor główny.
Ocena pracy (recenzja)
Praca jest recenzowana przez dwie osoby. Autor może
podać nazwiska potencjalnych recenzentów, lecz Redakcja
zastrzega sobie prawo decyzji o ich doborze. Recenzenci
nie znają nazwiska autora ani autor nie zna nazwisk recen-
zentów, dlatego do artykułu należy dołączyć tzw. ślepą
stronę, tzn. tylko z tytułem pracy. W zależności od sugestii
osób oceniających Redakcja podejmuje decyzję o dalszym
losie pracy. Decyzja Redakcji jest ostateczna.
Maszynopis (wydruk komputerowy)
Tekst prac empirycznych wraz ze streszczeniem, rycina-
mi i tabelami nie powinien przekraczać 20 stron, a prac prze-
glądowych – 30 stron znormalizowanych formatu A4 (ok.
1800 znaków na stronie, złożonych 12-punktowym pismem
Times New Roman z zachowaniem 1,5 interlinii). Redakcja
przyjmuje teksty przygotowane wyłącznie w edytorze tekstu
Microsoft Word. Strony powinny być ponumerowane.
The Human Movement journal, issued semi-annually,
accepts for publication original papers and review papers in
various aspects of human movement (e.g., sociology, psycho-
logy, pedagogy, exercise physiology, biomechanics, motor
control, sport medicine) in a broad sense of the term: physi-
cal education, recreation, physiotherapy, health and fitness,
and sport science. Authors are not paid for their articles.
Letters to the Editor, reports from scientific meetings and
book reviews are also welcome. Articles written in Polish
and English will be accepted. After acceptance, articles in
Polish will be translated into English by the Editorial Office.
Three copies of the manuscript and figures should be
sent to the Editorial Office. If you send the printed version
by e-mail, a floppy disk should be submitted containing the
whole text of the paper. The label of the disk should include
the name of the first author, paper title, as well as the ver-
sion numbers of the word processor and graphics programs
used. IBM 3 1/2’’ disks and CD-ROMs are acceptable. It is
advisable to use Microsoft Word. Electronic manuscripts
are preferred.
Cover letter
Authors must submit a cover letter with the manuscript.
Each submission packet should include a statement signed
by the first author that the work has not been published pre-
viously or submitted elsewhere for review. It should also
contain Author’s acceptance of Publisher’s terms. The pa-
per should be accompanied with the correspondence ad-
dress of the Author, the telephone number, fax number and
e-mail address.
Review process
Received manuscripts are first examined by the editors
of Human Movement. Incomplete packages or manuscripts
not prepared in the required style will be sent back to au-
thors without scientific review. Authors are encouraged to
suggest the names of possible reviewers, but Human Move-
ment reserves the right of final selection. Manuscripts will
be sent anonymously to two reviewers. As soon as possible
after the review process is concluded, you will be notified
by e-mail of the acceptance or rejection of your contribu-
tion for publication, our decision is ultimate.
Preparation of the manuscript
Experimental papers should be divided into the follo-
wing parts: title page, blind title page, abstract with key
words, introduction, materials and methods, results, discus-
sion, conclusions, acknowledgements, references. In papers
of a different type, sections and their titles should refer to
the described issues.
REGULAMIN PUBLIKOWANIA PRAC
INSTRUCTIONS FOR AUTHORS

HUMAN MOVEMENT
105
Regulamin publikowania prac – Instructions for Authors
STRONA TYTUŁOWA
Na stronie tytułowej należy podać:
1. Tytuł pracy w języku polskim i angielskim. 2. Skró-
cony tytuł artykułu w języku angielskim (nie dłuższy niż
40 znaków), który będzie umieszczony w żywej paginie. 3.
Nazwiska autorów z afiliacją. 4. Imię i nazwisko autora
(autorów) wraz z adresem do korespondencji, numerem te-
lefonu, faksu i koniecznie e-mailem.
Kontakt z autorem będzie utrzymywany wyłącznie za
pomocą poczty elektronicznej.
STRESZCZENIE
Przed tekstem głównym należy umieścić streszczenie
w języku angielskim, zawierające około 250 wyrazów i 3–6
słów kluczowych (ze słownika i w stylu MeSH). Powinno
się ono składać z następujących części: Purpose, Basic pro-
cedures, Main findings, Conclusions.
TEKST GŁÓWNY
Tekst główny pracy empirycznej powinien zawierać
następujące części: wstęp, materiał i metody, wyniki, dys-
kusja (omówienie wyników), wnioski, podziękowania (je-
żeli potrzebne), przypisy (jeżeli występują), piśmiennictwo
(zawarte tylko w bazach danych, np. SPORTDiscus, Med-
line). W pracach innego typu należy zachować logiczną
ciągłość tekstu, a tytuły poszczególnych jego części po-
winny odzwierciedlać omawiane w nich zagadnienia.
Wstęp. Należy wprowadzić czytelnika w tematykę arty-
kułu, opisać cel pracy oraz podać hipotezy oparte na prze-
glądzie literatury.
Materiał i metody. Należy dokładnie przedstawić mate-
riał badawczy (w przypadku osób biorących udział w eks-
perymencie podać ich liczebność, wiek, płeć oraz inne cha-
rakterystyczne cechy), omówić warunki, czas i metody
prowadzenia badań oraz opisać wykorzystaną do nich apa-
raturę (z podaniem nazwy wytwórni i jej adresu). Sposób
wykonywania pomiarów musi być przedstawiony na tyle
dokładnie, aby inne osoby mogły je powtórzyć. Jeżeli me-
toda jest zastosowana pierwszy raz, należy ją opisać szcze-
gólnie precyzyjnie, potwierdzając jej trafność i rzetelność
(powtarzalność). Modyfikując uznane już metody, trzeba
omówić, na czym polegają zmiany oraz uzasadnić koniecz-
ność ich wprowadzenia. Gdy w eksperymencie biorą udział
ludzie, konieczne jest uzyskanie zgody komisji etycznej na
wykorzystanie w nim zaproponowanych przez autora me-
tod (do maszynopisu należy dołączyć kopię odpowiedniego
dokumentu). Metody statystyczne powinny być tak opisa-
ne, aby można było bez problemu stwierdzić, czy są one
poprawne. Autor pracy przeglądowej powinien również po-
dać metody poszukiwania materiałów, metody selekcji itp.
Wyniki. Przedstawienie wyników powinno być logiczne
i spójne oraz powiązane z danymi zamieszczonymi w tabe-
lach i na rycinach.
Dyskusja (omówienie wyników). Autor powinien od-
nieść uzyskane wyniki do danych z literatury (innych niż
omówione we wstępie), podkreślając nowe i znaczące
aspekty swojej pracy.
Papers should be submitted in three printed copies or
sent via e-mail. An experimental paper, together with the
figures, tables and abstract, should not exceed 20 pages (30
pages for a review paper). A normal page is considered to
be an A4 sheet, of 30 lines and 60 characters per line, with
12-point Times New Roman font, one and half-spaced text,
with margins of 25 mm at the sides and at the top and bot-
tom. Type or print on only one side of the paper. Use one
and half spacing throughout, including the title page, abs-
tract, text, acknowledgments, references, tables, and le-
gends. Number pages consecutively, beginning with the ti-
tle page. Put the page number in the upper-right corner of
each page.
TITLE PAGE
The title page should contain: title of the article, name
and surnames of author(s) and their affiliations, name and
address of the author responsible for correspondence about
the manuscript with fax, phone, and e-mail address; and
a short running head of no more than 40 characters (count
letters and spaces).
BLIND TITLE PAGE. Because reviews are blind, include
a blind title page with only the title.
ABSTRACT
The second page should contain the abstract (ca. 250
words). The abstract should be divided into: Purpose, Basic
procedures, Main findings and Conclusions. It should em-
phasize any new and important aspects of the study.
Below the abstract, authors should provide (and identify
as such) 3 to 6 key words that will assist indexers to cross-
index the article. If suitable MeSH terms are not yet availa-
ble for recently introduced terms, present terms may be
used.
TEXT should contain the following sections: Introduc-
tion, Material and methods, Results, Discussion, Conclu-
sions, Acknowledgements (if necessary), References.
Introduction. State the purpose of the article and sum-
marize the rationale for the study. Give only strictly perti-
nent references and do not include data or conclusions from
the work being reported.
Material and methods. Clearly describe selection of the
experimental subjects. Identify their age, sex, and other
important characteristics. Identify the methods, apparatus
(give the manufacturer’s name and address in parentheses),
and procedures in sufficient detail to allow other workers to
reproduce the results. Give references to established me-
thods, including statistical methods (see below); provide
references and brief descriptions for methods that have
been published but are not well known; describe new or
substantially modified methods, give reasons for using
them, and evaluate their limitations. When reporting expe-
riments on human subjects, indicate whether the procedu-
res followed were in accordance with the ethical standards
of the responsible committee on human experimentation
(institutional or regional). The Editors reserve the right to

HUMAN MOVEMENT
106
Regulamin publikowania prac – Instructions for Authors
Wnioski. Przedstawiając wnioski, należy pamiętać
o celu pracy oraz postawionych hipotezach, a także unikać
stwierdzeń ogólnikowych i niepopartych wynikami wła-
snych badań. Stawiając nowe hipotezy, trzeba to wyraźnie
zaznaczyć.
Podziękowania. Można wymienić osoby lub instytucje,
które pomogły autorowi w przygotowaniu pracy bądź
wsparły go finansowo lub technicznie.
Piśmiennictwo. Piśmiennictwo należy uporządkować
według kolejności cytowania w tekście, w którym dla
oznaczenia odwołania do piśmiennictwa należy posługi-
wać się numerami ujętymi w nawiasy kwadratowe, np.
Bouchard et al. [23]. Piśmiennictwo (zawarte tylko w ba-
zach danych, np. SPORTDiscus, Medline) powinno się
składać z nie więcej niż 30 pozycji, z wyjątkiem prac prze-
glądowych. Niewskazane jest cytowanie prac nieopubliko-
wanych.
Przykłady zapisu piśmiennictwa
Powołanie na artykuł z czasopisma [nazwisko autora
(autorów), inicjał imienia, tytuł artykułu, tytuł czasopisma
w przyjętym skrócie, rok wydania, tom lub numer, strony]:
Shinohara M., Li S., Kang N., Zatsiorsky V.M., Latash
M.L., Effects of age and gender on finger coordination in
MVC and submaximal force-matching tasks. J Appl Phy-
siol, 2003, 94, 259–270.
Gdy autorami artykułu jest sześć lub mniej osób, należy
wymienić wszystkie nazwiska, jeżeli jest ich siedem i wię-
cej, należy podać sześć pierwszych, a następnie zastosować
skrót „et al.”
Tytuł artykułu w języku innym niż angielski autor po-
winien przetłumaczyć na język angielski, a w nawiasie
kwadratowym podać język oryginału. Tytuł czasopisma
należy zostawić w oryginale. W pracy powinny być
uwzględnianie tylko artykuły publikowane ze streszcze-
niem angielskim: Jaskólska A., Bogucka M., Świstak R.,
Jaskólski A., Mechanisms, symptoms and after-effects of
delayed muscle soreness (DOMS) [in Polish]. Med Sporti-
va, 2002, 4, 189–201.
Powołanie na książkę [nazwisko autora(ów) lub redak-
tora(ów), inicjał imienia, tytuł pracy przetłumaczony na
język angielski, wydawca, miejsce i rok wydania]: Osiń-
ski W., Anthropomotoric [in Polish]. AWF, Poznań 2001.
Powołanie na rozdział w książce [nazwisko autora(ów),
inicjał imienia, tytuł rozdziału, nazwisko autora(ów) lub
redaktora(ów), tytuł pracy, wydawca, miejsce i rok wyda-
nia, strony]: McKirnan M.D., Froelicher V.F., General prin-
ciples of exercise testing. In: Skinner J.S. (ed.), Exercise te-
sting and exercise prescription for special cases. 2nd Ed.
Lea & Febiger, Philadelphia 1993, 3–28.
Powołanie na materiały zjazdowe tylko umieszczane
w międzynarodowych bazach danych, np. SPORTDiscus:
Racz L., Tihanyi J., Hortobagyi T., Muscle fatigue during
concentric and eccentric contraction. In: Avela J., Komi
P.V., Komulainen J. (eds.), Proceedings of the 5th Annual
reject papers if there is doubt whether suitable procedures
were used. Describe statistical methods with enough detail
to enable a knowledgeable reader with access to the origi-
nal data to verify the reported results. When possible,
quantify findings and present them with appropriate indi-
cators of measurement error or uncertainty (such as confi-
dence intervals). Authors submitting a review manuscript
should include a section describing the methods used for
locating, selecting, extracting, and synthesizing data. These
methods should also be summarized in the abstract.
Results. Present results in a logical sequence in the text,
tables, and figures. Do not repeat in the text all the data
presented in the tables or illustrations; emphasize or sum-
marize only important observations.
Discussion. Emphasize the new and important aspects of
the study and the conclusions that follow from them. Do not
repeat in detail data or other material given in the Introduc-
tion or the Results section. Include implications of the fin-
dings and their limitations, including implications for future
research. Relate observations to other relevant studies.
Conclusions. Link the conclusions with the goals of the
study but avoid unqualified statements and conclusions not
completely supported by the data. Avoid claiming priority
and alluding to work that has not been completed. State
new hypotheses when warranted, but clearly label them as
such.
Acknowledgments. List all contributors who do not
meet the criteria for authorship (e.g., a person who provided
purely technical help or writing assistance). Financial and
material support should also be acknowledged.
References. References (only the ones included in inter-
national data bases, e.g. SPORTDiscus, Medline etc.) sho-
uld be submitted on a separate sheet of paper and in the or-
der of appearance in the text. References should be numbe-
red consecutively in the order in which they are first
mentioned in the text. Identify references in text, tables,
and legends by Arabic numerals in parentheses, e.g. Bo-
uchard et al. [23]. Except in the case of review articles, the
total number of references should not exceed 30.
A journal article should include: surname of the au-
thor(s); first name (only initials); title of the paper; title of
the journal in the accepted abbreviation; year, volume (num-
ber), and pages. List all authors when six or less; when seven
or more, list first six and add et al. Example: Shinohara M.,
Li S., Kang N., Zatsiorsky V.M., Latash M.L., Effects of age
and gender on finger coordination in MVC and submaximal
force-matching tasks. J Appl Physiol, 2003, 94, 259–270.
Articles not in English: Authors should translate the ti-
tle into English and enclose the language of translation in
square brackets. Do not translate the title of the journal.
Only papers with English abstracts should be cited. Exam-
ple: Jaskólska A., Bogucka M., Świstak R., Jaskólski A.,
Mechanisms, symptoms and after-effects of delayed musc-
le soreness (DOMS) [in Polish]. Med Sportiva, 2002, 4,
189–201.

HUMAN MOVEMENT
107
Regulamin publikowania prac – Instructions for Authors
Congress of the European College of Sport Science. July
19–23, 2000, Jyvaskyla Finland, 600.
Powołanie na artykuły w formie elektronicznej:
Donsmark M., Langfort J., Ploug T., Holm C., Enevold-
sen L.H., Stallknech B. et al., Hormone-sensitive lipase
(HSL) expression and regulation by epinephrine and
exercise in skeletal muscle. Eur J Sport Sci, Volume 2,
Issue 6 (December 2002). Available from: URL: http://
www.humankinetics.com/ejss/bissues.cfm/
Przypisy. Przypisy, objaśniające lub uzupełniające
tekst, powinny być numerowane z zachowaniem ciągłości
w całej pracy i umieszczone na końcu tekstu głównego.
Tabele i ryciny. Tabele i ryciny wraz z numeracją, pod-
pisami oraz opisami należy umieścić na osobnych stronach,
na których odwrocie trzeba podać tylko tytuł pracy, bez
nazwiska autora. Jeżeli w tekście nie ma powołania na ta-
belę lub rycinę, należy zaznaczyć miejsce jej umieszczenia.
Ryciny muszą być czarno-białe lub w odcieniach szarości.
Symbole, np. strzałki, gwiazdki, lub skróty należy dokład-
nie objaśnić w legendzie. Wykresy powinny być wykonane
w programach Excel lub Statistica 5.0 i dołączone jako
osobne pliki w formacie *.xls lub *.stg. Pozostałe ryciny
(np. schematy) należy przygotować w programie Corel
Draw (wersja 8 lub niższa) i dołączyć jako osobne pliki
w formacie *.cdr. Fotografie lub inne materiały ilustracyjne
można dostarczyć w formie elektronicznej (*.tif, *.jpg – gę-
stość punktów obrazu 300 lub 600 dpi) bądź w postaci na-
dającej się do ostatecznego opracowania przez Redakcję.
Nie można powtarzać tych samych wyników w tabe-
lach i na rycinach.
Praca, w której tabele i ryciny będą przygotowane nie-
zgodnie z podanymi wymogami, zostanie odesłana do au-
tora.
Korekta autorska
Artykuł po opracowaniu redakcyjnym zostanie przeka-
zany do autora w celu naniesienia przez niego korekty au-
torskiej. Obowiązkiem autora jest odesłanie korekty w cią-
gu jednego tygodnia. Kosztami poprawek innych niż dru-
karskie będzie obciążony autor.
Poczta elektroniczna
Zachęcamy autorów do przesyłania prac w postaci elek-
tronicznej (jako załączniki). Każda część pracy powinna
być przesłana jako oddzielny załącznik: plik tekstowy, plik
z rycinami, plik z tabelami, plik fotograficzny itd. Aby
przyspieszyć przesyłkę, pliki należy skompresować w po-
staci *.arj lub *.zip. Komplet plików powinien być przesła-
ny na adres [email protected]
Prawa Redakcji
Redakcja zastrzega sobie prawo poprawiania usterek
stylistycznych oraz dokonywania skrótów. Prace przygoto-
wane niezgodnie z regulaminem będą odsyłane autorom do
poprawy.
A book should include: the author’s or editor’s surname
(authors’ or editors’ surnames), first name initials, the title
of the book in English, publisher’s name, place and year of
publication. Example: Osiński W., Anthropomotoric [in
Polish]. AWF, Poznań 2001.
Chapter in a book: McKirnan M.D., Froelicher V.F.,
General principles of exercise testing. In: Skinner J.S. (ed.),
Exercise testing and exercise prescription for special cases,
2nd Ed. Lea & Febiger, Philadelphia 1993, 3–28.
Conference proceedings and papers can only be refer-
red to in the text if they are included in international data
bases, e.g. SPORTDiscus. Example: Racz L., Tihanyi J.,
Hortobagyi T., Muscle fatigue during concentric and ec-
centric contraction. In: Avela J., Komi P.V., Komulainen J.
(eds.), Proceedings of the 5th Annual Congress of the Euro-
pean College of Sport Science. July 19–23 2000, Jyvaskyla
Finland, 600.
Article in electronic form. Example: Donsmark M.,
Langfort J., Ploug T., Holm C., Enevoldsen L.H., Stallknech
B. et al., Hormone-sensitive lipase (HSL) expression and
regulation by epinephrine and exercise in skeletal muscle.
Eur J Sport Sci, Volume 2, Issue 6 (December 2002). Ava-
ilable from: URL: http://www.humankinetics.com/ejss/
bissues.cfm/
Tables and figures. Each table together with its number,
title, and annotations, should be submitted on a separate
sheet of paper. Authors should identify the places where ta-
bles and figures are to be included within the text. Figures
should be prepared in black and white and marked on the
back with the title of paper only (do not include the name of
the author). Legends for the figures should be submitted on
a separate sheet of paper and should be self-explanatory.
When symbols, arrows, numbers, or letters are used to
identify parts of the illustrations, identify and explain each
one clearly in the legend. Only Figures prepared in Excel,
Statistica 5.0 or Corel Chart (version 8 or lower) will be ac-
cepted. The recommended file formats for figures are:
*.jpg, *.tif, with an image resolution of 300 or 600 dpi.
Figures and tables should be numbered consecutively ac-
cording to the order in which they have been first cited in the
text. Data should not be repeated in tables and figures.
Photographs must be black and white glossy prints.
Proofs
The corresponding author will receive one proof. Only
minor corrections can be made at this time. Corrections
other than printing errors may be charged to the author. It is
the author’s responsibility to return the corrected proofs
within 1 week.
Sending via e-mail
Authors who have an access to Internet are encouraged
to send their work-files electronically using standard
e-mail software. The e-mail software must have an option
to send data files attached to the e-mail message. In such

HUMAN MOVEMENT
108
Regulamin publikowania prac – Instructions for Authors
Prawa autorskie
Publikacje podlegają prawu autorskiemu wynikającemu
z Konwencji Berneńskiej i z Międzynarodowej Konwencji
Praw Autorskich, poza wyjątkami dopuszczanymi przez
prawo krajowe. Żadna część publikacji nie może być repro-
dukowana, archiwizowana ani przekazywana w jakiejkol-
wiek formie ani żadnymi środkami bez pozwolenia właści-
ciela praw autorskich.
Płatna reklama
Redakcja przyjmuje zamówienia na reklamy, które
mogą być umieszczane na 2. i 3. stronie okładki lub na do-
datkowych kartach sąsiadujących z okładką. Ceny reklam
będą negocjowane indywidualnie.
cases, all parts of the work should be sent as a separate
files: text file, picture file(s), table file(s), photo
file(s). To speed up the data transfer, files should be com-
pressed (if possible) using *.arj or *.zip formats before
transmission. Complete packages of manuscripts are to be
sent to the following address: [email protected]
Reprints
Each Author will receive 1 copy of the issue in which
his/her work appears.
Advertising
The Editorial Board accepts advertising orders. Adver-
tisements can be published on the second and third page of
the cover or on the pages next to the cover. Advertisement
prices will be negotiated individually.
ZASADY PRENUMERATY CZASOPISMA HUMAN MOVEMENT
THE RULES OF SUBSCRIBING THE HUMAN MOVEMENT JOURNAL
Cena rocznej prenumeraty (dwa numery) dla odbiorców indy-
widualnych w kraju wynosi 27 zł, dla instytucji 55 zł.
Zamówienie wraz z potwierdzeniem dokonania wpłaty należy
przesłać na adres mailowy: [email protected] lub
Redakcja czasopisma Human Movement
Akademia Wychowania Fizycznego
ul. Mickiewicza 98
51-684 Wrocław
Numery czasopisma wysyłamy pocztą po otrzymaniu odpo-
wiedniej wpłaty na konto:
BPH PBK S.A. O/Wrocław
42 1060 0076 0000 3210 0014 7743
Akademia Wychowania Fizycznego
al. Paderewskiego 35, 51-612 Wrocław,
z dopiskiem: Prenumerata Human Movement.
Prosimy zamawiających o bardzo wyraźne podawanie adresów,
pod które należy wysyłać zamawiane egzemplarze czasopisma.
Pojedyncze egzemplarze można zamówić w ten sam sposób,
wpłacając 16 zł (odbiorca indywidualny) i 30 zł (instytucja) na
podane konto.
The price of annual subscription (two issues) for individual sub-
scribers is PLN 27 and PLN 55 for institutions.
All subscriptions are payable in advance. Subscribers are requ-
ested to send payment with their order whenever possible.
The orders should be sent to the Editorial Office:
e-mail: [email protected] or
Human Movement Editorial Office
University School of Physical Education
ul. Mickiewicza 98
51-684 Wrocław, Poland
The issues of the journal are sent by post after receiving the ap-
propriate transfer to the account:
BPH PBK S.A. O/Wrocław
42 1060 0076 0000 3210 0014 7743
Akademia Wychowania Fizycznego
al. Paderewskiego 35, 51-612 Wrocław, Poland,
with the note: Human Movement subscription.
We ask the subscribers to give correct and clearly written ad-
dresses to which the journal is to be sent.
Single copies can be ordered in the same way, by transferring
PLN 16 (individual subscribers) and PLN 30 (institutions) to the
above mentioned account.