effects of ph on asexual reproduction and statolith formation of the scyphozoan, aurelia labiata
TRANSCRIPT
Seediscussions,stats,andauthorprofilesforthispublicationat:https://www.researchgate.net/publication/225108193
EffectsofpHonasexualreproductionandstatolithformationofthescyphozoan,Aurelialabiata
ArticleinHydrobiologia·May2010
DOI:10.1007/s10750-010-0224-9
CITATIONS
23
READS
342
2authors:
AmandaK.Winans
WesternWashingtonUniversity
3PUBLICATIONS35CITATIONS
SEEPROFILE
JenniferE.Purcell
WesternWashingtonUniversity
153PUBLICATIONS6,814CITATIONS
SEEPROFILE
AllcontentfollowingthispagewasuploadedbyJenniferE.Purcellon30November2016.
Theuserhasrequestedenhancementofthedownloadedfile.Allin-textreferencesunderlinedinbluearelinkedtopublicationsonResearchGate,lettingyouaccessandreadthemimmediately.
JELLYFISH BLOOMS
Effects of pH on asexual reproduction and statolithformation of the scyphozoan, Aurelia labiata
Amanda K. Winans • Jennifer E. Purcell
Published online: 21 March 2010
� Springer Science+Business Media B.V. 2010
Abstract Although anthropogenic influences such
as global warming, overfishing, and eutrophication
may contribute to jellyfish blooms, little is known
about the effects of ocean acidification on jellyfish.
Most medusae form statoliths of calcium sulfate
hemihydrate that are components of their balance
organs (statocysts). This study was designed to test the
effects of pH (7.9, within the average current range,
7.5, expected by 2100, and 7.2, expected by 2300)
combined with two temperatures (9 and 15�C) on
asexual reproduction and statolith formation of the
moon jellyfish, Aurelia labiata. Polyp survival was
100% after 122 d in seawater in all six temperature
and pH combinations. Because few polyps at 9�C
strobilated, and temperature effects on budding were
consistent with published results, we did not analyze
data from those three treatments further. At 15�C,
there were no significant effects of pH on the numbers
of ephyrae or buds produced per polyp or on the
numbers of statoliths per statocyst; however, statolith
size was significantly smaller in ephyrae released from
polyps reared at low pH. Our results indicate that
A. labiata polyps are quite tolerant of low pH,
surviving and reproducing asexually even at the lowest
tested pH; however, the effects of small statoliths on
ephyra fitness are unknown. Future research on the
behavior of ephyrae with small statoliths would further
our understanding of how ocean acidification may
affect jellyfish survival in nature.
Keywords Jellyfish � Ocean acidification �Statolith � pH � Reproduction
Introduction
Research on jellyfish and their possible responses to
human influences, such as global climate change, has
increased in recent years because of negative effects
of jellyfish on human enterprises. Jellyfish can bloom
in very high densities and seriously affect their prey
populations, which include zooplankton, larval fish,
and fish eggs (Purcell, 1997). As well as being
jellyfish prey, the diets of zooplanktivorous fish,
including anchovies, herring, pollock, sandlance, and
sardines, overlap with jellyfish diets and competition
Guest editors: J. E. Purcell & Dror Angel / Jellyfish Blooms:
New Problems and Solutions
A. K. Winans
Biology Department, Western Washington University,
516 High Street, Bellingham, WA 98225, USA
A. K. Winans (&) � J. E. Purcell
Shannon Point Marine Center, Western Washington
University, 1900 Shannon Point Rd, Anacortes, WA
98221, USA
e-mail: [email protected]
J. E. Purcell
Coastal and Marine Resources Centre, University College
Cork, Naval Base, Haulbowline Island, Cobh, Co. Cork,
Ireland
123
Hydrobiologia (2010) 645:39–52
DOI 10.1007/s10750-010-0224-9
for food may occur (Purcell & Grover, 1990; Purcell
& Sturdevant, 2001; Brodeur et al., 2008b). Many
anthropogenic influences may be contributing to
recent jellyfish blooms, including global warming,
reduction of fish stocks, and eutrophication (reviewed
in Purcell et al., 2007). Because jellyfish play key
ecological and economic roles, it is important to
determine how such changes may affect them.
One of the greatest anthropogenic causes of global
climate change is the burning of fossil fuels. Since
before the industrial revolution (about 250 years
ago), the concentration of CO2 in the earth’s atmo-
sphere has increased by about 36% (Forster et al.,
2007). About 30% of this CO2 has been taken up by
the ocean (Feely et al., 2004). When CO2 dissolves in
seawater it forms carbonic acid, which then can
dissociate into bicarbonate (HCO3-), carbonate
(CO32-), and hydrogen (H?) ions; increased hydro-
gen ions lower the pH. The current average sea
surface pH is about 7.9–8.3 (Bindoff et al., 2007), a
decrease of about 0.1 pH units since before the
industrial revolution (Royal Society, 2005). Because
pH is on a logarithmic scale, a difference of one pH
unit is a tenfold change. Thus, the predicted decrease
in ocean pH of 0.3–0.4 units by the end of this
century would be a 150% increase in the concentra-
tion of H? ions (Orr et al., 2005).
As CO2 is taken up into the ocean, carbonate
chemistry and pH changes will affect marine life in
several ways (Doney et al., 2009): (1) reduced
calcification rates of shell-forming organisms in
response to supersaturation of CO2; (2) undersatura-
tion of aragonite, a more soluble form of CaCO3 in
the oceans than the more abundant calcite, which also
is important for some calcifying organisms; and
(3) biological effects of decreased pH other than on
calcification. With the first threat, as more CO2 is
taken up in seawater, more carbonate ions are
converted to bicarbonate and hydrogen ions, lowering
the saturation state of calcium carbonate (Kleypas
et al., 1999), which leaves less carbonate available for
shell and skeleton formation (Doney et al., 2009).
Calcification rates decreased in various marine
organisms grown in seawater with elevated CO2,
including mussels (Michaelidis et al., 2005), gastro-
pods and sea urchins (Shirayama & Thornton, 2005),
corals (Gattuso et al., 1998; Kleypas et al., 1999;
Langdon et al., 2000), and coccolithophores (Riebe-
sell et al., 2000). With the second threat, in lowered
pH, calcification decreased in certain species of
corals (Gattuso et al., 1998) and pteropods, whose
shells dissolved (Fabry et al., 2008). In the third
threat, in addition to reduced calcification, decreased
pH can cause acidosis (lowered pH in tissues and
body fluids) as well as decreased metabolic, growth,
and reproduction rates (Portner et al., 2005).
Decreased metabolic and growth rates occurred in
mussels exposed to low pH (Michaelidis et al., 2005),
and warmer temperatures may exacerbate those
effects (Portner et al., 2005; Metzger et al., 2007).
Because of the obvious issues related to changing
carbonate chemistry, most ocean acidification research
focuses on calcifying organisms. How ocean acidifi-
cation may affect pelagic cnidarians, such as jellyfish,
is poorly studied, and the results of existing studies are
inconsistent. Attrill et al. (2007) showed a negative
correlation of jellyfish frequency and pH (averaging
from 8.0 to 8.35) in the North Sea, and suggested
increasing jellyfish with ocean acidification. However,
Richardson & Gibbons (2008) looked at a larger area
and found no significant correlation of jellyfish
frequency and pH from in the North Sea and North
Atlantic. Activity and feeding of the jellyfish, Rhopil-
ema esculenta Kishinouye, decreased below pH 7.4 in
the laboratory (Gu et al., 2005).
Scyphozoans have two main stages in their life
cycles, the benthic polyps and pelagic jellyfish.
Scyphozoan polyps reproduce asexually by budding
polyps and through the process of strobilation, in
which ephyrae (juvenile jellyfish) are produced by
transverse fission. Asexual production rates of many
scyphozoan jellyfish are affected by water chemistry
variables, such as temperature, salinity (Purcell et al.,
1999; Purcell, 2007), and dissolved oxygen (DO)
(Condon et al., 2001). Polyps of temperate scyph-
ozoans, including Aurelia labiata Chamisso &
Eysenhardt, produce more ephyrae but fewer buds
in warm temperatures (Purcell et al., 1999; Purcell,
2007).
Like many other marine invertebrates, jellyfish
have statocysts, balance organs that enable them to
sense gravity. Scyphozoan jellyfish have statocysts
inside their rhopalia, the club-like structures around
the bell margin (Arai, 1997). Inside these statocysts
are numerous statoliths of trigonal crystals of calcium
sulfate hemihydrate (CaSO4�0.5H2O) that are formed
during strobilation (Spangenberg & Beck, 1968;
Spangenberg, 1976; Becker et al., 2005).
40 Hydrobiologia (2010) 645:39–52
123
The number and size of statoliths formed are
influenced by the presence or absence of certain
nutrients, minerals, and hormones. Spangenberg
(1984) found that polyps grown in the presence of
thyroxine, a hormone produced during strobilation in
Aurelia aurita Linnaeus, had significantly fewer stat-
oliths than polyps grown without thyroxine addition.
Statoliths also were fewer and smaller in ephyrae from
polyps grown in high concentrations of tetracycline
HCl; ‘‘minor’’ pH changes (not reported) also occurred
with the addition of tetracycline (Spangenberg & Beck,
1972). Starved polyps produced ephyrae with fewer
statoliths than did fed polyps (Spangenberg, 1984).
Statolith formation was almost completely inhibited
in sulfate-deficient water, and ephyrae with no stato-
liths were irregular and weak swimmers (Spangenberg,
1968). Calcium sulfate behaves similarly to calcium
carbonate, and can dissolve in the presence of hydrogen
ions.
In our study, we raised polyps of Aurelia labiata,
the local species of the cosmopolitan genus Aurelia, in
combinations of different pH levels (7.2, 7.5, and 7.9)
and temperatures (9 and 15�C) to determine the effects
on asexual production of buds and ephyrae and on
statolith formation (number and size). Because few
polyps strobilated at 9�C, we were only able to test the
null hypothesis that temperature and pH do not affect
the numbers of buds produced. For 15�C, we tested the
null hypotheses that pH does not affect the numbers of
buds or ephyrae produced by the polyps, the time until
strobilation, the number of strobilations, or the sizes
and numbers of statoliths in the ephyrae.
Methods
Experimental protocols
Aurelia labiata polyps produced by medusae col-
lected from Dyes Inlet, Washington were placed in
1.5-l glass finger bowls with filtered seawater (5 lm)
pumped from Puget Sound into the Shannon Point
Marine Center (SPMC) in Anacortes, Washington,
USA on December 28, 2007. The polyps were kept in
an incubator at 9�C in the dark without food for
78 days to inhibit them from strobilating until
stimulated at the beginning of the experiment;
feeding after a period of fasting, temperature increase
after cooling, and light after darkness can trigger
strobilation (Arai, 1997; Purcell et al., 1999; Lucas,
2001; Purcell, 2007).
Each of 108 arbitrarily selected polyps was placed
in an individual 125-ml glass jar and allowed a few
days for re-attachment. Eighteen polyps were arbi-
trarily assigned to each of the six combinations of
two temperatures (9 and 15�C) and three pH levels
(7.2, 7.5, and 7.9). The lower temperature is near
average for waters of Puget Sound in autumn and
early spring, and the high temperature occurs in
summer. The pH of 8.1 was chosen to represent the
current ocean pH mean of 7.9–8.3 (Bindoff et al.,
2007). Average pH levels at SPMC range from 7.7 to
8.2. Ocean pH levels are predicted be 0.3–0.4 units
lower by the end of the century (Orr et al., 2005) and
7.3 within the next 300 years (Caldeira & Wickett,
2003); therefore, 7.7 and 7.3 were chosen as inter-
mediate and extreme pH levels. Because of changes
in pH levels during the experiment, the actual pH
levels in the treatments averaged 7.2, 7.5, and 7.9.
Every 2–4 days, renewed seawater solutions were
prepared to replace the water in each of the six
treatments, the polyp observations and maintenance
were performed, and the water from some of the jars
re-tested. To prepare the treatments, 5-lm-filtered
seawater from SPMC was stored in six 8-l covered
plastic containers in each incubator at the experimental
temperatures. One container for each of the six
treatments was placed on a magnetic stirrer and the
pH tested with an Accumet� Basic AB15 pH meter
using the NBS scale. The pH was adjusted to the
desired level with drops of 1 M HCl or 1 M NaOH;
HCl and NaOH have been used to manipulate seawater
pH (e.g., Riebesell et al., 2000; Jokiel et al., 2008;
Kuffner et al., 2008). Gattuso & Lavigne (2009)
describes this as one of the five techniques that is ‘‘most
useful in the context of ocean acidification,’’ with the
drawback that the use of acids and bases to alter pH also
changes the alkalinity; low pH levels have low
alkalinities (Riebesell et al., 2000; Rost et al., 2008).
After the target pH level was obtained, the water was
tested for DO with a YSI� 550A meter, salinity with a
YSI� 30 meter, and alkalinity with the titration method
of Palmer (1992). The pH and DO meters were
calibrated at the beginning of each analysis day, using
4.0, 7.0, and 10.0 buffers to calibrate the pH meter.
Although this method of using one container to mix
each treatment may risk causing a container effect, it
was important to ensure that all individuals within each
Hydrobiologia (2010) 645:39–52 41
123
treatment received identical water. The containers
were arbitrarily switched so that any one would not
always be used for the same treatment.
The jars with polyps initially were kept in four
temperature-controlled incubators, two at each tem-
perature. Polyps were arbitrarily assigned to an
incubator, with equal numbers from each pH treatment
in each incubator. On day 72 of the experiment, the
number of incubators available decreased to 1 at each
temperature. One temperature logger iButton� was
kept in a jar of seawater beside the polyps in each
incubator until day 72, then two loggers were kept in
each incubator. Temperature in the jars also was
measured along with water chemistry. Average tem-
peratures (and standard error) in each incubator were
9.1 (0.007), 9.4 (0.01), 15.4 (0.004), and 15.3 (0.003).
Fluorescent lights were placed equidistant from the
trays in each incubator and were on for 12 h d-1.
Light levels at the trays ranged from 103 to 111 lux.
Polyp maintenance and asexual reproduction
The experiment began on March 4, 2008 and contin-
ued for 122 d until July 4, 2008. Every 2–4 days, the
chemistry of the incubation water in the jars was
measured, polyp data were collected, and the incuba-
tion water was replaced with the newly prepared
treatment water. First, DO, pH, salinity, and temper-
ature were measured in three arbitrarily chosen jars
from each treatment; one of those jars also was tested
for alkalinity. One jar was removed from the incubator
at a time to minimize temperature changes.
Ephyrae were counted and removed from each of
the 108 jars and then preserved in 100% EtOH in
microcentrifuge tubes specifically labeled by polyp
and date. Then, about three-quarters of the water was
poured out and 1–3 day old Artemia sp. nauplii were
added to the remaining water for at least an hour at
amounts sufficient to saturate polyp feeding and to
provide equal food to all polyps. Each polyp then was
checked for survival, strobilation, and new buds with
the aid of a dissecting microscope. Buds were
enumerated and removed from the jar when they
had separated from the parent polyp. The bottom of
each jar was cleaned with foam swabs about once
weekly, starting about 3 weeks into the experiment.
Finally, each jar was emptied of water, rinsed with
5-lm-filtered seawater, and refilled with the appro-
priate newly prepared treatment seawater. The lid
with parafilm was carefully replaced to prevent air
bubbles, and then the jar was returned to its
incubator. On the last day of the experiment, all
buds attached to the parent polyps and ephyrae that
were ready to detach were counted.
Statolith analyses
Ephyrae collected from the second strobilation (days
101–120 of the experiment) were chosen for statolith
analysis because the polyps had been in the pH
treatments much longer than for the first strobilation.
Only polyps from 15�C were used because few polyps
strobilated at 9�C. Uncurled ephyrae that could be
flattened easily on a microscope slide were chosen to
ensure accurate measurement of their diameter and
counts and measurements of the statoliths. Each
ephyra was pipetted onto a slide, and then a drop of
water-free glycerol added and mixed with the alcohol
to decrease the viscosity of the glycerol. After gently
applying the coverslip and absorbing excess glycerol–
alcohol from the edge of the coverslip, the diameter of
the ephyra was measured with a compound micro-
scope ocular micrometer at 409 magnification. Then
the ephyra was flattened further by gentle pressure on
the coverslip to maximize accuracy of the statolith
counts and size measurements. The number of stato-
liths in each rhopalium (8–12 rhopalia per ephyra) was
counted. For each ephyra, the length (long axis) and
width (short axis) of all statoliths in three rhopalia
were measured on a computer screen using Image Pro
Plus software at 4009 magnification. To test for
differences in numbers and sizes of statoliths among
ephyrae collected from the same polyp, six preserved
ephyrae from one polyp on one collection day were
chosen from each of the three pH treatments at 15�C.
To test for effects of different pH levels on statolith
numbers and sizes among ephyrae, one ephyra from
each of six polyps at each pH level at 15�C were
chosen and analyzed as above.
Statoliths from one ephyra at pH 7.2 and 15�C
were also examined with an scanning electron
microscope (SEM). The ephyra was preserved in
100% ethanol and then dissected with needles to
isolate the statoliths on a 12-mm-diameter aluminum
pin with double-sided carbon tabs. The sample was
coated for a minute with a Quorum (Polaron) SC7640
sputter-coater equipped with a gold/palladium target.
The SEM used was a Vega 5136MM (Tescan).
42 Hydrobiologia (2010) 645:39–52
123
Statistical analyses
The water chemistry data for three jars in each
combination were averaged for each day. Two-way
ANOVAs (analysis of variance) tested for differences
in pH, alkalinity, DO, pCO2, and salinity for
‘‘renewed water’’ (the newly prepared water) and
for ‘‘incubation water’’ (water from the jars with
polyps) (Table 1). pCO2 was calculated with CO2Sys.
In order to meet assumptions of the tests, all ‘‘pH’’
and ‘‘renewed DO’’ data were transformed to their
base-10 logarithms. The pCO2 tests did not meet the
assumption of homogenous variance, and so a was
halved to 0.025 in order to make the test more
conservative (Keppel & Wickens, 2004; Gamst et al.,
2008). Scheffe post-hoc tests were used to test the
differences among the three pH treatments.
ANOVAs were used to test for differences in
asexual reproduction among all treatments. Because
few polyps strobilated at 9�C, those polyps and
temperature effects were tested only for the numbers
of buds. For this test, a two-way ANOVA was used to
test for differences among pH and temperature
treatments. The ‘‘number of buds’’ was transformed
to its base-10 logarithm in order to meet the
assumption of homogeneous variance. pH treatments
at 15�C were tested for differences by one-way
ANOVAs for the total number of ephyrae produced
by each polyp over 122 d, the numbers of ephyrae
produced in the first and second strobilations, the
numbers of strobilations per polyp, and the days until
the first and second strobilations. The equation: no. of
ephyrae/(no. ephyrae ? no. buds) 9 100 was used
to calculate the percentages that ephyrae contributed
to total asexual production of each polyp. These
proportions were arcsine transformed and then tested
for differences among pHs at 15�C with a one-way
ANOVA. They did not meet the assumption for
homogeneity of variance, so a was changed to 0.025.
The numbers of statoliths per rhopalium were
compared among and within pH treatments in the
15�C treatments using a one-way ANOVA. To test
differences in statolith size, statolith volumes were
estimated by calculating the volume of a regular
hexagonal prism from measurements of the length and
width of each statolith. Then, volumes were compared
among and within pH treatments with a nested one-
way ANOVA. For all statolith volume analyses,
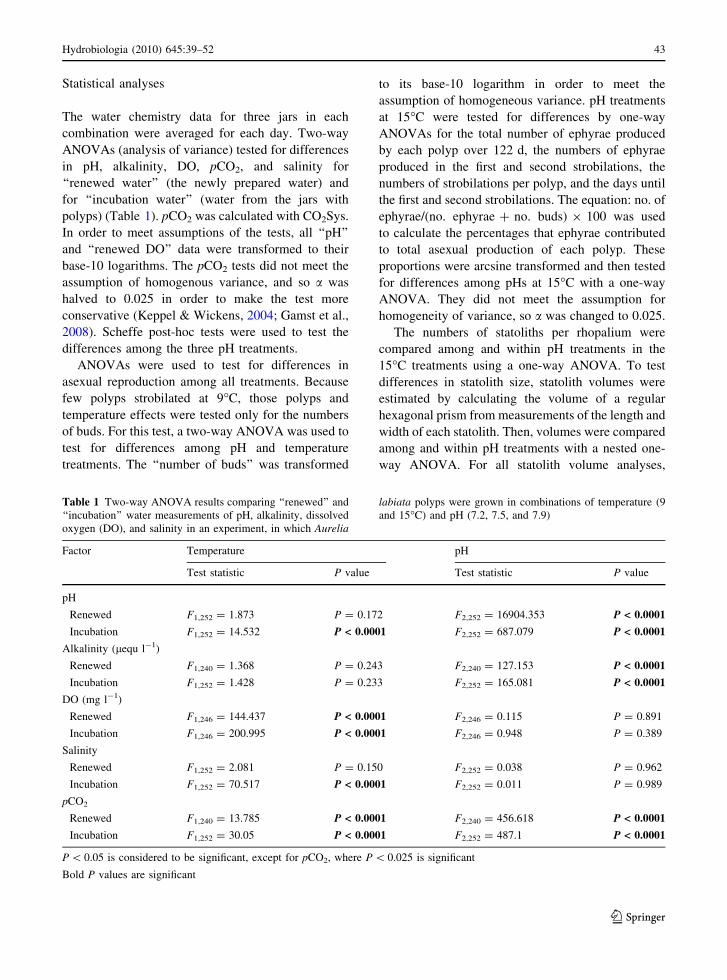
Table 1 Two-way ANOVA results comparing ‘‘renewed’’ and
‘‘incubation’’ water measurements of pH, alkalinity, dissolved
oxygen (DO), and salinity in an experiment, in which Aurelia
labiata polyps were grown in combinations of temperature (9
and 15�C) and pH (7.2, 7.5, and 7.9)
Factor Temperature pH
Test statistic P value Test statistic P value
pH
Renewed F1,252 = 1.873 P = 0.172 F2,252 = 16904.353 P < 0.0001
Incubation F1,252 = 14.532 P < 0.0001 F2,252 = 687.079 P < 0.0001
Alkalinity (lequ l-1)
Renewed F1,240 = 1.368 P = 0.243 F2,240 = 127.153 P < 0.0001
Incubation F1,252 = 1.428 P = 0.233 F2,252 = 165.081 P < 0.0001
DO (mg l-1)
Renewed F1,246 = 144.437 P < 0.0001 F2,246 = 0.115 P = 0.891
Incubation F1,246 = 200.995 P < 0.0001 F2,246 = 0.948 P = 0.389
Salinity
Renewed F1,252 = 2.081 P = 0.150 F2,252 = 0.038 P = 0.962
Incubation F1,252 = 70.517 P < 0.0001 F2,252 = 0.011 P = 0.989
pCO2
Renewed F1,240 = 13.785 P < 0.0001 F2,240 = 456.618 P < 0.0001
Incubation F1,252 = 30.05 P < 0.0001 F2,252 = 487.1 P < 0.0001
P \ 0.05 is considered to be significant, except for pCO2, where P \ 0.025 is significant
Bold P values are significant
Hydrobiologia (2010) 645:39–52 43
123
individual ephyrae were nested in pH treatment and
individual rhopalia were nested in individual ephyra
and pH treatment. In this ANOVA, the assumption of
homogeneity of dispersion matrices was not met
according to Levene’s test, so the base-10 logarithms
of the data were used. Because of the nested design of
this test, we also were able to test differences in
statolith volume among individual ephyrae. A one-
way ANOVA was used to test for differences in ephyra
age and diameters among pHs. This enabled us to
determine if other factors, i.e., size or age, could have
affected the variation because statoliths grow in size
and number with age (Holst et al., 2007). All statistical
tests were performed using SPSS 17.0.
Results
Water chemistry
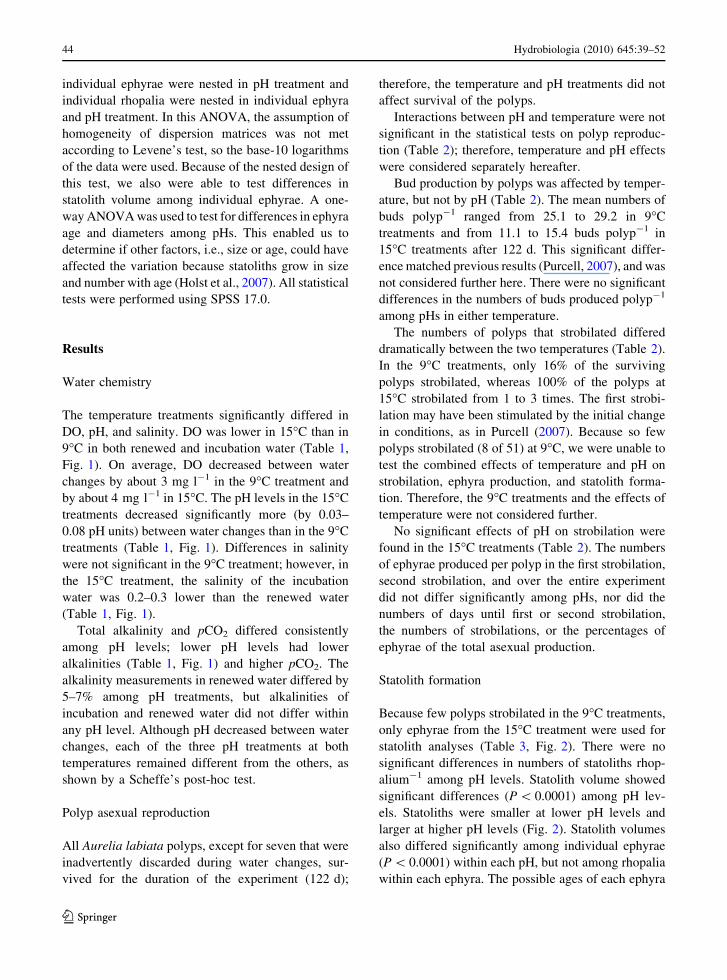
The temperature treatments significantly differed in
DO, pH, and salinity. DO was lower in 15�C than in
9�C in both renewed and incubation water (Table 1,
Fig. 1). On average, DO decreased between water
changes by about 3 mg l-1 in the 9�C treatment and
by about 4 mg l-1 in 15�C. The pH levels in the 15�C
treatments decreased significantly more (by 0.03–
0.08 pH units) between water changes than in the 9�C
treatments (Table 1, Fig. 1). Differences in salinity
were not significant in the 9�C treatment; however, in
the 15�C treatment, the salinity of the incubation
water was 0.2–0.3 lower than the renewed water
(Table 1, Fig. 1).
Total alkalinity and pCO2 differed consistently
among pH levels; lower pH levels had lower
alkalinities (Table 1, Fig. 1) and higher pCO2. The
alkalinity measurements in renewed water differed by
5–7% among pH treatments, but alkalinities of
incubation and renewed water did not differ within
any pH level. Although pH decreased between water
changes, each of the three pH treatments at both
temperatures remained different from the others, as
shown by a Scheffe’s post-hoc test.
Polyp asexual reproduction
All Aurelia labiata polyps, except for seven that were
inadvertently discarded during water changes, sur-
vived for the duration of the experiment (122 d);
therefore, the temperature and pH treatments did not
affect survival of the polyps.
Interactions between pH and temperature were not
significant in the statistical tests on polyp reproduc-
tion (Table 2); therefore, temperature and pH effects
were considered separately hereafter.
Bud production by polyps was affected by temper-
ature, but not by pH (Table 2). The mean numbers of
buds polyp-1 ranged from 25.1 to 29.2 in 9�C
treatments and from 11.1 to 15.4 buds polyp-1 in
15�C treatments after 122 d. This significant differ-
ence matched previous results (Purcell, 2007), and was
not considered further here. There were no significant
differences in the numbers of buds produced polyp-1
among pHs in either temperature.
The numbers of polyps that strobilated differed
dramatically between the two temperatures (Table 2).
In the 9�C treatments, only 16% of the surviving
polyps strobilated, whereas 100% of the polyps at
15�C strobilated from 1 to 3 times. The first strobi-
lation may have been stimulated by the initial change
in conditions, as in Purcell (2007). Because so few
polyps strobilated (8 of 51) at 9�C, we were unable to
test the combined effects of temperature and pH on
strobilation, ephyra production, and statolith forma-
tion. Therefore, the 9�C treatments and the effects of
temperature were not considered further.
No significant effects of pH on strobilation were
found in the 15�C treatments (Table 2). The numbers
of ephyrae produced per polyp in the first strobilation,
second strobilation, and over the entire experiment
did not differ significantly among pHs, nor did the
numbers of days until first or second strobilation,
the numbers of strobilations, or the percentages of
ephyrae of the total asexual production.
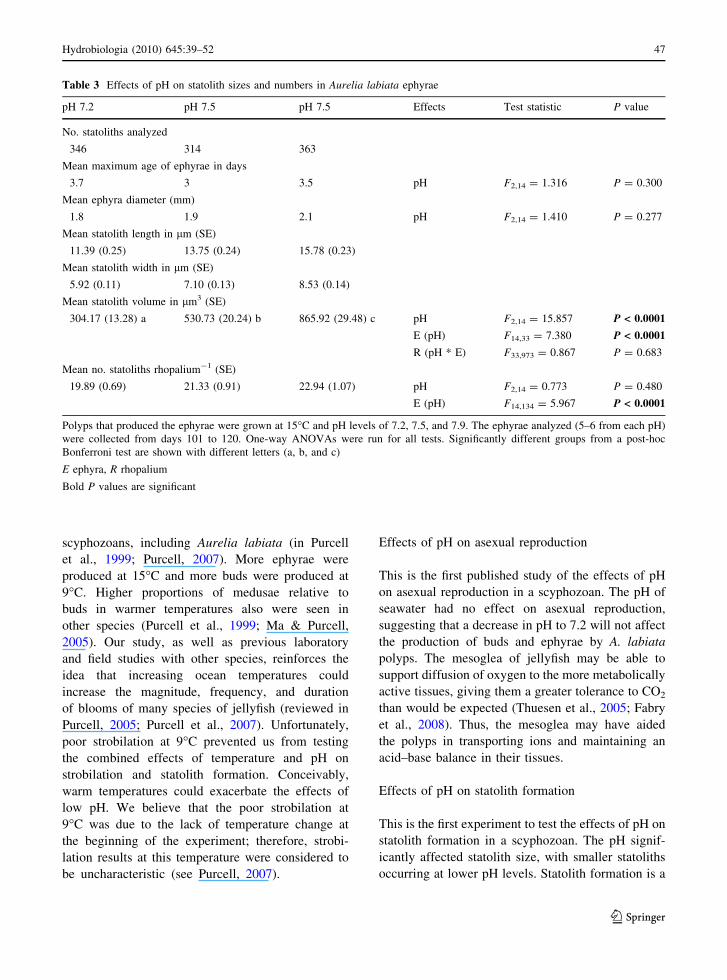
Statolith formation
Because few polyps strobilated in the 9�C treatments,
only ephyrae from the 15�C treatment were used for
statolith analyses (Table 3, Fig. 2). There were no
significant differences in numbers of statoliths rhop-
alium-1 among pH levels. Statolith volume showed
significant differences (P \ 0.0001) among pH lev-
els. Statoliths were smaller at lower pH levels and
larger at higher pH levels (Fig. 2). Statolith volumes
also differed significantly among individual ephyrae
(P \ 0.0001) within each pH, but not among rhopalia
within each ephyra. The possible ages of each ephyra
44 Hydrobiologia (2010) 645:39–52
123
ranged from 1 to 4 d due to the collection schedule,
which might have affected statolith numbers or
volumes; however, the ages and diameters of the
ephyrae did not different significantly among pHs
(Table 3). Therefore, they should not have affected
statolith numbers or volumes.
Statolith volume differences among genetically
identical ephyrae collected from the same jar and
sample collection also were significant (Table 4). The
possible ages of ephyrae ranged from 1 to 3 d in 7.2
and 7.5 pH and 1-4 d in 7.9 pH. Differences in
statolith volumes among rhopalia of individual
ephyrae were not significant at any pH.
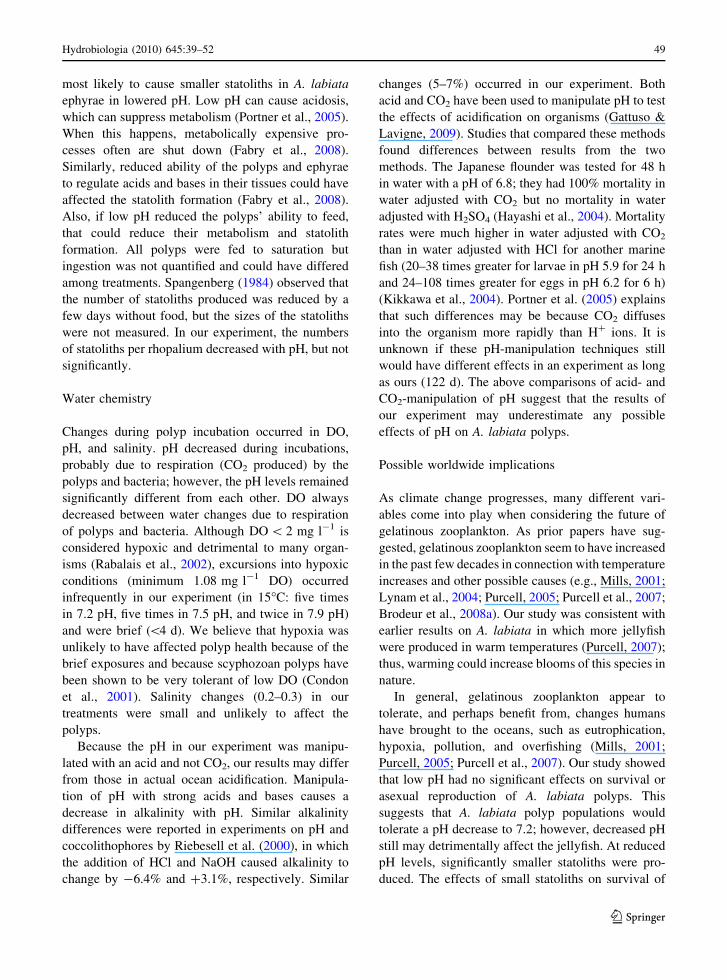
SEM showed that the statoliths of an ephyra raised
in the 7.2 pH and 15�C treatment varied in size and
shape (Fig. 3), as in Aurelia aurita (in Becker et al.,
2005). No pitting or dissolution of the statoliths was
apparent in SEM at 1,5509 magnification.
Discussion
Effects of temperature on asexual reproduction
The effects of temperature on asexual reproduc-
tion were consistent with previous studies on
Fig. 1 Water chemistry
measurements
(mean ± SE) of dissolved
oxygen, salinity, pH, and
alkalinity during a 122 d
experiment in which
Aurelia labiata polyps were
incubated at 9 and 15�C and
pH levels of 7.2, 7.5, and
7.9. The symbols represent
incubation (filled circle) and
renewed seawater (filledtriangle)
Hydrobiologia (2010) 645:39–52 45
123
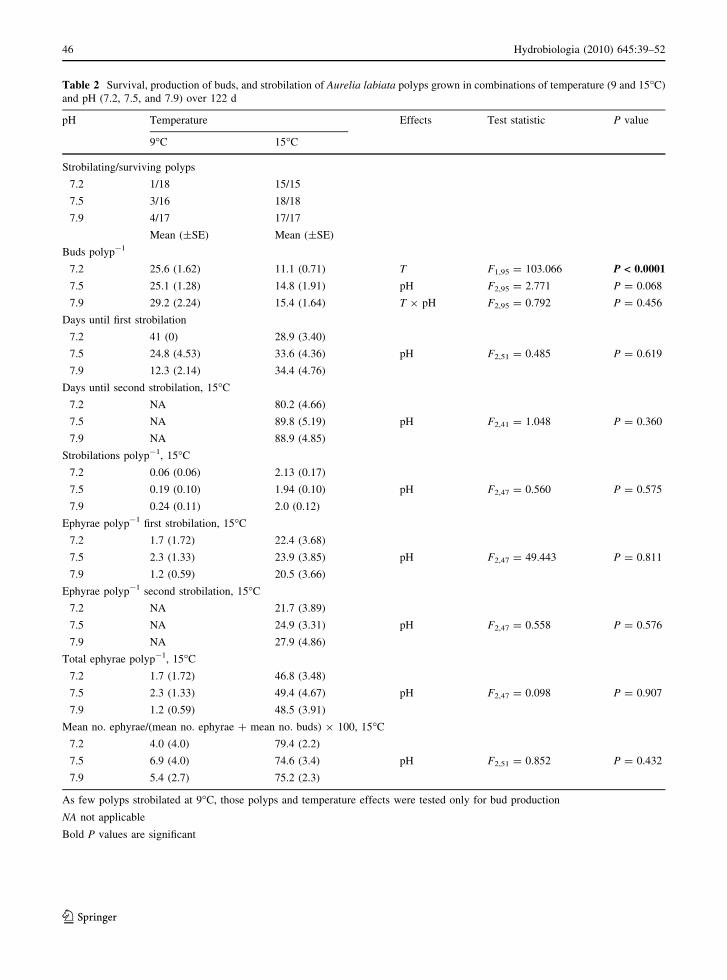
Table 2 Survival, production of buds, and strobilation of Aurelia labiata polyps grown in combinations of temperature (9 and 15�C)
and pH (7.2, 7.5, and 7.9) over 122 d
pH Temperature Effects Test statistic P value
9�C 15�C
Strobilating/surviving polyps
7.2 1/18 15/15
7.5 3/16 18/18
7.9 4/17 17/17
Mean (±SE) Mean (±SE)
Buds polyp-1
7.2 25.6 (1.62) 11.1 (0.71) T F1,95 = 103.066 P < 0.0001
7.5 25.1 (1.28) 14.8 (1.91) pH F2,95 = 2.771 P = 0.068
7.9 29.2 (2.24) 15.4 (1.64) T 9 pH F2,95 = 0.792 P = 0.456
Days until first strobilation
7.2 41 (0) 28.9 (3.40)
7.5 24.8 (4.53) 33.6 (4.36) pH F2,51 = 0.485 P = 0.619
7.9 12.3 (2.14) 34.4 (4.76)
Days until second strobilation, 15�C
7.2 NA 80.2 (4.66)
7.5 NA 89.8 (5.19) pH F2,41 = 1.048 P = 0.360
7.9 NA 88.9 (4.85)
Strobilations polyp-1, 15�C
7.2 0.06 (0.06) 2.13 (0.17)
7.5 0.19 (0.10) 1.94 (0.10) pH F2,47 = 0.560 P = 0.575
7.9 0.24 (0.11) 2.0 (0.12)
Ephyrae polyp-1 first strobilation, 15�C
7.2 1.7 (1.72) 22.4 (3.68)
7.5 2.3 (1.33) 23.9 (3.85) pH F2,47 = 49.443 P = 0.811
7.9 1.2 (0.59) 20.5 (3.66)
Ephyrae polyp-1 second strobilation, 15�C
7.2 NA 21.7 (3.89)
7.5 NA 24.9 (3.31) pH F2,47 = 0.558 P = 0.576
7.9 NA 27.9 (4.86)
Total ephyrae polyp-1, 15�C
7.2 1.7 (1.72) 46.8 (3.48)
7.5 2.3 (1.33) 49.4 (4.67) pH F2,47 = 0.098 P = 0.907
7.9 1.2 (0.59) 48.5 (3.91)
Mean no. ephyrae/(mean no. ephyrae ? mean no. buds) 9 100, 15�C
7.2 4.0 (4.0) 79.4 (2.2)
7.5 6.9 (4.0) 74.6 (3.4) pH F2,51 = 0.852 P = 0.432
7.9 5.4 (2.7) 75.2 (2.3)
As few polyps strobilated at 9�C, those polyps and temperature effects were tested only for bud production
NA not applicable
Bold P values are significant
46 Hydrobiologia (2010) 645:39–52
123
scyphozoans, including Aurelia labiata (in Purcell
et al., 1999; Purcell, 2007). More ephyrae were
produced at 15�C and more buds were produced at
9�C. Higher proportions of medusae relative to
buds in warmer temperatures also were seen in
other species (Purcell et al., 1999; Ma & Purcell,
2005). Our study, as well as previous laboratory
and field studies with other species, reinforces the
idea that increasing ocean temperatures could
increase the magnitude, frequency, and duration
of blooms of many species of jellyfish (reviewed in
Purcell, 2005; Purcell et al., 2007). Unfortunately,
poor strobilation at 9�C prevented us from testing
the combined effects of temperature and pH on
strobilation and statolith formation. Conceivably,
warm temperatures could exacerbate the effects of
low pH. We believe that the poor strobilation at
9�C was due to the lack of temperature change at
the beginning of the experiment; therefore, strobi-
lation results at this temperature were considered to
be uncharacteristic (see Purcell, 2007).
Effects of pH on asexual reproduction
This is the first published study of the effects of pH
on asexual reproduction in a scyphozoan. The pH of
seawater had no effect on asexual reproduction,
suggesting that a decrease in pH to 7.2 will not affect
the production of buds and ephyrae by A. labiata
polyps. The mesoglea of jellyfish may be able to
support diffusion of oxygen to the more metabolically
active tissues, giving them a greater tolerance to CO2
than would be expected (Thuesen et al., 2005; Fabry
et al., 2008). Thus, the mesoglea may have aided
the polyps in transporting ions and maintaining an
acid–base balance in their tissues.
Effects of pH on statolith formation
This is the first experiment to test the effects of pH on
statolith formation in a scyphozoan. The pH signif-
icantly affected statolith size, with smaller statoliths
occurring at lower pH levels. Statolith formation is a
Table 3 Effects of pH on statolith sizes and numbers in Aurelia labiata ephyrae
pH 7.2 pH 7.5 pH 7.5 Effects Test statistic P value
No. statoliths analyzed
346 314 363
Mean maximum age of ephyrae in days
3.7 3 3.5 pH F2,14 = 1.316 P = 0.300
Mean ephyra diameter (mm)
1.8 1.9 2.1 pH F2,14 = 1.410 P = 0.277
Mean statolith length in lm (SE)
11.39 (0.25) 13.75 (0.24) 15.78 (0.23)
Mean statolith width in lm (SE)
5.92 (0.11) 7.10 (0.13) 8.53 (0.14)
Mean statolith volume in lm3 (SE)
304.17 (13.28) a 530.73 (20.24) b 865.92 (29.48) c pH F2,14 = 15.857 P < 0.0001
E (pH) F14,33 = 7.380 P < 0.0001
R (pH * E) F33,973 = 0.867 P = 0.683
Mean no. statoliths rhopalium-1 (SE)
19.89 (0.69) 21.33 (0.91) 22.94 (1.07) pH F2,14 = 0.773 P = 0.480
E (pH) F14,134 = 5.967 P < 0.0001
Polyps that produced the ephyrae were grown at 15�C and pH levels of 7.2, 7.5, and 7.9. The ephyrae analyzed (5–6 from each pH)
were collected from days 101 to 120. One-way ANOVAs were run for all tests. Significantly different groups from a post-hoc
Bonferroni test are shown with different letters (a, b, and c)
E ephyra, R rhopalium
Bold P values are significant
Hydrobiologia (2010) 645:39–52 47
123
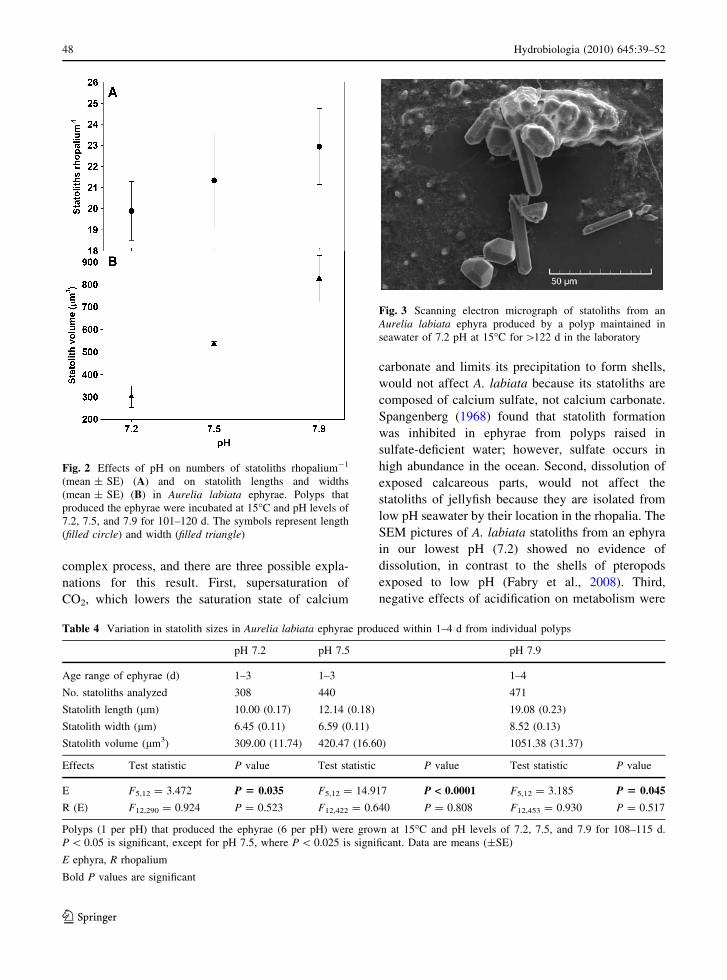
complex process, and there are three possible expla-
nations for this result. First, supersaturation of
CO2, which lowers the saturation state of calcium
carbonate and limits its precipitation to form shells,
would not affect A. labiata because its statoliths are
composed of calcium sulfate, not calcium carbonate.
Spangenberg (1968) found that statolith formation
was inhibited in ephyrae from polyps raised in
sulfate-deficient water; however, sulfate occurs in
high abundance in the ocean. Second, dissolution of
exposed calcareous parts, would not affect the
statoliths of jellyfish because they are isolated from
low pH seawater by their location in the rhopalia. The
SEM pictures of A. labiata statoliths from an ephyra
in our lowest pH (7.2) showed no evidence of
dissolution, in contrast to the shells of pteropods
exposed to low pH (Fabry et al., 2008). Third,
negative effects of acidification on metabolism were
Fig. 2 Effects of pH on numbers of statoliths rhopalium-1
(mean ± SE) (A) and on statolith lengths and widths
(mean ± SE) (B) in Aurelia labiata ephyrae. Polyps that
produced the ephyrae were incubated at 15�C and pH levels of
7.2, 7.5, and 7.9 for 101–120 d. The symbols represent length
(filled circle) and width (filled triangle)
Table 4 Variation in statolith sizes in Aurelia labiata ephyrae produced within 1–4 d from individual polyps
pH 7.2 pH 7.5 pH 7.9
Age range of ephyrae (d) 1–3 1–3 1–4
No. statoliths analyzed 308 440 471
Statolith length (lm) 10.00 (0.17) 12.14 (0.18) 19.08 (0.23)
Statolith width (lm) 6.45 (0.11) 6.59 (0.11) 8.52 (0.13)
Statolith volume (lm3) 309.00 (11.74) 420.47 (16.60) 1051.38 (31.37)
Effects Test statistic P value Test statistic P value Test statistic P value
E F5,12 = 3.472 P 5 0.035 F5,12 = 14.917 P < 0.0001 F5,12 = 3.185 P 5 0.045
R (E) F12,290 = 0.924 P = 0.523 F12,422 = 0.640 P = 0.808 F12,453 = 0.930 P = 0.517
Polyps (1 per pH) that produced the ephyrae (6 per pH) were grown at 15�C and pH levels of 7.2, 7.5, and 7.9 for 108–115 d.
P \ 0.05 is significant, except for pH 7.5, where P \ 0.025 is significant. Data are means (±SE)
E ephyra, R rhopalium
Bold P values are significant
Fig. 3 Scanning electron micrograph of statoliths from an
Aurelia labiata ephyra produced by a polyp maintained in
seawater of 7.2 pH at 15�C for [122 d in the laboratory
48 Hydrobiologia (2010) 645:39–52
123
most likely to cause smaller statoliths in A. labiata
ephyrae in lowered pH. Low pH can cause acidosis,
which can suppress metabolism (Portner et al., 2005).
When this happens, metabolically expensive pro-
cesses often are shut down (Fabry et al., 2008).
Similarly, reduced ability of the polyps and ephyrae
to regulate acids and bases in their tissues could have
affected the statolith formation (Fabry et al., 2008).
Also, if low pH reduced the polyps’ ability to feed,
that could reduce their metabolism and statolith
formation. All polyps were fed to saturation but
ingestion was not quantified and could have differed
among treatments. Spangenberg (1984) observed that
the number of statoliths produced was reduced by a
few days without food, but the sizes of the statoliths
were not measured. In our experiment, the numbers
of statoliths per rhopalium decreased with pH, but not
significantly.
Water chemistry
Changes during polyp incubation occurred in DO,
pH, and salinity. pH decreased during incubations,
probably due to respiration (CO2 produced) by the
polyps and bacteria; however, the pH levels remained
significantly different from each other. DO always
decreased between water changes due to respiration
of polyps and bacteria. Although DO \ 2 mg l-1 is
considered hypoxic and detrimental to many organ-
isms (Rabalais et al., 2002), excursions into hypoxic
conditions (minimum 1.08 mg l-1 DO) occurred
infrequently in our experiment (in 15�C: five times
in 7.2 pH, five times in 7.5 pH, and twice in 7.9 pH)
and were brief (\4 d). We believe that hypoxia was
unlikely to have affected polyp health because of the
brief exposures and because scyphozoan polyps have
been shown to be very tolerant of low DO (Condon
et al., 2001). Salinity changes (0.2–0.3) in our
treatments were small and unlikely to affect the
polyps.
Because the pH in our experiment was manipu-
lated with an acid and not CO2, our results may differ
from those in actual ocean acidification. Manipula-
tion of pH with strong acids and bases causes a
decrease in alkalinity with pH. Similar alkalinity
differences were reported in experiments on pH and
coccolithophores by Riebesell et al. (2000), in which
the addition of HCl and NaOH caused alkalinity to
change by -6.4% and ?3.1%, respectively. Similar
changes (5–7%) occurred in our experiment. Both
acid and CO2 have been used to manipulate pH to test
the effects of acidification on organisms (Gattuso &
Lavigne, 2009). Studies that compared these methods
found differences between results from the two
methods. The Japanese flounder was tested for 48 h
in water with a pH of 6.8; they had 100% mortality in
water adjusted with CO2 but no mortality in water
adjusted with H2SO4 (Hayashi et al., 2004). Mortality
rates were much higher in water adjusted with CO2
than in water adjusted with HCl for another marine
fish (20–38 times greater for larvae in pH 5.9 for 24 h
and 24–108 times greater for eggs in pH 6.2 for 6 h)
(Kikkawa et al., 2004). Portner et al. (2005) explains
that such differences may be because CO2 diffuses
into the organism more rapidly than H? ions. It is
unknown if these pH-manipulation techniques still
would have different effects in an experiment as long
as ours (122 d). The above comparisons of acid- and
CO2-manipulation of pH suggest that the results of
our experiment may underestimate any possible
effects of pH on A. labiata polyps.
Possible worldwide implications
As climate change progresses, many different vari-
ables come into play when considering the future of
gelatinous zooplankton. As prior papers have sug-
gested, gelatinous zooplankton seem to have increased
in the past few decades in connection with temperature
increases and other possible causes (e.g., Mills, 2001;
Lynam et al., 2004; Purcell, 2005; Purcell et al., 2007;
Brodeur et al., 2008a). Our study was consistent with
earlier results on A. labiata in which more jellyfish
were produced in warm temperatures (Purcell, 2007);
thus, warming could increase blooms of this species in
nature.
In general, gelatinous zooplankton appear to
tolerate, and perhaps benefit from, changes humans
have brought to the oceans, such as eutrophication,
hypoxia, pollution, and overfishing (Mills, 2001;
Purcell, 2005; Purcell et al., 2007). Our study showed
that low pH had no significant effects on survival or
asexual reproduction of A. labiata polyps. This
suggests that A. labiata polyp populations would
tolerate a pH decrease to 7.2; however, decreased pH
still may detrimentally affect the jellyfish. At reduced
pH levels, significantly smaller statoliths were pro-
duced. The effects of small statoliths on survival of
Hydrobiologia (2010) 645:39–52 49
123
ephyrae are unknown. Spangenberg (1968) saw
swimming abnormalities in A. aurita ephyrae that
had fewer than normal statoliths, but statolith sizes
were not measured. Gu et al. (2005) found reduced
swimming and feeding below pH 7.4 in the swim-
ming and feeding of Rhopilema esculenta Kishinouye
scyphomedusae.
Recent papers discuss how jellyfish populations
may respond to ocean acidification in the North Sea
and North Atlantic Ocean. Although Attrill et al.
(2007) showed a negative correlation of jellyfish
frequency and pH in the North Sea from continuous
plankton recorder (CPR) data over 43 years and
concluded that jellyfish might increase as an indirect
consequence of ocean acidification, Richardson &
Gibbons (2008) found no significant correlation of
jellyfish frequency and pH from CPR data over
57 years in the North Sea and North Atlantic. The
validity of the Attrill et al. (2007) analyses was
challenged by Haddock (2008), but Attrill & Edwards
(2008) concluded they were robust. Attrill et al.
(2007) invoked indirect ‘‘bottom-up’’ mechanisms to
explain why jellyfish might increase in lower pH. In
our experiment, we tested possible direct effects of
pH on survival and reproduction of Aurelia labiata
polyps and found no significant effects, suggesting
that this species is quite tolerant of low pH; however,
small statoliths produced by A. labiata ephyrae in low
pH may affect their survival and ultimately the
medusa population size.
Organisms may experience low pH conditions
more often than realized. A study in Puget Sound
found that pH fluctuates from 7.2 to 9.6 in 2.4-m-
deep water over the span of a couple of days (K. L.
Van Alstyne, SPMC, pers. comm.). With such large
pH fluctuations due to plant photosynthesis during the
day and respiration at night, many organisms may be
exposed to low pH conditions routinely.
Much more research is needed to determine the
fate of jellyfish under the influence of ocean acidi-
fication. Different species and populations of jellyfish
may have different responses to environmental vari-
ables (Liu et al., 2009). Effects of low pH on various
organisms have been tested in acute experiments;
however, organisms may be able to acclimate or
adapt to slowly changing pH conditions. CO2 should
be used to adjust pH and carbonate chemistry to
simulate ocean conditions more accurately and
because CO2-adjusted pH had greater toxic effects
than did acid-adjusted pH (Hayashi et al., 2004;
Kikkawa et al., 2004). The effects of small statoliths
on swimming and feeding of the ephyrae need to be
determined. If small statoliths negatively affect
A. labiata ephyra survival, then ocean acidification
could be detrimental to this species and counteract
the probable positive effects of warming and other
factors (reviewed in Purcell, 2005; Purcell et al.,
2007). Hopefully our research will encourage further
research to determine how ocean acidification will
affect jellyfish populations.
Acknowledgments We thank Dr. V. J. Fabry for inviting
J. E. P. to the Ocean Carbon and Biogeochemistry Scoping
Workshop on Ocean Acidification Research in 2007, and her
advice on methodology for this research. We thank Drs. Gisele
Muller-Parker, Benjamin Miner, and Brian Bingham for their
valuable comments. We are indebted to the following people
for their assistance; Rachel Garcia, Ritupreet Virk, Brandy
Carpenter, Jen Moore, Dr. Gary Winans, Nathan Schwarck,
Gene McKeen, Carissa Haug, Jeannie Gilbert, Peter Thut,
Chandler Colahan, Alyssa Gehman, Sylvia Graham, Lauren
Chomiczewski, and Carmen Guerra. Jellyfish polyps were
provided by the Seattle Aquarium with help from Kathryn
Kegel and Roland Anderson. We also thank Dr. K. L. Van
Alstyne for sharing her information on diel intertidal pH levels.
Financial support was provided by Western Washington
University through the RSP Fund for the Enhancement of
Graduate Research and the Biology Faculty Fellowship Fund.
References
Arai, M. N., 1997. A Functional Biology of Scyphozoa.
Chapman & Hall, London.
Attrill, M. J. & M. Edwards, 2008. Reply to Haddock. S.H.D.,
reconsidering evidence for potential climate-related
increases in jellyfish. Limnology and Oceanography 53:
2763–2766.
Attrill, M. J., J. Wright & M. Edwards, 2007. Climate-related
increases in jellyfish frequency suggest a more gelatinous
future for the North Sea. Limnology and Oceanography
52: 480–485.
Becker, A., I. Sotje, C. Paulmann, F. Beckmann, T. Donath, R.
Boese, O. Prymak, H. Tiemann & M. Epple, 2005. Cal-
cium sulfate hemihydrate is the inorganic mineral in
statoliths of scyphozoan medusae (Cnidaria). Dalton
Transactions 1545–1550.
Bindoff, N. L., J. Willebrand, V. Artale, A. Cazenave, J.
Gregory, S. Gulev, K. Hanawa, C. Le Quere, S. Levitus,
Y. Nojiri, C. K. Shum, L. D. Talley & A. Unnikrishnan,
2007. Observations: oceanic climate change and sea level.
In Solomon, S., D. Qin, M. Manning, Z. Chen, M. Mar-
quis, K. B. Averyt, M. Tignor & H. L. Miller (eds),
Climate Change 2007: The Physical Science Basis. Con-
tribution of Working Group I to the Fourth Assessment
Report of the Intergovernmental Panel on Climate
50 Hydrobiologia (2010) 645:39–52
123
Change. Cambridge University Press, Cambridge, UK and
New York, NY, USA.
Brodeur, R. D., M. B. Decker, L. Ciannelli, J. E. Purcell, N. A.
Bond, P. J. Stabeno, E. Acuna & G. L. Hunt Jr, 2008a.
Rise and fall of jellyfish in the eastern Bering Sea in
relation to climate regime shifts. Progress in Oceanogra-
phy 77: 103–111.
Brodeur, R. D., C. L. Suchman, D. C. Reese, T. W. Miller &
E. A. Daly, 2008b. Spatial overlap and trophic interactions
between pelagic fish and large jellyfish in the northern
California Current. Marine Biology 154: 649–659.
Caldeira, K. & M. E. Wickett, 2003. Anthropogenic carbon and
ocean pH. Nature 425: 365.
Condon, R. H., M. B. Decker & J. E. Purcell, 2001. Effects of
low dissolved oxygen on survival and asexual reproduc-
tion of scyphozoan polyps (Chrysaora quinquecirrha).
Hydrobiologia 451: 89–95.
Doney, S. C., V. J. Fabry, R. A. Feely & J. A. Kleypas, 2009.
Ocean acidification: the other CO2 problem. Annual
Review of Marine Science 1: 162–192.
Fabry, V. J., B. A. Seibel, R. A. Feely & J. C. Orr, 2008.
Impacts of ocean acidification on marine fauna and eco-
system processes. ICES Journal of Marine Science 65:
414–432.
Feely, R. A., C. L. Sabine, K. Lee, W. Berelson, J. Kleypas, V.
J. Fabry & F. J. Millero, 2004. Impact of anthropogenic
CO2 on the CaCO3 system in the oceans. Science 305:
362–366.
Forster, P., V. Ramaswamy, P. Artaxo, T. Berntsen, R. Betts,
D. W. Fahey, J. Haywood, J. Lean, D. C. Lowe, G. Myhre,
J. Nganga, R. Prinn, G. Raga, M. Schulz & R. Van Dor-
land, 2007. Changes in atmospheric constituents and in
radiative forcing. In Solomon, S., D. Qin, M. Manning, Z.
Chen, M. Marquis, K. B. Averyt, M. Tignor & H. L.
Miller (eds), Climate Change 2007: The Physical Science
Basis. Contribution of Working Group I to the Fourth
Assessment Report of the Intergovernmental Panel on
Climate Change. Cambridge University Press, Cambridge,
UK and New York, NY, USA.
Gamst, G., L. S. Meyers & A. J. Guarino, 2008. Analysis of
Variance Designs: A Conceptual and Computational
Approach with SPSS and SAS. Cambridge University
Press, Cambridge.
Gattuso, J.-P. & H. Lavigne, 2009. Technical note: approaches
and software tools to investigate the impact of ocean
acidification. Biogeosciences 6: 2121–2133.
Gattuso, J.-P., M. Frankignoulle, I. Bourge, S. Romaine &
R. W. Buddemeier, 1998. Effect of calcium carbonate
saturation of seawater on coral calcification. Global and
Planetary Change 18: 37–46.
Gu, L., M. Guo, H.-y. Lu, Z.-z. Sun & Y.-z. Lei, 2005. The
physical-chemical factors affecting jellyfish Rhopilemaesculenta breeding. Journal of Dalian Fisheries University
20: 41–44.
Haddock, H. S. D., 2008. Reconsidering evidence for potential
climate-related increases in jellyfish. Limnology and
Oceanography 53: 2759–2762.
Hayashi, K., J. Kita & A. Ishimatsu, 2004. Comparison of the
acid–base responses to CO2 and acidification in Japanese
flounder (Paralichthys olivaceus). Marine Pollution Bul-
letin 49: 1062–1065.
Holst, S., I. Sotje & H. Tiemann, 2007. Life cycle of the rhi-
zostome jellyfish Rhizostoma octopus (L.) (Scyphozoa,
Rhizostomeae), with studies on cnidocysts and statoliths.
Marine Biology 151: 1695–1710.
Jokiel, P. L., K. S. Rodgers, I. B. Kuffner, A. J. Anderson, E. F.
Fox & F. T. Mackenzie, 2008. Ocean acidification and
calcifying reef organisms: a mesocosm investigation.
Coral Reefs 27: 473–483.
Keppel, G. & T. D. Wickens, 2004. Design and Analysis: A
Researcher’s Handbook, 4th ed. Prentice Hall, Upper
Saddle River.
Kikkawa, T., J. Kita & A. Ishimatsu, 2004. Comparison of the
lethal effect of CO2 and acidification on red sea bream
(Pagrus major) during the early developmental stages.
Marine Pollution Bulletin 48: 108–110.
Kleypas, J. A., R. W. Buddemeier, D. Archer, J.-P. Gattuso, C.
Langdon & B. N. Opdyke, 1999. Geochemical conse-
quences of increased atmospheric carbon dioxide on coral
reefs. Science 284: 118–120.
Kuffner, I. B., A. J. Anderson, P. L. Jokiel, K. S. Rodgers & F. T.
Mackenzie, 2008. Decreased abundance of crustose coral-
line algae due to ocean acidification. Nature Geoscience 1:
114–117.
Langdon, C., T. Takahashi, C. Sweeney, D. Chipman & J.
Goddard, 2000. Effect of calcium carbonate saturation
state on the calcification rate of an experimental coral
reef. Global Biogeochemical Cycles 14: 639–654.
Liu, W.-C., W.-T. Lo, J. E. Purcell & H.-H. Chang, 2009.
Effects of temperature and light intensity on asexual
reproduction of the scyphozoan, Aurelia aurita (L.) in
Taiwan. Hydrobiologia 612: 247–258.
Lucas, C. H., 2001. Reproduction and life history strategies of
the common jellyfish, Aurelia aurita, in relation to its
ambient environment. Hydrobiologia 451: 229–246.
Lynam, C. P., S. J. Hay & A. S. Brierley, 2004. Interannual
variability in abundance of North Sea jellyfish and links to
the North Atlantic Oscillation. Limnology and Oceanog-
raphy 49: 637–643.
Ma, X. & J. E. Purcell, 2005. Temperature, salinity and prey
effects on polyp versus medusa bud production by the
invasive hydrozoan Moerisia lyonsi. Marine Biology 147:
225–234.
Metzger, R., F. J. Sartoris, M. Langenbuch & H. O. Portner,
2007. Influence of elevated CO2 concentrations on ther-
mal tolerance of the edible crab Cancer paguris. Journal
of Thermal Biology 32: 144–151.
Michaelidis, B., C. Ouzounis, A. Paleras & H. O. Portner,
2005. Effects of long-term moderate hypercapnia on acid–
base balance and growth rate in marine mussels Mytilusgalloprovincialis. Marine Ecology and Progress Series
293: 109–118.
Mills, C. E., 2001. Jellyfish blooms: are populations increasing
globally in response to changing ocean conditions? Hyd-
robiologia 451: 55–68.
Orr, J. C., V. J. Fabry, O. Aumont, L. Bopp, S. C. Doney, R. A.
Feely, A. Gnanadesikan, N. Gruber, A. Ishida, F. Joos, R.
M. Key, K. Lindsay, E. Maier-Reimer, R. Matear, P.
Monfray, A. Mouchet, R. G. Najjar, G.-K. Plattner, K. B.
Rodgers, C. L. Sabine, J. L. Sarmiento, R. Schlitzer, R. D.
Slater, I. J. Totterdell, M.-F. Weirig, Y. Yamanaka & A.
Yool, 2005. Anthropogenic ocean acidification over the
Hydrobiologia (2010) 645:39–52 51
123
twenty-first century and its impact on calcifying organ-
isms. Nature 437: 681–686.
Palmer, M., 1992. Standard Operating Procedure for GLNPO
Total Alkalinity Titration. United States Environmental
Protection Agency, Chicago.
Portner, H. O., M. Langenbuch & B. Michaelidis, 2005. Syner-
gistic effects of temperature extremes, hypoxia, and
increases in CO2 on marine animals: From Earth history to
global change. Journal of Geophysical Research 110:
C09S10.
Purcell, J. E., 1997. Pelagic cnidarians and ctenophores as
predators: selective predation, feeding rates and effects on
prey populations. Annales de l’Institut oceanographique,
Paris 73: 125–137.
Purcell, J. E., 2005. Climate effects on formation of jellyfish and
ctenophore blooms: a review. Journal of the Marine Bio-
logical Association of the United Kingdom 85: 461–476.
Purcell, J. E., 2007. Environmental effects on asexual repro-
duction rates of the scyphozoan Aurelia labiata. Marine
Ecology Progress Series 348: 183–196.
Purcell, J. E. & J. J. Grover, 1990. Predation and food limi-
tation as causes of mortality in larval herring at a
spawning ground in British Columbia. Marine Ecology
Progress Series 59: 55–61.
Purcell, J. E. & M. V. Sturdevant, 2001. Prey Selection and
dietary overlap among zooplanktivorous jellyfish and
juvenile fishes in Prince William Sound, Alaska. Marine
Ecology Progress Series 210: 67–83.
Purcell, J. E., J. R. White, D. A. Nemazie & D. A. Wright, 1999.
Temperature, salinity and food effects on asexual repro-
duction and abundance of the scyphozoan Chrysaora quin-quecirrha. Marine Ecology Progress Series 180: 187–196.
Purcell, J. E., S.-i. Uye & W.-T. Lo, 2007. Anthropogenic
causes of jellyfish blooms and their direct consequences
for humans: a review. Marine Ecology Progress Series
350: 153–174.
Rabalais, N. N., R. E. Turner & W. J. Wiseman Jr., 2002. Gulf
of Mexico hypoxia A.K.A. ‘‘the dead zone’’. Annual
Review of Ecology and Systematics 33: 235–263.
Richardson, A. J. & M. J. Gibbons, 2008. Are jellyfish
increasing in response to ocean acidification? Limnology
and Oceanography 53: 2040–2045.
Riebesell, U., I. Zondervan, B. Rost, P. D. Tortell, R. E. Zeebe
& F. M. M. Morel, 2000. Reduced calcification of marine
plankton in response to increased atmospheric CO2.
Nature 407: 364–367.
Rost, B., I. Zondervan & D. Wolf-Gladrow, 2008. Sensitivity
of phytoplankton to future changes in ocean carbonate
chemistry: current knowledge, contradictions, and
research directions. Marine Ecology Progress Series 373:
227–237.
Royal Society, 2005. Ocean Acidification Due to Increasing
Atmospheric Carbon Dioxide. The Royal Society,
London.
Shirayama, Y. & H. Thornton, 2005. Effect of increased
atmospheric CO2 on shallow water marine benthos.
Journal of Geophysical Research 110: C09S08.
Spangenberg, D. B., 1968. Statolith differentiation in Aureliaaurita. Journal of Experimental Zoology 169: 487–500.
Spangenberg, D. B., 1976. Intracellular statolith synthesis in
Aurelia aurita. In Watabe, N. & K. Wilbur (eds), The
Mechanisms of Mineralization in the Invertebrates and
Plants. University of South Carolina Press, Columbia:
231–248.
Spangenberg, D. B., 1984. Effects of exogenous thyroxine on
statolith synthesis and resorption in Aurelia. American
Zoologist 24: 917–923.
Spangenberg, D. B. & C. W. Beck, 1968. Calcium sulfate
dehydrate statoliths in Aurelia. Transactions of the
American Microscopical Society 8: 329–335.
Spangenberg, D. B. & C. W. Beck, 1972. Tetracycline effects
on statolith and nematocyst differentiation in Aurelia.
Calcified Tissue Research 9: 122–133.
Thuesen, E. V., L. D. Rutherford Jr., P. L. Brommer, K. Gar-
rison, M. A. Gutowska & T. Towanda, 2005. Intragel
hypoxia promotes hypoxia tolerance of scyphomedusae.
The Journal of Experimental Biology 208: 2475–2482.
52 Hydrobiologia (2010) 645:39–52
123