effects of park improvements on park use and physical activity
TRANSCRIPT

Effects of Park Improvements on Park Use and Physical ActivityPolicy and Programming Implications
Deborah Cohen, MD, MPH,RAND Corporation, Santa Monica
Daniela Golinelli, PhD,RAND Corporation, Santa Monica
Stephanie Williamson, BA,RAND Corporation, Santa Monica
Amber Sehgal, MS,RAND Corporation, Santa Monica
Terry Marsh, MPH, andRAND Corporation, Santa Monica
Thomas L McKenzie, PhDSan Diego State University, San Diego, California
AbstractBackground—Many assume that improving the quality and the perceived safety of facilities inparks and recreation centers are critical to attracting more users and increasing population physicalactivity. There are few studies in which these assumptions have been tested.
Purpose—To assess the impact of park improvements on park use and physical activity.
Methods—Five intervention parks and five matched comparison parks were studied by objectivelymeasuring park use and collecting self reports of park use by residents before and after parkimprovements. After using the System for Observing Play and Recreation in Communities(SOPARC) to count park users and measure their activity levels and conducting household interviewsand intercept surveys with park users, propensity score analyses were used to adjust for differencesin respondents’ characteristics between pre- and post-intervention and across conditions.
Results—Overall park use and physical activity declined in both intervention and control parks,with 39% of the decline directly attributable to fewer scheduled organized activities. Perceptions ofpark safety increased more in the intervention parks than in the comparison parks.
Conclusions—Improvements to parks may not automatically result in increased use and physicalactivity, especially when programming decreases. Multiple factors contribute to park use and needto be accounted for in future community-level interventions. Improving perceptions of safety aloneare unlikely to result in increased park use.
Address correspondence and reprint requests to: Deborah A. Cohen, MD, MPH, RAND Corporation, 1776 Main St, Santa Monica, CA90407. [email protected] financial disclosures were reported by the authors of this paper.Publisher's Disclaimer: This is a PDF file of an unedited manuscript that has been accepted for publication. As a service to our customerswe are providing this early version of the manuscript. The manuscript will undergo copyediting, typesetting, and review of the resultingproof before it is published in its final citable form. Please note that during the production process errors may be discovered which couldaffect the content, and all legal disclaimers that apply to the journal pertain.
NIH Public AccessAuthor ManuscriptAm J Prev Med. Author manuscript; available in PMC 2010 December 1.
Published in final edited form as:Am J Prev Med. 2009 December ; 37(6): 475. doi:10.1016/j.amepre.2009.07.017.
NIH
-PA Author Manuscript
NIH
-PA Author Manuscript
NIH
-PA Author Manuscript
IntroductionMany civic organizations and government agencies have lamented the low levels of physicalactivity and high levels of obesity that plague American adults and children and have calledfor stepped up efforts to help citizens become healthier.1 According to a recent NHANESassessment using accelerometry, only 42% of children, 9% of teens, and fewer than 5% ofadults meet national recommendations for physical activity.2 Multiple barriers to physicalactivity have been noted, including large distances between homes, work, and school thatrequire motorized transport, busy streets, lack of destinations to walk to, and insufficient parkspace. In addition, over the past several decades there have been insufficient investments inupdating recreational facilities and many believe that the lack of attractive and safe venues isa primary reason why it is difficult to increase levels of physical activity.3,4
Some localities, however, do manage to allocate funds to renovate and improve publicrecreational spaces in local neighborhoods. In one city in Southern California, the citizensapproved a bond measure which specifically allocated funds for upgrading and acquiring newopen spaces for recreation. The plan was broad and was intended to improve more than 300parks and open spaces. In addition, the bond mandated citizen participation and input in thedesign of new facilities and improvements. It is commonly believed that communityparticipation in decision making results in improvements that meet local needs and preferencesthat simultaneously enhance feelings of ownership and local pride, resulting in greater successand better use of facilities.5
An opportunity for a natural experiment to improve local parks using community participationin the design served as the basis of the current study which was aimed at determining the impactof the improvements on park use and the physical activity of park users.
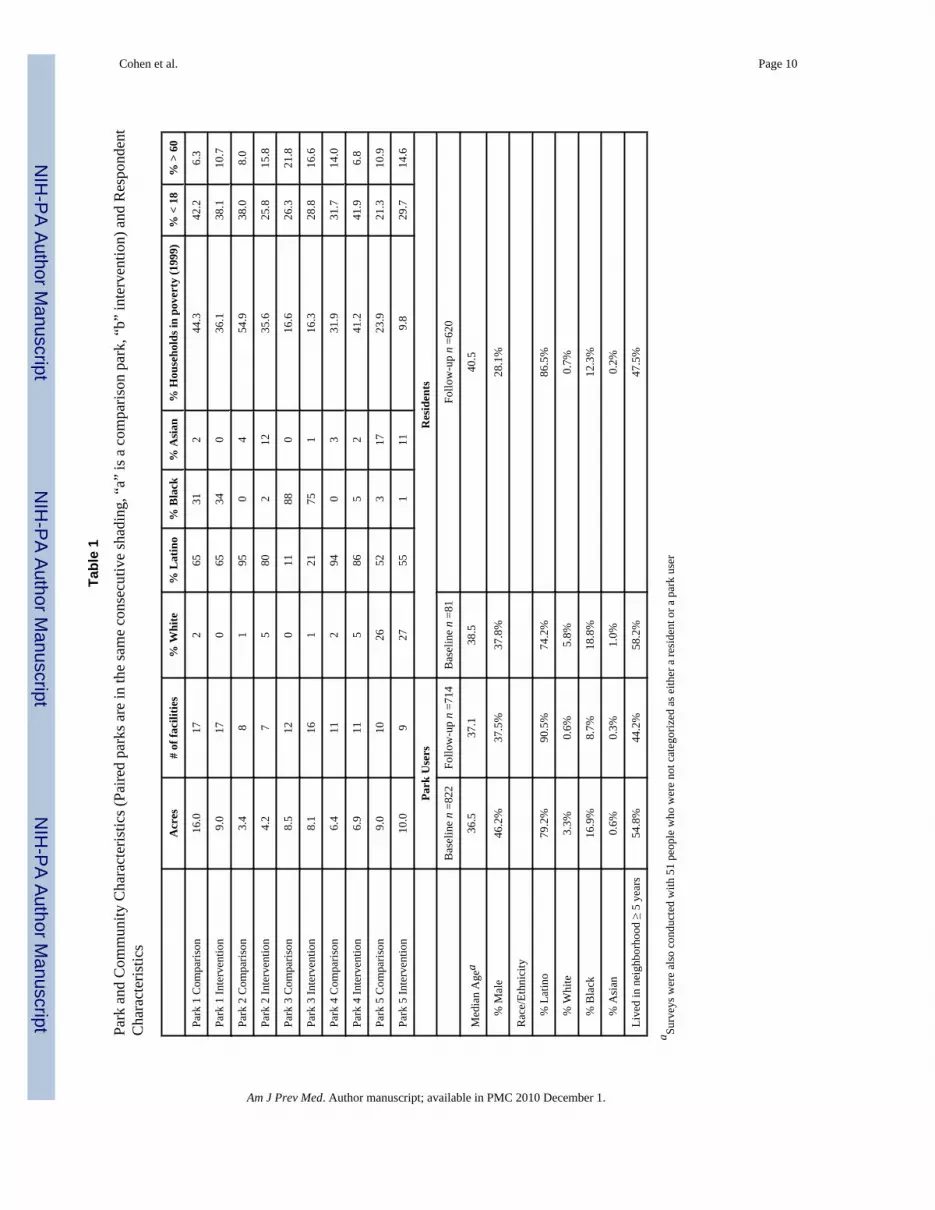
MethodsThe study was conducted in ten urban parks and their surrounding communities. Fiveintervention parks had been scheduled for major improvements with budgets in excess of$1,000,000 after December of 2003, and each intervention park was matched with a similarpark (i.e., comparison park) which was not planned to receive upgrades by the city. The selectedcomparison park had similar size, features, and amenities and it served a population with similarsociodemographic characteristics as its intervention counterpart. (See Table 1).
Each intervention park scheduled open public meetings to discuss improvements and aVoluntary Oversight Committee was formed with members appointed by local elected officialsto ensure community participation. Three parks constructed completely new gymnasiums. Twoof the three parks had old gymnasiums: one retained the old gym, so they ended up with twogyms, while the other razed and replaced the one they had. The fourth park had its oldgymnasium refurbished and underwent some field improvements in watering and landscaping.The fifth had improvements to picnic areas, upgrades to a walking path, and enhancements toa playground area so that it had rubberized surfacing around the climbing apparatus andstationary horses.
Assessments consisted of direct observations of park use and park characteristics plus interceptand household interviews at pre- and post-construction. Baseline data were collected betweenDec 2003 and Nov 2004, and follow-up data between April 2006 and March 2008. To accountfor seasonal variation, pre- and post-measures were conducted at the same time of year. Inaddition, follow-up measures were initiated at least 3 months after construction; thus, the onsetof post construction observations varied from 3 months to 14 months.
Cohen et al. Page 2
Am J Prev Med. Author manuscript; available in PMC 2010 December 1.
NIH
-PA Author Manuscript
NIH
-PA Author Manuscript
NIH
-PA Author Manuscript
We used the System for Observing Play and Recreation in Communities (SOPARC) protocolthat was developed specifically to objectively assess baseline park use and physical activity inthe is project. SOPARC has been found to have good reliability6 and has recently beenvalidated as an accurate method for providing estimates for total park use.7 Observations wereconducted in all activity areas 7:30–8:30am, 12:30–1:30pm, 3:30–4:30 pm, and 6:30–7:30pmduring each of the 7 days of the week. Any observation cancelled because of inclement weatherwas made up at the same time and on the same day of the following week. All area users arecounted by gender (female or male), age group (child, teen, adult, or senior), race/ethnicity(Latino, black, white, or other), and activity level (sedentary, walking, or vigorous). Thecharacteristics of each target area were also recorded (e.g., accessibility, usability, equipped,and whether activity in the area was being organized or supervised).
We also surveyed park users and recruited them systematically from the most and the leastbusy areas, by gender, and by activity level (i.e., sedentary, physically active). In addition,residents living within a 2-mile radius of the park were surveyed. More specifically, householdswere classified into four strata (within ¼ mile, from ¼ to ½ mile, from ½ to 1 mile, and from1 to 2 miles from each park) and sampled approximately equal numbers of households fromeach stratum. Field staff, trained bilingual promotoras from a community-based organization,administered the interviews in either English or Spanish with the adult at home whose birthdaymost closely matched the visit date. Interviewers returned to a sampled household up to 5 timesto locate residents before selecting an alternate address. Respondents were questioned abouttheir use of the park and their physical activity. The same households were visited at baselineand follow-up, but unique identifying personal information was not collected from respondents.All methods were approved by the RAND IRB.
Propensity score analysisTo assess whether park improvements had an effect on outcomes of interest (such as park use,perceived park safety, physical activity during leisure time and health, and use of other parks),a propensity score analysis was conducted. This analysis included only 8 of the10 study parks.The first pair was eliminated from this analysis because a few key questions had not beenincluded in the initial survey given to residents living near them. Park users and residents withina 2-mile radius were sampled and interviewed both before and after the park improvements(note that two different samples of people were drawn at the two time points). Because this isan observational study, survey respondents are not (and cannot be) randomized to live in acertain area or use a certain park; therefore, differences in the respondents’ characteristics,which in a randomized study would likely be null, might in part explain the observedintervention effect.
Propensity score weighting is an effective way of eliminating the differences in the observedcharacteristics (such as age, gender, and race) between survey respondents sampled at anintervention park at follow-up and respondents sampled at a control park at follow-up.Regression models rely too heavily on the linear assumption and are highly sensitive to modelspecification, such as the inclusion of important interaction terms. Propensity score weightingdoes not make linear assumptions and is more robust to model specification. The propensityscore weights were fitted using the R package TWANG8. Four distinct groups of respondentswere compared: those sampled at intervention parks at follow-up (the “treated” group), thosesampled at intervention parks at baseline, those sampled at control parks at follow-up, andthose sampled at control parks at baseline. Because the respondents of the treated group differedfrom the respondents of the other three groups with respect to some observed characteristicssuch as age, race, and gender, three propensity score models were run. The obtained propensityscore weights were then used to weight the other three groups of respondents to make themlook like the “treated group” with respect the observed characteristics. The following
Cohen et al. Page 3
Am J Prev Med. Author manuscript; available in PMC 2010 December 1.
NIH
-PA Author Manuscript
NIH
-PA Author Manuscript
NIH
-PA Author Manuscript

respondent characteristics were included in the propensity score model: age, gender, Latinoversus non-Latino, BMI, distance from home to the park, and whether the respondent engagesin moderate to vigorous physical activity at work. The propensity score weights eliminateddifferences with respect to the characteristics between the treated group and the three othergroups. A propensity score weighted logistic regression was then run to assess whether thechanges in the intervention parks were significantly different from the changes in the controlparks over time.
ResultsCharacteristics of parks and respondents
The 10 parks were located in predominantly Latino and African-American and low-incomeneighborhoods (average 31% households in poverty). The parks ranged from 3.4 to 16 acres(mean=8 acres) and served an average of 67,000 people within a 1 mile radius and 210,000people within a 2 mile radius. Parks contained an average of 12 physical activity areas, whichincluded indoor gymnasiums and classrooms as well as baseball and softball diamonds,bleachers, basketball, handball, tennis, and volleyball courts, multi purpose fields,playgrounds, gymnastics areas, and picnic and lawn areas.
Survey respondents included 768 park users and 767 household residents at baseline and 712and 620, respectively, at follow-up. Significantly more Latinos and women were interviewedat follow-up than baseline (p<.0001 and p< .0001, respectively).
Observed park useOverall, the number of people observed using the parks declined from baseline to follow-up.An average of 2000 people were observed using a park per week at baseline, but at follow-uponly 1500 were seen (Figure 1), with the decline in all age groups, except teens. Only threeparks showed increased use at follow-up, with one being a control park where the director hadscheduled additional baseball games that drew extra people. The two intervention parks (# 4and #6) with increased users had added new gymnasiums, rather than upgraded or replacedexisting facilities. The increase in park # 4, however, was less than that of its matchedcomparison park (#3). The number of users increased in park # 6 while they declined in itscomparison park (#5), but at follow-up more people still used the comparison park.
Target areas that were vacant during an observation increased from 57% at baseline to 69% atfollow-up. Meanwhile the number of areas with organized activities also declined, with thelargest decline in the number of organized baseball games, from 27 observed at baseline toonly 9 at follow-up. Parks were observed during the same weeks of the year, but baseball seasonwas shortened at follow-up. There was a decline in organized activities seen from baseline tofollow-up across the 10 parks, with observed organized activities in gymnasiums decliningfrom 35 to 27 and soccer competitions on multipurpose fields declining from 4 to 0. Amongall park users the percentage observed in organized activities declined from 20.1% to 13.0%(from 3,935 to 1,854), accounting for 39% of the total decline in the average number of parkusers.
Reported Park Use and SafetyAt baseline 67.0% of users reported going to the park one or more times per week, and 37.8%said they exercised at least 3 times per week in their leisure time. At follow-up, consistent withthe observed decline in park use, survey respondents reported going to the park less frequentlythan respondents at baseline (50.5% at least once per week) and significantly more reportednever going to the park at all (Figure 2). After accounting for differences in respondentcharacteristics, the propensity score analysis showed that the decline in observed park use for
Cohen et al. Page 4
Am J Prev Med. Author manuscript; available in PMC 2010 December 1.
NIH
-PA Author Manuscript
NIH
-PA Author Manuscript
NIH
-PA Author Manuscript
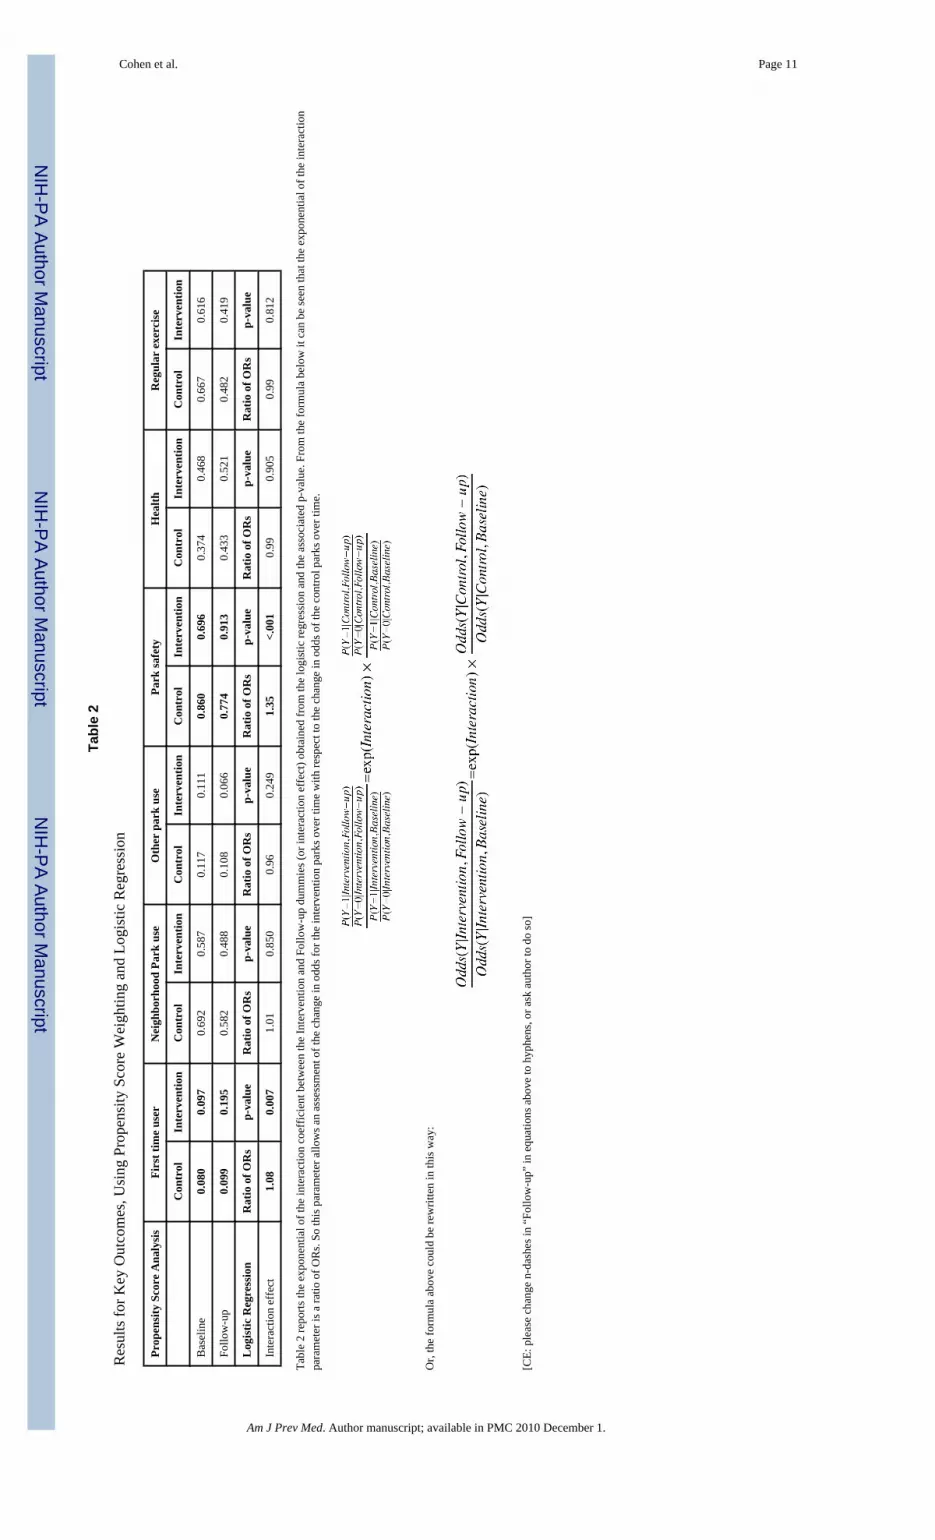
the intervention parks was not significantly different from the decline in park use in the controlparks, even though the overall decline in park use over time was significantly different fromzero. Thus, improvements in intervention parks did not result in increased park use and physicalactivity. However, the percentage of respondents who had visited the park for the first timewithin the past 12 months at follow-up doubled for intervention parks compared to less than25% for parks that were not improved. Meanwhile, the proportion of respondents reportinggoing to parks other than their neighborhood park did not change significantly, so the declinein park use could not be explained by increased visits to other parks. Moreover, after accountingfor differences in respondent characteristics, both intervention and control parks experienceda significant decline in the percentage of respondents reporting exercising at least three timesper week—from 67% to 48% in control parks and from 62% to 42% in intervention parks. Thedecline in the intervention parks over time, however, was not significantly different from thedecline experienced by the control parks (Table 2).
Perceptions of park safety from baseline to follow-up improved among intervention park usersand neighborhood residents; while it decreased for the control parks. This was a significantchange; however, it was not correlated with observed park use or self-reported exercise.
DiscussionGiven the large investments in improving park facilities, the lack of increased use in the parkswas disappointing. In 2 of the 3 parks with completely new facilities that did not replace orupgrade previous ones, there was a small increase in users. The numbers of users in therespective comparison parks which did not have new facilities, however, was still higher. Thegeneral decline in park use and in the amount of exercise reported by respondents over time isparticularly distressing when a major source of health problems and chronic diseases stem froman energy imbalance, which theoretically could be addressed in part by increasing physicalactivity. Given that declines occurred in both intervention and comparison parks, these seculartrends appear to be unrelated to park improvements. The findings of this study arecounterintuitive until one examines other changes that occurred concurrently with facilityimprovements. During the study period the Dept. of Recreation and Parks suffered budget cutsthat led to reduced programming. This resulted in reduced hours for several gymnasiums, andone gym reduced hours as a consequence of gang intimidation. Another park shortened itsbaseball season, which attracted both players and hundreds of spectators. Subsequently, withreduced hours of operation and fewer organized programs and events, lower attendance wouldbe expected regardless of new park facilities. An estimated 39% of the decline in park userscan be directly attributable to a reduced number of organized programs, with the remainingdecline being indirectly related, with fewer accompanying friends and family who might useplay areas or other parts of the parks concurrently. Other reasons for the remaining decline inpark use could be due to competing demands, other entertainment or leisure opportunities, oreven the economic recession, which was concurrent with much of the follow-up period.
Even with reduced park use and programming, respondents at intervention parks perceivedthem as being safer than at baseline and being safer than comparison parks. Perhaps the newlook of the buildings and facilities contributed to this perception. Meanwhile, parks with lowerratings of safety were often used more frequently than parks with higher safety ratings;suggesting that increasing park safety in itself is not sufficient to attract people to parks. In acomparison park which had the lowest safety ratings and a shooting/attempted murder incident,park visits actually increased. This increase was attributable to the scheduling of additionalbaseball games. Factors, such as programming, staffing, and outreach, thus appear to play alarger role in park use than safety.
Cohen et al. Page 5
Am J Prev Med. Author manuscript; available in PMC 2010 December 1.
NIH
-PA Author Manuscript
NIH
-PA Author Manuscript
NIH
-PA Author Manuscript
Community participation was built into the design and plan for park improvements, but waslimited to initial plans and did not continue once they were approved. Because the duration offacility construction was between 1 and 2 years, any potential advantage of the communityparticipation component may have been diluted by the length of time between facilitydevelopment and completion.
Study LimitationsBecause of the lengthy time span between baseline and follow-up measures it is possible thatfactors beyond the scope of the study contributed to the decline in park use. Observations werelimited to a single week in a single season at each time period, and if changes occurred in otherseasons, they would have been missed. Although having additional random measures over anextended period of time would provide a more representative evaluation, the logistics and costsof assembling field staff to work intermittently made this infeasible.
Other BarriersFew of the parks were doing any extensive outreach or marketing. Most only published abrochure on their offerings that was available at the park office and not widely distributed,except to local public schools. Public parks are considered public goods with a purpose ofsupplying a place for recreation and leisure and they are traditionally not supposed to competewith the private sector9: thus their personnel usually do not have the skill sets to recruit parkusers. In addition, parks typically subsidize recreation programs, so there is little financialincentive to develop more programs and fill them.
Rapid changes in technology and communications have occurred in our society recently, andthe increasing accessibility and convenience of stimulating sedentary behaviors are factorswith which outdoor and active recreational programs must compete. Attracting people toimproved park venues may not be successful unless the physical changes are so novel andremarkable that these alone would draw people to them. Multifaceted approaches that couplemarketing, programming, and other outreach efforts are likely needed to ensure that facilityuse is optimized and that the full benefits of investing in parks will accrue to local residents.With sedentary living becoming so easy and increasingly attractive, the challenge to parks andrecreation professionals to promote active living will only increase, particularly as the decliningeconomy forces even further funding reductions for park programming and outreach.
AcknowledgmentsThis study was supported by NIEHS grant # P50ES012383-05.
References1. CDC. BRFSS. 2005.
http://apps.nccd.cdc.gov/brfss/list.asp?cat=PA&yr=2005&qkey=4418&state=All2. Troiano RP, Berrigan D, Dodd KW, Mâsse LC, Tilert T, McDowell M. Physical activity in the United
States measured by accelerometer. Med Sci Sports Exerc 2008;40(1):181–8. [PubMed: 18091006]3. Romero AJ. Low-income neighborhood barriers and resources for adolescents’ physical activity. J
Adolesc Health 2005;36(3):253–9. [PubMed: 15737782]4. Gordon-Larsen P, Nelson MC, Page P, Popkin BM. Inequality in the built environment underlies key
health disparities in physical activity and obesity. Pediatrics 2006;117(2):417–24. [PubMed:16452361]
5. Brown LD. People-centered development and participatory research. Harv Educ Rev 1985;55(1):69–75.
Cohen et al. Page 6
Am J Prev Med. Author manuscript; available in PMC 2010 December 1.
NIH
-PA Author Manuscript
NIH
-PA Author Manuscript
NIH
-PA Author Manuscript

6. McKenzie TL, Cohen DA, Sehgal A, Williamson S, Golinelli D. System for Observing Parks andRecreation in Communities (SOPARC): Reliability and feasibility measures. Jl of Physical Activityand Health 2006;3(Suppl 1):S208–S222.
7. Cohen, D.; Setodji, C.; Marsh, T.; Ward, P.; Evenson, K.; Lapham, S., et al. Active Living Research.San Diego: A Day in the Life of a Park: Validation of SOPARC (System for Observing Play andRecreation in Communities).
8. Ridgeway, G.; McCaffrey, DF.; Morral, AR. R vignette. Santa Monica, CA: RAND; 2006. Toolkit forWeighting and Analysis of Nonequivalent Groups: A tutorial for the twang package.
9. Kaczynski AT. A more tenable marketing for leisure services and studies. Leisure Sciences 2008;30(3):253–272.
Cohen et al. Page 7
Am J Prev Med. Author manuscript; available in PMC 2010 December 1.
NIH
-PA Author Manuscript
NIH
-PA Author Manuscript
NIH
-PA Author Manuscript

Figure 1.Changes in park use from baseline to follow-up by age group, aggregate results for all ten parksBaseline: Avg of 2000 persons observed per parkFollow-up: Avg of 1500 persons observed per park
Cohen et al. Page 8
Am J Prev Med. Author manuscript; available in PMC 2010 December 1.
NIH
-PA Author Manuscript
NIH
-PA Author Manuscript
NIH
-PA Author Manuscript

Figure 2.Reported frequency of park use at baseline and follow-up by park users and residents,aggregated for all ten parks.
Cohen et al. Page 9
Am J Prev Med. Author manuscript; available in PMC 2010 December 1.
NIH
-PA Author Manuscript
NIH
-PA Author Manuscript
NIH
-PA Author Manuscript
NIH
-PA Author Manuscript
NIH
-PA Author Manuscript
NIH
-PA Author Manuscript
Cohen et al. Page 10
Tabl
e 1
Park
and
Com
mun
ity C
hara
cter
istic
s (Pa
ired
park
s are
in th
e sa
me
cons
ecut
ive
shad
ing,
“a”
is a
com
paris
on p
ark,
“b”
inte
rven
tion)
and
Res
pond
ent
Cha
ract
eris
tics
Acr
es#
of fa
cilit
ies
% W
hite
% L
atin
o%
Bla
ck%
Asi
an%
Hou
seho
lds i
n po
vert
y (1
999)
% <
18
% >
60
Park
1 C
ompa
rison
16.0
172
6531
244
.342
.26.
3
Park
1 In
terv
entio
n9.
017
065
340
36.1
38.1
10.7
Park
2 C
ompa
rison
3.4
81
950
454
.938
.08.
0
Park
2 In
terv
entio
n4.
27
580
212
35.6
25.8
15.8
Park
3 C
ompa
rison
8.5
120
1188
016
.626
.321
.8
Park
3 In
terv
entio
n8.
116
121
751
16.3
28.8
16.6
Park
4 C
ompa
rison
6.4
112
940
331
.931
.714
.0
Park
4 In
terv
entio
n6.
911
586
52
41.2
41.9
6.8
Park
5 C
ompa
rison
9.0
1026
523
1723
.921
.310
.9
Park
5 In
terv
entio
n10
.09
2755
111
9.8
29.7
14.6
Park
Use
rsR
esid
ents
Bas
elin
e n
=822
Follo
w-u
p n
=714
Bas
elin
e n
=81
Follo
w-u
p n
=620
Med
ian
Age
a36
.537
.138
.540
.5
%
Mal
e46
.2%
37.5
%37
.8%
28.1
%
Rac
e/Et
hnic
ity
%
Lat
ino
79.2
%90
.5%
74.2
%86
.5%
%
Whi
te3.
3%0.
6%5.
8%0.
7%
%
Bla
ck16
.9%
8.7%
18.8
%12
.3%
%
Asi
an0.
6%0.
3%1.
0%0.
2%
Live
d in
nei
ghbo
rhoo
d ≥
5 ye
ars
54.8
%44
.2%
58.2
%47
.5%
a Surv
eys w
ere
also
con
duct
ed w
ith 5
1 pe
ople
who
wer
e no
t cat
egor
ized
as e
ither
a re
side
nt o
r a p
ark
user
Am J Prev Med. Author manuscript; available in PMC 2010 December 1.
NIH
-PA Author Manuscript
NIH
-PA Author Manuscript
NIH
-PA Author Manuscript
Cohen et al. Page 11
Tabl
e 2
Res
ults
for K
ey O
utco
mes
, Usi
ng P
rope
nsity
Sco
re W
eigh
ting
and
Logi
stic
Reg
ress
ion
Prop
ensi
ty S
core
Ana
lysi
sFi
rst t
ime
user
Nei
ghbo
rhoo
d Pa
rk u
seO
ther
par
k us
ePa
rk sa
fety
Hea
lthR
egul
ar e
xerc
ise
Con
trol
Inte
rven
tion
Con
trol
Inte
rven
tion
Con
trol
Inte
rven
tion
Con
trol
Inte
rven
tion
Con
trol
Inte
rven
tion
Con
trol
Inte
rven
tion
Bas
elin
e0.
080
0.09
70.
692
0.58
70.
117
0.11
10.
860
0.69
60.
374
0.46
80.
667
0.61
6
Follo
w-u
p0.
099
0.19
50.
582
0.48
80.
108
0.06
60.
774
0.91
30.
433
0.52
10.
482
0.41
9
Log
istic
Reg
ress
ion
Rat
io o
f OR
sp-
valu
eR
atio
of O
Rs
p-va
lue
Rat
io o
f OR
sp-
valu
eR
atio
of O
Rs
p-va
lue
Rat
io o
f OR
sp-
valu
eR
atio
of O
Rs
p-va
lue
Inte
ract
ion
effe
ct1.
080.
007
1.01
0.85
00.
960.
249
1.35
<.00
10.
990.
905
0.99
0.81
2
Tabl
e 2
repo
rts th
e ex
pone
ntia
l of t
he in
tera
ctio
n co
effic
ient
bet
wee
n th
e In
terv
entio
n an
d Fo
llow
-up
dum
mie
s (or
inte
ract
ion
effe
ct) o
btai
ned
from
the
logi
stic
regr
essi
on a
nd th
e as
soci
ated
p-v
alue
. Fro
m th
e fo
rmul
a be
low
it c
an b
e se
en th
at th
e ex
pone
ntia
l of t
he in
tera
ctio
npa
ram
eter
is a
ratio
of O
Rs.
So th
is p
aram
eter
allo
ws a
n as
sess
men
t of t
he c
hang
e in
odd
s for
the
inte
rven
tion
park
s ove
r tim
e w
ith re
spec
t to
the
chan
ge in
odd
s of t
he c
ontro
l par
ks o
ver t
ime.
Or,
the
form
ula
abov
e co
uld
be re
writ
ten
in th
is w
ay:
[CE:
ple
ase
chan
ge n
-das
hes i
n “F
ollo
w-u
p” in
equ
atio
ns a
bove
to h
yphe
ns, o
r ask
aut
hor t
o do
so]
Am J Prev Med. Author manuscript; available in PMC 2010 December 1.