effects of inorganic metabolites of sulphate-reducing ... - mdpi
TRANSCRIPT
Citation: Li, J.; Liu, X.; Zhang, J.;
Zhang, R.; Wang, M.; Sand, W.; Duan,
J.; Zhu, Q.; Zhai, S.; Hou, B. Effects of
Inorganic Metabolites of
Sulphate-Reducing Bacteria on the
Corrosion of AZ31B and AZ63B
Magnesium Alloy in 3.5 wt.% NaCl
Solution. Materials 2022, 15, 2212.
https://doi.org/10.3390/ma15062212
Academic Editor: Pavel Lukác
Received: 10 January 2022
Accepted: 8 March 2022
Published: 17 March 2022
Publisher’s Note: MDPI stays neutral
with regard to jurisdictional claims in
published maps and institutional affil-
iations.
Copyright: © 2022 by the authors.
Licensee MDPI, Basel, Switzerland.
This article is an open access article
distributed under the terms and
conditions of the Creative Commons
Attribution (CC BY) license (https://
creativecommons.org/licenses/by/
4.0/).
materials
Article
Effects of Inorganic Metabolites of Sulphate-Reducing Bacteriaon the Corrosion of AZ31B and AZ63B Magnesium Alloy in3.5 wt.% NaCl SolutionJinrong Li 1,2,3, Xin Liu 2,3,*, Jie Zhang 1,3,* , Ruiyong Zhang 1,3,*, Mingxing Wang 1,3, Wolfgang Sand 4,5,6 ,Jizhou Duan 1,3 , Qingjun Zhu 1,3 , Shenbao Zhai 7 and Baorong Hou 1,3
1 Key Laboratory of Marine Environmental Corrosion and Biofouling, Institute of Oceanology,Chinese Academy of Sciences, Qingdao 266071, China; [email protected] (J.L.);[email protected] (M.W.); [email protected] (J.D.); [email protected] (Q.Z.);[email protected] (B.H.)
2 College of Materials Science and Engineering, Qingdao University of Science and Technology,Qingdao 266042, China
3 Open Studio for Marine Corrosion and Protection, Pilot National Laboratory for Marine Science andTechnology, Qingdao 266273, China
4 Institute of Biosciences, University of Mining and Technology, 09599 Freiberg, Germany;[email protected]
5 Department of Aquatic Biotechnology, University of Duisburg-Essen, 45141 Essen, Germany6 Textile Pollution Controlling Engineering Center of Ministry of Environmental Protection,
College of Environmental Science and Engineering, Donghua University, Shanghai 200051, China7 Zibo Deyuan Metal Material Co., Ltd., Zibo 200051, China; [email protected]* Correspondence: [email protected] (X.L.); [email protected] (J.Z.); [email protected] (R.Z.);
Tel.: +86-18366235518 (X.L.); +86-532-82898851 (J.Z.); +86-532-82898851 (R.Z.)
Abstract: This study seeks prevent and alleviate the failure of magnesium alloy anodes in pipelines,which we suspect is a problem related to SRB. The electrochemical corrosion behaviour of two kindsof magnesium alloys, AZ31B and AZ63B, in 3.5 wt.% NaCl solution with sulphide or phosphide—thetwo main inorganic metabolites of sulphate-reducing bacteria—were studied by electrochemicaltests combined with other characterisation methods such as scanning electron microscopy and X-raydiffraction. The results show that the corrosion film formed by inorganic metabolites of SRB’s initialstage of corrosion (1–3 d) can lead to the corrosion of magnesium alloys. However, the loose andporous corrosion product film cannot protect the substrate effectively. The inorganic metabolitesin the solution can accelerate the corrosion of the surface of magnesium alloy after the corrosionproducts have fallen off. This study provides a theoretical basis for alleviating the premature failureof magnesium alloy anodes and for corrosion protection in the future.
Keywords: magnesium alloy; sulphate-reducing bacteria; inorganic metabolites; electrochemicalimpedance spectroscopy; corrosion
1. Introduction
There is a wide range of environments where microbiologically influenced corrosion(MIC) can occur. Due to the widespread presence of corrosive microorganisms, manymetallic materials may be subjected to microbial corrosion [1,2]. Sulphate-reducing bacteria(SRB) account for more than 50% of all cases of microbiologically influenced corrosion [3].The mechanisms of MIC caused by anaerobic microbes have been classified into two maintypes [4,5]. Type I MIC involves extra-cellular electron transfer (EET) and, thus, is alsoknown as EET-MIC [6–8]. Secreted corrosive metabolites such as inorganic and organicacids can also cause MIC. Thus, they are also called Type II MIC or metabolite-MIC (M-MIC) [9]. However, it is still difficult to determine the leading factors of corrosion in theMIC processes because multiple species and their metabolites may be involved [10,11].
Materials 2022, 15, 2212. https://doi.org/10.3390/ma15062212 https://www.mdpi.com/journal/materials
Materials 2022, 15, 2212 2 of 15
Thus, the influence of different microbial metabolites on the metal corrosion process has tobe explored and clarified.
There are many metabolic modes of sulphate-reducing bacteria, and the anabolism ofdifferent species is also quite different. Some metabolites, common to various SRB, suchas sulphide, organic acids, and oxidising agents, can be detected through various analysismethods [12]. These inorganic metabolites are mainly sulphide produced by microbialsulphate reduction. Some accelerate the corrosion of the matrix by reducing phosphate tophosphide on the metal surface. The phosphide causes significant corrosion [13,14].
Magnesium alloys are known as “the green engineering material of the 21st century”.Their density is approximately 1.7−2 g/cm3, which provides an excellent applicationperformance as the lightest metallic structural material currently available. As a sacrificialanode material, magnesium alloys are very susceptible to corrosion due to their highchemical activity, which restricts their use on a large scale. Mg also has advantagesdue to high chemical activity, negative electrode potential, high driving voltage, anduniquely high specific strength. Because of the advantages mentioned above, magnesiumanodes have been widely used for cathodic protection of buried pipelines. With thecontinuing development of offshore oil and gas installations, their corrosion problemshave received considerably increased attention. The use of magnesium alloy anodes forcathodic protection is also an important research topic. However, in practical engineeringapplications, engineers often find that the current efficiency of magnesium anodes is toolow. They often fail to achieve the desired protective effect and the danger of this isthat it may result in failure. As this aspect of the research is needed, we hypothesizethat the failure of the dissolution corrosion process of magnesium alloy was affected bysulphate-reducing bacteria.
There are two main reasons for the low corrosion resistance of magnesium alloys.First, the density coefficient of the oxide film formed naturally on the surface is less than1, which makes it difficult to form a stable protection for the matrix. The second is themicrogalvanic corrosion caused by the second phase and impurities [15,16]. The corrosionbehaviour of a magnesium alloy is controlled through a slightly superficial protectivelayer [17]. Surface modification is a common method to enhance the corrosion resistance ofmagnesium alloys [18–20]. At present, although many studies have been performed on thesurface corrosion of magnesium alloys, there are only a small number of reports concerningof the influence of SRB metabolites on magnesium alloy. Most studies have focused onthe effects of SRB growth and sulphide production for the corrosion of carbon steel orcopper [21,22]. For example, some studies discuss how extracellular polymeric substances(EPS) can protect Q235 steel from corrosion in the initial stage of the experiment, but itsintrinsic inorganic metabolite sulphide will accelerate corrosion [23,24]. Therefore, it isdifficult to determine the role of SRB metabolites for metal corrosion. Thus, the contributioneffect of different metabolites to the corrosion process needs to be clarified.
The purpose of this study was to determine the influence of inorganic SRB metabolites—phosphorous compounds and sulphides—on the corrosion behaviour of magnesium al-loys by means of electrochemical testing and surface morphology characterisation. Therole of SRB inorganic metabolites on the corrosion properties of magnesium alloys isalso discussed.
2. Materials and Methods2.1. Preparation of Materials
The test materials were commercial 10 mm × 10 mm × 10 mm AZ63B and AZ31Bsacrificial magnesium alloy anodes. The chemical compositions of the two alloys are shownin Table 1. A copper screw (Φ 3 mm) was inserted into one end of the magnesium alloy.After welding the screw with copper wire, the working face was exposed and the restwas sealed with an epoxy resin. According to national standard GB5776-86, the workingface was ground step-by-step to 2000# with sandpaper. After ultrasonic cleaning, theworking face was wiped with anhydrous ethanol. The samples were then rinsed with
Materials 2022, 15, 2212 3 of 15
ultrapure water. All solutions were prepared using analytical reagents obtained fromShanghai Chemical Reagent Co. Ltd., (Shanghai, China). Ultrapure water was Millipore(18.2 MΩ-cm).
Table 1. The chemical composition of two Mg alloy sacrificial anodes (wt.%).
Composition Al Be Si Ca Zn Mn Cu Fe Ce Mg
AZ31B 3.19 0.100 0.020 0.040 0.810 0.334 0.050 0.005 — 95.5
AZ63B 5.30 — — — 2.50 0.150 — — trace 92.1
—: no detection or below detection limit.
2.2. Experimental Medium
Synthetic seawater containing 3.5% NaCl was used as a blank control. According tothe usual metabolism of SRB [25], Na2S·9H2O was used to study the effects of different con-centrations of sulphur ion metabolism on magnesium alloys by preparing concentrations of2, 4, and 6 mmol/L, respectively. Since phosphorous compounds are unstable, volatile, andhighly toxic, they are not suitable for electrochemical tests. An appropriate concentrationof PO4
3− was selected for electrochemical tests [26]. pH was between 6.0 and 6.5.
2.3. Electrochemical Corrosion Analyses
The working electrodes were AZ31B or AZ63B magnesium alloy coupons embeddedin epoxy with a 10 mm × 10 mm exposed surface. A saturated calomel electrode (SCE)was used as the reference electrode. A 20 mm × 20 mm platinum plate served as thecounter electrode for the three-electrode system. Electrochemical tests were carried out atroom temperature. The working electrodes were immersed in the 3.5% NaCl solution withdifferent concentrations of sulphides and phosphorous compounds for 14 days. Each testwas started once the open-circuit potential of the system changed by less than 2 mV within300 s. The excitation signal of the electrochemical impedance spectroscopy test was 10 mVsine wave voltage, and the scanning frequency range was 10 mHz~105 Hz. The potentialrange of the polarisation curve scanning was relative open-circuit potential (±250) mVwith a scanning speed of 0.5 mV/s.
2.4. Weight-Loss Testing
The two magnesium alloy samples were soaked in solutions of different concentrationsand taken out after 6 days. Three parallel specimens were tested under each conditionto ensure the reproducibility of the results. According to GB11112-89, the samples werepickled with boiling chromic acid solution for 1 min, then washed with distilled waterimmediately, cleaned in absolute ethanol, and dried using high-purity N2.
2.5. Surface Characterisation
In the process of immersion experiment, the white acicular product were falling offthe electrode surface and sedimented at the bottom. At the end of the 14-day immersion,the precipitate was centrifuged and identified by using an X-ray diffractometer (XRD)after drying. After the experiment, the sample was washed with distilled water andthen scrubbed with alcohol before drying. The electrode was removed and its surfacemorphology was visualised by scanning electron microscopy.
3. Results and Discussion3.1. Open-Circuit Potential
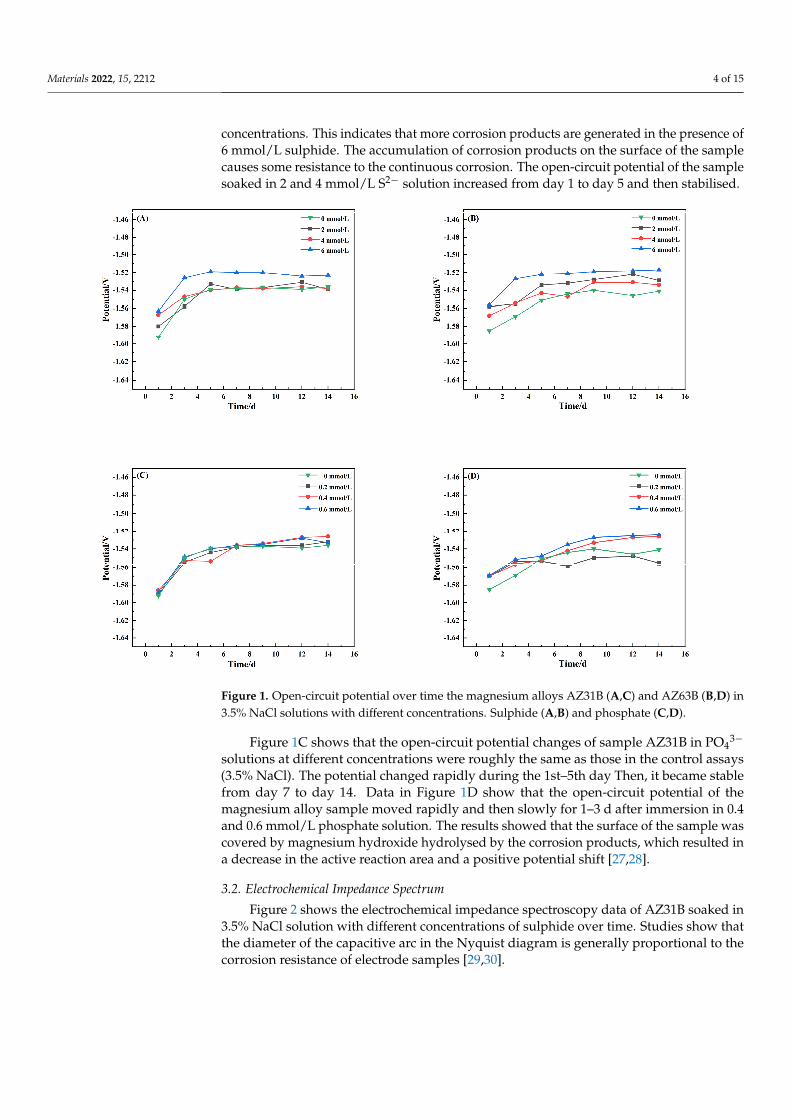
Figure 1A shows that the corrosion potential of the magnesium alloy AZ31B in thepresence of different concentrations of sulphide is similar to that without addition ofsulphide. The corrosion potential tends to be stable after a positive potential shift at thestart. Figure 1B shows that the open-circuit potential of the magnesium alloy AZ63Bsamples at 6 mmol/L sulphide is always higher than that of the magnesium alloy at other
Materials 2022, 15, 2212 4 of 15
concentrations. This indicates that more corrosion products are generated in the presence of6 mmol/L sulphide. The accumulation of corrosion products on the surface of the samplecauses some resistance to the continuous corrosion. The open-circuit potential of the samplesoaked in 2 and 4 mmol/L S2− solution increased from day 1 to day 5 and then stabilised.
Materials 2022, 15, x FOR PEER REVIEW 4 of 15
3. Results and Discussion 3.1. Open-Circuit Potential
Figure 1A shows that the corrosion potential of the magnesium alloy AZ31B in the presence of different concentrations of sulphide is similar to that without addition of sul-phide. The corrosion potential tends to be stable after a positive potential shift at the start. Figure 1B shows that the open-circuit potential of the magnesium alloy AZ63B samples at 6 mmol/L sulphide is always higher than that of the magnesium alloy at other concentra-tions. This indicates that more corrosion products are generated in the presence of 6 mmol/L sulphide. The accumulation of corrosion products on the surface of the sample causes some resistance to the continuous corrosion. The open-circuit potential of the sam-ple soaked in 2 and 4 mmol/L S2− solution increased from day 1 to day 5 and then stabi-lised.
Figure 1. Open-circuit potential over time the magnesium alloys AZ31B (A,C) and AZ63B (B,D) in 3.5% NaCl solutions with different concentrations. Sulphide (A,B) and phosphate (C,D).
Figure 1C shows that the open-circuit potential changes of sample AZ31B in PO43− solutions at different concentrations were roughly the same as those in the control assays (3.5% NaCl). The potential changed rapidly during the 1st–5th day Then, it became stable from day 7 to day 14. Data in Figure 1D show that the open-circuit potential of the mag-nesium alloy sample moved rapidly and then slowly for 1–3 d after immersion in 0.4 and 0.6 mmol/L phosphate solution. The results showed that the surface of the sample was covered by magnesium hydroxide hydrolysed by the corrosion products, which resulted in a decrease in the active reaction area and a positive potential shift [27,28].
3.2. Electrochemical Impedance Spectrum Figure 2 shows the electrochemical impedance spectroscopy data of AZ31B soaked
in 3.5% NaCl solution with different concentrations of sulphide over time. Studies show
Figure 1. Open-circuit potential over time the magnesium alloys AZ31B (A,C) and AZ63B (B,D) in3.5% NaCl solutions with different concentrations. Sulphide (A,B) and phosphate (C,D).
Figure 1C shows that the open-circuit potential changes of sample AZ31B in PO43−
solutions at different concentrations were roughly the same as those in the control assays(3.5% NaCl). The potential changed rapidly during the 1st–5th day Then, it became stablefrom day 7 to day 14. Data in Figure 1D show that the open-circuit potential of themagnesium alloy sample moved rapidly and then slowly for 1–3 d after immersion in 0.4and 0.6 mmol/L phosphate solution. The results showed that the surface of the sample wascovered by magnesium hydroxide hydrolysed by the corrosion products, which resulted ina decrease in the active reaction area and a positive potential shift [27,28].
3.2. Electrochemical Impedance Spectrum
Figure 2 shows the electrochemical impedance spectroscopy data of AZ31B soaked in3.5% NaCl solution with different concentrations of sulphide over time. Studies show thatthe diameter of the capacitive arc in the Nyquist diagram is generally proportional to thecorrosion resistance of electrode samples [29,30].
Materials 2022, 15, 2212 5 of 15
Materials 2022, 15, x FOR PEER REVIEW 5 of 15
that the diameter of the capacitive arc in the Nyquist diagram is generally proportional to the corrosion resistance of electrode samples [29,30].
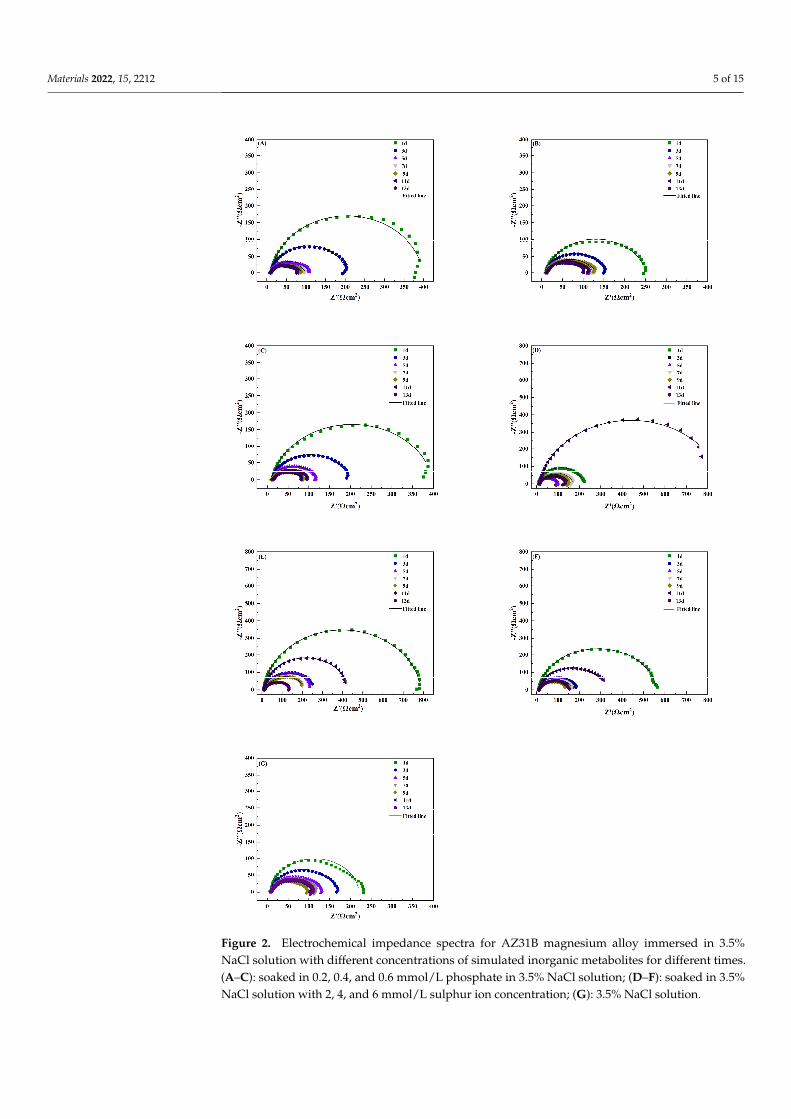
Figure 2. Electrochemical impedance spectra for AZ31B magnesium alloy immersed in 3.5% NaCl solution with different concentrations of simulated inorganic metabolites for different times. (A–C): soaked in 0.2, 0.4, and 0.6 mmol/L phosphate in 3.5% NaCl solution; (D–F): soaked in 3.5% NaCl solution with 2, 4, and 6 mmol/L sulphur ion concentration; (G): 3.5% NaCl solution.
Figure 2. Electrochemical impedance spectra for AZ31B magnesium alloy immersed in 3.5%NaCl solution with different concentrations of simulated inorganic metabolites for different times.(A–C): soaked in 0.2, 0.4, and 0.6 mmol/L phosphate in 3.5% NaCl solution; (D–F): soaked in 3.5%NaCl solution with 2, 4, and 6 mmol/L sulphur ion concentration; (G): 3.5% NaCl solution.
Materials 2022, 15, 2212 6 of 15
As can be seen in Figure 2A–C, with the increase in soaking time, the arc diameter ofreactance for the AZ31B magnesium alloy in the phosphate solutions repeatedly experi-enced a process of gradually decreasing and then slightly increasing. This is due to theinstability of the attachment of the corrosion products on the sample surface. The reactionresistance increased with the increase in the capacitance arc diameter. It is speculated thatthe corrosion products attached to the electrode surface cause an increase in the resistanceof corrosion. Due to the shedding effects of corrosion products, part of the sample surfacebecame exposed to the solution, which aggravated local corrosion. Consequently, thecapacitive arc diameter was reduced. Compared with impedance diagrams for differentconcentrations, the arc reactance of the sample in phosphate solution of 0.4 mmol/L wassignificantly smaller than that of other concentrations. It indicates that the magnesium alloyis more susceptible to corrosion at a phosphate concentration of 0.4 mmol/L. As shown inFigure 2D–F, the magnesium alloy sample also exhibited a phenomenon of repeated arcchanges for an addition of 3.5% NaCl solution with different concentrations of sulphide.This finding further proves that corrosion products of magnesium alloys are unstable.These adhere loosely to the substrate surface and cannot inhibit corrosion effectively.
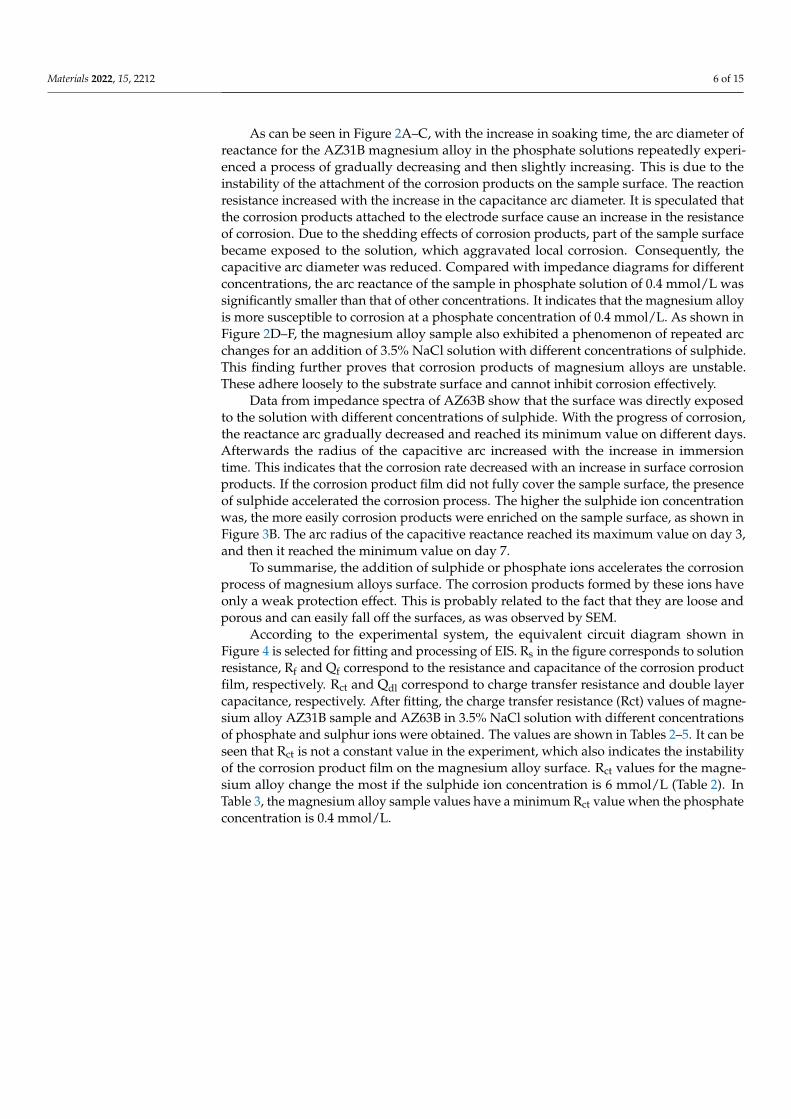
Data from impedance spectra of AZ63B show that the surface was directly exposedto the solution with different concentrations of sulphide. With the progress of corrosion,the reactance arc gradually decreased and reached its minimum value on different days.Afterwards the radius of the capacitive arc increased with the increase in immersiontime. This indicates that the corrosion rate decreased with an increase in surface corrosionproducts. If the corrosion product film did not fully cover the sample surface, the presenceof sulphide accelerated the corrosion process. The higher the sulphide ion concentrationwas, the more easily corrosion products were enriched on the sample surface, as shown inFigure 3B. The arc radius of the capacitive reactance reached its maximum value on day 3,and then it reached the minimum value on day 7.
To summarise, the addition of sulphide or phosphate ions accelerates the corrosionprocess of magnesium alloys surface. The corrosion products formed by these ions haveonly a weak protection effect. This is probably related to the fact that they are loose andporous and can easily fall off the surfaces, as was observed by SEM.
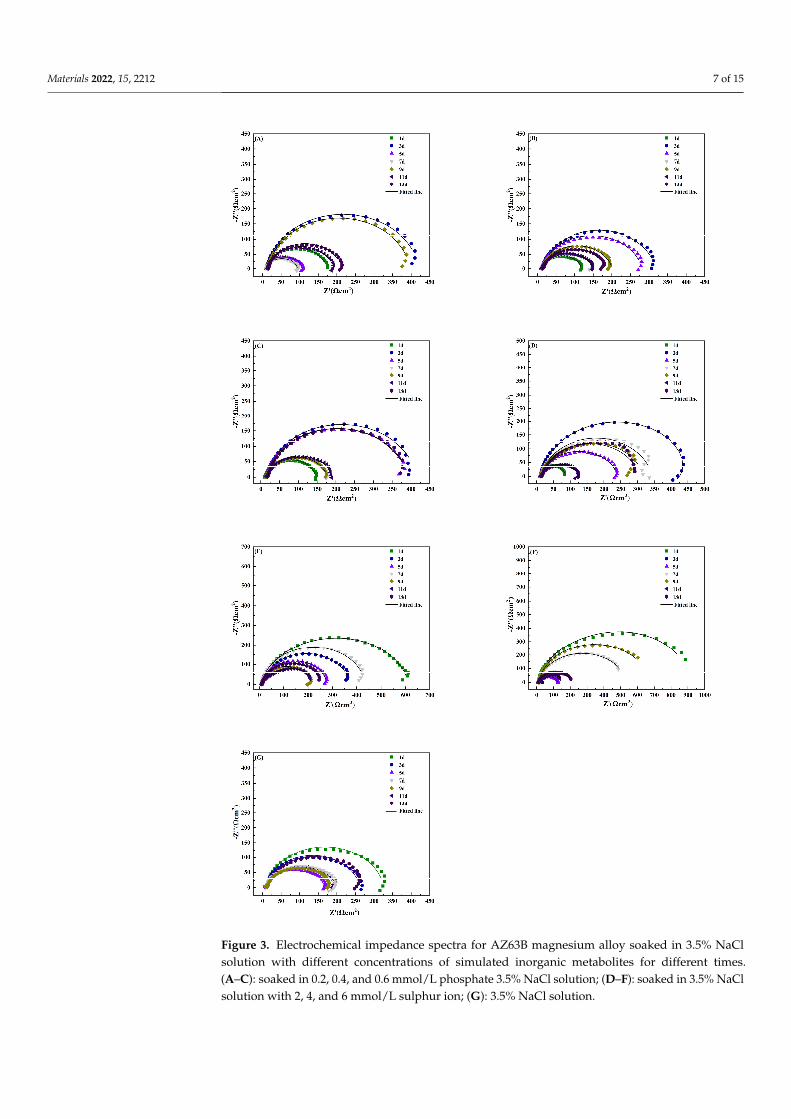
According to the experimental system, the equivalent circuit diagram shown inFigure 4 is selected for fitting and processing of EIS. Rs in the figure corresponds to solutionresistance, Rf and Qf correspond to the resistance and capacitance of the corrosion productfilm, respectively. Rct and Qdl correspond to charge transfer resistance and double layercapacitance, respectively. After fitting, the charge transfer resistance (Rct) values of magne-sium alloy AZ31B sample and AZ63B in 3.5% NaCl solution with different concentrationsof phosphate and sulphur ions were obtained. The values are shown in Tables 2–5. It can beseen that Rct is not a constant value in the experiment, which also indicates the instabilityof the corrosion product film on the magnesium alloy surface. Rct values for the magne-sium alloy change the most if the sulphide ion concentration is 6 mmol/L (Table 2). InTable 3, the magnesium alloy sample values have a minimum Rct value when the phosphateconcentration is 0.4 mmol/L.
Materials 2022, 15, 2212 7 of 15
Materials 2022, 15, x FOR PEER REVIEW 7 of 16
Figure 3. Electrochemical impedance spectra for AZ63B magnesium alloy soaked in 3.5% NaCl so-lution with different concentrations of simulated inorganic metabolites for different times. (A–C): soaked in 0.2, 0.4, and 0.6 mmol/L phosphate 3.5% NaCl solution; (D−F): soaked in 3.5% NaCl solu-tion with 2, 4, and 6 mmol/L sulphur ion; (G): 3.5% NaCl solution.
Figure 3. Electrochemical impedance spectra for AZ63B magnesium alloy soaked in 3.5% NaClsolution with different concentrations of simulated inorganic metabolites for different times.(A–C): soaked in 0.2, 0.4, and 0.6 mmol/L phosphate 3.5% NaCl solution; (D–F): soaked in 3.5% NaClsolution with 2, 4, and 6 mmol/L sulphur ion; (G): 3.5% NaCl solution.
Materials 2022, 15, 2212 8 of 15Materials 2022, 15, x FOR PEER REVIEW 8 of 15
Figure 4. Schematic diagram of equivalent circuit derived from EIS results.
Table 2. Rct values obtained by EIS fitting of magnesium alloy AZ31B immersed in 3.5% NaCl solu-tion with different concentrations of S2−.
Immersion Time (d) 2 mmol·L−1 4 mmol·L−1 6 mmol·L−1 1 201.8 764.4 554.2 3 83.30 249.6 203.8 5 83.16 241.3 160.8 7 157.7 47.21 159.6 9 138.0 41.43 132.7
11 409.8 346.5 312.3 13 121.4 123.1 144.4
Table 3. Rct values obtained by EIS fitting of magnesium alloy AZ63B immersed in 3.5% NaCl solu-tion with different concentrations of S2−.
Immersion Time (d) 2 mmol·L−1 4 mmol·L−1 6 mmol·L−1 1 62.63 605.5 885.9 3 430.4 358.8 39.94 5 227.5 268.8 113.9 7 329.3 422.4 526.1 9 292.5 201.5 662.1
11 110.4 60.71 149.8 13 301.2 246.0 198.6
Table 4. Rct values obtained by EIS fitting of magnesium alloy AZ31B immersed in 3.5% NaCl solu-tion with different concentrations of PO43−.
Immersion Time (d) 0.2 mmol·L−1 0.4 mmol·L−1 0.6 mmol·L−1 1 389.4 219.0 381.8 3 191.4 140.9 184.8 5 96.47 102.3 104.9 7 83.56 112.8 74.18 9 73.56 118.4 74.90
11 63.05 89.03 70.85 13 58.01 99.82 84.81
Figure 4. Schematic diagram of equivalent circuit derived from EIS results.
Table 2. Rct values obtained by EIS fitting of magnesium alloy AZ31B immersed in 3.5% NaClsolution with different concentrations of S2−.
Immersion Time (d) 2 mmol·L−1 4 mmol·L−1 6 mmol·L−1
1 201.8 764.4 554.23 83.30 249.6 203.85 83.16 241.3 160.87 157.7 47.21 159.69 138.0 41.43 132.711 409.8 346.5 312.313 121.4 123.1 144.4
Table 3. Rct values obtained by EIS fitting of magnesium alloy AZ63B immersed in 3.5% NaClsolution with different concentrations of S2−.
Immersion Time (d) 2 mmol·L−1 4 mmol·L−1 6 mmol·L−1
1 62.63 605.5 885.93 430.4 358.8 39.945 227.5 268.8 113.97 329.3 422.4 526.19 292.5 201.5 662.111 110.4 60.71 149.813 301.2 246.0 198.6
Table 4. Rct values obtained by EIS fitting of magnesium alloy AZ31B immersed in 3.5% NaClsolution with different concentrations of PO4
3−.
Immersion Time (d) 0.2 mmol·L−1 0.4 mmol·L−1 0.6 mmol·L−1
1 389.4 219.0 381.83 191.4 140.9 184.85 96.47 102.3 104.97 83.56 112.8 74.189 73.56 118.4 74.9011 63.05 89.03 70.8513 58.01 99.82 84.81
Materials 2022, 15, 2212 9 of 15
Table 5. Rct values obtained by EIS fitting of magnesium alloy AZ63B immersed in 3.5% NaClsolution with different concentrations of PO4
3−.
Immersion Time (d) 0.2 mmol·L−1 0.4 mmol·L−1 0.6 mmol·L−1
1 158.6 105.0 133.63 381.3 305.6 399.45 93.51 268.2 375.97 79.29 134.8 163.19 398.5 185.4 163.311 192.0 135.1 175.313 197.0 165.7 371.0
3.3. Characterisation of Electrochemical Polarisation Curves
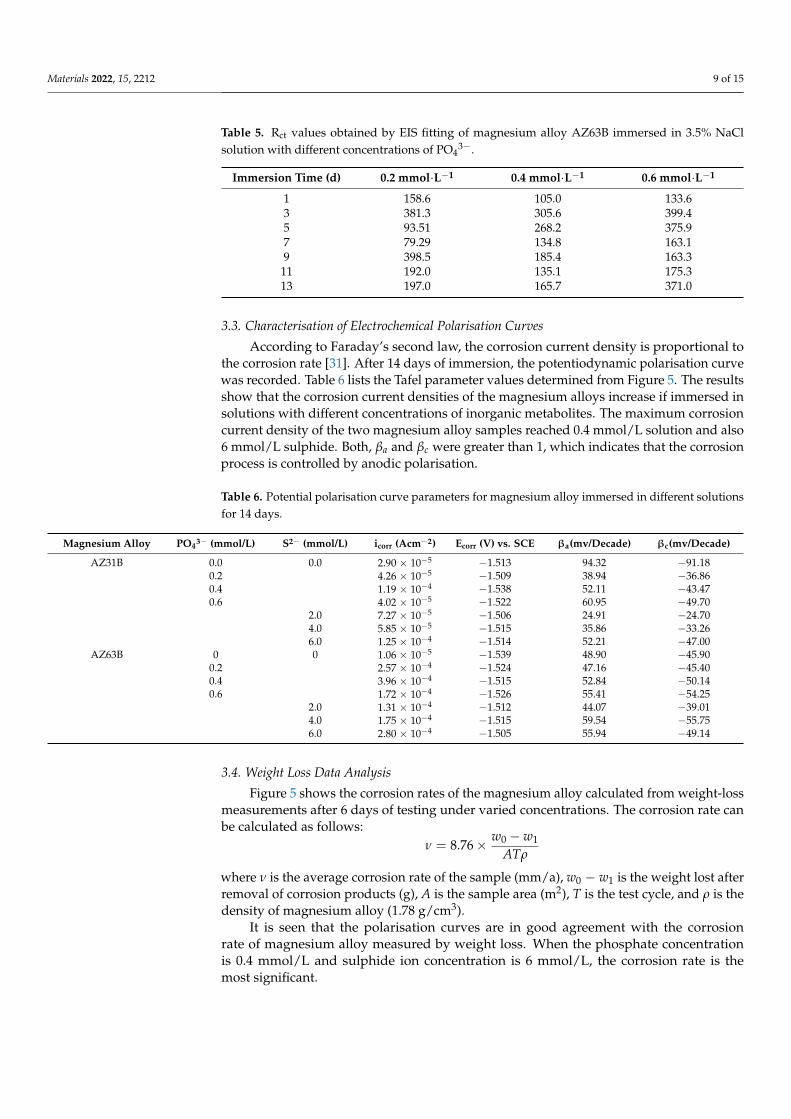
According to Faraday’s second law, the corrosion current density is proportional tothe corrosion rate [31]. After 14 days of immersion, the potentiodynamic polarisation curvewas recorded. Table 6 lists the Tafel parameter values determined from Figure 5. The resultsshow that the corrosion current densities of the magnesium alloys increase if immersed insolutions with different concentrations of inorganic metabolites. The maximum corrosioncurrent density of the two magnesium alloy samples reached 0.4 mmol/L solution and also6 mmol/L sulphide. Both, βa and βc were greater than 1, which indicates that the corrosionprocess is controlled by anodic polarisation.
Table 6. Potential polarisation curve parameters for magnesium alloy immersed in different solutionsfor 14 days.
Magnesium Alloy PO43− (mmol/L) S2− (mmol/L) icorr (Acm−2) Ecorr (V) vs. SCE βa(mv/Decade) βc(mv/Decade)
AZ31B 0.0 0.0 2.90 × 10⁻⁵ −1.513 94.32 −91.180.2 4.26 × 10⁻⁵ −1.509 38.94 −36.860.4 1.19 × 10⁻⁴ −1.538 52.11 −43.470.6 4.02 × 10⁻⁵ −1.522 60.95 −49.70
2.0 7.27 × 10⁻⁵ −1.506 24.91 −24.704.0 5.85 × 10⁻⁵ −1.515 35.86 −33.266.0 1.25 × 10⁻⁴ −1.514 52.21 −47.00
AZ63B 0 0 1.06 × 10⁻⁵ −1.539 48.90 −45.900.2 2.57 × 10⁻⁴ −1.524 47.16 −45.400.4 3.96 × 10⁻⁴ −1.515 52.84 −50.140.6 1.72 × 10⁻⁴ −1.526 55.41 −54.25
2.0 1.31 × 10⁻⁴ −1.512 44.07 −39.014.0 1.75 × 10⁻⁴ −1.515 59.54 −55.756.0 2.80 × 10⁻⁴ −1.505 55.94 −49.14
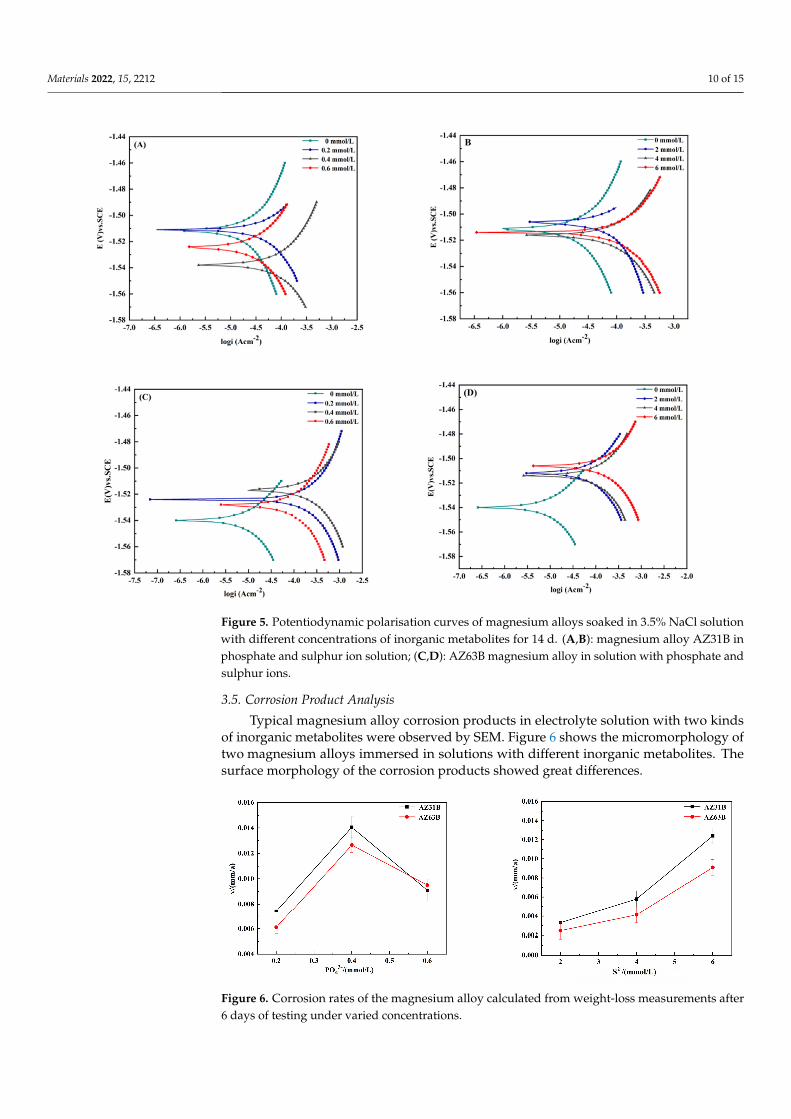
3.4. Weight Loss Data Analysis
Figure 5 shows the corrosion rates of the magnesium alloy calculated from weight-lossmeasurements after 6 days of testing under varied concentrations. The corrosion rate canbe calculated as follows:
ν = 8.76× w0 − w1
ATρ
where ν is the average corrosion rate of the sample (mm/a), w0 − w1 is the weight lost afterremoval of corrosion products (g), A is the sample area (m2), T is the test cycle, and ρ is thedensity of magnesium alloy (1.78 g/cm3).
It is seen that the polarisation curves are in good agreement with the corrosionrate of magnesium alloy measured by weight loss. When the phosphate concentrationis 0.4 mmol/L and sulphide ion concentration is 6 mmol/L, the corrosion rate is themost significant.
Materials 2022, 15, 2212 10 of 15
Materials 2022, 15, x FOR PEER REVIEW 9 of 15
Table 5. Rct values obtained by EIS fitting of magnesium alloy AZ63B immersed in 3.5% NaCl so-lution with different concentrations of PO43−.
Immersion Time (d) 0.2 mmol·L−1 0.4 mmol·L−1 0.6 mmol·L−1 1 158.6 105.0 133.6 3 381.3 305.6 399.4 5 93.51 268.2 375.9 7 79.29 134.8 163.1 9 398.5 185.4 163.3
11 192.0 135.1 175.3 13 197.0 165.7 371.0
3.3. Characterisation of Electrochemical Polarisation Curves According to Faraday’s second law, the corrosion current density is proportional to
the corrosion rate [31]. After 14 days of immersion, the potentiodynamic polarisation curve was recorded. Table 6 lists the Tafel parameter values determined from Figure 5. The results show that the corrosion current densities of the magnesium alloys increase if immersed in solutions with different concentrations of inorganic metabolites. The maxi-mum corrosion current density of the two magnesium alloy samples reached 0.4 mmol/L solution and also 6 mmol/L sulphide. Both, βa and βc were greater than 1, which indicates that the corrosion process is controlled by anodic polarisation.
Figure 5. Potentiodynamic polarisation curves of magnesium alloys soaked in 3.5% NaCl solution with different concentrations of inorganic metabolites for 14 d. (A,B): magnesium alloy AZ31B in phosphate and sulphur ion solution; (C,D): AZ63B magnesium alloy in solution with phosphate and sulphur ions.
Figure 5. Potentiodynamic polarisation curves of magnesium alloys soaked in 3.5% NaCl solutionwith different concentrations of inorganic metabolites for 14 d. (A,B): magnesium alloy AZ31B inphosphate and sulphur ion solution; (C,D): AZ63B magnesium alloy in solution with phosphate andsulphur ions.
3.5. Corrosion Product Analysis
Typical magnesium alloy corrosion products in electrolyte solution with two kindsof inorganic metabolites were observed by SEM. Figure 6 shows the micromorphology oftwo magnesium alloys immersed in solutions with different inorganic metabolites. Thesurface morphology of the corrosion products showed great differences.
Materials 2022, 15, x FOR PEER REVIEW 10 of 15
3.4. Weight Loss Data Analysis Figure 5 shows the corrosion rates of the magnesium alloy calculated from weight-
loss measurements after 6 days of testing under varied concentrations. The corrosion rate can be calculated as follows: 𝜈 = 8.76 × 𝑤 − 𝑤𝐴𝑇𝜌
where 𝜈 is the average corrosion rate of the sample (mm/a), w0–w1 is the weight lost after removal of corrosion products (g), A is the sample area (m2), T is the test cycle, and ρ is the density of magnesium alloy (1.78 g/cm3).
It is seen that the polarisation curves are in good agreement with the corrosion rate of magnesium alloy measured by weight loss. When the phosphate concentration is 0.4 mmol/L and sulphide ion concentration is 6 mmol/L, the corrosion rate is the most signif-icant.
3.5. Corrosion Product Analysis Typical magnesium alloy corrosion products in electrolyte solution with two kinds
of inorganic metabolites were observed by SEM. Figure 6 shows the micromorphology of two magnesium alloys immersed in solutions with different inorganic metabolites. The surface morphology of the corrosion products showed great differences.
Figure 6. Corrosion rates of the magnesium alloy calculated from weight-loss measurements after 6 days of testing under varied concentrations.
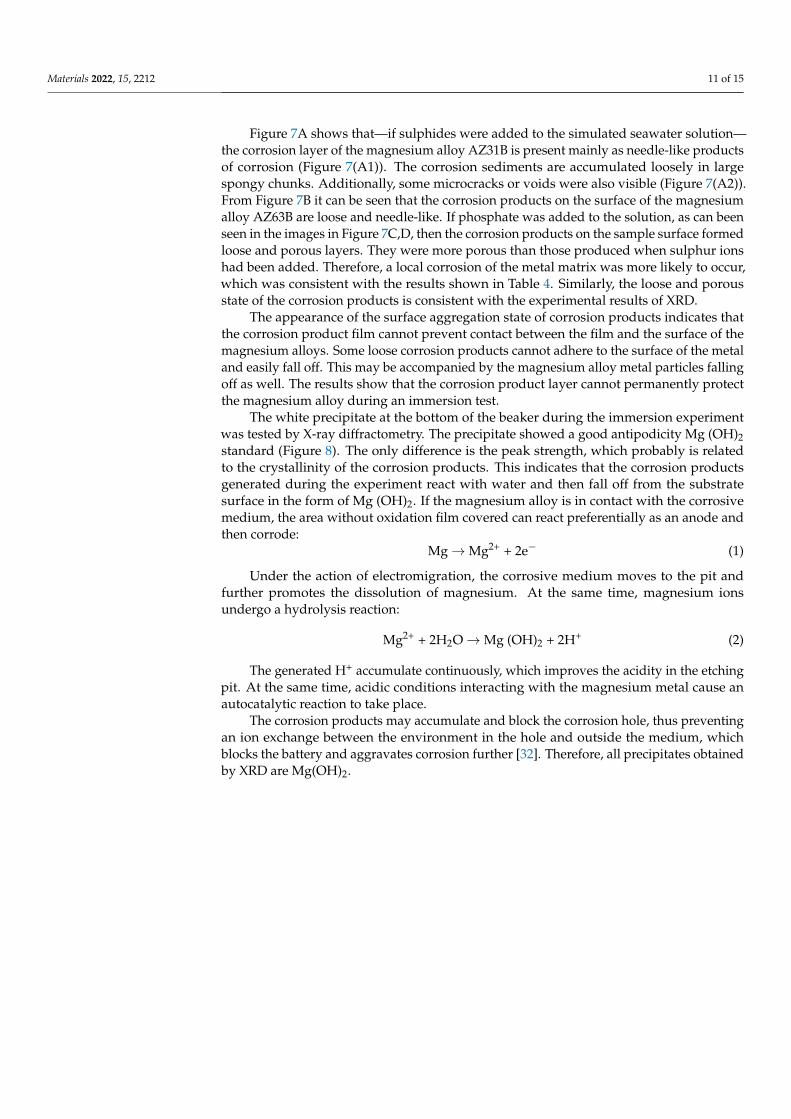
Figure 7A shows that—if sulphides were added to the simulated seawater solution—the corrosion layer of the magnesium alloy AZ31B is present mainly as needle-like prod-ucts of corrosion (Figure 7(A1)). The corrosion sediments are accumulated loosely in large spongy chunks. Additionally, some microcracks or voids were also visible (Figure 7(A2)). From Figure 7B it can be seen that the corrosion products on the surface of the magnesium alloy AZ63B are loose and needle-like. If phosphate was added to the solution, as can been seen in the images in Figure 7C,D, then the corrosion products on the sample surface formed loose and porous layers. They were more porous than those produced when sul-phur ions had been added. Therefore, a local corrosion of the metal matrix was more likely to occur, which was consistent with the results shown in Table 4. Similarly, the loose and porous state of the corrosion products is consistent with the experimental results of XRD.
The appearance of the surface aggregation state of corrosion products indicates that the corrosion product film cannot prevent contact between the film and the surface of the magnesium alloys. Some loose corrosion products cannot adhere to the surface of the metal and easily fall off. This may be accompanied by the magnesium alloy metal particles falling off as well. The results show that the corrosion product layer cannot permanently protect the magnesium alloy during an immersion test.
Figure 6. Corrosion rates of the magnesium alloy calculated from weight-loss measurements after6 days of testing under varied concentrations.
Materials 2022, 15, 2212 11 of 15
Figure 7A shows that—if sulphides were added to the simulated seawater solution—the corrosion layer of the magnesium alloy AZ31B is present mainly as needle-like productsof corrosion (Figure 7(A1)). The corrosion sediments are accumulated loosely in largespongy chunks. Additionally, some microcracks or voids were also visible (Figure 7(A2)).From Figure 7B it can be seen that the corrosion products on the surface of the magnesiumalloy AZ63B are loose and needle-like. If phosphate was added to the solution, as can beenseen in the images in Figure 7C,D, then the corrosion products on the sample surface formedloose and porous layers. They were more porous than those produced when sulphur ionshad been added. Therefore, a local corrosion of the metal matrix was more likely to occur,which was consistent with the results shown in Table 4. Similarly, the loose and porousstate of the corrosion products is consistent with the experimental results of XRD.
The appearance of the surface aggregation state of corrosion products indicates thatthe corrosion product film cannot prevent contact between the film and the surface of themagnesium alloys. Some loose corrosion products cannot adhere to the surface of the metaland easily fall off. This may be accompanied by the magnesium alloy metal particles fallingoff as well. The results show that the corrosion product layer cannot permanently protectthe magnesium alloy during an immersion test.
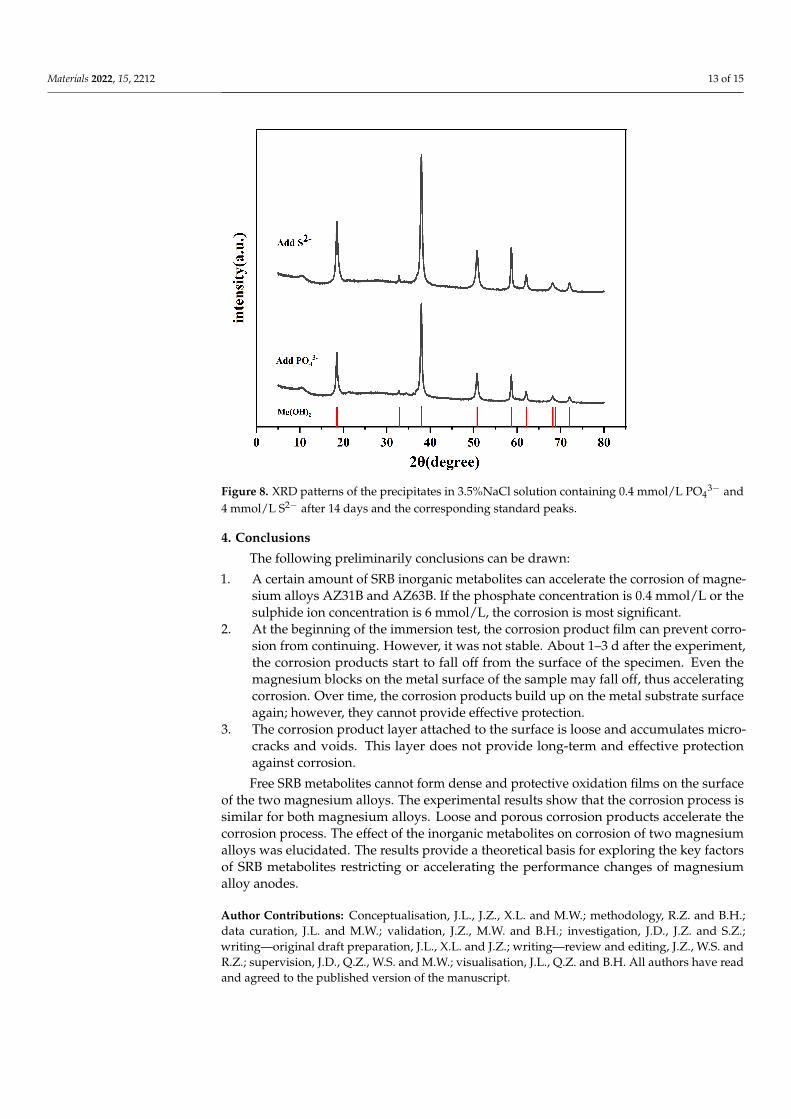
The white precipitate at the bottom of the beaker during the immersion experimentwas tested by X-ray diffractometry. The precipitate showed a good antipodicity Mg (OH)2standard (Figure 8). The only difference is the peak strength, which probably is relatedto the crystallinity of the corrosion products. This indicates that the corrosion productsgenerated during the experiment react with water and then fall off from the substratesurface in the form of Mg (OH)2. If the magnesium alloy is in contact with the corrosivemedium, the area without oxidation film covered can react preferentially as an anode andthen corrode:
Mg→Mg2+ + 2e− (1)
Under the action of electromigration, the corrosive medium moves to the pit andfurther promotes the dissolution of magnesium. At the same time, magnesium ionsundergo a hydrolysis reaction:
Mg2+ + 2H2O→Mg (OH)2 + 2H+ (2)
The generated H+ accumulate continuously, which improves the acidity in the etchingpit. At the same time, acidic conditions interacting with the magnesium metal cause anautocatalytic reaction to take place.
The corrosion products may accumulate and block the corrosion hole, thus preventingan ion exchange between the environment in the hole and outside the medium, whichblocks the battery and aggravates corrosion further [32]. Therefore, all precipitates obtainedby XRD are Mg(OH)2.
Materials 2022, 15, 2212 12 of 15
Materials 2022, 15, x FOR PEER REVIEW 11 of 15
The white precipitate at the bottom of the beaker during the immersion experiment was tested by X-ray diffractometry. The precipitate showed a good antipodicity Mg (OH)2 standard (Figure 8). The only difference is the peak strength, which probably is related to the crystallinity of the corrosion products. This indicates that the corrosion products gen-erated during the experiment react with water and then fall off from the substrate surface in the form of Mg (OH)2. If the magnesium alloy is in contact with the corrosive medium, the area without oxidation film covered can react preferentially as an anode and then cor-rode:
Mg → Mg2+ + 2e− (1)
Figure 7. Influence of different inorganic metabolites of SRB on the morphology of magnesium alloysobserved by SEM. (A1,A2): alloy AZ31B immersed in 2 mmol sulphide ions, (B1,B2): alloy AZ63Bimmersed in 2 mmol sulphide ions, (C1,C2): alloy AZ31B immersed in 0.4 mmol phosphate ions, and(D1,D2): alloy AZ63B immersed in 0.4 mmol phosphate ions.
Materials 2022, 15, 2212 13 of 15
Materials 2022, 15, x FOR PEER REVIEW 12 of 15
Figure 7. Influence of different inorganic metabolites of SRB on the morphology of magnesium al-loys observed by SEM. (A1,A2): alloy AZ31B immersed in 2 mmol sulphide ions, (B1,B2): alloy AZ63B immersed in 2 mmol sulphide ions, (C1,C2): alloy AZ31B immersed in 0.4 mmol phosphate ions, and (D1,D2): alloy AZ63B immersed in 0.4 mmol phosphate ions.
Under the action of electromigration, the corrosive medium moves to the pit and fur-ther promotes the dissolution of magnesium. At the same time, magnesium ions undergo a hydrolysis reaction:
Mg2+ + 2H2O → Mg (OH)2 + 2H+ (2)
The generated H+ accumulate continuously, which improves the acidity in the etch-ing pit. At the same time, acidic conditions interacting with the magnesium metal cause an autocatalytic reaction to take place.
The corrosion products may accumulate and block the corrosion hole, thus prevent-ing an ion exchange between the environment in the hole and outside the medium, which blocks the battery and aggravates corrosion further [32]. Therefore, all precipitates ob-tained by XRD are Mg(OH)2.
Figure 8. XRD patterns of the precipitates in 3.5%NaCl solution containing 0.4 mmol/L PO43− and 4 mmol/L S2− after 14 days and the corresponding standard peaks.
Table 6. Potential polarisation curve parameters for magnesium alloy immersed in different solu-tions for 14 days.
Magnesium Alloy
PO43− (mmol/L)
S2− (mmol/L)
icorr (Acm−2) Ecorr (V) vs. SCE
βa
(mv/Dec-ade)
βc (mv/Dec-
ade) AZ31B 0.0 0.0 2.90 × 10⁻⁵ −1.513 94.32 −91.18
0.2 4.26 × 10⁻⁵ −1.509 38.94 −36.86 0.4 1.19 × 10⁻⁴ −1.538 52.11 −43.47 0.6 4.02 × 10⁻⁵ −1.522 60.95 −49.70 2.0 7.27 × 10⁻⁵ −1.506 24.91 −24.70 4.0 5.85 × 10⁻⁵ −1.515 35.86 −33.26 6.0 1.25 × 10⁻⁴ −1.514 52.21 −47.00
AZ63B 0 0 1.06 × 10⁻⁵ −1.539 48.90 −45.90
Figure 8. XRD patterns of the precipitates in 3.5%NaCl solution containing 0.4 mmol/L PO43− and
4 mmol/L S2− after 14 days and the corresponding standard peaks.
4. Conclusions
The following preliminarily conclusions can be drawn:
1. A certain amount of SRB inorganic metabolites can accelerate the corrosion of magne-sium alloys AZ31B and AZ63B. If the phosphate concentration is 0.4 mmol/L or thesulphide ion concentration is 6 mmol/L, the corrosion is most significant.
2. At the beginning of the immersion test, the corrosion product film can prevent corro-sion from continuing. However, it was not stable. About 1–3 d after the experiment,the corrosion products start to fall off from the surface of the specimen. Even themagnesium blocks on the metal surface of the sample may fall off, thus acceleratingcorrosion. Over time, the corrosion products build up on the metal substrate surfaceagain; however, they cannot provide effective protection.
3. The corrosion product layer attached to the surface is loose and accumulates micro-cracks and voids. This layer does not provide long-term and effective protectionagainst corrosion.
Free SRB metabolites cannot form dense and protective oxidation films on the surfaceof the two magnesium alloys. The experimental results show that the corrosion process issimilar for both magnesium alloys. Loose and porous corrosion products accelerate thecorrosion process. The effect of the inorganic metabolites on corrosion of two magnesiumalloys was elucidated. The results provide a theoretical basis for exploring the key factorsof SRB metabolites restricting or accelerating the performance changes of magnesiumalloy anodes.
Author Contributions: Conceptualisation, J.L., J.Z., X.L. and M.W.; methodology, R.Z. and B.H.;data curation, J.L. and M.W.; validation, J.Z., M.W. and B.H.; investigation, J.D., J.Z. and S.Z.;writing—original draft preparation, J.L., X.L. and J.Z.; writing—review and editing, J.Z., W.S. andR.Z.; supervision, J.D., Q.Z., W.S. and M.W.; visualisation, J.L., Q.Z. and B.H. All authors have readand agreed to the published version of the manuscript.
Materials 2022, 15, 2212 14 of 15
Funding: This paper is supported by the National Natural Science Foundation of China(No. 42076043) and Shandong Provincial Natural Science Foundation (No. ZR2020MD080). Thefunder had no role in the study design, data collection, analysis, decision to publish, and manuscriptpreparation.
Institutional Review Board Statement: Not applicable.
Informed Consent Statement: Not applicable.
Data Availability Statement: All the data are already provided in the main manuscript. Contact thecorresponding author if further explanation is required.
Acknowledgments: We would also like to acknowledge the National Natural Science Foundation ofChina (No. 42076043) and Shandong Provincial Natural Science Foundation (No. ZR2020MD080). Weare also thankful to the Institute of Oceanology, Chinese Academy of Sciences, for providing us witha learning environment. Without this platform to do this work, it would not have been an easy task.
Conflicts of Interest: The authors declare no conflict of interest.
References1. Sherar, B.W.; Power, I.M.; Keech, P.G.; Mitlin, S.; Southam, G.; Shoesmith, D.W. Characterizing the effect of carbon steel exposure
in sulfide containing solutions to microbially induced corrosion. Corros. Sci. 2011, 53, 955–960. [CrossRef]2. Rao, T.S.; Kora, A.J.; Anupkumar, B.; Narasimhan, S.V.; Feser, R. Pitting corrosion of titanium by a freshwater strain of sulphate
reducing bacteria (Desulfovibrio vulgaris). Corros. Sci. 2005, 47, 1071–1084. [CrossRef]3. Wu, J.J.; Zhang, D.; Wang, P.; Cheng, Y.; Sun, S.M.; Sun, Y.; Chen, S. The influence of Desulfovibrio sp. and Pseudoalteromonas sp. on
the corrosion of Q235 carbon steel in natural seawater. Corros. Sci. 2016, 112, 552–562. [CrossRef]4. Zhang, P.Y.; Xu, D.K.; Li, Y.C.; Yang, K.; Gu, T.Y. Electron mediators accelerate the microbiologically influenced corrosion of
304 stainless steel by the Desulfovibrio vulgaris biofilm. Bioelectrochemistry 2015, 101, 14–21. [CrossRef] [PubMed]5. Gu, T.Y.; Jia, R.; Unsal, T.; Xu, D.K. Toward a better understanding of microbiologically influenced corrosion cause by sulfate
reducing bacteria. J. Mater. Sci. Technol. 2018, 35, 631–636. [CrossRef]6. Li, Y.C.; Xu, D.K.; Chen, C.F.; Li, X.G.; Jia, R.; Zhang, D.W.; Wolfgang, S.; Wang, F.H.; Gu, T.Y. Anaerobic microbiologically
influenced corrosion mechanisms interpreted using bioenergetics and bioelectrochemistry: A review. J. Mater. Sci. Technol. 2018,34, 1713–1718. [CrossRef]
7. Jia, R.; Jie, L.T.; Jin, P.; Daniel, J.B.; Xu, D.K.; Gu, T.Y. Effects of biogenic H2S on the microbiologically influenced corrosion ofC1018 carbon steel by sulfate reducing Desulfovibrio vulgaris biofilm. Corros. Sci. 2018, 130, 1–11. [CrossRef]
8. Huang, Y.; Zhou, E.Z.; Jiang, C.Y.; Jia, R.; Liu, S.J.; Xu, D.K.; Gu, T.Y.; Wang, F.H. Endogenous phenazine-1-carboxamide encodinggene PhzH regulated the extracellular electron transfer in biocorrosion of stainless steel by marine Pseudomonas aeruginosa.Electrochem. Commun. 2018, 94, 9–13. [CrossRef]
9. Dou, W.W.; Liu, J.L.; Cai, W.Z.; Wang, D.; Jia, R.; Chen, S.G.; Gu, T.Y. Electrochemical investigation of increased carbon steelcorrosion via extracellular electron transfer by a sulfate reducing bacterium under carbon source starvation. Corros. Sci. 2019, 150,258–267. [CrossRef]
10. Sheng, X.X.; Ting, Y.P.; Pehkonen, S.O. The influence of sulphate-reducing bacteria biofilm on the corrosion of stainless steel AISI316. Corros. Sci. 2007, 49, 2159–2176. [CrossRef]
11. Videla, H.A.; Herrera, L.K. Understanding microbial inhibition of corrosion. A comprehensive overview. Int. Biodeterior. Biodegrad.2009, 63, 896–900. [CrossRef]
12. Voordouw, G.; Niviere, V.; Ferris, F.G.; Fedorak, P.M.; Westlake, D.W. Distribution of hydrogenase genes in Desulfovibrio spp.and their use in identification of species from the oil field environment. Appl. Environ. Microbiol. 1990, 56, 3748–3754. [CrossRef][PubMed]
13. Iverson, W.P. Direct evidence for the cathodic depolarization theory of bacterial Corrosion. Science 1996, 151, 986–988. [CrossRef][PubMed]
14. Glindeman, D.; Eismann, F.; Bergmann, A.; Kuschk, P.; Stottmeister, U. Phosphine by bio-corrosion of phosphide-rich iron.Environ. Sci. Pollut. Res. 1998, 5, 71–74. [CrossRef]
15. Yin, L.Y.; Huang, R.N.; Zhou, W.; Li, L. Analysis of factors affecting hydrogen evolution in Magnesium seawater battery. Chin. J.Power Sources 2011, 21, 259–268.
16. Esmaily, M.; Svensson, J.E.; Fajardo, S.; Birbilis, N.; Frankel, G.S.; Virtanen, S.; Arrabal, R.; Thomas, S.; Johansson, L.G.Fundamentals and advances in magnesium alloy corrosion. Prog. Mater. Sci. 2017, 89, 92–193. [CrossRef]
17. Abbasi, S.; Aliofkhazraei, M.; Mojiri, H.; Mina, A.; Mohammad, A.; Masoud, S. Corrosion behavior of pure Mg and AZ31magnesium alloy. Prot. Met. Phys. Chem. Surf. 2017, 53, 573–578. [CrossRef]
18. Gray-Munro, J.E.; Seguin, C.; Strong, M. Influence of surface modification on the in vitro corrosion rate of magnesium alloy AZ31.J. Biomed. Mater. Res. Part A 2010, 91, 221–230.
Materials 2022, 15, 2212 15 of 15
19. Zhang, T.C.; Zhang, K.M.; Zou, J.X.; Yan, P.; Yang, H.Y.; Song, L.X.; Zhang, X. Surface microstructure and property modificationsin a Mg-8Gd-3Y-0.5Zr magnesium alloy treated by high current pulsed electron beam. J. Alloys Compd. 2019, 788, 231–239.[CrossRef]
20. Yang, G.Z.; Yang, H.W.; Shi, L.; Wang, T.L.; Zhou, W.C.; Zhou, T.; Han, W.; Zhang, Z.Y.; Lu, W.; Hu, J.Z. Enhancing CorrosionResistance, Osteoinduction and Antibacterial Properties by Zn/Sr Additional Surface Modification of Magnesium Alloy. ACSBiomater. Sci. Eng. 2018, 4, 4289–4298. [CrossRef]
21. Duan, J.Z.; Wu, S.R.; Zhang, X.J.; Huang, G.Q.; Du, M.; Hou, B. Corrosion of carbon steel influenced by anaerobic biofilm innatural seawater. Electrochim. Acta 2009, 54, 22–28. [CrossRef]
22. Chen, S.Q.; Zhang, D. Study of corrosion behavior of copper in 3.5 wt.% NaCl solution containing extracellular polymericsubstances of an aerotolerant sulphate-reducing bacteria. Corros. Sci. 2018, 136, 275–284. [CrossRef]
23. Qi, B.; Zhang, D.; Lv, D.D.; Wang, P. Effects of two main metabolites of sulphate-reducing bacteria on the corrosion of Q235 steelsin 3.5 wt.% NaCl media. Corros. Sci. 2012, 65, 405–413.
24. Chen, S.Q.; Wang, P.; Zhang, D. Corrosion behavior of copper under biofilm of sulfate-reducing bacteria. Corros. Sci. 2014, 87,407–415. [CrossRef]
25. Wan, Y.; Zhang, D.; Liu, H.Q.; Li, Y.J.; Hou, B.R. Influence of sulphate-reducing bacteria on environmental parameters and marinecorrosion behavior of Q235 steel in aerobic conditions. Electrochim. Acta 2010, 55, 1528–1534. [CrossRef]
26. Xu, D.; Li, Y.C.; Gu, T.Y. Mechanistic modeling of biocorrosion caused by biofilms of sulfate. Bioelectrochemistry 2016, 110, 52–58.[CrossRef]
27. Wang, N.G.; Wang, R.C.; Peng, C.Q.; Feng, Y.; Chen, B. Effect of hot rolling and subsequent annealing on electrochemical dischargebehavior of AP65 magnesium alloy as anode for seawater activated battery. Corros. Sci. 2012, 64, 17–27. [CrossRef]
28. Wang, N.G.; Wang, R.C.; Peng, C.Q.; Feng, Y. Enhancement of the discharge performance of AP65 magnesium alloy anodes byhot extrusion. Corros. Sci. 2014, 81, 85–95. [CrossRef]
29. Liu, H.W.; Gu, T.Y.; Asif, M.; Zhang, G.A.; Liu, H.F. The corrosion behavior and mechanism of carbon steel induced by extracellularpolymeric substances of iron-oxidizing bacteria. Corros. Sci. 2017, 114, 102–111. [CrossRef]
30. Yu, L.; Duan, J.Z.; Du, X.Q.; Huang, Y.L.; Hou, B.R. Accelerated anaerobic corrosion of electroactive sulfate-reducing bacteria byelectrochemical impedance spectroscopy and chronoamperometry. Electrochem. Commun. 2013, 26, 101–104. [CrossRef]
31. Liu, Z.Y.; Li, X.G.; Cheng, Y.F. Electrochemical state conversion model for occurrence of pitting corrosion on a cathodicallypolarized carbon steel in a near-neutral pH solution. Electrochim. Acta 2011, 56, 4167–4175. [CrossRef]
32. LI, Y.; Shi, Z.M.; Chen, X.R.; Atrens, A. Anodic hydrogen evolution on Mg. J. Magnes. Alloy. 2021, 9, 2049–2062. [CrossRef]