effects of inoculation and liming on nodulation and nitrogen
TRANSCRIPT
EFFECTS OF INOCULATION AND LIMING ON NODULATION AND NITROGEN
FIXATION IN SOYBEAN (Glycine max) ON SELECTED ACIDIC SOILS OF KENYA
RUKIA BAKARI KHAMIS
A Thesis Submitted to the Graduate School in Partial Fulfillment of the Requirements for
the Master of Science Degree in Soil Science of Egerton University
EGERTON UNIVERSITY
OCTOBER, 2020

ii
DECLARATION AND RECOMMENDATION

iii
COPYRIGHT
Copyright © 2020, Rukia Bakari Khamis
All rights reserved. No part of this thesis may be reproduced, stored in any retrieval form or
transmitted in any part or form, electronic, mechanical, photocopying, recording or otherwise
without prior permission from the author or Egerton University.

iv
DEDICATION
This thesis is dedicated to my parents, family, and my sons Hajj and Abdulhafidh Abdikarim.

v
ACKNOWLEDGEMENTS
I wish to thank Almighty God for the blessings and mercies He has given me throughout my study.
My sincerest thanks go to IITA’s COMPRO –II project, International Nitrogen Initiative and
Towards International Nitrogen Management System for funding my study. I am also thankful to
the IITA and CIAT laboratory staff for their support during my laboratory analyses. I appreciate
my lecturers at the department of Crop, Horticulture and Soils, and Egerton University as a whole
for the knowledge they have provided me. I am thankful to my supervisors Prof. Nancy Mungai,
Dr. Cargele Masso and Dr. Moses Thuita for their endless effort to advice and guide me throughout
my studies. I also appreciate my course mates for their encouragement throughout my study. Am
grateful for the moral support I received from my parents, family and Friends.
vi
ABSTRACT
Soybean (Glycine max) is a legume of tropical to sub-tropical origin, used as a source of
food, feed and in oil production. Soybean yields in Kenya are low due to detrimental effects of soil
acidity on soybean and rhizobia inoculants. The objectives of this study were; first, to determine
the optimal soil pH range for effective nodulation and biological nitrogen fixation (BNF) of
soybean varieties TGx1740-2F (SB19) and Nyala inoculated with Biofix and Legumefix.
Secondly, to evaluate effects of soil fertility on nodulation and biological nitrogen fixation (BNF)
of soybean inoculated with Biofix and Legumefix. Thirdly, to determine the effectiveness of
agricultural lime and Mijingu phosphate rock (MPR) in raising soil pH and fourth, to evaluate the
impact of liming on nodulation and BNF of inoculated soybean. For the 1st and 2nd objectives, soils
of pH range 4.5-6.3 obtained from Central Rift Valley, Central Kenya and Lower Eastern regions
were used for greenhouse experiment at IITA, Nairobi, with soybean variety Nyala and SB19
under inoculation with two commercial products; Biofix and Legumefix and a non-inoculated
control. At mid podding, numbers of pods, nodules fresh weight, nodule effectiveness, shoot and
root dry weight, nodule occupancy, nitrogen (N) and phosphorus (P) uptake and N fixation were
determined. For objective three, two acidic soils were used in the laboratory, with three lime levels
(agricultural lime, MPR and without-lime treatment), two lime requirement methods (Shoe-Maker,
McLean and Pratt (SMP) and exchangeable acidity) and the treatments incubated with lime for 12
weeks in the laboratory. Soil pH was determined after every 2 weeks and on the 12th week of
incubation, soil available P was determined. For objective four, two acidic soils were limed with
agricultural lime and soybean varieties SB19 and Nyala inoculated with Biofix and Legumefix and
data collection was same as in the 1st objective. The experiments were in a completely randomized
design (CRD). In the first greenhouse experiment, soils with pH range 5.5-5.9 had the highest
measured growth parameters. Inoculation of soybean in soil S7 had highest amount of nitrogen
uptake (1.36g N plant-1) and nitrogen fixation (43.03%). In the soil-lime incubation study, liming
with agricultural lime resulted in increased soil pH6.0 while liming MPR resulted increase of soil
pH to 5.8. Lime rate estimation by SMP methods had significance influence in raising soil pH
p<0.05 compared to exchangeable acidity. Co-application of lime and inoculation increased
nodule fresh weight (5.8g plant-1 in Kuresoi soil) and nitrogen fixation (58.3% in Murang’a soil).
Co-application of lime and inoculation has potential to increasing soybean nodulation and BNF
and hence yield increase.
vii
TABLE OF CONTENTS
DECLARATION AND APPROVAL ......................................................................................... II
COPYRIGHT .............................................................................................................................. III
DEDICATION............................................................................................................................. IV
ACKNOWLEDGEMENTS ........................................................................................................ V
ABSTRACT ................................................................................................................................. VI
TABLE OF CONTENTS ......................................................................................................... VII
LIST OF TABLES ...................................................................................................................... XI
LIST OF FIGURES .................................................................................................................. XII
LIST OF ABBREVIATIONS ................................................................................................... XV
CHAPTER ONE ........................................................................................................................... 1
INTRODUCTION......................................................................................................................... 1
1.1 Background information ..................................................................................................... 1
1.2 Statement of the Problem .................................................................................................... 2
1.3 Objectives ........................................................................................................................... 3
1.3.1 Broad objective ........................................................................................................... 3
1.3.2 Specific objectives ...................................................................................................... 3
1.4 Hypotheses .......................................................................................................................... 3
1.5 Justification of the Study .................................................................................................... 3
References ................................................................................................................................... 4
CHAPTER TWO .......................................................................................................................... 6
LITERATURE REVIEW ............................................................................................................ 6
2.1 Soybean production in Kenya ............................................................................................. 6
2.2 Inoculants use in Kenya ...................................................................................................... 7
2.3 Methods for Determination of biological nitrogen fixation ................................................ 8
2.4 Methods for Determination Bradyrhizobium population .................................................... 9
2.5 Soil suitability for soybean production ............................................................................. 10
2.6 Impact of soil pH on soybean nodulation and BNF .......................................................... 10
2.7 Soil pH amendment........................................................................................................... 11
2.8 Lime use in Kenya ............................................................................................................ 12
References ................................................................................................................................. 13

viii
CHAPTER THREE .................................................................................................................... 17
EFFECTS OF SOIL ACIDITY ON NODULATION AND BIOLOGICAL NITROGEN
FIXATION OF SOYBEAN (Glycine Max) ............................................................................... 17
3.1 Abstract ............................................................................................................................. 17
3.2 Introduction ....................................................................................................................... 18
3.3 Material and methods ........................................................................................................ 19
3.3.1 Soil collection sites ................................................................................................... 19
3.3.2 Soil sampling ............................................................................................................ 21
3.3.3 Experimental treatments ........................................................................................... 21
3.3.4 Determination of soil physical and chemical properties ........................................... 21
3.3.5 Soybean Inoculation and Planting ............................................................................ 22
3.4 Data collection .................................................................................................................. 22
3.5 Data analysis ..................................................................................................................... 24
3.6 Results ............................................................................................................................... 25
3.6.1 Physical and Chemical properties of the study soil .................................................. 25
3.6.2 Number of pods......................................................................................................... 27
3.6.3 Nodule fresh weight .................................................................................................. 27
3.6.4 Nodules effectiveness ............................................................................................... 28
3.6.5 Shoot dry weight ....................................................................................................... 29
3.6.6 Root dry weight......................................................................................................... 30
3.6.7 Biological Nitrogen fixation and N uptake ............................................................... 31
3.6.8 Phosphorus uptake .................................................................................................... 32
3.6.9 Nodule occupancy ..................................................................................................... 33
3.7 Discussion ......................................................................................................................... 34
3.8 Conclusion ........................................................................................................................ 36
References ................................................................................................................................. 36
CHAPTER FOUR ....................................................................................................................... 40
EVALUATION OF LIME REQUIREMENT METHODS AND THE EFFECTS OF
AGRICULTURAL LIME AND MIJINGU PHOSPHATE ROCK ON SELECTED ACIDIC
SOILS ........................................................................................................................................... 40
4.1 Abstract ............................................................................................................................. 40
ix
4.2 Introduction ....................................................................................................................... 41
4.3 Materials and methods ...................................................................................................... 42
4.3.1 Soil collection and analysis ....................................................................................... 42
4.3.2 Lime analysis ............................................................................................................ 43
4.3.3 Methods of lime estimation ...................................................................................... 43
4.4 Incubation setup ................................................................................................................ 44
4.5 Data collection and analysis.............................................................................................. 44
4.6 Results ............................................................................................................................... 45
4.6.1 Soil and lime analyses ............................................................................................... 45
4.6.2 Soil incubation .......................................................................................................... 47
4.7 Discussion ......................................................................................................................... 51
4.8 Conclusion ........................................................................................................................ 52
References ................................................................................................................................. 52
CHAPTER FIVE ........................................................................................................................ 55
EFFECT OF LIMING AND INOCULATION ON SOYBEAN NODULATION AND
BIOLOGICAL NITROGEN FIXTION ................................................................................... 55
5.1 Abstract ............................................................................................................................. 55
5.2 Introduction ....................................................................................................................... 56
5.3 Materials and methods ...................................................................................................... 57
5.4 Data collection and analysis.............................................................................................. 57
5.5 Results ............................................................................................................................... 58
5.5.1 Soil physical and chemical characteristics and lime rates ........................................ 58
5.5.2 Number of pods......................................................................................................... 58
5.5.3 Nodule fresh weight .................................................................................................. 60
5.5.4 Nodules effectiveness ............................................................................................... 62
5.5.5 Shoot dry weight ....................................................................................................... 65
5.5.6 Root dry weight......................................................................................................... 66
5.5.7 Biological nitrogen fixation and phosphorus uptake ................................................ 68
5.5.8 ttest for pH at planting and pH at harvesting ............................................................ 70
5.5.9 Nodule analysis ......................................................................................................... 70
5.6 Discussion ......................................................................................................................... 71
x
5.7 Conclusion ........................................................................................................................ 73
References ................................................................................................................................. 73
CHAPTER SIX ........................................................................................................................... 75
GENERAL DISCUSSION, CONCLUSIONS AND RECOMMENDATIONS .................... 75
6.1 General Discussion ........................................................................................................... 75
6.2 Conclusions ....................................................................................................................... 77
6.3 Recommendations ............................................................................................................. 77
APPENDICES ............................................................................................................................. 79
Appendix 1: Nutrients salts and application rates............................................................. 79
Appendix 2: Mean square table for the factors affecting soybean growth parameters ..... 80
Appendix 3: Mean square for soil pH in the soil-lime incubation .................................... 81
Appendix 4: Mean squares for soil available phosphorus for Mehlich and Olsen P ........ 82
Appendix 5: Mean square for the factors affecting soybean growth parameters (Kuresoi
Soil) ................................................................................................................................... 83
Appendix 6: Mean square for the factors affecting soybean growth parameters (Murang’a
Soil) ................................................................................................................................... 84
Appendix 7: List of publications....................................................................................... 85
Appendix 8: Research Permit ........................................................................................... 86
xi
LIST OF TABLES
Table 2.1: Major soybean production regions in Kenya ................................................................. 6
Table 3.1: Treatments outline for determination of optimal soil pH for effective nodulation and
BNF in soils of different fertility .................................................................................................. 22
Table 3.2: Top soil (0-20cm) physical and chemical characteristics ............................................ 26
Table 4.1: Treatments outline for determination of an effective liming material ......................... 44
Table 4.2: Soil physical and chemical characteristics and lime analyses ..................................... 46
Table 4.3: Lime application rates in T Ha-1 determined by soil exchangeable acidity and
Shoemaker-Mclean-Pratt lime requirement methods ................................................................... 47
Table 5.1: Treatment outline for the determination of effect of liming, inoculation and varieties on
soybean growth ............................................................................................................................. 57
Table 5.2: Intergenic spacer region (percentage) from nodule analysis of soybean variety planted
in limed and without-lime treatment ............................................................................................. 71

xii
LIST OF FIGURES
Figure 3.1: Map of Kenya showing soil sampling sites ................................................................ 20
Figure 3.2: Number of pods as influenced by soil, varieties and inoculation interaction. The error
bar represents standard error of the differences (SED) for the soil × variety × inoculation
interaction. .................................................................................................................................... 27
Figure 3.3a: Nodule fresh weight as affected by soybean varieties. The error bar represents
standard error of the differences (SED) for variety effect. ........................................................... 28
Figure 3.3b: Nodule fresh weight as affected by soil and inoculation interaction. The error bar
represents standard error of the differences (SED) for the soil × inoculation interaction……….30
Figure 3.4: Nodules effectiveness as affected by soil, variety and inoculation. The error bar
represents standard error of the differences (SED) for the soil × variety × inoculation interactions.
....................................................................................................................................................... 29
Figure 3.5a: Shoot dry weight as influenced by soil. The error bar represents standard error of the
differences (SED) for the soil effect. ............................................................................................ 30
Figure 3.5b: Shoot dry weight as influenced by inoculation. The error bar represents standard error
of the differences (SED) for inoculation effect…………………………………………………..31
Figure 3.6: Root dry weight as affected by soil, inoculation and soybean varieties. The error bar
represents standard error of the differences (SED) for the soil × variety × inoculation interactions.
....................................................................................................................................................... 31
Figure 3.7: Nitrogen uptake as affected by soil, inoculation and soybean varieties. The error bar
represents standard error of the differences (SED) for the soil × variety × inoculation interactions.
....................................................................................................................................................... 32
Figure 3.8: Nitrogen fixation influenced by soil, inoculation and soybean varieties. The error bar
represents standard error of the differences (SED) for the soil × variety × inoculation interactions.
....................................................................................................................................................... 32
Figure 3.9: Phosphorus uptake as affected by soil and inoculation. The error bar represents
standard error of the differences (SED) for the soil × inoculation interaction. ............................ 33
Figure 4.1: Soil pH as influenced by lime materials, lime requirement method and soils. The error
bar represents standard error of the differences (SED) for the soil × lime material × weeks of
incubation interactions. ................................................................................................................. 48
xiii
Figure 4.2: Soil pH as influenced by liming materials and weeks of incubation. The error bar
represents standard error of the differences (SED) for the soil lime material and weeks of
incubation interaction.................................................................................................................... 49
Figure 4.3: Soil available P as influenced by lime materials, lime requirement methods, and soils.
The error bar represents the standard error of the difference (SED) for the lime materials, lime
requirement methods, and soil interactions. ................................................................................. 50
Figure 4.4: Influence of lime requirement methods on soil available P. The error bar represents
standard error of the differences (SED) for the soil × lime requirement methods interactions. ... 50
Figure 5.1: Number of pods as influenced by (a) inoculation, (b) soybean varieties and (c) liming
in Kuresoi soil. The errors bars indicate the standard error of differences (SED)........................ 59
Figure 5.2: Number of pods as influenced by liming, soybean varieties and inoculation interaction
in Murang’a soil. The error bar indicates the standard error of differences of the means (SED). 60
Figure 5.3: Nodule fresh weight as influenced by (a) liming and inoculation and (b) variety and
inoculation on soils of initial pH 5.0 (Kuresoi soil). The error bars indicate the standard error of
differences of mean. ...................................................................................................................... 61
Figure 5.4: Nodule fresh weight plant as influenced by (a) interaction of liming ×inoculation, (b)
interaction lime × variety and (c) interaction of variety × inoculation in Murang’a soil. The error
bars indicate the standard error of differences of means (SED). .................................................. 63
Figure 5.5: Nodule effectiveness as influenced by (a) interaction of liming × inoculation, (b)
interaction of liming × variety, and (c) interaction of variety × inoculation on Kuresoi soils. The
error bars indicate the standard error of differences of the means (SED). ................................... 64
Figure 5.6: Nodule effectiveness as influenced by interaction of liming, soybean varieties and
inoculation on Murang’a soil. The error bar indicates the standard error of differences of mean
(SED). ........................................................................................................................................... 64
Figure 5.7: Shoot dry weight as influenced by liming, soybean varieties and inoculation on soils
of initial pH 5.0 (Kuresoi soil). The error bar indicates the standard error of differences of mean
(SED). ........................................................................................................................................... 65
Figure 5.8: Shoot dry weight as influenced by: (a) liming and (b) inoculation on soils of initial pH
4.9 (Murang’a soil). The error bar indicates the standard error of differences of mean (SED). .. 66
Figure 5.9: Effect of liming and inoculation on root biomass of soils pH 5.0 (Kuresoi soil). The
error bar indicates the standard error of differences of mean (SED). ........................................... 67
xiv
Figure 5.10: Influence of: (a) liming and (b) inoculation on the root dry weight in Murang’a soil.
The error bar indicates the standard error of differences of the means. ....................................... 67
Figure 5.11: (a) Nitrogen uptake as influenced by liming and inoculation interaction and (b)
percent Ndfa as influenced by interaction of lime, variety and inoculation in Kuresoi soil. The error
bars indicate the standard error of differences of the means. ....................................................... 68
Figure 5.12: Shoot P as influenced (a) liming and (b) inoculation in Kuresoi soil. The error bars
indicate the standard error of differences of the means. ............................................................... 69
Figure 5.13: (a) Nitrogen uptake as influenced by variety and inoculation interaction and (b) Ndfa
as influenced by interaction of lime and inoculation in Murang’a soil. The error bars indicate the
standard error of differences of the means. ................................................................................... 70

xv
LIST OF ABBREVIATIONS
ARDRA Amplified Ribosomal Deoxyribonucleic Acid Restriction
Analysis
ASAL Arid and Semi-Arid Lands
BNF Biological Nitrogen Fixation
CCE Calcium Carbonate Equivalent
CFU Colony Forming Unit
DGGE Denaturing Gradient Gel Electrophoresis
IGS Intergenic Spacer region
IITA International Institute of Tropical Agriculture
KEPHIS Kenya Plant Health Inspectorate Services
MPN Most Probable Number
MPR Mijingu Phosphate Rock
MT Metric Tons
NDFA Nitrogen derived from atmosphere
PCR Polymerase chain reaction
rDNA Ribosomal Deoxyribonucleic Acid
RFLP Restriction Fragment Length Polymorphism
rRNA Ribosomal Ribonucleic Acid
SSA sub-saharan Africa
TGGE Temperature Gradient Gel Electrophoresis
TGx Tropical Glycine Crosses
YEMA Yeast Extract Mannitol Agar
1
CHAPTER ONE
INTRODUCTION
1.1 Background information
Soybean (Glycine max) is a legume of tropical to subtropical origin and an important source
of food and income (Maingi et al., 2006). Soybean production in sub-Sahara Africa (SSA) remains
low compared to South America and USA. Biological nitrogen fixation (BNF) is the major source
of nitrogen in soybean (Staton, 2011). Nitrogen fixation by soybean is affected by factors including
the population, presence and effectiveness of rhizobia present in soil, soil physiochemical
characteristics, amount of nitrogen in soil, plant- soil interaction and soybean genotype (Mathenge,
2017). Rhizobia are not commonly present in soils and those present are not always highly
effective, thus it is often necessary to inoculate legumes to ensure effective nodulation and nitrogen
fixation (Thilakarathna et al., 2018). Soil acidity affects rhizobia effectiveness and in turn,
nodulation and nitrogen fixation are impaired. Acidic soils have a high concentration of hydrogen
(H+), aluminum (Al3+), iron (Fe3+) and manganese (Mn2+) and low amounts of calcium (Ca),
magnesium (Mg), molybdenum (Mo), and available phosphorus (P). Soybean production regions
in Kenya include Western, Nyanza, Rift valley as well as Central and Eastern Provinces (Infonet
Biovision, 2018). These regions receive adequate rainfall, with well-drained soils; however, they
are highly affected by soil acidity (Kisinyo et al., 2014). Soil acidity is a major constraint to food
production in tropical and subtropical regions. Soil acidity limits soybean nodulation and yields
thus poor soybean production levels (Muleta et al., 2017). High concentration of Al, H, Fe and Mn
constrains legume root-nodule formation, functioning, and subsequently grain production and
Rhizobium-plant association (Yakubu et al.,2010).
Soil pH has shown a strong correlation with changes in microbial communities particularly
bacterial communities (Lauber et al., 2009) while soybean is considered a crop sensitive to pH
and perform well in soils of pH between 6.00-6.50 (Infonet Biovision, 2018). Soil liming to correct
acidity is necessary to make nutrients available to the crop and provision of favorable conditions
for microbial functioning. Lime estimation is crucial in ameliorating soil acidity; various methods
have been tested to estimate liming rates including exchangeable acidity, Shoe-maker, McLean
and Pratt method (SMP), soil-lime incubation method and Mehlich 3 method (Tunney et al., 2010).
Soil liming should be cost efficient thus liming method should not underestimate or overestimate
lime application. The limitation to lime use in Kenya includes cost, availability in the markets,
2
intensive hand application method by small-scale farmers and lack of knowledge on the benefits
of liming (Kisinyo et al., 2014).
1.2 Statement of the Problem
Soil is the most valuable and widespread natural resource that supports agricultural based
livelihoods. Soil fertility in smallholder farmers is declining due to lack of replenishment of lost
nutrients. Acidic soils cover about 13% (7.5 million Ha) of Kenyan arable land (Kisinyo et al.,
2014). Soil acidity limits crop production regardless of the application of fertilizer. Soybean
production in Kenya ranges between 5000-10000 tons (T) year-1 which is lower than the industrial
demand of more than 120,000 T year-1. Soybean growing areas in Kenya produce an average yield
of 0.8 T Ha-1which is lower than the potential of 3.0-3.5 T Ha-1 (Infonet Biovision, 2018). Major
soybean production regions face soil acidity limiting productivity. Soil acidity affects not only the
development of rhizobia and nodule formation but also the growth and uptake of nitrogen by
plants. Nutrients availability including nitrogen, phosphorus, potassium, sulfur, calcium,
magnesium, and molybdenum is highly dependent on soil pH and their uptake by soybean is
impaired at low soil pH levels. The use of inoculants can be effective only when applied at the
optimal soil pH. Soybean inoculation is necessary in soils with low rhizobia population. In Kenya,
the use of inoculants is not common among farmers, leading to poor nodulation, nitrogen fixation,
and hence low yield. Soybean inoculation in some regions in Kenya has not been effective in
increasing yields and this is attributed to soil acidity as one of the limiting factors (Kihanda &
Gachingiri, 2013). Major areas of high agricultural potential including Rift valley and highlands
of Rift Valley face soil acidity problem (pH< 5.5) limiting crop production (Kisinyo et al., 2014).
Soybean as well as rhizobia inoculants are all sensitive to low soil pH (<5.5). Soil liming is one of
the methods of ameliorating soil acidity increasing nutrients availability to plants. Studies done in
soil acidity-affected regions on the use of lime to improve soybean yields including the Central
parts of Kenya, Eastern and Western regions have proven to be effective. However, a suitable lime
requirement method for Kenyan acidic soils that will ensure accurate application is not established.
This study will provide insight for soil liming to an optimal pH and provide small-scale farmers
with a cost-effective liming material and in turn, increasing their yields. The determination of
optimal soil pH for use of rhizobia inoculants in soybean is crucial in ensuring effective nodulation
and BNF.
3
1.3 Objectives
1.3.1 Broad objective
To contribute to increasing soybean yields in Kenya through soybean inoculation and liming of
acidic soils.
1.3.2 Specific objectives
i. To determine optimal soil pH range for effective nodulation and BNF of soybean
varieties TGx1740-2F (SB19) and Nyala inoculated with Biofix and Legumefix.
ii. To determine nodulation and BNF in soils of different fertility using soybean varieties
SB19 and Nyala inoculated with Biofix and Legumefix.
iii. To evaluate the effectiveness of agricultural lime and Mijingu phosphate rock (MPR)
in raising soil pH.
iv. To assess the effects of liming on BNF and nodulation soybean varieties inoculated
with Biofix and Legumefix.
1.4 Hypotheses
This study tested the null hypotheses that:
i. Soil pH does not affect nodulation and BNF of inoculated SB19 and Nyala soybean
varieties.
ii. Soil fertility has no effect on nodulation and BNF of SB19 and Nyala under inoculation.
iii. Agricultural lime and MPR are not effective in raising soil pH.
iv. Soil liming does not have an impact on nodulation and BNF on soybean under
inoculation.
1.5 Justification of the Study
Soybean is an important food legume in sub-Saharan Africa due to its high nutritive value.
In Kenya, mainly small-scale farmers produce soybean and the production levels are low. Potential
areas of soybean production in Kenya have acidity problem thus contributing to low yield, this
leads to high soybean importation to meet the demand. Nutrients deficiency caused by acidic soils
affects not only the crop but also the rhizobia inoculants. This leads to poor nodulation, low
nitrogen fixation and in turn reduces yields. Rhizobia inoculants are sensitive to acidic and their
effectiveness is impaired at low pH levels. Soil liming is one of the amelioration ways of reducing
soil acidity effects on crop through reduction of Al, H, Mn and Fe toxicity and increasing the
4
availability of nutrients to crops. However, lime application needs to be to the optimal range in
which it will favor crop and inoculant used. There is little research and information on optimal
range for soybean and rhizobia inoculants. This study will provide directions in the use of rhizobia
inoculants for soybean production under variable pH conditions. It will therefore provide a guide
for the most optimal soil pH range for soybean inoculation to improve yields. The findings and
recommendations of this research work will also be beneficial to the national government and
development partners in making decision regarding the applications of soil amendments to
improve and increase yields in soybean.
References
Infonet Biovision. (2018). Plant Health/ Crops Fruits and Vegetables/ Soybean. Retrieved
February 15, 2019, from Infonet Biovision:
https://www.infonet-biovision.org/PlantHealth/Crops/Soybean
Kihanda, F. M. & Gachingiri, J. M. (2013). Effect of selected soil amendments on growth and
yield ofbeansin acidicNitisol of Nyeri County, central Kenya. Joint Proceedings of the 27th
Soil Science Society of East Africa and the 6th African Soil Science Society Conference,
(pp. 487-482). Nakuru, Kenya.
Kisinyo, P. O., Opala, P. A., Gudu, S. O., Okalebo, J. R., Palapala, V. & Otingo, A. N. (2014).
Recent advancement towards understanding and managing Kenya acid soils for improved
crop production. African Journal of Agricultural Research, 9(13), 2397-2408.
Lauber, C. L., Micah, H., Rob, K. & Noah, F. (2009). Pyrosequency-base assessment of soil pH
as a predictor of soil bacterial community structure at continental scale. Applied and
environmental microbiology, 75(15), 5111-5120.
Maingi, J. M., Gitonga, N. M., Shisanya, C. A., Hornetz, B. & Muluvi, G. M. (2006). Population
Levels of Indigenous Bradyrhizobia Nodulating Promiscuous Soybean in two Kenyan
Soils of the Semi-arid and Arid Regions. Journal of Agriculture and Rural Development
in the Tropics and Subtropics, 107(2), 149-159.
Mathenge, C. (2017). Soybean (Glycine max) ) Response to Rhizobia Inoculation as influenced
by Soil Nitrogen Levels. Nairobi: Kenyatta University.
Muleta, D., Maarten, H. R. & Matthew, D. D. (2017). The potential for rhizobial inoculation to
increase soybean grain yields on acid soils in Ethiopia. Journal of Soil Science and Plant
Nutrition, 63(5), 441-451.
5
Staton, M. (2011). Evaluating Soybean Nodulation. Retrieved May 03, 2015, from Michigan State
University Extension: http://www.msue.msue.edu
Thilakarathna, M. S., Tejendra , C., Bhawana , G., Roshan , P., Bir , B. T., Shankar, G. & Manish,
N. (2018, 07 01). Symbiotic Nitrogen Fixation, Growth and Yield Response of Common
Bean and Cowpea for Rhizobia Inoculation and Micronutrients (B and Mo)
Tunney, H., Sikora, F. J., Kissel, D., Wolf, A., Sonon, L. & Goulding, K. (2010). A comparison
of lime requirements by five methods on grassland mineral soils in Ireland. Soil Use and
Management, 26, 126-132. doi:10.1111/j.1475-2743.2010.00263.x
Yakubu, H., Kwari, J. D. & Ngala, A. L. (2010). N fixation by Grain legume Varieties as Affected
by Rhizobia Inoculation in the Sandy soils of Sudano-Sahelian Zone of Noth Eastern
Nigeria. Nigerian Journals of Basic and Applied science, 18(2), 22-236.
6
CHAPTER TWO
LITERATURE REVIEW
2.1 Soybean production in Kenya
Soybean (Glycine max) is a legume of tropical to subtropical origin and is a multipurpose
crop ranked as number two in oil production in Kenya (Mahasi et al., 2011). Soybean grows in
areas where maize and common beans are mainly grown. It grows to a height of 60-120cm and
matures in 3 to 6 months depending on the variety, climate, and location. Depending on the variety,
the crop can grow up to 2200m above sea level (Mathu et al., 2009) and under rainfall ranging
from 300 to 1200mm.
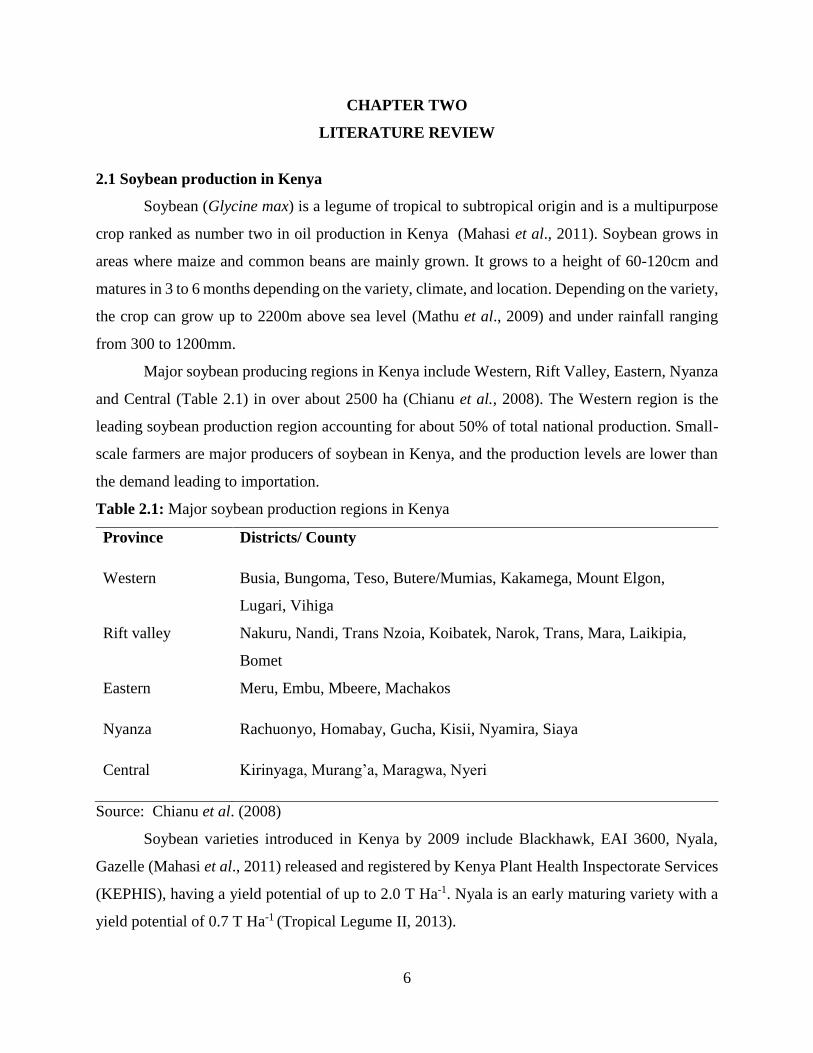
Major soybean producing regions in Kenya include Western, Rift Valley, Eastern, Nyanza
and Central (Table 2.1) in over about 2500 ha (Chianu et al., 2008). The Western region is the
leading soybean production region accounting for about 50% of total national production. Small-
scale farmers are major producers of soybean in Kenya, and the production levels are lower than
the demand leading to importation.
Table 2.1: Major soybean production regions in Kenya
Province Districts/ County
Western Busia, Bungoma, Teso, Butere/Mumias, Kakamega, Mount Elgon,
Lugari, Vihiga
Rift valley Nakuru, Nandi, Trans Nzoia, Koibatek, Narok, Trans, Mara, Laikipia,
Bomet
Eastern Meru, Embu, Mbeere, Machakos
Nyanza Rachuonyo, Homabay, Gucha, Kisii, Nyamira, Siaya
Central Kirinyaga, Murang’a, Maragwa, Nyeri
Source: Chianu et al. (2008)
Soybean varieties introduced in Kenya by 2009 include Blackhawk, EAI 3600, Nyala,
Gazelle (Mahasi et al., 2011) released and registered by Kenya Plant Health Inspectorate Services
(KEPHIS), having a yield potential of up to 2.0 T Ha-1. Nyala is an early maturing variety with a
yield potential of 0.7 T Ha-1 (Tropical Legume II, 2013).
7
The International Institute of Tropical Agriculture (IITA) introduced promiscuous soybean
varieties, Tropical Glycine crosses (TGx) series and in 2010 TGx 1740-2F (SB 19), TGx 1895-
33F (SB 8) were introduced in Kenya and have been tested and found to have a high ability to fix
nitrogen (Mahasi et al., 2011). The variety SB19 is a medium maturity, and has been found to best
for mono-cropping with yields potential of about 2.7 T Ha-1 (although yields of 4 T Ha-1 have been
recorded), while SB 8 best for intercropping with high grain yield of 2.5 T Ha-1 and biomass
accumulation (Tropical Legume II, 2013).
Recently, IITA introduced two new TGx varieties i.e. TGx 1988-5F which is an early maturing
variety (90-100 days after sowing) with promiscuous nodulation and high resistance to disease
(IITA, 2015), and TGx 1989-19F which is medium maturing (101-110 days after sowing). The
two varieties were released in 2014 and trial tests have shown that they have potential yields of
about 2.5 T Ha-1.
2.2 Inoculants use in Kenya
Nitrogen is a major limiting plant nutrient in sub-Saharan Africa (SSA), resulting in low
yields in crop production. Inorganic N fertilizers such as Di-Ammonium Phosphate (DAP) and
Urea frequently used to supply the needed nitrogen to the farming system in SSA. The presence
of Bradyrhizobium in the roots of soybean enables the crop to fix nitrogen in the soil thus making
nitrogen available to soybean. The soil factors affecting inoculation include excessive soil
moisture, drought, soil acidity, P deficiency, excess mineral N and deficiency of micronutrients
such as molybdenum, cobalt and boron (Muleta et al., 2017). When Bradyrhizobium population is
low or no soybean has ever grown in the field, this will necessitate the use of inoculants containing
nitrogen-fixing bacteria. In a study conducted in Kenya (Lesueur et al., 2012) it found, that the
application of Rhizobium inoculants significantly increased the soybean yields in all tested areas
(about 75% of the farms).
The limitation in the use of commercial inoculants in Kenya includes lack of access by the
small-scale farmers, limited production in Kenya and insufficient distribution network (Mutuma
et al., 2014). Biofix is a peat-based inoculant, produced by MEA Ltd and commercialized in
Kenya. It contains industrial standard Bradyrhizobium diazoefficiences strain USDA 110. Biofix
is widely adopted but has shown low efficacy thus posing a limitation to its use (Mungai &
Karubiu, 2011). Low inoculants efficacy is associated with high population of indigenous rhizobia,

8
which outcompete the introduced rhizobia. Unfavorable soil conditions will also influence the
efficacy of the inoculant; this includes soil pH of below 5.0.
Legumefix is a rhizobia inoculant manufactured by Legume Technologies in the United
Kingdom. it contains Bradyrhizobium japonicum stain 532C. Research on Legumefix in Kenya
has found it to boost the natural population of beneficial nitrogen-fixing bacteria, hence effective
in increasing nodulation and BNF (Mburu et al., 2011). Legumefix also increases nodule fresh
weight and yields. Commercial inoculants increase nodulation, dry matter yield, and grain yield
hence necessary for increasing soybean yields (Ulzen et al., 2016)
2.3 Methods for Determination of biological nitrogen fixation
The determination of biological nitrogen fixation (BNF) can be done by measuring
parameters including dry matter yield, nodule index based on nodule color, nodule size, nodule
number, and weight (Prevost & Antoun, 2008), nodule fresh weight, shoot and root dry weights.
A well-nodulated soybean will have 8-10 nodules of about 2-4 mm in size. The color should also
be red-pink due to the presence of leghemoglobin (Staton, 2012).
The N- difference method is another method for N fixation and is widely used when total
N analysis is available. The N fixed is estimated by the difference between the total amount of N
fixed by soybean and non-fixing plant both grown under same conditions (Prevost & Antoun,
2008; FAO, 1993). The main assumption with this method is that both plants assimilate the same
amount of soil nitrogen; it is, however, limited in that plants differ in their root morphologies
(Prevost & Antoun, 2008).
Acetylene reducing assay method also determines BNF and the method is on the principle
that rhizobia cells produce nitrogenase, which is an enzyme that reduces nitrogen to ammonia and
other compounds like ethylene. The roots, nodules, and even plant parts incubated with 10%
acetylene and the ethylene gas produced measured by gas chromatography. It is a sensitive method
and the total nitrogen not measured due to nitrogenase activity (Roger and Ladha, 1990).
Another method for BNF determination is the 15N dilution method where the fixing legume
plant is labeled with a 15N inorganic or organic fertilizer. The principle is that the fixing legume
will assimilate both the 15N labeled as well as the atmospheric nitrogen (Prevost and Antoun, 2008;
FAO, 1993). The 15N natural abundance method involves no addition of labeled N fertilizer in the
soil. During nitrogen uptake in the soil, 14N is lost to atmosphere thus causing an increase in 15N:
9
14N ratio in soil than in the atmosphere (Prevost and Antoun, 2008). Both methods involve the use
of a reference crop that does not fix nitrogen. Although they are accurate methods for BNF
determination, they are however expensive. The N difference method is a cheap method of
determining BNF, thus combined with nodule index to give a good estimation of BNF.
2.4 Methods for Determination Bradyrhizobium population
Soil microbial population is determined using various methods including biochemical,
physiological and molecular methods. Various techniques have developed to quantify the
population of Bradyrhizobia in the soil. This includes plate counts which is a simple and rapid
method, it involves incubation of soil with a nutrient medium yeast extract mannitol agar (YEMA)
at several serial dilution and determination of the colony forming units (CFU) to evaluate the
population of the indigenous Bradyrhizobia population (Germida & Freitas, 2008). Gram staining
indicates if the rhizobia are gram negative or gram positive (Somasegaran & Hoben, 1985).
Another technique of enumeration is the most probable number (MPN) method, which
relies on the presence or absence of microorganisms in the samples of several series of dilution
(Prevost & Antoun, 2008). The MPN method is applicable on soil capable of nodule formation to
determine the population of indigenous rhizobia responsible for nodulation (Germida & Freitas,
2008; FAO, 1993). However, plate technique and MPN are disadvantaged in the choice of
appropriate media and adsorption of microbes to pipette walls.
Direct methods of studying population of Bradyrhizobia include the use of molecular
methods. Molecular methods used includes nucleic acid reassociation and hybridization, DNA
microarrays, polymerase chain reaction (PCR) based approaches including restriction fragment
length polymorphism (RFLP), denaturing gradient gel electrophoresis (DGGE), temperature
gradient gel electrophoresis (TGGE) and amplified ribosomal DNA restriction analysis (ARDRA)
(Prevost and Antoun, 2008). The PCR-RFLP method is widely used for determination of rhizobia
diversity and by sequencing of the 16S rRNA gene for identification of rhizobia species and the
16S-23S rDNA intergenic spacer (IGS) which allows the differentiation of strains within the same
species (Sikora & Sulejman, 2003). Molecular methods are advantageous over traditional methods
in that they allow identification of the cultivatable and non–cultivatable microorganism (Prevost
& Antoun, 2008).
10
2.5 Soil suitability for soybean production
Kenya has about 4.5 million ha as arable land out of about 60 million ha of the land in the
country. The Arid and Semi-Arid Lands (ASAL) cover about 80% of the land and about 13% of
the land has acidity problem (Kanyanjua et al., 2002). The arable lands in the country face
acidification and aluminum toxicity while the ASAL have salinity and sodicity problems (Matolo
et al., 2000). The medium to high rainfall potential regions are most affected by soil acidity with
the East of Rift valley and Western region of the country being most affected. These conditions
make agricultural productivity a challenge in these regions. Soybean is produced in a broad range
of well-drained soil with the medium-textured soils (loam) being ideal for soybean than heavy clay
soil or sandy/gravy soils (Upfold & Olechowski, 2000).
Soil pH in the regions with high agricultural potential ranges from extreme acidity to
slightly alkaline with Western regions having a range 4.20- 7.42, Rift valley 5.00-7.80, Kisumu
4.1-8.14, Eastern 4.3-7.74 and central 4.1-8.1 (NAAIAP & KARI, 2014). Soils with pH below
6.00 limit agricultural production and especially soybean, which is sensitive to soil pH.
2.6 Impact of soil pH on soybean nodulation and BNF
Soil acidity constrains symbiotic nitrogen fixation in both tropical and temperate soils by
limiting rhizobial survival and reducing nodulation. Phosphorus is highly dependent on soil pH,
and in acidic soils, P usually fixed by Al, Mn or Fe, thus unavailable to plants hence limiting
nodulation. Aluminium is soluble at low soil pH, and the more the soil is acidic the more soluble
aluminum becomes hence causing aluminum toxicity in the soils. The presence of available
aluminum in acid soils will inhibit nodulation directly and indirectly by stunting root growth and
tends to compound the effects of low-level calcium by inhibiting its uptake. Soils of pH below 6.0
have low molybdenum (Mo) availability (Erker & Brick, 2014), as Mo solubility and availability
is pH dependent. Molybdenum is an important micronutrient in nitrogen fixation since it is an
essential component of one of the two proteins, which together form nitrogenase (Eaglesham &
Ayanaba, 2005). Soil acidity affects the survival of soil microorganism, with fast-growing rhizobia
being more sensitive to soil acidity than slow-growing Rhizobia including Bradyrhizobium.
The management of soil pH is important when high yields and profitable soybeans are
expected. Soybeans mostly perform well at a soil pH of between 6.0 and 7.0 (Staton, 2012). At the
optimal pH, there is maximum nutrient availability like nitrogen, potassium, phosphorus,
11
magnesium, and calcium. Factors such as unfavorable soil pH, mineral toxicity, and nutrient
deficiency and plant diseases limit inoculants strains due to lack of expression their full capacity
for nitrogen fixation regardless of strains’ competitiveness (Hassen et al., 2014).
A study conducted in Kenya (Lesueur et al., 2012) on soybean, concluded that soil factors
such as pH, P, C, N can affect the inoculants efficiency whether the strain is occupying the nodules
or not. The study also reported that soil pH significantly affects nodulation and yield, although this
effect varies from regions to region. A study also conducted to assess the effects of varying soil
pH on soybean production in several soil types across the state of Madison (Wisconsin) (Peters et
al., 2004), reported that soil liming to pH of between 5.5 and 6.6 resulted in optimum yields and
at low soil pH (< 5.0) there was significant reduction in soybean yields. Soybean will show limited
nodulation when soils are strongly acidic (5.2-5.4) (Hassen et al., 2014). Legumes usually fail to
nodulate under acidic soil conditions leading to impaired symbiotic efficiency and reduced yields.
The determination of optimum soil pH range for inoculation is important and when found to be
outside the range, inoculation should not be done unless soil pH amendment has been considered.
2.7 Soil pH amendment
Liming is an important practice to achieve optimum yields on crops grown in acidic soils.
Soil liming will result in the increase of soil pH, base saturation, Ca, and Mg content and a
reduction in Al concentration. It also enhances microbial activities in the rhizosphere, improving
root growth thus increase in nitrogen fixation. The efficiency and quality of liming material depend
on the neutralizing value of the material expressed as calcium carbonate equivalent (CCE), particle
size distribution, and initial soil pH, clay content of the soil and buffering capacity of the soil.
Methods, frequency, depth, and time of application are important factors on lime efficiency.
Various methods can used to apply lime including spot application, band application, and
broadcasting. Broadcasting is the most recommended method of lime application due to its
effectiveness.
Lime requirement is the amount of a basic material needed to raise soil pH to the desired
level. Accurate and rapid methods to determine the amount of liming material needed is an
essential step in soil liming. Lime requirement is affected by factors such nature of acidity,
neutralizing sequence (initial and desired pH), soil properties including parent material and texture
and organic matter content (Thomas, 1996). Methods for lime requirement determination include
12
soil-lime incubation, soil-base titration, soil buffer equilibrations, and exchangeable Al (Edmeades
et al., 2012). For accuracy in lime requirement methods, different lime requirement test will give
the recommendation based on a specific geographic region. The buffer equilibrations methods
include Shoemaker-McLean-Pratt (SMP) single buffer method, Adams and Evans single buffer
methods, and Mehlich single buffer method. The SMP buffer method is quick, cost efficient and
has a good reproducibility, however, the chemicals it uses including p-nitrophenol and chromate
ions are hazardous thus posing a health risk to the user. Sikora buffer developed in the USA to
eliminate the use of p-nitrophenol and chromate in SMP. Brazil has been able to come with a new
buffer suitable for tropic and subtropical soil Maria Santa (TSM) buffer that mimics the SMP uses
some of SMP chemicals and Sikora chemicals (Maria et al., 2010).
2.8 Lime use in Kenya
Agricultural lime has been used in several studies in Kenya, and proven to be an effective
liming material. A study in Uasin Gishu showed that the use of agricultural lime with MPR
increases soybean and maize yields (Nekesa et al., 2008). Mijingu phosphate rock (MPR) has been
widely used as a source of P and liming material. The addition of rock phosphate in soils increases
P availability, Ca and Mg thus leading to a reduction in soil acidity (Anetor & Akinkunmi, 2007).
Use of Mijingu phosphate rock (MPR) as a liming material resulted in high soybean yield in
western Kenya (Nekesa et al., 2008). Application of MPR at a rate of 60 kg P ha-1 resulted in the
increase in soil available P and maize grain yields in Western Kenya.
There is no documented study of the use of wood ash as a liming material in Kenya.
However, use of wood ash as an alternative liming material in Canada, has proven to be an
effective liming material as its mode of action attributed to being same as that for agricultural lime
(Lickacz, 2002). Calcium carbonate equivalent (CCE) of most wood ash ranges between 10-90%
(Mbah & Deborah, 2010). Wood ash improves the availability of nutrients C, P, K, Zn, Mn, Ca,
and B. Use of wood ash on pea and barley lead to increase in yield (Arshap et al., 2012). Increase
in yield of barley and mixed forage was observed in using wood ash as a liming material than use
of agricultural lime (Lickacz, 2002).Wood ash when applied at same rate as agricultural lime
improves on soil chemical and physical properties thus increasing crop production (Mbah &
Deborah, 2010).
13
MEA Ltd has produced a new lime material called physiolith, mainly contains 36% CaO and
2.5% MgO and has a recommended rate of application of 100kg/acre. No documented research on
the effectiveness of this product has been published in its use has a lime material.
References
Anetor, M. O. & Akinkunmi, E. A. (2007). Lime Effectiveness of some Fertilizers in Tropical
Acid Alfisols. Journal of Central European Agriculture, 8(1), 17-24.
Arshap, M. A., Azooz, P. H., Chang, S. X., Soon, Y. K. & Lupwayi, N. Z. (2012). Soil and Crop
Response to Wood Ash and Lime Application on Acidic Soils. Agronomy Journal, 104(3),
715-721.
Chianu, J. N., Vanlauwe, B., Mahasi, J. M., Katungi, E., Akech, C., Mairura, F. S. & Sanginga, N.
(2008). Soybean situation and outlook analysis: The case of Kenya. TSBF-CIAT. Nairobi:
AFNET.
Eaglesham, A. R. & Ayanaba, A. (2005). Tropical stress ecology of rhizobia, root nodulation and
legume fixation. In A current development in biological nitrogen fixation (pp. 1-35). Subba
Rao., N.S. (ed.), London, U.K: Edward Arnold Publishers.
Edmeades, D. C., Wheeler, D. M. & Waller, J. E. (2012). Comparison of Methods for Determining
Lime Requirements of New Zealand Soils. New Zealand Journal of Agricultural Research,
28(1), 93-100.
Erker, B. & Brick, M. A. (2014). Colorado State University Extension. Retrieved November 5,
2014, from CSU Homepage:http://extension.colostate.edu/topic-areas/agriculture/legume-
seed-inoculants-0-305/
FAO. (1993). Technical Handbook on Symbiotic Nitrogen Fixation. Rome: Food and Agricultural
Organization of the United Nations.
Germida, J. J. & Freitas, J. R. (2008). Soil Biological Analyses- Cultural Methods for Soil and
Root- Associated Microorganisms. In M. R. Carter, and E. G. Gregorich, Soil Sampling
and Methods of Analysis (pp. 341-351). New York: Taylor and Francis Group.
Hassen, A. I., Isabella, H., Galalet, S. & Francina, L. (2014). Nodulation Efficacy of
Bradyrhizobium japonicum Inoculant Strains WB74 on Soybean is Affected by Several
Lmiting Factors. Africa Journal of Microbilogy Research, 8(20), 2069-2076.
14
IITA. (2015). Nigeria releases two soybean varieties developed at IITA. Retrieved February 2,
2016, from http://www.iita.org/c/document_library/get_file?uuid=abd272f1-201c-459d-
af86-a8b667c1a743andgroupId=25357
Lesueur, D., Atieno, M., Mathu, S. & Herrmann, L. (2012). Potential of the Commercial Inoculant
and Native Strains for Improving Legume Yields in Different Land-use Systems.
Importance of Rhizobia in Agriculture, 632. EGU General Assembly.
Lickacz, J. (2002). Alberta Agricultural and Rural Development- Pulse and Oil Seed Unit.
Retrieved February 14, 2016, from Agdex 534-2:
http://www1.agric.gov.ab.ca/$department/deptdocs.nsf/all/agdex3435/$file/534-
2.pdf?OpenElement
Mahasi, J. M., Mukalama, J., Mursoy, R. C., Mbehero, P. & Vanlauwe, B. (2011). A Sustainable
Approach to Increase Soybean Production in Western Kenya. African Crop Science
Confrence Proceedings (pp. 115-129). Uganda: Africa Crop Science Society.
Maria , A. S., João , K., Danilo , R. d., Jaderson , d., Cesar , C. & Diogo , S. (2010). A new buffer
that imitates the SMP solution for determining potential acidity of Brazilian soils. World
Congress of Soil Science, Soil Solutions for a Changing World (pp. 13-16)
Brisbane,Australia:DVD.
Mathu, R. W., Nandokha, T., Riungu, T. C., Matere, S. & Bandera, N. K. (2009). The potential of
soybean to increase agricultural productivity in dry areas of Central Kenya. KARI.
Matolo, N., Wayogu, S., Gicheru, P. & Maingi, P. (2000). Saline and sodic soils in drylands of
Kenya. Nairobi: Kenya soil survey.
Mbah, C. N. & Deborah, N. (2010). Response of Maize (Zea mays L) to Different Rates of wood-
ash Application in acid Ultisol in Southeast Nigeria. Journal of American Science, 53-57.
Mburu, M. W., Okalebo, J. R., Lesueur, D., Pypers, P., Ngetich, W., Mutegi, E. & Nekesa, O. A.
(2011). Evaluation of biological commercial inoculants on soybean production in
Bungoma county. Africa Crop Science Confrence Proceeding, 10, 605-610.
Mungai, N. & Karubiu, M. N. (2011). Effectiveness of Rhizobia Isolates from Njoro Soils (Kenya)
and Commercial Inoculants in Nodulation of Common Bean (Phaseolus vulgaris). Journal
of Agriculture, Science and Technology, 12(1), 17-59.

15
Muleta, D., Maarten, H. R. & Matthew, D. D. (2017). The potential for rhizobial inoculation to
increase soybean grain yields on acid soils in Ethiopia. Journal of Soil Science and Plant
Nutrition, 63(5), 441-451.
Mutuma, S. P., Okello, J. J., Karanja, N. K. & Woomer, P. L. (2014). Smallholder Farmers" use
and Profitability of Legume Inoculants in Western Kenya. African Crop Science Journal,
22(3), 205-213.
NAAIAP & KARI. (2014). Soil Suitability Evaluation for Maize Production in Kenya. Nairobi:
National Accelarated Agricultural Inputs Acess Programme and Kenya Agricultural
Research Institute- Department of Kenya Soil Survey.
Nekesa, A. O., Okalebo, J. R., Othieno, C., Thuita, M. N., Batiano, A. & Waswa, B. S. (2008).
The Potential of Increase Maize and Soybean Production in Uasin Gishu District Kenya,
Resulting from Soil acidity Amendments using Mijingu Phosphate Rock and Agricultural
Lime. Springer Link, 343-348.
Peters, J. B., Speth, P. E., Kellings, K. A. & Borges, R. (2004). Effects of soil pH on soybean
yields. Retrieved December 08, 2014, from University of Wisconsin- Madison:
http://www.soils.wisc.edu/extension/wcmc/2005/pap/Peters.pdf
Prevost, D. & Antoun, H. (2008). Root Nodule Becteria and Symbiotic Nitrogen Fixation. In M.
R. Carter, and E. G. Gregorich, Soil Sampling and Methods of Analysis (pp. 379-397). New
York: Taylor and Francis.
Roger, P. A. & Ladha, J. K. (1990). Estimation of Biological Nitrogen Fixation and its
Contribution to Nitrogen Balance in Wetland Rice Fields. Manilla: International Rice
Research Institute.
Sikora, S. & Sulejman, R. (2003). Genotypic Characterisation of Indigenous Soybean Rhizobia by
PCR-RFLP of 16S rDNA, rep-PCR and RAPD Analysis. Biotechnology, 41(1), 61-67.
Somasegaran, P. & Hoben, J. H. (1985). Selecting Effective Strains of Rhizobia in Potted Field
Soil. In P. Somasegaran, and H. H. J, Niftal Training Manual. Hawaii: University of
Hawaiii.
Staton, M. (2011). Evaluating Soybean Nodulation. Retrieved May 03, 2015, from Michigan State
University Extension:
http://msue.anr.msu.edu/news/evaluating_soybean_nodulation
16
Staton, M. (2012). Michigan State University. Retrieved from Managing soil pH for optimal
soybeanproduction:http://msue.anr.msu.edu/news/managing_soil_pH_for_optimal_soybe
an_production
Thomas, J. S. (1996). Lime requirement. In D. L. Sparks, A. L. Page, P. A. Helmke, and R. H.
Loeppert, Methods of soil analysis-Chemical analysis (pp. 491-511). Madison: Soil
Science Society of America.
Tropical Legume II. (2013). Retrieved 01 20, 2014, from Tropical Legume Farming in Kenya:
http://www.icrisat.org/TropicalLegumesII/pdfs/Flyer_A%20Bulletin%20of%20the%20Tr
opical%20October.pdf (Accessed on 01.20. 2016).
Ulzen , J., Abaidoo , R. C., Mensah, N. E., Masso, C. & AbdelGadir, A. H. (2016). Bradyrhizobium
Inoculants Enhance Grain Yields of Soybean and Cowpea in Northern Ghana. Frontier in
Plant Science, 7, 1770. doi:10.3389/fpls.2016.01770
Upfold, R. A. & Olechowski, H. T. (2000). Soybean Production. Ecological Agricultural Projects.
Ontorio Ministry of Agriculture and Food.

17
CHAPTER THREE
EFFECTS OF SOIL ACIDITY ON NODULATION AND BIOLOGICAL NITROGEN
FIXATION OF SOYBEAN (GLYCINE MAX)
3.1 Abstract
Kenya arable lands face acidity problems limiting soybean production. Soil pH is one of
the limiting factors to effective nodulation and biological nitrogen fixation (BNF) causing low
soybean yields. A greenhouse study was conducted at the International Institute of tropical
agriculture (IITA) in Nairobi, to evaluate the effect of soil acidity on soybean nodulation and BNF
when inoculated with Biofix and Legumefix using soybean varieties Nyala and TGx1740-2F
(SB19). Ten soils with a pH range of 4.3-6.3 (labeled S1-S10) obtained from Central Kenya
(Murang’a), Central Rift Valley (Kuresoi) and Lower Eastern regions (Kitui) were used for this
study. The soils were analyzed for physical and chemical characteristics and amended using
nutrient solutions, and packed in 2 kg capacity pots maintained at field capacity. Soils S5-S8 (pH
range 5.5-5.9) had the highest measured growth parameters. Inoculation of extreme acidic soil (pH
<5.5) had no significant influence on nodulation and BNF. The interaction of soil × variety ×
inoculation was significant for the number of pods (p<0.05), root biomass (p<0.05), nodules
effectiveness (p<0.0001), nitrogen (N) uptake (p<0.05) and nitrogen derived from the atmosphere
(p<0.05). Soybean variety SB19 inoculated with Biofix in soil S5 (pH 5.6) had the highest number
of pods (89 pods plant-1) and nodules effectiveness (85.8%). Highest nodules fresh weight was in
soil S6 in soybean inoculated with Legumefix (11.37 g plant-1). Soil S7 (pH 5.8) planted with SB19
and inoculated with Biofix had the highest N uptake (1.368 g plant-1) and Ndfa (43.09%). The
results suggest that at soil pH 5.6-6.0, inoculation of soybean increased BNF and nodulation, hence
a high number of pods that may translate to high grain yield. Soybean varieties differ in terms of
nodulation, biomass, and nitrogen fixation. Inoculants effectiveness highly depends on the soybean
variety inoculated and soil fertility level. In addition, there is need to lime acidic soils to soil pH
5.5-6.0 to improve soybean nodulation and BNF.
Keywords: Biological nitrogen fixation, effective nodulation, nodule effectiveness, soil pH
18
3.2 Introduction
Soil pH plays a major role in influencing nutrients availability for plant growth. Soil
fertility has been declining over years due to lack of sufficient replenishment of lost nutrients. Soils
nutrients including nitrogen (N) and phosphorus (P) are most liming to crop production. Nitrogen
demands are meet by use of mineral nitrogen fertilizers, which pose a high cost in crop production
and causes environmental pollution. An alternative source of N for legumes is through biological
nitrogen fixation (BNF). Inoculation of legumes such as soybean results in increase of BNF and
yield (Zarei et al., 2012). The use of effective high quality rhizobium inoculants in Kenya has
resulted in increased soybean yields (Lesueur et al., 2012). Soil pH is one of the liming factors to
symbiotic efficiency between host legume and rhizobium (Cooper & Schere, 2012).
Soybean grows well at pH 5.6-6.8 where there is maximum nutrients availability. Acidic
soils are usually deficient in P, Mg, Ca, Mo and K with a high concentration of Fe, Al, H, Cu and
Mn ions (Osundwa et al., 2013). In Kenya, acidic soils occur in high rainfall areas, including
highlands of east Rift valley and it occurs in about 13% of Kenya land area (Kanyanjua et al.,
2002). Soybean production in Kenya is low and this could be due to the sensitivity of the crop to
soil acidity (or low pH). Soil pH below 5.2 and above 6.8 does not favor soybean growth hence
poor yields at these pH ranges. High levels of aluminum and low levels of phosphorus in acidic
soils affect the growth of symbiotic nitrogen-fixing bacteria (Nisa et al., 2012). Most acidic soils
will require re-inoculation after harvesting due to poor survival of rhizobia in the soil. Soils of pH
<5.5 causes nodulation failure in terms of formation and functioning leading to impaired symbiotic
efficiency and reduced yield (Ferguson et al., 2013).
Acidic soils face reduced organic matter breakdown, nutrient cycling by microorganisms,
reduced uptake of nutrients by plant roots and inhibition of root growth (Fageria et al., 2013).
Soybean require a high amount of nutrients, with P and K being most crucial for optimal
production (Sikka et al., 2012). Acidic soils have high concentration of Al and Fe ions in solution
and these causes P sortion making it unavailable for plant use (Osundwa et al., 2013). Soil fertility
has significant influence on rhizobial efficiency and soils with different fertility status respond
differently to inoculation (Korir, 2016). Rhizobium in culture media has shown a critical range of
pH 4.0-6.0 (Goncalves et al., 2000) and Bradyrhizobium japonicum is tolerant to low pH compared
to other fast-growing Rhizobium (Nisa et al., 2012). This study investigated the impact of soil pH
on soybean nodulation and BNF on soils that differ in fertility.
19
3.3 Material and methods
3.3.1 Soil collection sites
The soils for the greenhouse study were obtained from Nakuru County (Kuresoi and
Mauche), Murang’a (Kangema), and Kitui (Kyangwithya East). Kuresoi is located at about
0.2993°S longitude and 35.5302°E latitude while Mauche occurs at Mauche 0.3316°S longitude
and 35.9449°E latitude, at an elevation of 1480-1550m (Figure 3.1). The mean annual temperature
is 18.1°C and an average annual rainfall of 1200-1900mm (MoALF, 2016). The soils from Kuresoi
are humic Andosols while soils from Mauche are mollic Andosols. These soils are well drained,
deep to very deep, dark brown, friable and smeary, with acid humic topsoil. Kuresoi soils are sandy
clay to clay and Mauche soils are silty clay-to-clay (Jaetzold et al., 2006).
Kangema (Murang’a) lies at 0.7957°S longitude and 37.1327°E latitude, at an elevation of
2150m above sea level (Figure 3.1). The area has a mean annual temprature of 17.6°C and average
annual rainfall 1980mm (Climate-Data.org, 2016). These region occurs in upper midland zones i.e
coffe tea zones and the soils are humic Nitosols, well drained, extemely deep, dusky red to dark
reddish brown, friable clay, with acid humic topsoil (Jaetzold et al., 2006).
Kyangwithya (Kitui) lies at 1.3751°S longitude and 37.952°E latitude and occurs at an
elevation of 1700m above sea level in the lower midlands i.e. marginal cotton zone (Figure 3.1).
The area has a mean annual temperature of 21.4°C and an annual average rainfall of 1068 mm
(Climate-Data.org, 2016). The soils in these regions are humic Cambisols, well-drained, dark
reddish brown-to-brown, friable, rocky stony, sandy clay to clay with acidic humic topsoil
(Jaetzold et al., 2006).

20
Figure 3.1: Map of Kenya showing soil-sampling sites. Source: (ArcGIS [GIS software], 2010)

21
3.3.2 Soil sampling
Soil collection was at a depth of 20cm and ten subsamples randomly collected per site
using hoe for digging out soils. The soil samples from each site were homogenized and the
composite samples obtained put in 50kg capacity sack and transferred to the greenhouse at IITA
Nairobi. The samples were then air-dried for 48 hours and sieved through a 2mm sieve and a
subsample (50g) used in physical and chemical analyses of the soils.
3.3.3 Experimental treatments
The experiment was set in a greenhouse with the soils obtained from Murang’a, Kuresoi and Kitui.
Treatments were; inoculation with Legumefix-soybean, Biofix-soybean, and a negative control
(no inoculation) with two soybean varieties TGx1740-2F (SB19) and Nyala and the experiment
laid in a completely randomized design (CRD) in factorial arrangement. Soybean variety SB19 is
promiscuous and medium maturing with high biomass yield while Nyala is early maturing, non-
promiscuous and does well as an intercrop (ICRISAT, 2013). The two varieties differ in their N
fixation and pod formation (Thuita et al., 2011), hence yield differences. The commercial
inoculants used differ in strain content; Legumefix manufactured from UK (Legume Technology
LTD-UK) contains strain 532C and Biofix manufactured by MEA LTD Kenya, contains strain
USDA110. Biofix is a widely used inoculant due to its availability. Recent studies indicate the
effectiveness of Legumefix inoculants in Kenyan soil (Thuita et al., 2011).
3.3.4 Determination of soil physical and chemical properties
The soil samples collected were analysed for physical and chemical characteristics following
procedures described in Okalebo et al (2002). Soil pH- water was determined using glass electrode
pH meter in a 1: 2.5 soil/water ratio while Exchangeable acidity was analyzed using buffered
neutral salts (KCl). The soil particle size analysis was determined using the hydrometer method
and the amount of soil total nitrogen was determined using Kjeldahl method. Soil organic carbon
was determined using the Walkley-black method (sulfuric acid– dichromate digestion followed by
back titration with ferrous ammonium sulfate). Available P, exchangeable bases (Ca, Mg and K)
and micronutrient were extracted using Mehlich 3 method and available P was then determined
using ammonium vanadate method and amount determined using a spectrophotometer. The
amount of extracted exchangeable bases was determined using atomic absorption (emission for K)
22
spectrophotometry after extraction with ammonium acetate (pH 7.0). Micronutrients Cu, Mn and
Zn were measured using atomic absorption.
3.3.5 Soybean Inoculation and Planting
Plastic containers of 2kg capacity filled with the soil of different pH to a bulk density of
1kgm-3 were used for planting soybean. Basal nutrients application containing 300 mg P, 0.06 mg
Cu, 0.2 mg Zn, 0.04 mg B and 0.008 mg Mo pot-1 (Somasegaran & Hoben, 1994) was applied 2
days prior to planting. The soils were maintained at 80% field capacity and reference crop pots.
The nutrient solution did not include any source of Ca, Mg, or N. Seeds were surface sterilized
with sodium hypochlorite for 1 minute and rinsed 5 times with sterilized distilled water. Planting
of the negative control (uninoculated) was first to avoid any potential contamination. Inoculation
was at a rate of 1g of inoculant/100g seeds following instruction on each pack of the inoculants
and three seeds planted per pot, and later thinned to one plant per pot on 10th day after planting.
Sorghum was planted as a reference crop for BNF estimation.
Table 3.1: Treatments outline for determination of optimal soil pH for effective nodulation and
BNF in soils of different fertility
Factors Levels Description
Soil 10 Soils of different pH (4.3, 4.6, 4.7, 4.8, 5.6, 5.7, 5.8, 5.9, 6.2 and
6.3)
Inoculation 3 Inoculation with Biofix or Legumefix and uninoculated (control)
Varieties 2 TGx1740-2F (SB 19) and Nyala
Number of pots (10×3×2×3) =180 pots.
Sorghum for BNF estimation (10 soils × 3replicates) = 30 pots
Total number of pots 180+30=210 pots
3.4 Data collection
3.4.1 Number of pods and nodulation
Plant harvesting was done on 10th week after planting and the number of pods counted from
each plant and recorded. The shoot was cut from the pots and soil was removed from roots and the
nodules separated from roots by washing in running water (Somasegaran & Hoben, 1985),
obtaining the fresh nodules and their weight recorded for each pot. After nodule weight
23
determination, the nodules from each plant were, subgrouped into two, one group was used
determination for nodule effectiveness, and the other group stored in glycerol and used for nodule
occupancy analysis. Nodule effectiveness was determined by cutting half of the counted nodules
into two and observed for color. A pink-red color indicated nitrogen fixation, whitish or greenish
nodule indicating nodule was not effective at fixing nitrogen (FAO, 1993). The percentage
effectiveness of the nodules was determined as:
% nodules effectiveness= number of pink nodules ×100
Total number of nodules
3.4.2 Biomass yield, nutrient uptake and biological nitrogen fixation
The shoots and roots were dried in the greenhouse before transferring to the oven for further
drying at 70˚C for 24 hours and the dry weights were determined. Nitrogen fixation was
determined using the N difference method. This was by procedure described by Unkovich et al.,
(2008). The dry shoot of soybean and sorghum shoots were grinded and used to determine tissue
N concentration using Kjeldahl method (Rutherford et al., 2008). The total N determined together
with dry matter yield to give the amount of N2 fixed (Mary et al., 1995).
Total N uptake in plants= Dry matter weights × %N in plants
100
N fixed (Ndfa) = Total N uptake in legume – Total N uptake in reference crop
%Ndfa= Total N uptake in legume – Total N uptake in reference crop×100
Total N uptake in legume
3.4.3 Phosphorus uptake
The dried and grounded soybean shoots were digested with HNO3 and 30% H2O2, then analyzed
using inductively-coupled plasma atomic emission spectroscopy (ICP-AES) as described in
Okalebo et al., (2002).
3.4.4 Assessment of nodule occupancy
The assessment of nodule occupancy was by polymerase chain reaction-restriction
fragment length polymorphism (PCR-RFLP) to determine the composition and actual
characteristic of microorganisms involved in nodulation. Two sites were chosen Mauche (S6) and
Kitui (S9) to be representative based on their nodulation effectiveness (soil S6 had 85.5% and S9

24
had 85.2%). Eight nodules per plant were analyzed. Deoxyribonucleic acid (DNA) extraction from
nodules was done by use of standard phenol-chloroform-isoamyl in presence of sodium acetate
(Krosova-Wade et al., 2003). A 930–1100bp intergenic region between the 16S and 23S rDNA
was amplified by PCR using rhizobia-specific primers derived from the 3′ end of the 16S rDNA
(FGPS 1490-72; 5′-TGCGGCTGGATCCCCTC CTT-3′)(Navarro et al., 1992) and from the 5′ end
of the 23S rDNA (FGPL 132-38; 5′-CCGGGTTTCCCCATTCGG-3′)(Ponsonnet & Nesme,
1994).
The PCR amplification was carried out in a 25μl reaction volume containing 2μl of total
DNA extract, 10pmol of each primer, and one freeze-dried bead (puReTaq Ready-To-Go PCR
beads, GE Healthcare UK Ltd) containing 2.5U of Taq DNA polymerase, 200μM in 10mM Tris-
HCl (pH 9 at room temperature) of each dNTP, 50mM KCl, and 1.5mM MgCl2. The PCR
amplification was performed in a Bio-Rad iCycler™ thermal cycler adjusted to the following
program: initial denaturation for 5min at 94°C, 35 cycles of denaturation (30s at 94°C), annealing
(30s at 58°C) and extension (30s at 72°C) and a final extension (7min at 72°C). The PCR products
were visualized by electrophoresis of 3μl of the amplified DNA on 2% horizontal agarose gel in
TBE buffer (1.1% TrisHCl, 0.1% Na2EDTA·2H2O, and 0.55% boric acid), pre-stained with
0.033mg ml−1 of Ethidium Bromide. The gel was photographed under UV illumination with Gel
Doc (BIO-RAD) Software (USA). Aliquots (10μl) of PCR products were digested with the
restriction endonucleases MspI and HaeIII (5U) in a total volume of 15μl for 2h at 37°C. The
restriction fragments were separated by horizontal electrophoresis in 1X TBE buffer with 3%
agarose gel pre-stained with 0.033mg ml−1 of Ethidium Bromide. The gels were run at 100V for
3h and photographed under UV illumination with Gel Doc (BIO-RAD, USA) software. Strains
with identical restriction fragment profiles (in individual fragment size and number) were classified
into the same intergenic spacer (IGS) group.
3.5 Data analysis
All the data of the number of pods, nodulation, shoot and roots dry weight, nutrients uptake
and BNF were subjected to Analysis of Variance (ANOVA) to evaluate the effect and interaction
between soils, soybean varieties and inoculation on the measured parameters using the procedure
glm of the SAS System (SAS Institute Inc, 2006). The effects of the different treatments were
compared by computing their standard errors of the differences (SED); the significance of
difference was evaluated at P<0.05. The model for the experiment was:

25
Yijkl= μ +Si + Tj + STij + Vk +SVik + TVjk + STVijk + Ԑijkl
Where;
Yijkl is observation due to the effect of ith soil, with jth inoculation and kth variety
μ is the overall mean
Si is the effect due to ith soil
Tj is effect due to jth inoculation
STij is the interaction due to ith soil and jth inoculation
Vkis the effects due to kth variety
SVik is the interaction due to ith soil and kth variety
TVjk is interaction due to jth inoculation and kth variety
STVijk is the interaction due to ith soil, jth inoculation, and kth variety
Ԑijkl is the random error term.
3.6 Results
3.6.1 Physical and Chemical properties of the study soil
The soils differed in fertility level (Table 3.2); soils from Murang’a (S1 with pH 4.3 and
S2 with pH 4.8) and Kuresoi (S3 with pH 4.6 and S4 with pH 4.7) were strongly acidic. Mauche
soils (S5-S8) were moderately acidic while Kitui soils (S9-S10) were slightly acidic. Available P
ranged from medium to high (Okalebo et al., 2002) expect for soil S2 and S3 which had 6 mg kg-
1 of soil available P. Basic cations in soils S3 and S4 were very low contributing to their low CEC.
Although Soil S9 and S10 had moderate acidity, they however had low basic cations and total N
content. Soil S2 had low total N (0.07%) and organic carbon (0.42%).
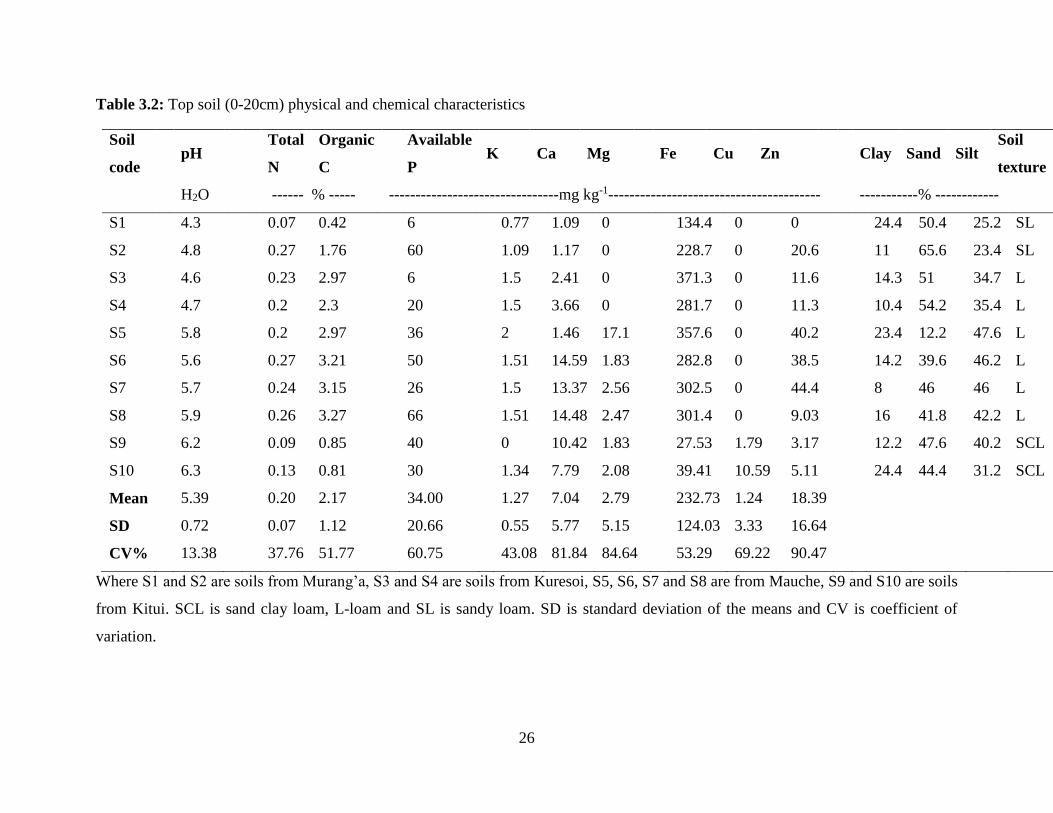
26
Table 3.2: Top soil (0-20cm) physical and chemical characteristics
Soil
code pH
Total
N
Organic
C
Available
P K Ca Mg Fe Cu Zn
Clay Sand Silt
Soil
texture
H2O ------ % ----- --------------------------------mg kg-1---------------------------------------- -----------% ------------
S1 4.3 0.07 0.42 6 0.77 1.09 0 134.4 0 0 24.4 50.4 25.2 SL
S2 4.8 0.27 1.76 60 1.09 1.17 0 228.7 0 20.6 11 65.6 23.4 SL
S3 4.6 0.23 2.97 6 1.5 2.41 0 371.3 0 11.6 14.3 51 34.7 L
S4 4.7 0.2 2.3 20 1.5 3.66 0 281.7 0 11.3 10.4 54.2 35.4 L
S5 5.8 0.2 2.97 36 2 1.46 17.1 357.6 0 40.2 23.4 12.2 47.6 L
S6 5.6 0.27 3.21 50 1.51 14.59 1.83 282.8 0 38.5 14.2 39.6 46.2 L
S7 5.7 0.24 3.15 26 1.5 13.37 2.56 302.5 0 44.4 8 46 46 L
S8 5.9 0.26 3.27 66 1.51 14.48 2.47 301.4 0 9.03 16 41.8 42.2 L
S9 6.2 0.09 0.85 40 0 10.42 1.83 27.53 1.79 3.17 12.2 47.6 40.2 SCL
S10 6.3 0.13 0.81 30 1.34 7.79 2.08 39.41 10.59 5.11 24.4 44.4 31.2 SCL
Mean 5.39 0.20 2.17 34.00 1.27 7.04 2.79 232.73 1.24 18.39
SD 0.72 0.07 1.12 20.66 0.55 5.77 5.15 124.03 3.33 16.64
CV% 13.38 37.76 51.77 60.75 43.08 81.84 84.64 53.29 69.22 90.47
Where S1 and S2 are soils from Murang’a, S3 and S4 are soils from Kuresoi, S5, S6, S7 and S8 are from Mauche, S9 and S10 are soils
from Kitui. SCL is sand clay loam, L-loam and SL is sandy loam. SD is standard deviation of the means and CV is coefficient of
variation.
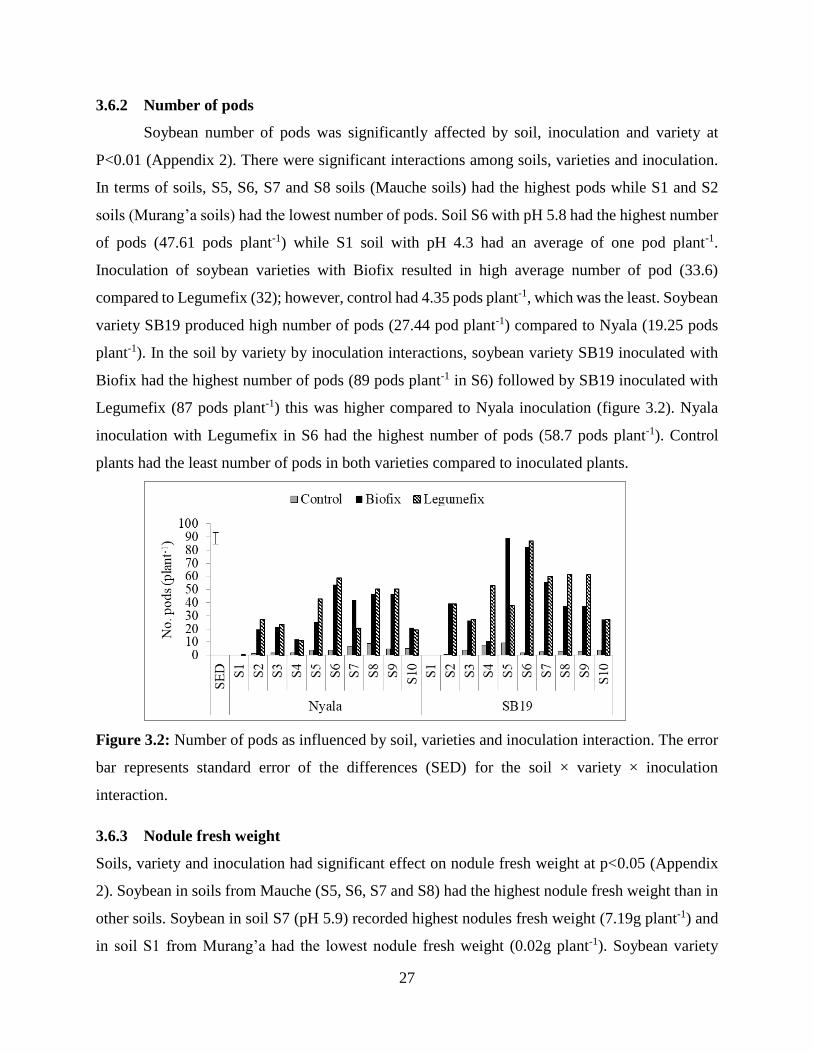
27
3.6.2 Number of pods
Soybean number of pods was significantly affected by soil, inoculation and variety at
P<0.01 (Appendix 2). There were significant interactions among soils, varieties and inoculation.
In terms of soils, S5, S6, S7 and S8 soils (Mauche soils) had the highest pods while S1 and S2
soils (Murang’a soils) had the lowest number of pods. Soil S6 with pH 5.8 had the highest number
of pods (47.61 pods plant-1) while S1 soil with pH 4.3 had an average of one pod plant-1.
Inoculation of soybean varieties with Biofix resulted in high average number of pod (33.6)
compared to Legumefix (32); however, control had 4.35 pods plant-1, which was the least. Soybean
variety SB19 produced high number of pods (27.44 pod plant-1) compared to Nyala (19.25 pods
plant-1). In the soil by variety by inoculation interactions, soybean variety SB19 inoculated with
Biofix had the highest number of pods (89 pods plant-1 in S6) followed by SB19 inoculated with
Legumefix (87 pods plant-1) this was higher compared to Nyala inoculation (figure 3.2). Nyala
inoculation with Legumefix in S6 had the highest number of pods (58.7 pods plant-1). Control
plants had the least number of pods in both varieties compared to inoculated plants.
Figure 3.2: Number of pods as influenced by soil, varieties and inoculation interaction. The error
bar represents standard error of the differences (SED) for the soil × variety × inoculation
interaction.
3.6.3 Nodule fresh weight
Soils, variety and inoculation had significant effect on nodule fresh weight at p<0.05 (Appendix
2). Soybean in soils from Mauche (S5, S6, S7 and S8) had the highest nodule fresh weight than in
other soils. Soybean in soil S7 (pH 5.9) recorded highest nodules fresh weight (7.19g plant-1) and
in soil S1 from Murang’a had the lowest nodule fresh weight (0.02g plant-1). Soybean variety
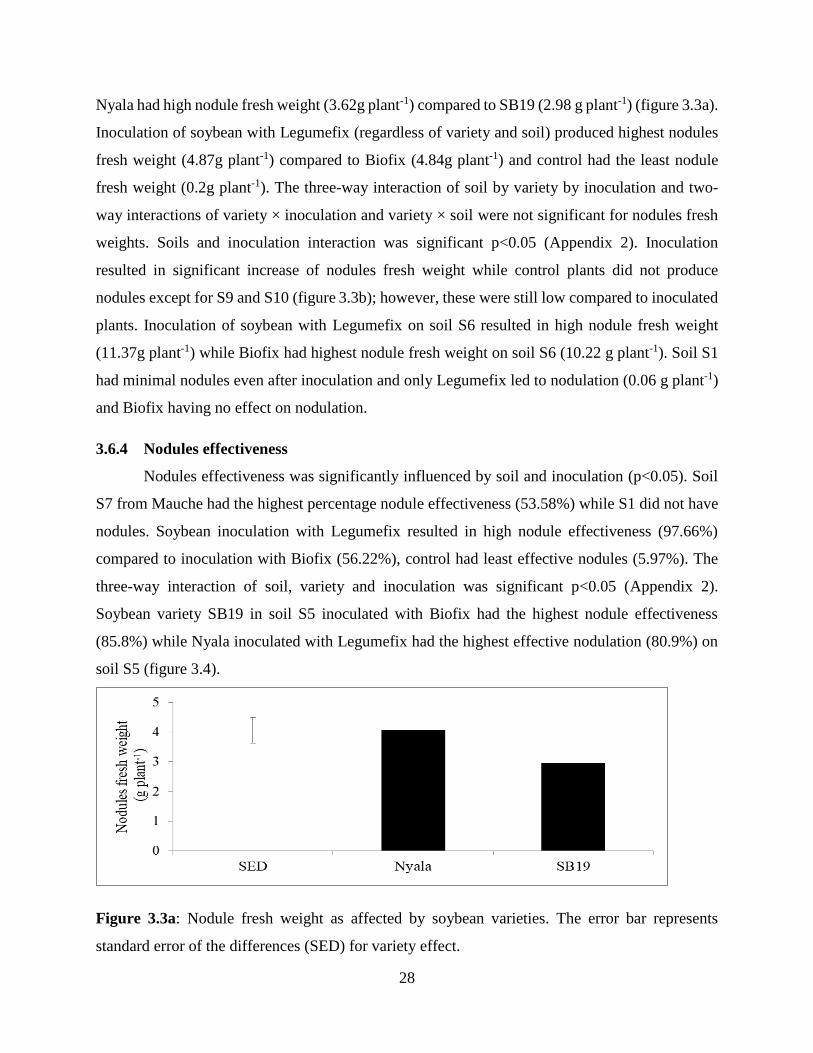
28
Nyala had high nodule fresh weight (3.62g plant-1) compared to SB19 (2.98 g plant-1) (figure 3.3a).
Inoculation of soybean with Legumefix (regardless of variety and soil) produced highest nodules
fresh weight (4.87g plant-1) compared to Biofix (4.84g plant-1) and control had the least nodule
fresh weight (0.2g plant-1). The three-way interaction of soil by variety by inoculation and two-
way interactions of variety × inoculation and variety × soil were not significant for nodules fresh
weights. Soils and inoculation interaction was significant p<0.05 (Appendix 2). Inoculation
resulted in significant increase of nodules fresh weight while control plants did not produce
nodules except for S9 and S10 (figure 3.3b); however, these were still low compared to inoculated
plants. Inoculation of soybean with Legumefix on soil S6 resulted in high nodule fresh weight
(11.37g plant-1) while Biofix had highest nodule fresh weight on soil S6 (10.22 g plant-1). Soil S1
had minimal nodules even after inoculation and only Legumefix led to nodulation (0.06 g plant-1)
and Biofix having no effect on nodulation.
3.6.4 Nodules effectiveness
Nodules effectiveness was significantly influenced by soil and inoculation (p<0.05). Soil
S7 from Mauche had the highest percentage nodule effectiveness (53.58%) while S1 did not have
nodules. Soybean inoculation with Legumefix resulted in high nodule effectiveness (97.66%)
compared to inoculation with Biofix (56.22%), control had least effective nodules (5.97%). The
three-way interaction of soil, variety and inoculation was significant p<0.05 (Appendix 2).
Soybean variety SB19 in soil S5 inoculated with Biofix had the highest nodule effectiveness
(85.8%) while Nyala inoculated with Legumefix had the highest effective nodulation (80.9%) on
soil S5 (figure 3.4).
Figure 3.3a: Nodule fresh weight as affected by soybean varieties. The error bar represents
standard error of the differences (SED) for variety effect.
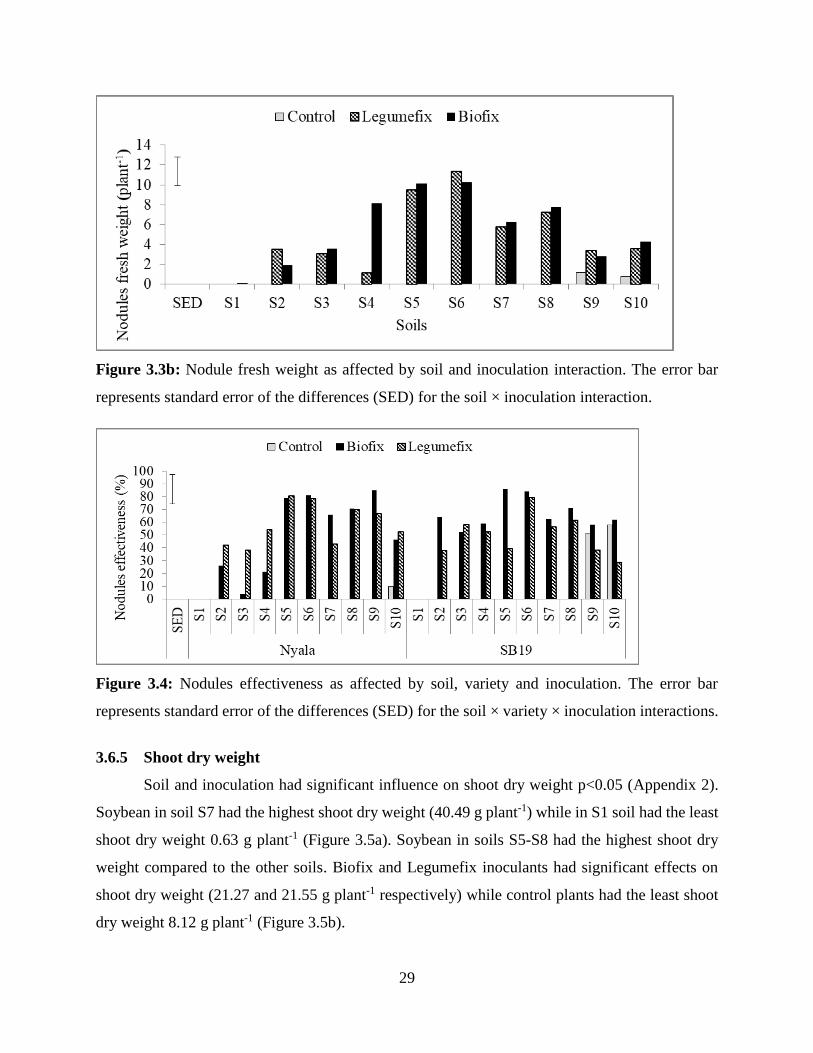
29
Figure 3.3b: Nodule fresh weight as affected by soil and inoculation interaction. The error bar
represents standard error of the differences (SED) for the soil × inoculation interaction.
Figure 3.4: Nodules effectiveness as affected by soil, variety and inoculation. The error bar
represents standard error of the differences (SED) for the soil × variety × inoculation interactions.
3.6.5 Shoot dry weight
Soil and inoculation had significant influence on shoot dry weight p<0.05 (Appendix 2).
Soybean in soil S7 had the highest shoot dry weight (40.49 g plant-1) while in S1 soil had the least
shoot dry weight 0.63 g plant-1 (Figure 3.5a). Soybean in soils S5-S8 had the highest shoot dry
weight compared to the other soils. Biofix and Legumefix inoculants had significant effects on
shoot dry weight (21.27 and 21.55 g plant-1 respectively) while control plants had the least shoot
dry weight 8.12 g plant-1 (Figure 3.5b).
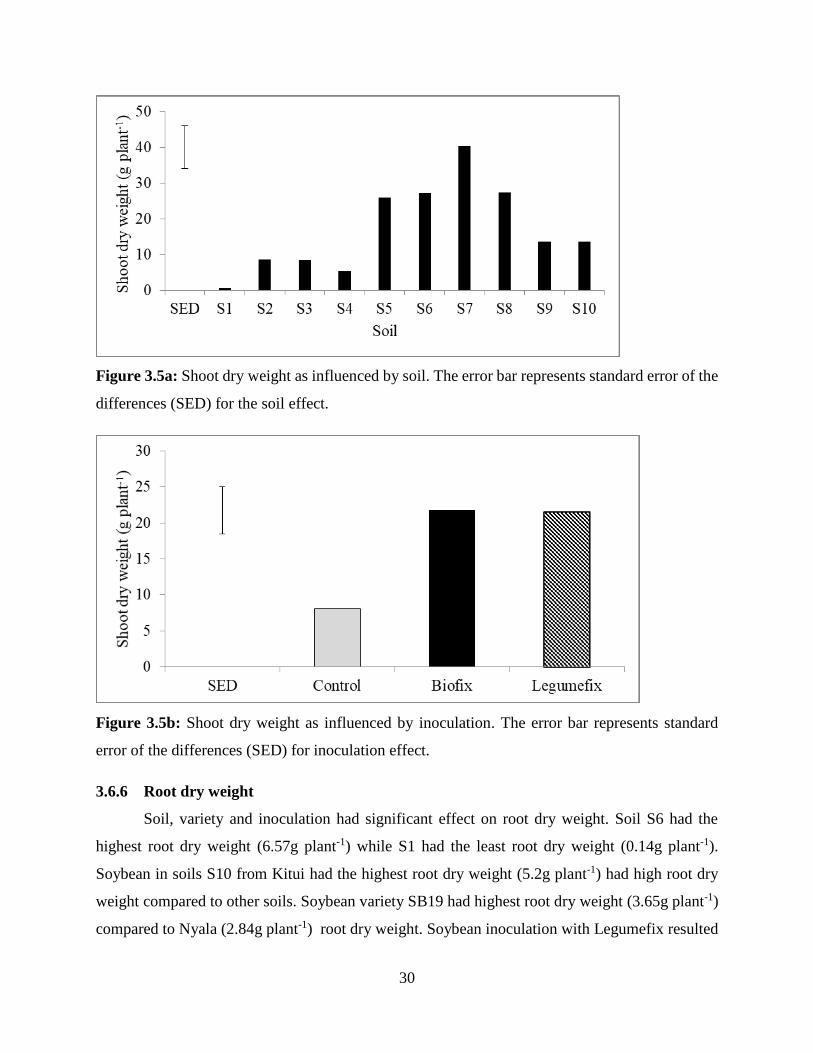
30
Figure 3.5a: Shoot dry weight as influenced by soil. The error bar represents standard error of the
differences (SED) for the soil effect.
Figure 3.5b: Shoot dry weight as influenced by inoculation. The error bar represents standard
error of the differences (SED) for inoculation effect.
3.6.6 Root dry weight
Soil, variety and inoculation had significant effect on root dry weight. Soil S6 had the
highest root dry weight (6.57g plant-1) while S1 had the least root dry weight (0.14g plant-1).
Soybean in soils S10 from Kitui had the highest root dry weight (5.2g plant-1) had high root dry
weight compared to other soils. Soybean variety SB19 had highest root dry weight (3.65g plant-1)
compared to Nyala (2.84g plant-1) root dry weight. Soybean inoculation with Legumefix resulted
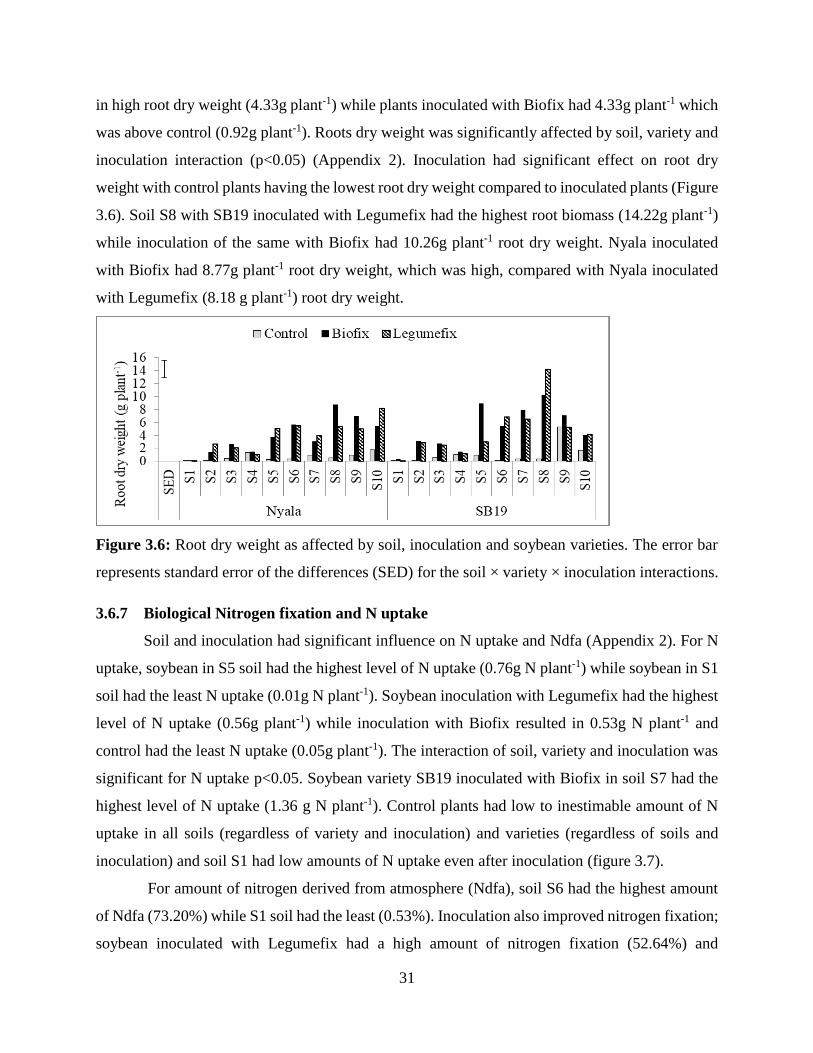
31
in high root dry weight (4.33g plant-1) while plants inoculated with Biofix had 4.33g plant-1 which
was above control (0.92g plant-1). Roots dry weight was significantly affected by soil, variety and
inoculation interaction (p<0.05) (Appendix 2). Inoculation had significant effect on root dry
weight with control plants having the lowest root dry weight compared to inoculated plants (Figure
3.6). Soil S8 with SB19 inoculated with Legumefix had the highest root biomass (14.22g plant-1)
while inoculation of the same with Biofix had 10.26g plant-1 root dry weight. Nyala inoculated
with Biofix had 8.77g plant-1 root dry weight, which was high, compared with Nyala inoculated
with Legumefix (8.18 g plant-1) root dry weight.
Figure 3.6: Root dry weight as affected by soil, inoculation and soybean varieties. The error bar
represents standard error of the differences (SED) for the soil × variety × inoculation interactions.
3.6.7 Biological Nitrogen fixation and N uptake
Soil and inoculation had significant influence on N uptake and Ndfa (Appendix 2). For N
uptake, soybean in S5 soil had the highest level of N uptake (0.76g N plant-1) while soybean in S1
soil had the least N uptake (0.01g N plant-1). Soybean inoculation with Legumefix had the highest
level of N uptake (0.56g plant-1) while inoculation with Biofix resulted in 0.53g N plant-1 and
control had the least N uptake (0.05g plant-1). The interaction of soil, variety and inoculation was
significant for N uptake p<0.05. Soybean variety SB19 inoculated with Biofix in soil S7 had the
highest level of N uptake (1.36 g N plant-1). Control plants had low to inestimable amount of N
uptake in all soils (regardless of variety and inoculation) and varieties (regardless of soils and
inoculation) and soil S1 had low amounts of N uptake even after inoculation (figure 3.7).
For amount of nitrogen derived from atmosphere (Ndfa), soil S6 had the highest amount
of Ndfa (73.20%) while S1 soil had the least (0.53%). Inoculation also improved nitrogen fixation;
soybean inoculated with Legumefix had a high amount of nitrogen fixation (52.64%) and

32
inoculation with Biofix resulted in 50.35% Ndfa and was higher than control (0.97%). The soil,
variety, and inoculation interaction had significant effect on nitrogen fixation at p≤0.01, (Appendix
2). Soils S1- S4 had the least level of N fixation on both varieties under inoculation while soils S5-
S8 had the highest N fixation amounts on both Nyala and SB19 under inoculation (Figure 3.8).
Nitrogen fixation on control plants for both Nyala and SB19 was very low in all the soils.
Figure 3.7: Nitrogen uptake as affected by soil, inoculation and soybean varieties. The error bar
represents standard error of the differences (SED) for the soil × variety × inoculation interactions.
Figure 3.8: Nitrogen fixation influenced by soil, inoculation and soybean varieties. The error bar
represents standard error of the differences (SED) for the soil × variety × inoculation interactions.
3.6.8 Phosphorus uptake
Soil, inoculation and their interaction had significant influence on P uptake p<0.05
(Appendix 2). Soybean in soil S8 had the highest uptake (299 mg P plant-1) while in soil S2 had
the least uptake (55mg P plant-1). Inoculation with Legumefix resulted in high uptake (262 mg P
plant-1) compared to Biofix (240 mg P plant-1) and control (148 mg P plant-1). All inoculated plants
had a high amount of N fixed above the control (Figure 3.9).
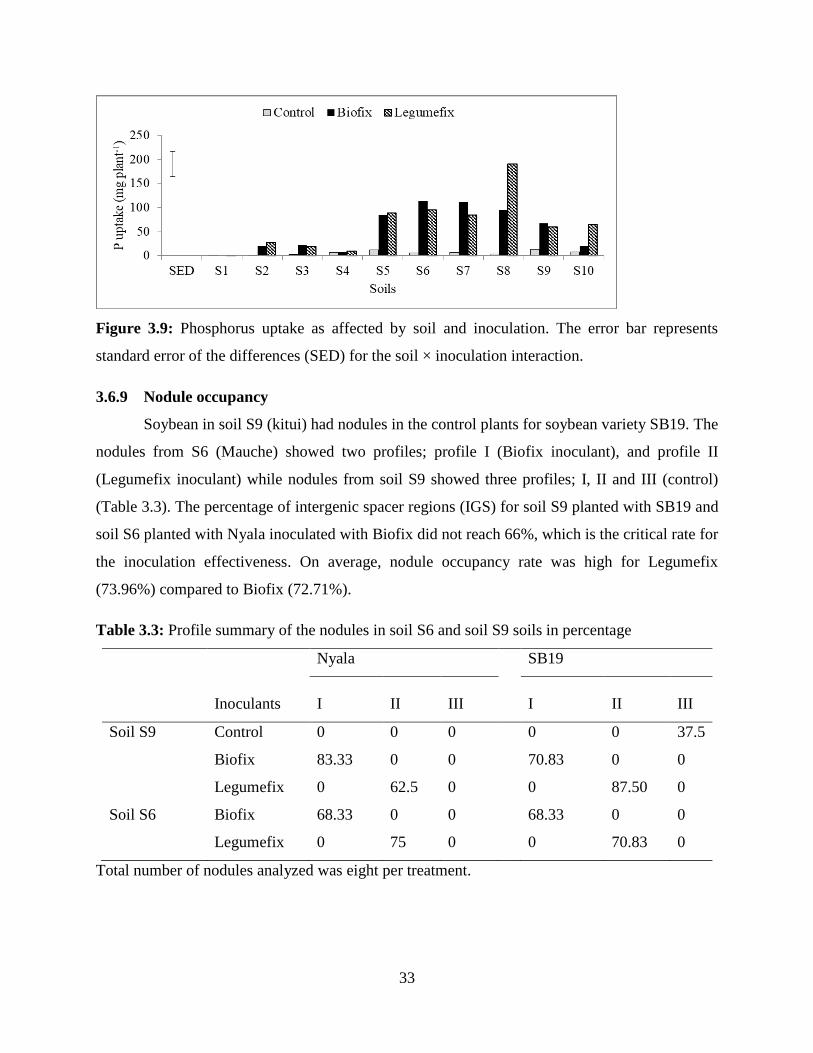
33
Figure 3.9: Phosphorus uptake as affected by soil and inoculation. The error bar represents
standard error of the differences (SED) for the soil × inoculation interaction.
3.6.9 Nodule occupancy
Soybean in soil S9 (kitui) had nodules in the control plants for soybean variety SB19. The
nodules from S6 (Mauche) showed two profiles; profile I (Biofix inoculant), and profile II
(Legumefix inoculant) while nodules from soil S9 showed three profiles; I, II and III (control)
(Table 3.3). The percentage of intergenic spacer regions (IGS) for soil S9 planted with SB19 and
soil S6 planted with Nyala inoculated with Biofix did not reach 66%, which is the critical rate for
the inoculation effectiveness. On average, nodule occupancy rate was high for Legumefix
(73.96%) compared to Biofix (72.71%).
Table 3.3: Profile summary of the nodules in soil S6 and soil S9 soils in percentage
Nyala SB19
Inoculants I II III I II III
Soil S9 Control 0 0 0 0 0 37.5
Biofix 83.33 0 0 70.83 0 0
Legumefix 0 62.5 0 0 87.50 0
Soil S6 Biofix 68.33 0 0 68.33 0 0
Legumefix 0 75 0 0 70.83 0
Total number of nodules analyzed was eight per treatment.
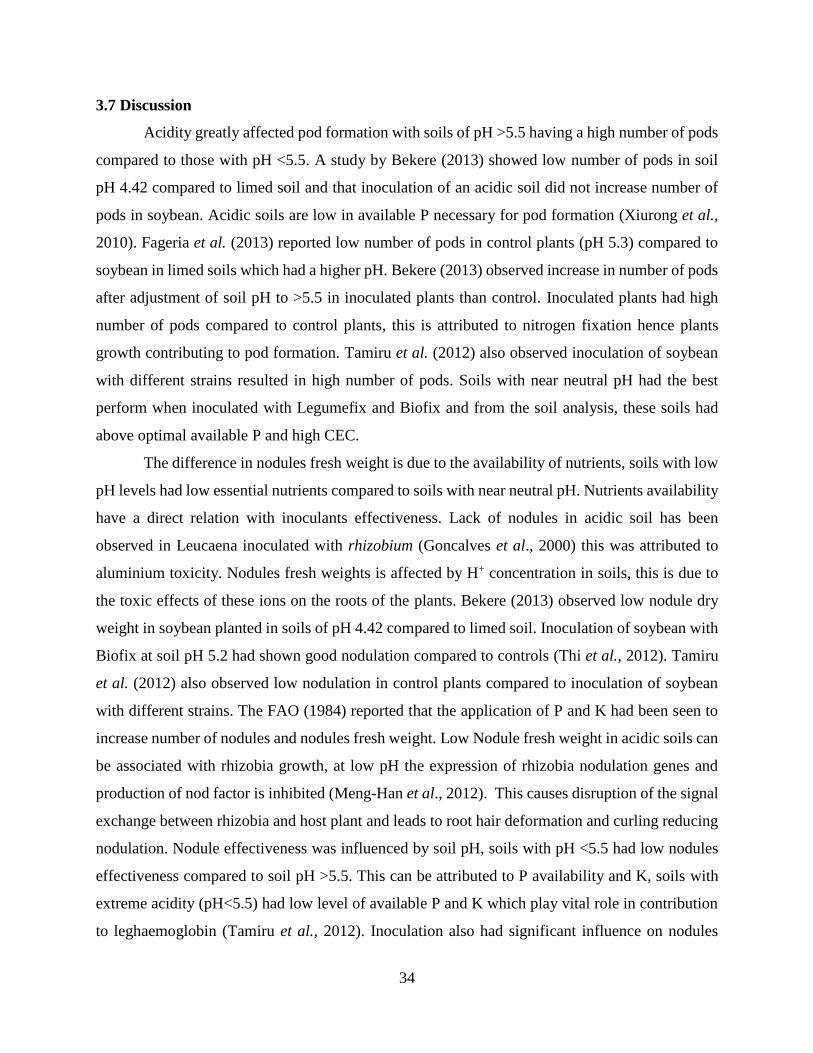
34
3.7 Discussion
Acidity greatly affected pod formation with soils of pH >5.5 having a high number of pods
compared to those with pH <5.5. A study by Bekere (2013) showed low number of pods in soil
pH 4.42 compared to limed soil and that inoculation of an acidic soil did not increase number of
pods in soybean. Acidic soils are low in available P necessary for pod formation (Xiurong et al.,
2010). Fageria et al. (2013) reported low number of pods in control plants (pH 5.3) compared to
soybean in limed soils which had a higher pH. Bekere (2013) observed increase in number of pods
after adjustment of soil pH to >5.5 in inoculated plants than control. Inoculated plants had high
number of pods compared to control plants, this is attributed to nitrogen fixation hence plants
growth contributing to pod formation. Tamiru et al. (2012) also observed inoculation of soybean
with different strains resulted in high number of pods. Soils with near neutral pH had the best
perform when inoculated with Legumefix and Biofix and from the soil analysis, these soils had
above optimal available P and high CEC.
The difference in nodules fresh weight is due to the availability of nutrients, soils with low
pH levels had low essential nutrients compared to soils with near neutral pH. Nutrients availability
have a direct relation with inoculants effectiveness. Lack of nodules in acidic soil has been
observed in Leucaena inoculated with rhizobium (Goncalves et al., 2000) this was attributed to
aluminium toxicity. Nodules fresh weights is affected by H+ concentration in soils, this is due to
the toxic effects of these ions on the roots of the plants. Bekere (2013) observed low nodule dry
weight in soybean planted in soils of pH 4.42 compared to limed soil. Inoculation of soybean with
Biofix at soil pH 5.2 had shown good nodulation compared to controls (Thi et al., 2012). Tamiru
et al. (2012) also observed low nodulation in control plants compared to inoculation of soybean
with different strains. The FAO (1984) reported that the application of P and K had been seen to
increase number of nodules and nodules fresh weight. Low Nodule fresh weight in acidic soils can
be associated with rhizobia growth, at low pH the expression of rhizobia nodulation genes and
production of nod factor is inhibited (Meng-Han et al., 2012). This causes disruption of the signal
exchange between rhizobia and host plant and leads to root hair deformation and curling reducing
nodulation. Nodule effectiveness was influenced by soil pH, soils with pH <5.5 had low nodules
effectiveness compared to soil pH >5.5. This can be attributed to P availability and K, soils with
extreme acidity (pH<5.5) had low level of available P and K which play vital role in contribution
to leghaemoglobin (Tamiru et al., 2012). Inoculation also had significant influence on nodules
35
effectiveness. The control plants did not nodulate (except for Kitui soil (S9) indicating absence of
native rhizobia population specific to soybean. Inoculation was effective based on nodule
effectiveness results hence nitrogen fixation.
Soils with pH <5.5 had low shoot dry weight compared to soils with pH > 5.5. this is
attrubuted to low levels of essential nutrients at pH<5.5 resulting in stunted growth (Keino et al.,
2015). Low shoot biomass in control plants had been observed in many research work while the
inoculated plants response to the inoculants can be attributed to the effectiveness of the inoculant
to influence plant growth (Goncalves et al., 2000). Soil pH had a direct effect on shoot biomass,
this is due to its influence on nutrients availability to plants. Magnesium plays a vital role in plant
growth when it’s limiting like in acidic soils, it interferes with photosynthesis and P reactions
(Keino et al., 2015). Soil P plays an important role in soybean production, when fixed in soils plant
growth is negatively affected. Al toxicity will cause sorption of P, reduced uptake of the basic
cations. Root hairs are also sensitive to H+, this is prone in acidic soils (Goncalves et al., 2000)
thus attributed to lower root biomass regardless of inoculation. Calcium deficiency in acidic soils
affects plants cell growth and root development, impaired roots limits nutrients uptake hence poor
plant growth (Keino et al., 2015).
Nitrogen fixation and uptake is influenced by soil pH; soils with pH <5.5 had low level of
N fixation and uptake compared with soil pH >5.5; this is attributed to poor roots development and
poor nodulation in acidic soils. Nitrogenase activity increases with increasing K in the soil (Keino
et al., 2015) hence high rate of BNF in soils. Nodules effectiveness and BNF are directly related
to number of nodules per plant, hence affected directly as a result of soil pH and nutrient content.
Calcium in soil is used for adhesion by rhizobia hence its deficiency in acidic soils affects rhizobia
attachment, infection and infection thread formation (Meng-Han et al., 2012) hence nitrogen
fixation is negatively affected. The Rhizobium in the inoculants has the ability to solubilize the
precipitated P hence making it available for uptake (Fatima 2007) hence high shoot P in inoculated
plants over the control. The high shoot P in the soils of pH 5.5-6.3 can be attributed to P availability
in the soil hence ease uptake by the plants. Acidic soils have low soil available P due to sorption
on the soil surface. Fageria et al. (2013) observed low shoot P content and they concluded that soil
P uptake influences the number of pods.
36
3.8 Conclusion
Soybean response to inoculation was high in soil of pH range 5.5-6.2, at this range there
was highest % effective nodules, number of pods, nodules fresh weight, shoot and root biomass
among other measured parameters. The soybean varieties did not differ in the measurement of
growth parameters both varieties did better at pH 5.5-6.2. Poor results of nodulation, BNF among
other measured parameters were recorded in acidic soils (pH<5.2) from Murang’a and Kuresoi.
To improve on nodulation and BNF of these soils, there is need for liming.
References
ArcGIS [GIS software]. (2010). Environmental Systems Research Institute, Inc. Version 10.
Redlands, CA.
Bekere, W. (2013). Liming Effects on Yield and Yield Attributes of Nitrogen Fertilized and
Bradyrhizobia Inoculated Soybean (Glycine max L.) Grown in Acidic Soil at Jimma, South
Western Ethiopia. Journal of Biology, Agriculture and Healthcare, 3(7), 2224-3208.
Cooper , J. E. & Schere , H. W. (2012). Nitrogen fixation. Plant-soil relationship, part II, 389-
408.
Climate- Data .org. (2014). Kitui Climate. from Climate - Data.org: https://en.climate-
data.org/africa/kenya/kitui/kitui-11147/. Accesed on 23.02. 2016.
Fageria, N. K., Moreira, A., Castro, C. & Moraes, F. M. (2013). Optimal Acidity Indices for
Soybean Production in Brazilian Oxisols. Communications in Soil Science and Plant
Analysis, 22(20), 2941-2951.
Fatima , Z., Muhammad, Z. & Fayyaz, C. (2006). Effects of Rhizobium Strains and Phosphorus
on Growth of Soy Bean (Glycin Max) and Survival of Rhizobium and P Solubilizing
Bacteria. Pakistan Journal of Botany, 38(2), 459-464.
FAO. (1993). Technical Handbook on Symbiotic Nitrogen Fixation. Rome: Food and Agricultural
Organization of the United Nations.
Ferguson , B. J., Meng-han, L. & Peter , M. (2013). Regulation of legume nodulation by acidic
growth conditions. Plant Signaling & Behavaviour, 8(3), e23426. doi:10.4161/psb.23426
Goncalves, L. M., Moura, V. T., Marques, M. S., Maria, R. & Scotti, M. M. (2000). Effects of
Acidity and Lime on Growth and Nodulation of Leucaena Leucocephala De Wit in
Eucalyptus soil. Indian Journal of Agriculture, 34(4), 229-234.
37
ICRISAT. (2013). Tropical legumes. Retrieved August 2017, from
http://www.icrisat.org/TropicallegumesII/ Bulletin-of-Tropical-Legumes.html
Jaetzold, R., Schmidt, H., Hornetz, B. & Shisanya, C. (2006). Farm Management handbook of
Kenya. Nairobi: Ministry of Agriculture, Kenya, in Cooperation with the German Agency
for Technical Cooperation (GTZ).
Kanyanjua, S., Ired , L., Wambua, S. & Nandwa, S. (2002). Acid soils in Kenya: Constraints and
remedial options. KARI Technical Note.
Keino, L., Fredrick, B., Ng'etich, W., Otinga, A., Okalebo, J. & Njoroge, R. (2015). Nutrients
Limiting Soybean (Glycine max l) Growth in Acrisols and Ferralsols of Western Kenya.
PLOS|ONE, 10(12), e0145202.doi:10.1371/journal.pone.0145202.
Korir, H. (2016). Assement of the Quality and Effectiveness of Plant Growth Promoting
Rhizobacteria on Soybean (Glycine max) and Common Bean (Phaseolus vulgaris) Growth.
Kenya: Egerton University.
Krosova-Wade, T., Ndoye, I., Braconnier, S., Sarr, B., de Lajuide, P. & Neyra, M. (2003).
Diversity of indigenous bradyrhizobia associated with three cowpea cultivars (Vigna
unguiculata L.) (Walp) grown under limited and favorable water conditions in Senegal
(West Africa). Afr J Biotechnology, 2, 13-22.
Lesueur, D., Atieno, M., Mathu, S. & Herrmann, L. (2012). Potential of the commercial inoculant
and native strains for improving legume yields in different land-use systems. Importance
of Rhizobia in Agriculture, 632. EGU General Assembly.
Mary, S. V., Carlos, M. S., Segundo, U. & Robert, M. B. (1955). Quantification of the contribution
of N2 fixation to tropical forage legumes and transfer to association grass. Soil Biology and
Biochemistry, 27, 1193-1200.
Meng-Han, L., Peter, M. G. & Brett, J. F. (2012). Systemic Regulation of Soybean Nodulation by
Acidic Growth Conditions. Plant Physiology, 160(4), 2028-2039.
MoALF. (2016). Climate Risk Profile for Nakuru. Kenya County Climate Risk Profile Series.
Nairobi, kenya: The Kenya Ministry of Agriculture, Livestock and Fisheries (MoALF).
Navarro, E., Simonet, P., Normand, P. & Bardin, R. (1992). Characterization of natural
populations of Nitrobacter spp. using PCR/RFLP analysis of the ribosomal intergenic
spacer. Archives of Microbiology, 157, 107-115.

38
Nisa, R., Hanum, H. & Aris, T. (2012). Greenhouse experiments of symbiotic effectiveness of
acid-tolerance Bradyrhizobium japonicum strains on soybean plant. International
Conference on Applied Life Sciences (pp. 337-342). Turkey: INTECH.
Okalebo, J. R., Kenneth, L. & Gathua, W. (2002). Laboratory Methods of Soil and Plant Analysis
:a working manual (pp.34-62). Nairobi - Kenya: SACRED Africa.
Osundwa , M. A., Okalebo, J. R., Ngetich, W. K., Ochuodho , J. O., Othieno , C. O., Langat, B. &
Omenyo, V. S. (2013). Influence of Agricultural Lime on Soil Properties and Wheat
(Triticum aestivum L.) Yield on Acidic Soils of Uasin Gishu County, Kenya. American
Journal of Experimental Agriculture, 3(4), 806-823.
Ponsonnet, C. & Nesme, X. (1994). Identification of Agrobacterium strains by PCR-RFLP analysis
of pTi and chromosomal regions. Archives of Microbiology, 161, 300-309.
Rutherford, P. M., McGill, W. B., Arocena, J. M. & Figueiredo, C. T. (2008). Total nitrogen. In
M. R. Carter, and E. G. Gregorich, Soil Sampling and Methods of Analysis (pp. 239-249).
New York: Taylor and Francis.
SAS softaware version 9.4. (2016). SAS Institute Inc. Cary, NC, USA: Licensed to Institute of
Tropical Agriculture.
Sikka, R., Singh, D. & Deol, J. S. (2012). Productivity and nutrient uptake by soybean as
influenced by intergrated nutrient and some other agronomic management practices.
Legume Resources, 36(6), 545-551.
Somasegaran, P. & Hoben, J. H. (1985). Selecting Effective Strains of Rhizobia in Potted Field
Soil. In P. Somasegaran, and H. H. J, Niftal Training Manual. Hawaii: University of
Hawaiii.
Tamiru, S., Lalit, M. P. & Tsige, A. (2012). Effects of Inoculation by Bradyrhizobium japonicum
Strains on Nodulation, Nitrogen Fixation, and Yield of Soybean (Glycine max L. Merill)
Varieties on Nitisols of Bako, Western Ethiopia. ISRN Agronomy, 2012(261475), 8.
doi:http://dx.doi.org/10.5402/2012/261475. Accessed on 01.02.2017.
Thi , A. T., Bancha, B., Pongdet, P. & Aphakron, L. (2012). Enhanced soybean biomass by co-
inoculation of Bradyrhizobium Japonicum and plant growth promoting rhizobacteria and
it's effects on microbial community structure. African Journal of Microbiology Research,
7(29), 3858-3873.

39
Thuita, M., Bernard , V., Mutegi, E. & Masso, C. (2018). Reducing spatial variability of soybean
response to rhizobia inoculants in farms of variable soil fertility in Siaya County of western
Kenya. Agriculture, Ecosystems and Environment, 8. doi: https://doi.org/10.1016/j.agee.
Accessed on 01.07.2018.
Thuita, M., Pieter, P. & Laetitia, H. (2011). Commercial rhizobial inoculants significantly enhance
growth and nitrogen fixation of a promiscuous soybean varierty in Kenyan soils. Biol Fertil
soils, 48, 87-86.
Unkovich , M., Herridge, D., Peoples, M., Cadisch, G., Boddey, R., Giller, K. & Chalk, P. (2008).
Measuring plant-associated nitrogen fixation in agricultural systems. ACIAR Monograph
No, 136, 258.
Xiurong, W., Xiurong , Y. & Hong, L. (2010). Genetic improvement for phosphorus efficiency in
soybean: a radical approach. Oxford Journal, 106, 215-222.
Zarei, I., Sohrabi, Y., Heidari, G. R., Jalilian, A. & Mohammadi, K. (2012). Effects of biofertilizers
on grain yield and protein content of two soybean (Glycine max L.) cultivars. African
Journal of Biotechnology, 11(27), 7028-7037.

40
CHAPTER FOUR
EVALUATION OF LIME REQUIREMENT METHODS AND THE EFFECTS OF
AGRICULTURAL LIME AND MIJINGU PHOSPHATE ROCK ON SELECTED
ACIDIC SOILS
4.1 Abstract
Soil acidity is a major problem in Kenyan arable lands and liming using accurate lime
estimation method and effective materials are necessary when ameliorating acidic soils. A
laboratory incubation study using soils from Kuresoi (pH 4.9) and Murang’a (pH 5.0) was set up
using agricultural lime and Mijingu phosphate rock (MPR) as liming materials. Exchangeable
acidity and Shoemaker-Mclean-Pratt (SMP) used as lime requirement methods (LRM) and the
experiment laid in completely randomized design (CRD). Soil pH was measured every two weeks
for 12 weeks using destructive sampling and pH measured in 1:2.5 soil/ water ratio. Available P
was determined after the twelfth week of incubation using Olsen P and Mehlich available P
methods. The data were subjected to analysis of variance and t-test done between the two LRM.
Soil liming with agricultural lime increased soil pH (5.6) compared to liming with MPR (5.4). The
SMP method recommended high amount of lime (agricultural lime 32 T Ha-1 and MPR 95 T Ha-
1) compared to exchangeable acidity method (agricultural lime 6.2 T Ha-1 and MPR 4.55 T Ha-1).
Liming with exchangeable acidity rates did not increase soil pH to > 5.5. Olsen available P in soils
amended with MPR was higher (45 mg kg-1) compared to those amended with agricultural lime
(37 mg kg-1). The results of this study suggest that 2 weeks of soil-lime incubation is sufficient in
raising soil pH. Agricultural lime had the high (78.9%) effective calcium carbonate equivalent
compared to MPR (65.2%) indicating that lime quality plays a major role in its effectiveness.
Keywords: Exchangeable acidity, Shoemaker-Mclean-Pratt, Agricultural lime, Mijingu phosphate
rock, Lime requirement method, soil pH
41
4.2 Introduction
Kenya has about 13% arable land affected by soil acidity, this is nearly 7.5 million ha, and
majority of this land occur in high rainfall area with medium to high potential agricultural
productivity, including the highlands east of Rift valley. Sources of soil acidity include leaching
of basic cations, release of the proton during major nutrient cycles (C, N and S) in the soil-plant
systems, poor farm management practices including use of acidifying fertilizers. The cause of
acidic soils in Kenya include leaching of basic cations due to high rainfall leaving Al3+, H+, Fe2+
and Mn3+ as predominant cations (Obura, 2008), and also the non-calcareous parent material that
Kenyan soils develop from are acidic in nature.
The effects of soil acidity on plants include poor yields, poor root growth, and poor nutrient
uptake especially for Ca, P, Mg, Mo and K ( Oguntoyinbo et al., 1996). Soil acidity also reduces
organic matter breakdown and nutrient cyclying by microflora. Soil liming increases the
availability of basic cations, reduces the concentration of toxic levels of Al and increases P
availability hence increasing soil pH (Mesfin et al., 2014). Different lime product are available in
the market and the most common being agricultural lime. Due to the cost associated with lime,
accessibility, labor in application, and low demand by farmers due to lack of knowledge about soil
liming results in its limited use among farmers.
Lime rates are determined by its calcium carbonate equivalence (CCE) and fineness factor
hence the effective calcium carbonate equivalence (ECCE) or the total neutralizing value. Lime
requirement (LR) is the amount of lime needed to neutralize soil acidity to the desired level
(Thomas, 1996). Thus for lime to be considered effective, it should be applied at the recommended
rate considering its ECCE and choosing a suitable lime requirement method (LRM). An optimal
incubation period of 14-28 days recommended after lime addition before planting (Ezekiel, 2007;
John & Antonio , 2016 and Opala et al. 2012). Lime requirement is affected by factors such nature
of acidity, neutralizing sequence (initial and desired pH), soil properties including parent material
and texture and organic matter content (Thomas, 1996). The buffering capacity of the soil is also
an important factor in soil liming; this is the ability of soil to resist change in pH after lime addition.
Soils with high buffer capacity (soils with high amount of clay, oxides and organic matter) require
much lime compared to soils with low buffering capacity.
Soil liming should consider the concentration of Al3+ ions as liming to <0.1meq Al/ 100g
soil has been seen to have an impact on plants like sorghum and soybean (Reeve & Summer, 1980).
42
Exchangeable acidity LRM is suitable in highly weathered soils and in lime recommendation; the
value of exchangeable acidity multiplied by a factor of 1.5 or 2 depending on crop sensitivity to
acidity (Thomas, 1996). Application of lime increases Ca2+ and Mg2+ and reduces Al3+, H+, Mn2+
and Fe3+ thus increasing soil pH and available P.
The Shoemaker-McLean-Pratt (SMP) LRM relies on soil-buffer pH measurement and it
was first developed in incubated soils of Ohio (Shoemaker et al., 1961). The method is suited for
soils with <5.8 pH, LR >4.5tons ha-1 and organic matter <10%. Once the soil-buffer pH has been
determined the LR table for SMP is used to estimate the amount of lime to be applied and this is
adjusted based on CCE >100% and fineness factor for the top 20cm of soil depth. SMP method is
not widely used as a LRM. Nuwamanya (1984) found a good correlation between SMP and
CaCO3- incubation study. The study concluded that SMP- double buffer method is suitable for
lime estimation for acidic soils in Kenyan. Kenya acidic soil have high level of exchangeable Al3+
thus exchangeable acidity has been used in lime requirement determination. Methods, frequency,
depth, and time of application are important factors on lime efficiency. Various methods can be
used to apply lime including spot application, band application, and broadcasting together with
incorporation is the most recommended method of lime application due to its effectiveness.
Agricultural lime (quick lime- CaO) is one of the lime materials used in Kenya. Athi river
mining company and Koru mining companies are major manufacturers. It is effective in improving
yield when used alone as well as in combination with other fertilizers (Nekesa et al., 2011).
Mijingu phosphate rock (MPR) mined in northern Tanzania used as P source and liming effects
and its recommended application rate is 60 kg Ha-1 (Opala et al., 2012). Lime requirement methods
for Kenyan acidic soils are not clear thus farmers may be miss-guided on the rate and timing of
application. In addition, there is lack of information of effectiveness of lime materials in Kenyan
soils and this could lead to ineffectiveness of applied lime to raise pH due to underestimation/
overestimation. This research work will determine the most effective lime material to raise soil pH
using LRM exchangeable acidity and SMP and liming materials agricultural lime and MPR.
4.3 Materials and methods
4.3.1 Soil collection and analysis
Top Soil (0-20cm) were obtained from Rift Valley Nakuru County (Kuresoi) and central
region in Murang’a County (Kangema) in Kenya. The soils were sieved through a 2mm sieve and
43
their initial characteristic determined (Chapter 3). The soil physical and chemical characteristics
were determined following procedures described in Okalebo et al. 2002. The initial soil pH was
determined in 1:2.5 soil/ water using the glass electrode pH meter, soil particle size analysis was
determined using hydrometer method, total nitrogen using Kjeldahl method and soil organic
carbon using Walkley-black method. The available phosphorus, exchangeable cations (Ca, Mg, K,
and Na) and micronutrients (Cu, Zn, Fe, and Mn) were extracted using Mehlich 3 method and
amounts determined using atomic absorption spectrometer.
4.3.2 Lime analysis
Agricultural lime and Mijingu phosphate rock were used as lime materials and their
calcium carbonate equivalence (CCE) was determined by back titrating a 6N HC1 solution of each
lime material with NaOH to a phenolphthalein end point (Jian-Ling et al., 2010). Lime materials
fineness was determined by sieving through a 2mm and a 0.25mm (John, 2016). The values of
fineness together with CCE were to determine the effective CCE of the lime materials (Table 4.2).
4.3.3 Methods of lime estimation
4.3.3.1 Exchangeable acidity
The soil exchangeable acidity was determined by weighing 5g of each soil in replicate in
plastic bottles and adding 50ml of 1N KCl followed by shaking for 30 minutes and centrifuging at
700 rpm for 10 minutes. The samples then filtered through Whatman filter paper No.40 and the
extract titrated with 0.1M standardized NaOH using phenolphalein indicator (Thomas, 1996).
Lime requirement was calculated using exchangeable acidity cmolcKg-1 as shown below:
Lime requirement T Ha-1= Exchangeable acidity (cmolc Kg-1) × 2
4.3.3.2 Shoemaker-Mclean-Pratt (SMP) double buffer method
The SMP buffer was prepared as described in Thomas (1996). Five grams of each soil
weighed into plastic bottles and 5ml of distilled water added to each sample and shaking them for
10 minutes. The soil pH was then determined using glass electrode pH meter and then 10ml of the
SMP buffer was added to each bottle and shaken again for 10minutes. The pH reading for soil-
buffer suspension recorded after 15 minutes. Lime requirement for the target pH was determined
using the SMP table taking into consideration the CCE and lime fineness. The experiment was in
CRD and replicated three.
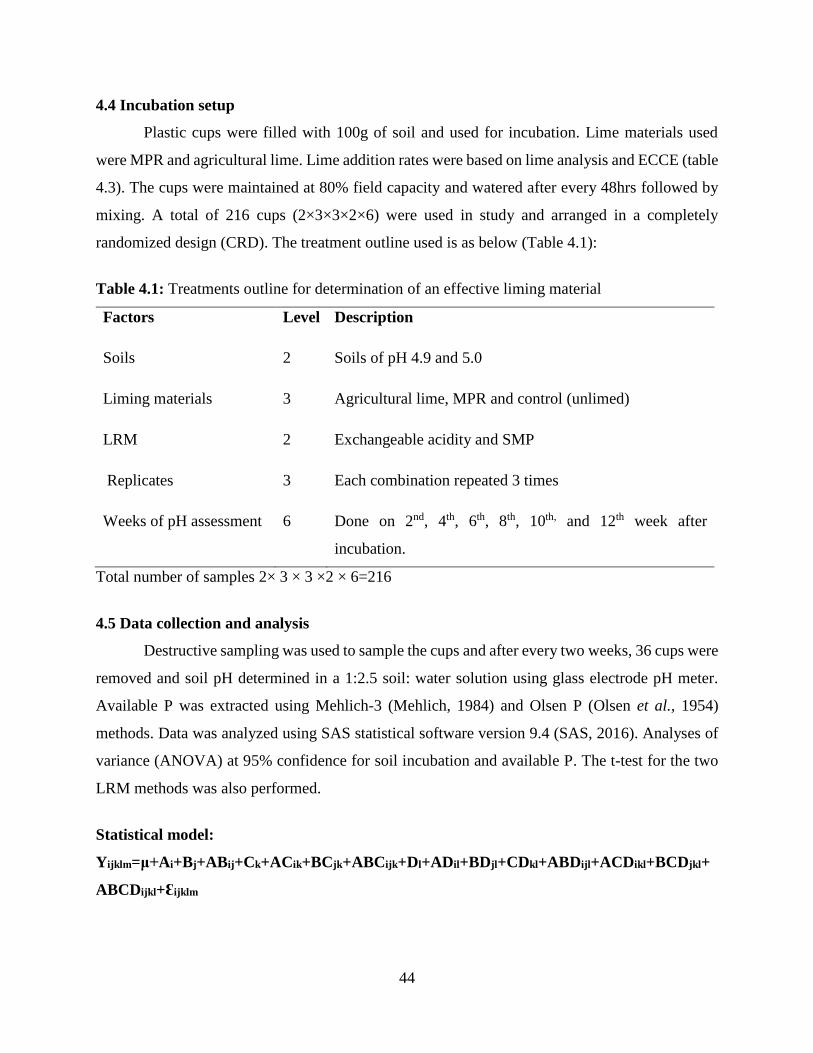
44
4.4 Incubation setup
Plastic cups were filled with 100g of soil and used for incubation. Lime materials used
were MPR and agricultural lime. Lime addition rates were based on lime analysis and ECCE (table
4.3). The cups were maintained at 80% field capacity and watered after every 48hrs followed by
mixing. A total of 216 cups (2×3×3×2×6) were used in study and arranged in a completely
randomized design (CRD). The treatment outline used is as below (Table 4.1):
Table 4.1: Treatments outline for determination of an effective liming material
Factors Level Description
Soils 2 Soils of pH 4.9 and 5.0
Liming materials
LRM
3
2
Agricultural lime, MPR and control (unlimed)
Exchangeable acidity and SMP
Replicates
Weeks of pH assessment
3
6
Each combination repeated 3 times
Done on 2nd, 4th, 6th, 8th, 10th, and 12th week after
incubation.
Total number of samples 2× 3 × 3 ×2 × 6=216
4.5 Data collection and analysis
Destructive sampling was used to sample the cups and after every two weeks, 36 cups were
removed and soil pH determined in a 1:2.5 soil: water solution using glass electrode pH meter.
Available P was extracted using Mehlich-3 (Mehlich, 1984) and Olsen P (Olsen et al., 1954)
methods. Data was analyzed using SAS statistical software version 9.4 (SAS, 2016). Analyses of
variance (ANOVA) at 95% confidence for soil incubation and available P. The t-test for the two
LRM methods was also performed.
Statistical model:
Yijklm=μ+Ai+Bj+ABij+Ck+ACik+BCjk+ABCijk+Dl+ADil+BDjl+CDkl+ABDijl+ACDikl+BCDjkl+
ABCDijkl+Ԑijklm
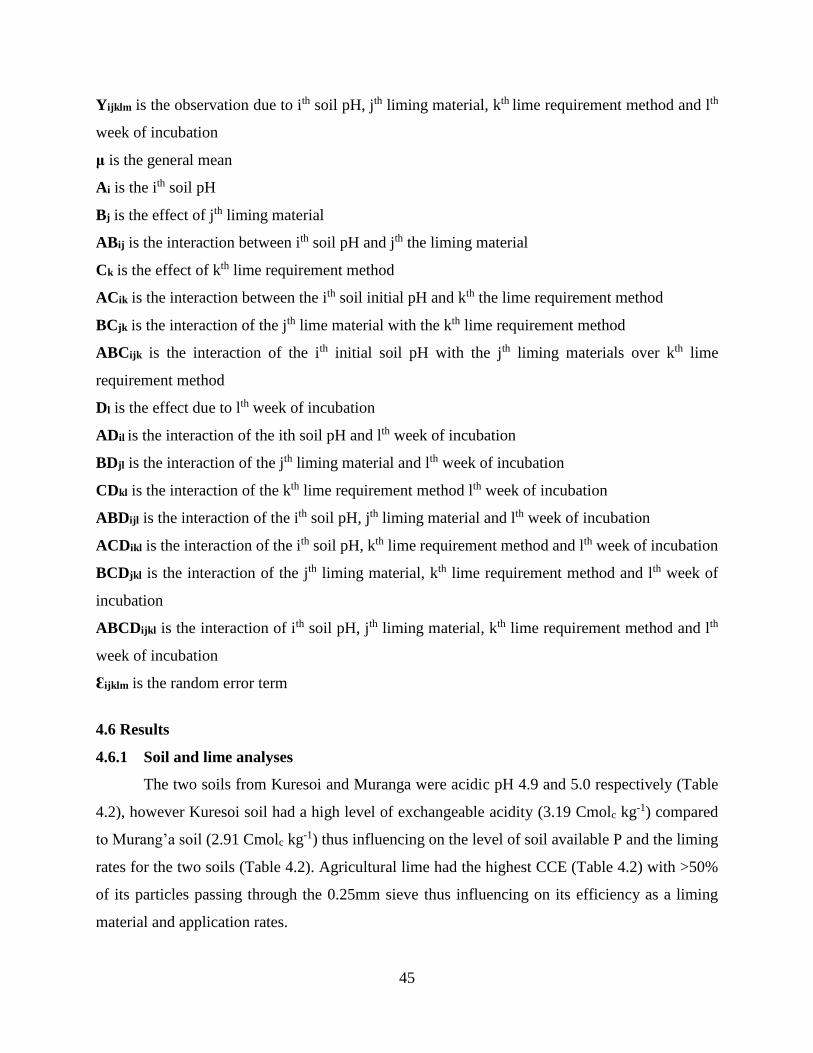
45
Yijklm is the observation due to ith soil pH, jth liming material, kth lime requirement method and lth
week of incubation
μ is the general mean
Ai is the ith soil pH
Bj is the effect of jth liming material
ABij is the interaction between ith soil pH and jth the liming material
Ck is the effect of kth lime requirement method
ACik is the interaction between the ith soil initial pH and kth the lime requirement method
BCjk is the interaction of the jth lime material with the kth lime requirement method
ABCijk is the interaction of the ith initial soil pH with the jth liming materials over kth lime
requirement method
Dl is the effect due to lth week of incubation
ADil is the interaction of the ith soil pH and lth week of incubation
BDjl is the interaction of the jth liming material and lth week of incubation
CDkl is the interaction of the kth lime requirement method lth week of incubation
ABDijl is the interaction of the ith soil pH, jth liming material and lth week of incubation
ACDikl is the interaction of the ith soil pH, kth lime requirement method and lth week of incubation
BCDjkl is the interaction of the jth liming material, kth lime requirement method and lth week of
incubation
ABCDijkl is the interaction of ith soil pH, jth liming material, kth lime requirement method and lth
week of incubation
Ԑijklm is the random error term
4.6 Results
4.6.1 Soil and lime analyses
The two soils from Kuresoi and Muranga were acidic pH 4.9 and 5.0 respectively (Table
4.2), however Kuresoi soil had a high level of exchangeable acidity (3.19 Cmolc kg-1) compared
to Murang’a soil (2.91 Cmolc kg-1) thus influencing on the level of soil available P and the liming
rates for the two soils (Table 4.2). Agricultural lime had the highest CCE (Table 4.2) with >50%
of its particles passing through the 0.25mm sieve thus influencing on its efficiency as a liming
material and application rates.

46
Use of exchangeable acidity method resulted in low lime rates for both agricultural lime
and MPR compared to SMP method (table 4.3). Liming rate for MPR was high (Kuresoi soil 100
T Ha-1 while Murang’a soil 89 T Ha-1), for agricultural lime it required 34 T Ha-1 of lime to raise
the pH to 6.0 for Kuresoi soil and 30 T Ha-1 of lime for Murang’a soil.
Table 4.2: Soil physical and chemical characteristics and lime analyses
Parameters Kuresoi Murang'a
pH (H2O 1:2.5) 4.9 5.0
pH (SMP buffer 1:2) 5 5.0
Exchangeable acidity (cmolc kg-1) 3.19 1.94
Ca 2.41 1.17
Mg 0 0
K 1.51 1.09
Organic carbon (%) 2.97 1.76
Total N (%) 0.23 0.27
Mehlich P (mg kg-1) 15 20
Texture
Sand (%) 51 65.6
Silt (%) 34.7 23.4
Clay (%) 14.3 11
Textural class Loam Sandy loam

47
Table 4.3: Lime application rates in T Ha-1 determined by soil exchangeable acidity and
Shoemaker-Mclean-Pratt lime requirement methods
Lime characteristic Agricultural lime MPR
Moisture content (%) 0.53 8.09
pH (H2O 1:2.5) 8.6 9
CCE 78.9 65.2
Fineness% (sieve method)
pass >2mm 0.17 48.78
pass 0.25-2mm 40.97 36.94
pass <0.25mm 58.86 14.28
Lime requirement method Lime material Rates T Ha-1
Kuresoi Murang'a
Exchangeable acidity Agricultural lime 7.5 4.9
MPR 3.95 5.15
SMP Agricultural lime 34 30
MPR 101 89
4.6.2 Soil incubation
Soils, lime materials, lime requirement methods and weeks of incubation had significant
influence on soil pH at p<0.05. Kuresoi soil had average high soil pH 5.4 compared to Murang’a
soil pH 5.1 regardless of lime materials, lime requirement methods and weeks of incubation. Soil
liming with agricultural lime resulted in increase in soil to pH 5.6 while soil liming with MPR
resulted to change in soil pH to 5.4 and control had soil pH 4.7 on average. Lime estimation using
SMP method resulted in increase in soil pH to 5.5 while lime application based on exchangeable
acidity estimates resulted in low soil pH 5.0. After the second week of soil incubation, there was
increase of soil pH to 5.5 and in the fourth and sixth week soil pH dropped to 5.4, there was further
drop in soil pH to 5.3 in the eighth, tenth and twelfth week of incubation. The interaction of soil,
lime materials, lime requirement methods and weeks of incubation was not significant (Appendix
3), however, the interaction of soil, lime materials and lime requirement methods and interaction
of lime with weeks of incubation were significant p<0.05. Soil liming with agricultural lime
estimated by SMP method resulted in increase of soil pH to 6.0 for both Murang’a and Kuresoi
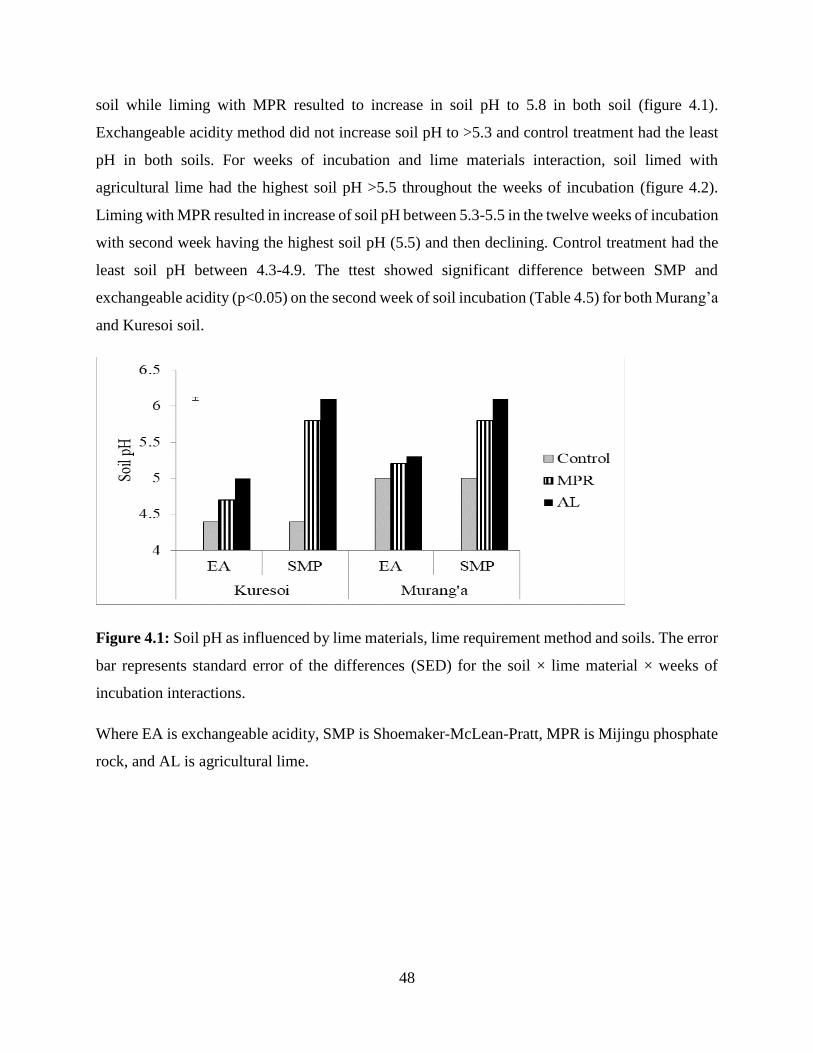
48
soil while liming with MPR resulted to increase in soil pH to 5.8 in both soil (figure 4.1).
Exchangeable acidity method did not increase soil pH to >5.3 and control treatment had the least
pH in both soils. For weeks of incubation and lime materials interaction, soil limed with
agricultural lime had the highest soil pH >5.5 throughout the weeks of incubation (figure 4.2).
Liming with MPR resulted in increase of soil pH between 5.3-5.5 in the twelve weeks of incubation
with second week having the highest soil pH (5.5) and then declining. Control treatment had the
least soil pH between 4.3-4.9. The ttest showed significant difference between SMP and
exchangeable acidity (p<0.05) on the second week of soil incubation (Table 4.5) for both Murang’a
and Kuresoi soil.
Figure 4.1: Soil pH as influenced by lime materials, lime requirement method and soils. The error
bar represents standard error of the differences (SED) for the soil × lime material × weeks of
incubation interactions.
Where EA is exchangeable acidity, SMP is Shoemaker-McLean-Pratt, MPR is Mijingu phosphate
rock, and AL is agricultural lime.

49
Figure 4.2: Soil pH as influenced by liming materials and weeks of incubation. The error bar
represents standard error of the differences (SED) for the soil lime material and weeks of
incubation interaction.
4.6.3 Soil available phosphorus
Soil available P for the two soils was not significantly different based on Mehlich 3 method.
Lime requirement method and lime materials had significant influence on soil available P at p<0.05
(Appendix 4). The three-way interaction of soil × lime × lime requirement method was significant
for Mehlich available P (p<0.05). Soil liming with Mijingu phosphate rock resulted in high
Mehlich 3 available P 156.67 mg kg-1 (Figure 4.3) with liming rates determined by SMP method.
There was increase in soil available P in soils limed with agricultural lime (78 mg P kg-1 Kuresoi
soil and 36.67 mg P kg-1 Murang’a soil) based on SMP liming rates compared to exchangeable
acidity (16.67 mg P kg-1 Kuresoi soil and 21.67 mg P kg-1 Murang’a soil).
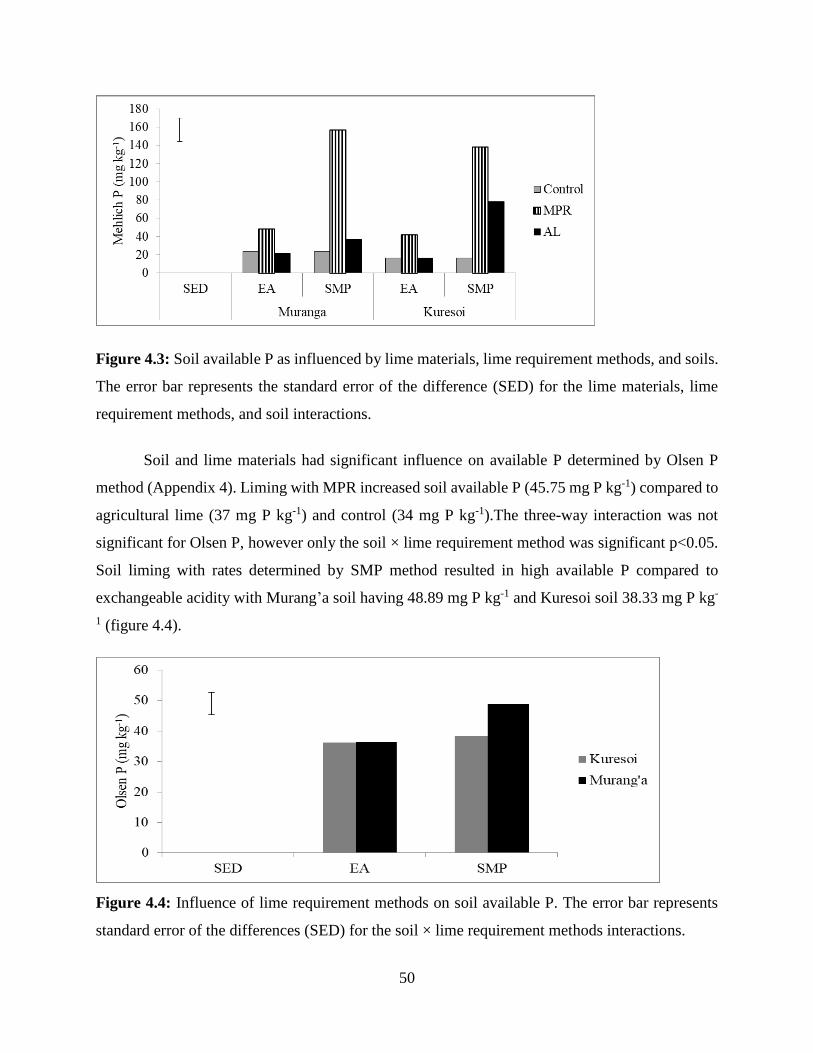
50
Figure 4.3: Soil available P as influenced by lime materials, lime requirement methods, and soils.
The error bar represents the standard error of the difference (SED) for the lime materials, lime
requirement methods, and soil interactions.
Soil and lime materials had significant influence on available P determined by Olsen P
method (Appendix 4). Liming with MPR increased soil available P (45.75 mg P kg-1) compared to
agricultural lime (37 mg P kg-1) and control (34 mg P kg-1).The three-way interaction was not
significant for Olsen P, however only the soil × lime requirement method was significant p<0.05.
Soil liming with rates determined by SMP method resulted in high available P compared to
exchangeable acidity with Murang’a soil having 48.89 mg P kg-1 and Kuresoi soil 38.33 mg P kg-
1 (figure 4.4).
Figure 4.4: Influence of lime requirement methods on soil available P. The error bar represents
standard error of the differences (SED) for the soil × lime requirement methods interactions.
51
4.7 Discussion
An increase in soil pH after liming indicates the ability of liming material to reduce the H+
activity (Oguntoyinbo et al.,2008) and precipitation of exchangeable and soluble Al in the soil
solution (Opala et al., 2012). The high CCE of agricultural lime increase its ability to increase soil
pH compared to MPR. The low effect of MPR on soil pH compared to agricultural lime is due to
the fineness of lime particles. Agricultural lime had >50% of its particles passing the <0.25mm
sieve while MPR had more of coarse particles, fine particles in the lime increase lime dissolution
in the soil hence more efficiency in raising soil pH (Kym et al., 2010). Mijingu phosphate rock has
been found to have low solubility affecting its use as a lime material alone, however, its
combination with farmyard manure (Opala et al., 2012) or agricultural lime has been seen to reduce
acidity (Nekesa et al., 2011) and increase available P as shown in this study. Soil incubation studies
have shown changes in soil pH after liming within the second week (Mercy & Ezekiel, 2007). The
decline in soil pH after four weeks of incubation is due to maximum lime absorption by the soil
colloids.
Application of lime based on SMP method has been found to be effective in raising soil
pH to target pH of 6.0 compared to exchangeable acidity. Exchangeable acidity has been on its
own not to be a suitable method in lime requirement (Ssali & Nuwamanya, 1981) and researchers
recommend using it along with residual acidity (Mehlich et al., 1976). Mehlich (1976)
recommended the use of Mehlich buffer for determining lime requirement of acid tropical soils,
however, Ssali & Nuwamanya (1981) found that the method underestimates lime requirement.
Incubation of soil with calcium carbonate as a reference method gave a lime requirement of 15-21
T Ha-1 (Ssali & Nuwamanya, 1981) and they observed that SMP was accurate in determining lime
requirement for soils with high or low liming needs. The findings of the current study was in
contrast with those found by Husni et al. (1994), concluded that SMP overestimates lime for soils
with high lime requirements and underestimates for those with low lime requirements and he
attributed this to the predominance of H+ and Al3+ in the soils. Exchangeable acidity is suitable
only when liming soil to pH 5.5 (Ssali & Nuwamanya, 1981).
Liming of acidic soil has been to increase soil available P (Raij & Quaggio, 1990) and this
due to release of P from Al and Fe with the reduction in soil acidity. Calcium in the extracting
solution of Olsen P prevents dissolution of labile P thus underestimating the amount of Olsen P
(Raij & Quaggio, 1990; Mercy et al., (2007). Mercy et al. (2007) also observed an increase in soil
52
available P in limed soils over the without-lime, however, a reduction in soil available P has been
observed with high rates of liming (Fageria et al., 1995). Mijingu phosphate rock has high amount
of P compared to agricultural lime this is due to initial levels of P in MPR. Soil lime estimation by
exchangeable acidity method resulted in low level of available P for both Mehlich P and Olsen P
compared to SMP method, indicating its unsuitability in amelioration of acidic soil.
The SMP method recommended high liming rates compared to exchangeable acidity this
was due to the buffering capacity of the soils. Exchangeable acidity method only considered Al
and H ions while SMP consider the buffering capacity of the soil. The greater the buffering
capacity, the greater the quantity of base used to alter the pH (Thomas, 1996). Soil rich in organic
matter with a high buffering capacity would require more lime in order to raise the pH. Previous
studies have revealed that soil buffering capacity is governed mostly by acidic functional groups,
dissolution or precipitation of carbonates and CEC, in soils with pH> 4.5 (Nelson & Su, 2010).
Soil carbonates and nonacidic exchangeable cations can also buffer pH; carbonates consume added
hydrogen carbonates and exchangeable non-acid cations exchange with hydrogen carbonates,
removing it from solution.
4.8 Conclusion
Agricultural lime was most effective in raising soil pH based on the SMP LRM. There was
an increase in Olsen P and Mehlich available P to above optimal level when soils were limed based
on SMP rates. Although soil limed with MPR had high amounts of available P, its use as a liming
material is limited to its low CCE and particle size giving it a high recommendation rates compared
to agricultural lime. This study suggests more research to be conducted on field calibration of the
SMP method and recommendation on the split application of liming materials to avoid the
incidence of under/ over liming.
References
Fageria, N. K., Zimmermann, F. J. & Baligar, V. C. (1995). Lime and Phosphorus Interaction on
Growth and Nutrient Uptake by Upland Rice, Wheat, Common Bean and Corn in an
Oxisoil. Journal of Plant Nutrition, 18, 2519-2532.
53
Husni, H. A., Shanthi, D., Peli, M. & Anuar, A. R. (1994). Lime requirement determination of
tropical peat soil using buffer‐pH methods. Communications in Soil Science and Plant
Analysis, 25(13), 2467-2480.
Jian-Ling, F., Noura, Z., Bernard, G. & Zheng-Yi, H. (2010). Soil phosphorus fractions following
annual paper mill biosolid and liming materials application. Canadian Journal of Soil
Science, 90, 467-479.
John , D. & Antonio , P. M. (2016). Influence of Sources and Particle Size on Agricultural
Limestone Efficiency at Increasing Soil pH. North Central Extension-Industry Soil
Fertility Conference. 32, pp. 91-96. Des Moines, IA: International Plant Nutrition Institute
Kym, M. W., Leigh, A. S., Angus, E. M., Col, R. A., Edward, D. B. & Scott, G. J. (2010).
Effectiveness of Lime Particle size in the Neutralisation of Sulfidic Acid Sulfate Soil
Materials. Brisbane, Australia: World Congress of Soil Science, Soil Solutions for a
Changing World.
Mehlich, A., Bowling, S. & Hatfield, A. (1976). Buffer pH acidity in relation to nature of soil
acidity and expression of lime requirement. Communications in Soil Science and Plant
Analysis, 7, 253-263.
Mehlich, A. (1984). Mehlich 3 Soil Test Extractant: A Modification of Mehlich 2 Extractant.
Communication in Soil Science and Plant Analysis, 15(12), 1409–1416.
Mercy, O. A. & Ezekiel, A. A. (2007). Lime effectiveness of some fertilizers in a tropical acid
alfisol. Journal of Central Europe Agriculture, 8(1), 17-24.
Nekesa, A. O., Okalebo, J. R., Othieno, C. O., Thuita, M. N. & Batiano, A. (2011). The potential
of increased maize and soybean production in Uasin Gishu District, Kenya, resulting from
soil acidity amendment using Mijingu phosphate rock and agricultural lime. Springer, DOI
10.1007/978-90-481-2543-2_34, 343-348.
Nelson, P. N. & Su, N. (2010). Soil pH buffering capacity: a descriptive function and its application
to some acidic tropical soils. Soil Research, 48, 201-207.
Nuwamanya, J. K. (1984). The effect of lime levels on the growth of beans and maize and
nodulation of beans in three tropical acid soils. Communications in Soil Science and Plant
Analysis, 15(9), 1017-1027.
Obura, P. A. (2008). Effects of soil properties on bioavailabilty of aluminium and phosphorus in
selected Kenyan and Brazilian soils. USA: Purdue University.

54
Oguntoyinbo, F. I., Aduayi, E. A. & Sobulo, R. A. (1996). Effectiveness of some local liming
materials in Nigeria as Ameliorants of soil acidity. Journal of Plant Nutrition, 19(7), 999-
1016.
Oguntoyinbo, F. I., Aduayi, E. A. & Sobulo, R. A. (2008). Effectiveness of some local liming
materials in Nigeria as Ameliorants of soil acidity. Journal of Plant Nutrition, 19(7), 999-
1016.
Okalebo, J. R., Kenneth, L. & Gathua, W. (2002). Laboratory Methods of Soil and Plant Analysis
:a working manual (pp.34-62). Nairobi - Kenya: SACRED Africa.
Olsen , S., Cole , C., Watanabe , F. & Dean , L. (1954). Estimationof available phosphorus in soils
by extraction withsodium bicarbonate. Office Washington D.C: US Goverment Print.
Opala, P. A., Okalebo, J. R. & Othieno, C. O. (2012). Effects of organic and inorganic materials
on soil acidity and phosphorus availablity ina soil incubation study. International Scholarly
Research Network, doi:10.5402/2012597216, Article ID 597216 10 pages.
Raij, V. B. & Quaggio, J. A. (1990). Extractable phosphorus availability indexes as affected by
liming. Communications in Soil Science and Plant Analysis, 21(13), 1267-1276.
SAS softaware version 9.4. (2016). SAS Institute Inc. Cary, NC, USA: Licensed to Institute of
Tropical Agriculture.
Shoemaker, H. E., McLean, E. O. & Pratt, P.F. (1961). Buffer methods for determining lime
requirement for soil with appreaciable amounts of extractable aluminium. Soil Science
Society of America proceedings, 25, 275-277.
Ssali, H. & Nuwamanya, J. (1981). Buffer pH methods for estimation of lime requirement of
tropical acid soils. Communications in Soil Science and Plant Analysis, 12(7), 643-659.
Thomas, S. J. (1996). Lime Requirement. In S. D. L, Soil Science Society of America (pp. 491-
515). Madison: Soil Science Society of America.
55
CHAPTER FIVE
EFFECT OF LIMING AND INOCULATION ON SOYBEAN NODULATION AND
BIOLOGICAL NITROGEN FIXTION
5.1 Abstract
Soil acidity is a major limiting factor to crop production and acidic soils limit soybean
nodulation and BNF. Soil liming is one of amelioration ways of reducing effects of soil acidity in
achieving maximum yields. This study aimed at finding the effect of soil liming on soybean
nodulation and BNF, using soybean varieties TGx1740-2F (SB19) and Nyala and inoculation with
Biofix and Legumefix. A greenhouse experiment was set up at IITA Nairobi using two acidic soils,
Kuresoi (pH 4.9) and Murang’a (pH 5.0). The treatments included liming with agricultural lime
and without-lime, two soybean varieties SB19 and Nyala and three inoculation treatments (Biofix,
Legumefix, and control). The experiment was in completely randomized design (CRD) and each
treatment combination replicated three times. Analysis of variance was done at 95% confidence
level using SAS software. For Kuresoi soil, Soil liming and inoculation with Legumefix
significantly increased nodules fresh weight (5.8 g plant-1), nodules effectiveness (88.61%), shoot
dry weight (27.82 g plant-1), N uptake (0.27 g plant-1). Inoculation of SB19 with Legumefix grown
in limed soil increased the amount of nitrogen derived from atmosphere (Ndfa) by 58.57%. For
Murang’a soil, Soil liming and inoculation with Legumefix was significant in increasing nodules
fresh weight (5.3 g plant-1) and Ndfa (62.35%). Inoculation of SB19 with Legumefix grown in
limed soil increased nodules effectiveness (91.25%). Soybean variety and inoculation had
significant influence on N uptake, with inoculation of Nyala with Legumefix resulting in 0.08 g
plant-1 of N uptake. The mean soil pH at the end of the experiment was 6.0 indicating consecutive
planting is possible after soil liming. These results indicate that co-application of inoculants and
lime has potential of increasing soybean nodulation and nitrogen fixation in acidic soils.
Key words: Biofix, Legumefix, Liming, N uptake, Ndfa,
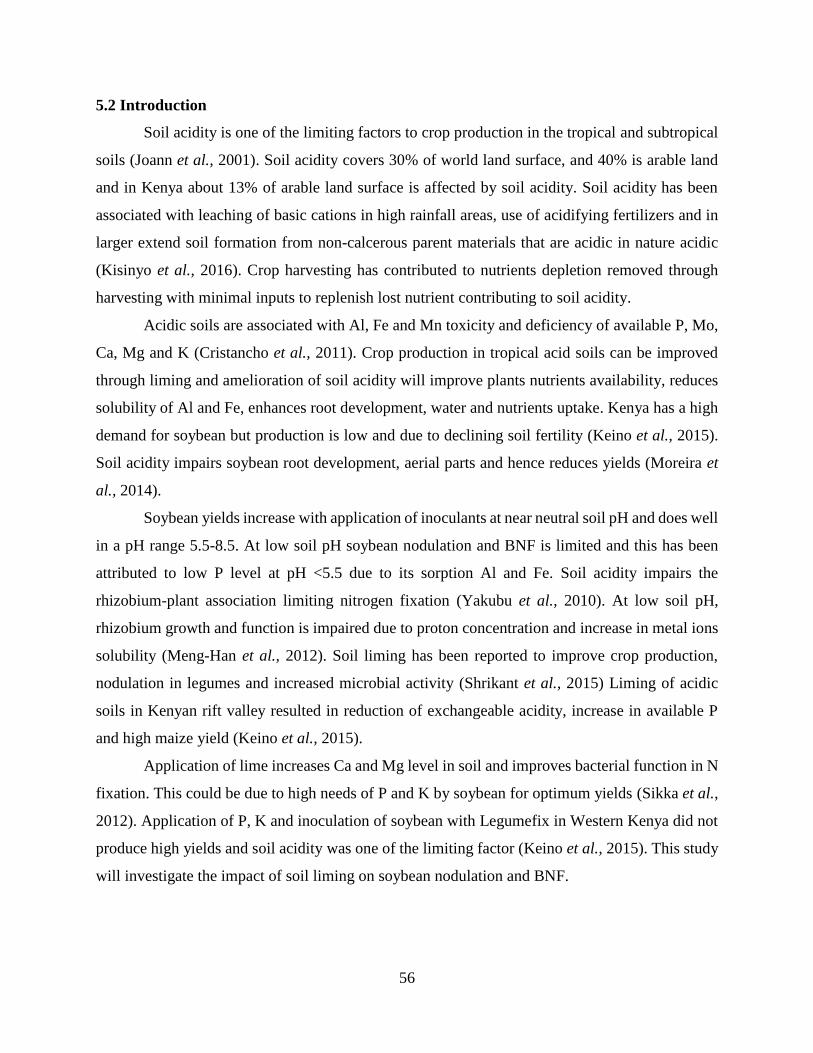
56
5.2 Introduction
Soil acidity is one of the limiting factors to crop production in the tropical and subtropical
soils (Joann et al., 2001). Soil acidity covers 30% of world land surface, and 40% is arable land
and in Kenya about 13% of arable land surface is affected by soil acidity. Soil acidity has been
associated with leaching of basic cations in high rainfall areas, use of acidifying fertilizers and in
larger extend soil formation from non-calcerous parent materials that are acidic in nature acidic
(Kisinyo et al., 2016). Crop harvesting has contributed to nutrients depletion removed through
harvesting with minimal inputs to replenish lost nutrient contributing to soil acidity.
Acidic soils are associated with Al, Fe and Mn toxicity and deficiency of available P, Mo,
Ca, Mg and K (Cristancho et al., 2011). Crop production in tropical acid soils can be improved
through liming and amelioration of soil acidity will improve plants nutrients availability, reduces
solubility of Al and Fe, enhances root development, water and nutrients uptake. Kenya has a high
demand for soybean but production is low and due to declining soil fertility (Keino et al., 2015).
Soil acidity impairs soybean root development, aerial parts and hence reduces yields (Moreira et
al., 2014).
Soybean yields increase with application of inoculants at near neutral soil pH and does well
in a pH range 5.5-8.5. At low soil pH soybean nodulation and BNF is limited and this has been
attributed to low P level at pH <5.5 due to its sorption Al and Fe. Soil acidity impairs the
rhizobium-plant association limiting nitrogen fixation (Yakubu et al., 2010). At low soil pH,
rhizobium growth and function is impaired due to proton concentration and increase in metal ions
solubility (Meng-Han et al., 2012). Soil liming has been reported to improve crop production,
nodulation in legumes and increased microbial activity (Shrikant et al., 2015) Liming of acidic
soils in Kenyan rift valley resulted in reduction of exchangeable acidity, increase in available P
and high maize yield (Keino et al., 2015).
Application of lime increases Ca and Mg level in soil and improves bacterial function in N
fixation. This could be due to high needs of P and K by soybean for optimum yields (Sikka et al.,
2012). Application of P, K and inoculation of soybean with Legumefix in Western Kenya did not
produce high yields and soil acidity was one of the limiting factor (Keino et al., 2015). This study
will investigate the impact of soil liming on soybean nodulation and BNF.

57
5.3 Materials and methods
Soils used in the study were collected Kuresoi (0.2993°S, 35.5302°E) and Murang’a
(0.7957°S, 37.1327°E) sampling was done at depth 0-15cm and transferred to the green house at
ICIPE-IITA, Nairobi. The samples were air dried for 48hours and sieved through a 2mm sieve and
the initial physical and chemical characteristics were determined following standards procedure as
described in Okalebo et al., (2002) as in section 3.3.4. Containers of 2kg capacity were fill with
soils and incubated with agricultural lime for 2 weeks at field capacity before planting. Soybean
varieties SB19 and Nyala were surface sterilized with sodium hypochlorite for 1 minute and rinsed
5 times with sterilized distilled water and negative control (uninoculated) planting done first to
avoid any potential contamination with three seeds sown per pot. Inoculation was at a rate of 1g
of inoculant/100g seeds following instruction on each pack of the inoculants (Legumefix and
Biofix) and the experiment laid in a completely randomized design (CRD). The Shoemaker-
McLean-Pratt method determined the liming rates for the two soils as in section 4.3.3. In BNF
determination, sorghum was the non-fixing plant and N difference method used to calculate BNF.
Soil pH was determined from each pot before planting and after harvest. Nodules analysis
performed as described in section 3.4.4.
Table 5.1: Treatment outline for the determination of effect of liming, inoculation and varieties
on soybean growth
Factors Level Description
Soils 2 Soils of pH 4.9 and 5.0
Liming treatments 2 lime and without-lime
Inoculation 3 Biofix, Legumefix and Uninoculated
(control)
Varieties 2 SB 19 and Nyala
Replications 3 Each combination repeated 3 times
Total pots number = 2×2×3×2×3=72 + 12 (additional pots for sorghum) = 84 pots

58
5.4 Data collection and analysis
Data collection was in reference to the first greenhouse experiment (section 3.4) and the
analysis of variance done using SAS (SAS software version 9.4, 2016) for each soil sample
considering the experiment as a three-factor experiment.
Statistical model
Yijkl= μ +Si + Tj + STij + Vk +SVik + TVjk+STVijk + Ԑijkl
Where,
Yijkl is observation due to the effect of ith liming, with jth inoculation and kth variety
μ is the overall mean
Si is the effect due to ith soil liming
Tj is effect due to jth inoculation
STij is the interaction due to ith soil liming and jth inoculation
Vk is the effects due to kth variety
SVik is the interaction due to ith soil liming and kth variety
TVjk is interaction due to jth inoculation and kth variety
STVijk is the interaction due to ith soil liming, jth inoculation, and kth variety
Ԑijkl is the random error term.
5.5 Results
5.5.1 Soil physical and chemical characteristics and lime rates
The soils were acidic, with Kuresoi soil having pH 4.9 and Murang’a pH 5.0; the soils also
had low level of available P Kuresoi (15mg P kg-1) and Murang’a (18mg P kg-1) and high
exchangeable acidity. Kuresoi soil was limed with 19 g lime kg-1 soil, which was equivalent to 34
T Ha-1 while Murang’a soil was limed with 15 g lime kg-1 soil, which was equivalent to 30 T Ha-
1.
5.5.2 Number of pods
5.5.2.1 Kuresoi soil
Soil liming had significant influence on the number of pods p˂0.05. Soybean planted in
soils limed with agricultural lime had high number of pods (31.78 plant-1) compared to those in
without-lime treatments (16.89 plant-1) (figure 5.1). Soybean inoculation with Legumefix and
Biofix also had significant influence on the number of pods p<0.05 above the uninoculated plants,
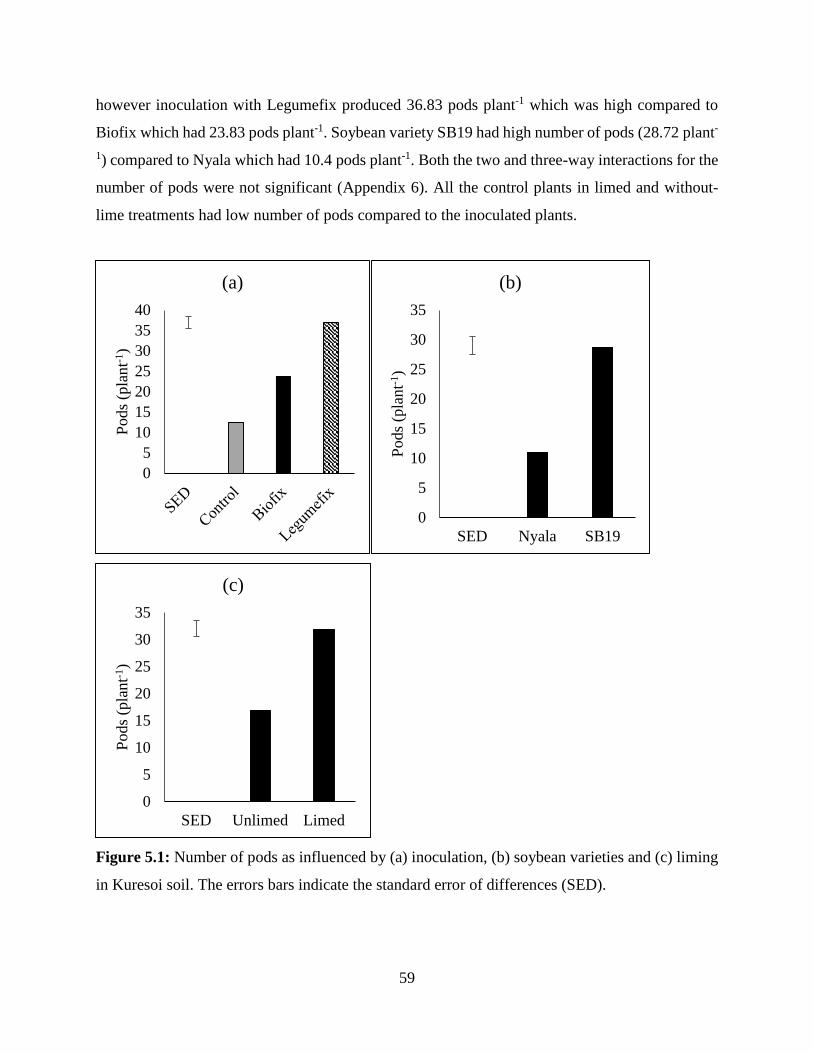
59
however inoculation with Legumefix produced 36.83 pods plant-1 which was high compared to
Biofix which had 23.83 pods plant-1. Soybean variety SB19 had high number of pods (28.72 plant-
1) compared to Nyala which had 10.4 pods plant-1. Both the two and three-way interactions for the
number of pods were not significant (Appendix 6). All the control plants in limed and without-
lime treatments had low number of pods compared to the inoculated plants.
Figure 5.1: Number of pods as influenced by (a) inoculation, (b) soybean varieties and (c) liming
in Kuresoi soil. The errors bars indicate the standard error of differences (SED).
0
5
10
15
20
25
30
35
40
Pods
(pla
nt-1
)
(a)
0
5
10
15
20
25
30
35
SED Nyala SB19
Pods
(pla
nt-1
)
(b)
0
5
10
15
20
25
30
35
SED Unlimed Limed
Pods
(pla
nt-1
)
(c)
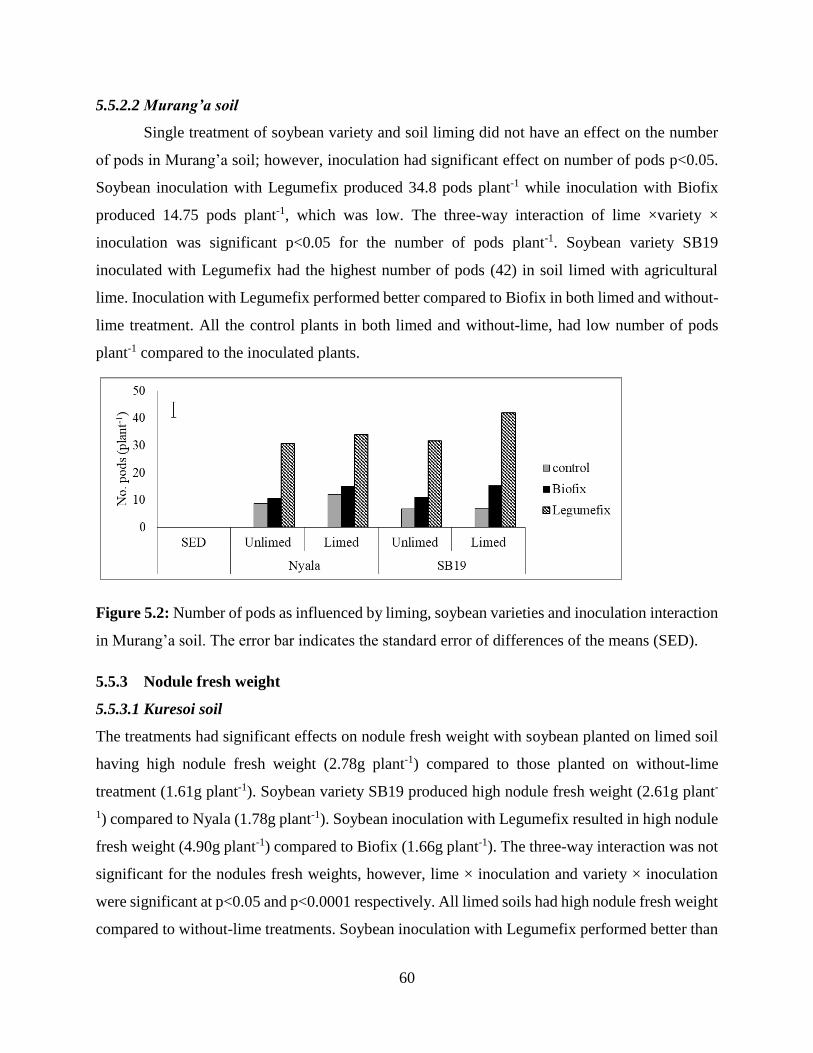
60
5.5.2.2 Murang’a soil
Single treatment of soybean variety and soil liming did not have an effect on the number
of pods in Murang’a soil; however, inoculation had significant effect on number of pods p<0.05.
Soybean inoculation with Legumefix produced 34.8 pods plant-1 while inoculation with Biofix
produced 14.75 pods plant-1, which was low. The three-way interaction of lime ×variety ×
inoculation was significant p<0.05 for the number of pods plant-1. Soybean variety SB19
inoculated with Legumefix had the highest number of pods (42) in soil limed with agricultural
lime. Inoculation with Legumefix performed better compared to Biofix in both limed and without-
lime treatment. All the control plants in both limed and without-lime, had low number of pods
plant-1 compared to the inoculated plants.
Figure 5.2: Number of pods as influenced by liming, soybean varieties and inoculation interaction
in Murang’a soil. The error bar indicates the standard error of differences of the means (SED).
5.5.3 Nodule fresh weight
5.5.3.1 Kuresoi soil
The treatments had significant effects on nodule fresh weight with soybean planted on limed soil
having high nodule fresh weight (2.78g plant-1) compared to those planted on without-lime
treatment (1.61g plant-1). Soybean variety SB19 produced high nodule fresh weight (2.61g plant-
1) compared to Nyala (1.78g plant-1). Soybean inoculation with Legumefix resulted in high nodule
fresh weight (4.90g plant-1) compared to Biofix (1.66g plant-1). The three-way interaction was not
significant for the nodules fresh weights, however, lime × inoculation and variety × inoculation
were significant at p<0.05 and p<0.0001 respectively. All limed soils had high nodule fresh weight
compared to without-lime treatments. Soybean inoculation with Legumefix performed better than
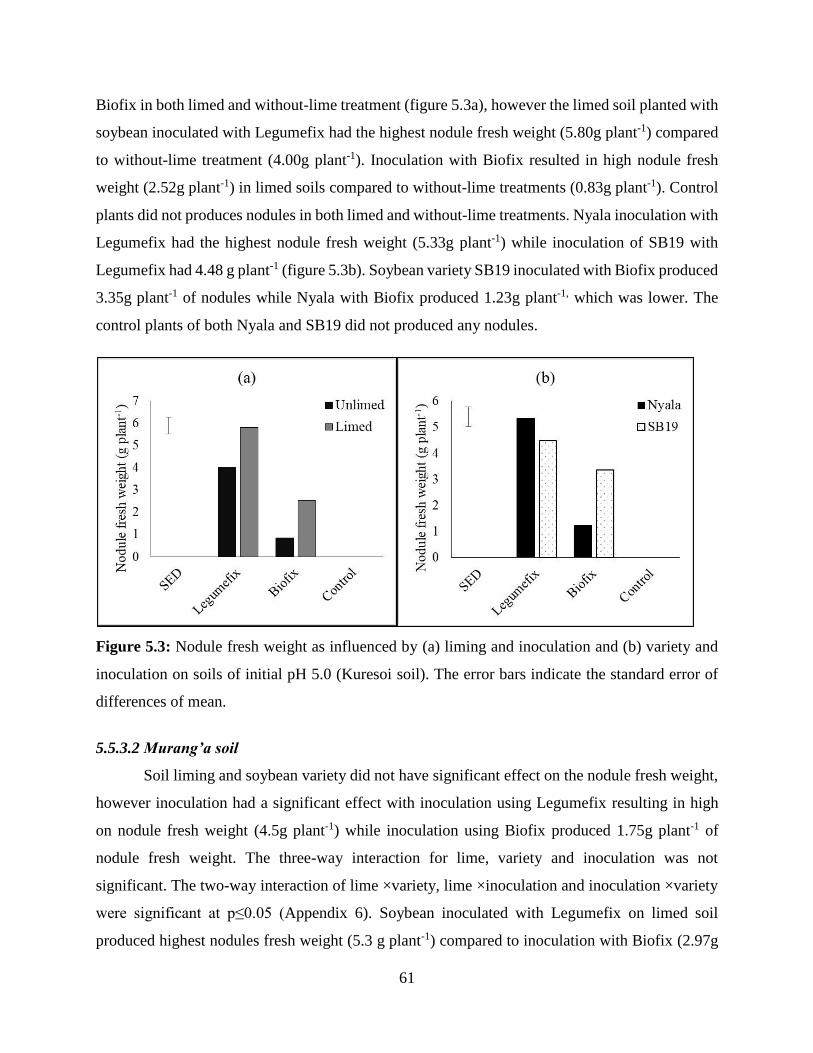
61
Biofix in both limed and without-lime treatment (figure 5.3a), however the limed soil planted with
soybean inoculated with Legumefix had the highest nodule fresh weight (5.80g plant-1) compared
to without-lime treatment (4.00g plant-1). Inoculation with Biofix resulted in high nodule fresh
weight (2.52g plant-1) in limed soils compared to without-lime treatments (0.83g plant-1). Control
plants did not produces nodules in both limed and without-lime treatments. Nyala inoculation with
Legumefix had the highest nodule fresh weight (5.33g plant-1) while inoculation of SB19 with
Legumefix had 4.48 g plant-1 (figure 5.3b). Soybean variety SB19 inoculated with Biofix produced
3.35g plant-1 of nodules while Nyala with Biofix produced 1.23g plant-1, which was lower. The
control plants of both Nyala and SB19 did not produced any nodules.
Figure 5.3: Nodule fresh weight as influenced by (a) liming and inoculation and (b) variety and
inoculation on soils of initial pH 5.0 (Kuresoi soil). The error bars indicate the standard error of
differences of mean.
5.5.3.2 Murang’a soil
Soil liming and soybean variety did not have significant effect on the nodule fresh weight,
however inoculation had a significant effect with inoculation using Legumefix resulting in high
on nodule fresh weight (4.5g plant-1) while inoculation using Biofix produced 1.75g plant-1 of
nodule fresh weight. The three-way interaction for lime, variety and inoculation was not
significant. The two-way interaction of lime ×variety, lime ×inoculation and inoculation ×variety
were significant at p≤0.05 (Appendix 6). Soybean inoculated with Legumefix on limed soil
produced highest nodules fresh weight (5.3 g plant-1) compared to inoculation with Biofix (2.97g

62
plant-1). Inoculation with Legumefix resulted in much higher nodules fresh weight compared to
Biofix in both lime and without-lime treatments (figure 5.4a). Biofix inoculant was more effective
in increasing nodule fresh weight in limed soils (2.97g plant-1) than without-lime treatments (1.93g
plant-1). The control plants in both lime and without-lime treatment did not produce any nodules.
For the interaction of lime with varieties, soils liming resulted in increase in nodule fresh weight
(figure 5.4b) in both Nyala and SB19 with Nyala producing highest nodule fresh weight (2.47g
plant-1) compared to SB19 (2.1g plant-1). Soybean variety SB19 did better in without-lime
treatments (1.9g plant-1) compared to Nyala variety (1.4g plant-1). For the interaction of variety
with inoculation (figure 5.4c), Nyala inoculation with Legumefix resulted in increase of nodules
fresh weight (5.33 g plant-1) compared to inoculation with Biofix (1.44g plant-1). Inoculation of
SB19 and Nyala with Legumefix had significant effect in increasing nodules fresh weight
compared to inoculation with Biofix. The control plants of both soybean varieties did not produce
any nodules.
5.5.4 Nodules effectiveness
5.5.4.1 Kuresoi soil
Soil liming did not have significant influence on nodule effectiveness, however, soybean
varieties and inoculation had a significant effect on nodule effectiveness p<0.05. Inoculation with
SB19 resulted in high percentage effective nodule (58.33) compared to Biofix inoculation
(28.69%). The three-way interaction was not significant for nodules effectiveness, however all the
two-way interactions were significant. Lime × inoculation, variety × inoculation and lime × variety
were significant at p<0.01, p<0.0001 and p<0.05 respectively (Appendix 6). Inoculation with
Legumefix on limed soil resulted in high effective nodules (88.61%) compared to Biofix in limed
soil (43.26%). Both lime and without-lime with plants inoculated with Legumefix had the highest
effective nodules compared to those inoculated with Biofix (figure 5.5a). Both limed and without-
lime treatments planted with SB19 variety had high effective nodules compared to Nyala variety
(Figure 5.5b). Effective nodules in SB19 planted in lime soil was higher (57.77%) compared to
Nyala in limed soil (24.05%). In terms of varieties with inoculation, SB19 inoculation resulted in
high effective nodules compared to Nyala using either Biofix or Legumefix (figure 5.5c).
Inoculation of SB19 with Legumefix had most effective nodules (87.67%) compared to Nyala
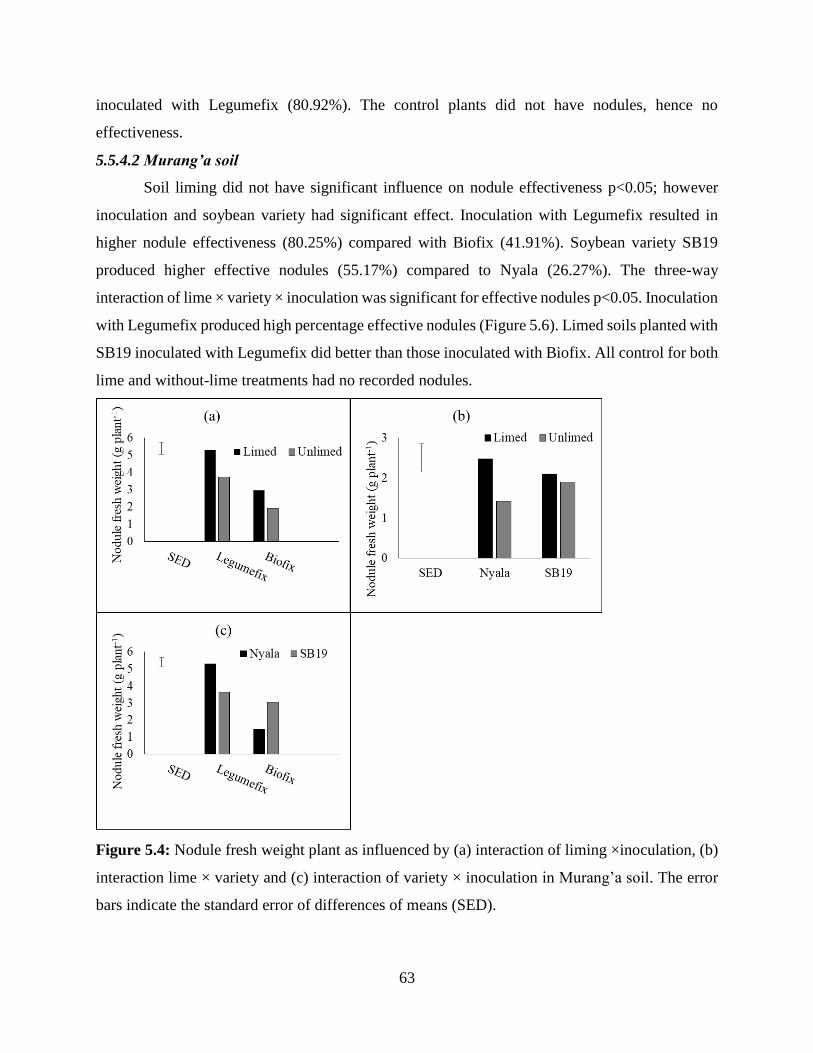
63
inoculated with Legumefix (80.92%). The control plants did not have nodules, hence no
effectiveness.
5.5.4.2 Murang’a soil
Soil liming did not have significant influence on nodule effectiveness p<0.05; however
inoculation and soybean variety had significant effect. Inoculation with Legumefix resulted in
higher nodule effectiveness (80.25%) compared with Biofix (41.91%). Soybean variety SB19
produced higher effective nodules (55.17%) compared to Nyala (26.27%). The three-way
interaction of lime × variety × inoculation was significant for effective nodules p<0.05. Inoculation
with Legumefix produced high percentage effective nodules (Figure 5.6). Limed soils planted with
SB19 inoculated with Legumefix did better than those inoculated with Biofix. All control for both
lime and without-lime treatments had no recorded nodules.
Figure 5.4: Nodule fresh weight plant as influenced by (a) interaction of liming ×inoculation, (b)
interaction lime × variety and (c) interaction of variety × inoculation in Murang’a soil. The error
bars indicate the standard error of differences of means (SED).
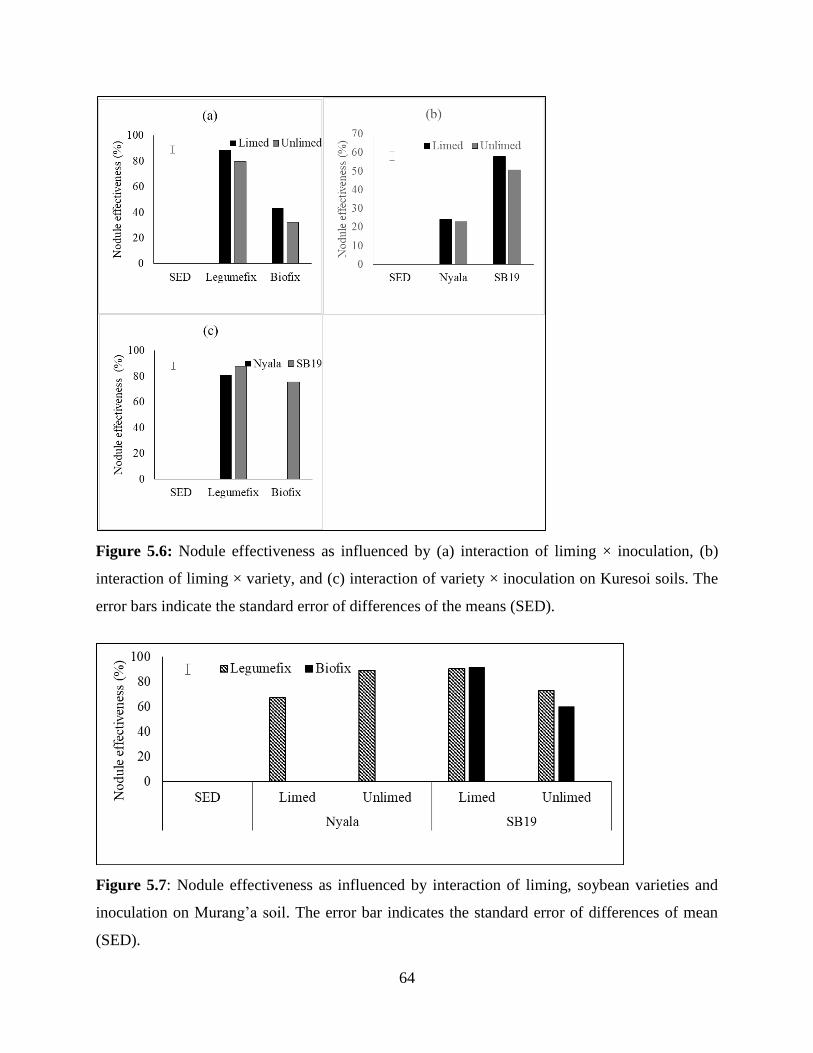
64
Figure 5.6: Nodule effectiveness as influenced by (a) interaction of liming × inoculation, (b)
interaction of liming × variety, and (c) interaction of variety × inoculation on Kuresoi soils. The
error bars indicate the standard error of differences of the means (SED).
Figure 5.7: Nodule effectiveness as influenced by interaction of liming, soybean varieties and
inoculation on Murang’a soil. The error bar indicates the standard error of differences of mean
(SED).
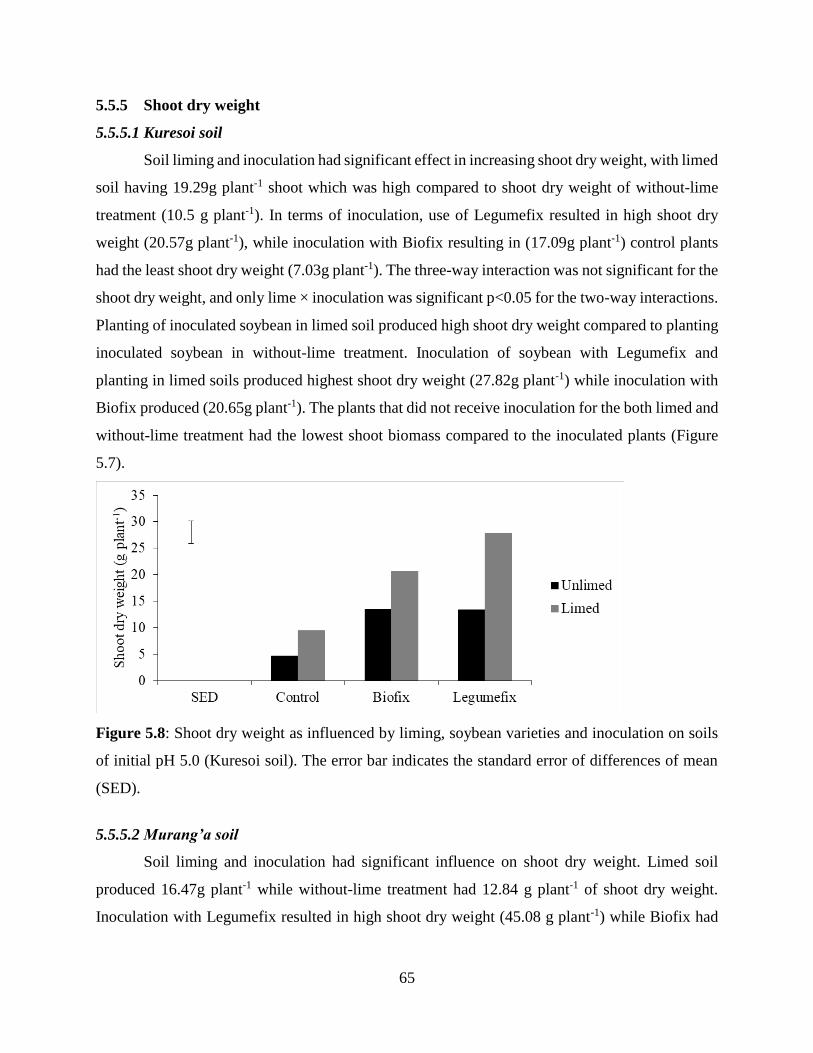
65
5.5.5 Shoot dry weight
5.5.5.1 Kuresoi soil
Soil liming and inoculation had significant effect in increasing shoot dry weight, with limed
soil having 19.29g plant-1 shoot which was high compared to shoot dry weight of without-lime
treatment (10.5 g plant-1). In terms of inoculation, use of Legumefix resulted in high shoot dry
weight (20.57g plant-1), while inoculation with Biofix resulting in (17.09g plant-1) control plants
had the least shoot dry weight (7.03g plant-1). The three-way interaction was not significant for the
shoot dry weight, and only lime × inoculation was significant p<0.05 for the two-way interactions.
Planting of inoculated soybean in limed soil produced high shoot dry weight compared to planting
inoculated soybean in without-lime treatment. Inoculation of soybean with Legumefix and
planting in limed soils produced highest shoot dry weight (27.82g plant-1) while inoculation with
Biofix produced (20.65g plant-1). The plants that did not receive inoculation for the both limed and
without-lime treatment had the lowest shoot biomass compared to the inoculated plants (Figure
5.7).
Figure 5.8: Shoot dry weight as influenced by liming, soybean varieties and inoculation on soils
of initial pH 5.0 (Kuresoi soil). The error bar indicates the standard error of differences of mean
(SED).
5.5.5.2 Murang’a soil
Soil liming and inoculation had significant influence on shoot dry weight. Limed soil
produced 16.47g plant-1 while without-lime treatment had 12.84 g plant-1 of shoot dry weight.
Inoculation with Legumefix resulted in high shoot dry weight (45.08 g plant-1) while Biofix had
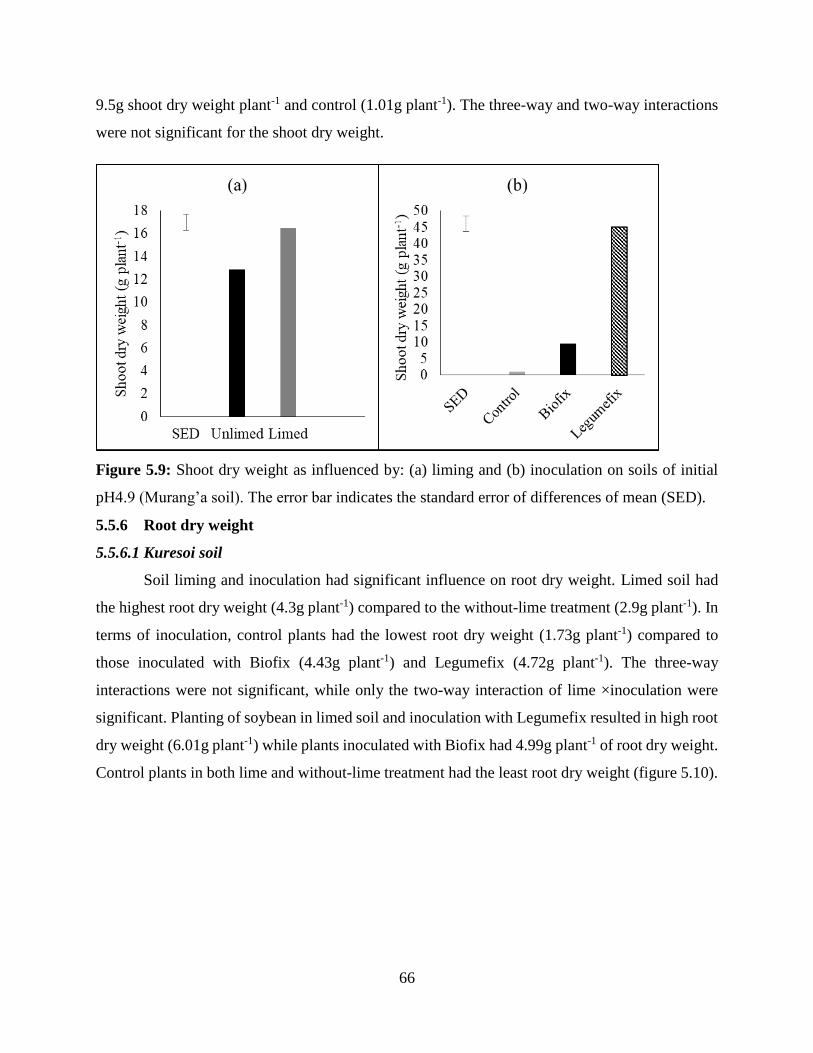
66
9.5g shoot dry weight plant-1 and control (1.01g plant-1). The three-way and two-way interactions
were not significant for the shoot dry weight.
Figure 5.9: Shoot dry weight as influenced by: (a) liming and (b) inoculation on soils of initial
pH4.9 (Murang’a soil). The error bar indicates the standard error of differences of mean (SED).
5.5.6 Root dry weight
5.5.6.1 Kuresoi soil
Soil liming and inoculation had significant influence on root dry weight. Limed soil had
the highest root dry weight (4.3g plant-1) compared to the without-lime treatment (2.9g plant-1). In
terms of inoculation, control plants had the lowest root dry weight (1.73g plant-1) compared to
those inoculated with Biofix (4.43g plant-1) and Legumefix (4.72g plant-1). The three-way
interactions were not significant, while only the two-way interaction of lime ×inoculation were
significant. Planting of soybean in limed soil and inoculation with Legumefix resulted in high root
dry weight (6.01g plant-1) while plants inoculated with Biofix had 4.99g plant-1 of root dry weight.
Control plants in both lime and without-lime treatment had the least root dry weight (figure 5.10).
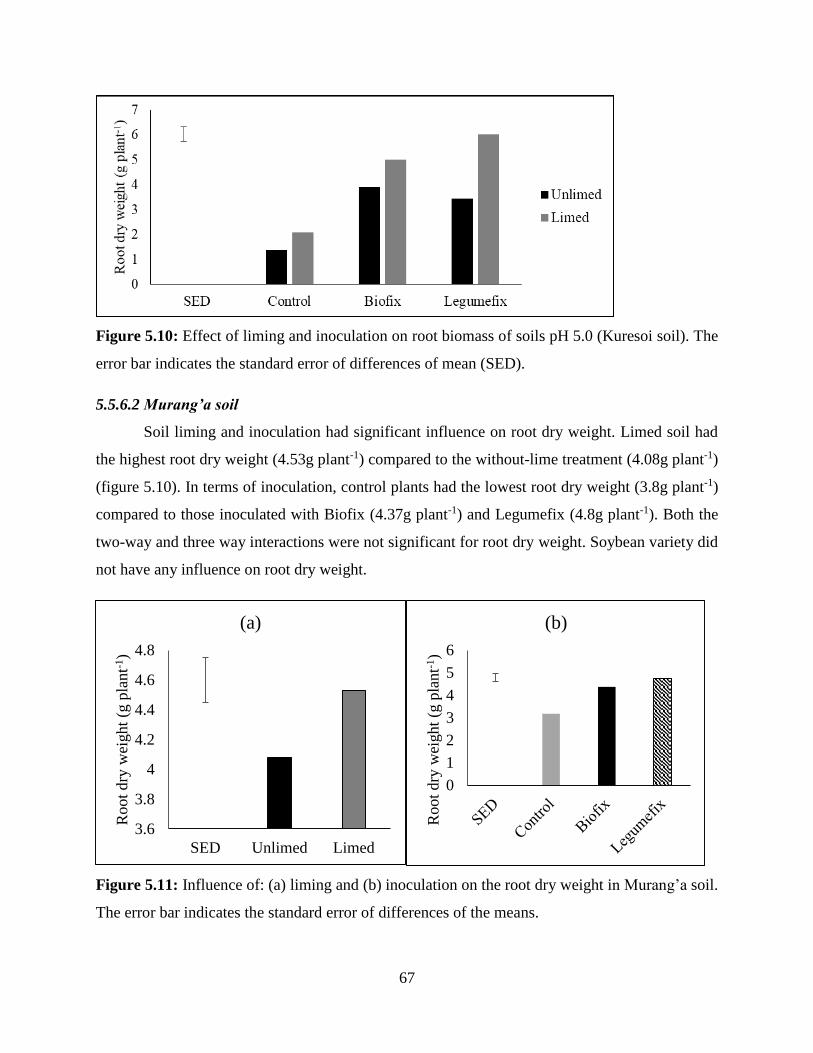
67
Figure 5.10: Effect of liming and inoculation on root biomass of soils pH 5.0 (Kuresoi soil). The
error bar indicates the standard error of differences of mean (SED).
5.5.6.2 Murang’a soil
Soil liming and inoculation had significant influence on root dry weight. Limed soil had
the highest root dry weight (4.53g plant-1) compared to the without-lime treatment (4.08g plant-1)
(figure 5.10). In terms of inoculation, control plants had the lowest root dry weight (3.8g plant-1)
compared to those inoculated with Biofix (4.37g plant-1) and Legumefix (4.8g plant-1). Both the
two-way and three way interactions were not significant for root dry weight. Soybean variety did
not have any influence on root dry weight.
Figure 5.11: Influence of: (a) liming and (b) inoculation on the root dry weight in Murang’a soil.
The error bar indicates the standard error of differences of the means.
3.6
3.8
4
4.2
4.4
4.6
4.8
SED Unlimed Limed
Root
dry
wei
ght
(g p
lant-1
)
(a)
0
1
2
3
4
5
6
Root
dry
wei
ght
(g p
lant-1
)
(b)
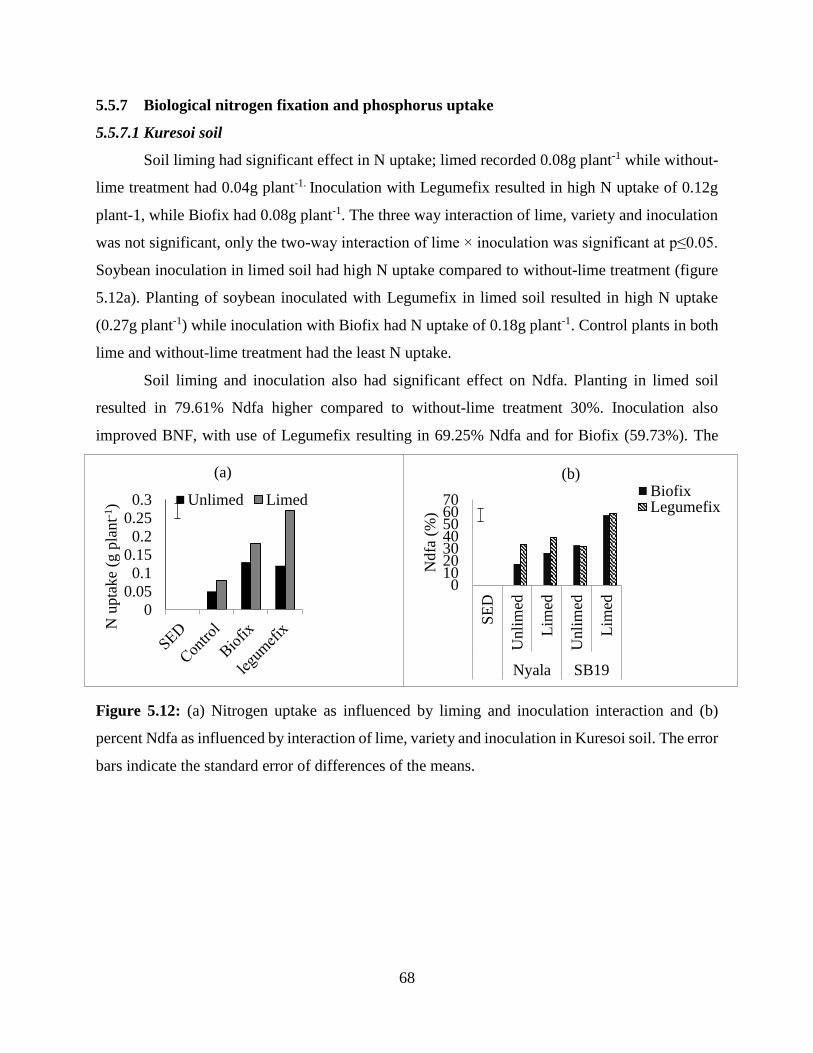
68
5.5.7 Biological nitrogen fixation and phosphorus uptake
5.5.7.1 Kuresoi soil
Soil liming had significant effect in N uptake; limed recorded 0.08g plant-1 while without-
lime treatment had 0.04g plant-1. Inoculation with Legumefix resulted in high N uptake of 0.12g
plant-1, while Biofix had 0.08g plant-1. The three way interaction of lime, variety and inoculation
was not significant, only the two-way interaction of lime × inoculation was significant at p≤0.05.
Soybean inoculation in limed soil had high N uptake compared to without-lime treatment (figure
5.12a). Planting of soybean inoculated with Legumefix in limed soil resulted in high N uptake
(0.27g plant-1) while inoculation with Biofix had N uptake of 0.18g plant-1. Control plants in both
lime and without-lime treatment had the least N uptake.
Soil liming and inoculation also had significant effect on Ndfa. Planting in limed soil
resulted in 79.61% Ndfa higher compared to without-lime treatment 30%. Inoculation also
improved BNF, with use of Legumefix resulting in 69.25% Ndfa and for Biofix (59.73%). The
three-way interaction Lime × variety × inoculation was significant p<0.05 for the Ndfa. The
amount of N fixed by SB19 variety inoculated with Legumefix and planted in limed was the
highest (58.57%). Nyala variety inoculated with Legumefix fixed high amount of N compared
with Biofix in both limed and without-lime treatments (Figure 5.12b). Soil liming had significant
influence in P uptake, with limed soils having 20 mgkg-1 P while without-lime treatment had 11.94
mgkg-1 P. in terms of inoculation, plants inoculated with Legumefix had highest P uptake (19.33
mgkg-1 P) while for Biofix was 19.01 mgkg-1. The three-way and two-way interactions were not
significant for P uptake.
Figure 5.12: (a) Nitrogen uptake as influenced by liming and inoculation interaction and (b)
percent Ndfa as influenced by interaction of lime, variety and inoculation in Kuresoi soil. The error
bars indicate the standard error of differences of the means.
0
0.05
0.1
0.15
0.2
0.25
0.3
N u
pta
ke
(g p
lant-1
)
(a)
Unlimed Limed
010203040506070
SE
D
Unli
med
Lim
ed
Unli
med
Lim
ed
Nyala SB19
Ndfa
(%
)
(b)BiofixLegumefix
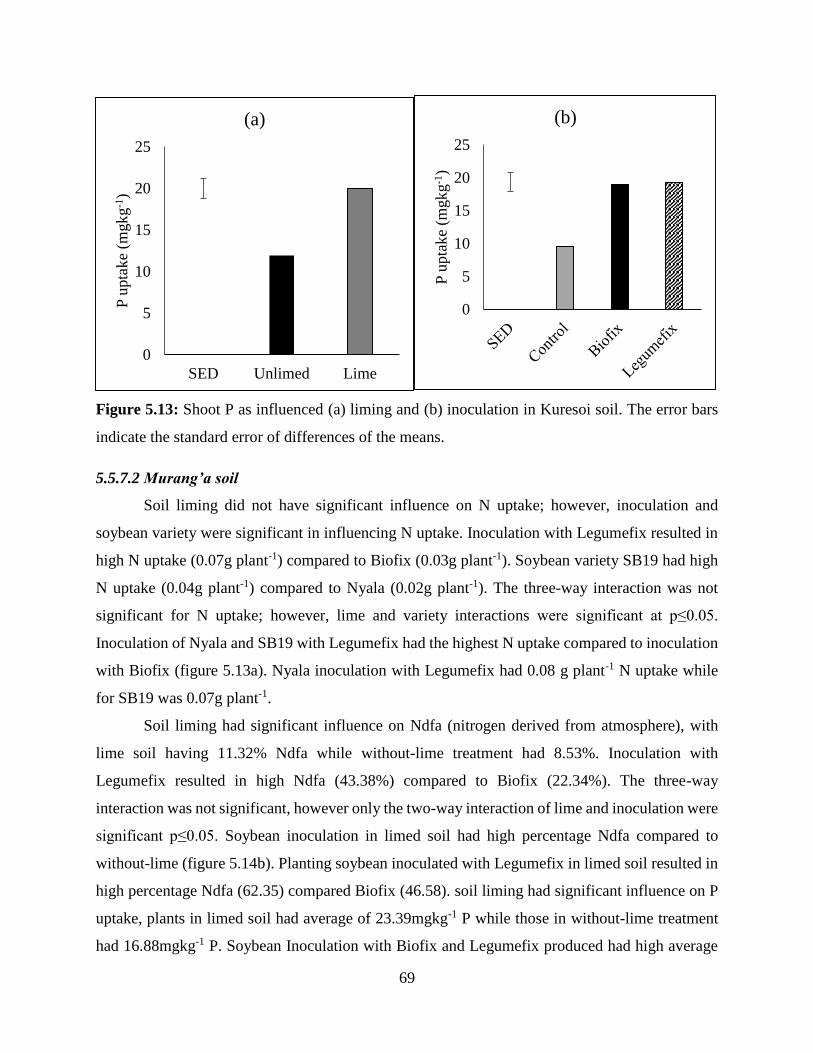
69
Figure 5.13: Shoot P as influenced (a) liming and (b) inoculation in Kuresoi soil. The error bars
indicate the standard error of differences of the means.
5.5.7.2 Murang’a soil
Soil liming did not have significant influence on N uptake; however, inoculation and
soybean variety were significant in influencing N uptake. Inoculation with Legumefix resulted in
high N uptake (0.07g plant-1) compared to Biofix (0.03g plant-1). Soybean variety SB19 had high
N uptake (0.04g plant-1) compared to Nyala (0.02g plant-1). The three-way interaction was not
significant for N uptake; however, lime and variety interactions were significant at p≤0.05.
Inoculation of Nyala and SB19 with Legumefix had the highest N uptake compared to inoculation
with Biofix (figure 5.13a). Nyala inoculation with Legumefix had 0.08 g plant-1 N uptake while
for SB19 was 0.07g plant-1.
Soil liming had significant influence on Ndfa (nitrogen derived from atmosphere), with
lime soil having 11.32% Ndfa while without-lime treatment had 8.53%. Inoculation with
Legumefix resulted in high Ndfa (43.38%) compared to Biofix (22.34%). The three-way
interaction was not significant, however only the two-way interaction of lime and inoculation were
significant p≤0.05. Soybean inoculation in limed soil had high percentage Ndfa compared to
without-lime (figure 5.14b). Planting soybean inoculated with Legumefix in limed soil resulted in
high percentage Ndfa (62.35) compared Biofix (46.58). soil liming had significant influence on P
uptake, plants in limed soil had average of 23.39mgkg-1 P while those in without-lime treatment
had 16.88mgkg-1 P. Soybean Inoculation with Biofix and Legumefix produced had high average
0
5
10
15
20
25
SED Unlimed Lime
P u
pta
ke
(mgkg
-1)
(a)
0
5
10
15
20
25
P u
pta
ke
(mgk
g-1
)
(b)
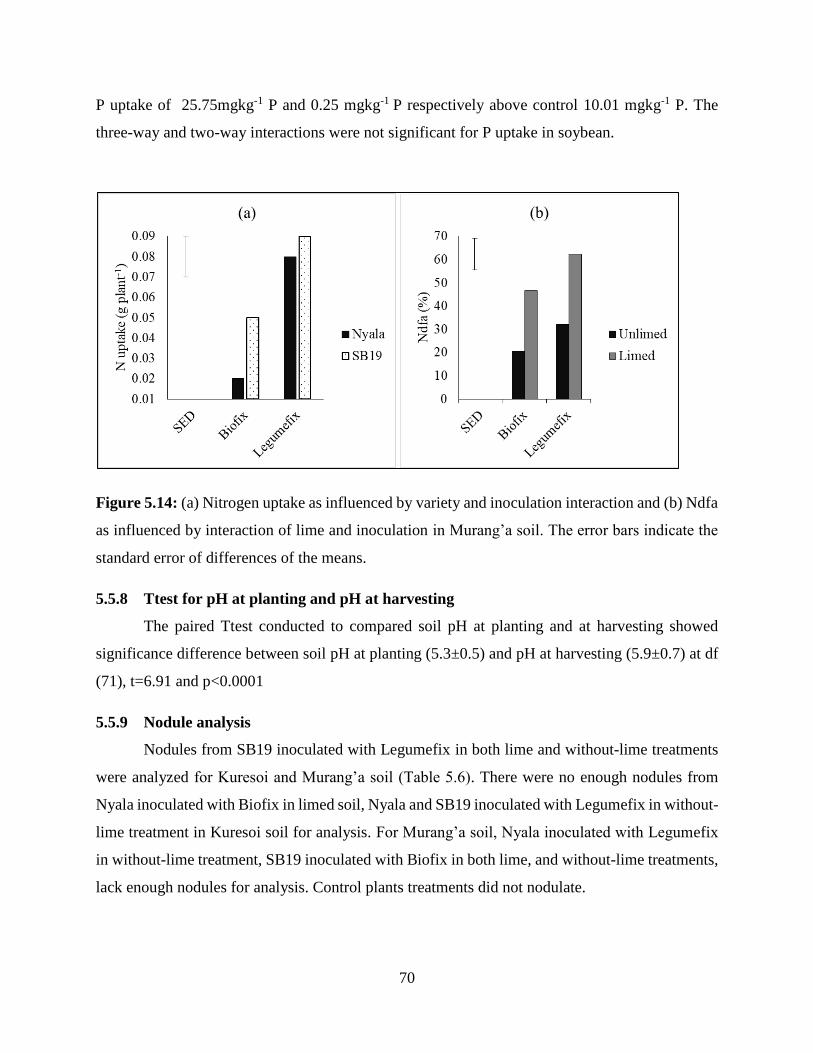
70
P uptake of 25.75mgkg-1 P and 0.25 mgkg-1 P respectively above control 10.01 mgkg-1 P. The
three-way and two-way interactions were not significant for P uptake in soybean.
Figure 5.14: (a) Nitrogen uptake as influenced by variety and inoculation interaction and (b) Ndfa
as influenced by interaction of lime and inoculation in Murang’a soil. The error bars indicate the
standard error of differences of the means.
5.5.8 Ttest for pH at planting and pH at harvesting
The paired Ttest conducted to compared soil pH at planting and at harvesting showed
significance difference between soil pH at planting (5.3±0.5) and pH at harvesting (5.9±0.7) at df
(71), t=6.91 and p<0.0001
5.5.9 Nodule analysis
Nodules from SB19 inoculated with Legumefix in both lime and without-lime treatments
were analyzed for Kuresoi and Murang’a soil (Table 5.6). There were no enough nodules from
Nyala inoculated with Biofix in limed soil, Nyala and SB19 inoculated with Legumefix in without-
lime treatment in Kuresoi soil for analysis. For Murang’a soil, Nyala inoculated with Legumefix
in without-lime treatment, SB19 inoculated with Biofix in both lime, and without-lime treatments,
lack enough nodules for analysis. Control plants treatments did not nodulate.
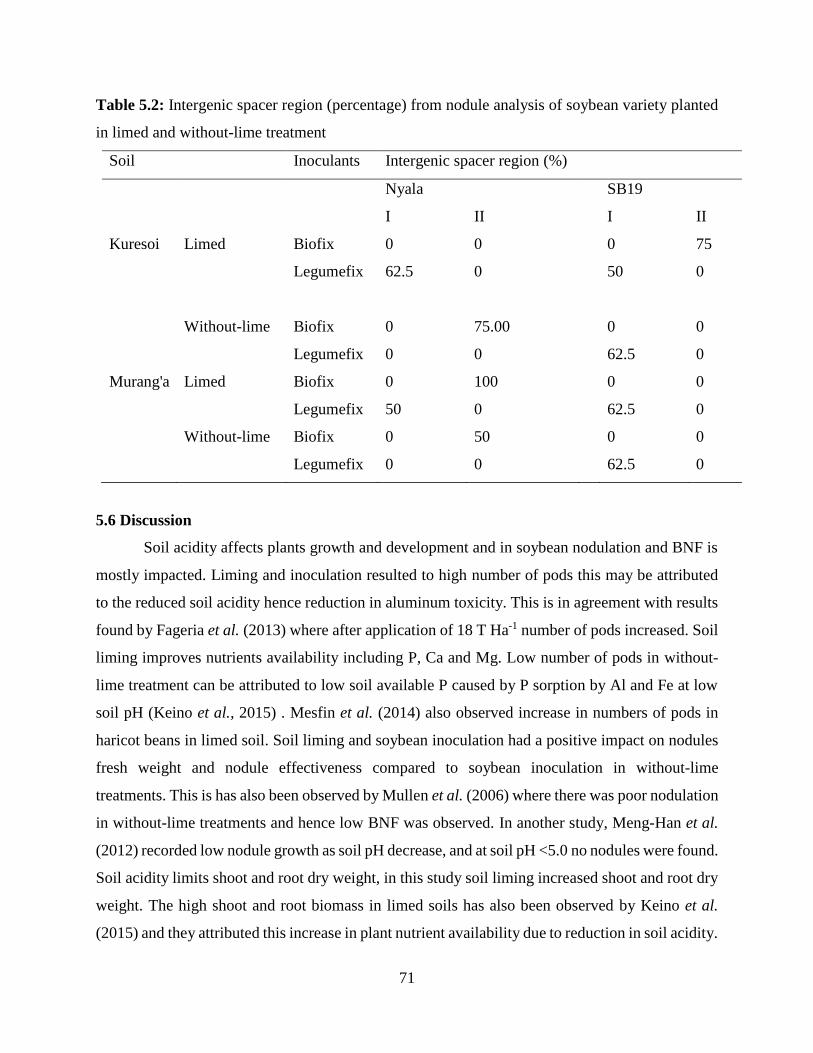
71
Table 5.2: Intergenic spacer region (percentage) from nodule analysis of soybean variety planted
in limed and without-lime treatment
Soil Inoculants Intergenic spacer region (%)
Nyala SB19
I II I II
Kuresoi Limed Biofix 0 0 0 75
Legumefix 62.5 0 50 0
Without-lime Biofix 0 75.00 0 0
Legumefix 0 0 62.5 0
Murang'a Limed Biofix 0 100 0 0
Legumefix 50 0 62.5 0
Without-lime Biofix 0 50 0 0
Legumefix 0 0 62.5 0
5.6 Discussion
Soil acidity affects plants growth and development and in soybean nodulation and BNF is
mostly impacted. Liming and inoculation resulted to high number of pods this may be attributed
to the reduced soil acidity hence reduction in aluminum toxicity. This is in agreement with results
found by Fageria et al. (2013) where after application of 18 T Ha-1 number of pods increased. Soil
liming improves nutrients availability including P, Ca and Mg. Low number of pods in without-
lime treatment can be attributed to low soil available P caused by P sorption by Al and Fe at low
soil pH (Keino et al., 2015) . Mesfin et al. (2014) also observed increase in numbers of pods in
haricot beans in limed soil. Soil liming and soybean inoculation had a positive impact on nodules
fresh weight and nodule effectiveness compared to soybean inoculation in without-lime
treatments. This is has also been observed by Mullen et al. (2006) where there was poor nodulation
in without-lime treatments and hence low BNF was observed. In another study, Meng-Han et al.
(2012) recorded low nodule growth as soil pH decrease, and at soil pH <5.0 no nodules were found.
Soil acidity limits shoot and root dry weight, in this study soil liming increased shoot and root dry
weight. The high shoot and root biomass in limed soils has also been observed by Keino et al.
(2015) and they attributed this increase in plant nutrient availability due to reduction in soil acidity.
72
Acidic soils have low level of Ca hence impairing roots development (Whalen et al., 2001).
Cations K, Mg and Ca are prone to leaching in high rainfall areas leading to their deficiency and
soil liming increases cations saturations in soil solution increasing their uptake hence increase in
shoot and root dry weight (Keino et al., 2015). Poor roots development in acidic soils is attributed
Ca deficiency. Calcium plays a role in cell growth both at terminal and root tip and in low Ca soils,
browning and dying of the root tip causes poor root system development (Keino et al., 2015).
Magnesium plays a role in enzyme activation in protein synthesis hence plant growth and
development. The nutrients deficiencies contribute to low root dry weight, poor nodulation,
retarded growth with low shoot dry weight and poor pod formation due limited nutrients uptake.
Soybean variety SB19 had high shoot dry weight compared to Nyala variety. This result is in
agreement with Thuita et al. (2011) where SB19 had much higher shoot dry weight compared to
Nyala and its was attributed to high N fixing ability of the promiscuous soybean varieties
contributing to high biomass and pod formation. Moreira et al, (2015) also observed increase in
shoot dry weight with liming on different soybean varieties. The study concluded that different
soybean varieties adapted to tropical and subtropical soils respond differently to soil acidity. Soil
liming improved N and P uptake compared to without-lime treatment, and this is in agreement
with study by Fageria et al. (2013) and he concluded that N and P uptake increased with soil
liming. Whalen et al. (2001) also observed that soil liming improved plant nutrients concentration
in canola and wheat. Benvido et al. (2018) observed that application of lime increased N and P
uptake but its combination with P fertilizers and organic manure had significant influence; this
contrasts this study since use of lime alone improved P uptake. The impact of liming in improving
P availability is debatable and its ability to increase P availability is high dependent on lime rates.
At high lime rates, soil pH raises to >6.5 and soluble P forms complex with Ca and at low lime
rate there is toxicity effects of Al and Fe. A study by Keino et al. (2015) are in agreement with
current study where soil liming increase nutrient uptake in soybean. Increase in soil pH after liming
had a positive effect on BNF. At soil pH above 5.5, there is increasing in nitrogenase activity hence
high rate on N fixation due to easy uptake of Mo and K.
Various researchers have observed the effect of liming in the consecutive planting season.
At the end of this study, the soil pH in limed soil was 6.0 and this indicated that replanting will
translated in much higher response in nodulation, podding, biomass and generally BNF. Mullen et
al. (2006) reported that soil liming supported subsequent planting of wheat and canola for up to 9
73
years. Soil liming has support soybean growth for subsequent 3 years after application of 18T Ha-
1 during the first season (Fageria et al., 2013).
5.7 Conclusion
Inoculated soybean grown in limed soils compared to without-lime treatment has
significance influence on number of pods, shoot and root biomass, nodule fresh weight, BNF and
nutrients uptake (N and P). The liming rates used in this study were relatively higher compared to
what other authors recommended thus, there is need for a more convenient method of lime
requirement determination to ensure maximum economic yield for soybean production.
References
Benvindo , V., Benjamin , D. & Jayne , M. (2018). Influence of manure, phosphate fertilizer and
lime on soil available NPK and uptake of NP by soybean in Embu county, Kenya.
Discovery, 54(265), 13-22.
Cristancho , J. A., Hanafi , M. M., Syed, R. S. & Rafii, M. Y. (2011). Alleviation of soil acidity
improves the performance of oil palm progenies planted on an acid Ultisol. Acta
Agriculturae Scandinavica, Section B - Soil & Plant Science, 61(6), 487-498.
doi:10.1080/09064710.2010.506448
Fageria, N. K., Moreira, A., Castro, C. & Moraes, M. F. (2013). Optimal acidity Indices for
Soybean production in Brazilian Oxisols. Communications in Soil Science and Plant
analysis, 44(20), 2941-2951.
Joann, K. W., Chang, C. & George, C. (2001). Cattle manure and lime amendments to improve
crop production of acidic soils in nothern Alberta. Canadian Journal of Soil Science, 82,
227-238.
Keino, L., Fredrick, B., Ng'etich, W., Otinga, A., Okalebo, J. & Njoroge, R. (2015). Nutrients
Limiting Soybean (Glycine max l) Growth in Acrisols and Ferralsols of Western Kenya.
Kisinyo, P. O. (2016). Long term effects of lime and phosphorus application on maize productivity
in an acid soil of Uasin Gishu County, Kenya. Sky Journal of Agricultural Research, 5(3),
048-055.
Meng-Han, L., Peter, M. G. & Brett, J. F. (2012). Systemic Regulation of Soybean Nodulation by
Acidic Growth Conditions. Plant Physiology, 160(4), 2028-2039.
74
Mesfin, K., Belay, Y. & Abera, H. (2014). Liming Effects on Yield and Yield Components of
Haricot Bean (Phaseolus vulgaris L.) Varieties Grown in Acidic at Wolaita Zone, Ethiopia.
International Journal of Soil Science, 9(2), 67-74.
Moreira, A., Sfredo, G. J., Moraes , L. A. & Fageria, N. K. (2015). Lime and Cattle Manure in Soil
Fertility and Soybean Grain Yield Cultivated in Tropical Soil. Communications in Soil
Science and Plant Analysis, 46(9), 1157-1169. doi:10.1080/00103624.2015.1033542
Mullen, C. L., Scott, B. J., Evans, C. M. & Conyers, M. K. (2006). Effects of soil acidity and
liming on lucerne and following crops in central-western New South Wales. Australian
Journal of Experiemntal Agricultural, 46, 1291-1300.
Okalebo, J. R., Kenneth, L. & Gathua, W. (2002). Laboratory Methods of Soil and Plant Analysis
:a working manual. Nairobi - Kenya: SACRED Africa.
SAS softaware version 9.4. (2016). SAS Institute Inc. Cary, NC, USA: Licensed to Institute of
Tropical Agriculture.
Shrikant, B., Ashim, D., Nirmalendu, B., Anindita, S., Dhaneshwar, P. & Biswapati, M. (2015).
Liming Influences Forms of Acidity in Soils Belonging to Different Orders under
Subtropical India. Communications in Soil Science and Plant Analysis, 46(16), 2079-2094.
Sikka, R., Singh, D. & Deol, J. S. (2012). Productivity and nutrient uptake by soybean as
influenced by intergrated nutrient and some other agronomic management practices.
Legume Resources, 36(6), 545-551.
Thuita, M., Pieter, P. & Laetitia, H. (2011). Commercial rhizobial inoculants significantly enhance
growth and nitrogen fixation of a promiscuous soybean varierty in Kenyan soils. Biol Fertil
soils, 48, 87-86.
Whalen, J. K., Chi , C. & George , C. W. (2002). Cattle manure and lime amendments to improve
crop production of acidic soils in Northern Alberta. Canadian Journal of Soil Science,
82(2), 227-238.
Yakubu, H., Kwari, J. D. & Ngala, A. L. (2010). N fixation by Grain legume Varieties as Affected
by Rhizobia Inoculation in the Sandy soils of Sudano-sahelian Zone of Noth Eastern
Nigeria. Nigerian Journals of Basic and Applied science, 18(2), 22-236.
75
CHAPTER SIX
GENERAL DISCUSSION, CONCLUSIONS AND RECOMMENDATIONS
6.1 General Discussion
Soil acidity limits nutrients uptake in soybean affecting nodulation, biomass, and nitrogen
fixation. The measured number of pods was highest in soils S5-S10 and low in S1-S4. The
observed difference is due to the effects of soil acidity on soybean grown in soils of pH < 5. Acidic
soils have high concentration of Al, Fe and H ions limiting root development, hence poor
development of the roots in turn cause poor nutrients uptake which are already limiting in these
soils. Inoculation in acidic soils did not increase the measured parameters; this is attributable to
soil acidity effects on the rhizobium and the soybean variety itself. The root and shoot biomass in
soils S1-S4 (pH <5) was low and this was attributed to the toxic effects of soil acidity on plant
roots, impairing nutrients uptake and in turn contributing to poor plant growth.
There was no nodulation in extreme acidic soils, soils S1-S4 (pH<5.0) and control plants
except for soil S9 and S10. Nodulation in the control plants in soil S9 and S10 is due to the presence
of native rhizobia, however, the nodules fresh weight and nodules effectiveness was lower than
that of inoculated plants indicating that the inoculants were effective in increasing nodulation.
Inoculation ineffectiveness is mainly due to rhizobia sensitivity to low soil pH, toxicity effects of
Al and Fe on the rooting system of the plants affecting root and nodules formation and functioning.
Soil acidity causes binding of P by Al ions, causing low levels of P in soil solution. This impairs
plants growth, nodulation since P play a major role in increasing the size, and number of nodules,
the amount of N fixed and in turn increases the amount of nitrogen uptake by the host legume and
improves the density of Rhizobia bacteria in the soil surrounding the root. Inoculation of soybean
in soil pH >5.5 had a high level of nitrogen fixation and uptake compared to soils with pH <5.5;
this is attributed to poor roots development and poor nodulation in acidic soils. Soybean variety
SB19 had a high level of Ndfa and N uptake after inoculation with Biofix in soil S7 and inoculation
with Legumefix in soil S6. These soils had pH >5.5 hence high nutrients availability including K
which is crucial in N fixation. Nodules effectiveness and BNF are directly related to the number
of nodules per plant, hence affected directly as a result of soil pH and nutrient content. Calcium
also plays a major role in rhizobia-legume symbioses, it’s used for adhesion by rhizobia hence its
76
deficiency in acidic soils affects rhizobia attachment, infection and infection thread formation thus
nitrogen fixation is negatively affected.
Soil liming increases P, Ca, Mg, K, Mo availability in soil and reduces the toxic effects of
Al, Fe and H ions in soil, hence increased nutrients uptake by plant increasing nodulation.
Application of agricultural lime increased soil pH-to-pH 6.0 in both acidic soils S2 and S4
compared to Mijingu phosphate rock (MPR). The difference in changes in soil pH between the
two is due to the high calcium carbonate equivalent (CCE) and fineness of agricultural lime
compared to MPR. Estimation of lime requirement using the Shoe-maker, McLean and Pratt
method resulted in change of soil pH to target pH 6.0 while exchangeable acidity method did not
change soil pH to >5. Exchangeable acidity underestimates the liming needs of soil since it does
not consider the soil buffering capacity. Soil limed with MPR had high amounts of available P
compared to liming with agricultural lime, this is due to initial levels of P in MPR.
Soil liming with agricultural lime increased the initial soil pH of soil S2 and S4 to target
pH 6.0 and co-application of inoculants and lime increased the number of pods, nodules fresh
weight, root and shoot dry weight, N fixation and N and P uptake. Inoculation with Legumefix in
limed soils increased nodules fresh weight compared to inoculation with Biofix. Rhizobia
inoculants are highly sensitive to low soil pH (<5.5) and application of lime increases soil pH to a
favorable level hence increasing rhizobia efficiency. Soil liming and inoculation of Nyala with
Legumefix resulted in high nodules fresh weight and nodules effectiveness. The difference in
nodulation for the two varieties is due to their maturity and nutrient uptake ability hence influence
other parameters such as the number of pods, shoot dry weight and nitrogen fixation.
Soil liming increased shoot dry weight and this is due to increased plant nutrient
availability due to reduction in soil acidity. Cations K, Mg and Ca are prone to leaching in high
rainfall areas leading to their deficiency and soil liming increases cations saturations in soil
solution increasing their uptake hence increase in shoot dry weight. Soybean variety SB19 had
high shoot dry weight compared to Nyala variety and this is due to high N fixing ability of the
promiscuous soybean varieties contributing to high biomass and pod formation.
Soil liming and soybean inoculation had a significant influence on nodulation. Soybean
inoculation in limed soils had high nodulation compared to unlimed treatments this is due to
increased nutrients availability in limed soil hence improved root hair development increasing
inoculants efficiency. Inoculation of SB19 with Legumefix in limed soil increased nitrogen
77
fixation and uptake. SB19 is a promiscuous variety with longer growth period and high ability to
nodulate hence higher percentage Ndfa compared to Nyala variety. Soil liming improved nitrogen
fixation and uptake compared to without-lime treatment indicating that N and P uptake increased
with soil liming. The increase in soil pH after liming had a positive effect on BNF due to reduced
toxic effects of Al and Fe and increased availability of Ca and Mo necessary for nitrogen fixation.
At soil pH above 5.5, there is an increase in nitrogenase activity hence high rate on N fixation due
to easy uptake of Mo and K.
6.2 Conclusions
Declining soil fertility is one of the limiting factor to crop production and contributing to food
insecurity. Soil acidity limits soybean yields due to toxicity effects of Al, Fe and H ions and
nutrients deficiency of P, Ca, Mg, Mo, and K affecting soybean growth and the rhizobia strain in
the inoculants. This results in poor nodulation, nitrogen fixation, and hence low yield. The
following conclusions were made from the study;
i) Biological nitrogen fixation and nodulation is effective at soil pH range 5.5-6.3 and
soybean inoculation should be at this pH range.
ii) Soils of pH range 5.5-6.3 have sufficient nutrients supply for effective nodulation and BNF.
iii) Nodulation and BNF was more effective in soybean variety SB19 than in Nyala.
iv) Legumefix inoculants is more effective in increasing nodulation and BNF compared to
Biofix inoculant.
v) Agricultural lime has shown to be most effective lime material to raise soil pH compared
to MPR and lime estimation using SMP method resulted in a greater change in soil pH
compared to exchangeable acidity.
vi) Co-application of liming and inoculation improved nodulation and BNF in acidic soil.
6.3 Recommendations
From this study, the following recommendations can be made;
i) Soybean should be planted in soil pH 5.5-6.3 were there are sufficient nutrients supply.
ii) TGx1740-2F (SB19) soybean variety is recommended due to its high response to
inoculation and high nodulation and BNF.
iii) Agricultural lime is a recommended lime material in amelioration of acidic soils.

78
iv) There is need for further study on field calibration of SMP method in Kenyan acidic soils.
v) Documentation of lime rates for Kenyan acidic soils is crucial.
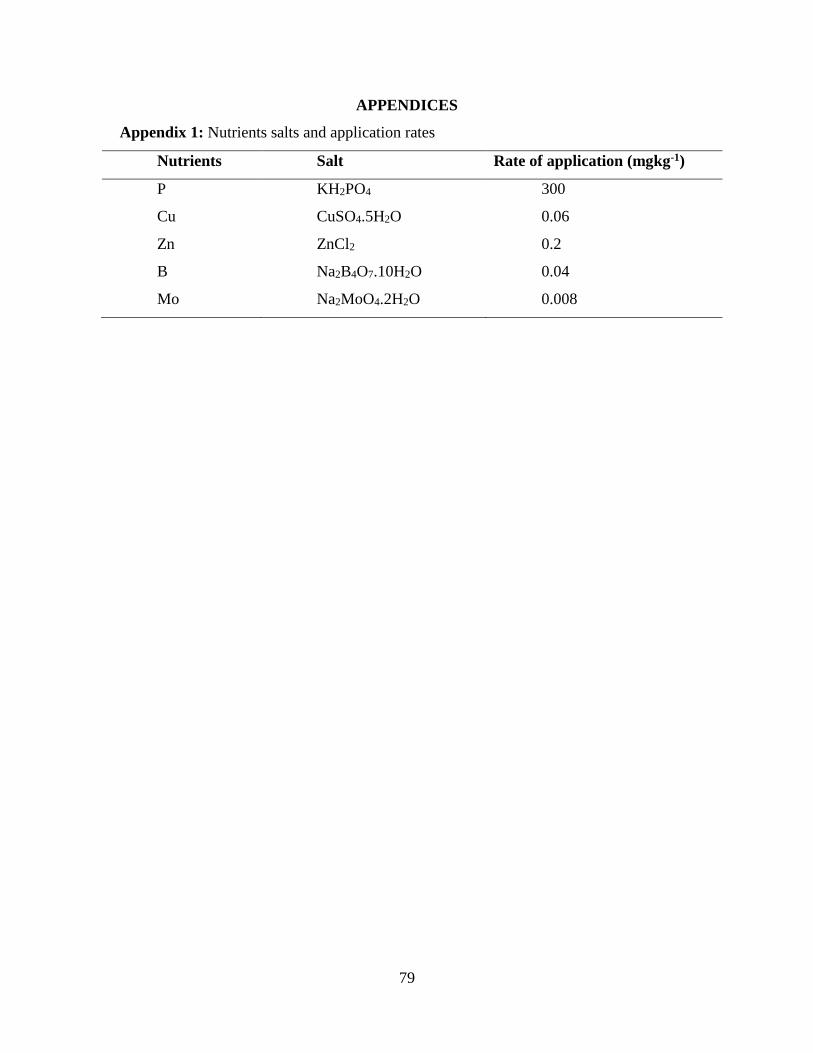
79
APPENDICES
Appendix 1: Nutrients salts and application rates
Nutrients Salt Rate of application (mgkg-1)
P KH2PO4 300
Cu CuSO4.5H2O 0.06
Zn ZnCl2 0.2
B Na2B4O7.10H2O 0.04
Mo Na2MoO4.2H2O 0.008
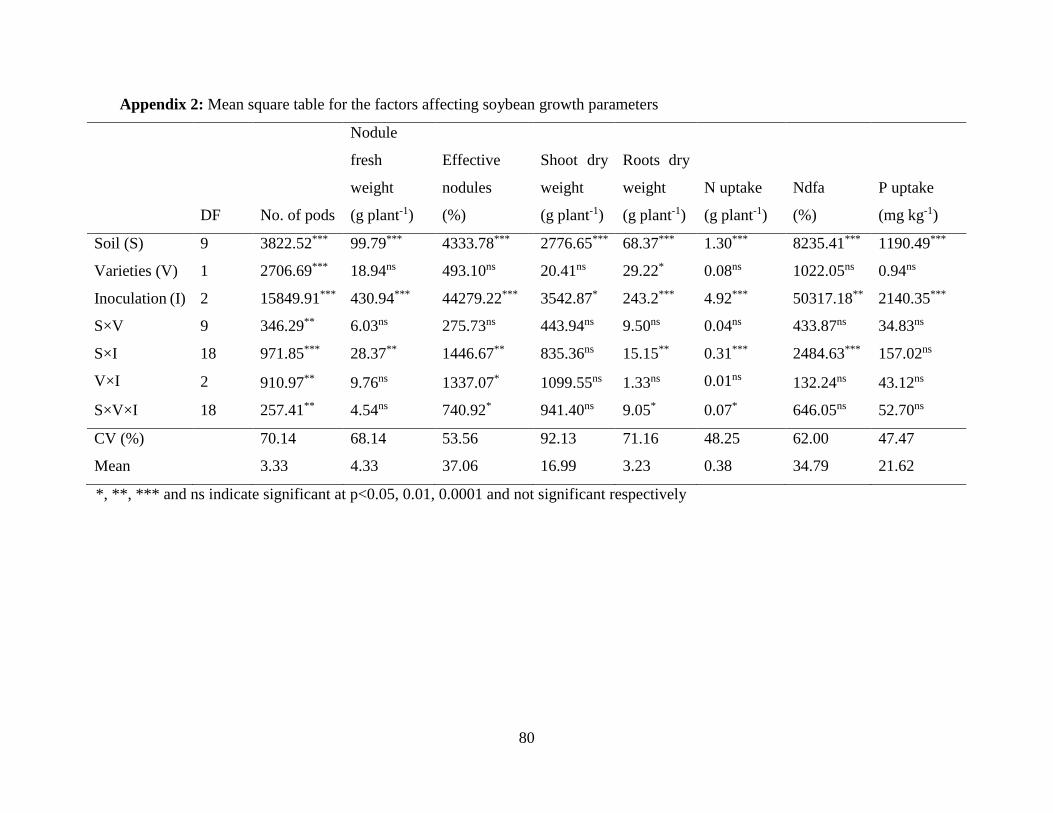
80
Appendix 2: Mean square table for the factors affecting soybean growth parameters
DF No. of pods
Nodule
fresh
weight
(g plant-1)
Effective
nodules
(%)
Shoot dry
weight
(g plant-1)
Roots dry
weight
(g plant-1)
N uptake
(g plant-1)
Ndfa
(%)
P uptake
(mg kg-1)
Soil (S) 9 3822.52*** 99.79*** 4333.78*** 2776.65*** 68.37*** 1.30*** 8235.41*** 1190.49***
Varieties (V) 1 2706.69*** 18.94ns 493.10ns 20.41ns 29.22* 0.08ns 1022.05ns 0.94ns
Inoculation (I) 2 15849.91*** 430.94*** 44279.22*** 3542.87* 243.2*** 4.92*** 50317.18** 2140.35***
S×V 9 346.29** 6.03ns 275.73ns 443.94ns 9.50ns 0.04ns 433.87ns 34.83ns
S×I 18 971.85*** 28.37** 1446.67** 835.36ns 15.15** 0.31*** 2484.63*** 157.02ns
V×I 2 910.97** 9.76ns 1337.07* 1099.55ns 1.33ns 0.01ns 132.24ns 43.12ns
S×V×I 18 257.41** 4.54ns 740.92* 941.40ns 9.05* 0.07* 646.05ns 52.70ns
CV (%) 70.14 68.14 53.56 92.13 71.16 48.25 62.00 47.47
Mean 3.33 4.33 37.06 16.99 3.23 0.38 34.79 21.62
*, **, *** and ns indicate significant at p<0.05, 0.01, 0.0001 and not significant respectively
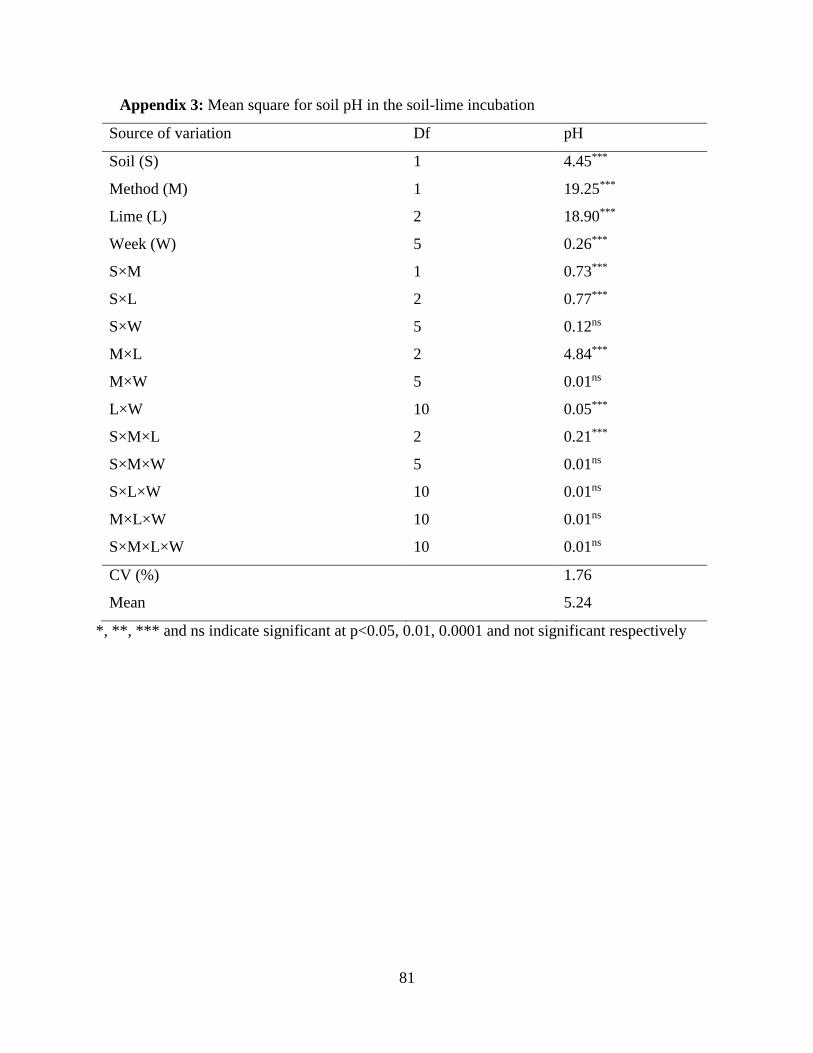
81
Appendix 3: Mean square for soil pH in the soil-lime incubation
Source of variation Df pH
Soil (S) 1 4.45***
Method (M) 1 19.25***
Lime (L) 2 18.90***
Week (W) 5 0.26***
S×M 1 0.73***
S×L 2 0.77***
S×W 5 0.12ns
M×L 2 4.84***
M×W 5 0.01ns
L×W 10 0.05***
S×M×L 2 0.21***
S×M×W 5 0.01ns
S×L×W 10 0.01ns
M×L×W 10 0.01ns
S×M×L×W 10 0.01ns
CV (%) 1.76
Mean 5.24
*, **, *** and ns indicate significant at p<0.05, 0.01, 0.0001 and not significant respectively
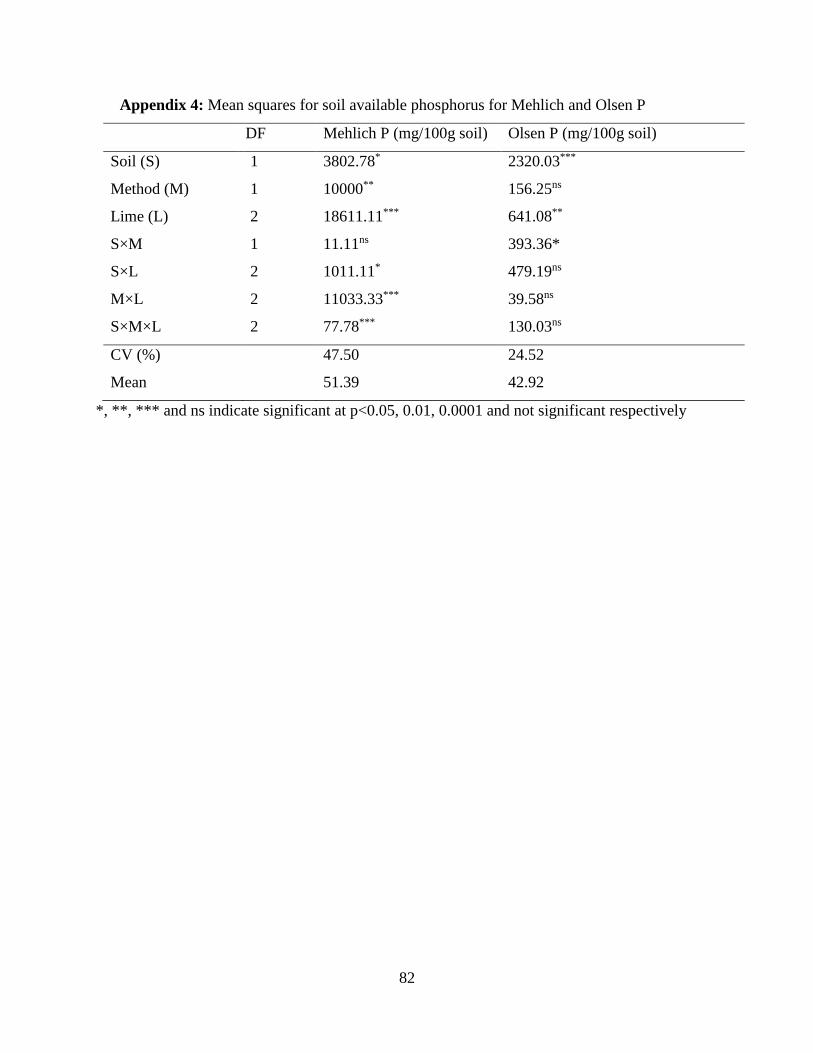
82
Appendix 4: Mean squares for soil available phosphorus for Mehlich and Olsen P
DF Mehlich P (mg/100g soil) Olsen P (mg/100g soil)
Soil (S) 1 3802.78* 2320.03***
Method (M) 1 10000** 156.25ns
Lime (L) 2 18611.11*** 641.08**
S×M 1 11.11ns 393.36*
S×L 2 1011.11* 479.19ns
M×L 2 11033.33*** 39.58ns
S×M×L 2 77.78*** 130.03ns
CV (%) 47.50 24.52
Mean 51.39 42.92
*, **, *** and ns indicate significant at p<0.05, 0.01, 0.0001 and not significant respectively

83
Appendix 5: Mean square for the factors affecting soybean growth parameters (Kuresoi Soil)
DF
No. of
pods
Nodule
fresh
weight
(g plant-1)
Effective
nodules
(%)
Shoot dry
weight
(g plant-1)
Roots dry
weight
(g plant-1)
N uptake
(g plant-1)
Ndfa
(%)
P uptake
(mg kg-1)
Lime (L) 1 1995.11** 12.26** 3.33ns 690.55* 19.1*** 0.002* 1019.22ns 4.69*
Variety (V) 1 693.44* 6.24ns 6693.09*** 0.49ns 0.63ns 0.02ns 558.63*** 584.03ns
Inoculation (I) 2 1803** 74.50*** 21232.39*** 596.15*** 32.84*** 0.03*** 5583.74*** 367.69***
L×V 1 1.00ns 2.85ns 373.68* 2.25ns 0.84ns 0.00ns 752.22ns** 26.69ns
L×I 2 370.11ns 3.03* 309.73** 75.6* 2.92* 0.00* 296ns* 20.86ns
V×I 2 311.11ns 14.84*** 5297.63*** 3.76*** 0.04ns 0.001ns 1017.36*** 52.03ns
L×V×I 2 156ns 2.91*** 99.23ns 4.83ns 1.02ns 0.01ns 24.63ns 8.58ns
CV (%) 54.06 42.86 17.64 28.58 19.98 49.00 37.6 31.08
Mean 24.33 2.19 40.61 14.91 3.63 0.07 24.8 15.97
*, **, *** and ns indicate significant at p<0.05, 0.01, 0.0001 and not significant respectively
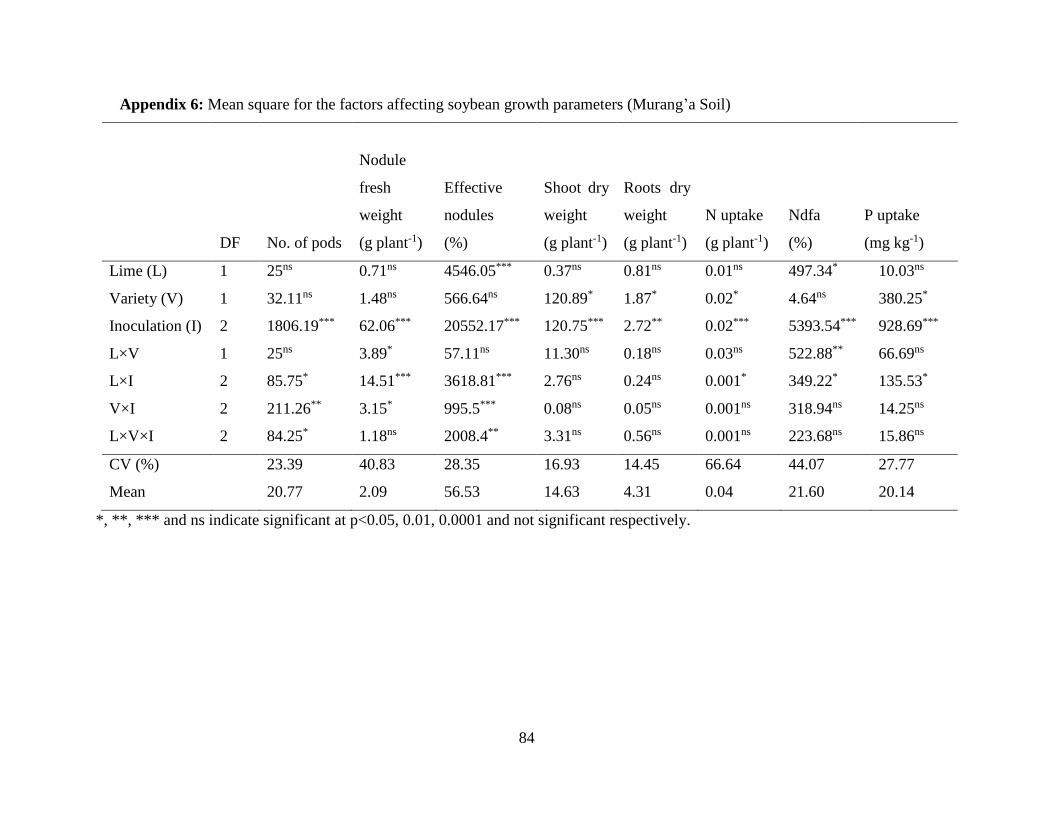
84
Appendix 6: Mean square for the factors affecting soybean growth parameters (Murang’a Soil)
DF No. of pods
Nodule
fresh
weight
(g plant-1)
Effective
nodules
(%)
Shoot dry
weight
(g plant-1)
Roots dry
weight
(g plant-1)
N uptake
(g plant-1)
Ndfa
(%)
P uptake
(mg kg-1)
Lime (L) 1 25ns 0.71ns 4546.05*** 0.37ns 0.81ns 0.01ns 497.34* 10.03ns
Variety (V) 1 32.11ns 1.48ns 566.64ns 120.89* 1.87* 0.02* 4.64ns 380.25*
Inoculation (I) 2 1806.19*** 62.06*** 20552.17*** 120.75*** 2.72** 0.02*** 5393.54*** 928.69***
L×V 1 25ns 3.89* 57.11ns 11.30ns 0.18ns 0.03ns 522.88** 66.69ns
L×I 2 85.75* 14.51*** 3618.81*** 2.76ns 0.24ns 0.001* 349.22* 135.53*
V×I 2 211.26** 3.15* 995.5*** 0.08ns 0.05ns 0.001ns 318.94ns 14.25ns
L×V×I 2 84.25* 1.18ns 2008.4** 3.31ns 0.56ns 0.001ns 223.68ns 15.86ns
CV (%) 23.39 40.83 28.35 16.93 14.45 66.64 44.07 27.77
Mean 20.77 2.09 56.53 14.63 4.31 0.04 21.60 20.14
*, **, *** and ns indicate significant at p<0.05, 0.01, 0.0001 and not significant respectively.
85
Appendix 7: List of publication

86
Appendix 8: Research Permit