effects of hydrocarbons on bivalves - arlis.org
TRANSCRIPT
I'·
1-lllllililllllll 3 3755 001 51446 2
STATE/FEDERAL NATURAL RESOURCE DAMAGE ASSESSMENT DRAFT PRELIMINARY STATUS REPORT
Project Title:
. Study ID Number:
Lead Agency:
Cooperating Agency(ies):
Principal Coinvestigators:
Assisting Personnel:
Date Submitted:
.. ~. . .._ ' ., ; . ' ;,• ....
EFFECTS OF HYDROCARBONS ON BIVALVES
Fish/Shellfish Study Number 13
State of Alaska, ADF&G Commercial Fish Division
Federal: USFS State: DNR
Alan s. Davis Wayne Donaldson
Dave Ackley - Project Biometrician Charles Trowbridge - Field Leader Dan Urban
December 3, 1990
.,.. ' i .
. .. '.
CONFIDENTIAL . NOT FOR PUBUC DISTRIBUTION
EXECUTIVE SUMMARY
During the 1990 field season, lit~leneck clams (Protothaca staminea), butter clams (SaxidomL giganteus) and razor clams (Siliqua patula) were collected from oiled and non-oiled sites in Prince William Sound, Cook Inlet, Kodiak and the Alaska Peninsula for growth data. A primary component of .this study is to document length at age in order to compare growth between oiled and non-oiled areas. Hydrocarbon and histopathology samples were collected to document oiling and to assess organ damage.
Two contracts, vital to the assessment of injury are in progress. Preliminary work on the microstructure of littleneck clam shells is completed. No stress check was apparent on the shell or hingeplate during a pilot study involving 20 littleneck clams from Prince William Sound. An additional 600 clams (oiled and non-oiled sites) from Prince William Sound will be examined during 1991.
Le~gth at age analysis is continuing by contract at the University of Alaska, Institute of Marine Science in Seward. To date 2,6El 1989 littleneck clams representing 9 sites and 175, 1990 lit~~eneck clams are aged. Littleneck clams are the priority species for analysis due to their ubiquitous distribution throughout the study area. As more sites are finished in 1991, comparisons of the growth rate between oiled and non-oiled sites will be made.
Preliminary results of hydrocarbon samples indicate widespread oiling in sediments and tissues from both oiled and non-oiled sites in Prince William Sound and from oiled sites in Cook Inlet. A final determination for the source of oiling is needed.
Approximately one-half of the tissue hydrocarbon samples are analyzed. At oiled sites, 62% of the tissue samples indicate oiling and at non-oiled sites 7% indicate oiling.
For sediments only 13% of the samples are analyzed. At oiled sites 88% of the sediment samples show oiling and at non-oiled sites 55% show oiling. This information should be considered preliminary. For many sites, samples from only one or two transects are complete, and for certain locations no results are available (Table 11).
During the summer no recently dead clams were found.
A reciprocal transplant of clams was conducted between oiled and unoiled beaches during the summer of 1990. Clams transplanted to oiled sites grew significant~y less than those transplanted to unoiled sites. The reduced growth at oiled sites was confirmed for both of length and weight.
This i.~ an inte;im or draft document. Oats pre.s.er.~tiCin, 2.Df.,__!'t"Lc., intr.·rpret<;tivn. and ~mc!usioru ~re suhject to chenge. f. .. (:a.ders Me enc<,lJraged to comact th(' E:t~--ironmeotal Se.ctiOI~ Al.a.~ka Department of Law bef01c dting.
1
'.
TABLE OF CONTENTS
LIST OF TABLES ........................................... •" ... i
LIST OF FIGURES ............................................... iii E::\ECUTIVE SUMMARY ............................................ 1
OBJECTIVES ................................................... 2
INTRODUCTION ............................................ 3
STUDY METHODOLOGY 4
STUDY RESULTS 8
STATUS OF INJURY ASSESSMENT .................................. 11
LITEAATURE CITED.... . . . . • • . . . . . • . . . . • . . • • • • . • • . • . • • • • . • . . . • . • • 14
an or draft doo.tm.::nt. entdysis, conclusions
pr.;:~n t3 ti0n, . . d U!V.rpre~HIOO. an are Sl;.t:;ect to chz..nge.
Rc-:~ers a.re er.o-,'.<.rug~~o to cor.;;act the E:rv:ronmcntal S<:-'-"tion, Ata.\ko. Dep~.runenr of T . .::.tw t..ef01 c dung.
LIST OF TABLES
Table
1. Locations and dates of sampling for the 1990 clam oil spill assessment project in Prince William Sound .•...•.• 15
2. Locations and dates of sampling for the 1990 clam oil spill assessment project in the Kenai and Kodiak area ..• 15
3. Locations and dates of sampling for ths 1990 clam oil spill assessment project in the Cook Inlet and Alaska Peninsula areas.·....................................... 15
4. Environmental factors by site for the 1990 clam oil spill assessment project in Prince William Sound ••.••••• 16
5. Environmental factors by site for the 1990 clam oil spill assessment project in the Kenai and Kodiak areas •• 16
6. Environmental factors by site for the 1990 razor clam oil spill assessment project in the Cook Inlet and Alaska Peninsula areas •...•••••.••••••••••..••.••••••..• 16
7. Quadrate height by transect and site from the 1990 oil spill clam assessment project in Prince William Sound ••• 17
8. Quadrate height by transect and site from the 1990 oil spill clam assessment project in Kenai and Kodiak areas. 18
9. Average number of littleneck clams per quadrate by transect for the 1990 clam oil assessment project at all sites....................................... . . . . . 19
10. Number of clams transplanted and recovered by site for the Prince William Sound reciprocal transplant experiment conducted from May to September, 1990 •••••••. 20
11. Results of the analysis of the sediment and clam hydrocarbon samples by area and sample type for the 1990 and 1989 clam oil assessment projects including the reciprocal transplant experiment •••••••••••••••••••. 21
12. Hydrocarbon samples by location, date, and sample type collected during the 1990 Prince William sound oil spill clam assessment study •••••••••••••••••••••••.•••.• 22
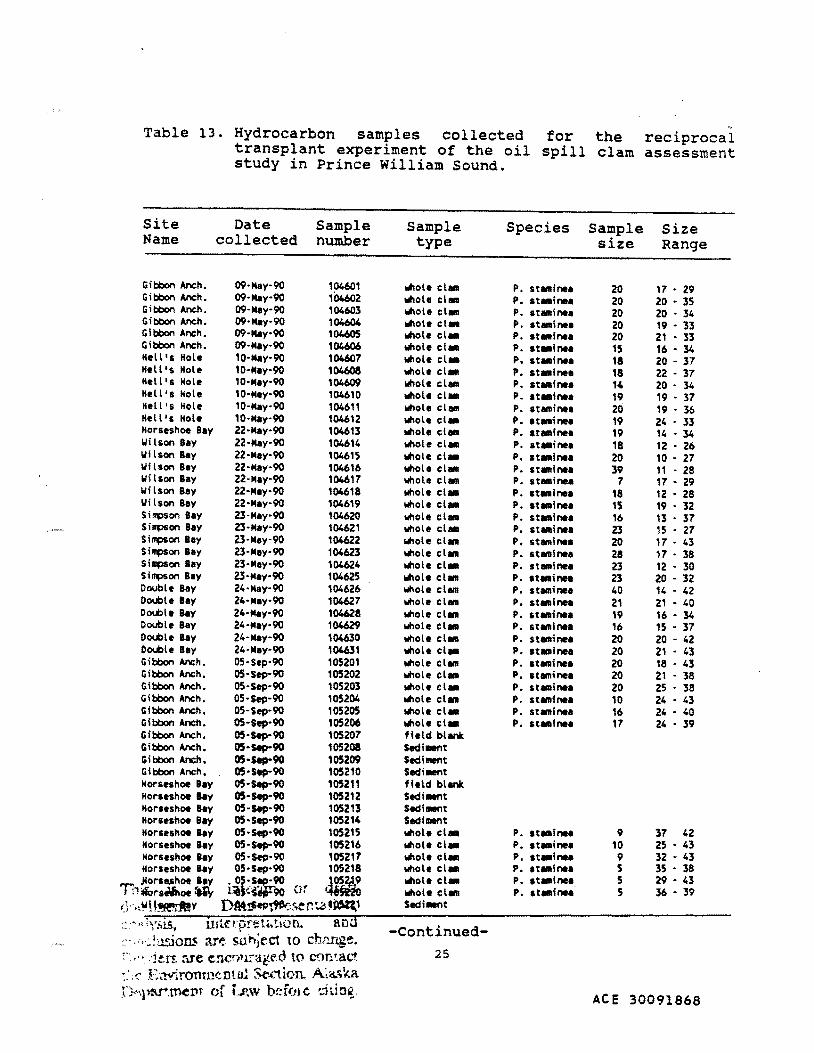
13. Hydrocarbon samples collected for the reciprocal transplant experiment of the oil spill clam assessment study in Prince William Sound ••••••••••••.•••••••••••••. 25
This is an i:nkrl"ll or draft dO<..·ument. [kt.t prc.:;en":.a tion, :Wtt''-":~ts, i.t>t('ror~toticn.. and :-:···.:::usiom arf! set:lject to ch.mge. f:,r:~~:~ers_ !i.Te e ncr-,t;..r age n. to ronf.act C~<' L~"!V'.ronm<:nttl! :\.e.-."tion, Aia.\ka D:~par.menr of L:.~w befOJ c: dti.ng.
i
ACE 30091840
LIST OF TABLES (continued)
Table
14. Hydrocarbon samples by location, date, and sample type collected during the 1990 clam oil spill assessment study in the Kenai and Kodiak areas ....•................ 27
15. Hydrocarbon samples by location, date, and sample type collected during the 1990 razor clam oil spill assess-ment study in the Cook Inlet and Alaska Peninsula areas. 30
16. Necropsy samples taken during the 1990 clam oil spill assessment project in Prince William Sound •••••.•.••.... 31
17. Necropsy samples taken during the 1990 clam oil spill assessment project in the Kenai and Kodiak areas •.•..•.. 31
18. Necropsy samples taken during the 1990 razor clam oil spill assessment project in the Cook Inlet and Alaska Peninsula areas ........•...•.•.•.••••.•••.••••••...•.•.. 32
19. Prince William Sound, 1990 Status Table, littleneck & butter clams. . . . . . . . . . . . . . . . . . . . . . . . . . . . . . . . . . . . . . . . . . 3 3
20. Cook Inlet/Kodiak, 1990 Status Table, littleneck & butter cla~s.... . . . . . . . . . . . . . . . . . . . . . . . . . . . . . . . . . . . . . . . . 34
21. Alaska Peninsula, 1990 Status Chart, razor clams •.•..... 35
22. Prince William Sound, Spring 1989 Status Table, littleneck, butter & cockles ..•.••••.......•••••••.•.... 36
23. Prince William Sound, Fall 1989 Status Table, littleneck clams ..•.••.•••..•..•..•.••••••••••.••••..... 37
24. cook Inlet/Kodiak, 1989 Status Table, littleneck & butter clams.............. . . . . . . . . . . . . . . . . . . . . . . . . . . . . . . 38
25. Growth parameters for clams from the reciprocal transplant experiment for oil spill damage assess-ment May 1990 to September 1990 .•••••..••...•••••••..... 39
26. Mean initial length in millimeters, mean initial weight in grams, mean increase in length in milli-meters and mean increase in weight in grams with accompanying standard deviations ..••••••••.••••••••..•.. 40
(!C"l: ~;~~i--i'.--~ ..... Uii:lit:~;"'""'.._Mrl""t en --~
M Th' . . . ~;;: ii l: 1 lS 15 an Jnterun or draft r;:·! !lJ docu~ent. . Data pre.~entation, • 1
i•i ana..)'Sl.S.' mterpretation. and i: 1
I 1 condu.s.Hlrls <ue suhjee1 to change. ;.·. Re~en; are enc!)uraged to contact ~;:
1~; the Environmental Sl"...,.k~n. A.l~~"~- l ACE 30091a41 ' r , . . -· -- .. . ~ ,...
i
- -::;:~: ..::1 ~: ~.:.-:= .. ~ ~-~ :_·:~· ... ---·-· .. -........ ~;.",

LIST OF FIGURES
Figure
1. Site loc"tions for the 1990 field season in Prince William ~ound, Fish/Shellfish study #13 •••••••••••••.•.• 41
2. Site locations for the 1990 field season in cook Inlet, Kodiak, and ~he Alaska Peninsula •••.•...••••••... 42
3. Paired locations for the reciprocal clam transplant in Prince William Sound •••.••..•••••••.•••••••.••..•.••. 43
4. Beach plot configuration for the reciprocal transplant experiment in Prince William Sound •••••.••••••••••.•.•.. 44
5. Length frequency histograms of clams tagged for reciprocal transplant experiment in Prince William Sound 1990 ..•••••••••••••••••.•••••••••••••••••••••••••• 45
6. Quantile-quantile plots of clam lengths for clams tagged in reciprocal transplant experiment in Prince William sound 1990...... • • • . . • • • • • • • • • • • • • • • • • • . • • • • • . . . 46
7. Quantile-quantile plots of clam lengths for clams notched but not tagged in reciprocal transplant experiment in Prince William Sound 1990 ••••••••••.•.•••• 47
S. Length frequency histograms for clams tagged for reciprocal transplant experiment in Prince William Sound and for clams which remained at the transplant site. . . . . . . . . . . . . . . . . . . . . . . . . . . . . . . . . . . . . . . . . . . . . . . . . . . . 4 8
9. Ford-Walford diagram for tagged clams removed from Double Bay and transplanted to Horseshoe Bay •••••.....•. 49
10. Ford-Walford diagram for tagged clams removed from Gibbon Anchorage and transplanted to Hell's Hole •.••.... 50
11. Ford-Walford diagram for tagged clams removed from Hell's Hole and transplanted to Gibbon Anchorage •••••••• 51
12. Ford-Walford diagram for tagged clams removed from Horseshoe Bay and transplanted to Double Bay ••••.••••... 52
13. Ford-Walford diagram for tagged clams removed from Simpson Bay and transplanted to Wilson Bay •••••••••.•••• 53
"1.~.~- Ford-Wa:lford. ~4i~gram -for tagged clams removed from Wilson Bay and transplanted to Simpson Bay ••••••••••••.. 54
T'ois is an interim or draft document. Data presen~tion, iii !:':1BJl-"SlS, h1terpretation. and ',,: c::.r.c~u.sions are subject to cb.anJze. r:~:v1ers are encouraged tf\ ,..,..,,._,;,v• s4Z l:,e .Eavironm~Y"~tn 1 -:--, /1-C.E 30°
9l
Depa~,. ... :
LIST OF FIGURES (continued)
Table Page
15. Von Bertalanffy (LVB) growth curve for each site and tidal height. Curves with lines represent clams transplanted.to oiled sites. The LVB curve is from a GM regress1on .••...•.••••......••.••.....•••••••.....• 55
16. Von Bertalanffy (LVB) growth curve for each site and tidal height. Curves with lines represent clams transplanted to oiled sites. The LVB curve is from a Ford-Walford type regression •••••••••••.•••••••..••••• 56
This is an interim or draft document. IX.ta pre.sentation, ana'·YSLS, h1tcrpretatioo. and condusions are subject to change. F..e~ers are encm1raged to cont.act t};c E:.1v1ronmeotal Se<:tion, Alaska Department of Law before citing.
iv
ACE 30091843
e:;.
4.
OBJECTIVES
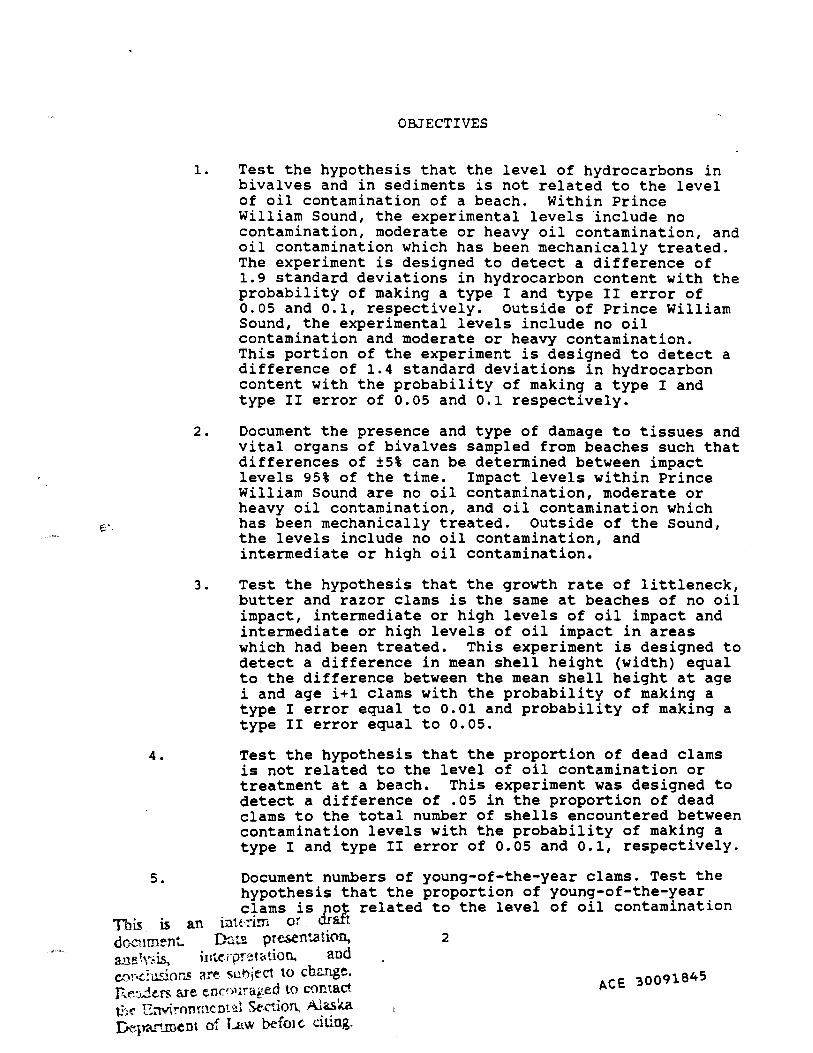
1. Test the hypothesis that the level of hydrocarbons in bivalves and in sediments is not related to the level of oil contamination of a beach. Within Prince
2.
3.
William Sound, the experimental levels include no contamination, moderate or heavy oil contamination, and oil contamination which has been mechanically treated. The experiment is designed to detect a difference of 1.9 standard deviations in hydrocarbon content with the probability of making a type I and type II error of 0.05 and 0.1, respectively. outside of Prince William Sound, the experimental levels include no oil contamination and moderate or heavy contamination. This portion of the experiment is designed to detect a difference of 1.4 standard deviations in hydrocarbon content with the probability of making a type I and type II error of 0.05 and 0.1 respectively.
Document the presence and type of damage to tissues and vital organs of bivalves sampled from beaches such that differences of ±5% can be determined between impact levels 95% of the time. Impact levels within Prince William Sound are no oil contamination, moderate or heavy oil contamination, and oil contamination which has been mechanically treated. outside of the Sound, the levels include no oil contamination, and intermediate or high oil contamination.
Test the hypothesis that the growth rate of littleneck, butter and razor clams is the same at beaches of no oil impact, intermediate or high levels of oil impact and intermediate or high levels of oil impact in areas which had been treated. This experiment is designed to detect a difference in mean shell height (width) equal to the difference between the mean shell height at age i and age i+1 clams with the probability of making a type I error equal to 0.01 and probability of making a type II error equal to 0.05.
Test the hypothesis that the proportion of dead clams is not related to the level of oil contamination or treatment at a beach. This experiment was designed to detect a difference of .05 in the proportion of dead clams to the total number of shells encountered between contamination levels with the probability of making a type I and type II error of 0.05 and 0.1, respectively.
5. Document numbers of young-of-the-year clams. Test the hypothesis that the proportion of young-of-the-year clams is not related to the level of oil contamination
This 15 an intcim or draft document. Dam -presentatiCln, 2 &JJ!i~Y::;is, ii1tupr';t"tion. and Cl)N.!usior.:.s 2l'"'! seoject to change. ACE 30091845 R~:.;.den;. are enc11.&raged to contact t:::~ E::tviromacntul $t-.ction, ~~ka Depa.rtment of Law befm c c1uog.
6.
or treatment at a beach. This experiment is designed to detect a diff2=ence of .05 in the proportion of youngof-the-year clams to "-he total number of live clams between contamination levels with the probability of making a type I and type II error of 0.05 and 0.1, respectively.
Identify potential alternative methods and strategies for restoration of lost use, populations, or habitat where injury is identified.
INTRODUCTION
The Management Team, during the winter of 1989-90, combined both Fish/Shellfish studies #13 & #21 into one project, Fish/Shellfish #13. The focus for 1989, was to conduct transect sampling at oiled and unoiled beaches for cockles, littleneck and butter clams. Obtaining length at age data for clams by known tidal height along with acquiring histopathology and hydrocarbon samples was the primary focus. Study #13 examined beaches within Prince William Sound and study #21 sampled the outer Kenai Peninsula coast, Cook Inlet and Kodiak Island.
The ·.raluation of growth at oiled and non-oiled sites in the spill area is also the primary focus of this study. The population size of clam resources is not estimated due to the small sample size and the limited number of beach sites visited.
Transect sampling for Prince William Sound, outer Kenai Peninsula coast, Cook Inlet and Kodiak Island continued in 1990. To further test the effects of hydrocarbons on bivalves, the Management Team suggested the addition of razor clam beaches on the Alaska Peninsula to the study plan. cockles were dropped as a target species as limited numbers of cockles were encountered in 1989.
A reciprocal clam transplant to test the site specific effects on growth of littleneck clams was conducted. Growth of clams from oiled beaches is compared to the growth of clams from the same beaches, when transplanted to non-oiled beaches during the summer growth period. Likewise a transplant from non-oiled to oiled clam beaches is employed for comparison.
To detect if a stress check, caused by the oil spill, is present, and to examine differences in growth between the year prior to the spill and the year of the spill, a contract with the washington Department of Fisheries was established for microstructure analysis of littleneck clam shells. The J.nicrost.ruct.ure work is preliminary, with initial cross sections
This 15 an mk~1!D or driUt dOClJment. Th.lt.a pre.~m.a tion, 3 aneJyl\is, iute.rpr~t~tion. and c.o1:.dusiom are sob~r.ct to cbznge. ACE 3oo9lB46 Re:.:.den: are encol.>rag.ed to cnntact t};e Enviromaemn1 Section, Ai~s~.~ D~pru"".roent of La.w before citing.
of the hingeplate and shell being examined. The determination of clam age by microstructure is being compared to visual aging techniques conducted by the University of Alaska. Institute of Marine Science in Seward.
STUDY METHODOLOGY
Beach sites for the 1990 season in Prince William Sound were selected after discussions with the marine mammal project leader for sea otters and with the ADF&G game biologist for the Prince William Sound Area (Figure 1). Sites were chosen in the vicinity of sea otter and bear habitat as directed by the Peer Reviewers. Six of the nine beaches sampled in 1989 were also sampled in 1990. Three of the sites sampled in 1989 were dropped (Ellamar, Foxfarm and outside Bay) and four sites were added (Double Bay, North Chenega, Green Island and Horseshoe Bay) for a total of ten sites in 1990. Pellew Cove, a control site initially dropped from the 1990 sampling plan was later added so that three control sites which were sampled in 1989 would be repeated in 1990. After site selection an unsuccessful attempt was made to identify which beach sites were mechanically cleaned.
For the Cook Inlet/Kodiak portion of the study, six of the eight sites sampled in 1989 were again surveyed in 1990. Two sites on Kodiak were d.._)pped (McDonald Lagoon and Ruth Bay) due to the low number of clams encountered in 1989 and two sites in Cook Inlet were added (Tutka Bay, Tonsina Bay) (Figure 2).
Five razor clam beaches were substituted for those listed in the 1990 study plan. The change was made during the field season when more information became available regarding razor clam resources on the Alaska Peninsula (Figure 2).
Transect sampling for littleneck and butter clams was accomplished similar to the 1989 field season with the exception of quadrate placement. Three parallel transects were laid out perpendicular to the water line with each transect containing eight, 1/4 m2 quadrates. The top of each transect was located at the +1.6 m (5.2 ft.) tide height and a trench was dug downslope until the first clam was located. Upon determining the tide height at which the first clam was discovered the quadrates were located by dividing the total change in elevation (from first clam to water's edge) by eight, yielding the elevational increment between each quadrate. In this manner the first quadrate was located one increment below the first clam, the second quadrate two increments below, etc., with the eighth quadrate being located at the daily low water.
This is an inteim or draft d~1ment.. D'..lU presen~tiCI~ an e. ~y:o.is, illt(rpn~thtion. and 4 c::n-;c~usior..s ~r(! S\!bject to change. r:.e:.:.ders Me e:ncct,~rat.:e~ to C?~i.act ti::~ Enviro:nnenta! Se(~IQJt A..la."k.a ACE 30091847 Depru"":..tnel'lt of i...r~w bt:fu1 c citing.
Quadrates were excavated to a depth of 0.3 meters (1ft.). All littleneck and butter clams within a quadrate were taken for hydrocarbon, histopathology or grc~th samples. Shell debris consisting of dead hinged shells ~~d complete single valves was also collected during quadrate sampling.
Before excavating each quadrate the top 2-5 em of substrate was removed and placed onto a tarp for later sieving with a 1 mm wire screen. The purpose in using a fine screen on the near surface sediments was to locate very small clams. The remainder of each quadrate was excavated with a shovel and clam rake. These sediments were later·sieved through a 3 mm wire screen to obtain any clams which were masked by the substrate. Water was supplied by a small gas fired pump.
The hydrocarbon samples collected at each site consisted of one composite clam sample of each target species (if present) per transect with an environmental replicate of littleneck and butter clams collected from transect one. Three composite sediment samples were collected at each transect with a single concurrent field blank.
Littleneck and butter c~am histopathology samples were collected at each site if a sufficient number of clams were present. The samples were placed in ten percent buffered formalin and then transferred to a seventy percent alcohol solution after three days. ·
The site layout for razor clams consisted of a single transect running parallel to the tide line and spanning the 0 to -1 ft. tide height. The majority of razor clams were dug using clam shovels with the balance collected by hand or with the use of a pump and nozzle to excavate them. Hydrocarbon samples taken at each site consisted of three composite sediments, one field blank, three whole clam composites, and one environmental replicate. One histopathology sample was taken at each site.
The tagging and reciprocal transplant of littleneck clams was new this year. six sites (3 oiled, 3 non-oiled) in Prince William sound were utilized (Figure 3).
This experiment began in May 1990, with the tagging and transplanting of clams. Recovery occurred during September 1990, bracketing most of the growing season. Clams were transplanted from oiled to non-oiled beaches and from non-oiled to oiled beaches.
This is an interi!D or draft document. Data preser.~tion. anaJvsis, h1t{ rpretation. and con~lu.sioru; ~.re sub;~ct to ch;mge. F.e:.;.ders are encol.I!Uf,fO to contact the Eavtronmeow! Se("tiOn, Alaska Department of Law befo1 c ci ling.
5
ACE 30091848
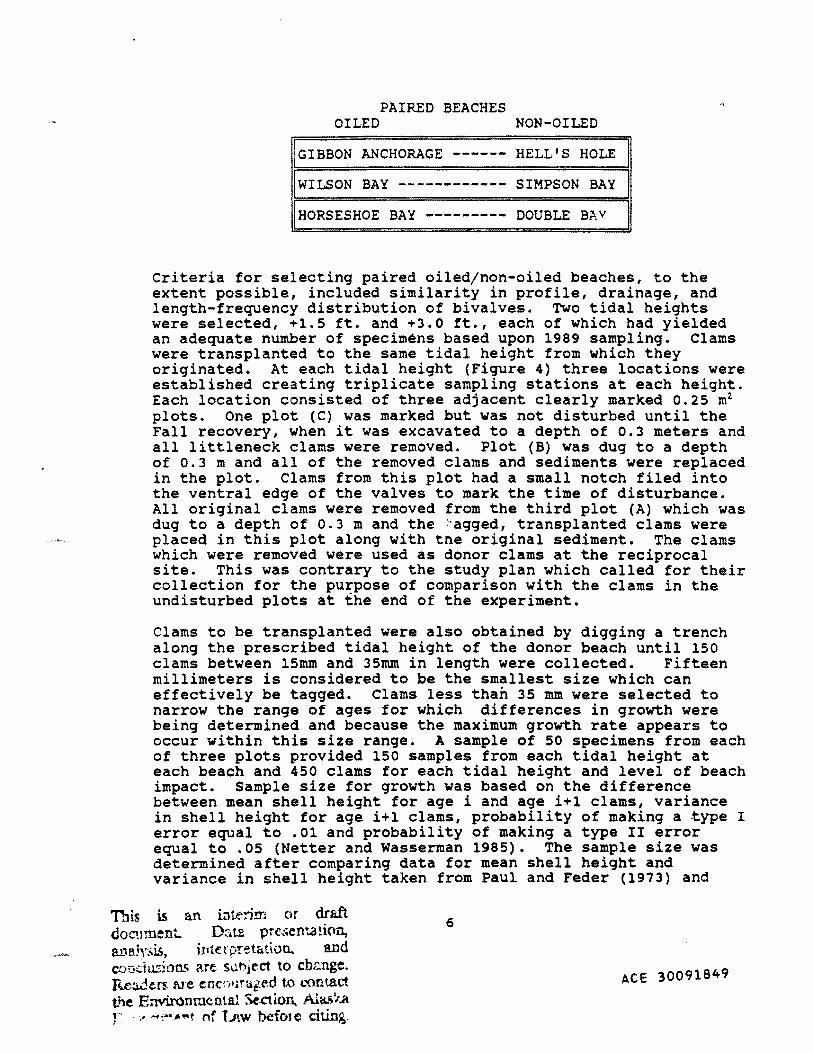
PAIRED BEACHES OILED NON-OILED
GIBBON ANCHORAGE ------ HELL'S HOLE
WILSON BAY ------------ S IMPC:::"'"' "'" " ....
HORSESHOE BAY --------- DOUBLE BAY
Criteria for selecting paired oiledjnon-oiled beaches, to the extent possible, included similarity in profile, drainage, and length-frequency distribution of bivalves. Two tidal heights were selected, +1.5 ft. and +3.0 ft., each of which had yielded an adequate number of specimens based upon 1989 sampling. Clams were transplanted to the same tidal height from which they originated. At each tidal height (Figure 4) three locations were established creating triplicate sampling stations at each height. Each location consisted of three adjacent clearly marked 0.25 m2
plots. One plot (C) was marked but was not disturbed until the Fall recovery, when it was excavated to a depth of 0.3 meters and all littleneck clams were removed. Plot (B) was dug to a depth of 0.3 m and all of the removed clams and sediments were replaced in the plot. Clams from this plot had a small notch filed into the ventral edge of the valves to mark the time of disturbance. All original clams were removed from the third plot (A) which was dug to a depth of 0.3 m and the >agged, transplanted clams were placed in this plot along with the original sediment. The clams which were removed were used as donor clams at the reciprocal site. This was contrary to the study plan which called for their collection for the purpose of comparison with the clams in the undisturbed plots at the end of the experiment.
Clams to be transplanted were also obtained by digging a trench along the prescribed tidal height of the donor beach until 150 clams between 15mm and 35mm in length were collected. Fifteen millimeters is considered to be the smallest size which can effectively be tagged. Clams less than 35 mm were selected to narrow the range of ages for which differences in growth were being determined and because the maximum growth rate appears to occur within this size range. A sample of 50 specimens from each of three plots provided 150 samples from each tidal height at each beach and 450 clams for each tidal height and level of beach impact. Sample size for growth was based on the difference between mean shell height for age i and age i+1 clams, variance in shell height for age i+1 clams, probability of making a type I error equal to .01 and probability of making a type II error equal to .05 (Netter and Wasserman 1985). The sample size was determined after comparing data for mean shell height and variance in shell height taken from Paul and Feder (1973) and
This is &.n interim or draft doc'.lment. D::.ca prc$entation, enaJYi-LS, illterpr~tt~-t\on. and co::::·dusion.~; ~.re sul')~ect to change. Rcaaers. rue enc;~-,llrat:ed to '-'Oilta.ct ti-le Emtironm(':.otal ~ctton. Ala.~~.a r '·,• """:"'~'"t nf l.nw before citin&.
6
ACE 30091849

Nickerson (1977). The sample size for detecting between impact level differences in growth at age of clams in the size range of 15 mm to 35 mm was estimated at 133 clams from the Paul and Feder data and at 85 clams from the Nickerson data for each impact level. The higher estimate was rounded up to 150 clams by including the next smaller size group (age 5-6). The purpose of three sites for each impact level is to provide replicates at each impact level.
The transplanted clams were identified by marking each clam with a numbered, laninated-plastic Floy1 tag secured with a quickdrying cyanoacrylate'adhesive. All marked clams had a small notch filed into the ventral edge of each valve to mark the time of transplantation. Individual clams were measured at the beginning and end of the experiment. Total length (anterior to posterior), and whole weight were taken at the time of transplant with wet shell weight taken in addition to these at recovery. Clams were collected in September 1990 rather than October as prescribed in the study plan.
Contrary to the study plan, hydrocarbon clam samples were taken at station A, both at the experiment's inception and end. An additional ten to twenty notched clams were placed in each plot A to allow for a hydrocarbon sample at recovery without sacrificing tagged individuals. Hydrocarbon sediment samples were taken only at recovery. No necropsy samples were collected.
All tide levels were found using a Tidefinder, model # TF20 manufactured by Connex Electro systems. Beach elevations were determined through the use of the Tidefinder in conjunction with a hand level and stadia rod.
Floy Tag & Manufacturing Inc., Seattle, Wa
This is an interi!ll or draft docmnent. Dam pre:;entation, antdr~is. il1terpretation. and
7
condusions are schject to ch.mge. F,t:~ers are enc(-:-,tl!aged to rom.at."t ti::~ E .. mronmenta~ Section Aiet.'i!ut. ACE 30091850 n~panruenr of Lnw befmc citing.
STUDY RESULTS
Reciprocal Transplant Experiment
Clams between roughly 15 mm and 35 mm were selected for tagging. F1fteen millimeters was considered to be the smallest size which could effectively be tagged. Clams less than 35 mm were selected to narrow the·range of ages for which differences in growth occur and because the incremental growth for larger clams was small enough to make differences difficult to detect. A sample of 50 specimens from each of three plots provided 150 samples from each tidal height at each beach and 450 clams for each tidal height and level of beach impact oiling. The actual number of clams recovered are shown in Table 10.
Data was recorded for the tagged clams, the clams from disturbed plots and the clams which were left undisturbed until the end of the experiment. Although length and weight information were recorded for the clams from disturbed and undisturbed plots, no initial lengths were available from these clams. Growth analysis for these clams will be delayed until the clams can be aged, and the length at time of notching or at the annulus prior to the experiment can be determined. The majority of the data presented below is for the tagged clams only. The results presented below should be considered preliminary because site effects and or transplantation effects have yet to be analyzed.
The size distribution of the tagged clams for two tidal heights at'each site of origination is provided in Figure 5. As can be seen in the histograms, the size distribution within the range of clams selected for transplant was fairly similar between the two tide heights at each site. The exception to this similarity of clam sizes between heights was at the paired sites of Simpson Bay and Wilson Bay where the clams in the lower tidal height appear to be generally smaller than those in the upper tidal height. The quantile-quantile plots shown in Figure 6 confirm the size differences between tidal heights. In each plot, the upper tidal height is being compared to the lower tidal height (1:1 correspondence line), and the upper is noticeably higher in the clams from Simpson Bay and Wilson Bay. When the clams from plots which had been disturbed (notched but untagged clams) were compared by quantile-quantile plot (Figure 7), the same general pattern seen in Figure 6 was evident for clams not selected by size.
The size distribution of the tagged and transplanted clams is compared to the size distribution of the clams recovered from the recipient site at the end of the experiment in Figure a. The tagged clams from Hell's Hole and Gibbon Anchorage similarly tend to be larger than those located in the recipient beach. For instance, tagged clams from Gibbon Anchorage are shown as tagged
8
ACE 30091851
in the plot of indigenous clams from Hell's Hole. There were few disturbed or undisturbed clams recovered from Horseshoe Bay. The tagged clams which or:ginated in Horseshoe Bay (shown in Double Bay) were generally larger than those finally recovered from Double Bay. Simpson Bay and Wilson Bay donor clams appear to be of the same size distribution as the sites to which they were transplanted.
Growth for tagged clams was determined for clams pooled over the three replicate tagging plots at each tidal height (1.5 ft and 3.0 ft) at each site. The Ford-Walford plot of final length to initial length is presented for each site in Figures 9 - 14. The site names are those of the donor site from which the clam originated. The lines are from the regression with final length as the dependent variable and initial length as the independent variable for each tidal height. In a Ford-Walford plot, the asymptotic size (L.) of the clam is where the regression line crosses the 45" diagonal. The figures also provide a scatter plot of final growth on initial growth. As would be expected, clams of a smaller size have increased by a greater amount than the larger clams. The clams with the smallest overall increase in size appear those which originated in Simpson Bay (unoiled) and were transplanted to Wilson Bay (oiled).
Growth curve parameters for the von Bertalanffy (LVB) growth curve were estimated from the Ford-Walford regressions shown in Figures 9 - 14 above, and by a geometric mean (GM) regression suggested by Ricker (1975). The parameters are presented in Table 25. In a study of clams in Prince William Sound in 1'~ 7, Nickerson (1977) found similar growth parameters for clams at Simpson Bay with a value of LVB K of 0.23 and a value for L. of 51.5. The values found in the Ford-Walford plot in this study had LVB K values of .204 and .233 and L. values of 38.2 and 34.3 for the 1.5 and the 3.0 foot tide heights, respectively for clams which had been transplanted to Simpson Bay from Wilson Bay.
The LVB parameters in this study show the slowest growth for the lower tidal height at Simpson Bay, as would be expected from the plot of growth in Figure 13. For each pair (oiled vs unoiled), L. appears to be lower and the LVB growth parameter K higher in clams which were transplanted to oiled sites. This is represented graphically in Figures 15 and 16 which show the curves resulting from the parameters presented in Table 25. Growth curves with lines represent clams which were transplanted into oiled areas. For both curve equations, the lower curves tend to be those for clams transplanted to oiled locations.
In order to examine differences in growth between oiled and unoiled sites, the increment of growth in millimeters which had been added to clam length over the summer of 1990 was compared between oiling and tidal height categories. The mean initial
This is an intc:~i!n or draft d0cunent. D:::.c: ~rre~;ern.atiOD.s :::.t.,.F-.-''1".-iLS, i!ltt' rpr~.:t&.tioo. and C.'J!'dJ.Sions are sut.ject tO cbr..nge. r .. r---::.:..:krs are enc~)l..l!"ageti to rontact t}:~ E•,....;ronme~ud Se.ction, Ala\~ D~partrnent of LAw before citing.
9
ACE 30091852
length and growth during the experimental period for each site and each tide level are provided in Table 26. The table shows that the growth increment for length over the experimental period was less for clams transplanted to oiled sites in each pair at each tide level. Ignoring differences in tidal height and examining differences between paired sites, the only site showing a slightly greater increase in mean length was the 1.5 foot level from Double Bay (transplanted to an oiled site - Hor~~shoe Bay) which showed a mean increase of 2.21 mm compared to a 2.20 mm increase for clams from the 3.0 foot level at Horseshoe Bay (transplanted to an unoiled site- Double Bay).
Clams were pooled into oiled and unoiled categories according to the site to which they had been transplanted. Clams transplanted to oiled sites grew significantly less (mean=1.67 mm, N=837) than those transplanted to unoiled sites (mean=2.86 mm, N=SlS, Kruskal-Wallis p=.0001). Clams similarly pooled according to tidal height were found to have grown significantly more at the lower (1.5 ft) tidal height (mean=2.60 mm, N=842) than did those at the higher (3.0 ft) tidal height (mean=1.91 mm, N=813, Kruskal-Wallis p=.OOOl).
Since larger clams grow at a slower rate, the size of clam was analyzed as above. Clams pooled by the oil status of the site to which they were transferred were found to be significantly larger at oiled sites (mean=26.65 mm, N=837) than at the unoiled sites (mean=24.42 mm, N=SlS, Kruskal-Wallis p=.OOOl), and to be significantly larger at the higher tidal height (3.0 m) (mean=26.21 mm, N=813) than at the lower tidal height (1.5 m) (mean=24.9l, N=842, Kruskal-Wallis p=.001).
since the larger average size of clams at oiled sites and at the higher tidal level could have caused the reduced seasonal growth in clams at the levels shown above, a regression was conducted with clam growth over one season as the dependent variable and the initial length of the clam, the oil status of the site (0 if unoiled, 1 if oiled) and tide height as independent variables. The stepwise regression was significant (p=.0001) with a (somewhat low) R2 value of 23.3% and all of the parameters entered the model with the following coefficients (significant at p=.0001):
IG • 6.624 - .122(IL) - .916(0) - .358(TH)
where IG is incremental shell growth in millimeters, IL is initial length, 0 is oil status, and TH is tidal height. This regression implies that the growth during the 1990 season was reduced by the size of the clam, as would be expected in an LVB growth curve. Growth was also reduced, however, by the level of oiling (0 if unoiled, 1 -if oiled) and tide height. This
This ~ an inte~i!ri or draft doCtnnent. D~tt pre$en~tion, &L'\eh~is. inte rpr~u.tioo. and c.·::n~;,.iusioru: are subject to change. :r.~:~ders are encouraged to contact t! :e E:.1Y"ironmemal Section. Ala.~ka lfr.par.roent of i..Jtw before dti.og.
10
indicates that the lesser growth at oiled areas and higher tida'l heights may be in addition to effects due to clam size.
The mean weight for each site at each tide level is also provided in Table 26. As was the case with mean lengths, clams at most of the sites showed a reduced increase in weight when transplanted to oiled sites than did those transplanted to unoiled sites. Two exceptions were clams transplanted from the 1.5 foot level at Double Bay (to an oiled site - Horseshoe Bay) which increased an average of 1.16 g compared to a 0.90 g increase in clams transplanted from Horseshoe Bay (to an unoiled site - Double Bay) and clams transplanted from the 3.0 foot level at Simpson Bay (tc an oiled site - Wilson Bay) which increased an average of .12 g compared to a 0.11 g increase in clams transplanted from Wilson Bay (to an unoiled site- Simpson Bay).
Results similar to those above were found for differences in clam weight between oiled and unoiled sites. Clams transplanted to oiled sites increased significantly less in weight (mean=.572 g, N=786) than did clams transplanted to unoiled sites (mean=.946 g, N=782, Kruskal-Wallis p=.0001), and clams transplanted at the higher tidal height (3.0 ft) increased significantly less in weight (mean=.481 g, N=768) than did clams transplanted to the lower tidal height (1.5 ft) (mean=1.03 g, N•BOO, Kruskal-Wallis p=.0001). Clams did, however weigh more at oiled sites (mean=6.06 g, N=786) than unoiled sites (mean=4.50 g, N=482, Kruskal-Wallis p=.0001) and at the higher tidal height (mean=5.67 g, N=768) than at the lower tidal height (mean=4.91 g, N=SOO, Kruskal-Wallis p=.001). A significant regression (p=.0001, R2=16.4t) was also found for weight with all parameters significant (p=.0001) as follows:
IG = 1.990 - .075(IW) - .241(0) - .320(TH)
where IG is incremental seasonal growth in grams, IW is initial weight, 0 is oil status, and TH is tidal height. The regression has the same tendency as that for length above, but the influence of oiling is reduced in the equation for weight.
STATUS OF INJURY ASSESSMENT
To date, 703 hydrocarbon clam and sediment samples (294 from 1989 and 409 from 1990) have been collected and submitted for analysis. Results have been received on 205 of these samples. This leaves a total of 498 samples in the analytical queue at the Auke Bay Repository. Preliminary results indicate that 62.0t and aa.ot of the clam and sediment samples analyzed from oiled sites show
is an inte.>:;im or draft This dr;C'nn:nt. D:ln! {)re.:;en~tion, :; na h·~-\L\, i11tc rpret<> tio~ and
11
c;r.cmsio~ l.'tre sl.!t:'!ject to ch<:.nge. f..,~:,,::!e.~. are c:;aco'lraged to rontact t.i::'!' E~~ronmcot.al S~.ction. Alas!ul o.-..pa.."'tDleDt of Lnw before dti.o.g.
ACE 30091854
contamination and that 6.7% and 55.5% of the clam and sediment samples from unoiled sites show contamination (Table 11). No razor clam tissue or sediment samples are analyzed, although razor clam tissue samples collected in May 1989 from Cook Inlet by the Sport Fish Division of ADF&G did not show oiling.
Based on preliminary hydrocarbon results, showing oiling in both tissue and sediment samples, it is recommended that histopathology of stored littleneck clam samples begin, to determine if damage occurred to vital organs.
The age and growth ·rate of littleneck clams has not yet been determined due to the backlog of length at age samples to be processed at the University. of Alaska. currently, ten of the twenty two sites sampled in 1989 and three of the eighteen 1990 sites have been processed for length at age information. This leaves twenty six sites awaiting aging by UA-IMS. At present none of the data is entered or analyzed.
Total length, whole weight and wet shell weight information is available on all clams except three of the 1990 control sites and four of the fall 1989 sites in Prince William Sound. This information is not analyzed.
once the length at age information is available, a history of growth for each site will be established. Growth data by quadrate will also be available to establish differences in rate with tidal height. Relative cohort strength will be predicted using all the quadrates from each site.
The low numbers of butter clams collected during both sampling years has precluded their inclusion in the growth and age determination effort. They will be processed as time and money allow however littleneck clams will remain the priority.
Length and weight information has been taken on all razor clams collected in 1990. At present, unless hydrocarbon results show oiling, razor clams will not be a priority for length at age analysis.
Shell debris was collected at all littleneck and butter clam sites sampled in 1990. These samples are being processed and are expected to be completed this winter. After processing a comparison will be made between sites. Since no dead clams were
.encountered, a comparison of recently dead clams to shell debris will not be accomplished as stated in objective four.
Documentation of young-of-the-year (YOY) clams will be part of the growth and age determination work being conducted by UA-IMS. As this work progresses, the age of clams by site will be available.
12
ACE 30091855
~~\J.~i·r .. f!, r. ~ •
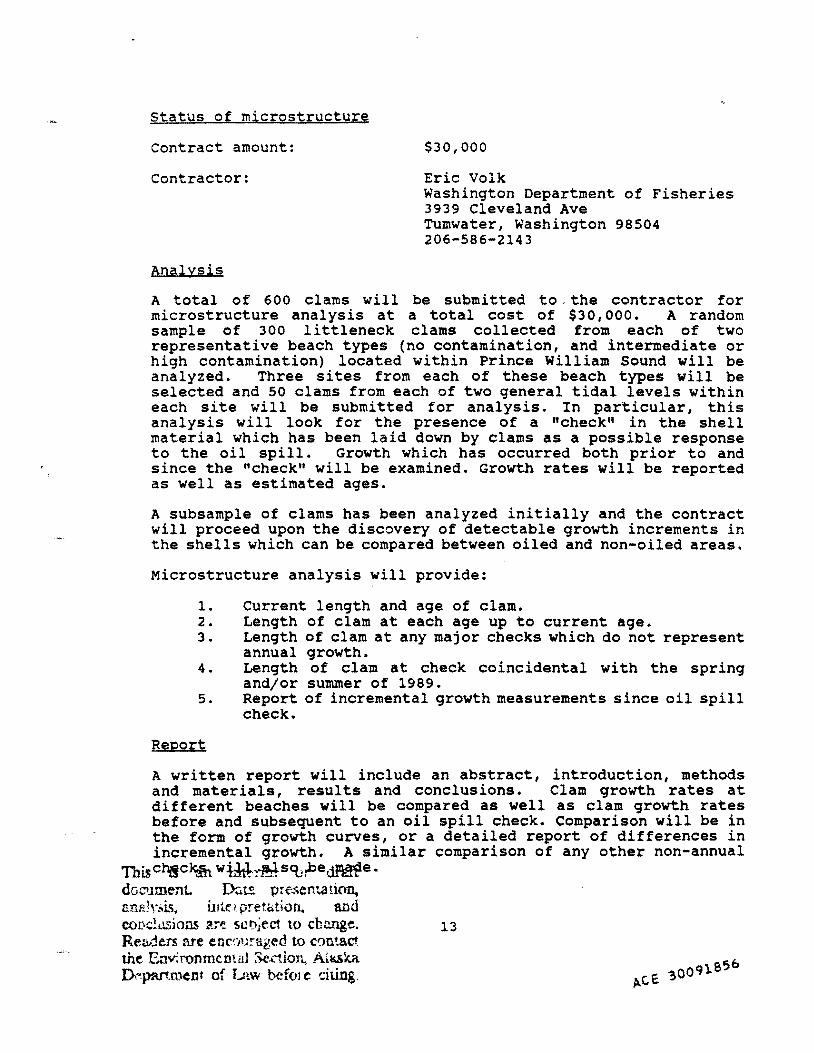
Status of microstructure
Contract amount:
Contractor:
Analysis
$30,000
Eric Volk Washington Department of Fisheries 3939 Cleveland Ave Tumwater, Washington 98504 206-586-2143
A total of 600 clams will be submitted to the contractor for microstructure analysis at a total cost of $30,000. A random sample of 300 littleneck clams collected from each of two representative beach types (no contamination, and intermediate or high contamination) located within Prince William Sound will be analyzed. Three sites from each of these beach types will be selected and 50 clams from each of two general tidal levels within each site will be submitted for analysis. In particular, this analysis will look for the presence of a "check" in the shell material which has been laid down by clams as a possible response to the oil spill. Growth which has occurred both prior to and since the "check .. will be examined. Growth rates will be reported as well as estimated ages.
A subsample of clams has been analyzed initially and the contract will proceed upon the discovery of detectable growth increments in the shells which can be compared between oiled and non-oiled areas.
Microstructure analysis will provide:
1. current length and age of clam. 2. Length of clam at each age up to current age. 3. Length of clam at any major checks which do not represent
annual growth. 4. Length of clam at check coincidental with the spring
andjor summer of 1989. 5. Report of incremental growth measurements since oil spill
check.
Report
A written report will include an abstract, introduction, methods and materials, results and conclusions. Clam growth rates at different beaches will be compared as well as clam growth rates before and subsequent to an oil spill check. Comparison will be in the form of growth curves, or a detailed report of differences in incremental growth. A similar comparison of any other non-annual
Thlsct;!ck:fit wHtt:-J!rl.scurbe~e. document. D::.:.t.!. presentation, a.neh':'is, interpret~t;on, and coN.:!usions are sor,ject to cbnnge. Re:.v::!ers are encrlll;aged to C'JJlta.ct. the Ec\I'LronmemaJ Section, Aluk.a Th~pru-t.roent of Lnw before dting.
13
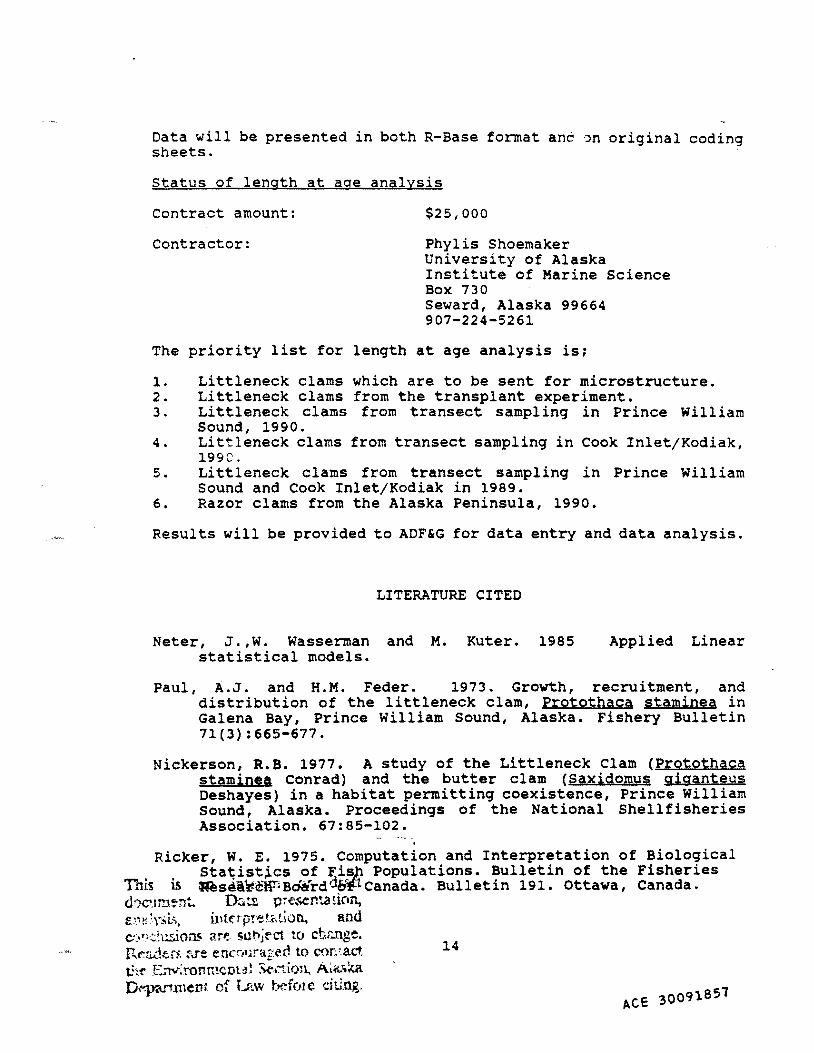
Data will be presented in both R-Base format anc ·:>n original coding sheets.
Status of length at age analysis
Contract amount: $25,000
Contractor: Phylis Shoemaker University of Alaska Institute of Marine Science Box 730 Seward, Alaska 99664 907-224-5261
The priority list for length at age analysis is;
1. Littleneck clams which are to be sent for microstructure. 2. Littleneck clams from the transplant experiment. 3. Littleneck clams from transect sampling in Prince William
sound, 1990. 4. Littleneck clams from transect sampling in Cook Inlet/Kodiak,
199C. 5. Littleneck clams from transect sampling in Prince William
sound and Cook Inlet/Kodiak in 1989. 6. Razor clams from the Alaska Peninsula, 1990.
Results will be provided to ADF&G for data entry and data analysis.
LITERATURE CITED
Neter, J.,w. Wasserman and M. Kuter. 1985 statistical models.
Applied Linear
Paul, A.J. and H.M. Feder. 1973. Growth, recruitment, and distribution of the littleneck clam, Protothaca staminea in Galena Bay, Prince William Sound, Alaska. Fishery Bulletin 71(3):665-677.
Nickerson, R.B. 1977. A study of the Littleneck Clam (Protothaca staminea conrad) and the butter clam (Saxidomus giganteus oeshayes) in a habitat permitting coexistence, Prince William sound, Alaska. Proceedings of the National Shellfisheries Association. 67:85-102.
Ricker, w. E. 1975. Computation and Interpretation of Biological Sta~ist~cs of F,is~ Populations. Bulletin of the Fisheries
TI1is is :Resei~¢""HDB0Nrd'J6tflcanada. Bulletin 191. Ottawa, canada. doc>.tme-n!. Ik.tt. pre.senUt!i(ln, e;_,~T.l.L~, itlt("rpr-:t<-.tion, and c::···.::.:~usiom arl! sohje-ct tO cb.t..nge. Rr.:.;.d.en ;-;Ie enc:-o11rageo to e0r~·.act c·1(' £;rv: ronmcoti!l s.e.-:1ion, Ala.'il.a. ~me1H of Lmv befo1 c dlln&.
14
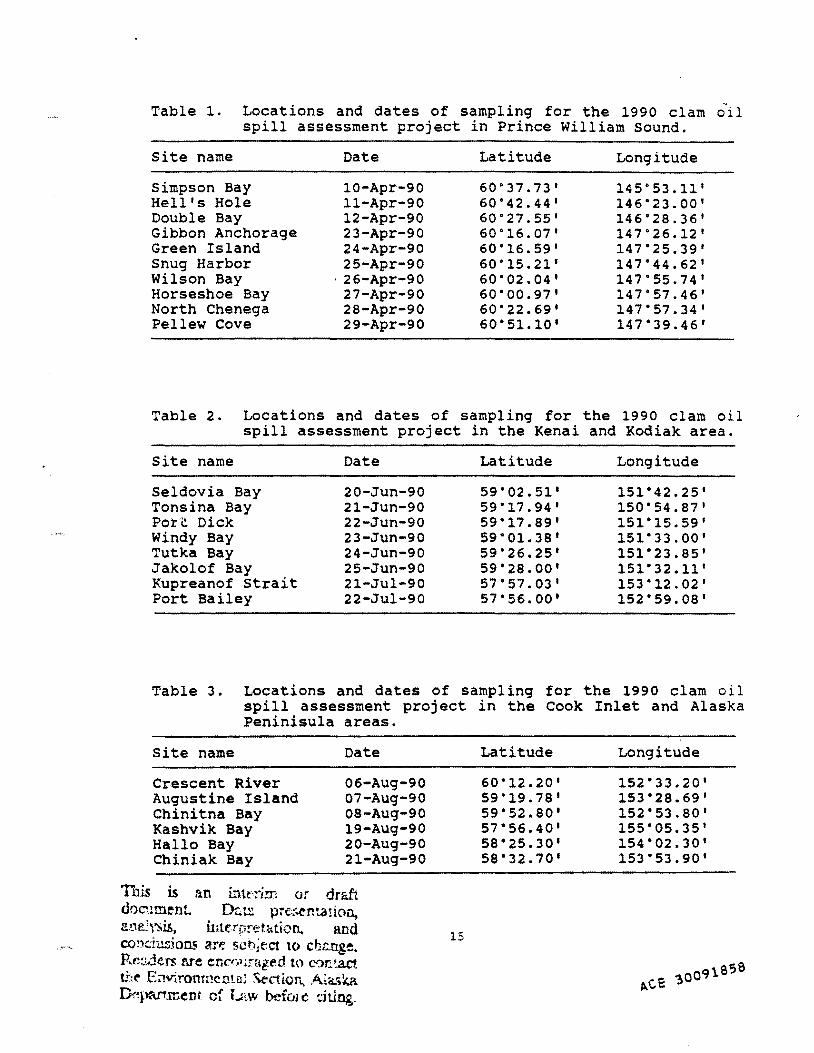
Table 1. Locations and dates of sampling for the 1990 clam ~)1 spill assessment project in Prince William sound.
Site name
Simpson Bay Hell's Hole Double Bay Gibbon Anchorage Green Island snug Harbor Wilson Bay Horseshoe Bay North Chenega Pellew Cove
Date
10-Apr-90 11-Apr-90 12-Apr-90 23-Apr-90 24-Apr-90 25-Apr-90
· 26-Apr-90 27-Apr-90 28-Apr-90 29-Apr-90
Latitude
60.37.73' 60"42.44 1
60"27.55' 60.16.07 1
60"16.59 1
60"15.21' 60"02.04 1
60'00.97' 60'22.69 1
60" 51.10'
Longitude
145"53.11' 146'23.00 1
146'28.36' 147"26.12 1
147'25.39' 147'44.62 1
147"55.74 1
147"57.46' 147"57.34 1
147"39.46'
Table 2. Locations and dates of sampling for the 1990 clam oil spill assessment project in the Kenai and Kodiak area.
Site name Date Latitude Longitude
Seldovia Bay 20-Jun-90 59"02.51 1 151°42.25' Tonsina Bay 21-Jun-90 59"17.94' 150"54.87 1
Potc Dick 22-Jun-90 59"17.89 1 151"15.59' Windy Bay 23-Jun-90 59"01.38 1 151"33.00 1
Tutka Bay 24-Jun-90 59"26.25 1 151"23.85' Jakolof Bay 25-Jun-90 59"28.00 1 151"32.11' Kupreanof strait 21-Jul-90 57"57.03 1 153"12.02 1
Port Bailey 22-Jul-90 57"56.00' 152"59.08'
Table 3. Locations and dates of sampling for the 1990 clam oil spill assessment project in the Cook Inlet and Alaska Peninisula areas.
Site name Date
Crescent River 06-Aug-90 Augustine Island 07-Aug-90 Chinitna Bay 08-Aug-90 Kashvik Bay 19-Aug-90 Hallo Bay 20-Aug-90 Chiniak Bay 21-Aug-90
This is an t\'l.lt'!.;!n or draft document rku: fH'e:.enta!iCln, 2.:!_"18.5Y~LS, i11tt:rpr~t.Mion. and co:.:•chlSions ~r~ scl"t;ect to cb:nge. Rc~e.rs are encollraged to c...'On~ ti::t E:~'llironmeme; S-tction., A~a.o;ka Th"!parr.roens. of L:~w befuJ c dti.og.
Latitude Longitude
60"12.20 1 152"33.20 1
59"19.78 1 153"28.69' 59"52.80' 152"53.80' 57"56.40 1 155"05.35 1
58"25.30 1 154"02.30 1
58"32.70 1 153"53.90 1
15
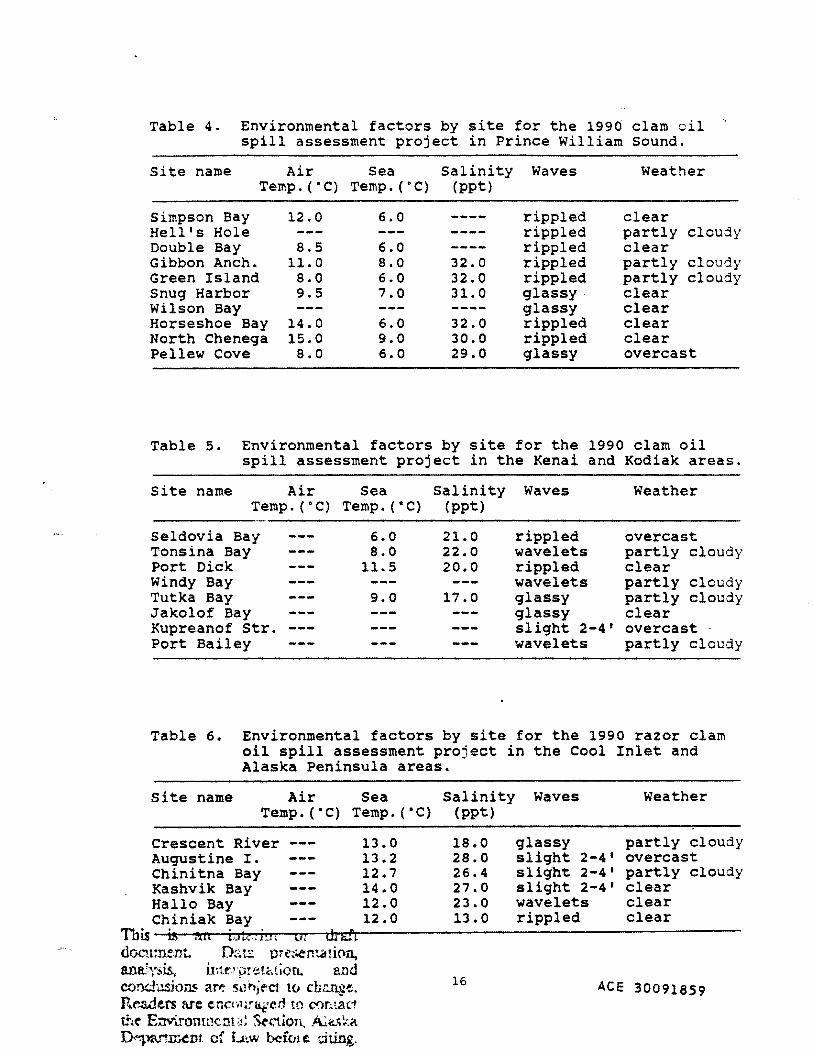
Table 4. Environmental factors by site for the 1990 clam oil spill assessment project in Prince William sound.
Site name Air sea Salinity Waves Weather Temp. ( • C) Temp. ("C) (ppt)
Simpson Bay 12.0 6.0 rippled clear Hell's Hole rippled partly cloudy Double Bay 8.5 6.0 rippled clear Gibbon Anch. 11.0 8.0 32.0 rippled partly cloudy Green Island 8.0 6.0 32.0 rippled partly cloudy Snug Harbor 9.5 7.0 31.0 glassy. clear Wilson Bay glassy clear Horseshoe Bay 14.0 6.0 32.0 rippled clear North Chenega 15.0 9.0 30.0 rippled clear Pellew cove 8.0 6.0 29.0 glassy overcast
Table 5. Environmental factors by site for the 1990 clam oil spill assessment project in the Kenai and Kodiak areas.
Site name Air Sea Temp. ("C) Temp.("C)
Seldovia Bay 6.0 Tonsina Bay 8.0 Port Dick 11.5 Windy Bay Tutka Bay 9.0 Jakolof Bay Kupreanof Str. Port Bailey
Salinity (ppt)
21.0 22.0 20.0
17.0
Waves Weather
rippled overcast wavelets partly cloudy rippled clear wavelets partly cloudy glassy partly cloudy glassy clear slight 2-4' overcast · wavelets partly cloudy
Table 6. Environmental factors by site for the 1990 razor clam oil spill assessment project in the Cool Inlet and Alaska Peninsula areas.
Site name Air Sea Temp.("C) Temp.("C)
crescent River 13.0 Augustine I. 13.2 Chinitna Bay 12.7 Kashvik Bay 14.0 Hallo Bay 12.0 Chiniak Bay 12.0
This is ;,n iak. i:Jo o: ch sir document. IX~!!: pre~;.en-:.a!inn, ana.;..,";i.is, h:tr.Tv!etC~tion. a."ld conclu.siom. ar~ s~~l"t;ect to ch.rmg~. Rt>..sders are enc(il;!"tif:eO to ror~tac:t the E::ri.ronm<:::n<l! Sec."t.ion, .4.la.~!:.a ~12\...""!.Ir.~IH of iJ'.W b<:fo1 e dt.ing.
Salinity (ppt)
18.0 28.0 26.4 27.0 23.0 13.0
16
waves
glassy slight 2-4 1
slight 2-4' slight 2-4' wavelets rippled
Weather
partly cloudy overcast partly cloudy clear clear clear
ACE 30091859
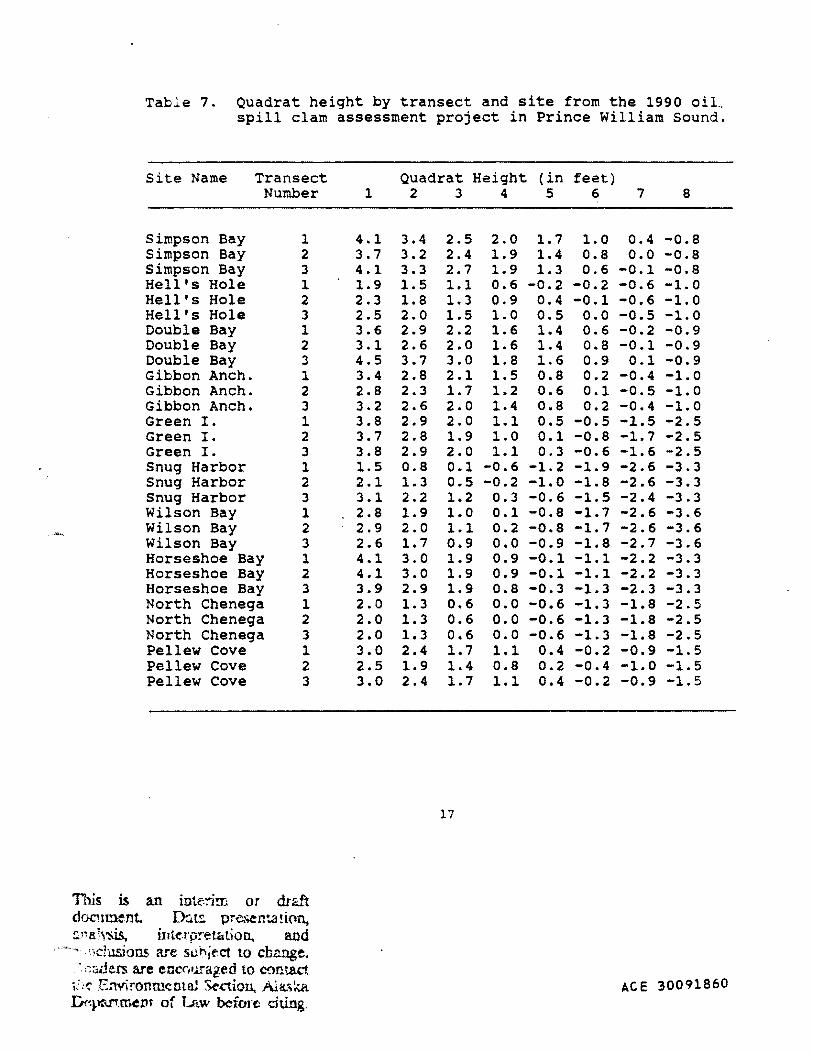
Table 7. Quadrat height by transect and site from the 1990 oil~ spill clam assessment project in Prince William Sound.
Site Name Transect Number
Simpson Bay 1 Simpson Bay 2 Simpson Bay 3 Hell's Hole 1 Hell's Hole 2 Hell's Hole 3 Double Bay 1 Double Bay 2 Double Bay 3 Gibbon Anch. 1 Gibbon Anch. 2 Gibbon Anch. 3 Green I. 1 Green I. 2 Green I. 3 Snug Harbor 1 Snug Harbor 2 Snug Harbor 3 Wilson Bay 1 Wilson Bay 2 Wilson Bay 3 Horseshoe Bay 1 Horseshoe Bay 2 Horseshoe Bay 3 North Chenega 1 North Chenega 2 North Chenega 3 Pellew Cove 1 Pellew Cove 2 Pellew cove 3
Tllis is an inte::i!.n or draft dGcument. Dr.t!: pre.:.;emati(l~ !:)'B.~VSlS, iute.ro!"etation, and
A ~ f~dus.lons are soi"tject to change. · :e:s.ders are eoc('ll.rraged to contact
t: :': E:w'ironmental Section. Al~.ska D<~J.Y.U"T.meot of T...r\w before d~.
1
4.1 3.7 4.1 1.9 2.3 2.5 3.6 3.1 4.5 3.4 2.8 3.2 3.8 3.7 3.8 1.5 2.1 3.1 2.8 2.9 2.6 4.1 4.1 3.9 2.0 2.0 2.0 3.0 2.5 3.0
Quadrat Height 2 3 4
3.4 2.5 2.0 3.2 2.4 1.9 3.3 2.7 1.9 1.5 1.1 0.6 1.8 1.3 0.9 2.0 1.5 1.0 2.9 2.2 1.6 2.6 2.0 1.6 3.7 3.0 1.8 2.8 2.1 1.5 2.3 1.7 1.2 2.6 2.0 1.4 2.9 2.0 1.1 2.8 1.9 1.0 2.9 2.0 1.1 0.8 0.1 -0.6 1.3 0.5 -0.2 2.2 1.2 0.3 1.9 1.0 0.1 2.0 1.1 0.2 1.7 0.9 o.o 3.0 1.9 0.9 3.0 1.9 0.9 2.9 1.9 0.8 1.3 0.6 0.0 1.3 0.6 o.o 1.3 0.6 o.o 2.4 1.7 1.1 1.9 1.4 0.8 2.4 1.7 1.1
17
(in feet) 5 6 7 8
1.7 1.0 0.4 -0.8 1.4 0.8 o.o -o.8 1.3 0.6 -0.1 -0.8
-0.2 -0.2 -0.6 -1.0 0.4 -0.1 -0.6 -1.0 0.5 o.o -0.5 -1.0 1.4 0.6 -0.2 -0.9 1.4 0.8 -0.1 -0.9 1.6 0.9 0.1 -0.9 0.8 0.2 -0.4 -1.0 0.6 0.1 -0.5 -1.0 0.8 0.2 -0.4 -1.0 0.5 -0.5 -1.5 -2.5 0.1 -0.8 -1.7 -2.5 0.3 -0.6 -1.6 -2.5
-1.2 -1.9 -2.6 -3.3 -1.0 -1.8 -2.6 -3.3 -0.6 -1.5 -2.4 -3.3 -0.8 -1.7 -2.6 -3.6 -0.8 -1.7 -2.6 -3.6 -0.9 -1.8 -2.7 -3.6 -0.1 -1.1 -2.2 -3.3 -0.1 -1.1 -2.2 -3.3 -0.3 -1.3 -2.3 -3.3 -0.6 -1.3 -1.8 -2.5 -0.6 -1.3 -1.8 -2.5 -0.6 -1.3 -1.8 -2.5
0.4 -0.2 -0.9 -1.5 0.2 -0.4 -1.0 -1.5 0.4 -0.2 -0.9 -1.5
ACE 30091860
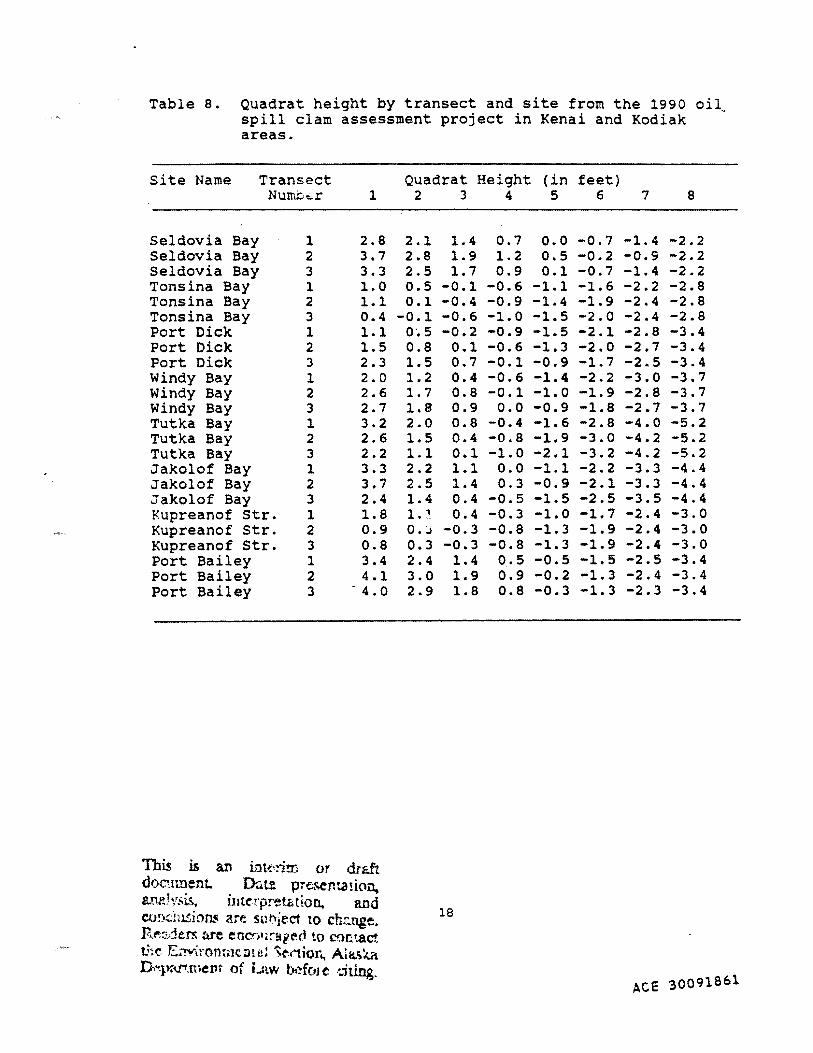
Table a. Quadrat height by transect and site from the 1990 oil .. spill clam assessment project in Kenai and Kodiak areas.
Site Name Transect Nurn..i::ier 1
Seldovia Bay 1 2.8 Seldovia Bay 2 3.7 Seldovia Bay 3 3.3 Tons ina Bay 1 1.0 Tons ina Bay 2 1.1 Tons ina Bay 3 0.4 Port Dick 1 1.1 Port Dick 2 1.5 Port Dick 3 2.3 Windy Bay 1 2.0 Windy Bay 2 2.6 Windy Bay 3 2.7 Tutka Bay 1 3.2 Tutka Bay 2 2.6 Tutka Bay 3 2.2 Jakolof Bay 1 3.3 Jakolof Bay 2 3.7 Jakolof Bay 3 2.4 Kupreanof str. 1 1.8 Kupreanof str. 2 0.9 Kupreanof Str. 3 0.8 Port Bailey 1 3.4 Port Bailey 2 4.1 Port Bailey 3 - 4. 0
This is an iot<d!ri or drAft doo.nnent. Thi.tt presen:.a!ion, a.n.aJv.-,is, intc:rpr<etc.tion, and cs.mdn.$ions are suhject 10 cb:nge. Re::.den: are eno-,,•.:-a~e,t to cm:tact ti1t'- :C;wironmtDtll! 'Se-.(·tior.., Aia\~ 0,"-pru"'.mel'lt of i..ltW f.;l!ofore dting.
Quadrat Height 2 3 4
2.1 1.4 0.7 2.8 1.9 1.2 2.5 1.7 0.9 0.5 -0.1 -0.6 0.1 -0.4 -0.9
-0.1 -0.6 -1.0 o·. 5 -0.2 -0.9 0.8 0.1 -0.6 1.5 0.7 -0.1 1.2 0.4 -0.6 1.7 o.a -0.1 1.8 0.9 o.o 2.0 o.a -0.4 1.5 0.4 -o.a 1.1 0.1 -1.0 2.2 1.1 0.0 2.5 1.4 0.3 1.4 0.4 -0.5 1.] 0.4 -0.3 O.J -0.3 -0.8 0.3 -0.3 -o.a 2.4 1.4 0.5 3.0 1.9 0.9 2.9 1.8 0.8
18
(in feet) 5 6 7 8
o.o -0.7 -1.4 -2.2 0.5 -0.2 -0.9 -2.2 0.1 -0.7 -1.4 -2.2
-1.1 -1.6 -2.2 -2.8 -1.4 -1.9 -2.4 -2.8 -1.5 -2.0 -2.4 -2.8 -1.5 -2.1 -2.8 -3.4 -1.3 -2.0 -2.7 -3.4 -0.9 -1.7 -2.5 -3.4 -1.4 -2.2 -3.0 -3.7 -1.0 -1.9 -2.8 -3.7 -0.9 -1.8 -2.7 -3.7 -1.6 -2.8 -4.0 -5.2 -1.9 -3.0 -4.2 -5.2 -2.1 -3.2 -4.2 -5.2 -1.1 -2.2 -3.3 -4.4 -0.9 -2.1 -3.3 -4.4 -1.5 -2.5 -3.5 -4.4 -1.0 -1.7 -2.4 -3.0 -1.3 -1.9 -2.4 -3.0 -1.3 -1.9 -2.4 -3.0 -o.5 -1.5 -2.5 -3.4 -0.2 -1.3 -2.4 -3.4 -0.3 -1.3 -2.3 -3.4
ACE 30091861
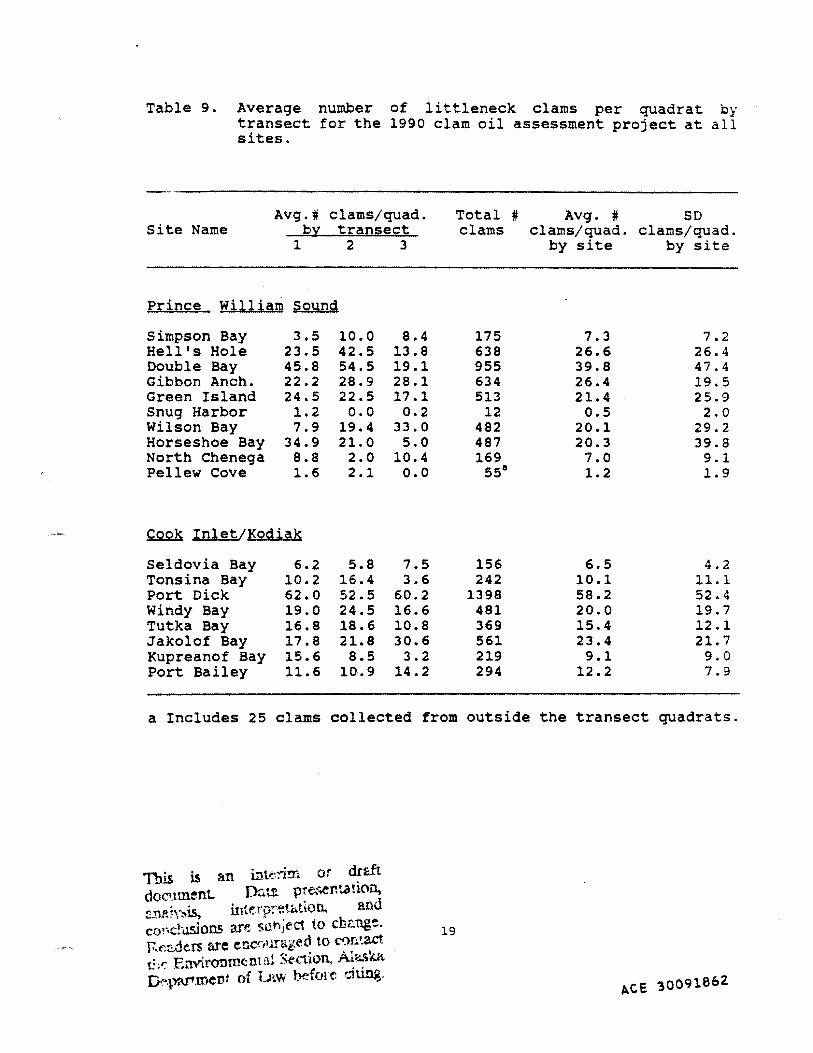
Table 9. Average number of littleneck clams per quadrat ~Y transect for the 1990 clam oil assessment project at all sites.
Site Name Avg.# clams/quad.
by transect 1 2 3
Prince William Sound
Simpson Bay 3.5 10.0 8.4 Hell's Hole 23.5 42.5 13.8 Double Bay 45.8 54.5 19.1 Gibbon Anch. 22.2 28.9 28.1 Green Island 24.5 22.5 17.1 snug Harbor 1.2 o.o 0.2 Wilson Bay 7.9 19.4 33.0 Horseshoe Bay 34.9 21.0 5.0 North Chenega 8.8 2.0 10.4 Pellew cove 1.6 2.1 o.o
Cook Inlet/Kodiak
Seldovia Bay 6.2 5.8 7.5 Tonsina Bay 10.2 16.4 3.6 Port Dick 62.0 52.5 60.2 Windy Bay 19.0 24.5 16.6 Tutka Bay 16.8 18.6 10.8 Jakolof Bay 17.8 21.8 30.6 Kupreanof Bay 15.6 8.5 3.2 Port Bailey 11.6 10.9 14.2
Total # Avg. # so clams clams/quad. clams/quad.
by site by site
175 7.3 7.2 638 26.6 26.4 955 39.8 47.4 634 26.4 19.5 513 21.4 25.9
12 0.5 2.0 482 20.1 29.2 487 20.3 39.8 169 7.0 9.1
551 1.2 1.9
156 6.5 4.2 242 10.1 11.1
1398 58.2 52.4 481 20.0 19.7 369 15.4 12.1 561 23.4 21.7 219 9.1 9.0 294 12.2 7.9
a Includes 25 clams collected from outside the transect quadrats.
19
ACE 30091862.
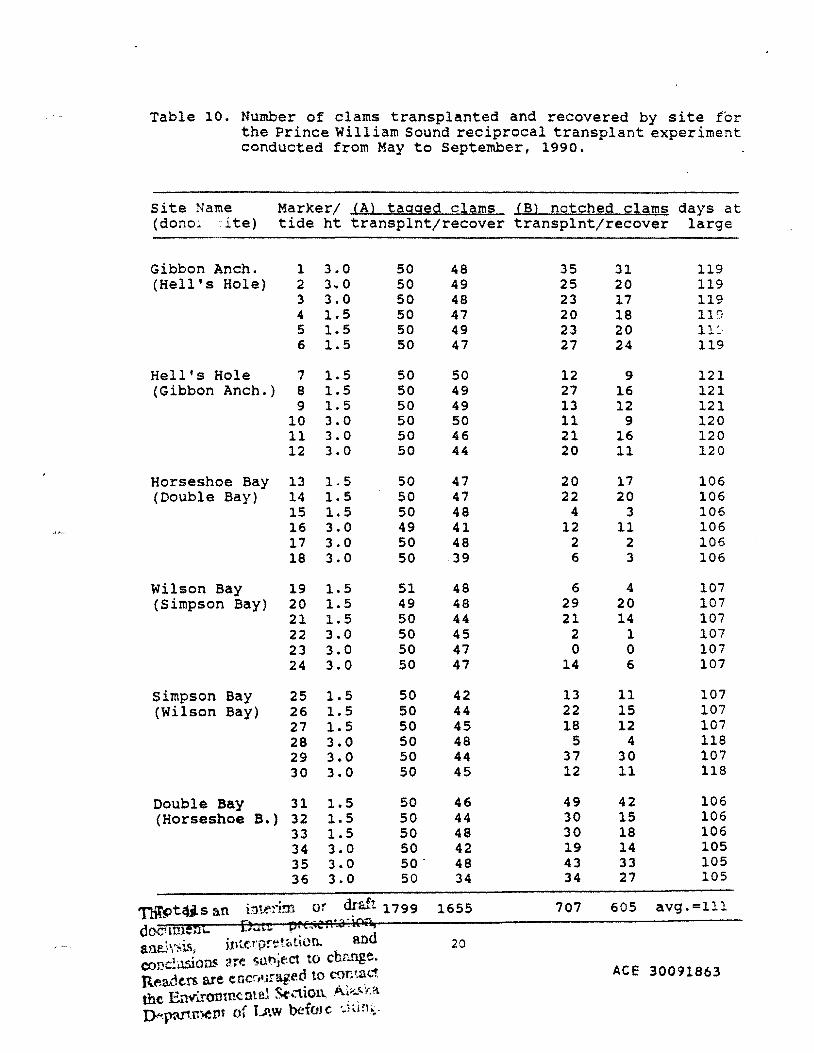
Table 10. Number of clams transplanted and recovered by site for the Prince William Sound reciprocal transplant experiment conducted from May to September, 1990.
Site Name (dono:.. lte)
Marker/ CAl tagged clams (B) notched clams days at tide ht transplnt;recover transplntjrecover large
Gibbon Anch. l 3.0 (Hell's Hole) 2 3.0
3 3.0 4 1.5 5 1.5 6 1.5
Hell's Hole 7 1.5 (Gibbon Anch.) 8 1.5
9 1.5 10 3.0 ll 3.0 12 3.0
Horseshoe Bay 13 1.5 (Double Bay) 14 1.5
15 l. 5 16 3.0 17 3.0 18 3.0
Wilson Bay 19 1.5 (Simpson Bay) 20 1.5
21 1.5 22 3.0 23 3.0 24 3.0
Simpson Bay 25 1.5 (Wilson Bay) 26 1.5
27 1.5 28 3.0 29 3.0 30 3.0
Double Bay 31 1.5 (Horseshoe B.) 32 1.5
33 1.5 34 3.0 35 3.0 36 3.0
50 50 50 50 50 50
50 50 50 50 50 50
50 50 50 49 50 50
51 49 50 50 50 50
50 50 50 50 50 50
50 50 50 50 so· 50
48 49 48 47 49 47
50 49 49 50 46 44
47 47 48 41 48 39
48 48 44 45 47 47
42 44 45 48 44 45
46 44 48 42 48 34
1655
20
35 25 23 20 23 27
12 27 13 ll 21 20
20 22
4 12
2 6
6 29 21
2 0
14
13 22 18
5 37 12
49 30 30 19 43 34
707
31 20 17 18 20 24
9 16 12
9 16 11
17 20
3 ll
2 3
4 20 14
1 0 6
11 15 12
4 30 11
42 15 18 14 33 27
119 119 119 11~ 11 ', 119
121 121 121 120 120 120
106 106 106 106 106 106
107 107 107 107 107 107
107 107 107 118 107 118
106 106 106 105 105 105
605 avg. =111
ACE 30091863
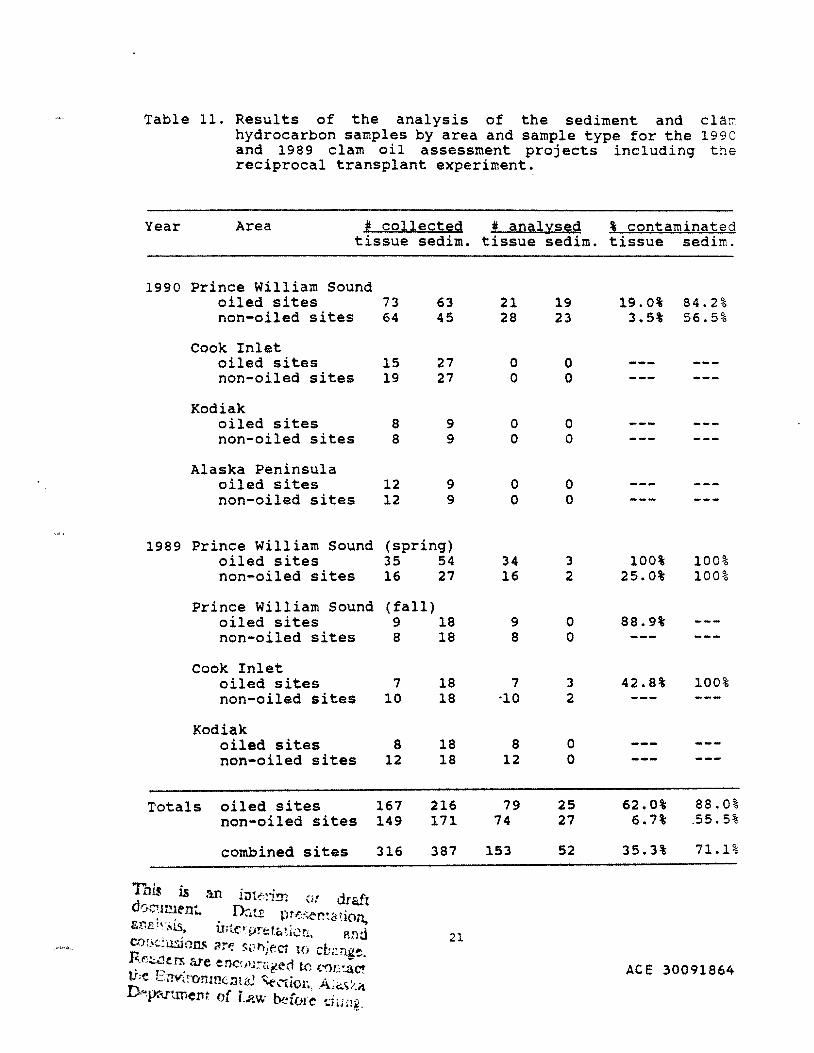
Table 11. Results of the analysis of the sediment and cla~ hydrocarbon samples by area and sample type for the 1990 and 1989 clam oil assessment projects including the reciprocal transplant experiment.
Year Area # ~ollectig # anal::ised l contaminated tissue sedim. tissue sedim. tissue sedim.
1990 Prince William Sound oiled sites 73 63 21 19 19.0% 84.2% non-oiled sites 64 45 28 23 3.5% 56.5%
Cook Inlet oiled sites 15 27 0 0 non-oiled sites 19 27 0 0
Kodiak oiled sites 8 9 0 0 non-oiled sites 8 9 0 0
Alaska Peninsula oiled sites 12 9 0 0 non-oiled sites 12 9 0 0
1989 Prince William Sound (spring) oiled sites 35 54 34 3 100% 100% non-oiled sites 16 27 16 2 25.0% 100%
Prince William Sound (fall) oiled sites 9 18 9 0 88.9% non-oiled sites 8 18 8 0
cook Inlet oiled sites 7 18 7 3 42.8% 100% non-oiled sites 10 18 ·10 2
Kodiak oiled sites 8 18 8 0 non-oiled sites 12 18 12 0
Totals oiled sites 167 216 79 25 62.0% 88.0% non-oiled sites 149 171 74 27 6.7% .55. 5%
combined sites 316 387 153 52 35.3% 71.1%
Thu is an i:utt:~i!n (if draft d~J.C!.Hnen!. D:.u; p~r-··en·a·ion, • # ' .... ~ .. • '·
S1"~~ ''' 15 • ' - . . ... • u•.' • iJ"'"" t. , ; .,r d • I '- • · ../J- Q',.l~ 1. fln# 21 C..?!<;'USJnn.c; ~,. r •• h. - : " • '= ·'': 1ect to cb:m2e.
R~:.,:!en are '*Ol"' , ........ e~ t -• ~ '. -· ~·}...._ ujt. '·' 0 ('OL~C! ACE 30091864 tr·.. 1.. :tv ,...0,., l " • ' ..... '-··· · •· •• m(;nt&~ -.e..:-t101;.. A;c:.c;.l.~t
D~}X'.r...mem of l.~w before d LHI~.
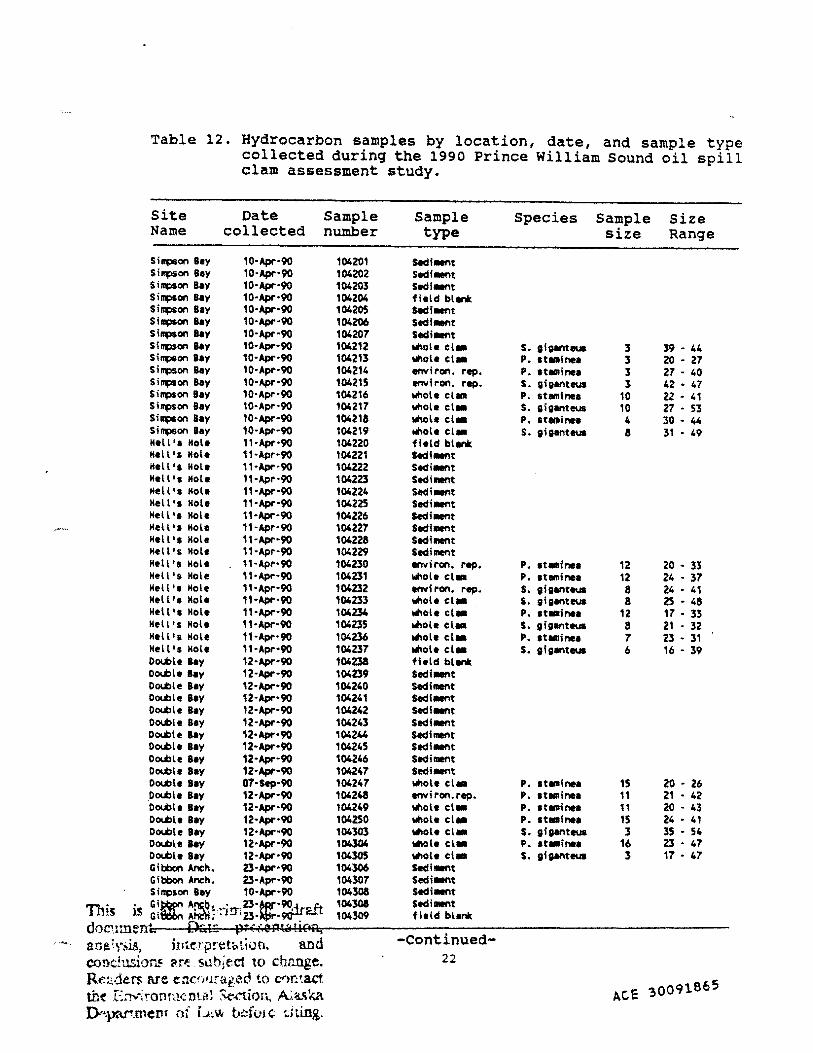
Table 12. Hydrocarbon samples by location, date, and sample type collected during the 1990 Prince William Sound oil spill clam assessment study.
Site Name
Date collected
sample number
Siq)Son Bay 10·Apl"·90 Siq)Son Bey 10·Apl"·90 Siq:lSon Bay 10·Apl"·90 Siq)Son Bay 10·Apl"·90 Simpson Bay 10·Apl"·90 Simpson Sly 10·Apl"·90 Siq:lSon Sly 10·Apl"·90 Simpson B1y 10·Apl"·90 Sii!1)Son Bay 10·Apl"•90 Siq)Son Bay 10·Apl"·90 Simpson Bey 10·Apr·90 Siq:lSon B1y 10·Apr·90 Simpson Bay 10·Apr·90 Siq:lSon B1y 10·Apl"·90 Simpson Bay 10·Apr·90 Hall's Hole 11·Apl"·90 Hell's Hole 11·Apr·90 Hell's Hole 11·Apl"·90 Hell's Hole 11·Apr·90 Hell's Hole 11·Apl"·90 Hell's Hole 11·Apl"·90 Hell's Hole 11·Apl"·90 Hell's Hole 11·Apr·90 Hall's Hole 11·Apl"•90 Hell's Hole 11·Apr·90 Hell's Hole 11·Apr·90 Hell's Hole 11·Apr·90 Hell's Hole 11·Apr·90 Hell•• Kola 11·Apl"·90 Hell's Hole 11·Apl"·90 Hell's Kola 11·Apr·90 Hell's Hole 11·Apr·90 Hell's Kola 11·Apr·90 OOI.i:>le B1y 12·Apl"·90 OOible Sly 12·Apl"·90 Double Bey 12·Apl"·90 OOible BIY 12·Apl"·90 DOible B1y 12·Apl"·90 Double Bay 12·Apl"·90 DOible Bay 12·Apl"·90 DOible Bay 12·Apl"·90 DOible Bay 12·Apl"·90 DOible Bay 12·Apr·90 DOible Bay 07·Sep·90 DOible Bay 12·Apl"·90 'oOible lay 12·Apl"·90 DOible Bay 12·Apl"·90 DOible Bay 12·Apl"·90 DOible Bay 12·Apl"·90 DOible Bay 12·Apl"·90 GIbbon Anc:h. 23 • Apl"•90 Gibbon Anc:h. 23·Apr·90 Simpson Bey 10·Apl"·90
This is ~:~ ~®~~·i!Dg:Wr:~w docm.nent. Oc.ta pro:,;tf'll.,'li ttt:tn; a.na:y:.;,is, htterpretC:~Livn. and conc!u.sioru: ar( suhiect to ch:mge. Re~ .. je.rs are encnt.:rat:ed to contact the E;'!'ll":ront~l<:nte! M-... '"tion, Ata.-;ka tr.va,r..tnern of i...~~w befo1 c. d ting.
104201 104202 104203 104204 104205 104206 104207 104212 104213 104214 104215 104216 104217 10421a 104219 104220 104221 104222 104223 104224 104225 104226 104227 10422a 104229 104230 104231 104232 104233 104234 104235 104236 104237 104238 104239 104240 104241 104242 104243 104244 104245 104246 104247 104247 104248 104249 104250 104303 104304 104305 104306 104307 104308 104308 104309
Sample type
SecliMnt Sed i llel'lt SediMnt field blri Secllllllt'lt Sedlt~~nt SediMnt whole cl• whole cl• environ. rep. envl ron. rep. whole c11111 whole cl• whole cl• whole cia~~~ field blri Sedlt~~nt SediMnt Sedi~~ent Sedit~~nt Sed!Mnt SecliMnt Sedlllllt'lt Sedi~~ent Sed! ~~~~tnt environ. rep. whole cl• envf ron. rep. whole cl• whole cl• whole cl1111 whole cl• whole cl• field blri Sedi..nt Sedillllnt SediMnt SedfMnt SediMnt Sed! llllnt Sedl..nt Sedi 1111nt SediMnt whole cl• environ. rep. whole cl• whole cl• whole c11111 whole cl• whole cl1111 Seclllllll"'t Sed!Mnt SediMnt Sediment field blank
-continued-22
Species
s. ;l~~rttP. st•inet P. stllllinea s. ;!;ant-.. P. stamlnee s. ;i;anteus P. st•inea s. ;i;anteus
P. st1111inea P. staminea s. ;i;ant-.. s. ;i;anteua P. stllllinea s. ;!;ant-.. P. st1111! nee s. ;I ;ant-..
P. stamine• P. 1t1111ine1 P • 1 t IIIII ne1 P. st1111lnea s. ;i;anteua P. st•inea s. gi ;anteus
Sample size
Size Range
3 39 • 44 3 20 • 27 3 27 • 40 3 42 • 47
10 22 • 41 10 27 • 53 4 30 • 44 a 31 - 49
12 20 • 33 12 24 • 37 8 24 • 41 a 25 - 48
12 17 • 33 8 21 • 32 7 23 • 31 6 16 • 39
15 20 • 26 11 21 • 42 11 20 • 43 15 24 • 41 3 35 • 54
16 23 • 47 3 17 • 47
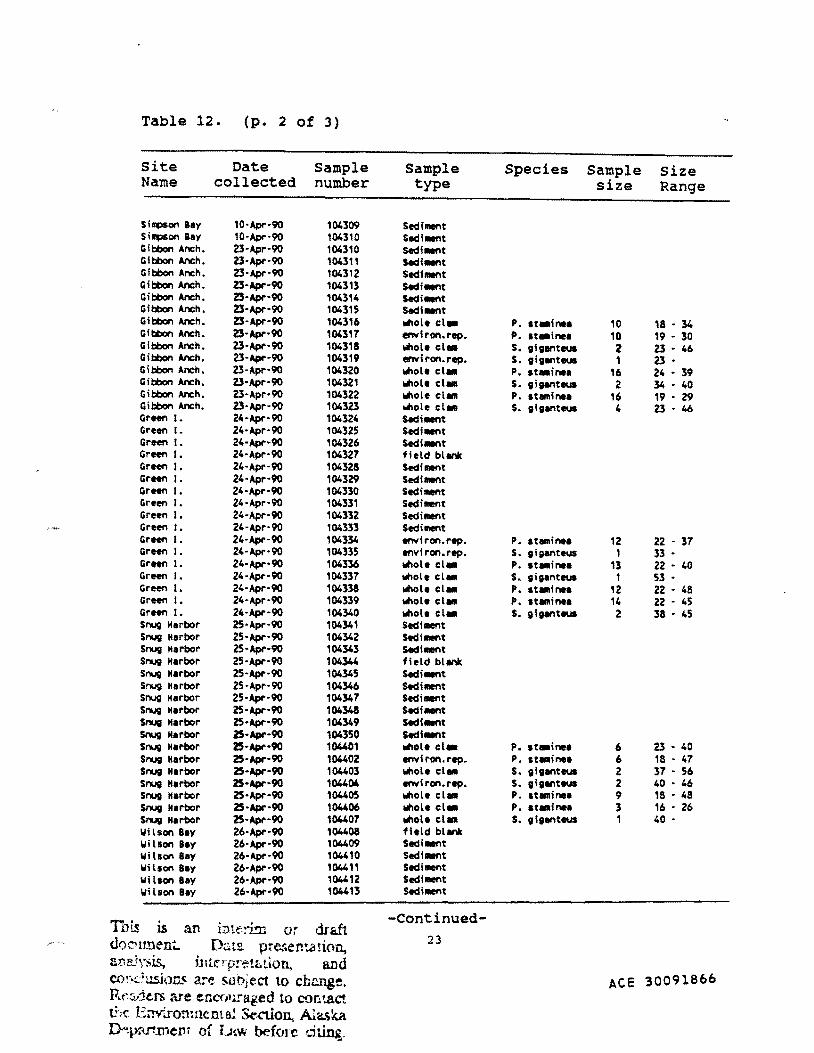
Table 12. (p. 2 of l)
Site Date Sample Sample Species Sample Size Name collected number type size Range
Siq::w~~on Bay 10·Apr·90 104309 Sedf~t Siq15on Bay 10·Apr·90 104310 Sedi.nt Gibbon Anch. 23·Apr·90 104310 Sedi.nt Gibbon Anch. 23·Apr·90 104311 Sedf.nt Gibbon Anch. 23·Apr·90 104312 Sedi~~~ent Gibbon Anch. 23. Apr·90 104313 S«ti-.nt Gibbon Anch. Z!·Apr·90 104314 Sedl-.nt GIbbon Anch. 23·Apr·90 104315 Secli.nt Gibbon Anch. 2!-Apr-90 104316 lolhole cl• P. at•inea 10 18 • 34 GIbbon Anch. 23·Apr·90 104317 envl ron. rep. P. at•inea 10 19 • 30 Gibbon Anch. 23·Apr·90 104318 lolhole cl• s. gi;~t~teus z 23 • 46 Gibbon Anch. 23. Apr ·90 104319 environ. rep. S. giglll'lteus 1 23· GIbbon Anch. 23·Apr·90 104320 lolhole cl• P. suminea 16 24 • 39 Gibbon Anch. 23·Apr·90 104321 lolhola cl• s. gi;anteus 2 34 • 40 Gibbon Anch. 23·Apr·90 104322 lllhole clam P. staminea 16 19 • 29 Gibbon Anch, 23·Apr·90 104323 lolhole cl• s. gl;anteus 4 23·46 Green I. 24·Apr·90 104324 Sedl-.nt Green 1. 24·Apr·90 104325 Sedi-.nt Green 1. 24·Apr·90 104326 Sedi-.nt Green 1. 24·Apr·90 104327 field blank Green 1. 24·Apr·90 104328 Sedi~~~ent Green 1. 24•Apr·90 104329 Sedi~~~ent Green I. 24·Apr·90 104330 Sedi111ent Green I. 24·Apr·90 104331 Sediment Green I. 24·Apr·90 104332 Sedilllent Green 1. 24·Apr·90 104333 Sedi~t Green 1. 24·Apr·90 104334 environ. rep. P. 1 tam! nee 12 22 • 37 Green I. 24·Apr·90 104335 environ. rep. s. gi ;anteus 1 33 • Green 1. 24·Apr·90 104336 lolhola cl• P. st•lnea 13 22 • 40 Green I. 24·Apr·90 104337 whole cl11111 S. ;i;anteus 1 53 • Green 1. 24·Apr·90 104338 whole cl• P. stami nee 12 22 • 48 Green I. 24·Apr·90 104339 lolhole clam P. staminea 14 22 • 45 Green I. 24·Apr·90 104340 lolhole cl• s. gi;enteus 2 38 • 45 S~ Harbor 25·Apr·90 104341 Sedflllll"'t S~ Harbor 25·Apr·90 104342 Sedi~t S~ Harbor 25·Apr·90 104343 S«<illlll"'t s~ Harbor 25·Apr·90 104344 field blank S~ Harbor 25·Apr·90 104345 Sedi-.nt S~ Harbor 25·Apr·90 104346 Sedilllll"'t S~ Harbor 25·Apr·90 104347 Sedilllll"'t ~Harbor 25·Apr·90 104348 Sedf-.nt ~Harbor 25·Apr·90 104349 S«ti-.nt ~Harbor 25· Apl"·90 104350 S«tl-.nt S~ Harbor 25. Apr ·90 104401 lolhola cl• P. st•inea 6 23 • 40 s~ Harbor 2S. Apr· 90 104402 environ. rep. P. st•inea 6 18 • 47 S~ Harbor 25. Apr ·90 104403 whole cl• s. ;igenteus 2 37 • 56 S~ Harbor 25. Ap1"·90 104404 tiiWi ron. rep. s. ;i;lll'ltfiUI 2 40 • 46 S~ Harbor 25·Apr·90 104405 lolhola cl• P. at ami nea 9 18 • 48 $~ Harbor 2S. Apr ·90 104406 lolhola cl• P. at•inea 3 16 • 26 S~ Harbor 25·Apr·90 104407 lolhole cl• s. gfglll'lte\IS 1 40 • Wilson Bay 26·Apr·90 104408 field blank Wilson Bay 26·Apr·90 104409 Sedi.nt Wilson Bay 26·Apr·90 104410 Sedfa.nt Wilson Bay 26·Apr·90 104411 Sedl~t
Wf laon Bey 26·Apr·90 104412 Sedi~t Wilson Bey 26·Apr·90 104413 Sedilllent
This is ivtlf:~-i!D draft -continued-an or
doc-ument.. D~t2- presen-:.a !ion, 23
S..J:'!e.h·;o;is, ilt'r:r--y· .. t·· '~on. and l, P· •. "'~' con~!us.io~ are ~object to change. ACE 30091866 Rt~:::/krs are encoura~ed to C!llltact t.i-:{ Env'.ronmema.! Section. Ala\ka ~J.m.rtmevr of iJtw be.forc dting.
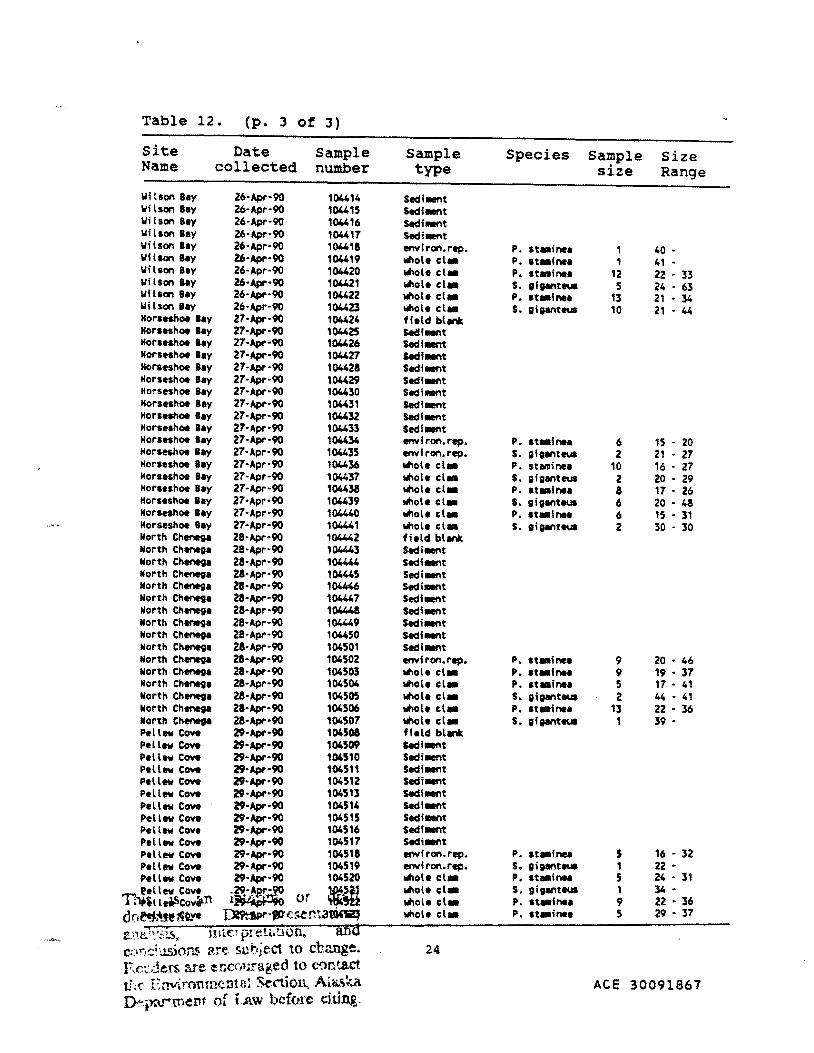
Table 12. (p. 3 of 3)
Site Name
Date collected
Sample number
Witson Bay 26·Apr·90 104414 Wilson Bay 26·Apr·90 104415 Witson Bay 26-Apr-90 104416 WIlson Bay 26·Apr·90 104417 Witson Bay 26·Apr·90 104418 Wilson Bay 26·Apr·90 104419 Wilson Bay 26·Apr·90 104420 WIlson Bay 26·Apr·90 104421 WIlson Bay 26·Apr·90 104422 Wilson Bay 26·Apr·90 104423 Horseshoe Bay 27·Apr·90 104424 Horseshoe Bay 27·Apr·90 104425 Horseshoe lay 27·Apr·90 104426 Horseshoe Bay 27·Apr·90 104427 Horseshoe Bay 27·Apr·90 104428 Horseshoe Bay 27·Apr·90 104429 Horseshoe Bay 27·Apr·90 104430 Horseshoe Bay 27·Apr·90 104431 Horaelhoe Bay 27·Apr-90 104432 Horseshoe Bay 27·Apr·90 104433 Horseshoe lay 27·Apr·90 104434 Horseshoe Bay 27·Apr·90 104435 Horseshoe Bay 27-Apr-90 104436 Horseshoe Bay 27·Apr·90 104437 Horseshoe Bay 27·Apr·90 104438 Horseshoe Bay 27·Apr·90 104439 Horseshoe Bay 27·Apr·90 104440 Horseshoe Bay 27·Apr·90 104441 North Chenega 28·Apr·90 104442 North Chenega 28·Apr·90 104443 North Chenega 28·Apr·90 104444 North Chenega 28·Apr·90 104445 North Chenega 28·Apr·90 104446 North Chenega 28·Apr·90 104447 North Chenega 28·Apr·90 104448 North Chenega 28·Apr·90 104449 North Chenega 28·Apr·90 104450 North Chenega 28·Apr·90 104501 North Chenega 28·Apr·90 104502 North Chenega 28·Apr·90 104503 North Chenega 28·Apr·90 104504 North Chenega 28·Apr·90 104505 North Chenega 28·Apr·90 104506 North Chenega 28·Apr·90 104507 Pel lew Cove 29·Apr·90 104508 Pellew Cove 29·Apr·90 104509 Pel lew Cove 29·Apr·90 104510 Pellew Cove 29·Apr·90 104511 Pellett Cove 29·Apr·90 104512 Pellett Cove 29·Apr·90 104513 Pellew Cove 29·Apr·90 104514 Pellett Cove 29·Apr·90 104515 Pellew Cove 29·Apr·90 104516 Pellett Cove 29-Apr·90 104517 Pellett cove 29·Apr·90 104518 Pellew Cove 29·Apr·90 104519 Pel lew Cove 29·Apr·90 104520 l?ellev Cove .29·A~:~r·90 Ul,!t'~
TI~illflrSCovtt-n l~ or ~~i doMmlf~ Dt9::!Pr·f.O'e~:n~tQOili:J lt:Jd•::is. l!la:.! preu.non. and c;)nd':J.Sioru. are. sut•ject to change. f,.c::ders are enco1.rraged to rontact ti:<' E~wironmente! Sccticu, A~~\a rr .• Y.\f"xntllf of Law before cJung.
Sample type
SediMnt Sldi-.nt Sedi_,t SecliMnt envl ron. rep. whole cl• whole cl• whole cl• whole cl• whole cl• field blri WfMnt SediMnt SediMnt Sldi-.nt Sldf-.nt Sedl_,t SedfMnt SediMnt SediMnt envl ron. rep. envf ron. rep. whole cl• whole cl• whole cl• whole cl• whole cl• whole cl• field blri Sedi_,..t Sedi_...t SediMnt Sedi_,..t Sedf_,..t Sedi_,t Sedi_,t SediMnt Sedi_,t environ. rep. whole cl• whole cl• whole cl• whole cl• whole cl• field blri Sedl_,t Sedi-.nt Sedf_,t Sedi_,t Secll_,t Sedi_,t Sedi_,..t Sedl.,..t Secli_,t erwf ron. rep. envi ron. rep. whole cl• whole cl• whole cl• whole cl•
24
Species
P. st•inea P. at•lnea P. st1111inea s. gi;anteua P. st•lnea S. lli;anteua
P. st•tr.a s. ;l;anteua P. staminea s. gl;anteua P. ltll'lliMa s. ;lganteua P. st•iMI s. lli;anteua
P. st1111inea P. st•IMI P. st•lnea s. 11i;anteus P. st•lr.a s. ;f;anteua
P. st•lnea s. lli;anteua P. st•ir.a s. ;i;ante~a P. st•lr.a P. st•ir.a
Sample size
Size Range
1 40 -1 41 •
12 22 • 33 5 24 • 63
13 21 • 34 10 21 • 44
6 15 - 20 2 21 • 27
10 16 • 27 2 20 • 29 8 17 • 26 6 20 • 48 6 15 - 31 2 30 • 30
9 20 • 46 9 19 • 37 5 17 • 41 2 44 • 41
13 22 • 36 1 39 •
5 16 • 32 1 22 • 5 24 • 31 1 34 • 9 22 • 36 5 29 • 37
ACE 30091867
.. Table 13. Hydrocarbon samples collected for the reciprocal
transplant experiment of the oil spill clam assessment study in Prince William Sound.
Site Date Sample Sample Species Sample size Name collected nUJI\l:)er type size Range
Gibbon Anch. 09·May·90 104601 whole cl• P. stMinea 20 17 • 29 Gibbon Anch. 09·May·90 1b46o2 whole cl1111 P. st1111fnea 20 20 • 35 Gibbon Anch. 09·May·90 104603 whole cl• P. st•inea 20 20 • 34 Gibbon Anch. 09·May·90 104604 whole cl1111 P. stMinea 20 19 • 33 GIbbon Anch. 09·May·90 104605 whole Clllll P. st1111inea 20 21 • 33 Gibbon Anch, 09·May·90 104606 whole cl• P. Stllllfnea 15 16 • 34 Helt•s Hole 10·May·90 104607 whole cl• P. st•lnea 18 20 • 37 Hell's Hole 10·May·90 104608 whole cl• P. st•inea 18 22 • 37 Hell's Hole 10·May·90 104609 whole cl• P. st•fnea 14 20 • 34 Hell's Hole 10·Mey·90 104610 whole elM P. 1t1111inea 19 19 • 37 Hell's Mole 10·May·90 104611 whole clam P. staminea 20 19 • 36 Hell's Hole 10·May•90 104612 whole cl• P. st•inea 19 24 • 33 Horseshoe Bay 22·May·90 104613 whole clam P. st•fnea 19 14 • 34 Wilson Bay 22·May·90 104614 whole cl• P. st•lnea 18 12 • 26 Wilson Bay 22·May·90 104615 whole cl• P. st•inea 20 10 - 27 Wilson Bay 22·May·90 104616 whole ct• P. st•inea 39 11 • 28 Wilson Bay 22·May·90 104617 whole cl• P. st•fnea 7 17 • 29 Wilson Bay 22·May·90 104618 whole cl• P. st•lnea 18 12 • 28 Wilson Bay 22·May·90 104619 whole cl• P. st•inea 15 19 • 32 Si~on Bay 23·May·90 104620 whole cl• P. st•lnea 16 13 • 37 Si~on Bay 23·May·90 104621 whole cl• P. staminea 23 15 • 27 Si~on Bay 23·May·90 104622 whole cl• P. st1111inea 20 17 • 43 Si~on Bay 23·May·90 104623 whole cl1111 P. stMinea 28 17 • 38 Simpson Bay 23·May·90 104624 whole cl1111 P. st1111inea 23 12 • 30 Si~on Bay 23·May·90 104625 whole cl1111 P. st1111inea 23 20 • 32 Double Bay 24·May·90 104626 whole clam P. staminea 40 14 • 42 DOI.i:>le Bay 24·May·90 104627 whole ct• P. st1111i nea 21 21 • 40 DOI.i:>le Bay 24·May•90 104628 whole c 11111 P. st1111inea 19 16 • 34 Double Bay 24·May·90 104629 whole cl• P. Stllllinea 16 15 • 37 DOI.i:>le Bay 24-May-90 104630 whole cl1111 P. Stllllinea 20 20 • 42 DOI.i:>le Bay 24·May·90 104631 whole cl1111 P. st1111lnea 20 21 • 43 Gibbon Anch. 05·Sep·90 105201 whole clam P. st1111inea 20 18 • 43 Gibbon Anch. 05·Sep·90 105202 whole c Lilli P. st1111inea 20 21 • 38 GIbbon Anch • 05·Sep•90 105203 whole cl1111 P. st•inea 20 25 • 38 Gibbon Anch. 05·Sep·90 105204 whole cl1111 P. st1111inea 10 24 • 43 GIbbon Anch, 05·Sep·90 105205 whole cl• P. st1111inea 16 24 • 40 Gibbon Anch. 05·Sep·90 105206 whole cl1111 P. st•lnea 17 24 • 39 Gibbon Anch. 05·Sep-90 105207 field blank GIbbon Anch. 05-sep-90 105208 Sedl..nt Gibbon Anch. 05·Sep-90 105209 Sedllllll'lt Gibbon Anch. OS•Sep-90 105210 Sedi1111nt Horseshoe Bay 05·Sep-90 105211 field blri Horseshoe Bly 05·Sep-90 105212 Sed I ~~tnt Horseshoe Bay 05·Sep·90 105213 Sed I ~~~tnt Horseshoe Bay 05•Sep•90 105214 Sedillllflt Horseshoe Bay 05·Sep·90 105215 whole cl1111 P. st1111inea 9 37 42 Horseshoe Bay 05·Sep-90 105216 whole cl• P. Stllllinea 10 25 • 43 Horseshoe lay 05·Sep·90 105217 whole cl• P. 1t1111inea 9 32 • 43 Horseshoe Bay 05·Sep·90 105218 whole cl• P. st1111inea 5 35 • 38
T: )lorsuhoe Bay ~-$~90 - whole cl1111 P. st1111fnea 5 29 • 43 J iiiOrs~oe 'iY i4 1!:$~90 or whole Clllll P. st1111inea 5 36 • 39
d·-;~\~~y DMDIIP~:~:;er.~ ~~, Sedi.nt l iutr:roret<.tton. and :~: .... ,.~ ~ ~f' :.lS,
-continued--·. ·. ~ ~~.lSioru arte su hject tO ch,'lllg~. :-. , .. :Jet'!. are encnt1rageo to ror.:.tat't 25
:;~ .~· E.:t-vf.ronm<:nta! Se-ction, Ata.~\.r:.a f;,y.pt'lr.~IIi of i...P.W b~:fm C ddog.
ACE 30091868
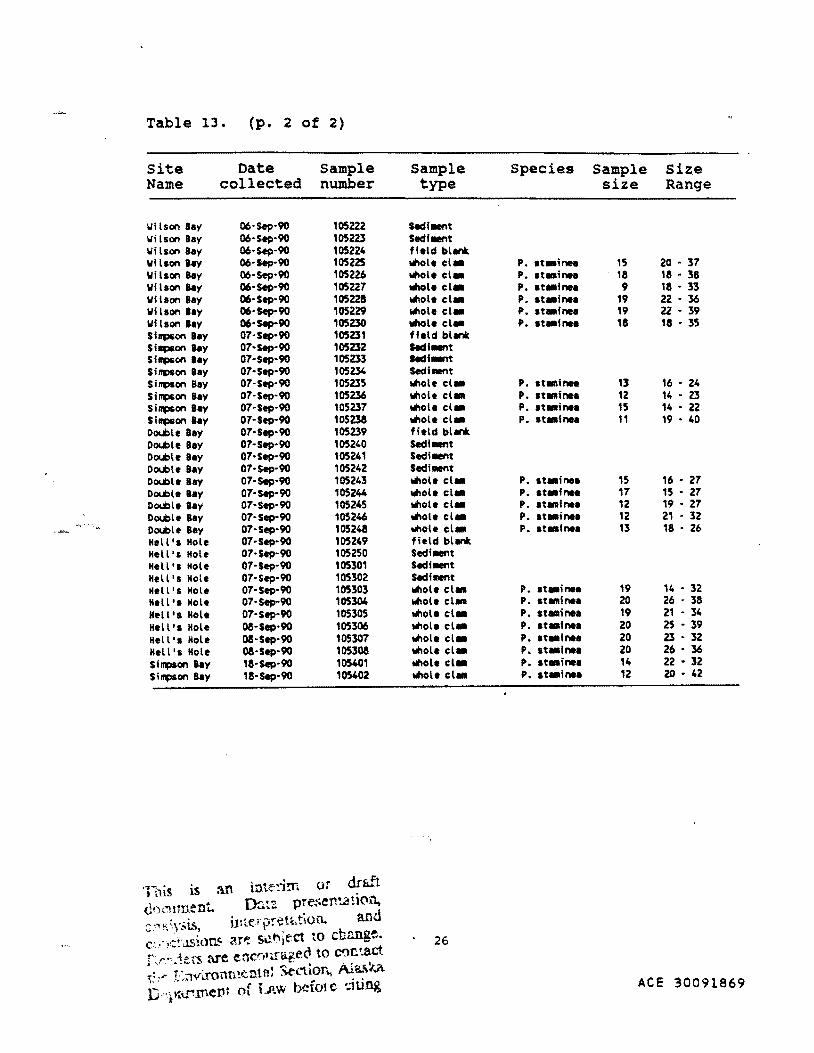
Table 13. (p. 2 of 2)
Site Date Sample Sample Species Sample Siz.e Name collected number type size Range
Wilson Bay 06·Sep·90 105222 Sedillent Wilson Bay 06·Sep·90 105223 Sedillent Wilson Bay 06-Sep-90 105224 field blri WIlson ley 06-Sep-90 105225 whole cl• P. 1t1111inea 15 20 • 37 Wilson Bey 06·Sep·90 105226 whole cl• P. st•inea 18 18 • 38 Wilson S.y 06·Sep·90 105227 whole cl• P. 1t111fnea 9 18 • 33 Wilson Bay 06·Sep·90 105228 whole cl111 P. st111inee 19 22 • 36 Wilson lay 06-Sep-90 105229 whole cl• P. 1t111fnee 19 22 • 39 Wftson ley 06·hp-90 105230 whole cl• P. ttlllfnea 18 18 • 35 Sl..-on Bey 07·Sap•90 105231 ffeld blri Si•on lay 07·Sep·90 105232 leclf~t
Sl..-on Bey 07·Sep·90 105233 leclf~t
Sl..-on Bey 07·Sep·90 105234 SediMnt si.._,.on Bey 07·Sep·90 105235 whole cl• P. st•lnee 13 16 • 24 Si"""on Bey 07·Sep·90 105236 whole cl• P. stMinea 12 14 • 23 st..-on Bay 07·Sep·90 105237 whole cl• P. 1t111inea 15 14 • 22 Sl..-on Bey 07·Sep·90 105238 whole cl• P. st•lnea 11 19 • 40 Double Bay 07·Sap·90 105239 field blri Double Bey 07·Sep·90 105240 Sed lllll'lt Double Bey 07·Sep·90 105241 Secllllent Double Bey 07·Sep·90 105242 Secli1111nt Double Bay 07·Sep·90 105243 whole cl• P. st•inea 15 16 • 27 Double Bay 07·Sep·90 105244 whole cl• P. at•fnea 17 15 • 27 Double Bay 07·Sep·90 105245 whole cl• P. st•inea 12 19 • 27 Double Bey 07·Sep-90 105246 whole cl• P. st111inea 12 21 • 32
~,
Double Bey 07·Sep·90 105248 whole cl• P. st111fnea 13 18 • 26 Hell •s Hole 07·Sep•90 105249 field blll'tk Hell's Hole 07·Sep·90 105250 Secli llll'lt Hell • 1 Hole 07·Sep·90 105301 Seclillll'lt Hell's Hole 07·Sep·90 105302 Sediment Hell's Hole 07·Sep·90 105303 whole cl111 P. st111inee 19 14 • 32 Hell's Hole 07·Sep·90 105304 whole cl• P. st1111lnea 20 26 • 38 Hell •s Hole 07·Sep·90 105305 whole cl• P. Stlllinea 19 21 • 34 Hell •s Hole 08·Sap•90 105306 whole cl• P. st•tnea 20 25 • 39 Hell •s Hole 08·Sep·90 105307 whole cllll P. 1t111fnee 20 23 • 32 Hell's Hole 08·Sep·90 105308 whole cl• P. st•fnee 20 26 • 36 Si.._,.on ley 18·Sep·90 105401 whole cl• P. 1t111inee 14 22 • 32 Si.._,.on Bey 18•Sap·90 105402 whole cl111 P. st•inee 12 20 • 42
26
ACE 30091869
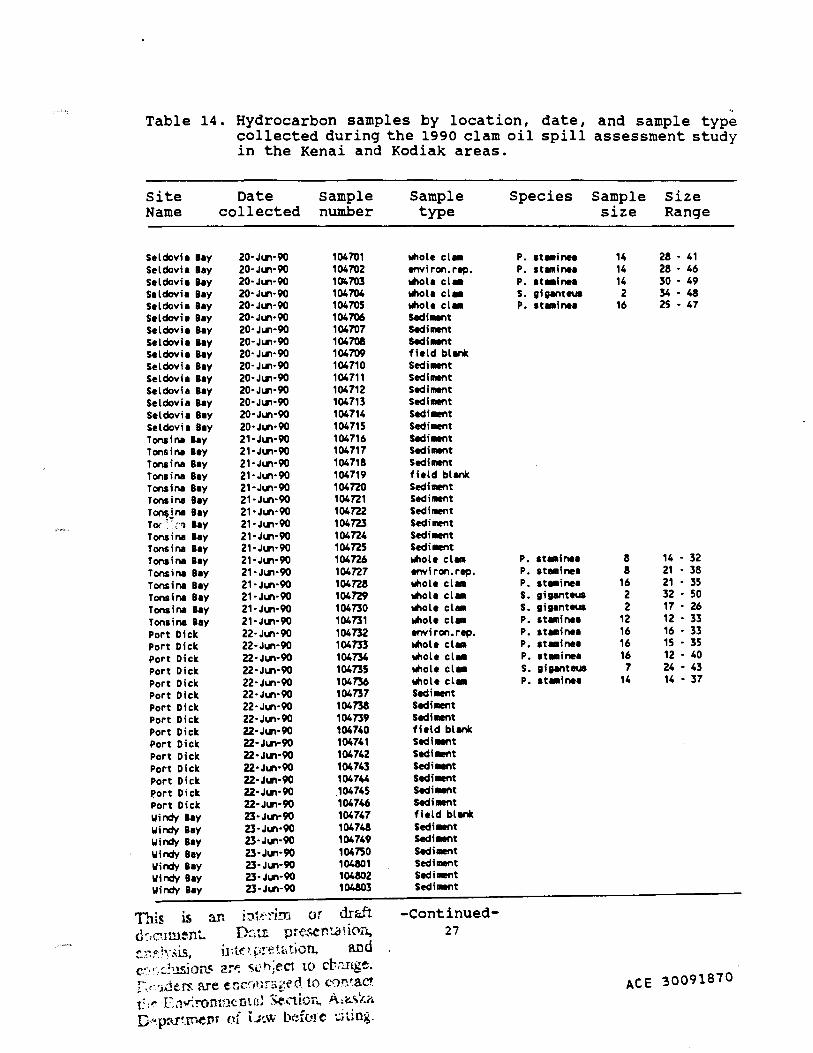
Table 14. Hydrocarbon samples by location, date, and sample type collected during the 1990 clam oil spill assessment study in the Kenai and Kodiak areas.
Site Name
Seldovia Bey Seldovia Bey Seldovia Bey Seldovia Bey Seldovia Bey Seldovia Bey Seldovia Bey Seldovia Bey Seldovia Bey Seldovia Bey Seldovia Bey Seldovia Bey Seldovia Bey Seldovia Bey Seldovia Bey Tonsine Bey Tonsine Bey Tonsina Bey Tonsine Bey Tonsine Bey Tonsina Bey T~lne Bey TOi >·1 Bey Tonsina Bey Tonsina Bey Tonsine Bey Tonsine Bey Tonsine Bey Tonsine Bey Tonsina Bey Tonaine Bey Port Dick Port Dick Port Dick Port Dick Port Dick Port Dick Port Dick Port Dick Port Dick Port Dick Port Dick Port Dick Port Dick port Dick Port Dick Windy Bey Windy Bey Windy Bey Windy Bey Windy Bey Windy Bey Windy Bey
Date collected
20·JIII·90 20·JIII·90 20·JIII·90 20·JIII•90 20·JIII·90 20·JIII•90 20·JIII·90 20·JIII•90 20•JIII•90 20·JIII•90 20·JIII·90 20·JIII·90 20•JIII·90 20·JIII·90 20•JIII•90 21·JIII•90 21·JIII·90 21·JIII·90 21·JIII·90 21·JIII·90 21. Jlll·90 21•JIII·90 21·JIII·90 21·JIII·90 21·JIII·90 21·JIII·90 21·JIII·90 21. Jlll·90 21·JIII•90 21·JIII·90 21·JIII•90 22·JIII•90 22·JIII·90 22·JIII·90 22•JIII·90 22·JIII·90 22•JIII·90 22•JIII·90 22·JIII·90 Z2•JIII·90 Z2•JIII•90 Z2•JIII·90 Z2•JIII•90 Z2•JIII•90 Z2·JIII•90 Z2•JIII·90 23•JIII·90 23·JIII•90 23·JIII·90 23·JIII•90 23·JIII·90 23·JIII•90 23·JIII·90
sample number
104701 104702 104703 104704 104705 104706 104707 104708 104709 104710 104711 104712 104713 104714 104715 104716 104717 104718 104719 104720 104n1 104722 104723 104n4 104n5 104726 104n7 104n8 104729 104730 104731 104732 104733 104734 104735 104736 104737 104738 104739 104740 104741 104742 104743 104744 104745 104746 104747 104748 104749 104750 104801 104802 104803
This is an i;,to!"·~·i!n or dr&.ft (h~:':'!.nn~nt. fk,tz pre:~r.-:.c 1 iNl,
~~1f'_:y~is, i1M r ~;!'~'-<- tion. and c-.-•• ,(;~Usio~ ar~ ~~h;eC'I tO cb:--Jt.ge. r.r'·.i.de~ :u-e er.cn';.ra~~ed to .. ~')r;t.act
• ' ... • ii.. • c l, .. t7 :-:- E.:1v-;:onu1<:01.u •. "'C' . ..-uor., -~~c.:., •• ii. D'·-p~~-rnei'Ir of L;~w bdm e ~iting.
Sample type
whole cl• environ. rep. whole cl• whole cl• whole cl• Secli..,t Sedia.nt Secli..,t field blank Sedi_,t Sedia.nt Sediment Sedilaent Sedi_,t Sedia.nt Sedi_,t SediNnt Sedia.nt field blank Sedhaent Sediment Sediment Sediment Sedia.nt Sedi_,t whole cl• environ. rep. whole cl• whole cl• whole cl• whole cl• environ. rep. whole cl• whole cl• whole cl• whole cl• Sedia.nt Sediment Sediaent field blank Sedi..,t Sedi_,t Sedi..,t Sedi_,t Sedi..,t Sedi..,t field blank Sedi..,t Sedi..,t Sedi..,t Sedi_,t Sedia.nt Sedia.nt
-continued-27
Species Sample size
P. at•inee 14 P. at~inee 14 P. at•inee 14 s. gigenteua 2 P. st•inee 16
P. at .. inee 8 P. ateminee 8 P. st•inee 16 s. ;i;enteus 2 s. ;i;enteua 2 P. ateminee 12 P. at .. inee 16 P. at•inee 16 P. at•inee 16 s. ;i;enteus 7 P. at•inee 14
Size Range
28 • 41 28 - 46 30 • 49 34·48 25 • 47
14 • 32 21 • 38 21 • 35 32 • 50 17 • 26 12 • 33 16 • 33 15 • 35 12 • 40 24 - 43 14 • 37
ACE 30091870
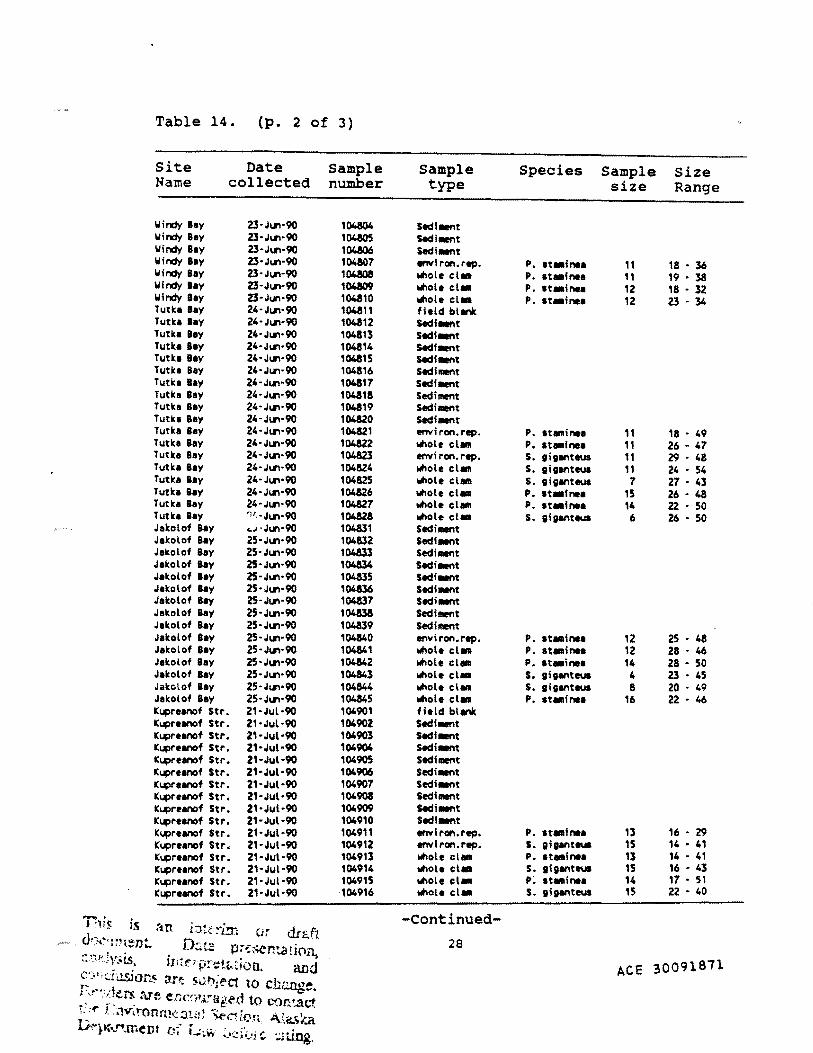
Table 14. (p. 2 of 3)
Site Date Sample Sample Species Sample Size Name collected number type size Range
Windy Bay 2.3·J161·90 104804 Secfi111nt Windy Bey 2.3·J161•90 104805 Secfilllnt Windy Bey 2.3·J161·90 104806 Sedilllnt Windy ley 2.3•J161·90 104807 .nvf ran.rep. P. st•inea 11 18 • 36 Windy Bay 2.3· J\61•90 104MIS whole cl• P. st•fnee 11 19 • 38 Windy lay Z3·J161·90 104809 whole cl• P. •t•lnea 12 18 • 32 Windy Bay 2.3·J161·90 104810 whole cl• P. st•inea 12 23·34 Tutka lay 24·J161·90 10481, field blank Tutka ley 24•J161·90 104812 Sedilllnt Tutka ley 24·J161·90 104813 Sedi111nt Tutka lay 24-J\61•90 104814 Secfflllnt Tutke Bay 24-J\61·90 104115 Secfflllnt Tutka Bay 24·J~.n·90 104816 Sediment Tutka Bey 24-J\61•90 104117 Sedi111nt Tutlca Bay 24-J\61•90 104818 Sediment Tutke Bey 24-J\61•90 104819 Sediment Tutka Bey 24-J~.n-90 104120 Sldi111nt Tutlca Bay 24·J~.n·90 104121 envi ran. rep. P. staminea 11 18 • 49 Tutka Bay 24-J\61•90 104822 whole clam P. stamf nea 11 26 • 47 Tutlce Bey 24-J\61•90 104823 .nvi ran. rep. s. giganteus 11 29 • 48 Tutka Bay 24·J161·90 104824 whole clam s. ;i;anteua 11 24 • 54 Tutka Bay 24·J~.n•90 104825 whole cl1111 s. ;iganteua 7 27 • 43 Tutka Bay 24·J~.n·90 104826 whole cl1111 P. st•fnea 15 26·48 Tutlca Bay 24·J~.n•90 104827 whole cl1111 P. st•inea 14 22 • 50 Tutlca Bay ')I,,J\61•90 104828 whole cl• s. giganteua 6 26 • 50 Jakolof Bay .... ·J\61•90 104131 Sldi_..t Jakolof Bay 25·J~.n·90 104832 Sedf111nt Jakolof Bay 25·J~on·90 104133 Sediment Jalcolof Bay 2S•J161·90 104834 Sldi111nt Jakolof lay 2S·J161·90 104135 Sedilllnt Jalcolof Bay 25·J161·90 104836 Sldi111nt Jakolof Bay 2S·J161·90 104137 Sldi111nt Jekolof Bay 25·J161·90 104838 Sediment Jekolof Bay 25-J\61•90 104139 Sediment Jakolof Bay 25·J161•90 104840 enviran.rep. P. 1t1111inea 12 25 • 48 Jalcolof Bay 25-J\61•90 104841 whole c Lilli P. st•inea 12 28 • 46 Jalcolof Bay 25·J161•90 104842 whole Clllll P. st•inea 14 28 • 50 Jaltolof Bay 25·J~.n·90 104843 whole cl• s. giganteua 4 2.3 • 45 Jaltolof Bay 25-J\61•90 104844 whole cl• s. gi;anteua II 20 • 49 Jakolof Bay 25-J\61•90 104845 whole cl• P. It IIIIi nee 16 22 • 46 Kupreanof Str. 21·Jul·90 104901 field blank Kupreanof Str. 21•Jul·90 104902 Sedf111nt Kupreanof Str. 21•Jul·90 104903 Sldflllnt Kupreanof Str. 21·Jul·90 104904 Sedilllnt Kupreanof Str. 21·Jul·90 104905 Sediment Kupreanof Str. 21·Jul·90 104906 Sedi111nt Kupreanof Str. 21·Jul ·90 104907 Sedilllnt Kupreanof Str. 21·Jul·90 104908 Sediment Kupreanof Str. 21·Jul·90 104909 Secfilllnt Kupreanof Str. 21·Jul·90 104910 Sedf~~~nt
Kupreanof Str. 21·Jul·90 104911 enviran.rep. P. ltllllinea 13 16 - 29 Kupreenof Str. 21-Jul-90 104912 envf ran. rep. s. gigantNI 15 14 - 41 Kupreanof Str. 21·Jul·90 104913 whole clam P. 1t1111inea 13 14 - 41 Kupreanof Str. 21·Jul·90 104914 whole cl• s. gi gW~teua 15 16 - 43 Kupreenof Str. 21 ·Jul·90 104915 whole cl• P. 1t1111inee 14 17 • 51 Kupreenof Str. 21·Jul·90 104916 whole cl• s. giganteua 15 22 • 40
........ i.5 -continued-J ')1~ an i::J!.:d!n ur dr::.ft d•x''"'l"n· . D.:'.tE p:-c:;er.Ul !i(ln, 28 ' J'/., ........
~-'=_,f:.Jv .. ~is, Jlitt.'• p:~tt.tion and ACE 3009lB7l ~::>t<.iasia.r.s arl!:' s~f)jf"ct to. ch.:mg~ , ...... ·i .. rx •
• '· . , .... h ru-e enc~·,•l.:ag~d to C.."lno:act. •• ~ ~. . • • 4 •
:. ' L.w·~ronm.::.::nE!: ~~""'! ~D•\ A~_ , 1), ... • ' o . ' •. I. • ' . .', ~'i ;r.a "}Y....r .. rnent o· t • ·· · ·· • ·t -:.w •J'.-"'it•t r •'jUDg
- ....... ilr ... •
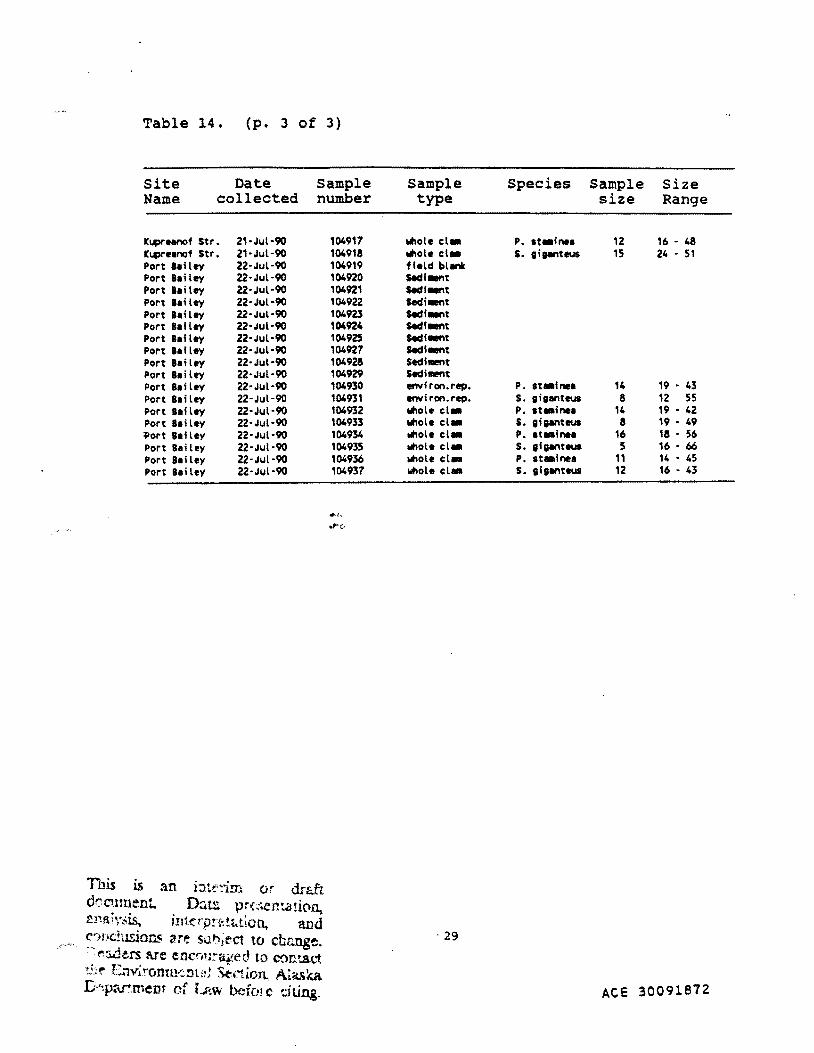
Table 14. (p. 3 of 3)
Site Date Sample Name collected number
Kupreenof Str. 21•Jul•90 ICI4)reanof Str. 21·Jul·90 Port Bailey 22-Jul-90 Port Bailey 22·Jul·90 Port Ia i ley 22·Jul·90 Port Bailey 22·Jul·90 Port Bailey 22·Jul·90 Port Bailey 22·Jul•90 Port Bailey 22·Jul·90 Port Ialley 22·Jul·90 Port Bailey 22·Jul·90 Port Bailey 22·Jul·90 Port Bailey 22·Jul ·90 Port Bailey 22-Jul ·90 Port Bailey 22·Jul·90 Port Bailey 22·Jul·90 'ort BaiLey 22·Jul·90 Port BaiLey 22·Jul·90 Port Bailey 22·Jul·90 Port Bailey 22·Jul·90
ThiS. . IS an i:lt':''~'i!n or drE:.ft.
dco.nnent ~ts prt-.:~ematiCI~ ::maiy.:o~is, itlterpn:t<.tion, and c:mdusions ar~; s'O.hject to d:w.nge. ~:ldus are enco,;:;aged to comact
~.1 ;t: r:.,"~.ronmcnw! St-ction, Ala.'ika .C.~pr~.ment of i..r~w bef(n c dting.
104917 104918 104919 104920 104921 104922 104923 104924 104925 104927 104928 104929 104930 104931 104932 104933 104934 104935 104936 104937
Jit",l ..
.rc..
Sample Species Sample Size type size Range
lllole c:l• P. ltMinta 12 16 - 48 lllole c:lM s. tiaenteus 15 24 - 51 field blri SediMnt Sedl..,t Sedi..,t Sedl..,t Sedf..,t Sedi..,t Sedhaent Sedllllel'lt Sedilllel'lt environ. rep. P. atMinea 14 19 • 43 environ. rep. S. titanteus 8 12 55 whole c:l• P. at•inea 14 19 • 42 lllole c:LM s. ti;~~nteus a 19 • 49 lllole c:l• P. at•inea 16 18 • 56 whole c:l• s. tf;Witeul 5 16 • 66 whole c:l• P. at•inea 11 14 - 45 whole c:l• s. ;i;Witeut 12 16 • 43
. 29
ACE 30091872
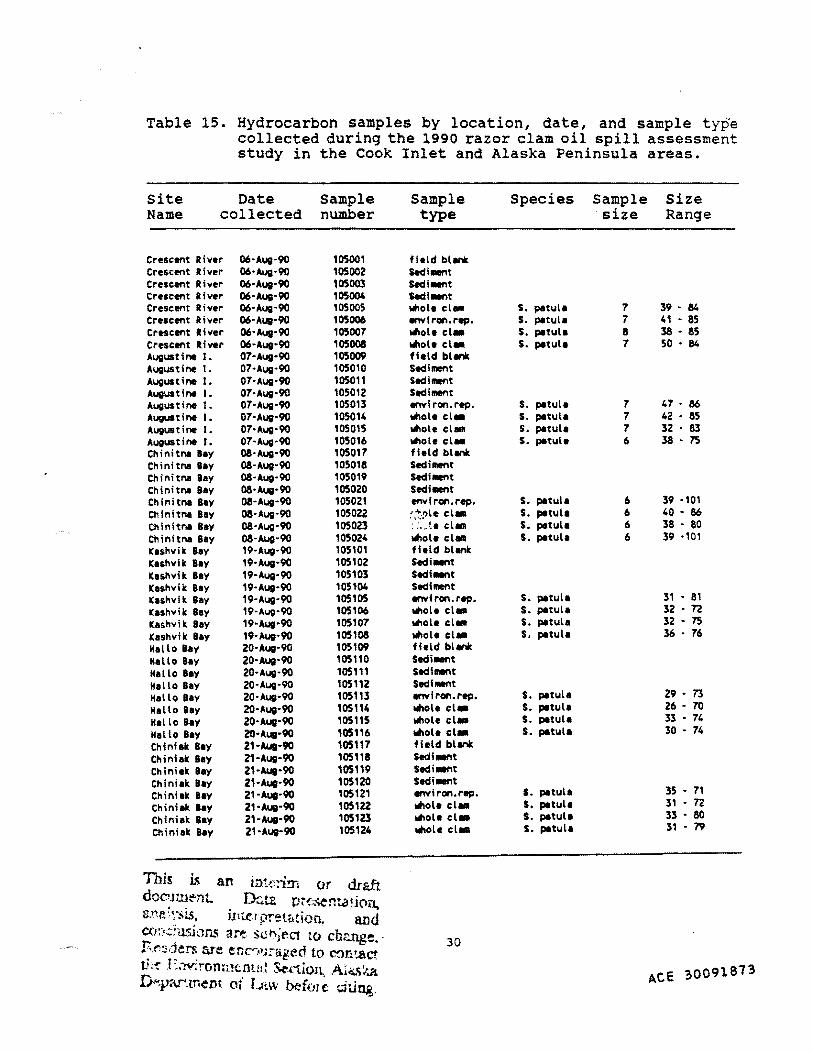
Table 15. Hydrocarbon samples by location, date, and sample type collected during the 1990 razor clam oil spill assessment study in the Cook Inlet and Alaska Peninsula areas.
Site Name
Date collected
Crescent River Crescent River Crescent River Crescent River Crescent River Crescent River Crescent River Crescent River Augustine 1. Augustine 1. Augustine 1. Augustine 1. Augustine I. Augustine I . Augustine 1. Augustine 1. Chinltna lay Chinitna lay Chinitna lay Chinitna lay Chinitna ley Chinitna Bey Chinitna Bey Chinftna ley ICishvilc Bey Keshvilc Bey Keshvik Bey Keshvilc Bey Keshvik Bey Keshvilc Bey Keshvik Bey Keshvik Bay Hello Bey Hello Bay Hello lay Hello Bey Hello Bey Hello Bey Hello ley Hello lay Chiniak Bay Chiniak ley Chiniek lay Chiniak Bey Chiniak Bey Chiniak lay Chiniak Bey Chiniak Bay
06·Aug·90 06·Aug·90 06·Aug·90 06·Aug·90 06·Aug·90 06·Aug·90 06·Aug·90 06·Aug•90 07·Aug·90 07·Aug·90 07·Aug·90 07·Aug·90 07·Aug·90 07·Aug·90 07•Aug·90 07·Aug·90 08·Aug·90 08·Aug•90 08·Aug·90 08·Aug·90 08·Aug·90 08·Aug·90 08·Aug·90 08·Aug·90 19·Aug•90 19·Aug·90 19•Aug·90 19·Aug·90 19·Aug•90 19·Aug·90 19·Aug·90 19·Aug·90 20·Aug·90 20·Aug·90 20•Aug·90 20·Aug•90 20·Aug•90 20·Aug·90 20·Aug·90 20·Aug•90 21·Aug·90 21·Aug·90 21·Aug·90 21·Aug·90 21·Aug·90 21•Aug·90 21-Aug-90 21·Aug•90
Sample number
105001 105002 105003 105004 105005 105006 105007 105008 105009 105010 105011 105012 105013 105014 105015 105016 105017 105018 105019 105020 105021 105022 105023 105024 105101 105102 105103 105t04 105105 105106 105107 105108 105109 105110 105111 105112 105113 105114 105115 105116 105117 105118 105119 105120 105121 105122 105123 105124
sample type
field blank Sedi.,t SediMnt SecliMnt whole cl• envf ron.,...,, wflole elM whole elM field blank Sediment Sedilllent Sediment environ.,...,. whole elM whole cl1111 whole cl111 field blank Sedi_,t Sediment Sedi_,t envfron.r..,. '-1:-.'>le cl• , ·~·.le Clll'ft
whole cl• field blank SediMnt SediMnt Sediment environ. rep. whole cl111 whole cl• whole cl111 field blank SediMnt Sedi~~ent Sedilllnt environ. rep. whole elM whole cl• whole elM field blank SediMnt Sediatnt SediMnt environ. rep. whole c\111 whole c\111 lllhole cl1111
30
Species
s. petule s. petule s. petule s. petula
s. pstule s. petula s. pstula s. pstule
s. pstula s. petule s. pstula s. pstull
s. pstule s. pstula s. pstula s. pstula
s. pstula S. PltUll s. pstula s. pstu\1
S. PltUll $, PltUll s. pstula $, Pltula
Sample ·size
7 7 8 7
7 7 7 6
6 6 6 6
Size Range
39- 84 41 • 85 38 • 85 50 • 84
47. 86 42 • 85 32 . 83 38·75
39 ·101 40 • 86 38 • 80 39 ·101
31 • 81 32 • 72 32 • 75 36 • 76
29 • 73 26 • 70 33 . 74 30 • 74
35 - 71 31 • 72 33 - 80 31 • 79
ACE 30091873

Table 16. Necropsy samples taken during the 1990 clam oil assessment project in Prince William Sound.
Site Name Date Species Number Size Range in sample (mm)
Simpson Bay 10-Apr-90 P. staminea 16 17 - 37 simpson Bay 10-Apr-90 s. giganteus 6 45 - 53 Hell's Hole 11-Apr-90 P. staminea 12 n;a Hell's Hole 11-Apr-90 s. giganteus 8 n;a Double Bay 12-Apr-90 P. staminea 20 22 40 Double Bay 12-Apr-90 s. giganteus 10 12 - 45 Gibbon Anch. 23-Apr-90 s. giganteus 9 19 - 46 Gibbon Anch. 23-Apr-90 P. staminea 22 25 - 41 Wilson Bay 26-Apr-90 P. staminea 12 19 - 36 Wilson Bay 26-Apr-90 s. giganteus 9 20 - 43 Horseshoe Bay 27-Apr-90 P. staminea n/a Horseshoe Bay 27-Apr-90 s. giganteus n;a North Chenega 28-Apr-90 P. staminea 17 16 - 35
Table 17. Necropsy samples taken during the 1990 clam oil assessment project in the KeP~i and Kodiak areas.
Site Name Date Species
Seldovia Bay 20-Jun-90 P. Tonsina Bay 21-Jun-90 P. Port Dick 22-Jun-90 P. Windy Bay 23-Jun-90 P. Tutka Bay 24-Jun-90 P. Jakolof Bay 25-Jun-90 P. Kupreanof str. 21-Jul-90 P. Kupreanof Str. 21-Jul-90 s. Port Bailey 22-Jul-90 P. Port Bailey 22-Jul-90 s.
This is an iiJt~':!'t!I'.i or dr&ft dOCl.Itnent. IX.u:. prc.:;er.ul!io~ &..TIRh"ttis, iJ>t('rpreu.ti.on. and c::-,nc:usiom ar~; su~;e.ct to ch:mge. Re~~ders rue en~o,lra~eo to Mntact
. ' ,. ..... . A·· .,,, , tl:e En"1ronm<'-ma~ .')(" .•. dOl\ ~~., ... a.
staminea staminea staminea staminea staminea staminea staminea giganteus staminea giganteus
31
Number Size Range in sample (mm)
20 n/a 20 n;a 20 nja 16 20 - 42 21 31 - 51 22 22 - 52 14 12 - 45 23 18 - 44 20 22 - 48 15 31 - 60
spil"1
Sample Number
N23-P N24-S N25-P N26-P N27-P N28-S N29-S N30-P N35-P N36-S N37-P N38-S N41-P
spill
Sample Number
N43-P N44-P N45-P N46-P N47-P N48-P N49-P NSO-S N51-P N52-S
D~par.tr.eru of Lr~w bdm c dting. ACE 30091874
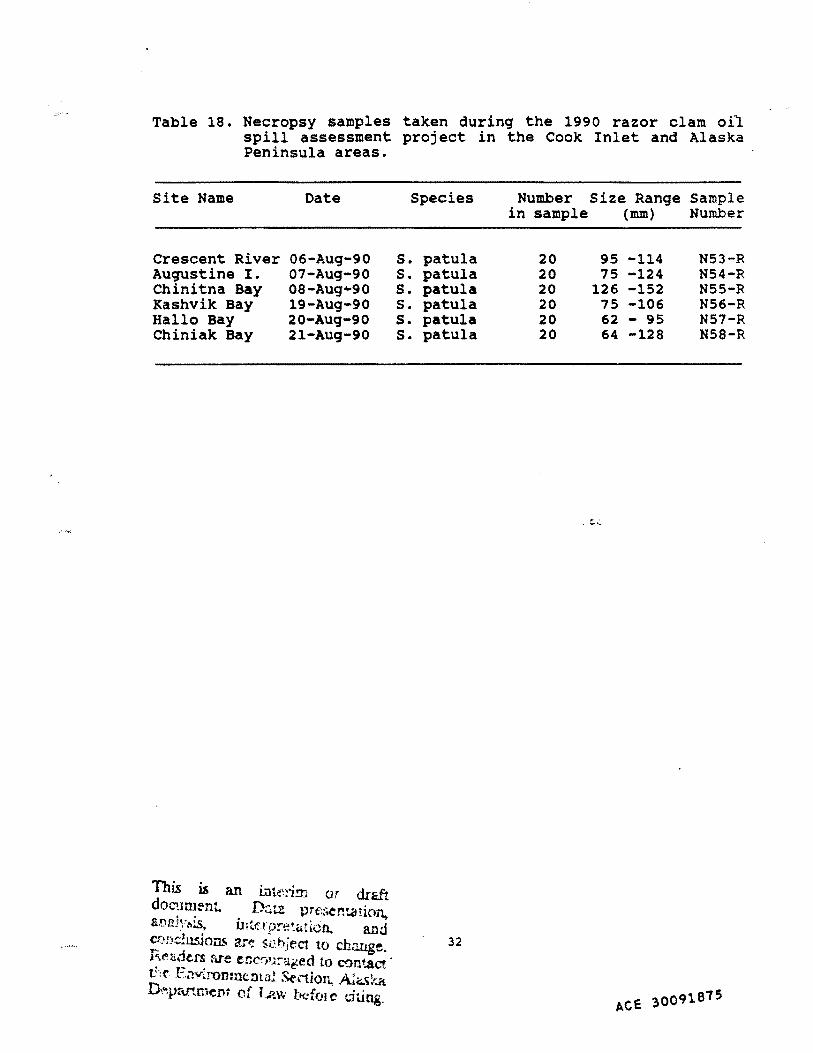
Table 18. Necropsy samples taken durinq the 1990 razor clam oi1 spill assessment project in the Cook Inlet and Alaska Peninsula areas.
Site Name Date Species Number Size Ranqe Sample in sample (mm) Number
Crescent River 06-Auq-90 s. patula 20 95 -114 N53-R Augustine I. 07-Auq-90 s. patula 20 75 -124 N54-R Chinitna Bay 08-Auq ... 90 s. patula 20 126 -152 N55-R Kashvik Bay 19-Auq-90 s. patula 20 75 -106 N56-R Hallo Bay 20-Auq-90 s. patula 20 62 - 95 N57-R Chiniak Bay 21-Auq-90 s. patula 20 64 -128 N58-R
32
ACE 30091.875
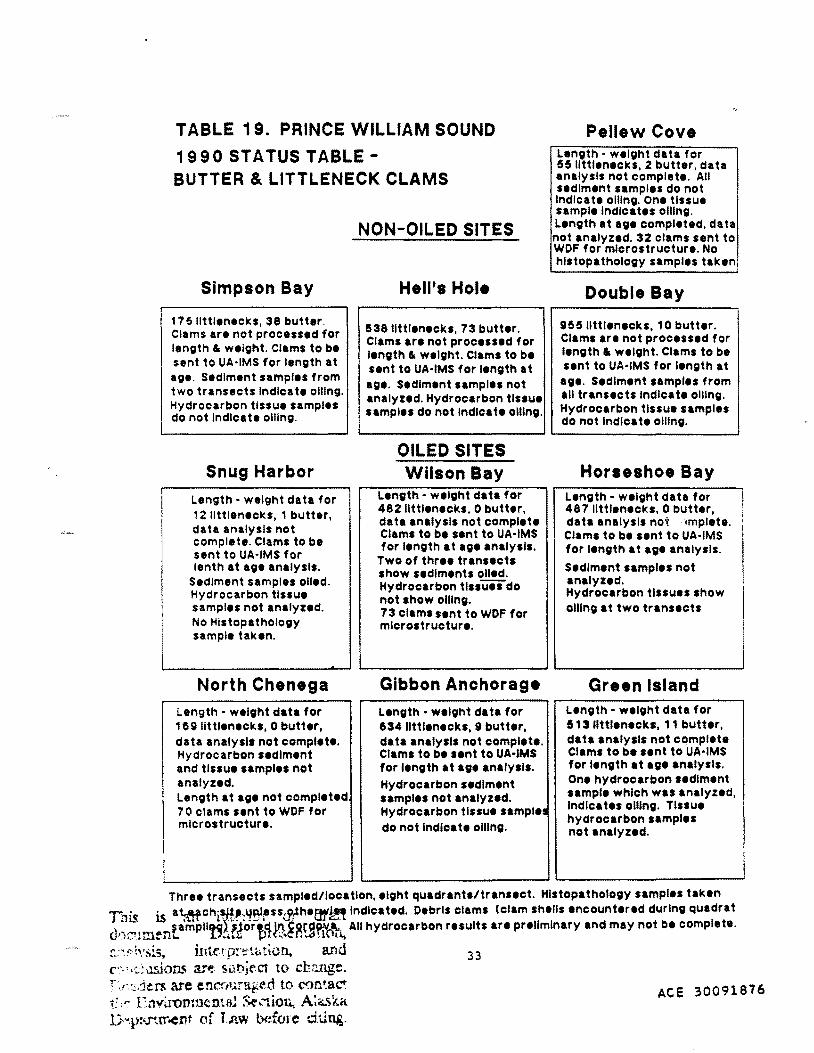
TABLE 19. PRINCE WILLIAM SOUND
1990 STATUS TABLE-BUTTER & LITTLENECK CLAMS
Simpson Bay
175 llttlenecks, 38 butter. Clams are not processed for length & weight. Clams to be sent to UA·IMS for length at age. Sediment samples from two transects Indicate oiling. Hydrocarbon tissue samples do not Indicate oiling.
Snug Harbor
Length· weight data for 12 llttlenecks, 1 butter, data analysis not complete. Clams to be sent to UA·IMS for lenth at age analysts.
Sediment samples oiled. Hydrocarbon tissue samples not analyzed. No Histopathology sample taken.
North Chenega Length • weight data for 16!1 llttlenecks, 0 butter, data analysis not complete. Hydrocarbon sediment and tissue samples not analyzed. Length at age not completed 70 clams sent to WDF for microstructure.
NON-OILED SITES
Hell's Hole
53811ttlenecks, 73 butter. Clams are not processed for length & weight. Clams to be sent to UA·IMS for length at age. Sediment samples not analyzed. Hydrocarbon tissue samples do not Indicate oiling.
OILED SITES Wilson Bay
Length· weight data for 482 llttlenecks, 0 butter, data analysis not complete Clams to be sent to UA·IMS for length at age analysts.
Two of three transects show sediments oiled. Hydrocarbon tissues do not show oiling. 73 clams sent to WDF for microstructure.
Gibbon Anchorage
Length· weight data for 534 llttlenecks, Iii butter, data analysis not complete. Clams to be sent to UA·IMS for length at age analysis. Hydrocarbon sediment samples not analyzed. Hydrocarbon tissue sample1 do not Indicate oiling.
Pellew Cove Length· weight data for 55 llttlenecks, 2 butter, data analysis not complete. All sediment samples do not Indicate oiling. One tissue sample Indicates oiling. Length at age completed, data not analyzed. 32 clams sent to WDF for microstructure. No histopathology samples taken
Double Bay
lil5511ttlenecks, 10 butter. Clams are not processed for length & weight. Clams to be sent to UA·IMS for length at
age. Sediment samples from all transects Indicate oiling. Hydrocarbon tissue samples do not Indicate oiling.
Horseshoe Bay Length· weight data for 487 llttlenecks, 0 butter, data analysis not ··mplete. Clams to be sent to UA·IMS for length at age analysis.
Sediment samples not analyzed. Hydrocarbon tissues show oiling at two transects
Green Island Length· weight data for 61311ttlenecks, 11 butter, data analysis not c~mplete Clams to be sent to UA·IMS for length at age analysis. One hydrocarbon sediment sample which was analyzed, Indicates oiling. Tissue hydrocarbon samples not analyzed.
Three transects sampled/location, eight quadrants/transect. Histopathology samples taken This is awchi~~.!';~~~ssa>rhellf~ Indicated. Debris clams (clam shells encountered during quadrat QliCl:'nent*mpll'f'!flortJ~J!:}.gR~fi'b~~ All hydrocarbon results are preliminary and may not be complete.
. . . . d t.·:"~'::o~:.s, wte-rprs:u.w::m. an· C'''•(.:I!Sions arf!: Si.:\tJ;rct to cb.rJJ.ge. r-:r.:i.:kn: are encnuraged to ron~act t' '"' .Fnvi.ron:nentaJ Sfuiou, A~~.sk.a v".p:•.rtrr.ent of Lr~w before dung.
33
ACE 30091876
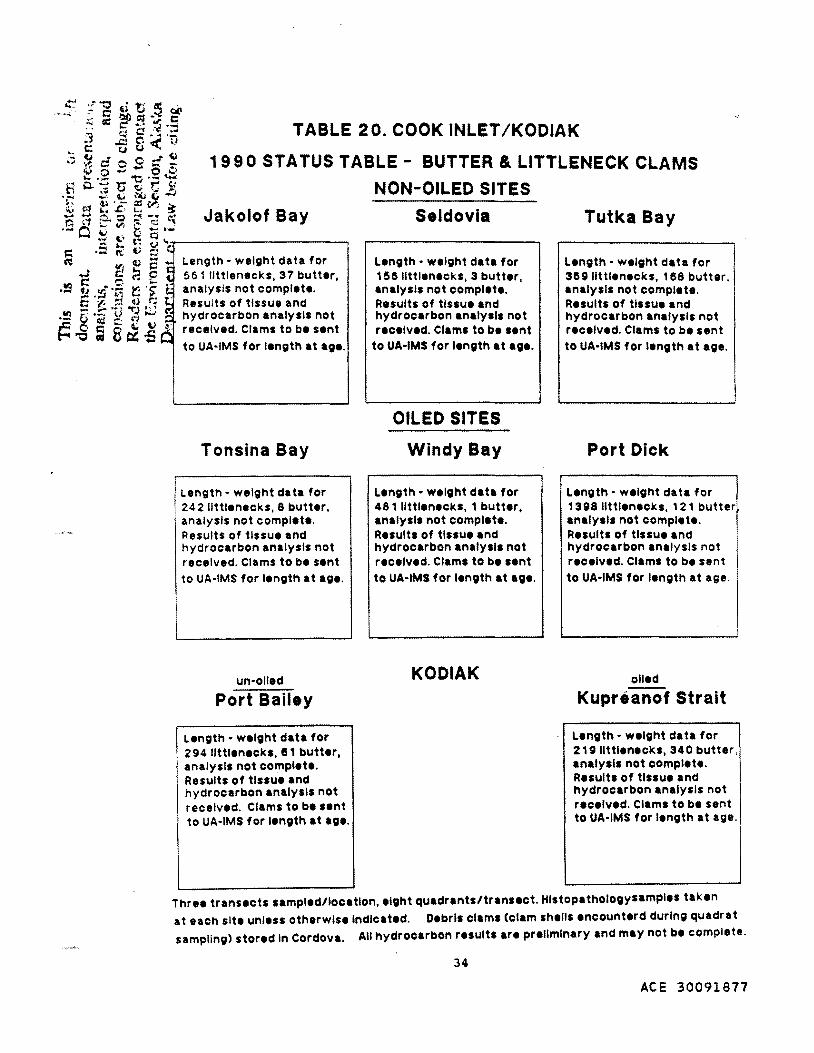
!"g ~ g -~ a(\ ~ m ~· ... ~ ~ .. E -- eJ a .-c ,J
~ 73 8 < ·n TABLE 2 0. COOK INLET /KODIAK
:.;~coS 0~~ ~ .2 ..,; 'C ·- ~ R c. ":'.! ti 1:,: t S!
19 9 0 STATUS TABLE - BUTTER & LITTLENECK CLAMS
.. _ :: «; l't(j".,;,.;
~: R t::c~ ev; ~ i5t1&a~~~ Jakolof Bay ·- Q IV . ~ - •~..: ,. ,. c.l '-•..-------------.
::.~.;~ fl3 ·- v. ~ § Length· weight data for
E g ~ P 561 llttlenecks, 37 butter, .!5 ~ .:!f·f, t; ·~ •. analysis not complete.
~ -,. ::.1 ~ .r~ ~ Results of tissue and .!! g ·~ g ~ ~ . . hydrocarbon analysis not ~ "Q ~ 8 ~ £ ~ received. Clams to be sent
to UA·IMS for length at age.
I
Tonsina Bay
Length- weight data for 242 llttlenecks, 8 butter, analysis not complete. Results of tissue and hydrocarbon analysis not received. Clams to be sent to UA·IMS for length at age.
un·olled
Port Bailey
Length· weight data for 29411ttlenecks, e1 butter, analysis not complete. Results of tissue and hydrocarbon analysis not received. Clams to be sent to UA·IMS for length at age.
NON-OILED SITES
Seldovia
Length· weight data for 15511ttlenecks, 3 butter, analysis not complete. Results of tissue and hydrocarbon analysis not received. Clams to be sent
to UA·IMS for length at age.
OILED SITES
Windy Bay
Length· weight data for 481 llttlenecks, 1 butter, analysis not complete. Results of tissue and hydrocarbon analysis not received. Clams to be sent to UA·IMS for length at age.
KODIAK
Tutka Bay
Length· weight data for 359 llttlenecks, 158 butter, analysis not complete. Results of tissue and hydrocarbon analysis not received. Clams to be sent to UA·IMS for length at age.
Port Dick
Length· weight data for 1398 llttlenecks, 121 butter analysis not complete. Results of tissue and hydrocarbon analysis not received. Clams to be sent to UA·IMS for length at age.
oiled
Kupreanof Strait
Length· weight data for 219 llttlenecks, 34 0 butter, analysis not complete. Results of tissue and hydrocarbon analysis not received. Clams to be sent to UA·IMS for len;th at age.
Three transects sampled/location, eight quadrants/transect. Hlstopathologysamples taken
at each site unless otherwise Indicated. Debris clams (clam shells encounterd during quadrat sampling) stored In Cordova. All hydrocarbon results are preliminary and may not be complete.
34
ACE 30091877
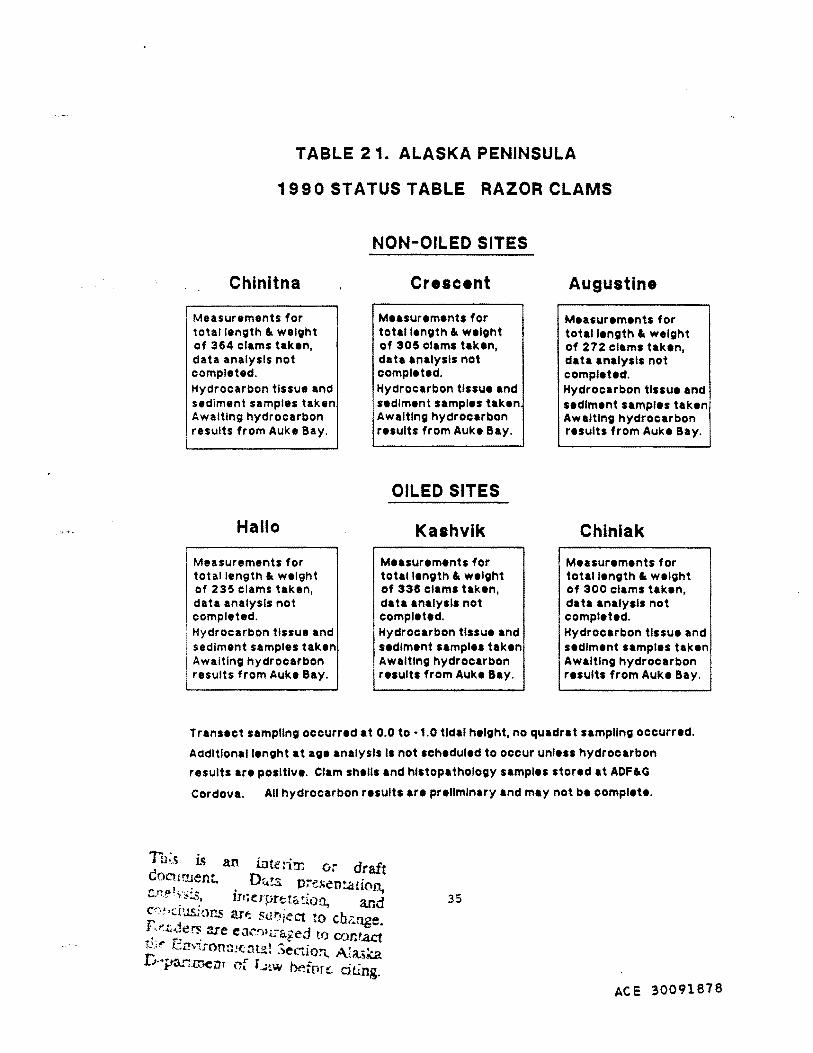
TABLE 2 1. ALASKA PENINSULA
1990 STATUS TABLE RAZOR CLAMS
Chinitna
, Measurements for total length • weight of 364 clams taken, data analysis not completed. Hydrocarbon tissue and sediment samples taken
I Awaiting hydrocarbon
. results from Auke Bay.
Hallo
Measurements for total length • weight of 235 clams taken, data analysis not completed. Hydrocarbon tissue and sediment samples taken Awaiting hydrocarbon results from Auke Bay.
NON-OILED SITES
Crescent
Measurements for total length • weight of 305 clams taken, data analysis not completed. Hydrocarbon tissue and sediment samples taken Awaiting hydrocarbon results from Auke Bay .
OILED SITES
Kashvik
Measurements for total length • weight of 335 clams taken, data analysis not completed. Hydrocarbon tissue and sediment samples taken Awaiting hydrocarbon results from Auke Bay.
Augustine
Measurements for total length • weight of 272 clams taken, data analysis not completed. Hydrocarbon tissue and sediment samples taken Awaiting hydrocarbon results from Auke Bay.
Chiniak
Measurements for total length • weight of 300 clams taken, data analysis not completed. Hydrocarbon tissue and sediment samples taken Awaiting hydrocarbon results from Auke Bay.
Transect sampling occurred at 0.0 to· 1.0 tidal height, no quadrat sampling occurred.
Addltlonallenght at age analysis Is not scheduled to occur unless hydrocarbon
results are positive. Clam shells and histopathology samples stored at ADF•G
cordova. All hydrocarbon results are preliminary and may not be complete.
ACE 30091878
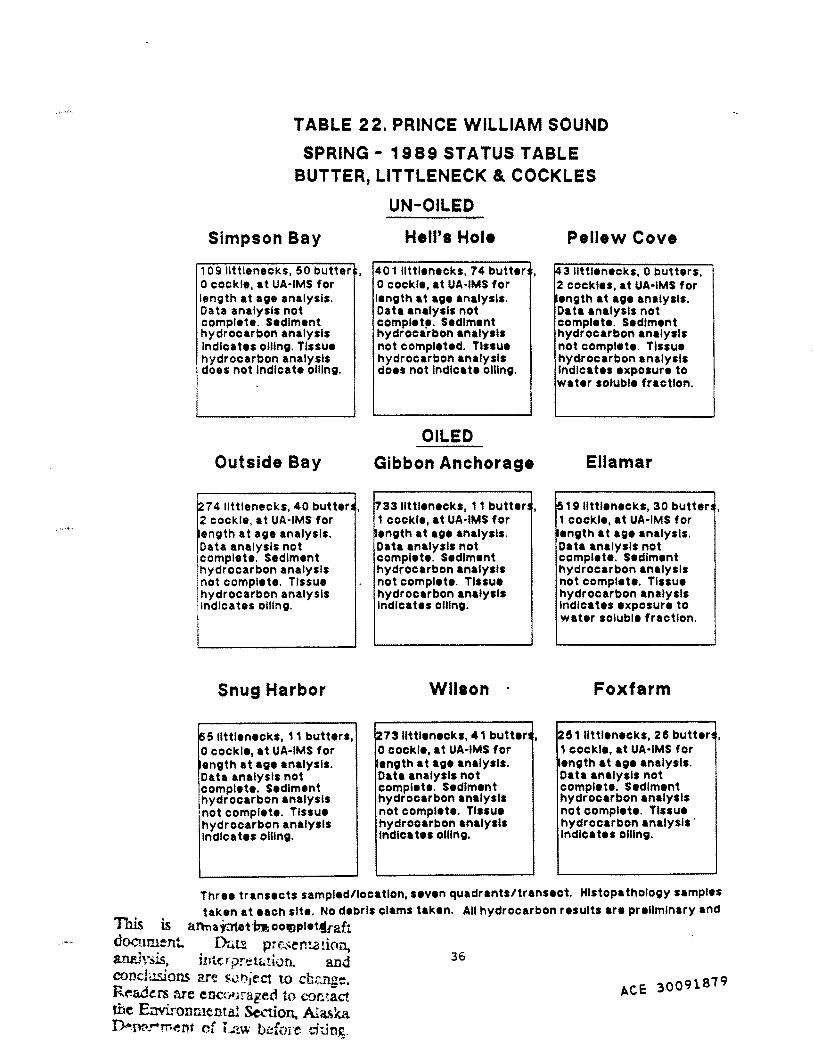
TABLE 2 2. PRINCE WILLIAM SOUND
SPRING- 1989 STATUS TABLE BUTTER, LITTLENECK & COCKLES
Simpson Bay
10911tt!enecks, 50 butter , o cockle, at UA·IMS for length at age analysis. Data analysis not complete. Sediment hydrocarbon analysis Indicates oiling. Tissue hydrocarbon analysis does not Indicate oiling.
Outside Bay
~74 llttlenecks, 40 butters, 2 cockle, at UA·iMS for ength at age analysis. Data analysis not complete. Sediment hydrocarbon analysis not complete. Tissue hydrocarbon analysis Indicates oiling.
Snug Harbor
165 llttienecks, 11 butters, 0 cockle, at UA·IMS for ength at age analysis. Data analysis not complete. Sediment hydrocarbon analysis not complete. Tissue hydrocarbon analysis Indicates oiling.
UN-OILED
Hell's Hole
40 111ttlenecks, 74 butter , o cockle, at UA·IMS for length at age analysis. Data analysis not complet~. Sediment hydrocarbon analysts not completed. Tissue hydrocarbon analysis does not Indicate oiling.
OILED
Gibbon Anchorage
733 llttlenecks, 11 butter , 1 cockle, at UA·IMS for ength at age analysis. Data analysis not complete. Sediment hydrocarbon analysis not complete. Tissue hydrocarbon analysis Indicates oiling.
Wilson
lz73 llttlenecks, 41 butttrl , o cockle, at UA·IMS for ength at age analysis. Data analysis not complete. Sediment hydrocarbon analysis not complete. Tissue hydrocarbon analysis Indicates oiling.
Pellew Cove
[43 llttlanacks, 0 butters, 2 cockles, at UA·IMS for angth at age analysis. Data analysis not complete. Sediment hydrocarbon analysis not complete. Tissue hydrocarbon analysis Indicates exposure to water soluble fraction.
Ella mar
51 G llttlenecks, 30 butter , 1 cockle, at UA·IMS for ength at age analysis. Data analysis not complete. Sediment hydrocarbon analysis not complete. Tissue hydrocarbon analysis Indicates exposure to water soluble fraction.
Fox farm
~5111ttlenecks, 2e butten. 1 cockle, at UA·IMS for ength at age analysis. Data analysis not complete. Sediment hydrocarbon analysis not complete. Tissue hydrocarbon analysis· Indicates oiling.
Three transacts sampled/location, seven quadrants/transact. Histopathology samples taken at each site. No debris clams taken. All hydrocarbon results are preliminary and
This is annajateti:nhcolf)plet!faft
document. D-u~ pre:~enuHinn, &neJ\"SlS, i.!Jtt:.q:m:u.tion. and 36
conclusions arf! sub}ect to cbw.1ge. 9 Readers are encr,•;raged to cor..~act ACE 300
9l
87
tbe Envi.ronmenta! ~'"'lion, Alaska D-n~rrr.ent of Law bdorc dting.
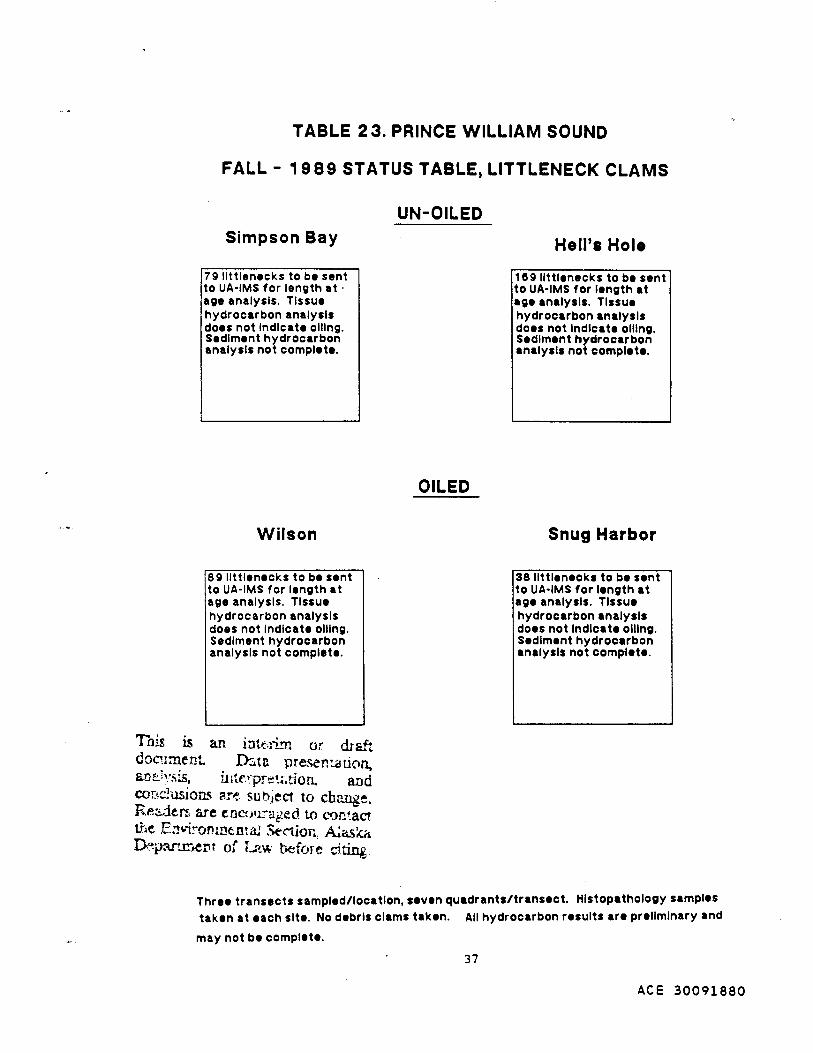
TABLE 2 3. PRINCE WILLIAM SOUND
FALL - 19 B 9 STATUS TABLE, LITTLENECK CLAMS
Simpson Bay
79 llttlenecks to be sent to UA·IMS for length at · age analysis. Tissue hydrocarbon analysis does not Indicate oiling. Sediment hydrocarbon analysis not complete.
Wilson
89 llttlenecks to be sent to UA-IMS for length at age analysis. Tissue hydrocarbon analysis does not Indicate oiling. Sediment hydrocarbon analysis not complete.
Tni.s is an intt.!-L'n or draft docmnent D::4ta presen:ation. an~·h·sis u· •.• ,..,·pr,;.j· t·a·on. and - .r ~ ' .......... - ... <, ..
cor•dusions ar~ sut~_iect to change. Re:i.:lc.rs are enco11.raged to cm~·.act tbe E:1"ironmemal SeC"tjon. Aa-;!cd Departmel'lt of L .. '!w before citing
UN-OILED
OILED
Hell's Hole
189 llttlenecks to be sent to UA·IMS for length at age analysis. Tissue hydrocarbon analysis does not Indicate oiling. Sediment hydrocarbon analysis not complete.
Snug Harbor
38 llttlenecks to be sent to UA·IMS for length at age analysis. Tissue hydrocarbon analysis does not Indicate oiling. Sediment hydrocarbon analysis not complete.
Three transects sampled/location, seven quadrants/transect. Histopathology samples taken at each site. No debris clams taken. All hydrocarbon results are preliminary and
may not be complete.
37
ACE 30091880
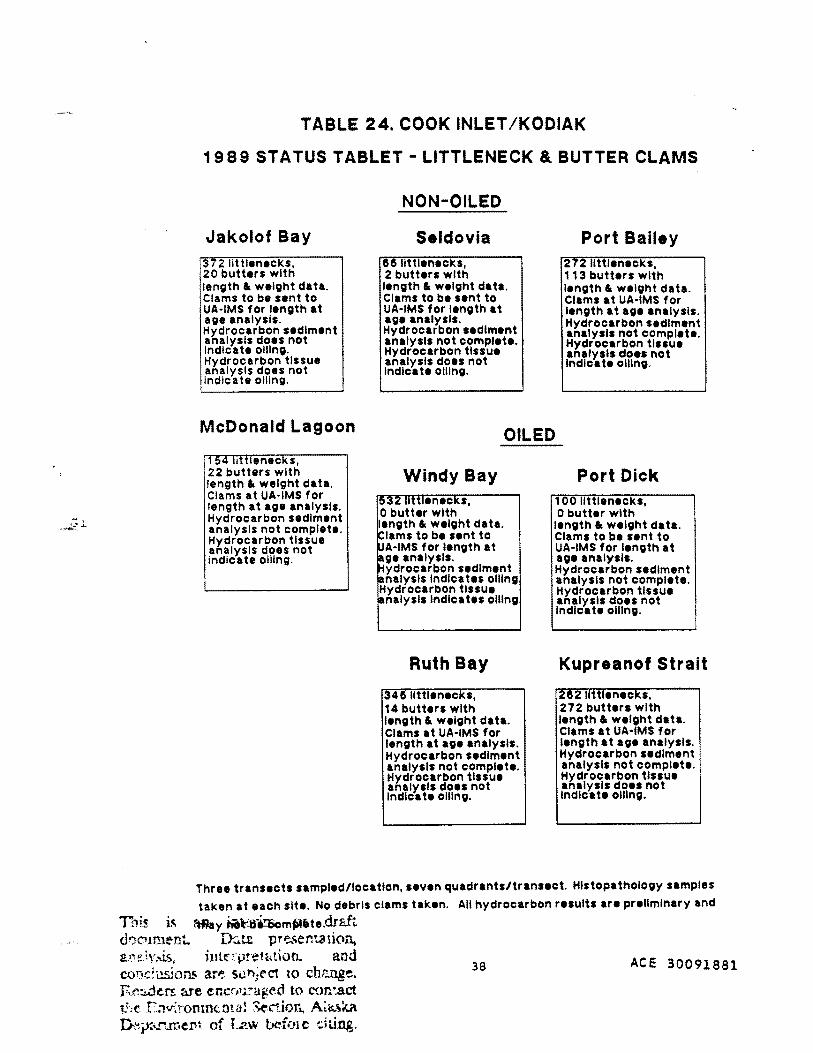
TABLE 24. COOK INLET /KODIAK
1989 STATUS TABLET- LITTLENECK & BUTTER CLAMS
Jakolof Bay 372 llttlenecl<s. 20 butters with length • weight data. Clams to be sent to UA·IMS for length at age analysts. Hydrocarbon sediment analysts does not Indicate oiling. Hydrocarbon tissue analysts does not indicate oiling.
McDonald Lagoon
1 enec s. 22 butters with length & weight data. Clams at UA·IMS for length at age analysts. Hydrocarbon sediment analysis not complete. Hydrocarbon tissue analysis does not indicate oiling.
NON-OILED
Seldovia 6611ttlenecks, 2 butters with length & weight data. Clams to be sent to UA·IMS for length at age analysts. Hydrocarbon sediment analysts not complete. Hydrocarbon tissue analysts does not Indicate oiling.
Port Bailey 27Z llttlenecks, 1 1 3 butters with length • weight data. Clams at UA·IMS for length at age analysis. Hydrocarbon sediment analysis not complete. Hydrocarbon tissue analysis does not Indicate oiling.
OILED
Windy Bay enec s,
0 butter with length • weight data.
tams to be sent to A-IMS for length at ge analysts. ydrocarbon sediment nalysls Indicates oiling
Hydrocarbon tissue nalysls Indicates oiling
Ruth Bay
!34611ttlenecks, 14 butters with length • weight data. Clams at UA·IMS for length at age analysis. Hydrocarbon sediment analysis not complete. Hydrocarbon tissue analysts does not Indicate oiling.
Port Dick 100 Uttlenecks, 0 butter with length • weight data. Clams to be sent to UA·IMS for length at age analysis. Hydrocarbon sediment analysis not complete. Hydrocarbon tissue analysts does not Indicate oiling.
Kupreanof Strait
Z62 llttlenecks, 272 butters with length & weight data. Clams at UA·IMS for length at age analysts. Hydrocarbon sediment analysts not complete. Hydrocarbon tissue analysis does not Indicate oiling.
Three transects sampled/location, seven quadrants/transect. Histopathology samples
taken at each site. No debris clams taken. All hydrocarbon results are preliminary and
Thi~ is ~Y iio~ai:oomP1•te.draft d')cumtnt. llitr. pre..~en~tion, a.,,elriis, inteqJ!'etc.tion. and con..c!usions ar~;: suhject to chrJJ.ge. r:.e:.i.Jers are enc(n;ageo to c<:mtact !ht' C1v::··onm<:.ma! Section., A~a.~!<.a.
,f • f .. Ot~y::•.rtrr.erH 01 L.~w be 01 c: <:.:JU.Dg.
38 ACE 30091881
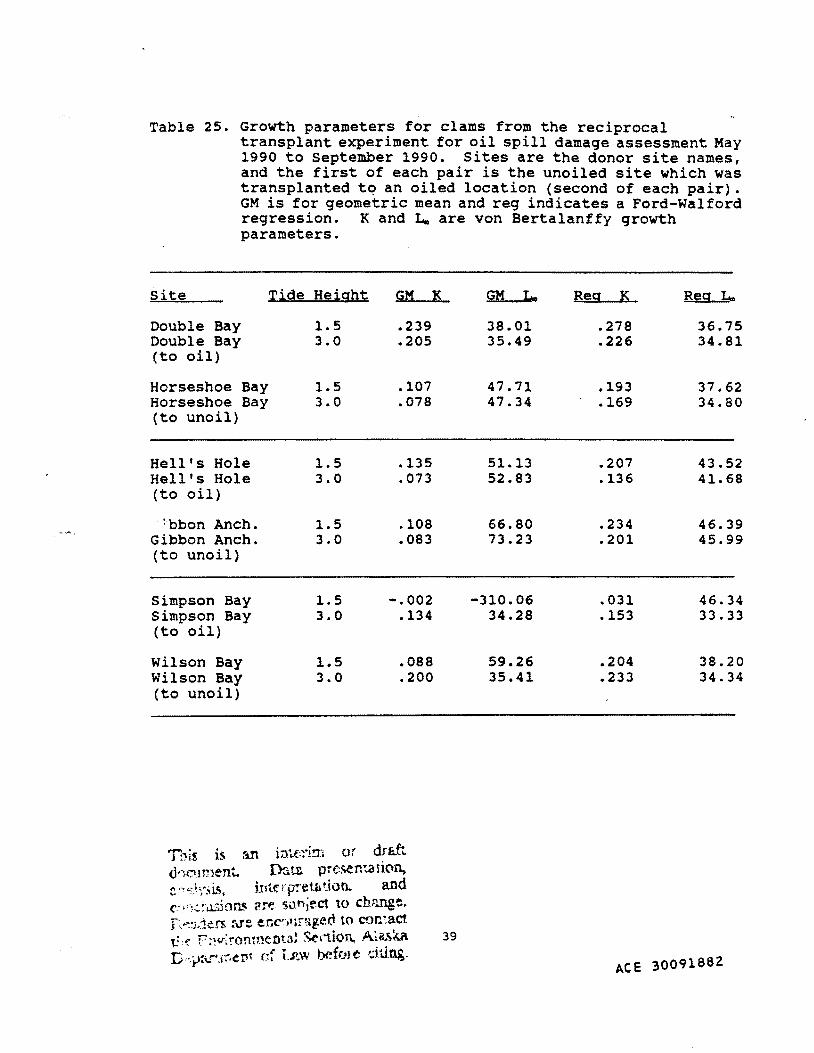
Table 25. Growth parameters for clams from the reciprocal transplant experiment for oil spill damage assessment May 1990 to September 1990. Sites are the donor site names, and the first of each pair is the unoiled site which was transplanted tq an oiled location (second of each pair). GM is for geometric mean and reg indicates a Ford-Walford regression. K and L. are von Bertalanffy growth parameters.
Site Tide Height GM K GM L. Reg K Reg L.,
Double Bay 1.5 .239 38.01 .278 36.75 Double Bay 3.0 .205 35.49 .226 34.81 (to oil)
Horseshoe Bay 1.5 .107 47.71 .193 37.62 Horseshoe Bay 3.0 .078 47.34 .169 34.80 (to unoil)
Hell's Hole 1.5 .135 51.13 .207 43.52 Hell's Hole 3.0 .073 52.83 .136 41.68 (to oil)
:bbon Anch. 1.5 .108 66.80 .234 46.39 Gibbon Anch. 3.0 .083 73.23 .201 45.99 (to unoil)
Simpson Bay 1.5 -.002 -310.06 .031 46.34 Simpson Bay 3.0 .134 34.28 .153 33.33 (to oil)
Wilson Bay 1.5 .088 59.26 .204 38.20 Wilson Bay 3.0 .200 35.41 .233 34.34 (to unoil)
39
ACE 30091882
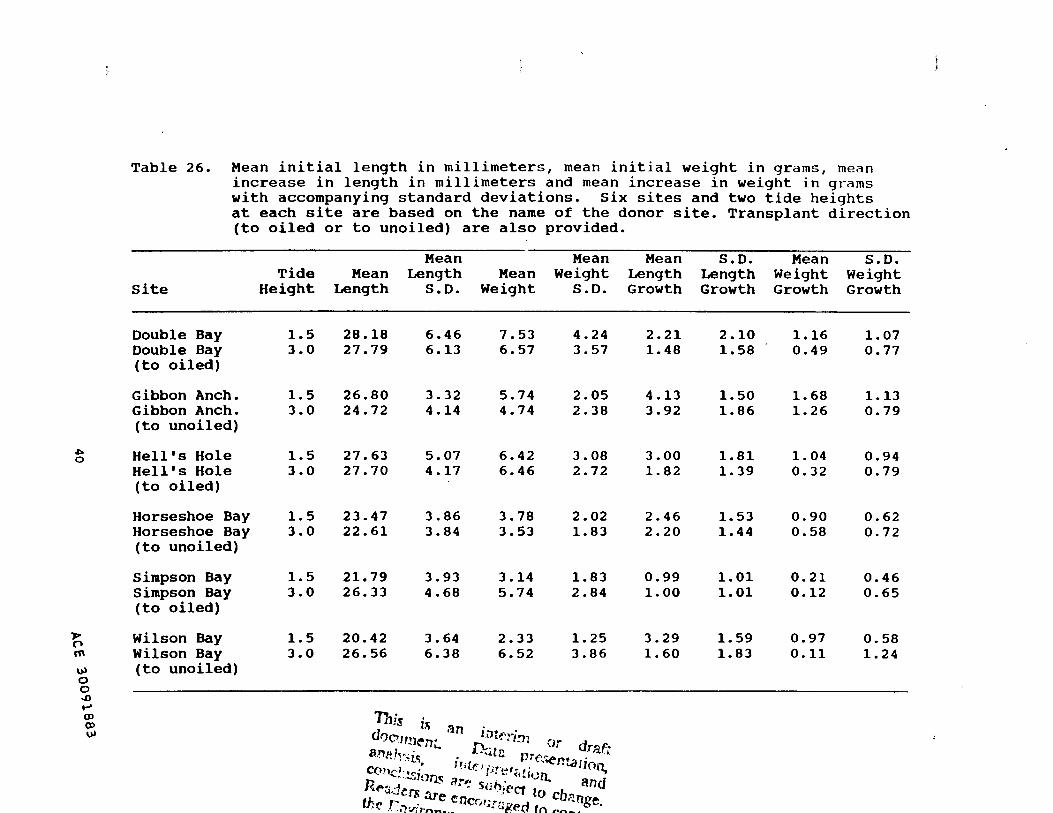
..,. 0
):>' ("l
"' U)
0 0 -o .... (J) (J) U)
Table 26. Mean initial length in millimeters, mean initial weight in grams, mean increase in length in millimeters and mean increase in weight in grams with accompanying standard deviations. Six sites and two tide heights at each site are based on the name of the donor site. Transplant direction (to oiled or to unoiled) are also provided.
Site
Double Bay Double Bay (to oiled)
Gibbon Anch. Gibbon Anch. (to unoiled)
Hell's Hole Hell's Hole (to oiled)
Horseshoe Bay Horseshoe Bay (to unoiled)
Simpson Bay Simpson Bay (to oiled)
Wilson Bay Wilson Bay (to unoiled)
Tide Height
1.5 3.0
1.5 3.0
1.5 3.0
1.5 3.0
1.5 3.0
1.5 3.0
Mean Length
28.18 27.79
26.80 24.72
27.63 27.70
23.47 22.61
21.79 26.33
20.42 26.56
Mean Length
S.D.
6.46 6.13
3.32 4.14
5.07 4.17
3.86 3.84
3.93 4.68
3.64 6.38
Mean Weight
7.53 6.57
5.74 4.74
6.42 6.46
3.78 3.53
3.14 5.74
2.33 6.52
Mean Weight
S.D.
4.24 3.57
2.05 2.38
3.08 2.72
2.02 1.83
1.83 2.84
1. 25 3.86
This ;, on inv.-c;, or drafi
doco ""~nt Dc.r~ I"''"'""' r ioo, an~:i~~.;ir;, iHF.IfJ!'~'<~tion. and CQ!Jc!usion, or~ '"~iecr to cb~nge. Rt-~ders are encr,'•rail~d tn ~--tht! T?r,v;· .... ,.. __ -
Mean Length Growth
2.21 1.48
4.13 3.92
3.00 1.82
2.46 2.20
0.99 1.00
3.29 1.60
S.D. Length Growth
2.10 1.58
1.50 1.86
1.81 1.39
1. 53 1.44
1.01 1.01
1.59 1.83
Mean Weight Growth
1.16 0.49
1.68 1. 26
1. 04 0.32
0.90 0.58
0.21 0.12
0.97 0.11
S.D. Weight Growth
1.07 0.77
1.13 0.79
0.94 0.79
0.62 0.72
0.46 0.65
0.58 1. 24
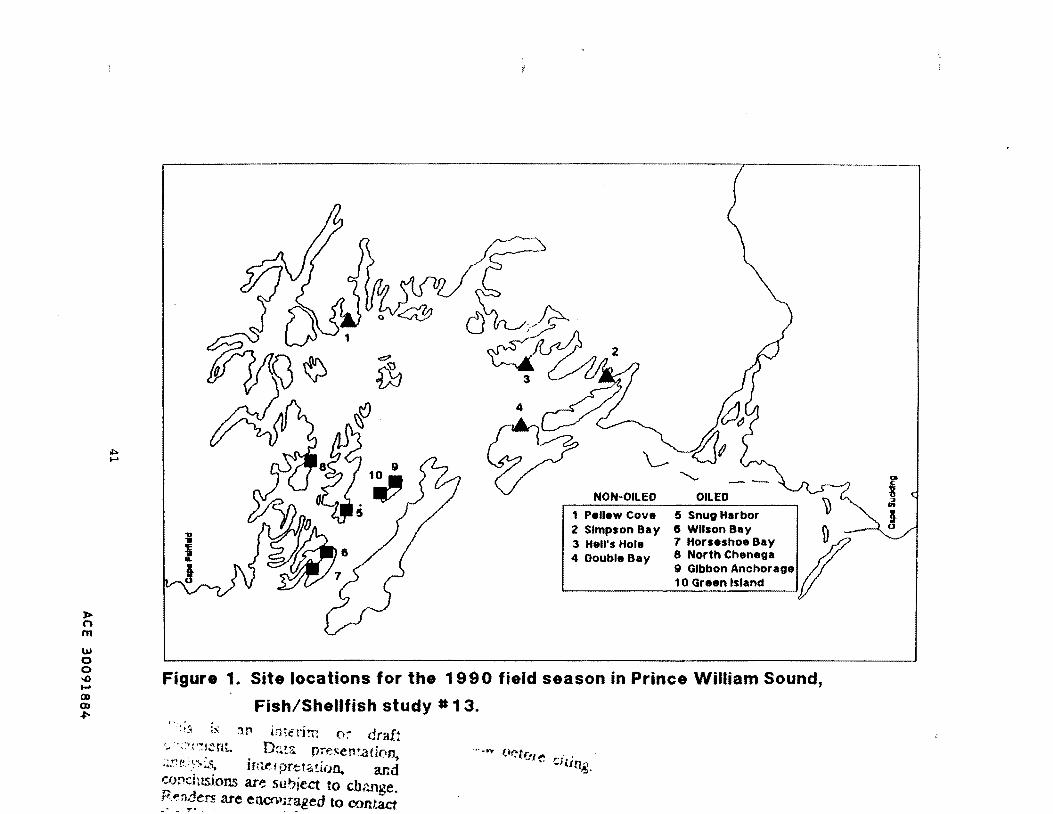
,.. n m
w 0 0 -o ..... Q) Q)
.f.'
ol>o ..... \._
NON·OILED
1 Pellew Cove 2 Simpson Bay 3 Hell's Hole 4 Double Bay
""'OILED
5 Snug Harbor 6 Wilson Bay (\
7 HorseshoeBay v 8 North Chenega 9 Gibbon Anchorage 1 0 Green Island
Figure 1. Site locations for the 1990 field season in Prince William Sound,
Fish/Shellfish study # 1 3.
;s :111 htc tim o:- draft '.- ·r.:'c''!l~nt D~~.a pre~en~..a!k•"-t -.:.nt~-~~-:·1..~ im~:rpr!!::tation. and conclusions arl! subject to cbMge. ,P.,..n.ders are eaCfmraged to cont.a.ct
" _, - -
.. _..,. oetf.•Je ching.
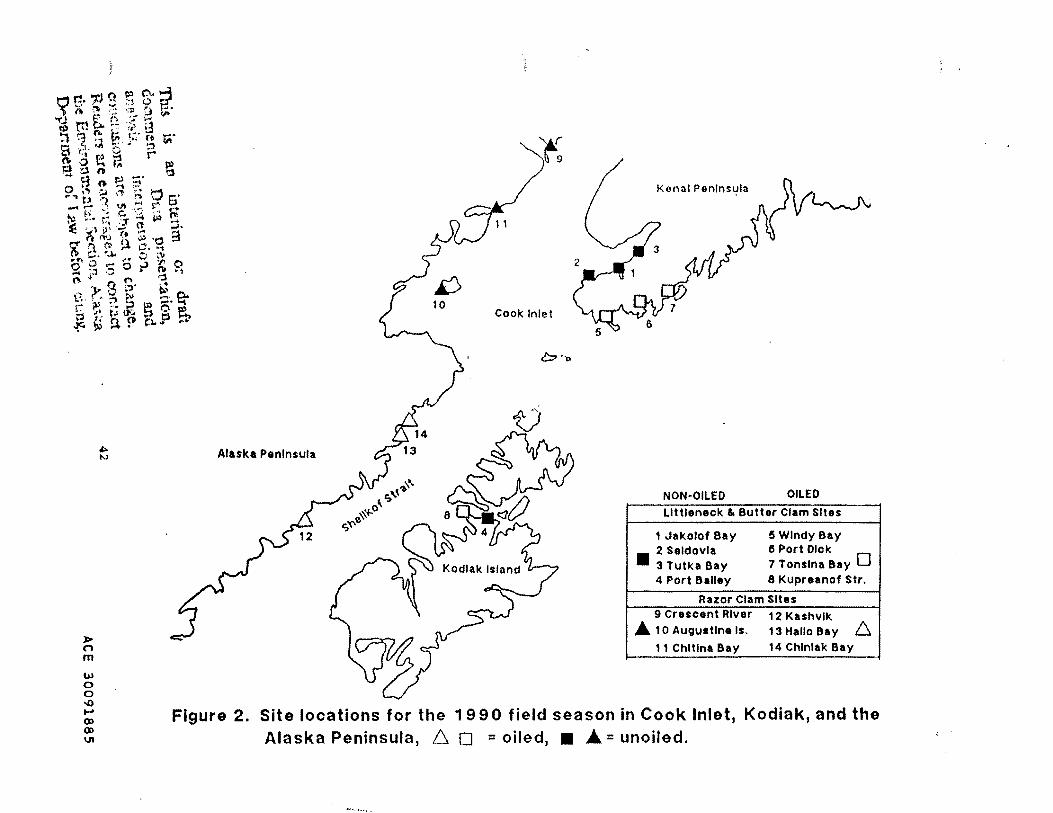
t'j g. j."J r-. r; ~ ft. '-},n,~-~:0 ~ tr' b. 6 '~ 8 ,;. . :1 •;:l ~ t;; ;-:. 8 !3 /.;. "' ;;•. •.. n ~-~dg~ f! ~- ~ , !,. SlO 0 s , ~ !':t' '::1 ,.., .. .... -..... u ';' ,,. -· jooOI - ,... -~ n \.I r::· .. t~ ;;. tit .":! t'' 0 ,;) ,.d "'"" c t .•• .' w'1 f ...
ti :J) ~\ 2 ~ ~ !.": n ~¥..:. '• ..., .-'· r;~a-~~-"a
... ~ ....... ..... ~- "'1
0o ... o'"
.... ;:s s 0 ~ ~ 0 ('!. f'\ ~ .,
., )' !l ::r" l..~ \ .... ,."-h. "" r+i\l;")t; .-.-g. t:~ r t.; u;:. g s· p.: ~ ~ ~ fl b .. P ::r
)> 0 m
tf>. N Alaska Peninsula
~ ,lj -9
Cook Inlet
b··o
Kenai Penln$ula
NON·OILED OILED
Littleneck a. Butter Clam Sites
1 Jakolof Bay 5 Windy Bay • 2 Seldovia 6 Port Dick
7 Tonslna Bay D 3 Tutka Bay 4 Port Bailey 8 Kupreanof Str.
Razor Clam Sites 9 Crescent River 12 Kashvlk
A 1 o Auguctlne Is. 13 Hallo Bay 6 11 Chitina Bay 14 Chiniak Bay
w 0 0 ..0 .... C» C» VI
Figure 2. Site locations for the 19 9 0 field season in Cook Inlet, Kodiak, and the Alaska Peninsula, 6 0 = oiled, • A= unoiled.
-~. h•,.
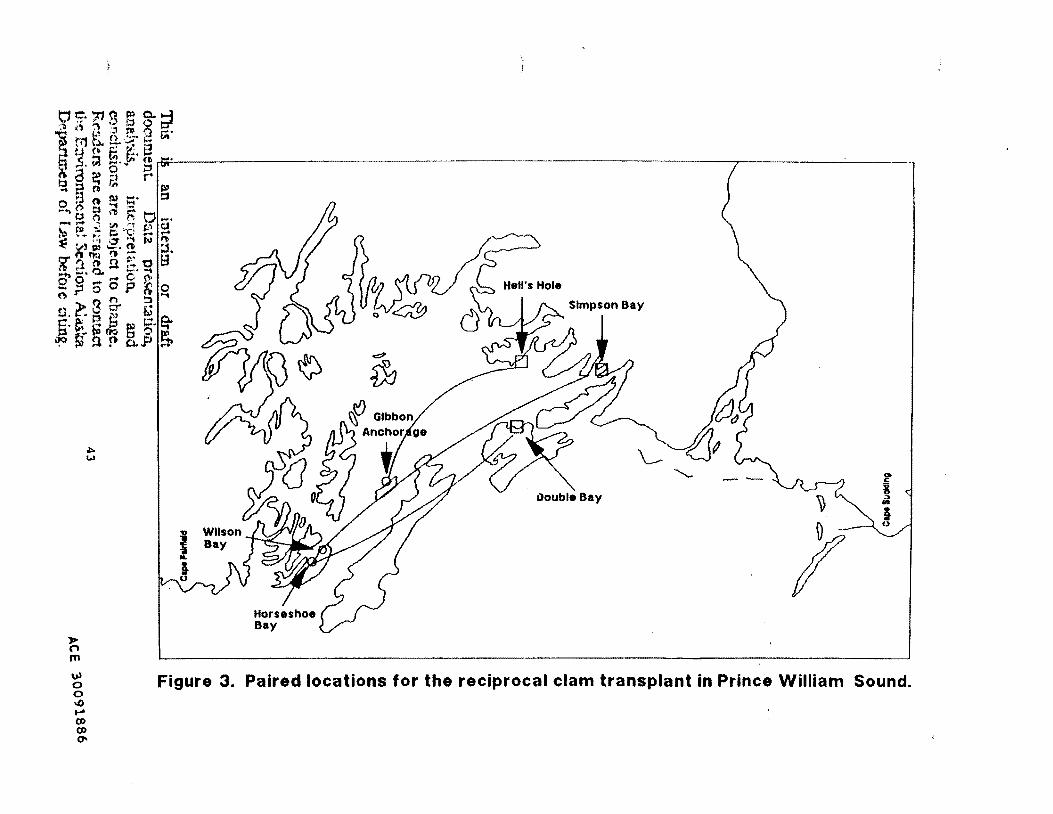
>• co c:: ~ __
_ ..,.K
0.. E
0
This
an interim
or
dra
ft docum
ent D~u
presem.atic,n,
amdyill,
intcrpret~tion. and
C!)'Jclusion.s are sobject to change.
Rc-;~1ers are enc'"~';:::-aged to C'lntact
t}:-!; E::!VironlTIC:.Jta: Section. A
las.ka D
t>.partment of i...aw
befm e citing.
43
. , c ::J 0
en E
('CI
3: CD (,) c ·- .. 0.. c ·-- c ('CI
-Q.
en c ('CI .. -E ('CI
(,)
-('CI (,)
0 .. . 9-(,)
CD .. CD .t:.
- .. 0 .... en c 0
- ('CI (,)
0 -, CD .. ·-. (')
CD .. :s a
')
·-LL.
ACE 3
00
91
88
6
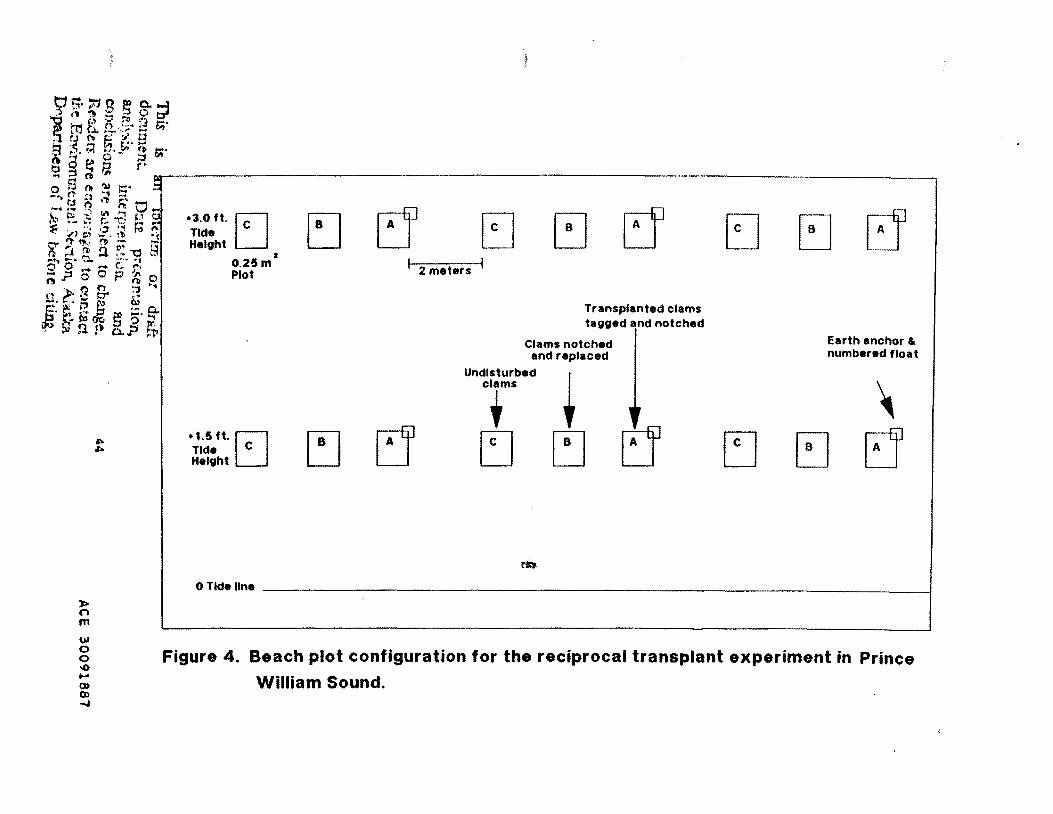
?i'~·~g ~ g~ ~l.J f...\. ,_ .,.,. -~ l-1ot f· (} ,••·4 ,., 1::;
b ('1; ~ ~.s
..... s ;! '"•.?' ~· :·~----------------------------------=~l o~· 0 ;::~oo
g g ~ ;;! r• ... ~ o ... n ~ s· ~ ... g g ·~ F.;' v _, r" j; :...) ..... .;T ,, tJ ,, ·- ~~ r=- ;-:1 r; ~ •3.0ft. tJ
Tide rJ B tJ ~ B ~~ ~ ,_,, f;>l .,;1, t'b ;j
~ 'I' f!l.) !'\). ~ ~ ... 1 !1> !l . .. "'0 '· r •"""" """'"' ""i ~ .. o· :: .... c. 11·'
::.?oOP~o n n ~ .,
f}~?~§" ~0. ~· "!. ii ~ g s· "" . !l $l o..P r;
)> ("''
m UJ 0 0 -o ... Q) Q)
~
,. ,.
Height I
0.25m Plot
•1.5ft. tJ Tide C Height
0 Tide line
c:J
I 2 meters I
[1
Transplanted clams tagged and notched
Clams notched and replaced
Undisturbed clams
+ []
~.
+ c:J b
EJ
[]
Earth anchor & numbered float
' ~ tJ
Figure 4. Beach plot configuration for the reciprocal transplant experiment in Prince
William Sound.
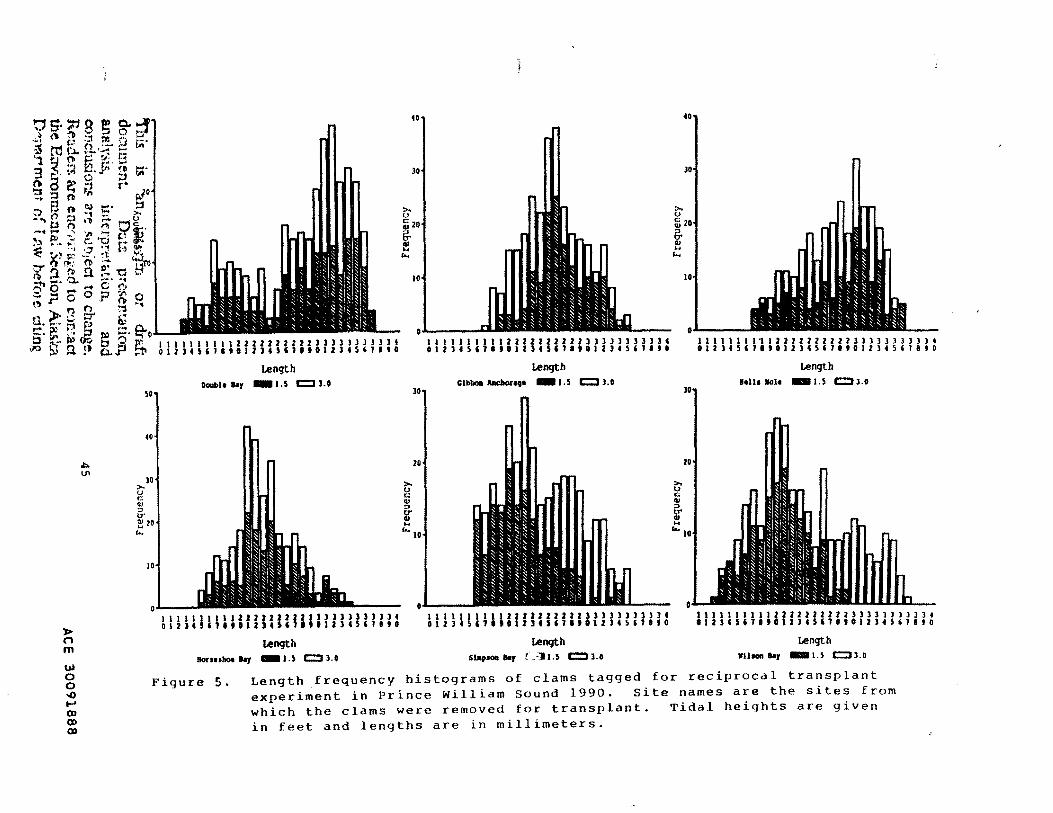
as-::t:~g~g. -~ ('\ ~ ':1 - # ··• F .• ... '3 t;;· ~ ~ i..i.. !l.·~:... ·1 ~- f.!' t;.; :~ ... e 3 ... ' t:l c;· ,r;; ~ ~ a ~ ":l r~ ~ :2 ri r, :::> s ... ~ ;::::· !"' () :J :.: ;:..
tJ n I'll ~ -· .......... t• :.-. ' P> - ~· ' ~ !'.;~ ,._ .. --. r~ '"Cl r• ~ •. , -:;r .... , '!:'! ~) ""~ ·- • ~t ~!) !'!'.· n- c-: ..... ~ f'Q .u ·- '0 ... -· t::l.. -.· .. 1 ~o .... .-.c<'J ::-.J:lo0?1) ~., n n ~; t'' > .~ ::r ,.; ;!· ~~ .. ;; rl) .. .: -· ~ , .• l::l ):1) ..... t:t'o..L.--.~ ty- ~ ~ 1:1 ;; 1\~ I I I I I I I I I I Z 2 2 2 2 2 2 l l 2 J J l J J l l l J J 4 • ;>.> ,._.. Q..r ~ OI2H!,11tti2J4Sillt01ZJ45UIIO
)> 0 m
"' Ul I
)0
tl ...
Length Double IIJ - 1.5 1::::1 J.O
111 n
I llliii11112222222222JJJJ)JJ))Jf OIZJ4S,llti12J45'llti12J4S'lltG
Length Hou .. hoe lly - 1. S 1::::1 l. 0
4C
)0
20
>. 0 c Ill ::> cr .. ... r..
11111111112222222222JJ)))JJ])J4 Ol2lt 5'llt012 l4S,llt012l4 5'llt0
Length Glbboa Aacllorate - 1 . 5 1::::1 l. 0
0"----11111111112222222222Jlllllllll4 0 I 2 l 4 5 ' l I t 0 I 2 l t S' l I t 01 2 J4 5 ' 1 I I 0
Length SlllpJOCI ... , L')I.S 1::::1 J.O
>. u c: Ill ::>
&' .... ...
11111111112222222222)))))3)))]4 112ltS,lii012J45,71tGillt5'l8t0
Length blla llole - 1. 5 1::::1 l. o
llllllllii2222222222JJJ))]]))J4 012l4S,llttl2JtS,l11012J4S,lltO
Length wu- ... , -1.5 c:::::JJ.o
liJ 0 0 -o ..... OJ OJ OJ
Figure S. Length frequency histograms of clams tagged for reciprocal transplant experiment in Prince William Sound 1990. Site names are the sites from which the clams were removed for transplant. Tidal heights are given in feet and lengths are in millimeters.
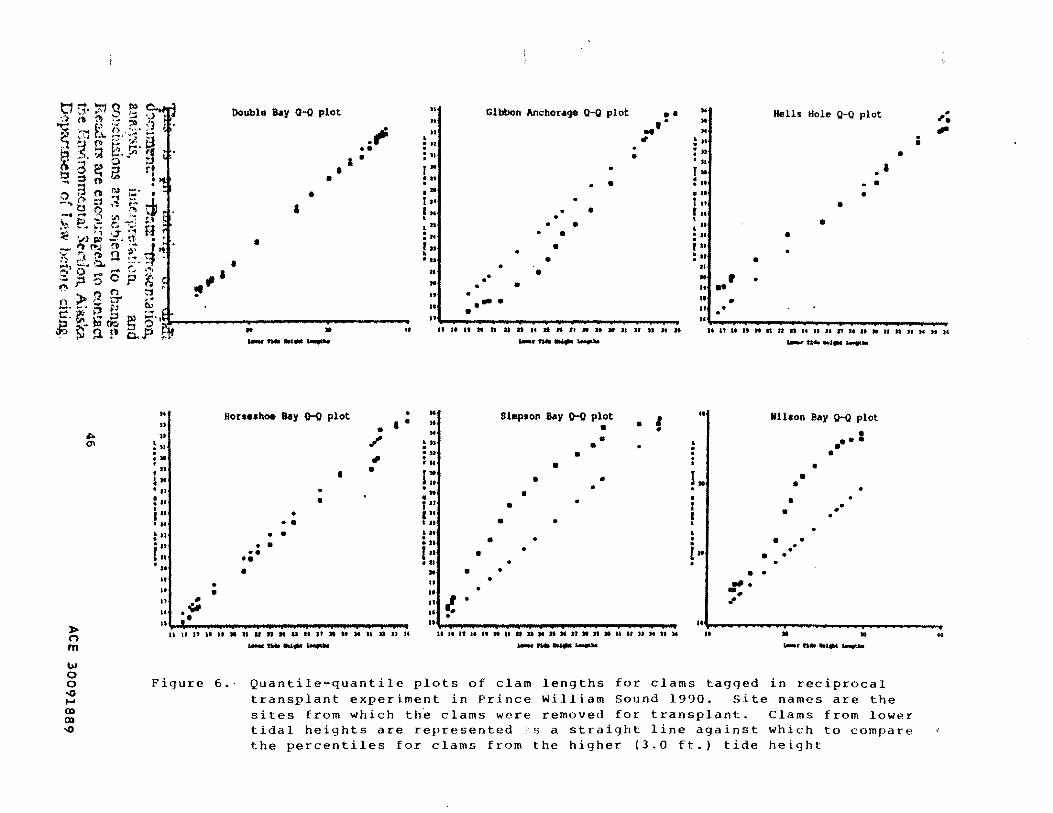
H r;. :r,; ~ e o., •· ·-~· (, 'r') ~ ~ ~;
~' - f (i: ··;;· 8 ~ :.; f-:- gl ;~~. il :~ !'"' t-2. _p: ,, e . .s. ~~~ o ;.1
i\ 3 e: :::1 rr 1::1 :s () til • .... 3 () 1",) r.:· : 0;... ., - ~ _,.., {\/" :1 , ..... "'.·~ tJo .,..,, -·s.;; ... ~.·: p ~ -· •~ e ~ R ~ ;,) ~ :?~ ~l . ~ - """""' !l ;).' ~ .. ~ .... - ~ ,... ... :)1 .:t o. n -~·. ~· o·. f""l' r~ )~· ;:._r::~SO?fl; ~ ()r'l ~ n>ccr ~
.,. '!'
Double Bay o-o plot
' •
I
• • •
·' •• ' . .. .. .. • ... .
: 1l
J'" ... . ... t.• 1 .. • ... : .. ,., • ... .. .. ..
•• ..
Gibbon Anchorage Q-Q plot
• . • . . • • • • . • • .
• • •• • . • . ....
•
•• .. Hells Hole Q-Q plot . ·•'. .. '• .. ~ , !u ;
• : .. • • ' .. l• . ' : .. . • • •• • r •• I •• • • • . .. : .. • , ..
• ~ .. • II .. ' • .. •• .. ill .. . • u 2: ~· ~ ~ e: s·. •
t:J ~- ,., ~ ~ fl'l". .. ~ ;ll !1. !' 0. .P ::tJ -- .... -
.. 11 •• u • :tl n n " 1t H n a u • ,. u JJ J• n .. .......................................
)> 0 m w 0 0 -o ...... Q) Q)
-o
"' "'
-·--- -.......... _ .. Horaeahoe Bay Q-0 plot . .. S1•p•on Bay o-o plot • • W1llon Bay Q-0 plot u I • .. • • ' • ill u .. • ;,. / ~ .. • • • •• • . : • . ... • • ... ,. • .
t I ll • • • ... • • 1: I .. ~II • • • • • ... • . . • . .. • : .. • • I • • f" • • t • I • , .. • I" I • . ... • • ... • .. •
~u • • . .. • . • • • • • ... • • ... . . f,. •• ! .. • • 1 .. • • • •• • II • • •• • .. • • • . If .. . .. . • It • .. • ••
11 i/1 11 1.. • "' II ·"" " • • u .. II
u u ll u lt 11 at u n H u •• tt 11 tt M It u n u ............ ,. ...... " ..................... .. .. .. __ .. __ ---- ._. .. n .... •~
Figure 6.· Quantile-quantile plots of clam lengths for clams tagged in reciprocal transplant experiment in Prince William Sound 1990. Site names are the sites from which th~ clams were removed for transplant. Clams from lower tidal heights are represented s a straight line against which to compare the percentiles for clams from the higher (3.0 ft.) tide height
••
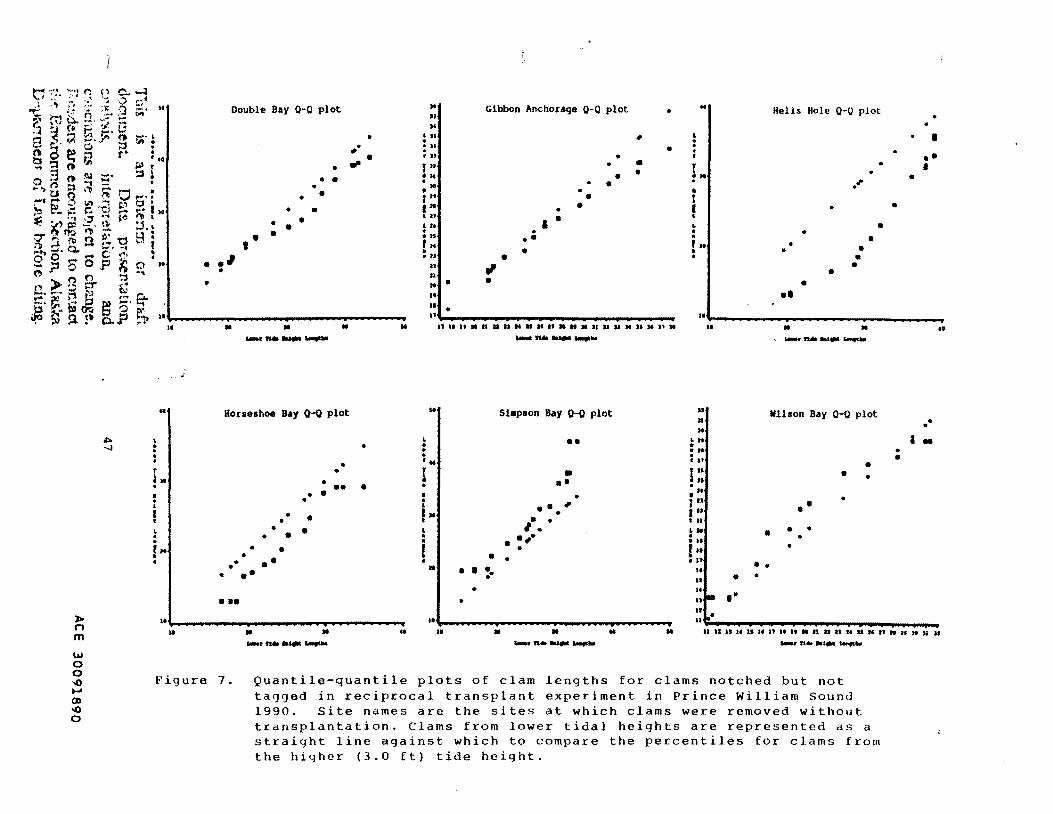
ti ... , .. ,r:: e ~ ;:1 ' .,. ;· t . ~. .I -...._, ..,, H
' ., ~, .~, l: ') t;,• ...;:; . :..~ r·"} "--:·;._ ~ m t... ;::;· ~.~ s (..l !'.J (II !;; t;; • (J (j;• ! ' s :A --:· v ;:::, :
8 t;· o r• • •• gg~~ ~I ... s n ~ s· : ?., (') :.; ,,. ft u !"':';
tJo ..,pol -· e Ct ll' ''C' ..... .... )0 ' .- c:. ~"' .., • ~ - :".j •:1 ;~ :J. ~ ~ • ~ IX! - • ... l1 • .., !'!"..! ~ ~· 'tj D i
7 !1 ,"1) ll !:. ... ' :) ...... Q. .... c ~· . ,.
Double Bay Q-Q plot
• • • •
• • • •
• • • . ' •
. ·' • •
o .. osoFl)Q ;.? 0 1
..... ~t:r c.;~ ,.. ..... ~ ....... u .•. " ~ -· • "'· !:' 10 .. g: ., .. .. • • -~ ~f ~ ~~ Q... p ~ II ._,--
•• Horseshoe Bay Q-0 plot
,.. L -..I :
• . • f • 1. • . •• I • • . • I
r • • • • L • • • • • . !" • • • • • •• • • ••
•••
• ,. • .,.
..
•
•
·~~~ .. ~~~~ .. ~ .. ~~~~ .. ~ .. ~~·
:• Gibbon Anchorage Q-Q plot • .. ~ .. "' . : ,. • . .. • P' . • :n • •
• • ... . I" • •• . • ... • ... I • • . .. •• r .. • • ... • " " •• .. • • .. ::, .
J I I • • • n IU U Ill II D D lK II H H Ill It M II P P M SO Jf I' M
.. • • . • ... I . I • 1 •• • • . • r • ..
----'" Si•pson Bay Q-0 plot
••
• •• • . . ,
• , ... . . , . • •
• • • • •
•
•
··~~~~~ .......... ~~~~ ............ ~'1r
••
L . . . • L. .
• . . r •• ' .
II
••
It
II ,. . .. • •• . . .. I" II . • •• , .. ... I II
~-. ... r II . .. .. "t
• .. II
,. u u .•
Hells Hole Q-0 plot
·"
• • • • • • • • • •
• • It • -·---
Wilson Bay Q-Q plot
• • • •
• • • • • •
• • •
•
•
• •
• I
• • • •
••
••
; -
)lo n m II It It •• -·---'" •• " " .. ........ __ .. UUUUUIIIIIIUMHHUitUIIUNHMIIU
._. ...... _ ....... '" w 0 0 '<0 .... ())
'<0 0
Figure 7. Quantile-quantile plots of clam lengths for clams notched but not tagged in reciprocal transplant experiment in Prince William Sound 1990. Site names are the sites at which clams were removed without transplantation. Clams from lower tidal heights are represented as a straight line against which to compare the percentiles for clams from the higher (3.0 ft) tide height.
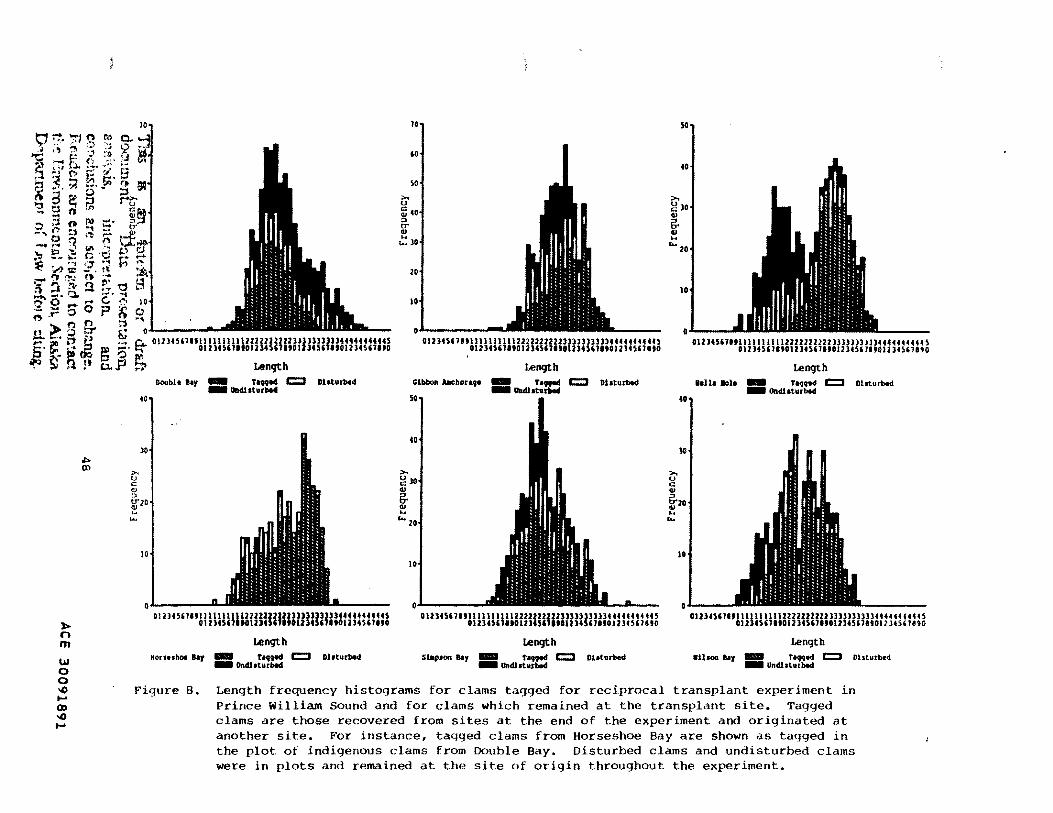
He. ';:'J t:'! !I' o.. 3' ;, 1 '5 :; ?
"'!:;;~ '":'! fi ('; . ;; . ;:! ~;' ('-.. :..~· !;.
' ':1 ..., t;:; r.;:· .... ::'1 ~ ·~· :A " 3' .. 0 • ~o~?n 0 3 til f\) :::;·
n "1 -. -- .. Q ~ ·~ h -· ...... :.J "' .:....! ~· !:'_ ~o.": c ·o ~ • ... •';! ·~
'A~:: -. t" ~ ~ !?.J (t ~-; :=s :::. !'lr 2 . .• "0 ~- .. J::t.. ............. .... 0 ..... c .. , :::._~ooP~o
11!111! 11 1H 1: i: n ~ i: 'II
"' f".l n ~ ·~ t >ot:r .. o' ·-g. j;;'., ~ ~ C... 012lHil19111111111UZ222222UlllllllUlU44444444S
I . ::: :·' I . U H~ !: 1!: 1, 1.1 ... : : ~ : . ! ~ . . . '
~· !>"~ fi dQ ~ ~· "1 OUltSUUOUl4SUitOIU45UUOU34S6lUO
.:) ~ ~ !• o...P ~ Lenqtb
J> (l
m
40
"'" m
D..,bie lor - Ta99ed c:::::J Dhturbed - Undl.aturbed
-
01214 SUI II lllllllii222UZUlUUUUUl4444444 t44S 012l4Si11t012 JUUIIOIUUUI IOU l4 5i 1190
Lenqtb
- Ta99ed c:::::J - llnclhturbed
Dlaturbed Hors .. hoo lar
~j I so
ldj ... 30 • 20
10
OUlUnettllllllll 1222UU2Ullllllllll4 4444444445 0Ul4S,llt012J4Sillt0Ul4SUUOIZH5UIIO
Lenqtb lllbboft Anchorat• - Ta99ed c:::::J Dhturbed
- llllcllatlltbed
>o g 30 Ill
& Ill
'"' ""zo
10 n
0 Ul4SUitlllllllll 122UU2U2llUUllll4 44 U44 4 445 012l4SUIJOUJUIJitllU4SUUOUl45UUO
Lenqtb
St..p,won llaJ - fa99ed c:::::J - Ulldlaturbed
Dlaturbecl
50
40
>o g ]0 Ill
& cu ... ... 20
40
lO
>o u c Ill ::> lif20
'"' ...
10
OUJ45UUIIllllllll22222222lllllU3Ul)444444444H 812l45UUOUHSUUOU 345' 119012345' 1190
Lenqth ••ll• lol• - ra.,.,ed c:::::J Disturbed
- llncllaturbed
OUJ4S,1Ulllllllll U22222U2HlllUlllH444H 1444 5 OUlUUitOU 34SUUOIUtSUUOI2lH' 1890
Lenqth •u- ear ..,. r • .,q... c:::::J
- Oncllaturbed blsturbed w
0 0 ..0 .... CD ..0 .....
Figure B. Length frequency histograms for clams tagged for reciprocal transplant experiment in Prince William Sound and for clams which remained at the transplant site. Tagged clams are those recovered from sites at the end of the experiment and originated at another site. For instance, tagged clams from Horseshoe Bay are shown as taqged in the plot of indigenous clams from Double Bay. Disturbed clams and undisturbed clams were in plots and remained at the site of origin throughout the experiment.
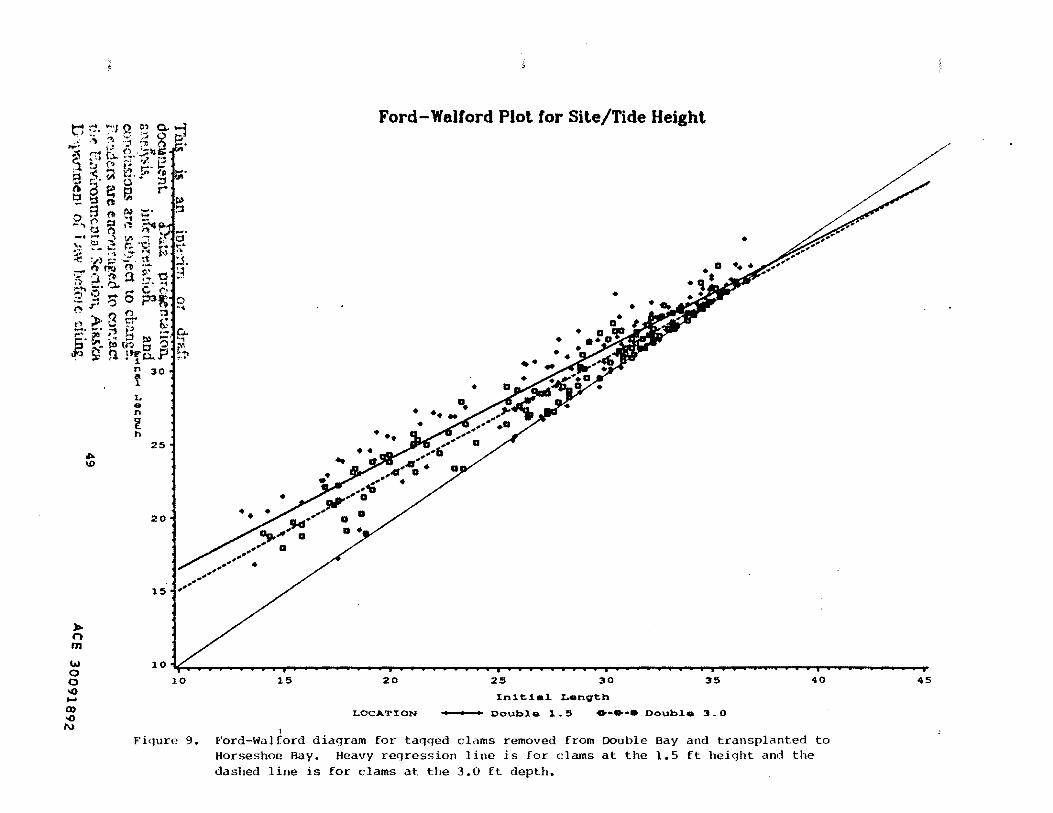
t'1 ::. '7'1 ? ?.? Q. --4 .,:; .... ~ ~s ~ ~ e: ~ ,.~1 to: (i . .:;:;,.c ~ ' .• t ... ''!'' _, .... . :1 ~· ('> ~:. '.1· lj ~ ~ ~ b. ,.t:· ,,. iliil•
~a· e: ~ ~ _':io 0 a 01 rOJ ::::· -.... ('> ::1 .~ -:=....
t). ("') • "' ...
.::• ;; ~ VI ~ "l ~-' *.... ... ... \.:.. e '=~ ..... ..... •'1 i~ •1 .,., < ,,, ~ ...:: . ~t -- ,., f'?Q (t ~"':" '""> :::&: :"'I !l ~ .. 't1 ;..,., ..... ~ ·-·· •-t .... ,., ....... c ~· :-:..;: -::> 0 ?3~10 ~ 0 ~ ~ ..
{' > 8 0" ~· -· -·· .... t:j'" WJE ~ ~.. ,._ ,..,_ E;'e: -~ 1:1) -· "i ,jQ ~~ f!' (¥:1 ~ ':':) ~ .~ ;» fl. !tro...P ""'
)lr. 0 m w 0 0 -o ,_. Q) -o N
~ ID
n 30 r L • n
~ h
25
20
15
10
10
Fiqure 9.
Ford-Walford Plot for Site/Tide Height
•
•
••
15 20 25 30 3!5 40
l:nJ.tJ.al. Lanqth
LOCATl:ON Double 1.5 •·•·• Doub1a 3.0
I Ford-Walford diagram for tagged clams removed from Double Bay and transplanted to Horseshoe Bay. Heavy regression line is for clams at the 1.5 ft height and the dashed line is for clams at the 3.0 ft depth.
45
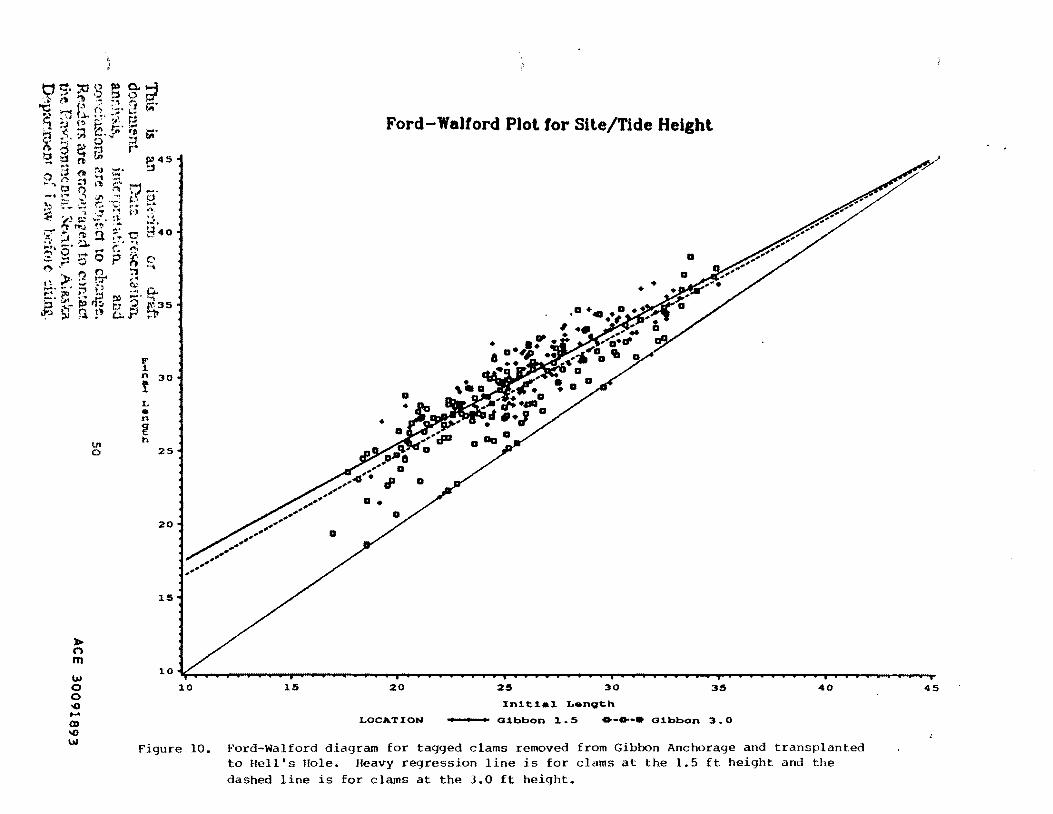
S'~·~§ ~ g~ "C: ;.-,.~ !· 0 ·-· .:• !<0 ::J ;..':' c~ :..~· :; r.i '1.;J( ~-·'-". ;... ,; :"' 'C ~ 'P -· 1:;.1 •.• ';!'! .. ·~ -· b'l 1'1> ~· :;..I ..
-~~P r· ~ ~ n ·" s:."45
~~ ,.. ~,.) ~. ~ 0 ~ lo.H' ~1 ~ ~ .., " ::1 ,,. ,., H
0 (") ,, :( -· ;:· _; -~ rp_ ·1:; ~-- q ~ ·- ~·• ::; .-; r; ::~ ~ r,, ~ ._;: ~ ~\; 'f ~
,-:;;.--, f!"..t !t- ~'-: ~·40 --.;..J,:'l>!l,.,.'O~·· ;.\ _:. ~ "-'• ... ,-,•o ,...r'.-r.· .:=.;::oO.?~C'J ('lo·. f')O :;-,""'
' ·'b~ '"""'- !7 .... ~. !:". - ., (;,.: ~ ... "" i:' !..., •• , c... ~ .. r.; .,.,. ......, IX) ..... ~-0 ~-~ll:;, r;,? j.\~35
i!'> hi Q !' (;.l. F ~
;to. n m
U1 0
F ;1. n 30 r L • n
~ h
25
20
15
Ford-Walford Plot for Site/Tide Height
w 0 0 ..0 .... ()) ...,
1 0 1(:, o o u s u u c e ; o a ; c o • u c u ; e u u a o e u u o 1 u e s u ; e e a a 1 e u s e ; u u a t o o a u o u u o ; 1 o e u e u u u e e 1
10
w Figure 10.
15 20 25 30 35 40
Xn1.t:l.a1 Lan<;Jth
LOCATXON G:l.bbon 1.5 •-•-• Gi.bbon 3.0
Ford-Walford diagram for tagged clams removed from Gibbon Anchorage and transplanted to Hell's Hole. Heavy regression line is for clams at the 1.5 ft height and the dashed line is for clams at the 3.0 ft height.
45
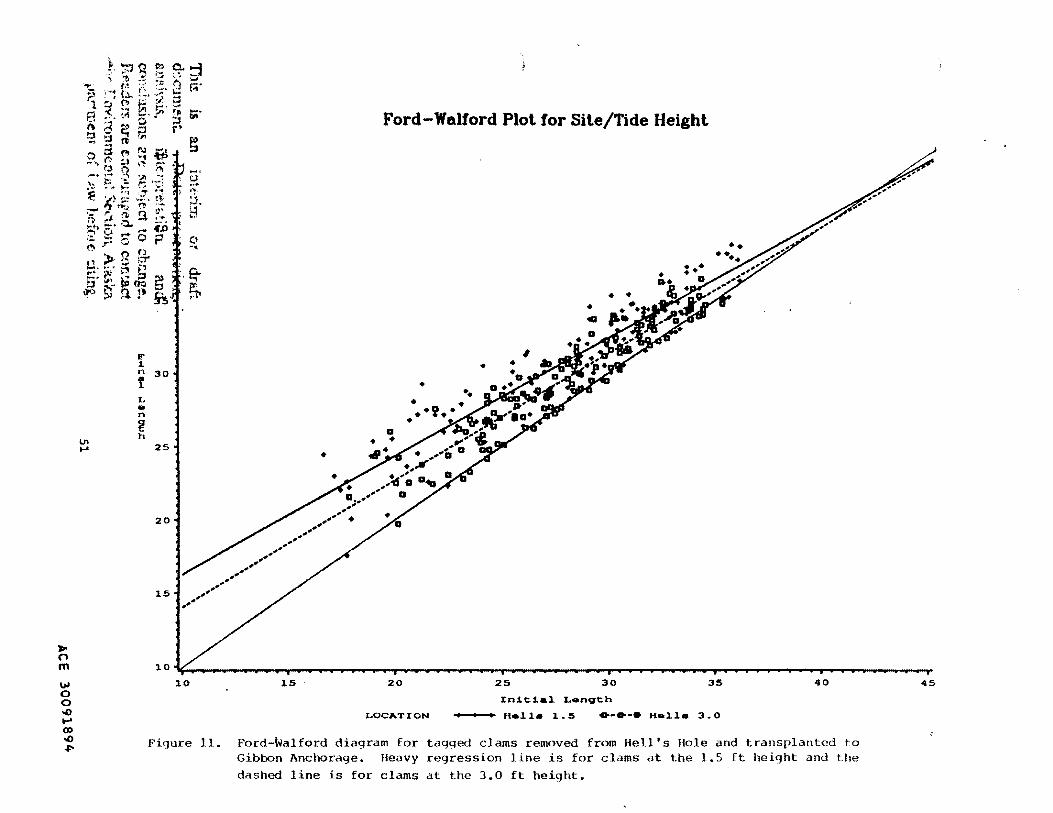
,. n m w 0 0 -o ..... (D
-o
""
~~l\'0..~ '·41' t- •'"'
'"t. . ~ :-.~ ~~ (·~ , <-:' • ;! b. r: . .:::·· J e:; • l :".J ~ .~· ~~ ~ ;-. ~ ""' l:ii r.: . ... d --·. >"i ..... ?" ,,. ;;· na .. ,o ;:1
!:::S ·~ c::t F.! r• -.. .... n ... o~t"!~~·~ ,...~ t~ :.t ,.,. ~ ~ -· ~·'fl ~ ~ ~ .-It
~ ~~ !-~ ~ ·;~ ;! . ~,, ~-= .:.:: • t\ :~· :- ~ ,.,...,~ n• .... :J.
:~ ~ ~ !l ~· ~ >-tl -· ;':l,. ~. '"'' t:'O,_.,...c;o ;; ;: -:1 0 p ,, t' > r.1 g. .• 2: ~~ 5 r~ !::1 IF' ~ .. ;:I :» ..r ... ~- . ~ 1::.1 ...., . . n
F .t. n 30 f L • n
~ h
·.~
ffi.
U'l 25 . ~
20
15
•
Ford-Walford Plot for Site/Tide Height
• •
, • ...
10~~~~~~~~~~-P~~~.,~.-~~~~~~~~~~~~~~~~~~~,-~~~~~~-r~~--~~~~ 10
Figure ll.
15 20 25 30 35 40
J:n.t.t.t.al. Len9th
LOCATION He1l.• 1.5 O•o-•• He11a 3.0
Ford-Walford diagram for taqqed clams removed from Hell's Hole and transplanted to Giblx:m Anchorage. Heavy regression line is for clams at the 1. 5 ft height and the
dashed line is for clams at the 3.0 ft height.
45

-:--gl"lc:i....:l ': .' :;J' .:-.1 ~ ·'."l ·~) .,_j •, ~ .~ '' ;, {; P-. ~ ,_.. h . ·:;:" .: (,1 ~ ~ u. . .... ' -41 5 1 b f" ;~ ~. !..1 .·, < :., :::'.!,. .r,. ... J::! •.• ~,.~ ~J~
,<ji d ~ ~ r· ':l l:l !1> ,. f." ... 8 r~ eo! t::· ;-,
0 "" ;;) 1 •• , --. t:l 0 •'t h," ,., (L. ...... ,... ........ Vt ':~ ~ tJ ""' {".)' ,..- c ·~; :-... ....... .... lito~· t ,..,. .. ~ f'j ·~· ~ "'/} ~'! ~·. ~-~ ;J. r-<- "'!: rr..: "' ... 1-1 ... j ~ .Q. ;-.... "0 !. .. ;:., ~. ~:l. c·:. ~ s Si ..... 5 p ~3. ,... .r- 0 n ..• .. n :-;
...._ ~ r- ;, (j ..... ...; ,, 0.: ' • . .. .. ;:;, f' ·-· c.._ ~- ~ ~& ~ ~· ~ ~ ~f n !' ,; jJ ~
:1 n 30 t L • n
~ h
U'l 25 "'
20
15
I
Ford-Walford Plot for Site/Tide Height
, .. , .. ., .. .;;*'
•
•
•
.... , .. , .. , .. ....
. ,;.,"";"'" . .,•" .... .. ..
- ..,., #"'
~ n m 1 0 "'i(:'o' 1 u e u o e e o a t o o o u o e e 1 e u o u u a u : 1 e o a u ; ; u e ; ; o o o u u t e o e a o u o 1 1 o o o e u o c o u 1 w 0 0 ..0 .... Q)
..0 VI
10
Figure 12.
15 20 25 30 35 40
:tn.1.t.1.al. Len9th
LOCATXON Horae 1.5 0••·• Horae 3.0
I
Ford-Walford diagram for taqqed clams removed from Horseshoe Bay and transplanted to Double Bay. Heavy regression line is for clams at the 1.5 ft height and the dashed line is for clams at the 3.0 ft height.
45
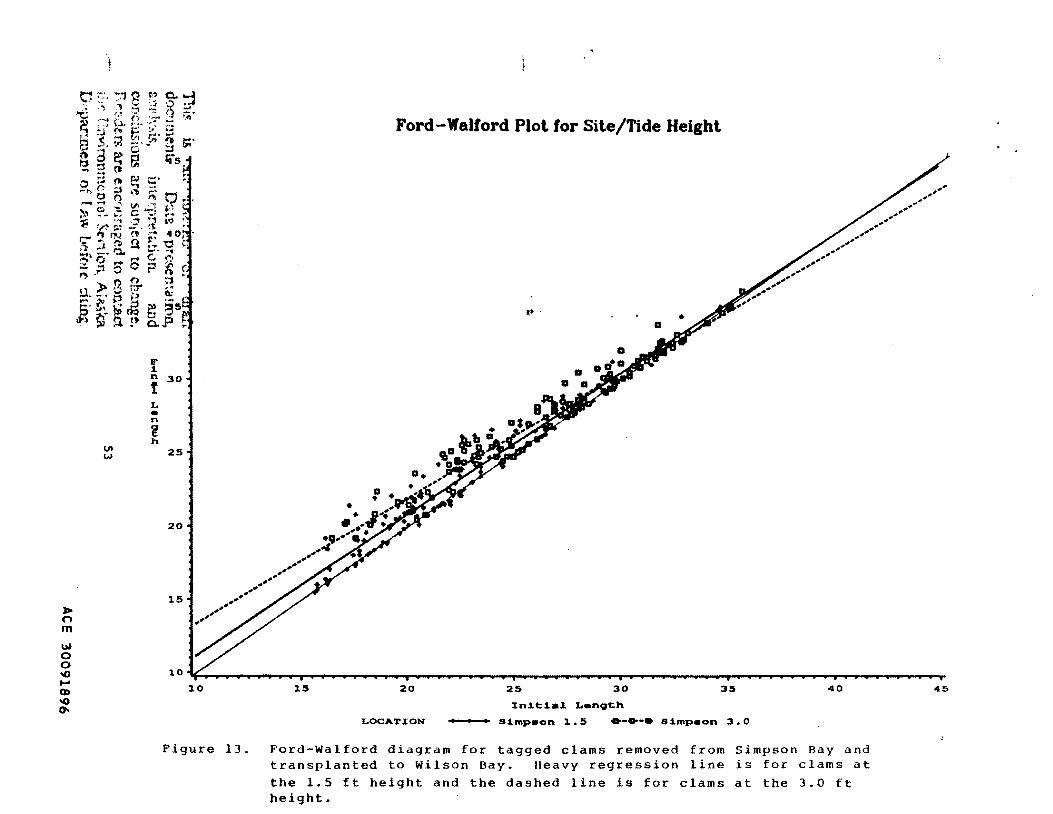
~ n m Ul 0 0 .., .... CD .., o-
t;:1 ;·•. -::1 8 f:' 0.. ~ -, :~ :-l ~ :2 9 :;.. "'0 ~~ ,, "'~~ ·;:) ,_ ..
'JJ :-,_, (~ (; . ·-;:- .:.. ....
G ; J' ""'> i:r ~,~ r..: '~ .... ;.., t'> r:;:· ..... !:'l ·:-. ~ ••• Y' I) ..... .... -· 0 ;::., llO'I
g S e; fl G'"5 _.. . ....,. (')
a t1l ~ r::· 00,.. ,_. ....... ~~··.,""-~ ..... () ,... ;-- b -2 tl\ ~ ~- ,. •"'' ...... ,. .. c .,.~ ..... ~ ~ '!r. ~ :.?. ;~ '"\) :~ r-""' IN ~ ~'! 40 ;) ;,;. ~ !l ::. '9 •. .... , -· ,... ,. . .... 0 ......... , ... fJ ; -~ 0 c ? if) f.
~"-f) -;-, ,, " 0 !:T' ~~ ..... -.· p p Q.:
f;· ~- ~· ~ ~ ~5 .n ?'!' t t t-i . ;p • • C.r r
F .1 n 30 t L • n
~ h
V'l 25 w
20
15
......
.... .... .... .... .... ....
.... .... .... ....
Ford-Walford Plot for Site/Tide Height
, . • • .j
.... ... •..... ...,.. ., ........ ...... 4
~
.... .... .... .... ....
.. .. .... .. .. .... .,. .. .... .,. ..
.... .... .... .... .... .. ..
.. .. ...... ....
10~.-~-P.-~-r~~-P.-~~~~~~~~~~~~~~~~~.-~~.-~-P~~-P~~-.~~-.~~~~~-.~~-.~~ 10
Figure 13.
15 20 25 30 35 40
:In.1t.1al. Lenc;,rth
LOCA'I'J:ON S.1mpaon 1.5 •·•·• S.1mpaon 3.0
Ford-Walford diagram for tagged clams removed from Simpson Bay and transplanted to Wilson Bay. Heavy regression line is for clams at the 1.5 ft height and the dashed line is for clams at the 3.0 ft height.
45
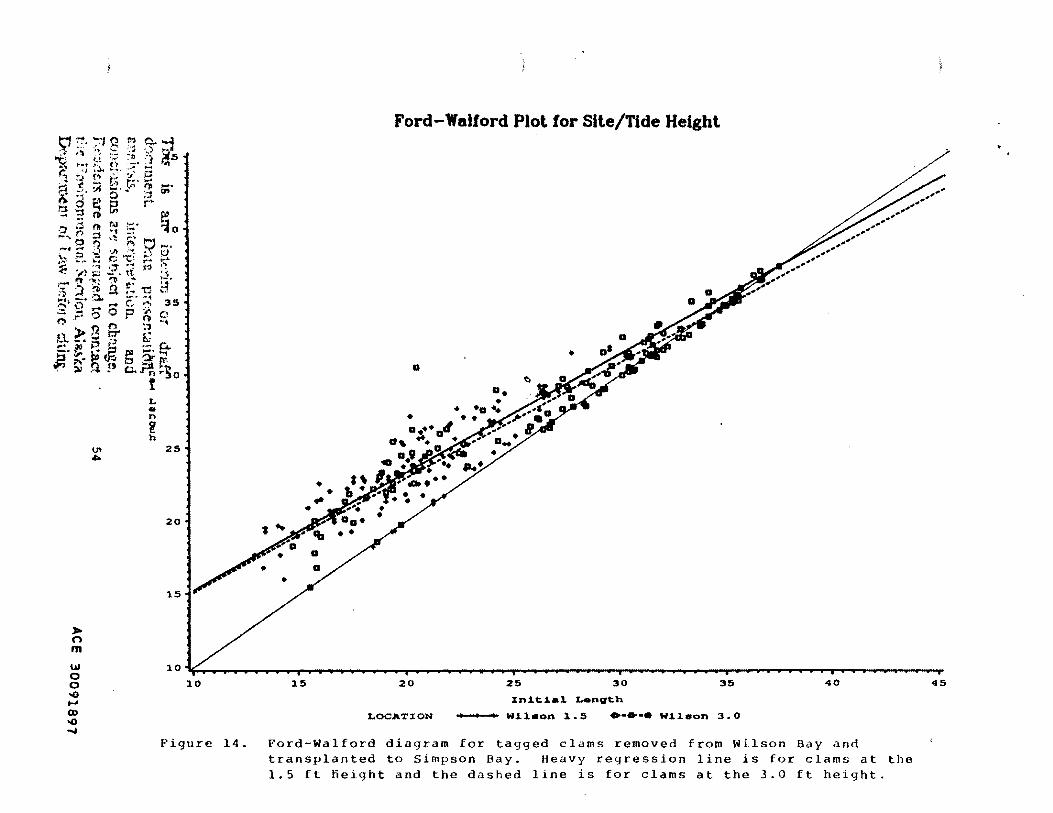
-'"''In\"" 0..:::1 H ... - C · . ..: ·.) Os ~· ;~ ~'· ::.:: :1) '] ll --c -· ~i n. :~~- a .. , ' ~J • ,.,, "J. ...
~ :'J ~ t:; ~~- ~ r;;· . • t :-1 --. '•J
~~re;~ r• I':S ':'j t) ~0 - ~~ r"' t::· 1
:;!; I'! •t -· ·':1 n :.1 •'t ~ 1."'1 -· ~ ... 0 "l .:.. ;r 1;:.1
-· ; :j ~ ·t:! r~ ~~ "~ :..~ ... ": ·.;;. ·~ ;(? -~ ,_.. '1: ',..- tt ,..,. .. ~ .,} ~ ~- 4 ~ ~ ~ ~~ n f~ "'0 "'" ,_ ;s ~ .... !.... .•• 35 ;} ..:.. ~:l....,. G ~ ~· 9 .... 0 p 1) ~4 ~r•O • ., ,. n ·•
....... ~ t=r' c.; ff ,. """' .. ., -U.~ • .,& ;... ,..~ .. ~-:lr~.
""ilt ;.J ~ .....
I; .,.,~ fi n o. ~ ,.. o if>;~.~~. f
> n m
VI ...
L • n
~ h
25
20
15
Ford-Walford Plot for Site/Tide Height
.... ..... - . .,.,. ,. ... ....
• a
a.
I • 'lfll •
.... .. .. .... .... .... .... ....
.... .... .... .... ....
.... , ... , ..
w 0 0 ...0 ..... Q)
...0 .....
lO'F~~.-~~-r~~~~~.---~~~~~~~~~~~.-~~~---.~~~.,--.---~~~~--~--~--~-r 10
Figure 14.
15 20 25 30 35 40
:tnJ.tJ.al. Length
LOCA'l'J:ON WJ.l.aon 1.5 •·•·• WJ.laon 3.0
Ford-Walford diagram for tagged clams removed from Wilson Bay and transplanted to Simpson Bay. Heavy regression line is for clams at the 1.5 ft fieight and the dashed line is for clams at the 3.0 ft height.
45
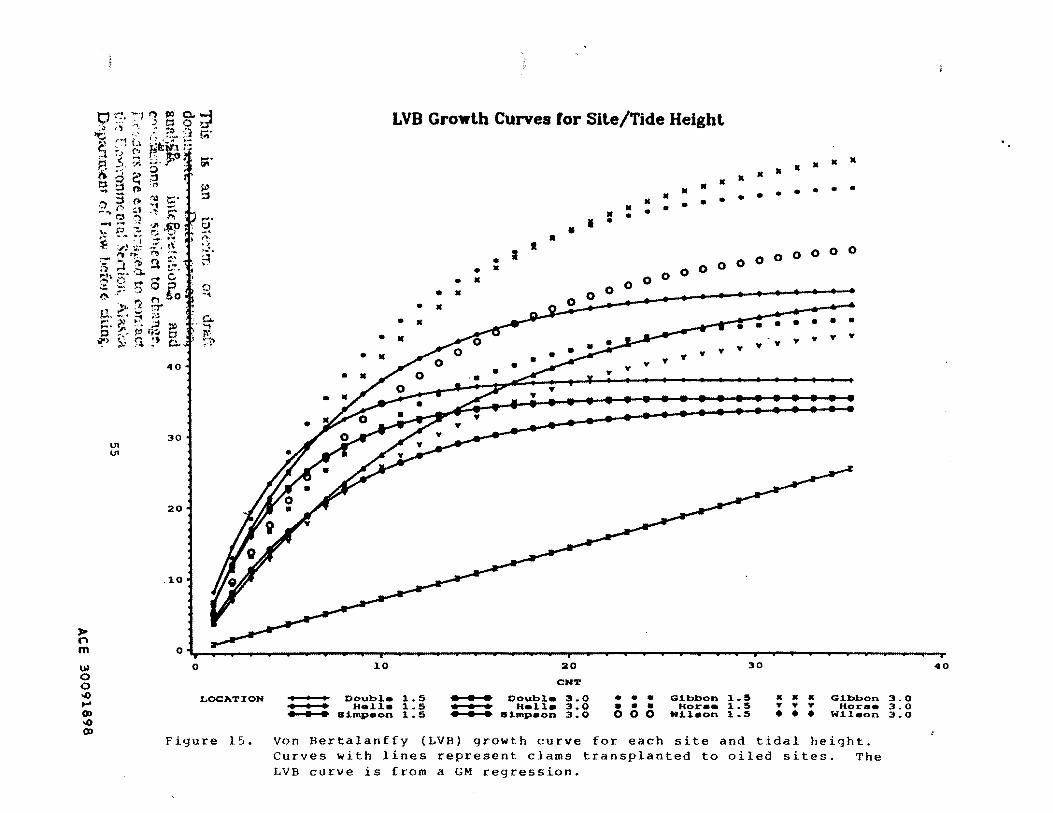
~ n m
'-"» 0 0 -o .... CJ)
-o CJ)
0 ':"!. -·j I") 1!0 0.. -1 ··~ ;) :,, . -?. (:j 9 'l'j
..... •.' • :0 '· j ·~· ':" , .. 1 .. c~ . ··:r "- v:~ ;.'! ;;. ' ~; ti .. ·t:jh ;· ::l . -> r~ !W :.1 a s_ :;. ;..:. • ~~ ~·
3::;$;.•5 l:S Cj .., ·1'1 _, - f) ::s fit ;";) !:;:: • ? ... ~ =.1 ~~ ;::... (";) .:") , ro,
~;; ~ ~ ,fiP f._. - ... :--:; ;.. ·~ f ._,} ~; -~ . !\ ;-~~"t-.. ':"0,:" '};...!~!l ... ~· .s· ·~,....c.· .;::. ·~ ..... 0 ~ - .r ? ,_. . n o u..l'-3?" :::~·;:;;; p !'- ttl (j:, g ~) ~ n !' o..
Vt Vt
40
30
20
.10
§
§' .... ,:,
~~-, ..
0 -.. c..
''"I
e:;. ,..I •
LVB Growth Curves for Site/Tide Height
• II. • II. II. • II. II.
• • • • •
I • • • • • • • • • • • • •
• •
•
•
• •
• • • •
I • 0 0 0 0 0 0 0 0 0 0 0 0 0
0 0 0 •
• • IC
• •
... ... ... ... ...
• • • • • ... ...
... ... ... ... ... ... ...
0~-.~--~.-~-.~--r-.-~-P~--P-.-~-.~--r-.-~-.~--r-.-~-P-.~~~,--P-.------~~~------T 0
LOCATl:ON
Figure 15.
10
Doub1e 1.5 Hel.1• 1.5
Bi.mpeon 1.5 - -Doub1e
He11e - a.t.mp•on
20
CNT
3.0 • • • 3.0 • • • 3.0 000
30
G.t.bbon 1.5 • • • G1.bbon Horae 1.5 ... ... ... Horae
WJ.1•on 1.5 • • • Wi.l.eon
Von Bertalanffy (LVB) growth curve for each site and tidal height. Curves with lines represent clams transplanted to oiled sites. The LVB curve is from a GM regression.
40
3.0 3.0 3.0
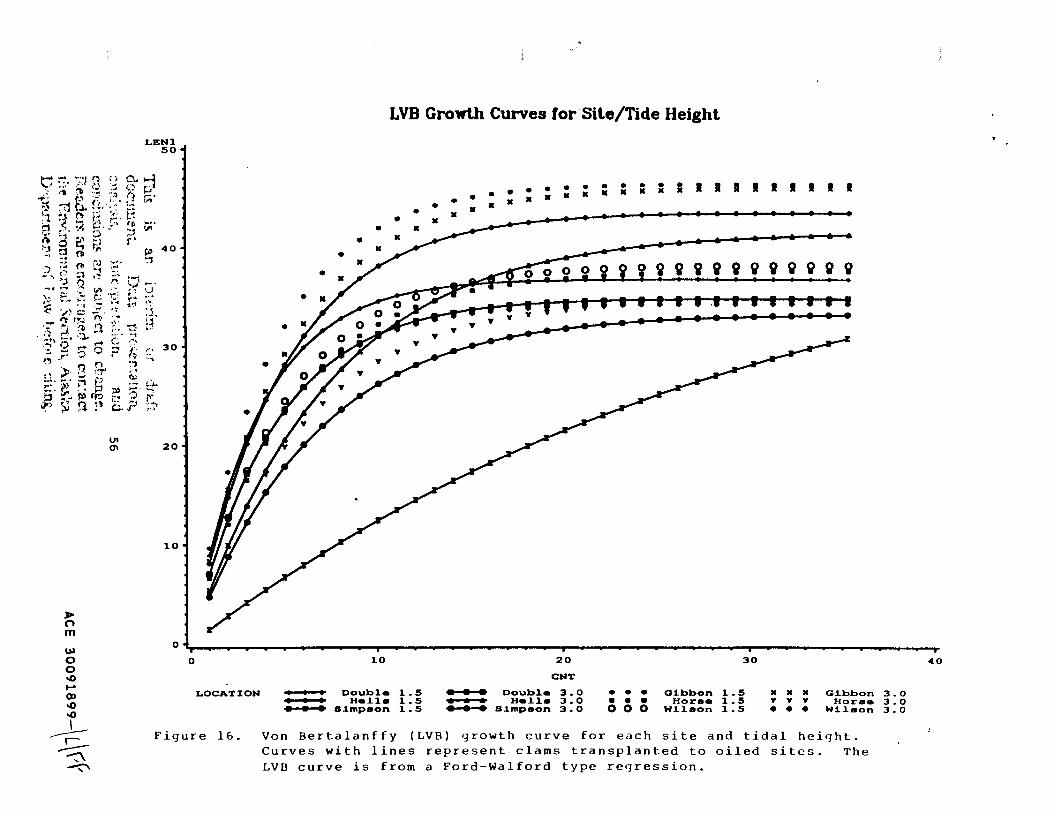
LEN1 so
t: ..... ~-·1 f') '' a.. ~ / ~· ~ ~~ ::: 0 p
~- . F ·-· ·" ,, __.. ~ ~ ~ n ....... ;:: "" ~i ?.i ~ :~· :-~. [~ !:1 -< :?. b. ~" ·~ ,.. .. r .... "' , .. "' ..... tl"'
~8~~ r~ ~ 9 n ~ ~ 40 '"~ :.s {J' i.J ~=.. ~ ·' ,, '1 ., -· - ·~ ;:".J Q ~~ ;,..... r~-1 -· .... -..· ti\ ·-· ~~ 0 ~· f'_ ~--:: ~a; •-;:: ~~ .. ~~ ,. • 4 ,.- I~ .. oj I~ ~ .,) c .::. ~t • ~
;:- ~- TY..! ( ")--: _... l~· :" ';...!. :'11 .1 ,., ,,; '· ,.· -:. -~ ·;.:· "·t . .,~ ·~ ..... ~.... ... ·:""'' ::. f! 5 0 p ~ r' 30 ~., n . ., '):· ~ •T ; .• ~. -·....,. · .. ., (:.: . ... ~) ~ 6 -~· ~ .-· ~ . • ;» ,_ ...... 0 • ~ fl' (Y.t ~· ';) 1''
\1') .... , n t) ··:~ ,....) ··"') ;lJ .· • C..s ,..
U1 ()\ 20
)oo n m
10
• •
• •
•
•
LVB Growth Curves for Site/Tide Height
• • • • • • • • • • • I I I I I • • • • • • • • • • • I I I I
• • • • • • • • • -
v ~ i ~ i i i i i i ~ i
Ul 0 0 .0 ~
CXl .0 .0
o'r--~~.-~-P~--r-~~~~~.------.~~.-~---,----~~-------------.~~.-~------~.---------r
__L...I=
""0 ~
0 10 20 30
CNT
LOCATI:ON Doub1• 1.5 • • • Doub1• 3.0 • • • aJ.bbon 1.5 • • • G1.bbon H•11a 1.5 • • • H•11a 3.0 • • • Hor•• 1.5 y y y Horae
81.mpaon 1.5 ........... S1.mpaon 3.0 00 0 W1.1aon 1.5 • • • WJ.1aon
Figure 16. Von Bertalanffy (LVB) growth curve for each site and tidal height . Curves with lines represent clams transplanted to oiled sites. The LVB curve is from a Ford-Walford type regression.
40
3.0 3.0 3.0