recovery of polycyclic aromatic hydrocarbons and their
TRANSCRIPT
Recovery of polycyclic aromatic hydrocarbons and their oxygenated derivatives in
contaminated soils using aminopropyl silica solid phase extraction
Coren Pulleyblanka,b, Brian Kellehera, Pablo Campob, Frederic Coulonb*,
a Dublin City University, School of Chemical Sciences, Glasnevin, Dublin 9, Ireland
b Cranfield University, School of Water, Energy and Environment, Cranfield, UK
Corresponding author: Frederic Coulon
School of Water, Energy and Environment,
Vincent Building, Cranfield University,
Bedford MK43 0AL
Tel direct: +44 (0)1234 754981
Fax +44 (0)1234 751671
Email: [email protected]
Abstract
The formation, fate, and toxicology of oxy-, hydroxy-, and carboxy- substituted PAH
(OPAH, OHPAH, COOHPAH, respectively) alongside PAH in contaminated soils have
received increasing attention over the past two decades; however, there are still to date
no standardized methods available for their identification and quantitation in soil. Here
we investigated and developed the first method using aminopropylsilica solid phase
extraction (SPE) for these compounds. We further investigated the efficacy of the
developed method for three soils representing a range of contamination levels and soil
textural characteristics and evaluated the impact of different sample preparation steps on
the recovery of targeted compounds. Average recovery of PAH, OPAH, and OHPAH
standards were 99%, 84%, and 86%, respectively for the SPE method. In contrast,
COOHPAH exhibited the lowest recovery (0-82%) and poor inter-batch reproducibility.
Soil texture and contamination levels influenced full method efficiency. Specifically,
soils with higher proportion of clay contributed to the loss of the higher molecular weight
OHPAH prior to SPE. Soil with the highest contamination showed enhanced recovery of
some lower-concentration mid weight PAH and OPAH, while the least contaminated soil
showed greater sensitivity to evaporative losses during sample preparation.
Recommendations for reducing matrix effects as well as the practice of using deuterated
PAH surrogate standards for OPAH analysis are further discussed. Quantitation of
recovered PAH and oxygenated PAH across the three soils showed high reproducibility
(<10% relative standard deviation for a majority of compounds), supporting the use of
this method for PAH, OPAH, and OHPAH at contaminated sites.
Keywords: Polycyclic Aromatic Hydrocarbons, oxy-PAH, hydroxy-PAH, solid phase
extraction, aminopropyl silica, soil analysis
1. Introduction
Polycyclic aromatic hydrocarbons (PAH) are among the most widely reported persistent
organic pollutants contributing to risks associated with petroleum- and industrially-
contaminated soils. A substantial body of research has shed light on the fate and transport
of PAH in the environment as well as their toxic effects to both on human health and
other ecological receptors (Abdel-Shafy and Mansour, 2016). Information garnered to
date has enhanced decision making for remediation and management of sites
contaminated with PAH (Alegbeleye et al., 2017). However, studies have also
demonstrated that efforts to remediate PAH-contaminated soils sometimes lead to
increases in toxicity despite notable reductions in concentrations of the targeted PAH
compounds (Chibwe et al., 2015; Jiang et al., 2016). Soils contaminated with PAH
contain significant amounts of other polycyclic aromatic compounds, including PAH that
have been transformed through substitution of polar carbonyl, hydroxyl, and/or carboxyl
groups (OPAH, OHPAH, and COOHPAH, respectively) onto the aromatic ring structure
through photo-, chemical, or biological oxidative processes (Andersson and Achten,
2015). Critically, there is growing awareness that some of these oxygenated PAH
transformation products may be more toxic and carcinogenic than the parent compounds
(Knecht et al., 2013; Schrlau et al., 2017), and that remediation approaches that allow the
build-up of these compounds could contribute to additional risks for receptors at or
downstream from contaminated sites (Andersson et al., 2003; Chibwe et al., 2015; Hu et
al., 2014; Lundstedt et al., 2006).
While a greater understanding of transformation products with a range of chemistries
could improve decision making at contaminated sites (Lundstedt et al., 2007), this
research is currently hampered by a lack of standard protocols for identifying and
quantifying these compounds in soils (Pulleyblank et al., 2019, for extended review and
references). Effort has been made towards routinizing OPAH analysis in soils (Lundstedt
et al., 2014), with the most typical approach involving extraction of the soil with
dichloromethane, hexane, or hexane/acetone, followed by a clean-up or fractionation step
over silica using column chromatography or solid phase extraction (SPE) in order to
remove interferents and/or fractionate PAH and OPAH. The use of broad specificity
solvents and/or multiple cycles during the extraction stage offers the opportunity to
identify a greater number of analytes through extension of the subsequent preparative
chromatography to isolate more polar fractions. Fractionation also offers the opportunity
for analysing different compound classes using, e.g., different derivatization or
instrumental methods. However, only a few studies have described methods for the
separation of OHPAH and COOHPAH alongside PAH and OPAH in whole-soil extracts
(Bandowe and Wilcke, 2010; Chibwe et al., 2015; Letzel et al., 2001; Meyer et al., 1999),
and there has been little broader uptake in the use of these methods (Pulleyblank et al.
2019). Further work is needed to address specific limitations of available methods such
as uncertain quantitative performance (Chibwe et al., 2015; Meyer et al., 2013),
uncertainty in the best application of surrogate recovery compounds, low recovery of
OHPAH and COOHPAH (Bandowe and Wilcke, 2010), and/or the amount of material
and complexity of the methods (Chibwe et al., 2015; Meyer et al., 1999). In addition,
available soils-based methods have thus far reported recovery of oxygenated PAH from
standard solutions or single spiked uncontaminated soils (Bandowe and Wilcke, 2010,
Meyer et al., 1999). Yet even amongst soils, variations in soil texture and contamination
level may also be expected to affect the identification and quantitative recovery of target
analytes. Many studies also have not reported recovery for individual stages of sample
preparation. A greater understanding of method performance across multiple preparative
stages and soil types could reduce uncertainties in method applicability, help focus efforts
to improve the most relevant steps of the protocols and increase adoption and
standardization of methods.
Existing methods targeting one or more class of oxygenated PAH in crude soil extracts
have utilized silica, alumina, polymeric, or strong base sorbents, sometimes in
combination (Pulleyblank et al., 2019). To date, the utility of weak base aminopropyl
silica for the fractionation of PAH, OPAH, OHPAH and COOHPAH from soil extracts
has not been investigated. Retention characteristics of aminopropyl silica are primarily
influenced by the terminal primary amine group which increases hydrogen bonding
capacity and offers basic functionality that can be modulated by adjusting eluent pH and
solvent polarity. The capacity of aminopropyl silica to allow the separation of a wide
range of neutral, polar, and acidic lipids in crude sediment extracts has been demonstrated
(Murphy et al., 2016; Pinkart et al., 1998), suggesting it could also be applied to enhance
separation of oxygenated PAH of multiple functionalities while using a single sorbent
phase. An SPE method using aminopropyl silica has been proposed for the separation of
nitro-substituted and oxygenated PAH in aerosol samples (Cochran et al., 2012).
However limited data have been presented for the recovery of oxygenated PAH and the
use of methanol for the elution of OHPAH requires a full dry-down and solvent exchange
step prior to derivatization, which may contribute unnecessarily to analyte loss. At the
same time, protocols developed for alternate sample types may not be suitable for soils
due to the possibility of substantial matrix effects (Avagyan et al., 2015; Cochran et al.,
2012) .
Therefore, our aim was to investigate the use of aminopropyl silica SPE for the
fractionation of target PAH and their transformation products in crude soil extracts,
specifically isolating three fractions for subsequent GC-MS analysis: (A) less polar PAH
and OPAH which can be analysed together without requiring derivatization; (B)
moderately polar compounds, OHPAH and related natural non-acidic phenolic
compounds requiring derivatization, but avoiding solvent exchange via sample dry down;
and (C) acidic transformation products, including COOHPAH and related acidic phenolic
compounds, which requires removal of protic, acidic, or basic solvents prior to
derivatization via silylation (Schummer et al., 2009). We further investigated the
application of the method to three soil matrix types, presenting the first study to consider
the impacts of soil textural class and contamination level on the method recovery of this
broad range of polar aromatic compounds. In order to elucidate factors affecting the
selected methodology, this study separately examined recovery and the effect of matrix
using a four-stage approach:
Stage 1: SPE method development using analytical standards: comparison of eluents, load
volumes, linearity tests, consideration of post-SPE evaporative losses;
Stage 2: testing the SPE method with pre-prepared soil extracts spiked with target analytes
(hereafter Matrix-SPE tests); comparison of three soils and standards. This helped
elucidate whether other constituents in the soil extracts specifically influence recovery of
the SPE method, e.g. through competition for sorption sites, and the extent to which
whole-method recovery is affected at the SPE stage;
Stage 3: full method recovery testing - analytes spiked into soil prior to extraction;
comparison of recovery for three soils. When combined with stage 2 results, this helped
elucidate the extent to which losses occur during the extraction stage including specific
matrix-associated effects; and,
Stage 4: Qualitative and quantitative characterization of the original unspiked soils.
Surrogate standards are
Finally, surrogate standards, i.e. compounds of known concentration and similar
chemistry to target analytes, typically isotopically labelled, are frequently added prior to
extraction or SPE. By tracking the amount of surrogate lost (or gained), the recovery of
related target analytes can be estimated, and/or final target analyte concentrations may be
adjusted or “corrected” for losses/ gains/ matrix effects introduced during sample
processing. Although the availability of deuterated OPAH internal or surrogate standards
is improving, these compounds are not widely available, and there is uncertainty in their
best use during OPAH analysis (Pulleyblank et al., 2019). In the meantime, more readily
available deuterated PAH are sometimes used as surrogates estimating OPAH recovery
or correcting for losses during sample preparation (Obrist et al. 2015). We investigated
the impact of using deuterated PAH to estimate losses of OPAH during each stage of the
study in order to evaluate this practice.
2. Materials and Methods
2.1 Chemical reagents and Materials
Target PAH, transformation products, and internal standards were obtained from Sigma-
Aldrich UK including 13 2.5-6 ring PAH in EPA semi volatile mix B (Table 1). Supelco
Discovery aminopropyl silica SPE columns (500 mg/3 mL), derivatization agent N,O-
Bis(trimethylsilyl)trifluoroacetamide (BSTFA) with 1 % trimethylchlorosilane (TMCS),
sodium sulfate, hydrochloric acid (HCl), and triethylamine (TEA) were also obtained
from Sigma Aldrich UK. Deuterated PAH used for surrogate recovery were obtained as
a mixture (2000 μg/mL each in acetone) from Thames Restek, UK. Solvents hexane
(HEX), dichloromethane (DCM), acetone (ACE), acetonitrile (ACN) methanol (MeOH)
were analytical reagent grade or higher and were obtained from Fischer Scientific, UK.
Amber vials used for extraction and SPE eluent collection were acid washed, rinsed with
deionized water, then furnaced at 450 °C for 4 h to remove residual organic materials.
Volumetric glassware used during the preparation of standards, spike solutions, and
samples, was rinsed 3x in acetone and 3x in the ‘incoming’ solvent and was wrapped in
foil below the fill line in order block excess light which can cause transformation of
aromatic compounds (Woudneh et al., 2016). PTFE lined screwcaps were rinsed 3x with
acetone prior to use.
2.2 Soil characteristics
In order to consider the influence of soil matrix on SPE method performance, three soils
with varying texture and contamination level were investigated (Table 2). Soils 1 and 2
were contaminated soils obtained from former gasworks sites in the southern UK. Soil 3
was obtained from a residential garden area in Bedford UK (10-15 cm depth) to provide
comparison to a relatively uncontaminated soil. Soils were loosely wrapped in foil and
air dried overnight, then ground and sieved to 2 mm and stored frozen at - 80°C before
further analysis. Soil pH was measured in 0.01 M CaCl2 (5:1 liquid:solid) following ISO
procedure 10390 (2005). Total soil organic matter was determined as loss on ignition
(LOI): oven dried soils (24 h 105°C) were heated to 450°C for 5 h to ash organic material,
and the mass lost was calculated as a percentage of the total oven-dried mass (Institution,
2000). Soil was determined by sieving and sedimentation procedure (ISO 11277, 2009;
Natural England TIN037 2008). Total carbon-TC and total nitrogen-TN were determined
through combustion-elemental analysis using a Vario EL III Element Analyzer (BS-EN
13654-2, 2001).
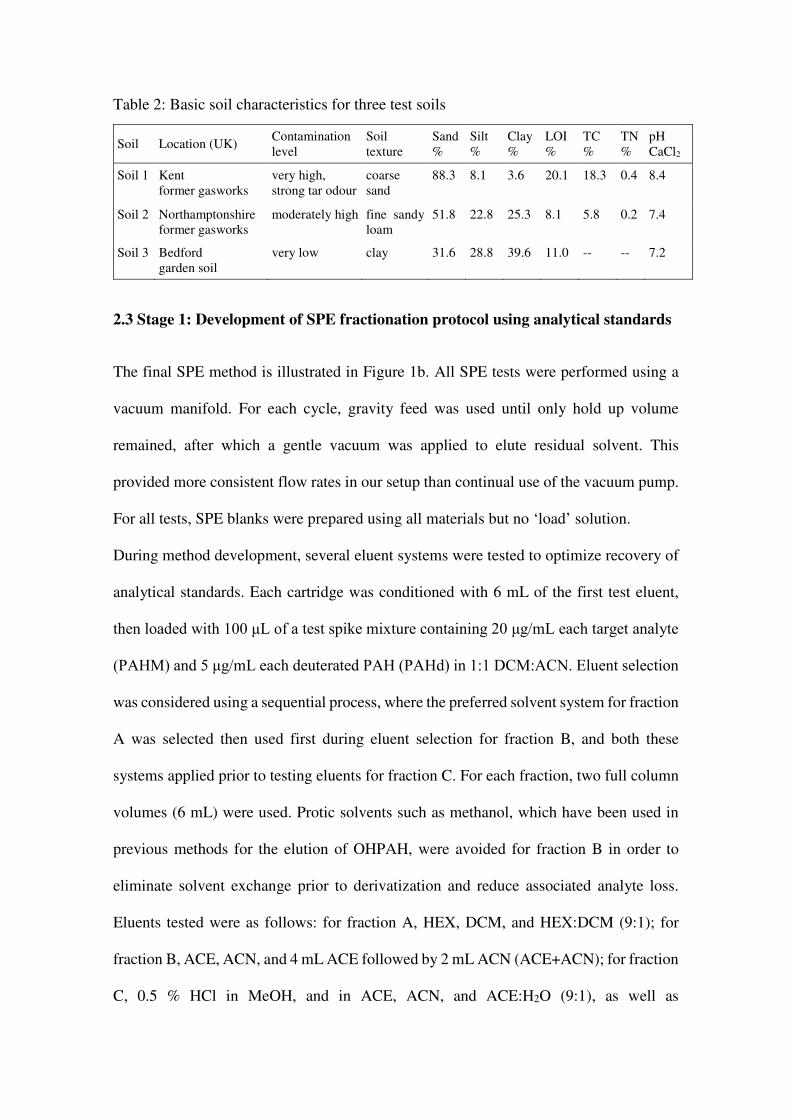
Table 2: Basic soil characteristics for three test soils
Soil Location (UK) Contamination level
Soil texture
Sand %
Silt %
Clay %
LOI %
TC %
TN %
pH CaCl2
Soil 1 Kent former gasworks
very high, strong tar odour
coarse sand
88.3 8.1 3.6 20.1 18.3 0.4 8.4
Soil 2 Northamptonshire former gasworks
moderately high fine sandy loam
51.8 22.8 25.3 8.1 5.8 0.2 7.4
Soil 3 Bedford garden soil
very low clay 31.6 28.8 39.6 11.0 -- -- 7.2
2.3 Stage 1: Development of SPE fractionation protocol using analytical standards
The final SPE method is illustrated in Figure 1b. All SPE tests were performed using a
vacuum manifold. For each cycle, gravity feed was used until only hold up volume
remained, after which a gentle vacuum was applied to elute residual solvent. This
provided more consistent flow rates in our setup than continual use of the vacuum pump.
For all tests, SPE blanks were prepared using all materials but no ‘load’ solution.
During method development, several eluent systems were tested to optimize recovery of
analytical standards. Each cartridge was conditioned with 6 mL of the first test eluent,
then loaded with 100 μL of a test spike mixture containing 20 μg/mL each target analyte
(PAHM) and 5 μg/mL each deuterated PAH (PAHd) in 1:1 DCM:ACN. Eluent selection
was considered using a sequential process, where the preferred solvent system for fraction
A was selected then used first during eluent selection for fraction B, and both these
systems applied prior to testing eluents for fraction C. For each fraction, two full column
volumes (6 mL) were used. Protic solvents such as methanol, which have been used in
previous methods for the elution of OHPAH, were avoided for fraction B in order to
eliminate solvent exchange prior to derivatization and reduce associated analyte loss.
Eluents tested were as follows: for fraction A, HEX, DCM, and HEX:DCM (9:1); for
fraction B, ACE, ACN, and 4 mL ACE followed by 2 mL ACN (ACE+ACN); for fraction
C, 0.5 % HCl in MeOH, and in ACE, ACN, and ACE:H2O (9:1), as well as
ACE:H2O:TEA (90:10:0.05) and ACN:H2O:TEA (90:10:0.05). Fraction C tests with HCl
and no water were conducted in duplicate, while all other tests were conducted in
triplicate. For eluent selection tests, post-SPE processing was conducted as in Figure 1c,
with the exception that fraction A was also derivatized in order to detect early-eluting
OHPAH, and fraction B was not subject to further concentration under N2.
After final selection of the eluent system, increased load volumes of 1 mL and 500 μL
were tested, but this led to early elution of OHPAH in fraction A, so 100 μL was
maintained for all subsequent experiments. The linearity of the method was investigated
through triplicate tests of PAHM at 10, 1, 0.1, and 0 μg/mL (as blanks), each with 5 μg/mL
PAHd. As genuine samples would often require further concentration for the analysis of
transformation products, fractions A and B were further reduced to 1 mL under N2 prior
to instrumental analysis.
2.4 Preparation of soil extracts for Stages 2 -4:
The preparation of soil extracts using ultrasonic assisted extraction is shown in Figure 1a.
Preliminary tests using 1 g soil demonstrated that Soil 1 extracts became very tarry and
difficult to re-suspend after initial concentration. Therefore, a 0.5 g mass was selected
and used for all soils to maintain consistency during these tests. Each sample was
extracted in two cycles, first with 10 mL DCM, then with 10 mL ACN to target polar
transformation products (Wang et al., 2012). The supernatants from each extraction cycle
were combined and reduced to 1 mL then topped with an additional 1 mL DCM and
sonicated briefly in order to re-suspend materials which had collected on vessel walls
during the concentration steps and to maintain consistency of the 1:1 ACN:DCM load
solvent system used for all SPE tests. All extractions, including blanks (all reagents except
soil), were conducted in triplicate.
2.5 Stage 2: Matrix-SPE tests - testing the SPE-method with spiked soil extracts
To investigate the effect of the soil matrices on target analyte recoveries through the SPE
method alone, 1 mL of each previously-prepared concentrated soil extract as well as 1:1
ACN:DCM solvent standard were spiked to obtain added concentrations of 20 μg/mL
PAHM and 5 μg/mL PAHd (see Figure 1- starred point 1). An additional 1 mL each soil
extract/solvent standard was spiked with 5 μg/mL PAHd only in order to account for any
target analytes already present in the soil extract/blank. Triplicate 100 μL aliquots were
then processed as in Figure 1b-c.
2.6 Stage 3 and 4: Full method recovery tests and quantitation in soils
In order to investigate the recovery and the effect of the soil matrices on the full method
(extraction + SPE), triplicate samples of each soil were spiked prior to extraction (Figure
1- starred point 2) to yield target added soil concentrations of 20 μg/g PAHM and 8 μg/g
PAHd, respectively. PAHM spike levels reflect a mid-range concentration of OPAH
previously reported in industrially contaminated soils (Arp et al., 2014). An additional set
of samples was spiked with the PAHd mixture only to quantify contaminants present in
the original soils. Six samples were also prepared with sodium sulfate and the same spike
solutions to assist characterization of losses independent of the presence of soil matrix,
and as extraction blanks. During sample preparation, an additional 3 samples for each
soil of approximately 1 g each were used to obtain moisture content at the time of analysis
(as percent mass difference after oven drying 105° C for 24 h). The average moisture
content was used to calculate final dry-mass analyte concentrations.
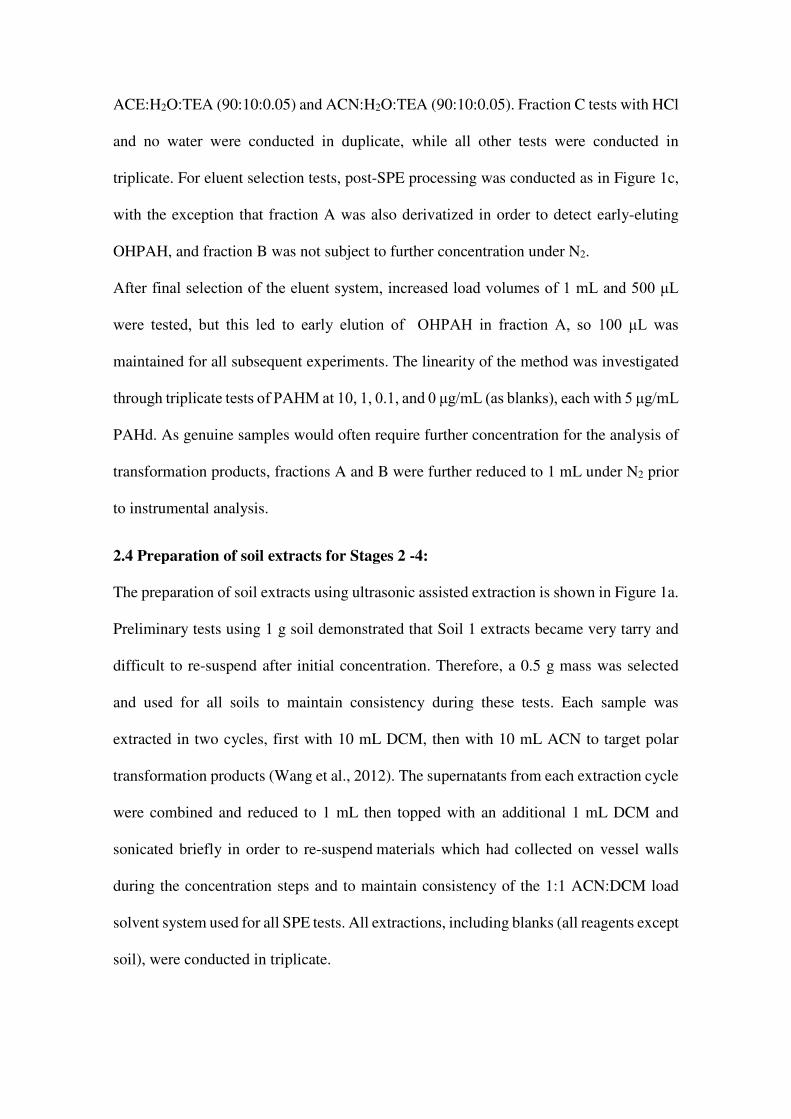
Table 1: GC-MS method for target PAH and oxygenated transformation products
Target analyte CAS no. Mass g/mol
SR grp 1
RT min
SIM m/z quant., ref
R2 LOD2
(μg/mL)LOQ2
(μg/mL)Fig.43
PAH Naphthalene 91-20-3 128.2 SR1 7.79 128, 64 0.999 0.009 0.030 a Acenaphthylene 208-96-8 152.2 SR2 12.34 152, 126 0.999 0.003 0.012 b Fluorene 86-73-7 166.2 SR2 14.37 166, 83 0.999 0.004 0.013 c Phenanthrene 85-01-8 178.2 SR3 17.22 178, 89 0.998 0.005 0.017 d Anthracene 120-12-7 178.2 SR3 17.38 178, 89 0.998 0.004 0.013 e Pyrene 129-00-0 202.3 SR3 22.90 202, 101 0.999 0.003 0.009 f Benz[a]anthracene 56-55-3 228.3 SR4 29.80 228, 114 0.998 0.001 0.004 g Chrysene 218-01-9 228.3 SR4 30.11 228, 114 0.998 0.001 0.004 h Benzo[b]fluoranthene 205-99-2 252.3 SR5 36.78 252, 126 0.998 0.002 0.006 j Benzo[k]fluoranthene 207-08-9 252.3 SR5 36.92 252, 126 0.997 0.003 0.009 k Benzo[a]pyrene 218-01-9 252.3 SR5 38.69 252, 126 0.997 0.002 0.006 l Indeno[1,2,3-cd]pyrene 193-39-5 276.3 SR5 45.21 276, 138 0.999 0.002 0.008 m Dibenz[a,h]anthracene 53-70-3 276.3 SR5 45.48 278, 139 0.999 0.004 0.015 n Benzo[ghi]perylene 191-24-2 276.3 SR5 46.52 276, 138 0.999 0.003 0.009 o
OPAH 1-Indanone 83-33-0 132.2 SR1 9.431 132, 104 0.999 0.002 0.007 p 9-Fluorenone4 486-25-9 180.2 SR2 16.60 180, 152 0.999 0.002 0.006 q 9,10-Anthraquinone 84-65-1 208.2 SR3 20.24 208, 180 0.999 0.002 0.007 r 9,10-Phenanthrenequinone 84-11-7 208.2 -- 24.21 208, 180 nq5 nq nq -
OHPAH
Catechol 120-80-9 110.1 9.98 254, 151 0.999 0.003 0.011 nd6
1-Hydroxynaphthalene 1779-10-8 144.2 13.65 216, 201 0.999 0.003 0.011 s 1-Hydroxyacenaphthene 6306-07-6 170.1 16.85 242, 152 0.999 0.001 0.004 t 9-Hydroxyfluorene 1689-64-1 182.2 17.45 254, 165 0.999 0.001 0.004 u 9-Hydroxyphenanthrene 484-17-3 194.2 22.45 266, 251 0.999 0.002 0.008 w 1-Hydroxypyrene 5315-79-7 218.3 30.41 290, 175 0.998 0.003 0.010 x
Phenolic aldehydes
4-Hydroxybenzaldehyde 123-08-0 122.1 10.90 179, 151 0.999 0.003 0.010 A Vanillin 121-33-5 152.1 13.52 194, 201 0.999 0.003 0.009 B
COOHPAH 1-Naphthylacetic acid 86-87-3 186.1 17.00 258, 168 0.999 0.059 0.197 C Fluorene-9-carboxylic acid 1989-33-9 210.2 19.58 282, 165 nq nq nq - 1-Hydrox-2-naphthoic acid 86-48-6 188.2 20.45 317, 243 0.996 0.001 0.004 D
Phenolic Acids
Salicylic acid 69-72-7 138.1 13.15 267, 209 0.999 0.004 0.014 E 4-Hydroxybenzoic acid 99-96-7 138.1 14.83 267, 193 0.999 0.026 0.087 F 2,5-Dihydroxybenzoic acid 490-79-9 154.1 16.98 355, 297 0.999 0.001 0.004 G Ferulic acid 1135-24-6 194.2 22.17 338, 323 0.998 0.010 0.036 H
Deuterated PAH for
surrogate recovery (SR) SR1- Naphthalene-d8 1146-35-2 136.2 7.75 136, 108 na na na i SR2- Acenaphthene-d10 15067-26-2 164.3 12.86 164, 162 na na na ii SR3- Phenanthrene-d10 1517-22-2 188.3 17.22 188, 160 na na na iii SR4- Chrysene-d12 1719-03-5 240.4 30.00 240, 120 na na na iv SR5- Perylene-d12 1520-96-3 264.4 39.08 264, 132 na na na v
Internal standards Nonadecane---d40 39756-36-0 308.8 18.12 66, 98 na na na I Triacontane –d62 93952-07-9 485.2 40.37 66, 98 na na na II
1 SR group identifies surrogate standard used for recovery adjustment 2 LOD and LOQ based on 1 μL injection. 3 peak reference for Figure 4. 4 cautiously quantitative, see text for further discussion. 5 nq not quantitative, see further discussion in text. 6 nd not detected in sample displayed in Figure 4
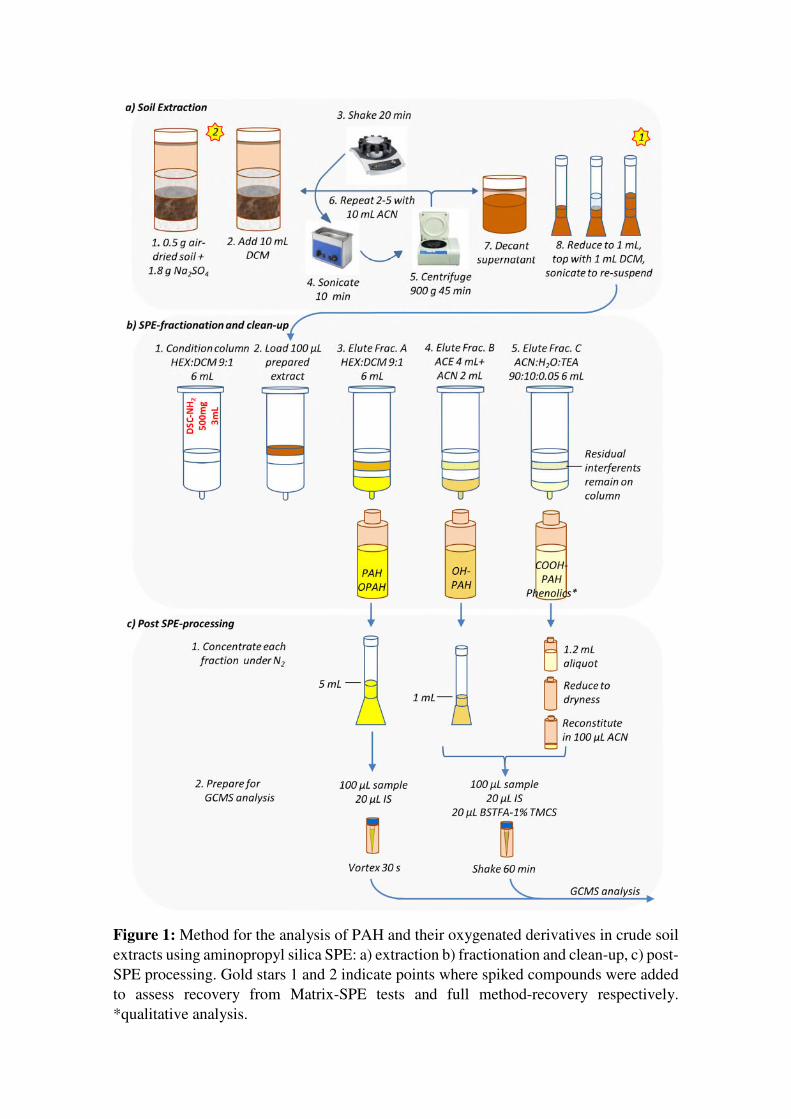
Figure 1: Method for the analysis of PAH and their oxygenated derivatives in crude soil extracts using aminopropyl silica SPE: a) extraction b) fractionation and clean-up, c) post-SPE processing. Gold stars 1 and 2 indicate points where spiked compounds were added to assess recovery from Matrix-SPE tests and full method-recovery respectively. *qualitative analysis.
2.7 GC-MS analysis
Target compounds were analysed by GC-EI-MS (Shimadzu TQ-8040) with AOC-6000
autosampler and Lab Insight Solutions software (Shimadzu, 2015-2016). Compound
separation was achieved using a 30 m Rtx-5 column (5% diphenyl/95%
dimethylpolysiloxane 0.25 mm i.d., 0.25 μm df). Instrument settings were as follows -
injection port: 200 °C, 1 μL injections, splitless mode; column flow, 36 cms-1; oven
program: initial temperature 80 °C, increasing 5 °C min-1 to 100 °C, then 8 °C min-1 to
200 °C, and 3 °C min-1 to 300 °C, hold for 2 min; transfer line and MS system: 300 °C;
EI: 70 eV SCAN /SIM mode, event times of 0.3 s and 0.060 s respectively.
To prepare samples for analysis, 100 μL sample and 20 μL of internal standard (IS)
mixture (20 μg/mL nonadecane-d40 and triacontane-d62) were added to a 200 μL glass
insert inside a 2 mL amber glass GC vial then capped (silicone/PTFE) and shaken to
combine. For samples requiring derivatization, 20 μL of BSTFA 1% TMCS was also
added, and vials were shaken at room temperature for 60 min. BSTFA reacts with
hydroxyl and carboxyl groups, to form trimethylsilyl (TMS) derivatives; this increases
the volatility of polar compounds allowing for their analysis by GC-MS.
PAH and OPAH were identified as the M﮲+ ion, while OHPAH, COOHPAH, and phenolic
compounds were identified as their trimethylsilyl derivatives (SIM-monitored ions are
given in Table 1). A compound was considered identified if the retention time deviated
<0.1 min from the standard, the ratio of quantitative and reference ion differed less than
30 % of the analytical standard, and other ions present in the overall mass pattern showed
good visual agreement with the standard spectrum. Reference check mixtures containing
all analytes were run with each experiment in order to monitor for any shifts in retention
time or substantive changes in instrument sensitivity. Derivatized samples were also
monitored for the presence of residual underivatized target compounds. SPE and full
method blanks were also checked for interferences, and an additional blank injection was
included every 10 samples to monitor for instrument carry over. Any contribution of a
target m/z value over the specified integration period in a blank sample was subtracted
from experimental samples prior to the calculation of recovery.
External instrument calibration was conducted using the internal standard (IS) method
with four point calibration curves (0.01-10 μg/mL), with 0 μg/mL serving as a blank.
PAH and OPAH were prepared in DCM, while all other analytes were prepared in ACN
with derivatization. By introducing an internal standard with known concentration, it is
possible to monitor and normalize GC-MS signals to account for any changes in injection
volume or instrument sensitivity for a given run. Ideally each analyte would be
normalized to the signal of its isotopically labelled counterpart; however in practice this
is not feasible, and it is most important that the concentration-dependent signal of the
target analyte and the internal standard is consistent during instrument calibration (i.e. the
IS-normalized calibration curve is consistent and linear). In this study, deuterated alkanes
were used as the internal standards while deuterated aromatic compounds were prioritized
for use as surrogate compounds to monitor losses/gains throughout the extraction and
fractionation procedures. It should be noted that recovery of surrogate compounds also
accounts for any differences in instrument response introduced by the matrix, and that
when an analyte signal is also adjusted by the recovery of the surrogate, the signal - and
chemistry - of the internal standard becomes mathematically irrelevant. Limits of
detection (LOD) and quantitation (LOQ) were established through calculation of,
respectively, 3 and 10 times the standard deviation of the IS-normalized signal from seven
replicate injections of the 0.01 μg/mL calibration solution divided by the slope of the
calibration curve.
2.8 Calculations
All post-processing was conducted in Microsoft Excel (2010) or in Matlab (2018b
Academic License) using custom scripts incorporating common functions (mean,
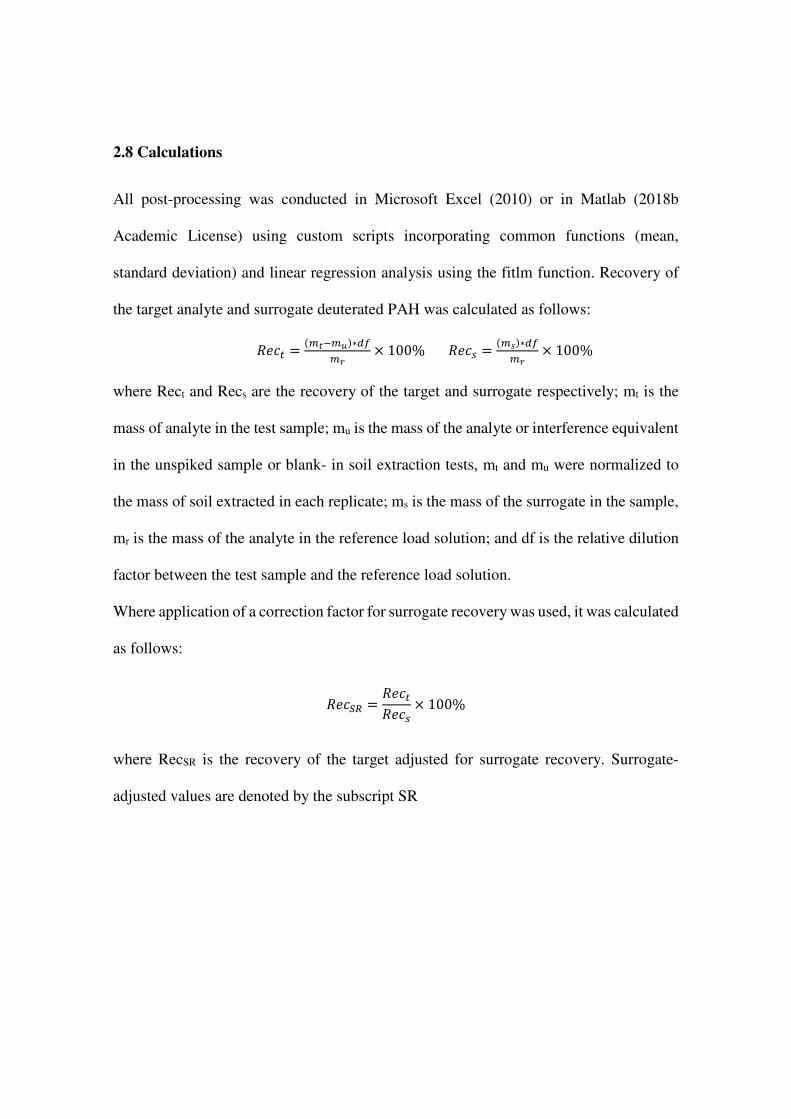
standard deviation) and linear regression analysis using the fitlm function. Recovery of
the target analyte and surrogate deuterated PAH was calculated as follows: ���� = (�����)∗���� × 100% ���� = (��)∗���� × 100%
where Rect and Recs are the recovery of the target and surrogate respectively; mt is the
mass of analyte in the test sample; mu is the mass of the analyte or interference equivalent
in the unspiked sample or blank- in soil extraction tests, mt and mu were normalized to
the mass of soil extracted in each replicate; ms is the mass of the surrogate in the sample,
mr is the mass of the analyte in the reference load solution; and df is the relative dilution
factor between the test sample and the reference load solution.
Where application of a correction factor for surrogate recovery was used, it was calculated
as follows:
����� = �������� × 100%where RecSR is the recovery of the target adjusted for surrogate recovery. Surrogate-
adjusted values are denoted by the subscript SR
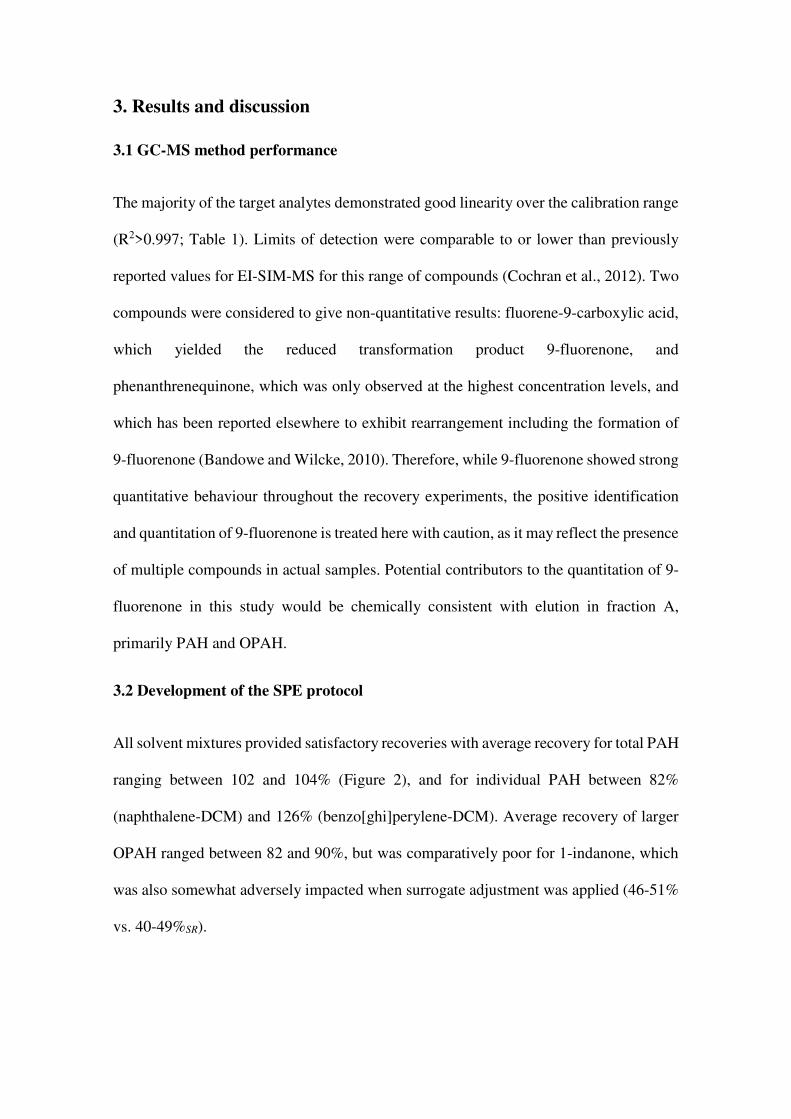
3. Results and discussion
3.1 GC-MS method performance
The majority of the target analytes demonstrated good linearity over the calibration range
(R2>0.997; Table 1). Limits of detection were comparable to or lower than previously
reported values for EI-SIM-MS for this range of compounds (Cochran et al., 2012). Two
compounds were considered to give non-quantitative results: fluorene-9-carboxylic acid,
which yielded the reduced transformation product 9-fluorenone, and
phenanthrenequinone, which was only observed at the highest concentration levels, and
which has been reported elsewhere to exhibit rearrangement including the formation of
9-fluorenone (Bandowe and Wilcke, 2010). Therefore, while 9-fluorenone showed strong
quantitative behaviour throughout the recovery experiments, the positive identification
and quantitation of 9-fluorenone is treated here with caution, as it may reflect the presence
of multiple compounds in actual samples. Potential contributors to the quantitation of 9-
fluorenone in this study would be chemically consistent with elution in fraction A,
primarily PAH and OPAH.
3.2 Development of the SPE protocol
All solvent mixtures provided satisfactory recoveries with average recovery for total PAH
ranging between 102 and 104% (Figure 2), and for individual PAH between 82%
(naphthalene-DCM) and 126% (benzo[ghi]perylene-DCM). Average recovery of larger
OPAH ranged between 82 and 90%, but was comparatively poor for 1-indanone, which
was also somewhat adversely impacted when surrogate adjustment was applied (46-51%
vs. 40-49%SR).
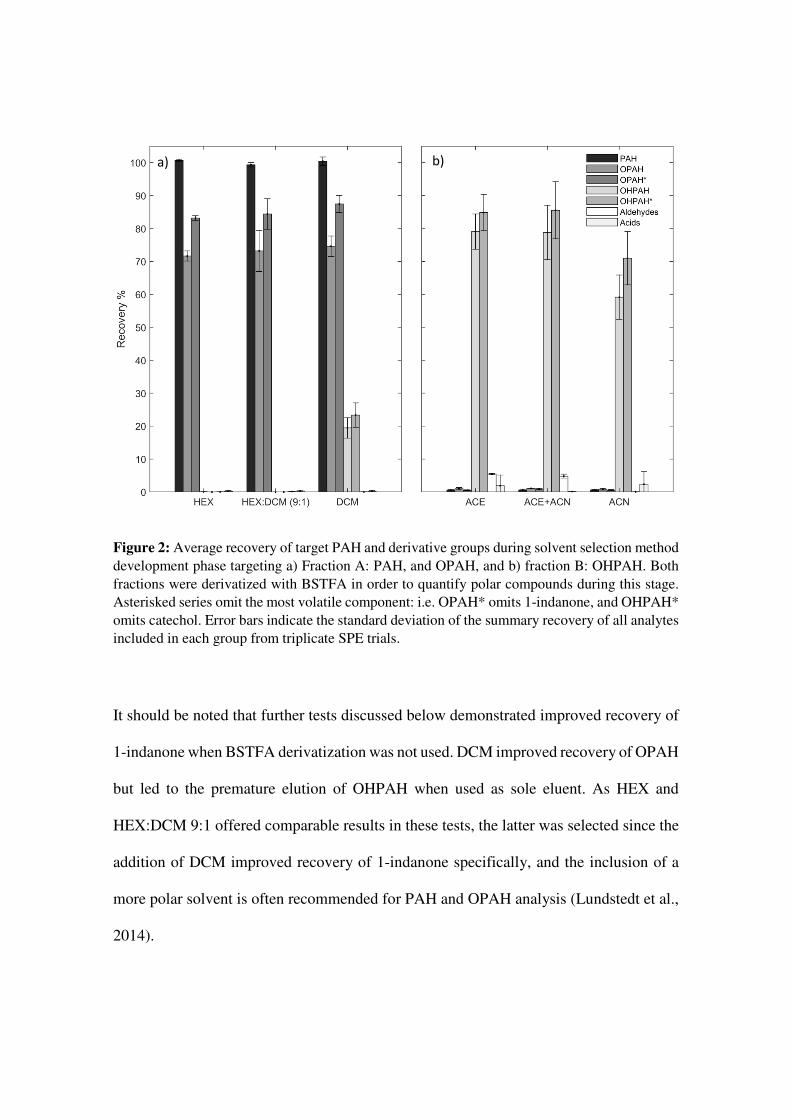
Figure 2: Average recovery of target PAH and derivative groups during solvent selection method development phase targeting a) Fraction A: PAH, and OPAH, and b) fraction B: OHPAH. Both fractions were derivatized with BSTFA in order to quantify polar compounds during this stage. Asterisked series omit the most volatile component: i.e. OPAH* omits 1-indanone, and OHPAH* omits catechol. Error bars indicate the standard deviation of the summary recovery of all analytes included in each group from triplicate SPE trials.
It should be noted that further tests discussed below demonstrated improved recovery of
1-indanone when BSTFA derivatization was not used. DCM improved recovery of OPAH
but led to the premature elution of OHPAH when used as sole eluent. As HEX and
HEX:DCM 9:1 offered comparable results in these tests, the latter was selected since the
addition of DCM improved recovery of 1-indanone specifically, and the inclusion of a
more polar solvent is often recommended for PAH and OPAH analysis (Lundstedt et al.,
2014).
b) a)

For OHPAH, the inclusion of ACE in the eluent system substantially improved recoveries
over the use of ACN alone, with average recovery increasing by 15-20%, and recovery
of catechol specifically increasing by 45-50%. In the ACE and ACE+ACN systems,
average recoveries were respectively, for 1-hydroxynaphthalene 108 and 106%, mid
weight OHPAH (1-hydroxyacenaphthene, 9-hydroxyfluorene, and 9-
hydroxyphenanthrene) 82 and 85%, and heavier weight OHPAH (1-hydroxypyrene) 66
and 63%. As the two systems provided comparable results, the ACE-ACN system was
selected because ACN is recommended for promoting the derivatization of OHPAH
(Schummer et al., 2009) and may be useful in reducing excessive volatilization of analytes
during concentration steps as it evaporates more slowly than acetone.
It was initially thought that all non-acidic phenolic compounds would elute in fraction B
along with catechol, however 4-hydroxybenzaldehyde and vanillin did not follow this
pattern. With typically less than 5% recovery of these compounds in the OHPAH fraction
and no further elution in fraction C using initial HCl + solvent eluents, it was supposed
that the aldehyde group might be bonding covalently with amino groups on the SPE
sorbent to form Schiff bases, which is a reversible reaction in the presence of water and
H+ or OH- (Nomura and Jones, 2013). As the use of acid-only-modified solvents initially
tested for fraction C yielded poor recoveries of both target acids and phenolic aldehydes
(<2%), three additional systems were tested, one incorporating water into the HCl-ACN
eluent system and two incorporating water and TEA, ACN:H2O:TEA (90:10:0.05) and
ACE:H2O:TEA (90:10:0.05). Both TEA-modified systems substantially improved the
recovery of 4-hydroxybenzaldehyde, though total recovery was still low (15-20%), and
marginally improved the recovery of vanillin (3-7%). The ACN:H2O:TEA system also
yielded the best recoveries for salicylic acid (58+-11%), gentisic acid (38+- 9.1%), and
1-hydroxy-2-naphthoic acid (82 +/- 7.4%), offering apparent method improvements over
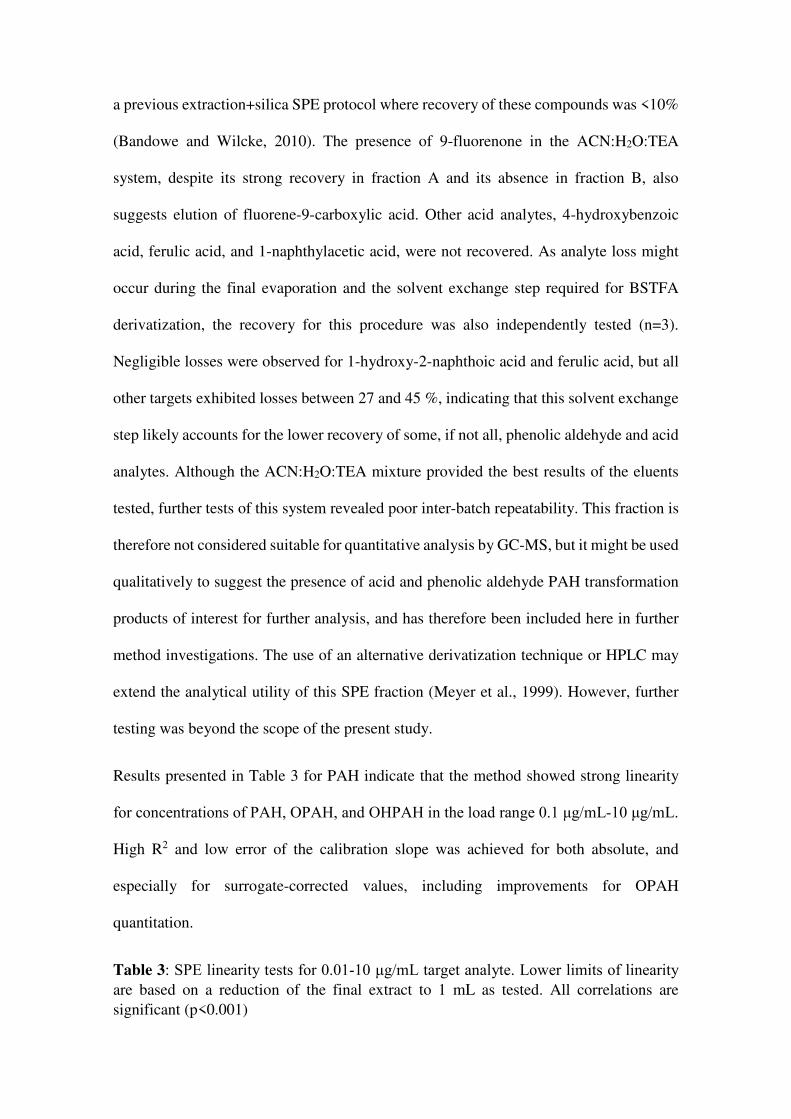
a previous extraction+silica SPE protocol where recovery of these compounds was <10%
(Bandowe and Wilcke, 2010). The presence of 9-fluorenone in the ACN:H2O:TEA
system, despite its strong recovery in fraction A and its absence in fraction B, also
suggests elution of fluorene-9-carboxylic acid. Other acid analytes, 4-hydroxybenzoic
acid, ferulic acid, and 1-naphthylacetic acid, were not recovered. As analyte loss might
occur during the final evaporation and the solvent exchange step required for BSTFA
derivatization, the recovery for this procedure was also independently tested (n=3).
Negligible losses were observed for 1-hydroxy-2-naphthoic acid and ferulic acid, but all
other targets exhibited losses between 27 and 45 %, indicating that this solvent exchange
step likely accounts for the lower recovery of some, if not all, phenolic aldehyde and acid
analytes. Although the ACN:H2O:TEA mixture provided the best results of the eluents
tested, further tests of this system revealed poor inter-batch repeatability. This fraction is
therefore not considered suitable for quantitative analysis by GC-MS, but it might be used
qualitatively to suggest the presence of acid and phenolic aldehyde PAH transformation
products of interest for further analysis, and has therefore been included here in further
method investigations. The use of an alternative derivatization technique or HPLC may
extend the analytical utility of this SPE fraction (Meyer et al., 1999). However, further
testing was beyond the scope of the present study.
Results presented in Table 3 for PAH indicate that the method showed strong linearity
for concentrations of PAH, OPAH, and OHPAH in the load range 0.1 μg/mL-10 μg/mL.
High R2 and low error of the calibration slope was achieved for both absolute, and
especially for surrogate-corrected values, including improvements for OPAH
quantitation.
Table 3: SPE linearity tests for 0.01-10 μg/mL target analyte. Lower limits of linearity are based on a reduction of the final extract to 1 mL as tested. All correlations are significant (p<0.001)
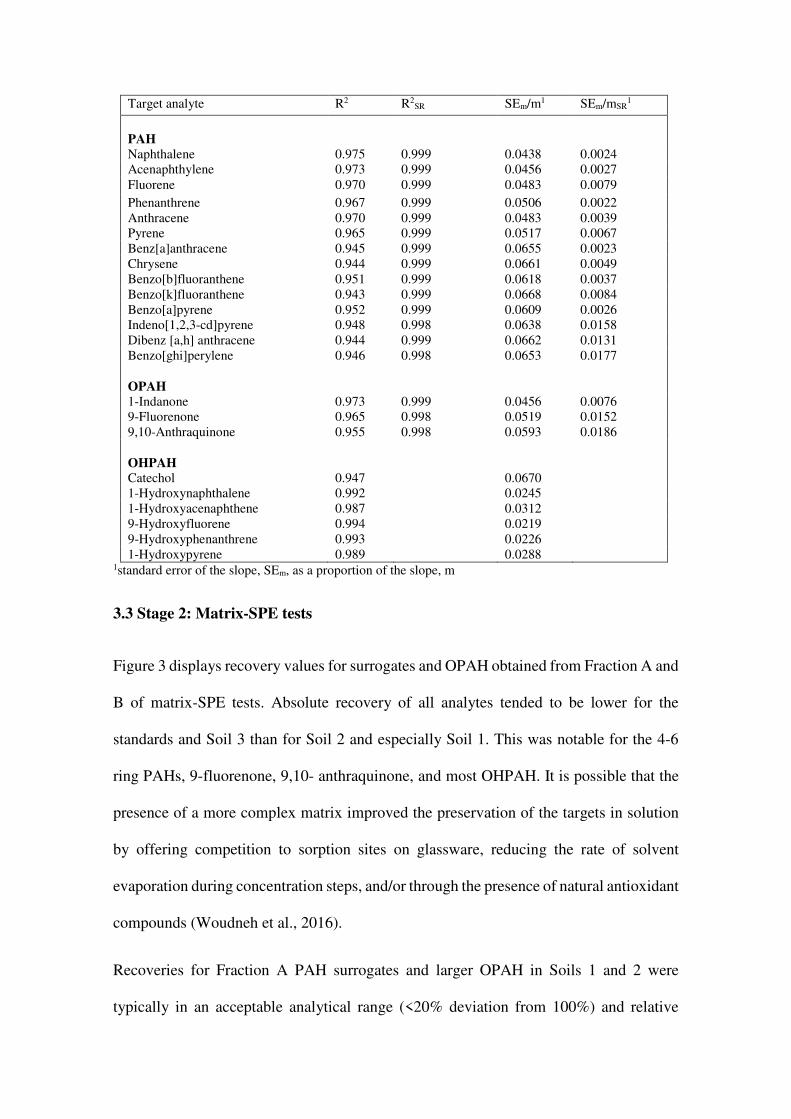
Target analyte R2 R2SR SEm/m1 SEm/mSR
1
PAH
Naphthalene 0.975 0.999 0.0438 0.0024 Acenaphthylene 0.973 0.999 0.0456 0.0027 Fluorene 0.970 0.999 0.0483 0.0079
Phenanthrene 0.967 0.999 0.0506 0.0022 Anthracene 0.970 0.999 0.0483 0.0039 Pyrene 0.965 0.999 0.0517 0.0067 Benz[a]anthracene 0.945 0.999 0.0655 0.0023 Chrysene 0.944 0.999 0.0661 0.0049 Benzo[b]fluoranthene 0.951 0.999 0.0618 0.0037 Benzo[k]fluoranthene 0.943 0.999 0.0668 0.0084 Benzo[a]pyrene 0.952 0.999 0.0609 0.0026 Indeno[1,2,3-cd]pyrene 0.948 0.998 0.0638 0.0158 Dibenz [a,h] anthracene 0.944 0.999 0.0662 0.0131 Benzo[ghi]perylene 0.946 0.998 0.0653 0.0177
OPAH
1-Indanone 0.973 0.999 0.0456 0.0076 9-Fluorenone 0.965 0.998 0.0519 0.0152 9,10-Anthraquinone 0.955 0.998 0.0593 0.0186
OHPAH
Catechol 0.947 0.0670 1-Hydroxynaphthalene 0.992 0.0245 1-Hydroxyacenaphthene 0.987 0.0312 9-Hydroxyfluorene 0.994 0.0219 9-Hydroxyphenanthrene 0.993 0.0226 1-Hydroxypyrene 0.989 0.0288
1standard error of the slope, SEm, as a proportion of the slope, m
3.3 Stage 2: Matrix-SPE tests
Figure 3 displays recovery values for surrogates and OPAH obtained from Fraction A and
B of matrix-SPE tests. Absolute recovery of all analytes tended to be lower for the
standards and Soil 3 than for Soil 2 and especially Soil 1. This was notable for the 4-6
ring PAHs, 9-fluorenone, 9,10- anthraquinone, and most OHPAH. It is possible that the
presence of a more complex matrix improved the preservation of the targets in solution
by offering competition to sorption sites on glassware, reducing the rate of solvent
evaporation during concentration steps, and/or through the presence of natural antioxidant
compounds (Woudneh et al., 2016).
Recoveries for Fraction A PAH surrogates and larger OPAH in Soils 1 and 2 were
typically in an acceptable analytical range (<20% deviation from 100%) and relative
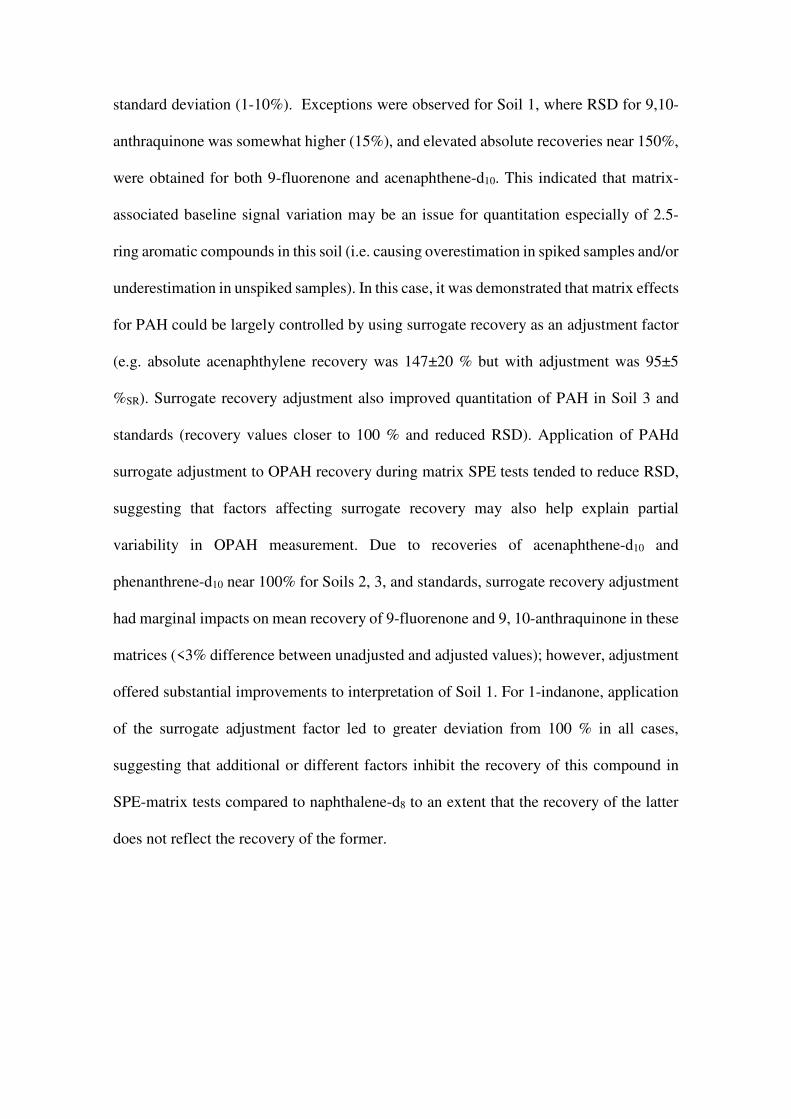
standard deviation (1-10%). Exceptions were observed for Soil 1, where RSD for 9,10-
anthraquinone was somewhat higher (15%), and elevated absolute recoveries near 150%,
were obtained for both 9-fluorenone and acenaphthene-d10. This indicated that matrix-
associated baseline signal variation may be an issue for quantitation especially of 2.5-
ring aromatic compounds in this soil (i.e. causing overestimation in spiked samples and/or
underestimation in unspiked samples). In this case, it was demonstrated that matrix effects
for PAH could be largely controlled by using surrogate recovery as an adjustment factor
(e.g. absolute acenaphthylene recovery was 147±20 % but with adjustment was 95±5
%SR). Surrogate recovery adjustment also improved quantitation of PAH in Soil 3 and
standards (recovery values closer to 100 % and reduced RSD). Application of PAHd
surrogate adjustment to OPAH recovery during matrix SPE tests tended to reduce RSD,
suggesting that factors affecting surrogate recovery may also help explain partial
variability in OPAH measurement. Due to recoveries of acenaphthene-d10 and
phenanthrene-d10 near 100% for Soils 2, 3, and standards, surrogate recovery adjustment
had marginal impacts on mean recovery of 9-fluorenone and 9, 10-anthraquinone in these
matrices (<3% difference between unadjusted and adjusted values); however, adjustment
offered substantial improvements to interpretation of Soil 1. For 1-indanone, application
of the surrogate adjustment factor led to greater deviation from 100 % in all cases,
suggesting that additional or different factors inhibit the recovery of this compound in
SPE-matrix tests compared to naphthalene-d8 to an extent that the recovery of the latter
does not reflect the recovery of the former.
Figure 3: Average recovery of PAH surrogates, OPAH, OHPAH from Matrix-SPE tests in a) Fraction A, with and without the application of surrogate recovery adjustment for OPAH (SR series); b) Fraction B. Error bars indicate the standard deviation of recoveryfrom triplicate Matrix-SPE trials.
b)
a)
In addition to impacts on calculated recovery of the spiked analytes, the complexity of
the Soil 1 matrix also contributed to late elution of some high-concentration PAH in
fraction B, typically less than 5 % of the combined analyte signal of Fractions A and B.
Increasing the proportion of DCM by up to 50 % in the first eluent, as suggested by
Cochran et al. (2012) might reduce this effect for the most contaminated soils.
For fraction B, the average recovery of OHPAH excluding catechol, ranged between 63
and 113 %, with most recovery values between 70 and 85 %. RSD across matrix-SPE
tests was generally <10 %, except for Soil 1 where both apparent recovery and variability
were greater. The somewhat lower recovery values obtained here when compared to
original solvent selection experiment may be due to the addition of the evaporation-
concentration step. Separate testing of the evaporation step (n=3) indicated this could
alone account for target losses of up to 33, 30, 20, 19, 8, and 14 % for catechol, 1-
hydroxynaphthalene, 1-hydroxyacenaphthene, 9-hydroxyfluorene, 9-
hydroxyphenanthrene, and 1-hydroxypyrene, respectively, and could explain 2-10 % of
the relative standard deviation in OHPAH recoveries. The consistency of the pattern
observed across all OHPAH except catechol suggests that the use of a deuterated mid-
weight hydroxylated PAH surrogate could be useful for the quantitation of these
compounds at the SPE stage. With the exception of some catechol, carryover of OHPAH
to fraction C was not observed.
3.4 Stage 3: Full method recovery tests
The recovery of target analytes after full method tests (Table 4) demonstrated greater
variability than SPE-matrix tests, which was expected due to the inherent heterogeneity
of soil and greater number of steps involved in sample preparation (Gerlach and
Nocerino, 2003). For standards and Soil 3, the average recoveries of PAH and deuterated
surrogates were generally very good (77-129%), with the exception of enhanced recovery
of SR4 compounds, observed across all matrices, as well as lower recovery and greater
variability for the more volatile compounds in SR groups 1 and 2. For Soils 1 and 2,
despite low RSD in concentrations (< 10% for most PAH), at the high concentrations of
specific PAH present in the original soils, this variability exceeded and thus masked the
contribution of the spike used for recovery calculation, leading to calculated values not
representative of true extraction recovery (e.g. > 400% and /or negative values). The PAH
calculated recoveries impacted specifically in this way have been marked not
representative, ‘NR’, in Table 3. In most cases, the recovery of the associated deuterated
surrogate indicated that the method had similar recovery to Soil 3. In some cases, very
high recovery values obtained for the surrogate suggest the presence of residual matrix
enhancement effects e.g. for mid-weight PAH (SR2-SR4) in Soil 1 and to a lesser extent
in Soil 2. However, strong agreement between final quantitation for mid-weight PAH
using this method and alternate analysis using simple DCM extraction (agreement within
1-15% without surrogate adjustment, data not shown) suggests matrix enhancements may
have impacted lower-concentration analytes including surrogates, but did not
substantially impact quantitation of high-concentration PAH (2-3 orders of magnitude
higher) reported here.
Recovery of OPAH followed similar trends to PAH. Strong recoveries were obtained for
standards and Soil 3, while Soil 1 yielded non-representative values due to elevated
concentrations which masked the spike contribution. For Soil 2, the OPAH enhanced
recovery is likely attributed to the residual matrix effects also observed for lower-
concentration PAH in groups SR2-SR4. Surrogate recovery adjustment increased RSD
and had a negative effect on calculated recovery for both 1-indanone and 9-fluorenone in
standards, Soil 2, and Soil 3, but tended to reduce RSD and improve calculated recovery
for 9-fluorenone in Soil 1 and 9, 10-anthaquinone in all soils. In the latter cases, where
surrogate adjustment offered improvements during recovery tests, the benefit of using
this factor during final quantitation was ambiguous: adjustment either increased RSD, or
did not substantially impact final quantitation. The inconsistencies and lack of clear
benefit observed in these tests suggest use of the deuterated PAH as surrogates for
tracking full-method recovery and quantitation of OPAH in soils is not suitable as a
general approach.
The recovery of OHPAH for standards generally ranged between 68 and 89%, agreeing
within ~10% with the matrix-SPE tests, with the exception of catechol, which was not
recovered in any of the extraction-SPE tests. For the recovered OHPAH, deviations from
the matrix-SPE recovery levels were greater when soil was present in the extraction (vs.
standards in Na2SO4) and demonstrated different trends related to specific analyte and
soil type. It is possible that the presence of a more complex matrix improved the
preservation of 1-hydroxyacenaphthene and 9-hydroxyfluorene in solution as suggested
during the matrix-SPE tests, with further enhancements for Soil 1 following trends for
mid-weight PAH and OPAH in Fraction A. This does not appear to hold for the other
OHPAH. In the case of 1-hydroxynaphthalene (recoveries ranging between 31 and 77%),
the trend may reflect a trade-off between increased preservative effect of the more
complex matrices and the more extended evaporation period required to concentrate
highly contaminated sample extracts prior to SPE. It could also be related to the
differential sorption on soil particles. For 1-hydroxypyrene and especially 9-
hydroxyphenanthrene, the range of recoveries across soil types was substantial (30-81%
and 11-145%, respectively), and did not follow a clear trend associated with
contamination level or preparative evaporation time. Instead, particularly low recovery of
these compounds for Soil 2 and 3 can be best explained by the substantial and increasing
proportion of clay in the soil mass (Biswas et al., 2015). The small size of clay particles
as well as specific structure and charge characteristics of the minerals offers substantial
sorptive capacity in soils even for non-polar PAH, and may also restrict the extractability
of related aromatic compounds (Biswas et al., 2015). Low recovery of 9-
hydroxyphenanthrene from clay soils has also been reported by Bandowe and Wilke
(2010). As 9-hydroxyphenanthrene and 9-hydroxypyrene displayed similar trends in soil
extractions, the use of deuterated hydroxy-pyrene as a surrogate could improve
quantitation of both compounds without leading to overestimation of 9-
hydroxyphenanthrene. Similarly, use of a 2.5-ring deuterated OHPAH could help track
recovery could improve quantitation of 1-hydroxyacenaphthene and 9-hydroxyfluorene.
With the exception of lower recovery of 1-hydroxypyrene, this method offered a
comparable or better range of OHPAH recoveries to those reported in previous methods
targeting only OHPAH using methanol extraction followed by silica-SPE (Avagyan et
al., 2015), or using water+ACN extraction followed by C18-SPE or dispersive liquid
liquid microextraction and GC-MS (Wang et al., 2012). In comparison to methods
targeting a range of functionalities, this method demonstrated elevated recovery of a
greater number of target OHPAH when compared to accelerated solvent extraction (ASE)
+ silica clean-up and GC-MS analysis (Bandowe and Wilcke, 2010), especially when the
contaminated soils presented here are considered. Improvements over the ASE-silica
method were substantial for 9-hydroxyfluorene specifically (91 % vs ~60 %), and were
similar to those obtained using a Soxhlet extraction and silica/strong base clean up step
followed by HPLC analysis (93 %) (Meyer et al., 1999). Recoveries of hydroxy-
naphthalenes for the current method were within range of and in some cases higher (by
~10-40 %), than those presented in the ASE-silica method but were lower compared to
the Soxhlet-silica/strong base/HPLC approach. Although the coarser texture of soil used
in the development of the latter method may have improved recovery of these compounds
through reduced sorption, our investigation also suggests that particle size shifts are not
the primary controlling factor for recovery of 1-hydroxynaphthalene, and more likely, the
evaporative step included prior to preparative chromatography is responsible for losses
observed here.
3.5 Stage 4: Characterization of unspiked tests soils
3.5.1 Qualitative identification of polyaromatic compounds
SPE offered substantial clean-up and fractionation capacities for the analysis of PAH,
OPAH, and OHPAH in uncontaminated and contaminated soils (Figure 4). In the most
contaminated soils, target breakdown products were difficult to detect in whole extracts
even when these compounds were spiked directly into the extract, as in the load solutions
for matrix-SPE tests. Interferences in the complex soil matrix led to poor
chromatographic resolution (Figure 4a), obscurance of analyte mass spectral pattern, and
possibly limited derivatization or ionization of these compounds. Fractionation assisted
the identification of target compounds in these soils, which would otherwise not have
passed detection criteria. In the unspiked sample presented in Figure 4, only 2 of 5 target
OHPAH detected in fraction B, and only 2 of 6 (or of 7 if the presence of 9-fluorenone is
indicative of fluorene-9-carboxylic acid) acid transformation products detected in
fraction C were identified in the derivatized whole extract. The reduction of interferents
in fraction A also improved signals for 9-fluorenone and 9,10- anthraquinone.
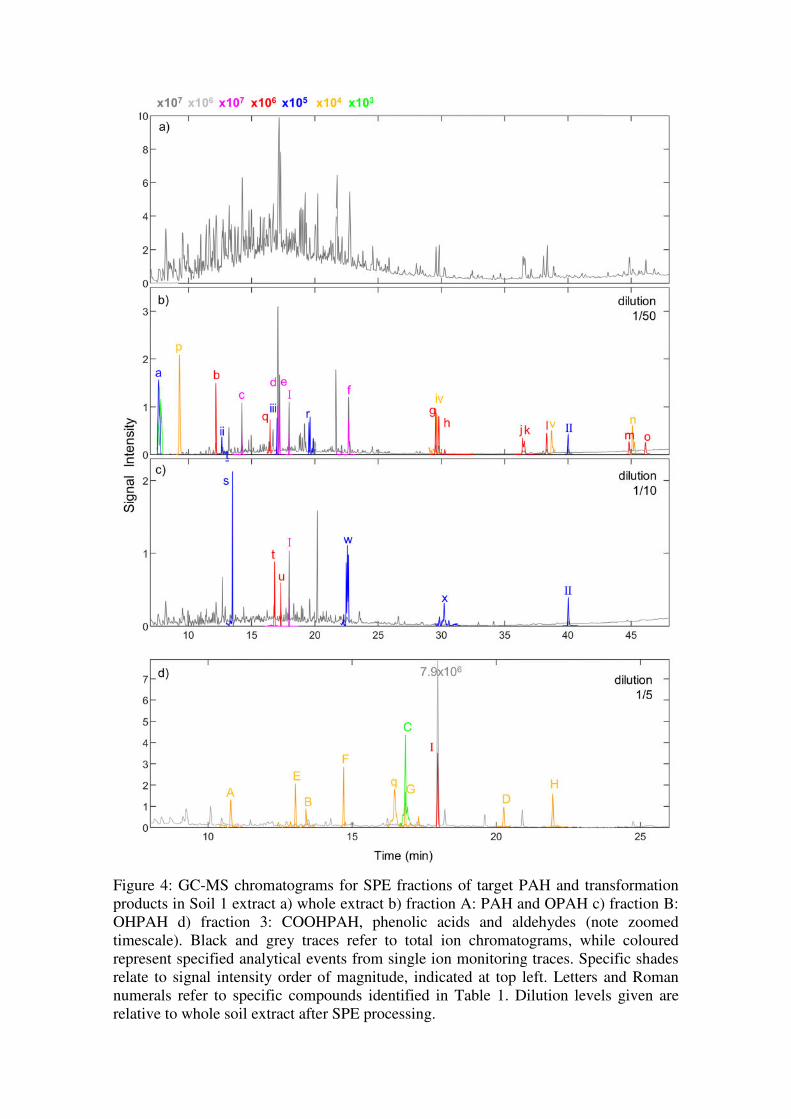
Figure 4: GC-MS chromatograms for SPE fractions of target PAH and transformation products in Soil 1 extract a) whole extract b) fraction A: PAH and OPAH c) fraction B: OHPAH d) fraction 3: COOHPAH, phenolic acids and aldehydes (note zoomed timescale). Black and grey traces refer to total ion chromatograms, while coloured represent specified analytical events from single ion monitoring traces. Specific shades relate to signal intensity order of magnitude, indicated at top left. Letters and Roman numerals refer to specific compounds identified in Table 1. Dilution levels given are relative to whole soil extract after SPE processing.
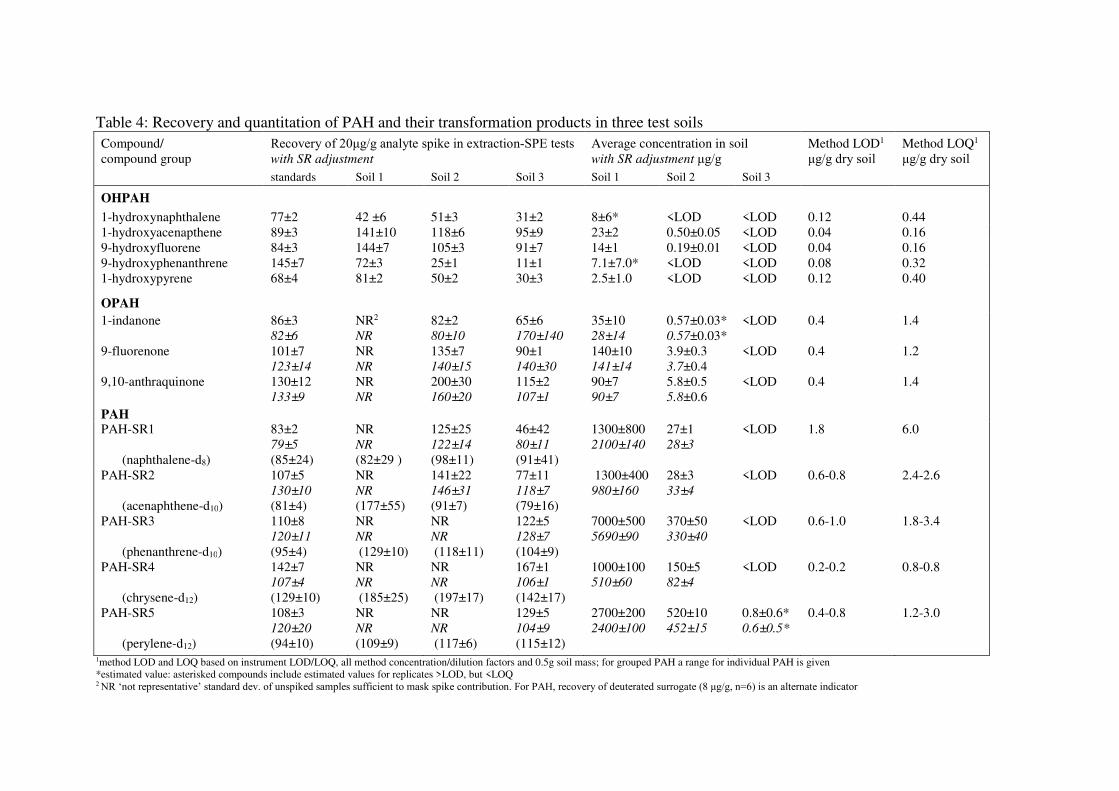
Table 4: Recovery and quantitation of PAH and their transformation products in three test soils Compound/ compound group
Recovery of 20μg/g analyte spike in extraction-SPE tests with SR adjustment
Average concentration in soil with SR adjustment μg/g
Method LOD1
μg/g dry soil Method LOQ1
μg/g dry soil standards Soil 1 Soil 2 Soil 3 Soil 1 Soil 2 Soil 3
OHPAH
1-hydroxynaphthalene 77±2 42 ±6 51±3 31±2 8±6* <LOD <LOD 0.12 0.44 1-hydroxyacenapthene 89±3 141±10 118±6 95±9 23±2 0.50±0.05 <LOD 0.04 0.16 9-hydroxyfluorene 84±3 144±7 105±3 91±7 14±1 0.19±0.01 <LOD 0.04 0.16 9-hydroxyphenanthrene 145±7 72±3 25±1 11±1 7.1±7.0* <LOD <LOD 0.08 0.32 1-hydroxypyrene 68±4 81±2 50±2 30±3 2.5±1.0 <LOD <LOD 0.12 0.40
OPAH
1-indanone 86±3 82±6
NR2
NR
82±2 80±10
65±6 170±140
35±10 28±14
0.57±0.03* 0.57±0.03*
<LOD 0.4 1.4
9-fluorenone 101±7 123±14
NR NR
135±7 140±15
90±1 140±30
140±10 141±14
3.9±0.3 3.7±0.4
<LOD 0.4 1.2
9,10-anthraquinone 130±12 133±9
NR NR
200±30 160±20
115±2 107±1
90±7 90±7
5.8±0.5 5.8±0.6
<LOD 0.4 1.4
PAH PAH-SR1
(naphthalene-d8)
83±2 79±5
(85±24)
NR NR
(82±29 )
125±25 122±14
(98±11)
46±42 80±11
(91±41)
1300±800 2100±140
27±1 28±3
<LOD 1.8 6.0
PAH-SR2
(acenaphthene-d10)
107±5 130±10
(81±4)
NR NR
(177±55)
141±22 146±31
(91±7)
77±11 118±7
(79±16)
1300±400 980±160
28±3 33±4
<LOD 0.6-0.8 2.4-2.6
PAH-SR3
(phenanthrene-d10)
110±8 120±11
(95±4)
NR NR
(129±10)
NR NR
(118±11)
122±5 128±7
(104±9)
7000±500 5690±90
370±50 330±40
<LOD 0.6-1.0 1.8-3.4
PAH-SR4
(chrysene-d12)
142±7 107±4
(129±10)
NR NR
(185±25)
NR NR
(197±17)
167±1 106±1
(142±17)
1000±100 510±60
150±582±4
<LOD 0.2-0.2 0.8-0.8
PAH-SR5
(perylene-d12)
108±3 120±20
(94±10)
NR NR
(109±9)
NR NR
(117±6)
129±5 104±9
(115±12)
2700±200 2400±100
520±10452±15
0.8±0.6* 0.6±0.5*
0.4-0.8 1.2-3.0
1method LOD and LOQ based on instrument LOD/LOQ, all method concentration/dilution factors and 0.5g soil mass; for grouped PAH a range for individual PAH is given *estimated value: asterisked compounds include estimated values for replicates >LOD, but <LOQ 2 NR ‘not representative’ standard dev. of unspiked samples sufficient to mask spike contribution. For PAH, recovery of deuterated surrogate (8 μg/g, n=6) is an alternate indicator
A search in the National Institute of Standards and Technology (NIST) library for Soil 1
extracts (70 % match, following Chibwe et al., 2017) indicated the presence of additional
polyaromatic compounds (PAC) which could suggest extended utility of this SPE method
for a greater number of target compounds. Fraction A also revealed the presence of
alkanes, additional PAH and alkyl PAH, S- and O- heterocyclic compounds, as well as
additional carbonyl substituted PAC including 2-Butyl-10H-acridin-9-one and
benzanthraquinone. Fraction B also contained a variety of semi-polar aromatic
compounds, including cresols and other alkylated phenols, additional OH-phenanthrenes,
a greater number of N-heterocyclic PAC and cyano, amino- and nitro-substituted PAH,
as well as PAC with multiple polar functional groups. Fraction C indicated the presence
of additional monoaromatic aldehydes such as 3-Methyl-p-anisaldehyde and 2,5-
thiophenedicarboxaldehyde, as well as additional phenolic acids 4-methyl-2-
hydroxybenzoic acid.
3.5.2 Quantitation of target analytes in soils
Concentrations of target analytes in soils are summarized in Table 4. Levels of PAH were
highest in Soil 1, while PAH concentrations in Soil 2 were more moderate but at the mid-
high range of for industrially contaminated soils presented in Arp et al. (2014). Minimal
levels of high molecular weight PAH were detected in Soil 3, which could reflect the
presence of combustion materials in the urban environment; more specifically, the
relative abundance of benzo[a]pyrene as a proportion of benzo[a]pyrene + chrysene totals
(i.e. ratio > 0.35) may suggest the presence of coal combustion residues (Tobiszewski and
Namieśnik, 2012). Concentrations of target oxygenated PAH were also highest in Soil 1
with lower levels detected in Soil 2. OPAH concentrations in Soil 1 and 2 were in line
with those observed for other industrial soils with high-range and mid-range
contamination levels, respectively (Arp et al., 2014). Comparison for OHPAH was
somewhat more difficult due to the paucity of studies reporting concentrations of these
compounds, but in general OHPAH concentrations here tended to be higher than those
reported across soils of varying land-use histories (Pulleyblank et al., 2019). Soil 2
indicated levels that are similar to those evaluated for ERM-CC013a, obtained from a
former gasworks sites in Berlin (Bandowe and Wilke, 2010), while Soil 1 indicated levels
substantially higher levels than have previously been reported. This was likely related to
the overall very high levels of contamination in this soil when compared to other
industrial sites (Arp et al., 2014).
4 Conclusions
The developed SPE method using aminopropyl silica showed good performance for the
separation of PAH and oxygenated PAH into relevant groups for subsequent instrumental
analysis by GC-MS, while improving recovery and/or reducing materials and simplifying
preparation compared to previous methods. The combined extraction+ SPE method
showed strong reproducibility for the quantitation of PAH, OPAH, and most OHPAH in
individual soils, and offered further qualitative information for some COOHPAH and
phenolic acids and aldehydes. We demonstrated that the level of contamination and
proportion of clay in the soil matrix may impact recovery at different stages of the
protocol. In many cases, this may be adequately accounted for through the use of suitable
deuterated surrogate compounds. The increased availability of a range of labelled
oxygenated PAH would be especially useful when recovery is to be monitored throughout
the full extraction method. The method presented here can be used to compare soils or to
monitor changes in concentrations of these analytes in individual soils over time. In order
to support the establishment of best practices for managing short- and long-term risk from
oxygenated PAH at and downstream from contaminated sites, we recommend the
continued development, adoption, and standardization of analytical protocols which
include these compounds alongside parent PAH.
Acknowledgements: This work was completed as part of the REMEDIATE (Improved
decision-making in contaminated land site investigation and risk assessment) H2020
Marie Skłodowska-Curie Actions (Grant agreement n. 643087). We further thank
Ecologia Environmental Solutions Limited and Paddock Geo Engineering for providing
the contaminated soil samples necessary for this study.
5. References
Abdel-Shafy, H.I., Mansour, M.S.M., 2016. A review on polycyclic aromatic hydrocarbons: Source, environmental impact, effect on human health and remediation. Egypt. J. Pet. 107-123 https://doi.org/10.1016/j.ejpe.2015.03.011
Alegbeleye, O.O., Opeolu, B.O., Jackson, V.A., 2017. Polycyclic Aromatic Hydrocarbons: A Critical Review of Environmental Occurrence and Bioremediation. Environ. Manage. 60, 758–783. https://doi.org/10.1007/s00267-017-0896-2
Andersson, B.E., Lundstedt, S., Tornberg, K., Schnürer, Y., Öberg, L.G., Mattiasson, B., 2003. Incomplete degradation of polycyclic aromatic hydrocarbons in soil inoculated with wood-rotting fungi and their effect on the indigenous soil bacteria. Environ. Toxicol. Chem. 22, 1238–1243. https://doi.org/10.1897/1551-5028(2003)022<1238:IDOPAH>2.0.CO;2
Andersson, J.T., Achten, C., 2015. Time to say goodbye to the 16 EPA PAHs? Toward an up-to-date use of PACs for environmental purposes. Polycycl. Aromat. Compd. 35, 330–354. https://doi.org/10.1080/10406638.2014.991042
Arp, H.P.H., Lundstedt, S., Josefsson, S., Cornelissen, G., Enell, A., Allard, A.S., Kleja, D.B., 2014. Native oxy-PAHs, N-PACs, and PAHs in historically contaminated soils from Sweden, Belgium, and France: Their soil-porewater partitioning behavior, bioaccumulation in Enchytraeus crypticus, and bioavailability. Environ. Sci. Technol. 48, 11187–11195. https://doi.org/10.1021/es5034469
Avagyan, R., Nyström, R., Boman, C., Westerholm, R., 2015. Determination of hydroxylated polycyclic aromatic hydrocarbons by HPLC-photoionization tandem mass spectrometry in wood smoke particles and soil samples. Anal. Bioanal. Chem. 407, 4523–4534. https://doi.org/10.1007/s00216-015-8638-x
Bandowe, B.A.M., Wilcke, W., 2010. Analysis of polycyclic aromatic hydrocarbons and their oxygen-containing derivatives and metabolites in soils. J. Environ. Qual. 39, 1349. https://doi.org/10.2134/jeq2009.0298
Biswas, B., Sarkar, B., Rusmin, R., Naidu, R., 2015. Bioremediation of PAHs and VOCs: Advances in clay mineral-microbial interaction. Environ. Int. 85, 168–81. https://doi.org/10.1016/j.envint.2015.09.017
Chibwe, L., Davie-Martin, C.L., Aitken, M.D., Hoh, E., Massey Simonich, S.L., 2017. Identification of polar transformation products and high molecular weight polycyclic aromatic hydrocarbons (PAHs) in contaminated soil following bioremediation. Sci. Total Environ. 599–600, 1099–1107. https://doi.org/10.1016/j.scitotenv.2017.04.190
Chibwe, L., Geier, M.C., Nakamura, J., Tanguay, R.L., Aitken, M.D., Simonich, S.L.M., 2015. Aerobic bioremediation of PAH contaminated soil results in increased genotoxicity and developmental toxicity. Environ. Sci. Technol. 49, 13889–13898. https://doi.org/10.1021/acs.est.5b00499
Cochran, R.E., Dongari, N., Jeong, H., Beránek, J., Haddadi, S., Shipp, J., Kubátová, A., 2012. Determination of polycyclic aromatic hydrocarbons and their oxy-, nitro-, and hydroxy-oxidation products. Anal. Chim. Acta 740, 93–103. https://doi.org/10.1016/j.aca.2012.05.050
Gerlach, R.., Nocerino, J.M., 2003. USEPA/600/R-03/027 Guidance for obtaining representative laboratory anlaytical subsamples from particulate laboratory samples.
Hu, J., Adrion, A.C., Nakamura, J., Shea, D., Aitken, M.D., 2014. Bioavailability of (geno)toxic contaminants in polycyclic aromatic hydrocarbon–contaminated soil before and after biological treatment. Environ. Eng. Sci. 31, 176–182. https://doi.org/10.1089/ees.2013.0409
BS-EN 13654-2. 2001. Soil improvers and growing media; Determination of nitrogen. Dumas method.
BS EN 13039 2000. Soil improvers and mrowing media. Determination of organic matter content and ash.
ISO 10390, 2005. Soil Quality – Determination of pH. 7pp available at https://www.iso.org/standard/40879.html
ISO 11277, 2009. Soil quality -- Determination of particle size distribution in mineral soil material - Method by sieving and sedimentation. 34pp, available at https://www.iso.org/standard/54151.html
Jiang, Y., Brassington, K.J., Prpich, G., Paton, G.I., Semple, K.T., Pollard, S.J.T., Coulon, F., 2016. Insights into the biodegradation of weathered hydrocarbons in contaminated soils by bioaugmentation and nutrient stimulation. Chemosphere 161, 300–307. https://doi.org/10.1016/j.chemosphere.2016.07.032
Knecht, A.L., Goodale, B.C., Truong, L., Simonich, M.T., Swanson, A.J., Matzke, M.M., Anderson, K.A., Waters, K.M., Tanguay, R.L., 2013. Comparative developmental toxicity of environmentally relevant oxygenated PAHs. Toxicol. Appl. Pharmacol. 271, 266–275. https://doi.org/10.1016/j.taap.2013.05.006
Letzel, T., Pöschl, U., Wissiack, R., Rosenberg, E., Grasserbauer, M., Niessner, R., 2001. Phenyl-modified reversed-phase liquid chromatography coupled to atmospheric pressure chemical ionization mass spectrometry: A universal method for the analysis of partially oxidized aromatic hydrocarbons. Anal. Chem. 73, 1634–1645. https://doi.org/10.1021/ac001079t
Lundstedt, S., Bandowe, B.A.M., Wilcke, W., Boll, E., Christensen, J.H., Vila, J., Grifoll, M., Faure, P., Biache, C., Lorgeoux, C., Larsson, M., Frech Irgum, K., Ivarsson, P., Ricci, M., 2014. First intercomparison study on the analysis of oxygenated polycyclic aromatic hydrocarbons (oxy-PAHs) and nitrogen heterocyclic polycyclic aromatic compounds (N-PACs) in contaminated soil. TrAC Trends Anal. Chem. 57, 83–92. https://doi.org/10.1016/j.trac.2014.01.007
Lundstedt, S., Persson, Y., Öberg, L., 2006. Transformation of PAHs during ethanol-Fenton treatment of an aged gasworks’ soil. Chemosphere 65, 1288–1294. https://doi.org/10.1016/j.chemosphere.2006.04.031
Lundstedt, S., White, P.A., Lemieux, C.L., Lynes, K.D., Lambert, I.B., Öberg, L., Haglund, P., Tysklind, M., 2007. Sources, fate, and toxic hazards of oxygenated polycyclic aromatic hydrocarbons (PAHs) at PAH-contaminated sites. AMBIO A J. Hum. Environ. 36, 475–485. https://doi.org/10.1579/0044-7447(2007)36[475:SFATHO]2.0.CO;2
Meyer, S., Cartellieri, S., Steinhart, H., 1999. Simultaneous determination of PAHs, hetero-PAHs (N, S, O), and their degradation products in creosote-contaminated soils. Method development, validation, and application to hazardous waste sites. Anal. Chem. 71, 4023–4029. https://doi.org/10.1021/ac990136j
Meyer, W., Seiler, T.B., Reininghaus, M., Schwarzbauer, J., Püttmann, W., Hollert, H., Achten, C., 2013. Limited waterborne acute toxicity of native polycyclic aromatic compounds from coals of different types compared to their total hazard potential. Environ. Sci. Technol. 47, 11766–11775. https://doi.org/10.1021/es401609n
Murphy, B.T., Reilly, S.S.O., Monteys, X., Reid, B.F., Szpak, M.T., Mccaul, M. V, Jordan, S.F., Allen, C.C.R., Kelleher, B.P., 2016. The occurrence of PAHs and faecal sterols in Dublin Bay and their in fl uence on sedimentary microbial communities. MPB 106, 215–224. https://doi.org/10.1016/j.marpolbul.2016.02.066
Natural England Technical Information Note TIN037, 2008. Soil Texture. pp. 1–6. N.
Nomura, A., Jones, C.W., 2013. Amine-functionalized porous silicas as adsorbents for aldehyde abatement. ACS Appl. Mater. Interfaces 5, 5569–5577. https://doi.org/10.1021/am400810s
Obrist, D., Zielinska, B., Perlinger, J.A., 2015. Accumulation of polycyclic aromatic hydrocarbons (PAHs) and oxygenated PAHs (OPAHs) in organic and mineral soil horizons from four U.S. remote forests. Volume 134, 98-105. Chemosphere https://doi.org/10.1016/j.chemosphere.2015.03.087
Pinkart, H.C., Devereux, R., Chapman, P.J., 1998. Rapid separation of microbial lipids using solid phase extraction columns. J. Microbiol. Methods. 34, 9-15 https://doi.org/10.1016/S0167-7012(98)00060-8
Pulleyblank, C., Cipullo, S., Campo, P., Kelleher, B., Coulon, F., 2019. Analytical progress and challenges for the detection of oxygenated polycyclic aromatic hydrocarbon transformation products in aqueous and soil environmental matrices : A review transformation products in aqueous and soil. Crit. Rev. Environ. Sci. Technol. 49, 357–409. https://doi.org/10.1080/10643389.2018.1547622
Schrlau, J.E., Kramer, A.L., Chlebowski, A., Truong, L., Tanguay, R.L., Simonich, S.L.M., Semprini, L., 2017. Formation of Developmentally Toxic Phenanthrene Metabolite Mixtures by Mycobacterium sp. ELW1. Environ. Sci. Technol. 51, 8569–8578. https://doi.org/10.1021/acs.est.7b01377
Schummer, C., Delhomme, O., Appenzeller, B.M.R., Wennig, R., Millet, M., 2009. Comparison of MTBSTFA and BSTFA in derivatization reactions of polar compounds prior to GC/MS analysis. Talanta 77, 1473–1482. https://doi.org/10.1016/j.talanta.2008.09.043
Tobiszewski, M., Namieśnik, J., 2012. PAH diagnostic ratios for the identification of pollution emission sources. Environ. Pollut. 162, 110–119. https://doi.org/10.1016/j.envpol.2011.10.025
Wang, X., Lin, L., Luan, T., Yang, L., Tam, N.F.Y., 2012. Determination of hydroxylated metabolites of polycyclic aromatic hydrocarbons in sediment samples by combining

subcritical water extraction and dispersive liquid-liquid microextraction with derivatization. Anal. Chim. Acta 753, 57–63. https://doi.org/10.1016/j.aca.2012.09.028
Woudneh, M.B., Benskin, J.P., Grace, R., Hamilton, M.C., Magee, B.H., Hoeger, G.C., Forsberg, N.D., Cosgrove, J.R., 2016. Quantitative determination of hydroxy polycylic aromatic hydrocarbons as a biomarker of exposure to carcinogenic polycyclic aromatic hydrocarbons. J. Chromatogr. A 1454, 93–100. https://doi.org/10.1016/j.chroma.2016.05.057