effects of heavy drinking, binge drinking, and family history of alcoholism on regional brain...
TRANSCRIPT
Effects of Heavy Drinking, Binge Drinking, and FamilyHistory of Alcoholism on Regional Brain Metabolites
D. J. Meyerhoff, R. Blumenfeld, D. Truran, J. Lindgren, D. Flenniken, V. Cardenas, L. L. Chao, J. Rothlind,C. Studholme, and M. W. Weiner
Background: The main goals are to investigate the effects of chronic active heavy drinking onN-acetylaspartate (NAA) and other metabolites throughout the brain and to determine whether they areaffected by family history (FH) of alcoholism and long-term drinking pattern.
Methods: Forty-six chronic heavy drinkers (HD) and 52 light drinkers (LD) were recruited from thecommunity and compared on measures of regional brain structure using magnetic resonance imaging andmeasures of common brain metabolites in gray matter (GM) and white matter (WM) of the major lobes,subcortical nuclei, brainstem, and cerebellum using short–echo time magnetic resonance spectroscopicimaging. Regional atrophy-corrected levels of NAA, myoinositol (mI), creatine, and choline-containingmetabolites were compared as a function of group, FH of alcoholism, and bingeing.
Results: Frontal WM NAA was lower in FH-negative HD than FH-positive HD and tended to be lowerin women than men. Creatine-containing metabolites in parietal GM were higher in HD than LD. FH-negative compared with FH-positive HD also had more mI in the brainstem and tended to have lower NAAand more mI in frontal GM. Although parietal GM NAA was not significantly lower in HD than LD, it waslower in non–binge drinkers than bingers. Frontal WM NAA was lower in HD than LD, with the differencedriven by a small number of women, FH-negative HD, and older age. Lower frontal WM NAA in HD wasassociated with lower executive and working memory functions and with lower P3b amplitudes at frontalelectrodes.
Conclusions: Community-dwelling HD who are not in alcoholism treatment have brain metabolitechanges that are associated with lower brain function and are likely of behavioral significance. Age, FH, andbinge drinking modulate brain metabolite abnormalities. Metabolite changes in active HD are less pro-nounced and present with a different spatial and metabolite pattern than reported in abstinent alcoholics.
Key Words: Magnetic Resonance, Brain, Social Drinking, Binge Drinking, Family History.
LONG-TERM CHRONIC ALCOHOL consumption isassociated with regional structural and metabolite
brain damage, as determined by human neuroimaging stud-ies (e.g., Rosenbloom et al., 1995; Sullivan, 2000). Thisconclusion has been drawn from studies typically per-formed in short-term sober alcoholics recruited from sub-stance abuse treatment programs. These treatment-seekingindividuals represent only a small fraction of the approxi-mately 9% of American adults who exhibit an alcohol usedisorder at some time during their lives (Grant, 1994a,b;Harwood et al., 1994) but never undergo alcoholism treat-
ment. Socially functioning heavy drinkers (HD) often donot recognize that their level of drinking constitutes aproblem that warrants treatment. It is unknown to whatextent such active HD display structural or metabolic braindamage, whether the spatial pattern of potential damage issimilar to that described in sober recovering alcoholics, andto what extent such damage is associated with cognitivedeficits that may interfere with daily routines. On the basisof the available literature and epidemiological data, wepreviously hypothesized (Fein et al., 2002) that alcohol-dependent subjects who seek treatment have more comor-bid conditions—including substance abuse, affective symp-toms, and other psychopathology—than the sociallyfunctioning HD population. Therefore, it cannot be as-sumed that the brain damage described in alcohol-dependent treatment samples appropriately reflects thetype, extent, and magnitude of brain damage possiblypresent in community samples of socially functioningdrinkers.
Genetic factors, including a family history of alcoholism(FHA), may play a role in the vulnerability to, and severityof, alcohol-induced brain damage (McGue, 1994). Also, thepattern of heavy drinking, i.e., binge alcohol drinking as
From the Departments of Radiology (DJM, VC, LLC, CS, MWW), Med-icine (MWW), Psychiatry (JR, MWW), and Neurology (MWW), University ofCalifornia–San Francisco; and MR Unit (DJM, RB, DT, JL, DF, VC, LLC,JR, CS, MWW), Department of Veterans Affairs Medical Center, San Fran-cisco, California.
Received for publication June 30, 2003; accepted December 18, 2003.Funded by an NIAAA program project grant (AA11493), originally
awarded to Dr. George Fein.Reprint requests: Dieter J. Meyerhoff, Dr.rer.nat., Magnetic Resonance
Unit (114M), Veterans Affairs Medical Center, 4150 Clement St. 114M, SanFrancisco, CA 94121; Fax: 415-668-2864; E-mail: [email protected].
Copyright © 2004 by the Research Society on Alcoholism.
DOI: 10.1097/01.ALC.0000121805.12350.CA
0145-6008/04/2804-0650$03.00/0ALCOHOLISM: CLINICAL AND EXPERIMENTAL RESEARCH
Vol. 28, No. 4April 2004
650 Alcohol Clin Exp Res, Vol 28, No 4, 2004: pp 650–661
opposed to continual heavy drinking, may be a significantand specific contributor to brain damage in chronic alco-holics (Agartz et al., 1999; Crews, 1999; Crews et al., 2000;Fadda and Rossetti, 1998; Hunt, 1993a). Therefore, weexamined the effects of FHA and drinking pattern on braindamage.
Proton magnetic resonance spectroscopy imaging (1HMRSI) studies of abstinent alcoholics in treatment showalterations of brain metabolites primarily in the frontallobes, cerebellum, and thalami—mostly brain regions thatalso show tissue loss at neuroimaging and pathologicchanges at autopsy (Sullivan, 2000). These metabolite al-terations are consistent with regional neuronal/axonal dam-age [inferred from N-acetylaspartate (NAA) concentra-tions] and with changes in glial and general cell membranemetabolism [inferred from myoinositol (mI) measures].Recently, we showed in a preliminary study that NAAconcentrations are indeed low in the frontal WM of activeHD (Goldmann et al., 2000); this prompted us to investi-gate metabolite levels throughout the brains of these indi-viduals by using multislice 1H MRSI.
Our primary hypothesis was that in HD compared withlight drinkers (LD), NAA is lower and mI is higher in thosebrain regions that are also affected in recovering alcoholics,i.e., the frontal lobes, cerebellum, and thalamus. A second-ary aim was to determine the extent to which the density ofFHA affects chronic alcohol-induced brain metabolitechanges. Then, we hypothesized that a predominant pat-tern of binge drinking is associated with greater NAA lossand higher mI than continual heavy drinking. Finally, weassessed the clinical relevance of metabolite alterations bycorrelation with cognitive test performance and electro-physiological characteristics, knowing that recently absti-nent alcoholics have impaired executive or frontal lobefunctions (Fein et al., 1990; Oscar-Berman, 2000; Parsonsand Nixon, 1993; Ratti et al., 1999) and that heavy socialdrinkers have been hypothesized to have at least mildcognitive deficits (Parsons and Nixon, 1998). Specifically,we hypothesized that lower frontal lobe NAA in HD isassociated with lower executive functioning and workingmemory and with smaller P3a amplitude, as well as pro-longed latency of P3 event-related potentials.
METHODS
Participants
LD and HD were recruited from the general community via advertise-ments in local newspapers and flyers. Table 1 lists demographic andalcohol use data on 46 chronic HD (8 women) and 52 LD (20 women)participating in this study. The enrollment criterion for HD was theconsumption of more than an average of 100 alcoholic drinks per monthfor men over 3 years before the study (80 drinks for women). A drink wasdefined as containing 13.6 g of pure alcohol. The criterion for LD was theconsumption of fewer than an average of 45 drinks per month for men (35for women) over lifetime. Drinking history since the onset of regulardrinking (defined as drinking more than one alcoholic drink per month)was ascertained by using a structured interview (Skinner and Sheu, 1982;Sobell and Sobell, 1992; Sobell et al., 1988). An individual who over 3
years before the study drank on average more than 100 alcoholic drinksper month (80 for women) on fewer than 21 drinking days per month (i.e.,not a daily continual drinker) was defined as a binge drinker. This workingdefinition accepts bingeing as the consumption of more than five drinksper day (four for women) but not per occasion and is therefore slightlydifferent from definitions used in the literature (Wechsler and Austin,1998). An FHA was obtained via questionnaire (Mann et al., 1985) byasking participants to classify all first- and second-degree blood relativesover the age of 18 years as “abstainers,” “social drinkers,” or “problemdrinkers.” Individuals with at least one parent or sibling identified as aproblem drinker were defined as family history–positive (FH�) foralcoholism.
Before the study, all participants gave written, informed consent ap-proved by the institutional review boards of the San Francisco Departmentof Veterans Affairs Medical Center and the University of California–SanFrancisco. All participants were screened to exclude those with a history ofpsychiatric or neurological disorders, a history of head trauma with loss ofconsciousness, human immunodeficiency virus infection, dependence onsubstances other than alcohol within the past 12 months, pregnancy, ormagnetic resonance imaging (MRI) hazards (i.e., metal implants or pace-makers). No HD exhibited neurological signs of Wernicke-Korsakoffsyndrome. Exclusion criteria at the time of study were a positive breathtest for alcohol (i.e., �0.005%, the lower detection level of our breatha-lyzer) or obvious signs of alcohol withdrawal (e.g., nausea or vomiting,tremor, or paroxysmal sweats). Participants were asked to abstain fromdrugs and alcohol for 12 hr before all experimental procedures, and thiswas verified via a short questionnaire. Only those HD were enrolled whocould abstain for up to 12 hr without going into withdrawal. Most HDreported that they usually drank at night after work, only two reportedhaving consumed one and four alcoholic drinks 2 and 10 hr before thestudy, respectively, and less than half of all participants reported drinkingat all within the 24 hr before the MRI study (Table 1). This indicates thatparticipation in this study did not cause significant alterations of drinkers’typical drinking patterns and that HD likely were not in acute alcoholwithdrawal at the time of MRI.
MRI Acquisition and Processing
Brain MRI data were obtained with a standard 1.5-T scanner (Vision,Siemens Medical Systems, Inc., Iselin, NJ). Structural MRI data were
Table 1. Demographic and Drinking History Data in Light Drinkers (LD) andHeavy Drinkers (HD) (mean � SD)
Measure LD HD
n (female) 52 (20) 46 (8)Age, years (range) 41.0 � 8.5 (21–56) 41.3 � 9.4 (27–56)Education, years (range) 15.7 � 2.1 (12–21) 14.0 � 2.0 (11–20)Ethnicitya (%) 76 C, 7 A, 11 L, 6 O 61 C, 27 AA, 10 L, 2 OFamily history (% positive)b 42 65Drinks per month last year 10 � 12 196 � 114Drinks per month last 3 years 11 � 12 204 � 104Drinks per month over lifetime 13 � 11 169 � 126Drinks over lifetime 3373 � 3139 48,715 � 51,543Duration of regular drinking
(years)22.8 � 8.1 23.6 � 9.4
Duration of heavy drinking(years)
NA 22.4 � 9.3
Onset age of heavy drinking(years)
NA 17.5 � 4.9
Time since last alcoholic drinkc
(hr)17.8 � 6.9 (n � 6) 14.0 � 3.9 (n � 22)
Drinks during 24 hr before MRIc 0.50 � 0.65 (n � 6) 2.7 � 3.4 (n � 22)
NA, not applicable.a Self-identified. C, Caucasian; A, Asian; AA, African American; L, Latino; O,
other.b �2 � 4.5; p � 0.05.c In only those who reported drinking more than one drink within the last 24 hr
before MRI.
1H MRSI OF CHRONIC ACTIVE HEAVY DRINKERS 651
acquired by using a double spin-echo sequence with TR, TE1, and TE2(repetition and echo times) of 2500, 20, and 80 msec, respectively; 1 � 1mm2 in-plane resolution; and 50 contiguous 3-mm-thick axial slices ori-ented along an imaginary line connecting the anterior and posteriorcommissures as seen on midsagittal scout MRI. A volumetricmagnetization-prepared rapid gradient echo was acquired with TR, TE,and TI of 10, 5, and 300 msec, respectively; 15° flip angle; 1 � 1 mm2
in-plane resolution; and 1.5-mm-thick coronal partitions oriented alongthe main long axes of bilateral hippocampi as seen on sagittal scout MRI.
To obtain metabolite measures by tissue type, we co-registered MRSIdata with MRIs that had been segmented into gray matter (GM), whitematter (WM), and cerebrospinal fluid (CSF). We used probabilistic seg-mentation of T1-weighted images similar to that in other reported meth-ods (Ashburner and Friston, 2000; Shattuck et al., 2001; Van Leemput etal., 1999; Wells et al., 1996). We then used an atlas-based method toidentify regions of interest (ROI) in the brain (Collins et al., 1994; Dawantet al., 1999; Gee et al., 1993; Iosifescu et al., 1997). A single high-resolution reference MRI was manually edited to delineate ROIs. TheROIs included the hemispheres, the major lobes of the brain, subcorticalstructures, brainstem, and cerebellum. A entropy-driven B-spline free-form deformation program (Studholme et al., 2001a,b) was used to reg-ister each scan to the reference brain. The use of a B-spline model of thedeformation provided a direct, analytical estimate of the transformationthat was then inverted and applied to the atlas labels to demarcatesubject-specific ROIs on each MRI. After careful inspection of all auto-matically marked images for quality, GM, WM, and CSF volumes withinthe lobar ROIs were computed.
MRSI Acquisition and Processing
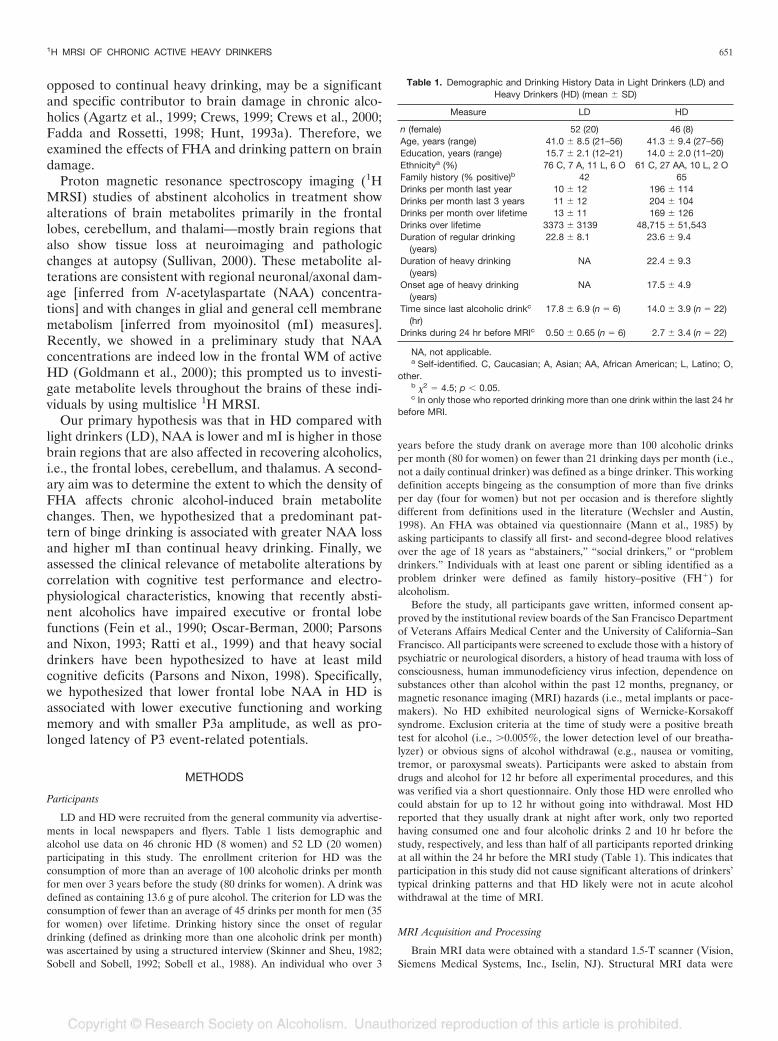
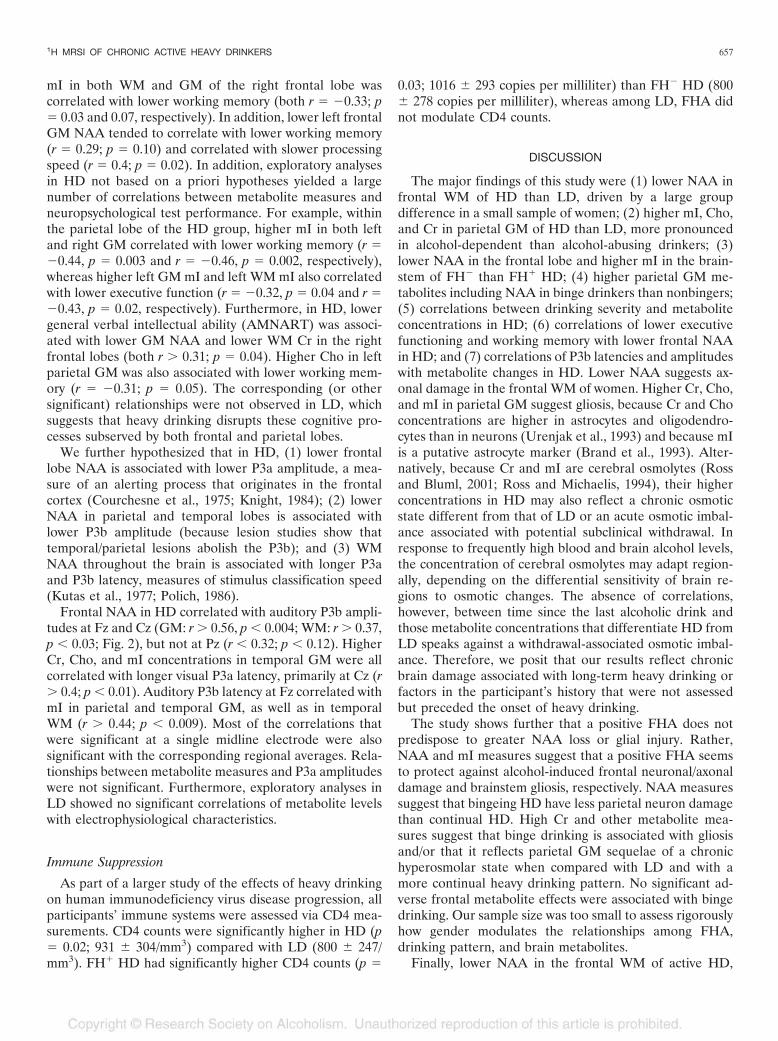
MRI was followed by automated head shimming and a multislice 1HMRSI sequence with TR, TI, and TE of 1800, 165, and 25 msec, respec-tively; circular k-space sampling; and three slices, each 15 mm thick witha slice gap of at least 6 mm, angulated parallel to the double spin-echoslices, covering the major cerebral lobes, subcortical nuclei, brainstem, andthe anterior superior cerebellar vermis (see Fig. 1 for slice positions).Details of the sequence and MRSI results have been published (e.g., Soheret al., 2000; Wiedermann et al., 2001). The total acquisition time wasapproximately 90 min for MRI and MRSI.
Multislice 1H MRSI data processing and analysis were applied offlinewith mostly automated techniques to obtain absolute metabolite concen-trations in all voxels sampled (Soher et al., 2000; Wiedermann et al., 2001).The MRSI dataset was water-suppressed with a finite impulse responsedeconvolution filter (Kuroda et al., 1989), and spectral regions of noise ineach voxel were then suppressed without affecting resonance line widths
by using principal components analysis based on a deformation shape-intensity model (Zhu et al., 2002). Integrals for the resonances corre-sponding to N-acetyl–containing metabolites (NAA), creatine (Cr)-containing metabolites, choline (Cho)-containing metabolites, and mIwere estimated, including baseline correction. Metabolite integrals werecorrected for differences in receiver gain and coil loading between par-ticipants. Furthermore, metabolite peak quantities in each voxel weredivided by the volume fraction of tissue (volumes of GM and WM in thevoxel divided by total voxel volume), which was obtained from the co-registered tissue-segmented MRI (Schuff et al., 2001) (see below). Thefinal result was CSF-corrected absolute metabolite concentrations ex-pressed in institutional units, herein referred to as concentrations. Spectraldata were subjected to automated quality-control measures, and 1H MRSIvoxels that did not meet the following inclusion criteria were rejected fromfurther analysis: (1) spectral line width, 3 to 11 Hz; (2) NAA chemicalshift, 1.96–2.06 ppm; (3) chemical shift difference between Cr and NAApeaks, 0.95–1.07 ppm; (4) chemical shift difference between Cr and mIpeaks, 0.63–0.43 ppm; and (5) volume fraction of brain tissue in voxel,33% or more. Because of this quality-control step, slightly different num-bers of participants contributed to metabolite concentrations derived fordifferent brain regions. Figure 1 shows MRSI slice positions and anexample of the kind of spectroscopic information obtained.
MRI/1H MRSI Co-Processing
To calculate metabolite concentrations for GM and WM in each ROIidentified on MRI, the segmented MRI was spatially co-registered to the1H MRSI dataset and reduced to MRSI resolution, taking into account theMRSI point-spread function, chemical-shift displacement, and slice pro-file (Schuff et al., 2001). This operation permitted computation of thetissue composition of each voxel in the 1H MRSI acquisition volume.Tissue composition values were used to implement CSF correction ofmetabolite concentrations. For each tissue category in each ROI, metab-olite concentrations from all automatically selected voxels containing asufficiently high tissue fraction (volume of targeted tissue category in thevoxel divided by total tissue volume in the voxel) were averaged together.In the various ROIs, “sufficiently high” was defined as 90% or more forfrontal and parietal WM; 80% or more for temporal WM; 60% or morefor frontal GM; 50% or more for parietal GM, temporal GM, cerebellarGM and WM, thalamus, and brainstem tissue; and 30% or more forcaudate and lenticular nucleus tissue. The average numbers of voxels perROI analyzed were as follows: 25 to 60 for lobar WM regions; 35 to 70 forlobar GM regions; 15 to 30 for thalami, lenticular nuclei, and brainstem;18 for vermian WM; and 10 for caudate. Only approximately 40% ofsubjects had more than two caudate spectra of sufficient quality to be
Fig. 1. Example of one slice of a three-slice1H MRSI dataset acquired with TR and TE of1800 and 25 msec, respectively: MRSI slicepositions are overlaid on a midsagittal MRI, aT1-weighted MRI corresponding to the centerof the top MRSI slice, corresponding metabo-lite maps with overlaid MRI outline (left), twoexamples of cortical spectra, their automati-cally determined baselines, and overlaid spec-tral fits.
652 MEYERHOFF ET AL.
included in statistical analyses. Sulcal and ventricular CSF was assumed tohave a concentration of 0 for all metabolites, an assumption supported bya lack of metabolite signal in voxels containing exclusively CSF. Metabo-lite concentrations in bilateral ROIs were analyzed separately by side, butbecause no significant side effects were found, left and right measureswere averaged.
Neurocognitive Testing
Typically within 0 to 7 days of the MRI examination, all participantsunderwent extensive neuropsychological testing (Rothlind et al., 2004,unpublished data). Raw test scores were converted to z scores with refer-ence to the entire sample. Domain scores were calculated by averaging thez scores of the contributing measures. Domains were verbal intelligence,processing speed, balance, working memory, visuospatial function, exec-utive function, and learning and memory. Domain scores were based on aselection of standardized computerized and paper-and-pencil tests (Mey-erhoff et al., 1999), including the MicroCog Computerized Assessment ofCognitive Functioning, Controlled Oral Word Association Test, Wiscon-sin Card Sorting Test, Category Test, Trail Making, Grooved Pegboard,Symbol Digit, Brown-Peterson Auditory Trigrams, American version ofthe Nelson Adult Reading Task (AMNART), California Verbal LearningTest, Rey-Osterrieth Complex Figure Drawing Test, Brief VisuospatialMemory Test, Stroop Test, and Fregly Ataxia Battery. These scores wereused in correlation analyses with metabolite measures to test our a priorihypotheses.
Electrophysiological Measurements Indexing Brain Function
Electrophysiological measurements were obtained, typically within 0 to3 days of the MRI examination, while subjects performed oddball para-digms similar to those described in previous studies (Fein et al., 1995).Methodological differences from Fein et al. included the use of anElectro-Cap (Electro-Cap International, Inc., Eaton, OH) with 64 tinelectrodes and the Neuroscan data-acquisition system (Neuroscan, Inc., ElPaso, TX). We quantified visual and auditory P3a and P3b event-relatedpotential components at three midline electrodes in the frontal (Fz),central (Cz), and parietal (Pz) cortex and averaged over the frontal (FP1,FP2, AF1, AF2, F3, Fz, F4, F7, and F8), central (FC1, FC2, FC5, FC6, C3,Cz, and C4), parietal (CP1, CPz, Cp2, P3, Pz, and P4), and temporal (CP5,Cp6, T3, T4, T5, and T6) electrodes. These measures were used inanalyses of associations with metabolite measures.
Statistical Analysis
We evaluated the categorical effects of HD, drinking pattern, andpresence of FHA on metabolite measures by using the general linearmodel procedures in SAS (SAS Institute Inc., Cary, NC). Initial analysesrevealed gender effects on some outcome measures. Because the relativelysmall proportion of female participants precluded a thorough and mean-ingful analysis with gender as a factor in an ANOVA, we analyzed dataindependently of gender and repeated the analyses on men-only orwomen-only groups. Although the main groups were age matched, age wasused as a covariate in analyses because of known age effects on metabolitemeasures and because of the relatively wide age range of the studyparticipants (21–56 years). Associations within each study group of demo-graphic, drinking, cognitive domain, and electrophysiological variableswith MRSI measures used Spearman correlations, and effects of age werepartialed out where appropriate. Selection of associations was guided byour a priori hypotheses of greater metabolite damage with greater drink-ing severity and with worse scores on neurocognitive or functional tests. Inthese tests of a priori hypotheses, we did not correct for multiple com-parisons. In all tests, p � 0.05 was considered statistically significant,except in metabolite/electrophysiological relationships, where the crite-rion for significance was p � 0.01. All measures are reported as mean �SD.
RESULTS
Participants
All HD were non–treatment seeking at the time of en-rollment and met the DSM-IV criteria for alcohol depen-dence (41 of 46 HD) or abuse (5 of 46 HD) during the lastyear before enrollment. Although none of the HD was in aformal alcoholism treatment at the time of enrollment, anestimated 75% were in motivational conflict about chang-ing their drinking behavior. Therefore, we made a list oftreatment programs in the San Francisco Bay Area avail-able to those who were interested (located at a VeteransAdministration hospital, we were not able to offer treat-ment to our nonveteran HD). As shown in Table 1, HDconsumed an average of 200 standard alcoholic drinks permonth over the last 1 or 3 years before the study and had alifetime average alcohol consumption of 169 monthlydrinks, or 663 kg over 23.6 years of regular drinking. Age ofonset of HD (�100 drinks per month) was 17.5 � 4.9 years,with only 9 of 46 HD reporting having started heavy drink-ing at age 21 years or older. This contrasts with a typicalmonthly alcohol consumption of 280 drinks over 31 years ofheavy drinking in a typical sample of recovering alcoholicsin treatment (Durazzo et al., 2004). Furthermore, and incontrast with the typical alcoholic in treatment described inthe literature, HD were relatively young, highly educated,and of relatively high socioeconomic status. The meanduration of education was 14 years, 25% were collegegraduates, 29% were working at the time of study, only25% were on disability, and approximately 60% reportedincomes between $20,000 and greater than $100,000 theyear preceding the study. LD consumed an average of 13drinks per month over approximately 23 years of regulardrinking, corresponding to a lifetime average alcohol con-sumption of 46 kg.
Effects of HD and Alcohol Dependence
Regional 1H MRSI metabolite concentrations in the en-tire HD sample are shown in Table 2. NAA in frontal WMwas 5% lower in all HD compared with all LD (p � 0.04).No other cortical or subcortical region, cerebellum, orbrainstem showed significant NAA loss. Cr in parietal GMwas 8% higher in HD compared with LD (p � 0.005),whereas Cr differences in parietal WM were less significant(p � 0.13). Similarly, parietal GM mI (p � 0.05) and Cho(p � 0.07) were also higher in HD versus LD, whereas thecorresponding WM measures showed no significant groupdifferences. Metabolite concentrations in the cerebellumand in the three subcortical nuclei, including the thalami,were not significantly affected by heavy drinking.
When statistical analyses were restricted to the smallersample of female LD and HD (20 LD and 8 HD), we foundtrends to lower frontal WM NAA [�13%; F(2,24) � 3.77;p � 0.06] and lower brainstem NAA [�15%; F(2,18) �3.02; p � 0.10]. The magnitude of these NAA losses was
1H MRSI OF CHRONIC ACTIVE HEAVY DRINKERS 653
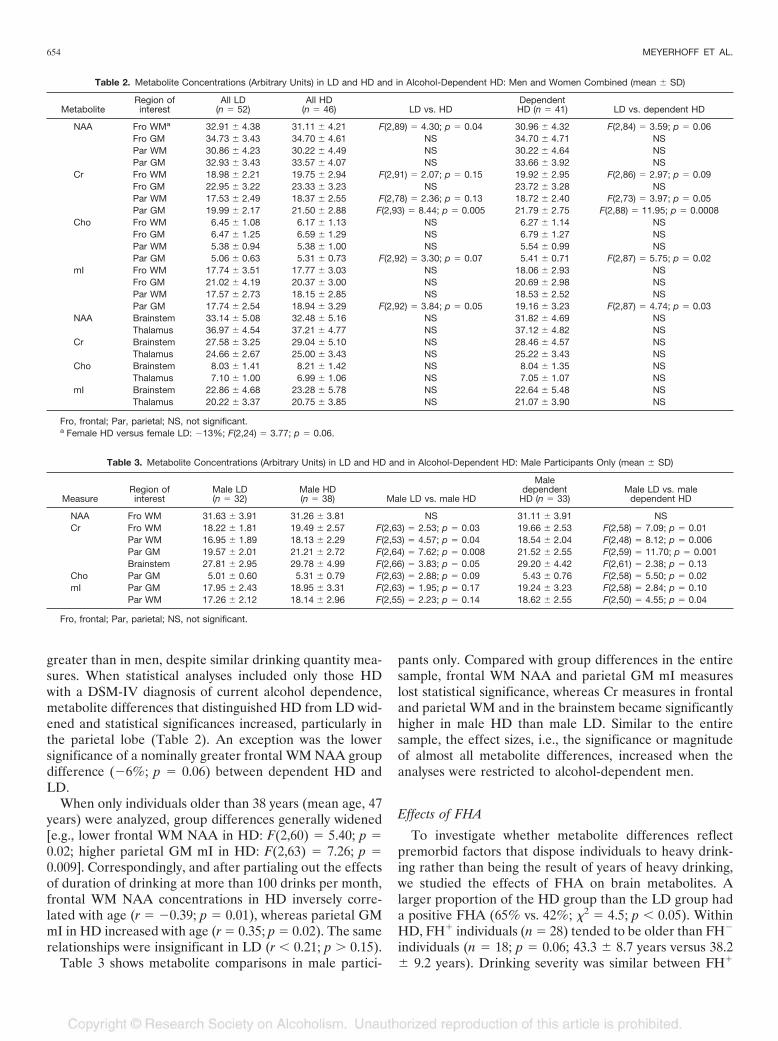
greater than in men, despite similar drinking quantity mea-sures. When statistical analyses included only those HDwith a DSM-IV diagnosis of current alcohol dependence,metabolite differences that distinguished HD from LD wid-ened and statistical significances increased, particularly inthe parietal lobe (Table 2). An exception was the lowersignificance of a nominally greater frontal WM NAA groupdifference (�6%; p � 0.06) between dependent HD andLD.
When only individuals older than 38 years (mean age, 47years) were analyzed, group differences generally widened[e.g., lower frontal WM NAA in HD: F(2,60) � 5.40; p �0.02; higher parietal GM mI in HD: F(2,63) � 7.26; p �0.009]. Correspondingly, and after partialing out the effectsof duration of drinking at more than 100 drinks per month,frontal WM NAA concentrations in HD inversely corre-lated with age (r � �0.39; p � 0.01), whereas parietal GMmI in HD increased with age (r � 0.35; p � 0.02). The samerelationships were insignificant in LD (r � 0.21; p � 0.15).
Table 3 shows metabolite comparisons in male partici-
pants only. Compared with group differences in the entiresample, frontal WM NAA and parietal GM mI measureslost statistical significance, whereas Cr measures in frontaland parietal WM and in the brainstem became significantlyhigher in male HD than male LD. Similar to the entiresample, the effect sizes, i.e., the significance or magnitudeof almost all metabolite differences, increased when theanalyses were restricted to alcohol-dependent men.
Effects of FHA
To investigate whether metabolite differences reflectpremorbid factors that dispose individuals to heavy drink-ing rather than being the result of years of heavy drinking,we studied the effects of FHA on brain metabolites. Alarger proportion of the HD group than the LD group hada positive FHA (65% vs. 42%; �2 � 4.5; p � 0.05). WithinHD, FH� individuals (n � 28) tended to be older than FH�
individuals (n � 18; p � 0.06; 43.3 � 8.7 years versus 38.2� 9.2 years). Drinking severity was similar between FH�
Table 2. Metabolite Concentrations (Arbitrary Units) in LD and HD and in Alcohol-Dependent HD: Men and Women Combined (mean � SD)
MetaboliteRegion ofinterest
All LD(n � 52)
All HD(n � 46) LD vs. HD
DependentHD (n � 41) LD vs. dependent HD
NAA Fro WMa 32.91 � 4.38 31.11 � 4.21 F(2,89) � 4.30; p � 0.04 30.96 � 4.32 F(2,84) � 3.59; p � 0.06Fro GM 34.73 � 3.43 34.70 � 4.61 NS 34.70 � 4.71 NSPar WM 30.86 � 4.23 30.22 � 4.49 NS 30.22 � 4.64 NSPar GM 32.93 � 3.43 33.57 � 4.07 NS 33.66 � 3.92 NS
Cr Fro WM 18.98 � 2.21 19.75 � 2.94 F(2,91) � 2.07; p � 0.15 19.92 � 2.95 F(2,86) � 2.97; p � 0.09Fro GM 22.95 � 3.22 23.33 � 3.23 NS 23.72 � 3.28 NSPar WM 17.53 � 2.49 18.37 � 2.55 F(2,78) � 2.36; p � 0.13 18.72 � 2.40 F(2,73) � 3.97; p � 0.05Par GM 19.99 � 2.17 21.50 � 2.88 F(2,93) � 8.44; p � 0.005 21.79 � 2.75 F(2,88) � 11.95; p � 0.0008
Cho Fro WM 6.45 � 1.08 6.17 � 1.13 NS 6.27 � 1.14 NSFro GM 6.47 � 1.25 6.59 � 1.29 NS 6.79 � 1.27 NSPar WM 5.38 � 0.94 5.38 � 1.00 NS 5.54 � 0.99 NSPar GM 5.06 � 0.63 5.31 � 0.73 F(2,92) � 3.30; p � 0.07 5.41 � 0.71 F(2,87) � 5.75; p � 0.02
mI Fro WM 17.74 � 3.51 17.77 � 3.03 NS 18.06 � 2.93 NSFro GM 21.02 � 4.19 20.37 � 3.00 NS 20.69 � 2.98 NSPar WM 17.57 � 2.73 18.15 � 2.85 NS 18.53 � 2.52 NSPar GM 17.74 � 2.54 18.94 � 3.29 F(2,92) � 3.84; p � 0.05 19.16 � 3.23 F(2,87) � 4.74; p � 0.03
NAA Brainstem 33.14 � 5.08 32.48 � 5.16 NS 31.82 � 4.69 NSThalamus 36.97 � 4.54 37.21 � 4.77 NS 37.12 � 4.82 NS
Cr Brainstem 27.58 � 3.25 29.04 � 5.10 NS 28.46 � 4.57 NSThalamus 24.66 � 2.67 25.00 � 3.43 NS 25.22 � 3.43 NS
Cho Brainstem 8.03 � 1.41 8.21 � 1.42 NS 8.04 � 1.35 NSThalamus 7.10 � 1.00 6.99 � 1.06 NS 7.05 � 1.07 NS
mI Brainstem 22.86 � 4.68 23.28 � 5.78 NS 22.64 � 5.48 NSThalamus 20.22 � 3.37 20.75 � 3.85 NS 21.07 � 3.90 NS
Fro, frontal; Par, parietal; NS, not significant.a Female HD versus female LD: �13%; F(2,24) � 3.77; p � 0.06.
Table 3. Metabolite Concentrations (Arbitrary Units) in LD and HD and in Alcohol-Dependent HD: Male Participants Only (mean � SD)
MeasureRegion ofinterest
Male LD(n � 32)
Male HD(n � 38) Male LD vs. male HD
Maledependent
HD (n � 33)Male LD vs. male
dependent HD
NAA Fro WM 31.63 � 3.91 31.26 � 3.81 NS 31.11 � 3.91 NSCr Fro WM 18.22 � 1.81 19.49 � 2.57 F(2,63) � 2.53; p � 0.03 19.66 � 2.53 F(2,58) � 7.09; p � 0.01
Par WM 16.95 � 1.89 18.13 � 2.29 F(2,53) � 4.57; p � 0.04 18.54 � 2.04 F(2,48) � 8.12; p � 0.006Par GM 19.57 � 2.01 21.21 � 2.72 F(2,64) � 7.62; p � 0.008 21.52 � 2.55 F(2,59) � 11.70; p � 0.001Brainstem 27.81 � 2.95 29.78 � 4.99 F(2,66) � 3.83; p � 0.05 29.20 � 4.42 F(2,61) � 2.38; p � 0.13
Cho Par GM 5.01 � 0.60 5.31 � 0.79 F(2,63) � 2.88; p � 0.09 5.43 � 0.76 F(2,58) � 5.50; p � 0.02mI Par GM 17.95 � 2.43 18.95 � 3.31 F(2,63) � 1.95; p � 0.17 19.24 � 3.23 F(2,58) � 2.84; p � 0.10
Par WM 17.26 � 2.12 18.14 � 2.96 F(2,55) � 2.23; p � 0.14 18.62 � 2.55 F(2,50) � 4.55; p � 0.04
Fro, frontal; Par, parietal; NS, not significant.
654 MEYERHOFF ET AL.
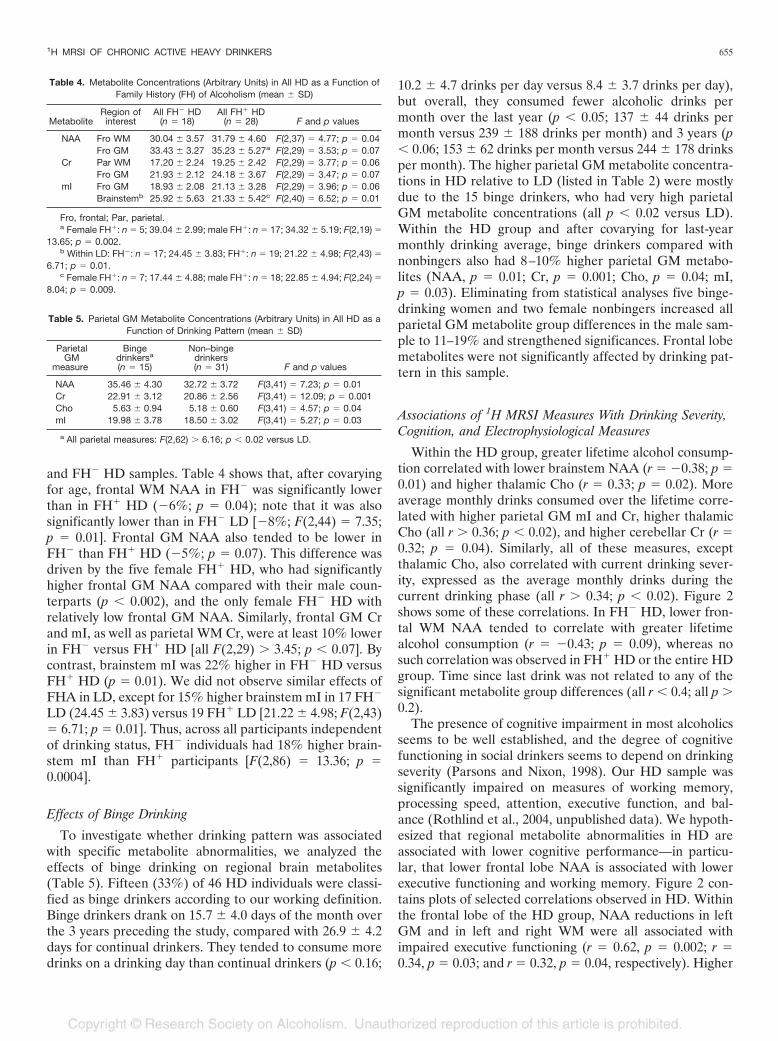
and FH� HD samples. Table 4 shows that, after covaryingfor age, frontal WM NAA in FH� was significantly lowerthan in FH� HD (�6%; p � 0.04); note that it was alsosignificantly lower than in FH� LD [�8%; F(2,44) � 7.35;p � 0.01]. Frontal GM NAA also tended to be lower inFH� than FH� HD (�5%; p � 0.07). This difference wasdriven by the five female FH� HD, who had significantlyhigher frontal GM NAA compared with their male coun-terparts (p � 0.002), and the only female FH� HD withrelatively low frontal GM NAA. Similarly, frontal GM Crand mI, as well as parietal WM Cr, were at least 10% lowerin FH� versus FH� HD [all F(2,29) � 3.45; p � 0.07]. Bycontrast, brainstem mI was 22% higher in FH� HD versusFH� HD (p � 0.01). We did not observe similar effects ofFHA in LD, except for 15% higher brainstem mI in 17 FH�
LD (24.45 � 3.83) versus 19 FH� LD [21.22 � 4.98; F(2,43)� 6.71; p � 0.01]. Thus, across all participants independentof drinking status, FH� individuals had 18% higher brain-stem mI than FH� participants [F(2,86) � 13.36; p �0.0004].
Effects of Binge Drinking
To investigate whether drinking pattern was associatedwith specific metabolite abnormalities, we analyzed theeffects of binge drinking on regional brain metabolites(Table 5). Fifteen (33%) of 46 HD individuals were classi-fied as binge drinkers according to our working definition.Binge drinkers drank on 15.7 � 4.0 days of the month overthe 3 years preceding the study, compared with 26.9 � 4.2days for continual drinkers. They tended to consume moredrinks on a drinking day than continual drinkers (p � 0.16;
10.2 � 4.7 drinks per day versus 8.4 � 3.7 drinks per day),but overall, they consumed fewer alcoholic drinks permonth over the last year (p � 0.05; 137 � 44 drinks permonth versus 239 � 188 drinks per month) and 3 years (p� 0.06; 153 � 62 drinks per month versus 244 � 178 drinksper month). The higher parietal GM metabolite concentra-tions in HD relative to LD (listed in Table 2) were mostlydue to the 15 binge drinkers, who had very high parietalGM metabolite concentrations (all p � 0.02 versus LD).Within the HD group and after covarying for last-yearmonthly drinking average, binge drinkers compared withnonbingers also had 8–10% higher parietal GM metabo-lites (NAA, p � 0.01; Cr, p � 0.001; Cho, p � 0.04; mI,p � 0.03). Eliminating from statistical analyses five binge-drinking women and two female nonbingers increased allparietal GM metabolite group differences in the male sam-ple to 11–19% and strengthened significances. Frontal lobemetabolites were not significantly affected by drinking pat-tern in this sample.
Associations of 1H MRSI Measures With Drinking Severity,Cognition, and Electrophysiological Measures
Within the HD group, greater lifetime alcohol consump-tion correlated with lower brainstem NAA (r � �0.38; p �0.01) and higher thalamic Cho (r � 0.33; p � 0.02). Moreaverage monthly drinks consumed over the lifetime corre-lated with higher parietal GM mI and Cr, higher thalamicCho (all r � 0.36; p � 0.02), and higher cerebellar Cr (r �0.32; p � 0.04). Similarly, all of these measures, exceptthalamic Cho, also correlated with current drinking sever-ity, expressed as the average monthly drinks during thecurrent drinking phase (all r � 0.34; p � 0.02). Figure 2shows some of these correlations. In FH� HD, lower fron-tal WM NAA tended to correlate with greater lifetimealcohol consumption (r � �0.43; p � 0.09), whereas nosuch correlation was observed in FH� HD or the entire HDgroup. Time since last drink was not related to any of thesignificant metabolite group differences (all r � 0.4; all p �0.2).
The presence of cognitive impairment in most alcoholicsseems to be well established, and the degree of cognitivefunctioning in social drinkers seems to depend on drinkingseverity (Parsons and Nixon, 1998). Our HD sample wassignificantly impaired on measures of working memory,processing speed, attention, executive function, and bal-ance (Rothlind et al., 2004, unpublished data). We hypoth-esized that regional metabolite abnormalities in HD areassociated with lower cognitive performance—in particu-lar, that lower frontal lobe NAA is associated with lowerexecutive functioning and working memory. Figure 2 con-tains plots of selected correlations observed in HD. Withinthe frontal lobe of the HD group, NAA reductions in leftGM and in left and right WM were all associated withimpaired executive functioning (r � 0.62, p � 0.002; r �0.34, p � 0.03; and r � 0.32, p � 0.04, respectively). Higher
Table 4. Metabolite Concentrations (Arbitrary Units) in All HD as a Function ofFamily History (FH) of Alcoholism (mean � SD)
MetaboliteRegion ofinterest
All FH� HD(n � 18)
All FH� HD(n � 28) F and p values
NAA Fro WM 30.04 � 3.57 31.79 � 4.60 F(2,37) � 4.77; p � 0.04Fro GM 33.43 � 3.27 35.23 � 5.27a F(2,29) � 3.53; p � 0.07
Cr Par WM 17.20 � 2.24 19.25 � 2.42 F(2,29) � 3.77; p � 0.06Fro GM 21.93 � 2.12 24.18 � 3.67 F(2,29) � 3.47; p � 0.07
mI Fro GM 18.93 � 2.08 21.13 � 3.28 F(2,29) � 3.96; p � 0.06Brainstemb 25.92 � 5.63 21.33 � 5.42c F(2,40) � 6.52; p � 0.01
Fro, frontal; Par, parietal.a Female FH�: n � 5; 39.04 � 2.99; male FH�: n � 17; 34.32 � 5.19; F(2,19) �
13.65; p � 0.002.b Within LD: FH�: n � 17; 24.45 � 3.83; FH�: n � 19; 21.22 � 4.98; F(2,43) �
6.71; p � 0.01.c Female FH�: n � 7; 17.44 � 4.88; male FH�: n � 18; 22.85 � 4.94; F(2,24) �
8.04; p � 0.009.
Table 5. Parietal GM Metabolite Concentrations (Arbitrary Units) in All HD as aFunction of Drinking Pattern (mean � SD)
ParietalGM
measure
Bingedrinkersa
(n � 15)
Non–bingedrinkers(n � 31) F and p values
NAA 35.46 � 4.30 32.72 � 3.72 F(3,41) � 7.23; p � 0.01Cr 22.91 � 3.12 20.86 � 2.56 F(3,41) � 12.09; p � 0.001Cho 5.63 � 0.94 5.18 � 0.60 F(3,41) � 4.57; p � 0.04mI 19.98 � 3.78 18.50 � 3.02 F(3,41) � 5.27; p � 0.03
a All parietal measures: F(2,62) � 6.16; p � 0.02 versus LD.
1H MRSI OF CHRONIC ACTIVE HEAVY DRINKERS 655
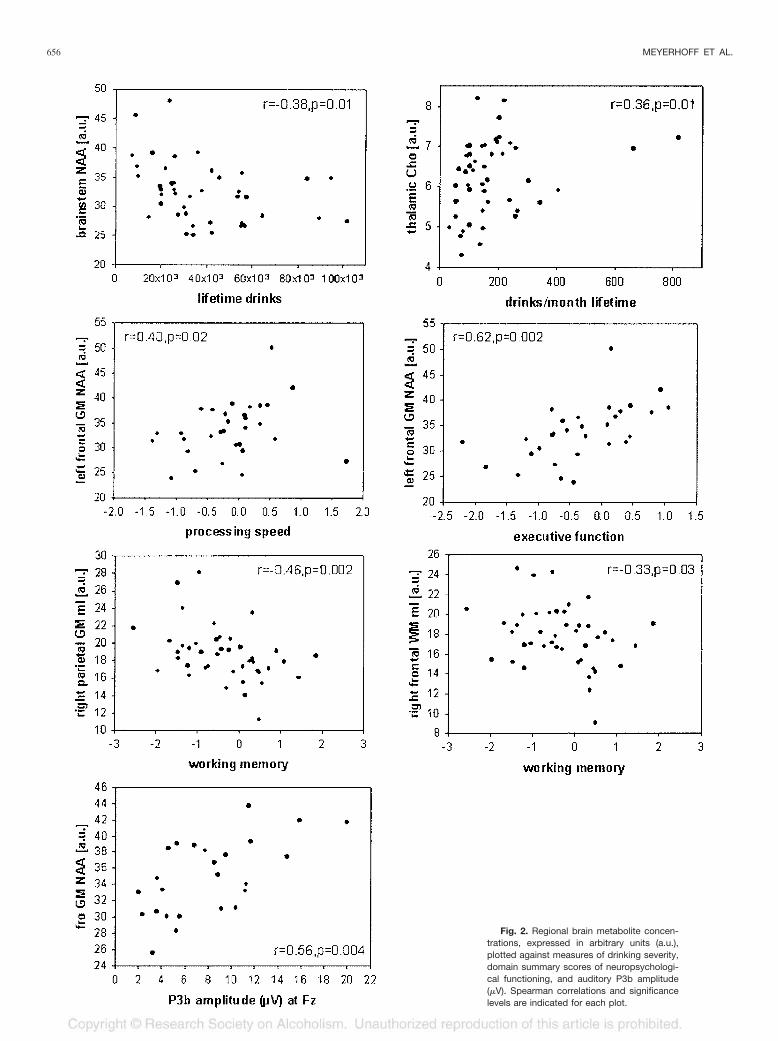
Fig. 2. Regional brain metabolite concen-trations, expressed in arbitrary units (a.u.),plotted against measures of drinking severity,domain summary scores of neuropsychologi-cal functioning, and auditory P3b amplitude(�V). Spearman correlations and significancelevels are indicated for each plot.
656 MEYERHOFF ET AL.
mI in both WM and GM of the right frontal lobe wascorrelated with lower working memory (both r � �0.33; p� 0.03 and 0.07, respectively). In addition, lower left frontalGM NAA tended to correlate with lower working memory(r � 0.29; p � 0.10) and correlated with slower processingspeed (r � 0.4; p � 0.02). In addition, exploratory analysesin HD not based on a priori hypotheses yielded a largenumber of correlations between metabolite measures andneuropsychological test performance. For example, withinthe parietal lobe of the HD group, higher mI in both leftand right GM correlated with lower working memory (r ��0.44, p � 0.003 and r � �0.46, p � 0.002, respectively),whereas higher left GM mI and left WM mI also correlatedwith lower executive function (r � �0.32, p � 0.04 and r ��0.43, p � 0.02, respectively). Furthermore, in HD, lowergeneral verbal intellectual ability (AMNART) was associ-ated with lower GM NAA and lower WM Cr in the rightfrontal lobes (both r � 0.31; p � 0.04). Higher Cho in leftparietal GM was also associated with lower working mem-ory (r � �0.31; p � 0.05). The corresponding (or othersignificant) relationships were not observed in LD, whichsuggests that heavy drinking disrupts these cognitive pro-cesses subserved by both frontal and parietal lobes.
We further hypothesized that in HD, (1) lower frontallobe NAA is associated with lower P3a amplitude, a mea-sure of an alerting process that originates in the frontalcortex (Courchesne et al., 1975; Knight, 1984); (2) lowerNAA in parietal and temporal lobes is associated withlower P3b amplitude (because lesion studies show thattemporal/parietal lesions abolish the P3b); and (3) WMNAA throughout the brain is associated with longer P3aand P3b latency, measures of stimulus classification speed(Kutas et al., 1977; Polich, 1986).
Frontal NAA in HD correlated with auditory P3b ampli-tudes at Fz and Cz (GM: r � 0.56, p � 0.004; WM: r � 0.37,p � 0.03; Fig. 2), but not at Pz (r � 0.32; p � 0.12). HigherCr, Cho, and mI concentrations in temporal GM were allcorrelated with longer visual P3a latency, primarily at Cz (r� 0.4; p � 0.01). Auditory P3b latency at Fz correlated withmI in parietal and temporal GM, as well as in temporalWM (r � 0.44; p � 0.009). Most of the correlations thatwere significant at a single midline electrode were alsosignificant with the corresponding regional averages. Rela-tionships between metabolite measures and P3a amplitudeswere not significant. Furthermore, exploratory analyses inLD showed no significant correlations of metabolite levelswith electrophysiological characteristics.
Immune Suppression
As part of a larger study of the effects of heavy drinkingon human immunodeficiency virus disease progression, allparticipants’ immune systems were assessed via CD4 mea-surements. CD4 counts were significantly higher in HD (p� 0.02; 931 � 304/mm3) compared with LD (800 � 247/mm3). FH� HD had significantly higher CD4 counts (p �
0.03; 1016 � 293 copies per milliliter) than FH� HD (800� 278 copies per milliliter), whereas among LD, FHA didnot modulate CD4 counts.
DISCUSSION
The major findings of this study were (1) lower NAA infrontal WM of HD than LD, driven by a large groupdifference in a small sample of women; (2) higher mI, Cho,and Cr in parietal GM of HD than LD, more pronouncedin alcohol-dependent than alcohol-abusing drinkers; (3)lower NAA in the frontal lobe and higher mI in the brain-stem of FH� than FH� HD; (4) higher parietal GM me-tabolites including NAA in binge drinkers than nonbingers;(5) correlations between drinking severity and metaboliteconcentrations in HD; (6) correlations of lower executivefunctioning and working memory with lower frontal NAAin HD; and (7) correlations of P3b latencies and amplitudeswith metabolite changes in HD. Lower NAA suggests ax-onal damage in the frontal WM of women. Higher Cr, Cho,and mI in parietal GM suggest gliosis, because Cr and Choconcentrations are higher in astrocytes and oligodendro-cytes than in neurons (Urenjak et al., 1993) and because mIis a putative astrocyte marker (Brand et al., 1993). Alter-natively, because Cr and mI are cerebral osmolytes (Rossand Bluml, 2001; Ross and Michaelis, 1994), their higherconcentrations in HD may also reflect a chronic osmoticstate different from that of LD or an acute osmotic imbal-ance associated with potential subclinical withdrawal. Inresponse to frequently high blood and brain alcohol levels,the concentration of cerebral osmolytes may adapt region-ally, depending on the differential sensitivity of brain re-gions to osmotic changes. The absence of correlations,however, between time since the last alcoholic drink andthose metabolite concentrations that differentiate HD fromLD speaks against a withdrawal-associated osmotic imbal-ance. Therefore, we posit that our results reflect chronicbrain damage associated with long-term heavy drinking orfactors in the participant’s history that were not assessedbut preceded the onset of heavy drinking.
The study shows further that a positive FHA does notpredispose to greater NAA loss or glial injury. Rather,NAA and mI measures suggest that a positive FHA seemsto protect against alcohol-induced frontal neuronal/axonaldamage and brainstem gliosis, respectively. NAA measuressuggest that bingeing HD have less parietal neuron damagethan continual HD. High Cr and other metabolite mea-sures suggest that binge drinking is associated with gliosisand/or that it reflects parietal GM sequelae of a chronichyperosmolar state when compared with LD and with amore continual heavy drinking pattern. No significant ad-verse frontal metabolite effects were associated with bingedrinking. Our sample size was too small to assess rigorouslyhow gender modulates the relationships among FHA,drinking pattern, and brain metabolites.
Finally, lower NAA in the frontal WM of active HD,
1H MRSI OF CHRONIC ACTIVE HEAVY DRINKERS 657
driven by a small number of women and older age, suggestsage-related axonal damage, which seems greater in womenthan men despite similar drinking severity. These resultssupport the notion that WM in the frontal lobe is particu-larly vulnerable to the long-term effects of heavy drinking(e.g., Sullivan, 2000) and that women may be more vulner-able to chronic alcohol-induced axonal damage than men.Moreover, metabolite abnormalities in frontal and otherbrain regions correlated with functional deficits reflected inlower cognitive test performance and electrophysiologicalresponses to external stimuli. Compared with alcoholicstypically described in the MRI literature, cumulative life-time alcohol consumption in these non–treatment-seekingindividuals was much below that of treated alcoholics, andmetabolite group differences were relatively subtle. Never-theless, this study demonstrates that long-term heavy alco-hol consumption in socially functioning individuals has sig-nificant detrimental effects on important cognitive domainsand information processing.
Family History of Alcoholism
Genetic factors play an important role in the risk foralcoholism. Studies have shown that FH� individuals are athigher risk for early development of alcoholism than theirFH� counterparts (Cloninger, 1987; Schuckit, 1984; Tarteret al., 1985), and reports in children and adolescents sug-gest that a positive FHA contributes to impaired cognitionand lower P3 event-related potential amplitude (Berman etal., 1993; Drejer et al., 1985; Hill and Steinhauer, 1993;Polich et al., 1994). Furthermore, nonalcoholic high-riskindividuals also have a different sensitivity to acute alcoholthan low-risk individuals (e.g., Newlin and Thomson 1999).Brain neurochemical or metabolic differences may be re-lated to these different vulnerabilities, sensitivities, and thereinforcing and toxic properties of alcohol as a function ofFH. Our sample of FH� HD had higher NAA in the frontallobe and lower mI in the brainstem than FH� HD, despitesimilar drinking severities. Thus, lower frontal WM NAA inthe entire sample was driven by lower NAA in FH� HD.Together, these results raise the possibility that FH posi-tivity imparts some degree of protection against alcohol-induced frontal neuronal/axonal damage and brainstem gli-osis in HD or, conversely, that FH� HD are morevulnerable to brain damage than FH� HD. Because ouranalyses showed that NAA and Cr in frontal GM tended todifferentiate FH� and FH� HD and did not differentiateLD from HD, but showed a significant alcohol status �FHA status interaction, we conclude that the majorLD/HD group differences observed in this study reflect thelong-term effects of heavy drinking per se but not premor-bid factors. This interpretation is further supported by thecorrelations we observed between the amount of alcoholconsumed and the degree of metabolite abnormalities inHD (described above).
Drinking Pattern (Binge Drinking)
Animal models of controlled drinking suggest that bingedrinking, because of effects of alcohol toxicity or repeatedwithdrawal episodes, leads to neurodegeneration in theentorhinal cortex, hippocampi, and olfactory bulb (Crewset al., 2000 and references cited therein) (Agartz et al.,1999; Crews, 1999; Fadda and Rossetti, 1998; Hunt, 1993b)that may adversely affect spatial learning (Obernier et al.,2002). In humans, binge drinking may be more damaging tothe brain than continual heavy alcohol consumption(Agartz et al., 1999; Crews, 1999; Crews et al., 2000; Faddaand Rossetti, 1998; Hunt, 1993b). Thus, we investigatedwhether drinking pattern had an effect on the nature anddegree of metabolite brain damage in chronic HD. Accord-ing to our working definition of binge drinking, bingeingwas the preferred way of prior-3-year alcohol consumptionin 33% of our HD. Significant changes associated withbinge drinking were present only in parietal GM. HigherCho, mI, and Cr in binge drinkers is suggestive of gliosis orregional metabolite changes, possibly secondary to hyper-osmolarity. Higher NAA in the binge drinkers is counter-intuitive; it does not support the hypothesis of increasedneuronal damage in binge drinkers and may reflect ourlimited knowledge of NAA’s function in the brain.
Functional Relevance of Metabolite Measures
We observed associations of contiguous measures ofdrinking severity, cognitive abilities (primarily executivefunction and working memory), and electrophysiologicalcharacteristics with frontal, parietal, and temporal metab-olite measures that underscore their functional relevance.These correlations further support our hypotheses thatchronic heavy drinking decreases frontal NAA levels andincreases compounds associated with cell turnover and gli-osis throughout the brain. The ensuing brain damage isrelevant to cognitive functioning in active HD and mayinterfere with day-to-day routines or with a HD’s recogni-tion of a potential drinking problem. The most significantcorrelations pointed to an association of frontal NAA losswith impaired executive functioning and processing speed,whereas parietal GM mI abnormalities were associatedwith deficits in working memory. Frontal GM NAA losswas also significantly associated with lower P3b amplitudes,which may reflect impaired processing of incoming infor-mation (Johnson, 1993). Studies have shown that longer P3latency is associated with inferior cognitive performance inhealthy controls (e.g., Polich et al., 1983, 1990; Polich andMartin, 1992) and in patients with dementing illnesses (e.g.,Brown et al., 1982; Homberg et al., 1986; O’Donnell et al.,1987; Polich et al., 1986, 1990; Squires et al., 1979). Thisrelationship seems to be present also in chronic HD in thepresence of higher Cr, Cho, and mI in temporal and pari-etal GM, which are regional measures of gliosis and cellturnover. Most of the predicted associations between me-tabolite levels and event-related potential measures, how-
658 MEYERHOFF ET AL.
ever, were not observed, prompting us to report only cor-relations with p � 0.01. Nevertheless, existing correlationsbetween metabolite levels and function support the hypoth-esis that in active HD, metabolite abnormalities are asso-ciated with changes in cognitive processing.
Comparison With Studies in Abstinent Alcoholics
The magnitude and anatomical distribution of the ob-served drinking effects seem to differ from those reportedin clinical samples of abstinent alcoholics. Those studies,including our own in an elderly sample of recovering alco-holics (Fein et al., 1994), found lower NAA in frontal GMand cerebellar vermis of the order of 10–20%, suggestingneuron damage (Jagannathan et al., 1996; Seitz et al.,1999). Less frequently was NAA loss in WM reported(Goldmann et al., 2000; Schweinsburg et al., 2001). In-creased mI in WM and thalamus in abstinent alcoholicssuggests glial changes (Schweinsburg et al., 2000, 2001).The chronic HD in our study had frontal WM NAA loss ofthe order of 5% (men) and 13% (women), suggestingfrontal axonal damage, but no significant NAA loss infrontal GM or cerebellum and no significant subcorticalmetabolite alterations. Instead, parietal GM showed signif-icantly higher mI, Cho, and Cr, suggesting regionally spe-cific glial and cell membrane alterations or effects of os-motic imbalance in active HD. The different pattern anddegree of metabolite abnormalities between active HD andabstinent recovering alcoholics may be due to several fac-tors: (1) lower severity and prevalence of alcoholism in ourcommunity sample of HD, (2) less subclinical comorbidneuropsychopathology in our study sample, (3) age, and/or(4) experimental differences.
Eighty-nine percent of our chronic HD met criteria forcurrent alcohol dependence, and 88% were physiologicallydependent. By contrast, the typical treatment sample isalmost exclusively physiologically dependent on alcohol.That alcohol dependence is associated with greater brainmetabolite damage than abuse was confirmed by our find-ings of greater alcohol effects when abusing HD wereeliminated from analyses (Tables 2 and 3). However, eventhe dependent HD had a smaller magnitude of metabolitedamage than the typical short-term abstinent alcoholic de-scribed. This may be due to lower cumulative lifetimealcohol consumption (by comparison, alcoholics in treat-ment studied in this laboratory consumed approximatelytwice the amount of alcohol as our HD sample over a 50%longer heavy drinking period), younger age (the typicalalcoholic in the literature is 47 years old), or fewer episodesof withdrawal and/or detoxification, the number of whichcontributes to changes in brain function in animals andhumans (Duka et al., 2003 and references therein). Fur-thermore, compared with alcoholics in treatment samples,socially functioning HD are likely to have less obviouscomorbid central nervous system psychopathology, whichmay escape screening in the clinical research setting.
Finally, differences in experimental methods (spectro-scopic imaging versus single-volume MRS; short versuslong TE) may contribute to the different extent of metab-olite damage observed in active HD and abstinent alcohol-ics. However, our studies in abstinent alcoholics that applythe same short TE MRSI acquisition sequence used heredemonstrate metabolite differences of the order of thosedetected with single-volume methods at short TE (Durazzoet al., 2004). This makes it unlikely that the main metabo-lite differences between our HD and previously describedabstinent alcoholics is primarily due to experimental pa-rameters. Thus, we believe that our community-dwellingactive HD have a lower severity of alcoholism than thetypical abstinent alcoholic described in the literature andless comorbid neuropsychopathology, both of which areassociated with less brain metabolite damage. Prospectivestudies are necessary that directly contrast active HD withabstinent alcoholics matched on severity and prevalence ofalcoholism and comorbid psychopathology.
In conclusion, our results demonstrate that relativelyyoung, non–treatment-seeking active HD have measurablebrain metabolite abnormalities, which are modulated in acomplex way by FHA, drinking pattern, age, gender, andalcohol use disorder diagnosis. Most importantly, brainmetabolite damage in socially functioning active HD isassociated with lower cognitive function.
ACKNOWLEDGMENTS
This article is dedicated to the memory of Linda Rogers, PhD(1946–2003). We thank our staff for recruiting, screening, andassessing study participants, who are appreciated for so gener-ously having donated their time and effort.
REFERENCES
Agartz I, Momenan R, Rawlings RR, Kerich MJ, Hommer DW (1999)Hippocampal volume in patients with alcohol dependence. Arch GenPsychiatry 56:356–363.
Ashburner J, Friston KJ (2000) Voxel-based morphometry—the methods.Neuroimage 11:805–821.
Berman SM, Whipple SC, Fitch RJ, Noble EP (1993) P3 in young boys asa predictor of adolescent substance use. Alcohol 10:69–76.
Brand A, Richter-Landsberg C, Leibfritz D (1993) Multinuclear NMRstudies on the energy metabolism of glial and neuronal cells. DevNeurosci 15:289–298.
Brown WS, Marsh JT, LaRue A (1982) Event-related potentials in psy-chiatry: differentiating depression and dementia in the elderly. Bull LosAngeles Neurol Soc 47:91–107.
Cloninger CR (1987) Neurogenetic adaptive mechanisms in alcoholism.Science 236:410–416.
Collins DL, Peters TM, Dai W, Evans AC (1994) Model based segmen-tation of individual brain structures from MRI data. SPIE VisualizatBiomed Comput 1808:10–23.
Courchesne E, Hillyard SA, Galambos R (1975) Stimulus novelty, taskrelevance and the visual evoked potential in man. ElectroencephalogrClin Neurophysiol 39:131–143.
Crews FT (1999) Alcohol and neurodegeneration. CNS Drug Rev 5:379–394.
1H MRSI OF CHRONIC ACTIVE HEAVY DRINKERS 659
Crews FT, Braun CJ, Hoplight B, Switzer RC III, Knapp DJ (2000) Bingeethanol consumption causes differential brain damage in young adoles-cent rats compared with adult rats. Alcohol Clin Exp Res 24:1712–1723.
Dawant BM, Hartmann SL, Thirion JP, Maes F, Vandermeulen D, De-maerel P (1999) Automatic 3-D segmentation of internal structures ofthe head in MR images using a combination of similarity and free-formtransformations: part I, methodology and validation on normal subjects.IEEE Trans Med Imaging 18:909–916.
Drejer K, Theilgaard A, Teasdale TW, Schulsinger F, Goodwin DW(1985) A prospective study of young men at high risk for alcoholism:neuropsychological assessment. Alcohol Clin Exp Res 9:498–502.
Duka T, Townshend JM, Collier K, Stephens DN (2003) Impairment incognitive functions after multiple detoxifications in alcoholic inpatients.Alcohol Clin Exp Res 27:1563–1572.
Durazzo TC, Gazdzinski S, Meyerhoff DJ (2004) Brain metabolite con-centrations and cognition during short-term abstinence from alcohol.Alcohol Clin Exp Res, in press.
Fadda F, Rossetti ZL (1998) Chronic ethanol consumption: from neuro-adaptation to neurodegeneration. Prog Neurobiol 56:385–431.
Fein G, Bachman L, Fisher S, Davenport L (1990) Cognitive impairmentsin abstinent alcoholics. West J Med 152:531–537.
Fein G, Biggins CA, MacKay S (1995) Delayed latency of the P3A ERPcomponent in HIV disease: progressive effects with increasing cognitiveimpairment. Arch Neurol 52:1109–1118.
Fein G, Di Sclafani V, Cardenas VA, Goldmann H, Tolou-Shams M,Meyerhoff DJ (2002) Cortical gray matter loss in treatment-naive alco-hol dependent individuals. Alcohol Clin Exp Res 26:558–564.
Fein G, Meyerhoff DJ, Di Sclafani V, Ezekiel F, Poole N, MacKay S,Dillon WP, Constans JM, Weiner MW (1994) 1H Magnetic ResonanceSpectroscopic Imaging Separates Neuronal From Glial Changes inAlcohol-Related Brain Atrophy (NIAAA Research Monograph No. 27).NIH, Bethesda, MD, 227–241.
Gee JC, Reivich M, Bajcsy R (1993) Elastically deforming 3D atlas tomatch anatomical brain images. J Comput Assist Tomogr 17:225–236.
Goldmann H, Tolou-Shams M, Salas G, Fein G, Meyerhoff DJ (2000) 1HMRS in the brain of light and heavy drinkers: alcohol and neurons.Seventh Annual Meeting of the International Society of Magnetic Res-onance in Medicine, Denver, CO, vol. 2. ISMRM, Berkeley, CA, 1165.
Grant B (1994a) The influence of comorbid major depression and sub-stance use disorders on alcohol and drug treatment: results of a nationalsurvey, in National Institute on Drug Abuse Technical Review Meeting:Comorbid Mental Disorders (NIDA Research Monograph No. 172)(Onken LS, Blaine JD, Genser S, Horton AM Jr eds). US Departmentof Health and Human Services, National Institutes of Health, Rockville,MD, 4–15.
Grant BF (1994b) Alcohol consumption, alcohol abuse and alcohol de-pendence. The United States as an example. Addiction 89:1357–1365.
Harwood H, Thomson M, Nesmith T (1994) Healthcare Reform andSubstance Abuse Treatment: The Cost of Financing Under AlternativeApproaches. Lewin-VHI, Fairfax, VA.
Hill SY, Steinhauer SR (1993) Assessment of prepubertal and postpuber-tal boys and girls at risk for developing alcoholism with P300 from avisual discrimination task. J Stud Alcohol 54:350–358.
Homberg V, Hefter H, Granseyer G, Strauss W, Lange H, Hennerici M(1986) Event-related potentials in patients with Huntington’s diseaseand relatives at risk in relation to detailed psychometry. Electroen-cephalogr Clin Neurophysiol 63:552–569.
Hunt WA (1993a) Are binge drinkers more at risk of developing braindamage? Alcohol 10:559–561.
Hunt WA (1993b) Neuroscience research: how has it contributed to ourunderstanding of alcohol abuse and alcoholism? A review. Alcohol ClinExp Res 17:1055–1065.
Iosifescu DV, Shenton ME, Warfield SK, Kikinis R, Dengler J, Jolesz FA,McCarley RW (1997) An automated registration algorithm for measur-ing MRI subcortical brain structures. Neuroimage 6:13–25.
Jagannathan NR, Desai NG, Raghunathan P (1996) Brain metabolitechanges in alcoholism: an in vivo proton magnetic resonance spectros-copy (MRS) study. Magn Reson Imaging 14:553–557.
Johnson R Jr (1993) On the neural generators of the P300 component ofthe event-related potential. Psychophysiology 30:90–97.
Knight RT (1984) Decreased response to novel stimuli after prefrontallesions in man. Electroencephalogr Clin Neurophysiol 59:9–20.
Kuroda Y, Wada A, Yamazaki T, Nagayama K (1989) Postacquisitiondata processing method for suppression of the solvent signal. J MagnReson 84:604–610.
Kutas M, McCarthy G, Donchin E (1977) Augmenting mental chronom-etry: the P300 as a measure of stimulus evaluation time. Science 197:792–795.
Mann RE, Sobell LC, Sobell MB, Pavan D (1985) Reliability of a familytree questionnaire for assessing family history of alcohol problems.Drug Alcohol Depend 15:61–67.
McGue M (1994) Genes, environment, and the etiology of alcoholism, inThe Development of Alcohol Problems: Exploring the BiopsychosocialMatrix of Risk (NIAAA Research Monograph No. 26) (Zucker R, Boyd G,Howard J eds), pp 1–40. US Government Printing Office, Washington,DC.
Meyerhoff DJ, Bloomer C, Cardenas V, Norman D, Weiner MW, Fein G(1999) Elevated subcortical choline metabolites in cognitively and clin-ically asymptomatic HIV� patients. Neurology 52:995–1003.
Newlin DB, Thomson JB (1999) Chronic tolerance and sensitization toalcohol in sons of alcoholics: II. Replication and reanalysis. Exp ClinPsychopharmacol 7:234–243.
Obernier JA, White AM, Swartzwelder HS, Crews FT (2002) Cognitivedeficits and CNS damage after a 4-day binge ethanol exposure in rats.Pharmacol Biochem Behav 72:521–532.
O’Donnell BF, Squires NK, Martz MJ, Chen JR, Phay AJ (1987) Evokedpotential changes and neuropsychological performance in Parkinson’sdisease. Biol Psychol 24:23–37.
Oscar-Berman M (2000) Neuropsychological Vulnerabilities in Chronic Al-coholism: Review of NIAAA’s Neuroscience and Behavioral ResearchPortfolio (NIAAA Research Monograph No. 34), pp 437–472. NationalInstitute on Alcohol Abuse and Alcoholism, Bethesda, MD.
Parsons OA, Nixon SJ (1993) Neurobehavioral sequelae of alcoholism.Neurol Clin 11:205–218.
Parsons OA, Nixon SJ (1998) Cognitive functioning in sober social drink-ers: a review of the research since 1986. J Stud Alcohol 59:180–190.
Polich J (1986) Attention, probability, and task demands as determinantsof P300 latency from auditory stimuli. Electroencephalogr Clin Neuro-physiol 63:251–259.
Polich J, Ehlers CL, Otis S, Mandell AJ, Bloom FE (1986) P300 latencyreflects the degree of cognitive decline in dementing illness. Electroen-cephalogr Clin Neurophysiol 63:138–144.
Polich J, Howard L, Starr A (1983) P300 latency correlates with digit span.Psychophysiology 20:665–669.
Polich J, Ladish C, Bloom FE (1990) P300 assessment of early Alzheimer’sdisease. Electroencephalogr Clin Neurophysiol 77:179–189.
Polich J, Martin S (1992) P300, cognitive capacity, and personality: acorrelations study of university undergraduates. Pers Individ Diff 13:533–543.
Polich J, Pollock V, Bloom F (1994) Meta-analysis of P300 amplitude frommales at risk for alcoholism. Psychol Bull 115:55–73.
Ratti MT, Soragna D, Sibilla L, Giardini A, Albergati A, Savoldi F, Bo P(1999) Cognitive impairment and cerebral atrophy in “heavy drinkers.”Prog Neuropsychopharmacol Biol Psychiatry 23:243–258.
Rosenbloom MJ, Pfefferbaum A, Sullivan EV (1995) Structural brainalterations associated with alcoholism. Alcohol Health Res World 19:266–272.
Ross B, Bluml S (2001) Magnetic resonance spectroscopy of the humanbrain. Anat Rec 265:54–84.
Ross B, Michaelis T (1994) Clinical applications of magnetic resonancespectroscopy. Magn Reson Q 10:191–247.
660 MEYERHOFF ET AL.
Schuckit MA (1984) Subjective responses to alcohol in sons of alcoholicsand control subjects. Arch Gen Psychiatry 41:879–884.
Schuff N, Ezekiel F, Gamst A, Amend D, Capizzano A, Maudsley AA,Weiner MW (2001) Region and tissue differences of metabolites innormally aged brain using 1H magnetic resonance spectroscopic imag-ing. Magn Reson Med 45:899–907.
Schweinsburg BC, Taylor MJ, Alhassoon OM, Videen JS, Brown GG,Patterson TL, Berger F, Grant I (2001) Chemical pathology in brainwhite matter of recently detoxified alcoholics: a 1H magnetic resonancespectroscopy investigation of alcohol-associated frontal lobe injury. Al-cohol Clin Exp Res 25:924–934.
Schweinsburg BC, Taylor MJ, Videen JS, Alhassoon OM, Patterson TL,Grant I (2000) Elevated myo-inositol in gray matter of recently detox-ified but not long-term alcoholics: a preliminary MR spectroscopystudy. Alcohol Clin Exp Res 24:699–770.
Seitz D, Widmann U, Seeger U, Nagele T, Klose U, Mann K, Grodd W(1999) Localized proton magnetic resonance spectroscopy of the cere-bellum in detoxifying alcoholics. Alcohol Clin Exp Res 23:158–163.
Shattuck DW, Sandor-Leahy SR, Schaper KA, Rottenberg DA, LeahyRM (2001) Magnetic resonance image tissue classification using apartial volume model. Neuroimage 13:856–876.
Skinner HA, Sheu WJ (1982) Reliability of alcohol use indices. TheLifetime Drinking History and the MAST. J Stud Alcohol 43:1157–1170.
Sobell LC, Sobell MB (1992) Timeline follow-back: a technique for as-sessing self-reported alcohol consumption, in Measuring Alcohol Con-sumption (Litten R, Allen J eds), pp 41–72. Humana Press, Totowa, NJ.
Sobell LC, Sobell MB, Riley DM, Schuller R, Pavan DS, Cancilla A,Klajner F, Leo GI (1988) The reliability of alcohol abusers’ self-reportsof drinking and life events that occurred in the distant past (publishederratum appears in J Stud Alcohol 1989;50:92). J Stud Alcohol 49:225–232.
Soher BJ, Vermathen P, Schuff N, Wiedermann D, Meyerhoff DJ, WeinerMW, Maudsley AA (2000) Short TE in vivo (1)H MR spectroscopicimaging at 1.5 T: acquisition and automated spectral analysis. MagnReson Imaging 18:1159–1165.
Squires NK, Galbraith G, Aine C (1979) Event-related potentials assess-ment of sensory and cognitive deficits in the mentally retarded, inHuman Evoked Potentials: Applications and Problems (Lehmann D,Callaway E eds), pp 397–413. Plenum Press, New York.
Studholme C, Cardenas V, Weiner M (2001a) Multi-scale image andmulti-scale deformation of brain anatomy for building average brainatlases. Proceedings SPIE Medical Imaging, vol. 4322, 557–568.
Studholme C, Novotny E, Zubal IG, Duncan JS (2001b) Estimating tissuedeformation between functional images induced by intracranial elec-trode implantation using anatomical MRI. Neuroimage 13:561–576.
Sullivan EV (2000) Human brain vulnerability to alcoholism: evidencefrom neuroimaging studies, in Review of NIAAA’s Neuroscience andBehavioral Research Portfolio (NIAAA Research Monograph No. 34)(Noronha A, Eckardt M, Warren K eds), pp 473–508. National Instituteon Alcohol Abuse and Alcoholism, Bethesda, MD.
Tarter RE, Alterman AI, Edwards KL (1985) Vulnerability to alcoholismin men: a behavior-genetic perspective. J Stud Alcohol 46:329–356.
Urenjak J, Williams SR, Gadian DG, Noble M (1993) Proton nuclearmagnetic resonance spectroscopy unambiguously identifies differentneural cell types. J Neurosci 13:981–989.
Van Leemput K, Maes F, Vandermeulen D, Suetens P (1999) Automatedmodel-based tissue classification of MR images of the brain. IEEETrans Med Imaging 18:897–908.
Wechsler H, Austin SB (1998) Binge drinking: the five/four measure.J Stud Alcohol 59:122–124.
Wells WM, Grimson WEL, Kikinis R, Jolesz FA (1996) Adaptive seg-mentation of MRI data. IEEE Trans Medical Imaging 15:429–442.
Wiedermann D, Schuff N, Matson GB, Soher BJ, Du AT, Maudsley AA,Weiner MW (2001) Short echo multislice MR spectroscopic imaging:metabolite distributions and reliability. Magn Reson Imaging 19:1073–1080.
Zhu X, Du A, Jahng G, Maudsley A, Weiner M, Schuff N (2002) Im-proved SNR of proton MRSI using a deformation shape-intensitymodel ISMRM. Proceedings of the 10th Scientific Meeting of theInternational Society for Magnetic Resonance in Medicine, Honolulu,HI. ISMRM, Berkeley, CA, vol. 1, 231.
1H MRSI OF CHRONIC ACTIVE HEAVY DRINKERS 661