effects of food assistance and nutrition programs on nutrition and health, volume 2, data sources
TRANSCRIPT

United StatesDepartment ofAgriculture
Economic ResearchService
Food Assistanceand NutritionResearch ReportNumber 19-1
Food Assistance & Nutrition Research Program
Effects of Food Assistance and Nutrition Programs on Nutrition andHealthVolume 2, Data Sources
United StatesDepartment ofAgriculture
Economic ResearchService
Food Assistanceand NutritionResearch ReportNumber 19-2
Christopher LoganMary Kay FoxBiing-Hwan Lin

Effects of Food Assistance and Nutrition Programs on Nutrition and Health:Volume II, Data Sources. By Christopher Logan and Mary Kay Fox of AbtAssociates Inc., and Biing-Hwan Lin, Food and Rural Economics Division,Economic Research Service, U.S. Department of Agriculture. Food Assistance andNutrition Research Report No. 19-2.
Abstract
This is the second of four reports completed by Abt Associates Inc., under thecontract “The Nutrition and Health Outcome Study.” This report is an evaluation ofvarious data sources for their potential for analyzing the impacts of USDA’s foodassistance and nutrition programs (FANPs). Data sources are evaluated againstthree criteria: coverage of both program participants and nonparticipants;identification of participants and determination of eligibility amongnonparticipants; and availability of impact measures. Each data source is classifiedinto one of four categories: principal, potential, recognized, and insufficient.Principal and potential sources are discussed and profiled in this report.
Key words: USDA Food Assistance and Nutrition Programs, data sources,program participation, nutrition outcomes, health outcomes.
Acknowledgments
The authors wish to recognize the numerous staff members of Abt Associates whoprovided valuable assistance. Simon Cohen, Nike Griffin, Tina Mello, BillO’Brien, and Manuel Orejuela collected documentation and summarized datasources. William (Chris) Hamilton provided helpful technical review. Eileen Faheyprovided steadfast production support. The report also benefited greatly frominsightful comments and suggestions from many reviewers at USDA, includingAlanna Moshfegh at Agricultural Research Service; David Smallwood, MargaretAndrews, and Joanne Guthrie at Economic Research Service; and PatriciaMcKinney and Steve Carlson at Food and Nutrition Service.
Washington, D.C. 20036 September 2002

Contents
Summary . . . . . . . . . . . . . . . . . . . . . . . . . . . . . . . . . . . . . . . . . . . . . . . . . . . . . . iv
Introduction . . . . . . . . . . . . . . . . . . . . . . . . . . . . . . . . . . . . . . . . . . . . . . . . . . . . . 1Identifying Data Sources for Review . . . . . . . . . . . . . . . . . . . . . . . . . . . . . . . . 1Completing Initial Utility Assessments . . . . . . . . . . . . . . . . . . . . . . . . . . . . . . 2Categorizing the Relevance of Data Sources . . . . . . . . . . . . . . . . . . . . . . . . . . 2
Principal Data Sources . . . . . . . . . . . . . . . . . . . . . . . . . . . . . . . . . . . . . . . . . . . . 3Overview of Principal Sources . . . . . . . . . . . . . . . . . . . . . . . . . . . . . . . . . . . . . 6
Consumer Expenditure Surveys (CES): Interview and Diary Surveys . . . . . .6 Continuing Survey of Food Intakes by Individuals
(CSFII 1994-96, 1998) . . . . . . . . . . . . . . . . . . . . . . . . . . . . . . . . . . . . . . .7Current Population Survey (CPS) Food Security Supplement . . . . . . . . . . . .8Early Childhood Longitudinal Study-Kindergarten Cohort
(ECLS-K) . . . . . . . . . . . . . . . . . . . . . . . . . . . . . . . . . . . . . . . . . . . . . . . .9National Food Stamp Program Survey (NFSPS, 1996-97) . . . . . . . . . . . . .10National Health and Nutrition Examination Survey,
Third Round (NHANES-III) . . . . . . . . . . . . . . . . . . . . . . . . . . . . . . . . .11National Longitudinal Survey of Youth, 1979 Cohort (NLSY79) . . . . . . . .12National Longitudinal Survey of Youth-Mother and Child
Supplements (NLSY-MC) and National Longitudinal Survey of Youth-Young Adults (NLSY-YA) . . . . . . . . . . . . . . . . . . . . . . . . . . . .12
National Survey of America’s Families (NSAF) . . . . . . . . . . . . . . . . . . . . .13Panel Study of Income Dynamics and Child Development
Supplement (PSID-CDS) . . . . . . . . . . . . . . . . . . . . . . . . . . . . . . . . . . . .14Survey of Income and Program Participation (SIPP) . . . . . . . . . . . . . . . . .15Survey of Program Dynamics (SPD) . . . . . . . . . . . . . . . . . . . . . . . . . . . . .16
Information on FANP Participation . . . . . . . . . . . . . . . . . . . . . . . . . . . . . . . . 17FSP Participation . . . . . . . . . . . . . . . . . . . . . . . . . . . . . . . . . . . . . . . . . . . 17WIC Participation . . . . . . . . . . . . . . . . . . . . . . . . . . . . . . . . . . . . . . . . . . .19NSLP Participation . . . . . . . . . . . . . . . . . . . . . . . . . . . . . . . . . . . . . . . . . .19SBP Participation . . . . . . . . . . . . . . . . . . . . . . . . . . . . . . . . . . . . . . . . . . . .22Participation in Other FANPs . . . . . . . . . . . . . . . . . . . . . . . . . . . . . . . . . . .22
Data on Nutrition- and Health-Related Measures . . . . . . . . . . . . . . . . . . . . . .22Food Expenditures and Intake . . . . . . . . . . . . . . . . . . . . . . . . . . . . . . . . . .24Food Sufficiency . . . . . . . . . . . . . . . . . . . . . . . . . . . . . . . . . . . . . . . . . . . .24Physical and Biochemical Measures . . . . . . . . . . . . . . . . . . . . . . . . . . . . . .27Birth Outcomes . . . . . . . . . . . . . . . . . . . . . . . . . . . . . . . . . . . . . . . . . . . . .27Health Behaviors . . . . . . . . . . . . . . . . . . . . . . . . . . . . . . . . . . . . . . . . . . . .27Health Status and Other Health-Related Variables . . . . . . . . . . . . . . . . . . .27Physical, Cognitive, and Emotional Status/Performance . . . . . . . . . . . . . . .30
Potential Data Sources . . . . . . . . . . . . . . . . . . . . . . . . . . . . . . . . . . . . . . . . . . . .30Sources With Poor Match Between Program and Outcome Data . . . . . . . . . . .30
Americans’ Changing Lives (ACL) . . . . . . . . . . . . . . . . . . . . . . . . . . . . . .32Medical Expenditure Panel Survey (MEPS) . . . . . . . . . . . . . . . . . . . . . . . .32National Health Interview Survey (NHIS) . . . . . . . . . . . . . . . . . . . . . . . . .33National Household Education Survey (NHES) . . . . . . . . . . . . . . . . . . . . .33
ii • Effects of Food Assistance and Nutrition Programs on Nutrition and Health/FANRR-19-2 Economic Research Service, USDA

National Longitudinal Study of Youth 1997 (NLSY97) . . . . . . . . . . . . . . .34National Survey of Family Growth (NSFG) . . . . . . . . . . . . . . . . . . . . . . . .35
Sources With Limited Populations . . . . . . . . . . . . . . . . . . . . . . . . . . . . . . . . .35Evaluation of the Comprehensive Child Development Program-
Second Cohort (CCDP2) . . . . . . . . . . . . . . . . . . . . . . . . . . . . . . . . . . . .37Health and Retirement Study (HRS) . . . . . . . . . . . . . . . . . . . . . . . . . . . . . .38National Immunization Survey (NIS) . . . . . . . . . . . . . . . . . . . . . . . . . . . . .38Pregnancy Risk Assessment Monitoring System (PRAMS) . . . . . . . . . . . .39Survey of Assets and Health Dynamics among the
Oldest Old (AHEAD) . . . . . . . . . . . . . . . . . . . . . . . . . . . . . . . . . . . . . .39
Sources With No Information on FANP Participation . . . . . . . . . . . . . . . . . . .40Behavior Risk Factor Surveillance System (BRFSS) . . . . . . . . . . . . . . . . .40National Longitudinal Study of Adolescent Health (Add Health) . . . . . . . .40
References . . . . . . . . . . . . . . . . . . . . . . . . . . . . . . . . . . . . . . . . . . . . . . . . . . . . . . .43
Appendix AInsufficient Data Sources . . . . . . . . . . . . . . . . . . . . . . . . . . . . . . . .45
Appendix BProfiles of Principal and Potential Data Sources . . . . . . . . . . . . . . .48
List of Tables
Table 1Recognized data sources . . . . . . . . . . . . . . . . . . . . . . . . . . . . . . . . . . . . . .4
Table 2Summary of key data elements in principal data sources . . . . . . . . . . . . . .5
Table 3Information available on food stamp program participation . . . . . . . . . . .18
Table 4Information available on WIC participation . . . . . . . . . . . . . . . . . . . . . . .20
Table 5Information available on NSLP participation . . . . . . . . . . . . . . . . . . . . . .21
Table 6Information available on SBP participation . . . . . . . . . . . . . . . . . . . . . . .23
Table 7Available information on food expenditures and intake . . . . . . . . . . . . . .25
Table 8Information available on food sufficiency and hunger . . . . . . . . . . . . . . .26
Table 9Information available on nutrition- and health-related outcomes . . . . . . .28
Table 10Information available on behavioral, developmental, and performance-related outcomes . . . . . . . . . . . . . . . . . . . . . . . . . . . . . . . . . . . . . .29
Table 11Summary of key data elements in potential data sources with poor match between program data and nutrition/health measures . . . . . . . . . . . .31
Table 12Summary of key data elements in potential data sources that have limited populations . . . . . . . . . . . . . . . . . . . . . . . . . . . . . . . . . . . . . . . . . . .36
Table 13Summary of key data elements in potential data sources that have no information on FANP participation . . . . . . . . . . . . . . . . . . . . . . . . . . . .41
Economic Research Service, USDA Effects of Food Assistance and Nutrition Programs on Nutrition and Health/FANRR-19-2 • iii

iv • Effects of Food Assistance and Nutrition Programs on Nutrition and Health/FANRR-19-2 Economic Research Service, USDA
Summary
Since the mid-1940s, the United States Government has committed to alleviatinghunger and the consequences of inadequate dietary intake. Today, the U.S.Department of Agriculture (USDA) implements 15 programs as a “food safetynet,” to provide low-income people with food or the means to purchase food.These 15 food assistance and nutrition programs (FANPs) were funded at a levelof $34.1 billion in fiscal year (FY) 2001.
Under contract with the Economic Research Service of USDA, Abt Associates Inc.has conducted a study to review the state of current knowledge about FANPimpacts on nutrition- and health-related outcomes. A thorough literature reviewwas conducted to evaluate the strengths and weaknesses of research design,analytical methods, and data sources employed to analyze FANP outcomes. Aseries of four reports has been prepared to document what we know and do notknow about FANP outcomes and to identify future research needs.
This report, the second of the four reports, documents available data sources. Athorough search was conducted to identify data sources of relevance to FANP-related research. The FANPs of interest in this report are the Food Stamp Program(FSP), the Special Supplemental Nutrition Program for Women, Infants, andChildren (WIC), the National School Lunch Program (NSLP), and the SchoolBreakfast Program (SBP).
Each data source was evaluated against three criteria:
• coverage of both program participants and eligible nonparticipants for atleast one of the FANPs;
• identification of program participation status and sufficient information todetermine eligibility for nonparticipants; and
• nutrition- or health-related measures that might be useful in studyingprogram impacts or in describing relevant characteristics of programparticipants and nonparticipants.
Using these criteria, each data source was assigned to one of four categories withcurrent and potential usefulness for FANP research, as follows:
Principal Sources. This category includes existing databases that appear to havethe greatest potential for conducting research on FANP outcomes. These datasources meet all three of the criteria noted above and, in some cases, provide theonly or best source of data for a given outcome. The principal sources haveundergone the most detailed of the assessments for this report.
Potential Sources. The sources in this category are less useful than the principalsources because they cover limited populations, have a critical gap in participationinformation, or include outcome measures that, by comparison, are weaker thanthose available in the principal sources. Many of the potential sources are ongoingdata collection programs that could be made more useful for future FANP researchif questions were incorporated to fill gaps in relevant information.

Recognized Sources. This category includes existing databases that have alreadybeen used to evaluate one or more of the FANPs. The sources are either dated orhave not been expanded since initial analyses were conducted, so additionalanalyses of them may not be warranted.
Insufficient Sources. Data sources in this category were judged to have very littlepotential for evaluating outcomes of FANPs, so detailed assessments were notcompleted.
In all, 26 data sources were classified into the 2 categories offering clear potentialfor FANP-related research, namely, principal and potential sources. (There are 13principal sources and 13 potential sources.) In this report, key FANP-related datafor each of the 26 data sources are discussed in detail. In addition, each of them isprofiled by listing information on purpose of the research, sponsoringorganization/agency, data collection timeline, population covered, sampling design,FANPs for which participation is identified, nutrition- and health-related data,demographic data, and data availability.
Economic Research Service, USDA Effects of Food Assistance and Nutrition Programs on Nutrition and Health/FANRR-19-2 • v


Introduction
The Nutrition and Health Outcomes Study is beingcarried out by Abt Associates Inc., under contract withthe Economic Research Service (ERS) of the U.S.Department of Agriculture (USDA). One goal of thestudy was to assess the potential for using availableand future data sources in evaluating the impact ofUSDA’s food assistance and nutrition programs(FANPs) on nutrition- and health-related outcomes.The FANPs of interest are the Food Stamp Program(FSP), the Special Supplemental Nutrition Program forWomen, Infants, and Children (WIC), the NationalSchool Lunch Program (NSLP), and the SchoolBreakfast Program (SBP). The information presentedin this report is an inventory of data sources that canbe used as a foundation for future FANP-relatedresearch.
This report presents assessments of data sources ofpotential interest to researchers in ERS and elsewhereand identifies those most worthy of futureinvestigation. The report focuses exclusively ondocumenting what is available in extant data sourcesor expected to be available through ongoing datacollection programs. No attempt has been made todefine or recommend, in more than a general way,analyses that could be completed with the availabledata. Moreover, it should be noted that, in describingavailable data, we assumed that researchers may beinterested in using these data sources for exploratoryor descriptive analyses as well as impact analyses.Consequently, we cast a very wide net in identifyingpotentially interesting variables. For example, wedocumented the availability of measures of cognitiveand emotional status and performance.
A caveat to using any of the available data sources tomeasure program impacts is that such analyses arelikely to be subject to selection bias, although theanalysis may be specifically structured to address thisproblem. As emphasized in the first report preparedunder this contract, statistical adjustments may be usedto deal with the problem of selection bias, but one cannever be certain that bias has been successfullyremoved (Hamilton and Rossi, 2001).
The report is divided into three sections. The rest ofthis introductory section provides a brief overview ofthe approach used to identify the data sources weexamined, as well as a description of the methods usedto obtain and compile the information for assessing theusefulness of each source. Subsequent sectionsdescribe and compare the principal and potential datasources.
Identifying Data Sources for Review
Identification and review of data sources wereconducted mainly in mid-1999, but information knownto be in flux was updated periodically until this reportwas finalized. The search assumed that the idealsource would combine the following characteristics:
• coverage of both program participants and eligible nonparticipants for at least one of the programs in FANPs;1
• identification of program participation status and sufficient information to determine eligibility for nonparticipants; and
Economic Research Service, USDA Effects of Food Assistance and Nutrition Programs on Nutrition and Health/FANRR-19-2 • 1
1 Some approaches to evaluating program impacts do not requiredata on nonparticipants (e.g., dose-response models), but the mostuseful sources have such data. See Hamilton and Rossi (2001) forfurther discussion.
Effects of Food Assistance and NutritionPrograms on Nutrition and Health:
Volume II, Data Sources
Christopher Logan, Mary Kay Fox, and Biing-Hwan Lin

• nutrition- or health-related measures that might be useful in studying program impacts or in describing characteristics of program participants and nonparticipants.
To compile a comprehensive inventory of availabledata, we cast a wide net in identifying potentiallyuseful variables for FANP research.
The search considered available databases that mightmeet all of these criteria, as well as ongoing orplanned data collection programs that could do so inthe future. Development of the list of potential datasources began with the data sources used in theNational Nutrition Monitoring and Related ResearchProgram (NNMRRP) (Federation of AmericanSocieties for Experimental Biology (FASEB), 1995).Additional sources were identified through a carefulreview of major database references, as well asthrough searches of World Wide Web sites ofgovernment agencies and other research organizationsknown to collect nutrition- and/or health-related data.To ensure relevance to the current policy and programenvironment, databases that included only datacollected before 1990 were not considered for review.
Recently, the Interagency Board for NutritionMonitoring and Related Research (IBNMRR, 2000)compiled a list of surveys, studies, and databases thatcontain data on (1) nutrition- and health-relatedmeasurements, (2) food and nutrient consumption,(3) knowledge, attitudes, and behavior assessments, (4)food composition and nutrition databases, (5) foodsupply determinations, and (6) nutrition monitoringactivities in the States. This document was not reviewedin detail, but a preliminary check (as well as the authors’and reviewers’ knowledge) suggested that no importantsources have been overlooked. Many of the surveyslisted in the IBNMRR report are not reviewed herebecause they do not meet the aforementioned criteria,but they may contain data useful for researchpertaining to nutrition, diet, and health.
Completing Initial Utility Assessments
A standard profile form was used to document eachdata source. The profile included the followinginformation:
• purpose of research,
• sponsoring organization/agency,
• data collection timeline (beginning and end dates),
• population covered,
• sampling design,
• FANPs for which participation is identified,
• nutrition- and health-related data,
• demographic data,
• data availability, and
• purchasing/ordering contact and costs.
For the most promising sources, FANP participationvariables and nutrition and health measures weredocumented in more detail.
Information on the characteristics of each data sourcewas obtained from the first volume of the Third Reporton Nutrition Monitoring in the United States (FASEB,1995); searches of World Wide Web sites; and telephoneand mail communication with sponsoring agencies andorganizations. Copies of survey questionnaires andassociated documentation were obtained from theWorld Wide Web, Abt Associates’ in-house resources,or the data repository for the source.
Categorizing the Relevance of Data Sources
As noted, it was assumed that the ideal data source forFANP research would include coverage of both programparticipants and eligible nonparticipants for at least oneFANP; identification of program participation statusand sufficient information to determine eligibility fornonparticipants; and potentially useful nutrition-and/or health-related measures.
Using these criteria, each data source was assigned toone of four categories reflecting current and potentialusefulness for FANP research, described below.
Principal Sources
This category includes existing databases that appear tohave the greatest potential for conducting FANP research.They meet all three of the criteria noted above and, insome cases, provide the best or only source of data fora given outcome. All but one of the principal datasources are recurrent data collection programs, offeringopportunity for historical analyses, and several are longi-tudinal in design. The principal sources have undergonethe most detailed of the assessments for this report.
2 • Effects of Food Assistance and Nutrition Programs on Nutrition and Health/FANRR-19-2 Economic Research Service, USDA

Economic Research Service, USDA Effects of Food Assistance and Nutrition Programs on Nutrition and Health/FANRR-19-2 • 3
Potential Sources
The data sources in this category are less useful thanthe principal sources because they cover limitedpopulations, have a critical gap in participationinformation (for example, they include birth outcomemeasures but not information on WIC participation),or include outcome measures that, by comparison, areweaker than those available in the principal sources.(Some potential sources have limitations in two ormore of these areas.) Many of these sources areongoing data collection programs that could be mademore useful for future FANP research if questionswere incorporated to fill gaps in relevant information.
Recognized Sources
This category includes existing databases that havealready been used to evaluate one or more of theFANPs. These sources are either dated (including onlypre-1990 data) or have not been expanded since theirinitial analyses were conducted, so it is unlikely thatadditional analyses are warranted. Recognized sourcesare listed in table 1.
Insufficient Sources
Data sources assigned to this category were notconsidered candidates for future analyses and detailedassessments were not completed. Although many ofthese sources include relevant data, they were judgedto have very little potential for evaluating outcomes ofFANPs. Sources were classified as insufficient forhaving one or more of the following drawbacks:
• including only pre-1990 data;
• having limited or nonexistent measures of interest (program participation and/or outcomes), with the gaps either impossible to fill (extant databases) or unlikely to be rectified (narrowly focused ongoing data collection program);
• including a very limited population (descriptive studies of program participants are in this category);
• being proprietary; or
• being an administrative database that wouldrequire a complex linkage to another data source to combine information on program participation and outcomes.
A list of insufficient data sources is given in Appendix A.
It should be noted that the classification ofadministrative databases as insufficient is based on thepurposes of this study. Nevertheless, these data sourcescan be merged with other databases that provideinformation on program participation. A good exampleis the WIC-Medicaid database constructed for USDA’sFood and Nutrition Service (FNS) in the late 1980s(Devaney et al., 1991).
The next sections provide detailed descriptions ofprincipal and potential data sources, respectively. Adetailed profile of each source is provided inAppendix B.
Principal Data Sources
The data sources described in this section are currentlyavailable datasets that can be used to examine theeffects of FANPs on nutrition and health outcomes.Each source meets the minimum requirements describedin the preceding section. In addition, all but two of theprincipal data sources are ongoing national datacollection programs that are updated on a regularschedule, allowing update of any analyses as subsequentdata become available.2 The recurring nature of thesedata collection programs also provides the opportunityfor future expansion of program participation informa-tion and/or nutrition and health outcome measures.Some data collection programs have been in progressfor some time, offering the potential for longitudinalanalyses at the aggregate or individual level. Finally,some of the principal data sources represent the best oronly source of information for certain outcomes ofinterest.
Table 2 summarizes key characteristics of the principaldata sources. Sources are listed in alphabetical order,by title. The table shows the major FANPs for whichparticipation information is available and the broadcategories of nutrition- and health-related measuresthat are available.3 It also provides the time period for
2 As discussed later in this section, two of the principal sourceshave been combined into a single ongoing program since the mostrecent available data were collected.
3 Table 2 focuses on participation data for the SpecialSupplemental Nutrition Program for Women, Infants and ChildrenProgram (WIC), the Food Stamp Program (FSP), the National SchoolLunch Program (NSLP), and the School Breakfast Program (SBP).These are the four FANPs most often identified in major surveys.Available participation data for other FANPs (quite limited bycomparison) are discussed in the text.

4 • Effects of Food Assistance and Nutrition Programs on Nutrition and Health/FANRR-19-2 Economic Research Service, USDA
Bogalusa Heart Study
Child and Adolescent Trial for Cardiovascular Health
Food Stamp Program Cash-Out Evaluations
National Evaluation of the Elderly Nutrition Program
National Maternal and Infant Health Survey
National Maternal and Infant Health Survey, Longitudinal Followup
Nationwide Food Consumption Survey (NFCS)
School Nutrition Dietary Assessment Study (SNDA-I)
WIC-Medicaid Database
Table 1—Recognized data sources

Econom
ic Research S
ervice,US
DA
Effects of Food A
ssistance and Nutrition P
rograms on
Nutrition and H
ealth/FAN
RR
-19-2•
5
Table 2—Summary of key data elements in principal data sourcesFANPs identified Nutrition- and health-related measures available1
Physical/Latest Food Food/ Food Physical/ Health- Health cognitive/year expend- nutrient sufficiency/ biochemical Birth related status/ emotional status
Data source available* WIC FSP NSLP SBP itures intake hunger measures outcomes behaviors2 care3 or performance4
Consumer Expenditure Surveys (CES) Interview and Diary Surveys 1999 � �5 �5 � �
Continuing Survey of Food Intakes 1994-96,by Individuals (CSFII) 1998 � � � � � � � � � �
Current Population Survey-Food Security Supplement (CPS-FSS) 1999 � � � � � � �
Early Childhood Longitudinal Study,Kindergarten Cohort (ECLS-K) 1998-99 � � � � � � � � � �
National Food Stamp Program Survey (NFSPS) 1996-97 � � � � � �6 � � �
National Health and Nutrition Examination Survey (NHANES) III 1988-94 � � � � � � � � � � �
National Longitudinal Survey of Youth 1979 (NLSY79) 1999 � � � � � � � � �
National Longitudinal Survey of Youth-Mothers and Children (NLSY-MC) 1998 � � � � � � � � �
National Longitudinal Survey of Youth-Young Adults (NLSY-YA) 1998 � � � � � � � �
National Survey of America’s Families (NSAF) 1999 � � � � � � �
Panel Study of Income Dynamics-Child Development Supplement (PSID-CDS) 1997 � � � � � � � � � � � �
Survey of Income and Program Participation (SIPP) 2000 � � � � � � �
Survey of Program Dynamics (SPD) 1998 � � � � � � � �
1See text for definitions and outcome categories.2Includes breastfeeding, immunization, and other health-related behaviors.3Includes medical conditions related to nutrition, general health status, and health care utilization/expenses.4Includes physical development/performance, cognitive development/performance, emotional/social development/health, school attendance/performance.5Identifies participants in school lunch or breakfast program, treating the two programs as a program rather two separate programs.6Household food use and availability of nutrients are reported using a 7-day household food use record.*As of 12/21/01.

6 • Effects of Food Assistance and Nutrition Programs on Nutrition and Health/FANRR-19-2 Economic Research Service, USDA
the most recent data. Tables and text presented later inthis section give more detailed information on thespecific measures within each of the broad categoriesshown in table 2.
Overview of Principal Sources
The following pages describe each of the principalsources and the kinds of data they provide. Sources arereviewed in alphabetical order, as they appear in table2. Following these individual descriptions, separatesections describe the information on FANPparticipation and specific nutrition- and health-relatedmeasures available in each source.
Consumer Expenditure Surveys (CES):Interview and Diary Surveys
The CES are a continuing series of studies on all typesof expenditures by consumers, ranging from food andother expendable items to major purchases of durablegoods and housing expenses. The objectives of theCES are “to provide the basis for revising the weightsand associated pricing samples for the Consumer PriceIndex (CPI) and to meet the need for timely anddetailed information on the spending patterns ofdifferent types of families.”4 The Bureau of LaborStatistics (BLS), U.S. Department of Labor, hasoverall responsibility for the CES, and the Bureau ofthe Census, U.S. Department of Commerce, performsthe data collection and initial processing undercontract with the BLS.
The current version of the CES began in 1979, after aseries of less frequent consumer expenditure surveys.The CES has two separate components: the quarterlyInterview Survey and the annual Diary Survey. TheInterview Survey gathers detailed quarterly data onlarge and regularly occurring expenditures,employment, and household income (including foodstamp benefits and public assistance). One potentiallyuseful component is the series of items on out-of-pocket health care expenditures and health insurancepremiums. This survey also collects global estimatesof food and other frequent, variable expenses; theseestimates include the frequency and average price ofschool meals purchased by or for children in the
household.5 Each sampled household participates forfive consecutive quarters, with one-time questions onhousehold composition, demographics, and certaintypes of income (such as alimony and child support).
For the Diary Survey, which has an independentsample, each consumer unit (household) completes adiary for 2 consecutive weeks, providing detailed,item-level records of expenditures on food andbeverages (at home and away) and on other small,frequent purchases for which a quarterly recall islikely to be inaccurate (such as nonprescription drugs).A Census interviewer collects information from eachDiary Survey household on household compositionand on individual characteristics, including age, sex,race, marital status, work experience, annual earnings,and annual income from public assistance, food stampbenefits, and other nonearned sources. Since the Diaryand Interview Surveys involve separate samples, datafrom these surveys cannot be combined at thehousehold level, but it can be combined at higherlevels, such as for demographic characteristics.
The Consumer Expenditure Survey uses a multistage,nationally representative probability sample of civiliannoninstitutionalized households. The sample ofhouseholds is selected within 101 primary samplingunits (PSUs), which are counties, parts of counties, orindependent cities. The main sample frame is the mostrecent Census 100-percent detail file, which is updatedwith new construction permits. For the Diary Survey,8,020 addresses are selected annually in order to yieldan effective sample of 5,870 households. The DiarySurvey response rate in 1994 was 81 percent. For theInterview Survey, 8,910 addresses are contacted eachquarter, with one-fifth being new to the sample. Theeffective sample size is targeted at 6,160; this figureexcludes households in the first quarter ofparticipation, for whom the expenditure data arecollected for bounding purposes. The 1994 InterviewSurvey had a response rate of 83 percent.
The CES has few measures related to nutrition orhealth, but the food expenditure data it provides are ofpotential interest. With the discontinuation of USDA’sNationwide Food Consumption Survey, the CES is the
4 U.S. Department of Labor, Bureau of Labor Statistics (1997).BLS Handbook of Methods, p. 161.
5 The Interview Survey does not differentiate between schoollunches and breakfasts, so this source cannot be used to assessdiscrete impacts for the NSLP or SBP. It could be used, however, to study overall “school-based” Child Nutrition programs. The sametype of information is collected in the Diary survey using a 30-dayreference period.

Economic Research Service, USDA Effects of Food Assistance and Nutrition Programs on Nutrition and Health/FANRR-19-2 • 7
most comprehensive ongoing source of informationabout how much low-income families spend for foodand what they purchase, although the National FoodStamp Program Survey also provides data on thistopic, as discussed later in this section.
Continuing Survey of Food Intakes byIndividuals (CSFII 1994-96, 1998)
The CSFII 1994-96, 1998, conducted by theAgricultural Research Service (ARS), was USDA’s10th nationwide food consumption survey and the 6thto include information on individual dietary intake.6
The survey was designed to measure the kinds andamounts of foods eaten by a nationally representativesample of noninstitutionalized individuals of all agesin the 50 States and Washington, DC.
Dietary intake was measured through twononconsecutive 24-hour recalls. In addition to detaileddietary recalls, the survey included a nonquantitativefood frequency table, questions about food sufficiencyand breastfeeding, and self-reported height, weight,and general health status. Finally, the CSFII includedquestions about individual household members’participation in the FSP, WIC, NSLP, and SBP.
The sample design used for the 1994-96 CSFII is astratified, multistage area probability sample.Households were screened to identify appropriatenumbers of sample persons in specified sex/agegroups, with oversampling of households at or below130 percent of the Federal poverty guidelines.
In all, 19,830 sample persons were identified throughscreening over the 3 years of the survey (1994-96). Athouseholds where one or more sample persons wereselected, interviewers administered the householdquestionnaire. This interview included individual-leveldata on FANP participation for each householdmember. Any adult household member was anacceptable respondent for the household interview, butan effort was made to conduct this part of the surveywith the main meal planner/preparer or a personknowledgeable about characteristics such as householdincome. Approximately 85 percent of the householdsthat were screened responded to this interview.Interviewers then attempted to conduct the first 24-
hour recall interviews with sample persons/proxies(making repeated in-person visits, when necessary, todo so). The protocol for the 24-hour recall in theCSFII did not allow interviewers to scheduleappointments with respondents for followup attemptsand day-2 intake interviews after the first scheduledinterview; it was believed that respondents’ eatingbehavior might be influenced if they knew when theywould be asked to report what they had eaten. Thesecond dietary recall was to be conducted 3 to 10 daysafter the first. Both recall interviews used identicalmethodology, including a “multiple pass” method tomaximize the sample person’s ability to rememberwhat he or she had consumed. The overall responserate for the first recalls was 80 percent; for the secondrecalls it was 76 percent.
In addition to the CSFII, USDA also conducted theDiet and Health Knowledge Survey (DHKS) among arandom sample of the CSFII respondents whocompleted the day-1 intake and were age 20 and over.When USDA added the DHKS to the CSFII in 1989-91, the DHKS was the first national survey of dietaryattitudes and knowledge in which the results could belinked to the respondents’ food and nutrient intakes.The DHKS provides information on respondents’perceived adequacy of their food and nutrient intakes,their knowledge about the recommendations in theFood Guide Pyramid (USDA, 1992), the personalimportance they place on dietary guidance messages,their awareness of relationships between diet andhealth, and their use and understanding of food labels.Data from the DHKS are used to improveunderstanding of factors that affect food intake and toidentify ways to implement effective dietary guidance.The DHKS was conducted mainly as a telephonesurvey, with 5,765 respondents completing it, aresponse rate of 74 percent, in 1994-96.
A supplemental survey of a sample of 5,559 childrenup to the age of 9 was completed in 1998. This survey(CSFII 1998) used the same methods as the CSFII1994-96 and obtained the same food and nutrientintake data. The supplemental sample was added toprovide an adequate sample of children for analyzingexposure to pesticide residues. However, the combinedCSFII 1994-96 and 1998 data on children’s food andnutrient intakes will also be useful for analyses ofchildren’s nutritional and health status.
6 In 2000, a decision was made to merge the CSFII and theNational Health and Nutrition Examination Survey (NHANES). TheCSFII dietary recall instrument and data processing system willbecome part of the NHANES protocol.

8 • Effects of Food Assistance and Nutrition Programs on Nutrition and Health/FANRR-19-2 Economic Research Service, USDA
Starting in 2002, the CSFII will be integrated with theNational Health and Nutrition Examination Survey(NHANES), as discussed in the section on NHANES.
Current Population Survey (CPS) FoodSecurity Supplement
The CPS is a continuing monthly household survey ofthe U.S. civilian noninstitutionalized population,designed to provide updates of population,demographic, and labor force data, including uniformnational data on employment and unemployment rates.This survey has been conducted by the BLS for over50 years. The monthly CPS uses a multiframe,multistage stratified random sample of approximately60,000 households, designed to produce reliable Stateestimates on an annual basis for items in the basicmonthly questionnaire. The sample is divided intoeight panels or rotation groups. Each rotation group isinterviewed for 4 consecutive months, is out of samplefor the next 8 months, and then is interviewed for 4additional months before being retired from the survey.Therefore, there is approximately a 75-percent overlapof sample from month to month. Each time ahousehold enters (or reenters) the sample, the CPSinterview is conducted in person; at other times,telephone interviews are conducted if possible. Thebasic monthly CPS has no FANP participation ornutrition/health outcome data.
Various supplements to the CPS are collected annuallyor on other schedules. The Annual DemographicSupplement (ADS), conducted in person every March,collects information on income, public assistance, andFANP participation in the prior calendar year. TheADS also gathers data on educational attainment andgeographic mobility, and it provides the basis forannual profiles of the U.S. population. The March CPSsample for the ADS is supplemented by approximately2,500 Hispanic households from the previousNovember sample, who are out of the current CPSsample. (Other supplemental topics collected onvarious schedules include school enrollment, fertility,and marital history.)
The CPS is the principal source for data on foodsecurity among FANP participants andnonparticipants. In April 1995, the Census Bureauadministered the first annual Food SecuritySupplement (FSS) to the CPS. The FSS, which wasdeveloped by USDA and other Federal agencies,comprised two related series of questions about food
sufficiency, hunger or skipping meals, and copingstrategies when food supplies available through usualmeans were insufficient. One set of questions used a12-month reference period, while the other used a 30-day period. Through a statistical modeling process, the12-month series was used to develop a continuousscale of food insecurity and hunger (Hamilton et al.,1997).7 Eighteen questions are used to construct thisscale; these questions have been included in annualCPS-FSS data collection from 1996 through the present.
The CPS-FSS also includes questions on programparticipation (WIC, FSP, NSLP, and SBP) and otherimportant household characteristics not covered by theregular monthly CPS.8 Screening questions are used toexclude households with incomes above 185 percentof the poverty level, except for those that indicatepossible food insecurity through responses toscreening questions. The FSS obtains self-reporteddata on household food expenditures and generalhealth status of adult respondents.
The CPS-FSS data for 1996-97 have been analyzedunder a contract to FNS, and the 1998 data have beenanalyzed by ERS. Preliminary results from theseanalyses have been published by FNS (Bickel et al.,1999) and ERS (Andrews et al., 2000). These resultsindicate that the food security scale is stable androbust. ERS has also funded a study to test the foodsecurity measure in a sample of low-incomehouseholds in Hawaii.9
Although USDA has already committed considerableresources to analyzing the available CPS-FSS data, it isconsidered a principal source of the information neededto examine the relationship between food security andFANP participation (single or multiple programs).Moreover, the sample overlap between the
7 The 30-day items were used to construct another scale, but thisscale was not considered sufficiently robust for further use.
8 The CPS-FSS also identifies preschoolers and children inchildcare who receive free or reduced price meals. The qualificationof free or reduced-price meals clearly identifies low-income FANPparticipants; however, it is not possible to tell whether meals areprovided by the NSLP (preschools or childcare associated withNSLP schools) or the Child and Adult Care Food Program(CACFP)(other childcare institutions). Moreover, because childrenparticipating in the CACFP through family childcare homes are notmeans tested, the question would fail to identify these children.
9 Jennifer Anderson, “Independent Validation of the Core FoodSecurity Measure with Asian and Pacific Islanders,” research inprogress at Colorado State University, under a USDA-ERS smallgrant through Institute for Research on Poverty.

Economic Research Service, USDA Effects of Food Assistance and Nutrition Programs on Nutrition and Health/FANRR-19-2 • 9
April FSS and the March ADS provides additionalopportunities for analysis.
Use of the CPS-FSS is subject to several caveats. First,although the response rate for the basic CPS is quitehigh (around 95 percent) and the sample frame is ofvery high quality, coverage rates for somedemographic groups (especially Blacks under the ageof 40) fall below 85 percent. Second, the effectiveresponse rate for the 1995 FSS was only 77 percent.Third, the CPS does not include homeless persons,who may represent the population relying most onfood stamps and other benefits to avoid hunger(particularly homeless adults without dependents).Fourth, the analytic literature suggests that the CPShas tended to understate FSP participation rates, basedon comparisons with estimates derived from the SIPPand administrative data, although the 1994 redesign ofthe CPS may have reduced this bias (Castner andCody, 1999).
Early Childhood Longitudinal Study-Kindergarten Cohort (ECLS-K)
The ECLS is designed to collect nationallyrepresentative data on the status and development ofyoung children and on their family, school, andcommunity environments. The primary focus of thisstudy is on the child’s educational progress andexperience, including transition to nonparental care,preschool education, preparedness for school, andexperiences and growth through the fifth grade. TheNational Center for Education Statistics (NCES) hasundertaken this study with the goal of creating a“comprehensive and reliable data set that can be usedto inform policies related to early and middlechildhood education” (NCES, 1999). The study isdesigned (1) to provide reliable descriptive data onchildren from birth through the fifth grade and (2) tosupport analytic tests of hypotheses about therelationships between children’s developmentalexperiences, their individual characteristics, and thecharacteristics of their families, schools, andcommunities.
The ECLS will follow two cohorts of children,kindergarten and birth, for several years. The study hasbegun collecting data on the kindergarten cohort(ECLS-K), a nationally representative sample of about22,000 children who entered kindergarten during the1998-99 school year. According to current plans, this
cohort will be followed through the fifth grade in2004. In 1999 and 2000, field tests were conducted forthe study of the birth cohort (ECLS-B). According toavailable plans for the study, ECLS-B will include anationally representative sample of 15,000 childrenborn in 2001 and will follow the children through thefirst grade (NCES, 2001). The ECLS-B instrumentsare currently undergoing revisions to address problemsencountered in the field tests, and the availableinformation is limited.10 Therefore, only the ECLS-Kis clearly a principal source that is available and usefulfor FANP research. Nevertheless, if current plans arerealized, the ECLS-B will likely have considerablesearch value, particularly with respect to FANP impactson the development of infants and toddlers.
The ECLS-K uses a multistage design with samplingof PSUs, schools, and students. Asian and PacificIslander children were oversampled to provide asufficient sample for analysis, as were private schoolsand kindergartens. The study is designed to supportestimates for Black, Hispanic, and White childrenwithout oversampling.
ECLS-K baseline data were collected from children,parents, and teachers in the fall of 1998, when thecohort entered kindergarten. Data were collected againfrom these three groups and from the schools in thespring of 1999.11 In the fall of 1999 (the start of thefirst grade year for children who leave kindergarten),data were collected from a subsample of children andtheir parents. Data from the full sample of children,parents, teachers, and schools were collected in thespring of 2000 and will be repeated in the spring of2002 and of 2004 (that is, near the end of first, third,and fifth grades for children who progress each year).Child assessments are being done in school viacomputer-assisted personal interview (CAPI); Spanish-speaking children not proficient in English are beingassessed in Spanish. Parent interviews are being doneby computer-assisted telephone interview (CATI) or,for households without telephones, by CAPI.
10 Current plans for the ECLS-B call for collection of data onpregnancy and birth outcomes; breastfeeding and other infantfeeding practices; food security; height, weight and other bodymeasurements; early childhood health status; and cognitive, social,emotional, and physical development.
11 Data for the base year of ECLS-K (fall and springkindergarten) were released in December 2000.

10 • Effects of Food Assistance and Nutrition Programs on Nutrition and Health/FANRR-19-2 Economic Research Service, USDA
Results from the 1998-99 school year data collectionsuggest some potential problems with response rates.Only 69 percent of the 1,277 sampled schoolsparticipated in the fall, but the response rate for theseschools increased to 74 percent in the spring, and 73substitute schools were added to increase the springsample (West, Denton, and Reaney, 2000).Cooperation rates for child assessments, parentinterviews, and teacher questionnaires were quite high(between 85 and 90 percent), but the schoolnonresponse rates drove down the effective responserates to levels that might be cause for concern (66percent for the child assessments and 63 percent forparent interviews). NCES asserts that the response ratesare comparable to its other school-based longitudinalstudies. NCES is currently conducting a multifacetedanalysis of potential nonresponse bias.
ECLS-K data of particular interest include participationin FANPs and a wealth of developmental outcomesrelated to nutrition and health. FANP participation datawill include WIC participation for the mother andchild, household food stamp participation, and thechild’s participation in NSLP, SBP, and snacksprovided in childcare.
The ECLS-K will provide the opportunity to relateprogram participation by children and their families toobjective measures of the child’s well-being anddevelopment, as well as to educational and socialoutcomes. Key nutrition- and health-related measuresinclude food security, eating patterns, height andweight, birth outcomes, health-related behaviors,general health status, measures of physical, cognitive,and social/emotional development, and schoolperformance. In addition, the ECLS-K will collect aconsiderable array of demographic and contextualinformation on the children, their parents or guardians,their teachers and schools, and their communities.
National Food Stamp Program Survey (NFSPS, 1996-97)
The NFSPS was conducted under contract to USDA’sFood and Nutrition Service between June 1996 andJanuary 1997. Among the principal data sources, theNFSPS is the only one-time survey. The surveyexamined the monetary and nonmonetary costs ofparticipating in FSP, customer satisfaction withservices provided, accessibility of the FSP, access toand satisfaction with food stores, food security statusof FSP participants and eligible nonparticipants, and
nutrient availability of food use by a subset of FSPparticipants. Even though there is no plan to repeat theNFSPS in the future, it is considered a principal datasource due to the strengths discussed below.12
The NFSPS employed both computer-assistedtelephone interview (CATI) and computer-assistedpersonal interview (CAPI) methods to collect datafrom low-income households, including 2,454 FSPparticipants, 450 eligible nonparticipants, and 405near-eligible nonparticipants. Social, demographic, andeconomic characteristics of sampled households werecollected. The respondents’ experience, time required,and cost incurred in FSP application and recertificationwere recorded. The reasons that low-income eligiblehouseholds did not apply for Food Stamp benefits werealso asked. Therefore, the NFSPS data are ideally suitedfor understanding the factors affecting low-incomehouseholds’ decisions about FSP participation.13
There are two major strengths in the NFSPS data.First, approximately 950 FSP households providedrecords on food use over a 1-week period. The recordsinclude data on both the quantity and prices of foodused (but not the intake), as well as on expendituresfor food at home and away from home. This is themost recent of USDA surveys that have collectedhousehold-level data on food use, as opposed to theindividual food intake data collected by the CSFII.14
The Food Intake Analysis System (FIAS) was used tocreate a nutrient database of the food purchased,enabling researchers to study nutrient availability toFSP households. A second strength of the NFSPS datalies in the consistent timeframe for data related to foodexpenditure, household income, and food stampbenefits; household income and FSP benefit amountswere collected for the same month in which food usewas reported.
Other useful information collected in the NFSPSincludes the 18-item food security module and data onshopping practices and habits, diet- and health-relatedattitudes and knowledge, and special dietary needs of
12 The final reports for the NFSPS are available atwww.fns.usda.gov/oane/menu/published/fsp/fsp.htm.
13 The reasons for nonparticipation were a major topic of theNFSPS analysis conducted for FNS (Ponza et al., 1999).
14 Earlier surveys include the cash-out demonstration studiesconducted in Alabama, San Diego, and Washington State, as wellas the Nationwide Food Consumption Surveys conducted in 1977-78 and 1987-88.

Economic Research Service, USDA Effects of Food Assistance and Nutrition Programs on Nutrition and Health/FANRR-19-2 • 11
household members. The questions on diet and healthattitudes and knowledge are similar to those questionsin the Diet and Health Knowledge Survey, discussed inthe section on the CSFII.
In addition to detailed information on FSPparticipation, several pieces of information onparticipation in other FANPs were collected. Thesurvey asked if the household had received, during thelast 30 days, (1) free or reduced-cost meals for theelderly, (2) free or reduced-cost school lunches orbreakfasts, (3) WIC food packages (and if so, thenumber of household members participating in WIC),and (4) free foods from other programs, such as a foodbank or pantry.
National Health and Nutrition ExaminationSurvey, Third Round (NHANES-III)
The NHANES-III is the latest in a series of sevennational health examination studies conducted by theNational Center for Health Statistics (NCHS) of theCenters for Disease Control and Prevention (CDC).Beginning in 1971, a large nutrition component wasadded to the basic design, enabling the NHANES-IIIto contribute periodic information on the nutritionalstatus of the U.S. population. The NHANES-III hascontributed substantially to the formulation and conductof public health policy for the Nation and is one of themajor national surveys in the National NutritionMonitoring and Related Research Programs. NHANES-III data were collected between 1988 and 1994.
The NHANES-III was designed to obtain informationfor assessing the nutritional and health status of theU.S. civilian, noninstitutionalized population. NHANES-III data allow estimation of the national prevalence ofselected diseases, investigation of the natural history ofselected diseases, and assessment of nutritional andhealth status. The survey addressed a broad array ofnutrition and health outcomes and included a single 24-hour recall, a detailed nonquantitative food frequency,information on food sufficiency and hunger, anthropo-metric measurements, nutritional biochemistries(blood, serum, and urine), and selected clinicalassessments.15 The survey also included questionsabout participation in the FSP, WIC, the NSLP, and the SBP.
The first stage of the sample design for NHANES-IIIwas the selection of 81 primary sampling units(PSUs), which were principally individual counties.Using lists of addresses, households in each countywere screened, and individuals were then selectedfrom sampled households based on gender, age, andrace or ethnicity. The procedure was designed to drawlarge numbers of young children, older persons,African Americans, and Mexican Americans in orderto reduce sampling errors for these subgroups.
About 40,000 persons 2 months of age and over wereselected, and they (or their proxies, in the case ofyoung children) were asked to complete extensiveinterviews and examinations in a large mobileexamination center. After the sample individuals wereselected, the interviewer administered either theHousehold Adult Questionnaire (for those 17 years andover) or the Household Youth Questionnaire (for those2 months through 16 years of age) to the sampledperson or proxy respondent. These surveys focused onthe incidence of common diseases and healthconditions. The interview closed with the FamilyQuestionnaire, which was administered to aresponsible adult household member. Thisquestionnaire collected household information oneducational levels, ethnicity, occupations, healthinsurance coverage, family income, and housingarrangements. Sampled persons were then asked tovisit a Mobile Examination Center (MEC) for physicalexaminations, other tests and measurements, nutritioninterviews, and collection of blood and urinespecimens. Approximately 77 percent of those whowere sampled completed the MEC portion of the survey.
The NHANES-III sample consists of 31,311individuals. From previous work with the NHANES-III data, we know that 4,745 of these sample membersare children aged 12 to 59 months. After excludingchildren with incomplete or inconsistent data on WICparticipation and income eligibility, the databaseincludes 1,010 child WIC participants, 2,101nonparticipating children who are financially eligible,and 1,261 children who are financially ineligible(defined as those whose family income is over 200percent of the Federal poverty level).16
The current NHANES began to operate under a newapproach in 1999 as a continuous, annual survey with
15 Because data collection for NHANES-III began before theofficial module of food security questions was finalized by FNS, thesurvey did not include the full module of 18 items.
16 In these exploratory analyses for FNS, we defined WIC incomeeligibility a little more broadly than the actual 185-percent-of-povertycutoff because household income fluctuates from month to monthand WIC income eligibility is checked only when a householdapplies for the benefit.
12 • Effects of Food Assistance and Nutrition Programs on Nutrition and Health/FANRR-19-2 Economic Research Service, USDA
nationally representative samples of 5,000 people peryear. This change will enhance timely release ofNHANES data. NHANES will share PSUs andquestionnaire content with the National HealthInterview Survey (NHIS). The Department of Healthand Human Services plans to provide links toMedicare records and the National Death Index. In2002, the CSFII and NHANES-III data collections willbe combined, providing a single national data sourcefor information on the nutrient intake, nutritionalstatus, and health status of Americans (NCHS, 2000;Dwyer et al., 2001).
National Longitudinal Survey of Youth,1979 Cohort (NLSY79)
The NLSY79 is a continuing longitudinal survey of anationally representative cohort of men and women whowere ages 14-22 when data collection began in 1979.The purpose of the study is to gather information aboutthe lives of the study cohort, with particular attention totheir family backgrounds, education and job training,labor market experiences, and marital and childbearingexperiences. The NLSY79 is the successor to surveysof earlier NLS cohorts of young men and womenbegun in the late 1960s. The NLS program is directedby the BLS. The Center for Human Resource Research(CHRR), Ohio State University, contributes to thesurvey design and manages survey operations and datadissemination, and the National Opinion ResearchCenter (NORC) conducts the surveys under subcontractto CHRR.
Although the NLSY79 is primarily focused onemployment-related activities and experiences, itprovides a substantial amount of longitudinalinformation on respondents’ food expenditures, health,prenatal care, dietary practices during pregnancy, birthoutcomes, postnatal infant care, and infant feeding.17 Italso provides detailed data on household composition,income, assets, housing assistance, food stamp receipt,WIC receipt, and demographic and environmentalvariables. The survey uses a main annual questionnairethat is relatively consistent from year to year but hasevolved as the cohort has aged; special-topic modulesare added periodically to address additional subjects ofinterest. Supplemental surveys have included a 1980survey of respondents’ schools to gather enrollment
data, test scores, and school characteristics; a 1980-83survey of completed high school transcripts; and theadministration of the Armed Services VocationalAptitude Battery. With the exception of 1987, over 80percent of interviews have been conducted in person,with computer-assisted personal or telephoneinterviewing (CAPI/CATI) used since 1993.
The NLSY79 cohort had 8,636 respondents (87 percentof the 9,964 eligible members) in 1996, the mostrecent year for which final counts are available. Theoriginal study sample of 12,686 youth included threesubsamples: a nationally representative main sample of6,111 youths; a supplemental sample of 5,295 youthsrepresenting Hispanic, Black, and economicallydisadvantaged White youth; and a sample of 1,280youths representing enlistees in the Armed Forces. Thesample has diminished because of attrition and becausethe subsamples of military enlistees and disadvantagednon-Hispanic Whites have been discontinued.
National Longitudinal Survey of Youth-Mother and Child Supplements (NLSY-MC)and National Longitudinal Survey of Youth-Young Adults (NLSY-YA)
Two related studies have collected longitudinal data onthe children of the NLSY79 cohort. The Mother andChild Supplements (NLSY-MC) began in 1986 tocollect supplementary data on the birth and earlychildhood experiences of mothers in the NLSY79cohort and their children. Since then, these children(and subsequent children born to the NLSY79 women)have been assessed biennially on cognitive,psychological, and social/emotional dimensions, boththrough interviews with their mothers and throughdirect administration of standardized developmentaltests. Older children (ages 10-14) have been givenself-administered questionnaires on sensitive topicsconcerning behavior, attitudes, relationships, andeducational expectations. Starting in 1994, theNLSY79 cohort’s children aged 15 and older havebeen interviewed biennially as a new cohort of youngadults (NLSY-YA). NLSY-YA collects information oneducation and training, work, health, dating andmarriage, pregnancy and birth outcomes, infant feedingpractices, childcare, household composition, and familyincome and assets.
The longitudinal nature of the NLSY permits theNLSY79 data on the mothers to be linked with theNLSY-MC data on their children and with the
17 Pregnancy and birth outcomes include: maternal weight gain,length of gestation/weeks premature, and infant birthweight andlength.

Economic Research Service, USDA Effects of Food Assistance and Nutrition Programs on Nutrition and Health/FANRR-19-2 • 13
subsequent NLSY-YA data on those children as youngadults and their early experiences as parents. The mainNLSY questionnaire collects information on maternalcharacteristics, which can be linked, through the twosubsequent surveys, to child demographics and familybackground; prenatal and postnatal health andhealthcare services; parent-reported height and weight;infant feeding practices; disability-related services;pediatric health care; and educational experiences.Assessments conducted by trained interviewersprovide data on the nature and quality of the homeenvironment, cognitive development, and motor,social, and emotional development. Educationalexperiences have been further documented by a 1995survey of schools attended by NLSY children in 1993-94 or 1994-95; this survey gathered both school-levelcharacteristics and individual educational outcomes ofthe respondents, including attendance, grades, andtranscripts. As described above, further sources includethe self-administered questionnaires for older childrenand the NLSY-YA interviews. Both FSP and WICparticipation data are available for the NLSY79mothers, the NLSY-MC children, and the NLSY-YAcohort. The impact of WIC participation on infants’birthweights, health, and development in the NLSY-MC is the subject of a research project funded by ERSthrough a grant administered by the Institute forResearch on Poverty.18
The NLSY-MC cohort of mothers and their childrenhas grown from 4,971 respondents in 1986 to 7,103respondents in 1996. During this time, the youngestage group (birth to age 9) has declined from 4,676 to3,480, while the older group (10-14 years) grew from294 in 1986 to a peak of 2,084 in 1994, beforedropping to 1,951 in 1996 as children aged out of theNLSY-MC. The NLSY-YA cohort had 851respondents in 1994 and 1,672 respondents in 1996.
The sampling designs of the NLSY-MC and NLSY-YAhave both strengths and weaknesses. On the one hand,the longitudinal data on the mothers of the samplemembers offer a rich set of variables to explorerelationships between maternal histories and children’ssubsequent development. On the other hand, theNLSY-MC and NLSY-YA cohorts are not nationallyrepresentative, for several reasons. First, they representa truncated portion of the potential offspring of thewomen in the cohort represented by the NLSY,because data have not been collected on the earliest
and latest childbearing years (that is, the data are left-censored and right-censored). Second, the study doesnot represent young women who immigrated after1979 and their children. Last, attrition of the sampleaffects these studies as it does all panel studies: of the10,507 children born to the original cohort of womenin the NLSY79, data were collected on 7,103 offspringin 1996—a retention rate of 68 percent (CHRR, 1998).
National Survey of America’s Families (NSAF)
The NSAF is designed to assess the well-being ofchildren and adults, to identify changes over time, andto examine the relationships between indicators ofwell-being and changes in the structure and operationof the social safety net. The NSAF is part of theAssessing the New Federalism (ANF) project, amultiyear study of the devolution of social programsand associated policy changes, such as those resultingfrom recent welfare reforms. The NSAF is designedand directed by the Urban Institute, with assistancefrom Child Trends Inc. in developing measures ofchild well-being. Westat Inc. is conducting the survey.The ANF project is funded by a number of foundations.
NSAF collects data on seven domains of well-being:(1) economic security for children, adults, andhouseholds or families, including income,employment, receipt of cash and food assistance, andfood sufficiency; (2) health and healthcare for childrenand adults, with additional data for children on (3)education and cognitive development, (4) socialdevelopment and positive activities, and (5) behaviorproblems; (6) family environment measures forchildren, adults, and family units, including familystructure, psychological well-being of adults, familystress, immigration status, and childbearing practices;and finally, (7) adults’ on their knowledge of availablecommunity services.
The NSAF sample has two parts. The primary samplewas designed to provide State-level estimates for the13 States that comprise over half of the U.S.population: Alabama, California, Colorado, Florida,Massachusetts, Michigan, Minnesota, Mississippi,New Jersey, New York, Texas, Washington, andWisconsin. In each State, the NSAF sampled 1,000households with children and 1,000 nonelderly adultswho do not live with children as parents or guardians.An additional sample was drawn from the balance ofthe Nation to make the overall sample nationallyrepresentative. Low-income households were18 See L. Kowaleski-Jones and G. Duncan (2000).

14 • Effects of Food Assistance and Nutrition Programs on Nutrition and Health/FANRR-19-2 Economic Research Service, USDA
oversampled, so 53 percent of households with childrenin the sample had incomes below 200 percent of thepoverty level. Elderly adults and homeless orinstitutionalized persons were excluded.
All interviews were conducted by telephone fromFebruary to November 1997. The completed sampleincluded 42,973 households with telephones and 1,488households without telephones, who were contacted byfield staff and interviewed using cellular phones. Twosample frames were used: an RDD frame forhouseholds with telephones and an area probabilitysample for others. The total sample included 75,437adults and 34,439 children. A second cross-sectionalsurvey of 50,277 households was conducted in 1999.The 1999 sample partially overlapped the 1997 sampleand was designed to provide more precise nationalestimates.19
There are some weaknesses in the use of the NSAF tostudy FANP outcomes. Raw response rates for thecombination of the screener (used to identify eligiblehouseholds) and the full interview were 65 percent forchildren and 61 percent for adults (Brick, 1999).(Responses for children were provided by the mostknowledgeable adult.) After weights were applied fordifferent portions of the sample and other technicaladjustments were made, the overall response rate was70 percent. The adjusted response rate for the 1999NSAF was 64 percent. One indicator of potentialnonresponse bias is the coverage rate, which in 1997was 93 percent for children, comparable to that of theCPS, but the coverage rate for adults was only 86percent (versus 91 percent for the CPS).20 Thecoverage rate for children fell to 90 percent in the1999 survey, while the rate for adults rose to 87percent. Several studies of nonresponse in the 1997NSAF have found little or no evidence of bias, butanalysis of this potential problem is ongoing (Safir et al., 2001).
Summary results from the 1997 NSAF were releasedin January 1999; 1999 NSAF results were released inOctober 2000. Available public-use files from the 1997NSAF include child data, adult data, and family data;all of these files include weights to adjust for
differential sampling rates, nonresponse, andundercount (relative to Census data). Some analyses,such as relating food sufficiency to FSP participation,may require linking different datasets using individual,family, and household identifiers. From the 1999NSAF, a public-use file of selected child and familydata is available. The discussion of data availability inthis report is based on the 1997 data.
Panel Study of Income Dynamics and ChildDevelopment Supplement (PSID-CDS)
The PSID is a longitudinal study of income,employment, family composition, and residentiallocation in a representative sample of U.S. civilianhouseholds. The PSID was begun in 1968 by theOffice of Economic Opportunity to study poverty andgovernment-sponsored antipoverty programs. It is runby the Survey Research Center of the Institute forSocial Research (ISR) at the University of Michigan,with funding from the National Science Foundationand other Federal agencies.
The core questions, which have been consistent overthe life of the PSID, focus on income sources andamounts, employment, family composition andchanges, and demographic characteristics and events.The income questions include information on FSPparticipation, spell incidence, duration, and benefitlevels. Other core topics include food and housingexpenditures, food sufficiency, health status, andfertility histories. Supplements have gathered data onhealth experiences and expenditures, education,childcare, neighborhood characteristics, and wealth.
The PSID began with a sample of 5,000 households in1968, and data have been collected annually sincethen. The study had grown to 8,700 households in1995 as a result of births, other additions to samplehouseholds, formation of new households by panelmembers, and the addition of a national sample of2,000 Latino households in 1990. There has beensubstantial turnover, but the panel still includesmembers that have been interviewed since 1968.
In 1997, a Child Development Supplement (CDS) wasadded to the PSID. Funded by the Departments ofHealth and Human Services, Agriculture, andEducation, this supplement focuses on the developmentand well-being of children. The panel for this studycomprises 2,500 families from the PSID sample who
19 In the 1999 survey, about 60 percent of the telephone numbersand 93 percent of the area segments for interviews with non-telephone households were taken from the 1997 sample.
20 The coverage rate is the estimate of the total population fromweighted survey data divided by a control total presumed to bemore complete.

Economic Research Service, USDA Effects of Food Assistance and Nutrition Programs on Nutrition and Health/FANRR-19-2 • 15
have at least one child age 12 or younger.21 The PSID-CDS includes age-specific measures of the cognitive,behavioral, and health status of 3,500 children,collected through direct assessment of the children (age3 and up) and interviews with mothers and othercaregivers, teachers, and school administrators.
Like the main PSID, the CDS is designed as an annualsurvey with several components. The CDS primarycaregiver interview gathers data on participation inWIC, FSP, NSLP, and SBP.22 This interview providesnumerous nutrition and health outcome variables forcaregiver and child, including the full food securitybattery, pregnancy and birth outcomes, breastfeedingchoices, child immunization, health status, andhealthcare utilization. The caregiver also providesinformation on the child’s health history, behavior,childcare history, and school attendance andperformance. Child assessments include height andweight (using a combination of parent report andinterviewer measurement), cognitive ability (reading,math, and memory), and social/emotionaldevelopment. Teacher interviews provide additionalprofessional assessments of the child’s academicability and behavior in preschool and elementaryschool. The 1997 data from child assessments andprimary caregiver interviews have been released, alongwith demographic data on the CDS children and theirfamilies.
There is mixed evidence concerning therepresentativeness of the main PSID sample fromwhich the CDS sample is drawn. The original 1968PSID sample was designed to be nationallyrepresentative, incorporating a stratified, multistagesample of the civilian noninstitutionalized populationof the United States and a national survey of urbanlow-income families. Following rules were developedto retain the representativeness of the sample asindividuals moved in and out of the originalhouseholds. The initial response rate in 1968 was 76
percent, and the 1969 reinterview response rate was 89percent. Although subsequent response rates werequite high, the cumulative effect of attrition was thatby 1988 only 56 percent of the persons in the originalhouseholds responded. ISR has developed weights toadjust for differential sampling and attrition in theoriginal sample, and for the addition of the Latinosample, with the intention of providing a basis fornationally representative estimates from the PSIDsample. The PSID User’s Guide cites several studiesthat favorably compare the PSID to the SIPP and theCPS in several lines of analysis; the study findingssuggest that attrition and other factors have notadversely affected the generalizability of the PSIDdata (Hill, 1992). Nevertheless, researchers shouldcarefully consider the potential effects on theiranalyses of the PSID’s sample design, following rules,and resulting sample composition.
Survey of Income and Program Participation (SIPP)
The SIPP is a series of longitudinal, nationallyrepresentative studies of the dynamics of employment,income, eligibility for and participation in assistanceprograms, and demographics in the civilian noninstitu-tionalized U.S. population. It is specifically designedfor use in program planning, policy analysis, and eval-uation. It also supports more-basic research on patternsof income, poverty, and household composition.
The first SIPP panel was created by the Bureau of theCensus in 1983 and continued with interviews every 4months until July 1986. Since then, new panels ofhouseholds have been inaugurated at varying times,with varying sample sizes and numbers of interviewwaves. To facilitate cross-sectional analyses, theBureau of the Census has released public-use filesfrom individual survey waves as the data becomeavailable. Upon completion of all interviews for agiven panel, the bureau has constructed longitudinalanalysis files in which all of the data are linked acrosstime and weighted to account for attrition,nonresponse, and differential sampling rates.
Each SIPP panel has a core questionnaire that isadministered in each wave (that is, every 4 months toeach household) and a series of topical modulesadministered one or more times during the panel. Thecore questionnaire varies somewhat from panel topanel, but it has generally included questions onhousehold composition and demographics,
21 Some children in CDS sample families will not be included inthe CDS, because they are not in the PSID sample. The PSID has acomplex set of rules for determining when new household membersare added to the sample. See Hill (1992).
22 PSID-CDS also identifies preschoolers and children inchildcare who receive free or reduced-price meals. The qualificationof free or reduced-price meals clearly identifies low-income FANPparticipants; however, it is not possible to tell whether meals areprovided by the NSLP (preschools or childcare associated withNSLP schools) or the Child and Adult Care Food Program (CACFP)(other childcare institutions). Moreover, because childrenparticipating in the CACFP through family childcare homes are notmeans tested, the question would fail to identify these children.

16 • Effects of Food Assistance and Nutrition Programs on Nutrition and Health/FANRR-19-2 Economic Research Service, USDA
employment and earnings, application for and receiptof cash and food assistance, and other income.Program participation information has been obtainedfor FSP, WIC, NSLP, and SBP, as well as for cashassistance programs. (This information has beensupplemented by a Welfare History module to gatherinformation on participation spells prior to the start ofthe panel.) The core questionnaire also has includedlimited information on health status and disabilityrelating to working, attending school, or performingother functions. More extensive information on illness,disability, and healthcare utilization has been obtainedin a Health and Disability module administered toseveral SIPP panels. A Child Well-Being moduleadministered to each panel has gathered informationon children’s school enrollment, last grade completed,and suspension/expulsion experiences (as well asinformation on time use, enrichment activities, andadult supports). The adequacy of household foodsupplies and incidence of hunger have been measuredby two related modules, the Extended Measures ofWell-Being module and the Basic Needs module.Other modules have asked detailed questions on assetsand shelter costs, facilitating identification of fullyeligible FSP nonparticipants (rather than simply usingan income cutoff). Further modules of potentialinterest cover migration history, fertility history, andchildcare.
The SIPP uses a combination of personal andtelephone interviews. Each household member 15 orolder is asked to respond individually, but proxyresponses may be used if a person is unavailable.
The most recent completed SIPP panels were begun in1991, 1992, 1993 and, after significant redesigning,1996. The 1991 panel consisted of approximately14,000 households that were interviewed eight times(covering 32 months), starting in February 1991. The1992 panel consisted of 20,000 households interviewed10 times (covering 40 months), starting in February1992.23 These panels, which together containedinformation on a total of 2,715 infant and child WICparticipants, were used in a recently completed analysisof the dynamics of WIC participation among children(Burstein, Fox, et al., 2000). Since then, additionaldata have become available, including the longitudinalanalysis file for the 9-wave 1993 panel, and Waves 1-12 of the 1996 panel. The 1993 panel consisted of
20,000 households. The 1996 panel (completed in2000)) comprised some 37,000 households, withoversampling of economically disadvantaged groups(Blacks, Hispanic Whites, and female-headedhouseholds). Approximately 35,000 households fromthe 1992 and 1993 SIPP panels were interviewed inthe 1997 “bridge survey” for the new Survey ofProgram Dynamics (SPD). As discussed below, theSPD is expected to run until 2002, providing up to 10years’ data on these panels.
As with the other panel surveys, the usefulness of theSIPP hinges in part on its sample design and patternsof attrition. The SIPP uses a multistage stratifiedrandom sampling design, with counties or groups ofcounties as PSUs. The 1996 SIPP uses PSUs based on1990 Census data, with steps taken to minimizebetween-PSU variance on stratification variables andto maximize overlap with the PSUs derived from the1980 Census for earlier SIPP panels (Siegel and Mack,1995). Past SIPP panels generally have not oversampledlow-income households, but the 1996 panel does, using1990 Census data to stratify households within sampledPSUs. Initial response rates for the SIPP panels arearound 80 percent, and final response rates havehistorically been on the order of 67 to 74 percent. TheCensus Bureau has developed weights to compensatefor differential sampling, Census undercounts, andnonresponse. As noted earlier, some literature suggeststhat the SIPP compares favorably to other sources(particularly the pre-1994 CPS) on the accuracy ofdata on food stamp participation and other measures ofinterest to FANP studies, while other literature pointsto reasons for caution in using the SIPP rather thansources such as the PSID and CPS. The 1996 panel isstill relatively new, so there is much yet to learn aboutthe results of the changes in the SIPP’s design.
Survey of Program Dynamics (SPD)
The SPD is a Congressionally mandated longitudinalstudy of a nationally representative sample of theU.S.population.24 The SPD will collect annual data for10 years on the demographic, social, and economiccharacteristics of this sample, focusing on thedynamics of employment, earnings, participation inwelfare programs, and adult and child well-being. Amajor objective of the SPD was to aid study of theresults of welfare reforms and their effects on Americans.
23 One of the four rotation groups was interviewed only nine times.
24 The SPD was mandated and funded by Section 414 of P.L.104-193.

Economic Research Service, USDA Effects of Food Assistance and Nutrition Programs on Nutrition and Health/FANRR-19-2 • 17
The SPD is an extension of the 1992 and 1993 SIPPpanels. The data collected on these panels provide abaseline of 3 years prior to the enactment ofPRWORA in 1996. The SPD follows the householdsin these panels from 1996 through 2001.
As implied by the study’s name, a major focus of theSPD is on the dynamics of participation in means-tested assistance programs, including cash assistance,food and nutrition assistance, housing assistance, andgovernment-funded health insurance. There aredetailed data on two other major domains, income andemployment. For children, the SPD captures data onschool status and problems, childcare, healthcare,child support, residence history, time use, andactivities that promote cognitive, emotional, andsocial development.
Data collection for the SPD began in 1997 with a“bridge survey” that recontacted the sample personsfrom the 1992 and 1993 SIPP panels, who had last beeninterviewed in 1995. The first round of interviews withthe SPD instruments was in 1998. Collection of datafrom the SPD panel, including a core questionnaireand topical modules, was planned to continue on anannual basis through 2001. Each year’s survey providesretrospective data on the previous 12 months. Unlikethe SIPP, the main questionnaire for the SPD collecteddata on all members of the household through an in-person interview with a single knowledgeable householdmember aged 15 and older. The 1998 SPD also includeda self-administered audiocassette questionnaire forpersons age 12 to 17. Available public-use data from theSPD include the 1997 survey file and a longitudinalfile of 1992 through 1998 data.
Because the SPD began with the 1992 and 1993 SIPPpanels, the sample was originally representative of theU.S. population but is subject to attrition, both duringand after the SIPP data collection from these panels.The 1997 bridge survey had a sample of about 38,000households, of which 30,125 were interviewed (79percent). The 1998 sample of 18,500 households was asubsample of the 1997 respondents, including all house-holds with children in the panel and an oversamplingof households below or near the poverty level. Datawere collected on every member of the samplehousehold, including those who had joined or returnedto the household since the last wave of data collection.
A major limitation of the SPD is the cumulative effectof nonresponse and shrinking samples over the 10-yearseries of surveys from which it draws. The cumulativeresponse rate for the SPD from sample selection (in1992-93) to the 13th interview in 1999 was 50 percent(Weinberg and Shipp, 2000). The SPD was alsoconstrained by budget limitations, which reduced thesize of the sample for the 1998 survey to 67 percent ofthe eligible 1997 sample. Subsequent samples wereessentially the same in size. About 1,900nonrespondents to the 1997 bridge survey wereinterviewed in 2000 (Census, 2001).
Information on FANP Participation
The scope of the participation data on a given programis a critical factor in determining the kinds of analysesthat can be performed. Therefore, we reviewed theavailability of program participation data from eachprincipal source in terms of three important dimensions:the reference period for which participation is deter-mined, whether and how the duration of participationis determined, and whether and how the size of thebenefit “dose” is measured (for example, FSP benefitlevel or the frequency of subsidized meals). Inaddition, we identified which participation data coverentire households or families and which refer tospecific individuals.
It is important to note that, in addition to thecharacteristics described below, the longitudinal datasources (ECLS-K, NLSY79, NLSY-MC, NLSY-YA,PSID-CDS, SIPP, and SPD) permit the construction oflonger-term histories of FANP participation bymerging data collected in different waves.
FSP Participation
Table 3 summarizes the data on FSP participationavailable in each of the principal sources, all of whichprovide this information at the household level.Several sources (CSFII, NLSY-MC, NSAF, PSID-CDS, SIPP, and SPD) also have participation data forone or more individuals in the sampled households.Most of the sources use a 12-month reference periodfor FSP participation, either alone or in combinationwith other periods. The exceptions are the CPS-FSS,NFSPS, NLSY-YA, and SIPP.

18•
Effects of Food A
ssistance and Nutrition P
rograms on
Nutrition and H
ealth/FAN
RR
-19-2E
conomic R
esearch Service,U
SD
A
Table 3—Information available on food stamp program participationReference period1 Duration1 Benefit level1
Months in Current/ Total forLast 12 reference most recent reference
Data source Current month months2 Other period3 Other monthly period Other
Consumer Expenditure Surveys (CES) Interview and Diary Surveys �4 �4 Past 4 months5 � �4 �5
Continuing Survey of food intakes by Individuals (CSFII) �6 �6 Date last received6 �
Current Population Survey-Food Security Supplement (CPS-FSS) � �
Early Childhood Longitudinal Study, Since birth ofKindergarten Cohort (ECLS-K) � sample child �7
National Food Stamp Program Date last receivedSurvey (NFSPS) �6 �6 Lifetime length of last spell �
National Health and Nutrition Examination Survey (NHANES) III � �
National Longitudinal Survey of Youth 1979 (NLSY79) � � Specified months �
National Longitudinal Survey of Youth-Mothers and Children (NLSY-MC) �8 �8 �8
National Longitudinal Survey of Current calendar Dates and length of MonthlyYouth-Young Adults (NLSY-YA) year, lifetime � up to 5 spells for � average for
current recipients each year
National Survey of America’s Lifetime,Families (NSAF) � �9 previous year � �10 �10
Panel Study of Income Dynamics-Child Development Supplement (PSID-CDS) � � Prenatal11 � � �
Survey of Income and Program Start and length of MonthlyParticipation (SIPP) Past 4 months6 �6 1st spell, number � � detail
of spells forprimary recipient
Survey of Program Dynamics (SPD) �6 � �12
1All data are household level except as noted.2Includes sources using last 12 months or last calendar year.3Depending on reference period, may include one or more spells of participation (ongoing or completed).4Diary Survey component of CES.5Interview Survey component of CES.6Individual level data for every household member.7Number of months in last 12 months.8Data from main NLSY79 questionnaire for mother.9NSAF participation data identify whether adults, children, or both received benefits in previous year.10NSAF asks for annual total or monthly average benefits for last calendar year.11In Child Development Supplement, for mother of focus child.12SPD asks for annual total benefits for household using monthly average, estimated total, or varying benefit amounts.

Economic Research Service, USDA Effects of Food Assistance and Nutrition Programs on Nutrition and Health/FANRR-19-2 • 19
Most of the principal sources identify the specificnumber of months of FSP participation in the referenceperiod, but CSFII, CPS-FSS, and NHANES-III lackthis information. All of the sources except ECLS-K andNHANES-III have data on FSP benefit levels, mostoften the current or most recent monthly benefit.
WIC Participation
Table 4 provides detailed information on the WICparticipation data available from all but one of theprincipal sources. (The CES has only FSPparticipation data.) In general, WIC participation dataare less detailed than FSP participation data. OnlyCSFII, SIPP, and SPD have duration of WICparticipation for every household member. NHANES-III has relatively rich data on sample members,including individual-level participation for threereference periods (current, last month, and last year)and duration for the current or most recentlycompleted spell. The NFSPS asked the number ofhousehold members who received WIC foods duringthe past 30 days.
The information available in other data sources issomewhat more limited. The CPS-FSS has onlyhousehold-level WIC participation data, although itdoes identify the number of WIC participants in thehousehold. The three NLSY sources offer only themost basic information: whether anyone in thehousehold received WIC benefits during the last 12months. Given that eligibility for WIC participation isrestricted to a very narrow group of individuals,however, it should be possible to make reasonabledeductions about which member(s) participated in theprogram.
Three sources provide a clear basis for identifyinginfants and children whose mothers received WICbenefits during pregnancy: ECLS-K, PSID-CDS andSIPP. This relationship can be deduced for many casesin the NLSY-79 and NLSY-MC, and possibly in theSPD. In fact, as noted previously, an ERS-funded grantis currently examining the relationship between WICparticipation and birth outcomes using data from theNLSY-MC.25 The PSID-CDS also has current WICparticipation for the focus children under 3 years of age.
NSLP Participation
Table 5 indicates the specific information available onNSLP participation for the nine principal sources thatprovide any information. Questions are asked to elicitfive different measures of program exposure, asdiscussed below.
The first question is whether the child attends a schoolthat participates in the NSLP. CSFII, ECLS-K, andNHANES-III offer data on whether the NSLP isavailable at the child’s school (which, to be sure, isalmost always true for public schools).26 In the CSFII,this question, and all questions related to NSLPparticipation, are asked for every child in thehousehold between the ages of 5 and 18 years. Thus,one could easily construct measures that would reflecthousehold-level participation in the NSLP.
The second question is how often the child takes theNSLP meal. All of the listed sources have someinformation on this question except the NSAF. CSFII,ECLS-K, and NHANES-III quantify the frequency ofschool lunch consumption for individual children (allchildren in the CSFII and sample members who arechildren in ECLS-K and NHANES-III). SIPP providesquantitative frequency data at the household level andidentifies (in the 1996 panel) individual children who“usually” take school lunches. SPD identifies eachchild in the household who “usually” eats the lunchoffered at school. PSID-CDS has only a qualitativemeasure of whether the focal child usually takes theschool lunch.27
The third question is whether the child receives free orreduced-price lunches. NHANES-III has no data onthis. All of the other principal sources with NSLP datahave at least an indicator of free or reduced-pricestatus, but only CSFII and PSID-CDS identifyindividuals according to free vs. reduced-price status(all household members for the CSFII and samplemembers for the PSID-CDS). SIPP differentiates freevs. reduced-price participation at the household level(for all children in the house as a group). SPDidentifies whether each child in the household got freeor reduced-price lunches or breakfasts, thus allowing
26 Questions are framed in terms of the availability of “completemeals offered for the same fixed price every day,” which provides areasonable proxy for the NSLP.
27 The PSID-CDS asks: “Does (the child) usually eat a completehot lunch offered at (daycare/nursery school/ preschool/school)?”
25 Greg Duncan and Lori Kowaleski-Jones, “Effects ofParticipation in Food Assistance Programs: Evidence from NLSYChildren,” research in progress at Northwestern University.

20 • Effects of Food Assistance and Nutrition Programs on Nutrition and Health/FANRR-19-2 Economic Research Service, USDA
Table 4—Information available on WIC participationReference period Duration
Months inLast 12 reference
Data source Current month months1 Other period2 Other
Continuing Survey of Food Intakes by Individuals (CSFII) �3 �3
Current Population Survey-Food Security Supplement (CPS-FSS) �4
Early Childhood Longitudinal Study,Kindergarten Cohort (ECLS-K) Prenatal, infancy5
National Food Stamp Program Survey (NFSPS) �4
National Health and Nutrition CompletedExamination Survey (NHANES) III �5 �5 �5 �5 spell6
National Longitudinal Survey of Youth 1979 (NLSY79) �4
National Longitudinal Survey of Youth-Mothers and Children (NLSY-MC) �4
National Longitudinal Survey of Youth-Young Adults (NLSY-YA) �4
National Survey of America’s Families (NSAF) �7
Panel Study of Income Dynamics-Child Development Supplement (PSID-CDS) �8 Prenatal9
Survey of Income and Program MonthlyParticipation (SIPP)5 Past 4 month3 �3 detail3
Survey of Program Dynamics (SPD) �3 �3
1Includes sources using last 12 months or last calendar year.2Depending on reference period, may include one or more spells of participation (ongoing or completed).3Individual-level data for each household member. 4Information available for the number of WIC food packages received by the household.5Information available for individual sample member.6Length of completed spell ending in reference period, regardless of start date.7Household-level data.8In Child Development Supplement, for focus child under 3 years old.9In Child Development Supplement, for mother of focus child.

Economic Research Service, USDA Effects of Food Assistance and Nutrition Programs on Nutrition and Health/FANRR-19-2 • 21
Table 5—Information available on NSLP participationFrequency
Attends takes Receives free DietaryNSLP NSLP or reduced- recall
Data source school1 meals price meals data Other
Continuing Survey of food intakes by Individuals (CSFII) �2 �2 �3 �4
Current Population Survey-Food Security Supplement (CPS-FSS) �5
Early Childhood Longitudinal Study,Kindergarten Cohort (ECLS-K) �6 �6 �6
National Food Stamp Program Survey (NFSPS) �7 �7
National Health and Nutrition Examination Survey (NHANES) III �8 �8 �9
National Survey of America’s Families (NSAF) �10
Panel Study of Income Dynamics-Child Development Supplement (PSID-CDS) �11 �3
Survey of Income and Program Participation (SIPP) �12 �5 �13
Survey of Program Dynamics (SPD) �14 �15
1Question asks whether child attends school where a complete meal is offered every day for the same fixed price, a reasonable proxy for the existence of anNSLP lunch program (as opposed to a strictly a la carte program).
2CSFII has data for each household member between 5 and 18 years of age.3CSFII and PSID-CDS differentiate free participants from reduced-price participants.4CSFII data allow differentiation of foods obtained and eaten at school from foods eaten at school but obtained elsewhere.5Data collected at household level. CPS-FSS does not differentiate between free and reduced-price meals; the SIPP asks about each separately.6ECLS-K data are for sample child.7In the household food use component of NFSPS, the number of school lunches eaten was collected for the last 7 days. In the NFSPS main survey, each
household member reported if free or reduced-price lunches were consumed for the last 30 days. No distinction was made between free and reduced-pricelunches.
8NHANES-III collected data for sampled children/youth (ages 2 months to 16 years).9NHANES-III data include codes for place eaten rather than source of food. Therefore, foods coded as “eaten at school” include foods obtained elsewhere;
i.e., non-NSLP foods.10NSAF data indicate any receipt of free or reduced-price lunches by children in the last year (household-level data).11PSID-CDS asks whether focal child “usually” takes a complete lunch offered at school.12The 1993 SIPP collected information on the number of lunches consumed per week within the household. The 1996 panel questionnaire obtained
information on which children consumed lunches.13The SIPP also collects information on average price paid.14The SPD asks which children usually eat lunch offered at school.15For each child, the SPD asks whether the child received a free or reduced-price lunch or breakfast because he/she was qualified for the NSLP. This
information can be used to infer whether NSLP participation was via free or reduced-price meals.

22 • Effects of Food Assistance and Nutrition Programs on Nutrition and Health/FANRR-19-2 Economic Research Service, USDA
differentiation between free/reduced-price NSLPparticipants and those who are eligible for free/reducedprice meals but choose to take full-price meals instead.NFSPS asked for each household member receivingfree or reduced-price lunches or breakfasts for the last30 days. In the household food-use component ofNFSPS, each FSP household stated the number oftimes household members received free lunches andbreakfasts over the past 7 days. CPS-FSS hashousehold but not individual data and does notdifferentiate between free and reduced-priceparticipation. (This could be imputed based onhousehold income and size).
The fourth question is the nutrient content of theNSLP meals consumed by participating children andthe contribution of those meals to children’s total diets.CSFII and NHANES-III are the only sourcesproviding this information. Both sources providedietary recall data. CSFII data include information onwhether the foods consumed at lunch were prepared athome or school, whereas NHANES-III onlydifferentiates lunches eaten at school from those eatenat home. Thus, the CSFII provides a superior measureof the nutrient content of meals consumed by NSLPparticipants.28
The SIPP asks for a fifth data item on NSLPparticipants: the average price paid. This item might beuseful in explaining variation in participation amongchildren not eligible for free or reduced-price meals.
SBP Participation
As shown in table 6, eight of the nine sources withNLSP participation data also identify SBPparticipants; the SPD does not. Six of the sourcesprovide the same participation data for the SBP as forthe NSLP. The SIPP provides all of the same items forSBP as for NSLP except the average price paid permeal. The ECLS-K does not directly ask whether SBPparticipants receive free or reduced-price meals, butthis can be inferred from the response on free/reducedprice status for the NSLP.
Participation in Other FANPs
In addition to the four most commonly identifiedUSDA programs, participation in one other FANP canbe approximated in a few of the principal sources. TheCPS-FSS, NHANES-III, and PSID all includequestions about elders’ receipt of meals fromcongregate feeding sites or Meals on Wheels.NHANES-III differentiates between the two sources ofmeals. In addition, as noted in preceding discussions,the CPS-FSS and PSID-CDS provide informationabout children in childcare facilities who receive freeor reduced-price meals, but this does not allowdifferentiation of meals provided through the NSLP orCACFP. Moreover, because children participating inthe CACFP through family childcare homes are notmeans tested, survey questions are unlikely to pick upthese children. The NFSPS asked if householdmembers had received, during the past 30 days, free orreduced-cost meals for the elderly or at a daycare orHead Start program.
None of the other FANPs is represented in theprincipal data sources. For some programs this is notan unexpected finding, given that participation isdefined at the institutional rather than individual level.Survey respondents are unlikely to know, for example,whether the food pantry from which they receivedemergency food supplies participates in TheEmergency Food Assistance Program (TEFAP).Likewise, neither parent nor child respondents arelikely to know whether school-based nutritioneducation activities receive funding from the NutritionEducation and Training (NET) Program. For otherFANPs, however, participants could potentially beidentified in data collected via the principal sources ifappropriately worded questions were added to surveyinstruments. These include participants in the SummerFood Service Program, Commodity SupplementalFood Program, Special Milk Program, FoodDistribution Program on Indian Reservations, and WICFarmer’s Market Nutrition Program.
Data on Nutrition- and Health-Related Measures
The principal data sources include a wide variety ofnutrition- and health-related measures. For thediscussion that follows, these measures have beendivided into seven groups:28 In NHANES-III, the frequency of taking the NSLP meal could
be used to identify which children’s lunches are likely to be NSLPmeals; however, this approach might require the exclusion of datafor infrequent NSLP participants and thereby produce biased results.

Economic Research Service, USDA Effects of Food Assistance and Nutrition Programs on Nutrition and Health/FANRR-19-2 • 23
Table 6—Information available on SBP participationFrequency
Attends takes Receives free DietarySBP SBP or reduced- recall
Data source school1 meals price meals data
Continuing Survey of food intakes by Individuals (CSFII) �2 �2 �3 �4
Current Population Survey-Food Security Supplement (CPS-FSS) �5
Early Childhood Longitudinal Study,Kindergarten Cohort (ECLS-K) �6 �6 �6
National Food Stamp Program Survey (NFSPS) �7 �7
National Health and Nutrition Examination Survey (NHANES) III �8 �8 �9
National Survey of America’s Families (NSAF) �10
Panel Study of Income Dynamics-Child Development Supplement (PSID-CDS) �11
Survey of Income and Program Participation (SIPP) �12 �5
1Question asks whether child attends school where a complete meal is offered every day for the same fixed price, a reasonable proxy for the existence of anSBP breakfast program (as opposed to a strictly a la carte program).
2CSFII has data for each household member between 5 and 18 years of age.3CSFII and PSID-CDS differentiate free participants from reduced-price participants.4CSFII data allow differentiation of foods obtained and eaten at school from foods eaten at school but obtained elsewhere.5Data collected at household level. The CPS-FSS and NFSPS do not differentiate between free and reduced-price meals; the SIPP asks about
each separately.6ECLS-K data are for the sample child. Receipt of free/reduced price breakfast can be inferred from free/reduced price lunch and SBP participation. The
ECLS-K also has information on number of meals or snacks in day care or other child care.7In the household food use component of NFSPS, the number of school breakfasts eaten was collected for the last 7 days. In the NFSPS main survey, each
household member reported if free or reduced-price breakfasts were consumed for the last 30 days. No distinction was made between free and reduced-pricebreakfasts.
8NHANES-III collected data for sampled children/youth (ages 2 months to 16 years). 9NHANES-III data includes codes for place eaten rather than source of food. Therefore, foods coded as “eaten at school” include foods obtained elsewhere;
i.e., non-SBP foods.10NSAF data indicate any receipt of free or reduced-price breakfasts by children in the last year (household-level data).11PSID-CDS asks whether focal child “usually” takes a complete breakfast offered at school.12The 1993 SIPP collected information on the number of school breakfasts consumed per week within the household. The 1996 panel questionnaire obtained
information on which children consumed school breakfasts.

24 • Effects of Food Assistance and Nutrition Programs on Nutrition and Health/FANRR-19-2 Economic Research Service, USDA
• food expenditures and intake;
• sufficiency of the individual’s or household’s food supply;
• physical and biochemical measures related to nutritional status;
• birth outcomes;
• breastfeeding, immunization, and other health-related behaviors;
• health status and other health-related variables; and
• measures related to physical, cognitive,and emotional status or performance.
The text and tables that follow provide specificinformation about the data available in each of thesecategories. Each table repeats the information onprogram participation data, so that readers can easilysee the overlap between available programparticipation information and available nutrition- andhealth-related measures.
Food Expenditures and Intake
Table 7 shows the availability of data from theprincipal sources on the following types of outcomes:
• food expenditures (how much is spent on food or what foods are purchased)
• food intake (meals, food groups, or specific foods consumed)
• nutrient intake (daily consumption of energy and nutrients)
CES provides the most detailed data on foodexpenditures, including information on the specificfoods purchased by sampled households. Data areobtained through a diary in which respondents recordpurchases of food, household supplies, and other itemsfor two 1-week periods over the course of a year.NFSPS provides detailed data on the quantity andexpense of specific food purchased and used in a 1-week period, but only for the FSP households. Incontrast, all of the other data sources obtain much-more-general information. NLSY-MC, NLSY79,PSID-CDS, and SPD obtain measures of total foodexpenditures over the preceding 12 months, using abrief set of survey questions. CSFII and NFSPS use asimilar set of questions to obtain data on at-home andaway-from-home food expenditure for the previous 3months, while CPS-FSS obtain the data for the
previous week. None of the sources, except NFSPS,directly measures the proportion of purchased foodthat is actually used or nutrient equivalents of thehousehold food supply (nutrient availability at thehousehold level). Neither ECLS-K, NSAF, nor SIPPprovides any information on food consumption.
In terms of information on food and nutrient intake, acontrast exists between the two sources that arenational surveys included in the NNMRRP —NHANES-III and CSFII — and the other data sourcesthat provide these types of data. Both NHANES-IIIand CSFII obtain detailed information on the foodsconsumed by survey respondents through guidedrecalls covering a 24-hour period (one such period forNHANES-III and two nonconsecutive periods forCSFII). These recalls are then used to estimate intakesof food energy and a broad array of nutrients. CSFIIalso provides food intakes for 71 food groups and 30pyramid food groups. Both CSFII and NHANES-IIIinclude a nonquantified food frequency. NHANES-IIIhas an infant feeding history. The NFSPS collecteddata on household food use, and a nutrient database isused to derive the household nutrient availability fromthe food use data.
The other sources offer much-more-limited data onselected eating habits or practices. NLSY79 andNLSY-YA, for example, have a series of questionsabout dietary practices during pregnancy and infantfeeding practices. PSID-CDS has only one food intakeitem: how often the focal child eats breakfast.
Food Sufficiency
As table 8 illustrates, 9 of the 13 principal sourcesprovide some type of self-reported information on thesufficiency of food available to respondent householdsor individuals. The most authoritative sources ofinformation on this topic are CPS-FSS, ECLS-K,NFSPS, PSID-CDS, and SPD. As noted in thepreceding descriptions of each data source, thesesources include the full 18-item food security scaledeveloped for FNS (Hamilton et al., 1997).
CSFII, NHANES-III, NSAF, and SIPP have morelimited questions about whether the household hassufficient food and, if not, the reasons why. (The mainPSID has similar questions.) In addition, NHANES-III, NSAF, and SIPP have a few questions on hunger,framed in terms of skipping meals or losing weightbecause of not enough money or other resources to get

Economic Research Service, USDA Effects of Food Assistance and Nutrition Programs on Nutrition and Health/FANRR-19-2 • 25
Table 7—Available information on food expenditures and intakeFANPs identified
Food Food NutrientData source WIC FSP NSLP SBP expenditures intake intake
Consumer Expenditure Surveys Detailed(CES) Interview and Diary Surveys � expenditures diary
(2 weeks/year)
Continuing Survey of food intakes by Food expenditures: 2 nonconsecutive 24-hour recallsIndividuals (CSFII) � � � � household and Food intakes in 71 Use of vitamin &
away from home food groups & 30 mineral supplementspyramid food groups (type/frequency)
Current Population Survey-Food Food expenditures:Security Supplement (CPS-FSS) � � � � household and
away from home
National Food Stamp Program Food expenditures: Household food use and nutrientSurvey (NFSPS) � � � � household and availability for 7 days
away from home
National Health and Nutrition 24-hour recallExamination Survey (NHANES) III � � � � Nonquantified food Use of vitamins and
frequency (12+ years) mineral supplementsInfant feeding (type/frequency)
history (<12 mos)
National Longitudinal Survey of Youth Food expenditures: Vitamin/mineral1979 (NLSY79) � � household and supplementation,
away from home calorie reduction,salt reduction, during
pregnancy; infantfeeding practices1
National Longitudinal Survey of Food expenditures: Infant feedingYouth-Mothers and Children household and practices1
(NLSY-MC) � � away from home
National Longitudinal Survey of Vitamin/mineralYouth-Young Adults (NLSY-YA) � � supplementation
calorie reduction,salt reduction during
pregnancy; infantfeeding practices
Panel Study of Income Dynamics-Child Food expenditures: Child usuallyDevelopment Supplement (PSID-CDS) � � � � household and eats breakfast
away from home
Survey of Program Dynamics (SPD) � � � � Food expenditures:household and
away from home1Infant feeding not available in NLSY79 1994-1996. NLSY79 main questionnaire is the source for food expenditure and intake data for the
NLSY-MC sample.

26 • Effects of Food Assistance and Nutrition Programs on Nutrition and Health/FANRR-19-2 Economic Research Service, USDA
Table 8—Information available on food sufficiency and hungerFANPs identified Food sufficiency outcomes
Full food Limited food Limitedsecurity sufficiency questions
Data source WIC FSP NSLP SBP model1 questions2 on hunger3
Continuing Survey of food intakes by Individuals (CSFII) � � � � �
Current Population Survey-Food Security Supplement (CPS-FSS) � � � � �
Early Childhood Longitudinal Study,Kindergarten Cohort (ECLS-K) � � � � �
National Food Stamp Program Survey (NFSPS) � � � � �
National Health and Nutrition Examination Survey (NHANES) III � � � � � �
National Survey of America’s Families (NSAF) � � � � � �
Panel Study of Income Dynamics-Child Development Supplement (PSID-CDS) � � � � � �
Survey of Income and Program Participation (SIPP) � � � � � �
Survey of Program Dynamics (SPD) � � � � �
1Reference period is past 12 months; household level. In addition, NFSPS included a reference period of past 30 days.2Questions about adequacy of available food, resources to purchase food, use of food pantries, etc. Household level for all, plus individual level for sample
members in NHANES-III.3Questions about meal skipping, diminished size of meals, experiencing hunger, etc. Both household and individual levels in NHANES.
Economic Research Service, USDA Effects of Food Assistance and Nutrition Programs on Nutrition and Health/FANRR-19-2 • 27
food. NHANES-III has both individual and householddata on food sufficiency; all other sources with thisinformation, including CPS-FSS and PSID-CDS,provide only household-level data.
Physical and Biochemical Measures
Of the 13 principal sources, 7 have data on the heightsand weights of individuals in the sample. As indicatedin table 9, self-reported heights and weights areobtained by NLSY-YA, CSFII, and NLSY79.29 PSID-CDS has heights measured by interviewers and self-reported weights for the focal children. ECLS-K,NLSY-MC and NHANES-III have heights and weightsmeasured by trained field staff. ECLS-K and NLSY-MC obtained child height and weight data as part ofmore general standardized assessments of childdevelopment. NHANES-III collected this informationas part of medical examinations in which skinfoldthickness and head circumference also were measured.NHANES-III is alone among the principal sources inproviding data on nutritional biochemistries, includingblood iron levels and serum and blood levels of otherselected nutrients.
Birth Outcomes
Except for CSFII, all of the sources that provide dataon height and weight also have information on birthoutcomes (table 9). The most common data includebirthweight and gestational age, as reported by thecurrent primary caregiver at the time of the interview.These data are available from ECLS-K, NHANES-III,PSID-CDS, NLSY79 (for the mothers in this cohort),NLSY-MC (for their children), and NLSY-YA (for theNLSY79 offspring who have become mothers). TheNLSY sources provide the potential for combiningdata across generations (such as examining therelationships between birthweight, subsequent growthof the child, pregnancy outcomes in young adulthood,and WIC participation). The NLSY sources and PSID-CDS permit longitudinal analyses to examine trendsover time in differences between WIC participants andnonparticipants on the outcome measures (for instance,the trend in the difference in birthweights betweeninfants born to women who were on WIC duringpregnancy and those born to nonparticipants). Thesesources could also be used to examine successivepregnancies and birth outcomes for WIC participantsand nonparticipants. The birth height and weight data
for the ECLS-K sample could be analyzed in thecontext of the caretakers’ reports of WIC participationduring pregnancy and infancy, but the recall period forall of these data is rather long (4 to 5 years).
Health Behaviors
Table 9 also shows the availability of data on twohealth-related behaviors that the WIC programspecifically seeks to influence—breastfeeding andchild immunizations. Except for the ECLS-K, all ofthe sources that provide information on birth outcomesalso include information on whether mothersattempted to breastfeed. CSFII and NFSPS alsoprovide this information.
NHANES-III and PSID-CDS are the only principalsources that include information on children’simmunizations; however, the data are quite limited.NHANES-III asks whether the child has received aDPT or tetanus shot and how long ago the last shotwas received. If the shot record is available, it is usedto verify this information. PSID-CDS has only oneself-reported item: “Is your child up to date on his/hershots?”
Other health-affecting behaviors, such as smoking,exercise, and selected dietary patterns, may be ofinterest to analysts as direct outcome measures or asimportant covariates for such outcomes as birthweightand gestational age. All of the principal sources exceptCES, CPS-FSS, and SIPP have questions on one ormore health-related behaviors (data shown in table 10).
Health Status and Other Health-Related Variables
All of the principal sources have self-reported data onrespondents’ general health, specific diseases, and/orsome measure of healthcare utilization. As indicated intable 9, five of the sources have all three of these typesof data: NLSY-YA, NHANES-III, NLSY-79, SIPP, andPSID-CDS. Most of the data on these outcomes arefocused on conditions that impede adults’ ability towork, attend school, or care for themselves or others.Some nutrition-related diseases are identified,however, such as diabetes and heart disease.NHANES-III also includes self-reported informationon the incidence of anemia, as does NLSY-MC andPSID-CDS. Other items of potential relevance toFANP research include parent-reported data on infantand early childhood healthcare that can be found in the29 For children, parents or caregivers serve as proxy providers of
self-reported items.

28•
Effects of Food A
ssistance and Nutrition P
rograms on
Nutrition and H
ealth/FAN
RR
-19-2E
conomic R
esearch Service,U
SD
A
Table 9—Information available on nutrition- and health-related outcomesPhysical/
biochemical Health-relatedFANPs identified measures1 behaviors2 Health status/care
HealthHeight & Birth Health Self-assessed care
Data source WIC FSP NSLP SBP weight outcomes Breastfeeding Immunizations conditions3 health status utilization
Consumer Expenditure Surveys (CES) Interview and Diary Surveys � �4
Continuing Survey of food intakes by Individuals (CSFII) � � � � �5 � � �
Current Population Survey-Food Security Supplement (CPS-FSS) � � � � �
Early Childhood Longitudinal Study,Kindergarten Cohort (ECLS-K) � � � � �6 � �
National Food Stamp Program Survey (NFSPS) � � � � � �7
National Health and Nutrition Examination Survey (NHANES) III � � � � �8 � � �9 � � �
National Longitudinal Survey of Youth 1979 (NLSY79) � � �10 � � � � �
National Longitudinal Survey of Youth-Mothers and Children (NLSY-MC) � � �8 � � � �
National Longitudinal Survey of Youth-Young Adults (NLSY-YA) � � �5 � � � � �
National Survey of America’s Families (NSAF) � � � � � �
Panel Study of Income Dynamics-Child Development Supplement (PSID-CDS) � � � � �11 � � �12 � � �
Survey of Income and Program Participation (SIPP) � � � � � �
Survey of Program Dynamics (SPD) � � � � � �
1NHANES-III also includes an extensive battery of physical measurements and nutritional biochemistries (see text).2Other health behaviors are shown in table 10. Self-reported unless otherwise noted.3Self-reported disease or health conditions. 4Out-of-pocket expenses for health care (Quarterly Interview).5Self-reported height and weight. 6Measured height and weight.7NFSPS asked if any household member is on a special diet, and if yes, which special diet.8Measured and self-reported height and weight.9Two questions: Ever received DPT or tetanus shot and how long since last DPT or tetanus. Verified with shot record if available.10Self-reported weight, height in 1981, 1982 and 1985.11Measured height and parent-reported weight for focus child in CDS. 12One question: “Is your child up to date on his shots?”

Econom
ic Research S
ervice,US
DA
Effects of Food A
ssistance and Nutrition P
rograms on
Nutrition and H
ealth/FAN
RR
-19-2•
29
Table 10—Information available on behavioral, developmental, and performance-related outcomesFANPs identified Physical/cognitive/emotional status or performance
Miscellaneous Physical Cognitive Emotional/social Schoolhealth-related development/ development/ development/ attendance/
Data source WIC FSP NSLP SBP behaviors1 performance performance health performance
Consumer Expenditure Surveys (CES) Interview and Diary Surveys �
Continuing Survey of food intakes by Individuals (CSFII) � � � � �
Current Population Survey-Food Security Supplement (CPS-FSS) � � � �
Early Childhood Longitudinal Study,Kindergarten Cohort (ECLS-K) � � � � � �2 �2 �2,4 �4
National Food Stamp Program Survey (NFSPS) � � � � �
National Health and Nutrition Examination Survey (NHANES) III � � � � � �2 �2
National Longitudinal Survey of Youth 1979 (NLSY79) � � � �3 �3
National Longitudinal Survey of Youth-Mothers and Children (NLSY-MC) � � � �3 �2 �3 �2
National Longitudinal Survey of Youth-Young Adults (NLSY-YA) � � � �3 �3
National Survey of America’s Families (NSAF) � � � � �3 �3
Panel Study of Income Dynamics-Child Development Supplement (PSID-CDS) � � � � � �3 �2 �3 �3
Survey of Income and Program Participation (SIPP) � � � � �3
Survey of Program Dynamics (SPD) � � � � � �3 �3
1Includes exercise, dieting, smoking, alcohol consumption, and drug abuse.2Measured and self-reported. Parent is proxy for child on self-reported data.3Self- or parent-reported. 4Teacher questionnaire and school records abstraction.

30 • Effects of Food Assistance and Nutrition Programs on Nutrition and Health/FANRR-19-2 Economic Research Service, USDA
NLSY-MC, NLSY-YA, NLSY79, PSID-CDS, andSIPP. Finally, NHANES-III includes medical anddental assessments for children and adults, plusradiographs and performance tests for persons age 60and older. Both CSFII and NFSPS include self-reported information on special diets.
Physical, Cognitive, and EmotionalStatus/Performance
As indicated in table 10, the principal sources providea variety of data on developmental or performancemeasures in the physical, cognitive, andemotional/social domains. In the physical domain,NLSY-MC and PSID-CDS provide data on physicaldevelopment of children (especially motor skills),based on parent reports elicited with standardizedscales. ECLS-K has a combination of parent-reportedand test-based data on motor skills. NHANES-III hasboth parent-reported data on physical development forchildren up to 4 years old and medical assessments forchildren 5 years and older. These sources also provideobjective data on children’s cognitive development orperformance, ranging from general professionalassessments to formal tests of memory, languageskills, mathematical skills, and other areas.30
Eight of the sources provide parent-reported data onchildren’s school attendance and performance.Depending on the source, this may include gradeattended, incidence of academic and disciplinaryproblems, or relative ranking in the child’s class.NLSY-MC also incorporates the results of a one-timeschool survey providing data from school records onattendance and grades, as well as descriptiveinformation on school characteristics.31 ECLS-Kincludes periodic teacher surveys, principal surveys,and abstraction of information from school records.Several sources also include data on the social oremotional development of children or on adults’mental health. These data are all parent-reported,except for teacher assessments and school recordsobtained for the ECLS-K.
Potential Data Sources
The data sources described in this section areconsidered “potential” because, although they includeuseful data, they have limitations that the previouslydescribed principal data sources do not. Somepotential sources are not useful at the present timebecause they either include no information on FANPparticipation or have a critical gap in this information(for example, a source that includes information onbirth outcomes but not on prenatal WIC participation).ERS has worked with other Federal agencies to fillcritical data needs for FANP research; these potentialdata sources represent further opportunities for ERS tofill information gaps through collaboration withsponsoring agencies and organizations.
Other potential sources focus on populations that arelimited to a specific lifecycle group (such aspreschoolers or the elderly) and/or specific States orlocalities. Although less useful than the nationallyrepresentative data sources described in previoussections, these sources can be used for case study orexploratory analysis.
Nutrition- and health-related measures available in thepotential data sources are often (but not always) oflower quality than comparable measures in principaldata sources. For example, a potential data sourcemight include parental reports about cognitiveperformance, while comparable data in principalsources are based on results of standardized testsadministered by trained field staff. As described below,some of the potential sources have high-qualityoutcome data, but these sources have other importantlimitations.
The following sections describe each of the potentialsources, grouped by their major limiting factor. Eachsection includes a table that summarizes availableinformation on FANP participation and nutrition- andhealth-related measures. Except as noted in thissection, all of the potential sources have public-usedata sets, available now or planned for the near future.
Sources with Poor Match BetweenProgram and Outcome Data
These data sources (table 11) have both FANPparticipation data and potentially useful nutrition- orhealth-related measures, but the combination of thesedata does not offer a strong basis for relating program
30 NLSY-79 is unique among these sources in providing cognitivetest scores and school transcript data for youth and young adults,but these data are of limited usefulness because they were collectedin 1980-83.
31 To obtain the school survey data, users must make specialarrangements with the data repository, at the Center of HumanResources Research, Ohio State University.

Economic Research Service, USDA Effects of Food Assistance and Nutrition Programs on Nutrition and Health/FANRR-19-2 • 31
Table 11—Summary of key data elements in potential data sources with poor match between program dataand nutrition/health measures
FANPs identified Nutrition- and health-related measures available
Physical/cognitive/
Food Food/ Food Physical/ Health- Health cemotional expend- nutrient sufficiency/ biochemical Birth related status/ status or
Data source WIC FSP NSLP SBP itures intake hunger measures outcomes behaviors care performance
Americans’ Changing Lives (ACL) � � � � �
Medical Expenditure Panel Survey (MEPS) � � � � � �
National Health Interview Survey (NHIS) � � � � � �
National Household Education Survey (NHES) � � �1 �1 � � � � � �
National Longitudinal Survey of Youth 1997 (NLSY97) � � � � � � �
National Survey of Family Growth (NSFG) � � � �
1NHES identifies children receiving free or reduced-price meals through NSLP or SBP, not differentiated between programs.

32 • Effects of Food Assistance and Nutrition Programs on Nutrition and Health/FANRR-19-2 Economic Research Service, USDA
participation and outcomes. In some cases, the programparticipation data do not provide enough detail or coverthe time period when the outcomes in question wereshaped. A common problem is relatively short-termparticipation data in a source for which the strongestoutcome data represent long-term impacts. Another issuewith these sources is that they often do not have any dataon the FANPs that are intended to affect the measuredoutcomes. In particular, several sources (such as theMedical Expenditure Panel Survey) have strong healthoutcomes that might reflect WIC impacts, but thesesources do not have WIC participation data. Finally,some sources have relatively well-documented FANPparticipation but do not have strong outcome measures.At present, these sources are more useful for descriptiveanalyses comparing participants with nonparticipantsthan for impact analyses, but several of the sourcescould be useful for impact analyses if the necessarydata were added.
Americans’ Changing Lives (ACL)
The ACL is an ongoing panel study of the lives ofolder adults, including activities, relationships, andresponses to acute and chronic stress. The study paysparticular attention to racial and other demographicdifferences in these dimensions. The study panel isnationally representative of the continental U.S.population age 25 and older, with oversampling ofAfrican-Americans and persons 60 and older. In-person interviews were conducted in 1986 and 1989;the third wave, in 1994, was conducted mainly bytelephone. A fourth wave is planned in 2001. Thecombined Wave 1/Wave 2 dataset includes 2,867respondents.32 The surveys have been conducted bythe Institute for Social Research, University ofMichigan, with funding and oversight from theNational Institute on Aging.
ACL identifies FSP participants but, to date, hasincluded few outcome items likely to be observablyaffected by FSP participation, once the determinants ofFSP participation are controlled for. The outcome mostdirectly related to FSP participation is food expenditures,but these data are much less detailed than in the CES oreven the CPS-FSS. The data are rich in measures ofhealth status, healthcare utilization, cognitiveperformance, emotional health, and health-related
behaviors. These outcomes could be related to long-term FSP participation patterns, but ACL onlydetermines whether the respondent householdsreceived food stamp benefits in the 12 months beforeeach interview. The longitudinal nature of this studywould make it a candidate for analyses of changes infood security over time, if a food security modulecould be added. It is important to note, however, thatthe panel is relatively small, so the sample ofhouseholds with some form of food insecurity is likelyto be quite small.
Medical Expenditure Panel Survey (MEPS)
The MEPS collects data on healthcare use, expenditures,sources of payment, and insurance coverage from apanel representing the U.S. civilian noninstitutionalizedpopulation.33 MEPS is the successor to the NationalMedical Care Expenditure Surveys conducted in 1977and 1987. The first panel of 10,000 families and24,000 persons was drawn from respondents to the 1995National Health Interview Survey (described below).Beginning in 1996, each household in this panel wasinterviewed five times over 2½ years, generally inperson.34 The data cover all household members forthe period from January 1996 through December 1997.A new panel is initiated each year, so the overlappingpanels provide larger cross-sectional samples for everycalendar year. In addition, MEPS surveys respondents’medical providers, employers, and insurance providersto supplement and validate the household survey data.The Agency for Health Care Policy and Research(AHCPR) and the National Center for Health Statistics(NCHS) jointly oversee the MEPS.
The only FANP identified in the 1996-1997 MEPSpanel was the FSP. The Round 5 questionnaire asked ifanyone in the household received food stamps in 1997and, if so, the number of months of receipt and themonthly value of the benefit.35
32 The number of respondents for the 1994 wave is not availableat present.
33 The MEPS has a separate survey of nursing homes andresidents, not described here.
34 The final wave of interviews with each household wasconducted by telephone except where this method was notconsidered feasible or suitable.
35 The available data documentation for 1996 surveys did notreference FSP participation and the corresponding questionnairewas not available on the MEPS web site. Therefore, the availabilityof these data for 1996 is uncertain.

Economic Research Service, USDA Effects of Food Assistance and Nutrition Programs on Nutrition and Health/FANRR-19-2 • 33
Nutrition- and health-related measures of potentialinterest include number of births and birthweight. Forchildren, health status data include immunizationstatus and height and weight (all parent-reported).Each household member is checked against a roster ofpotential health conditions (including diseases anddisabilities). Extensive data on all types of healthcareutilization are obtained. Clearly, if WIC participantswere identified in future MEPS panels, there would beinteresting opportunities for analyses of these data.
National Health Interview Survey (NHIS)
The NHIS is a major annual survey of the health anddemographic characteristics of the U.S. civilianpopulation. The NHIS collects data on the incidence ofacute and chronic conditions, injury, physician visits,hospitalizations, and related topics, using a stable corequestionnaire and a changing series of modules oncurrent health topics. The NHIS was started in 1957and is currently conducted by the Bureau of theCensus for the National Center for Health Statistics(NCHS). Each year, the NHIS conducts personalinterviews with a nationally representative, multistageprobability sample of over 100,000 persons (includingadults and children) in over 40,000 households.African-Americans and Hispanics have beenoversampled since 1995. The NHIS sample serves asthe sample frame for a growing number of healthsurveys, including the National Survey of FamilyGrowth and the Medical Expenditure Panel Survey.NHIS public-use data are available from the CensusBureau and from NCHS.
The NHIS includes data on FSP participation (householdparticipation in the last calendar year, identification ofindividual participants, and number of months of receiptfor the period), but no information is available onparticipation in other FANPs. A particularly unfortunate(but remediable) gap is the lack of information onWIC participation, given the presence of birthweightdata for infants and other outcomes of particularinterest to the WIC program.
All of the outcome measures in the NHIS are health-related. In addition to infant birthweights, particularlynotable measures include self/parent-reported heightand weight information for children and adults,presence of diseases such as hypertension anddiabetes, and healthcare utilization (inpatient andoutpatient). Other outcomes available from NHIS
include health-related behaviors (smoking, exercise,etc.), child behavior problems, and health status ofchildren and adults.
National Household Education Survey (NHES)
The NHES is an ongoing program for collectinginformation on educational issues from national cross-sectional samples of households. NHES data collectionbegan in 1991; subsequent surveys were conducted in1993, 1995, 1996, 1999, and 2001. According to thesponsor, the National Center for Educational Statistics(NCES), further surveys are planned for 2003 andevery 2 years thereafter (NCES, 1997). All NHESinterviews are conducted by telephone. About 60,000households are screened for eligibility, and minorityhouseholds are oversampled. The exclusive use oftelephone interviews is an important limitation of theNHES, particularly with respect to characterizing low-income populations that are more likely to be missedby such surveys.
The topics, relevant populations, and sample sizes varyfrom one round of the NHES to the next. The 1991topics were early childhood education (14,000 parentrespondents with children ages 3-8) and adult education.In 1993, the topics included school readiness (11,000parent respondents with children ages 3-7) and safetyand discipline. In 1995, the topics were the same as for1991, with a similar sample of 14,000 for the earlychildhood program participation component. The 1996topics were involvement in education and adult andyouth civic involvement. Plans for the 1999 interviewsincluded 24,600 interviews with parents of childrenfrom birth through 12th grade, 7,913 youths in 6ththrough 12th grade, and 6,697 adults age 16 and oldernot enrolled in grade 12 or below. The 1999 parentinterview topics included before- and after-schoolchildcare, early childhood program participation, andschool readiness.36
Both the 1993 school readiness and the 1995 earlychildhood program participation components obtaineddata on FSP and WIC participation, as did the 1999parent interview, which covered both of these topics.The 1993 survey asked about any food stamp receiptin the focal child’s first 5 years (for children inkindergarten or higher grades) and any WIC receipt
36 Documentation on the 2001 NHES is limited and the data arenot yet available, so the discussion in this report is limited to the1991-1999 surveys.

34 • Effects of Food Assistance and Nutrition Programs on Nutrition and Health/FANRR-19-2 Economic Research Service, USDA
since birth. For the FSP, the number of months oryears of receipt was obtained.37 This survey also askedabout receipt of free or reduced-price meals (breakfastor lunch, undifferentiated) for preschoolers in daycarecenters and children in kindergarten or higher grades.The 1995 and 1999 surveys used the preceding 12months as the reference period for FSP and WICparticipation, but did not collect data on other foodassistance programs.
The 1993, 1995, and 1999 surveys included somehealth-related measures, but only the 1993 survey hasinformation about hunger and food intake. The 1993survey had one very limited but conceivablyinteresting hunger question: whether the focal childhas gone without food for one-half day or more duringthe last month. The meal-eating-pattern questions inthe survey also were limited, asking how often thechild eats breakfast (per week) and how often a familymember prepares a hot meal for the child.
Among the available health-related measures, thequestion of greatest potential interest is the child’sbirthweight, which was obtained by the 1993 and 1995surveys. Unfortunately, neither of these surveysincluded data on maternal receipt of WIC duringpregnancy. The 1993 data do identify lifetime WICreceipt by the child, which could conceivably be usedas a proxy, but low birthweight is a major nutritionalrisk that may be used to qualify infants of non-WICmothers to receive WIC benefits.
The 1993, 1995, and 1999 surveys obtained indicatorsof physical or cognitive development and schoolperformance. These included grade attended, classstanding, behavior problems, and academic problemsor areas requiring special help. All three surveys alsoasked numerous questions on disability anddevelopmental delays, as well as about the child’sgeneral health status and routine healthcare. The 1993and 1999 surveys asked parents a series of questionsabout preschoolers’ development of abilities in theareas of colors, letters, and counting, plus (in 1993only) questions on the reading ability of school-agechildren.
National Longitudinal Study of Youth 1997 (NLSY97)
The NLSY97 is the latest cohort in the series of theNational Longitudinal Studies described in the sectionon principal data sources. It is a continuinglongitudinal survey of a nationally representativecohort of 9,000 youths who were ages 12-16 at the endof 1996, with oversamples of African-Americans andHispanics. This survey has substantial data on FANPparticipation, but it is considered merely as a potentialsource at present because of its limited data onnutrition and health outcomes.
The purpose of the study is to gather informationabout the lives of the study cohort, with particularattention to the transition from school to work and tothe relationships between this process and thecharacteristics of the youths, their families of origin, thefamilies they form, and their environments. These datawill be gathered through periodic in-person interviewswith the youths and their parents, surveys of theyouths’ schools, collection of transcripts and existingstandardized test scores, and administration of theArmed Services Vocational and Aptitude Battery(ASVAB). Initial school surveys were conducted in1996, and the first youth and parent interviews wereconducted in 1997. The NLS program of whichNLSY97 is part is directed by the BLS. The NationalOpinion Research Center (NORC) manages andconducts the survey under contract to BLS. The Centerfor Human Resource Research, Ohio State University,provides other support, including creation of variables,data documentation, and dissemination.
The NLSY97 provides data on FSP and WIC participa-tion, both for youths living with a parent or guardian andindependent youths, but has no participation data forNSLP or SBP. The 1997 parent interview askedwhether the household received food stamps in 1996and, if so, the total value of benefits for the year. Forboth WIC and FSP, this instrument also obtains thenumber of years the child’s parents received thebenefit during the last 5 years. For independent youths,the 1997 youth interview obtained a more detailed FSPhistory, including current receipt, any prior receipt,start and end dates of the first spell, total weeks of FSPbenefits, average monthly amount of FSP benefits, andall persons covered by the FSP benefits. For WIC, theyouth questionnaire asked the same questions,including the average monthly value of the benefits (interms of the expected cost to buy the items obtained
37 The survey collected income data only for the most recentyear. This information provides only a crude basis for identifyingchildren who were eligible nonparticipants in FSP or WIC over thecovered period of 5 years or more. This problem does not affectanalyses using the school breakfast/lunch participation variable,which is short term.

Economic Research Service, USDA Effects of Food Assistance and Nutrition Programs on Nutrition and Health/FANRR-19-2 • 35
with WIC benefits). It is important to note that, giventhe age range of the cohort at the start of the study, theearly years of the survey will include relatively fewindependent youths, and therefore the sample sizes forthis population will be small.
At present, the NLSY97 offers limited information onfood intake/habits. Youths are asked how often they eatbreakfast on school days (regardless of the source offood) and how often they eat green vegetables or fruit.Both parent and youth questionnaires obtain reports ofthe youth’s height and weight; the youth questionnairealso asks about perceived overweight or underweightstatus. The youth survey also includes data on health-related behaviors, diseases, and general health. Theparent survey includes items on physical, emotional, ormental limitations affecting the youth’s schooling orwork. In the future, stronger measures of cognitivedevelopment and school performance are expected tobe available from the tests administered by theNLSY97 and from school records.
The future value of the NLSY97 to FANP researchdepends largely on whether nutrition- and health-related measures are expanded from the current set.The basic questions on pregnancy outcomes are ofpotential value, although the data collected so far donot cover the entire cohort’s teenage years. If thefertility-related questions were expanded along thelines of the NLSY79 questionnaire, valuableinformation on birth outcomes and infant feedingwould be available. These data would be especiallyuseful if the WIC questions continue to be asked at theindividual level. Further potential would be created ifthe NLSY79-MC child assessments were replicated inthe children of the NLSY79 cohort.
National Survey of Family Growth (NSFG)
The NSFG is a series of surveys of women ofchildbearing age concerning sexual behavior,marriage/cohabitation, contraception, pregnancy,childbearing, and related aspects of maternal and childhealth. The NSFG began in 1973 and was conductedevery 4 to 7 years thereafter (1976, 1982, 1988, and1995).38 The next NSFG is planned to take place in2002 and will include men for the first time. Since1982, the sample has been representative of all women
aged 15 to 44, regardless of marital or childbearingstatus. The 1995 NSFG had a sample of 10,847women, with oversamples of African-American andHispanic women. All interviews were conducted inperson using a computerized instrument, with sensitivedata collected via a self-administered module. The1995 NSFG sample was drawn from the 1993 NationalHealth Interview Survey (NHIS) sample, and the 1995NSFG data include variables from the 1993 NHIS. TheNCHS oversees the NSFG and distributes the public-use files.
The 1995 NSFG identified FSP but not WICparticipants, despite the relevance of WIC to maternaland infant health. FSP participation data was collectedat the household level, using a 12-month referenceperiod, with no information on the identities ofparticipants, the duration of participation, or thebenefit level.
The most notable nutrition/health outcome data in theNSFG are the questions on birth outcomes andbreastfeeding. Birth outcome data for each pregnancyinclude live vs. still birth, gestational age, andbirthweight. The breastfeeding data are collected foreach named infant. These data include incidence ofever breastfeeding, problems encountered, age atintroduction of other foods, age at weaning, andreasons for weaning. Questions on disease and medicalconditions elicit information on anemia, diabetes, andhigh blood pressure, both during and outside ofpregnancy, and on infertility. The NSFG also has dataon health-related behaviors (especially those related tosexual activity or pregnancy) and on use of maternalhealthcare services. Clearly, the utility of this datasource for FANP research would be greatly enhancedif information on WIC participation were available.
Sources with Limited Populations
The sources listed in table 12 have some information onFANP participation data and some nutrition- and health-related measures; however, they are not consideredprincipal sources because their samples come fromrelatively narrow populations. One of the four, theEvaluation of the Comprehensive Child DevelopmentProgram-Second Cohort (CCDP2), contains data froma set of 10 demonstration sites that are not nationallyrepresentative. Two of the studies represent cohorts oftwo different age ranges among the elderly population.The other study, the National Immunization Survey, islimited to children aged 19 to 35 months.
38 A followup to the 1988 NSFG was conducted in 1990. Thissurvey was not considered for the review because the main datacollection occurred before the 1990 cutoff.

36 • Effects of Food Assistance and Nutrition Programs on Nutrition and Health/FANRR-19-2 Economic Research Service, USDA
Table 12—Summary of key data elements in potential data sources that have limited populations FANPs identified Nutrition- and health-related measures available
Physical/cognitive/
Food Food/ Food Physical/ Health- Health cemotional expend- nutrient sufficiency/ biochemical Birth related status/ status or
Data source WIC FSP NSLP SBP itures intake hunger measures outcomes behaviors care performance
Evaluation of the Compre-hensive Child Development Program—Second Cohort (CCDP2) � � � � � � � �
Health and Retirement Study (HRS) � � � � � �
National Immunization Survey (NIS) � �
Pregnancy Risk Assessment Monitoring System (PRAMS) � �1 �2 �3 �4 � � �
Survey of Assets and Health Dynamics Among the Oldest Old (AHEAD) � � � � � � �
1FSP data in Prams are collected only in some States.2Some States collect information on use of vitamin supplements and/or folic acid during pregnancy.3Some States ask limited question(s) on hunger/lack of food.4Some States collect information on maternal weight gain during pregnancy.

Economic Research Service, USDA Effects of Food Assistance and Nutrition Programs on Nutrition and Health/FANRR-19-2 • 37
Evaluation of the Comprehensive ChildDevelopment Program—Second Cohort (CCDP2)
The Comprehensive Child Development Program(CCDP) was first funded by the Department of Healthand Human Services’ Administration on Children,Youth, and Families (ACYF) in 1989. The overall goalof the program was to provide early and comprehensiveservices to enhance child health and development andto support families in gaining economic self-sufficiency.Two evaluations of CCDP have been conducted forACYF by Abt Associates Inc. The first one covered thefirst cohort of 22 sites (CCDP1), and the secondcovered the second cohort of 10 sites (CCDP2).39 Bothevaluations used random assignment designs andgathered rich data on the development of focalchildren in the sampled families (both treatment andcontrol) from the time of program entry until thechild’s third birthday.40 To enter the sample, the familyhad to have income at or below the poverty level, andthe mother had to be pregnant or within 12 monthspostpartum.
Only CCDP2 was considered for this review, however,because it is the only one of the two evaluations thatprovides both FSP and WIC participation data. The 10sites are not nationally representative, but wereselected on the basis of the respective sponsoringorganizations’ willingness and ability to oversee CCDPoperations. Nevertheless, the sites are quite diverse,including rural, urban, and suburban areas and varyingminority populations and representing four of theseven FNS regions.
CCDP2 had a sample of over 2,000 families, each witha focus child. Approximately half of the CCDP2families were in the treatment group. Inclusion of thisgroup may not be problematic for analyses of FSP orWIC impacts, because the CCDP does not appear tohave been effective.41 Although the sample frameinitially included only households under 100 percentof poverty, only 72 percent of children were at orbelow the poverty line by 2 years of age. Because of
the random assignment feature of the CCDPevaluation, the evaluation drew convenience samplesfrom the pool of families recruited for the program,rather than probability samples of eligible childrenwithin the sites.
CCDP2 includes data collected in person at programentry, 1 year later, and at the child’s second and thirdbirthdays. The baseline data includes demographicinformation such as race, income, and employment.Because CCDP was hypothesized to have a wide rangeof effects on both children and their families, thefollowup surveys were designed to collect informationon a variety of outcome measures for both childrenand their mothers.
Short-term WIC and FSP participation data werecollected from parents or caregivers at the focal child’ssecond and third birthdays. For the FSP, these datainclude incidence of benefit receipt, duration ofparticipation, and last benefit amount during thepreceding 6 months. For WIC, current enrollmentstatus was determined for the focal child, the caregiver,and other children in the household.42 Thus, this studydoes not provide a full history of FSP or WICparticipation for the entire period of the focal child’sdevelopment, nor on participation during the prenatalperiod—crucial limitations in light of the study’s focuson developmental measures. The study does, however,provide income and household-size data needed foridentifying eligible nonparticipants.
Available nutrition and health measures include bothshort- and long-term measures for the focal childderived from the parent/caregiver interviews. Theshort-term measures include limited indicators of foodsufficiency and hunger; data on regularity of meals andconsumption of certain food groups (milk, cereals,fruits and vegetables) and nutrients (added sugar, salt,and fats); health status; a detailed immunizationhistory; infant feeding practices; and healthcareutilization. Long-term measures of motor, cognitive,and emotional/social development are available from abattery of assessments performed by the data collectors.
42 At ages 2 and 3, 54 and 43 percent of focal children,respectively, were enrolled in WIC. (Source: Tabulations by AbtAssociates Inc.)
39 The CCDP2 evaluation has been completed but not yetreleased.
40 CCDP1 also collected data at ages 4 and 5 (St. Pierre et al.,1997).
41 The CCDP1 evaluation did not find any impacts whentreatment and control groups were compared.

38 • Effects of Food Assistance and Nutrition Programs on Nutrition and Health/FANRR-19-2 Economic Research Service, USDA
Health and Retirement Study (HRS)
The HRS is a longitudinal study of the lives of anationally representative panel of older adults,focusing on retirement choices, the transition toretirement, and coping with illness and limitations inlater life. The HRS began in 1992 with a survey of apanel of 12,600 adults, including persons aged 51 to61 and their spouses. Followup surveys have beenconducted every 2 years, the latest in 2000.43 Primarydata collection includes a combination of telephoneand in-person interviews, along with self-administered(mail) questionnaires. In addition, pension and healthinsurance data have been extracted from employerrecords, and earnings and benefit data have beenobtained from the Social Security Administration’sfiles. The study is conducted by the Institute for SocialResearch with support from the National Institute onAging. Starting with the 1998 wave, it is linkedthrough a common questionnaire and data collectionprocess with the Survey of Assets and HealthDynamics among the Oldest Old, which is discussedlater in this section.
HRS gathers data on participation in FSP and Mealson Wheels. For the FSP, Waves 2 and 3 of HRS (the1994 and 1996 surveys) gathered monthly participationdata covering the 2 years between interviews,including the last benefit amount received before theinterview. For Meals on Wheels, the surveys ask onlywhether the respondent’s household had ever used theprogram in the 2 years prior to the interview.
HRS includes data on food expenditures, foodsufficiency, and hunger, but the measures are relativelyweak when compared with those of the principalsources. The food expenditure data are approximateweekly averages (over a 2-year period) for foodpurchases, additional food delivered to the home, andmeals eaten out. There is one food sufficiency question(“In the past two years, have you always had enoughmoney to buy the food you need?”) and one hungerquestion (“At any time in the last two years have youskipped meals or eaten less than you felt you shouldbecause there was not enough food in the house?”).44
Health-related measures include a series of memorytests administered during the interviews. Questions onthe incidence of disease ask, among other things, abouthigh blood pressure and diabetes. Other health-relatedmeasures include health care utilization and expenses(out-of pocket and paid by insurance), general healthstatus, health-related behaviors (smoking, exercise, andalcohol use), and emotional health/depression.
National Immunization Survey (NIS)
The NIS collects information on the immunizationcoverage of children 19 to 35 months of age. As themonitoring tool for the National ImmunizationProgram, the NIS is designed to provide rapidlyavailable, statistically valid four-quarter movingaverages for each of the 50 States, the District ofColumbia, and 27 metropolitan areas.
NIS data collection began in 1994 and is ongoing. Eachquarter, approximately 8,580 interviews are completed,but over 400,000 random-digit dial (RDD) screeninginterviews are conducted to identify eligible households.These screening interviews provide the potential forconducting other surveys from the same initial RDDsample frame. To improve the accuracy of vaccinationdata, providers identified by survey respondents aremailed a self-administered questionnaire. The NIS isfunded and overseen by the Centers for DiseaseControl and Prevention (CDC); the current surveycontractor is Abt Associates Inc.
A key issue concerning the use of the NIS to studyFANP outcomes is the exclusive reliance on telephoneinterviews. Other sources (principally the NationalHealth Interview Survey, or NHIS) have shown thatchildren in households with telephones tend to havehigher immunization rates and higher family incomesthan those in households without telephones.45 TheNIS uses NHIS data on households without telephonesto adjust the estimates of overall immunizationcoverage; the results are comparable to the NHIS andother immunization data (Abt Associates, 1996). It isnot clear whether similar methods could be used torefine comparisons of WIC participants with eligiblenonparticipants. A related issue is whether the NISdata can reliably identify either subgroup, given thechallenges in this area encountered even bylongitudinal studies using both telephone and in-person interviews.46
45 The NHIS is a potential source for FANP outcomes analysis,as discussed later in the section on potential sources.
43 The information on HRS content in this report is based on the1992-96 questionnaires. The 1998 and 2001 questionnaires areavailable online at www.umich.edu/~hrswww/docs/qnaires/online.html.
44 Wording from Wave 3 questionnaire, downloaded fromwww.umich.edu/~hrswww.

Economic Research Service, USDA Effects of Food Assistance and Nutrition Programs on Nutrition and Health/FANRR-19-2 • 39
Information on FANP Participation. The NIS hasseveral items on WIC participation that were added in1997 and funded by USDA. No other information onFANP participation is available. The exclusive focuson WIC participation is a logical one and reflects therecent emphasis on using WIC nutrition education as avehicle for promoting childhood immunizations. Foreach child in the survey (i.e., age 19 to 35 months), theNIS asks whether the child has ever received WIC; theage (in months) at first receipt; current receipt status;age at last receipt for former recipients; and whetherWIC benefits were interrupted for 6 or more months.The NIS also asks whether the WIC program haschecked the child’s immunization record. Householdsize and income data are available to identify eligiblenonparticipants in the age range covered by the survey.
Nutrition- and Health-Related Measures.The NIShas comprehensive information on children’s receipt ofage-appropriate vaccinations from both parentinterviews and followup contacts with medicalproviders. No other nutrition or health outcome dataare obtained by the NIS.
A public-use file of the 1999 NIS data and relateddocumentation are available from the NCHS website(www.cdc.gov/nis/default.htm).
Pregnancy Risk Assessment MonitoringSystem (PRAMS)
The PRAMS is a surveillance system operated by theCDC and State health departments. Started in 1987 toaddress concerns about infant mortality rates and theincidence of low birthweight, PRAMS is a population-based survey of women who delivered live-borninfants. The survey measures maternal attitudes andbehaviors prior to, during, and immediately followingpregnancy. The overarching goal of the surveillancesystem is to provide State health officials with State-specific data on maternal characteristics that can beused to plan and assess health programs for mothersand infants. In 2000, 24 States, plus the District ofColumbia and New York City, participated in PRAMS(Liscomb, Johnson, and Morrow, 2000).
PRAMS sampling and data collection methodology arestandardized across States. Each month, every Statesamples 100-250 eligible women from State birth
certificate files. Most States oversample low birth-weights, and several States stratify their samples by raceor ethnicity. Data are collected through a mail survey,with mail and telephone followup. In 1998, the latestyear for which data are available, samples in States withfully implemented PRAMS systems ranged from 1,506to 3,322 (Liscomb, Johnson, and Morrow, 2000).
The PRAMS survey includes a core set of questions,administered by all participating States, as well as aState-specific set. The CDC periodically revises thecore survey in response to new areas of interest andareas needing improvement (Liscomb, Johnson, andMorrow, 2000). States may develop and test their ownsurvey items or use additional (optional) itemsdeveloped by CDC, referred to as “standard”questions. In addition to survey data, the PRAMSdatabase includes information on demographic andhealth characteristics for each mother and infant,extracted from State vital statistics records.
The core portion of the PRAMS questionnaire collectsinformation as to whether the woman participated inWIC during her pregnancy. Some States collectadditional information on when the woman enrolled inWIC, whether her infant is enrolled in WIC, and, ifnot, the reasons why. Some States collect informationon whether respondents participated in FSP duringtheir pregnancies. Currently, no States collectinformation on the duration or size of FSP benefits.
Information available from the PRAMS core question-naire (used by all States) includes data on prematurity(expected due date and actual delivery date), use ofneonatal intensive care, infant mortality, infant andmaternal morbidity, breastfeeding, use of drugs, alcohol,and cigarettes during pregnancy, and health care accessand utilization. Some States collect additional data inthese areas and/or data on maternal weight gain duringpregnancy, food insufficiency, and use of vitamin/mineral supplements and/or folic acid during pregnancy.
Survey of Assets and Health Dynamics among the Oldest Old (AHEAD)
The AHEAD is a longitudinal panel study of adults 70and older and their spouses. The study focuses on theinterplay between changes in health in later life and theresources to cope with these changes, includingpersonal economic resources, government programs,and family supports. AHEAD began with a 1993-94survey (Wave 1) of a nationally representative sample
46 Response rates for the NIS are not reported on the websitesfor the NIS. Consult the NIS web site at www.nisabt.org for furtherstudy design information.

40 • Effects of Food Assistance and Nutrition Programs on Nutrition and Health/FANRR-19-2 Economic Research Service, USDA
of 8,222 noninstitutionalized persons (7,447 of them70 or older). The study oversampled African-Americans,Hispanics, and Florida residents. A followup AHEADsurvey (Wave 2) was conducted with this panel in1995-96. To gather data on deceased members, thesurviving spouse or another proxy was interviewed inthis and subsequent waves. In 1998, the data collectionfor the AHEAD panel was combined with that of HRS(Health and Retirement study, discussed above),including the questionnaire. All waves have used acombination of in-person and telephone interviews.Study plans include interviews every 2 years and datalinkages with SSA earnings and benefits data, Medicareand Medicaid files, and the National Death Index. Thestudy is conducted by the Institute for Social Researchwith support from the National Institute on Aging.
AHEAD obtains the same monthly data on FSPparticipation as HRS, covering the 2-year period priorto each survey wave. As in the HRS, the FSP datainclude the last FSP benefit amount, and the samequestion on use of Meals on Wheels is asked. Income,age, and household composition data are available toidentify eligible nonparticipants.
The relevant outcome measures in AHEAD are largelythe same as in HRS. The same questions on foodexpenditures, food sufficiency, and hunger are asked.Health-related data include measures of cognitivestatus from a series of memory tests, as well as self-reported data on physical abilities (walking, preparingmeals, etc.), health status, health behaviors, diseases,healthcare use, and emotional health. AHEAD alsoincludes self-reported (over the telephone) measures ofheight and weight.
Sources with No Information on FANP Participation
Finally, the potential sources include two surveys thatpresently lack FANP participation data but have thepotential to be useful to FANP research if appropriatequestions are added (table 13). The following textdescribes each of these sources.
Behavior Risk Factor Surveillance System (BRFSS)
The BRFSS is a set of annual, State-based surveys ofadults that assess the prevalence of personal healthpractices related to leading causes of disease and death.State health departments use BRFSS data to guide
health promotion and disease prevention programs andto monitor their progress. The BRFSS began in 1984;since 1994, all 50 States, the District of Columbia, andseveral U.S. territories have participated. Allinterviews are conducted by telephone under Statesupervision, using a standard core questionnaire andoptional modules. State samples range from 1,200 to4,000; the national total is over 100,000 interviews.The National Center for Chronic Disease Preventionand Health Promotion of the Centers for DiseaseControl and Prevention (CDC) coordinates the survey,publishes State summary data, and makes electronicmicrodata available to researchers by agreement.
The BRFSS lacks information on FANP participationbut has a number of potentially useful outcomevariables.47 Core questionnaire measures include height,weight, medical and dental care usage, incidence ofdisease (including high blood pressure, high cholesterol,and diabetes), immunization (flu and pneumonia), andgeneral health status. Optional modules include alimited food sufficiency question (concern aboutenough food in the last 30 days), frequency ofconsuming specific fruits and vegetables, folic acidsupplementation, presence of cardiovascular disease,and weight control practices. Current pregnancy statusis asked, and data are collected on annual householdincome and household size and composition.
National Longitudinal Study of AdolescentHealth (Add Health)
The Add Health study examines the relationshipsbetween the health-related behaviors of adolescents ingrades 7-12 and their individual, family, school, andcommunity characteristics. Add Health is a nationalstudy that collects data from adolescents, parents, andschool administrators. The study includes 80 highschools and 54 “feeder schools” selected to representstrata by region, degree of urbanization, school type,ethnic mix, and size. There have been two waves ofdata collection: Wave 1 in 1994-95 and Wave 2 in1996. Wave 3 data collection began in August 2001and is scheduled to end in April 2002. Wave 1included a self-administered questionnaire completedin school with 90,000 respondents; in-home interviewsand vocabulary tests with 20,745 adolescents; in-homeinterviews with 17,700 parents; and self-administeredquestionnaires completed by 164 school administrators.Wave 2 included 14,738 followup in-home interviews
47 This description reflects the BRFSS questionnaires through1999.

Economic Research Service, USDA Effects of Food Assistance and Nutrition Programs on Nutrition and Health/FANRR-19-2 • 41
Table 13—Summary of key data elements in potential data sources that have no information on FANP participation
FANPs identified Nutrition- and health-related measures available
Physical/cognitive/
Food Food/ Food Physical/ Health- Health cemotional expend- nutrient sufficiency/ biochemical Birth related status/ status or
Data source WIC FSP NSLP SBP itures intake hunger measures outcomes behaviors care performance
Behavior Risk Factor Surveillance System (BRFSS) � � � � �
National Longitudinal Study of Adolescent Health (Add Health) � � � � �

42 • Effects of Food Assistance and Nutrition Programs on Nutrition and Health/FANRR-19-2 Economic Research Service, USDA
with adolescents and 125 self-administered schooladministrator questionnaires. The Wave 3 sampleincludes the Wave 1 in-home respondents (now youngadults ages 18 to 26) and a new sample of 1,500current partners of Wave 1 respondents. An importantfeature of the study is that the school-based sampleallows linkage of information about individualadolescents from their siblings, friends, classmates, andromantic partners, as well as contextual informationabout the school and community. The NationalInstitute of Child Health and Development (NICHD)was the lead funding agency of Add Health. The studyis managed by the Carolina Population Center at theUniversity of North Carolina, Chapel Hill.
Add Health did not collect any data on FANPparticipation in either Wave 1 or Wave 2. There maybe FSP participation data from the Wave 3 survey.48
In both Wave 1 and Wave 2, the Add Health in-homeinterviews with adolescents included questions on foodintake. The Wave 1 data include questions about whichspecific types of foods the respondent usually eats forbreakfast on a weekday and about the previous day’sfood frequency by food group. In Wave 2 there is,instead, a single series of questions on beverages andfoods consumed the previous day, using a moredetailed list of foods.49
The Wave 1 and Wave 2 interviews provide a varietyof health-related outcome data, generally with thesame items in both waves. Respondents reported theirheights and weights, as well as perceptions aboutunder/overweight and efforts to gain or lose weight.Other health-related behavior data include severalitems on exercise and many items on risky behaviors.In the domain of health status and care, the datainclude general health status, specific symptoms ofpossible illness, access to health care, and receipt ofroutine health care services. Several items provideinformation on school attendance and performance,notably a series of questions on grades received inspecific subjects, in addition to the common generalquestions about problems with behavior or academicsand repeating grades. Finally, a series of questionsassesses the respondent’s emotional health andtendency toward depression. Preliminary informationon the Wave 3 survey indicates a continuing focus onhealth considera-tions, including topics of pregnancyand childbirth.
The potential use of Add Health for FANP outcomesanalysis is uncertain. Given the lack of FANPparticipation data in Waves 1 and 2, these wavescannot be used for outcome analysis, although theymight be used as baseline data for future longitudinalanalysis. The potential use of Wave 3 data will dependon the availability of the FSP participation data andoutcomes likely to be related to FSP participation.Collection of WIC participation data in future wavesof this study might open up greater possibilities forexploiting the extensive health outcomes data.
48 The Wave 3 survey asks about household-level FSPparticipation (prior year and current) among the respondents, whoare young adults. The availability and quality of these data are yet tobe determined.
49 Preliminary documentation on the Wave 3 survey does notspecify whether food intake data will be available.

Economic Research Service, USDA Effects of Food Assistance and Nutrition Programs on Nutrition and Health/FANRR-19-2 • 43
References
Abt Associates Inc. (1996). Sample Design andProcedures to Produce Estimates of VaccinationCoverage in the National Immunization Survey.Online at www.nisabt.org.
Andrews, M., M. Nord, G. Bickel, and S. Carlson(2000) Household Food Security in the UnitedStates, 1999. Food and Nutrition Research ReportNo. 8, USDA, Economic Research Service.
Bickel, G., S. Carlson, and M. Nord (1999).Household Food Security in the United States,1995-1998 (Advance Report). Alexandria, VA:USDA, Food and Nutrition Service.
Brick, P. et al. (1999). 1997 NSAF Survey Methodsand Data Reliability. Washington, DC: UrbanInstitute. Online at www.newfederalism.urban.org.
Bureau of the Census (1999). Survey of ProgramDynamics (SPD) 1997: Experimental File TechnicalDocumentation (SPD-97). Online atwww.sipp.census.gov/spd/pubsmain.htm.
Bureau of the Census (2001). Survey of ProgramDynamics Status Report. U.S. Department ofCommerce. Online at http://www.sipp.census.gov/spd/pu00strp.htm. Accessed January 4, 2001.
Burstein, N., M. Fox, J. Hiller, R. Kornfeld, K. Lam,C. Price, and D. Rodda (2000). WIC GeneralAnalysis Project: Profile of WIC Children.Alexandria, VA: USDA, Food and NutritionService. Online at http://www.fns.usda.gov/oane/MENU/Published/WIC/FILES/profile.pdf.
Castner, L., and S. Cody (1999). Trends in FSPParticipation Rates: Focus on September 1997.Alexandria, VA: USDA, Food and NutritionService.
Center for Human Resource Research (1999). NLSY791996 Child and Young Adult Data Users Guide.Columbus, OH: CHRR, The Ohio State University.
Devaney, B., L. Bilheimer, and J. Shore (1991). TheSavings in Medicaid Costs for Newborns and TheirMothers from Prenatal Participation in the WICProgram. Alexandria, VA: USDA, Food andNutrition Service.
Dwyer, J., K. Ellwood, A. Moshfegh, and C. Johnson(2001). “Integration of the Continuing Survey ofFood Intakes by Individuals and the National Healthand Nutrition Examination Survey.” Journal of theAmerican Dietetic Association 101(10): 1142-1143.
Federation of American Societies for ExperimentalBiology (FASEB) (1995). Third Report on NutritionMonitoring in the United States. U.S. GovernmentPrinting Office.
Hamilton, W.L. et al. (1997). Household Food Securityin the United States in 1995: Summary Report ofthe Food Security Measurement Project. Cambridge,MA: Abt Associates Inc. Report prepared forUSDA, Food and Nutrition Service.
Hamilton, W., and P. Rossi (2001). Effects of FoodAssistance and Nutrition Programs on Nutrition andHealth: Volume I, Research Design. Food andNutrition Research Report No. 19-1, USDA,Economic Research Service.
Hill, M.S. (1992). The Panel Study of IncomeDynamics: A User’s Guide. Newbury Park, CA:Sage Publications.
Interagency Board for Nutrition Monitoring andRelated Research (2000). K. Bialostosky, ed.,Nutrition Monitoring in the United States: TheDirectory of Federal and State Nutrition Monitoringand Related Research Activities. Hyattsville, MD:National Center for Health Statistics.
Kowaleski-Jones, L., and G. Duncan (2000). Effects ofParticipation in the WIC Food Assistance Programon Children’s Health and Development: Evidencefrom NLSY Children. Institute for Research onPoverty. Online at www.ssc.wisc.edu/irp/pubs/dp120700.pdf.
Lipscomb, L.E., C.L. Johnson, B. Morrow, et al.(2000). PRAMS 1998 Surveillance Report. Atlanta,GA: Division of Reproductive Health, NationalCenter for Chronic Disease Prevention and HealthPromotion, Centers for Disease Control andPrevention.
National Center for Educational Statistics (1999).Project Summary, Early Childhood LongitudinalStudy, Kindergarten Class of 1998-99. Online atwww.nces.ed.gov/ecls/kindergarten/ksum.htm.

44 • Effects of Food Assistance and Nutrition Programs on Nutrition and Health/FANRR-19-2 Economic Research Service, USDA
National Center for Educational Statistics (NCES,2001). Early Childhood Longitudinal Study BirthCohort Study Brief. Online at http://nces.ed.gov/ecls/Birth/studybrief.asp.
National Center for Health Statistics (NCHS) (2000).Current NHANES on into the 21st Century. Onlineat www.cdc.gov/nchs/about/major/nhanes/current.htm. Accessed May 4, 2000.
National Center for Education Statistics (1997).National Household Education Survey: AnOverview. Online at www.nces.ed.gov/nhes.Accessed May 25, 1999.
Ponza, M., J.C. Ohls, L. Moreno, A. Zambrowski, andR. Cohen (1999). Customer Service in the FoodStamp Program, Final Report. Prepared byMathematica Policy Research Inc., for USDA, Foodand Nutrition Service, Alexandria, VA.
Russell, B., M. Leonard, and F. Scheuren (1999). 1997NSAF Child Public Use File Codebook, NationalSurvey of American’s Families (NSAF): MethodologySeries No. 11. Washington, DC: Urban Institute.
Safir A., F. Scheuren, and K. Wang. National SurveyOf America’s Families Survey Methods And DataReliability, 1997 and 1999. Washington, DC: UrbanInstitute, undated. Online athttp://newfederalism.urban.org/nsaf/survey?methods.html. Accessed 12/26/2001.
Siegel, P., and S. Mack (1995). Overview of RedesignMethodology for the Survey of Income and ProgramParticipation. U.S. Bureau of the Census.
St. Pierre, R., et al. (1997). National Impact Evaluationof the Comprehensive Child Development Program:Final Report. Prepared by Abt Associates Inc. forU.S. Department of Health and Human Services,Administration on Children, Youth and Families.
U.S. Department of Agriculture (1992). The FoodGuide Pyramid. Home and Garden Bulletin Number1992.
U.S. Department of Labor, Bureau of Labor Statistics(1997). BLS Handbook of Methods, p. 161.
Weinberg, D.H., and S.S. Shipp (2000). The Survey ofProgram Dynamics-A Mid-term Status Report.Washington, DC: U.S. Census Bureau. Online atwww.sipp.census.gov/spd/workpaper/summary10.htm.
West, J., K. Denton, and L.M. Reaney (2000).America’s Kindergartners: Statistical AnalysisReport, Early Childhood Longitudinal Study-Kindergarten Class of 1998-1999, Fall 1998. U.S.Department of Education, National Center forEducation Statistics.
West J., K. Denton, and L.M. Reaney (2000). TheKindergarten Year: Findings from the EarlyChildhood Longitudinal Study, Kindergarten Classof 1998-99. Washington DC: National Center forEducation Statistics.

Appendix A
Insufficient Data Sources
Include Only Pre-1990 Data
Hispanic Health and Nutrition Examination Survey (HHANES)
Longitudinal Study of Aging
National Children and Health Fitness Study 2, (NCYFS2), Ages 6 Years–9 Years
National Children and Youth Fitness Study 1, (NCYFS1), Ages 10 Years–18 Years
National Medical Expenditure Survey
National Survey of Children
National Survey of Personal Health Practices and Consequences, Wave I and II
Nationwide Food Consumption Survey
Third Wave Prevalence Findings from the Massachusetts Health Care Panel Study
Program Information Not Feasible to Add and/or Limited or WeakNutrition/Health Measures
American Community Survey
Community Tracking System Household Survey
General Social Survey
Health and Diet Survey/Food Label Use and Nutrition Education Survey
National Ambulatory Medical Care Survey (NAMCS)
National Assessment of Educational Progress
National Hospital Discharge Survey, 1991
National Longitudinal Mortality Study
National Survey of Adolescent Males
National Survey of Families and Households
New Beneficiary Data System
Administrative Database Requiring Complex Linkage to DatabaseProviding Program Participation Information
Income and Assets Supplement to the Medicare Current Beneficiary 1991 Round 1Public Use Release
Linked Birth/Death Set: Birth Cohort Numerator and Denominator Files, 1987
Maternal and Child Health Services Block Grant Reporting System
Medicaid Data System
Medicare Beneficiary File System of the Prospective Payment and AnalyticSupport Studies Database
Medicare Current Beneficiary Survey 1991 Round 1 Public Use Release
Medicare Current Beneficiary Survey 1992 Access to Care
Medicare National Claims History Files
National Linked File of Live Births and Infant Deaths
Economic Research Service, USDA Effects of Food Assistance and Nutrition Programs on Nutrition and Health/FANRR-19-2 • 45

National Vital Statistics System
Statistics of Income Family Panel, Family Cross-Section Files
Limited Populations (Including Studies Restricted to ProgramParticipants)
1990 Farm Bill School Lunch Studies
Adult Day Care Study
Assessing Low-Income Children’s Changing Environments and Effects on SchoolReadiness
Early Childhood and Childcare Study
Evaluation of the Nutrient Standard Menu Planning Demonstration
Expanded Food and Nutrition Education Report Program System
California Newborn Genetic Screeing
Child Nutrition Meal Cost Methodology Study
Child Nutrition Program Operations Studies
FDPIR Study
Framingham Heart Study, Children’s Cohort
Healthy Start Evaluation
Intergenerational Panel Study of Parents and Children
Los Angeles-New York City Immigrant Survey
Measuring Impacts on Children in Evaluations of State Welfare Reforms
Menu Modification Demonstration Grants: Evaluation
National Evaluation of Welfare-to-Work Grants
National Evaluation of Welfare-to-Work Strategies
National Survey of WIC Participants
New Immigrant Survey Pilot Project
Panel Study of Urban Youth: The Transition Out-of-School (Beginning SchoolStudy)
PC Data
Pediatric Nutrition Surveillance System
Pregnancy Nutrition Surveillance System
Project on Devolution and Urban Change
School Lunch and Breakfast Cost Study
School Nutrition Dietary Assessment - II
State and Local Area Integrated Telephone Survey
Strong Heart Dietary Study
Studies of Welfare Leavers
Study of Latino Families and Early School Performance
Survey of Army Female Basic Trainees
Survey of Heights and Weights of American Indian School Children
WIC Infant Feeding Practices Study
46 • Effects of Food Assistance and Nutrition Programs on Nutrition and Health/FANRR-19-2 Economic Research Service, USDA

WIC Nutrition Education Assessment Study
WIC Participant and Program Characteristics Studies
Wisconsin Longitudinal Study
Youth Risk Behavior Surveillance System
Proprietary data
Ross Laboratories Mothers Survey
Mead-Johnson Longitudinal Study
Economic Research Service, USDA Effects of Food Assistance and Nutrition Programs on Nutrition and Health/FANRR-19-2 • 47

48 • Effects of Food Assistance and Nutrition Programs on Nutrition and Health/FANRR-19-2 Economic Research Service, USDA
Appendix B
Profiles of Principal and Potential Data Sources
Contents
Principal data sources
Consumer Expenditure Surveys (CES): Interview and Diary Surveys
Continuing Survey of Food Intakes by Individuals (CSFII 1994-96, 1998)
Current Population Survey (CPS) Food Security Supplement
Early Childhood Longitudinal Study — Kindergarten Cohort (ECLS-K)
National Food Stamp Program Survey (NFSPS, 1996-97)
National Health and Nutrition Examination Survey, Third Round (NHANES-III)
National Longitudinal Survey of Youth, 1979 Cohort (NLSY79)
National Longitudinal Survey of Youth—Mothers and Children (NLSY-MC)
Supplements (NLSY-MC) and National Longitudinal Survey of Youth—Young Adults(NLSY-YA)
National Survey of America’s Families (NSAF)
Panel Study of Income Dynamics and Child Development Supplement (PSID-CDS)
Survey of Income and Program Participation (SIPP)
Survey of Program Dynamics (SPD)
Potential data sources
Americans’ Changing Lives (ACL)
Medical Expenditure Panel Survey (MEPS)
National Health Interview Survey (NHIS)
National Household Education Survey (NHES)
National Longitudinal Study of Youth 1997 (NLSY97)
National Survey of Family Growth (NSFG)
Evaluation of the Comprehensive Child Development Program—Second Cohort(CCDP2)
Health and Retirement Study (HRS)
National Immunization Survey (NIS)
Pregnancy Risk Assessment Monitoring System (PRAMS)
Survey of Assets and Health Dynamics among the Oldest Old (AHEAD)
Behavior Risk Factor Surveillance System (BRFSS)
National Longitudinal Study of Adolescent Health (Add Health)
The next page starts the first profile in the Principal Sources category.

Economic Research Service, USDA Effects of Food Assistance and Nutrition Programs on Nutrition and Health/FANRR-19-2 • 49

50 • Effects of Food Assistance and Nutrition Programs on Nutrition and Health/FANRR-19-2 Economic Research Service, USDA

Economic Research Service, USDA Effects of Food Assistance and Nutrition Programs on Nutrition and Health/FANRR-19-2 • 51

52 • Effects of Food Assistance and Nutrition Programs on Nutrition and Health/FANRR-19-2 Economic Research Service, USDA

Economic Research Service, USDA Effects of Food Assistance and Nutrition Programs on Nutrition and Health/FANRR-19-2 • 53

54 • Effects of Food Assistance and Nutrition Programs on Nutrition and Health/FANRR-19-2 Economic Research Service, USDA

Economic Research Service, USDA Effects of Food Assistance and Nutrition Programs on Nutrition and Health/FANRR-19-2 • 55

56 • Effects of Food Assistance and Nutrition Programs on Nutrition and Health/FANRR-19-2 Economic Research Service, USDA

Economic Research Service, USDA Effects of Food Assistance and Nutrition Programs on Nutrition and Health/FANRR-19-2 • 57

58 • Effects of Food Assistance and Nutrition Programs on Nutrition and Health/FANRR-19-2 Economic Research Service, USDA

Economic Research Service, USDA Effects of Food Assistance and Nutrition Programs on Nutrition and Health/FANRR-19-2 • 59
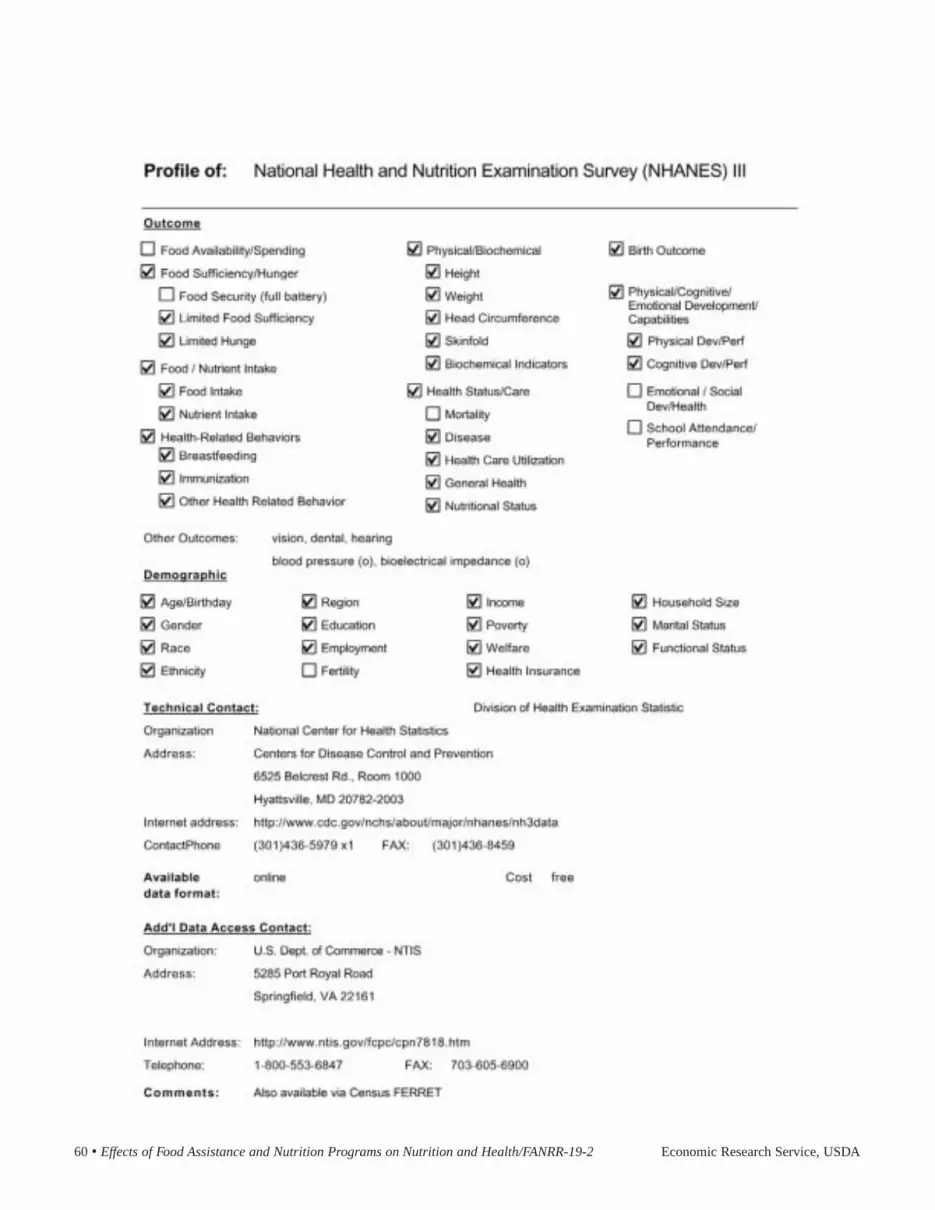
60 • Effects of Food Assistance and Nutrition Programs on Nutrition and Health/FANRR-19-2 Economic Research Service, USDA

Economic Research Service, USDA Effects of Food Assistance and Nutrition Programs on Nutrition and Health/FANRR-19-2 • 61
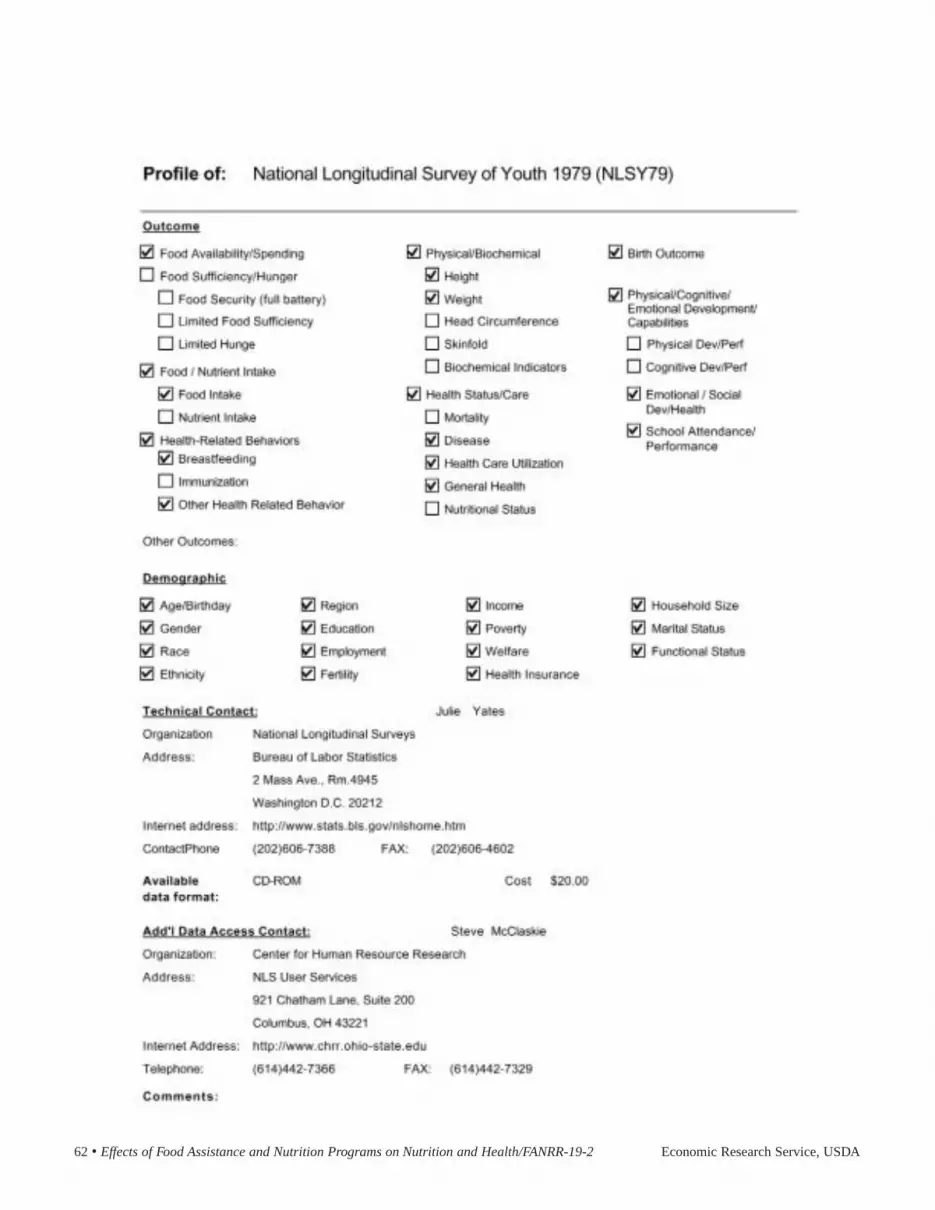
62 • Effects of Food Assistance and Nutrition Programs on Nutrition and Health/FANRR-19-2 Economic Research Service, USDA

Economic Research Service, USDA Effects of Food Assistance and Nutrition Programs on Nutrition and Health/FANRR-19-2 • 63

64 • Effects of Food Assistance and Nutrition Programs on Nutrition and Health/FANRR-19-2 Economic Research Service, USDA

Economic Research Service, USDA Effects of Food Assistance and Nutrition Programs on Nutrition and Health/FANRR-19-2 • 65

66 • Effects of Food Assistance and Nutrition Programs on Nutrition and Health/FANRR-19-2 Economic Research Service, USDA
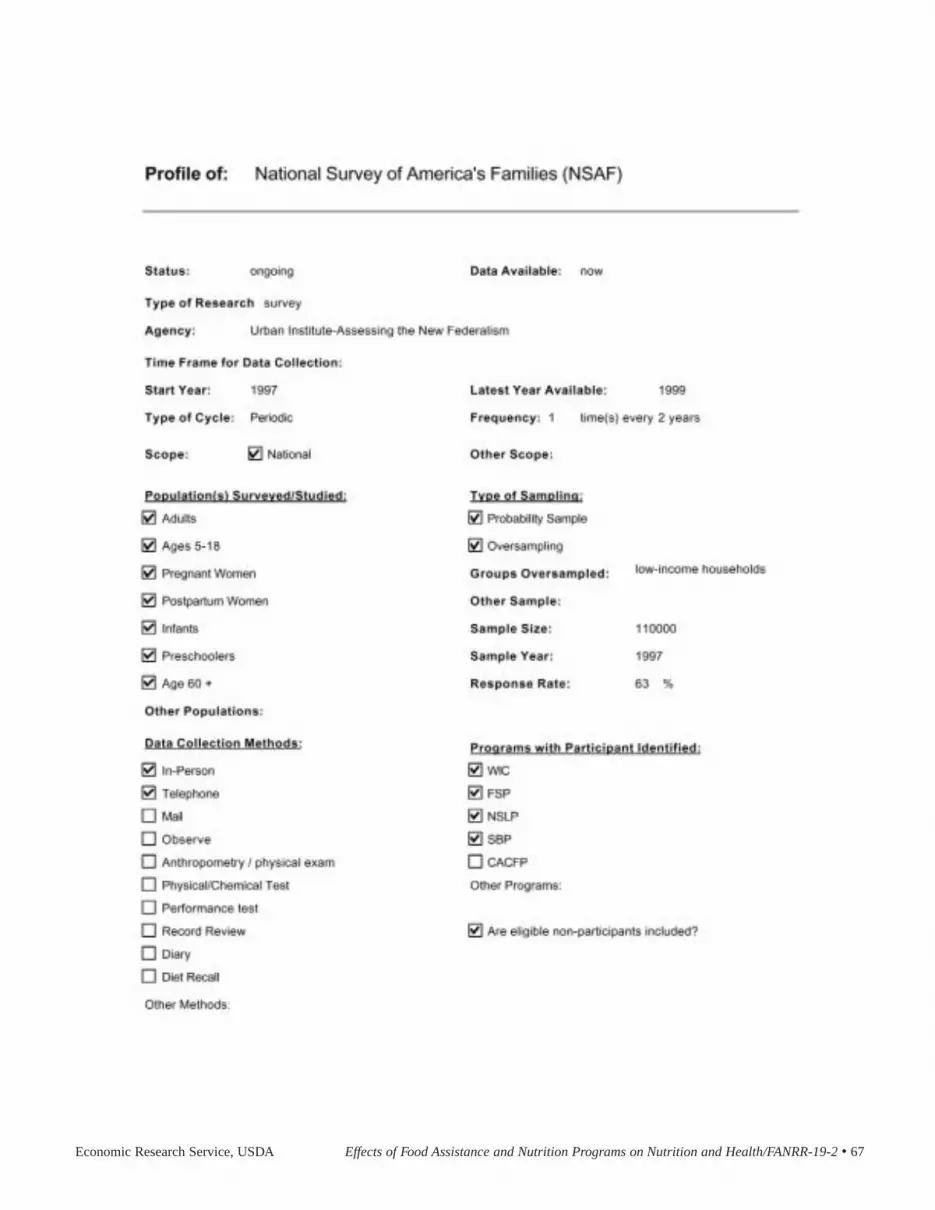
Economic Research Service, USDA Effects of Food Assistance and Nutrition Programs on Nutrition and Health/FANRR-19-2 • 67

68 • Effects of Food Assistance and Nutrition Programs on Nutrition and Health/FANRR-19-2 Economic Research Service, USDA

Economic Research Service, USDA Effects of Food Assistance and Nutrition Programs on Nutrition and Health/FANRR-19-2 • 69

70 • Effects of Food Assistance and Nutrition Programs on Nutrition and Health/FANRR-19-2 Economic Research Service, USDA

Economic Research Service, USDA Effects of Food Assistance and Nutrition Programs on Nutrition and Health/FANRR-19-2 • 71

72 • Effects of Food Assistance and Nutrition Programs on Nutrition and Health/FANRR-19-2 Economic Research Service, USDA

Economic Research Service, USDA Effects of Food Assistance and Nutrition Programs on Nutrition and Health/FANRR-19-2 • 73

74 • Effects of Food Assistance and Nutrition Programs on Nutrition and Health/FANRR-19-2 Economic Research Service, USDA

Economic Research Service, USDA Effects of Food Assistance and Nutrition Programs on Nutrition and Health/FANRR-19-2 • 75

76 • Effects of Food Assistance and Nutrition Programs on Nutrition and Health/FANRR-19-2 Economic Research Service, USDA

Economic Research Service, USDA Effects of Food Assistance and Nutrition Programs on Nutrition and Health/FANRR-19-2 • 77

78 • Effects of Food Assistance and Nutrition Programs on Nutrition and Health/FANRR-19-2 Economic Research Service, USDA

Economic Research Service, USDA Effects of Food Assistance and Nutrition Programs on Nutrition and Health/FANRR-19-2 • 79

80 • Effects of Food Assistance and Nutrition Programs on Nutrition and Health/FANRR-19-2 Economic Research Service, USDA

Economic Research Service, USDA Effects of Food Assistance and Nutrition Programs on Nutrition and Health/FANRR-19-2 • 81
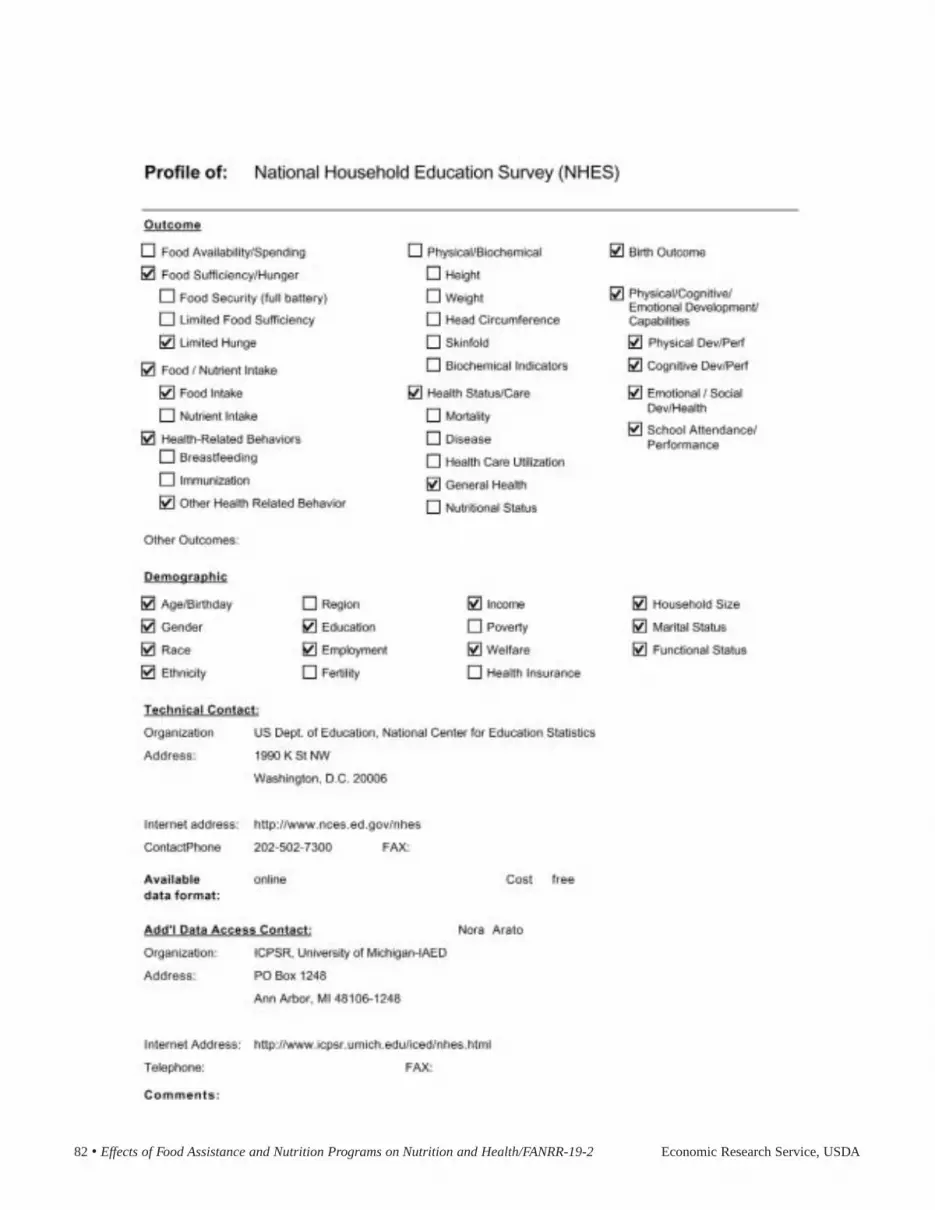
82 • Effects of Food Assistance and Nutrition Programs on Nutrition and Health/FANRR-19-2 Economic Research Service, USDA

Economic Research Service, USDA Effects of Food Assistance and Nutrition Programs on Nutrition and Health/FANRR-19-2 • 83

84 • Effects of Food Assistance and Nutrition Programs on Nutrition and Health/FANRR-19-2 Economic Research Service, USDA

Economic Research Service, USDA Effects of Food Assistance and Nutrition Programs on Nutrition and Health/FANRR-19-2 • 85
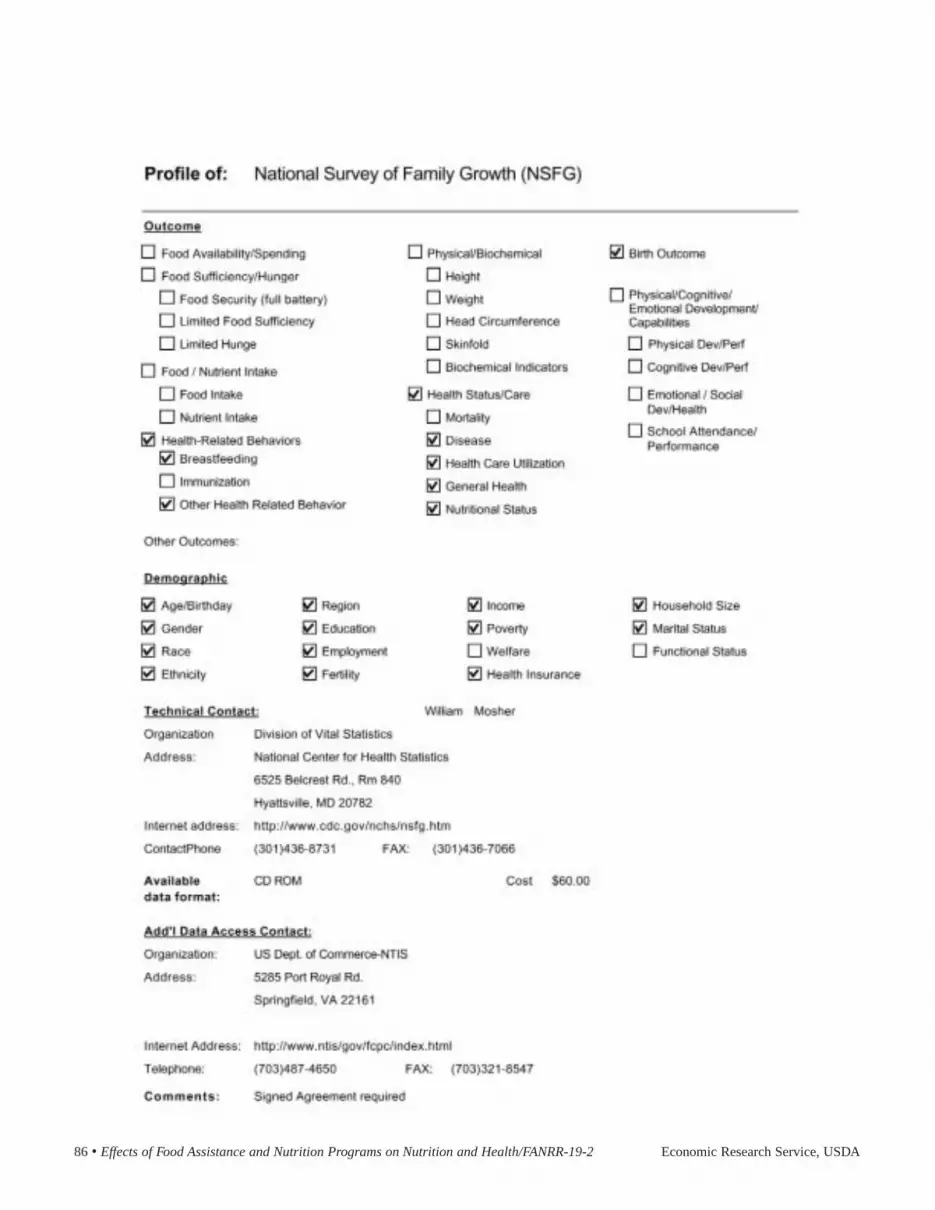
86 • Effects of Food Assistance and Nutrition Programs on Nutrition and Health/FANRR-19-2 Economic Research Service, USDA

Economic Research Service, USDA Effects of Food Assistance and Nutrition Programs on Nutrition and Health/FANRR-19-2 • 87

88 • Effects of Food Assistance and Nutrition Programs on Nutrition and Health/FANRR-19-2 Economic Research Service, USDA

Economic Research Service, USDA Effects of Food Assistance and Nutrition Programs on Nutrition and Health/FANRR-19-2 • 89

90 • Effects of Food Assistance and Nutrition Programs on Nutrition and Health/FANRR-19-2 Economic Research Service, USDA

Economic Research Service, USDA Effects of Food Assistance and Nutrition Programs on Nutrition and Health/FANRR-19-2 • 91

92 • Effects of Food Assistance and Nutrition Programs on Nutrition and Health/FANRR-19-2 Economic Research Service, USDA

Economic Research Service, USDA Effects of Food Assistance and Nutrition Programs on Nutrition and Health/FANRR-19-2 • 93

94 • Effects of Food Assistance and Nutrition Programs on Nutrition and Health/FANRR-19-2 Economic Research Service, USDA

Economic Research Service, USDA Effects of Food Assistance and Nutrition Programs on Nutrition and Health/FANRR-19-2 • 95

96 • Effects of Food Assistance and Nutrition Programs on Nutrition and Health/FANRR-19-2 Economic Research Service, USDA

Economic Research Service, USDA Effects of Food Assistance and Nutrition Programs on Nutrition and Health/FANRR-19-2 • 97

98 • Effects of Food Assistance and Nutrition Programs on Nutrition and Health/FANRR-19-2 Economic Research Service, USDA

Economic Research Service, USDA Effects of Food Assistance and Nutrition Programs on Nutrition and Health/FANRR-19-2 • 99

100 • Effects of Food Assistance and Nutrition Programs on Nutrition and Health/FANRR-19-2 Economic Research Service, USDA