effects of fish cage culture on water and
TRANSCRIPT
GHANA JOURNAL OF SCIENCEVOL. 60 1
EFFECTS OF FISH CAGE CULTURE ON WATER AND SEDIMENT QUALITY IN THE GORGE AREA
OF LAKE VOLTA IN GHANA: A CASE STUDY OF LEE FISH CAGE FARM
L. K. Osei*, R. AsmAh, s. AiKins And A.Y. KARiKARi (L. K. O., R. A. & A. Y. K.: CSIR -Water Research Institute, P. O. Box M. 32, Accra; S. A.:
Department of Theoretical and Applied Biology, Kwame Nkrumah University of Science and Technology, Kumasi, Ghana).
*Corresponding author’s email: [email protected]
GJS is an Open Access Journal and distributed under the terms of the Creative Commons (CC) License [CC BY 4.0]
https://dx.doi.org/10.4314/gjs.v60i1.1
Abstract The study determined the impacts of fish cage farming on the gorge area of Lake Volta. Water and sediment samples were collected from six sites in the Lee Cage Farm; four from sections with cages and two from about 1300 m upstream of the farm which served as the control. Water quality variables monitored were pH, temperature, dissolved oxygen, nitrate-nitrogen, ammonia-nitrogen, orthophosphate, faecal coliforms and total coliforms. Variables monitored in the sediment were organic matter, total carbon, total nitrogen and total phosphorus. There were variations in water quality between the farmed and control sites but the differences were not significant (p > 0.05). The mean counts of total coliform in the water ranged from 940 - 3318 cfu/100 ml while faecal coliforms ranged from 113 - 552 cfu/100 ml at the farmed site. The mean total coliform count at the control site ranged from 837 - 6960 cfu/100 ml while the faecal coliforms ranged from 48 - 120 cfu/100 ml. Therefore, there was significant variation between the faecal coliforms count at the two sites (p = 0.046). The results suggest that the general microbiological quality of the water at the study area was unacceptable.
Keywords: Cage culture, coliforms, gorge area, water quality, sediment quality
Introduction Major challenge faced by developing countries of which Ghana is no exception is the impact of aquaculture practices on the environment (FAO, 2006). High amount of discharges which include waste food and faeces, nutrients, medications and pesticides are released from cage farms. The impact of these effluents on the receiving environment depend largely on the quantity of waste discharged, the time period at which the discharge takes place, the ability of the environment to absorb the
discharges and the rate at which the receiving water body is able to flush the effluent (Masser, 2008). The sediments beneath the cages may be organically enriched, as a result the activity of the benthic organisms such as the microbes and macrofauna may be affected (Findlay et al., 1995). Environmental impacts associated with cage culture are primarily because production involves large input of high-quality artificial feeds to fish cages of which only a portion is consumed and assimilated by the cultured
Ghana J. Sci. 60 (1), 2019, 1 - 16
GHANA JOURNAL OF SCIENCE VOL. 602
species. This leads to large discharges of organic and inorganic wastes to the surrounding environment. The discharged organic wastes which has high levels of nitrogen (N) and phosphorus (P) have the ability to contaminate the waters and sediments beneath the cage farms causing local eutrophication, increased turbidity, loss of biodiversity and other impacts. The Lake Volta with its water quality and a consistent year round warm temperatures has a number of cage farms located on it in the Eastern and Volta regions of Ghana. The number of new commercial farms on the Volta Lake that are into intensive tilapia cage culture continue to increase at a fast rate whilst existing ones like Crystal Lake, Tropo Farms, West African Fish. Limited have expanded their operations. The Lake Volta has substantial number of fish farms without much management concerning water quality, waste and excess food therefore pose a risk of polluting the environment (Rao et al., 2012). There are currently five large farms and several small to medium sizes farms on the lake. The large ones are West African Fish Limited, Tropo Farms, Sunwoo Farms, Triton and Lee’s Farm, each producing between 165 to 5,000 tonnes of fish annually (Karikari et al., 2016). The gorge area of the Volta Lake had two of the large farms at the time of the study. These cage farms produce wastes (nitrogen and phosphorus) which are released in dissolved form into the water column and bottom sediments. High nutrient inputs (feed) is perceived to cause eutrophic conditions characterised by high phytoplankton blooms, high ammonia built up, high nitrite, low dissolved oxygen and high turbidity. Uneaten
feed and waste are discharged directly into the surrounding water. Islam (2005) reported that about 132 kg of nitrogen and 25 kg of phosphorus are discharged when a ton of fish is produced at the end of each culture period. Also, Gondwe et al. (2011) reported that about (81 - 90) % of carbon is released from cages into the recipient environment in tilapia cage culture; this could threaten the cultured fish (Effendie et al., 2005). Waste food and metabolic waste from the cage culture can also be an important source of organic matter and nutrient enrichment of the sediment. This enrichment often promotes the growth of microorganisms in the water and sediment. Since the studies conducted during the formation years of the Lake (Biswas, 1966, 1969; Entz, 1969), there has not been any consistent monitoring of the physico-chemical and bacteriological quality of this section of the Lake. Research by Ofori-Danson & Ntow (2005) and Karikari et al. (2013) on water quality of the lake were limited to the areas of Yeji and Kpong. Also work done by Ameworwor (2014) and Clottey (2014) was also restricted to stratum III of the Lake (Fig 1). It therefore becomes a challenge to establish trends in water quality since the proliferation of cage farms in the gorge area. This study looks at the possible effects of cage culture practices on the quality of water and sediment of the Volta Lake. The study was undertaken to determine the physical and chemical parameters of water and sediment samples at the farmed and control sites and also to determine the nutrient and bacteriological contents of water and sediment from the farmed and control sites.
GHANA JOURNAL OF SCIENCEVOL. 60 3
Experimental
Study site and sampling station The Volta Lake (Fig. 1) lies on latitude 6º 15’ N, 9º 10‘N and longitude 1º 30’ W, 0º 20‘E (Asmah et al., 2014). It is the largest man-made lake in the world by surface area (8,480 km2) and the world’s third largest by volume approximately 150 billion m3 (Béné, 2007). The Lake has a shoreline of 5,200 km and an
average depth of 18.8m. The deepest portions of the lake are about 90 m. The seasonal rise and fall is about 2.0 – 6.0 m and the areas covered by seasonal fluctuations are about 100,000 ha (Rurangwa et al., 2015). The study was carried out at Lee Farms located in the gorge area of the Volta Lake (Fig. 1). The main species cultured is the Nile tilapia (Oreochromis niloticus). The farm has been in operation since 2008. The farm has 66 cages
for grow out, 22 cages for fingerlings and 108 cages for broodstock. The size of a cage is (5x5x5) m3. The average stocking density (fingerling per cage) is 80 fish/m3.Total production per year is 200 - 300 tonnes. The fish are fed with extruded floating feed. The quantity of feed used per day is 1,750 kg. The average depth of the water at Lee Farms is 8 m. The area of the farm is 95,040 m2.
Fig. 1: Map of Ghana showing the study area.
GHANA JOURNAL OF SCIENCE VOL. 604
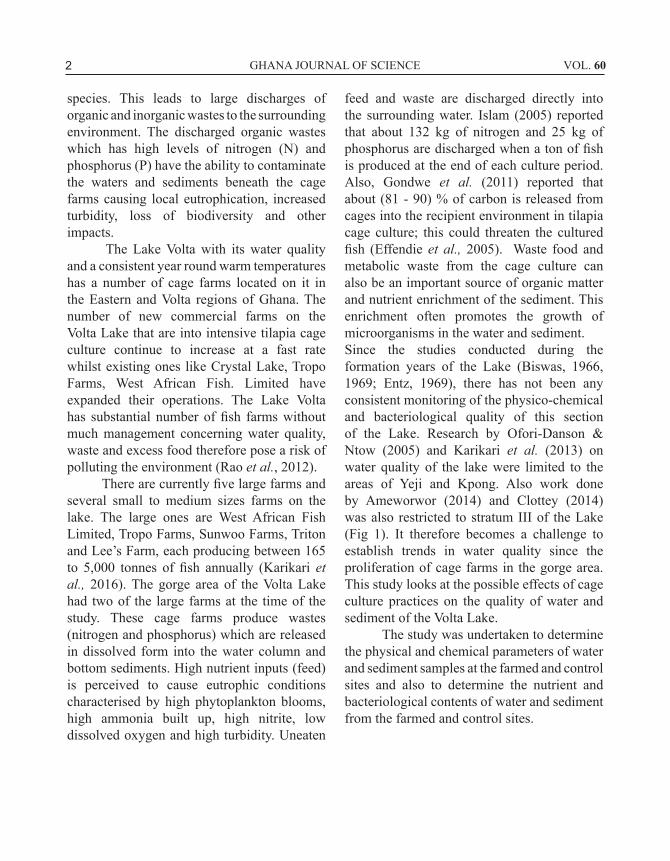
Sample collection Water and sediment samples were collected monthly from November 2014 to April, 2015 from six sampling points. The sampling stations were divided into two; four sampling points in the area where the fish cages were located and this served as the impacted site whiles the other two sampling points were located upstream in areas with no cages and this served as the control site. A total number of 108 samples were collected in the six-month period from the sampling sites.
Water quality determination Water samples were collected from a metre below the surface at each sampling site using a Van Dorn water sampler into pre-cleaned 1 L Nalgene sample bottles for the physico-chemical parameters. Samples for
Fig. 2: Map of the study area showing the sampling points.
bacteriological assessment were collected directly into 500 ml sterilized glass bottles for the bacteriological quality assessment. Each bottle was corked and labelled with full details of the site, time and date of collection and brought to the Council for Scientific and Industrial Research Water Research Institute (CSIR-WRI) laboratory in a cool box for analysis.
Laboratory analysis The following physico-chemical and bacteri-ological parameters were analysed; Dissolved oxygen, ammonia-nitrogen, nitrate-nitrogen, nitrite-nitrogen, electrical conductivity, total hardnesss, turbidity, alkalinity, chlorophyll-a, sulphate, phosphorus, total and faecal coliform bacteria of the water were determined month-ly. All water quality measurements and sam-
GHANA JOURNAL OF SCIENCEVOL. 60 5
ple collection were made between 09:00 and 14:00 hours GMT and analyzed using stan-dard methods for the examination of water and wastewater (APHA, 2012) Temperature, pH and dissolved oxygen were measured in situ using a multiparametric water quality analyser (Hach Hydrolab). Turbidity was measured using HACH 2100P turbidimeter.
Total hardness was measured using EDTA Titrimetric method. Nitrate was deter-mined using the Hydrazine Reduction Meth-od. Phosphate was determined by Stannous Chloride Method. Ammonium-Nitrogen was determined us-ing the Direct Nesslerization Method. Diazo-tization Method was used in the determination of nitrite-nitrogen. Total and faecal coliforms were determined by membrane filtration method using M-Endo-Agar Les (Difco) at 37oC and on MFC Agar at 44oC, respectively.
Sediment sampling and analysis Sediment samples were collected with an Ekman grab sampler from beneath the cages and at the control sites and put in plastic bags, sealed, preserved on ice and transported to the laboratory for analyses. Parameters determined were total phosphorus, total organic carbon, total nitrogen and total organic matter. The Walkley-Black procedure was used for organic carbon determination. Total phosphorus was determined by spectrophotometery (Cary 1E, 880 nm). The Kjeldahl procedure was used to
determine total nitrogen. Total organic matter was determined by loss on ignition.
Statistical analysis The data collected were analysed using Sta-tistical Package for Social Scientist (SPSS) version 20. Descriptive statistics was used to determine the mean, range and standard devi-ation for the various parameters. Student t-test was used to test for the level of significance. A probability value of 5% was assumed.
Results and Discussion
Fish cage culture impact on water quality The water quality at the farmed and control sites were within ranges observed by previous studies on the Volta Lake. The mean water temperature at the farmed site was 29.03oC and that at the control site was 29.29oC (Table 1) showing very minimal variation. The values obtained were similar to those obtained by TICOMFE (2011) and Asase (2013). They reported mean temperatures of 27.7oC and 28.42oC respectively. Also comparable to this study are findings of Ameworwor (2014) and Clottey (2014) who observed temperatures of 25.66oC to 29.06oC at the farmed sites and 26.20oC to 29.30oC at control sites respectively. All biological and chemical processes in an aquaculture operation are influenced by temperature (Devi et al., 2017).
GHANA JOURNAL OF SCIENCE VOL. 606
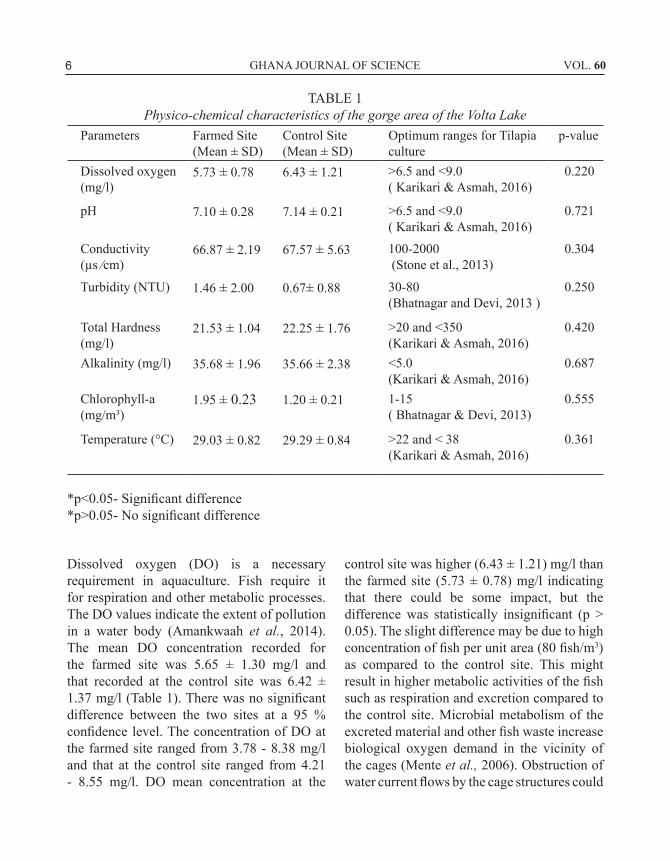
TABLE 1 Physico-chemical characteristics of the gorge area of the Volta Lake
Parameters Farmed Site (Mean ± SD)
Control Site (Mean ± SD)
Optimum ranges for Tilapia culture
p-value
Dissolved oxygen (mg/l)
5.73 ± 0.78 6.43 ± 1.21 >6.5 and <9.0 ( Karikari & Asmah, 2016)
0.220
pH 7.10 ± 0.28 7.14 ± 0.21 >6.5 and <9.0 ( Karikari & Asmah, 2016)
0.721
Conductivity (µs ⁄cm)
66.87 ± 2.19 67.57 ± 5.63 100-2000 (Stone et al., 2013)
0.304
Turbidity (NTU) 1.46 ± 2.00 0.67± 0.88 30-80 (Bhatnagar and Devi, 2013 )
0.250
Total Hardness (mg/l)
21.53 ± 1.04 22.25 ± 1.76 >20 and <350 (Karikari & Asmah, 2016)
0.420
Alkalinity (mg/l) 35.68 ± 1.96 35.66 ± 2.38 <5.0 (Karikari & Asmah, 2016)
0.687
Chlorophyll-a (mg/m³)
1.95 ± 0.23 1.20 ± 0.21 1-15 ( Bhatnagar & Devi, 2013)
0.555
Temperature (°C) 29.03 ± 0.82 29.29 ± 0.84 >22 and < 38 (Karikari & Asmah, 2016)
0.361
*p<0.05- Significant difference *p>0.05- No significant difference
Dissolved oxygen (DO) is a necessary requirement in aquaculture. Fish require it for respiration and other metabolic processes. The DO values indicate the extent of pollution in a water body (Amankwaah et al., 2014). The mean DO concentration recorded for the farmed site was 5.65 ± 1.30 mg/l and that recorded at the control site was 6.42 ± 1.37 mg/l (Table 1). There was no significant difference between the two sites at a 95 % confidence level. The concentration of DO at the farmed site ranged from 3.78 - 8.38 mg/l and that at the control site ranged from 4.21 - 8.55 mg/l. DO mean concentration at the
control site was higher (6.43 ± 1.21) mg/l than the farmed site (5.73 ± 0.78) mg/l indicating that there could be some impact, but the difference was statistically insignificant (p > 0.05). The slight difference may be due to high concentration of fish per unit area (80 fish/m3) as compared to the control site. This might result in higher metabolic activities of the fish such as respiration and excretion compared to the control site. Microbial metabolism of the excreted material and other fish waste increase biological oxygen demand in the vicinity of the cages (Mente et al., 2006). Obstruction of water current flows by the cage structures could
GHANA JOURNAL OF SCIENCEVOL. 60 7
also lead to minimised water exchange hence the lower DO concentrations at the farmed site. The values recorded for the farmed and control sites in this study were similar to findings by Antwi & Ofori Danson (1993) who recorded 7.78 mg/l at the Kpong area of the Lake and TICOMFE (2011) which recorded 5.08 mg/l-8.64 mg/l in the gorge area of the Volta Lake. Similar to this study, Clottey (2014) recorded DO levels ranging from 5.21 to 9.0 mg/l at farmed sites and 4.51 to 8.84 mg/l at control sites on the Lake Volta.
The pH values recorded for both monitoring sites were about neutral. The values for the farmed and control sites were 7.09 and 7.14 respectively (Table 1). The pH values were within levels typical of most natural waters i.e. 6.0 to 8.5; and that set by the European Union (EU) for fisheries and aquaculture environment of 6 to 9 (Chapman, 1992). Statistically, there was no significant variations in pH values between the two sites (p > 0.05). The slight drop in pH at the farmed site may be due to waste decomposition from the fish farm (Pitta et al., 1999) and extraction of DO in respiration by higher number of fish in the cage area. pH levels observed in this study at both sites were similar to findings by Asase (2013) who recorded a pH value of 7.70 in the Volta lake in Akosombo. It is also comparable to findings of Karikari et al. (2013) who recorded 6.80 and 7.50 at Kpong and Yeji sections of the Volta Lake.
Electrical conductivity (EC) is the numerical expression of an aqueous solution to carry electrical current and is a useful indicator of the mineralization in a water sample (Jain et al., 2005), and it also gives an account of all the dissolved ions in solution. The conductivity values recorded for farmed site was 66.87 μs/cm and that of the control site was 67.57 μs/cm. Variations between the two stations were
not significant at a 95% confidence level (p>0.05). These values were comparable with observations by Clottey (2014) who recorded 56.68 μs/cm at the Kpeve section of the Volta lake, and Antwi & Ofori-Danson (1993 ) 62.0 - 77.5 µs/cm at Kpong., the low conductivity values confirms the low ionic content of the Volta Lake (Karikari et al., 2013). According to Clottey et al. (2016), the low ionic content of the Volta Lake which indicates its low conductivity makes it favourable for the growth of aquatic life. Turbidity reflects the existence of dissolved and suspended organic and inorganic materials and also plankton and other microorganisms. Turbidity values for the farmed and control sites respectively ranged from 0.00 - 5.00 NTU with a mean value of 1.46 ± 2.00 NTU and 0.00 - 2.00 with mean 0.67 ± 0.88 NTU, indicating that turbidity was relatively higher at the farmed site but like other parameters, the difference was not significant (p > 0.05). The slightly higher turbidity at the farmed site could be associated with excess feed, fish faeces as well as fouling and debris removed from the cage nets at the farmed site (Nyanti et al., 2012). Increased turbidity can affect the penetration of light thereby impeding photosynthesis by phytoplankton and other vegetation in the water column (Harrison et al., 2005; Cole, 2002). High turbidity reduces the productivity of fish, clog filters and injure fish gills (WRC, 2003). The values observed are consistent with the observations of Asmah et al. (2014) who had values ranging from 1.55 to 6.91 NTU in stratum II of the Volta Lake. Clottey (2014) and Ameworwor (2014) also observed slightly high levels of turbidity at farmed sites with mean values of 3.38 ± 0.60 NTU and 2.46 ± 0.52 NTU compared to control sites values of 3.00 ± 0.60 NTU and 2.11 ± 0.64 NTU mg/l.
GHANA JOURNAL OF SCIENCE VOL. 608
Calcium and magnesium ions result in hardness. Total hardness plays key role in aquaculture. The total hardness values observed for both sites were similar. The minimum value for total hardness at the farm site was 20.45 mg/l and the maximum value was 23.10 mg/l. The minimum value for the control site was 19.50 mg/l and the maximum was 24.90 mg/l. These values were consistent with findings of Asmah et al. (2014) who obtained minimum and maximum values of 22 mg/l and 24 mg/l respectively confirming the soft nature of the Volta Lake (19 – 38 mg/l CaCO3) (Ofori-Danson & Antwi, 1994). The values observed in this study were within the range of 20 to 100 mg/l considered suitable for aquaculture (CSIR-WRI, 2003).
Alkalinity for both farmed and control sites during the period of study were similar
ranging from 33.00 - 38.80 mg/l with mean values 35.68 ± 1.96 mg/l and 33.40 - 39.60 mg/l with mean 35.66 ± 2.38 mg/l respectively. However, the alkalinity of the control site was slightly higher than the farmed site but variation between them was not significant (p>0.05). The values recorded were slightly higher but comparable to findings by Asase (2013) who had mean value of 28.50 ± 0.04 mg/l on the Volta Lake in Akosombo. When compared with the values of 34 - 52 mg/l showed by Abdul-Razak et al. (2009) in the Oti arm of the Volta Lake, alkalinity values during this study was lower. Samah (2012) also recorded alkalinity values of 12.68 - 16.05 mg/l in the Asukawkaw River. Alkalinity values more than 20 mg/l in water is recommended for good tilapia culture (Lucas & Southgate, 2012)
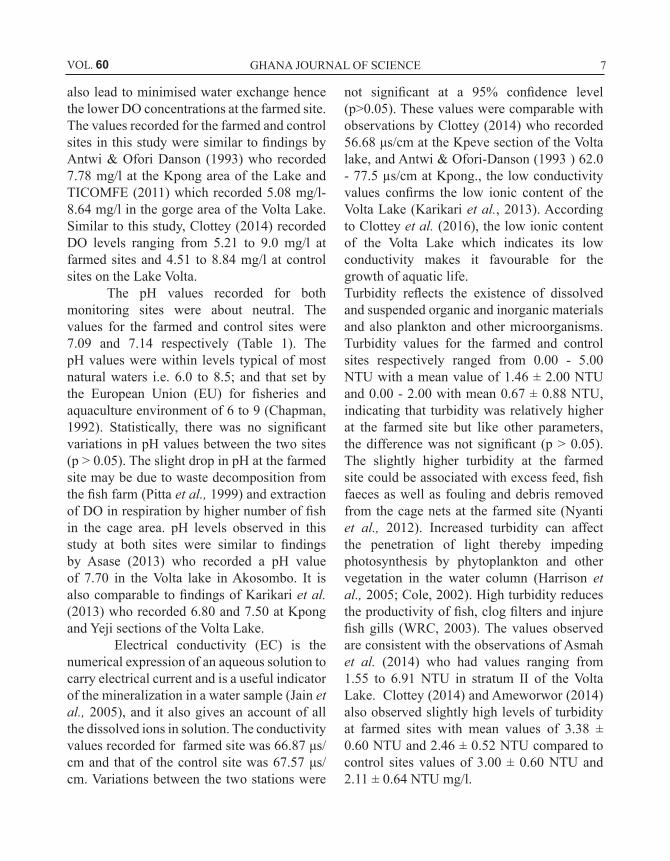
TABLE 2 Nutrient concentration of the Volta Lake from November, 2014 to April, 2015.
Parameter Farmed Site (Mean ± SD)
Control Site (Mean ± SD )
Optimum ranges for Tilapia culture
p-value
Nitrate (mg/l) 0.04 ± 0.03 0.05 ± 0.04 <10.0 /l (Karikari & Asmah, 2016)
0.983
Nitrite (mg/l) 0.01± 0.01 0.01± 0.01 < 0.10 (Karikari & Asmah, 2016)
0.659
Ammonia (mg/l)
0.22± 0.16 0.32 ± 0.13 < 5.0 (Karikari & Asmah, 2016)
0.600
Phosphate (mg/l)
0.09 ± 0.05 0.13± 0.06 < 1.5 (Karikari & Asmah, 2016)
0.628
Sulphate (mg/l) 2.90± 0.77 2.98± 0.85 < 500 (Karikari & Asmah, 2016)
0.749
*p < 0.05- Significant difference *p > 0.05- No significant difference
GHANA JOURNAL OF SCIENCEVOL. 60 9
Nitrate-nitrogen is an important nutrient for the growth of plants in the water. In an aerobic situation, the protein will be broken down by microorganisms into ammonia which later in the nitrification process will be oxidized into nitrate. The concentrations of nitrate-nitrogen for both the control and farmed site ranged from 0.02 - 0.12 mg/l and 0.00 - 0.09 mg/l. The difference between the two sites when tested statistically was not significant (p>0.05). The concentrations of nitrate-nitrogen recorded for both farmed and control sites were very low (0.04 and 0.05 mg/l respectively) compared to observations from earlier studies by Samah (2012) who recorded nitrate levels ranging from 0.96 - 0.12 mg/l in the Asukawkaw river. Higher results have, however been reported for other sections of the Lake; Karikari et al. (2013) recorded nitrate concentrations of 0.29 - 1.70 mg/l at Yeji upstream in the riverine section of the Volta Lake. Similar means of nitrite-nitrogen concentrations were recorded for both sites. The nitrite nitrogen levels in this study ranged from 0.00 - 0.02 mg/l with mean value 0.01 ± 0.01 mg/l at the farmed site and 0.00 - 0.01 mg/l with mean value 0.01 ± 0.01 mg/l at the control site. These results agree with Stirling & Dey (1990) who observed no difference in nitrite levels between farmed and control stations. Asmah et al. (2014) reported nitrite-nitrogen levels of 0.005 to 0.115 mg/l with a mean value of 0.035 mg/ in stratum II of the Volta Lake. Nyanti et al. (2012) reported that the nitrite concentration at cage stations was higher than control due to the contribution from fish waste and excess feed. It is found that increasing pH, low dissolved oxygen and high ammonia can increase its toxicity (Devi et al., 2017).
The concentrations of phosphate-phosphorus ranged between 0.00 - 0.15 mg/l with mean values 0.09 ± 0.05 mg/l at the farmed
site and 0.06 - 0.23 mg/l with mean value 0.13 ± 0.06 mg/l at control site. Phosphate-phosphorus concentrations at the farmed site were lower (0.09 mg/l) than the control site (0.13 mg/l). Comparatively, the difference between both sites was not significant (p > 0.05). Phosphate-phosphorus is not harmful at low concentrations but becomes harmful at higher levels thus higher doses of phosphate tend to interrupt digestion in both humans and animals (Samah, 2012). The phosphate concentrations in this study was within the range obtained by Clottey et al. (2016) which ranged from 0.057 - 0.291 mg/l in stratum II of the Volta Lake. The phosphate levels observed in this study was also similar to Ameworwor (2014) who recorded 0.057 - 0.29 mg/l and 0.029-0.43 mg/l at both farmed and control sites respectively. Santos et al. (2012) reported that the acceptable value of phosphorus was 0.025 mg/l for Nile Tilapia.
Ammonia-nitrogen concentrations for the farmed and control sites varied from 0.00 - 0.39 mg/l with mean value 0.22 mg/l and 0.12 - 0.47 mg/l with mean value 0.32 mg/l. Concentrations of ammonia-nitrogen at the farmed site was quite higher than the control site. At 95% confidence level, the difference between both sites was not significant (p > 0.05). The mean ammonia-nitrogen levels in this study (Table 2) was low which is consistent with findings of Antwi & Ofori-Danson (1994) in the Kpong Reservoir with mean of 0.02 mg/1 and varying between < 0.001 and 0.12 mg/l. At Akuse, CSIR-WRI (1999) reported a mean of 0.21 mg/l ammonia with range of 0.193–0.227 mg/l. Also TICOMFE (2011) observed values of 0.01 - 0.05mg/l in the gorge area. According to Chapman (1992), waters that are not contaminated have little levels of ammonia normally smaller than 0.1 mg/l. Clottey et al. (2016) also observed
GHANA JOURNAL OF SCIENCE VOL. 6010
low ammonianitrogen levels at both farmed (<0.001 - 0.444) and control (<0.001 - 0.242) sites. The concentrations of ammonia-nitrogen in the study site during the study period was not alarming which may be due to low anthropogenic activities reaching the area. Sulphate is widely distributed in nature and may be present in natural waters in concentrations ranging from a few to several thousand milligrams per liter (APHA, 2012). Mean monthly concentration of sulphate for the farmed site was 2.00 - 4.00 mg/l and that of the control site was 1.79 - 4.35 mg/l for the study period. Samah (2012) observed sulphur–sulphate levels ranging from 6.33 - 51.30 mg/l in the Asukawkaw River. Also, Ameworwor (2014) observed Sulphate levels of 0.43-5.14 mg/l at farmed sites in stratum II of the Volta Lake. The level of Sulphate in our study was slightly higher at the control site than the farmed site and this could be due to the discharge of industrial wastes and domestic sewage which tend to increase its concentration. However, the difference between both sites was not significant (p > 0.05). Sulphates, when added to water, tend to accumulate to progressively increasing concentration (WRC, 2003). Chlorophyll-a recorded at the farmed and control sites were 1.95 mg/m3 and 1.20 mg/m3 respectively. Chlorophyll-a levels at the farmed site was higher than the control sites. Although the p-value for the test between the two sites was not significant (p > 0.05), chlorophyll-a concentration at the farmed site was higher 1.95 mg/m3 giving indication of some impact
by the fish farm. This is similar to findings of Ameworwor (2014) who also observed slightly higher concentration of chlorophyll-a at cage sites. The increase in concentration of chlorophyll-a at the cage station may be due to fish excretion and excess fish feed as the nutrients from the excess feed and fish waste provided the necessary nutrients of nitrogen and phosphorus for algal bloom (Nyanti et al., 2012). Similar to this study, Demirak et al. (2006) observed no difference in chlorophyll- a level at 7 cage farms in Turkey when compared to control sites.
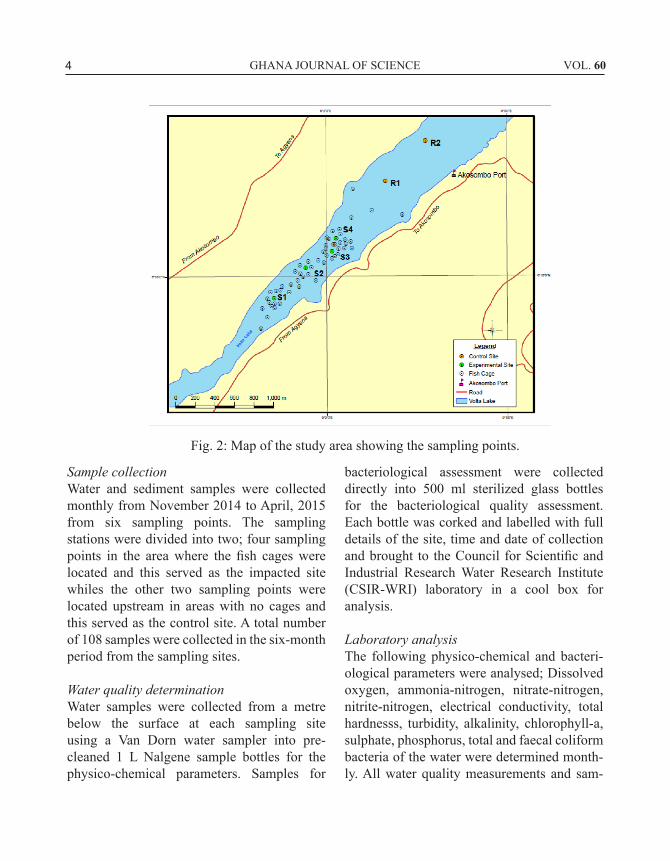
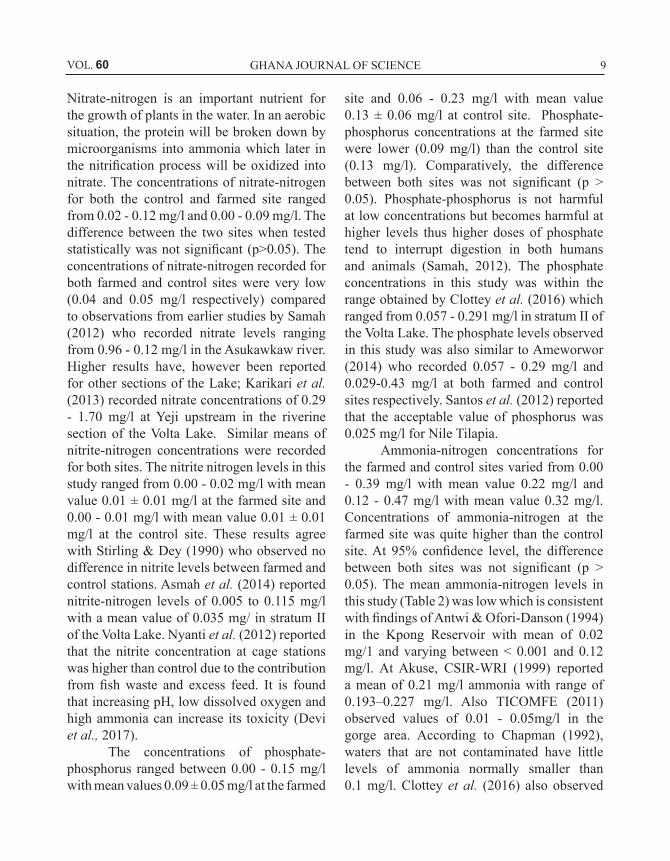
Microbiological quality of the study area The mean monthly counts of total coliform for the farmed site ranged between 940 - 3318 cfu/100 ml and that of the control site was 837 - 6960 cfu/100 ml (Fig. 3). Variations between the two sites was not significant (P > 0.05). The TC recorded in this study was similar to values observed by Abdul-Razak et al. (2009) who recorded TC levels ranging from 770 - 8820 cfu/100 ml. The high TC counts observed at the control site in this study may be due to anthropogenic activities such as tourism and sewage from the villages around the area. The people living along the lake depend on it for domestic purposes and a means of recreation such as swimming. The counts were above the Water Resources Commission recommended limit of <1000cfu/100 ml of total coliforms for aquaculture. Clottey et al. (2016) also observed TC levels of 132 - 1708 cfu/100 ml in stratum II of the Volta Lake.
GHANA JOURNAL OF SCIENCEVOL. 60 11
Fig. 3: Mean counts of bacteria concentration of the water at the control and farmed sites
The counts of faecal coliform bacteria at the farmed site was significantly higher than the control site (P = 0.046). The faecal coliforms varied between 113 - 552 cfu/100 ml at the farmed site and 48 - 120 cfu/100 ml at the control site. This indicates that the microbiological quality of the water at the study area, as shown by counts of faecal coliform, were unusually high. The counts were above the Water Resources Commission (WRC) recommended limit of <10 cfu/100 ml for faecal coliforms for aquaculture. The increase in coliform numbers recorded in the gorge area of the Volta Lake depicts the cultivation of fish in net cages which requires the use of large quantity of alimentary inputs resulting in a discharge of large amounts of
Fig. 3: Mean counts of bacteria concentration of the water at the control and farmed sites
0
500
1000
1500
2000
2500
3000
Total Coliform Faecal Coliform
Bac
teria
Cou
nts /
cfu
/ 10
0 m
l
Coliform Type
ControlFarmed
alimentary residues to the environment which can influence the microbiological quality of water (Gorlach-Lira et al., 2013) Also the high temperature of the water observed in the gorge area and the neutral and alkaline pH are favourable for the growth of bacteria (Gorlach-Lira et al., 2013). Such conditions were observed in this study where the water temperature ranged from 27.3 - 30.55oC and the majority of samples showed a pH of over 7.00 during the period of study.
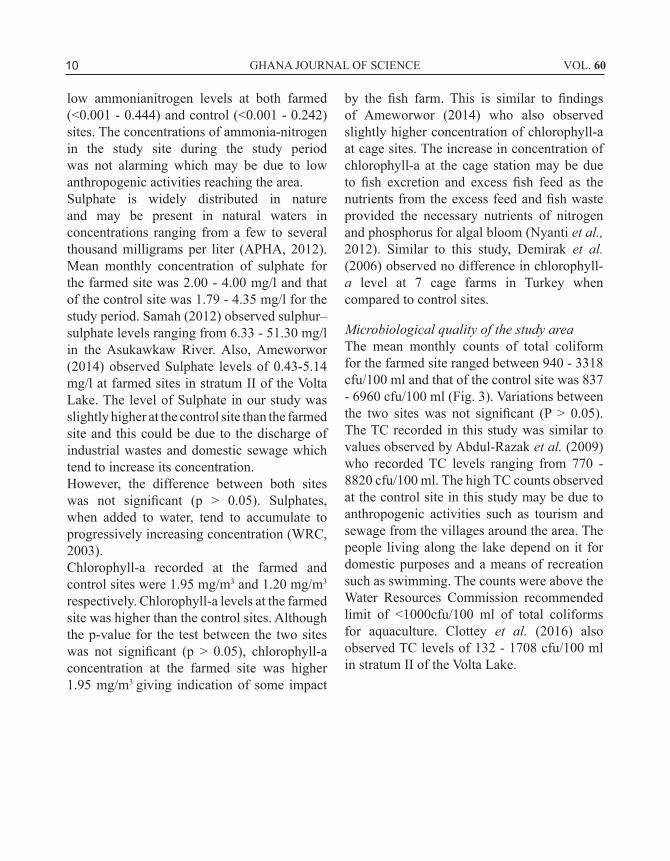
Sediment quality of the gorge area of the Volta Lake An important feature of impact of cage farm is increased levels of organic carbon in the sediment. Mean monthly concentrations of Total Organic Carbon (TOC) recorded at the farmed and control sites ranged from (0.22 - 4.27) % and (0.35 - 4.56) % (Fig. 4) with overall mean values of (1.27 ± 0.39) % and (2.13 ± 1.18) % respectively. Similar range of values were observed by Temporetti et al. (2001) in the sediment of a salmon cage culture facility. The authors reported values of 0.2% to 5.3%. The TOC values for both sites were generally low and the difference in mean values was not significant (p > 0.05). The concentration at the control site was, however, higher than that at the farmed site which is quite contrary to findings by Hargrave et al. (1997) who found TOC levels at a cage station in Canada to be 40% higher.
GHANA JOURNAL OF SCIENCE VOL. 6012
0
50
100
150
200
250
300
350
400
450
Total Coliform Faecal Coliform
Bac
teria
Cou
nts /
cfu
/ 100
ml
Coliform Type
ControlFarmed
Fig. 4: Mean levels of nutrients in the sediment at the farmed and control sites.
TOC: Total Organic Carbon TON: Total Organic Matter TP: Total Phosphorus The Total Organic Matter (TOM) content at the control site was marginally higher than the farmed site. Mean values for the farmed and control sites were (2.54 ± 0.98) % and (3.92 ± 2.07) % respectively. TOM is an estimation of the content of organic matter contents in the bottom sediments and for aquaculture its levels is determined by the cultured organisms, method of culturing, the type of feed used, and management practices (Wu, 1995). It is likely that the water current velocity was enough to distribute the solid waste thereby minimizing the accumulation of TOM in the sediment at the farmed site and its environs.
Total Nitrogen concentrations at the farmed and control sites were (0.02 - 0.37) % and (0.03 - 0.39) (%) respectively. The variation between the two sites was not significant (p > 0.05).The concentrations of nitrogen increase in sediments under fish farms due to organic materials that settle at
0
5
10
15
20
25
30
35
40
TOC TOM Nitrogen TP
Nut
rient
leve
ls (%
)
Nutrient Type
ControlFarmed
the bottom. The cultured organisms release nitrate and nitrite which are as a result of the breakdown of waste and excess or uneaten feed. The mean total nitrogen levels observed in this study for both farmed and control sites were similar (0.12 ± 0.05) % and (0.19 ± 0.01) % respectively. The level of Total Phosphorus concentration in the sediment during the entire period ranged from (22.50 - 54.34) % and (25.62 - 38.50) % at the farmed and control sites respectively. The mean concentration at the farmed site was quite higher (35.51 ± 4.05) % than at the control site (32.20 ± 3.58) % which indicates a possible contribution from the cage farm. However, the difference was not significant (p>0.05). Total Phosphorus (TP) in the form of fish faeces and uneaten food is released beneath aquaculture sites and it is an indicator of fish farm impact (Apostolaki et al., 2007). The fish cages mainly contributed to the increase in phosphorus levels at the farmed site, which were largely provided by the release of nitrogen and phosphorus obtained from uneaten feed, faeces and urine (Kibria et al., 1998). Similar to this study, Phillips et al. (1994) observed that more than 85% of phosphorus used is lost into the cage and the recipient waters.
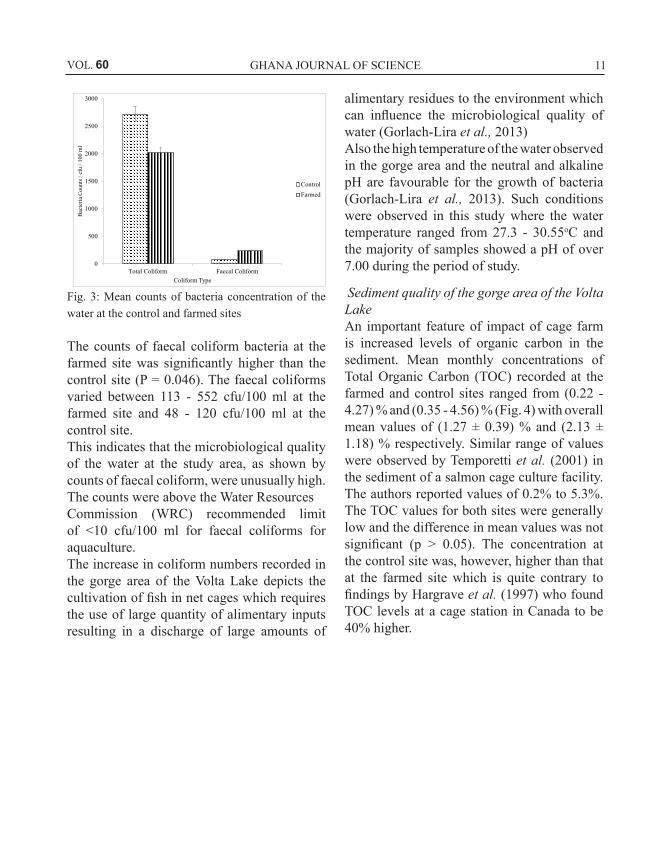
Fig. 5: Mean counts of bacteria in the sediment at the farmed and control sites.
GHANA JOURNAL OF SCIENCEVOL. 60 13
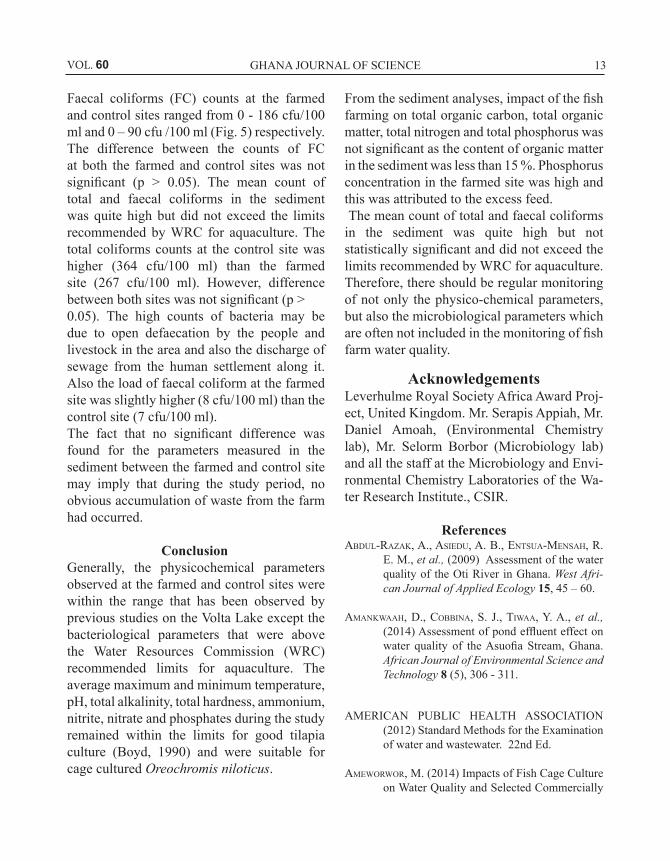
Faecal coliforms (FC) counts at the farmed and control sites ranged from 0 - 186 cfu/100 ml and 0 – 90 cfu /100 ml (Fig. 5) respectively. The difference between the counts of FC at both the farmed and control sites was not significant (p > 0.05). The mean count of total and faecal coliforms in the sediment was quite high but did not exceed the limits recommended by WRC for aquaculture. The total coliforms counts at the control site was higher (364 cfu/100 ml) than the farmed site (267 cfu/100 ml). However, difference between both sites was not significant (p > 0.05). The high counts of bacteria may be due to open defaecation by the people and livestock in the area and also the discharge of sewage from the human settlement along it. Also the load of faecal coliform at the farmed site was slightly higher (8 cfu/100 ml) than the control site (7 cfu/100 ml). The fact that no significant difference was found for the parameters measured in the sediment between the farmed and control site may imply that during the study period, no obvious accumulation of waste from the farm had occurred.
Conclusion Generally, the physicochemical parameters observed at the farmed and control sites were within the range that has been observed by previous studies on the Volta Lake except the bacteriological parameters that were above the Water Resources Commission (WRC) recommended limits for aquaculture. The average maximum and minimum temperature, pH, total alkalinity, total hardness, ammonium, nitrite, nitrate and phosphates during the study remained within the limits for good tilapia culture (Boyd, 1990) and were suitable for cage cultured Oreochromis niloticus.
From the sediment analyses, impact of the fish farming on total organic carbon, total organic matter, total nitrogen and total phosphorus was not significant as the content of organic matter in the sediment was less than 15 %. Phosphorus concentration in the farmed site was high and this was attributed to the excess feed. The mean count of total and faecal coliforms in the sediment was quite high but not statistically significant and did not exceed the limits recommended by WRC for aquaculture. Therefore, there should be regular monitoring of not only the physico-chemical parameters, but also the microbiological parameters which are often not included in the monitoring of fish farm water quality.
Acknowledgements Leverhulme Royal Society Africa Award Proj-ect, United Kingdom. Mr. Serapis Appiah, Mr. Daniel Amoah, (Environmental Chemistry lab), Mr. Selorm Borbor (Microbiology lab) and all the staff at the Microbiology and Envi-ronmental Chemistry Laboratories of the Wa-ter Research Institute., CSIR.
References AbduL-RAzAK, A., Asiedu, A. b., entsuA-mensAh, R.
e. m., et al., (2009) Assessment of the water quality of the Oti River in Ghana. West Afri-can Journal of Applied Ecology 15, 45 – 60.
AmAnKwAAh, d., CObbinA, s. J., tiwAA, Y. A., et al., (2014) Assessment of pond effluent effect on water quality of the Asuofia Stream, Ghana. African Journal of Environmental Science and Technology 8 (5), 306 - 311.
AMERICAN PUBLIC HEALTH ASSOCIATION (2012) Standard Methods for the Examination of water and wastewater. 22nd Ed.
AmewORwOR, m. (2014) Impacts of Fish Cage Culture on Water Quality and Selected Commercially
GHANA JOURNAL OF SCIENCE VOL. 6014
Important Fish Stocks in Volta Lake (Stratum II). (Mphil. Thesis). Department of Marine and Fisheries Sciences, University of Ghana, Legon.118pp.
Antwi, L. A. K. & OfORi-dAnsOn, P. K. (1993) Lim-nology of a tropical reservoir in Ghana. Tropi-cal Ecology 34, 75 – 87.
APOstOLAKi, e. t., tsAgARAKi, t., tsAPAKi, m., et al., (2007). Fish farming impact on sediments and macrofauna associated with seagrass mead-ows in the Mediterranean. Estuarine, Coastal and Shelf Science 75, 408 - 416.
AsAse, A. (2013) Effects of Stocking Density on the Production of Nile Tilapia (Oreochromisni-loticus) in Floating Net Cages on the Volta Lake. (M.Phil. Thesis).Department Of Ma-rine and Fisheries Sciences, University Of Ghana, Legon. 125pp.
AsmAh, R., KARiKARi, A. Y., AbbAn, e. K., et al., (2014). Cage Fish Farming in the Volta Lake and the Lower Volta: Practices and Potential Impacts on Water Quality. Ghana Journal of Science 54, 34 - 37.
béné, C. (2007) Diagnostic study of the Volta Basin fisheries Part 1 - Overview Of The Volta Basin Fisheries Resources. Report commissioned by the Focal Basin Project –Volta. WorldFish Center Regional Offices for Africa and West Asia, 31pp, Cairo Egypt.
bhAtnAgAR, A. & devi, P. (2013) Water quality guide-lines for the management of pond fish culture. International Journal of Environmental Sci-ences 3, 6.
biswAs, s. (1966) Ecological studies of phytoplankton in the newly forming Volta Lake of Ghana. Journal of the West African Science Associa-tion 11, 14 - 19.
biswAs, e. R. i. (1969). Some microbiological obser-vations on the Volta Lake. Ghana Journal of Science 9, 21 - 29.
bOYd, C. (1990) Water quality in ponds for aquacul-ture. Union Springs, AL: Agriculture Experi-ment Station, Auburn University.
ChAPmAn, d. (1992) Water Quality Assessment; A guide to the use of biota, sediments and wa-ter in environmental monitoring. University Press, Cambridge, 585pp.
CLOtteY, n. K. m. (2014) Effect of Microbial Loads on the Physiological Condition and Fecundi-ty of some Key Fish Species of Commercial Importance in Stratum II of the Volta Lake. (MPhil. Thesis). Department of Marine and Fisheries Sciences, University of Ghana, Le-gon. 105pp
CLOtteY, n.K.m., AsmAh, R., OfORi-dAnsOn, et al., (2016) Impacts of cage culture on physi-co-chemical and bacteriological water qual-ity in Lake Volta, Ghana, African Journal of Aquatic Science 41 (4), 473 – 480.
COLe, R. (2002). Impacts of marine farming on wild fish populations. Final Research Report for Ministry of Fisheries Research Project ENV2000/08, Objective One. National In-stitute of Water and Atmospheric Research, Auckland. CSIR - Water Research Institute (1999) Baseline data and monitoring of pol-lution on Volta Lake and Kpong Headpond. Amakye, J. S. and Opoku, A. A. (Eds.). WRI Technical Report, No. 556.55, Accra, 118pp.
CSIR - Water Research Institute (2003) Ghana raw
water quality criteria and guidelines on aqua-culture water use. CSIR–WRI, Accra.
demiRAK, A., bALCi, A. & tufeKCi, m. (2006) Envi-ronmental impact of the marine aquaculture in Gulluk Bay, Turkey. Environmental Monitor-ing and Assessment 123, 1 - 12.
devi, P. A., PAdmAvAthY, P., AAnAnd, s., et al., (2017). Review on water quality parameters in fresh water cage fish culture. International Journal of Applied Research 3 (5), 114 - 120
.
GHANA JOURNAL OF SCIENCEVOL. 60 15
effendie, i., niRmALA, K., hAsAn, s. u., et al., (2005). Water quality fluctuations under floating net cages for fish culture in Lake Cirata and its impact on fish survival. Fisheries Science 71, 972 - 977.
entz, b. (1969) Observations on the limnochemical conditions of the Volta Lake. 110-115 pp. In: L.E. Obeng (ed.) Man-Made Lakes. The Ac-cra Symposium. Universities Press, Accra.
FAO (2006) Cage Culture in Africa: FAO Regional Technical Workshop on Cage Culture in Af-rica. Entebbe, Uganda, 22nd – 23rd October, 2004.
findLAY, R. h., wAtLing, L. & mAYeR, L. m. (1995) Environmental impact of salmon net-pen cul-ture on marine benthic communities: a case study. Estuaries 18, 145 - 179.
gOndwe, m. J. s., guiLdfORd, s. J., & heCKY, R. e. (2011) Carbon, nitrogen and phosphorus load-ings from tilapia fish cages in Lake Malawi and factors influencing their magnitude. Jour-nal of Great Lakes Research 37, 93 – 101.
gORLACh-LiRA, K., PACheCO, C., CARvALhO, L. C. t., et al., (2013) The influence of fish culture in floating netcages on microbial indicators of water quality. Brazilian Journal of Biology 73, 457 – 463.
hARgRAve, b. t., duPLiseA, d. e., PdeiffeR, E., et al., (1997) Seasonal changes in benthic fluxes of dissolved oxygen and ammonium associated with marine cultured Atlantic salmon. Marine Ecology Progressive Series 96, 249 - 157.
hARRisOn, w. g., PeRRY, t. & Li, w. K. w. (2005) Ecosystem indicators of water quality, Part I. Plankton biomass, primary production and nutrient demand. In: Hargrave, B.T. (ed) En-vironmental effects of marine finfish aquacul-ture. Handbook Of Environmental Chemistry, Vol 5M. Springer-Verlag, Berlin, 59 – 82pp.
isLAm, m. s. (2005) Nitrogen and phosphorus budget in coastal and marine cage aquaculture and impacts of effluent loading on ecosystem:
review and analysis towards model develop-ment. Marine Pollution Bulletin 50, 48-61.
JAin, P., shARmA, J. d., sOhu, d., Et Al., (2005). Chemical Analysis of drinking water of Vil-lages of Sangener Tehsil, Juipur District. In-ternational Journal of Environmental Science and Technology 2 (4), 373 - 379.
KARiKARi, A. Y. & AsmAh, R. (2016) Water and sed-iment quality. In: Asmah, R., Karikari, A., Falconer, L., Telfer, T.C. & Ross, L.G. Cage aquaculture in Lake Volta, Ghana: Guide-lines for a sustainable future. CSIR- Water Research Institute, Ghana and University of Stirling, Stirling UK, 112pp.
KARiKARi, A. Y., AKPAbeY, f. & AbbAn, e. K. (2013) Assessment of water quality and primary productivity characteristics of Volta Lake in Ghana. Academia Journal of Environmental Sciences 1 (5), 88 - 103.
KARiKARi, A. Y., AsmAh, R., OfORi J. K., et al., (2016)
Characteristics of cage aquaculture in Ghana: A case study of Lake Volta at Asuogyaman District. Journal of Ghana Science Associa-tion 1 (17), 77.
KibRiA, g., nugegOdA, d., fAiRCLOugh, R., et al., (1998). Can nitrogen pollution from aquacul-ture be reduced? NAGA, the ICLARM Quar-terly 21, 17 - 25.
LuCAs, J. s. & sOuthgAte, P. C. (2012) Aquaculture Farming Aquatic Animals And Plants, 2nd Ed. MASSER, M. (2008) What is cage culture? SRAC publication No. 160.http://www.aces.edu/dept/fisheries/aquaculture/documents/SRAC160revised.pdf
mente, e., PieRCe, g. J., sAntOs, m. b. et al., (2006). Effect of feed and feeding in the culture of sal-monids on the marine aquatic environment: a synthesis for European aquaculture. Aquacul-ture International 14, 499 - 522.
nYAnti, L., hii, K. m., sOw, A., et al., (2012).Impacts of aquaculture differrent depths and distances
GHANA JOURNAL OF SCIENCE VOL. 6016
from cage culture sites in Batang Ai Hydro-electric Dam Reservoir, Sarawak, Malaysia.World Applied Science Journal, ISSN 1818-4952 19 (4), 451 – 156.
OfORi-dAnsOn, P. K. & Antwi, L. A. K. (1994) Lim-nology of the Volta Lake (Akosombo Gorge Area) twenty-five years after impoundment. Tropical Ecology 35, 69 - 82.
OfORi-dAnsOn, P. K. & ntOw, w. J. (2005) Studies on the current state of the limnochemistry and potential fish yield of Lake Volta (Yeji sector) after three decades of impoundment. Ghana Journal of Agricultural Science 35, 65 - 72.
PhiLiPs, m. J. (1994) Aquaculture and the environ-ment, striking a balance, INFOFISH AQUAT-ECH “94”, 29-31 August, 1994, Colombo, Sri Lanka.
PittA, P., KARAKAssis, i., tsAPAKis, m. et al., (1999). Natural versus mariculture induced variability in nutrients and plankton in the Eastern Medi-terranean. Hydrobiologia 391, 181 - 194.
RAO, d., PeRRinO, e. s., & bARReRAs, e. (2012) The Sustainability of Tilapia Fish Farming in Gha-na. Research paper. Blue Kitabu Research In-stitute, Boston.MA.
RuRAngwA, e., AgYAKwA, s. K., bOOn, h. et al., (2015) Development of aquaculture in Ghana, analy-sis of the fish value chain and potential busi-ness cases IMARES report C021/15.
sAmAh, O. h. (2012) Microbiological and physi-co-chemical assessment of surface water quality along Asukawkaw River in the Volta Region. MPhil thesis, Kwame Nkrumah Uni-versity of Science and Technology, Ghana.
sAntOs, d. m. s, CRuz, C. f., PeReiRA, d. P., et al., (2012) Microbiological water quality and gill histopathology of fish from fish farming in Itapecuru-Mirim County, Maranhao State. Acta Scientarium. Biological Sciences 34 (2), 199 – 205.
stiRLing, h. P. & deY, t. (1990). Impact of intensive cage fish farming on the phytoplankton and periphyton of a Scottish freshwater loch. Hyd-robiologia 190, 193 - 214.
stOne, n., sheLtOn, J. L., hAggARd, b. e. et al., (2013) Interpretation of water analysis reports for fish culture. Southern Regional Aquaculture Cen-tre (SRAC) publication 4606, 12pp.
temPORetti, f.P., ALAnsO, f.m., bAffiCO g., et al., (2001) Trophic state, fish community and intensive production of salmonids in Alicura Reservoir (Patagonia, Argentina). Research and Management 6, 259 - 267.
tiCOmffe (2011) Evaluation of commercial feeds for cage culture of the Nile Tilapia (Oreochromis niloticus) in Ghana. CSIR-Water Research In-stitute, Ghana, (unpublished).
wu, R. s. s. (1995) The environmental impact of ma-rine fish culture: Towards a sustainable future. Marine Pollution Bulletin 31, 159 - 166.
. Received 29 Apr 19; revised 19 Jul 19.