effects of distance between initial estimates and advice on advice utilization
TRANSCRIPT

Judgment and Decision Making, Vol. 10, No. 2, March 2015, pp. 144–171
Effects of distance between initial estimates and advice on advice
utilization
Thomas Schultze∗ Anne-Fernandine Rakotoarisoa† Stefan Schulz-Hardt‡
Abstract
Six experiments investigated how the distance between one’s initial opinion and advice relates to advice utilization. Going
beyond previous research, we relate advice distance to both relative adjustments and absolute adjustments towards the advice,
and we also investigate a second mode of advice utilization, namely confidence shifts due to social validation. Whereas
previous research suggests that advice is weighted less the more it differs from one’s initial opinion, we consistently find
evidence of a curvilinear pattern. Advice is weighted less when advice distance is low and when it is high. This is in particular
because individuals are much more likely to retain their initial opinions in the light of near advice. Also, absolute opinion
adjustments towards the advice increases in a monotone fashion as advice distance increases. This finding is in contrast to the
predictions of the theoretical framework previous studies on advice distance are based on, social judgment theory. Instead,
they data are more in line with a simple stimulus-response model suggesting that absolute adjustments towards the advice
increase with advice distance but—potentially—with diminished sensitivity. Finally, our data show that advice can be utilized
even when it receives zero weight during belief revision. The closer advice was to the initial opinions, the more it served as a
means for social validation, increasing decision-makers’ confidence in the accuracy of their final opinions. Thus, our findings
suggest that advice utilization is a more complex function of advice distance than previously assumed.
Keywords: advice, confidence, judgment, social judgment theory.
1 Introduction
When required to make a decision or judgment, people of-
ten solicit advice from others, especially from those they
consider experts on the topic in question. These topics may
vary greatly, from career management to investment deci-
sions, from issues in personal relationships to problems in
daily life. One of the purposes of soliciting advice is to build
a wide informational basis on which to make decisions. The
utilization of advice is therefore strongly related to an im-
provement of judgment or decision quality (e.g., Harvey &
Fischer, 1997; Soll & Larrick, 2009; Sniezek, Schrah &
Dalal, 2004; Yaniv, 2004a; Yaniv & Milyavsky, 2007). Ad-
vice taking is mostly investigated by using the judge-advisor
system (JAS, Sniezek & Buckley, 1995). In the JAS, one
person (the judge) first makes an initial judgment or deci-
sion, then receives advice and, subsequently, makes a final
(and possibly revised) judgment or decision. Comparing the
final to the initial judgment, then, allows to calculate the
relative adjustment towards the advice, that is, the percent
weight the judge assigned to the advice when making the
final judgment (Bonaccio & Dalal, 2006).
Copyright: © 2015. The authors license this article under the terms of
the Creative Commons Attribution 3.0 License.∗Institute of Psychology, Georg-August-University Goettingen.
Gosslerstrasse 14, D–37079 Goettingen. E-mail: [email protected]
goettingen.de.†Institute of Psychology, University of Kassel.‡Institute of Psychology, Georg-August-University Goettingen.
Previous research has shown that judges’ advice taking
behavior is influenced by a wide variety of advisor char-
acteristics such as the advisor’s expertise (Harvey & Fis-
cher, 1997; Yaniv & Kleinberger, 2000), reputation (Yaniv
& Kleinberger, 2000), age or social standing (Feng & Mac-
George, 2006), similarity to the judge (Gino, Shang, & Cro-
son, 2009; Yaniv, Choshen-Hillel, & Milyavsky, 2011), or
the number of advisors (Minson & Mueller, 2012; Yaniv &
Milyavsky, 2007). In addition, advice taking behavior can
depend on characteristics of the advice itself. One charac-
teristic that has been systematically investigated is advice
distance (Yaniv, 2004b; Yaniv & Milavsky, 2007).
Research on the effects of advice distance on advice
taking has postulated—and claimed to have consistently
shown—a monotone decrease in advice weighting as ad-
vice distance increases (Minson, Libermann, & Ross, 2011;
Yaniv, 2004b; Yaniv & Milyavsky, 2007). However, we
argue that previous studies draw an incomplete picture of
distance effects on advice taking. We will first give on
overview of the previous research and then point out why
this research cannot fully answer the question how advice
distance relates to advice taking.
1.1 Previous studies on distance effects in ad-
vice taking
The seminal study on distance effects in advice taking is a
study by Yaniv (2004b). Yaniv postulated a monotone neg-
144
Judgment and Decision Making, Vol. 10, No. 2, March 2015 Distance effects on advice utilitzation 145
ative relation of advice distance and advice weighting (i.e.,
relative adjustment of one’s opinion towards that of the ad-
visor) which is the most common measure of advice taking
(Bonaccio & Dalal, 2006). He derived this hypothesis from
early theorizing on attitude change, specifically, within the
framework of social judgment theory (SJT, Sherif & Hov-
land, 1961). Since attitude change and advice taking share a
number of structural features, it is plausible to take the for-
mer to derive predictions for the latter (Morrison, Rothman,
& Soll, 2011). In two of Yaniv’s (2004b) experiments, sub-
jects estimated the dates of historic events and received ad-
vice which was clustered into one of three advice distance
categories: near, intermediate, or far. In line with his hy-
pothesis, Yaniv found that advice was weighted most in the
near category and least in the far category with the interme-
diate category falling in between.
Subsequent studies addressing distance effects on advice
taking refer to Yaniv’s (2004b) study and, therefore, ex-
plained their findings using the same theoretical framework.
The first, by Yaniv and Milyavsky (2007), studied advice
taking when receiving advice from multiple advisors. They
compared judges’ final estimates to a variety of weighting
strategies such as averaging one’s own opinion and those
of all advisors or taking the median. These model compar-
isons suggested that judges’ engaged in an egocentric trim-
ming strategy, that is, they ignored those pieces of advice
that were most distant from their own initial estimates and
averaged the remaining opinions. These findings support the
idea that increasing advice distance leads to lower weights
of advice when making a final judgment, although it should
be noted that the study did not provide a direct test of how
advice distance relates to advice weighting.
The third and most recent study investigating distance ef-
fects on advice weighting is by Minson et al. (2011). Using
different estimation tasks, they tested whether advice dis-
tance was related to whether judges placed more weight on
their own or on their advisor’s estimates when making the
final decision. In line with the original Yaniv study, they
found a negative linear effect of advice distance on this di-
chotomized measure of advice weighting: the farther the ad-
vice the less likely judges were to weight the advice by more
than 50%.
In sum, previous research unanimously suggests a mono-
tone decrease in advice utilization as advice distance in-
creases. However, this conclusion might be premature both
because previous studies were not properly designed to test
for the proposed monotone relation, and because they ne-
glect the possibility that advice might even be utilized, in
a way, when it receives zero weight. We will elaborate on
these points in the following.
1.2 Distance effects on advice weighting:
Methodological and theoretical consider-
ations
We argue that, due to methodological limitations, previous
studies on distance effects in advice taking were not well-
suited to test for the monotone negative relation of advice
distance that Yaniv (2004b) originally postulated. The most
serious problem is that either the independent variable, ad-
vice distance, or the dependent variable, advice weighting,
were categorized in the previous studies. In his original
study, Yaniv formed three distance categories based either
on real advice from previous subjects or on advice generated
by a computer as percent deviations from the true values. In
both cases, advice distance roughly doubled from the near
to the intermediate distance category, but it almost quadru-
pled when comparing the near and the far category. Hence,
advice distance was restricted to three data points, and any
deviations from a monotonic relation that might have ex-
isted within the range of a given category were impossible
to detect.
Similarly, advice distance was categorized in the Yaniv
and Milyasky (2007) study. Yaniv and Milyavsky differen-
tiated between the two pieces of advice that were farthest
from the initial estimates, on the one hand, and close ad-
vice which was comprised of the remaining pieces of ad-
vice, on the other. The mere fact that—as observed by Yaniv
and Milyavsky—the farthest pieces of advice apparently re-
ceived a weight of zero does not allow conclusive inferences
regarding the shape of the underlying relation of advice dis-
tance and advice weighting. A similar problem occurs in
the case that advice weighting (i.e., the dependent variable)
is dichotomized as in the Minson et al. (2011) study. This di-
chotomization masks the shape of the relationship of advice
distance and advice weighting, again rendering it difficult to
properly test a monotone negative relation.
Categorization would not be that much of a problem if a
monotone negative relation between advice distance and ad-
vice weighting were the only theoretically plausible possi-
bility. However, we shall propose a plausible alternative the-
oretical account that makes predictions with regard to these
distance effects. Furthermore, both SJT and this alternative
approach also allow for the possibility of curvilinear dis-
tance effects on advice weighting. To understand these pos-
sibilities and, hence, to get a more comprehensive picture of
how advice distance might be related to advice weighting,
we first take a closer look at predictions that can be derived
from SJT, and we then introduce an alternative approach that
might also explain distance effects on advice weighting.
1.3 Social judgment theory (SJT)
SJT states that attitude change depends on how similar or
dissimilar a persuasive message is compared to an individ-
Judgment and Decision Making, Vol. 10, No. 2, March 2015 Distance effects on advice utilitzation 146
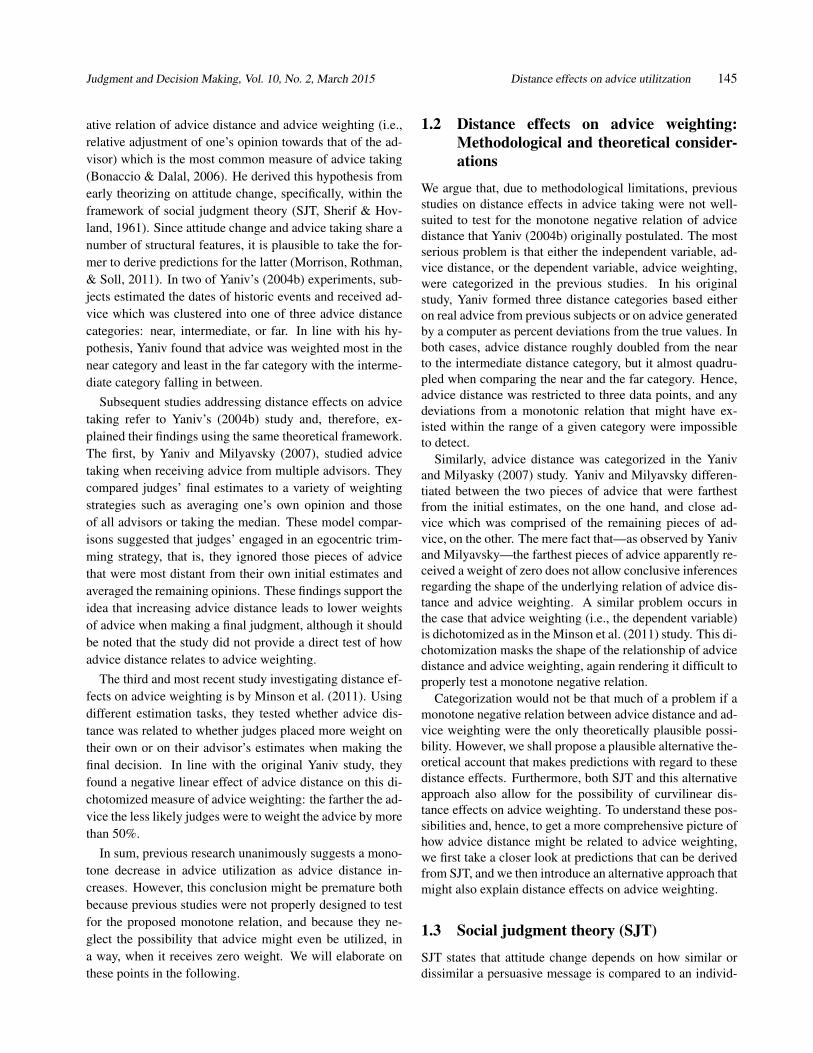
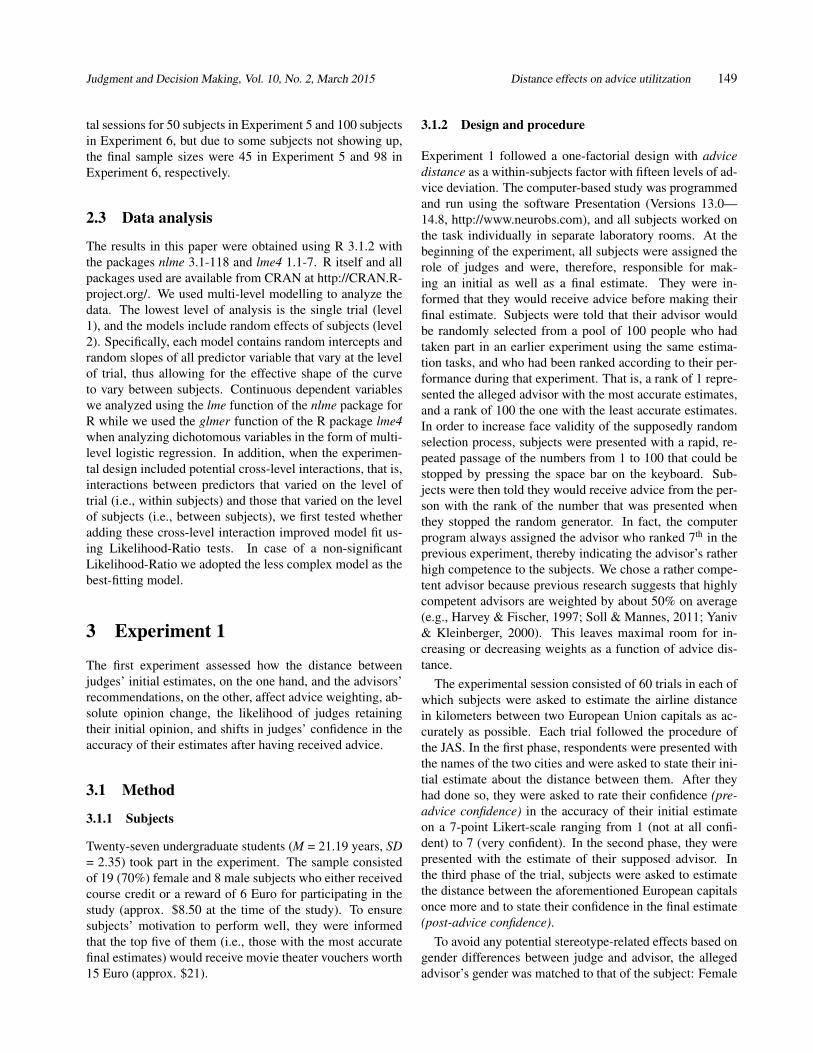
Figure 1: Predictions of SJT in its basic form (left panel) and assuming additional assimilation effects (right panel) for
both absolute and relative opinion change (advice weighting) as a function of advice distance. Advice distance and opinion
change are measured in arbitrary units. The curves in the right panel are based on a simulation of 2,000 judges with ROPEs
randomly drawn from a uniform distribution ranging from .01 to 0.2 arbitrary distance units.
0.0 0.2 0.4 0.6 0.8 1.0
0.0
0.2
0.4
0.6
0.8
1.0
advice distance
opin
ion
chan
geabsolute changerelative change
a) no assimilation effects
0.0 0.2 0.4 0.6 0.8 1.0
0.0
0.2
0.4
0.6
0.8
1.0
advice distance
opin
ion
chan
ge
absolute changerelative change
b) assimilation effects
ual’s initial attitude. It suggests an inversely U-shaped rela-
tion, assuming that moderately different messages produce
the greatest attitude change while both messages very sim-
ilar and very dissimilar to an individual’s initial attitude
produce less attitude change. Several studies on attitude
change found evidence of a quadratic effect, correspond-
ing to this inversely U-shaped relationship between opin-
ion discrepancy and attitude change (e.g., Aronson, Turner
& Carlsmith, 1963; Freedman, 1964; Insko, Murashima &
Saiyadain, 1966).
When we apply SJT to advice taking, we need to take
into account that SJT makes statements about absolute opin-
ion change, whereas research on advice taking investigates
advice weighting, that is, relative change. As mentioned
above, the most common measures of advice taking divide
some measure of absolute opinion change by advice dis-
tance (Bonaccio & Dalal, 2006). For example, the Advice
Taking coefficient (AT, Harvey & Fischer, 1997) is defined
as: (final judgment − initial judgment)/(advice − initial
judgment). Interestingly, a negative quadratic relationship
of advice distance and absolute adjustment towards the ad-
vice is equivalent to a negative linear decrease of advice
weighting, such as measured by the AT score, as advice dis-
tance increases.1 Therefore, the monotone negative relation
found in previous studies is—potentially—in line with the
predictions made by SJT, but only to the extent that the ab-
solute opinion change in these studies follows an inversely
U-shaped pattern.
However, SJT also allows for a curvilinear relation of ad-
vice distance and advice taking. The core idea behind this
1The quadratic model of absolute opinion change (c) as a function of
advice distance (d) in its most simple form is c = −d2 + d. Adding d in
this model ensures that opinion change is zero for advice identical to the
decision-maker’s initial opinion. In order to make statements about advice
weighting (w), we simply need to divide this equation by advice distance
d, leading to the linear model: w = −d + 1. This model represents a
monotone decrease of advice weighting as advice distance increases.
non-monotone pattern is as follows: if advice is very close
to the decision-makers’ initial opinion, there is an increased
chance that he or she will completely neglect the objective
difference and, accordingly, retain the initial opinion. In
SJT, this has been addressed in terms of an “assimilation ef-
fect” (Sherif, Taub & Hovland, 1958). Assimilation effects
lead to overestimating the similarity of one’s own attitude,
on one hand, and a message from another person, on the
other. Sometimes, such messages are perceived as practi-
cally equivalent to the recipient’s own attitude, so that the
objective discrepancy is no longer considered substantial—
rendering further adjustment towards the message seem-
ingly unnecessary. Such a region of practical equivalence
(ROPE) is likely to vary among subjects, and even within
subjects the size of the ROPE may vary from problem to
problem. If such assimilation effects occur, there should be
an increased likelihood of the judge assigning zero weight
to the advice when it is close to the initial estimate. Figure 1
illustrates the predictions of SJT—with and without assimi-
lation of near advice—regarding absolute and relative opin-
ion change as a function of advice distance. As can be seen
from the right panel, assimilation effects lead to a curvilin-
ear relation of advice distance on advice weighting, with low
weight of advice for very near advice and for advice that is
relatively far from judges’ initial opinion.
1.4 A stimulus-response model (SRM)
As already outlined, SJT is not necessarily the only ap-
proach that makes predictions about how advice taking re-
lates to advice distance. In our view, a particularly plausi-
ble alternative to SJT is a rather simple stimulus-response
model (SRM). According to this model, decision-makers’
absolute adjustment towards advice is proportional to the
intensity of the stimulus, that is, how strongly the advice
urges the judge to revise the initial opinion. In the context
Judgment and Decision Making, Vol. 10, No. 2, March 2015 Distance effects on advice utilitzation 147
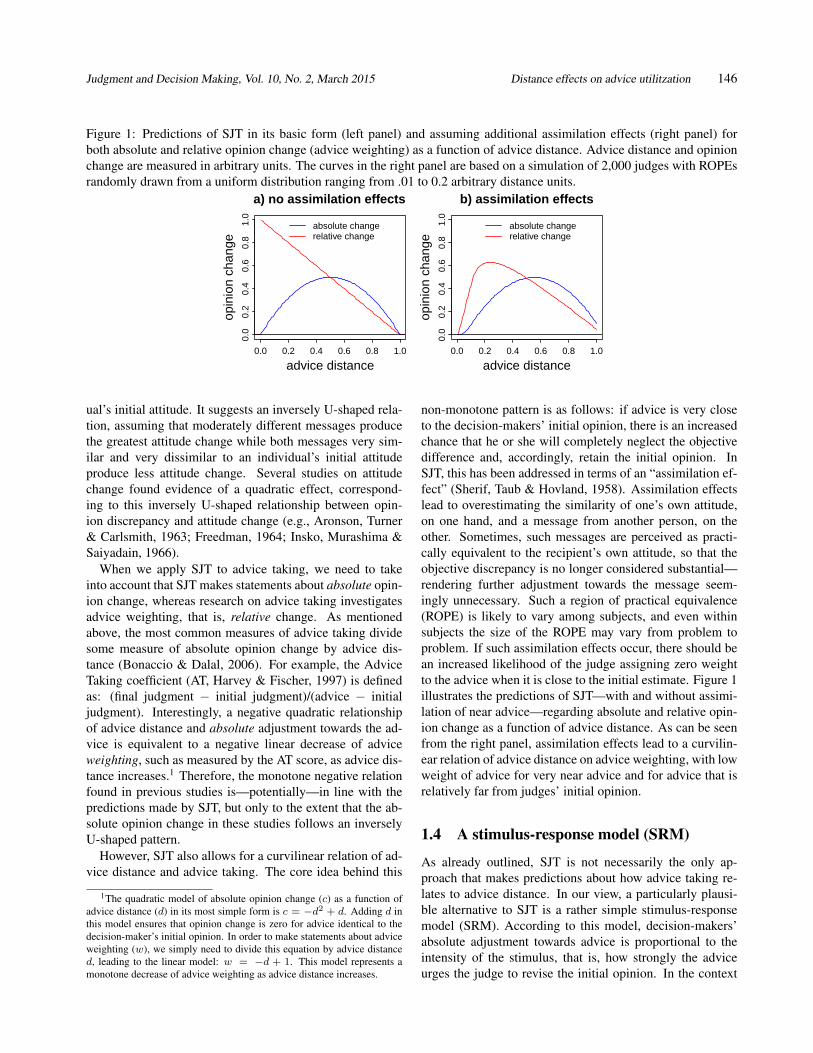
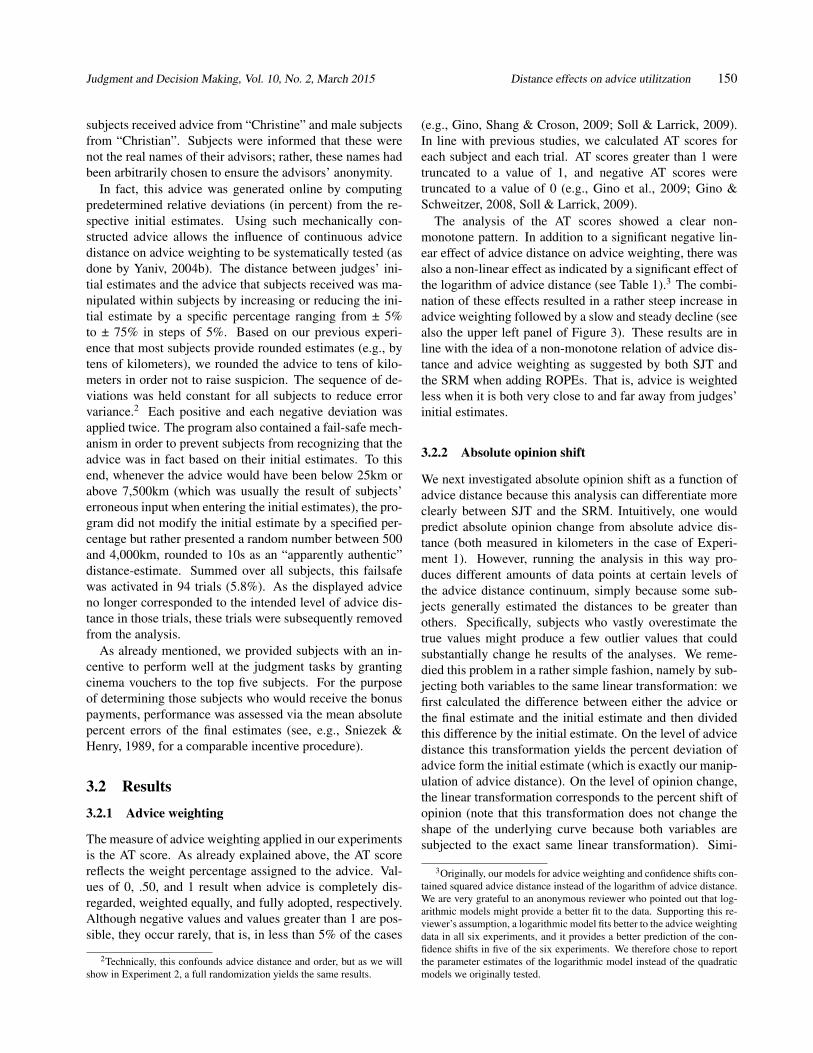
Figure 2: Predictions of a SRM in its basic form (left panel) and assuming an analogue to a sensory threshold (right panel)
for both absolute and relative opinion change (advice weighting) as a function of advice distance. Advice distance and
opinion change are measured in arbitrary units. The curves in the right panel are based on a simulation of 2,000 judges with
ROPEs randomly drawn from a uniform distribution ranging from .01 to 0.2 arbitrary distance units.
0.0 0.2 0.4 0.6 0.8 1.0
0.0
0.2
0.4
0.6
0.8
1.0
advice distance
opin
ion
chan
geabsolute changerelative change
a) no sensory threshold
0.0 0.2 0.4 0.6 0.8 1.0
0.0
0.2
0.4
0.6
0.8
1.0
advice distance
opin
ion
chan
ge
absolute changerelative change
b) sensory threshold
of advice, stimulus intensity could depend on a wide range
of features such as the advisor’s expertise or the judge’s
own confidence, but all else being equal, stimulus inten-
sity should be directly proportional to advice distance. As
with all stimuli, decision-makers’ perception of stimulus in-
tensity (i.e., advice distance) can be subject to diminishing
sensitivity (Stevens, 1957). A SRM with diminishing sensi-
tivity would predict that absolute opinion change increases
with advice distance, but that these increases become suc-
cessively smaller. That is, absolute opinion change is a
monotone positive, but negatively accelerating function of
advice distance. On the level of relative opinion change, we
would expect a pattern somewhat like that proposed by SJT,
namely a monotone decrease of advice weighting as advice
distance increases. The difference between the two is that a
SRM with diminishing sensitivity predicts a non-linear in-
stead of a linear decrease in advice weighting.
The SRM can also be expanded so that it predicts a
curvilinear relation of advice distance and advice weighting,
namely by incorporating an equivalent of sensory thresh-
olds. Of course, in the context of quantity estimates in the
judge-advisor system, it is implausible to assume that judges
will not notice a numerical difference between their esti-
mates and the advice. However, as an analogy to a sensory
threshold, they might perceive advice outside their ROPE
only as a stimulus that necessitates adjustment. Hence, if
advice falls into judges’ ROPE, they will assign zero weight
to it. The predictions a SRM makes regarding absolute and
relative opinion change are displayed in Figure 2.
The patterns predicted by the two theoretical accounts
when incorporating ROPEs are clearly distinct from the neg-
ative monotone relations that have been considered in the
previous literature. However, as outlined above, previous
studies did not allow detection of such non-monotone trends
in the near regions of advice. Nevertheless, a study by Yaniv,
Choshen-Hillel and Milyavsky (2009) hints towards the pos-
sibility that very near advice might increase the likelihood of
judges retaining their initial opinions. In this study, Yaniv
et al. were interested in how judges utilize interdependent
as compared to independent advice from multiple advisors.
Judges received advice from three advisors who were ei-
ther randomly drawn from a set of previous subjects, or who
were selected because their estimates were particularly close
to that of the judge. In the latter case, advice was less infor-
mative due to the dependency of the judgments, but there
was greater consensus among the advisors. Dependent ad-
vice was also closer to judges’ initial estimates than inde-
pendent advice. When receiving dependent advice, judges
were much more likely to assign zero weight to the advice
and retain their initial opinion. Whereas Yaniv et al. at-
tributed this effect to the greater consensus among depen-
dent advice, it could have also—at least partially—been due
to differences in advice distance.
As we have pointed out, both a monotone negative re-
lation of advice distance and advice weighting as well as
an inversely U-shaped relation are plausible given the the-
oretical frameworks we described. In order to differentiate
between monotone and non-monotone relations of advice
distance and advice weighting, we need to investigate the
whole spectrum of advice distance as a continuous variable.
In addition, the exact shape of the monotone relation or the
inversely U-shaped relation, respectively, differs between
SJT and the SRM. Hence, it is also necessary to investigate
both absolute and relative measures of opinion change. In
the present research, we will do both.
1.5 Distance effects on judges’ confidence
The possibility of a non-monotone relation of advice dis-
tance and advice weighting leads to an interesting question:
do low weights of advice generally mean that the advice was
not utilized? Focusing on measures of opinion adjustment
Judgment and Decision Making, Vol. 10, No. 2, March 2015 Distance effects on advice utilitzation 148
alone—whether they are absolute or relative – may tell only
part of the story. A more complete picture may emerge if we
consider a second form of advice utilization, namely, advice
as a means of social validation.
An important aspect in research on advice taking—
besides the accuracy of the judgments itself—is judges’ con-
fidence. Confidence in the initial estimates is often treated
as an input variable, that is, it is used as a predictor of advice
taking (e.g., See et al., 2011; Soll & Mannes, 2011). How-
ever, confidence can also be an outcome of advice taking
(e.g., Yaniv et al., 2009). For example, judges’ confidence
might increase from the initial to the final estimate because
they are aware that combining two independent estimates
tends to reduce idiosyncratic errors (Minson & Mueller,
2012). Here, we are interested in another possibility, namely
that a judge receives advice that is—subjectively—very sim-
ilar to the initial estimate. In this case, judges’ confidence
that their current belief is accurate may change from their
initial to their final estimate (even when the estimate itself
does not change), particularly due to the latter being in-
formed by advice. Such effects of social validation are well-
documented in research on group decision making. Confi-
dence in the correctness of a group decision increases with
the extent of social support for this decision, and the lack of
dissent(Schulz-Hardt, Frey, Lüthgens & Moscovici, 2000;
Schulz-Hardt, Jochims & Frey, 2002; Sniezek & Kolzow,
1992, as cited in Sniezek, 1992).
Assuming independent estimates, judges should feel val-
idated to the degree that they perceive the advice to be suf-
ficiently similar to their initial estimates. As we explained,
the study by Yaniv et al. (2009) provides suggestive sup-
port for this conclusion. Based on these findings, and in
accordance with Budescu (2006), we suggest that judges’
confidence increases most after receiving near advice, and
that this confidence gain decreases gradually as advice dis-
tance increases. Thus, low weights placed on near advice
would not generally mean that the advice was not utilized,
but rather that advice utilization takes a form different from
adjusting one’s opinion.
2 Overview of the present research
2.1 Research questions
Based on the reasoning above, we aim to answer the follow-
ing three research questions. The first concerns the shape of
the relation of advice distance and advice weighting. Here,
we will investigate whether this relation is a monotone nega-
tive trend, as implied by most previous research, or whether
there is evidence of an inverse U relation. In an inverse U is
found, a follow-up question is whether lower weights placed
on near advice are consistent with the idea of ROPEs, in
which case judges are more likely to retain their initial opin-
ions, giving zero weight to the advice, when advice is par-
ticularly close.
The second question is which of the outlined theoretical
accounts, SJT and the SRM, fits our data better. As men-
tioned above, it may be difficult to differentiate between the
two accounts if we restrict the analyses to the level of rel-
ative opinion change (advice weighting). We should, how-
ever, be better able to make this distinction if we also in-
vestigate absolute opinion change: Whereas SJT predicts
that absolute opinion change is maximal for moderate ad-
vice distance and lower for both near and far advice, a SRM
assumes a monotone positive relation, that is, the further the
advice is from judges’ initial opinion, the more judges will
change that opinion in the direction of the advice.
Finally, we are interested in whether judges utilize ad-
vice as a means of social validation, depending on its dis-
tance from the initial estimates. In the case of an inversely
U-shaped relation of advice distance and advice weighting,
the question is whether near and far advice are disregarded
equally, or whether the former is merely utilized in a differ-
ent way, namely as a validation of one’s initial opinion. In
the following, we address these questions in a series of six
experiments.
2.2 Data reporting and sample sizes
Following the recommendation of Simmons, Nelson and Si-
monsohn (2011), we report all cases of data exclusion in
the method sections of the respective experiments. We fur-
ther assert that we report all measures and conditions of
the conducted experiments. Sample sizes for the first four
experiments were determined based on a power analysis
for within-subjects effects in a repeated measures ANOVA,
which we originally planned to use in order to analyze our
data. Given a moderate effect size for the within-subjects
effect (f = .25), an alpha level of .05 and an aspired power
of .95, a design with 15 measurement points, and an as-
sumed average correlation of .44 between measurement
points (based on pretest data from N = 20 subjects work-
ing on 60 distance estimates in a judge-advisor system), the
analysis suggested a minimum sample size of 18 subjects.
Since samples sizes of 18 seemed rather low, we then chose
to match the sample sizes of the original Yaniv (2004b)
study on advice distance, that is, around 25 subjects per
between-subject condition. The exact number of subjects
in the first four experiments depended on how many sub-
jects showed up to the scheduled experimental sessions. We
overbooked all sessions, and due to varying numbers of sub-
jects not showing up, the effective sample sizes varied some-
what. In Experiments 5 and 6, we increased the sample size.
Since power analyses for random effects multi-level models
are rather complex (and beyond our current grasp), we fol-
lowed a rule of thumb and aimed for double the subjects
per between-subjects condition. We scheduled experimen-
Judgment and Decision Making, Vol. 10, No. 2, March 2015 Distance effects on advice utilitzation 149
tal sessions for 50 subjects in Experiment 5 and 100 subjects
in Experiment 6, but due to some subjects not showing up,
the final sample sizes were 45 in Experiment 5 and 98 in
Experiment 6, respectively.
2.3 Data analysis
The results in this paper were obtained using R 3.1.2 with
the packages nlme 3.1-118 and lme4 1.1-7. R itself and all
packages used are available from CRAN at http://CRAN.R-
project.org/. We used multi-level modelling to analyze the
data. The lowest level of analysis is the single trial (level
1), and the models include random effects of subjects (level
2). Specifically, each model contains random intercepts and
random slopes of all predictor variable that vary at the level
of trial, thus allowing for the effective shape of the curve
to vary between subjects. Continuous dependent variables
we analyzed using the lme function of the nlme package for
R while we used the glmer function of the R package lme4
when analyzing dichotomous variables in the form of multi-
level logistic regression. In addition, when the experimen-
tal design included potential cross-level interactions, that is,
interactions between predictors that varied on the level of
trial (i.e., within subjects) and those that varied on the level
of subjects (i.e., between subjects), we first tested whether
adding these cross-level interaction improved model fit us-
ing Likelihood-Ratio tests. In case of a non-significant
Likelihood-Ratio we adopted the less complex model as the
best-fitting model.
3 Experiment 1
The first experiment assessed how the distance between
judges’ initial estimates, on the one hand, and the advisors’
recommendations, on the other, affect advice weighting, ab-
solute opinion change, the likelihood of judges retaining
their initial opinion, and shifts in judges’ confidence in the
accuracy of their estimates after having received advice.
3.1 Method
3.1.1 Subjects
Twenty-seven undergraduate students (M = 21.19 years, SD
= 2.35) took part in the experiment. The sample consisted
of 19 (70%) female and 8 male subjects who either received
course credit or a reward of 6 Euro for participating in the
study (approx. $8.50 at the time of the study). To ensure
subjects’ motivation to perform well, they were informed
that the top five of them (i.e., those with the most accurate
final estimates) would receive movie theater vouchers worth
15 Euro (approx. $21).
3.1.2 Design and procedure
Experiment 1 followed a one-factorial design with advice
distance as a within-subjects factor with fifteen levels of ad-
vice deviation. The computer-based study was programmed
and run using the software Presentation (Versions 13.0—
14.8, http://www.neurobs.com), and all subjects worked on
the task individually in separate laboratory rooms. At the
beginning of the experiment, all subjects were assigned the
role of judges and were, therefore, responsible for mak-
ing an initial as well as a final estimate. They were in-
formed that they would receive advice before making their
final estimate. Subjects were told that their advisor would
be randomly selected from a pool of 100 people who had
taken part in an earlier experiment using the same estima-
tion tasks, and who had been ranked according to their per-
formance during that experiment. That is, a rank of 1 repre-
sented the alleged advisor with the most accurate estimates,
and a rank of 100 the one with the least accurate estimates.
In order to increase face validity of the supposedly random
selection process, subjects were presented with a rapid, re-
peated passage of the numbers from 1 to 100 that could be
stopped by pressing the space bar on the keyboard. Sub-
jects were then told they would receive advice from the per-
son with the rank of the number that was presented when
they stopped the random generator. In fact, the computer
program always assigned the advisor who ranked 7th in the
previous experiment, thereby indicating the advisor’s rather
high competence to the subjects. We chose a rather compe-
tent advisor because previous research suggests that highly
competent advisors are weighted by about 50% on average
(e.g., Harvey & Fischer, 1997; Soll & Mannes, 2011; Yaniv
& Kleinberger, 2000). This leaves maximal room for in-
creasing or decreasing weights as a function of advice dis-
tance.
The experimental session consisted of 60 trials in each of
which subjects were asked to estimate the airline distance
in kilometers between two European Union capitals as ac-
curately as possible. Each trial followed the procedure of
the JAS. In the first phase, respondents were presented with
the names of the two cities and were asked to state their ini-
tial estimate about the distance between them. After they
had done so, they were asked to rate their confidence (pre-
advice confidence) in the accuracy of their initial estimate
on a 7-point Likert-scale ranging from 1 (not at all confi-
dent) to 7 (very confident). In the second phase, they were
presented with the estimate of their supposed advisor. In
the third phase of the trial, subjects were asked to estimate
the distance between the aforementioned European capitals
once more and to state their confidence in the final estimate
(post-advice confidence).
To avoid any potential stereotype-related effects based on
gender differences between judge and advisor, the alleged
advisor’s gender was matched to that of the subject: Female
Judgment and Decision Making, Vol. 10, No. 2, March 2015 Distance effects on advice utilitzation 150
subjects received advice from “Christine” and male subjects
from “Christian”. Subjects were informed that these were
not the real names of their advisors; rather, these names had
been arbitrarily chosen to ensure the advisors’ anonymity.
In fact, this advice was generated online by computing
predetermined relative deviations (in percent) from the re-
spective initial estimates. Using such mechanically con-
structed advice allows the influence of continuous advice
distance on advice weighting to be systematically tested (as
done by Yaniv, 2004b). The distance between judges’ ini-
tial estimates and the advice that subjects received was ma-
nipulated within subjects by increasing or reducing the ini-
tial estimate by a specific percentage ranging from ± 5%
to ± 75% in steps of 5%. Based on our previous experi-
ence that most subjects provide rounded estimates (e.g., by
tens of kilometers), we rounded the advice to tens of kilo-
meters in order not to raise suspicion. The sequence of de-
viations was held constant for all subjects to reduce error
variance.2 Each positive and each negative deviation was
applied twice. The program also contained a fail-safe mech-
anism in order to prevent subjects from recognizing that the
advice was in fact based on their initial estimates. To this
end, whenever the advice would have been below 25km or
above 7,500km (which was usually the result of subjects’
erroneous input when entering the initial estimates), the pro-
gram did not modify the initial estimate by a specified per-
centage but rather presented a random number between 500
and 4,000km, rounded to 10s as an “apparently authentic”
distance-estimate. Summed over all subjects, this failsafe
was activated in 94 trials (5.8%). As the displayed advice
no longer corresponded to the intended level of advice dis-
tance in those trials, these trials were subsequently removed
from the analysis.
As already mentioned, we provided subjects with an in-
centive to perform well at the judgment tasks by granting
cinema vouchers to the top five subjects. For the purpose
of determining those subjects who would receive the bonus
payments, performance was assessed via the mean absolute
percent errors of the final estimates (see, e.g., Sniezek &
Henry, 1989, for a comparable incentive procedure).
3.2 Results
3.2.1 Advice weighting
The measure of advice weighting applied in our experiments
is the AT score. As already explained above, the AT score
reflects the weight percentage assigned to the advice. Val-
ues of 0, .50, and 1 result when advice is completely dis-
regarded, weighted equally, and fully adopted, respectively.
Although negative values and values greater than 1 are pos-
sible, they occur rarely, that is, in less than 5% of the cases
2Technically, this confounds advice distance and order, but as we will
show in Experiment 2, a full randomization yields the same results.
(e.g., Gino, Shang & Croson, 2009; Soll & Larrick, 2009).
In line with previous studies, we calculated AT scores for
each subject and each trial. AT scores greater than 1 were
truncated to a value of 1, and negative AT scores were
truncated to a value of 0 (e.g., Gino et al., 2009; Gino &
Schweitzer, 2008, Soll & Larrick, 2009).
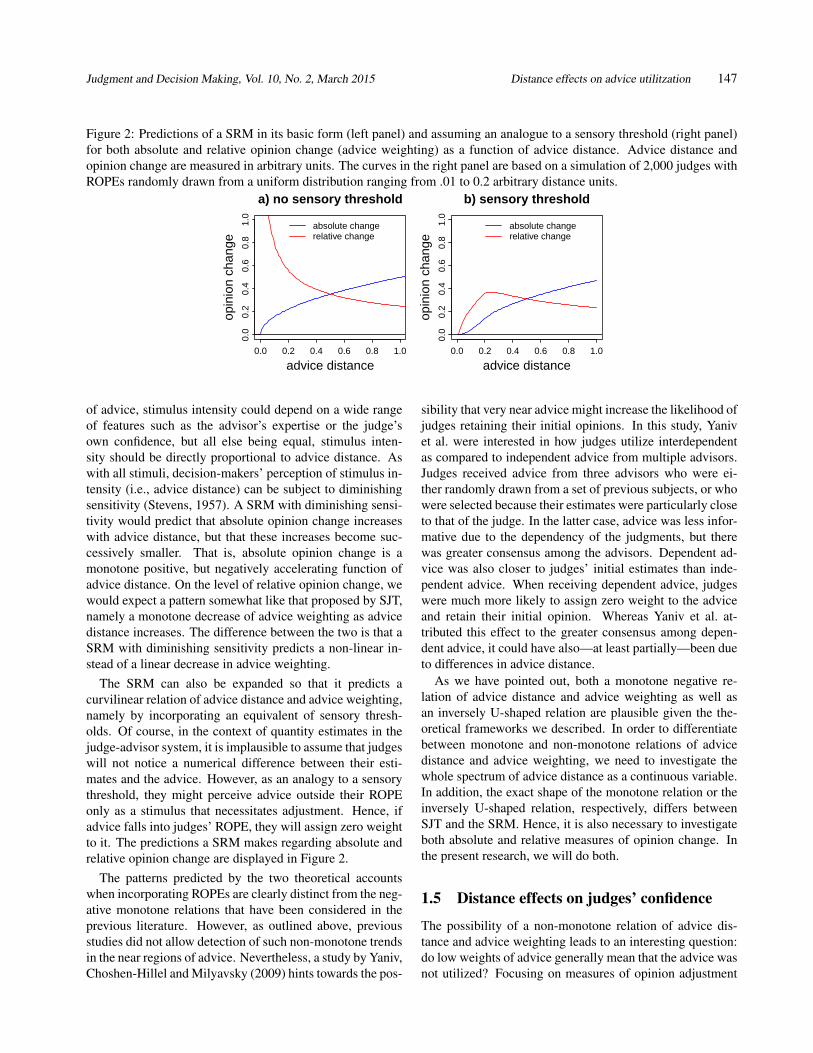
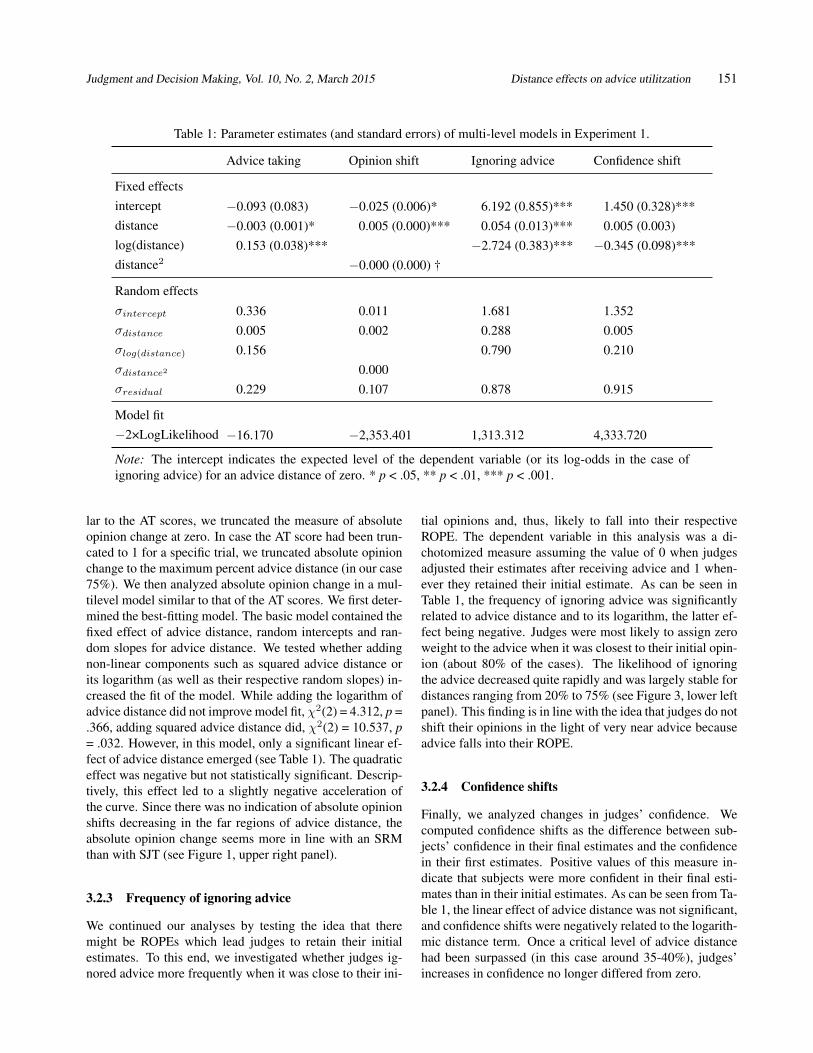
The analysis of the AT scores showed a clear non-
monotone pattern. In addition to a significant negative lin-
ear effect of advice distance on advice weighting, there was
also a non-linear effect as indicated by a significant effect of
the logarithm of advice distance (see Table 1).3 The combi-
nation of these effects resulted in a rather steep increase in
advice weighting followed by a slow and steady decline (see
also the upper left panel of Figure 3). These results are in
line with the idea of a non-monotone relation of advice dis-
tance and advice weighting as suggested by both SJT and
the SRM when adding ROPEs. That is, advice is weighted
less when it is both very close to and far away from judges’
initial estimates.
3.2.2 Absolute opinion shift
We next investigated absolute opinion shift as a function of
advice distance because this analysis can differentiate more
clearly between SJT and the SRM. Intuitively, one would
predict absolute opinion change from absolute advice dis-
tance (both measured in kilometers in the case of Experi-
ment 1). However, running the analysis in this way pro-
duces different amounts of data points at certain levels of
the advice distance continuum, simply because some sub-
jects generally estimated the distances to be greater than
others. Specifically, subjects who vastly overestimate the
true values might produce a few outlier values that could
substantially change he results of the analyses. We reme-
died this problem in a rather simple fashion, namely by sub-
jecting both variables to the same linear transformation: we
first calculated the difference between either the advice or
the final estimate and the initial estimate and then divided
this difference by the initial estimate. On the level of advice
distance this transformation yields the percent deviation of
advice form the initial estimate (which is exactly our manip-
ulation of advice distance). On the level of opinion change,
the linear transformation corresponds to the percent shift of
opinion (note that this transformation does not change the
shape of the underlying curve because both variables are
subjected to the exact same linear transformation). Simi-
3Originally, our models for advice weighting and confidence shifts con-
tained squared advice distance instead of the logarithm of advice distance.
We are very grateful to an anonymous reviewer who pointed out that log-
arithmic models might provide a better fit to the data. Supporting this re-
viewer’s assumption, a logarithmic model fits better to the advice weighting
data in all six experiments, and it provides a better prediction of the con-
fidence shifts in five of the six experiments. We therefore chose to report
the parameter estimates of the logarithmic model instead of the quadratic
models we originally tested.
Judgment and Decision Making, Vol. 10, No. 2, March 2015 Distance effects on advice utilitzation 151
Table 1: Parameter estimates (and standard errors) of multi-level models in Experiment 1.
Advice taking Opinion shift Ignoring advice Confidence shift
Fixed effects
intercept −0.093 (0.083) −0.025 (0.006)* 6.192 (0.855)*** 1.450 (0.328)***
distance −0.003 (0.001)* 0.005 (0.000)*** 0.054 (0.013)*** 0.005 (0.003)
log(distance) 0.153 (0.038)*** −2.724 (0.383)*** −0.345 (0.098)***
distance2 −0.000 (0.000) †
Random effects
σintercept 0.336 0.011 1.681 1.352
σdistance 0.005 0.002 0.288 0.005
σlog(distance) 0.156 0.790 0.210
σdistance2 0.000
σresidual 0.229 0.107 0.878 0.915
Model fit
−2×LogLikelihood −16.170 −2,353.401 1,313.312 4,333.720
Note: The intercept indicates the expected level of the dependent variable (or its log-odds in the case of
ignoring advice) for an advice distance of zero. * p < .05, ** p < .01, *** p < .001.
lar to the AT scores, we truncated the measure of absolute
opinion change at zero. In case the AT score had been trun-
cated to 1 for a specific trial, we truncated absolute opinion
change to the maximum percent advice distance (in our case
75%). We then analyzed absolute opinion change in a mul-
tilevel model similar to that of the AT scores. We first deter-
mined the best-fitting model. The basic model contained the
fixed effect of advice distance, random intercepts and ran-
dom slopes for advice distance. We tested whether adding
non-linear components such as squared advice distance or
its logarithm (as well as their respective random slopes) in-
creased the fit of the model. While adding the logarithm of
advice distance did not improve model fit, χ2(2) = 4.312, p =
.366, adding squared advice distance did, χ2(2) = 10.537, p
= .032. However, in this model, only a significant linear ef-
fect of advice distance emerged (see Table 1). The quadratic
effect was negative but not statistically significant. Descrip-
tively, this effect led to a slightly negative acceleration of
the curve. Since there was no indication of absolute opinion
shifts decreasing in the far regions of advice distance, the
absolute opinion change seems more in line with an SRM
than with SJT (see Figure 1, upper right panel).
3.2.3 Frequency of ignoring advice
We continued our analyses by testing the idea that there
might be ROPEs which lead judges to retain their initial
estimates. To this end, we investigated whether judges ig-
nored advice more frequently when it was close to their ini-
tial opinions and, thus, likely to fall into their respective
ROPE. The dependent variable in this analysis was a di-
chotomized measure assuming the value of 0 when judges
adjusted their estimates after receiving advice and 1 when-
ever they retained their initial estimate. As can be seen in
Table 1, the frequency of ignoring advice was significantly
related to advice distance and to its logarithm, the latter ef-
fect being negative. Judges were most likely to assign zero
weight to the advice when it was closest to their initial opin-
ion (about 80% of the cases). The likelihood of ignoring
the advice decreased quite rapidly and was largely stable for
distances ranging from 20% to 75% (see Figure 3, lower left
panel). This finding is in line with the idea that judges do not
shift their opinions in the light of very near advice because
advice falls into their ROPE.
3.2.4 Confidence shifts
Finally, we analyzed changes in judges’ confidence. We
computed confidence shifts as the difference between sub-
jects’ confidence in their final estimates and the confidence
in their first estimates. Positive values of this measure in-
dicate that subjects were more confident in their final esti-
mates than in their initial estimates. As can be seen from Ta-
ble 1, the linear effect of advice distance was not significant,
and confidence shifts were negatively related to the logarith-
mic distance term. Once a critical level of advice distance
had been surpassed (in this case around 35-40%), judges’
increases in confidence no longer differed from zero.
Judgment and Decision Making, Vol. 10, No. 2, March 2015 Distance effects on advice utilitzation 152
Figure 3: Advice weighting (upper left panel), absolute opinion shift (upper right panel), frequency of ignoring advice
(lower left panel), and confidence shifts (lower right panel) as a function of advice distance in Experiment 1. White dots
represent the observed mean values. The bold black line represents the model predictions. Light gray lines represent the
fitted data of the individual subjects based on the model’s random effects.
0 20 40 60 80
0.0
0.1
0.2
0.3
0.4
0.5
advice distance
advi
ce w
eigh
ting
0 20 40 60 80
0.0
0.1
0.2
0.3
0.4
0.5
advice distance
abso
lute
opi
nion
shi
ft
0 20 40 60 80
020
4060
8010
0
advice distance
advi
ce ig
nore
d (in
%)
0 20 40 60 80
−1.
0−
0.5
0.0
0.5
1.0
1.5
2.0
advice distance
conf
iden
ce s
hift
3.3 Discussion
The results of Experiment 1 show that the relation of advice
distance and advice weighting is not monotone as previously
assumed. Rather, it is characterized by lower weights of ad-
vice for both near and far advice. The low weights of near
advice are the result of judges’ being more likely to retain
their initial opinions when receiving advice close to their
own initial estimates, an observation consistent with the idea
of ROPEs. However, the results also indicate that advice
close to judges’ own initial estimates is likely to be seen as
social validation of these estimates. Although judges hardly
adjusted their estimates towards near advice, they became
more confident in their own estimates at the same time. In
other words, very near advice is, in fact, utilized, though not
necessarily by adjusting the final estimate but rather by in-
creasing the judge’s confidence that the initial estimate was
right in the first place. Finally, our investigation of abso-
lute opinion change revealed an interesting pattern, namely
a mostly linear increase with a barely noticeable negative
acceleration. The further the advice was from judges’ ini-
tial estimates, the more they shifted their opinion towards
it. This finding seems more in line with an SRM than SJT,
but we cannot rule out that more pronounced nonlinear ef-
fects and—possibly—decreasing opinion shifts would have
occurred had we investigated more extreme advice distances
(we will address this possibility in Experiment 3).
4 Experiment 2
The aim of Experiment 2 was to test whether the results of
Experiment 1 would generalize to another task type. This
time, subjects were asked to estimate the caloric content of
different types of food (e.g., toast, peas, boiled egg; calories
per 100g, one food at a time). This task was adopted from a
study by Yaniv et al. (2009).
4.1 Method
4.1.1 Subjects
The data from 31 undergraduate students (M = 24.35 years,
SD = 4.35) were analyzed in Experiment 2. The sample
consisted of 18 (58.1%) female and 13 male subjects who
either received course credits or 5 Euro (approx. $6.80 at
the time of the study) for participating. As with Experi-
ment 1, we chose a sample size similar to that in the original
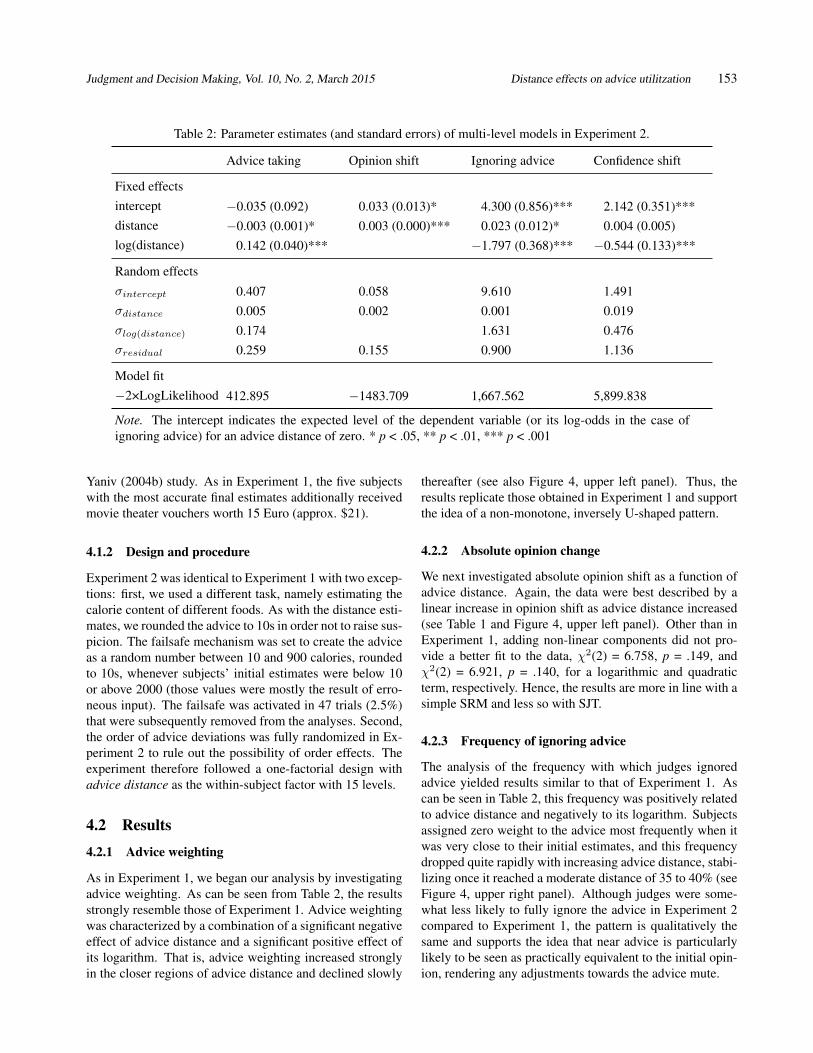
Judgment and Decision Making, Vol. 10, No. 2, March 2015 Distance effects on advice utilitzation 153
Table 2: Parameter estimates (and standard errors) of multi-level models in Experiment 2.
Advice taking Opinion shift Ignoring advice Confidence shift
Fixed effects
intercept −0.035 (0.092) 0.033 (0.013)* 4.300 (0.856)*** 2.142 (0.351)***
distance −0.003 (0.001)* 0.003 (0.000)*** 0.023 (0.012)* 0.004 (0.005)
log(distance) 0.142 (0.040)*** −1.797 (0.368)*** −0.544 (0.133)***
Random effects
σintercept 0.407 0.058 9.610 1.491
σdistance 0.005 0.002 0.001 0.019
σlog(distance) 0.174 1.631 0.476
σresidual 0.259 0.155 0.900 1.136
Model fit
−2×LogLikelihood 412.895 −1483.709 1,667.562 5,899.838
Note. The intercept indicates the expected level of the dependent variable (or its log-odds in the case of
ignoring advice) for an advice distance of zero. * p < .05, ** p < .01, *** p < .001
Yaniv (2004b) study. As in Experiment 1, the five subjects
with the most accurate final estimates additionally received
movie theater vouchers worth 15 Euro (approx. $21).
4.1.2 Design and procedure
Experiment 2 was identical to Experiment 1 with two excep-
tions: first, we used a different task, namely estimating the
calorie content of different foods. As with the distance esti-
mates, we rounded the advice to 10s in order not to raise sus-
picion. The failsafe mechanism was set to create the advice
as a random number between 10 and 900 calories, rounded
to 10s, whenever subjects’ initial estimates were below 10
or above 2000 (those values were mostly the result of erro-
neous input). The failsafe was activated in 47 trials (2.5%)
that were subsequently removed from the analyses. Second,
the order of advice deviations was fully randomized in Ex-
periment 2 to rule out the possibility of order effects. The
experiment therefore followed a one-factorial design with
advice distance as the within-subject factor with 15 levels.
4.2 Results
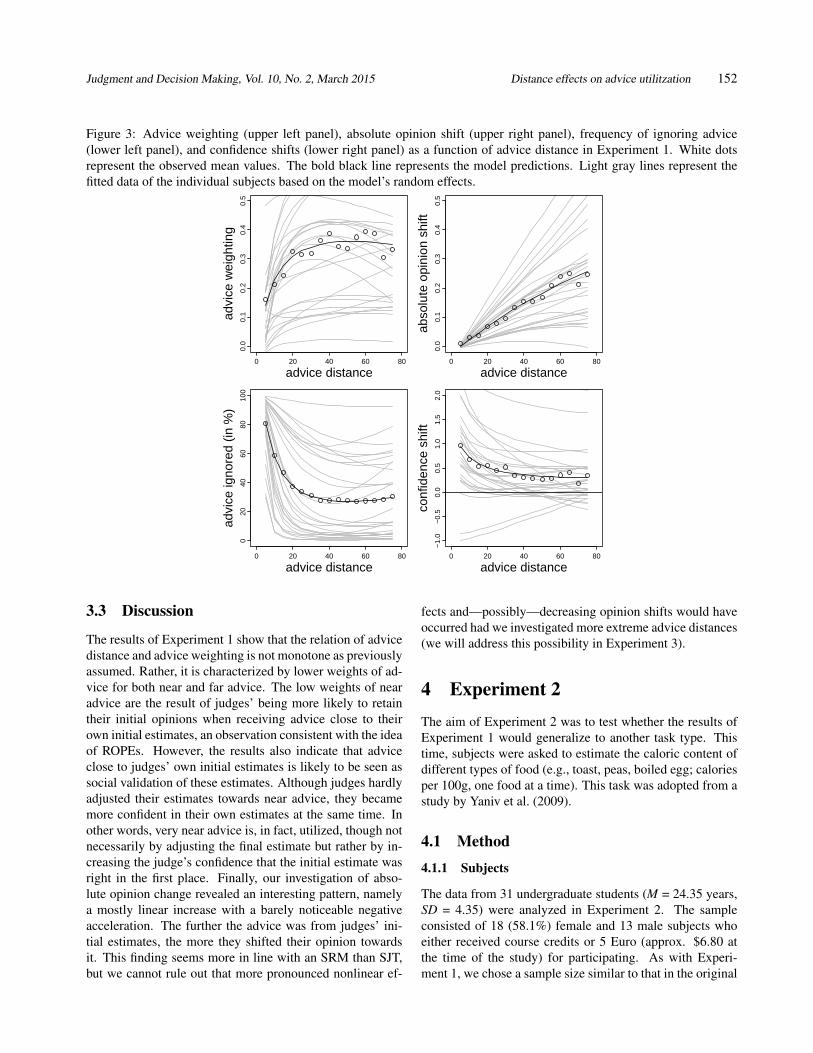
4.2.1 Advice weighting
As in Experiment 1, we began our analysis by investigating
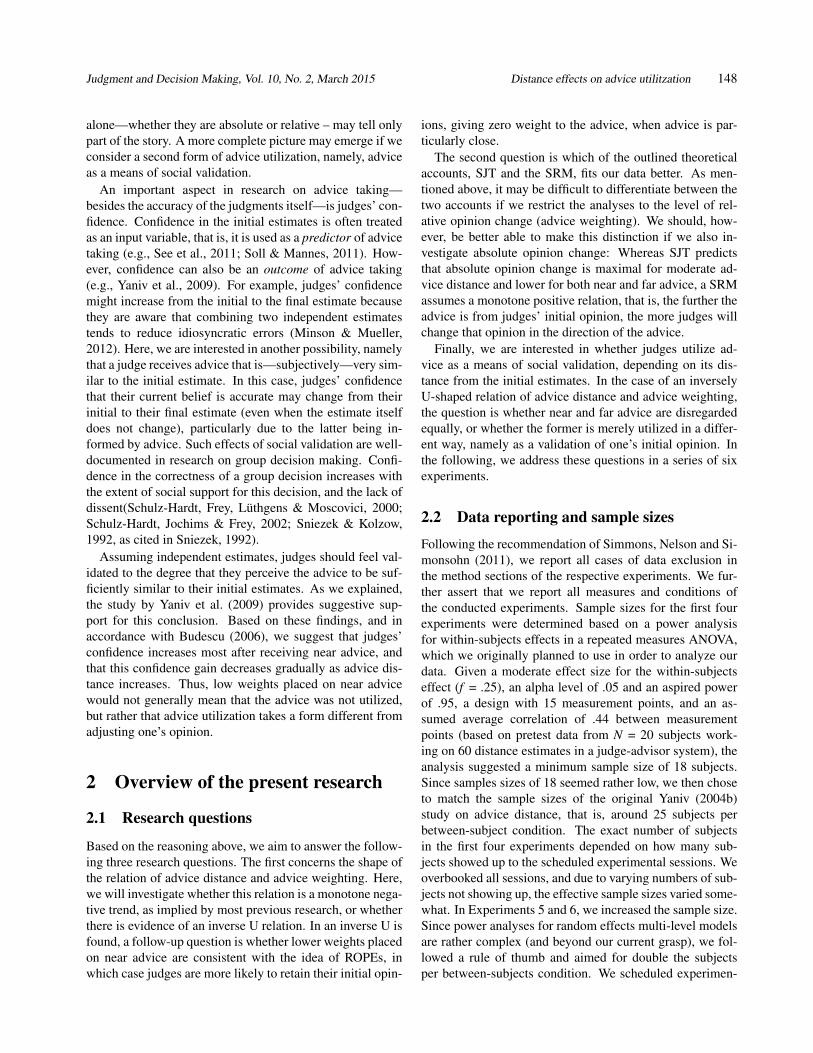
advice weighting. As can be seen from Table 2, the results
strongly resemble those of Experiment 1. Advice weighting
was characterized by a combination of a significant negative
effect of advice distance and a significant positive effect of
its logarithm. That is, advice weighting increased strongly
in the closer regions of advice distance and declined slowly
thereafter (see also Figure 4, upper left panel). Thus, the
results replicate those obtained in Experiment 1 and support
the idea of a non-monotone, inversely U-shaped pattern.
4.2.2 Absolute opinion change
We next investigated absolute opinion shift as a function of
advice distance. Again, the data were best described by a
linear increase in opinion shift as advice distance increased
(see Table 1 and Figure 4, upper left panel). Other than in
Experiment 1, adding non-linear components did not pro-
vide a better fit to the data, χ2(2) = 6.758, p = .149, and
χ2(2) = 6.921, p = .140, for a logarithmic and quadratic
term, respectively. Hence, the results are more in line with a
simple SRM and less so with SJT.
4.2.3 Frequency of ignoring advice
The analysis of the frequency with which judges ignored
advice yielded results similar to that of Experiment 1. As
can be seen in Table 2, this frequency was positively related
to advice distance and negatively to its logarithm. Subjects
assigned zero weight to the advice most frequently when it
was very close to their initial estimates, and this frequency
dropped quite rapidly with increasing advice distance, stabi-
lizing once it reached a moderate distance of 35 to 40% (see
Figure 4, upper right panel). Although judges were some-
what less likely to fully ignore the advice in Experiment 2
compared to Experiment 1, the pattern is qualitatively the
same and supports the idea that near advice is particularly
likely to be seen as practically equivalent to the initial opin-
ion, rendering any adjustments towards the advice mute.
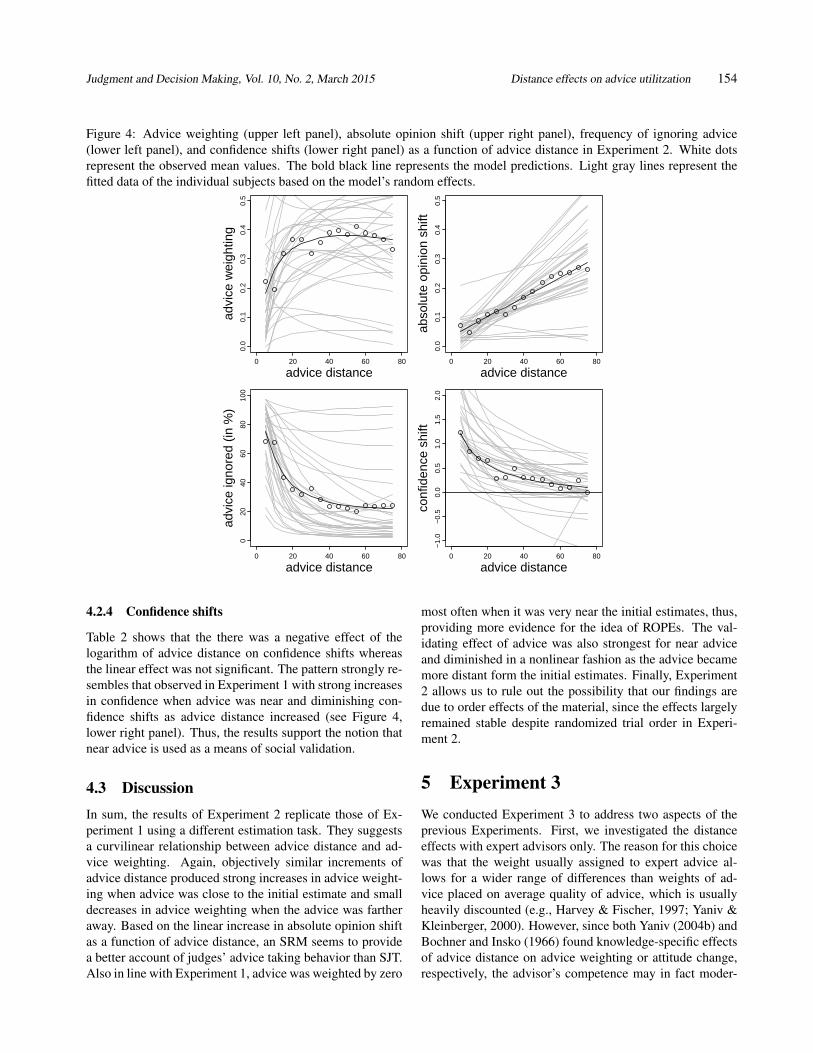
Judgment and Decision Making, Vol. 10, No. 2, March 2015 Distance effects on advice utilitzation 154
Figure 4: Advice weighting (upper left panel), absolute opinion shift (upper right panel), frequency of ignoring advice
(lower left panel), and confidence shifts (lower right panel) as a function of advice distance in Experiment 2. White dots
represent the observed mean values. The bold black line represents the model predictions. Light gray lines represent the
fitted data of the individual subjects based on the model’s random effects.
0 20 40 60 80
0.0
0.1
0.2
0.3
0.4
0.5
advice distance
advi
ce w
eigh
ting
0 20 40 60 80
0.0
0.1
0.2
0.3
0.4
0.5
advice distance
abso
lute
opi
nion
shi
ft
0 20 40 60 80
020
4060
8010
0
advice distance
advi
ce ig
nore
d (in
%)
0 20 40 60 80
−1.
0−
0.5
0.0
0.5
1.0
1.5
2.0
advice distance
conf
iden
ce s
hift
4.2.4 Confidence shifts
Table 2 shows that the there was a negative effect of the
logarithm of advice distance on confidence shifts whereas
the linear effect was not significant. The pattern strongly re-
sembles that observed in Experiment 1 with strong increases
in confidence when advice was near and diminishing con-
fidence shifts as advice distance increased (see Figure 4,
lower right panel). Thus, the results support the notion that
near advice is used as a means of social validation.
4.3 Discussion
In sum, the results of Experiment 2 replicate those of Ex-
periment 1 using a different estimation task. They suggests
a curvilinear relationship between advice distance and ad-
vice weighting. Again, objectively similar increments of
advice distance produced strong increases in advice weight-
ing when advice was close to the initial estimate and small
decreases in advice weighting when the advice was farther
away. Based on the linear increase in absolute opinion shift
as a function of advice distance, an SRM seems to provide
a better account of judges’ advice taking behavior than SJT.
Also in line with Experiment 1, advice was weighted by zero
most often when it was very near the initial estimates, thus,
providing more evidence for the idea of ROPEs. The val-
idating effect of advice was also strongest for near advice
and diminished in a nonlinear fashion as the advice became
more distant form the initial estimates. Finally, Experiment
2 allows us to rule out the possibility that our findings are
due to order effects of the material, since the effects largely
remained stable despite randomized trial order in Experi-
ment 2.
5 Experiment 3
We conducted Experiment 3 to address two aspects of the
previous Experiments. First, we investigated the distance
effects with expert advisors only. The reason for this choice
was that the weight usually assigned to expert advice al-
lows for a wider range of differences than weights of ad-
vice placed on average quality of advice, which is usually
heavily discounted (e.g., Harvey & Fischer, 1997; Yaniv &
Kleinberger, 2000). However, since both Yaniv (2004b) and
Bochner and Insko (1966) found knowledge-specific effects
of advice distance on advice weighting or attitude change,
respectively, the advisor’s competence may in fact moder-
Judgment and Decision Making, Vol. 10, No. 2, March 2015 Distance effects on advice utilitzation 155
ate the impact of advice distance on advice utilization. For
example, individuals may be more open to dissimilar ad-
vice when it stems from an expert source. Second, in the
first two experiments we quite arbitrarily chose a range of
advice distances with a maximum of 75% of judges’ ini-
tial estimates. In both experiments, we found evidence for
decreased weights placed on farther advice, but the effects
seemed rather small compared to the strong decreases for
very near advice. In addition, absolute opinion shifts neither
showed a decline in opinion shifts as suggested by SJT nor
a particularly pronounced negative acceleration that would
result from diminished sensitivity in an SRM. This may very
well be a result of an overly narrow range of advice distance.
In order to address these issues, we replicated Experiment 1
and introduced a second advisor who was allegedly rather
low in expertise. In addition, we expanded the range of ad-
vice distance.
5.1 Method
5.1.1 Subjects
Thirty-nine graduate and undergraduate students (M = 22.00
years, SD = 2.61 years) took part in the study. The sample
consisted of 21 (54%) female and 18 male subjects. Sub-
jects received either course credit or payment of 6 Euro (ap-
prox. $8.50). Again, the five most accurate subjects re-
ceived movie theater vouchers worth 15 Euro ($21) to en-
sure subjects were motivated to perform well.
5.1.2 Design and procedure
Experiment 3 was similar to Experiment 1 with two excep-
tions. First, the competence of the advisor was manipulated
between subjects: half of the subjects received advice from
a supposedly competent advisor (ranked 7th out of 100—
similar to Experiments 1 and 2) whereas the other half re-
ceived estimates from a supposedly less competent advisor
(ranked 78th of 100). Second, the range of advice distance
was expanded. In addition to deviations of ± 5% to ± 75% in
steps of 5%, positive deviations of up to 150%, also in steps
of 5%, were added. Each positive and negative percent de-
viation from 5% to 75% was run once, and each (positive)
deviation from 80% to 150% was run twice. Deviations of
80% and higher were only applied in the form of positive
values, because otherwise it is highly likely that the result-
ing advice would have appeared unrealistically low. Fur-
thermore, deviations of 100% and higher were applied only
in the form of positive values because, logically, there can
be no negative distances between two geographical loca-
tions. Experiment 3 was a mixed design with the between-
subjects factor advisor competence (competent vs. less com-
petent) and the within-subjects factor advice distance con-
sisting of thirty levels of absolute advice deviation. The
study included 60 trials with advice preset to appear in the
same previously randomized sequence for all subjects. We
switched back to this procedure since a full randomization,
as applied in Experiment 2, did not lead to crucial differ-
ences regarding the effects of manipulated advice distance
on advice weighting and confidence shift. A failsafe mech-
anism similar to that in Experiment 1 led to the exclusion of
42 trials (1.8%) from the analyses.
5.2 Results
5.2.1 Advice weighting
As in Experiments 1 and 2, we first analyzed advice weight-
ing. Due to the addition of advisor expertise as a predictor
on the subject level, the full model containing all fixed ef-
fects is much more complex than those in the previous ex-
periments. We, therefore, used a stepwise approach to de-
termine the appropriate model as outlined above. The basic
model contained only the fixed effects of advisor compe-
tence and the two components of advice distance. It also
included random intercepts and random slopes for the two
distance components. We then tested whether adding the
cross-level interactions (i.e., the interactions of advisor com-
petence and the advice distance components) led to a signif-
icant increase in model fit. This was not the case, χ2(2)
= 5.247, p = .073, implying that there was no significant
interaction of advice distance and advisor expertise. How-
ever, since the Likelihood-Ratio test failed to reach statisti-
cal significance by only a small margin, rejecting the more
complex model also did not seem justified. We therefore
adopted the mode complex model (see Table 3).4
The analysis revealed a significant positive effect of the
logarithm of advice distance similar to those in the previ-
ous experiments. The effect of advice distance itself was,
again, negative, but it was not statistically significant. In-
stead, there was a significant interaction of advice distance
and advisor competence. In order to disentangle this inter-
action, we analyzed the data separately for the competent
and the less competent advisor. For the competent advisor
we found the same pattern as in the previous experiment,
that is, a significant negative effect of advice distance, B =
−0.002 (SE = 0.001), t(1097) = −3.901, p < .001, and a
significant positive effect of its logarithm, B = 0.123 (SE =
0.035), t(1097) = 3.513, p < .001. For the less competent ad-
visor the logarithmic effect was also significant and positive,
B = 0.060 (SE = 0.025), t(1156) = 2.406, p = .016, while the
linear effect—although also negative—was not significant,
B = −0.000 (SE = 0.000), t(1156) = −1.357. p = .175. As
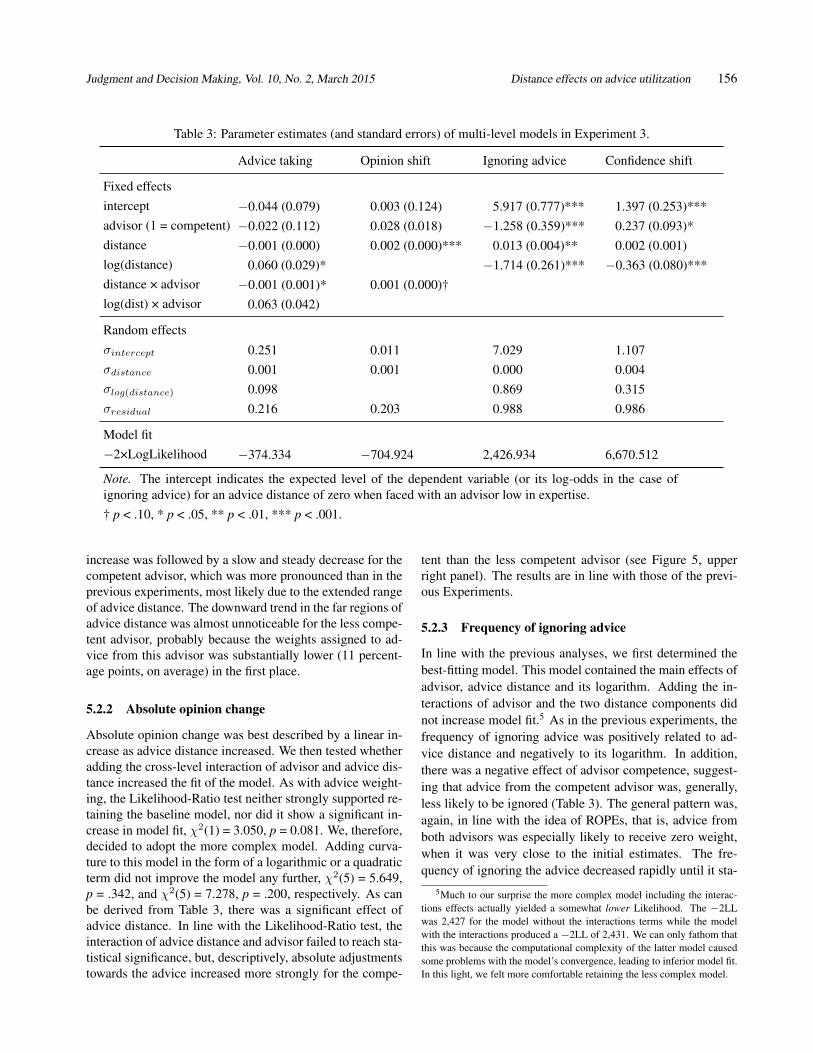
can be seen in Figure 5 (upper left panel), we again found a
strong increase in advice weighting in the near regions. This
4The basic model yields results similar to those of Experiments 1 and
2, that is, a significant negative effect of advice distance and a significant
positive effect of its logarithm. In addition, there is an effect of advisor with
the competent advisor being weighted more strongly than the incompetent
advisor.
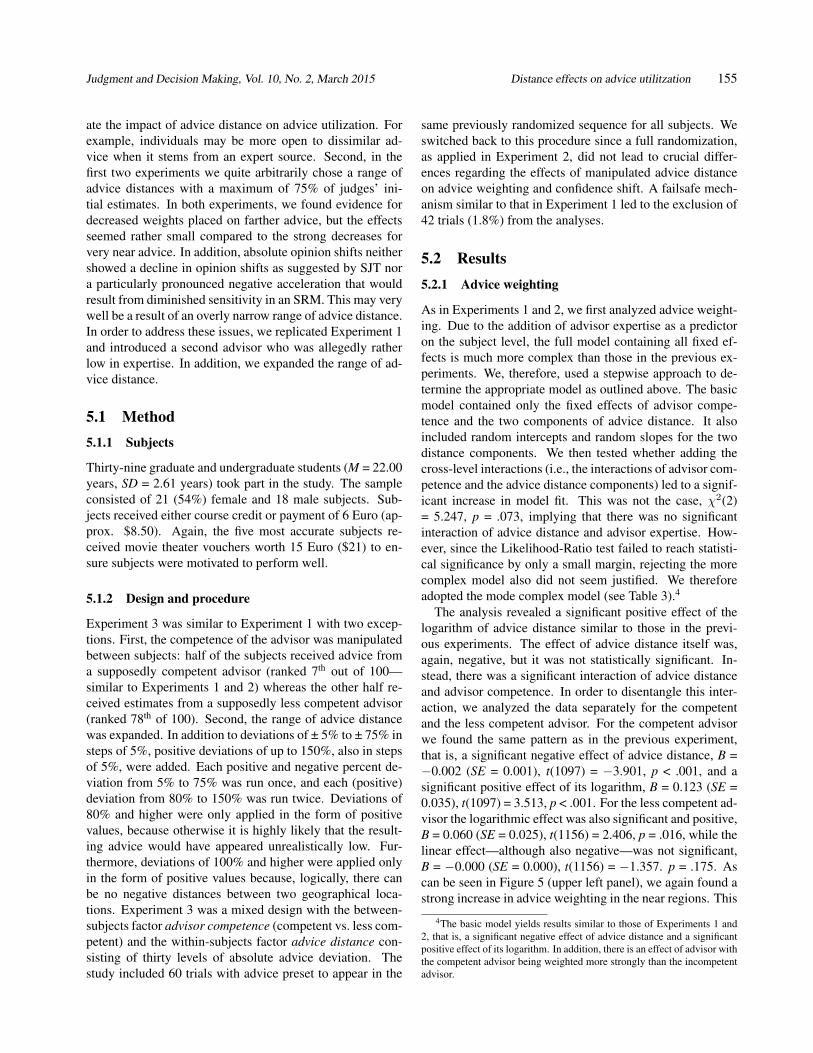
Judgment and Decision Making, Vol. 10, No. 2, March 2015 Distance effects on advice utilitzation 156
Table 3: Parameter estimates (and standard errors) of multi-level models in Experiment 3.
Advice taking Opinion shift Ignoring advice Confidence shift
Fixed effects
intercept −0.044 (0.079) 0.003 (0.124) 5.917 (0.777)*** 1.397 (0.253)***
advisor (1 = competent) −0.022 (0.112) 0.028 (0.018) −1.258 (0.359)*** 0.237 (0.093)*
distance −0.001 (0.000) 0.002 (0.000)*** 0.013 (0.004)** 0.002 (0.001)
log(distance) 0.060 (0.029)* −1.714 (0.261)*** −0.363 (0.080)***
distance × advisor −0.001 (0.001)* 0.001 (0.000)†
log(dist) × advisor 0.063 (0.042)
Random effects
σintercept 0.251 0.011 7.029 1.107
σdistance 0.001 0.001 0.000 0.004
σlog(distance) 0.098 0.869 0.315
σresidual 0.216 0.203 0.988 0.986
Model fit
−2×LogLikelihood −374.334 −704.924 2,426.934 6,670.512
Note. The intercept indicates the expected level of the dependent variable (or its log-odds in the case of
ignoring advice) for an advice distance of zero when faced with an advisor low in expertise.
† p < .10, * p < .05, ** p < .01, *** p < .001.
increase was followed by a slow and steady decrease for the
competent advisor, which was more pronounced than in the
previous experiments, most likely due to the extended range
of advice distance. The downward trend in the far regions of
advice distance was almost unnoticeable for the less compe-
tent advisor, probably because the weights assigned to ad-
vice from this advisor was substantially lower (11 percent-
age points, on average) in the first place.
5.2.2 Absolute opinion change
Absolute opinion change was best described by a linear in-
crease as advice distance increased. We then tested whether
adding the cross-level interaction of advisor and advice dis-
tance increased the fit of the model. As with advice weight-
ing, the Likelihood-Ratio test neither strongly supported re-
taining the baseline model, nor did it show a significant in-
crease in model fit, χ2(1) = 3.050, p = 0.081. We, therefore,
decided to adopt the more complex model. Adding curva-
ture to this model in the form of a logarithmic or a quadratic
term did not improve the model any further, χ2(5) = 5.649,
p = .342, and χ2(5) = 7.278, p = .200, respectively. As can
be derived from Table 3, there was a significant effect of
advice distance. In line with the Likelihood-Ratio test, the
interaction of advice distance and advisor failed to reach sta-
tistical significance, but, descriptively, absolute adjustments
towards the advice increased more strongly for the compe-
tent than the less competent advisor (see Figure 5, upper
right panel). The results are in line with those of the previ-
ous Experiments.
5.2.3 Frequency of ignoring advice
In line with the previous analyses, we first determined the
best-fitting model. This model contained the main effects of
advisor, advice distance and its logarithm. Adding the in-
teractions of advisor and the two distance components did
not increase model fit.5 As in the previous experiments, the
frequency of ignoring advice was positively related to ad-
vice distance and negatively to its logarithm. In addition,
there was a negative effect of advisor competence, suggest-
ing that advice from the competent advisor was, generally,
less likely to be ignored (Table 3). The general pattern was,
again, in line with the idea of ROPEs, that is, advice from
both advisors was especially likely to receive zero weight,
when it was very close to the initial estimates. The fre-
quency of ignoring the advice decreased rapidly until it sta-
5Much to our surprise the more complex model including the interac-
tions effects actually yielded a somewhat lower Likelihood. The −2LL
was 2,427 for the model without the interactions terms while the model
with the interactions produced a −2LL of 2,431. We can only fathom that
this was because the computational complexity of the latter model caused
some problems with the model’s convergence, leading to inferior model fit.
In this light, we felt more comfortable retaining the less complex model.
Judgment and Decision Making, Vol. 10, No. 2, March 2015 Distance effects on advice utilitzation 157
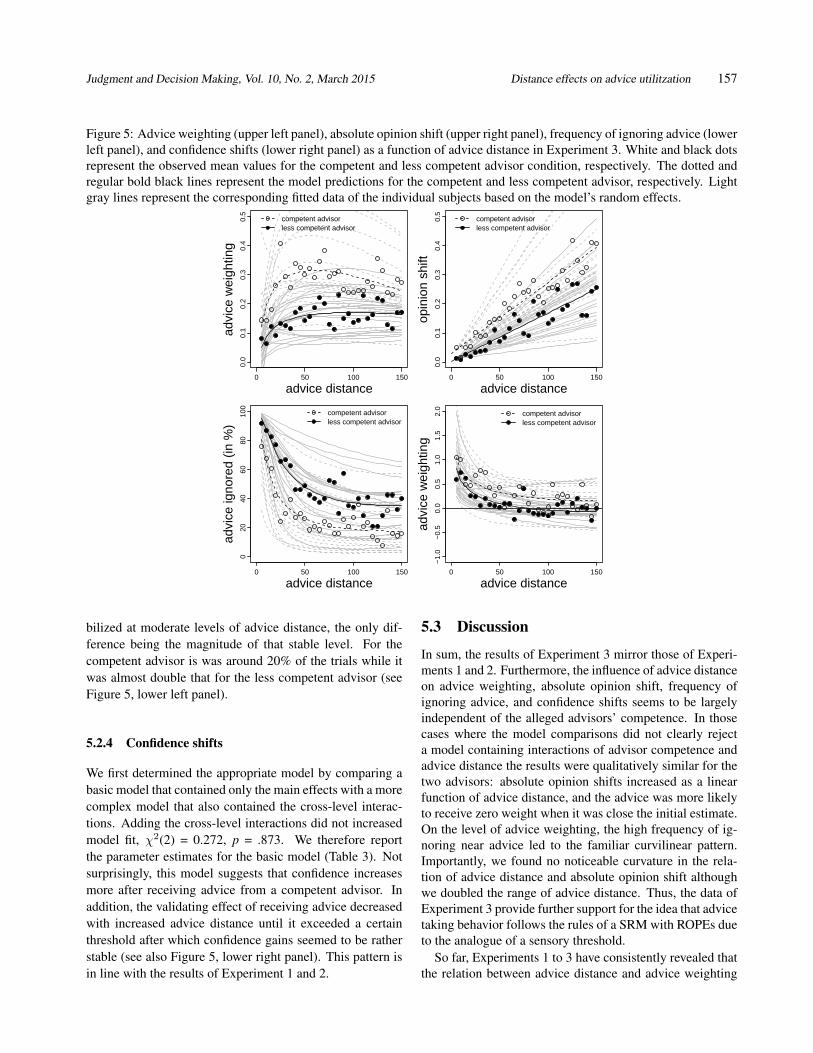
Figure 5: Advice weighting (upper left panel), absolute opinion shift (upper right panel), frequency of ignoring advice (lower
left panel), and confidence shifts (lower right panel) as a function of advice distance in Experiment 3. White and black dots
represent the observed mean values for the competent and less competent advisor condition, respectively. The dotted and
regular bold black lines represent the model predictions for the competent and less competent advisor, respectively. Light
gray lines represent the corresponding fitted data of the individual subjects based on the model’s random effects.
competent advisorless competent advisor
0 50 100 150
0.0
0.1
0.2
0.3
0.4
0.5
advice distance
advi
ce w
eigh
ting
competent advisorless competent advisor
0 50 100 150
0.0
0.1
0.2
0.3
0.4
0.5
advice distance
opin
ion
shift
competent advisorless competent advisor
0 50 100 150
020
4060
8010
0
advice distance
advi
ce ig
nore
d (in
%)
competent advisorless competent advisor
0 50 100 150
−1.
0−
0.5
0.0
0.5
1.0
1.5
2.0
advice distance
advi
ce w
eigh
ting
bilized at moderate levels of advice distance, the only dif-
ference being the magnitude of that stable level. For the
competent advisor is was around 20% of the trials while it
was almost double that for the less competent advisor (see
Figure 5, lower left panel).
5.2.4 Confidence shifts
We first determined the appropriate model by comparing a
basic model that contained only the main effects with a more
complex model that also contained the cross-level interac-
tions. Adding the cross-level interactions did not increased
model fit, χ2(2) = 0.272, p = .873. We therefore report
the parameter estimates for the basic model (Table 3). Not
surprisingly, this model suggests that confidence increases
more after receiving advice from a competent advisor. In
addition, the validating effect of receiving advice decreased
with increased advice distance until it exceeded a certain
threshold after which confidence gains seemed to be rather
stable (see also Figure 5, lower right panel). This pattern is
in line with the results of Experiment 1 and 2.
5.3 Discussion
In sum, the results of Experiment 3 mirror those of Experi-
ments 1 and 2. Furthermore, the influence of advice distance
on advice weighting, absolute opinion shift, frequency of
ignoring advice, and confidence shifts seems to be largely
independent of the alleged advisors’ competence. In those
cases where the model comparisons did not clearly reject
a model containing interactions of advisor competence and
advice distance the results were qualitatively similar for the
two advisors: absolute opinion shifts increased as a linear
function of advice distance, and the advice was more likely
to receive zero weight when it was close the initial estimate.
On the level of advice weighting, the high frequency of ig-
noring near advice led to the familiar curvilinear pattern.
Importantly, we found no noticeable curvature in the rela-
tion of advice distance and absolute opinion shift although
we doubled the range of advice distance. Thus, the data of
Experiment 3 provide further support for the idea that advice
taking behavior follows the rules of a SRM with ROPEs due
to the analogue of a sensory threshold.
So far, Experiments 1 to 3 have consistently revealed that
the relation between advice distance and advice weighting
Judgment and Decision Making, Vol. 10, No. 2, March 2015 Distance effects on advice utilitzation 158
is nonlinear and best described by a combination of a posi-
tive logarithmic effect and a downward linear trend. These
results contradict those of previous studies, in particular the
seminal study by Yaniv (2004b). Initially, we argued that
this difference is due to the rescaling of advice distance into
distinct categories, which made it difficult, if not impossible,
to identify the exact shape of the relationship of advice dis-
tance and advice weighting. However, this methodological
point is not the only explanation for the different findings.
Forming distinct advice distance categories might have also
led subjects to process advice distance in a qualitatively dif-
ferent manner. In addition, Yaniv used a different estimation
task, and although we found rather similar effects using two
different estimation tasks, we cannot rule out, that the task
Yaniv used leads to a different advice weighting function
than those we observed in Experiment 1 to 3. We address
these points in Experiments 4 and 5.
6 Experiment 4
In Experiments 1 to 3 we manipulated advice distance con-
tinuously in small steps of 5%. As we have outlined above,
this fine-grained manipulation of advice distance is neces-
sary when we want to properly analyze the shape of the re-
lation of distance and the measures of advice utilization. In
contrast, Yaniv (2004b) provided his subjects with advice
that fell into one of three categories regarding the devia-
tion of advice from people’s initial estimates. As mentioned
above, the categories used were “near”, “intermediate” and
“far”. Although advice varied to a certain amount within
these categories, a categorical manipulation might have led
subjects to differentiate more clearly between near, inter-
mediate, and far advice than subjects in our study did. In
other words, the difference between our findings and those
of Yaniv might be due not only to the methodological prob-
lem associated with the categorization of the advice dis-
tance. Instead, it is possible that this categorization leads
judges to perceive advice distance differently, resulting in
a different advice weighting function. In Experiment 4 we
address this possibility by comparing continuous and cate-
gorical manipulations of advice distance.
6.1 Method
6.1.1 Subjects
The data of 104 graduate and undergraduate students (M =
21.32 years, SD = 2.59 years) were collected in Study 4.
Sixty-eight (65%) of the respondents were female and 36
were male. As in Studies 1 to 3, subjects received either
course credit or 6C (approx. $8.50) for participation, and
we again provided additional incentives in the form of movie
theater vouchers worth 15 Euro ($ 21) for the top five per-
forming individuals.
6.1.2 Design and procedure
Task content and trial structure of Experiment 4 were iden-
tical to Experiment 3, except that we added the mode of ma-
nipulating advice distance as a second independent variable
(in addition to advisor competence). That is, the distance
between the initial estimates and the received advice was ei-
ther continuously altered as in our previous studies or it was
varied within four categories regarding the distance to their
initial estimates (near, intermediate, far, very far). The devi-
ations in the continuous distance condition were slightly dif-
ferent from those applied in Experiment 3 to increase com-
parability of the two distance mode conditions in the statis-
tical analysis. Continuous advice differed between ±5% and
±70% as well as +75% up to +140% from the respondents’
initial estimate, in steps of 5%. Each positive and negative
deviation from 5% to 70% was applied once, and each (pos-
itive) deviation from 75% to 140% was run twice. The four
levels of advice distance in the categorical condition were
chosen to equal the mean deviation of a set of seven consec-
utive continuous distance categories: For example, the de-
viation in the “near” category was 20%, which is equivalent
to the mean of the continuous deviations between 5% and
35%. Following this procedure, a total of four distance cat-
egories resulted: 20%, 55%, 90% and 125%, with 20% and
55% being applied as both positive and negative deviations
to establish maximum comparability of the two modes of
distance manipulation. Distances of ±20% and ±55% were
run seven times and deviations of 90% and 125% were run
fourteen times each. Subjects therefore had to work on 56
trials in one of the two distance mode conditions, and the
alleged advice was, on average, equally far away in both
conditions.
Also, as in Experiment 2, the order of advice deviations
was fully randomized in Experiment 4 to avoid confounding
the sequence of advice deviations with the mode of advice
manipulation. We excluded 206 trials (3.5%) from the anal-
yses as they triggered a failsafe mechanism similar to those
used in Experiments 1 and 3.
6.2 Results and discussion
6.2.1 Advice weighting
We began the analysis by determining the model most ap-
propriate to describe our data. We started with a basic model
containing fixed effects of advisor expertise and distance
mode, their interaction, the fixed effects of advice distance
and its logarithm, random intercepts, and random slopes for
advice distance and its logarithm. A more complex model
that also contained the two-way cross-level interactions did
not provide a better fit to the data, χ2(4) = 0.293, p = .864.
Neither did the full model which also contained the three-
way cross-level interactions, χ2(6) = 0.592, p = .997. We
Judgment and Decision Making, Vol. 10, No. 2, March 2015 Distance effects on advice utilitzation 159
Table 4: Parameter estimates (and standard errors) of multi-level models in Experiment 4.
Advice taking Opinion shift Ignoring advice Confidence shift
Fixed effects
intercept −0.117 (0.051)* 0.006 (0.033) 5.607 (0.601)*** 0.824 (0.415)*
advisor (1 = competent) 0.158 (0.040)*** −0.020 (0.015) −1.421 (0.391)*** 1.540 (0.427)***
distance mode 0.034 (0.039) 0.012 (0.015) −0.123 (0.385) −0.035 (0.455)
advisor × distance mode −0.067 (0.055) 0.004 (0.017) 0.824 (0.543) −0.366 (0.165)*
distance −0.002 (0.000)*** 0.002 (0.000)*** 0.019 (0.003)*** 0.002 (0.002)
log(distance) 0.100 (0.015)*** −0.007 (0.011) −1.788 (0.183)*** 0.003 (0.002)
distance × advisor 0.001 (0.000)*** −0.003 (0.002)
distance × dist. mode −0.000 (0.000) −0.220 (0.129)
log(dist.) × advisor −0.363 (0.127)**
log(dist.) × dist. mode 0.118 (0.138)
Random effects
σintercept 0.288 0.071 10.92 1.627
σdistance 0.001 0.002 0.000 0.004
σlog(distance) 0.093 0.037 0.865 0.420
σresidual 0.219 0.195 0.954 0.879
Model fit
−2×LogLikelihood −633.236 −2,059.826 5,620.052 14,657.812
Note. The intercept indicates the expected level of the dependent variable (or its log-odds in the case of ignoring
advice) for an advice distance of zero when faced with an advisor low in expertise and working in the categorical
distance mode. * p < .05, ** p < .01, *** p < .001.
therefore report the parameter estimates for the basic model
(Table 4).
In line with the findings of Experiments 1 to 3, there
was both a negative effect of linear and a positive effect of
logarithmic advice distance on advice weighting. Not sur-
prisingly, advice from the allegedly competent advisor was
weighted more strongly than that of the less competent advi-
sor. Finally, neither the main effect of distance mode nor its
interaction with advisor expertise were significant. Hence,
the distance effects on advice weighting did not depend on
the mode of distance manipulation. In line with the results
of Experiment 3, whether advice was provided by an al-
legedly competent or less competent source, the relationship
between advice distance and advice taking was, once more,
characterized by a strong increase in advice taking followed
by a slow decline (see also Figure 6). These results sug-
gest that the discrepancy between our findings and those of
Yaniv (2004b) are unlikely to be the result of subjects per-
ceiving advice distance differently based on the way it was
operationalized.
6.2.2 Absolute opinion change
As with the AT scores, we first identified the model that
best described our data. The basic model contained the
between-subject variables, their interaction, advice distance,
random intercept, and random slopes for advice distance.
Adding the two-way cross-level interactions led to a signif-
icant increase in model fit, χ2(2) = 11.301, p = .004, but
adding the three-way interaction did not further improve it,
χ2(1) = 0.644, p = .422. As in the previous Experiments,
we also tested whether model fit increased when we added
non-linear terms and the corresponding random slopes to
the model. Model fit increased both when adding the log-
arithm of advice taking and squared advice distance, χ2(4)
= 15.481, p = .004, and χ2(4) = 11.149, p = .025, respec-
tively (adding interactions of the between-subject variables
and the non-linear terms did not improve the model further,
both p < .16). Since the increase in model fit was greater for
the model containing the logarithm of advice distance, we
adopted it as the best-fitting model.
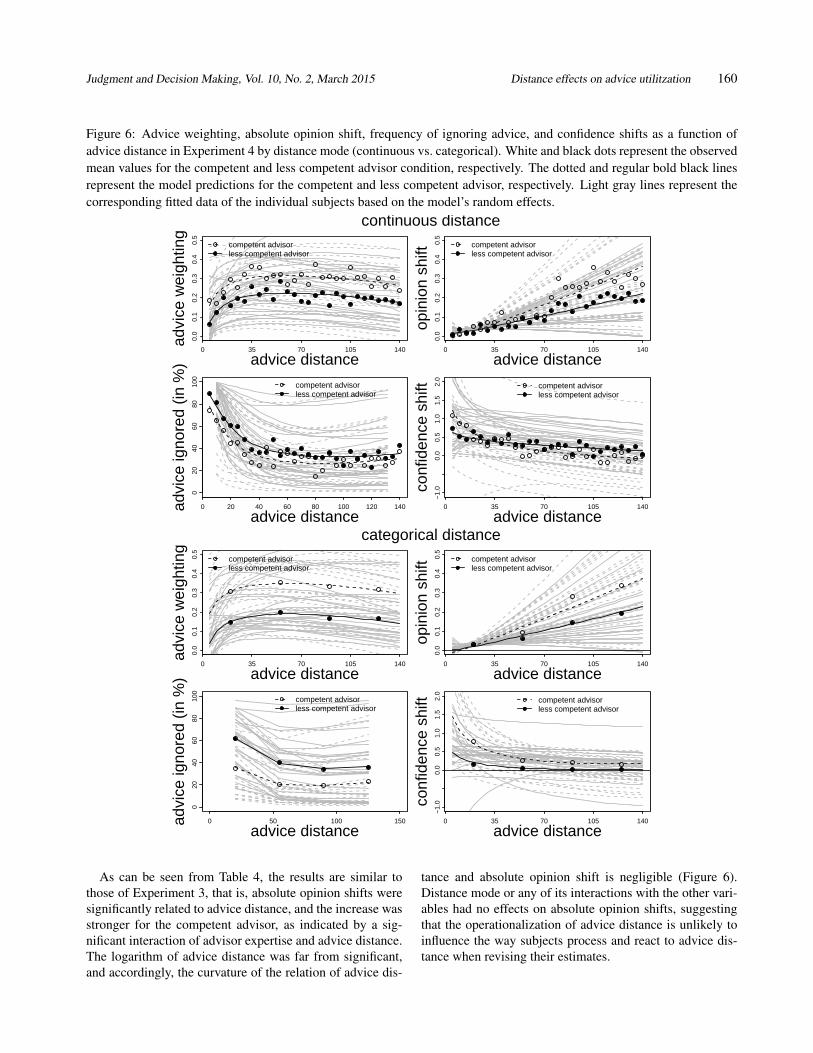
Judgment and Decision Making, Vol. 10, No. 2, March 2015 Distance effects on advice utilitzation 160
Figure 6: Advice weighting, absolute opinion shift, frequency of ignoring advice, and confidence shifts as a function of
advice distance in Experiment 4 by distance mode (continuous vs. categorical). White and black dots represent the observed
mean values for the competent and less competent advisor condition, respectively. The dotted and regular bold black lines
represent the model predictions for the competent and less competent advisor, respectively. Light gray lines represent the
corresponding fitted data of the individual subjects based on the model’s random effects.
competent advisorless competent advisor
0 35 70 105 140
0.0
0.1
0.2
0.3
0.4
0.5
advice distance
advi
ce w
eigh
ting
continuous distancecompetent advisorless competent advisor
0 35 70 105 140
0.0
0.1
0.2
0.3
0.4
0.5
advice distance
opin
ion
shift
competent advisorless competent advisor
0 20 40 60 80 100 120 140
020
4060
8010
0
advice distance
advi
ce ig
nore
d (in
%)
competent advisorless competent advisor
0 35 70 105 140
−1.
00.
00.
51.
01.
52.
0
advice distance
conf
iden
ce s
hift
competent advisorless competent advisor
0 35 70 105 140
0.0
0.1
0.2
0.3
0.4
0.5
advice distance
advi
ce w
eigh
ting
categorical distancecompetent advisorless competent advisor
0 35 70 105 140
0.0
0.1
0.2
0.3
0.4
0.5
advice distance
opin
ion
shift
competent advisorless competent advisor
0 50 100 150
020
4060
8010
0
advice distance
advi
ce ig
nore
d (in
%)
competent advisorless competent advisor
0 35 70 105 140
−1.
00.
00.
51.
01.
52.
0
advice distance
conf
iden
ce s
hift
As can be seen from Table 4, the results are similar to
those of Experiment 3, that is, absolute opinion shifts were
significantly related to advice distance, and the increase was
stronger for the competent advisor, as indicated by a sig-
nificant interaction of advisor expertise and advice distance.
The logarithm of advice distance was far from significant,
and accordingly, the curvature of the relation of advice dis-
tance and absolute opinion shift is negligible (Figure 6).
Distance mode or any of its interactions with the other vari-
ables had no effects on absolute opinion shifts, suggesting
that the operationalization of advice distance is unlikely to
influence the way subjects process and react to advice dis-
tance when revising their estimates.
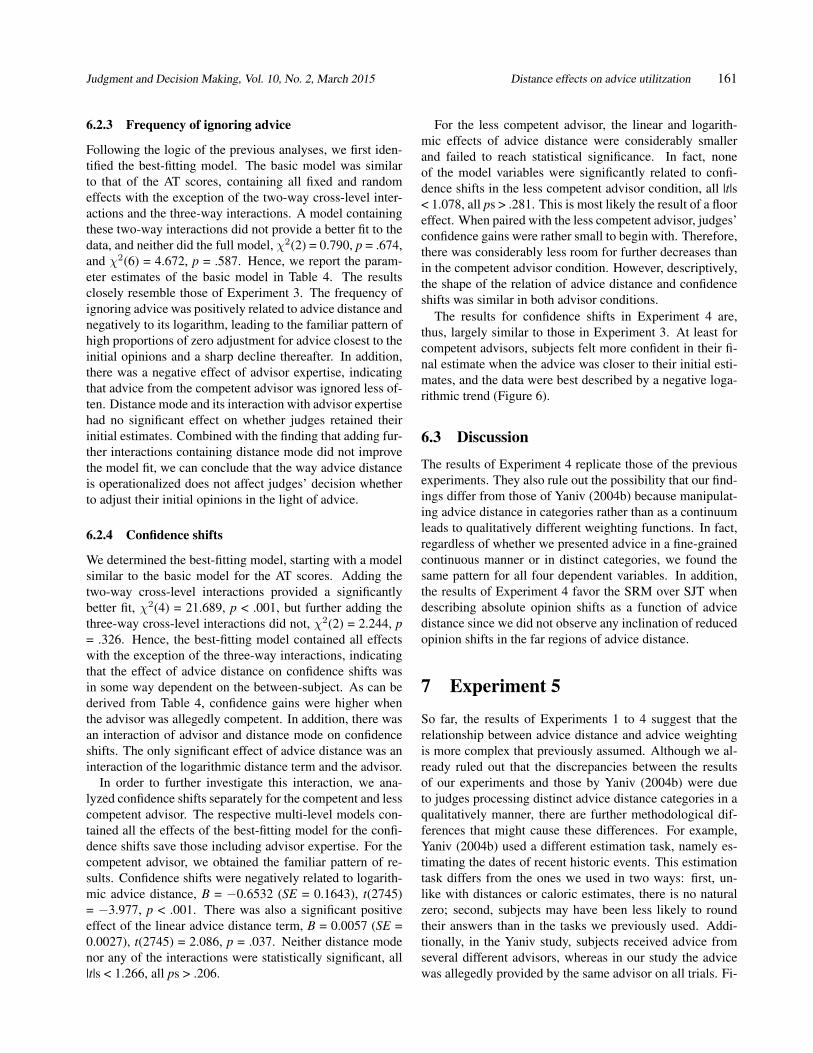
Judgment and Decision Making, Vol. 10, No. 2, March 2015 Distance effects on advice utilitzation 161
6.2.3 Frequency of ignoring advice
Following the logic of the previous analyses, we first iden-
tified the best-fitting model. The basic model was similar
to that of the AT scores, containing all fixed and random
effects with the exception of the two-way cross-level inter-
actions and the three-way interactions. A model containing
these two-way interactions did not provide a better fit to the
data, and neither did the full model, χ2(2) = 0.790, p = .674,
and χ2(6) = 4.672, p = .587. Hence, we report the param-
eter estimates of the basic model in Table 4. The results
closely resemble those of Experiment 3. The frequency of
ignoring advice was positively related to advice distance and
negatively to its logarithm, leading to the familiar pattern of
high proportions of zero adjustment for advice closest to the
initial opinions and a sharp decline thereafter. In addition,
there was a negative effect of advisor expertise, indicating
that advice from the competent advisor was ignored less of-
ten. Distance mode and its interaction with advisor expertise
had no significant effect on whether judges retained their
initial estimates. Combined with the finding that adding fur-
ther interactions containing distance mode did not improve
the model fit, we can conclude that the way advice distance
is operationalized does not affect judges’ decision whether
to adjust their initial opinions in the light of advice.
6.2.4 Confidence shifts
We determined the best-fitting model, starting with a model
similar to the basic model for the AT scores. Adding the
two-way cross-level interactions provided a significantly
better fit, χ2(4) = 21.689, p < .001, but further adding the
three-way cross-level interactions did not, χ2(2) = 2.244, p
= .326. Hence, the best-fitting model contained all effects
with the exception of the three-way interactions, indicating
that the effect of advice distance on confidence shifts was
in some way dependent on the between-subject. As can be
derived from Table 4, confidence gains were higher when
the advisor was allegedly competent. In addition, there was
an interaction of advisor and distance mode on confidence
shifts. The only significant effect of advice distance was an
interaction of the logarithmic distance term and the advisor.
In order to further investigate this interaction, we ana-
lyzed confidence shifts separately for the competent and less
competent advisor. The respective multi-level models con-
tained all the effects of the best-fitting model for the confi-
dence shifts save those including advisor expertise. For the
competent advisor, we obtained the familiar pattern of re-
sults. Confidence shifts were negatively related to logarith-
mic advice distance, B = −0.6532 (SE = 0.1643), t(2745)
= −3.977, p < .001. There was also a significant positive
effect of the linear advice distance term, B = 0.0057 (SE =
0.0027), t(2745) = 2.086, p = .037. Neither distance mode
nor any of the interactions were statistically significant, all
|t|s < 1.266, all ps > .206.
For the less competent advisor, the linear and logarith-
mic effects of advice distance were considerably smaller
and failed to reach statistical significance. In fact, none
of the model variables were significantly related to confi-
dence shifts in the less competent advisor condition, all |t|s
< 1.078, all ps > .281. This is most likely the result of a floor
effect. When paired with the less competent advisor, judges’
confidence gains were rather small to begin with. Therefore,
there was considerably less room for further decreases than
in the competent advisor condition. However, descriptively,
the shape of the relation of advice distance and confidence
shifts was similar in both advisor conditions.
The results for confidence shifts in Experiment 4 are,
thus, largely similar to those in Experiment 3. At least for
competent advisors, subjects felt more confident in their fi-
nal estimate when the advice was closer to their initial esti-
mates, and the data were best described by a negative loga-
rithmic trend (Figure 6).
6.3 Discussion
The results of Experiment 4 replicate those of the previous
experiments. They also rule out the possibility that our find-
ings differ from those of Yaniv (2004b) because manipulat-
ing advice distance in categories rather than as a continuum
leads to qualitatively different weighting functions. In fact,
regardless of whether we presented advice in a fine-grained
continuous manner or in distinct categories, we found the
same pattern for all four dependent variables. In addition,
the results of Experiment 4 favor the SRM over SJT when
describing absolute opinion shifts as a function of advice
distance since we did not observe any inclination of reduced
opinion shifts in the far regions of advice distance.
7 Experiment 5
So far, the results of Experiments 1 to 4 suggest that the
relationship between advice distance and advice weighting
is more complex that previously assumed. Although we al-
ready ruled out that the discrepancies between the results
of our experiments and those by Yaniv (2004b) were due
to judges processing distinct advice distance categories in a
qualitatively manner, there are further methodological dif-
ferences that might cause these differences. For example,
Yaniv (2004b) used a different estimation task, namely es-
timating the dates of recent historic events. This estimation
task differs from the ones we used in two ways: first, un-
like with distances or caloric estimates, there is no natural
zero; second, subjects may have been less likely to round
their answers than in the tasks we previously used. Addi-
tionally, in the Yaniv study, subjects received advice from
several different advisors, whereas in our study the advice
was allegedly provided by the same advisor on all trials. Fi-
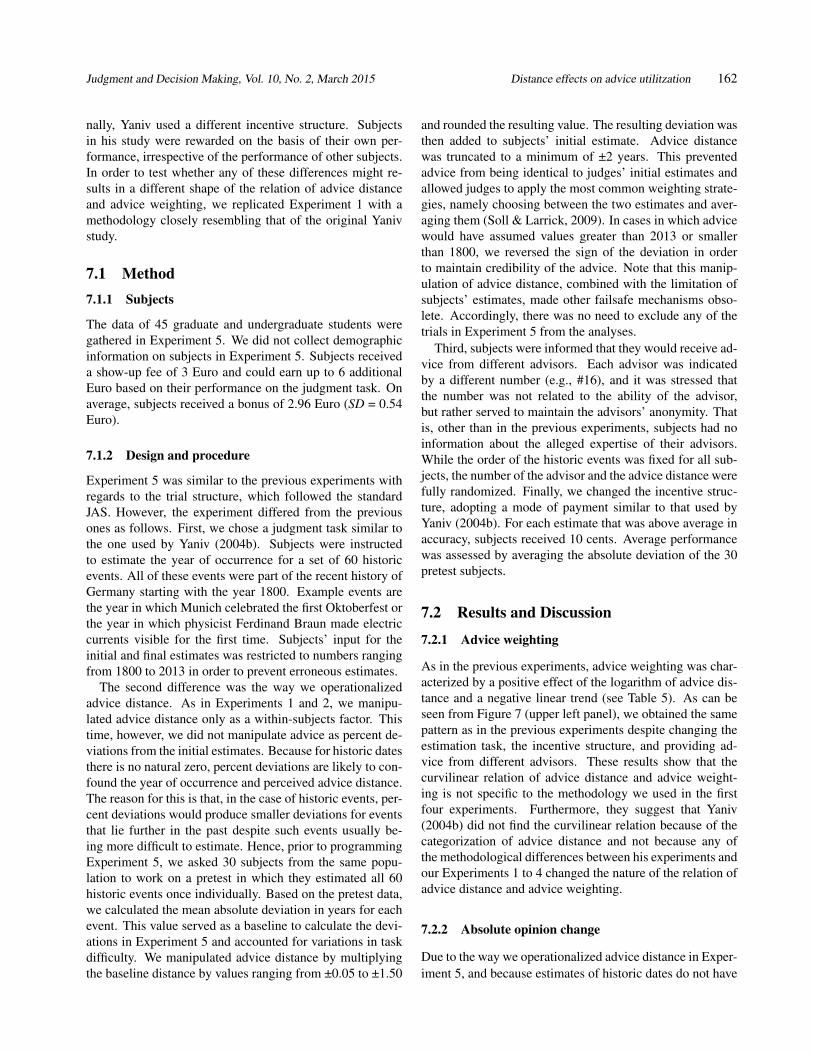
Judgment and Decision Making, Vol. 10, No. 2, March 2015 Distance effects on advice utilitzation 162
nally, Yaniv used a different incentive structure. Subjects
in his study were rewarded on the basis of their own per-
formance, irrespective of the performance of other subjects.
In order to test whether any of these differences might re-
sults in a different shape of the relation of advice distance
and advice weighting, we replicated Experiment 1 with a
methodology closely resembling that of the original Yaniv
study.
7.1 Method
7.1.1 Subjects
The data of 45 graduate and undergraduate students were
gathered in Experiment 5. We did not collect demographic
information on subjects in Experiment 5. Subjects received
a show-up fee of 3 Euro and could earn up to 6 additional
Euro based on their performance on the judgment task. On
average, subjects received a bonus of 2.96 Euro (SD = 0.54
Euro).
7.1.2 Design and procedure
Experiment 5 was similar to the previous experiments with
regards to the trial structure, which followed the standard
JAS. However, the experiment differed from the previous
ones as follows. First, we chose a judgment task similar to
the one used by Yaniv (2004b). Subjects were instructed
to estimate the year of occurrence for a set of 60 historic
events. All of these events were part of the recent history of
Germany starting with the year 1800. Example events are
the year in which Munich celebrated the first Oktoberfest or
the year in which physicist Ferdinand Braun made electric
currents visible for the first time. Subjects’ input for the
initial and final estimates was restricted to numbers ranging
from 1800 to 2013 in order to prevent erroneous estimates.
The second difference was the way we operationalized
advice distance. As in Experiments 1 and 2, we manipu-
lated advice distance only as a within-subjects factor. This
time, however, we did not manipulate advice as percent de-
viations from the initial estimates. Because for historic dates
there is no natural zero, percent deviations are likely to con-
found the year of occurrence and perceived advice distance.
The reason for this is that, in the case of historic events, per-
cent deviations would produce smaller deviations for events
that lie further in the past despite such events usually be-
ing more difficult to estimate. Hence, prior to programming
Experiment 5, we asked 30 subjects from the same popu-
lation to work on a pretest in which they estimated all 60
historic events once individually. Based on the pretest data,
we calculated the mean absolute deviation in years for each
event. This value served as a baseline to calculate the devi-
ations in Experiment 5 and accounted for variations in task
difficulty. We manipulated advice distance by multiplying
the baseline distance by values ranging from ±0.05 to ±1.50
and rounded the resulting value. The resulting deviation was
then added to subjects’ initial estimate. Advice distance
was truncated to a minimum of ±2 years. This prevented
advice from being identical to judges’ initial estimates and
allowed judges to apply the most common weighting strate-
gies, namely choosing between the two estimates and aver-
aging them (Soll & Larrick, 2009). In cases in which advice
would have assumed values greater than 2013 or smaller
than 1800, we reversed the sign of the deviation in order
to maintain credibility of the advice. Note that this manip-
ulation of advice distance, combined with the limitation of
subjects’ estimates, made other failsafe mechanisms obso-
lete. Accordingly, there was no need to exclude any of the
trials in Experiment 5 from the analyses.
Third, subjects were informed that they would receive ad-
vice from different advisors. Each advisor was indicated
by a different number (e.g., #16), and it was stressed that
the number was not related to the ability of the advisor,
but rather served to maintain the advisors’ anonymity. That
is, other than in the previous experiments, subjects had no
information about the alleged expertise of their advisors.
While the order of the historic events was fixed for all sub-
jects, the number of the advisor and the advice distance were
fully randomized. Finally, we changed the incentive struc-
ture, adopting a mode of payment similar to that used by
Yaniv (2004b). For each estimate that was above average in
accuracy, subjects received 10 cents. Average performance
was assessed by averaging the absolute deviation of the 30
pretest subjects.
7.2 Results and Discussion
7.2.1 Advice weighting
As in the previous experiments, advice weighting was char-
acterized by a positive effect of the logarithm of advice dis-
tance and a negative linear trend (see Table 5). As can be
seen from Figure 7 (upper left panel), we obtained the same
pattern as in the previous experiments despite changing the
estimation task, the incentive structure, and providing ad-
vice from different advisors. These results show that the
curvilinear relation of advice distance and advice weight-
ing is not specific to the methodology we used in the first
four experiments. Furthermore, they suggest that Yaniv
(2004b) did not find the curvilinear relation because of the
categorization of advice distance and not because any of
the methodological differences between his experiments and
our Experiments 1 to 4 changed the nature of the relation of
advice distance and advice weighting.
7.2.2 Absolute opinion change
Due to the way we operationalized advice distance in Exper-
iment 5, and because estimates of historic dates do not have
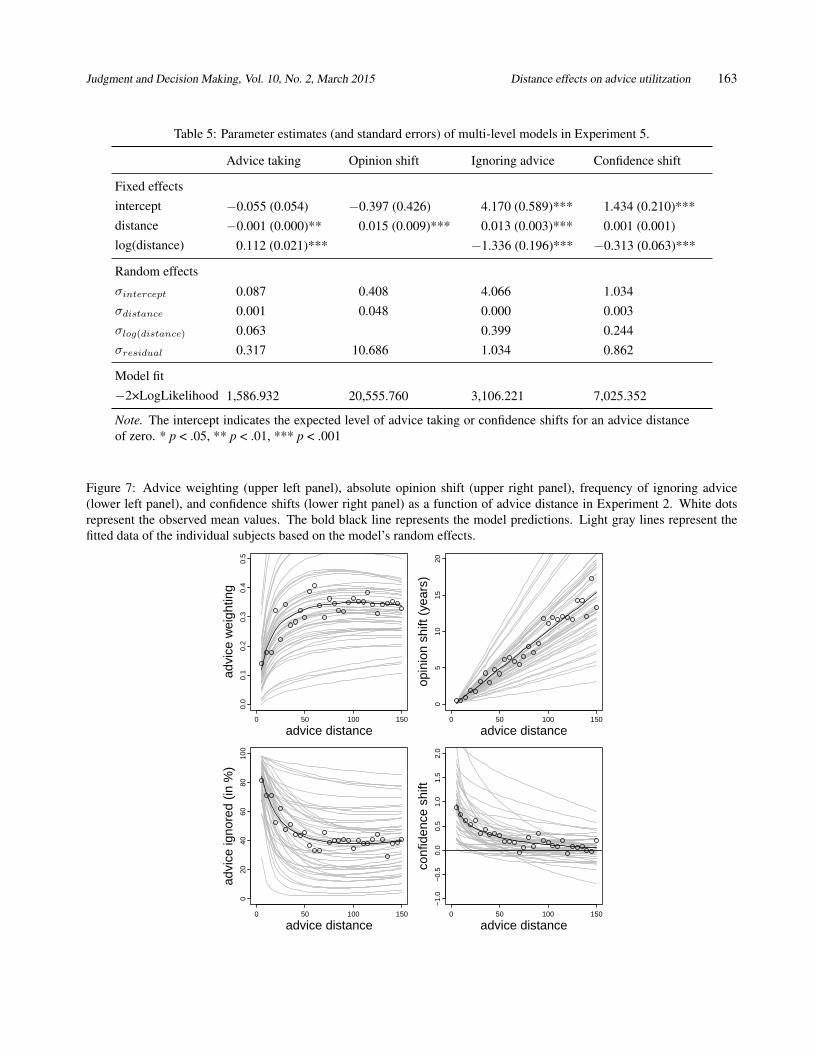
Judgment and Decision Making, Vol. 10, No. 2, March 2015 Distance effects on advice utilitzation 163
Table 5: Parameter estimates (and standard errors) of multi-level models in Experiment 5.
Advice taking Opinion shift Ignoring advice Confidence shift
Fixed effects
intercept −0.055 (0.054) −0.397 (0.426) 4.170 (0.589)*** 1.434 (0.210)***
distance −0.001 (0.000)** 0.015 (0.009)*** 0.013 (0.003)*** 0.001 (0.001)
log(distance) 0.112 (0.021)*** −1.336 (0.196)*** −0.313 (0.063)***
Random effects
σintercept 0.087 0.408 4.066 1.034
σdistance 0.001 0.048 0.000 0.003
σlog(distance) 0.063 0.399 0.244
σresidual 0.317 10.686 1.034 0.862
Model fit
−2×LogLikelihood 1,586.932 20,555.760 3,106.221 7,025.352
Note. The intercept indicates the expected level of advice taking or confidence shifts for an advice distance
of zero. * p < .05, ** p < .01, *** p < .001
Figure 7: Advice weighting (upper left panel), absolute opinion shift (upper right panel), frequency of ignoring advice
(lower left panel), and confidence shifts (lower right panel) as a function of advice distance in Experiment 2. White dots
represent the observed mean values. The bold black line represents the model predictions. Light gray lines represent the
fitted data of the individual subjects based on the model’s random effects.
0 50 100 150
0.0
0.1
0.2
0.3
0.4
0.5
advice distance
advi
ce w
eigh
ting
0 50 100 150
05
1015
20
advice distance
opin
ion
shift
(ye
ars)
0 50 100 150
020
4060
8010
0
advice distance
advi
ce ig
nore
d (in
%)
0 50 100 150
−1.
0−
0.5
0.0
0.5
1.0
1.5
2.0
advice distance
conf
iden
ce s
hift
Judgment and Decision Making, Vol. 10, No. 2, March 2015 Distance effects on advice utilitzation 164
a natural zero, measuring opinion shifts as percent changes
of the initial estimate makes little sense. However, since
we investigated only historic events from the recent past, all
subjects were equally well-aware of the proper upper and
lower bounds of the target values. Thus, the variance of sub-
jects’ estimates was constrained by the task itself, allowing
us to treat absolute opinion change in years as the dependent
variable. As in the previous experiments and consistent with
an SRM, absolute opinion shift increased as a linear func-
tion of advice distance (Table 6 and Figure 8, upper right
panel). Adding the logarithmic or the squared distance term
and their corresponding random slopes did not improve the
model, χ2(4) = 1.556, p = .817, and χ2(4) = 6.430, p =
.169, respectively. Apparently, our findings regarding ab-
solute opinion shifts hold when using a methodology and
judgment task similar to Yaniv’s (2004b).
7.2.3 Frequency of ignoring advice
As in the previous Experiments, we found that the frequency
of ignoring advice was positively related to advice distance
and negatively to its logarithm (see Table 5). Consistent
with the notion of ROPEs, subjects ignored advice most
frequently (about 80% of the time) when it was closest to
their initial opinions. With increasing advice distance, this
frequency declined rapidly until it stabilized at a level of
around 40% (see Figure 7, lower left panel).
7.2.4 Confidence shifts
As Table 7 shows, there was a significant negative effect
of the logarithm of advice distance, while the linear effect
was not significant. This pattern is in line with the previous
experiments and lends support to the idea of near advice be-
ing utilized as a form of social validation (Figure 7, lower
right panel). Consistent with the analyses of the other de-
pendent variables, the results suggest that our findings are
stable across different estimation tasks and operationaliza-
tions of advice distance.
7.3 Discussion
In sum, the data of Experiment 5 further speak to the gener-
alizability of our findings. The relation of advice distance to
our four dependent variables was similar to that of the pre-
vious experiments despite using a different judgment task,
operationalizing advice distance in a different fashion, and
pairing subjects with allegedly different advisors on each
trial. Furthermore, Experiment 5 rules out the last method-
ological differences between our study and that of Yaniv
(2004b) as potential explanation for the different findings.
8 Experiment 6
In a previous version of the manuscript, Experiment 6 was
designed to test a potential mediator of the relation of advice
distance and advice weighting, namely perceived distance of
the advice. During the revision of the manuscript this me-
diation test became obsolete. However, since we committed
to reporting all data and because Experiment 6 had a much
larger sample size than Experiments 1 to 4, we report it as
more powerful replication.
8.1 Method
8.1.1 Subjects
The data of 98 graduate and undergraduate students were
gathered in Experiment 6. We did not collect demographic
information on subjects in Experiment 6. Subjects received
a show-up fee of 3 Euro and could earn up to another 6 Euro
based on their performance on the judgment task. On av-
erage, subjects received a bonus of 1.14 Euro (SD = 0.58
Euro).
8.1.2 Design and procedure
Subjects in Experiment 6 worked on the calorie estimation
task used in Experiment 2. Experiment 6 was largely identi-
cal to Experiments 1 and 2, except that we added an advice
similarity rating as a between-subjects factor. Half of the
subjects rated how similar they felt the advice was to their
initial estimate prior to making their final estimate whereas
the others did not. The other half of the subjects did not rate
the similarity of the advice.6
As in Experiment 3, advice distance in the main trials,
ranged from 5% to 150%. We applied each distance rang-
ing from ±5% to ±75% in 5%-increments once, and each
distance from 85% to 150%, also in steps of 5%, twice. Ad-
vice distance was truncated at the lower end so that advice
differed by at least two calories, thus preventing advice from
being identical to the initial estimates while allowing for
choosing and averaging. In order to maintain credibility of
the advice, we again included a failsafe mechanism. When-
ever the advice would have assumed values smaller than 10
or larger than 3000 calories, the computer instead randomly
generated a caloric estimate between 20 and 900 calories.
The 76 trials in which this failsafe mechanism was activated
(1.3%) were excluded from the analysis. As in Experiment
5, subjects received advice from different advisors, and they
did not receive any information about the expertise of their
advisors. Finally, subjects were paid a bonus based on their
6The similarity ratings were originally included as the potential media-
tor, but since we no longer considered this mediation meaningful, we will
not go into detail regarding their exact operationalization. We will, however
report the effects that measuring advice similarity had on our dependent
variables.
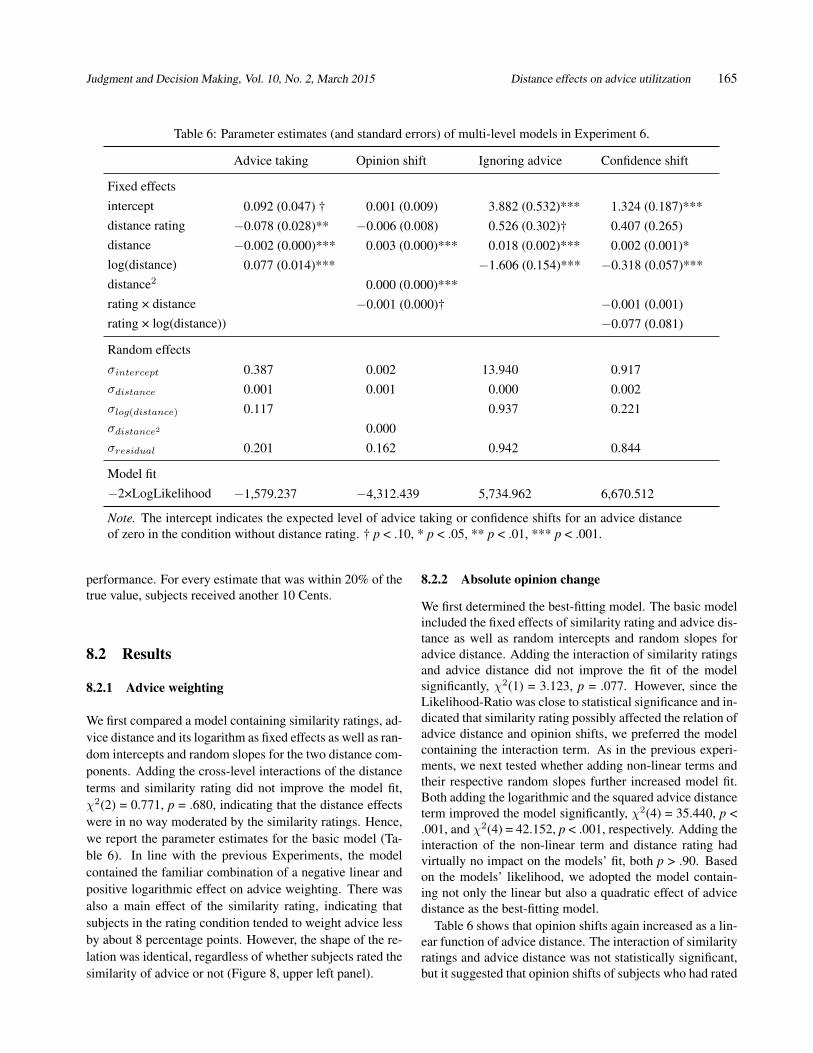
Judgment and Decision Making, Vol. 10, No. 2, March 2015 Distance effects on advice utilitzation 165
Table 6: Parameter estimates (and standard errors) of multi-level models in Experiment 6.
Advice taking Opinion shift Ignoring advice Confidence shift
Fixed effects
intercept 0.092 (0.047) † 0.001 (0.009) 3.882 (0.532)*** 1.324 (0.187)***
distance rating −0.078 (0.028)** −0.006 (0.008) 0.526 (0.302)† 0.407 (0.265)
distance −0.002 (0.000)*** 0.003 (0.000)*** 0.018 (0.002)*** 0.002 (0.001)*
log(distance) 0.077 (0.014)*** −1.606 (0.154)*** −0.318 (0.057)***
distance2 0.000 (0.000)***
rating × distance −0.001 (0.000)† −0.001 (0.001)
rating × log(distance)) −0.077 (0.081)
Random effects
σintercept 0.387 0.002 13.940 0.917
σdistance 0.001 0.001 0.000 0.002
σlog(distance) 0.117 0.937 0.221
σdistance2 0.000
σresidual 0.201 0.162 0.942 0.844
Model fit
−2×LogLikelihood −1,579.237 −4,312.439 5,734.962 6,670.512
Note. The intercept indicates the expected level of advice taking or confidence shifts for an advice distance
of zero in the condition without distance rating. † p < .10, * p < .05, ** p < .01, *** p < .001.
performance. For every estimate that was within 20% of the
true value, subjects received another 10 Cents.
8.2 Results
8.2.1 Advice weighting
We first compared a model containing similarity ratings, ad-
vice distance and its logarithm as fixed effects as well as ran-
dom intercepts and random slopes for the two distance com-
ponents. Adding the cross-level interactions of the distance
terms and similarity rating did not improve the model fit,
χ2(2) = 0.771, p = .680, indicating that the distance effects
were in no way moderated by the similarity ratings. Hence,
we report the parameter estimates for the basic model (Ta-
ble 6). In line with the previous Experiments, the model
contained the familiar combination of a negative linear and
positive logarithmic effect on advice weighting. There was
also a main effect of the similarity rating, indicating that
subjects in the rating condition tended to weight advice less
by about 8 percentage points. However, the shape of the re-
lation was identical, regardless of whether subjects rated the
similarity of advice or not (Figure 8, upper left panel).
8.2.2 Absolute opinion change
We first determined the best-fitting model. The basic model
included the fixed effects of similarity rating and advice dis-
tance as well as random intercepts and random slopes for
advice distance. Adding the interaction of similarity ratings
and advice distance did not improve the fit of the model
significantly, χ2(1) = 3.123, p = .077. However, since the
Likelihood-Ratio was close to statistical significance and in-
dicated that similarity rating possibly affected the relation of
advice distance and opinion shifts, we preferred the model
containing the interaction term. As in the previous experi-
ments, we next tested whether adding non-linear terms and
their respective random slopes further increased model fit.
Both adding the logarithmic and the squared advice distance
term improved the model significantly, χ2(4) = 35.440, p <
.001, and χ2(4) = 42.152, p < .001, respectively. Adding the
interaction of the non-linear term and distance rating had
virtually no impact on the models’ fit, both p > .90. Based
on the models’ likelihood, we adopted the model contain-
ing not only the linear but also a quadratic effect of advice
distance as the best-fitting model.
Table 6 shows that opinion shifts again increased as a lin-
ear function of advice distance. The interaction of similarity
ratings and advice distance was not statistically significant,
but it suggested that opinion shifts of subjects who had rated
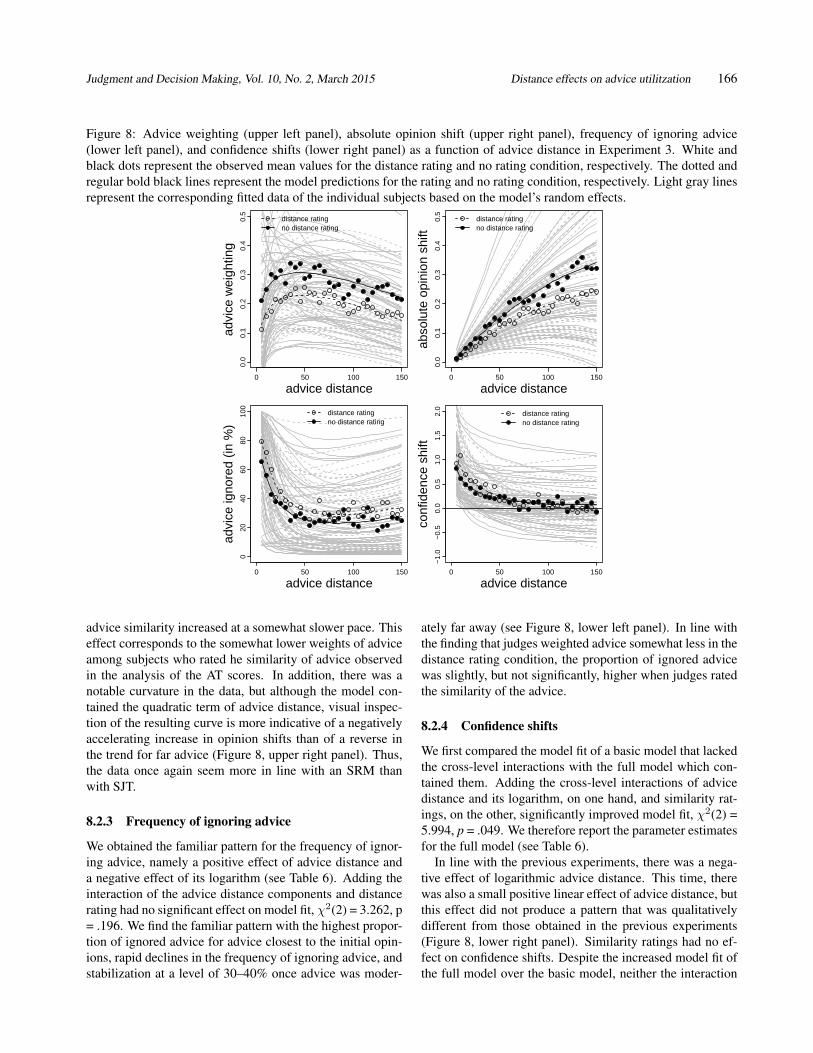
Judgment and Decision Making, Vol. 10, No. 2, March 2015 Distance effects on advice utilitzation 166
Figure 8: Advice weighting (upper left panel), absolute opinion shift (upper right panel), frequency of ignoring advice
(lower left panel), and confidence shifts (lower right panel) as a function of advice distance in Experiment 3. White and
black dots represent the observed mean values for the distance rating and no rating condition, respectively. The dotted and
regular bold black lines represent the model predictions for the rating and no rating condition, respectively. Light gray lines
represent the corresponding fitted data of the individual subjects based on the model’s random effects.
distance ratingno distance rating
0 50 100 150
0.0
0.1
0.2
0.3
0.4
0.5
advice distance
advi
ce w
eigh
ting
distance ratingno distance rating
0 50 100 150
0.0
0.1
0.2
0.3
0.4
0.5
advice distance
abso
lute
opi
nion
shi
ftdistance ratingno distance rating
0 50 100 150
020
4060
8010
0
advice distance
advi
ce ig
nore
d (in
%)
distance ratingno distance rating
0 50 100 150
−1.
0−
0.5
0.0
0.5
1.0
1.5
2.0
advice distance
conf
iden
ce s
hift
advice similarity increased at a somewhat slower pace. This
effect corresponds to the somewhat lower weights of advice
among subjects who rated he similarity of advice observed
in the analysis of the AT scores. In addition, there was a
notable curvature in the data, but although the model con-
tained the quadratic term of advice distance, visual inspec-
tion of the resulting curve is more indicative of a negatively
accelerating increase in opinion shifts than of a reverse in
the trend for far advice (Figure 8, upper right panel). Thus,
the data once again seem more in line with an SRM than
with SJT.
8.2.3 Frequency of ignoring advice
We obtained the familiar pattern for the frequency of ignor-
ing advice, namely a positive effect of advice distance and
a negative effect of its logarithm (see Table 6). Adding the
interaction of the advice distance components and distance
rating had no significant effect on model fit, χ2(2) = 3.262, p
= .196. We find the familiar pattern with the highest propor-
tion of ignored advice for advice closest to the initial opin-
ions, rapid declines in the frequency of ignoring advice, and
stabilization at a level of 30–40% once advice was moder-
ately far away (see Figure 8, lower left panel). In line with
the finding that judges weighted advice somewhat less in the
distance rating condition, the proportion of ignored advice
was slightly, but not significantly, higher when judges rated
the similarity of the advice.
8.2.4 Confidence shifts
We first compared the model fit of a basic model that lacked
the cross-level interactions with the full model which con-
tained them. Adding the cross-level interactions of advice
distance and its logarithm, on one hand, and similarity rat-
ings, on the other, significantly improved model fit, χ2(2) =
5.994, p = .049. We therefore report the parameter estimates
for the full model (see Table 6).
In line with the previous experiments, there was a nega-
tive effect of logarithmic advice distance. This time, there
was also a small positive linear effect of advice distance, but
this effect did not produce a pattern that was qualitatively
different from those obtained in the previous experiments
(Figure 8, lower right panel). Similarity ratings had no ef-
fect on confidence shifts. Despite the increased model fit of
the full model over the basic model, neither the interaction
Judgment and Decision Making, Vol. 10, No. 2, March 2015 Distance effects on advice utilitzation 167
of the similarity ratings and advice distance nor that of the
similarity ratings and logarithmic advice distance reached
statistical significance. This suggests that the relation of ad-
vice distance and confidence shifts was independent of the
similarity ratings.
8.3 Discussion
Experiment 6 once again replicates the curvilinear relation
of advice distance and advice weighting. The same is true
for the frequency of ignoring advice and confidence shifts,
that is, Experiment 6 also supports the idea of ROPEs as
well as the validating effect of near advice. The results
regarding absolute opinion shifts are also in line with the
previous experiments in that they are more suggestive of
an SRM than of SJT when it comes to describing opinion
shifts. The notable difference is that, this time, we observed
a non-linear relation of advice distance and absolute opinion
shift. However, despite the significant quadratic effect of ad-
vice distance on opinion shift, we did not find evidence of
an actual decrease in opinion shift for advice very far from
the initial estimates. Thus the data are in line with the idea
of an SRM with diminishing sensitivity. The fact that we
found the non-linear pattern in Experiment 6 but not—or at
least not statistically significant—in the remaining experi-
ments might be due to the greater sample size and, therefore,
greater test power of Experiment 6.
9 Additional meta-analysis
We conclude our results section by reporting an analysis that
we based on the combined data of our six experiments. It
addresses the inversely U-shaped relation of advice distance
and advice weighting. The combination of a positive loga-
rithmic and a negative linear effect, as observed in all six ex-
periments, is in line with such an inverse U-shape. However,
graphical inspection of our data suggests that the increase in
advice taking in the near regions is much more pronounced
than the decrease in the far regions. One way to test for ac-
tual curvilinearity is to divide the data at the maximum of
the predicted curve and to test for linear effects in both sub-
datasets. Following this idea, we first combined the data of
all six experiments. Since the relation of advice distance
and advice weighting was qualitatively similar in the vari-
ous experimental conditions between-subjects, we collapsed
across all between-subject variables. We then predicted AT
scores from advice distance and its logarithm and included
random intercepts and slopes for subjects nested within ex-
periments. We found the familiar pattern, that is, a non-
significant intercept, B0 = −0.013 (SE = 0.025), t(19302) =
−0.527, p = .599, a negative linear trend, B1 = −0.002 (SE =
0.000), t(19302) = −8.690, p < .001, and a positive effect of
the logarithm of advice distance, B2 = 0.101, (SE = 0.008),
t(19302) = 11.979, p < .001.
We then determined the maximum of the predicted func-
tion, which is defined as −(B2/B1) for a model containing
both a linear and logarithmic term. For our data, the pre-
dicted curve was maximal at an advice distance of 63.84%.
Accordingly, we split our data so that one subset consisted
only of trials with advice distances between 5% and 60%
while the second data set contained all trials with distances
ranging from 65% to 150%. We then tested for linear effects
of advice distance in both data sets. Both models contained
random slopes for subjects nested within experiments. The
analysis of the subset with the lower advice distances re-
vealed a strong positive linear effect of advice distance, B =
0.002 (SE = 0.000), t(9202) = 6.636, p < .001. In case of the
subset with the far advice, there was a negative linear effect
of advice distance, but this effect was not statistically signifi-
cant, B = −0.000 (SE = 0.000), t(19302) = −1.534, p = .125.
We ran similar analyses, separately for all six experiments
and found a positive linear effect of advice distance for ad-
vice left of the predicted maximum in all six cases, all p <
.001. The pattern was mixed with regards to advice distance
to the right of the predicted maximum, though. Whereas the
descriptive effects of advice distance were all negative, this
downward trend was much less pronounced than the upward
trend observed in the near advice subsets. It was significant
only in Experiments 1, 2, and 6 (p = .019, p = .014, and p
< .001, respectively), but not in Experiments 3, 4 and 5, (p
= .281, p = .052, and p = .594, respectively). In sum, we
find consistent evidence of the lower weights placed on ad-
vice near the initial estimates. Descriptively, our analyses
are also consistent with previous research in that judges had
a tendency to weight advice less when it was far away from
the initial estimates.
10 General discussion
In six experiments, we investigated how the distance be-
tween judges’ initial estimates and received advice influ-
ences advice utilization. Going beyond previous research,
we found that advice is not only weighted to a lesser de-
gree when it is very far from judges’ initial opinions, but
also when it is very close to them. In all six experiments,
we found a curvilinear relation of advice distance and ad-
vice weighting characterized by a linear downwards trend
as well as a logarithmic effect of advice distance. As our
analysis of the combined data revealed, the increase in ad-
vice weighting between very near and moderately far advice
is reliable, and we can—at least descriptively—replicate the
decrease in advice weighting as advice moves further from
the initial estimates.
We further found that the low weights of near advice were
not simply the result of judges weighting near advice less
Judgment and Decision Making, Vol. 10, No. 2, March 2015 Distance effects on advice utilitzation 168
but—most likely—because they retained their initial opin-
ions more often and weighted the advice by exactly zero.
Both the strongly increased frequency of judges ignoring
advice when it was near the initial opinion and the fact that
this effect diminished rapidly, are consistent with the idea
of ROPEs. That is, judges quite possibly noted that the ad-
vice was numerically different from their initial estimates,
but they considered the difference to be negligible or irrele-
vant, rending the advice practically equivalent to their initial
estimates and making adjustments towards it obsolete.
We also investigated absolute rather than relative opin-
ion change in order to be able to differentiate between so-
cial judgment theory (SJT), on the one hand, and stimulus-
response model (SRM), on the other. The data, so far, fa-
vor an SRM over SJT because absolute opinion shifts did,
on average, increase in a monotone fashion as advice dis-
tance increased. We did find evidence of an additional non-
linear effect of advice distance on absolute opinion shift in
some of our Experiments, but the effects were not particu-
larly strong, and they did not lead to an actual decrease in
opinion shifts for far advice in any of our experiments. Of
course, while an SRM seems an appropriate description of
our data, we cannot rule out the possibility that we would
have observed such a decrease if we had expanded the range
of advice distance even further. Our findings regarding ab-
solute opinion shifts are quite striking for another reason,
however, namely because they show that our understand-
ing of how we revise our opinions in the light of advice de-
pends strongly on the measures of advice taking we apply.
Whereas the commonly used relative measures such as the
percent weight of advice suggest that advice is utilized less
when it is either very close to or far away from the initial
opinion, absolute opinion shifts tell a somewhat different
story. Here, receiving advice always results in more opinion
change the further the advice is away from the initial opin-
ion. This dissociation may lead us to think that far advice
had less impact on our judgments than moderately distant
advice because it received less weight, even if we revised
our initial judgments more strongly in the former than in the
latter case.
Finally, near advice led to stronger increases in judges’
confidence regarding the accuracy of their initial judgments,
supporting the idea that near advice is not actually disre-
garded even if judges do not adjust their estimates towards
it. Instead, its utilization is reflected in the way judges’ con-
fidence increases (Gino and Moore, 2007). When predict-
ing confidence gains we found a negative logarithmic ef-
fect. The considerable increase in confidence when advice
was near the initial estimate indicated that judges felt par-
ticularly validated by such advice. The further the advice
was the less judges’ confidence increased, and once advice
distance surpassed a certain distance, judges’ confidence no
longer changed at all. This findings is also consistent with
Budescu’s (2006) model of confidence in aggregated judg-
ments which suggests that confidence increases as variance
(or distance, for that matter) decreases.
10.1 Implications for theory and practice
One important implication of our findings concerns the the-
oretical basis of distance effects in advice taking. Our study
is the first to operationalize both advice distance and opinion
change in a way that actually allows testing the assumptions
different theoretical frameworks make about the shape of the
relation of the two variables. As stated above, we found that
a simple SRM was more in line with our data than SJT. On
average, absolute opinion change was roughly proportional
to advice distance with the exception of Experiment 6 which
showed signs of diminishing sensitivity, and the main reason
for the strongly reduced weight placed on near advice was
that judges more frequently choose to retain their initial es-
timates when receiving such advice. In addition, we found
that advice from competent advisors led to stronger abso-
lute opinion shift, but also to a greater likelihood of adjust-
ing towards the advice at all. This raises a rather interesting
possibility, namely that variables affecting advice weight-
ing might do so in two qualitatively ways. For example one
variable could increase the absolute adjustments towards the
advice while the frequency of adjustments remains constant.
Another variable could work in the exact opposite way, that
is, while the magnitude of adjustments remains constant, the
variable affects the frequency of adjustment. Of, course, a
combination of the two effects is also possible. Considering
these two qualitatively different ways moderating variables
can affect belief revision in the light of advice, it seems nec-
essary to develop theoretical frameworks that make more
precise statements regarding the effects of certain variables
on advice utilization. As our data suggest, a simple SRM
might be a useful starting point for this endeavor.
Second, advice can be utilized in two different ways,
namely in the form of adjustment of one’s judgment to-
wards the advice, on the one hand, and adjustments of
one’s confidence in the correctness of one’s opinion, on
the other. Previous research has investigated both advice
weighting and confidence shifts in the JAS (see Bonaccio
& Dalal, 2006), but apart from a few exceptions such as re-
cent studies by Yaniv et al. (2009) or Minson and Mueller
(2012), those variables were investigated separately (i.e., re-
searchers tested one or the other). Our results show that ad-
vice weighting does not fully reflect advice utilization. In-
stead, the perceived similarity of initial estimates and advice
seems to have an informational value of its own, and usage
of this information is reflected in confidence shifts as well.
Hence, we would like to encourage researchers to measure
both advice weighting and confidence shifts when studying
advice taking in order to provide a more complete picture of
how judges utilize advice.
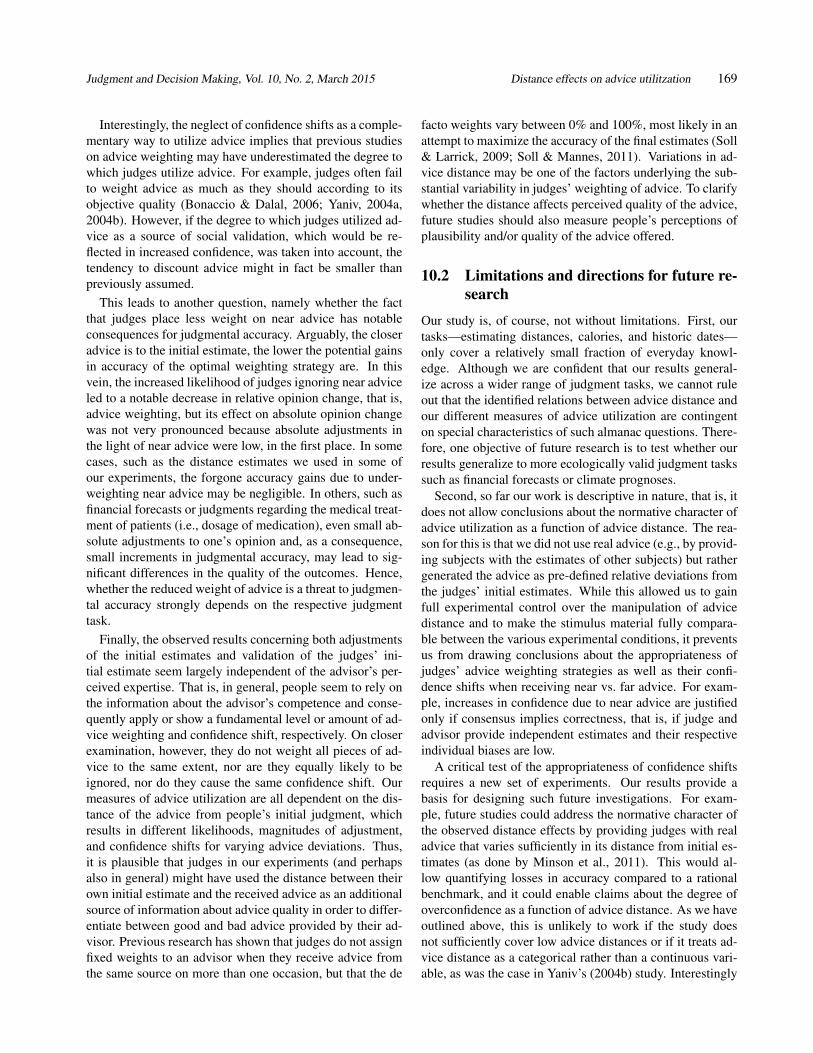
Judgment and Decision Making, Vol. 10, No. 2, March 2015 Distance effects on advice utilitzation 169
Interestingly, the neglect of confidence shifts as a comple-
mentary way to utilize advice implies that previous studies
on advice weighting may have underestimated the degree to
which judges utilize advice. For example, judges often fail
to weight advice as much as they should according to its
objective quality (Bonaccio & Dalal, 2006; Yaniv, 2004a,
2004b). However, if the degree to which judges utilized ad-
vice as a source of social validation, which would be re-
flected in increased confidence, was taken into account, the
tendency to discount advice might in fact be smaller than
previously assumed.
This leads to another question, namely whether the fact
that judges place less weight on near advice has notable
consequences for judgmental accuracy. Arguably, the closer
advice is to the initial estimate, the lower the potential gains
in accuracy of the optimal weighting strategy are. In this
vein, the increased likelihood of judges ignoring near advice
led to a notable decrease in relative opinion change, that is,
advice weighting, but its effect on absolute opinion change
was not very pronounced because absolute adjustments in
the light of near advice were low, in the first place. In some
cases, such as the distance estimates we used in some of
our experiments, the forgone accuracy gains due to under-
weighting near advice may be negligible. In others, such as
financial forecasts or judgments regarding the medical treat-
ment of patients (i.e., dosage of medication), even small ab-
solute adjustments to one’s opinion and, as a consequence,
small increments in judgmental accuracy, may lead to sig-
nificant differences in the quality of the outcomes. Hence,
whether the reduced weight of advice is a threat to judgmen-
tal accuracy strongly depends on the respective judgment
task.
Finally, the observed results concerning both adjustments
of the initial estimates and validation of the judges’ ini-
tial estimate seem largely independent of the advisor’s per-
ceived expertise. That is, in general, people seem to rely on
the information about the advisor’s competence and conse-
quently apply or show a fundamental level or amount of ad-
vice weighting and confidence shift, respectively. On closer
examination, however, they do not weight all pieces of ad-
vice to the same extent, nor are they equally likely to be
ignored, nor do they cause the same confidence shift. Our
measures of advice utilization are all dependent on the dis-
tance of the advice from people’s initial judgment, which
results in different likelihoods, magnitudes of adjustment,
and confidence shifts for varying advice deviations. Thus,
it is plausible that judges in our experiments (and perhaps
also in general) might have used the distance between their
own initial estimate and the received advice as an additional
source of information about advice quality in order to differ-
entiate between good and bad advice provided by their ad-
visor. Previous research has shown that judges do not assign
fixed weights to an advisor when they receive advice from
the same source on more than one occasion, but that the de
facto weights vary between 0% and 100%, most likely in an
attempt to maximize the accuracy of the final estimates (Soll
& Larrick, 2009; Soll & Mannes, 2011). Variations in ad-
vice distance may be one of the factors underlying the sub-
stantial variability in judges’ weighting of advice. To clarify
whether the distance affects perceived quality of the advice,
future studies should also measure people’s perceptions of
plausibility and/or quality of the advice offered.
10.2 Limitations and directions for future re-
search
Our study is, of course, not without limitations. First, our
tasks—estimating distances, calories, and historic dates—
only cover a relatively small fraction of everyday knowl-
edge. Although we are confident that our results general-
ize across a wider range of judgment tasks, we cannot rule
out that the identified relations between advice distance and
our different measures of advice utilization are contingent
on special characteristics of such almanac questions. There-
fore, one objective of future research is to test whether our
results generalize to more ecologically valid judgment tasks
such as financial forecasts or climate prognoses.
Second, so far our work is descriptive in nature, that is, it
does not allow conclusions about the normative character of
advice utilization as a function of advice distance. The rea-
son for this is that we did not use real advice (e.g., by provid-
ing subjects with the estimates of other subjects) but rather
generated the advice as pre-defined relative deviations from
the judges’ initial estimates. While this allowed us to gain
full experimental control over the manipulation of advice
distance and to make the stimulus material fully compara-
ble between the various experimental conditions, it prevents
us from drawing conclusions about the appropriateness of
judges’ advice weighting strategies as well as their confi-
dence shifts when receiving near vs. far advice. For exam-
ple, increases in confidence due to near advice are justified
only if consensus implies correctness, that is, if judge and
advisor provide independent estimates and their respective
individual biases are low.
A critical test of the appropriateness of confidence shifts
requires a new set of experiments. Our results provide a
basis for designing such future investigations. For exam-
ple, future studies could address the normative character of
the observed distance effects by providing judges with real
advice that varies sufficiently in its distance from initial es-
timates (as done by Minson et al., 2011). This would al-
low quantifying losses in accuracy compared to a rational
benchmark, and it could enable claims about the degree of
overconfidence as a function of advice distance. As we have
outlined above, this is unlikely to work if the study does
not sufficiently cover low advice distances or if it treats ad-
vice distance as a categorical rather than a continuous vari-
able, as was the case in Yaniv’s (2004b) study. Interestingly
Judgment and Decision Making, Vol. 10, No. 2, March 2015 Distance effects on advice utilitzation 170
however, the study by Minson et al. (2011) seems to ful-
fill the requirements we postulate. Reanalyzing their data
with the log-linear model we employed and then linking the
weights placed on advice to both, judgmental accuracy and
confidence shifts might be an easy and elegant way to test
whether or to what extent distance effects on advice utiliza-
tion violate normativity.
Third, similar to the majority of studies on advice-
taking in the judge-advisor-paradigm so far, we used a non-
interactive setting for the measurement of advice weighting
and confidence shifts. Although this allows for close compa-
rability with the findings of previous studies, it might limit
the generalizability of findings obtained in this setting to
those real-world advice-taking and advice-giving situations
that do not involve social interaction between the judge and
the advisor. With regard to our research question, it remains
to be seen whether the same distance effects occur if the ad-
visor has the opportunity to interact with the judge and can,
for example, provide the reasoning behind an estimate that
is quite far from the judge’s initial estimate. In such a situa-
tion, the plausibility of the judge’s explanation for her or his
advice might become a more important indication of advice
quality than advice distance and, subsequently, of the weight
that should be assigned to the advice. Thus, transferring the
investigation of distance effects to real social interaction (ei-
ther with real subjects or with confederates in the role of the
advisor) would be a logical next step to extend the findings
presented here.
10.3 Conclusion
Overall, our results stress the importance of taking into ac-
count both judges’ adjustment towards advice as well as
changes in their confidence when investigating advice uti-
lization. By doing so, we can obtain a more thorough—
and more complete—understanding of advice utilization. In
essence, our data show that judges do, in fact, utilize advice
even if they do not adjust towards it, which is reflected in
increased confidence after receiving validating advice. Tak-
ing this into account, we have shown how both measures of
belief adjustment and confidence depend on the distance be-
tween judges’ initial opinions and the advice they received.
We feel that these findings add to our knowledge concerning
how and why we utilize advice. We are confident that they
provide good grounds for further investigations, especially
if the duality of advice utilization is taken into account.
References
Aronson, E., Turner, J. A., & Carlsmith, J. M. (1963). Com-
municator credibility and communication discrepancy as
determinants of opinion change. Journal of Abnormal
and Social Psychology, 67, 31–36.
Bochner, S., & Insko, C. A. (1966). Communicator discrep-
ancy, source credibility, and opinion change. Journal of
Personality and Social Psychology, 4, 614–621.
Bonaccio, S., & Dalal, R. S. (2006). Advice taking and
decision-making: An integrative literature review, and
implications for the organizational sciences. Organiza-
tional Behavior and Human Decision Processes, 101,
127–151.
Budescu, D. V. (2006). Confidence in aggregation of opin-
ions from multiple sources. In Fiedler, K., & Juslin,
P. (Eds.), Information Sampling and Adaptive Cognition
(pp. 327–352). New York: Cambridge University Press.
Feng, B., & MacGeorge, E. L. (2006). Predicting receptive-
ness to advice: Characteristics of the problem, the advice-
giver, and the recipient. Southern Communication Jour-
nal, 71, 67–85.
Freedman, J. L. (1964). Involvement, discrepancy, and
change. Journal of Abnormal and Social Psychology,
69(3), 290–295.
Gino, F., & Moore, D.A. (2007). Effects of task difficulty
on use of advice. Journal of Behavioral Decision Making,
20, 21–35.
Gino, F., & Schweitzer, M. (2008). Blinded by anger or
feeling the love: How emotions influence advice taking.
Journal of Applied Psychology, 93, 1165–1173. http://dx.
doi.org/10.1037/0021-9010.93.5.1165.
Gino, F., Shang, J., & Croson, R. (2009). The impact of
information from similar or different advisors on judg-
ment. Organizational Behavior and Human Decision
Processes, 108, 287–302.
Harvey, N., & Fischer, I. (1997). Taking advice: Accepting
help, improving judgment, and sharing responsibility. Or-
ganizational Behavior and Human Decision Processes,
70, 117–133.
Insko, C. A., Murashima, F., & Saiyadain, M. (1966). Com-
municator discrepancy, stimulus ambiguity, and influ-
ence. Journal of Personality, 34, 262–274.
Minson, J. A., Liberman, V., & Ross, L. (2011). Two
to tango: Effects of collaboration and disagreement on
dyadic judgment. Personality and Social Psychology Bul-
letin, 37, 1325–1338.
Minson, J. A., & Mueller, J. S. (2012). The cost of collab-
oration: Why joint decision making exacerbates rejection
of outside information. Psychological Science, 23, 219–
224. http://dx.doi.org/10.1177/0956797611429132.
Schulz-Hardt, S., Frey, D., Lüthgens, C., & Moscovici, S.
(2000). Biased information search in group decision mak-
ing. Journal of Personality and Social Psychology, 78,
655–669.
Schulz-Hardt, S., Jochims, M., & Frey, D. (2002). Produc-
tive conflict in group decision making: genuine and con-
trived dissent as strategies to counteract biased informa-
tion seeking. Organizational Behavior and Human Deci-
sion Processes, 88, 563–586.
Judgment and Decision Making, Vol. 10, No. 2, March 2015 Distance effects on advice utilitzation 171
See, K. E., Morrison, E. W., Rothman, N. B., & Soll, J.
B. (2011). The detrimental effects of power on confi-
dence, advice taking, and accuracy, Organizational Be-
havior and Human Decision Processes, 116, 272–285.
Sherif, M., & Hovland, C. (1961). Social judgment: Assimi-
lation and contrast effects in communication and attitude
change. New Haven: Yale University Press.
Sherif, M., Taub, D., & Hovland, C. I. (1958). Assimilation
and contrast effects of anchoring stimuli on judgments.
Journal of Experimental Psychology, 55, 150–155.
Simmons, J. P., Nelson, L. D., & Simonsohn, U. (2011).
False-Positive Psychology: Undisclosed Flexibility in
Data Collection and Analysis Allow Presenting Anything
as Significant, Psychological Science, 22, 1359–1366.
Sniezek, J. A. (1992). Groups under uncertainty: An exam-
ination of confidence in group decision making. Orga-
nizational Behavior and Human Decision Processes, 52,
124–155.
Sniezek, J. A., & Buckley, T. (1995). Cueing and cogni-
tive conflict in judge-advisor decision making. Organiza-
tional Behavior and Human Decision Processes, 62, 159–
174.
Sniezek, J.A., Schrah, G. E., & Dalal, R. S. (2004). Im-
proving judgment with prepaid expert advice. Journal of
Behavioral Decision Making, 17, 173–190.
Sniezek, J., & Henry, R. A. (1989). Accuracy and confi-
dence in group judgment. Organizational Behavior and
Human Decision Processes, 43, 1–28.
Soll, J. B., & Larrick, R. P. (2009). Strategies of revis-
ing judgment: How (and how well) people use others’
opinions. Journal of Experimental Psychology: Learn-
ing, Memory and Cognition, 35(3), 780–805.
Soll, J. B., & Mannes, A.E. (2011). Judgmental aggregation
strategies depend on whether the self is involved. Inter-
national Journal of Forecasting, 27, 81–102.
Stevens, S. S. (1957). On the psychophysical law. Psycho-
logical Review, 64, 153–181.
Yaniv, I. (2004a). The benefit of additional opinions. Cur-
rent Directions in Psychological Science, 13, 75–78.
Yaniv, I. (2004b). Receiving other people’s advice: Influ-
ence and benefit. Organizational Behavior and Human
Decision Processes, 93, 1–13.
Yaniv, I., Choshen-Hillel, S. & Milyavsky, M. (2009). Spu-
rious consensus and opinion revision: Why might people
be more confident in their less accurate judgments? Jour-
nal of Experimental Psychology: Learning, Memory, and
Cognition, 35, 558–563.
Yaniv, I., Choshen-Hillel, S., & Milyavsky, M. (2011). Re-
ceiving advice on matters of taste: Similarity, majority
influence, and taste discrimination. Organizational Be-
havior and Human Decision Processes, 115, 111–120.
Yaniv, I., & Kleinberger, E. (2000). Advice taking in deci-
sion making: Egocentric discounting and reputation for-
mation. Organizational Behavior and Human Decision
Processes, 83, 260–281.
Yaniv, I., & Milyavsky, M. (2007). Using advice from mul-
tiple sources to revise and improve judgments. Organi-
zational Behavior and Human Decision Processes, 103,
104–120.