effects of climate change on new zealand lakes
TRANSCRIPT

19Effects of Climate Change onNew Zealand LakesDavid P. Hamilton1, Chris McBride1, Deniz Ozkundakci1,Marc Schallenberg2, Piet Verburg3, Mary de Winton3, David Kelly4,Chris Hendy5, and Wei Ye1
1Department of Biological Sciences, University of Waikato, New Zealand2Department of Zoology, University of Otago, New Zealand3National Institute of Water and Atmosphere Ltd (NIWA), New Zealand4Cawthron Institute, New Zealand5Chemistry Department,University of Waikato, New Zealand
19.1 IntroductionThis chapter outlines the potential impacts of climate change on New Zealand (NZ)lakes and examines how these effects may be mitigated. The chapter briefly outlinesthe origin and nature of NZ lakes, considers the historical climate to which the lakeshave been exposed, and examines the potential impact of a future climate, up to 2100.The isolated nature of the land masses of NZ (including North, South and StewartIslands, as well as several offshore islands) has led to specific distinguishing features ofits freshwater flora and fauna, including limited representation of some lifeform typesfound elsewhere, local endemism, and sensitivity to the direct and indirect impacts ofexotic species. In providing a context with which to evaluate the impacts of climatechange in NZ lakes we repeatedly draw comparisons with the massive landscapechanges that have occurred in the past 150 years as a result of human settlement andwidespread conversion of forests, wetlands and lakes into agricultural land, or use offreshwater for other economic benefits such as hydro power.
19.2 Geographical and climate perspectiveNew Zealand is located over a wide, mid-latitudinal band (34◦ to 47 ◦S) in the southernhemisphere. The climate is temperate maritime and is characterized by modest seasonal
Climatic Change and Global Warming of Inland Waters: Impacts and Mitigation for Ecosystems and Societies,First Edition. Edited by Charles R. Goldman, Michio Kumagai and Richard D. Robarts. 2013 John Wiley & Sons, Ltd. Published 2013 by John Wiley & Sons, Ltd.

338 CH 19 EFFECTS OF CLIMATE CHANGE ON NEW ZEALAND LAKES
temperature oscillations and strong westerly winds, which alternate with subtropicalhigh-pressure systems (Maunder 1971; Sturman and Tapper 2006). Annual mean airtemperature varies from about 9 ◦C in the far south to 16 ◦C in the far north. Theinteraction of westerly winds with the perpendicularly aligned land mass results inmarked variations in rainfall across the land mass. Rainfall across the mid part of theSouth Island may vary from 3–4 m year−1 on the west coast to >12 m year−1 in thesouthern Alps and <0.4 m year−1 in the arid interior (Wratt et al. 1996).
Interannual variations in climate are predominantly associated with the InterdecadalPacific Oscillation (IPO) (Salinger, Renwick, and Mullan 2001) and the El Nino-Southern Oscillation (ENSO) cycle (Mullan 1995). El Nino periods are characterizedby increased intensity of westerly winds, often reinforcing the high annual meanrainfall in westerly regions but coincident with drought east of the Southern Alps(South Island) as well as in eastern regions of the middle of North Island. Periodsof La Nina tend to be more variable but are typically warmer, with higher rainfall inthe north-east and lower rainfall in the south-west. Overlaying the ENSO cycle is theInterdecadal Pacific Oscillation (IPO). A positive IPO phase leads to more intense ElNino events with predominance of westerly winds and frontal systems compared witha negative IPO phase corresponding to a La Nina phase.
The effect of ENSO events on lakes has not been studied in great detail but LakeEllesmere (in Maori, Te Waihora), a large (surface area, A = 186 km2), shallow (meandepth, z = 1.9 m) lake on the east coast of the Canterbury region of South Island,experiences lower total rainfall in about two-thirds of summers when there is an ElNino phase but no specific pattern of higher or lower summer rainfall during LaNina. The largest NZ lake, Taupo (A = 616 km2, z = 90 m) did not undergo its regularannual winter mixing cycle in 1998 when there was an intense El Nino phase (seeSection 19.11).
19.3 Historical climateAlong with the rest of the world, the NZ climate has changed continuously for as longas climatic proxies are available. Over the past 600 000 years the periodicity of majorclimatic changes has been about 100 000 years, but within this period there havebeen significant excursions ranging in length from multimillennia to multi-decadal(Hays, Imbrie, and Shackleton 1976; Imbrie and Imbrie 1979). Multi-millennial cli-matic changes have been identified using excursions of the oxygen isotope ratiosof foraminifera in marine sediments, which were first described by Emiliani (1966).During the last glacial/interglacial cycle the prominent interglacial intervals were des-ignated marine oxygen-isotope (MOI) stage 5 (90 000 to 125 000 years ago) and MOIstage 1 (the Holocene, ∼10 000 years ago to present), whilst MOI stages 2 and 4represented prominent periods of glaciation.
Within NZ (at least from latitudes extending from mid South Island to mid NorthIsland), there appears to have been little difference in the magnitude of climate change,with the long-term average temperature about 5 ◦C colder in MOI stages 2 and 4 thanat present, even within 50 km of the piedmont glaciers, which developed at the base ofthe Southern Alps. The effect of such a decrease in mean temperature was a loweringof the snow line resulting in large-scale advance of glaciers from high mountains,particularly in the Southern Alps, to form coalescing piedmont glaciers in Westland

19.3 HISTORICAL CLIMATE 339
(South Island), some of which extended well beyond the present-day coastline, andthe occupation of all of the finger lakes to the south and east of the Southern Alps. Atthe same time the accumulation of ice in large sheets in North America and Europeresulted in a drop of sea level by 120 to 140 m, combining the three main islands ofNZ (South, North and Stewart Islands) into one contiguous land mass. Glacial erosionfrom the vastly increased volume of ice produced huge volumes of sediment rangingin size from boulders many meters in diameter to clay-sized silt, which was depositedas outwash extending from the glacier fronts to beyond the coastline, and wind-blownloess which smothered much of the non-glaciated landscape. With mean temperaturesreduced by between 4 and 6 ◦C, vegetation cover altered drastically and the treelinewas reduced to near current sea level over the southern half of NZ. Most of the SouthIsland lakes would either have been occupied by ice or drained where coastal barrierswere breached. Lakes of the Taupo Volcanic Zone (TVZ), North Island, would stillhave been in existence, although many of the current lakes were formed by Holoceneeruptions. Most of the Waikato lowland lakes formed subsequent to the breakout floodfollowing the Ouranui eruption ∼22 000 years ago and restabilization and revegetationof the landscape ∼15 000 years ago.
During MOI stage 2, three sets of glacial advances took place (30 000, 20 000 and16 700 years ago), each of which completely occupied the finger lakes south and eastof the Southern Alps. Each of the advances was matched by significant vegetationchanges, with a decline in subalpine shrublands and increased dominance of grasses.
Warming from the last glacial maximum (LGM) appeared to have started in Antarc-tica ∼18 000 years ago, 3000 years earlier than in the northern hemisphere, and wasalso marked by a temporary (1500 years ago) cooling known as the Antarctic ColdReversal. By 14 700 years ago vegetation cover had largely recovered from its glacialdepression. In the northern hemisphere a similar cooling (the Younger Dryas) occurreda little later. In NZ the late glacial readvance caused the Tasman Glacier to advancesubstantially 11 700 years ago, to the current location of Lake Pukaki, and for theFranz Josef Glacier to also advance substantially and form the Waiho Loop. No similarre-advances of the glaciers have taken place since that time.
Within the Holocene, climate continued to change continuously although deviationswere of lower magnitude and shorter duration. Within the last 500 years the mostsignificant climatic changes have been a period of cooling referred to as the “LittleIce Age” with maximum cooling attained about 1730 AD. This period lasted until thelate nineteenth century when it was followed by rapid warming beginning in the middleof the twentieth century and continuing until the present day. Over the past 200 years,mean temperatures in NZ have risen by about 1.5 ◦C. Accurate air temperature data areavailable since 1910 (Mullan et al. 2008) and indicate an increase in temperature ofabout 0.9 ◦C from that time to 2000. This rate of increase is higher than that reportedin many other locations around the globe and could be linked to low concentrationsof sulfate aerosol pollution resulting in reduced global dimming in the South Pacific.In 1998 a strong El Nino phase was associated with this year being the warmeston record in NZ. Mean air temperature in NZ has, however, been relatively stablesince 1970 (Renwick et al. 2010a), unlike the increases observed in the global mean(Hansen et al. 2010). A negative excursion of the IPO commencing around 1999–2000may have moderated the climate change signal over NZ in the past decade or two.Compared with the 1971–2000 mean, annual mean temperatures in NZ were +0.4 ◦C

340 CH 19 EFFECTS OF CLIMATE CHANGE ON NEW ZEALAND LAKES
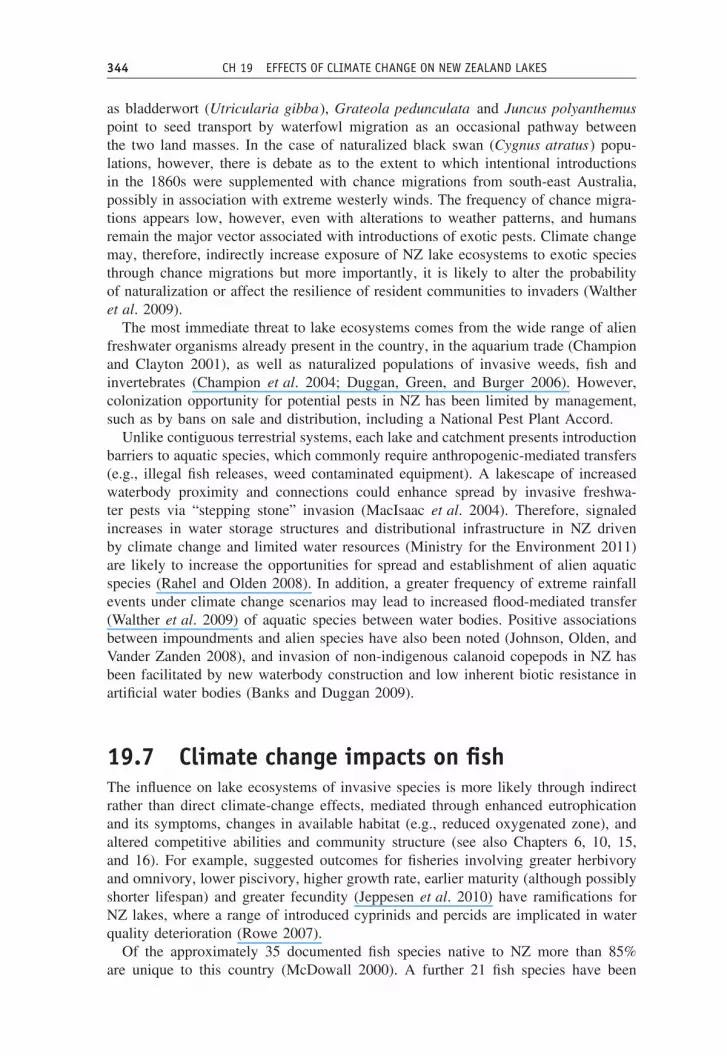
Figure 19.1 Tasman Lake at the foot of the Tasman Glacier, South Island, NZ, in 2010. Source:Wikipedia (http://en.wikipedia.org/wiki/Tasman_Lake).
and −0.2 ◦C in 2008 and 2009, respectively (Renwick et al. 2010a), and 0 ◦C and−0.5 ◦C for Taupo in 2008 and 2009, respectively, compared with the local mean.
The average rate of retreat of the largest glacier in NZ, the Tasman, has been about180 m year−1 since the 1990s, leading to the formation of terminal Lake Tasman in1973. This lake was 7 km long, 2 km wide and 245 m deep by 2008 and is expectedto continue to expand until the disappearance of Tasman Glacier as climate warms(Figure 19.1).
The NZ coastline is 15 100 km in length and NZ ranks ninth in the world for ratio ofcoastline length to land area. There is an average of 7.4 lakes, wetlands and lagoons per100 km of coastline which are vulnerable to a 1 m rise in sea level (Schallenberg, Hall,and Burns 2003). As the sea pushes inland with climate warming, the main effect onthese ecosystems will be salinization. The last time that this occurred was during themid-Holocene sea level highstand, ∼4000–6000 years ago (Gibb 1986), during whichtime a coastal freshwater lake in South Island experienced sufficient marine influenceto shift its waters to brackish. The lake, with resident freshwater mussel, Hyridellamenziesii , was at the time extensively colonized by the estuarine clam, Austrovenusstutchburyi , which requires a salinity of ∼14 ppt to survive (Marsden 2004).
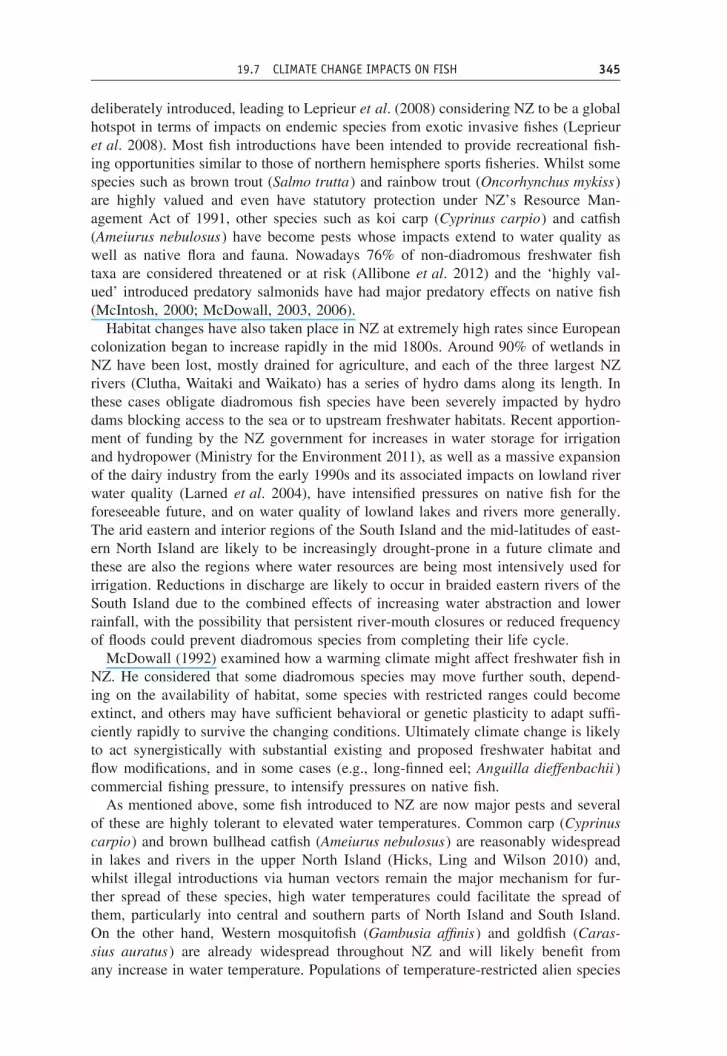
19.4 Future climateThe ensemble results of global climate models yield an increase in global mean tem-perature of around 3 ◦C by the end of this century, under an A1B emissions scenario(see definition below), which is in the mid-range for all emissions scenarios (1.1 to6.4 ◦C). The 3 ◦C increase under the A1B scenario equates to a mean increase over NZof around 2.1 ◦C (Figure 19.2a, Mullan et al. 2008), with the reduced rate of warmingfor NZ attributed largely to the moderating effect of the surrounding Pacific Ocean; ofthe major oceans across the globe southern oceans are likely to be the most resilientto a warming climate. Of particular note, however, is an increase in the intensity ofthe ENSO cycle and a higher frequency of westerly winds. El Nino events are likelyto lead to more rainfall in the wetter western land mass and lower rainfall in the east(Figure 19.2b). The frequency of intense rainfall events is likely to increase (Pall,Allen, and Stone 2007) whilst warmer temperatures and more rainfall (as opposed tosnowfall) are predicted to reduce the snow pack in the Southern Alps (Mullan et al.2008; Hendrikx et al. 2009), possibly affecting the seasonal hydrological cycles andthe duration of ice-free season in high-altitude lakes.

19.4 FUTURE CLIMATE 341
North IslandMissing data
2.09 - 2.11
2.11 - 2.12
2.12 - 2.13
2.13 - 2.14
2.14 - 2.15
2.15 - 2.16
2.16 - 2.17
2.17 - 2.18
2.18 - 2.19
2.19 - 2.20
2.20 - 2.21
2.21 - 2.22
2.22 - 2.23
2.24 - 2.25
2.25 - 2.26
South Island
Missing data
North IslandMissing data
2.02 - 2.04
2.04 - 2.06
2.06 - 2.08
2.08 - 2.09
2.09 - 2.11
2.11 - 2.13
2.13 - 2.15
2.15 - 2.17
2.17 - 2.18
2.18 - 2.20
2.20 - 2.22
2.22 - 2.24
2.24 - 2.26
2.26 - 2.27
2.27 - 2.29
−8.73 - −7.84
−7.84 - −6.95
−6.95 - −6.06
−6.06 - −5.17
−5.17 - −4.28
−4.28 - −3.39
−3.39 - −2.50
−2.50 - −1.62
−1.62 - −0.73
−0.73 - 0.16
0.16 - 1.05
1.05 - 1.94
1.94 - 2.83
2.83 - 3.72
3.72 - 4.61
South IslandMissing data
−6.19 - −4.75
−4.75 - −3.32
−3.32 - −1.89
−1.89 - −0.46
−0.46 - 0.98
0.98 - 2.41
2.41 - 3.84
3.84 - 5.28
5.28 - 6.71
6.71 - 8.14
8.14 - 9.57
9.57 - 11.01
11.01 - 12.44
12.44 - 13.87
13.87 - 15.30
(a)
(b)
Figure 19.2 Change in (a) temperature (◦C) and (b) percentage precipitation in 2091–2099compared with baseline of 1965–1995, based on ensemble output and statistical downscalingfrom 12 GCM models. (See insert for color representation.)

342 CH 19 EFFECTS OF CLIMATE CHANGE ON NEW ZEALAND LAKES
Other statistical measures associated with a warming climate are likely to follow,such as reduced number of frost days, higher frequency of heat waves and reducedsoil moisture, but one outcome of changes to weather circulation patterns and inten-sification of the ENSO cycle is likely to be an increase in the frequency of extremewinds (Mullan et al. 2008). This change may have implications for surface mixedlayer depths of deep lakes, which are markedly deeper in NZ than for lakes at compa-rable latitudes in the northern hemisphere (Davies-Colley 1998), and also for shallowcoastal and lowland lakes whose submerged vegetation can be influenced by extremewind events. For example, a massive storm (“the Wahine”) destroyed extensive sub-merged fringing weed beds (mostly Ruppia spp. and Potamogeton spp.) in shallow(z = 1.9 m) Lake Ellesmere in 1968. Weed beds have not re-established to any substan-tial extent since the storm and black swan (Cygnus atratus) numbers have decreasedfrom up to 80 000 prior to the storm to <10 000 nowadays.
Based on records from four long-term tidal gauges, sea levels in NZ have increasedapproximately 1.6 mm year−1 during the twentieth century; similar to the globalaverage of 1.7 ± 0.3 (standard error) mm year−1 (Church and White 2006). TheInternational Panel for Climate Change (IPCC) projections for sea-level rise, whichare generally considered conservative, range from 18 to 59 cm across six differentemission scenarios, with more extreme sea level rise (56–200 cm) projected based onrecently-observed rapid declines in ice mass in Greenland and Antarctica. These moreextreme sea-level rise scenarios would obliterate many of the coastal lakes and lagoonswhich currently open either naturally or artificially (by breaching coastal barrier sub-strates) to the sea, and would lead to saline intrusion in other currently freshwatersystems.
19.5 Overview of lake types and formationprocesses
There are 3820 lakes in NZ that have a surface area larger than one hectare, col-lectively representing about 1.3% of the land area (Leathwick et al. 2010). Theselakes are of widely varying types and origins. Many of the lakes in the central NorthIsland area are volcanic crater lakes, while the majority of the lakes near the SouthernAlps are associated with glacial scour and retreat. Coastal lakes, lagoons and wet-lands are widespread across both North and South Islands with approximately 74 per1000 km of coastline which have their mean water level within 1 m of mean sea level(Schallenberg, Hall, and Burns 2003). Artificial lakes are also extremely importantfor storage-water for hydropower generation (∼65% of the electricity supply of NZ),and major river systems including the Waitaki (South Canterbury), Clutha (Otago)and Waikato (Waikato region) have a series of dams at intervals along their lengths(approximately 25 hydro lakes nationally). Each of these rivers has a large storagesource, some of which have artificially regulated water levels, including Lake Taupofor the Waikato River, lakes Pukaki, Tekapo and Ohau for the Waitaki River, andlakes Hawea, Wanaka and Wakatipu for the Clutha River. The largest power stationin NZ is associated with Lake Manapouri and together with a hydro power stationat Lake Te Anau, where lake levels are also artificially regulated, these stations capi-talize on the very high rainfall in this area of the south-west of South Island known

19.6 CLIMATE CHANGE AND IMPACTS ON ENDEMIC AND EXOTIC FLORA AND FAUNA 343
as Fiordland. A large number of smaller shallow man-made lakes, totaling 544, havebeen created for both domestic water use in urban areas, and for water storage foragricultural irrigation.
Shallow lakes in NZ are polymictic (frequently alternating periods of mixing andstratification) (Hamilton, Hawes, and Davies-Colley 2004). Deep lakes are almostuniformly monomictic (one vertical circulation period per year) with the exceptionof some high-altitude lakes in the central South Island which freeze over in winter(Hamilton, Hawes, and Davies-Colley 2004; Hamilton et al . 2010), though there isno current record of a dimictic circulation pattern (two periods of complete verticalcirculation per year) in these lakes. According to the classification scheme of Lewis(2000), lakes at >40o latitude (i.e., encompassing the South Island and lower part ofthe North Island) should be dimictic. The anomaly of mixing patterns in NZ lakescompared with Lewis’ (2000) classification reflects the temperate windy climate inNZ in which lakes mix more deeply than those of large continental land masses andare not subject to calm cold winters or especially hot summers (Davies-Colley 1988).Interestingly, Lake Taupo (z = 90 m) has deviated from monomictic behavior andremained vertically stratified (amictic) in exceptionally warm winters such as 1998,when there was a strong El Nino phase (see Section 19.11).
Most lakes in NZ were formed in the past 20 000 years but they have been shaped bya wide variety of geological and climatic processes (Lowe and Green 1987). Glaciallakes of the South Island represent 38% of all NZ lakes and were formed duringPleistocene glaciations. Volcanic lakes occur in the Taupo Volcanic Zone where mas-sive volcanic eruptions have led to a localized concentration of deep lakes, someof which are directly influenced by geothermal inputs. Shallow coastal lakes formedeither through shoreline erosional and depositional processes as riverine lagoons (291lakes), or by the blockage of small river valleys by windblown sand as coastal dunelakes (319 lakes), are numerous along the coastline (Leathwick et al. 2010). Manycoastal lakes are eutrophic from impacts of agricultural development in their catch-ments and reduced water levels from draining, but may also be increasingly affected byinundation of saline waters with projected increases in sea level with climate change.There are approximately 106 lakes under 3 m elevation above sea level, and just over300 under 10 m elevation above sea level.
19.6 Climate change and impacts on endemicand exotic flora and fauna
Regulations around importation of organisms have effectively prevented potentialfreshwater pests entering NZ officially, but illegal introduction routes remain (Cham-pion and Clayton 2000). These routes may be enhanced by changing internationaltrade, altered human migration, demographics and additional pest pathways and vec-tors associated with climate change. New Zealand’s isolation and maritime bordershave largely protected against chance freshwater introductions. The freshwater faunaof NZ are characterized by a high level of endemism and, in the case of Galaxiidfish in particular, also a high level of local endemism (Allibone et al. 2012). How-ever, the NZ aquatic flora has many species in common with Australia, but witha narrower representation of lifeforms (e.g., absence of water lily types). Contin-ued establishment of “colonizer” plants (de Lange et al. 2009) from Australia such
344 CH 19 EFFECTS OF CLIMATE CHANGE ON NEW ZEALAND LAKES
as bladderwort (Utricularia gibba), Grateola pedunculata and Juncus polyanthemuspoint to seed transport by waterfowl migration as an occasional pathway betweenthe two land masses. In the case of naturalized black swan (Cygnus atratus) popu-lations, however, there is debate as to the extent to which intentional introductionsin the 1860s were supplemented with chance migrations from south-east Australia,possibly in association with extreme westerly winds. The frequency of chance migra-tions appears low, however, even with alterations to weather patterns, and humansremain the major vector associated with introductions of exotic pests. Climate changemay, therefore, indirectly increase exposure of NZ lake ecosystems to exotic speciesthrough chance migrations but more importantly, it is likely to alter the probabilityof naturalization or affect the resilience of resident communities to invaders (Waltheret al. 2009).
The most immediate threat to lake ecosystems comes from the wide range of alienfreshwater organisms already present in the country, in the aquarium trade (Championand Clayton 2001), as well as naturalized populations of invasive weeds, fish andinvertebrates (Champion et al. 2004; Duggan, Green, and Burger 2006). However,colonization opportunity for potential pests in NZ has been limited by management,such as by bans on sale and distribution, including a National Pest Plant Accord.
Unlike contiguous terrestrial systems, each lake and catchment presents introductionbarriers to aquatic species, which commonly require anthropogenic-mediated transfers(e.g., illegal fish releases, weed contaminated equipment). A lakescape of increasedwaterbody proximity and connections could enhance spread by invasive freshwa-ter pests via “stepping stone” invasion (MacIsaac et al. 2004). Therefore, signaledincreases in water storage structures and distributional infrastructure in NZ drivenby climate change and limited water resources (Ministry for the Environment 2011)are likely to increase the opportunities for spread and establishment of alien aquaticspecies (Rahel and Olden 2008). In addition, a greater frequency of extreme rainfallevents under climate change scenarios may lead to increased flood-mediated transfer(Walther et al. 2009) of aquatic species between water bodies. Positive associationsbetween impoundments and alien species have also been noted (Johnson, Olden, andVander Zanden 2008), and invasion of non-indigenous calanoid copepods in NZ hasbeen facilitated by new waterbody construction and low inherent biotic resistance inartificial water bodies (Banks and Duggan 2009).
19.7 Climate change impacts on fishThe influence on lake ecosystems of invasive species is more likely through indirectrather than direct climate-change effects, mediated through enhanced eutrophicationand its symptoms, changes in available habitat (e.g., reduced oxygenated zone), andaltered competitive abilities and community structure (see also Chapters 6, 10, 15,and 16). For example, suggested outcomes for fisheries involving greater herbivoryand omnivory, lower piscivory, higher growth rate, earlier maturity (although possiblyshorter lifespan) and greater fecundity (Jeppesen et al. 2010) have ramifications forNZ lakes, where a range of introduced cyprinids and percids are implicated in waterquality deterioration (Rowe 2007).
Of the approximately 35 documented fish species native to NZ more than 85%are unique to this country (McDowall 2000). A further 21 fish species have been
19.7 CLIMATE CHANGE IMPACTS ON FISH 345
deliberately introduced, leading to Leprieur et al. (2008) considering NZ to be a globalhotspot in terms of impacts on endemic species from exotic invasive fishes (Leprieuret al. 2008). Most fish introductions have been intended to provide recreational fish-ing opportunities similar to those of northern hemisphere sports fisheries. Whilst somespecies such as brown trout (Salmo trutta) and rainbow trout (Oncorhynchus mykiss)are highly valued and even have statutory protection under NZ’s Resource Man-agement Act of 1991, other species such as koi carp (Cyprinus carpio) and catfish(Ameiurus nebulosus) have become pests whose impacts extend to water quality aswell as native flora and fauna. Nowadays 76% of non-diadromous freshwater fishtaxa are considered threatened or at risk (Allibone et al. 2012) and the ‘highly val-ued’ introduced predatory salmonids have had major predatory effects on native fish(McIntosh, 2000; McDowall, 2003, 2006).
Habitat changes have also taken place in NZ at extremely high rates since Europeancolonization began to increase rapidly in the mid 1800s. Around 90% of wetlands inNZ have been lost, mostly drained for agriculture, and each of the three largest NZrivers (Clutha, Waitaki and Waikato) has a series of hydro dams along its length. Inthese cases obligate diadromous fish species have been severely impacted by hydrodams blocking access to the sea or to upstream freshwater habitats. Recent apportion-ment of funding by the NZ government for increases in water storage for irrigationand hydropower (Ministry for the Environment 2011), as well as a massive expansionof the dairy industry from the early 1990s and its associated impacts on lowland riverwater quality (Larned et al. 2004), have intensified pressures on native fish for theforeseeable future, and on water quality of lowland lakes and rivers more generally.The arid eastern and interior regions of the South Island and the mid-latitudes of east-ern North Island are likely to be increasingly drought-prone in a future climate andthese are also the regions where water resources are being most intensively used forirrigation. Reductions in discharge are likely to occur in braided eastern rivers of theSouth Island due to the combined effects of increasing water abstraction and lowerrainfall, with the possibility that persistent river-mouth closures or reduced frequencyof floods could prevent diadromous species from completing their life cycle.
McDowall (1992) examined how a warming climate might affect freshwater fish inNZ. He considered that some diadromous species may move further south, depend-ing on the availability of habitat, some species with restricted ranges could becomeextinct, and others may have sufficient behavioral or genetic plasticity to adapt suffi-ciently rapidly to survive the changing conditions. Ultimately climate change is likelyto act synergistically with substantial existing and proposed freshwater habitat andflow modifications, and in some cases (e.g., long-finned eel; Anguilla dieffenbachii )commercial fishing pressure, to intensify pressures on native fish.
As mentioned above, some fish introduced to NZ are now major pests and severalof these are highly tolerant to elevated water temperatures. Common carp (Cyprinuscarpio) and brown bullhead catfish (Ameiurus nebulosus) are reasonably widespreadin lakes and rivers in the upper North Island (Hicks, Ling and Wilson 2010) and,whilst illegal introductions via human vectors remain the major mechanism for fur-ther spread of these species, high water temperatures could facilitate the spread ofthem, particularly into central and southern parts of North Island and South Island.On the other hand, Western mosquitofish (Gambusia affinis) and goldfish (Caras-sius auratus) are already widespread throughout NZ and will likely benefit fromany increase in water temperature. Populations of temperature-restricted alien species
346 CH 19 EFFECTS OF CLIMATE CHANGE ON NEW ZEALAND LAKES
have also established in NZ thermal areas from aquarium “escapees” including fish(e.g., guppy: Poecilia reticlata) and snails (e.g., Malaysian trumpet snail: Melanoidestuberculata) (Duggan 2002; Wilding and Rowe 2008). Although it is unlikely thatfuture elevations in temperature will be sufficient to see expansions in these species,additional tropical/subtropical organisms may be subsequently released through theaquarium trade.
19.8 Climate change impacts on aquatic plantsand macroinvertebrates
It is hypothesized that climate change may increase disturbance intensity in freshwaters, making them easier to invade (Rahel and Olden 2008). Examples of invasionsby major weeds in relatively pristine NZ lakes (e.g., Lagarosiphon major in LakeWanaka), however, suggest their competitive abilities already put them at a signifi-cant competitive advantage and disturbance is unlikely to be a factor in introduction orestablishment. Nevertheless, climate change scenarios of increased lake nutrient sta-tus and turbidity could further favor growth performance of tall-growing weed species(e.g., Egeria densa, Ceratophyllum demersum, L. major) over native plants becausethese weeds can “escape” light limitation by forming a dense canopy close to thewater surface (Tanner, Clayton, and Wells 1993). Indeed, E. densa appears most inva-sive in eutrophic conditions but it has also been associated with weed bed collapsesand transitions to a resilient devegetated turbid state (Schallenberg and Sorrell 2009).Phenotypic plasticity in invasive species has been suggested to increase the range ofenvironments under which they can establish or invade. Comparisons of photosyn-thesis and “fitness” measures for an invasive strain of C. demersum from NZ and anoninvasive strain showed the invasive strain acclimated better to elevated temper-atures (Hyldgaard and Brix 2012), suggesting weed performance could be enhancedunder climate change but distributions of a number of the submerged lake weeds (e.g.,E. densa, C. demersum) that reproduce vegetatively have been best explained by vari-ables characterizing human access and use (Compton et al. 2012). The advantage of anextended growing season for invasion by lake weeds under climate change (Rooneyand Kalff 2000) would not be pronounced in NZ compared with more continentalclimates due to the current perennial nature of lake vegetation.
Although the potential NZ range of the tropical floating weeds water hyacinth(Eichornia crassipes) and salvinia (Salvinia molesta) would theoretically be extendedby climate change, an ongoing management program effectively prevents expansion(Clayton 1990). Climate change would have limited impact on the threat that majorfreshwater pests such as zebra or quagga mussels (Dreissena polymorpha, D. bugensis)pose for NZ lake environments, as the climate of this country already falls within theirknown tolerance range.
Resilience of native lake species to competitive exclusion under climate change sce-narios is unknown, but, interestingly, several NZ freshwater biota have demonstratedan extended range and are regarded as invasive in other geographic areas, includingthe NZ mudsnail Potamopyrgus antipodarum (Loo, MacNally, and Lake. 2007), theamphibious macrophyte Glossostigma cleistanthum (Les, Capers, and Tippery 2006)and pygmyweed Crassula helmsii (Dawson 1996), suggesting tolerance of a wider setof environmental conditions than is currently experienced in NZ.

19.9 EFFECTS OF CLIMATE CHANGE ON SHALLOW NZ LAKES 347
19.9 Effects of climate change on shallowNZ lakes
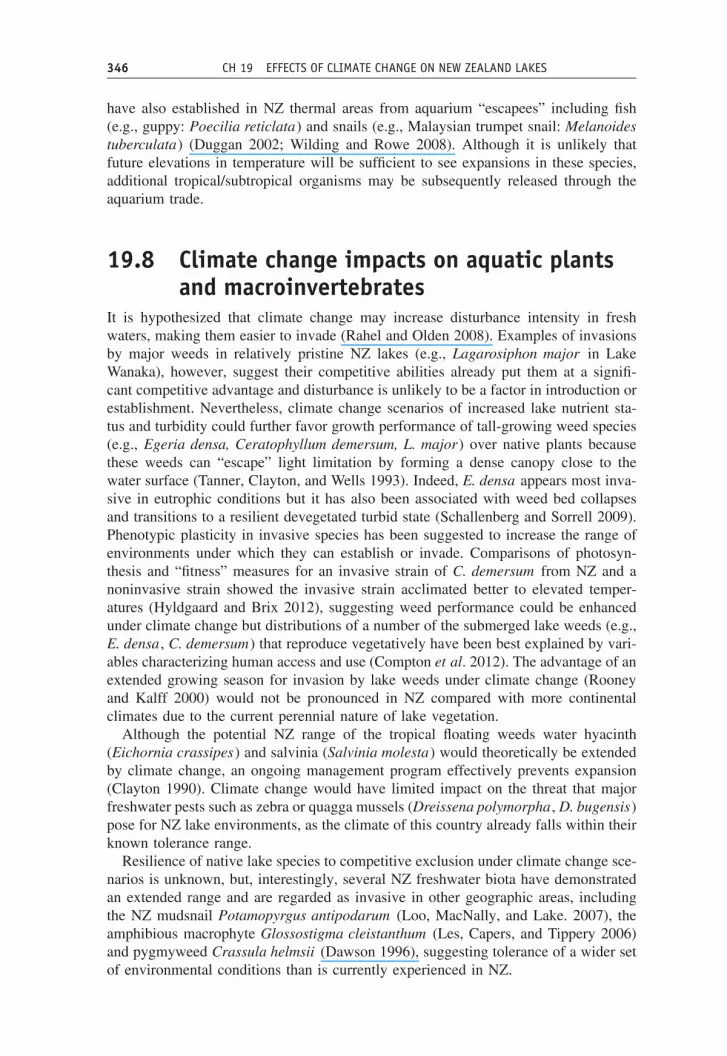
Schallenberg and Sorrell (2009) identified 37 shallow lakes in NZ that had undergoneregime shifts from a clearwater state to a turbid state. These lakes were locatedthroughout much of NZ, from Northland to Otago in the south. The authors alsoidentified 58 other lakes that had maximum depths and mean annual air temperatureswithin the ranges of the lakes which had undergone regime shifts, but the secondgroup of lakes had not been reported to have undergone such regime shifts. Thisdataset allows the examination of the effect of temperature on the tendency for lakesto undergo such regime shifts. Using the lakes from the Schallenberg and Sorrell(2009) dataset, Figure 19.3 shows the number of regime shifting and non-regimeshifting lakes in relation to mean annual air temperature. Regime shifting lakes werereported with a range of mean annual air temperatures of 8.7 to 15.8 ◦C. There wasa clear unimodal pattern in the proportion of lakes which underwent regime shifts inrelation to temperature (Figure 19.3). This appears to indicate that there is an optimumtemperature range of 10–13 ◦C within which regime shifts tend to occur in NZ lakes.Schallenberg and Sorrell (2009) found strong correlations between regime shifts andland use, the presence of an invasive macrophyte and the presence of benthivorous,herbivorous and planktivorous fish. Therefore, the unimodal relationship in Figure 19.3may be influenced by other, indirect factors. However, Figure 19.4 suggests thatclimate warming may shift the prevalence of regime shifting southward in NZ.
In contrast, supported by the historical analysis of trends in NZ sea levels byHannah (2004), the predictions of sea-level rise would appear to be more robust thanthose for air temperature alone. Studies from Lake Waihola, Otago, South Island,have demonstrated recently that a climate-induced saline intrusion, which raised thesalinity of the lake to 5 ppt, was sufficient to cause major changes to the zooplanktonabundance and community structure of the lake (Schallenberg, Hall, and Burns 2003).The salinity increase reduced zooplankton numerical abundance 5-fold, and taxonomicrichness three-fold while temporarily extirpating Daphnia carinata, a keystone speciesin the lake food web and a major grazer of phytoplankton and seston. This commonlyobserved sensitivity of Daphnia and other cladocerans to salinity (see references in
20181614121086420
7 8 9 10 11
Mean annual air temperature (°C)
12 13 14 15 16
Num
ber
of la
kes
RSL
NRSL
Figure 19.3 Number of regime shifting lakes (RSL) and non-regime shifting lakes (NRSL) inrelation to mean annual air temperature.
348 CH 19 EFFECTS OF CLIMATE CHANGE ON NEW ZEALAND LAKES
0.90.80.70.60.50.40.30.20.1
07 8 9 10 11 12 13 14 15 16
Pro
port
ion
of la
kes
unde
rgoi
ng r
egim
e sh
ifts
Mean annual air temperature (°C)
Figure 19.4 Proportion of lakes sampled in each temperature class which underwent regimeshifts.
Schallenberg, Hall, and Burns 2003) could play a pivotal role in instigating regimeshifts in salinizing shallow lakes (Jeppesen et al. 1994).
The predominant role of salinity variations in structuring zooplankton communitieswas also reported from an intermittently opened barrier-bar lagoon in southern NZ(Duggan and White 2010). In this system, zooplankton were sampled across multiplemarine incursions and the oligohaline taxa appeared to recover readily when freshwaterconditions were restored, indicating that re-population was possible after temporarysalinization, either as a result of the production of resting eggs or due to the availabilityand utilization of freshwater refugia within the lagoon system. Such resilience wouldnot be expected to persist with rising sea levels due to global climate change.
Although not studied formally, similarly strong effects of salinization occur on thecommunities of benthos and hyperbenthos in NZ’s coastal lakes and lagoons. In con-trast to the typically insect-dominated freshwater invertebrate communities found inNZ lakes and wetlands, invertebrates in estuarine systems tend to be dominated byhyperbenthic mysids and amphipods and by benthic polychaetes and snails. Chirono-mid larvae appear to be the main salinity-tolerant benthic insect larvae and a fewodonate taxa seem to tolerate moderate salinities.
The fish taxa found in NZ’s coastal lakes and wetlands are generally either diadro-mous (or facultatively diadromous) and, therefore, show high tolerances for salinity.Even the few taxa which are anadromous show moderately high salinity tolerances.Therefore, the strongest effects of salinization on fish communities in coastal lakesand wetlands are likely to be indirect, most likely due to the progressive colonizationof these systems by estuarine/marine fish species and/or to changes in their availableprey and habitats.
The moderately diverse aquatic macrophyte flora of shallow NZ lakes and wetlandsis poorly represented in coastal lakes and lagoons which experience saline intrusions.However, invasive exotic macrophytes such as L. major and E. canadensis are alsopoorly represented. As a result, where submerged aquatic macrophyte communitiespersist in brackish coastal lakes and lagoons, they generally comprise few species ofnative aquatic macrophytes, including Ruppia spp., Stuckenia pectinata, and Myrio-phyllum triphyllum . These species all rely on periods of low salinity for survival.Therefore, accelerating sea level rise will cause these communities to disappear fromcurrently brackish environments and will allow them to colonize the current freshwaterhabitats which will become brackish as sea level rises.

19.10 EFFECTS OF CLIMATE CHANGE ON HIGH-ALTITUDE NZ LAKES 349
Remane and Schlieper (1971) proposed that the taxonomic diversity of estuarineenvironments is generally lower than that of freshwater and marine environments.Their model appears to hold for most biological communities in NZ coastal lakes andlagoons. Although robust data so far only exist for zooplankton communities, obser-vations indicate that invertebrate and macrophyte communities in coastal lakes andwetlands will lose biodiversity as marine intrusions begin to affect them. Some key-stone species (e.g., Daphnia sp.) will be affected and consequently, salinity increaseswill cause major ecological regime shifts in many of these ecosystems.
19.10 Effects of climate change on high-altitudeNZ lakes
It is recognized that ecosystems dependent upon seasonal patterns of snowpack and iceare likely to be highly sensitive to future climate change (see reviews by Hauer et al.1997; Melack et al. 1997; Battarbee 2002; see also Chapter 13). Small changes intemperature can result in significant effects on hydrological processes and seasonalityof ice cover, which in turn can affect processes controlling communities and theirinteractions within the food web.
A significant number of lakes occur in alpine regions of NZ associated with theSouthern Alps as well as high-altitude volcanic crater lakes on the North Island. Thereare more than 600 lakes larger than one hectare above 1000 m elevation, with thehighest being crater lakes of the Central Volcanic Plateau region above 2500 m. Theduration of the annual cycle in which precipitation would fall as snow under a warmerclimate would likely influence the amount of spring snow-melt which occurs in thesecatchments. It is also expected that patterns of wind direction will alter (Mullan et al.2008), meaning that the amount of precipitation on the eastern and western portionsof mountain ranges will change with climate change.
Relatively little work has been conducted in NZ alpine lakes to potentially under-stand these effects on aquatic communities. Although alpine systems are expected tohave relatively simple food webs, many of the species are endemic and do not occurin lower altitude freshwater environments (Kilroy et al. 2006), thus there are sig-nificant unique biodiversity values in these environments. Some recent experimentalwork conducted by Greig et al. (2012) demonstrated that warming can have complexeffects on whole-system metabolism in alpine tarns as well as changing the dynamicsbetween insects and their predators through changes in emergence timing. Low tem-perature is known to limit the occupation of these environments by fish species, thuswarming could also change community interactions by enabling invasion by fish intosystems not presently inhabited. The climbing abilities of some of the NZ diadromousgalaxiid species such as koaro (Galaxias brevipinnis) would facilitate this potential.
In conclusion, alpine lakes are a significant feature of NZ lakes, and it is expectedthey are likely to be highly sensitive to future changes in climate. These will mostlikely be mediated through changes in precipitation patterns, changes in snowfall, andpossibly by changes in the duration of ice cover, as in other alpine areas. The limitedresearch conducted to date suggests that changes will mainly be manifested throughalterations to community interactions and predator–prey dynamics, and possibly byinvasion by species presently occurring in lower altitude freshwater environments.
350 CH 19 EFFECTS OF CLIMATE CHANGE ON NEW ZEALAND LAKES
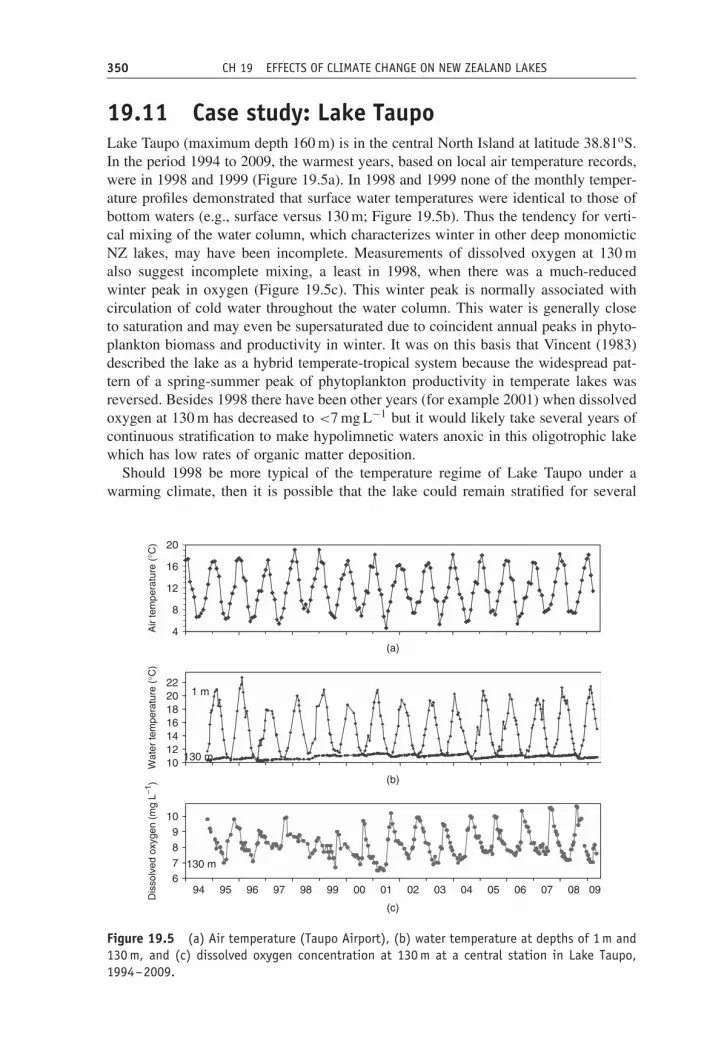
19.11 Case study: Lake TaupoLake Taupo (maximum depth 160 m) is in the central North Island at latitude 38.81oS.In the period 1994 to 2009, the warmest years, based on local air temperature records,were in 1998 and 1999 (Figure 19.5a). In 1998 and 1999 none of the monthly temper-ature profiles demonstrated that surface water temperatures were identical to those ofbottom waters (e.g., surface versus 130 m; Figure 19.5b). Thus the tendency for verti-cal mixing of the water column, which characterizes winter in other deep monomicticNZ lakes, may have been incomplete. Measurements of dissolved oxygen at 130 malso suggest incomplete mixing, a least in 1998, when there was a much-reducedwinter peak in oxygen (Figure 19.5c). This winter peak is normally associated withcirculation of cold water throughout the water column. This water is generally closeto saturation and may even be supersaturated due to coincident annual peaks in phyto-plankton biomass and productivity in winter. It was on this basis that Vincent (1983)described the lake as a hybrid temperate-tropical system because the widespread pat-tern of a spring-summer peak of phytoplankton productivity in temperate lakes wasreversed. Besides 1998 there have been other years (for example 2001) when dissolvedoxygen at 130 m has decreased to <7 mg L−1 but it would likely take several years ofcontinuous stratification to make hypolimnetic waters anoxic in this oligotrophic lakewhich has low rates of organic matter deposition.
Should 1998 be more typical of the temperature regime of Lake Taupo under awarming climate, then it is possible that the lake could remain stratified for several
10121416182022
94 95 96 97 98 99 00 01
(a)
(b)
(c)
02 03 04 05 06 07 08 096
7
8
9
10
1 m
130 m
130 m
4
8
12
16
20
Wat
er te
mpe
ratu
re (
°C)
Dis
solv
ed o
xyge
n (m
g L−1
)A
ir te
mpe
ratu
re (
°C)
Figure 19.5 (a) Air temperature (Taupo Airport), (b) water temperature at depths of 1 m and130 m, and (c) dissolved oxygen concentration at 130 m at a central station in Lake Taupo,1994–2009.
19.13 CASE STUDY 351
years, interrupted intermittently in years of complete winter mixing. A similar scenariohas been hypothesized for Lake Tahoe (California, USA; see Chapter 14) where incom-plete vertical mixing in winter has also been noted on two or three occasions since the1970s, and infrequent vertical mixing with climate warming could be of insufficientfrequency to prevent development of anoxia during extended periods of stratifica-tion. With anoxia there is potential for rapid increase in trophic status of the lakedue to bottom-sediment releases of phosphate and ammonium (e.g., see Chapter 6).Like several lakes of the TVZ, however, Taupo has geothermal heat inputs, which areevident by small increases in water temperature at depth (130 m) during stratification(Figure 19.5b). Thus hypolimnetic waters gradually warm during stratification, leadingto reduced vertical density stability. A warming climate is therefore more likely toresult in Lake Taupo not becoming fully amictic but almost certainly deviating fromthe idealized mixing regime implied by monomixis; perhaps a thermal regime moreclosely approximating a hybrid temperate-tropical system (cf. Vincent 1983).
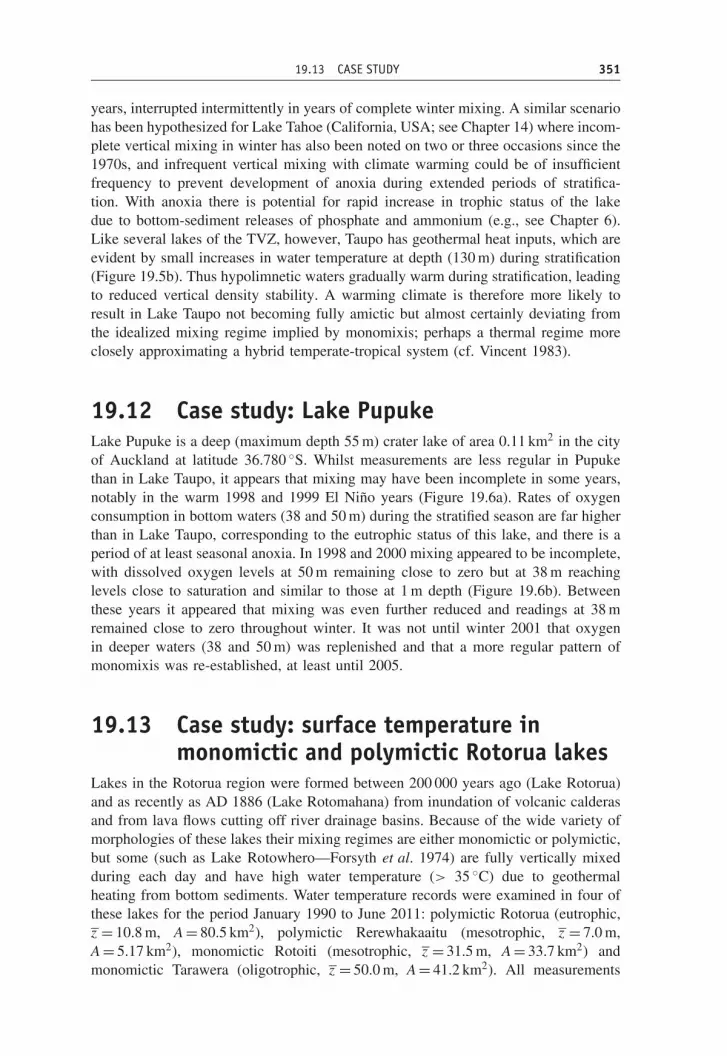
19.12 Case study: Lake PupukeLake Pupuke is a deep (maximum depth 55 m) crater lake of area 0.11 km2 in the cityof Auckland at latitude 36.780 ◦S. Whilst measurements are less regular in Pupukethan in Lake Taupo, it appears that mixing may have been incomplete in some years,notably in the warm 1998 and 1999 El Nino years (Figure 19.6a). Rates of oxygenconsumption in bottom waters (38 and 50 m) during the stratified season are far higherthan in Lake Taupo, corresponding to the eutrophic status of this lake, and there is aperiod of at least seasonal anoxia. In 1998 and 2000 mixing appeared to be incomplete,with dissolved oxygen levels at 50 m remaining close to zero but at 38 m reachinglevels close to saturation and similar to those at 1 m depth (Figure 19.6b). Betweenthese years it appeared that mixing was even further reduced and readings at 38 mremained close to zero throughout winter. It was not until winter 2001 that oxygenin deeper waters (38 and 50 m) was replenished and that a more regular pattern ofmonomixis was re-established, at least until 2005.
19.13 Case study: surface temperature inmonomictic and polymictic Rotorua lakes
Lakes in the Rotorua region were formed between 200 000 years ago (Lake Rotorua)and as recently as AD 1886 (Lake Rotomahana) from inundation of volcanic calderasand from lava flows cutting off river drainage basins. Because of the wide variety ofmorphologies of these lakes their mixing regimes are either monomictic or polymictic,but some (such as Lake Rotowhero—Forsyth et al. 1974) are fully vertically mixedduring each day and have high water temperature (> 35 ◦C) due to geothermalheating from bottom sediments. Water temperature records were examined in four ofthese lakes for the period January 1990 to June 2011: polymictic Rotorua (eutrophic,z = 10.8 m, A = 80.5 km2), polymictic Rerewhakaaitu (mesotrophic, z = 7.0 m,A = 5.17 km2), monomictic Rotoiti (mesotrophic, z = 31.5 m, A = 33.7 km2) andmonomictic Tarawera (oligotrophic, z = 50.0 m, A = 41.2 km2). All measurements
352 CH 19 EFFECTS OF CLIMATE CHANGE ON NEW ZEALAND LAKES
10
15
20
25
(a)
Wat
er te
mpe
ratu
re (
°C)
093 94 95 96 97 98 99
(b)
Year
00 01 02 03 04
2
4
6
8
10
12
Dis
solv
ed o
xyge
n (m
g L−1
)
1 m38 m50 m
1 m50 m
Figure 19.6 (a) Water temperature at 1 and 50 m depth, and (b) dissolved oxygen concentra-tion at 1, 38 and 50 m depth at a central station in Lake Pupuke, Auckland, 1993–2005.
were assigned to the day of the year the measurement was taken, and a polynomialmodel (Microsoft Excel) was fitted to minimize error between time of year andsurface water temperature (Figure 19.7). The residual (error) of modeled and observedwater temperature was then calculated for each measurement, and the resultingtime-series was analyzed for any trend by linear regression (Figure 19.8). Different

19.13 CASE STUDY 353
25
20
15
10
5
0
Wat
er te
mpe
ratu
re (
°C)
25
20
15
10
5
0
Wat
er te
mpe
ratu
re (
°C)
25
20
15
10
5
0
Wat
er te
mpe
ratu
re (
°C)
25
20
15
10
5
00 50 100 150 200
Day of the year
250 300 350
Wat
er te
mpe
ratu
re (
°C)
y = 5.117E-14x6 −4.972E-11x5 + 1.001E-08x4 + 4.247E-06x3 − 1.663E-03x2 + 1.079E-01x + 1.877E+01
y = −4.827E-14x6 −5.470E-11x5 − 3.143E-08x4 + 1.185E-05x3 − 2.260E-03x2 + 1.169E-01x + 1.942E+01
y = 2.578E-13x6 − 2.863E-10x5 + 1.039E-07x4 − 1.065E-05x3 − 8.546E-04x2 + 8.550E-02x + 1.955E+01
y = 2.209E-13x6 − 2.451E-10x5 + 9.003E-08x4 − 9.467E-06x3 − 7.607E-04x2 + 8.150E-02x + 1.993E+01
(a)
(b)
(c)
(d)
Figure 19.7 Surface water temperature by day of year based on records from January1990 to June 2011 and polynomial fit for (a) Lake Tarawera (R2 = 0.95, p<0.01), (b) LakeRotoiti (R2 = 0.93, p<0.01), (c) Lake Rerewhakaaitu (R2 = 0.94, p<0.01) and (d) Lake Rotorua(R2 = 0.93, p<0.01), Rotorua region, North Island.

354 CH 19 EFFECTS OF CLIMATE CHANGE ON NEW ZEALAND LAKES
5
4
3
2
1
0
5
4
3
2
1
0
5
4
3
2
1
0
5
4
3
2
1
0
−1
−2
−3
−4−5T
[mod
elle
d] -
T[o
bser
ved]
(°C
)
−1
−2
−3
−4
−5
−1
−2
−3
−4
−5
−1
−2
−3
−4
−5
T[m
odel
led]
- T
[obs
erve
d] (
°C)
T[m
odel
led]
- T
[obs
erve
d] (
°C)
T[m
odel
led]
- T
[obs
erve
d] (
°C)
y = 6.70E-05x – 2.41E+00
y = 9.30E-05x – 3.37E+00
y = 3.71E-05x – 1.18E+00
y = −2.62E-05x + 9.09E−01
1990 1992 1994 1996 1998 2000
Year
2002 2004 2006 2008 2010 2012
(a)
(b)
(c)
(d)
Figure 19.8 Time-series of the residual of observed and modeled water temperature (seeFigure 19.7) based on records from January 1990 to June 2011 and linear fit for (a) Lake Tarawera(R2 = 0.04, n.s.), (b) Lake Rotoiti (R2 = 0.05, n.s.), (c) Lake Rerewhakaaitu (R2 = 0.005, n.s.)and (d) Lake Rotorua (R2 = 0.003, n.s.), Rotorua region, North Island.

19.14 CASE STUDY: BOTTOM-WATER DISSOLVED OXYGEN IN LAKE ROTOITI 355
frequencies of measurement along the temperature time series, evident in all lakesexcept Rotorua, could potentially bias the residual trend line and inferences drawnbelow should be interpreted with caution, particularly given the limited time framefor which measurements are available, especially compared with well-monitoredlakes in the northern hemisphere.
Although no statistically significant (p<0.05) trends were observed, visual obser-vation of the time series revealed some interesting features. Slopes of regressions formonomictic lakes Tarawera and Rotoiti (0.00009 and 0.00007 ◦C day−1, respectively)were higher than those of polymictic lakes Rerewhakaaitu and Rotorua (0.00004and −0.00003 ◦C day−1, respectively). The percentage of variation explained by thepolynomial fit for day of year was also higher in the monomictic lakes (R2 = 0.04(Tarawera) and 0.05 (Rotoiti)) compared with the polymictic ones (R2 = 0.005(Rerewhakaaitu) and 0.003 (Rotorua)). The upper limit for the rate of temperatureincrease (equivalent to 0.33 ◦C per decade in Lake Tarawera) is still within the errorlimits observed in the annual maximum or minimum surface water temperaturesobserved in the Rotorua lakes but is substantially less than the rate of increaseobserved in many northern hemisphere lakes for which surface water temperatureshave warmed considerably faster than air temperatures in the past 1–2 decades (seeChapters 2, 3, 7 and 12).
19.14 Case study: bottom-water dissolvedoxygen in Lake Rotoiti
Dissolved oxygen at 60 m depth in Lake Rotoiti provides a good indication of con-centrations throughout the hypolimnion of this lake as geothermal heating from itsbottom sediments creates vertical mixing that largely homogenizes this water layer. Asimilar analysis technique was used for 60 m oxygen measurements in Lake Rotoitito that used above for surface water temperature in the four Rotorua lakes. Mea-surements were assigned to day of the year and a polynomial model was fitted torelate the measurements to time of year (Figure 19.9a). The time series between theresidual (error) of modeled and observed oxygen was then examined for any trendby linear regression (Figure 19.9b), again with the caveats noted above for the non-randomized nature of the time-series record. In the case of 60-m dissolved oxygenin Lake Rotoiti a significant (p<0.05) negative slope was noted for the linear regres-sion, with levels of dissolved oxygen declining by about 0.16 mg L−1 per decade. Thisrate of decline appears to have slowed considerably (cf. Hamilton, Hawes, and Gibbs2006) compared with what might be interpreted from intermittent records betweenthe 1950s and 1980s when Vincent, Gibbs, Dryden (1984) noted that hypolimneticwaters had changed from c. 50% saturation (1950s; Jolly 1968) to being anoxic at theend of the seasonally stratified period. Lake Rotoiti has changed from oligotrophicto mesotrophic/eutrophic in the period from the 1950s to 2000s, at least partly dueto eutrophication of its major inflow source—Lake Rotorua—as wastewater from thecity of Rotorua was discharged to this lake until 1990 (Von Westernhagen, Hamilton,and Pilditch 2010). Eutrophication of Rotoiti has probably obscured any other majorchanges in the lake ecosystem in the past few decades—with the possible exception ofintroductions of exotic weeds (see Section 19.6)—and in 2008 a wall was constructedat the western end of Lake Rotoiti to divert the Lake Rotorua inflow directly towardsthe outlet of Rotoiti to attempt to remedy the eutrophication problem in Rotoiti.

356 CH 19 EFFECTS OF CLIMATE CHANGE ON NEW ZEALAND LAKES
14
12
10
8
6
4
2
00 50 100 150
Days after 01 July200 250 300 350
Dis
solv
ed o
xyge
n (m
g L−1
)
543210
−1−2−3−4−51990 1992 1994 1996 1998 2000
Year
2002 2004 2006 2008 2010 2012
DO
[mod
elle
d] -
DO
[obs
erve
d] (
mg
L−1)
y = 7.490E-16x6 −2.580E-11x5 + 1.850E-08x4 − 2.988E-06x3 − 3.321E-04x2 + 4.661E-02x + 9.022E+00
y = −8.02E-05x + 2.96E+00
(a)
(b)
Figure 19.9 (a) Bottom-water (60 m) dissolved oxygen concentration by day of year basedon records from to 1976 to 2007 (polynomial fit: R2 = 0.94, p<0.01) and (b) time-series ofthe residual of observed and modeled bottom-water dissolved oxygen (linear fit: R2 = 0.03,p<0.05) for Lake Rotoiti, Rotorua region, North Island.
19.15 Case study: modeling effects of land useand climate change for Lake Rotorua
A one-dimensional coupled hydrodynamic-ecological model, DYRESM-CAEDYM,developed at Centre for Water Research, University of Western Australia, has pre-viously been applied to three NZ lakes to examine the relative impacts of climatechange and external nutrient loading on lake water quality (Trolle et al. 2011). Thesimulated lakes included two in the Rotorua region of North Island; polymicticRotoehu (eutrophic, A = 7.9 km2, z = 8.2 m) and monomictic Okareka (oligotrophic tomesotrophic, A = 3.34 km2, z = 20 m), and eutrophic Lake Ellesmere in Canterbury,South Island (polymictic, A = 186 km2, z = 1.9 m). The model had several simplify-ing assumptions including a truncated food web and limited number of phytoplanktontaxa as state variables. The results were broadly consistent amongst lakes, with a2100 climate (A2 scenario; air temperature warming 2.5–2.7 ◦C) being similar to anincrease in nutrient loading ranging from 25 to 50%, with lakes with lower trophicstatus (Okareka in particular) being somewhat more sensitive to both increases innutrient loading and climate change.
Here we demonstrate application of the model to eutrophic, polymictic Lake Rotorua(A = 80 km2, z = 10.8 m) to evaluate the relative impacts of climate change and land

19.15 CASE STUDY: MODELING EFFECTS OF LAND USE AND CLIMATE CHANGE 357
use change. Model input data (daily inflow, outflow and meteorology) were derivedfrom measurements from 2001 to 2009, with independent periods of calibration andvalidation within the whole duration of the simulation. Climate-change scenariosincluded simulations of future water quality for the period 2091–2099 without anyclimate change (i.e., with the measured 2001–2009 climate) and with the measuredclimate (i.e., air temperature, humidity and rainfall) perturbed based on an A1B sce-nario, equivalent to a mean annual increase in air temperature of 2.27 ◦C for thisregion, slightly lower than the increases in temperature of the A2 scenario used byTrolle et al. (2011). The A1B scenario is generally acknowledged to provide a conser-vative or mid-range projection of climate change by the end of the twenty-first century.A further series of scenarios included nutrient reductions, both with and without cli-mate change. These scenarios were generated by altering the inflow data input in thesimulations. Only reductions in external nutrient load are considered here becausemanagement actions are underway to address eutrophication of the lake from the pastthree or four decades. Details of the nutrient load reductions are given in Rutherford,Palliser, and Wadhwa (2011) but, briefly, they include land-use change (conversionsof intensive agricultural land to forestry) in order to reduce nitrogen loads by 250,300 and 350 t year−1 in three separate simulations. Reductions in phosphorus load aremade according to the land-use change, and changes in internal loading are inferredfrom knowledge of the composition of the bottom sediments under historical nutrientloading estimates (see Trolle, Hamilton, and Pilditch 2010).
The 2091–2090 climate-change scenario, with no alteration to the external nutrientload, produced a mean increase in surface water concentrations of total phosphorusby 35.5%, total nitrogen by 9.0% and chlorophyll a by 3.6% compared with unalteredclimate (2001–2009) and nutrient loading. Table 19.1 shows two metrics of criticalimportance to ecological processes in Lake Rotorua; concentrations of cyanobacteriain surface waters and dissolved oxygen in bottom waters. The most dramatic changedue to climate change alone is in the relative number of days with dissolved oxy-gen <2 mg L−1; these occurrences are 56% less frequent in 2001–2009 than underthe simulated climate of 2091–2099. Under the three nutrient reduction scenarios(land use to reduce external nitrogen loads by 250, 300 and 350 t year−1, and corre-sponding phosphorus load reductions), however, it is possible to not only negate thenegative impact of climate change on bottom-water dissolved oxygen concentrations,but to reverse it relative to identical simulations (2091–2099 climate) which have noreduction in nutrient loading (Table 19.1).
Days when chlorophyll a associated with cyanobacteria is greater than 20 mg m−3
have been used as a proxy for when there may be water quality problems in LakeRotorua associated with blooms of cyanobacteria. Similar to dissolved oxygen, thesimulations indicate that nutrient load reductions may more than offset the effects ofclimate change; for a 2091–2099 climate and land-use change equivalent to 350 t Nyear−1 load reduction there is a 56% reduction in days with cyanobacteria >20 mg m−3
relative to no nutrient load reduction, while a 2001–2009 climate and no nutrient loadreduction yields only a 3% reduction (Table 19.1).
358 CH 19 EFFECTS OF CLIMATE CHANGE ON NEW ZEALAND LAKES
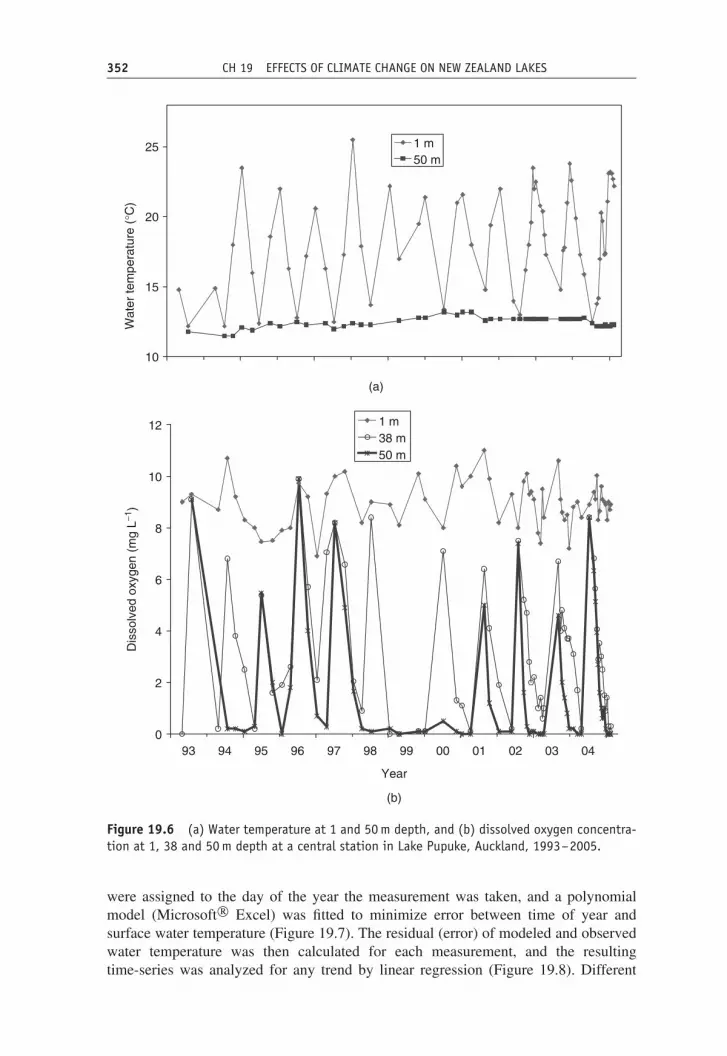
Table 19.1 Comparisons of cyanobacterial concentration (as equivalent chlorophyll aconcentration) and dissolved oxygen for five different simulations of Lake Rotorua withDYRESM-CAEDYM. Simulations include: 2091–2099 climate with no change in present(2001–2009) nutrient loading (CC-0), present climate (2001–2009) and no change innutrient loading (0–0), and climate change and reduced nutrient loading (CC-250,CC-300 and CC-350; see text). The output statistics are for the total number of days andproportion of days with cyanobacteria chlorophyll >20 mg m−3 (Cyan d>20 and Cyanp>20, respectively), the relative change in days with cyanobacteria chlorophyll>20 mg m−3 referenced against the CC-0 case (Cyan relative), the total number of daysand proportion of days with bottom-water dissolved oxygen concentrations <2 mg L−1
(DO d<2 and DO p<2) and the relative change in days with dissolved oxygen<2 mg L−1 (DO relative) referenced against the CC-0 case.
CC-0 0-0 CC-250 CC-300 CC-350
Cyan d>20 1158 1091 812 614 461Cyan p>0 (%) 40 37 28 21 16Cyan relative (%) 0 −3 −14 −37 −56DO d<2 373 163 18 0 0DO p<2 (%) 13 6 1 0 0DO relative (%) 0 −56 −95 −100 −100
19.16 Management challenges and mitigationmeasures
Examples from North American, European and Asian lakes (see Chapters 2, 3, 6, 8,10, 12, 14 and 24) and modeling studies of three NZ lakes of varying morphologyand trophic status (Trolle et al. 2011) as well as Lake Rotorua (this chapter) suggestthat climate warming can stimulate eutrophication. However, Visconti, Manca, andDe Bernardi (2008) report the warming effect as an increase in Daphnia biomass,rather than an increase in phytoplankton biomass. Similarly, the density of Daphniain spring increased strongly with increasing lake temperature, but winter phytoplanktonbiomass only correlated weakly with temperature in a shallow English lake (Carvalhoand Kirika 2003). Daphnia is a keystone species in lake planktonic food webs and itsability to control phytoplankton blooms underpins water quality in many lakes. Thus,the temporal coupling of phytoplankton production with Daphnia grazing pressure isa key trophic linkage that may be affected by climate warming and requires furtherinvestigation (see also Chapters 7 and 11).
Similarly, better understanding and models of changes to catchment hydrology andbiogeochemistry with climate change are required as most lake models that simulateclimate change have rudimentary or no representation of effects on the catchment.Return periods for major flood events will approximately halve under A1B and A2scenarios, which could have major implications for the delivery of sediments andnutrients from lake catchments. Nevertheless, the weight of evidence suggests thatlakes will respond to increased temperatures in a way that may mimic increases introphic status. Trolle et al. (2011) indicate that a 25% to 50% reduction in nutrientloads to three NZ lakes may be required to offset the increased phytoplankton biomass

19.16 MANAGEMENT CHALLENGES AND MITIGATION MEASURES 359
induced by warming by 2100, whilst Lake Rotorua simulations (not shown) suggesta 7–12% reduction in nutrient load (50–85 t N year−1) would be required.
Polymictic NZ lakes such as Rotorua have yet to show any clear directional changein surface water temperature (nonsignificant decrease in Rotorua and increase inRerewhakaaitu over the past 20 years) but could be highly sensitive to a changing cli-mate due to increases in frequency and duration of stratification events and, especiallyin eutrophic systems, greater potential for anoxia of bottom waters and associatednutrient release events (Burger et al. 2008). Strong westerly winds normally associ-ated with the El Nino phase of ENSO evidently did not offset the strong warmingthat took place in 1998–1999 in NZ when winter mixing of the water column indeep lakes such as Taupo and Pupuke was of reduced duration or incomplete. Thisfuture balance of altered wind speed and direction (Mullan et al. 2008) with higherair temperature may be critical from several perspectives and is not well understoodor readily predictable at present, and there has not been an analysis of the temporalcoherence of strong ENSO phases across NZ lakes or subsets of the lakes. The balancemay, for example, impact upon regime shifts in shallow lakes (specifically by chang-ing exposure of submerged plants to wind-wave-induced shear stresses), frequencyand duration of stratification and mixing in polymictic lakes in particular, for whichthere could be concomitant changes in bottom-water anoxia and sediment nutrientreleases, and potentially radically alter mixing behavior of deep monomictic lakes tointermittent with increased probability of development of anoxic hypolimnia even inoligotrophic systems.
In all of the above considerations it is evident that some degree of protection fromimpacts of climate change may be afforded by appropriate land use and managementin lake catchments to arrest and ultimately decrease external nutrient load increases,particularly given the potential for increasing storm events to increase catchmentsediment and nutrient loads (also see Chapter 24). The effects of reduced nutrientand sediment loads, as well as reduced organic matter deposition, could offset theincreased probability of anoxia in bottom waters with climate change. It could alsoreduce heat trapping of solar radiation in surface waters through reduced concentra-tions of suspended minerals, phytoplankton and other suspended organic particulates.Finally, in shallow regime-shifting lakes whose vegetation may be susceptible to theturbulent forces of increased wind speeds with climate change (Mullan et al. 2008),it could increase the resilience of the vegetated clear-water phase over the turbid,phytoplankton-dominated phase.
For the moment climate change remains but one (minor) aspect in wider globalchanges that affect alien invasions in NZ lakes, and interplays with increased humanpopulation pressure, international trade, and habitat alteration. This escalating globalchange, as a whole, is seen as driving the emergence of a “homogocene era” (sensuStrayer 2010), coined to represent increasing similitude and loss of local biotic dis-tinctiveness worldwide. However, increased pressure on natural water resources inNZ to provide ecosystem services, such as irrigation and hydro power, is likely tointensify on two fronts with climate change reducing rainfall and soil moisture inintensively farmed eastern areas and with the NZ government signaling that it willmake substantial future investment in irrigation and hydro power development. Thus,we can expect a synergistic effect of climate change on currently existing pressureson water resources at catchment and waterbody scales.

360 CH 19 EFFECTS OF CLIMATE CHANGE ON NEW ZEALAND LAKES
Table 19.2 Predicted effects of anthropogenic climate change in New Zealand and keylimnological impacts.
Effect Predicted magnitudeof effect
Reference Limnologicalimpact
Reference
Warming 0.1– 1.4 ◦C by2030s
0.2– 4.0 ◦C by2080s
Wratt et al.(2004)
Wratt et al.(2004)
Eutrophication
Phenology
Visconti et al.(2008), Trolleet al. (2011)
Winder andSchindler(2004a, b)
Precipitation Increase excepteastern NorthIsland andnorthern SouthIsland
Hennesseyet al.(2007)
Decreased waterresidence times
Increased externalnutrient loading
Wind Midrangeprojections by2080: 60%increase inmean westerlycomponent ofwind speed
Wratt et al.(2004)
Increased turbulence/resuspension
Deeper mixing
Increased aeoliandust (phosphorus)
Hamilton andMitchell (1997)
Davies-Colley(1984)
McGowan et al.(1996)
Sea level By 2100:0.18–0.59 mincreaserelative to year2000
Hennesseyet al.(2007)
Salinization ofcoastal lakes andlagoons anddisappearance ofsome
Schallenberget al. (2003)
Duggan andWhite (2010)
While there is only a modest level of information on the limnological impacts ofchanging climate on NZ lakes and wetlands, particularly given the lack of obvioustemperature signals in the past 30–40 years, a substantial amount of work has beendone to predict the changes of key climatic drivers of ecosystem structure and func-tion. Table 19.2 lists some of the predicted changes in key climatic drivers. Warming,precipitation and wind effects are estimated from statistically downscaled global circu-lation models. Thus, the magnitudes of these effects may be subject to substantial errorand should be considered provisional (see Koutsoyiannis et al. 2008). The predictionsin Table 19.2 have been used as a basis for discussing in detail (see above) three ofthe likely limnological impacts of global climate change on NZ lakes: (i) increasesin the duration of thermal stratification, possibly changing some polymictic lakes tomonomictic and some monomictic lakes to amictic or rarely mixed, (ii) potential forregime shifts in shallow lakes, and (iii) effects of sea-level rise on the ecologicalstructure and functioning of coastal lakes, wetlands and lagoons.
Hydro power constitutes a large fraction of the total electricity demand in NZ(Renwick et al. 2010b). and climate change therefore presents a risk to the securityof this energy source. The balance of increased rainfall and reduced snowpack withclimate change complicates assessments of how hydro storages will be affected, butthere is likely to be altered seasonality of inputs to hydro storage reservoirs, which willaffect the alignment of hydro power availability and demand (McKerchar, Pearson,

19.17 CONCLUSIONS 361
and Fitzharris 1998). Evaporation will also be altered with changing climate due tochanges in water temperature as well as water vapor content. Renwick et al. (2010c)projected increases in evaporation losses from 6 to 129% of present under differentfuture climate scenarios for Lake Ellesmere, located in the relatively dry coastal regionof Canterbury, South Island. This could have important implications for the artificialopening regime currently used to manage water levels in the lake.
19.17 ConclusionsThe longest continuous regional record of lake water temperature in NZ is for theRotorua lakes in central North Island. Over 2–3 decades, there has been no signifi-cant change in seasonally corrected surface-water temperature in the deep, monomicticor shallow polymictic Rotorua lakes. Similarly for the largest NZ lake, Taupo, alsoin the geothermally active area of the Taupo Volcanic Zone and Lake Pupuke (Auck-land), there have not been significant changes in water temperature since the early1990s. Important climate signals have, however, been reflected in changes in mixingand hydrological regimes in some lakes. For example, an intense El Nino phase in1998–1999 coincided with reduced vertical mixing in winter, leading to greater deple-tion of dissolved oxygen in bottom waters of lakes Taupo and Pupuke. A warmingclimate may not necessarily produce multi-year periods without seasonal mixing inseveral of the deep monomictic TVZ lakes, however, because of progressive geother-mal warming of bottom waters, which gradually erodes the water column thermalgradient. Similar geothermal warming is absent from the deep monomictic lakes ofthe subalpine region of South Island for which a warming climate may slightly extendthe period of stratification in these oligotrophic lakes. Climate events acting overa more prolonged period, such as the Interdecadal Pacific Oscillation, also play animportant role in the hydro-ecology of NZ lakes, with changes in rainfall and runoffto lakes of the TVZ acting at decadal time scales. By contrast to effects of climate,the TVZ lakes have shown quite profound changes due to modifications of land useassociated with increased land area and intensity of pastoral farming within their catch-ments, leading to symptoms of lake eutrophication. For the many shallow coastal andlowland lakes in NZ that are polymictic, the effect of a warming climate may be moreprofound than for deep lakes, as periods of temporary stratification will become moreregular and prolonged, with potential for increased deoxygenation of bottom waters ineutrophic systems. The resulting increases in nutrient inputs from bottom sedimentsmay increase their trophic status; many of these lakes are already highly impactedby anthropogenic activities. An important consideration for the large number of NZlakes that are tidally influenced is changes in sea level with climate change. Coastallakes, wetlands and lagoons with mean water level within 1 m of mean seawater levelswill be particularly vulnerable to marine ingress, leading to loss of some systems andmajor ecological and food web changes from saline intrusion in others. Our modelingacross lakes of different mixing regime and trophic status indicates that the effects ofan indicative conservative warming scenario may produce water quality effects similarto moderate to substantial increases in nutrient load. The modeling results suggest thatboth long-term climate change as well as short-term extreme climate events shouldbe built into the future management plans for NZ lakes to reduce involving reductionof catchment nutrient and sediment loads.

362 CH 19 EFFECTS OF CLIMATE CHANGE ON NEW ZEALAND LAKES
The effect of climate change on NZ lakes is likely to be a synergistic one, withmajor existing pressures from alien species, water extraction and eutrophication, actingin tandem with additional pressures from forecasted increases in irrigation and waterimpoundment as well as new alien species introductions, to negatively impact uponlake ecological integrity and biodiversity. Actions to improve land management and insome cases make land use change, will be necessary to reduce nutrient and sedimentloads to lakes and provide greater resilience to storm events, whilst also increasingsurveillance, control and eradication efforts for noxious alien freshwater invaders.
ReferencesAllibone, R., David, B., Hitchmough, R., et al. (2012) Conservation status of New Zealand
freshwater fish, 2009. New Zeal. J. Marine and Freshwater Res., 45, 301–2, doi:10.1080/00288330.2010.514346.
Banks, C.M. and Duggan, I.C. (2009) Lake construction has facilitated calanoid copepod inva-sions in New Zealand. Divers. Distrib., 15, 80–7, doi:10.1111/j.1472-4642.2008.00524.x.
Battarbee, R.W., Grytnes, J.A., Thompson, R., et al. (2002) Comparing palaeolimnological andinstrumental evidence of climate change for remote mountain lakes over the last 200 years.J. Paleolimnol., 28, 161–79, doi:10.1023/A:1020384204940.
Burger, D.F., Hamilton, D.P., and Pilditch, C.A. (2008) Modelling the relative impor-tance of internal and external nutrient loads on water column nutrient concentrationsand phytoplankton biomass in a shallow polymictic lake. Ecol. Model., 211, 411–23,doi:10.1016/j.ecolmodel.2007.09.028.
Carvalho, L., and Kirika, L. (2003) Changes in shallow lake functioning: responseto climate change and nutrient reduction. Hydrobiologia , 506–509, 789–96, doi:10.1023/B:HYDR.0000008600.84544.0a.
Champion, P.D., and Clayton, J.S. (2000) Border Control for Potential Aquatic Weeds.Stage 1—Weed Risk Model. Science for Conservation 141 . Department of Conservation,Wellington.
Champion, P.D. and Clayton, J.S. (2001) Border Control for Potential Aquatic Weeds.Stage 2 Weed Risk Assessment. Science for Conservation 185 . Department of Conservation,Wellington.
Champion, P., Rowe, D., Smith, B., et al. (2004) Identification guide: freshwater pests of NewZealand. NIWA Information Series No. 55, National Institute of Water and Atmosphere(N.Z.).
Church, J.A. and White, N.J. (2006) A twentieth century acceleration in global sea-level rise.Geophys. Res. Lett., 33, L01602, doi:10.1029/2005GL024826
Clayton, J. (1990) Impact of climate change on aquatic plants, in The Impact of Climate Changeon Pests, Diseases, Weeds and Beneficial Organisms Present in New Zealand Agricultural andHorticultural Systems (eds. R.A. Prestidge, and R.P. Pottinger), New Zealand Ministry forthe Environment, Wellington, pp. 113–16.
Compton, T.J., De Winton, M., Leathwick, J.R., and Wadhwa, S. (2012) Predicting spread ofinvasive macrophytes in New Zealand lakes using indirect measures of human accessibility.Freshwat. Biol., 57, 938–48, doi:10.1111/j.1365-2427.2012.02754.x
Davies-Colley, R.J. (1988) Mixing depths in New Zealand lakes. New Zeal. J. Mar. Fresh., 22,517–27, doi:10.1080/00288330.1988.9516322.
Dawson, F.H. (1996) Crassula helmsii : attempts at elimination using herbicides. Hydrobiologia,340, 241–5, doi: 10.1007/BF00012762.
De Lange P.J., Heenan, P.B., Norton, D.A., et al. (2009) Threatened Plants of New Zealand ,Canterbury University Press, Christchurch.
Duggan, I.C. (2002) First record of a wild population of the tropical snail Melanoidestuberculata in New Zealand natural waters. New Zeal. J. Mar. Fresh., 36, 825–30, doi:10.1080/00288330.2002.9517135.

REFERENCES 363
Duggan, I.C. Green, J.D. and Burger, D.F. (2006) First New Zealand recordsof three non-indigenous zooplankton species: Skistodiaptomus pallidus, Sinodiapto-mus valkanovi, and Daphnia dentifera. New Zeal. J. Mar. Fresh., 40, 561–9, doi:10.1080/00288330.2006.9517445.
Duggan, I.C., and White, W.A. (2010) Consequences of human-mediated marine intrusions onthe zooplankton community of a temperate coastal lake. New Zeal. J. Mar. Fresh., 44, 17–28,doi: 10.1080/00288331003641661.
Emiliani, C. (1966) Isotopic palaeotemperatures. Science, 154, 851–7, doi: 10.1126/science.154.3751.851.
Forsyth, D.J., and McColl, R.H.S. (1974) The limnology of a thermal lake: Lake Rotowhero,New Zealand: I. General description and water chemistry. Hydrobiologia , 43, 313–32, doi:10.1007/BF00015354.
Gibb, J.G. (1986) A New Zealand regional Holocene eustatic sea-level curve and its applicationto determination of vertical tectonic movements. A contribution to IGCP-Project 200. RoyalSoc. N. Z. Bull., 24, 377–95.
Greig, H.S., Kratina, P., Thompson, P.L., et al. (2012) Warming, eutrophication, and predatorloss amplify subsidies between aquatic and terrestrial ecosystems. Glob. Change Biol., 18,504–514, doi:10.1111/j.1365-2486.2011.02540.x
Hamilton, D.P., and Mitchell, S.F. (1997) Wave-induced shear stresses, plant nutrients andchlorophyll in seven shallow lakes. Freshwat. Biol., 38, 159–68, doi: 10.1046/j.1365-2427.1997.00202.x.
Hamilton, D.P., Hawes, I., and Davies-Colley, R. (2004) Physical and chemical characteristicsof lake water, in Freshwaters of New Zealand (eds. J. Harding, P. Mosley, C. Pearson, andB. Sorrell), New Zealand Hydrological Society, Christchurch, pp. 21.1–21.20.
Hamilton, D.P., Hawes, I., and Gibbs, M.M. (2006) Climatic shifts and water quality responsein North Island lakes, New Zealand. Verh. Internat. Verein. Limnol., 29, 1821–4, doi:10.1029/2003GL019166.
Hamilton, D.P., O’Brien, K.R., Burford, M.A., et al. (2010) Vertical distributions of chlorophyllin deep, warm monomictic lakes. Aquat. Sci., 72, 295–307, doi: 10.1007/s00027-010-0131-1.
Hannah, J. 2004. An updated analysis of long term sea level change in New Zealand. Geophys.Res. Lett., 31, L03307, doi:10.1029/2003GL019166
Hansen, J., Ruedy R., Sato, M. and Lo, K. (2010) Global surface temperature change. Rev.Geophys., 48, doi: 8755-1209/10/2010RG000345
Hauer, F.R., Baron, J.S., Campbell, D.H., et al. (1997) Assessment of climate change andfreshwater ecosystems of the Rocky Mountains, USA and Canada. Hydrol. Process , 11,903–24, doi:10.1002/(SICI)1099-1085(19970630)11:8<903::AID-HYP511>3.0.CO;2–7.
Hays, J.D., Imbrie, J., and Shackleton, N.J. (1976). Variations in the earth’s orbit: Pacemakerof the ice ages. Science, 194, 1121–32, doi: 10.1126/science.194.4270.1121
Hellmann, J.J., Byers, J.E., Bierwagen, B.G., and Dukes, J.S. (2008) Five potential consequencesof climate change for invasive species. Conserv. Biol., 22, 534–43, doi: 10.1111/j.1523-1739.2008.00951.x.
Hendrikx, J., Clark, M., Hreinsson, E.O., et al. (2009) Simulations of seasonal snow in NewZealand: past and future. Proceedings of the 9th International Conference on Southern Hemi-sphere Meteorology and Oceanography, Melbourne, February 2009. American MeteorologicalSociety.
Hennessy, K., Fitzharris, B., Bates, B.C., et al. (2007) Australia and New Zealand. climatechange 2007: Impacts, adaptation and vulnerability, in Fourth Assessment Report of the Inter-governmental Panel on Climate Change Contribution of Working Group II (eds. M.L. Parry,O.F. Canziani, J.P. Palutikof, et al.), Cambridge University Press, Cambridge.
Hicks, B.J., Ling, N., and Wilson, B. (2010) Introduced fish, in Waters of the Waikato: Ecologyof New Zealand’s Longest River (eds. K.J. Collier, D.P. Hamilton, W. Vant, and C. Howard-Williams), Waikato/University of Waikato, Hamilton, pp. 209–28.
Hyldgaard, B. and H. Brix (2012) Intraspecies differences in phenotypic plasticity: Invasiveversus non-invasive populations of Ceratophyllum demersum . Aquat. Bot. 97, 49–56, doi:10.1016/j.aquabot.2011.11.004.

364 CH 19 EFFECTS OF CLIMATE CHANGE ON NEW ZEALAND LAKES
Imbrie, J. and Imbrie, K.P. (1979) Ice Ages: Solving the Mystery , Macmillan, London.Jeppesen, E., Meerhoff, M., Holmgren, K., et al. (2010) Impacts of climate warming on lake
fish community structure and potential effects on ecosystem function. Hydrobiologia, 646,73–90, doi: 10.1007/s10750-010-0171-5.
Jeppesen, E., Søndergaard, M., Kanstrup, E., et al. (1994) Does the impact of nutrients onthe biological structure and function of brackish and freshwater lakes differ? Hydrobiologia,275/276, 15–30, doi: 10.1007/BF00026696.
Jolly, V.H. (1968) The comparative limnology of some New Zealand lakes. I. Physicaland chemical. New Zeal. J. Mar. Fresh, 2, 214–59, doi: 10.1080/00288330.1968.9515236.
Johnson, P.T.J., Olden, J.D., and Vander Zanden, M.J. (2008) Dam invaders: impound-ments facilitate biological invasions into freshwaters. Front. Ecol. Environ., 6, 357–63, doi:10.1890/070156.
Kilroy, C., Biggs, B.J.F., Vyverman, W., and Broady, P.A. (2006) Benthic diatom communitiesin subalpine pools in New Zealand: Relationships to environmental variables. Hydrobiologia,561, 95–110, doi: 10.1007/s10750-005-1607-1.
Koutsoyiannis, D., Efstratiadis, A., Mamassis, N., and Christofides, A. (2008) On the credibilityof climate predictions. Hydrolog. Sci. J., 53, 671–84, doi: 10.1623/hysj.53.4.671.
Leathwick, J.R., West, D., Gerbeaux, P., et al. (2010) Freshwater Ecosystems of NewZealand (FENZ) Geodatabase, Department of Conservation, Hamilton, http://www.doc.govt.nz/conservation/land-and-freshwater/freshwater/freshwater-ecosystems-of-new-zealand/(accessed July 23, 2012).
Larned, S.T., Scarsbrook, M.R., Snelder, T.H., et al. (2004) Water quality in low-elevationstreams and rivers of New Zealand: Recent state and trends in contrasting land-cover classes.New Zeal. J. Mar. Fresh., 38, 347–66, doi: 10.1080/00288330.2004.9517243.
Leprieur, F., Beauchard, O., Blanchet, S., et al. (2008) Fish invasions in the world’s riversystems: when natural processes are blurred by human activities. PLoS Biology , 6, 404–10,doi: 10.1371/journal.pbio.0060028.
Les, D.H., Capers, R.S., and Tippery, N.P. (2006) Introduction of Glossostigma (Phrymaceae)to North America: a taxonomic and ecological overview. Am. J. Bot., 93, 927–39, doi:10.3732/ajb.93.6.927.
Lewis, W.M. 2000. Basis for the protection and management of tropical lakes. Lakes & Reser-voirs: Research and Management 5, 35–48, doi: 10.1046/j.1440-1770.2000.00091.x.
Loo, S.E., MacNally, R., and Lake, P.S. (2007) Forecasting New Zealand mudsnail invasionrange: model comparisons using native and invaded ranges. Ecol. Appl. 17, 181–9, doi:10.1890/1051-0761(2007)017[0181:FNZMIR]2.0.CO;2.
Lowe, D.J., and Green, J.D. (1987) Origins and development of the lakes. NZ DSIR Bull., 241,1–64.
Marsden, I.D. (2004) Effects of reduced salinity and seston availability on growth of the NewZealand little-neck clam Austrovenus stutchburyi . Mar. Ecol. Prog. Ser., 266, 157–71, doi:10.3354/meps266157.
MacIsaac, H.J., Borbely, J.V.M., Muirhead, J.R., and Graniero, P.A. (2004) Backcasting andforecasting biological invasions of inland lakes. Ecol. Appl., 14, 773–83, doi:10.1890/02-5377.
McDowall, R.M. (1992) Global climate change and fish and fisheries: What might hap-pen in a temperate oceanic archipelago like New Zealand. Geojournal , 28, 29–37,doi:10.1007/BF00216404.
McDowall, R.M. (2000) The Reed Field Guide to New Zealand Freshwater Fishes, Reed Pub-lishing, Auckland.
McDowall, R.M. (2003) Impacts of introduced salmonids on native galaxiids in New Zealandupland streams: a new look at an old problem. Trans. Am. Fish. Soc., 132, 229–38, doi:10.1577/1548-8659(2003)132<0229:IOISON>2.0.CO;2.

REFERENCES 365
McDowall, R.M. 2006. On size and growth in freshwater fish. Ecol. Freshwater Fish , 3, 67–79,doi: 10.1111/j.1600-0633.1994.tb00108.x.
McGowan, H.A., Sturman, A.P., and Owens, I.F. (1996) Aeolian dust transport and depositionby foehn winds in an alpine environment, Lake Tekapo, New Zealand. Geomorphology , 15,135–46, doi: 10.1016/0169-555X(95)00123-M.
McIntosh, A.R. (2000) Aquatic predator–prey interactions, in New Zealand Stream Inverte-brates: Ecology and Implications for Management (eds. K.J. Collier, and M.J. Winterbourn),New Zealand Limnology Society, Christchurch, NZ, pp. 125–56.
McKerchar, A.I., Pearson, C.P., and Fitzharris, B.B. (1998) Dependency of summer lake inflowsand precipitation on spring SOI . J. Hydrol., 205, 66–80, doi: 10.1016/S0022-1694.
Maunder, W.J. (1971) The climate of New Zealand—physical and dynamic features, in WorldSurvey of Climatology (ed. J. Gentilli), Elsevier, Amsterdam, p. 213–27.
Melack, J.M., Dozier, J., Goldman, C.R., et al. (1997) Effects of climate change on inlandwaters of the Pacific Coastal Mountains and Western Great Basin of North America.Hydrol. Process., 11, 971–92, doi: 10.1002/(SICI)1099-1085(19970630)11:8<971::AID-HYP514>3.0.CO;2-Y.
Ministry for the Environment (2011) Cabinet paper: Fresh Start for Fresh Water—Forward WorkProgramme, http://www.mfe.govt.nz/cabinet-papers/fresh-start-fresh-water-forward-work.pdf(accessed 22 May 2012). Ministry for the Environment, NZ.
Mullan, A.B. (1995) On the linearity and stability of Southern Oscillation-climate relationshipsfor New Zealand. Int. J. Climatol., 15, 1365–86, doi: 10.1002/joc.3370151205.
Mullan, B., Wratt, D., Dean, S., et al. (2008) Climate Change Effects and Impacts Assess-ment: A Guidance Manual for Local Government in New Zealand , 2nd edn, Ministry for theEnvironment, Wellington.
Pall, P., Allen, M.R., and Stone, D.A. (2007) Testing the Clausius-Clapeyron constraint onchanges in extreme precipitation under CO2 warming. Clim. Dynam., 28, 351–63, doi:10.1007/s00382-006-0180-2.
Parker, B.R., Vinebrooke, R.D., and Schindler, D.W. (2008) Recent climate extremes alteralpine lake ecosystems. PNAS , 105, 12927–31, doi: 10.1073/pnas.0806481105.
Rahel, F.J. and Olden, J.D. (2008) Assessing the effects of climate change on aquatic invasivespecies. Conserv. Biol., 22, 521–33, doi: 10.1111/j.1523-1739.2008.00950.x.
Remane, A., and Schlieper, C. (1971) The Biology of Brackish Waters, 2nd edn., Wiley Inter-science, New York.
Renwick, J., Clark, A., Griffiths, G., et al. (2010a) State of the Climate 2010, A Snapshot ofRecent Climate in New Zealand , NIWA Science and Technology Series No. 56, NationalInstitute of Water and Atmosphere, Wellington.
Renwick, J., Mladenov, P., Purdie, J., et al. (2010b) The effects of climate variability andchange upon renewable electricity in New Zealand, in Climate Change Adaptation in NewZealand: Future Scenarios and some Sectoral Perspectives (eds. R.A.C. Nottage, D. S. Wratt,J. F. Bornman, and K. Jones) New Zealand Climate Change Centre, Wellington, NZ, pp.70–81.
Renwick, J., Horrell, G., McKerchar, A., et al. (2010c) Climate change impacts on LakeEllesmere (Te Waihora), NIWA Client Report WLG2010-49, Project: ENC10301, NationalInstitute of Water and Atmosphere, Wellington.
Rooney, N. and Kalff, J. (2000) Inter-annual variation in submerged macrophyte communitybiomass and distribution: the influence of temperature and lake morphometry. Aquat. Bot.,68, 321–35, doi: 10.1016/S0304-3770(00)00126-1.
Rowe, D.K. (2007) Exotic fish introductions and the decline of water clarity in small NorthIsland, New Zealand lakes: a multi-species problem. Hydrobiologia , 583, 345–58, doi:10.1007/s10750-007-0646-1.
Rutherford, K., Palliser, C., and Wadhwa, S. (2011) Prediction of nitrogen loads to Lake Rotoruausing the ROTAN model. NIWA Client Report: HAM2010-134. National Institute of Waterand Atmosphere, Hamilton.

366 CH 19 EFFECTS OF CLIMATE CHANGE ON NEW ZEALAND LAKES
Salinger, M.J., Renwick, J.A., and Mullan, A.B. (2001) Interdecadal Pacific Oscillation andSouth Pacific climate. Int. J. Climatol., 21, 1705–21, doi: 10.1002/joc.691
Schallenberg, M., Hall, C.J., and Burns, C.W. (2003) Consequences of climate-induced salinityincreases on zooplankton abundance and diversity in coastal lakes. Mar. Ecol. Prog. Ser.,251, 181–9, doi: 10.3354/meps251181.
Schallenberg, M. and Sorrell, B. (2009) Regime shifts between clear and turbid water in NewZealand lakes: Environmental correlates and implications for management and restoration.New Zeal. J. Mar. Fresh., 43, 701–12, doi: 10.1080/00288330909510035.
Strayer, D.L. (2010) Alien species in fresh waters: ecological effects, interactions with otherstressors, and prospects for the future. Freshwat. Biol., 55, 152–74, doi: 10.1111/j.1365-2427.2009.02380.x.
Sturman, A.P. and Tapper, N.J. (2006) The Weather and Climate of Australia and New Zealand ,2nd edn, Oxford University Press, Melbourne.
Tanner, C.C., Clayton, J.S., and Wells, R.D.S. (1993) Effects of suspended solids on theestablishment and growth of Egeria densa . Aquat. Bot., 45, 200–310, doi: 10.1016/0304-3770(93)90030-Z.
Trolle, D., Hamilton, D.P., and Pilditch, C.A. (2010) Evaluating the influence of lake morphol-ogy, trophic status and diagenesis on geochemical profiles in lake sediments. Appl. Geochem.,25, 621–32, doi: 10.1016/j.apgeochem.2010.01.003.
Trolle, D., Hamilton, D.P., Pilditch, C.A., et al. (2011) Predicting the effects of climate changeon trophic status of three morphologically varying lakes: Implications for lake restorationand management. Environ. Modell. Softw., 26, 354–70, doi: 10.1016/j.envsoft.2010.08.009.
Vincent, W.F. (1983) Phytoplankton production and winter mixing: contrasting effects in twooligotrophic lakes. J. Ecol., 71, 1–20.
Vincent, W.F., Gibbs, M.M., and Dryden, S.J. (1984) Accelerated eutrophication in a NewZealand lake: Lake Rotoiti, Central North Island. New Zeal. J. Mar. Fresh., 18, 431–40, doi:10.1080/00288330.1984.9516064.
Von Westernhagen, N., Hamilton, D.P., and Pilditch, C.A. (2010) Temporal and spatial variationsin phytoplankton productivity in surface waters of a warm-temperate, monomictic lake in NewZealand. Hydrobiologia, 652, 57–70, doi: 10.1007/s10750-010-0318-4.
Visconti, A., Manca, M., and De Bernardi, R. (2008) Eutrophication-like response to climatewarming: an analysis of Lago Maggiore (N. Italy) zooplankton in contrasting years. J. Limnol.,67, 87–92, doi: 10.4081/jlimnol.2008.87.
Walther, G.-R., Roques, A., Hulme, P.E., et al. (2009) Alien species in a warmer world: risksand opportunities. Trends Ecol. Evol., 24, 686–93, doi: 10.1016/j.tree.2009.06.008.
Wilding, T. and Rowe, D. (2008) FRAM: fish risk assessment model for the importation andmanagement of alien freshwater fish in New Zealand. NIWA client report: HAM 2008–029,National Institute of Water and Atmosphere, Hamilton, NZ.
Williams, J.W. and S.T. Jackson (2007) Novel climates, no-analog plant communities, andecological surprises: Past and future. Front. Ecol. Evol., 5, 475–82, doi: 10.1890/070037.
Winder, M., and Schindler, D.E. (2004a) Climate effects on the phenology of lake processes.Glob. Change Biol., 10, 1844–56, doi: 10.1111/j.1365-2486.2004.00849.x.
Winder, M., and Schindler, D.E. (2004b) Climate change uncouples trophic interactionsEcology, 85, 2100–6, doi: 10.1890/04-0151.
Wratt, D.S., Ridley, R.N., Sinclair, M.R., et al. (1996) The New Zealand South-ern Alps Experiment. B. Am. Meteorol. Soc., 77, 683–92, doi: 10.1175/15200477(1996)077<0683:TNZSAE>2.0.CO;2
Wratt, D.S., Mullan, A.B., Salinger, M.J., et al. (2004) Climate Change Effects and ImpactsAssessment: A Guidance Manual for Local Government in New Zealand , New Zealand Cli-mate Change Office, Ministry for the Environment, Wellington.