effect of water solubility on carbon dioxide foam flow in porous media: an x-ray computed tomography...
TRANSCRIPT

Seediscussions,stats,andauthorprofilesforthispublicationat:https://www.researchgate.net/publication/231389125
EffectofWaterSolubilityonCarbonDioxideFoamFlowinPorousMedia:AnX-rayComputedTomographyStudy
ARTICLEinJOURNALOFINDUSTRIALANDENGINEERINGCHEMISTRY·JUNE2008
ImpactFactor:3.51·DOI:10.1021/ie701688j
CITATIONS
31
READS
58
4AUTHORS,INCLUDING:
DongxingDu
QingdaoUniversityofScienceandTechnol…
28PUBLICATIONS105CITATIONS
SEEPROFILE
R.Farajzadeh
DelftUniversityofTechnology
72PUBLICATIONS645CITATIONS
SEEPROFILE
P.L.J.Zitha
DelftUniversityofTechnology
134PUBLICATIONS1,001CITATIONS
SEEPROFILE
Availablefrom:R.Farajzadeh
Retrievedon:03February2016
Effect of Water Solubility on Carbon Dioxide Foam Flow in Porous Media: AnX-ray Computed Tomography Study
Dong-Xing Du,† Ali Naderi Beni,‡,§ Rouhollah Farajzadeh,‡ and Pacelli L. J. Zitha*,‡
Qingdao UniVersity of Science and Technology, Songling Road 69, 266061, Qingdao, P. R. China, and DelftUniVersity of Technology, SteVinweg 1, 2628 CN, Delft, The Netherlands
Carbon dioxide (CO2) has found wide application in the water-alternating-foam (WAF) processes for enhancedoil recovery (EOR), but few research works have been reported concerning the effect of water solubility onthe CO2 foam rheology in a porous medium. In this paper, an X-ray computed tomography (CT) study iscarried out to investigate CO2 foam flow in a consolidated Bentheimer sandstone core saturated with surfactantsolution under different system pressures. As a contrast gas with much lower solubility, nitrogen foam flowis also investigated to show the essence of gas solubility effects. Careful considerations were made on theselection of contrast gases, surfactant, and experimental procedures to focus on the effect of water solubilityof the gas on foam rheology in porous media. It is observed from the experiments that CO2 foam has lowerpressure loss and clearly suppressed entrance effect. With the increment of system pressure, the liquid saturationincreases and the pressure loss decreases significantly for CO2 foam flow in the sample core, while littlechange can be observed for N2 foam flow. It can be concluded that water solubility is one of the importantinfluential factors for CO2 foam rheology in porous media.
1. Introduction
When gas and surfactant solution are injected into a porousmedium, gas is dispersed into the liquid phase forming foam.1
A crucial application of foam is in enhanced oil recovery (EOR)projects that aim to produce more oil from undergroundformations.2 For example, water alternating gas (WAG) has beenregularly used in the field as a gas-flood mobility controlmeasure. Nevertheless, WAG has not always demonstrated thedesired beneficial mobility effects due to the gravity segregationand the unstable preceding of the front between the water andmore-mobile gas.3,4 Adding surfactant to the aqueous phase hasproved to increase the total recovery significantly by creatingfoam that increases the apparent viscosity of the system.5–9
There are many attractive features of EOR using CO2 foaminjection. First, carbon dioxide is a proven solvent for recon-necting, mobilizing, and recovering waterflood residual oil.Many studies show that it can achieve miscible-like displace-ment efficiency through multiple contacts (partitioning andextraction) with the crude oil.10 Second, CO2 is availablenaturally in large quantities and as a byproduct of lignitegasification and many manufacturing processes. Its price is alsolow, and there are no other large volume uses competing forCO2. Third, with the push toward sustainable power productionand the increasing realization for the need to reduce CO2
emissions, EOR using CO2 is becoming an important alternativefor geological CO2 storage.
Therefore, lots of laboratory studies concerning the CO2 foamin EOR have been carried out, including displacement tests,model construction, surfactant screening, etc.11–16 Because ofthe fact that CO2 is highly soluble in hydrocarbon oils, thereare also many research works focusing on the oil solubility effectof CO2. Holm et al.17 concluded from experimental study that
CO2 could enhance the recovery of oil from porous rock byswelling the oil due to its high oil solubility. Monger18 foundthe presence of nitrogen had an adverse effect on the CO2
solubility in oil while sulfur dioxide increases the solubility.Chung et al.19 measured the solubility of CO2 in Canyon andWilmington heavy oils and found that the solubility of CO2
increased with pressure but decreased with temperature andreduced API gravity. Nguyen et al.20 investigated the effect ofnitrogen on the solubility and diffusivity of CO2 into oil andoil recovery in WAG process and found that the presence ofnitrogen could reduce the solubility and diffusivity of carbondioxide, which results in a reduction in oil recovery.
Albeit the above survey shows the solubility of CO2 into oilhas been extensively investigated, the solubility of CO2 intowater has received little attention so far. As we know, in a wateralternating foam (WAF) process, CO2 exists with not onlyhydrocarbon oils but also aqueous foams. Gas dissolution inthe water phase, like its dissolution in oil phase, is also importantas it can modify interfacial tensions, fluid saturations, and hencethe foam rheology. Therefore, it is important to examine theeffect of solubility of CO2 into water on the foam rheology inthe porous media through experimental studies.
In this paper, two types of gases with large water solubilitycontrast, CO2 and N2, are injected with a surfactant (SDS)solution into a surfactant-saturated sandstone core. Liquiddisplacement by foam (LDF) along the core is monitored withthe aid of X-ray computed tomography (CT), and taking thesystem pressure as a control parameter, the experiment continuesunder various backpressures. CT images are investigated toreveal the dynamic foam flow process inside the sandstone core.The comparison of pressure drops, and in situ water saturationprofiles between the two kinds of foam flows are presented togive a better understanding of the effect of water solubility onfoam rheology.
However, there easily arises a question, and that is how theselection of the contrast gases and the surfactant solution withthe experimental procedure can clarify separately the watersolubility effect of CO2 gas. Foam is a complex system, and itsbehavior in porous media depends on various factors, especially
* To whom correspondence should be addressed. E-mail: [email protected]. Phone: +31 15 278 8437.
† Qingdao University of Science and Technology.‡ Delft University of Technology.§ Now at Applied Geophysics and Geothermal Energy, E.ON Energy
Research Center, RWTH Aachen University, Germany.
Ind. Eng. Chem. Res. 2008, 47, 6298–63066298
10.1021/ie701688j CCC: $40.75 2008 American Chemical SocietyPublished on Web 06/25/2008

on the composition of external phase (surfactant type, surfactantconcentration, extra additives, salinity, pH, oil presence, etc.),foam quality, and internal gas phase properties.
The criteria for a good CO2 foamer agent are mainly focusedon the generated foam washout stability, adsorption on the rock,foam stability to flowing, residual oil and pH values of aqueousphase.21–23 The surfactants ever reported for CO2 foam studiesare Alipal CD-128 (an ammonium salt of linear alcoholethoxylate sulfate),24 R-olefin sulfonate (AOS),25,26 Chaser CD1040 (alkyl sulfonate),27 Neodol 25-9 (a C12-15 nonionicalcohol ethoxylate),28 Chaser CD 1045 (a proprietary mixtureof anionic and nonionic surfactants),24,29 and the popularcommercial pure chemical of sodium dodecyl sulfate (SDS).30,31
Because of the commercial considerations, there are even nonames for the surfactants in some published articles.32,33 It canbe summarized, though, that the most popular surfactants forgenerating CO2 foam are anionic or nonionic ones with sulfateor sulfonate bases. Both the pressure drop across a smallsandpack, and the interfacial tension between the air andsurfactant solution become stable once the critical micelleconcentration (cmc) is exceeded.26 So it is usually safe to usethe solution with surfactant concentration well above the cmc.Another parameter in external phase which maybe leads to thedifferent foam behavior for CO2 and N2 gas is the pH values ofthe solution. Relatively new capabilities to measure pH in thepresence of CO2 under high pressure (up to 1500 psig) and hightemperature (up to 280 °F) indicate pH values in the range of3.5-4.1 for CO2 foam under down hole conditions.34 Fortu-nately, some pioneer researchers have revealed clearly that lowerpH values have little effect on foam viscosity,34 foam resistiv-ity,35 or foam stability when the surfactant concentration arehigher than the cmc.22
In our studies, the commercial anionic surfactant SDS wasused, and its concentration in external phase was well abovethe cmc. In all of the experiments the salt concentration remaibedunchanged, and no oil was present. Therefore, we can concludethe surfactant solution employed in the experiments could notintroduce side effects to our contrast gas foam systems. In otherwords, the different behaviors observed for CO2 and N2 foamscould not come from the external phase in our experiments.Actually, to compare CO2 and N2 foam flow behaviors, quite afew researchers employed same surfactant solution for drawingreasonable conclusions.24,27,36
The foam behavior in porous media also heavily rely on foamquality.27,28,37,38 As it is pointed out,27 foam exhibits at leasttwo steady-state flow regimes as a function of foam quality fg
(injected gas volume fraction, %). At high foam qualities,pressure gradient is nearly independent of gas flow rate. This“high-quality” or “coalescence” regime is controlled by bubblecoalescence at the “limiting capillary pressure” Pc* (Pa). In the“low-quality regime”, pressure gradient is nearly independentof liquid flow rate. The transition between regimes occurs at acritical foam quality fg*. These two foam-flow regimes arereported with both N2 and CO2 gas, with various surfactants,and in various porous media. It is true that CO2 foam and N2
foam could be in different foam regimes at the same foamquality, but lying in different foam regimes does not meannecessarily the pressure gradient for each foam system shouldhave much difference. Therefore, we cannot explain from thetwo-regime theory why fg* and pressure gradients for CO2 andN2 foam have different behaviors in porous media and why thereis a third regime observed for dense CO2 foam systems.28 Asto our understanding, the two-regime foam theory can success-fully reveal the foam generation mechanism in porous media,
but it cannot answer the question why different gas foamsystems exhibit different pressure gradients in the same porousmedia. So we still need to refer to the physical properties of N2
and CO2 gases for digging out the reasonable explanations. Forexample, in ref 27, the researchers compared the CO2 foam andN2 foam under same foam qualities, although they were awareof the two-regime theory.
On the basis of the above explanations, we could mainly referto the different physical properties between CO2 and N2 gas(internal phase) for explaining their different foam behaviors.In this paper, the experiments are carried out a constanttemperature of T ) 20 °C and different backpressures below20 bar, so the compressibility difference can be reasonablyneglected due to the fact that CO2 and N2 both can be treatedas ideal gases. Then the main different physical propertybetween CO2 and N2 gas is their water solubility. Therefore,we believe our choice of contrast gases, surfactant solution, andthe experimental procedures can focus on the study of CO2 watersolubility effect on foam behaviors in the porous media.
2. Experimental Principles, Apparatus, and Procedures
2.1. Experimental Principles. 2.1.1. Gas Solubility. Ac-cording to Henry’s law,39 when gas is in equilibrium with aliquid, its partial pressure P (Pa) is directly proportional to solutegas concentration C (mol L-1)
P)KC (1)
where K is a constant, dependent on the nature of the gas andthe solvent and on temperature. The values of K for CO2 andN2 in pure water at 25 °C are 2.937 × 10⁶ and 155 × 106 (PaL mol-1), respectively. The solubility of CO2 is thus about 50times higher than N2, which is a sufficient solubility contrastfor our purposes of study.
2.1.2. CT Imaging and Liquid Saturations Calculation.X-ray computed tomography (CT) is a technique which enablesthe visualization of static structures and dynamic processeswithin opaque objects by reconstructing the X-ray attenuationcoefficients from multidirectional X-ray transmission data. Thevariation in X-ray attenuation is closely related to densitydifferences within the object. Because density transitions usuallycorrespond to boundaries between materials or phases, thesedata are often straightforward to interpret. Another importantadvantage of the CT is its digital output, which leads to theeasily quantitative analysis.
The linear attenuation coefficient µ (cm-1) can be definedas40,41
µ)F{ σ(E)+ bZe
E3.2} (2)
where F is the electron density (bulk density) in electrons/cm3,σ(E) is the Klein-Nishina coefficient, b is a constant () 9.8 ×1024), Ze is the effective atomic number of the chemical species,and E is the X-ray photon energy in keV. The values that comeout from the computer attached to the CT scanner are measuredin Hounsfield units (HU). The relationship between attenuationcoefficient and HU is
HUm ) 1000 × (µm
µw- 1) (3)
where µw displays the water attenuation coefficient: we obtainHUm ) 0 for water and HUm ) -1000 for air. The followingequation is used to compute the liquid saturation Sw from the
Ind. Eng. Chem. Res., Vol. 47, No. 16, 2008 6299

measured HU, eliminating the contribution of the rock by thesubtraction:42
Sw )HUfoam -HUdry
HUwet -HUdry(4)
where the subscripts foam, wet, and dry stand for the foam flow,solution saturated, and dry core conditions, respectively. Thoughtheoretically the above equation is only valid under the insolubleconditions, it can still give good estimation for solutions withdissolved CO2 gas under our experimental conditions due tothe fact that there is only negligible density variation comingfrom the gas dissolution.
2.2. Materials Properties and Preparation. In this work,the surfactant solution is made of sodium dodecyl sulfate (SDS,Mw ) 288 g/mol) with a concentration of 3.02 × 10⁻³ M andbrine solution of 0.25 M NaCl. The concentration of SDS isabove its cmc in 0.25 M NaCl solution, which is reported to be0.8 × 10-3 M.31 To increase the capability of detection, KI(potassium iodide, Mw ) 166 g/mol) with a concentration of7.23 × 10-3 M is also added to the surfactant solution. Theporous media used to perform the experiments is consolidatedBentheimer sandstone: it is a quartz-rich sandstone, homoge-neous and isotropic. The sample core is 180 mm in length and44 mm in diameter, with the permeability of 1200 mD and theporosity of 22%.
The sample core is drilled out of a massive Bentheimersandstone block and dehydrated in oven at 60 °C for at least 2days. Then it is encapsulated in a 2 mm thin layer of low X-rayattenuation Araldite (CW 2215) glue with the CIBA HY 5160as hardener. The glue is necessary to prevent possible walleffects; otherwise, fluids would bypass the core and displacealong the low resistive interface of core holder and core. Finally,the core is fitted inside a specially designed core holder usingO-rings. The core holder is fabricated of poly(ether ether ketone)(PEEK) and has good mechanical properties and also low X-rayattenuation. The inner diameter of the PEEK tube is 48.0 mm,and the total length is 220.0 mm.
2.3. Foam Flow Setup and CT-Imaging Settings. Theexperimental setup used to perform the experiments is shownschematically in Figure 1. It consists of four parts: foam
generation part, testing part, pressure controlling part, and dataacquisition part.
In the foam generation part, located before the inlet of coreholder, gas is mixed with the surfactant solution to make foam.In order to ensure the supply of gas at stable rate, gas flow rateis controlled by using a high-precision needle valve and ismonitored by using a gas flow meter. A high-precision double-effect piston displacement pump (Pharmacia P 500) is used toinject the surfactant solution at a constant rate.
In the testing part, the sample core is placed inside acylindrical core holder. The foam is introduced from theinjection tube, and the liquid production is collected in a glasscup on an electronic mass balance. Two high-precision pressuretransducers locate at the inlet and the outlet to monitor thepressure drop along the tube.
The pressure control part connects to the outlet of the core.By using a backpressure regulator and a manometer, we canget different pressures in the system. The data acquisition unitrecords the gas injection rate, pressure, and liquid productiondata automatically. All experiments are conducted underisothermal conditions. A local air conditioner provided aconstant temperature of 20 °C.
Most of this core-flood setup is positioned on the table ofthe CT scanner. The PEEK core holder is horizontally placed,parallel to the length of the table. The third-generation SAMA-TOM Volume Zoom Quad slice scanner is used in our work.The main technical information about this machine was providedelsewhere,31 and the imaging settings in our experiments arelisted in Table 1.
The X-ray tube of the CT scanner is operated at the voltageof 125 kV and the current of 100 mA. The thickness of CT
Figure 1. Schematic of the foam flow setup.
Table 1. Settings of the CT Scan Measurement
parameter value
tube current (mA) 100tube voltage (kV) 125slice thickness (mm) 1number of slices 47effective slices 45scan mode spiralpixels in one CT image 512 × 512
6300 Ind. Eng. Chem. Res., Vol. 47, No. 16, 2008

slice is 1 mm, and one series of scan includes 47 slices. Becauseof the fact that it is hard to get reliable data at the immediateinlet and outlet cross section, the images and the consequentwater saturation analysis are actually carried out based on the45 slices without taking into account the first and the last sliceimages. The spiral scan mode is applied for imaging the dynamicfoam flow, instead of the more classical sequential scanning.The spiral scan allows fast and continuous acquisition of thedata from a complete volume and generates axial images usingstandard reconstruction kernel after the data interpolation. Onetypical slice image consists of 512 × 512 pixels. All HU valuesin the pixels are added together and divided by the total amountof pixels to get the average HU value for one slice image.Because of the fact that the noise for CT images typically rangesfrom 3 to 20 HU, it can be estimated that the measurementerror is about 2% for the HU values in our experiments.
2.4. Experimental Procedures. The whole experimentalprocedure are constituted by the following three steps:
a. Core Saturation. To ensure complete core saturation, firstair is removed by flushing CO2 through the core. A CT scan ofthe dry core is then taken. Next, the core is flushed with brine,and the brine injection is continued for 10 pore volumes at ahigh backpressure (18 bar) to ensure complete dissolution andremoval of CO2. Then, 17 pore volumes of surfactant solutionare injected to satisfy the surfactant adsorption capacity, andfinally a solution saturated core CT scan is taken. As for N2
foam experiments, the processes are similar to those of the CO2
foam to make the proper comparisons.b. Foam Injection. To induce foam generation, the surfactant
solution and gas are injected simultaneously into the foamgenerator located before the inlet of the core. Gas flow rate ismaintained around 7 mL min-1, and liquid flow rate is fixed at0.7 mL min-1. It has to be pointed out that the gas flow rate isdefined at temperature of 0 °C and absolute pressure of 1 atm(101.325 kPa), while the liquid flow rate is defined at the tubeinlet conditions. At first, the backpressure is set to atmospheric.CT scan images are taken during foam flow according to thefollowing sequence:
• One scan every 5 min for first 15 min.• One scan every 15 min for the following 45 min.• One scan every half an hour after an hour.c. System Pressure Alternation. After the measurements
under atmospheric backpressure, the experiments continue byincreasing the backpressures to gauge pressure of 7.5, 12.5, and16 bar. CT scan is carried out after the system reaching thesteady state. In our experiments, the steady state is notified bythe stable pressure drop along the core, continuous liquidproduction, and the stable average gas injection rate.
3. Results and Discussion
To scrutinize the effect of water solubility of CO2 on thefoam rheology in a porous medium, the foam of nitrogen, agas with much lower water solubility, is also studied to makeessential comparisons. At first, comparisons are made for theliquid displacement by foam (LDF) process under the atmo-spheric backpressure, and then taking the system pressure as acontrol parameter, comparisons between the two kinds of gasfoams continue under higher backpressures.
3.1. Comparison of CO2 and N2 Foam at AtmosphericBackpressure. As a base case, the CO2 and N2 foam propaga-tion in porous media are studied respectively at atmosphericbackpressure. The comparison of the measured parameters,including gas injection rate, pressure drop, and liquid produc-tions, between the CO2 and N2 foam flow are presented to give
a clear picture of the differences for two kinds of gas foams.Then more detailed investigations are carried out based on theCT images and water saturation profiles.
3.1.1. Profiles for Gas Injection Rate, Pressure Drop,and Liquid Production. Comparisons between CO2 and N2
foam flow in porous media are presented in Figure 2, based onthe measured parameters of gas injection rate, pressure drop,and the liquid production.
From Figure 2a we can see the remarkable difference betweenCO2 and N2 injection rates in the first 35 min. The injectionrate for CO2 is obviously higher than N2. After 35 min, the gasinjection rates for both gases are maintained at about 7 mLmin-1.
From Figure 2b, it can be seen that in the first 5 min thepressure drop for CO2 and N2 foam is nearly the same, but afterthat, the pressure drop for N2 foam flow increases more rapidly
Figure 2. Comparisons of different parameters for CO2 and N2 foam flows:(a) gas injection rate, (b) pressure drop, and (c) liquid production.
Ind. Eng. Chem. Res., Vol. 47, No. 16, 2008 6301
than that of CO2 foam. The higher pressure drop for N2 foamis quite meaningful, given that the flow rate for N2 foam is lowerthan CO2 foam in the time span of 5-35 min after injection.The pressure drop profile for CO2 foam becomes flat after 60min, with a value around 5 bar, while the N2 foam has a peakpressure drop at 90 min after the injection and finally gains astable value of 7 bar after 140 min.
The liquid productions for two kinds of foams are presentedin Figure 2c. Because of the gas rate difference in the beginningof the foam injection, it can be observed that liquid productionfor CO2 foam is higher than N2 foam. However, in generalproduction for CO2 foam is lower than N2 foam. This isconfirmed by comparing saturation profiles in Figure 4.
The above figures clearly reveal that N2 foam flow has higherpressure loss than CO2 foam in porous media. After 5 min offoam injection, the pressure drops for N2 foam becomeincreasingly higher than CO2 foam even at the low gas injectionrates. When foam injection approaches the steady state, whichis reflected by the flat pressure drop and steady gas injectionrates, the pressure drop of N2 foam is also about 2 bar higherthan CO2 foam. Our experimental results are in good agreementwith those reported by Gauglitz et al.,16,27 who also observed
lower CO2 foam pressure gradient compared to N2 foam, eventhough they employed the Boise sandstone and the surfactantof Chase CD1040.
The lower pressure drop for CO2 foam is most likely due toits weaker foam strength caused by its high solubility in water.Indeed, some researchers have expressed obscurely theirconsiderations concerning the CO2 water solubility effect. Valkoet al.43 attributed much of the rheology model error to theuncertainty of the CO2 solubility, while they can describe purenitrogen experiments with improved accuracy. Bhide et al.21
reported that the foam dissolution into the flowing water is thefactor limiting the foam lifetime of polymeric surfactant. Theydeclared that at field conditions foam lifetime will depend ondissolved gas content in produced water and type of gas in foam.The possible explanations could refer to Wellington andVinegar,11 who concluded the dissolved CO2 can decrease thesolubility of surfactant in the aqueous phase, causing lowerinterfacial tension and thus decrease the apparent foam viscosity.
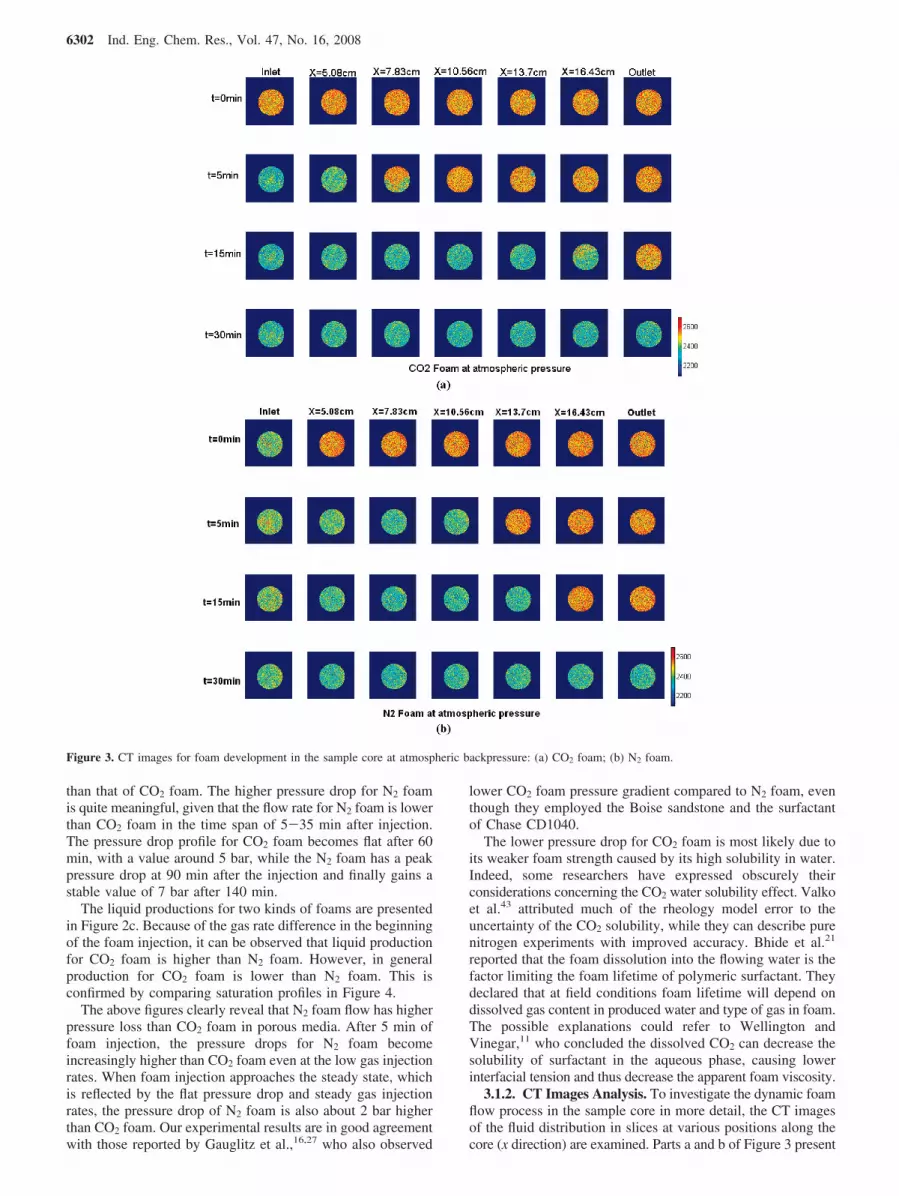
3.1.2. CT Images Analysis. To investigate the dynamic foamflow process in the sample core in more detail, the CT imagesof the fluid distribution in slices at various positions along thecore (x direction) are examined. Parts a and b of Figure 3 present
Figure 3. CT images for foam development in the sample core at atmospheric backpressure: (a) CO2 foam; (b) N2 foam.
6302 Ind. Eng. Chem. Res., Vol. 47, No. 16, 2008

respectively a partial set of CT images of the fluid distributionduring liquid displacement by CO2 and N2 foams in the first 30min of the gas injection. As mentioned in section 2.3, the inletand the outlet slices in the figures are actually the slices next tothe immediate inlet and outlet cross section, namely, the slicesat the position of X ) 0.39 cm and X ) 17.61 cm, respectively.To eliminate negative values, the HU numbers calculated byeq 3 are added to a constant of 1000 in the figure demonstration.The orange color, indicating the high HU numbers, correspondsto a core fully saturated with surfactant solution, while the bluecolor parts in the slices stand for the lower liquid saturation.The first row in Figure 3a shows a core fully saturated withsurfactant solution, except for a tiny portion of gas at 13.7 cm.The next rows of images present visually the evolution of liquidsaturation accompanying CO2 foam propagation in the sandcore,with all slices become progressively blue. At 5 min and atposition of X ) 7.83 cm, foam propagation can be observed inthe lower part of the core. At the time t ) 30 min, the last rowof images indicates the foam has make a breakthrough in theporous media. Figure 3b presents the nitrogen foam flushingprocess. Similarly, it can be concluded from the CT images thatfoam breakthrough occurs between 15 and 30 min.
3.1.3. Saturation Profiles. To analyze quantitatively theevolution of liquid saturation over the core, the CT data isconverted into saturation profiles by using eq 4. The saturationdistribution in the sample core at different times for CO2 andN2 foams flow are shown in parts a and b of Figure 4,respectively.
Both figures show two stages of the liquid displacement byfoam. In the first stage, starting from the beginning of theinjection up to the foam breakthrough, the so-called piston-likedisplacement occurs. As can be seen from the figures, the firststage consists of three regions: (a) a region with low liquidsaturation, (b) a region with high liquid saturation, and (c) atransition region. For both cases, the low liquid saturation regiongradually increases with the elapsing time. The second stagestarts after foam breakthrough and ends with the unchangedwater saturation distribution. This stage is characterized bysecondary liquid desaturation,44,45 which starts in the centralpart of the core and propagates toward the inlet and the outlet.The so-called capillary end effect is eliminated by this secondarydesaturation, and consequently the liquid saturation near theoutlet is low. However, secondary liquid desaturation does notcompletely eliminate the entrance effect at the inlet, andconsequently the liquid saturation near the core inlet remainsrelatively high.
Detailed investigation of the two figures reveals remarkabledifferences between CO2 and N2 foams in the foam propagationprocess in the porous media. First, the penetrating front for N2
foam is much sharper than CO2 foam, which can be clearlyread by comparing the two sets of data before foam break-through. Besides, the displacement front for nitrogen foambecomes steeper with elapsing time, while no such phenomenoncan be observed for CO2 foam. Second, it can be found that,except at the narrow inlet and outlet region, the liquid remainingin the porous media after CO2 foam sweep is obviously higherthan that after N2 foam penetration, namely, 30% vs 15%. Third,the entrance effect for CO2 foam displacement is much lesssignificant than N2 foam. As shown in Figure 4a, the entrancelength for CO2 foam is about 4 cm, while it is about 6 cm forN2 foam shown in Figure 4b. After 60 min of gas injection, theentrance effect can be reasonably neglected for CO2 foam, butthe entrance effect for N2 foam flow exists even after 150 minof gas injection. Because of the large contrast on the water
solubility for CO2 and N2, it can be concluded that higher watersolubility of the CO2 is an important factor which results indifferent foam behaviors.
3.2. Comparison of CO2 and N2 Foam at HigherBackpressures. Because of the significant effect of pressureon the gas water solubility, as stressed by Henry’s law, systempressure is the main parameter varied in the experiments. Asalready mentioned, the system pressure is controlled by usinga backpressure regulator. The backpressures employed in theexperiments are 7.5, 12.5, and 16 bar, respectively.
3.2.1. Pressure Drops and Gas Injection Rates. Table 2lists the comparisons of pressure drop and average gas injectionrate for CO2 and N2 foams under different backpressures. Itcan be seen clearly that the pressure loss for CO2 foam decreasesdrastically when the system backpressure increases to 7.5 bar.
Figure 4. Water saturation profile in different times at atmospheric pressure:(a) CO2 foam; (b) N2 foam.
Table 2. Comparison for CO2 and N2 Foam Flow under DifferentBackpressures
CO2 foam flow N2 foam flow
backpressure (gaugepressure) Pb (bar)
pressuredrop
∆p (bar)
gas injectionrate Q
(mL min-1)pressure drop
∆p (bar)
gas injectionrate Q
(mL min-1)
0.0 4.8 6.8 7.0 8.07.5 0.9 7.5 7.0 6.812.5 1.5 7.5 6.0 5.816.0 1.5 7.5 7.0 7.5
Ind. Eng. Chem. Res., Vol. 47, No. 16, 2008 6303

However, the pressure drop does not change much with furthersystem pressure increment. As for the N2 foam flow, it can beread from the table that the system pressure has little effect tothe pressure losses along the sand core, and the pressure dropmaintained at about 7.0 bar under all backpressure conditions.
The explanation for the different behavior of two kinds ofgases under higher backpressures also lies on the watersolubility. With the increment of system pressure the interfacialtension for CO2 foam decreases with increased water solubility,while the flow characteristics for N2 foam do not change muchfor its water insoluble property.
3.2.2. CT Images Analysis. Parts a and b of Figure 5 showCT images of the fluid distribution at different backpressuresfor CO2 and N2 foams, respectively. It is worthy mentioningthat for higher pressure experiments the initial state of the sandcore is no longer fully solution saturated but is foam saturatedat the former system pressure.
Figure 5a reveals that the liquid saturation for CO2 foamincreases as pressure increases. That is because more carbondioxide molecules dissolve into the water as the pressureincreases, referring to the Henry’s law. It is also read from the
figure that the dissolution occurs at first in the outlet region, asshown in the second row of images with backpressure of 7.5bar. Then more carbon dioxide gas is dissolved in the inletregion, as shown in the third row of the figure. Finally, the gasdissolves in the whole sandcore, as indicated in the last row ofimages under the system backpressure of 16 bar. However, thepressure effect for the N2 foam, as shown in Figure 5b, cannotbe clearly identified due to the low solubility of the nitrogen inthe water.
Another obvious phenomenon for CO2 foam flow, as shownin Figure 5a, is that the liquid phase is no longer uniformlydistributed in the cross section of the sandcore under highpressures. For example, at backpressure of 12.5 bar, gas phaseconcentrates in the upper and lower part while the liquid flowsin the center region of the core. However, no such phenomenonhappens on nitrogen foam flow, as shown in Figure 5b.
3.2.3. Saturation Profiles. Parts a and b of Figure 6 depictthe liquid saturation distribution along the sample for CO2 foamand N2 foam flow at different backpressures, respectively.
In accordance with the CT images shown in Figure 5a, Figure6a shows quantitatively the trend that higher pressure leads to
Figure 5. CT images for foam development at different backpressures: (a) CO2 foam; (b) N2 foam.
6304 Ind. Eng. Chem. Res., Vol. 47, No. 16, 2008
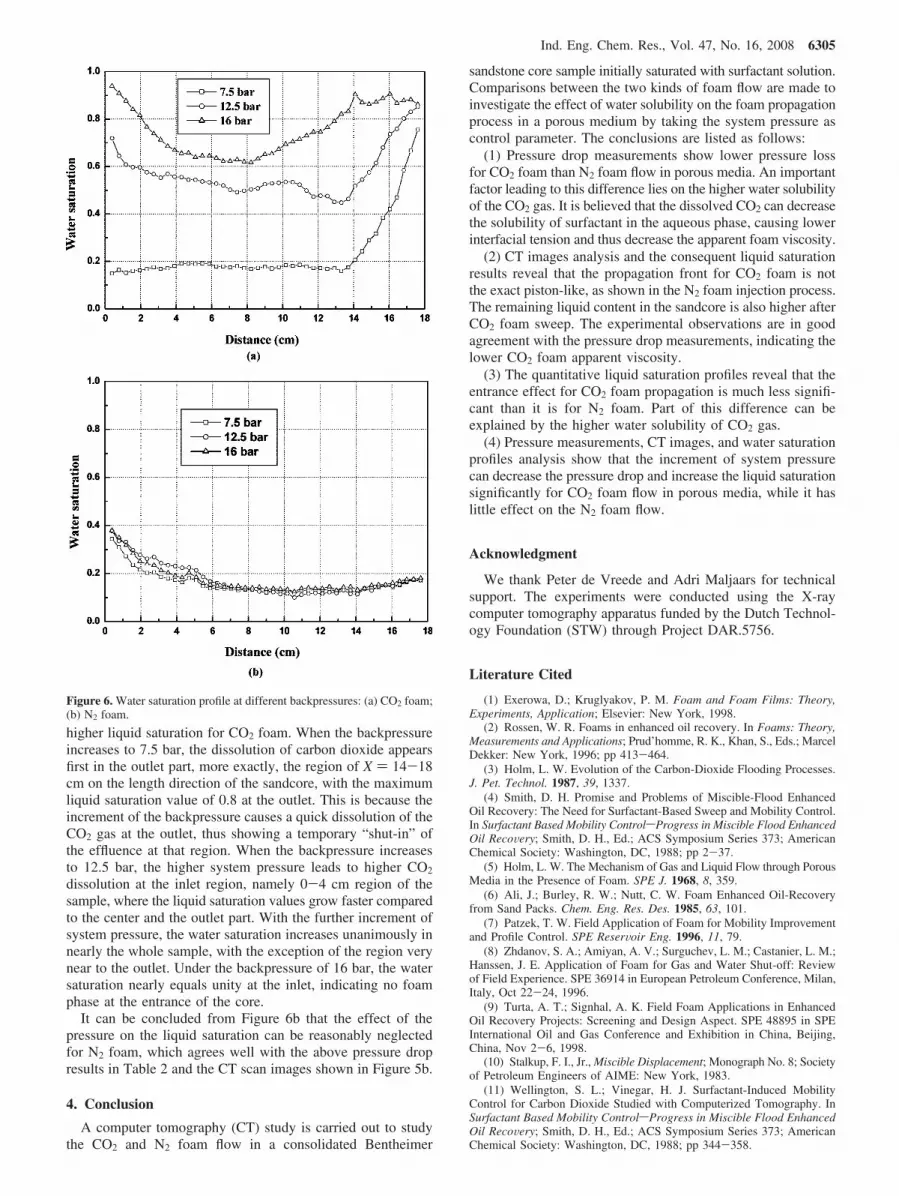
higher liquid saturation for CO2 foam. When the backpressureincreases to 7.5 bar, the dissolution of carbon dioxide appearsfirst in the outlet part, more exactly, the region of X ) 14-18cm on the length direction of the sandcore, with the maximumliquid saturation value of 0.8 at the outlet. This is because theincrement of the backpressure causes a quick dissolution of theCO2 gas at the outlet, thus showing a temporary “shut-in” ofthe effluence at that region. When the backpressure increasesto 12.5 bar, the higher system pressure leads to higher CO2
dissolution at the inlet region, namely 0-4 cm region of thesample, where the liquid saturation values grow faster comparedto the center and the outlet part. With the further increment ofsystem pressure, the water saturation increases unanimously innearly the whole sample, with the exception of the region verynear to the outlet. Under the backpressure of 16 bar, the watersaturation nearly equals unity at the inlet, indicating no foamphase at the entrance of the core.
It can be concluded from Figure 6b that the effect of thepressure on the liquid saturation can be reasonably neglectedfor N2 foam, which agrees well with the above pressure dropresults in Table 2 and the CT scan images shown in Figure 5b.
4. Conclusion
A computer tomography (CT) study is carried out to studythe CO2 and N2 foam flow in a consolidated Bentheimer
sandstone core sample initially saturated with surfactant solution.Comparisons between the two kinds of foam flow are made toinvestigate the effect of water solubility on the foam propagationprocess in a porous medium by taking the system pressure ascontrol parameter. The conclusions are listed as follows:
(1) Pressure drop measurements show lower pressure lossfor CO2 foam than N2 foam flow in porous media. An importantfactor leading to this difference lies on the higher water solubilityof the CO2 gas. It is believed that the dissolved CO2 can decreasethe solubility of surfactant in the aqueous phase, causing lowerinterfacial tension and thus decrease the apparent foam viscosity.
(2) CT images analysis and the consequent liquid saturationresults reveal that the propagation front for CO2 foam is notthe exact piston-like, as shown in the N2 foam injection process.The remaining liquid content in the sandcore is also higher afterCO2 foam sweep. The experimental observations are in goodagreement with the pressure drop measurements, indicating thelower CO2 foam apparent viscosity.
(3) The quantitative liquid saturation profiles reveal that theentrance effect for CO2 foam propagation is much less signifi-cant than it is for N2 foam. Part of this difference can beexplained by the higher water solubility of CO2 gas.
(4) Pressure measurements, CT images, and water saturationprofiles analysis show that the increment of system pressurecan decrease the pressure drop and increase the liquid saturationsignificantly for CO2 foam flow in porous media, while it haslittle effect on the N2 foam flow.
Acknowledgment
We thank Peter de Vreede and Adri Maljaars for technicalsupport. The experiments were conducted using the X-raycomputer tomography apparatus funded by the Dutch Technol-ogy Foundation (STW) through Project DAR.5756.
Literature Cited
(1) Exerowa, D.; Kruglyakov, P. M. Foam and Foam Films: Theory,Experiments, Application; Elsevier: New York, 1998.
(2) Rossen, W. R. Foams in enhanced oil recovery. In Foams: Theory,Measurements and Applications; Prud’homme, R. K., Khan, S., Eds.; MarcelDekker: New York, 1996; pp 413-464.
(3) Holm, L. W. Evolution of the Carbon-Dioxide Flooding Processes.J. Pet. Technol. 1987, 39, 1337.
(4) Smith, D. H. Promise and Problems of Miscible-Flood EnhancedOil Recovery: The Need for Surfactant-Based Sweep and Mobility Control.In Surfactant Based Mobility ControlsProgress in Miscible Flood EnhancedOil RecoVery; Smith, D. H., Ed.; ACS Symposium Series 373; AmericanChemical Society: Washington, DC, 1988; pp 2-37.
(5) Holm, L. W. The Mechanism of Gas and Liquid Flow through PorousMedia in the Presence of Foam. SPE J. 1968, 8, 359.
(6) Ali, J.; Burley, R. W.; Nutt, C. W. Foam Enhanced Oil-Recoveryfrom Sand Packs. Chem. Eng. Res. Des. 1985, 63, 101.
(7) Patzek, T. W. Field Application of Foam for Mobility Improvementand Profile Control. SPE ReserVoir Eng. 1996, 11, 79.
(8) Zhdanov, S. A.; Amiyan, A. V.; Surguchev, L. M.; Castanier, L. M.;Hanssen, J. E. Application of Foam for Gas and Water Shut-off: Reviewof Field Experience. SPE 36914 in European Petroleum Conference, Milan,Italy, Oct 22-24, 1996.
(9) Turta, A. T.; Signhal, A. K. Field Foam Applications in EnhancedOil Recovery Projects: Screening and Design Aspect. SPE 48895 in SPEInternational Oil and Gas Conference and Exhibition in China, Beijing,China, Nov 2-6, 1998.
(10) Stalkup, F. I., Jr., Miscible Displacement; Monograph No. 8; Societyof Petroleum Engineers of AIME: New York, 1983.
(11) Wellington, S. L.; Vinegar, H. J. Surfactant-Induced MobilityControl for Carbon Dioxide Studied with Computerized Tomography. InSurfactant Based Mobility ControlsProgress in Miscible Flood EnhancedOil RecoVery; Smith, D. H., Ed.; ACS Symposium Series 373; AmericanChemical Society: Washington, DC, 1988; pp 344-358.
Figure 6. Water saturation profile at different backpressures: (a) CO2 foam;(b) N2 foam.
Ind. Eng. Chem. Res., Vol. 47, No. 16, 2008 6305

(12) Claridge, E. L.; Lescure, B. M.; Wang, M. W. Carbon DioxideFoam Flooding, Laboratory Model and Computer Simulation of the Process.In Surfactant Based Mobility ControlsProgress in Miscible Flood EnhancedOil RecoVery; Smith, D. H., Ed.; ACS Symposium Series 373; AmericanChemical Society: Washington, DC, 1988; pp 359-374.
(13) Lee, H. O.; Heller, J. P. Carbon Dioxide-Foam Mobility Measure-ments at High Pressure. In Surfactant Based Mobility ControlsProgressin Miscible Flood Enhanced Oil RecoVery; Smith, D. H., Ed.; ACSSymposium Series 373; American Chemical Society: Washington, DC,1988; pp 375-386.
(14) Patton, J. T.; Holbrook, S. T. Enhancement of Crude Oil Recoveryin Carbon Dioxide Flooding. In Surfactant Based Mobility ControlsProgressin Miscible Flood Enhanced Oil RecoVery; Smith, D. H., Ed.; ACSSymposium Series 373; American Chemical Society: Washington, DC,1988; pp 387-404.
(15) Kuhlman, M. I.; Lau, H. C.; Falls, A. H. Surfactant Criteria forSuccessful Carbon Dioxide Foam in Sandstone Reservoirs. SPE ReserVoirEVal. Eng. 2000, 3, 35.
(16) Gauglitz, P. A.; Friedmann, F.; Kam, S. I.; Rossen, W. R. FoamGeneration in Homogeneous Porous Media. Chem. Eng. Sci. 2002, 57, 4037.
(17) Holm, L. W.; Josendal, V. A. Mechanism of Oil Displacement byCarbon Dioxide. J. Pet. Technol. 1974, 26, 1427.
(18) Monger, T. G. Measurement of Immiscible CO2 Injection in HeavyOil Reservoirs. Ind. Eng. Chem. Res. 1987, 26, 1147.
(19) Chung, F. T. H.; Jones, R. A.; Nguyen, H. T. Measurement andCorrelations of the Physical Properties of CO2/Heavy-Crude-Oil Mixtures.SPE ReserVoir Eng. 1988, 3, 822.
(20) Ngyuen, T. A.; Farouq, A. S. M. Effect of Nitrogen on the solubilityand diffusivity of Carbon Dioxide into Oil and Oil Recovery by theImmiscible WAG Process. J. Can. Pet. Technol. 1998, 37, 24.
(21) Bhide, V.; Hirasaki, G.; Miller, C.; Puerto, M. Foams for ControllingWater Production SPE 93273 in SPE International Symposium on OilfieldChemistry, the Woodlands, TX, Feb 2-4, 2005.
(22) Liu, Y.; Grigg, R. B. Salinity, pH, and Surfactant ConcentrationEffects on CO2-Foam. SPE 93095 in SPE International Symposium onOilfield Chemistry, the Woodlands, TX, Feb 2-4, 2005.
(23) Grigg, R. B.; Bai, B. Sorption of Surfactant Used in CO2 Floodingonto Five Minerals and Three Porous Media. SPE 93100 in SPEInternational Symposium on Oilfield Chemistry, the Woodlands, TX, Feb2-4, 2005.
(24) Holm, L. W.; Garrison, W. H. CO2 Diversion With Foam in anImmiscible CO2 Field Project. SPE ReserVoir Eng. 1988, 3, 112.
(25) Lee, H. O.; Heller, J. P. Laboratory Measurements of CO2-FoamMobility. SPE ReserVoir Eng. 1990, 5, 193.
(26) Bertin, H. J.; Apaydin, O. G.; Castanier, L. M.; Kovscek, A. R.Foam Flow in Heterogeneous Porous Media: Effect of Cross Flow. SPE J.1999, 4, 75.
(27) Gauglitz, P. A.; Friedmann, F.; Kam, S. I.; Rossen, W. R. FoamGeneration in Porous Media. SPE 75177 in SPE/DOE Improved OilRecovery Symposium, Tulsa, OK, April 13-17, 2002.
(28) Kim, J. S.; Dong, Y.; Rossen, W. R. Steady-State Flow Behaviorof CO2 Foam. SPE J. 2005, 10, 405.
(29) Bai, B.; Grigg, R. B. Kinetics and Equilibria of Calcium Ligno-sulfonate Adsorption and Desorption onto Limestone. SPE 93098 in SPEInternational Symposium on Oilfield Chemistry, the Woodlands, TX, Feb2-4, 2005.
(30) Du, D. X.; Zitha, P. L. J.; Uijttenhout, M. G. H. Carbon DioxideFoam Rheology in Porous Media: A CT Scan Study. SPE J. 2007, 12, 245.
(31) Nguyen, Q. P. Dynamics of Foam in Porous Media. Ph.D. Thesis,Delft University of Technology, Delft, The Netherlands, 2004.
(32) Harris, P. C. Rheology of Crosslinked Foams. SPE Prod. Facil.1996, 11, 113.
(33) Harris, P. C. A. Comparison of Mixed Gas Foams With N2 andCO2 Foam Fracturing Fluids on a Flow Loop Viscometer. SPE Prod. Facil.1995, 10, 197.
(34) Fredd, C. N., Miller, M. J., Quintero, B. W. Impact of Water-BasedPolymer Fluid Characteristics on CO2 Foam Rheology. SPE 86493 in SPEInternational Symposium and Exhibition on Formation Damage Control,Lafayette, LA, Feb 18-20, 2004.
(35) Zhu, T.; Strycker, A.; Raible, C. J.; Vineyard, K. Foams for MobilityControl and Improved Sweep Efficiency in Gas Flooding. SPE 39680 inSPE/DOE Improved Oil Recovery Symposium, Tulsa, OK, April 19-22,1998.
(36) Hutchins, R. D.; Miller, M. J. A Circulating Foam Loop forEvaluating Foam at Conditions of Use. SPE Prod. Facil. 2005, 20, 286.
(37) Cheng L.; Reme A. B.; Shan D.; Coombe D. A.; Rossen W. R.Simulating Foam Processes at High and Low Foam Qualities. SPE 59287in SPE/DOE Improved Oil Recovery Symposium, Tulsa, OK, April 3-5,2000.
(38) Kam, S. I.; Rossen, W. R. A Model for Foam Generation inHomogeneous Media. SPE J. 2003, 8, 417.
(39) Henrys-law.Org. http://www.mpch-mainz.mpg.de/∼sander/res/henry.html (accessed Feb 7, 2008).
(40) McCullough, E. C. Photon Attenuation in Computed Tomography.Med. Phys. 1975, 2, 307.
(41) Vinegar, H. J.; Wellington, S. L. Tomographic Imaging of three-phase Flow Experiments. ReV. Sci. Instrum. 1987, 58, 96.
(42) Nguyen, Q. P.; Currie, P. K.; Zitha, P. L. J. Effect of Cross-Flowon Foam-Induced Diversion in Layered Formations. SPE J. 2005, 10, 54.
(43) Valko, P.; Economides, M. J.; Baumgartner, S. A.; McElfresh, P. M.The Rheological Properties of Carbon Dioxide and Nitrogen Foams. SPE23778 in SPE Formation Damage Control Symposium, Lafayette, LA, Feb26-27, 1992.
(44) Nguyen, Q. P.; Currie, P. K.; Zitha, P. L. J. Determination of FoamInduced Fluid Partitioning in Porous Media using X-ray ComputedTomography. SPE 80245 in SPE International Symposium on OilfieldChemistry, Houston, TX, Feb 5-7, 2003.
(45) Zitha, P. L. J.; Nguyen Q. P.; Currie, P. K. Effect of Flow Velocityand Rock Layering on Foam Flow: an X-ray Computed Tomography Study.SPE 80530 in SPE Asia Pacific Oil and Gas Conference and Exhibition,Jakarta, Indonesia, Sept 9-11, 2003.
ReceiVed for reView December 11, 2007ReVised manuscript receiVed April 25, 2008
Accepted May 6, 2008
IE701688J
6306 Ind. Eng. Chem. Res., Vol. 47, No. 16, 2008