effect of production costs and sales on the company's net profit
TRANSCRIPT

Suzan and Nabilah R.: Effect of production Costs and Sales …
Jurnal Akuntansi/Volume XXIV, No. 02 December 2020: 169-186
DOI: http://dx.doi.org/10.24912/ja.v24i2.689 169
Effect of production Costs and Sales on the Company’s Net
Profit
Leny Suzan and Sausan Nabilah R.
1Faculty of Economics and Business, Telkom University, Bandung, Indonesia
Email address:
[email protected], [email protected] *Corresponding author
Abstract: One way to obtain optimal profits is to conduct sales activities and reduce costs.
Sales have an important role in providing income for the company. Production costs are
costs that need to be calculated by the company because the high production costs will
have an impact on sales and profits to be obtained. This study aims to determine the effect
of production costs and sales on net profit in pharmaceutical sub-sector manufacturing
companies listed in the Indonesia Stock Exchange period 2013-2018 both simultaneously
and partially. This research uses quantitative research methods. The sample used was 7
research samples in a period of six years to obtain 42 sample units. The results of the
research show that simultaneous production costs and sales affect profit. Partially shows
that the probability of production costs has a significant positive effect on net profit and
sales have no effect on net profit.
Keywords: Cost production, Net profit, Sales.
Abstrak: Salah satu cara dalam mendapatkan laba yang optimal yaitu dengan melakukan
kegiatan penjualan dan menekan biaya. Penjualan memiliki peran penting dalam
memberikan penghasilan bagi perusahaan. Biaya produksi adalah biaya yang perlu
diperhitungkan oleh perusahaan karena tingginya biaya produksi akan berdampak pada
tingkat penjualan dan laba yang akan diperoleh. Tujuan dilakukan penelitian yaitu untuk
memperoleh bukti empiris mengenai pengaruh biaya produksi dan penjualan terhadap laba
bersih perusahaan baik secara simultan maupun parsial. Penelitian ini dilakukan pada
perusahaan manufaktur sub sektor farmasi yang terdaftar di Bursa Efek Indonesia periode
2013-2018. Metode penelitian yang digunakan adalah metode kuantitatif. Penelitian ini
menggunakan 7 sampel penelitian dalam kurun waktu enam tahun sehingga didapat 42
unit sampel. Hasil penelitian menyatakan bahwa secara simultan biaya produksi dan
penjualan dapat mempengaruhi laba bersih. Secara parsial membuktikan bahwa biaya
produksi berpengaruh positif signifikan terhadap laba bersih dan penjualan tidak
berpengaruh terhadap laba bersih.
Kata Kunci: Biaya Produksi, Laba Bersih, Penjualan.

Suzan and Nabilah R.: Effect of production Costs and Sales …
Jurnal Akuntansi/Volume XXIV, No. 02 December 2020: 169-186
DOI: http://dx.doi.org/10.24912/ja.v24i2.689 170
INTRODUCTION
Getting big profits is the goal of every company. Companies are required to be able
to compete against other companies in maintaining market share and need to develop their
business and must finance the company's operations for survival by earning profits. The
amount of profit earned by the company is a measure of the company's success in its
operational activities and a view of management performance in managing the company.
The company has the urge to give signals as information to external parties, as for one of
the information provided is financial reports that can be trusted and prospective to support
the quality of the company in the future. In addition, the submitted signals can be as
promotions or other information which is an effort to support and confirm that the
company is superior compared to similar companies. According to (Haryani, 2017) "the
reduction between the amount of product sales results and the amount of expenditure to
buy resources in producing products will generate profit”. Therefore, income and costs are
elements that can form profits.
Based on the signal theory according to (Brigham and Houston, 1999) is a follow-up
by the company in conveying a sign to investors of the management's view of seeing
prospective matters of the company. The referred reference is a presentation of
information that explains what progress has been carried out by management and contains
many notes, details and conventional view to sustainable that are predicted to the future to
manifest investor desires. The external parties of the company have an influence on
investment decisions because they are influenced by important information released by the
company.
Optimal sales can bring the company to get maximum profits. The survival of the
company can be guaranteed by sales activities that the more sales the company makes, the
more profits are obtained. Source of income is generated by sales activities can cover all
costs incurred by the company. In addition to obtain optimal sales, maximum profits can
also be obtained by emphasizing costs. In manufacturing companies, the sales of products
are processed by the company will be a source of income, so the cost of production is one
of the costs that the company needs to calculate. Although the company needs to
emphasize production costs, but the company must keep increasing sales but still
consistently pay attention to the quality of the products are produced so that the profits
generated can increase.
The pharmaceutical industry contributes as a prime mover of the economy and is
one of the priority industries because it has provided a significant role in Indonesia's
economic growth. The gross domestic product (GDP) of the non-oil and gas processing
industry received contributions from the pharmaceutical industry, chemical drug products
and traditional medicine in 2018 by 2.78 percent and this industry has a growth of 4.46
percent recorded by the Ministry of Industry. But the pharmaceutical industry is still
constrained by almost 90% of raw material production which is still met of imports.
According to Airlangga as Minister of Industry, the pharmaceutical industry has been
placed as a priority industry as contained in the 2015-2035 National Industrial
Development Master Plan (RIPIN) (source: katadata.co.id, 2019).
Through the National Health Insurance (JKN) program gives hope to the
pharmaceutical industry to obtain an increasing in sales that can increase demand of drugs,
in fact of drugs demand has increased, in 2015 there were 796 drugs in the e-catalog
Suzan and Nabilah R.: Effect of production Costs and Sales …
Jurnal Akuntansi/Volume XXIV, No. 02 December 2020: 169-186
DOI: http://dx.doi.org/10.24912/ja.v24i2.689 171
auction list and in 2016 drugs are auctioned increased up to 1,240 drugs. In the two
companies that most met the drug needs for the JKN program, namely PT Indofarma Tbk
and PT Kimia Farma Tbk, the company's drug sales increased not accompanied by growth
in profit margins. For example, in 2016 Kimia Farma had a net profit that only grew 2.2%
compared to the previous year which grew 13.15% and in 2014 that grew 9.36%, although
it still obtained a profit but its profit growth slowed. Whereas Kimia Farma's sales in 2016
had the highest sales growth compared to 2015 and 2014 at 19% amounting to Rp.5.8
trillion (www.tirto.id, 2017). In 2014 the holding of the National Health Insurance
Program (JKN) led to increased drug demand but production activities were still
constrained by 90% of the production of pharmaceutical industry raw materials which
were still dependent on imports. The dependence of imported raw materials which
reaches 90% causes the large production costs that must be incurred by the company.
Based on the export and import data of the pharmaceutical and traditional medicine
industry in 2015-2018 processed by the Ministry of Industry (2019), the development of
imports of the pharmaceutical and traditional medicine industry from 2015 to 2018
continues to increase from US $ 788 million to US $ 906 million. In addition, when
viewed from the development of exports of the pharmaceutical and traditional medicine
industry, the value of exports from 2015 to 2018 decreased from US $ 591 million to US $
580 million. Meanwhile, according to the Kompas.com news quote (2018), the impact of
the implementation of the Health BPJS from this JKN program effected in the sale of the
value has decreased but the drug production has increased. The decline in sales was due to
the low price of drugs in e-catalogs conducted by the government through the Government
Services Procurement Policy Agency (LKPP).
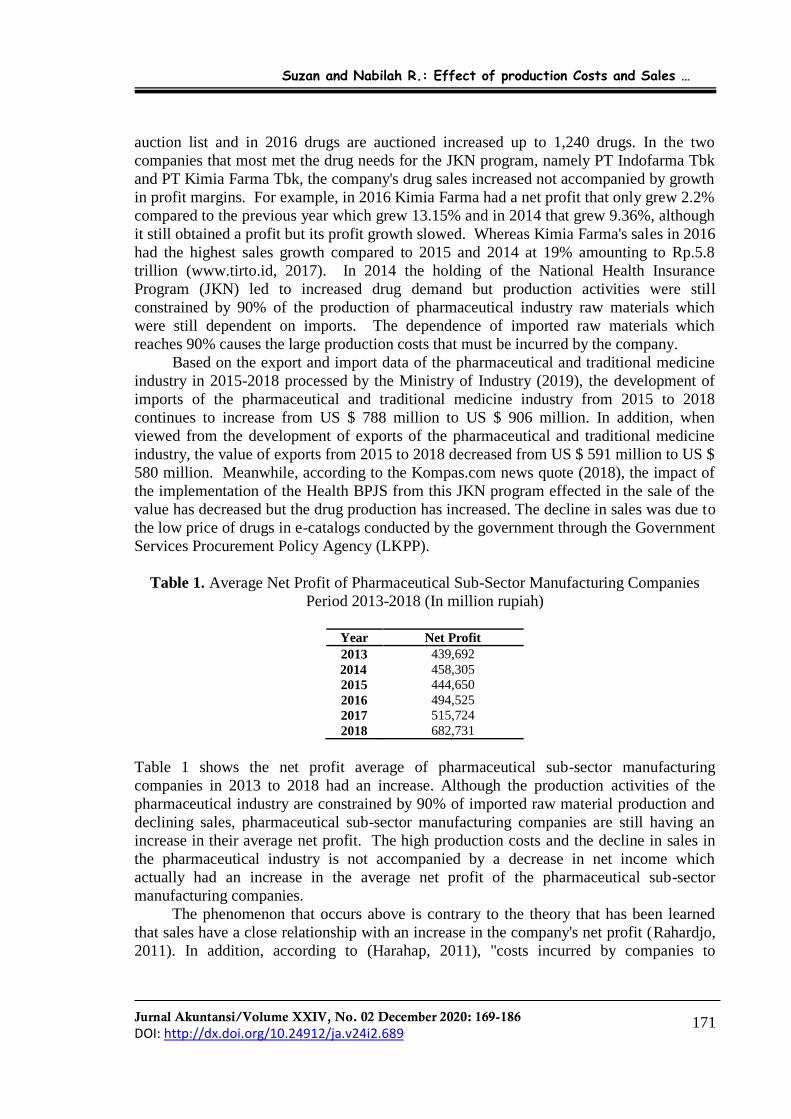
Table 1. Average Net Profit of Pharmaceutical Sub-Sector Manufacturing Companies
Period 2013-2018 (In million rupiah)
Year Net Profit
2013 439,692
2014 458,305
2015 444,650
2016 494,525
2017 515,724
2018 682,731
Table 1 shows the net profit average of pharmaceutical sub-sector manufacturing
companies in 2013 to 2018 had an increase. Although the production activities of the
pharmaceutical industry are constrained by 90% of imported raw material production and
declining sales, pharmaceutical sub-sector manufacturing companies are still having an
increase in their average net profit. The high production costs and the decline in sales in
the pharmaceutical industry is not accompanied by a decrease in net income which
actually had an increase in the average net profit of the pharmaceutical sub-sector
manufacturing companies.
The phenomenon that occurs above is contrary to the theory that has been learned
that sales have a close relationship with an increase in the company's net profit (Rahardjo,
2011). In addition, according to (Harahap, 2011), "costs incurred by companies to

Suzan and Nabilah R.: Effect of production Costs and Sales …
Jurnal Akuntansi/Volume XXIV, No. 02 December 2020: 169-186
DOI: http://dx.doi.org/10.24912/ja.v24i2.689 172
products and services are costs that can affect the achievement of net profit" so that by
suppressing production costs can affect the increase in corporate profits.
Based on previous research according to (Putranto, 2017) sales have a significant or
substantial effect on company profits. This means that to obtain a certain profit the
company tries to obtain a certain sales volume to support the company's growth.
However, it has a difference with research conducted by (Hesti Alifiani, 2016) which
states that sales do not have a significant effect on the company's net profit. Meanwhile,
according to (Sembiring and Siregar, 2018), there is a significant positive influence
between production costs and net profit. This means that an increase or decrease in net
profit can be influenced by an increase or decrease in production costs. This is different as
reported by (Putranto, 2017), that production costs have a negative and significant effect
on net profit. If interpreted, if there is a decrease in production costs, the company's net
profit will increase. However, research conducted by (Mulyana, 2017), revealed that net
profit was not affected by production costs.
According to the above phenomenon, researchers are interested in carrying out this
research in order to find out whether the realization of production and sales costs in
manufacturing companies in the pharmaceutical sub-sector in 2013-2018 has been done
well so that it affects net profit.
THEORITICAL REVIEW
Signaling Theory. Spence first introduced signaling theory in his research entitled Job
Market Signaling. The signal or signal put forward by (Spence, 1973) is interpreted as a
piece of relevant information given by the sender as the owner of the information to the
recipient, which can then be utilized by the recipient. The use of this information will be
adjusted by the recipient according to his understanding of the signal. (Brigham and
Houston, 1999) interpret the signal or signal as one of the follow-up actions taken by the
company in giving an indication to investors of the management's view of seeing the
prospective company. The intended reference is in the form of notification of what has
been done by management and contains many records, details and conventional to
sustainable images that are predicted to occur in the future with the aim of realizing the
owner's wishes. Provision of information by the company will affect the investment
decisions of companies outside the company because the information is important for
investors. There is asymmetry between the company and outside parties is an
encouragement for companies to provide signals or instructions in the form of
information. Investor's knowledge of the company's internal information is relatively
slower and less than that of management which causes information asymmetry. Reducing
information asymmetry can be done by the company by giving signals or instructions
aimed at external parties, namely by giving informative notices about trusted finance and
able to support the prospective level of a company in the future. Promotion or other
information methods that can bring the company in improving the quality of the company
from its competitors, can be a signal given by the company in reducing information
asymmetry.
Financial statements. Companies in their needs to review the results of the company's
performance in a period through detailed information called financial statements.

Suzan and Nabilah R.: Effect of production Costs and Sales …
Jurnal Akuntansi/Volume XXIV, No. 02 December 2020: 169-186
DOI: http://dx.doi.org/10.24912/ja.v24i2.689 173
According to (Kasmir, 2013) financial statements are detailed information that discloses
the company's current financial situation or for a certain period of time. Based on the
opinion of (Mulyawan, 2015), financial statements are a tool for evaluating the results of
work originating from the accounting unit which is useful in determining and evaluating
the company's financial position. The results of the achievement and financial condition of
the company can be observed through financial statements. Meanwhile, according to
(Subramanyam, 2017), information obtained from financial statements can be useful as a
prediction tool in the future, therefore financial statements can be useful for the decision
making process. The preparation of financial statements must be recorded based on
applicable accounting rules. (Kasmir, 2013) states that the nature of financial statements is
historical and comprehensive. Having historical character means that the report is
compiled based on past and present data. Whereas what is meant by being comprehensive
is that the financial statements prepared must be complete in accordance with the
applicable standards. There are types of reports contained in the financial statements
including balance sheets, income statements, statements of changes in capital, reports on
notes to financial statements, and statements of cash flows. The balance sheet reports the
amount of assets (assets), capital and debt of the company in a certain period. The income
statement describes the achievement of the profit or loss obtained by the company and
shows the costs that have come out over a certain period of time. The report on capital
changes describes the causes of developments that occur in capital and shows the amount
of capital the company has today. The statements of cash flows describe the entry of cash
flows and the allowance for cash flows that occur during a specified period of time. And
the notes to the financial statements explain the details of the values presented on the
balance sheet, income statement, cash flow statement, and capital change report.
Cost. Companies in operating their business activities require sacrifices in the form of
expenses or costs. According to (Mulyadi, 2016) in general the cost is an economic
source that is sacrificed by using a unit of currency as a measurement issued for certain
purposes. While (Carter and Usry, 2014) argues that costs are expenses, sacrifices or
exchange rates carried out in the hope of receiving benefits in the future. Often the term
cost is likened to the term load which actually has a gap in the angle of sacrifice. Based
on the angle of sacrifice, the cost aims to produce an output that has a value of benefits.
Costs are interpreted as expenses for capital. While the sacrifice angle of the expense
aims to get income from sales activities and expenses do not have benefits in the future.
Expenses are interpreted as income expenditure. Distribution of cost categories is done in
order to convey overall cost information for managerial needs in operating the company.
According to (Mulyadi, 2016) costs are categorized based on the object of expenditure,
changes in the number of activities, the main functions in the company, the correlation of
costs with something financed, and according to the term of the benefits. As an example
of categorizing costs based on the object of expenditure, costs incurred for wage labor fall
into the category of labor costs and expenses for purchasing raw materials are classified in
the category of raw material costs. Based on the main function, costs are classified into
marketing costs, production costs and general administrative costs. According to changes in activity volume, costs are grouped into variable costs, fixed costs, semi-fixed costs, and
semi-variable costs. Then based on the correlation of costs with something financed, the

Suzan and Nabilah R.: Effect of production Costs and Sales …
Jurnal Akuntansi/Volume XXIV, No. 02 December 2020: 169-186
DOI: http://dx.doi.org/10.24912/ja.v24i2.689 174
costs are divided into two namely indirect costs and direct costs. Meanwhile, according to
the term of the benefits, the costs are divided into capital costs and income costs.
Production cost. According to (Mulyadi, 2016), "direct labor costs, raw material costs
and overhead costs are components of the production costs ie all costs used in making raw
materials into products suitable for sale". According to (Sukirno, 2013), "All expenditures
by companies starting from the costs used for the factors of production and raw materials
in making products are defined as production costs”. Production costs can be determined
through two approaches including full costing and variable costing. According to
(Mulyadi, 2016), the difference between full costing and variable costing is in the method
of calculating the components of production costs. Full costing takes into account all
components of production costs including both fixed and variable costs. Whereas variable
costing only takes into account the component of production costs which are only variable.
Sales. According to (Hery, 2016), "sales are activities in selling goods produced by the
company to customers in cash or credit". According to (Sujarweni, 2015), "sales are the
company's main activity in the sale of goods and services that have been produced". Sales
are the company's main activity in an effort to achieve optimal company profit. According
to (Swastha, 2014) "the company sells with three objectives, namely, achieving certain
targets in sales, supporting the company's growth and trying to get a final profit that is
greater than the expenses". Sales are divided into credit sales and cash sales. Credit and
cash sales differ in the payment term. Cash sales require consumers to make payments
before delivery of goods or services. While credit sales have a grace period for payment
after the delivery of goods or services. Sales also have several factors that must be known
including the conditions and competence of sellers, market conditions, capital, and other
factors such as promotions, advertisements, price discounts or gift giving (Halawa, 2015).
Net profit. The company's performance can be reflected in the results of earnings.
Economics defines profit with the results of the acquisition of investment. Whereas
accounting science interprets profits with the results of calculations between income and
expenses. The several types of profit contained in the income statement include gross
profit, operating profit, profit before tax, profit after tax, and net profit. According to
(Simamora, 2013) states that "the results of the transaction income, expenses, losses and
profits will produce a net profit". Meanwhile, according to (Subramanyam, 2017), "net
income is obtained from the remaining profits of the company after reducing revenues and
profits with expenses and losses". According to (Mulyadi, 2016) profitability is
influenced by various factors including costs, sales and production quantities, and selling
prices. The effect of costs on profits is caused by expenses for the manufacture of an item
or service that can have an impact on the selling price of the item or service. Selling
prices can affect profits, because the selling price of an item or service has an impact on
the many sales volumes of the item or service. In addition, the large volume of sales has
an impact on the number of production volumes of goods or services so that the sales
volume and production volume can also be a factor affecting profit.

Suzan and Nabilah R.: Effect of production Costs and Sales …
Jurnal Akuntansi/Volume XXIV, No. 02 December 2020: 169-186
DOI: http://dx.doi.org/10.24912/ja.v24i2.689 175
Hypothesis Development
Effect of Production Costs on Net Profit. The company has a specific purpose in
running its business, which is obtaining optimal profit that must be achieved with a
supportive strategy. One way efforts can be made by increasing control of costs. In its
activities, the company spends most of its costs on production costs. Companies usually
reduce production costs incurred so that the company can optimize profits. (Mulyana,
2017) states that by determining the costs incurred by companies to products and services
are costs that support the achievement of net profit. The production process is the most
costly activity, if the company experiences an increase in production costs, the company
will get a low net profit. Companies need to consider setting production costs carefully so
that spending in an efficient and controlled production cost can affect maximum profit
earnings. In her research (Oktapia et al., 2017) states that there is a significant negative
effect between production costs and the company's net profit. Research shows that the
high production costs will affect the lower the level of company net profit. The research is
similar to that conducted by (Juwita and Budiati, 2015), (Andri et al., 2018) and (Casmadi,
2019) which states that there is a significant negative effect of production costs on
company profits.
H01: Production costs have a negative effect on net income.
Effect of Sales on Net Profit. In addition to controlling costs, companies also need to pay
attention to sales in increasing company profits. Sales are the most important activity
carried out by companies to get profits and obtain optimal profits. The higher level of
sales made by the company, it is expected to increase profits and create optimal profits.
According to (Basu Swastha, 2014) "the company sells with three objectives, namely,
achieving certain targets in sales, supporting the company's growth and trying to get a
final profit that is greater than the expenses". Meanwhile according to (Rustami, 2014)
states that sales have a close relationship with an increase in the company's net profit.
Previous research by (Wisesa et al., 2014), (Putranto, 2017) and (Simangunsong, 2019)
explains that sales have a positive influence on company profits. This study reviews that
each level of growth in sales will be followed by growth in the level of corporate profits.
Based on the theoretical study and hypothesis development, the following is the
explanation of the research framework in Figure 1:
H02: Sales have a positive effect on net income.

Suzan and Nabilah R.: Effect of production Costs and Sales …
Jurnal Akuntansi/Volume XXIV, No. 02 December 2020: 169-186
DOI: http://dx.doi.org/10.24912/ja.v24i2.689 176
Figure 1. Schematic Framework
Note:
Partial
Simultaneous
METHODS
This study will explain the results of quantitative data processing, the data used as
material for this review is data that has been processed by other parties or commonly
referred to as secondary data obtained from the complete financial statement data of
pharmaceutical sub-sector manufacturing companies listed on the Indonesia Stock
Exchange (IDX) from 2013 to 2018. In addition, the collection of data sources is done by
searching literacy through the method of reading and reviewing books, journals, internet
sites, or literature that has a correlation with the problem in this study. The study uses
descriptive verification method which is causality with the aim to explain the variables of
production and sales costs, and to find out a significant effect on net income with these
variables. At the time of implementation, panel data was used in this study because the
study was a combination of time series and cross sectional, which meant that it was
conducted in many companies with many periods. A total of 10 pharmaceutical sub-sector
manufacturing companies listed on the Indonesia Stock Exchange in 2013-2018 as a
population and 7 companies within a period of six years were sampled in this study. The
purposive sampling technique as a sampling technique. This study has a consideration of
a sample of pharmaceutical sub-sector manufacturing companies listed on the Indonesia
Stock Exchange (IDX) during the period 2013 to 2018 and pharmaceutical sub-sector
manufacturing companies that are consistently listed in presenting financial reports on the
Indonesia Stock Exchange (BEI) during the period 2013 to 2018.
Data analysis technique. This study uses descriptive analysis techniques that have a way
of analyzing data by collecting data which is then described through statistical processing
(Sugiyono, 2015). According to (Ghozali, 2016) an overview of data is given by looking
at the mean (maximum), maximum, minimum, standard deviation, variance, kurtosis, sum,
skewness (skewed distribution), and range.
Production Cost
(X1)
Sales (X2)
Independent Variable
Dependent Variable
Net Profit (Y)
-
+

Suzan and Nabilah R.: Effect of production Costs and Sales …
Jurnal Akuntansi/Volume XXIV, No. 02 December 2020: 169-186
DOI: http://dx.doi.org/10.24912/ja.v24i2.689 177
Panel Data Regression Analysis. The analytical method used in this study is panel data
regression analysis because this research is a combination of cross sectional and time
series which means it is carried out in many companies with many periods. The data is
processed using the Eviews version 10 program.
Panel Data Model Equation Analysis
𝑌 = 𝛼 + β1X1𝑖𝑡 + β2X2𝑖𝑡 + ℯ ............................................................................................. (1) Note:
𝑌 = Net Profit
𝛼 = A Constant
β1, β2,, β3 = Regression coefficients of each independent variable
X1𝑖𝑡 = Production Cost
X2𝑖𝑡 = Sales
ℯ = Error term
t = Time
i = Company
(Basuki and Prawoto, 2016) state that there are several types of ways to estimate the
regression model used in panel data are the Fixed Effect Model, the Common Effect
Model and the Random Effect Model. The Common Effect Model assumes that corporate
data has similar integrity in time period variations because the model does not observe
time or individual perspectives. The fixed effect model provides the speculation that
contrast between individuals can be accommodated from differences in their intercepts.
Panel effect data estimation still uses dummy variables as a technique in detecting
intercept differences between companies. The fixed panel data estimation model has
another name for the Least Square Dummy Variable (LSDV) technique. Whereas the
random effect model estimates the disruption variables that are likely interrelated between
individuals and between times. The advantage of using the random effect model is that it
can eliminate heteroscedasticity. There are several tests that can be done in managing
panel data through selecting the most appropriate model according to (Basuki and
Prawoto, 2016), namely the chow test, the hausman test and the lagrange multiplier test.
The right step in detecting the use of which model is right between the fixed effect model
or the common effect model, namely the chow test that determines the usage test in
estimating panel data. Hausman test is used in estimating panel data as a determination
between fixed effect models or random effects models that are more appropriate to use.
While the lagrange multiplier test is a test in estimating panel data to conclude a random
effect model or a common effect model that is more appropriate to use.
Determination Coefficient Test (Statistical Test R2). The purpose of the coefficient of
determination test (R2) is as a step in seeing the progress of the model competency in
explaining the independent variables. The coefficient of determination has a value
between zero and one (0 <R2 <1), if R2 has a low value then the explanation of the
variation of the dependent variable by the independent variable has competency
limitations (Imam Ghozali, 2016). However, the independent variable can reveal almost
all of the information needed in estimating the variation of the dependent variable if R2 is

Suzan and Nabilah R.: Effect of production Costs and Sales …
Jurnal Akuntansi/Volume XXIV, No. 02 December 2020: 169-186
DOI: http://dx.doi.org/10.24912/ja.v24i2.689 178
close to one. According to (Sugiyono, 2015), the analysis of the coefficient of
determination is obtained from the square of the correlation coefficient.
Coefficient of Determination,
Kd = R2 x 100% .............................................................................................................. (2)
Note:
Kd = Coefficient of Determination
R2 = Coefficient of Correlation
F Test. This test is carried out to review whether all independent variables simultaneously
have an effect on the dependent variable (Ghozali, 2016). Hypothesis testing can
simultaneously be carried out by reviewing the significance value obtained. H0 is rejected
and Ha is accepted when the significance value is below 0.05, so that simultaneously the
independent variable (X) is able to influence the dependent variable (Y). Likewise, the
opposite is accepted by H0 and Ha is rejected if the significance is greater than the value
of 0.05, meaning that simultaneously the independent variable (X) does not affect the
dependent variable (Y).
T test. Partial testing was carried out to review the progress of the effects of each variable
specifically in describing the variation of the dependent variable (Ghozali, 2016).
Hypothesis testing is partially obtained H0 results are rejected and Ha is accepted when
the significance value is lower than the value of 0.05 which means that individually the
independent variable (X) is able to influence the dependent variable (Y). Vice versa, H0 is
accepted and Ha is rejected when the significance value has a value higher than the value
of 0.05, on these results it can be concluded individually that the independent variable (X)
does not affect the dependent variable (Y).
RESULTS
Descriptive Analysis. Descriptive statistical test results of production and sales costs to
net income can be further reviewed in Table 2 below:
Table 2. Descriptive Statistics Results
(In million rupiah)
Net
Profit
Production
Cost
Sales
Mean 505,938 1,222,908 5,246,285
Minimum -54,222 9,318 192,555
Maximum 2,497,261 6,099,435 21,074,306
Std. Dev. 760,396 1,795,129 6,286,292
Observations 42 42 42
Table 2 shows the test results on the descriptive statistics of the dependent variable,
namely net profit, which has an average of Rp. 505,938,294,711 while a standard
deviation of Rp. The minimum net profit value of Rp -54,222,595,302 was owned by PT

Suzan and Nabilah R.: Effect of production Costs and Sales …
Jurnal Akuntansi/Volume XXIV, No. 02 December 2020: 169-186
DOI: http://dx.doi.org/10.24912/ja.v24i2.689 179
Indofarma Tbk in 2013. Meanwhile, the maximum net profit value of Rp
2,497,261,964,757 was achieved by PT Kalbe Farma Tbk in 2018.
In the independent variable production costs have an average of Rp
1,222,908,503,198 while the standard deviation of Rp 1,795,129,527,410, where the
average yield is lower than the standard deviation so that the data vary or have a large
degree of deviation. The minimum value of production costs is 9,318,369,998 owned by
PT Kimia Farma Tbk in 2018. Then the maximum value of production costs is valued at
Rp 6,099,435,860,146 won by PT Kalbe Farma Tbk in 2018.
The second independent variable, namely sales, has an average of Rp
5,246,285,485,531 while a standard deviation of Rp 6,286,292,563,913, where the average
value is lower than the standard deviation so the data varies or has a large degree of
deviation. The minimum value of sales of Rp 192,555,731,180 was owned by PT Pyridam
Farma Tbk in 2013. While the maximum value of sales of Rp 21,074,306,186,027 was
achieved by PT Kalbe Farma Tbk in 2018.
Panel Data Regression Analysis. The panel data regression analysis technique performed
in this review uses Eviews 10 software. Panel data regression analysis has several test
models that can be performed, namely, the fixed effect model, the common effect model
and the random effect model. The following tests are carried out as a step to ensure the
right model for this research is the chow test, the hausman test and the lagrange test. The
chow test is applied in determining the use of an appropriate model between a fixed effect
model or a common effect model. If the resulting probability value is lower than the value
of 0.05, then it is the reason for rejecting H0 with the meaning that the fixed effect model
is the most appropriate to use. Meanwhile, if the value of the probability produced is
greater than the value of 0.05, it results in the receipt of H0 which means the common
effect model is most appropriate to use. The Chow test results are shown as follows.
Table 3. Chow Test Results
Cross- Section F Cross-section Chi-square
statistic 6.234687 31.831223
d.f (6,33) 6
Probability 0.0002 0.0000
Based on Table 3, the results of the Chow test above show that the cross-section F
probability value (p-value) is 0.0002 lower than the significance level of 0.05 or 5%.
According to these data, it was concluded that the fixed effect was more appropriate than
the common effect because H0 was rejected and H1 was accepted. For the next stage,
testing with the hausman test after the chow test is completed.
To ensure the use of a suitable model between random effects and fixed effects, a
hausman test is performed. If the probability value is lower than the 0.05 value, it is
concluded that H0 is rejected, which means that the fixed effect model is the most
appropriate model to use. Meanwhile, if the probability is greater than the value of 0.05, it
is concluded that H0 is accepted, which means the random effect model is the most appropriate to use. The results of the Hausman test are described as follows.

Suzan and Nabilah R.: Effect of production Costs and Sales …
Jurnal Akuntansi/Volume XXIV, No. 02 December 2020: 169-186
DOI: http://dx.doi.org/10.24912/ja.v24i2.689 180
Table 4. Hausman Test Results
Correlated Random Effects - Hausman Test
Test Summary Cross-section random
Chi-Square Statistic 2.755620 Chi-Square d.f. 2
Probability 0.2521
In Table 4 the results of the thirsty test above show the probability (p-value) of the
cross-section F is 0.2521 higher than the significance level of 5% or 0.05. Based on the
data, it can be concluded that the research is more feasible to use the random effect model
than the fixed effect model because H0 is accepted and H1 is rejected. After completing
the hausman test, proceed with the Lagrange test.
To determine the use of an appropriate model between random effects or common
effects, a pagan breach test or lagrange test is performed. If the probability value is lower
than the 0.05 value, it is concluded that H0 is rejected, which means that the random effect
model is more appropriate to use. Whereas if the probability value is higher than the 0.05
value, it is concluded that H0 is accepted, which means the common effect model is the
most appropriate to use. Following is Table 5, the results of the pagan breusch test.
Table 5. Lagrange Test Results
Lagrange multiplier (LM) test for panel data
Breusch-Pagan
Cross-section One-sided 15.42243
(0.0001) Period One-sided 1.863734
(0.1722) Both 17.28616
(0.0000)
Table 5 above shows the results of the breusch-pagan test having a cross-section F
probability (p-value) of 0.0001 lower than the significance level of 5% or 0.05. Based on
the test results, it can be concluded that the use of the random effect model is more
appropriate than the common effect model because it proves that H0 is rejected and H1 is
accepted.
Based on the results after testing three models (chow test, Hausman test and
breusch-pagan test), the conclusion states that the random effect model is the most
appropriate model used in research and is described as follows.
Table 6. Random Effect Significance Test Results
Method: Panel EGLS (Cross-section random effects)
Variable Coefficient Std. Error
C -5.57E+09 1.00E+11

Suzan and Nabilah R.: Effect of production Costs and Sales …
Jurnal Akuntansi/Volume XXIV, No. 02 December 2020: 169-186
DOI: http://dx.doi.org/10.24912/ja.v24i2.689 181
Production cost 0.233965 0.105040 Sales 0.042963 0.030446
Based on Table 6, the panel data regression model equation from the results of the
Random Effect significance test that reviews "The Effect of Production and Sales Costs on
Net Profit in Pharmaceutical Sub Sector Manufacturing Companies Listed on the 2013-
2018 Indonesia Stock Exchange" as follows:
The Results of the Panel Data Regression Equation Model
Y = -5.57E+09 + 0.233965 X1 + 0.042963 ................................................................. (3)
Note:
Y = Net Profit
X1 = Production Cost
X2 = Sales
ℯ = Error term
The panel data regression equation describes a constant value of -5.57E + 09
meaning that if production and sales costs are considered to be of fixed value then net
profit will be worth -5.57E + 09. The production cost regression coefficient (X1) of
0.233965 means that every time there is an increase in production costs by one unit
assuming other variables have a fixed value, in other words the net profit of
pharmaceutical sub-sector manufacturing companies listed on the 2013-2018 Stock
Exchange will have an increase of 0.233965. Furthermore, the sales regression coefficient
(X2) of 0.042963 means that every time there is an increase in sales of one unit by
assuming other variables with a fixed value, the net profit of companies in the
pharmaceutical sub-sector listed on the Indonesia Stock Exchange in 2013-2018 will
obtain growth of 0.042963.
Testing the Coefficient of Determination (R2). This test aims to estimate the progress
of competence of each independent variable in describing the dependent variable.
Table 7. Determination Coefficient Test Results (R2)
Weighted Statistics
R-squared 0.690311 Adjusted R-squared 0.674430
S.E. of regression 1.73E+11 F-statistic 43.46645
Prob (F-statistic) 0.000000
Based on the test results in Table 7, the acquisition of the test of the coefficient of
determination (𝑅2) on the Adjusted R-squared value is 0.674430 or 67.444%. Therefore, the independent variable consisting of production and sales costs can explain or influence
the dependent variable, which is the net profit of pharmaceutical sub-sector manufacturing
companies in 2013-2018 of 67.444% while the remaining 32.557% is explained by other
variables.

Suzan and Nabilah R.: Effect of production Costs and Sales …
Jurnal Akuntansi/Volume XXIV, No. 02 December 2020: 169-186
DOI: http://dx.doi.org/10.24912/ja.v24i2.689 182
Test Results F. Simultaneous testing plays a role in revealing whether all independent
variables simultaneously have an impact on the dependent variable. If the result of the
probability (p-value) is lower than the 5% significance level or 0.05, it can be concluded
that H0 is rejected, meaning that the dependent variable can be affected by the
independent variable simultaneously. Following the results of the review in Table 7
shows that the F-statistic probability has a significant value of 0.000000 with a value
lower than 5%, then H0 is rejected, ie the cost of production and sales simultaneously or
simultaneously has an influence on net profit.
Test Results t. Partial testing aims to reveal the progress of the influence of each variable
partially on the decomposition of the dependent variable. If the result of the probability
(p-value) is lower than the significance level of 5% or 0.05, it can be concluded that H0 is
rejected, meaning that the dependent variable can be affected by the independent variable
individually.
Table 8. Random Effect Test Results
Method: Panel EGLS (Cross-section random effects)
C Production Cost Sales
Coefficient -5.57E+09 0.233965 0.042963 Std. Error 1.00E+11 0.105040 0.030446 t-Statistic -0.055684 2.227394 1.411100
Probability 0.9559 0.0318 0.1661
Based on Table 8, the results of a partial test (t test) conclude that the production
cost is coefficient of 0.233965 and the Prob (t-statistic) of the production cost is 0.0318.
This value indicates that the value of 0.0318 is lower than the significance level of 5% or
0.05 and the regression coefficient shows a positive value, thus resulting in the conclusion
that H01 is rejected and Ha1 is accepted so that production costs have a significant
positive effect on net profit. Sales have a coefficient of 0.042963 and Prob (t-statistic)
sales are worth 0.1661. The t-statistic probability value explains that 0.1661 is greater
than the 0.05 value and the regression coefficient shows a positive value, thus resulting in
the conclusion that H02 is accepted and Ha2 is rejected so that individual sales have no
effect on net profit.
DISCUSSION
Effect of Production Costs on Net Profit. Based on the probability value using the
statistical test t production costs have a value of 0.0318 lower than 0.05 significance level
with a value of 5% and a regression coefficient of 0.233965 which has a positive
correlation with net profit, the conclusions obtained are Ha1 accepted and H0 rejected so
that production costs have an influence significant positive on net profit. Therefore it can
be defined that when a company has high production costs, it will affect the increase in the company's net profit.

Suzan and Nabilah R.: Effect of production Costs and Sales …
Jurnal Akuntansi/Volume XXIV, No. 02 December 2020: 169-186
DOI: http://dx.doi.org/10.24912/ja.v24i2.689 183
Table 9. Comparison of Average Production Costs and Net Profit
Net Profit >
505,938,294,711
Net Profit<
505,938,294,711
Total
Amount Percentage Amount Percentage
Production Cost >
1,222,908,503,198
12 92.31% 0 0 12
Production Cost <
1,222,908,503,198
1 7.69% 29 100% 30
Total 13 100% 29 100% 42
Production costs can have a positive effect because optimizing production costs can
function significantly in positive net profit growth. Supported by the data in Table 9
above shows that of the 42 samples there are 12 samples that have a value of production
costs and net profit values above average, 1 data sample that has a value of production
costs below average and net profit above average, and 29 samples that have below average
production costs and net profit. The comparison results show that there is an influence
between production costs on net profit caused by sample data that has a value of
production costs and net profit below the average has more sample data. That is, with the
low production costs that companies incur, it will also lower the net profit obtained so that
there is a positive and significant correlation between production costs and net profit.
The results obtained from this review do not have a correlation with the research
framework which states that production costs have a negative influence on company
profits. However, research analysis reveals that there is a positive influence on production
costs related to net profit according to research conducted by (Putranto, 2017), (Fauzi
Dwi, 2017), (Felicia and Gultom, 2018), and (Sembiring and Siregar, 2018). Based on the
theory, previous research and research results obtained, then there is a positive influence
of production costs related to net income is due to an increase in production costs affect
the increase in the number of products produced so that it will affect the number of
products sold and also affect the profits earned by the company.
Effect of Sales on Net Profit. Based on the probability value using the statistical test, t
sales have a value of 0.1661, greater than 0.05, a significance level of 5% and a regression
coefficient of 0.042963 which has a positive correlation with net profit, then the
conclusion is that Ha2 is rejected and H0 is accepted so that sales have no effect on
earnings clean. This can be interpreted that when a company experiences an increase or
decrease in sales it will not affect the company's net profit.
Sales that have increased or decreased do not always have an impact on net profit
because there are other factors besides sales that have an impact on net profit. Other
factors such as costs or expenses incurred by the company include production costs, R&D
costs, operating expenses, moreover selling prices, high and low corporate taxes can also
be another factor that affects net profit. Therefore, the research framework which states
that sales have a positive effect on the company's net profit is not in line with the content
of the discussion of this study. The results of the study determine that net sales have no
effect on the company's net profit. Research shows that any increase or decrease in sales
does not affect the company's net profit, where the results are similar to the research
presented by (Sitohang et al., 2015), (Hesti Alfiani, 2016), (Zahara and Zannanti, 2018),

Suzan and Nabilah R.: Effect of production Costs and Sales …
Jurnal Akuntansi/Volume XXIV, No. 02 December 2020: 169-186
DOI: http://dx.doi.org/10.24912/ja.v24i2.689 184
and (Hidayanti et al., 2019). Based on the theory, previous research and research results
obtained, the sale does not affect the net profit is due to the company's net profit not only
influenced by sales but influenced by other factors.
CONCLUSION
From the review of the results of research conducted by analysts, it can be drawn
more than one conclusion. The variable costs of production, sales and net profit have
lower average values compared to the standard deviation, so the data has a value of
deviation. In addition, the simultaneous review of production and sales costs has an effect
on net profit. While the test results are taken partially, production costs have a significant
positive effect on net profit and sales have no effect on the net profit of pharmaceutical
sub-sector manufacturing companies which are listed on the Indonesia Stock Exchange.
The limitations in the process of conducting research, namely the population and
research samples are limited to the pharmaceutical sub-sector only and only use a period
of time for 6 years. In addition, another limitation is that this study only uses 2 factors
analyzed, namely production and sales costs.
Based on the limitations of the study, it is recommended to add population and
research samples to optimize the results of the research substance. The addition of
population and sample also aims to ensure that the review does not focus solely on the
pharmaceutical sub-sector, expanding the research year, as well as adding other
independent variables to future research related to other factors that have a significant
influence on net profit. The substance of the research also makes consideration for the
company and is useful for increasing production costs in the hope that it can increase
production results so as to increase sales, so that it does not experience losses and is
expected to maximize its net profit. In addition, investors have a role to not only monitor
the profits or net profits owned by the company but also pay attention to the company's
production costs because high production costs can affect the increase in net profit while
sales with high value do not guarantee the company has a high net profit.
REFERENCES
Andri. H. K. B, Sripeni, R., dan P, R. W. (2018). Pengaruh Biaya Produksi, Biaya
Administrasi Umum, dan Biaya Pemasaran Terhadap Laba Pada Perusahaan Food
and Beverages Yang Terdaftar Di Bursa Efek Indonesia. Jurnal Ilmu Ekonomi,
Manajemen, dan Akuntansi, 7(2), 83–88. https://doi.org/10.33319/jeko.v7i2.7.
Basuki, Tri, A., dan Prawoto, N. (2016). Analisis Regresi Dalam Penelitian Ekonomi &
Bisnis. Jakarta: Raja Grafindo.
Brigham, E. F., dan Houston, J. F. (1999). Manajemen Keuangan. Jakarta: Erlangga.
Carter, W. K., dan Usry, M. F. (2014). Akuntansi Biaya. Diterjemahkan oleh Krista. Buku
1 (Edisi 14). Jakarta: Salemba Empat.
Ermaya, A. Y., Priatna, H., & Alfiani, H. (2016). Pengaruh Penjualan Bersih Dan Biaya
Produksi Terhadap Laba Bersih (Studi kasus pada PT. Aneka Tambang (Persero). AKURAT| Jurnal Ilmiah Akuntansi FE UNIBBA, 7(2), 20–26. Diambil dari
https://ejournal.unibba.ac.id/
Fauzia, M. (2018). Industri Farmasi Nasional Mengalami Perlambatan Pertumbuhan

Suzan and Nabilah R.: Effect of production Costs and Sales …
Jurnal Akuntansi/Volume XXIV, No. 02 December 2020: 169-186
DOI: http://dx.doi.org/10.24912/ja.v24i2.689 185
Bisnis. Diambil 21 Februari 2020, dari https://ekonomi.kompas.com/
Felicia, dan Gultom, R. (2018). Pengaruh Biaya Produksi, Biaya Kualitas dan Biaya
Promosi terhadap Laba Bersih pada Perusahaan Manufaktur yang Terdaftar di Bursa
Efek Indonesia Periode 2013-2015. Jurnal Ilmu Manajemen METHONOMIX, 1(1),
1–12. Diambil dari https://methonomi.net/index.php/jm/article/view/74.
Ghozali, I. (2016). Aplikasi Analisis Multivariete Dengan Program (IBM SPSS) (Edisi 8).
Semarang: Badan Penerbit Universitas Diponegoro.
Gusti, R. (2019). Menprin: Industri Farmasi Nasional tumbuh 4,46% Tahun Lalu. Diambil
20 Februari 2020, dari https://katadata.co.id/
Halawa, A. (2015). Pengaruh Biaya Promosi Dan Biaya Distribusi Terhadap Volume
Penjualan Pocari Sweat. Jurnal Ilmiah Progresif Manajemen Bisnis (JIPMB), 6(2).
Diambil dari https://e-jurnal.stie-ibek.ac.id/.
Harahap, S. S. (2011). Analisis Kritis Atas Laporan Keuangan. Jakarta: PT Raja Grafindo.
Hery. (2016). Analisis Laporan Keuangan. Jakarta: Grasindo.
Hidayanti, F., Yahdi, M., dan DP, R. W. (2019). Pengaruh Volume Penjualan dan Biaya
Operasional terhadap Laba Bersih Perusahaan (Studi Empiris Pada Perusahaan
Manufaktur Sub Sektor Makanan dan Minuman yang Terdaftar di Bursa Efek
Indonesia Tahun 2012-2016. Counting: Journal of Accounting, 1(3), 88–99. Diambil
dari http://jkm.stiewidyagamalumajang.ac.id/index.php/jra/article/view/143.
Juwita, R., dan Budiati, S. A. (2015). Pengaruh Biaya Produksi dengan Menggunakan
Metode Full Costing terhadap Laba Bersih pada Perusahaan Manufaktur di Bursa
Efek Indonesia. Jurnal Akuntansi, 7(1), 25–32. Diambil dari
https://ejurnal.poltekpos.ac.id/index.php/akuntansi/article/view/368.
Kasmir. (2013). Analisis Laporan Keuangan. Jakarta: Rajawali Pers.
Mulyadi. (2016). Akuntansi Biaya. Yogyakarta: Sekolah Tinggi Ilmu Manajeman YKPN.
Mulyana, A. (2017). Pengaruh Biaya Produksi Dan Biaya Promosi Terhadap Laba usaha
Samsung Co Tahun 2009-2015. Jurnal Manajemen Indonesia, 17(3), 185–196.
https://doi.org/https://doi.org/10.25124/jmi.v17i3.1155.
Mulyawan, S. (2015). Manajemen Keuangan. Bandung: Pustaka Setia.
Oktapia, N., Manullang, R. R., dan Hariyani. (2017). Analisis Pengaruh Biaya Produksi
dan Biaya Operasional terhadap Laba Bersih Pada PT Mayora Indah Tbk Di Bursa
Efek Indonesia (BEI). Jurnal Ilmiah Akuntansi Bisnis dan Keuangan (JIPAK),
11(2). Diambil dari https://e-jurnal.stie-
ibek.ac.id/index.php/JIABK/article/view/278.
Perindustrian, K. (2019). Kebijakan Industri Farmasi Nasional Di Era Industri 4.0.
Diambil dari farmalkes.kemkes.go.id
Putra, F. D. (2017). Pengaruh Volume Penjualan dan Biaya Produksi Kalung terhadap
Laba Pada Hidayah Shop Kuta-Badung. Jurnal Pendidikan Ekonomi Undiksha, 9(2),
462–472. https://doi.org/http://dx.doi.org/10.23887/jjpe.v9i2.20127
Putranto, A. (2017). Analisis Pengaruh Biaya Produksi dan Penjualan terhadap Laba
Perusahaan (Studi Pada Usaha Mikro Kecil Dan Menengah Di Kecamatan
Wonosobo Kabupaten Wonosobo). Jurnal Penelitian dan Pengabdian Kepada
Masyarakat UNSIQ, 4(3), 280–286. https://doi.org/https://doi.org/10.32699/ppkm.v4i3.432.
Raharjo, B. (2011). Sistem Informasi Penjualan. Bandung: Informatika.
Rustami, P., Kriya, I. K., dan Cipta, W. (2014). Pengaruh Biaya Produksi, Biaya Promosi

Suzan and Nabilah R.: Effect of production Costs and Sales …
Jurnal Akuntansi/Volume XXIV, No. 02 December 2020: 169-186
DOI: http://dx.doi.org/10.24912/ja.v24i2.689 186
dan Volume Penjualan terhadap Laba Perusahaan Kopi Bubuk Banyuatis. e-Journal
Bisma Universitas Pendidikan Ganesha Jurusan Manajemen, 2(1). Diambil dari
https://ejournal.undiksha.ac.id/index.php/JMI/article/view/4305/3329.
Sembiring, M. dan Siregar, Alifiani. (2018). Pengaruh Biaya Produksi Dan Biaya
Pemasaran terhadap Laba Bersih. Jurnal Studi Akuntansi & Keuangan, 2(3), 135–
140. Diambil dari https://ejurnal.id/index.php/jsak/article/view/190.
Simamora, H. (2013). Pengantar Akuntansi II. Jakarta: Bumi Aksara.
Simangunsong, A. B., Panjaitan, C., Hasugian, E., Sinaga, A. N., dan Hutahaean, T. F.
(2019). Pengaruh Perputaran Persediaan, Perputaran Piutang, Penjualan Bersih,
Hutang Usaha terhadap Laba Bersih Perusahaan Manufaktur yang Terdaftar di BEI
2013-2016. Jurnal AKRAB JUARA, 4(2), 115–128. Diambil dari
http://www.akrabjuara.com/index.php/akrabjuara/article/view/551.
Sitohang, H., Fahrizal, A., dan Luthfi, M. (2015). Pengaruh Pertumbuhan Modal Dan
Pertumbuhan Penjualan Terhadap Laba Bersih Pada Perusahaan Food nd Beverage
Yang Terdaftar Di Bursa Efek Indonesia Periode 2010-2013. Jurnal Riset Akuntansi
dan Manajemen Malahayati, 4(1).
https://doi.org/https://doi.org/10.33024/.v4i1.1190.
Spence, M. (1973). Job Market Signaling. The Quarterly Journal of Economics, 87(3),
355–374. Diambil dari https://www.jstor.org/stable/i305247.
Subramanyam. (2017). Analisis Laporan Keuangan financial Statement Analysis. Jakarta:
Salemba Empat.
Sugiyono. (2015). Metode Penelitian Kombinasi (Mix Methods). Bandung: CV Alfabeta.
Sujarweni, V. W. (2015). Sistem Akuntansi. Yogyakarta: Pustaka Baru Press.
Sukirno. (2013). Mikro Ekonomi Teori Pengantar. Jakarta: PT Radja Grafindo Persada.
Swastha, B. (2014). Manajemen Pemasaran. Yogyakarta: BPFE.
Wisesa, I. W. B., Zukhri, A., dan Suwena, K. R. (2014). Pengaruh Volume Penjualan
Mente dan Biaya Operasional terhadap Laba Bersih pada UD. Agung Esha
Karangasem Tahun 2013. Jurnal Pendidikan Ekonomi Undiksha, 4(1).
https://doi.org/http://dx.doi.org/10.23887/jjpe.v4i1.3293.
Y.Casmadi, & Aziz, I. (2019). Pengaruh Biaya Produksi dan Biaya Operasional terhadap
Laba Bersih PT Ultrajaya Milk Industry & Trading Company Tbk. Jurnal
Akuntansi, 11(1), 41–51. Diambil dari
https://ejurnal.poltekpos.ac.id/index.php/akuntansi/article/view/489
Zahara, A., dan Zannati, R. (2018). Pengaruh Total Hutang, Modal Kerja, dan Penjualan
terhadap Laba Bersih Pada Perusahaan Sub Sektor Batu Bara Terdaftar Di BEI.
Jurnal Riset Manajemen dan Bisnis (JRMB) Fakultas Ekonomi UNIAT, 3(2), 155–
164. https://doi.org/https://doi.org/10.36226/jrmb.v3i2.108.
Zuhra, W. U. N. (2017). Program JKN Gagal Dongkrak Laba Perusahaan Farmasi.
Diambil 21 Februari 2020, dari https://tirto.id/