what explains governance structure in non-profit and for-profit microfinance institutions?
TRANSCRIPT
Electronic copy available at: http://ssrn.com/abstract=1342427
What explains governance structure innon-profit and for-profit microfinance
institutions?
Roy Mersland∗ R. Øystein Strøm †
First version: 0602 2009
Abstract
This paper aims to explain the choice of board and CEO characteristics in mi-crofinance institutions (MFI). Explanations are sought in substitution or comple-mentarity between the characteristics, external governance variables, and financialperformance and outreach performance to the poor. The data are from 290 MFIsin 61 countries, and the logit regressions methodology is employed. The board andCEO characteristics are board size, CEO-chairman duality, international directors,and female CEO. We find relationships among these variables, and also that the ex-ternal governance variables ownership type (shareholder owned) and internationalinitialization induce smaller board, less duality, more international directors, andfewer female CEOs. Except for the female CEO result we argue that these resultsare consistent. The consistency is repeated for outreach performance to poor indi-viduals and small businesses. We believe the study may inform better performancestudies in the future, and also to motivate better governance in MFIs.
Keywords: Micro-finance organization, governance, performance
JEL classification codes: G30, G32, J23
∗Agder University College, Kristiansand, Norway†University College of Østfold, N-1757 Halden, Norway
1
Electronic copy available at: http://ssrn.com/abstract=1342427
1 Introduction
There is no lack of recommendations of how the governance of the microfinance institu-
tion (MFI) should be (Rock et al., 1998), in particular board size and composition, but
little knowledge of what actually determines the MFI’s choice of its internal governance
mechanisms. The MFI pursues the twin objectives of financial sustainability and out-
reach to the poor (Armendariz de Aghion and Morduch, 2005). In this paper, we focus
upon four board and CEO characteristics, that is, board size, CEO-chairman duality, the
presence of international directors, and the presence of a female CEO. We seek explana-
tions of their occurrence from theories of board and CEO determination. Demsetz and
Lehn (1985) argue that interdependencies exist among these characteristics, for instance,
a large board and CEO-chairman duality could be found together in boards. Therefore,
substitutability in boards is important to investigate, as in Agrawal and Knoeber (1996).
External governance mechanisms such as the MFI’s competitive position determine the
board’s size and its composition (Schmidt, 1997). For instance, Mayers and Smith (2005)
find that ownership type is a strong predictor in the US insurance industry. The MFI’s
financial performance is taken to determine the board’s monitoring effort in Hermalin
and Weisbach (1998). Raheja (2005) and Harris and Raviv (2008) can be used to under-
stand how various forms of outreach may induce a better combination of board size and
composition.
The Hermalin and Weisbach (1998) model of endogenous determination of board size
and composition represents a “Copernican revolution” in board studies in particular and
governance in particular. The new idea is that one should study the process by which
the board is put together, and not assume that the board is exogenously given. Raheja
(2005) modifies this explanation since her model implies that board size and composition
are determined by the outside information complexity in the firm’s markets. This leads to
a search for outside, exogenous explanations for board and CEO characteristics. Studies
of this type are often tailored to the particular situation that the firm is engaged in.
The data for the explanations of board and CEO characteristics are income statement and
balance sheet data on 290 MFIs from 61 countries throughout the world collected by third
party rating agencies. We employ logit regression methodology for the purpose.
To our knowledge, no investigation into determinants of MFI governance has been un-
dertaken. The Mayers and Smith (2005) study shows the importance of ownership type
(shareholder or mutual) in understanding the choice of board size and composition. Barth
et al. (2007) find that external governance mechanisms matter for performance (ROA) in
a comparison of banks from 152 countries drawn from a World Bank survey. They include
1
Electronic copy available at: http://ssrn.com/abstract=1342427
measures for accounting standards, external audits, financial statement transparency and
external ratings in their study. Although these measures are different from ours, the in-
vestigation clearly shows the importance of external mechanisms for performance. Our
concern is whether these mechanisms determine the choice of the internal governance
mechanisms of board and CEO characteristics. Also, their sample is not limited to MFIs,
but include banks in general.
A puzzling main result in Mersland and Strøm (2009) is that few governance mecha-
nisms are significant in explaining financial and outreach performance in MFIs. For
instance, the type of MFI ownership turn out to have no influence on either performance
measure. In this paper we concentrate upon the interconnections among governance
mechanisms. These may in turn give better informed models of performance in MFIs at
a later stage.
We do find substitution and complementarity effects among board and CEO character-
istics. The presence of an international director and a female CEO is associated with a
larger board, however, duality decreases with international director. Among the external
governance mechanisms the fact that the MFI is a shareholder owned firm is associated
with a smaller board, more international directors, and no female director, while being
internationally initiated helps the MFI to reduce board size and duality, and increase
the presence of international directors. We note the consistency in these relationships.
A smaller board and no duality are generally considered beneficial in the board litera-
ture, while international directors has turned out to be advantageous in studies. The
same consistent pattern is repeated for outreach performance, where individual loan, the
MFI’s gender bias towards loans to women, and its number of loan products are impor-
tant. Thus, we do not find one theory to explain the occurrences of board and CEO
characteristics. An empirical researcher needs to be eclectic, but also needs to look closer
at the interactions among various governance mechanisms as well as their relations to
outside market conditions when setting up performance models.
The paper proceeds as follows. The next section 2 gives an overview of the hypotheses
we test. Section 3 gives an overview of the data from 61 countries together with descrip-
tive statistics on the variables we use. In the following section 4 the logistic regression
approach is discussed. Section 5 tests hypotheses first by simply comparing means on the
individual variables, and then performing the partial logit regressions with each of the four
board and CEO characteristics as dependent variable. Finally, section 6 concludes.
2
2 MFI governance
The central question in this paper is why an MFI chooses the set of governance mecha-
nisms it does. Before answering, we need to be explicit as to what governance mechanisms
we choose to focus on. Mersland and Strøm (2009) differentiate between internal and
external governance mechanisms. The internal mechanisms are board and CEO charac-
teristics and include variables such as board size, CEO-chairman duality, international
director, internal board auditor, and female CEO. To this list, the MFI’s incorporation,
or its ownership type, is included as well. The external mechanisms are competition and
bank regulation. In this paper, we focus upon the explanation of the internal governance
mechanisms apart from the ownership type. The reason for this is that the MFI’s incor-
poration as well as its regulation and competitive exposure are exogenous to the choice
of internal governance mechanisms. For instance, the ownership type is seldom changed,
and once changed, the MFI is likely to maintain its new incorporation for a long time.
In contrast, board size may well change from one year to the next. Thus, ownership type
and external governance mechanisms can be important predictors for board and CEO
characteristics, but hardly the other way around.
To sum up we will focus upon the board and CEO characteristics board size, CEO-
chairman duality, international director, and female CEO. In one way or another, these
variables turn out to be significantly related to MFI financial performance or outreach in
Mersland and Strøm (2009), and most are suggested in former studies. Yermack (1996)
and Eisenberg et al. (1998) find that a smaller board is associated with higher financial
performance, a result that later studies routinely confirm; Brickley et al. (1997) find
no performance difference between firms with CEO-chairman duality compared to firms
with split roles; and Oxelheim and Randøy (2003) report that higher performance follows
in firms having international directors. We include the female CEO variable since Allen
and Gale (2000) caution about the effectiveness of monitoring; they note that the board’s
monitoring is often ineffective due to the firm’s financing out of retained earnings. Owners
may find it advantageous to yield control to the CEO. Table 1 gives definitions and main
statistics for the dependent variables.
Table 1
Thus, the average number of board members is 7.5 and 24.6 per cent of CEOs are fe-
male.
Are board and CEO characteristics substitutes? The next table shows the correlations
of the four board and CEO characteristics that enter the analysis in this paper.
3
Table 2
We see some significant correlations, especially between board size on the one hand and
the female CEO and international directors on the other. Likewise, the relation between
the CEO-chairman duality and international directors is significant. However, we cannot
conclude from this that the CEO and board characteristics are substitutes (with negative
sign) or complements (with positive signs). The correlations are very low. According to
Kennedy (2008) the bivariate correlations need to be higher than 0.70 for variables to be
dependent. Thus, it seems board and CEO characteristics are chosen independently of
each other. We include the variables in regressions, since significant relationships may
appear when other variables are controlled for.
The tables reveal that a number of variables have few observations. These are time
invariant variables, that is, their value is constant for the four years of rating data. This
applies to the governance variables. Most of these variables will be constant over the
relatively short four year span. However, board variables may be easily changed. In fact,
this gives a further reason for converting the board size into a dummy variable, since the
change from a small board size into a large is less likely than a change, say, from five to
six members.
We explore hypotheses concerning internal governance mechanisms on board and CEO
characteristics, external governance mechanisms, and the effects of following the dual
objectives of financial performance and outreach to the poor. Demsetz and Lehn (1985)
hold that governance mechanisms are substitutes. The firm will choose its internal gov-
ernance mechanism so that the marginal utility of each are equalised. This implies some
dependence among the mechanisms. Thus, if the firm uses more of one mechanism, it
may be advantageous to increase or decrease the use of other. In the first case the mech-
anisms are substitutes, in the second they are complements. A small board, separate
chairman and CEO, international directors, and a female CEO may be good governance
mechanisms in an MFI. But the Demsetz and Lehn (1985) theory does not indicate how
their relationship may be. We turn to other explanations now.
External governance mechanisms concern the MFI ownership type, bank regulation,
international connections, and competition. The Mayers and Smith (2005) argue that
the mutual company has no owners and therefore lack some important governance mech-
anisms, such as the takeover opportunity. Hence, the mutual company strengthens other
governance mechanisms, notably the presence of independent directors. In our case, we
should expect that being an SHF leads the MFI to try avoiding agency problems as
in other shareholder owned firms with a dispersed ownership. Thus, we should expect
4
the SHF MFIs to have smaller boards, no duality, international directors, and a female
CEO.
Likewise, regulation supposedly has the same effects upon internal governance mecha-
nisms. Good governance is part of the Basel II requirements. Thus, the regulated MFIs
must show more transparency, but also assure regulators that their board and CEO act
responsibly.
International donors, shareholders, and lenders are important in microfinance. They
may require a transparent governance structure to be assured that money is safe and well
spent. For instance, many international financial institutions require transparency and
a recognizable governance structure in the MFIs they are dealing with. This has hardly
been elucidated before. But, from Tirole (2006), lenders’ impact can be important,
especially in mitigating the moral hazard problem. The Easterbrook (1984) argument is
really that by increasing the debt equity ratio the bank gets more involved in the running
of the firm. Thus, we should expect international debt to have the same advantageous
effect in MFIs.
Competition motivates the MFI to find beneficial governance structures. Thus, if the MFI
faces strong competition or takeover threats, its oversight efforts may become more lax
(Schmidt, 1997). The idea is that the firm needs to be well run to withstand competition,
and therefore, internal monitoring has little to contribute to further improvement in
company operations. Perhaps paradoxically, this leads to the prediction that the internal
governance mechanisms are weaker the stronger is competition. Weak internal board
monitoring in USA is explained by this. However, one could reason the other way around.
When competition is strong, the firm needs to be well run in all aspects, including its
internal monitoring. Thus, the prediction from this variable is uncertain.
Financial performance may determine the choice of governance mechanisms (Hermalin
and Weisbach, 1998). Their theory says that a CEO may be in a position to negotiate
for laxer oversight after delivering good firm performance. The position may be used to
people the board with persons who are friendly to the CEO. Thus, with continued good
performances the board becomes “endogenously determined” and the CEO entrenched.
The prediction from this theory in our context is that internal governance mechanisms
are weaker in MFIs with good financial performance.
Outreach performance is the extent to which the MFI is able to serve poor customers
and small enterprises. The MFI usually has two main goals, financial sustainability and
outreach to poor people. The outreach measures that the MFI follows may also have
consequences for the MFI’s choice of board and CEO characteristics. Armendariz de
5
Aghion and Morduch (2005, p. 267) mention that the outreach goals may be hard to
measure. On the other hand, the choice of outreach is at the same time the MFI’s choice
of business model, or its choice of market conditions it is facing. For instance, the MFI
may choose to focus upon female borrowers. This means we may use insights from this
field in the discussion of outreach impact.
Raheja (2005) presents a model of board size and its fraction of independent, that is,
outside directors when market conditions are important. More outside directors mean
more monitoring. However, this monitoring is ineffective if insiders do not share their
information with outsiders. Thus, the fraction of outsiders is higher the more important
the outside information. This will vary with the firm’s business condition. In our context,
an MFI operating in different financial products may need a larger board to accommodate
the various information needs. In general, the internal governance mechanisms may vary
with the market conditions facing its business. Harris and Raviv (2008) present a more
general theory yielding the same predictions1.
In this paper, we use the size of the average loan, lending methodology (group or indi-
vidual), the MFI’s conscious gender bias, the number of loan products, and the markets
served (mainly urban or rural) as indicators of outreach or business model. It may be
that the MFI’s ability to tap into local information networks, for instance by giving group
loans, necessitates better internal governance. If the bank lends mainly to women, we
should expect the MFI to prefer a female CEO, who may be better informed of this cus-
tomer segment’s banking needs than a male CEO. Monitoring of the loan contract may
call for better risk management expertise in an urban than a rural setting. The urban
borrower has more borrowing alternatives, and monitoring performed by neighbours and
relatives are not as effective as in the rural villages.
Absent from this analysis are stakeholder variables. For instance, a plausible hypothesis
is that the presence of employee directors may cause owners to strengthen their position
in the board, as Strøm (2009) finds for Norwegian boards. However, few MFIs state
employee directors on the board, making the records unreliable. Among those who do
state the number, very few have employee directors. The same goes for other stakeholders.
This is perhaps surprising, since one of the assumed benefits of the MFI is its ability to
tap into local information networks. Having stakeholders on the board could improve the
MFIs access to local information even further.
1In a literature review Hermalin and Weisbach (2003) note that the theory of the board is littledeveloped, and the field remains largely empirical. Yet, theories of the determination of the board arenumerous, we should also add Adams and Ferreira (2007), but the empirical literature on the determi-nation of boards is short.
6
We also leave out debt. Easterbrook (1984); Jensen (1986) suggest the debt to equity or
to assets as governance mechanisms. This interpretation may be difficult to uphold in
banking organisations, as they may as well be a measure of the bank’s riskiness.
3 Data
We use observations of 290 rated MFIs from 61 countries. Third-party organisations
perform the standardised ratings and outside organisations subsidize parts of the costs
involved (www.ratingfund.org). A main motive behind submitting to a rating is the
improved access to external funding. The third-party and standardised collected MFI
data from the rating agencies must be judged better than self-reported data, as found for
instance in the Mixmarket database. The data cover both financial and outreach data,
that is the income and balance reports and data on key outreach aspects. At each rating
four years of data are obtained, at best. Thus, the maximum number of observations is
1160. The ratings are performed in the period 2001 to 2007, which means that we have
data from 1998 to 2007. Most data are from the period 2001 to 2005.
The dataset contains information from risk assessment reports from five microlender
rating agencies, MicroRate, Microfinanza, Planet Rating, Crisil, and M-Cril, and their
reports can be found at www.ratingfund.org. All five are approved as official rating
agencies by the Ratingfund of the C-GAP. Their rating methodology reveals no major
difference in MFI assessment relevant to variables used in this study. When necessary,
all entries in the dataset have been annualised and dollarised using official exchange
rates.
The use of rating data may introduce sample selection bias. Few larger regulated microfi-
nance banks are included in the dataset, since they have funders who demand traditional
credit ratings offered by agencies such as Standard & Poor’s. Moreover, neither the vir-
tually endless number of small savings and credit cooperatives nor development programs
offering microcredit solely as a social service are included. The 290 MFIs in the dataset
represent commercial and professionally oriented institutions that have decided to be
rated to improve access to funding, benchmark themselves against others, and increase
transparency (see www.ratingfund.org). Despite these limitations, we consider our third
party collected data to be more reliable than self-reported data sources like Mixmarket
(www.mixmarket.org) or questionnaires. Compared to the MFIs included in Mixmarket
Annual MFI Benchmarks (2006), the MFIs in our sample are younger (7 vs. 9 median
years), smaller (median total assets USD 2.9 million vs. USD 6.2 million), have fewer
7
credit clients (4,900 vs. 10,000), and have smaller loan portfolios (USD2.1 million vs.
USD4.4 million), yet the median average loan is approximately the same (USD433 for
our dataset vs. USD456 for the Mixmarket data). Comparing averages between the two is
not meaningful, since the Mixmarket data contain more of the very large MFIs. Overall,
our data seem sufficiently representative. Specifically, we avoid a large firm bias.
3.1 Variable definitions and stylized facts
We need to define the variables used in the analysis before proceeding. This also gives
us the opportunity to supply some stylized facts about MFIs in our data sample. Since
little is known on a global scale, it seems worthwhile to give an overview.
The dependent internal governance mechanism variables are converted to binary variables,
if they are not already. Thus, the board size and the international director variables are
both taken to be binary. We note from table 1 that the average board size is 7.5. The
median is seven. We take the cutoff to be the median, thus, a small board is defined
to include all sizes from the lowest and including seven, the large board size from eight
and up to the maximum of 33. Many MFIs do not have international directors. Their
presence is marked with a dummy being 1 if the MFI has one or more international
directors.
Table 3 gives an overview of the independent variables in the analysis with definitions
at the bottom. The median is supplied as well since many variables are not normally
distributed.
Table 3
The table may be read as a short introduction to microfinance. The industry is notable
in terms of ownership type, regulation, its international dimension, loan size, and main
customer groups. In table 3 the SHF is a dummy variable indicating ownership type.
In fact, the MFIs comprise a number of ownership types, that is, a bank, a non-bank
financial institution, a non-governmental organization (NGO), a cooperative or credit
union, a state bank, and an “other” category. The SHF is defined to be the bank and
the non-bank financial institution. At 57.9 per cent the NGO is by far the largest group,
followed by the bank and non-bank financial institution at 28.3, and the cooperative and
credit union at 11.1 per cent. The remaining categories are only 2.7 per cent of the
sample. Thus, the partition into SHFs and others is a natural choice, since the other
organizational types do not have the same clear ownership structure.
Most MFIs are not regulated, in fact, only 30.2 per cent are under official regulation.
8
This is largely the case since most MFIs in our sample do not accept deposits, but it is
not a perfect overlap between deposit banks and regulated banks. All firms in our sample
is somewhat regulated, in that their accounts are transparent.
Many MFI are founded by international organizations, in fact, 37.6 per cent. We use
this variable as a proxy for international lenders’ influence. The reason for doing so is
the data situation. We have some data on international commercial and subsidized debt,
and on total debt. However, these data do not cover all firms, and further, they are not
as reliable as one would wish. For instance, the rating agencies give different definitions
of a subsidized loan.
The competition variable gives the MFI’s perceived competitive pressure in its market
on a one to seven point scale. The scale is self-constructed from the various scaling
conventions followed by the rating agencies. The measure is subjective in the sense that
it shows the MFI manager’s perceived competitive pressure in its market. The higher
is the score the higher the perceived competition. The table shows that most managers
perceive the competition to be above the 3.5 middle point.
The average loan variable shows the “micro” in microfinance. The average loan is USD
689, and the median is even lower. Besides being small, the loans are given with a short
duration, as practically all contracts are of less than a year’s duration. This fact removes
problems of periodization of the loan effect. Average loan is a prime outreach measure,
and the expectation is that the lower the loan the higher is “depth” outreach (Schreiner,
2002). Furthermore, despite microfinance is known for reviving group loan (Ghatak and
Guinnane, 1999), most of the loans are made to individuals. In our sample about 51 per
cent of the loans are to individuals.
Many MFIs favour women in their lending programme. For instance, the Grameen Bank
focusses to a major extent on women. In our sample, MFIs that report the percentage of
female clients tell that women constitute about 70 per cent of their borrowers, however,
very few report their percentage of female customers. Accordingly, we use the MFI’s
gender bias as a proxy for the actual lending to women. Table 3 shows that nearly half of
the firms have gender bias, that is, a bias for favouring female customers. This outreach
measure belongs to the depth outreach dimension as well, since women are generally
poorer than men, and their use of the loan includes family and community to a larger
extent than men’s (Armendariz de Aghion and Morduch, 2005).
The last outreach measure is rural or urban lending. The categories are mainly rural or
mainly urban, and a third category including both. Table 3 shows that most MFIs do
not lend mainly to urban borrowers.
9
The remaining variables are control variables. The first is an uncertainty measure, port-
folio at risk showing the percentage of loans 30 days or more in arrears. The low number
reflects the finding that the “poor always pay back” as early employees Dowla and Barua
(2006) of the Grameen Bank indicate. The MFI age variable shows the MFI is a fairly
young organization. The firm size variable shows a large dispersion of the MFIs’ size.
The Human Development Index (HDI) is a comparative measure of life expectancy, lit-
eracy, education and standards of living for countries worldwide. It is a standard means
of measuring well-being, especially child welfare. It is used to distinguish whether the
country is a developed, a developing or an under-developed country, and also to measure
the impact of economic policies on quality of life2.
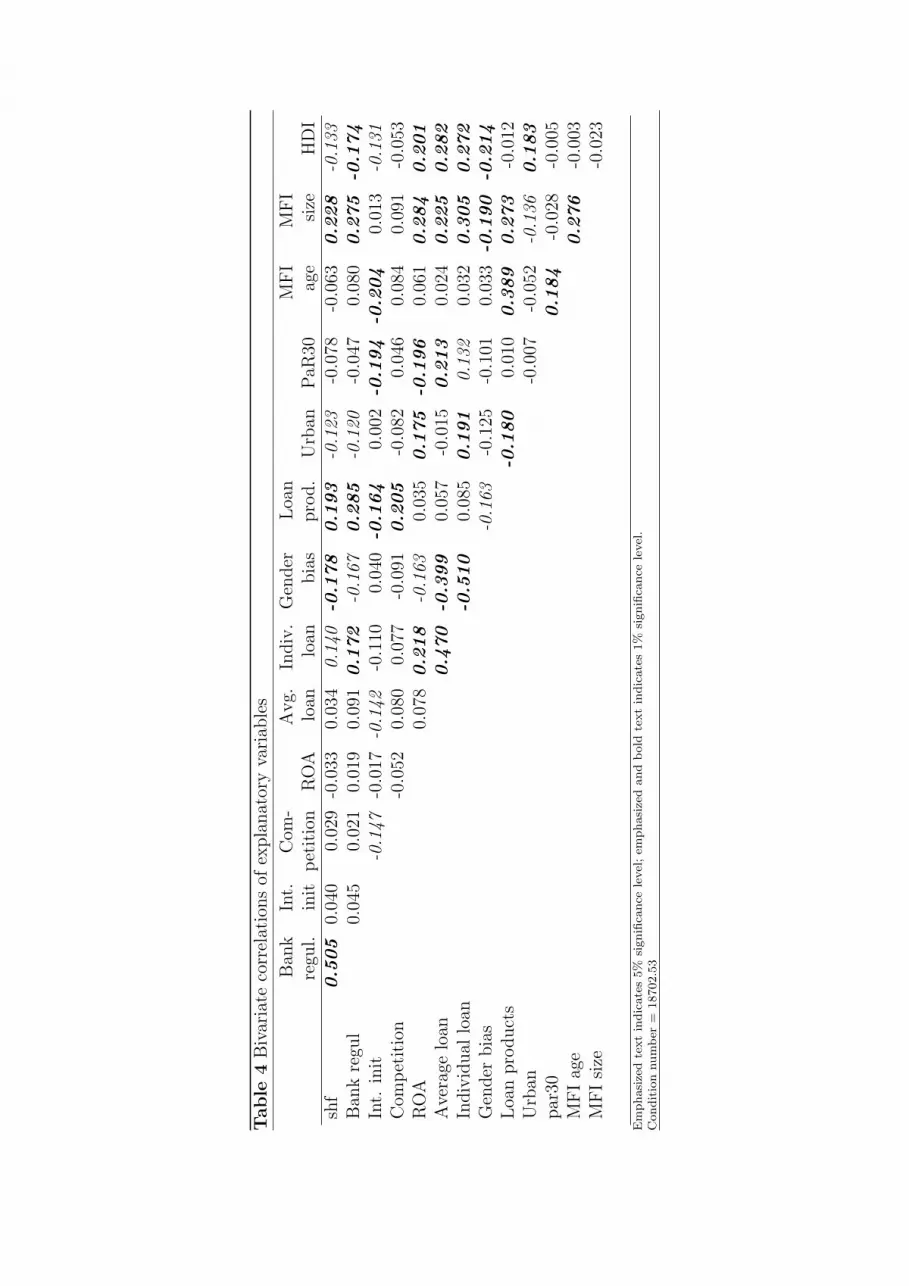
When using a number of explanatory factors, there is always the danger of multicollinear-
ity among the explanatory variables. A first check on this problem is to run a correlation
analysis of the variables.
Table 4
None of the correlations reach the 0.70 cutoff that Kennedy (2008) sets, but two are
above 0.50. These are the correlations between the SHF dummy and bank regulation,
and between individual loan and gender bias. However, these are too few and too low
to invalidate the regressions using these as explanatory variables. Specifically, we note
the low correlations between financial and outreach performance variables. ROA is sig-
nificantly correlated to individual loans and to the urban dummy only, and these are
at low levels. Thus, it is valid to use both performance variable sets together in the
analysis.
4 Methods
The many interrelationships among governance variables could mean that we use a simul-
taneous equations setup as in Agrawal and Knoeber (1996) and Strøm (2009). However,
we will follow a simpler procedure by running separate logistic regressions for the internal
governance mechanisms. Since the governance model is unknown, a simultaneous spec-
ification may be faulty, however complex. If an equation in the system is erroneously
specified, the error will contaminate the other equations too (Hayashi, 2000). With sep-
arate regressions, the error stays with the single equation.
2We use a list of countries by Human Development Index as included in a United Nations DevelopmentProgram’s Human Development Statistical Update released on December 18, 2008, compiled on the basisof data from 2006. The new list contains purchasing power parity (PPP) adjustments. The index wasdeveloped in 1990 by Pakistani economist Mahbub ul Haq and Indian economist Amartya Sen.
10
To estimate the probability that the loan methodology is individual loan the probit
method, applied to panel data, is used. The binary choice logit model may be writ-
ten
P (Y = 1|X) =eXβ
1 + eXβ(1)
where P is probability, Y is an internal governance mechanism, X is the set of explanatory
variables, and β is the vector of parameter estimates.
The logistic distribution has somewhat fatter tails than the standard normal distribu-
tion. Two common assumptions are added to the estimating function. The first is that
the internal governance mechanism variables are independently distributed across time
t conditional on the explanatory variables and unobserved firm heterogeneity. The sec-
ond assumption is that unobserved firm heterogeneity is normally distributed with zero
mean and a fixed standard deviation. With these assumptions in hand, we estimate the
relationship with maximum likelihood methods.
Our data cover up to four years of records for each MFI, that is, we have a panel data
structure. However, we may not use well-known methods for panel data, such as fixed
effects or random effects estimation. The logit models meet with the incidental parameters
problem (Woolridge, 2002, p. 484) when assuming a fixed effects model and performing
within transformations, leading to inconsistent estimates. Furthermore, panel estimation
with the random effects model requires very strong assumptions about the heterogeneity.
For these reasons, the panel data methods are dropped. To control for firm heterogeneity
as much as possible we introduce the HDI, which is unique to each country and thus
controls for country effects.
Woolridge (2002) recommends a full range of fixed effects and time dummies in logistic
regression on panel data. We tried, but find little difference to regressions without. Thus,
adding dummies for countries do not improve estimations, and are accordingly dropped.
Neither do we control for time effects in the main regressions. Unreported robustness re-
gressions with nine year dummies show that results are little perturbed. Since unobserved
firm heterogeneity cannot be removed, the coefficient values will be biased. However, the
coefficients will show the correct direction of impact of each explanatory variable.
We test for mis-specification for each independent variable by the Lagrange multiplier
(LM) test, in effect testing whether excluding the variable improves estimation. The
goodness of fit of the specified relation is tested with the likelihood ratio (LR) statistic
2 (Lur − Lr). Here, the Lur is the unrestricted model, that is, the regression with the
assumed independent variables, and Lr is the restricted regression, which we take to be
11
the constant in the regression. We also report the ”pseudo” R2Nag = R2/R2
max where
R2max = 1− [L(0)]2/N , and
R2 = 1− L(0)
L(β̂)
2/N
Here, L(0) is the likelihood of the model with only the intercept, L(β̂)
is the likelihood
of the estimated model and N is the sample size. The pseudo R2 is distributed between
zero and one. Lastly, we also report the percentage correctly classified.
5 Statistical evidence
This section gives an overview of the test results for the assumed relationships. We start
with a simple ANOVA test and then present results from the logit regressions.
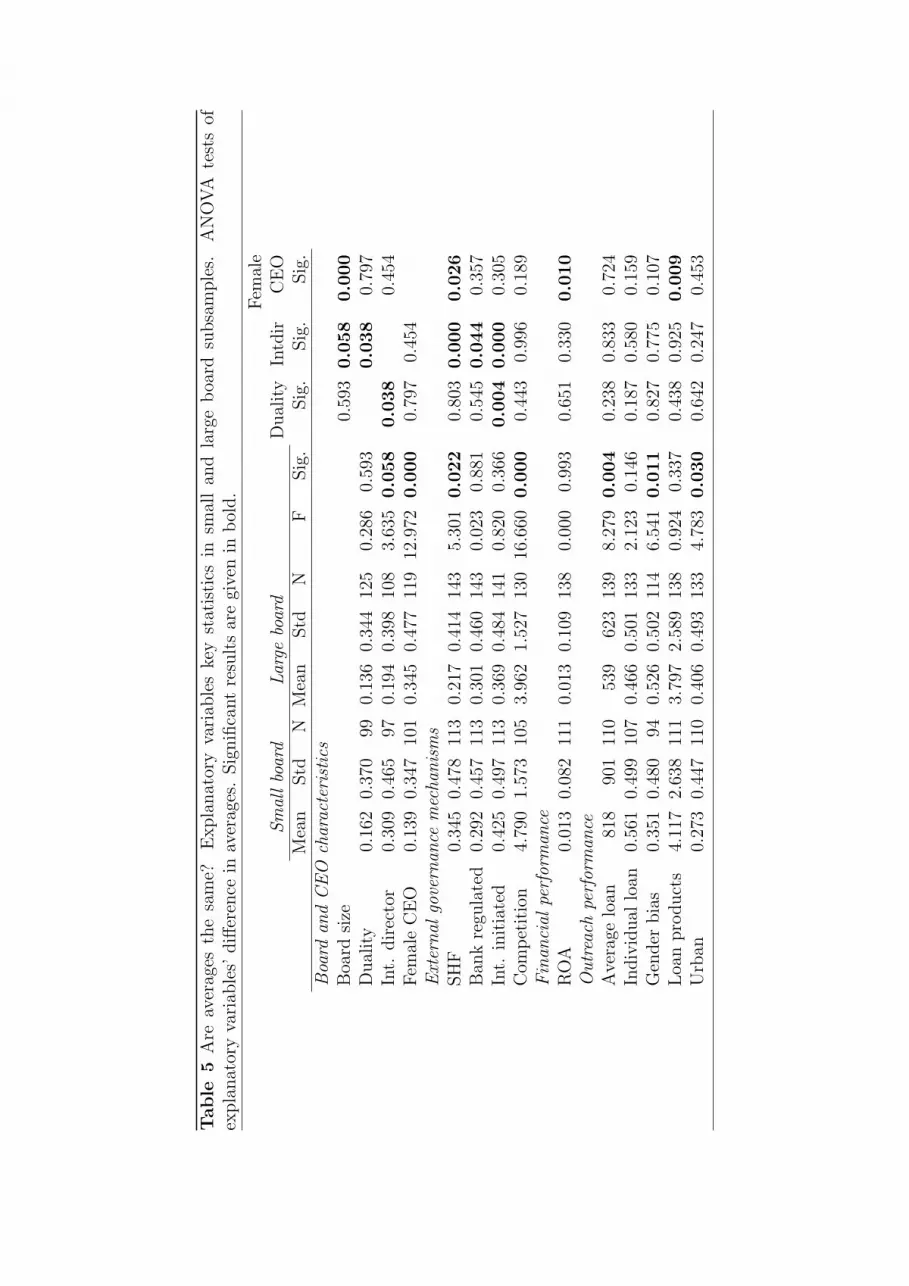
5.1 Partial ANOVA tests
The ANOVA analysis is a simple variable by variable test of average differences. The
tests may give an indication of importance that the single variable may have for the
chosen board or CEO characteristic. To show such tests for all board and CEO char-
acteristics is beyond the scope of this paper. Table 5 gives the test for the board size.
Then the remaining three columns show the significance of the other three dependent
variables.
Table 5
The ANOVA tests show several significant results. First of all, we notice important
relationships between the board and CEO characteristics, indicating that substitution
or complementarities exist among the variables. Furthermore, significant results appear
often for the external governance mechanisms. Thus, the choice of board and CEO
characteristics is at least partially driven by the slowly changing outside governance.
Then the financial and outreach performance measures show some significant results, but
perhaps surprisingly few. For instance, one would expect ROA to show more significant
results if the Hermalin and Weisbach (1998) theory of endogenous determination of board
composition and size is to hold.
All in all, the results from table 5 are encouraging for the further analysis.
12
5.2 Logit regressions
What can logit regressions tell us about substitution among board and CEO variables,
the impact of external governance mechanisms, and the role of financial and outreach
performance? Table 6 gives an overview of regressions when the board and CEO variables
alternate as dependent variable.
Table 6
First of all, the table shows satisfactory goodness-of-fit statistics. Thus, the relations
seem to explain the overall variations in the board and CEO characteristics fairly well.
We also note that most of the significant results belong to our explanatory variables, and
not to the control variables. For instance, firm size is significant in only one relation.
The results for the board size as well as the other board and CEO characteristics largely
overlap the results in table 5 for differences in averages in large and small boards.
Let us look at the board and CEO substitution issue. Board size turns out to be positively
related to international directors and to female CEO. International directors and CEO-
chairman duality are negatively related. How can we interpret these results? From the
general literature on boards, a large board and CEO-chairman duality are seen as inferior
governance arrangements. The results from Mersland and Strøm (2009) indicate that
an international director has a neutral influence upon performance, and that a female
CEO has a positive impact upon financial performance. Thus, it seems that a larger
board needs to be balanced with international directors and a female CEO. Or, otherwise
stated, the weaker oversight implied by a larger board needs to be compensated by
international directors and a female CEO. Likewise, a CEO-chairman duality needs to be
compensated with international directors. Together these results indicate that board and
CEO characteristics are chosen in conjunction, confirming the Demsetz and Lehn (1985)
proposition and results in Strøm (2009). It is interesting to note that these relationships
hold for the young MFI organizations as well.
Do external governance mechanisms impact upon board and CEO characteristics? The
two important variables are SHF, that is, the MFI’s incorporation, and international
initiated. Thus, when the MFI is shareholder owned, it tends to have a smaller board,
international directors, but no female CEO. We obtain no significant result for CEO-
chairman duality. Notice that again these results are consistent to some degree. When
the shareholder owned firm improves monitoring by holding a smaller board, the need
for a female CEO decreases at the same time. The same does not apply to international
directors. The reason may be that shareholder owned firms are large and international,
and therefore, find it advantageous to have international members on the board. In
13
our sample, 43.3 per cent of the shareholder owned firms have international commercial
debt, and the percentage for other organizational forms is 35.8. But for the international
subsidized debt, the numbers are the opposite; 41.8 per cent for the shareholder owned
MFIs, 48.4 per cent for other organizational forms. Although none of these differences
are significant using a χ2 test, they may be an indication that the shareholder owned firm
needs an international presence on the board.
The other important external governance mechanism is international initiation. When
the MFI is initiated by an international body, it tends to have a smaller board, no
CEO-chairman duality, and, not surprisingly, international directors. Again we note the
consistency of the results for board size and CEO-chairman duality. Thus, both the SHF
and the international initialized MFI results confirm expectations from general agency
theory built on the assumption of a potential conflict between owners and board and the
CEO. It seems that these two organizational aspects are carriers of the good governance
practices developed for Western companies, as set out in for instance OECD (2004).
We also note that bank regulation has importance for the female CEO only, and that
competition is nowhere significant. For bank regulation this is not as expected. One
would believe bank regulation to have an impact at the board level, since governance
issues are stressed in recent bank regulation (Greenbaum and Thakor, 2007, p. 499-515).
Here, it turns out that the impact comes at the CEO level. Perhaps the explanation is
that in those MFIs that are at all regulated (30.2% in our sample), the regulation is soft
and does not extend to governance.
The Hermalin and Weisbach (1998) theory of endogenous board determination is tested
using the ROA. We do not find any significant results for the board variables, but for
the female CEO. Thus, better firm performance is associated with a female CEO in
MFIs. The surprise is that no effect is found at the board level, since the theory makes
strong predictions about this. However, the Hermalin and Weisbach (1998) theory says
that former performance determines the present board size and composition. We test
for this by lagging ROA one period and performing regressions on all four board and
CEO characteristic using this specification. None of the regressions, including the one
for female CEO, gives a significant result for the lagged ROA. When lagging, we loose a
number of observations, in fact, the number is reduced to 265. Despite this lower number,
almost all other significant results are unperturbed relative to table 6, that is, they are
robust to a different variable specification. Thus, we cannot confirm the Hermalin and
Weisbach hypothesis. The upshot is that the CEO is not able to determine the choice of
board size and composition in the MFI, but that this choice is guided by the choice of
other governance mechanisms, and as we shall see, by outreach performance.
14
Now, the outreach performance shows a number of interesting results. The regressions
tell that the board size is reduced when the MFI has a conscious gender bias and offer
more loan products; that CEO-chairman duality is reduced with a conscious gender bias,
more loan products, and individual lending, but is increased with mainly urban lending;
and that MFI more often have international directors when it offers mainly individual
loans and has a conscious gender bias. Again we note the consistency in the results.
For instance, gender bias induces a smaller board, less CEO-chairman duality, and more
international directors. This pattern of impacts is repeated for the other market condition
variables as well. On the other hand, only the number of loan products impacts upon
the choice of female CEO, and lending mainly to urban customers leads to more CEO-
chairman duality. The last is perhaps surprising, as we should expect an MFI’s conscious
gender bias would lead the MFI to look for a female CEO.
Both Raheja (2005) and Harris and Raviv (2008) stress the need for information when
they explain that board size and composition are determined by market conditions. The
results in table 6 bear this out. For instance, one would expect better risk management
in an MFI giving individual loan since the bank must perform most of the monitoring of
the loan contract on its own, while with a group loan a large part of the monitoring is
transferred to the group members’ mutual oversight. Accordingly, the internal governance
in the MFI situated in an individual loan market needs to be better than the MFI in
the group loan market. In the case of gender bias the board needs to be more efficient
because the information from customers may not be as easily obtainable from the female
customers, who are most often the poorest of the customers. In addition to information
needs, the poorest customers also give the MFI the smallest margins. Thus, to stay in
business, the MFI targeting women simply needs to be cost effective. Last, increasing
the number of loan products indicates a greater information complexity in the MFI’s
operations. This increases the need for good internal governance, and thus should induce
the adaptations that we observe.
5.3 Robust results?
Multivariate analyses are notoriously difficult to perform. Despite the relatively low cor-
relation coefficients in table 4, interactions may appear when variables are run together.
This is the problem of multicollinearity, that is, the explanatory variables are dependent.
One way to check for multicollinearity is to see if the results are robust to different model
specifications. This is done in table 7 where only each group of explanations is taken at
the time together with the control variables. The results for the control variables are not
15
reported for readability.
Table 7
Compared to table 6 the results in table 7 are clearly different. However, the main
results from table 6 remain in terms of the direction of association and significant results.
The substitution effects are as before. The board size is positively associated with a
female CEO, and the CEO-chairman duality is negatively associated with international
directors. In the external governance group the two important variables SHF and the
international initiated are as in table 6. The conspicuous new finding in this group is
that competition shows significant results. The financial performance, ROA, gains one
significant result when run alone together with the control variables, while the outreach
performance variables show only minor differences in signs and significance. The size
of the coefficients are of minor importance since with panel data only the direction of
association and its significance can be ascertained.
Another possibility is that the panel data property upset the results in both 6 and 7.
The general problem with panel data is that residuals are not independent if the ordinary
least squares method on pooled data is used. However, if we run the models using the
averages of variables, few differences to the main results appear. These regressions are
not reported.
Thus, we cannot rule out multicollinearity in the results. However, this is often the
compromise one has to live with in this kind of research. We often want to keep variables
in the estimating model even when it may cause multicollinearity. The choice is not
between no or some multicollinearity, but what level of multicollinearity one is willing to
accept. Taken together, we are confident that the main results in this paper stand.
6 Conclusions
The main results may be summarized as follows. First, board and CEO characteristics
are substitutes and complements in the formation of board composition and size. This
confirms Demsetz and Lehn (1985) theory that internal governance mechanisms are cho-
sen in conjunction so as to harmonize with each other. Second, the external governance
mechanisms are important in understanding the choice of board and CEO characteris-
tics. The MFI’s ownership type and international initiation favour smaller board and
international directors. Third, the financial performance does not endogenously deter-
mine board characteristics (Hermalin and Weisbach, 1998), instead, there is a link to the
MFI’s choice of female CEO. Fourth, outreach performance is more important for the
16
associations to board and CEO characteristics than financial performance. We put this
down to different information needs when the MFI aims to reach out to specific customer
groups, such as women. Models in Raheja (2005) and Harris and Raviv (2008) predict
these outcomes. Fifth, we find consistency in the relationships between variables and
board size and composition. Thus, when the variable is negatively associated with board
size, it is positively related to international directors and female CEO.
The results from this study are in line with those that Mayers and Smith (2005) find
for mutual and shareholder owned insurance companies, and the evidence in Barth et al.
(2007) on an international sample of banks.
The implications following from these results are first of all, researchers should take
account of the relationships existing between different governance mechanisms when in-
vestingating the impact upon performance. For instance, Mersland and Strøm (2009)
find that ownership type plays no role in explaining financial performance in the MFI.
But perhaps the effect is indirect, say through its influence in reducing board size. An-
other implication is that the MFI should balance its board in several dimensions; first, it
should find a balance between different board and CEO characteristics, second, this in-
ternal balance should address the needs existing among external governance mechanisms
and the chosen customer segment.
17
References
Adams, R. B. and D. Ferreira (2007, Feb). A theory of friendly boards. Journal of Finance 62 (1),217–250.
Agrawal, A. and C. R. Knoeber (1996, Sep). Firm performance and mechanisms to controlagency problems between managers and shareholders. Journal of Financial and QuantitativeAnalysis 31 (3), 377–397.
Allen, F. and D. Gale (2000). Corporate Governance and competition, Chapter 2, pp. 23–84.Cambridge: Cambridge University Press.
Armendariz de Aghion, B. and J. Morduch (2005). The Economics of Microfinance. Cambridge:MIT Press.
Barth, J. R., M. J. Bertus, V. Hartarska, H. J. Jiang, and T. Phumiwasana (2007). A cross-country analysis of bank performance: the role of external governance. In B. E. Gup (Ed.),Corporate Governance in Banking, Chapter 8, pp. 151–183. Cheltenham, UK: Edward ElgarPublishing.
Brickley, J. A., J. L. Coles, and G. Jarrell (1997). Leadership structure: Separating the CEOand chairman of the board. Journal of Corporate Finance 3 (3), 189–220.
Demsetz, H. and K. Lehn (1985, Dec). The structure of corporate ownership: Causes andconsequences. Journal of Political Economy 93 (6), 1155–1177.
Dowla, A. and D. Barua (2006). The Poor Always Pay Back. The Grameen II Story. Bloomfield,USA: Kumarian Press, Inc.
Easterbrook, F. H. (1984, Sep). Two agency-cost explanations of dividends. American EconomicReview 74 (4), 650–59.
Eisenberg, T., S. Sundgren, and M. T. Wells (1998). Larger board size and decreasing firmvalue in small firms. Journal of Financial Economics 48, 35–54.
Ghatak, M. and T. W. Guinnane (1999). The economics of lending with joint liability: Theoryand practice. Journal of Development Economics 60, 195–228.
Greenbaum, S. I. and A. V. Thakor (2007). Contemporary Financial Intermediation. Amster-dam: Elsevier.
Harris, M. and A. Raviv (2008). A theory of board control and size. Review of FinancialStudies 21 (4), 1797–1832.
Hayashi, F. (2000). Econometrics. Princeton and Oxford: Princeton University Press.
Hermalin, B. E. and M. S. Weisbach (1998, Mar). Endogenously chosen boards of directors andtheir monitoring of the CEO. American Economic Review 88 (1), 96–118.
Hermalin, B. E. and M. S. Weisbach (2003, Apr). Boards of directors as an endogenouslydetermined institution: A survey of the economic literature. Economic Policy Review 9 (1),7–26.
18
Jensen, M. C. (1986). Agency cost of free cash flow, corporate finance and takeovers. AmericanEconomic Review 76, 323–339.
Kennedy, P. (2008). A Guide to Econometrics (6th ed. ed.). Oxford, UK: Blackwell Publishing.
Manne, H. (1965). Mergers and the market for corporate control. Journal of Political Econ-omy 73, 110–120.
Mayers, D., A. Shivdasani, and C. W. Smith (1997). Board composition and corporate control:Evidence from the insurance industry. Journal of Business 70 (1), 33–62.
Mayers, D. and C. W. Smith (2005). Agency problems and the corporate charter. Journal ofLaw, Economics, and Organization 21 (2), 417–440.
Mersland, R. and R. Ø. Strøm (2009). Performance and governance in microfinance institutions.Journal of Banking & Finance.
OECD (2004). OECD Employment Outlook. Paris: OECD.
Oxelheim, L. and T. Randøy (2003). The impact of foreign board membership on firm value.Journal of Banking & Finance 27 (12), 2369–2392.
Raheja, C. G. (2005). Determinants of board size and composition: A theory of corporateboards. Journal of Financial and Quantitative Analysis 40 (2), 283–306.
Rock, R., M. Otero, and S. Saltzman (1998). Principles and practices of microfinance gover-nance. Microenterprise Best Practices.
Schmidt, K. M. (1997). Managerial incentives and product market competition. Review ofEconomic Studies 64, 191–213.
Schreiner, M. (2002). Aspects of outreach: A framework for discussion of the social benefits ofmicrofinance. Journal of International Development 14, 591–603.
Strøm, R. Ø. (2009). Better firm performance with employees on the board? In P. O. Bjuggrenand D. Mueller (Eds.), The Modern Firm, Corporate Governance and Investment. London:Edward Elgar Publishing.
Tirole, J. (2006). The Theory of Corporate Finance. Princeton: Princeton University Press.
Woolridge, J. M. (2002). Econometric Analysis of Cross Section and Panel Data. Cambridge,Mass.: The MIT Press.
Yermack, D. (1996). Higher market valuation of companies with a small board of directors.Journal of Financial Economics 40, 185–212.
19
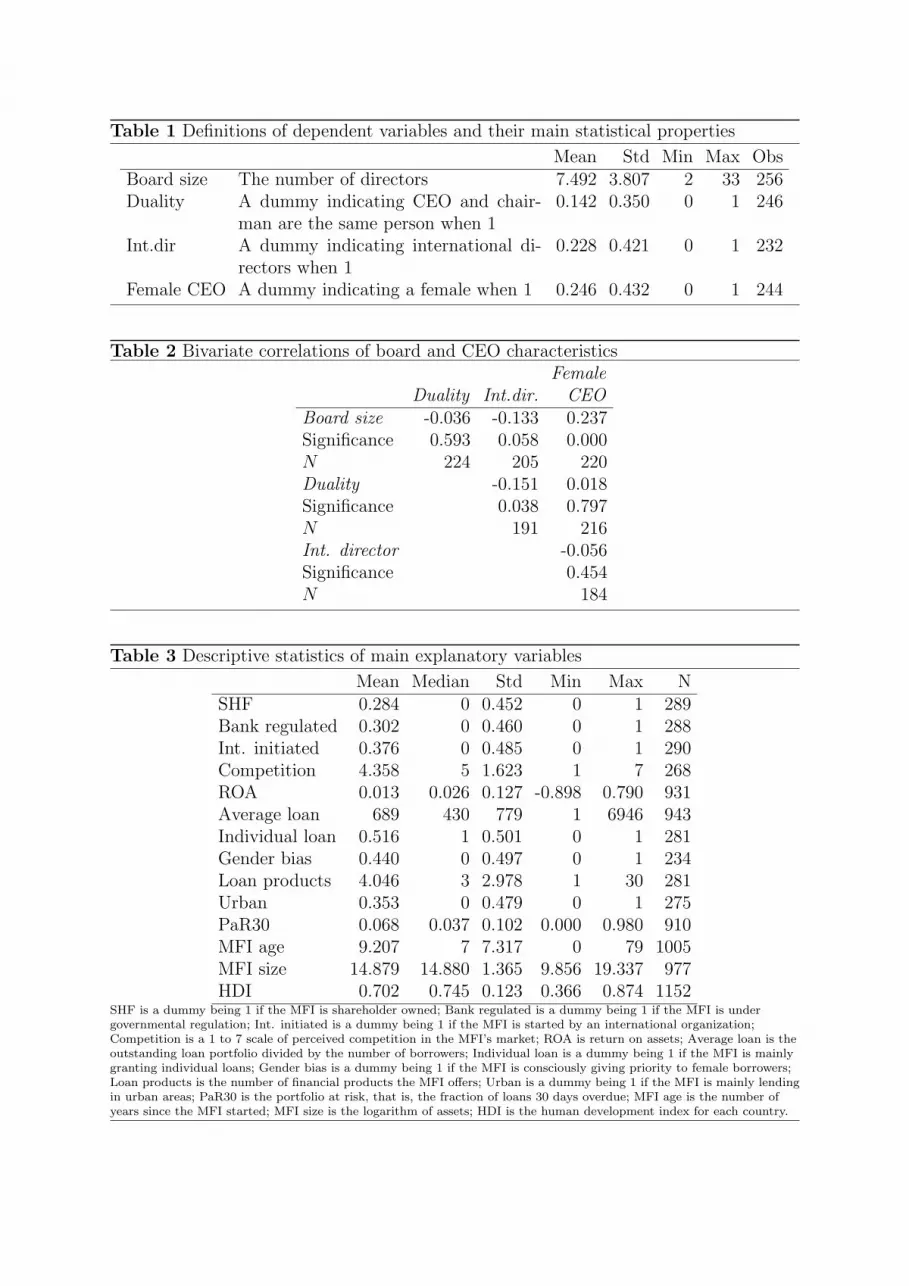
Table 1 Definitions of dependent variables and their main statistical properties
Mean Std Min Max ObsBoard size The number of directors 7.492 3.807 2 33 256Duality A dummy indicating CEO and chair-
man are the same person when 10.142 0.350 0 1 246
Int.dir A dummy indicating international di-rectors when 1
0.228 0.421 0 1 232
Female CEO A dummy indicating a female when 1 0.246 0.432 0 1 244
Table 2 Bivariate correlations of board and CEO characteristicsFemale
Duality Int.dir. CEOBoard size -0.036 -0.133 0.237Significance 0.593 0.058 0.000N 224 205 220Duality -0.151 0.018Significance 0.038 0.797N 191 216Int. director -0.056Significance 0.454N 184
Table 3 Descriptive statistics of main explanatory variables
Mean Median Std Min Max NSHF 0.284 0 0.452 0 1 289Bank regulated 0.302 0 0.460 0 1 288Int. initiated 0.376 0 0.485 0 1 290Competition 4.358 5 1.623 1 7 268ROA 0.013 0.026 0.127 -0.898 0.790 931Average loan 689 430 779 1 6946 943Individual loan 0.516 1 0.501 0 1 281Gender bias 0.440 0 0.497 0 1 234Loan products 4.046 3 2.978 1 30 281Urban 0.353 0 0.479 0 1 275PaR30 0.068 0.037 0.102 0.000 0.980 910MFI age 9.207 7 7.317 0 79 1005MFI size 14.879 14.880 1.365 9.856 19.337 977HDI 0.702 0.745 0.123 0.366 0.874 1152
SHF is a dummy being 1 if the MFI is shareholder owned; Bank regulated is a dummy being 1 if the MFI is undergovernmental regulation; Int. initiated is a dummy being 1 if the MFI is started by an international organization;Competition is a 1 to 7 scale of perceived competition in the MFI’s market; ROA is return on assets; Average loan is theoutstanding loan portfolio divided by the number of borrowers; Individual loan is a dummy being 1 if the MFI is mainlygranting individual loans; Gender bias is a dummy being 1 if the MFI is consciously giving priority to female borrowers;Loan products is the number of financial products the MFI offers; Urban is a dummy being 1 if the MFI is mainly lendingin urban areas; PaR30 is the portfolio at risk, that is, the fraction of loans 30 days overdue; MFI age is the number ofyears since the MFI started; MFI size is the logarithm of assets; HDI is the human development index for each country.
Table
4B
ivar
iate
corr
elat
ions
ofex
pla
nat
ory
vari
able
s
Ban
kIn
t.C
om-
Avg.
Indiv
.G
ender
Loa
nM
FI
MFI
regu
l.in
itpet
itio
nR
OA
loan
loan
bia
spro
d.
Urb
anPaR
30ag
esi
zeH
DI
shf
0.5
05
0.04
00.
029
-0.0
330.
034
0.14
0-0
.178
0.1
93
-0.1
23-0
.078
-0.0
630.2
28
-0.1
33B
ank
regu
l0.
045
0.02
10.
019
0.09
10.1
72
-0.1
670.2
85
-0.1
20-0
.047
0.08
00.2
75
-0.1
74
Int.
init
-0.1
47-0
.017
-0.1
42-0
.110
0.04
0-0
.164
0.00
2-0
.194
-0.2
04
0.01
3-0
.131
Com
pet
itio
n-0
.052
0.08
00.
077
-0.0
910.2
05
-0.0
820.
046
0.08
40.
091
-0.0
53R
OA
0.07
80.2
18
-0.1
630.
035
0.1
75
-0.1
96
0.06
10.2
84
0.2
01
Ave
rage
loan
0.4
70
-0.3
99
0.05
7-0
.015
0.2
13
0.02
40.2
25
0.2
82
Indiv
idual
loan
-0.5
10
0.08
50.1
91
0.13
20.
032
0.3
05
0.2
72
Gen
der
bia
s-0
.163
-0.1
25-0
.101
0.03
3-0
.190
-0.2
14
Loa
npro
duct
s-0
.180
0.01
00.3
89
0.2
73
-0.0
12U
rban
-0.0
07-0
.052
-0.1
360.1
83
par
300.1
84
-0.0
28-0
.005
MFI
age
0.2
76
-0.0
03M
FI
size
-0.0
23
Em
phasi
zed
text
indic
ate
s5%
signifi
cance
level
;em
phasi
zed
and
bold
text
indic
ate
s1%
signifi
cance
level
.C
ondit
ion
num
ber
=18702.5
3
Table
5A
reav
erag
esth
esa
me?
Expla
nat
ory
vari
able
ske
yst
atis
tics
insm
all
and
larg
eboa
rdsu
bsa
mple
s.A
NO
VA
test
sof
expla
nat
ory
vari
able
s’diff
eren
cein
aver
ages
.Sig
nifi
cant
resu
lts
are
give
nin
bol
d.
Fem
ale
Sm
allbo
ard
Lar
gebo
ard
Dual
ity
Intd
irC
EO
Mea
nStd
NM
ean
Std
NF
Sig
.Sig
.Sig
.Sig
.Boa
rdan
dC
EO
char
acte
rist
ics
Boa
rdsi
ze0.
593
0.0
58
0.0
00
Dual
ity
0.16
20.
370
990.
136
0.34
412
50.
286
0.59
30.0
38
0.79
7In
t.dir
ecto
r0.
309
0.46
597
0.19
40.
398
108
3.63
50.0
58
0.0
38
0.45
4Fem
ale
CE
O0.
139
0.34
710
10.
345
0.47
711
912
.972
0.0
00
0.79
70.
454
Ext
ernal
gove
rnan
cem
echa
nis
ms
SH
F0.
345
0.47
811
30.
217
0.41
414
35.
301
0.0
22
0.80
30.0
00
0.0
26
Ban
kre
gula
ted
0.29
20.
457
113
0.30
10.
460
143
0.02
30.
881
0.54
50.0
44
0.35
7In
t.in
itia
ted
0.42
50.
497
113
0.36
90.
484
141
0.82
00.
366
0.0
04
0.0
00
0.30
5C
ompet
itio
n4.
790
1.57
310
53.
962
1.52
713
016
.660
0.0
00
0.44
30.
996
0.18
9Fin
anci
alpe
rfor
man
ceR
OA
0.01
30.
082
111
0.01
30.
109
138
0.00
00.
993
0.65
10.
330
0.0
10
Outrea
chpe
rfor
man
ceA
vera
gelo
an81
890
111
053
962
313
98.
279
0.0
04
0.23
80.
833
0.72
4In
div
idual
loan
0.56
10.
499
107
0.46
60.
501
133
2.12
30.
146
0.18
70.
580
0.15
9G
ender
bia
s0.
351
0.48
094
0.52
60.
502
114
6.54
10.0
11
0.82
70.
775
0.10
7Loa
npro
duct
s4.
117
2.63
811
13.
797
2.58
913
80.
924
0.33
70.
438
0.92
50.0
09
Urb
an0.
273
0.44
711
00.
406
0.49
313
34.
783
0.0
30
0.64
20.
247
0.45
3
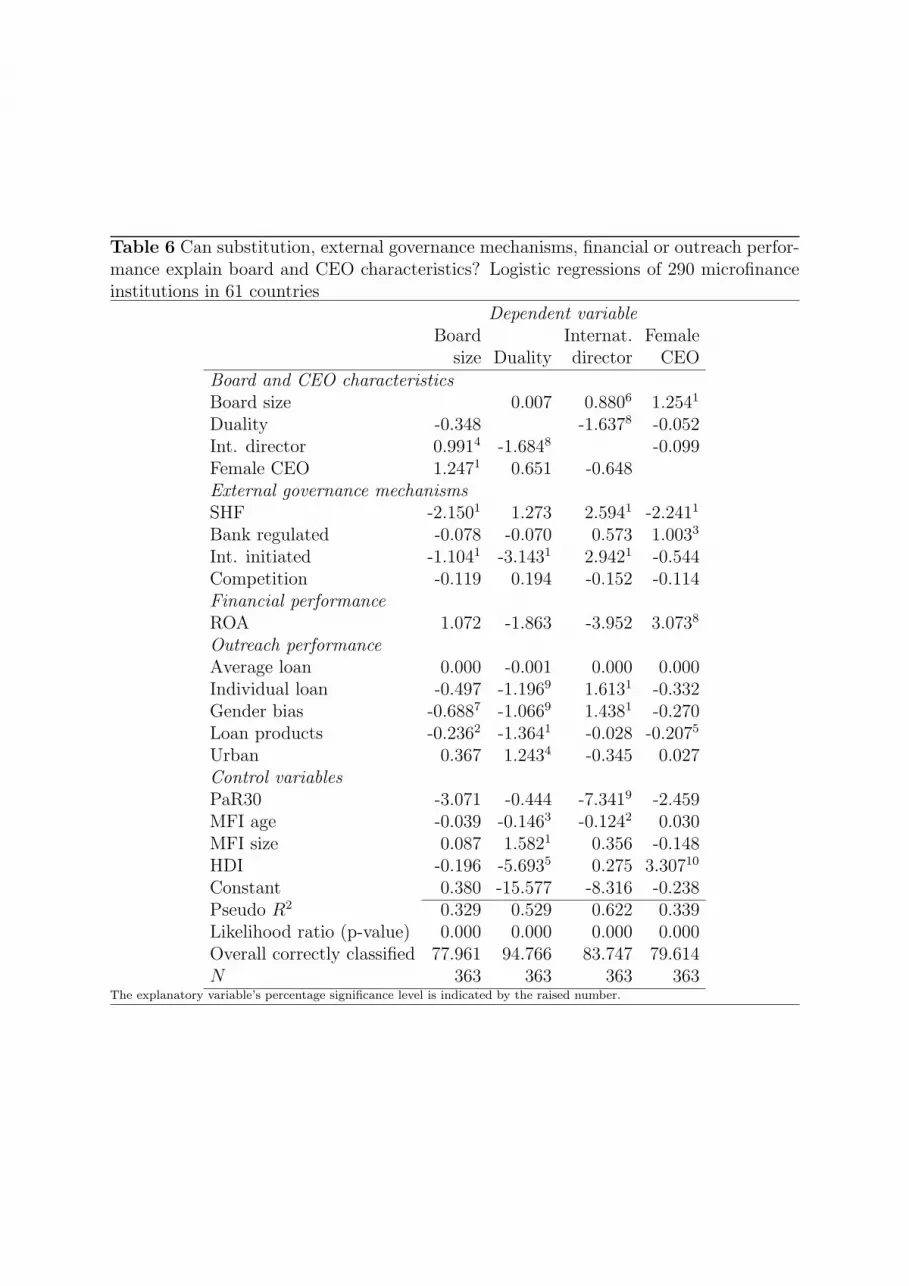
Table 6 Can substitution, external governance mechanisms, financial or outreach perfor-mance explain board and CEO characteristics? Logistic regressions of 290 microfinanceinstitutions in 61 countries
Dependent variableBoard Internat. Female
size Duality director CEOBoard and CEO characteristicsBoard size 0.007 0.8806 1.2541
Duality -0.348 -1.6378 -0.052Int. director 0.9914 -1.6848 -0.099Female CEO 1.2471 0.651 -0.648External governance mechanismsSHF -2.1501 1.273 2.5941 -2.2411
Bank regulated -0.078 -0.070 0.573 1.0033
Int. initiated -1.1041 -3.1431 2.9421 -0.544Competition -0.119 0.194 -0.152 -0.114Financial performanceROA 1.072 -1.863 -3.952 3.0738
Outreach performanceAverage loan 0.000 -0.001 0.000 0.000Individual loan -0.497 -1.1969 1.6131 -0.332Gender bias -0.6887 -1.0669 1.4381 -0.270Loan products -0.2362 -1.3641 -0.028 -0.2075
Urban 0.367 1.2434 -0.345 0.027Control variablesPaR30 -3.071 -0.444 -7.3419 -2.459MFI age -0.039 -0.1463 -0.1242 0.030MFI size 0.087 1.5821 0.356 -0.148HDI -0.196 -5.6935 0.275 3.30710
Constant 0.380 -15.577 -8.316 -0.238Pseudo R2 0.329 0.529 0.622 0.339Likelihood ratio (p-value) 0.000 0.000 0.000 0.000Overall correctly classified 77.961 94.766 83.747 79.614N 363 363 363 363
The explanatory variable’s percentage significance level is indicated by the raised number.
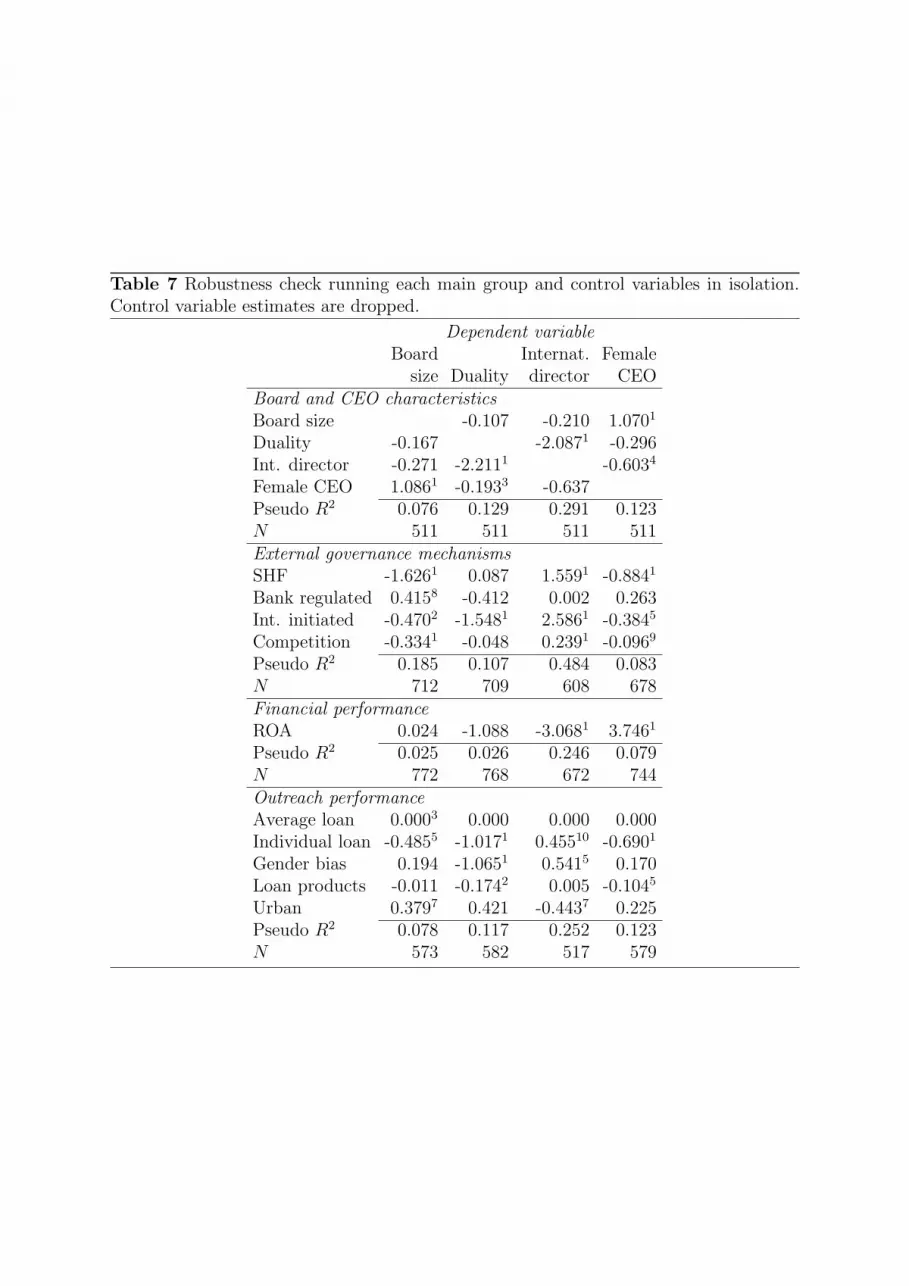
Table 7 Robustness check running each main group and control variables in isolation.Control variable estimates are dropped.
Dependent variableBoard Internat. Female
size Duality director CEOBoard and CEO characteristicsBoard size -0.107 -0.210 1.0701
Duality -0.167 -2.0871 -0.296Int. director -0.271 -2.2111 -0.6034
Female CEO 1.0861 -0.1933 -0.637Pseudo R2 0.076 0.129 0.291 0.123N 511 511 511 511External governance mechanismsSHF -1.6261 0.087 1.5591 -0.8841
Bank regulated 0.4158 -0.412 0.002 0.263Int. initiated -0.4702 -1.5481 2.5861 -0.3845
Competition -0.3341 -0.048 0.2391 -0.0969
Pseudo R2 0.185 0.107 0.484 0.083N 712 709 608 678Financial performanceROA 0.024 -1.088 -3.0681 3.7461
Pseudo R2 0.025 0.026 0.246 0.079N 772 768 672 744Outreach performanceAverage loan 0.0003 0.000 0.000 0.000Individual loan -0.4855 -1.0171 0.45510 -0.6901
Gender bias 0.194 -1.0651 0.5415 0.170Loan products -0.011 -0.1742 0.005 -0.1045
Urban 0.3797 0.421 -0.4437 0.225Pseudo R2 0.078 0.117 0.252 0.123N 573 582 517 579