effect of enhancement of spectral changes on speech intelligibility and clarity preferences for the...
TRANSCRIPT
Effect of enhancement of spectral changes on speechintelligibility and clarity preferences for the hearing impaired
Jing Chen,a) Thomas Baer, and Brian C. J. MooreDepartment of Experimental Psychology, University of Cambridge, Downing Street, Cambridge CB2 3EB,England
(Received 23 March 2011; revised 5 February 2012; accepted 7 February 2012)
Most information in speech is carried in spectral changes over time, rather than in static spectral
shape per se. A form of signal processing aimed at enhancing spectral changes over time was devel-
oped and evaluated using hearing-impaired listeners. The signal processing was based on the
overlap-add method, and the degree and type of enhancement could be manipulated via four param-
eters. Two experiments were conducted to assess speech intelligibility and clarity preferences.
Three sets of parameter values (one corresponding to a control condition), two types of masker
(steady speech-spectrum noise and two-talker speech) and two signal-to-masker ratios (SMRs)
were used for each masker type. Generally, the effects of the processing were small, although
intelligibility was improved by about 8 percentage points relative to the control condition for one
set of parameter values using the steady noise masker at �6 dB SMR. The processed signals were
not preferred over those for the control condition, except for the steady noise masker at �6 dB
SMR. Further work is needed to determine whether tailoring the processing to the characteristics
of the individual hearing-impaired listener is beneficial. VC 2012 Acoustical Society of America.[http://dx.doi.org/10.1121/1.3689556]
PACS number(s): 43.66.Ts, 43.71.Ky, 43.71.An [MAA] Pages: 2987–2998
I. INTRODUCTION
Listeners with moderately impaired hearing can usually
achieve high speech intelligibility in a quiet environment
when the presentation level is sufficiently high, but their per-
formance decreases in noisy environments (Moore, 2007).
The ability to understand speech in quiet may be determined
to a large extent by audibility (Humes and Roberts, 1990), but
the ability to understand speech in noise almost certainly
depends partly on other auditory functions such as frequency
selectivity (Festen and Plomp, 1983; Moore, 1996) and sensi-
tivity to temporal fine structure (Hopkins et al., 2008; Moore,
2008). Sensorineural hearing loss, particularly cochlear hear-
ing loss, is associated with broader-than-normal auditory fil-
ters (Glasberg and Moore, 1986). When a speech signal
passes through these broader filters, the resulting excitation
pattern is “smeared” relative to normal, reducing the differ-
ence in amplitude between peaks and dips in the internal rep-
resentation, and making it more difficult to determine the
formant frequencies that provide important cues for speech
recognition (Moore, 1996; Baer et al., 1993). Backgroundnoise can exacerbate this effect by filling in the valleys in the
spectrum, thereby reducing spectral contrast in the signal.
To compensate for this effect, several attempts have
been made to improve speech intelligibility for the hearing
impaired by enhancing spectral contrast (Boers, 1980; Sum-
merfield et al., 1985; Simpson et al., 1990; Stone and Moore,
1992; Baer et al., 1993). In a typical method for achieving
this (Baer et al., 1993), the magnitude spectra of short time
segments (frames) were obtained via the Fast Fourier Trans-
form (FFT), and the spectra were processed so that the peaks
increased in level and the valleys decreased in level, while
preserving overall level and phase. The results showed that
the recognition of speech in noise was sometimes, but not
always, slightly improved and that hearing-impaired people
sometimes, but not always, preferred the enhanced speech in
terms of sound quality (Boers, 1980; Summerfield et al.,1985; Simpson et al., 1990; Stone and Moore, 1992; Baer
et al., 1993; Baer and Moore, 1997). However, those studies
only enhanced the spectral contrast in individual frames;
spectral changes across frames were not considered. In the
present paper we examine the possible benefits of enhancing
spectral changes over time.
The auditory system, like all other perceptual systems,
is especially sensitive to abrupt changes in stimuli, and the
perceived properties of brief segments of sounds, including
speech, can be strongly influenced by preceding and follow-
ing segments (Summerfield et al., 1984; Watkins, 1991;
Watkins and Makin, 1996; Moore, 2003). It has been
reported that listeners identified place of articulation signifi-
cantly better for stimuli that preserved dynamic spectral
changes at their onsets than for stimuli with static onset spec-
tra (Kewley-Port et al., 1983). Hazan and Simpson (1998)
found that the intelligibility of speech in background noise
could be improved by amplifying hand-annotated consonan-
tal regions of natural vowel-consonant-vowel (VCV) stimuli,
and corresponding regions in natural semantically unpredict-
able sentence material. It has also been reported that proc-
esses of successive spectral contrast can serve to
disambiguate coarticulated speech (Kluender et al., 2003;Coady et al., 2003). These findings suggest that the ability to
detect spectral changes may be important for speech
intelligibility.
a)Author to whom correspondence should be addressed. Electronic mail:
J. Acoust. Soc. Am. 131 (4), April 2012 VC 2012 Acoustical Society of America 29870001-4966/2012/131(4)/2987/12/$30.00
Downloaded 13 Apr 2012 to 131.111.185.82. Redistribution subject to ASA license or copyright; see http://asadl.org/journals/doc/ASALIB-home/info/terms.jsp
Hearing-impaired people probably have a reduced abil-
ity to detect and discriminate spectral changes simply
because they have reduced frequency selectivity. If the
detection and discrimination of static spectral features is
impaired, then it naturally follows that the detection of
changes in those features will also be impaired. Spectral
enhancement on a frame-by-frame basis, as described above,
cannot restore the internal representation of spectral shape to
normal; it can only make the excitation pattern of a spec-
trally enhanced stimulus in an impaired ear somewhat closer
to the excitation pattern evoked in a normal ear by the unpro-
cessed signal (Baer et al., 1993). For example, a single sin-
ewave evokes an excitation pattern that is broader in an
impaired than in a normal ear, and there is no way to
enhance the spectrum so as to restore the excitation pattern
to normal.
Although spectral-change enhancement also has limita-
tions, it is possible in principle to make spectral changes au-
dible that would not otherwise be audible for a hearing-
impaired person. Say, for example, that a broadband stimu-
lus has a narrow spectral dip that is then “filled in” to give a
flat spectrum. For a hearing-impaired ear, the change might
not be detectable, since the narrow spectral dip would give
rise to only a very small dip in the excitation pattern. If the
stimuli are analyzed with a finer frequency analysis than per-
formed by the impaired ear, and the spectral change is then
enhanced, the result would be a momentary peak in the spec-
trum following filling in of the dip; this effect is illustrated
later (see Fig. 3). The hearing-impaired person might be able
to detect this spectral peak, and hence to detect the change in
spectrum over time. Thus, spectral-change enhancement has
the potential for increasing the audibility of spectral changes
for hearing-impaired people, possibly thereby increasing
speech intelligibility.
Signal processing to enhance spectral changes for
hearing-impaired people has rarely been explored in previ-
ous studies. The methods generally used in laboratory
experiments on the role of spectral changes could not be
implemented in hearing aids, because they used hand annota-
tion to identify regions of spectral change, and then ampli-
fied those regions (Gordon-Salant, 1986; Hazan and
Simpson, 1998, 2000). Yoo et al. (2007) extracted transient
components automatically by employing time-frequency
analysis, but the process was based on the whole signal
(monosyllablic words in their study), and such a process is
not suitable for real-time implementation.
In this paper we describe a new form of signal process-
ing aimed at enhancing spectral changes over time. The
processing uses the overlap-add method, based on the fast
Fourier transform. The processing does not require fine-scale
frequency analysis (Allen, 1977), although the resolution
should be greater than that of a typical hearing-impaired ear
over the frequency range of interest. Thus the processing
could, in principle, be implemented with a small time delay;
this is important, since the delay starts to have small disrup-
tive effects around 10–12 ms, though the effects do not
become serious until the delay reaches about 30 ms (Stone
and Moore, 2002). In a previous experiment (Chen et al.,2010), described briefly below, we showed that, for certain
selections of parameter values, hearing-impaired subjects
preferred speech in speech-spectrum noise (SSN) processed
using this method over unprocessed signals. The two sets of
parameter values used in the present study were based on the
results of this earlier experiment.
Here, we assessed whether the signal processing led to
improvements in the intelligibility of speech presented in
two types of masker, SSN and two-talker speech (TTS), for
hearing-impaired listeners with moderate hearing loss. Sub-
jective ratings of speech clarity based on paired-comparisons
were also obtained.
Effects of background sounds on speech intelligibility
are often characterized as arising from energetic masking
(EM), informational masking (IM), or a combination of the
two (Brungart et al., 2001). EM occurs when the neural ac-
tivity elicited by a signal plus masker is similar to the neural
activity evoked by the masker alone; the masker “swamps”
the response to the signal. IM for speech is conceptualized
as anything that reduces intelligibility once EM has been
accounted for, including effects such as difficulty in deter-
mining how to assign acoustic elements in the mixture to the
target and masker (Watson, 1987; Kidd et al., 1994, 1998;Freyman et al., 1999, 2001, 2004; Brungart et al., 2001;Arbogast et al., 2002; Durlach et al., 2003; Oxenham et al.,2003; Li et al., 2004; Wu et al., 2005; Mattys et al., 2009).However, Stone et al. (2011) have suggested that modulation
masking (MM) can also occur, and that a steady noise can
produce both EM and MM. SSN may produce mainly EM
and MM (Stone et al., 2011), while competing speech pro-
duces EM, MM, and IM, the latter perhaps being dominant
(Brungart et al., 2001). When the target speech consists of
nonsense sentences and the number of competing talkers in
the background is manipulated, IM appears to be maximal
when there are two talkers in the background (Brungart
et al., 2001; Freyman et al., 2001, 2004; Wu et al., 2007).We anticipated that the spectral-change processing might be
beneficial for speech in SSN, but it was not clear whether it
would be beneficial in situations where IM was dominant,
since the processing would not necessarily resolve confu-
sions between the target and background or aid perceptual
segregation of the target and background. To be beneficial in
everyday life, the processing would have to lead to improved
intelligibility for some types of background sounds, such as
SSN, and at least not degrade intelligibility for others, such
as TTS. We assessed whether the processing achieved these
goals by comparing the performance of hearing-impaired
subjects for processed and unprocessed signals. When
spectral-change enhancement was applied, the speech and
background (SSN or TTS) were mixed prior to processing,
as would occur in practical situations.
II. SIGNAL PROCESSING
A. Method
The signal-processing strategy used for spectral-change
enhancement was FFT based: the input signal was seg-
mented, windowed, Fourier transformed, spectrally
smoothed, spectral-change enhanced, inverse Fourier trans-
formed, and converted to a running waveform using the
2988 J. Acoust. Soc. Am., Vol. 131, No. 4, April 2012 Chen et al.: Enhancement of spectral changes in speech
Downloaded 13 Apr 2012 to 131.111.185.82. Redistribution subject to ASA license or copyright; see http://asadl.org/journals/doc/ASALIB-home/info/terms.jsp
overlap-add technique (Allen, 1977; Simpson et al., 1990;Baer et al., 1993). The processing flow is shown in Fig. 1,
and each step is described below.
The input signal, which was sampled at 16 kHz, was
segmented using a 16-ms frame length and 8-ms frame over-
lap. Each frame was weighted by a 16-ms Hamming win-
dow. Then, a 256-point FFT of the windowed segment was
calculated, giving 128 magnitude values (Specorg) and 128
phase values.
To remove minor irregularities in the spectrum and to
preserve major features in the spectrum that would be well
represented in a normal auditory system, the magnitude
spectrum was transformed to an auditory excitation pattern,
using a convolution procedure as described by Moore and
Glasberg (1983).1 As a result of this transformation, the orig-
inal 128 magnitude values were replaced by 128 new values,
denoted Mag. The new values represent a smoothed version
of the original spectrum, comparable to the representation in
a normal auditory system.
The spectral change across every two adjacent frames
was evaluated by expressing the Mag values in dB and tak-
ing the difference of the Mag values for bin j in frame n and
bin j in frame n-1:
Rj;n ¼ Magj;n �Magj;n�1; (1)
where if Rj,n> 0, the spectrum magnitude increased from
frame n-1 to frame n, and if Rj,n< 0, the magnitude
decreased from frame n-1 to frame n. The magnitude spec-
trum was modified based on the spectral change values, Rj,n.
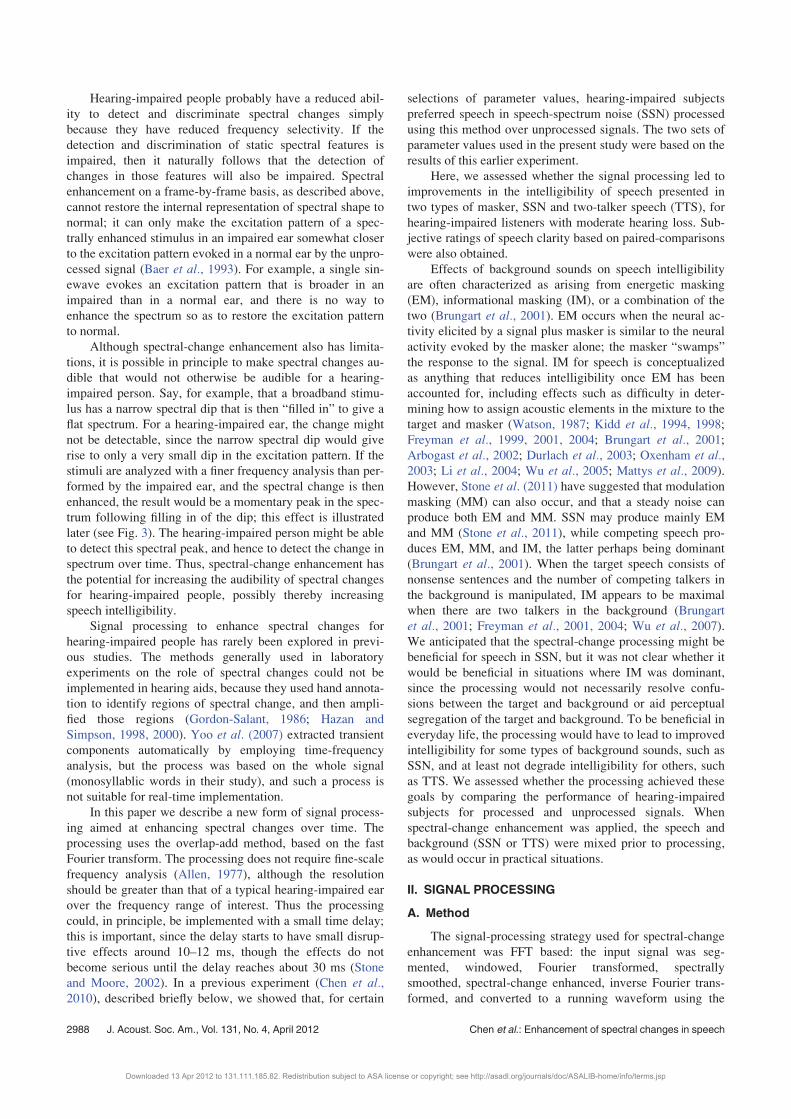
An enhancement function was derived from the spectral
change function by convolution with a difference-of-Gaus-
sians (DoG) function, which is described by the following
equation:
DoGðDf Þ ¼ ð1=2pÞ1=2hexp �ðDf=rbÞ2=2
n o
� ð1=2Þ exp �ðDf=2rbÞ2=2n oi
; (2)
where Df is the deviation in Hz from the center frequency, ris equal to the value of the equivalent rectangular bandwidth
of the normal auditory filter at that center frequency, ERBN
is the equivalent rectangular bandwidth of the auditory filter
in normal ears, as specified by Moore and Glasberg (1983),
and b is a parameter that determines the width of the central
lobe of the DoG function. When b¼ 1, the width of the cen-
tral lobe is 2.72 ERBN at the 0-magnitude points. Figure 2
shows DoG functions for center frequencies of 500, 1000,
and 4000 Hz. In each panel, the solid line is for b¼ 1, and
the dashed line is for b¼ 0.5. The DoG function was cen-
tered in turn on each frequency in the spectral change func-
tion Rj,n. For a given center frequency of the DoG function,
the value of the spectral change function was multiplied by
the value of the DoG function, and the products obtained in
this way were summed. The magnitude value (in dB) of the
spectral change function at that frequency was then replaced
by that sum. The result of this computation is denoted the
enhancement function (ENF, in dB). The ENF was used to
derive modified output spectra, as described below.
The modified magnitude spectrum for a given frame
was obtained by adding a gain function to the original mag-
nitude spectrum (both in dB units). It was desired that this
gain function was based on ENF and was influenced by the
smoothed spectrum in a number of preceding frames, with a
FIG. 1. Flow diagram of the signal processing used for spectral-change enhancement.
FIG. 2. Difference-of-Gaussian (DoG)functions for three center frequencies,
one for each panel. In each panel, the
solid line is for b¼ 1, and the dashed
line is for b¼ 0.5.
J. Acoust. Soc. Am., Vol. 131, No. 4, April 2012 Chen et al.: Enhancement of spectral changes in speech 2989
Downloaded 13 Apr 2012 to 131.111.185.82. Redistribution subject to ASA license or copyright; see http://asadl.org/journals/doc/ASALIB-home/info/terms.jsp
weight that progressively declined for frames that were ear-
lier in time than the current frame. To achieve this, the gain
function for frame n, Gainn, was constructed as a weighted
average across frames according to the formula:
Gainn¼ ENFnþnENFn�1þn2ENFn�2þ…nmENFn�m
1þnþn2þ…nm;
(3)
where n (�1) is a parameter controlling the relative weight-
ing of earlier frames, and m is the number of frames contrib-
uting to the weighted average. Then, the value of Gainn wasscaled by multiplying by a factor S, which was an adjustable
parameter used to control the degree of spectral-change
enhancement.2 Finally, the modified magnitude spectrum of
frame n, Specmod, was calculated as:
Specmod ¼ Specorg þ ðS� GainnÞ; (4)
Note that the spectrum magnitudes and values of Gainn are
both in dB units. For a given frame of the input signal, the
corresponding output signal was created by inverse FFT
with the modified magnitude spectrum and the original
phases. This was repeated for successive overlapping frames
to give the whole processed signal.
In summary, the processing was implemented with four
adjustable parameters: b, controlling the width of the DoGfunction; n and m, controlling the effect of preceding frames;
and S controlling the amount of enhancement.
B. Test signal
To check that the processing operated in the desired
way, synthesized harmonic complex tones were used, in
which the level of a subgroup of harmonics was abruptly
changed at a certain time, resulting in a change in spectral
shape. Spectrograms of these signals were determined after
they had been subjected to the processing. The results con-
firmed that enhancement of spectral changes did indeed
occur, and that the characteristics of the enhancement could
be altered by manipulating the values of the parameters b, n,m, and S.
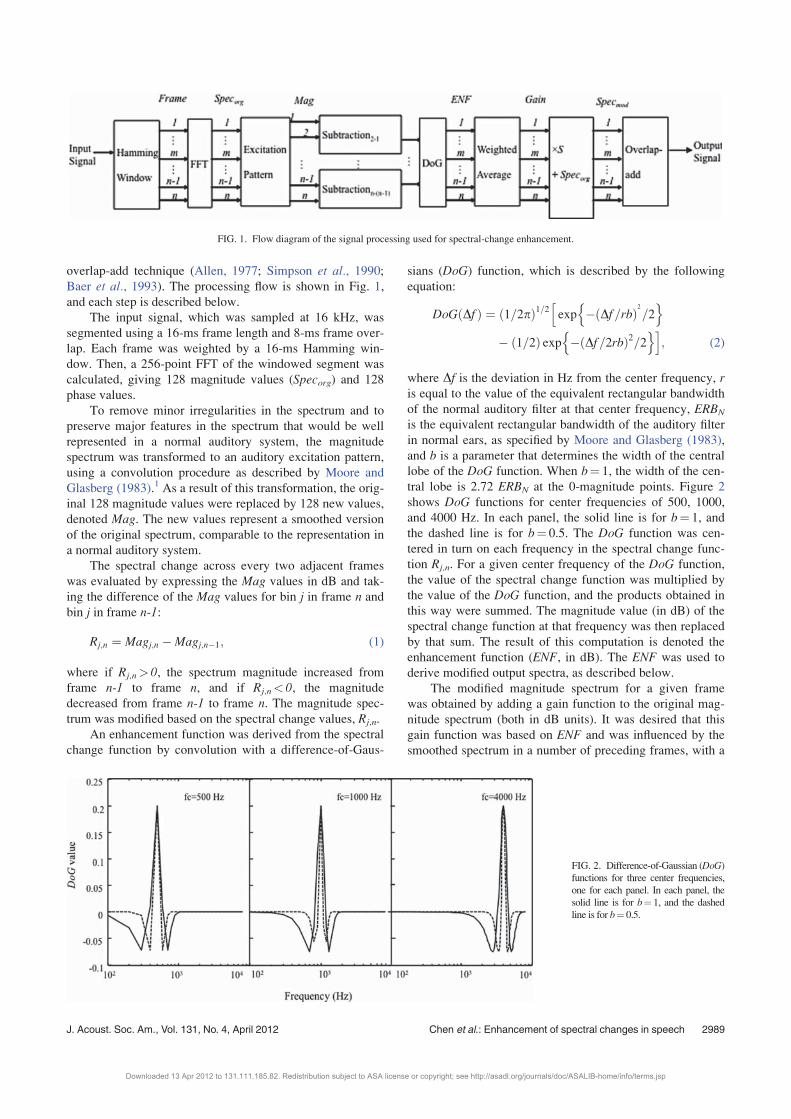
Figure 3 shows spectrograms of a test signal, before (left)
and after (right) spectral-change enhancement; dark regions
indicate higher energy. A harmonic complex tone with a fun-
damental frequency (F0) of 200 Hz was synthesized by add-
ing a series of harmonics. Each harmonic had the same level
except for a small group. Two 200-ms signal segments were
synthesized separately. For the first segment, the level of har-
monics with frequencies from 1000 to 1400 Hz was 5 dB
lower than for the other harmonics. For the second segment,
the level of harmonics with frequencies from 1600 to 2000 Hz
was 5 dB lower than for the other harmonics. A 5-ms raised-
cosine window was applied to the start and end of each seg-
ment, and the two segments were combined so that the end of
the first segment abutted the start of the second segment at the
0-voltage points. For the combined segments, there was a
change in spectral shape at 200 ms, as shown in Fig. 3(left).
After processing, the change was enhanced: the levels of har-
monics from 1000 to 1400 Hz increased above that of the
other harmonics for a short time following the change (shown
by the small dark region) and the levels of harmonics from
1600 to 2400 Hz were as much as 10 dB lower than that of ad-
jacent harmonics for a short time.
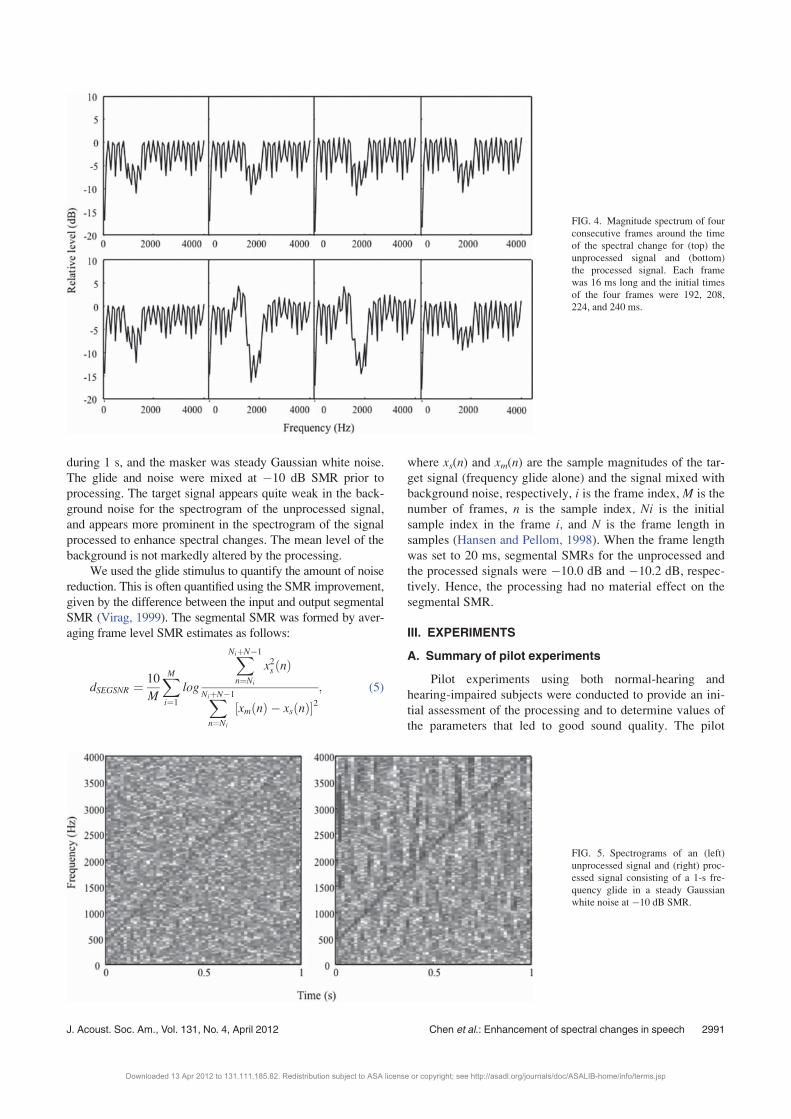
Figure 4 shows the magnitude spectrum of the unpro-
cessed signal (top) and the processed signal (bottom) for
four consecutive non-overlapping 16-ms frames around the
time where the change in spectral shape occurred. The initial
times of the four frames were 192, 208, 224, and 240 ms.
Notice that, for spectral regions and times where there was
no spectral change, the processing had little effect. Notice
also that the processing would not result in an enhancement
of increases in energy when they were uniform across fre-
quency. The enhancement occurs when the energy changes
in one frequency region relative to that in adjacent regions.
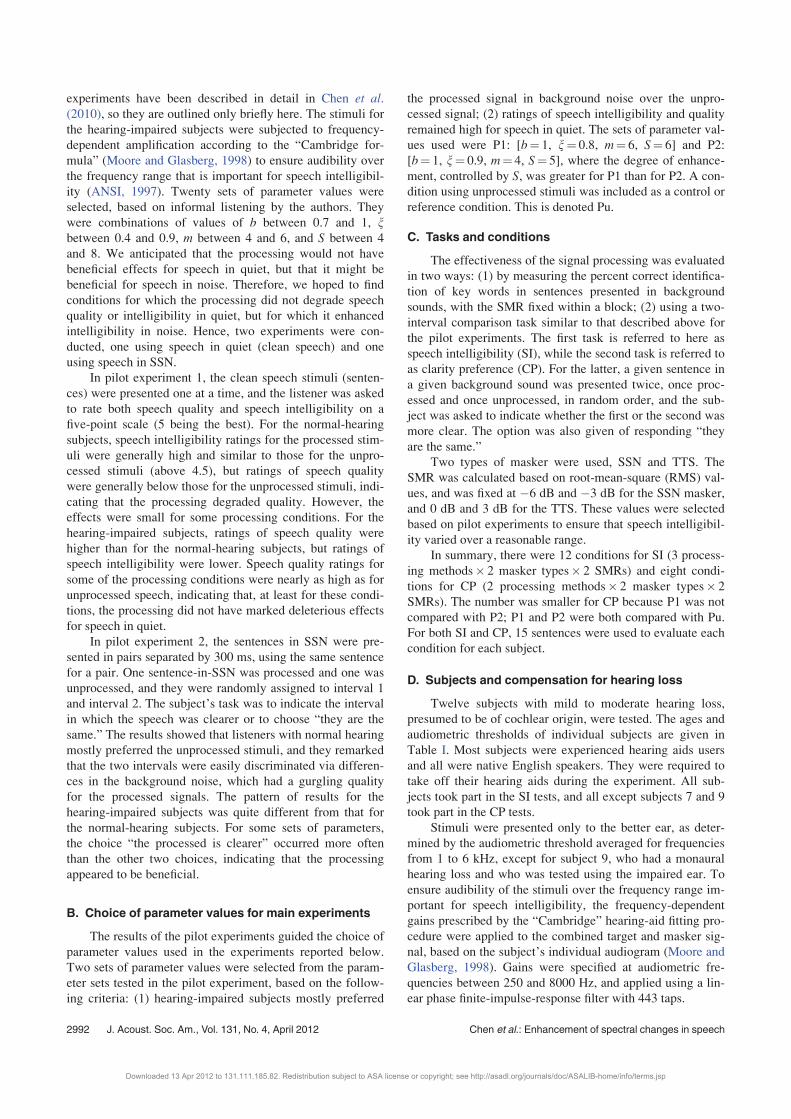
Finally, it should be noted that the spectral-change
enhancement processing was not intended as a means of noise
reduction. Indeed, for a steady noise background, the process-
ing has little effect on the background apart from enhancing
some of the random spectral fluctuations in the background.
This is illustrated in Fig. 5, which shows spectrograms of a
frequency glide in steady noise, before (left) and after (right)
spectral-change enhancement; dark regions indicate higher
energy. The glide frequency changed from 300 to 4200 Hz
FIG. 3. Spectrograms of an unpro-
cessed signal (left) and processed
signal (right). Dark areas indicate
higher energy. The signal was a har-
monic complex tone with an F0 of
200 Hz. Each harmonic had the
same level except for a small group.
For the first 200-ms segment, the
level of harmonics with frequencies
from 1000 to 1400 Hz was 5 dB
lower than for the other harmonics.
For the second 200-ms segment, the
level of harmonics with frequencies
from 1600 to 2000 Hz was 5 dB
lower than for the other harmonics.
The parameter values were: b¼ 1,
n¼ 0.9, m¼ 4, S¼ 5.
2990 J. Acoust. Soc. Am., Vol. 131, No. 4, April 2012 Chen et al.: Enhancement of spectral changes in speech
Downloaded 13 Apr 2012 to 131.111.185.82. Redistribution subject to ASA license or copyright; see http://asadl.org/journals/doc/ASALIB-home/info/terms.jsp
during 1 s, and the masker was steady Gaussian white noise.
The glide and noise were mixed at �10 dB SMR prior to
processing. The target signal appears quite weak in the back-
ground noise for the spectrogram of the unprocessed signal,
and appears more prominent in the spectrogram of the signal
processed to enhance spectral changes. The mean level of the
background is not markedly altered by the processing.
We used the glide stimulus to quantify the amount of noise
reduction. This is often quantified using the SMR improvement,
given by the difference between the input and output segmental
SMR (Virag, 1999). The segmental SMR was formed by aver-
aging frame level SMR estimates as follows:
dSEGSNR ¼ 10
M
XMi¼1
log
XNiþN�1
n¼Ni
x2s ðnÞ
XNiþN�1
n¼Ni
½xmðnÞ � xsðnÞ�2; (5)
where xs(n) and xm(n) are the sample magnitudes of the tar-
get signal (frequency glide alone) and the signal mixed with
background noise, respectively, i is the frame index, M is the
number of frames, n is the sample index, Ni is the initial
sample index in the frame i, and N is the frame length in
samples (Hansen and Pellom, 1998). When the frame length
was set to 20 ms, segmental SMRs for the unprocessed and
the processed signals were �10.0 dB and �10.2 dB, respec-
tively. Hence, the processing had no material effect on the
segmental SMR.
III. EXPERIMENTS
A. Summary of pilot experiments
Pilot experiments using both normal-hearing and
hearing-impaired subjects were conducted to provide an ini-
tial assessment of the processing and to determine values of
the parameters that led to good sound quality. The pilot
FIG. 4. Magnitude spectrum of four
consecutive frames around the time
of the spectral change for (top) the
unprocessed signal and (bottom)
the processed signal. Each frame
was 16 ms long and the initial times
of the four frames were 192, 208,
224, and 240 ms.
FIG. 5. Spectrograms of an (left)
unprocessed signal and (right) proc-
essed signal consisting of a 1-s fre-
quency glide in a steady Gaussian
white noise at �10 dB SMR.
J. Acoust. Soc. Am., Vol. 131, No. 4, April 2012 Chen et al.: Enhancement of spectral changes in speech 2991
Downloaded 13 Apr 2012 to 131.111.185.82. Redistribution subject to ASA license or copyright; see http://asadl.org/journals/doc/ASALIB-home/info/terms.jsp
experiments have been described in detail in Chen et al.(2010), so they are outlined only briefly here. The stimuli for
the hearing-impaired subjects were subjected to frequency-
dependent amplification according to the “Cambridge for-
mula” (Moore and Glasberg, 1998) to ensure audibility over
the frequency range that is important for speech intelligibil-
ity (ANSI, 1997). Twenty sets of parameter values were
selected, based on informal listening by the authors. They
were combinations of values of b between 0.7 and 1, nbetween 0.4 and 0.9, m between 4 and 6, and S between 4
and 8. We anticipated that the processing would not have
beneficial effects for speech in quiet, but that it might be
beneficial for speech in noise. Therefore, we hoped to find
conditions for which the processing did not degrade speech
quality or intelligibility in quiet, but for which it enhanced
intelligibility in noise. Hence, two experiments were con-
ducted, one using speech in quiet (clean speech) and one
using speech in SSN.
In pilot experiment 1, the clean speech stimuli (senten-
ces) were presented one at a time, and the listener was asked
to rate both speech quality and speech intelligibility on a
five-point scale (5 being the best). For the normal-hearing
subjects, speech intelligibility ratings for the processed stim-
uli were generally high and similar to those for the unpro-
cessed stimuli (above 4.5), but ratings of speech quality
were generally below those for the unprocessed stimuli, indi-
cating that the processing degraded quality. However, the
effects were small for some processing conditions. For the
hearing-impaired subjects, ratings of speech quality were
higher than for the normal-hearing subjects, but ratings of
speech intelligibility were lower. Speech quality ratings for
some of the processing conditions were nearly as high as for
unprocessed speech, indicating that, at least for these condi-
tions, the processing did not have marked deleterious effects
for speech in quiet.
In pilot experiment 2, the sentences in SSN were pre-
sented in pairs separated by 300 ms, using the same sentence
for a pair. One sentence-in-SSN was processed and one was
unprocessed, and they were randomly assigned to interval 1
and interval 2. The subject’s task was to indicate the interval
in which the speech was clearer or to choose “they are the
same.” The results showed that listeners with normal hearing
mostly preferred the unprocessed stimuli, and they remarked
that the two intervals were easily discriminated via differen-
ces in the background noise, which had a gurgling quality
for the processed signals. The pattern of results for the
hearing-impaired subjects was quite different from that for
the normal-hearing subjects. For some sets of parameters,
the choice “the processed is clearer” occurred more often
than the other two choices, indicating that the processing
appeared to be beneficial.
B. Choice of parameter values for main experiments
The results of the pilot experiments guided the choice of
parameter values used in the experiments reported below.
Two sets of parameter values were selected from the param-
eter sets tested in the pilot experiment, based on the follow-
ing criteria: (1) hearing-impaired subjects mostly preferred
the processed signal in background noise over the unpro-
cessed signal; (2) ratings of speech intelligibility and quality
remained high for speech in quiet. The sets of parameter val-
ues used were P1: [b¼ 1, n¼ 0.8, m¼ 6, S¼ 6] and P2:
[b¼ 1, n¼ 0.9, m¼ 4, S¼ 5], where the degree of enhance-
ment, controlled by S, was greater for P1 than for P2. A con-
dition using unprocessed stimuli was included as a control or
reference condition. This is denoted Pu.
C. Tasks and conditions
The effectiveness of the signal processing was evaluated
in two ways: (1) by measuring the percent correct identifica-
tion of key words in sentences presented in background
sounds, with the SMR fixed within a block; (2) using a two-
interval comparison task similar to that described above for
the pilot experiments. The first task is referred to here as
speech intelligibility (SI), while the second task is referred to
as clarity preference (CP). For the latter, a given sentence in
a given background sound was presented twice, once proc-
essed and once unprocessed, in random order, and the sub-
ject was asked to indicate whether the first or the second was
more clear. The option was also given of responding “they
are the same.”
Two types of masker were used, SSN and TTS. The
SMR was calculated based on root-mean-square (RMS) val-
ues, and was fixed at �6 dB and �3 dB for the SSN masker,
and 0 dB and 3 dB for the TTS. These values were selected
based on pilot experiments to ensure that speech intelligibil-
ity varied over a reasonable range.
In summary, there were 12 conditions for SI (3 process-
ing methods� 2 masker types� 2 SMRs) and eight condi-
tions for CP (2 processing methods� 2 masker types� 2
SMRs). The number was smaller for CP because P1 was not
compared with P2; P1 and P2 were both compared with Pu.
For both SI and CP, 15 sentences were used to evaluate each
condition for each subject.
D. Subjects and compensation for hearing loss
Twelve subjects with mild to moderate hearing loss,
presumed to be of cochlear origin, were tested. The ages and
audiometric thresholds of individual subjects are given in
Table I. Most subjects were experienced hearing aids users
and all were native English speakers. They were required to
take off their hearing aids during the experiment. All sub-
jects took part in the SI tests, and all except subjects 7 and 9
took part in the CP tests.
Stimuli were presented only to the better ear, as deter-
mined by the audiometric threshold averaged for frequencies
from 1 to 6 kHz, except for subject 9, who had a monaural
hearing loss and who was tested using the impaired ear. To
ensure audibility of the stimuli over the frequency range im-
portant for speech intelligibility, the frequency-dependent
gains prescribed by the “Cambridge” hearing-aid fitting pro-
cedure were applied to the combined target and masker sig-
nal, based on the subject’s individual audiogram (Moore and
Glasberg, 1998). Gains were specified at audiometric fre-
quencies between 250 and 8000 Hz, and applied using a lin-
ear phase finite-impulse-response filter with 443 taps.
2992 J. Acoust. Soc. Am., Vol. 131, No. 4, April 2012 Chen et al.: Enhancement of spectral changes in speech
Downloaded 13 Apr 2012 to 131.111.185.82. Redistribution subject to ASA license or copyright; see http://asadl.org/journals/doc/ASALIB-home/info/terms.jsp
E. Equipment
All stimuli were generated using a PC with an M-audio
external soundcard (Fast track pro, 16-bit, 16 000-Hz sam-
pling rate), passed through a mixing desk (Mackie 1402-
VLZ), and presented to the subject via Sennheiser HD 580
headphones at 65 dB SPL. For all tests, subjects were seated
in a double-walled sound attenuating chamber.
F. Test material
Sentences from the adaptive sentence list (ASL) corpus
(MacLeod and Summerfield, 1990) were used as the target
speech. They were spoken by a male British-English
speaker. The long-term spectrum level of the sentence lists
was flat for frequencies from about 100 to 500 Hz, and then
decreased at a rate of 9 dB/octave. The SSN masker had the
same average spectral shape as the speech.
The speech used for the TTS background was recorded
from male speakers of British English reading naturally
from scripts (unrelated to the ASL materials) in a large
sound-isolated and sound-treated room with a low reverber-
ation time (RT60< 50 ms for frequencies of 250 Hz and
above). Recordings were made direct to digital audio tape
using a high-quality, low-noise condenser microphone.
Using CoolEdit2000TM, stammerings, repetitions, and
pauses for breath were removed, but natural sounding
pauses between sentences with durations of 100–140 ms
were left. Each speaker used a different script. The
recorded length of the speech for each talker greatly
exceeded the 45-s duration of each target sentence list
(Stone and Moore, 2003). The TTS was produced by mix-
ing speech from two different talkers. The RMS level of the
speech from the two talkers was equated before mixing.
The segment of the TTS to be used on a given trial was
selected randomly from within the file. For each trial, the
background sound started 500 ms before the target sen-
tence, and finished synchronously with the sentence.
G. Design and procedure
For the SI test, six of the subjects were tested first using
the SSN masker and then using the TTS masker. The
remaining six subjects were tested in the opposite order. The
order of presentation of the different processing conditions
was counterbalanced across subjects. The 12 test conditions
were organized into six blocks (3 processing methods� 2
masker types), and in each block 30 sentences (15 at each
SMR) were presented, with SMRs in a random order. For
each subject, 12 test lists were assigned randomly to the 12
conditions.
Subjects were instructed to verbally repeat the whole
target sentence as well as they could immediately after the
trial was completed. The experimenter recorded how many
key words had been identified correctly and then initiated
the next trial. Before data collection, subjects completed two
practice runs, each using 15 sentences (one ASL list), one
using the SSN masker and one using the TTS masker.
For the CP test, the stimuli and test conditions were
same as for the SI test, and they were organized into four
blocks according to the two processing methods (P1 and P2)
and two masker types. There were 30 trials in each block, 15
trials using the higher SMR (one ASL list) and 15 using the
lower SMR. The 15 trials included 12 test trials and 3 control
trials. In the test trials, one segment contained a sentence-
plus-masker processed using P1 or P2 and one contained the
same sentence-plus-masker, but unprocessed (Pu). The two
segments were separated by 300 ms and their order was ran-
dom. In the control trials, both segments were unprocessed.
The control trials were used to assess the reliability of the
judgments, and in particular to assess whether subjects
sometimes rated one segment as sounding better than the
other when they were in fact processed in the same way. The
subject selected one of the three options presented on a com-
puter screen: (1) interval 1 is clearer; (2) interval 2 is clearer;
and (3) they are the same. If the subject could not make a de-
cision, (s)he was allowed to listen to the stimulus again by
clicking a “repeat” button.
All subjects took the SI test on one day and took the CP
test on a later day. Each test lasted about one hour. The
orders of the different conditions for a given subject were
same for the SI and CP tests. ASL lists 11 to 22 were used
for the SI test, and lists 11–18 were used for the CP tests.
IV. RESULTS
A. Speech intelligibility
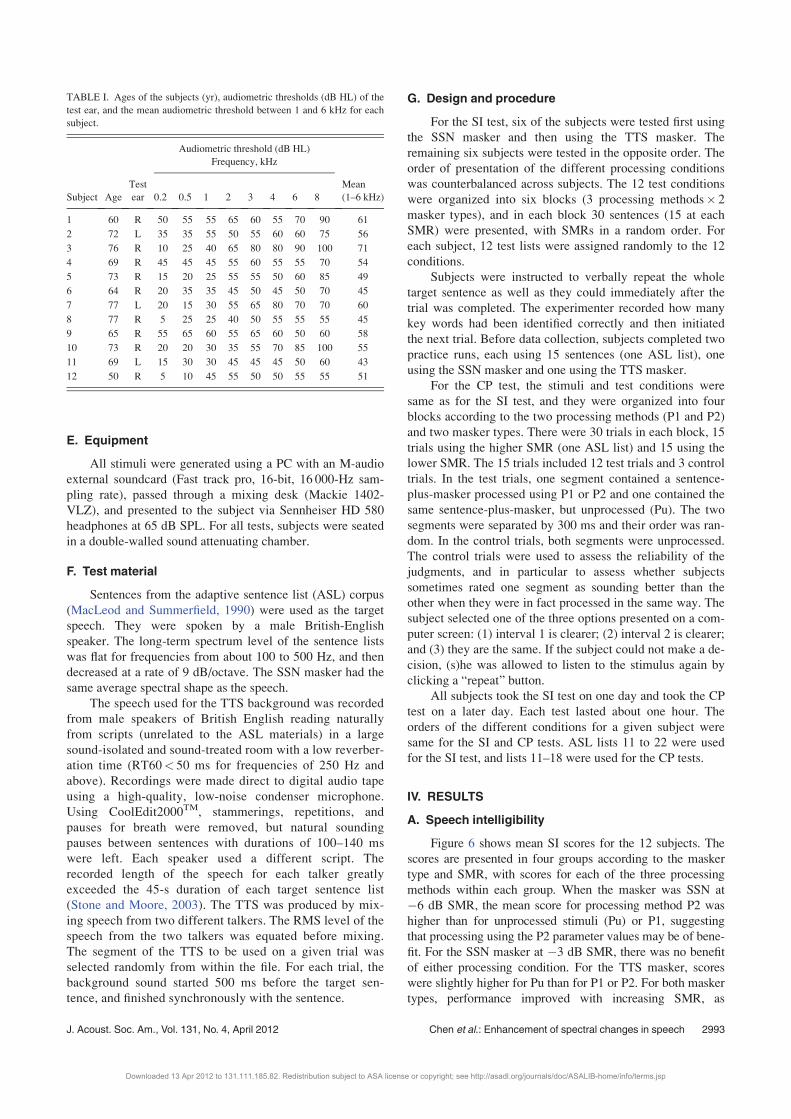
Figure 6 shows mean SI scores for the 12 subjects. The
scores are presented in four groups according to the masker
type and SMR, with scores for each of the three processing
methods within each group. When the masker was SSN at
�6 dB SMR, the mean score for processing method P2 was
higher than for unprocessed stimuli (Pu) or P1, suggesting
that processing using the P2 parameter values may be of bene-
fit. For the SSN masker at �3 dB SMR, there was no benefit
of either processing condition. For the TTS masker, scores
were slightly higher for Pu than for P1 or P2. For both masker
types, performance improved with increasing SMR, as
TABLE I. Ages of the subjects (yr), audiometric thresholds (dB HL) of the
test ear, and the mean audiometric threshold between 1 and 6 kHz for each
subject.
Audiometric threshold (dB HL)
Frequency, kHz
Subject Age
Test
ear 0.2 0.5 1 2 3 4 6 8
Mean
(1–6 kHz)
1 60 R 50 55 55 65 60 55 70 90 61
2 72 L 35 35 55 50 55 60 60 75 56
3 76 R 10 25 40 65 80 80 90 100 71
4 69 R 45 45 45 55 60 55 55 70 54
5 73 R 15 20 25 55 55 50 60 85 49
6 64 R 20 35 35 45 50 45 50 70 45
7 77 L 20 15 30 55 65 80 70 70 60
8 77 R 5 25 25 40 50 55 55 55 45
9 65 R 55 65 60 55 65 60 50 60 58
10 73 R 20 20 30 35 55 70 85 100 55
11 69 L 15 30 30 45 45 45 50 60 43
12 50 R 5 10 45 55 50 50 55 55 51
J. Acoust. Soc. Am., Vol. 131, No. 4, April 2012 Chen et al.: Enhancement of spectral changes in speech 2993
Downloaded 13 Apr 2012 to 131.111.185.82. Redistribution subject to ASA license or copyright; see http://asadl.org/journals/doc/ASALIB-home/info/terms.jsp
expected. The improvement with increasing SMR was larger
for the SSN than for the TTS masker, consistent with the shal-
lower psychometric functions for speech than for steady noise
maskers that have been observed in previous studies (Baer
et al., 1993; Brungart et al., 2001; Li et al., 2004).As different SMRs were used for the two maskers,
separate two-way analyses of variance (ANOVAs) were
conducted for the two masker types, with SMR and process-
ing method as factors. For the SSN masker, the effect of
processing method was not significant, but the effect of
SMR was significant [F(1, 11)¼ 125.2, p< 0.001], and the
interaction was significant [F(2, 22)¼ 5.0, p¼ 0.016]. A
one-way ANOVA showed that the effect of processing
method was significant for the SSN masker at �6 dB SMR
[F(2, 22)¼ 6.3, p¼ 0.007]. Pair-wise comparisons (Bonfer-
roni corrected) indicated that scores for method P2 were sig-
nificantly higher than scores for Pu (p¼ 0.004), but scores
for P1 did not differ from scores for Pu or P2. A second one-
way ANOVA showed that the effect of processing method
was not significant for the SSN masker at �3 dB SMR.
For the TTS masker, the two-way ANOVA showed sig-
nificant effects of processing method [F(2, 22)¼ 5.3,
p¼ 0.013] and SMR [F(1, 11)¼ 26.4, p< 0.001], but the
interaction was not significant. Pair-wise comparisons indi-
cated that scores for Pu were significantly higher than scores
for P2 (p< 0.05), but that scores did not differ significantly
for other pairs of conditions.
The effect of processing method varied greatly across
subjects and masking conditions. This may partly reflect
“noise” in the data, for example produced by different
degrees of practice at different points during the test. How-
ever, the individual differences may also indicate that there
are real differences in the benefit of spectral-change
enhancement across subjects and/or that the optimal parame-
ters of the processing vary across subjects.
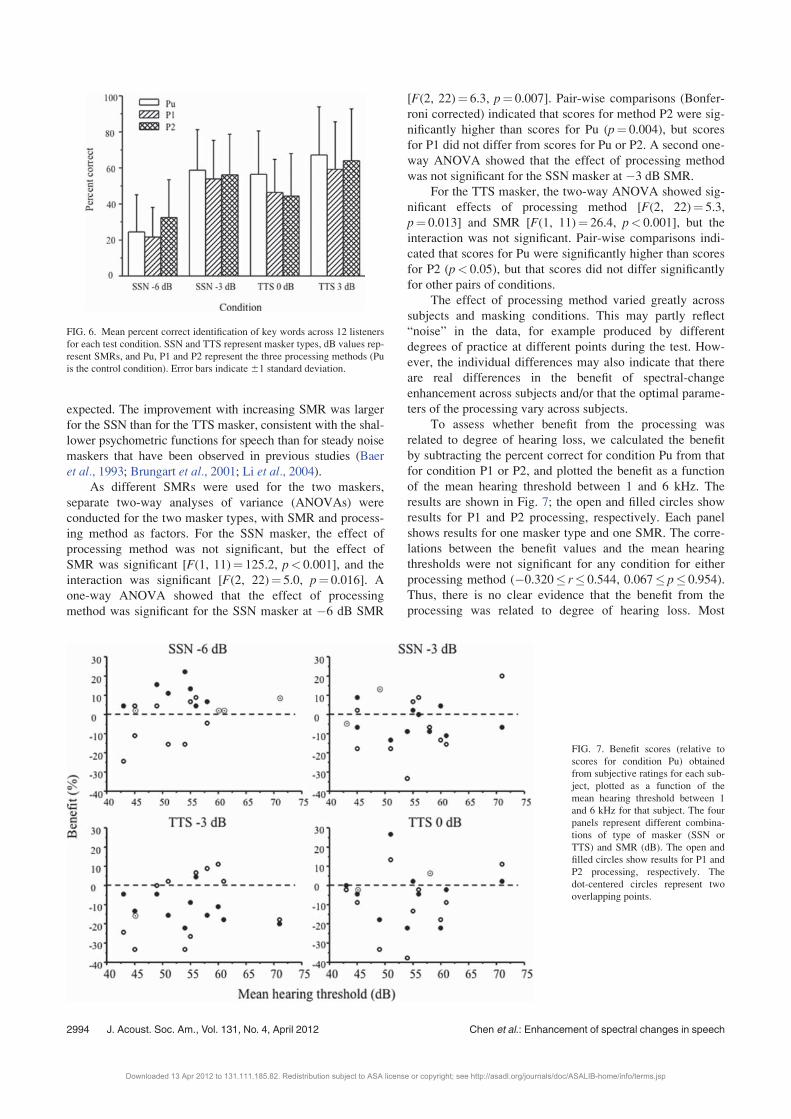
To assess whether benefit from the processing was
related to degree of hearing loss, we calculated the benefit
by subtracting the percent correct for condition Pu from that
for condition P1 or P2, and plotted the benefit as a function
of the mean hearing threshold between 1 and 6 kHz. The
results are shown in Fig. 7; the open and filled circles show
results for P1 and P2 processing, respectively. Each panel
shows results for one masker type and one SMR. The corre-
lations between the benefit values and the mean hearing
thresholds were not significant for any condition for either
processing method (�0.320� r� 0.544, 0.067� p� 0.954).
Thus, there is no clear evidence that the benefit from the
processing was related to degree of hearing loss. Most
FIG. 6. Mean percent correct identification of key words across 12 listeners
for each test condition. SSN and TTS represent masker types, dB values rep-
resent SMRs, and Pu, P1 and P2 represent the three processing methods (Pu
is the control condition). Error bars indicate61 standard deviation.
FIG. 7. Benefit scores (relative to
scores for condition Pu) obtained
from subjective ratings for each sub-
ject, plotted as a function of the
mean hearing threshold between 1
and 6 kHz for that subject. The four
panels represent different combina-
tions of type of masker (SSN or
TTS) and SMR (dB). The open and
filled circles show results for P1 and
P2 processing, respectively. The
dot-centered circles represent two
overlapping points.
2994 J. Acoust. Soc. Am., Vol. 131, No. 4, April 2012 Chen et al.: Enhancement of spectral changes in speech
Downloaded 13 Apr 2012 to 131.111.185.82. Redistribution subject to ASA license or copyright; see http://asadl.org/journals/doc/ASALIB-home/info/terms.jsp
benefit values were less than 0, indicating that the processing
usually did not produce any benefit, but rather led to reduced
speech intelligibility. Values above 0, indicating benefit
from the processing, did, however, occur for all subjects for
method P2 at �6 dB SMR (filled circles). Based on a bino-
mial test, the probability of this occurring by chance
is< 0.001. Even if a correction were made for the possible
number of such comparisons, the result would still be
significant.
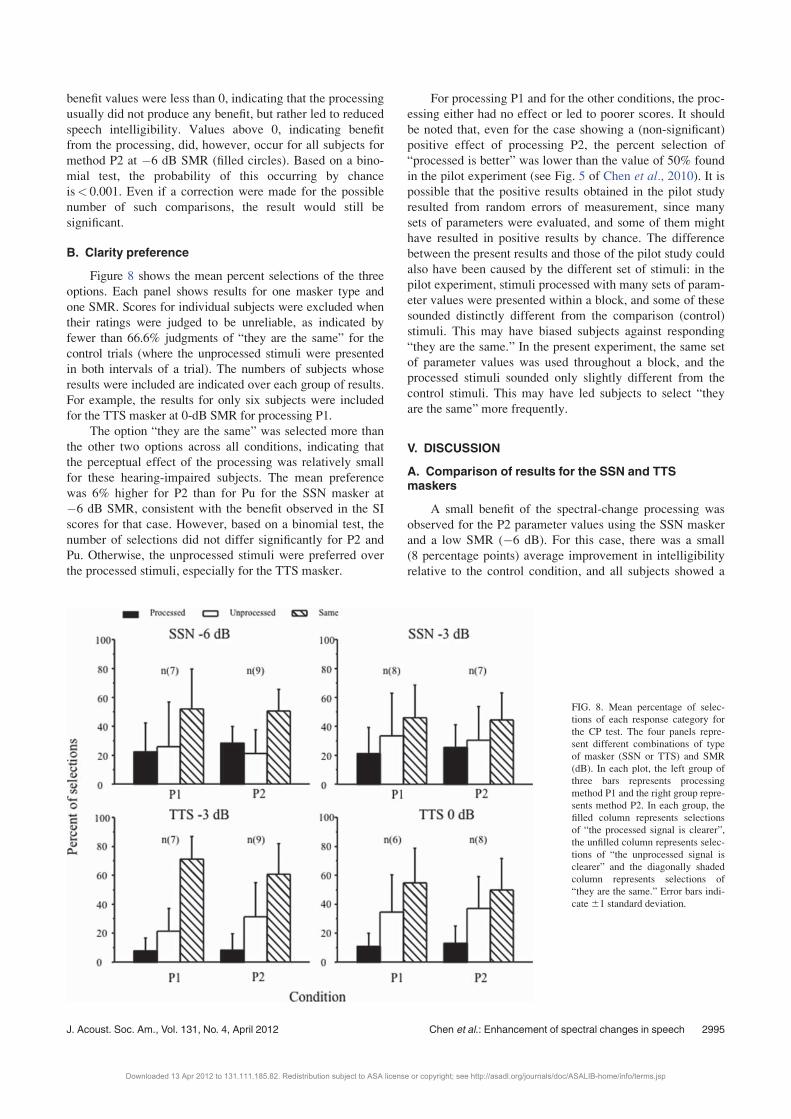
B. Clarity preference
Figure 8 shows the mean percent selections of the three
options. Each panel shows results for one masker type and
one SMR. Scores for individual subjects were excluded when
their ratings were judged to be unreliable, as indicated by
fewer than 66.6% judgments of “they are the same” for the
control trials (where the unprocessed stimuli were presented
in both intervals of a trial). The numbers of subjects whose
results were included are indicated over each group of results.
For example, the results for only six subjects were included
for the TTS masker at 0-dB SMR for processing P1.
The option “they are the same” was selected more than
the other two options across all conditions, indicating that
the perceptual effect of the processing was relatively small
for these hearing-impaired subjects. The mean preference
was 6% higher for P2 than for Pu for the SSN masker at
�6 dB SMR, consistent with the benefit observed in the SI
scores for that case. However, based on a binomial test, the
number of selections did not differ significantly for P2 and
Pu. Otherwise, the unprocessed stimuli were preferred over
the processed stimuli, especially for the TTS masker.
For processing P1 and for the other conditions, the proc-
essing either had no effect or led to poorer scores. It should
be noted that, even for the case showing a (non-significant)
positive effect of processing P2, the percent selection of
“processed is better” was lower than the value of 50% found
in the pilot experiment (see Fig. 5 of Chen et al., 2010). It ispossible that the positive results obtained in the pilot study
resulted from random errors of measurement, since many
sets of parameters were evaluated, and some of them might
have resulted in positive results by chance. The difference
between the present results and those of the pilot study could
also have been caused by the different set of stimuli: in the
pilot experiment, stimuli processed with many sets of param-
eter values were presented within a block, and some of these
sounded distinctly different from the comparison (control)
stimuli. This may have biased subjects against responding
“they are the same.” In the present experiment, the same set
of parameter values was used throughout a block, and the
processed stimuli sounded only slightly different from the
control stimuli. This may have led subjects to select “they
are the same” more frequently.
V. DISCUSSION
A. Comparison of results for the SSN and TTSmaskers
A small benefit of the spectral-change processing was
observed for the P2 parameter values using the SSN masker
and a low SMR (�6 dB). For this case, there was a small
(8 percentage points) average improvement in intelligibility
relative to the control condition, and all subjects showed a
FIG. 8. Mean percentage of selec-
tions of each response category for
the CP test. The four panels repre-
sent different combinations of type
of masker (SSN or TTS) and SMR
(dB). In each plot, the left group of
three bars represents processing
method P1 and the right group repre-
sents method P2. In each group, the
filled column represents selections
of “the processed signal is clearer”,
the unfilled column represents selec-
tions of “the unprocessed signal is
clearer” and the diagonally shaded
column represents selections of
“they are the same.” Error bars indi-
cate61 standard deviation.
J. Acoust. Soc. Am., Vol. 131, No. 4, April 2012 Chen et al.: Enhancement of spectral changes in speech 2995
Downloaded 13 Apr 2012 to 131.111.185.82. Redistribution subject to ASA license or copyright; see http://asadl.org/journals/doc/ASALIB-home/info/terms.jsp
positive benefit in intelligibility. Also for this case, the sub-
jective preference scores showed a small (but not statistically
significant) benefit of the processing. The benefit is probably
linked to the fact that the SSN masker would have filled in
the valleys in the short-term spectrum of the target speech,
and the processing would have had the effect of accentuating
the changes in formant frequencies over time (see the exam-
ple given in Fig. 4).
Disappointingly, the spectral-change enhancement proc-
essing was not of benefit with the SSN masker at the higher
SMR used, and the processing tended to degrade both SI and
CP scores with the TTS masker. The poor results with the
TTS masker are probably the result of three things: (1) The
effect of the TTS masker on speech intelligibility can mainly
be attributed to IM, and the processing did not provide extra
cues that might be used to overcome the effects of IM; (2)
There were side-effects of the processing, such as musical
noise and gurgling sounds; (3) With the TTS masker, the
mixed signal contained three different talkers. The spectral-
change enhancement applied to the mixture would have
resulted in partially correlated changes in spectrum across
talkers, which might have led to increased difficulty in per-
ceptual segregation of the talkers. This effect is analogous to
the cross-modulation produced by fast-acting amplitude
compression, which can also have deleterious effects in a
competing-talker situation (Stone and Moore, 2003, 2004,
2008).
It is possible that a different selection of parameter val-
ues would lead to better performance with a TTS masker.
For example, the effect of the introduction of correlated
changes in spectrum across talkers could be reduced by mak-
ing the processing operate on a longer time scale, or by
reducing the strength of the enhancement. Previous studies
of spectral enhancement on a frame-by-frame basis have
also led to the conclusion that the amount of enhancement
should be limited to reduce distortion and artifacts (Simpson
et al., 1990; Baer et al., 1993).
B. Effect of parameter set
The results of both the SI and CP tests showed differen-
ces between processing using the two sets of parameters, P1
and P2. Although both of these sets of parameters led to high
subjective ratings in the pilot experiment, the results
obtained here suggested that P2 led to more benefit, or had
smaller deleterious effects, than P1.
The processing was manipulated via four parameters: b,controlling the width of the DoG function; n and m, control-ling the effect of preceding frames; and S controlling the
amount of enhancement. The value of b was the same for the
two parameter sets used here, but the other parameters dif-
fered across sets: for P1 [b¼ 1, n¼ 0.8, m¼ 6, S¼ 6], and
for P2 [b¼ 1, n¼ 0.9, m¼ 4, S¼ 5]. The value of n was
smaller for P1 than for P2, while the value of m was larger
for P1 than for P2, meaning that more preceding frames
played a role for P1, but that the weighting of previous
frames was slightly lower for P1. These two effects might
have partly counter-balanced each other, although the way in
which they trade is difficult to determine. The degree of
enhancement, controlled by S, was greater for P1 than for
P2. The finding that P2 tended to give better performance
than P1 is consistent with the idea, proposed above, that a
smaller amount of enhancement might be beneficial.
Only a single value of b (¼1) was used here, and with
that value the width of the DoG function between the
0-magnitude points was 2.72 ERBN. It is possible that better
results would be obtained using a smaller value of b, forexample, 0.5 instead of 1. A smaller value would result in
enhancement of spectral changes on a finer frequency scale. It
remains to be determined whether this would be beneficial.
One limitation of the processing described here is that it
was applied uniformly across the whole frequency spectrum.
It is possible that the processing might work better if the
strength of the spectral-change enhancement in a particular
frequency region were made dependent on the degree of
hearing loss in that region. That remains to be determined.
C. Individual differences
There were large individual differences in the outcomes.
For example, for P2 processing, the benefit with the SSN
masker at �6 dB SMR ranged from 2 percentage points to
22 percentage points. For P2 processing and the TTS masker
at 0 dB SMR, the “benefit” ranged from �22 percentage
points to 26 percentage points. While some of these differen-
ces reflect random variability in the data, they appear large
enough to reflect genuine individual differences. However,
the benefit from the processing was not related to audiomet-
ric thresholds; see Fig. 7.
If there are consistent individual differences in benefit,
these might be revealed as a correlation in benefit across
the SI and CP measures. To assess whether there were such
correlations, benefit scores were calculated for each of the
ten subjects who participated in both the SI test and CP
test, i.e., all except subjects 7 and 9 in Table I. The benefit
for SI was calculated as before. The benefit for CP was cal-
culated by subtracting the percent correct for selecting “the
unprocessed is clearer” from that for selecting “the proc-
essed is clearer.” There were no significant correlations
between the benefit for SI and that for CP, even for P2
processing with SSN at �6 dB SMR (�0.612� r� 0.552,
0.060� p� 0.580). The lack of correlation might be a
result of noise in the data, or might indicate that objectively
measured speech intelligibility is not closely related to sub-
jective ratings of clarity.
It is possible that the benefit from the processing
depends on auditory functions other than the audiogram.
Many studies have examined the relationship between
speech intelligibility and auditory functions for hearing-
impaired listeners (Dreschler and Plomp, 1980, 1985; Festen
and Plomp, 1983; Glasberg and Moore, 1989; Strelcyk and
Dau, 2009; Hopkins and Moore, 2011). The outcomes vary
somewhat across studies, but there is general agreement that
the ability to understand speech in noise is partly determined
by factors other than audibility, such as frequency selectivity
and sensitivity to temporal fine structure. It is possible that
the benefit from signal processing to enhance spectral
changes also depends on such supra-threshold factors. If so,
2996 J. Acoust. Soc. Am., Vol. 131, No. 4, April 2012 Chen et al.: Enhancement of spectral changes in speech
Downloaded 13 Apr 2012 to 131.111.185.82. Redistribution subject to ASA license or copyright; see http://asadl.org/journals/doc/ASALIB-home/info/terms.jsp
measures of these factors could be used to select hearing-
impaired people who would benefit from the processing.
Such measures might also be useful in selecting the parame-
ters of the processing that would work best for a specific
individual. This is an area for future research.
VI. CONCLUSIONS
Following previous studies focusing on “static” spectral
enhancement (Simpson et al., 1990; Baer et al., 1993), weevaluated a processing scheme in which spectral changes
across frames were enhanced. The results of speech intelligi-
bility tests and ratings of clarity preference indicated that the
processing method produced small benefits for hearing-
impaired listeners for speech presented in SSN at a relatively
low SMR (�6 dB). However, for SSN at a higher SMR and
for TTS at both SMRs used, the processing either had little
effect or degraded performance. Further research is needed
to optimize parameter values of the processing, to determine
whether the “best” processing parameters vary across indi-
vidual subjects, and to determine whether the “best” process-
ing parameters can be estimated from measures of supra-
threshold auditory functions.
ACKNOWLEDGMENTS
This work was supported by a Newton International Fel-
lowship from the Royal Society and the Royal Academy of
Engineering. Thomas Baer and Brian C. J. Moore were sup-
ported by the MRC (Grant number G0701870). We thank
Michael Stone for assistance with the experimental set-up.
We also thank Michael Akeroyd and two anonymous
reviewers for their many helpful comments and suggestions
on an earlier version of this paper.
1This involved calculating the output of an array of simulated auditory
filters in response to the magnitude spectrum. Each side of each auditory
filter was modeled as an intensity-weighting function, assumed to have the
form of the rounded-exponential filter described by the formula:
WðgÞ ¼ ð1þ pgÞ expð� pgÞ; where g is the normalized distance from the
center of the filter (distance from center frequency divided by the center
frequency, fc), and p is a parameter determining the slope of the filter
skirts. The value of p was assumed to be the same for the two sides of the
filter and was equal to 4fc/ERBN.2Due to a programming error, the values of S specified in our earlier publi-
cation (Chen et al., 2010) need to be doubled to correspond to the values
of S specified in this paper.
Allen, J. B. (1977). “Short term spectral analysis, synthesis and modification
by discrete Fourier transform,” IEEE Trans. Acoust. Speech Sig. Proc. 25,235–238.
ANSI (1997). ANSI S3.5–1997, Methods for the Calculation of the SpeechIntelligibility Index (American National Standards Institute, New York).
Arbogast, T. L., Mason, C. R., and Kidd, G., Jr. (2002). “The effect of spa-tial separation on informational and energetic masking of speech,” J.
Acoust. Soc. Am. 112, 2086–2098.Baer, T., and Moore, B. C. J. (1997). “Evaluation of a scheme to compensate
for reduced frequency selectivity in hearing-impaired subjects,” in Model-ing Sensorineural Hearing Loss, edited by W. Jesteadt (Erlbaum, New Jer-
sey), pp. 329–341.
Baer, T., Moore, B. C. J., and Gatehouse, S. (1993). “Spectral contrast
enhancement of speech in noise for listeners with sensorineural hearing
impairment: effects on intelligibility, quality and response times,” J.
Rehab. Res. Devel. 30, 49–72.
Boers, P. M. (1980). “Formant enhancement of speech for listeners with sen-
sorineural hearing loss,” IPO Ann. Prog. Rep. 15, 21–28.Brungart, D. S., Simpson, B. D., Ericson, M. A., and Scott, K. R. (2001).“Informational and energetic masking effects in the perception of multiple
simultaneous talkers,” J. Acoust. Soc. Am. 110, 2527–2538.Chen, J., Baer, T., and Moore, B. C. J. (2010). “Effects of enhancement of
spectral changes on speech quality and subjective speech intelligibility,”
in Proceedings of INTERSPEECH 2010 (Tokyo, Japan), pp. 1640–1643.
Coady, J. A., Kluender, K. R., and Rhode, W. S. (2003). “Effects of contrastbetween onsets of speech and other complex spectra,” J. Acoust. Soc. Am.
114, 2225–2235.Dreschler, W. A., and Plomp, R. (1980). “Relations between psychophysical
data and speech perception for hearing-impaired subjects. I,” J. Acoust.
Soc. Am. 68, 1608–1615.Dreschler, W. A., and Plomp, R. (1985). “Relations between psychophysical
data and speech perception for hearing-impaired subjects. II,” J. Acoust.
Soc. Am. 78, 1261–1270.Durlach, N. I., Mason, C. R., Kidd, G., Arbogast, T. L., Colburn, H. S., and
Shinn-Cunningham, B. (2003). “Note on informational masking,” J.
Acoust. Soc. Am. 113, 2984–2987.Festen, J. M., and Plomp, R. (1983). “Relations between auditory functions
in impaired hearing,” J. Acoust. Soc. Am. 73, 652–662.Freyman, R. L., Balakrishnan, U., and Helfer, K. S. (2001). “Spatial releasefrom informational masking in speech recognition,” J. Acoust. Soc. Am.
109, 2112–2122.Freyman, R. L., Balakrishnan, U., and Helfer, K. S. (2004). “Effect of num-
ber of masking talkers and auditory priming on informational masking in
speech recognition,” J. Acoust. Soc. Am. 115, 2246–2256.Freyman, R. L., Helfer, K. S., McCall, D. D., and Clifton, R. K. (1999).“The role of perceived spatial separation in the unmasking of speech,” J.
Acoust. Soc. Am. 106, 3578–3588.Glasberg, B. R., and Moore, B. C. J. (1986). “Auditory filter shapes in sub-
jects with unilateral and bilateral cochlear impairments,” J. Acoust. Soc.
Am. 79, 1020–1033.Glasberg, B. R., and Moore, B. C. J. (1989). “Psychoacoustic abilities of
subjects with unilateral and bilateral cochlear impairments and their
relationship to the ability to understand speech,” Scand. Audiol. 32,1–25.
Gordon-Salant, S. (1986). “Recognition of natural and time/intensity altered
CVs by young and elderly subjects with normal hearing,” J. Acoust. Soc.
Am. 80, 1599–1607.Hansen, J. H. L., and Pellom, B. L. (1998). “An effective quality evaluation
protocol for speech enhancement algorithms,” ICSLP 7, 2819–2822.Hazan, V., and Simpson, A. (1998). “The effect of cue-enhancement on the
intelligibility of nonsense word and sentence materials presented in noise,”
Speech Commun. 24, 211–226.Hazan, V., and Simpson, A. (2000). “The effect of cue-enhancement on con-
sonant intelligbility in noise: speaker and listener effects,” Lang. Speech.
43, 273–294.Hopkins, K., and Moore, B. C. J. (2011). “The effects of age and cochlear
hearing loss on temporal fine structure sensitivity, frequency selectivity,
and speech reception in noise,” J. Acoust. Soc. Am. 130, 334–349.Hopkins, K., Moore, B. C. J., and Stone, M. A. (2008). “Effects of moderate
cochlear hearing loss on the ability to benefit from temporal fine structure
information in speech,” J. Acoust. Soc. Am. 123, 1140–1153.Humes, L. E., and Roberts, L. (1990). “Speech-recognition difficulties of thehearing-impaired elderly: The contributions of audibility,” J. Speech.
Hear. Res. 33, 726–735.Kewley-Port, D., Pisoni, D. B., and Studdert-Kennedy, M. (1983).“Perception of static and dynamic cues to place of articulation in initial
stop consonants,” J. Acoust. Soc. Am. 73, 1779–1793.Kidd, G., Mason, C. R., Deliwala, P. S., Woods, W. S., and Colburn, H. S.
(1994). “Reducing informational masking by sound segregation,” J.
Acoust. Soc. Am. 95, 3475–3480.Kidd, G., Mason, C. R., Rohtla, T. L., and Deliwala, P. S. (1998).“Release from masking due to spatial separation of sources in the identi-
fication of nonspeech auditory patterns,” J. Acoust. Soc. Am. 104,422–431.
Kluender, K. R., Coady, J. A., and Kiefte, M. (2003). “Sensitivity to change
in perception of speech,” Speech Commun. 41, 59–69.Li, L., Daneman, M., Qi, J. G., and Schneider, B. A. (2004). “Does the infor-mation content of an irrelevant source differentially affect spoken word
recognition in younger and older adults?,” J. Exp. Psych.: Hum. Per. Perf.
30, 1077–1091.
J. Acoust. Soc. Am., Vol. 131, No. 4, April 2012 Chen et al.: Enhancement of spectral changes in speech 2997
Downloaded 13 Apr 2012 to 131.111.185.82. Redistribution subject to ASA license or copyright; see http://asadl.org/journals/doc/ASALIB-home/info/terms.jsp
MacLeod, A., and Summerfield, Q. (1990). “A procedure for measuring au-
ditory and audio-visual speech-reception thresholds for sentences in noise:
rationale, evaluation, and recommendations for use,” Br. J. Audiol. 24,29–43.
Mattys, S. L., Brooks, J., and Cooke, M. (2009). “Recognizing speech under
a processing load: dissociating energetic from informational factors,” Cog-
nitive Psychol. 59, 203–243.Moore, B. C. J. (1996). “Perceptual consequences of cochlear hearing loss
and their implications for the design of hearing aids,” Ear Hearing 17,133–161.
Moore, B. C. J. (2003). “Temporal integration and context effects in
hearing,” J. Phonetics 31, 563–574.Moore, B. C. J. (2007). Cochlear Hearing Loss: Physiological, Psychologi-cal and Technical Issues, 2nd ed. (Wiley, Chichester), pp. 332.
Moore, B. C. J. (2008). “The role of temporal fine structure processing in
pitch perception, masking, and speech perception for normal-hearing and
hearing-impaired people,” J. Assoc. Res. Otolaryngol. 9, 399–406.Moore, B. C. J., and Glasberg, B. R. (1983). “Suggested formulae for calcu-
lating auditory-filter bandwidths and excitation patterns,” J. Acoust. Soc.
Am. 74, 750–753.Moore, B. C. J., and Glasberg, B. R. (1998). “Use of a loudness model for
hearing aid fitting. I. Linear hearing aids,” Br. J. Audiol. 32, 317–335.Oxenham, A. J., Fligor, B. J., Mason, C. R., and Kidd, G., Jr. (2003).“Informational masking and musical training,” J. Acoust. Soc. Am. 114,1543–1549.
Simpson, A. M., Moore, B. C. J., and Glasberg, B. R. (1990). “Spectralenhancement to improve the intelligibility of speech in noise for hearing-
impaired listeners,” Acta Otolaryngol. 469, 101–107.Stone, M. A., and Moore, B. C. J. (1992). “Spectral feature enhancement for
people with sensorineural hearing impairment: Effects on speech intelligi-
bility and quality,” J. Rehab. Res. Devel. 29, 39–56.Stone, M. A., and Moore, B. C. J. (2002). “Tolerable hearing-aid delays. II.
Estimation of limits imposed during speech production,” Ear Hearing 23,325–338.
Stone, M. A., and Moore, B. C. J. (2003). “Effect of the speed of a single-
channel dynamic range compressor on intelligibility in a competing
speech task,” J. Acoust. Soc. Am. 114, 1023–1034.Stone, M. A., and Moore, B. C. J. (2004). “Side effects of fast-acting dynamic
range compression that affect intelligibility in a competing speech task,” J.
Acoust. Soc. Am. 116, 2311–2323.
Stone, M. A., and Moore, B. C. J. (2008). “Effects of spectro-temporal
modulation changes produced by multi-channel compression on intelli-
gibility in a competing-speech task,” J. Acoust. Soc. Am. 123,1063–1076.
Stone, M. A., Fullgrabe, C., Mackinnon, R. C., and Moore, B. C. J. (2011).“The importance for speech intelligibility of random fluctuations in
“steady” background noise,” J. Acoust. Soc. Am. 130, 2874–2881.Strelcyk, O., and Dau, T. (2009). “Relations between frequency selectivity,
temporal fine-structure processing, and speech reception in impaired
hearing,” J. Acoust. Soc. Am. 125, 3328–3345.Summerfield, A. Q., Foster, J., Tyler, R., and Bailey, P. J. (1985).“Influences of formant narrowing and auditory frequency selectivity on
identification of place of articulation in stop consonants,” Speech Com-
mun. 4, 213–229.Summerfield, Q., Haggard, M. P., Foster, J., and Gray, S. (1984). “Perceivingvowels from uniform spectra: Phonetic exploration of an auditory after-
effect,” Percept. Psychophys. 35, 203–213.Virag, N. (1999). “Single channel enhancement based on masking properties
of the human auditory system,” IEEE Trans. Speech Audio Process. 7,126–137.
Watkins, A. J. (1991). “Central, auditory mechanisms of perceptual compen-
sation for spectral-envelope distortion,” J. Acoust. Soc. Am. 90,2942–2955.
Watkins, A. J., and Makin, S. J. (1996). “Effects of spectral contrast on per-
ceptual compensation for spectral-envelope distortion,” J. Acoust. Soc.
Am. 99, 3749–3757.Watson, C. S. (1987). “Uncertainty, informational masking, and the capacity
of immediate auditory memory,” in Auditory Processing of ComplexSounds, edited by W. A. Yost, and C. S. Watson (Lawrence Erlbaum
Associates, Hillsdale, N.J.), pp. 267–277.
Wu, X. H., Chen, J., Yang, Z. G., Huang, Q., Wang, M. Y., and Li, L.
(2007). “Effect of number of masking talkers on speech-on-speech
masking in Chinese,” in Proceedings of INTERSPEECH 2007 (Antwerp,
Belgium), pp. 390–393.
Wu, X. H., Wang, C., Chen, J., Qu, H. W., Li, W. R., Wu, Y. H., Schneider,
B. A., Li, L. (2005). “The effect of perceived spatial separation on infor-
mational masking of Chinese speech,” Hearing Res. 199, 1–10.Yoo, S. D., Boston, J. R., El-Jaroudi, A., Li, C. C., Durrant, J. D., Kovacyk,
K., Shaiman, S. (2007). “Speech signal modification to increase intelligi-
bility in noisy environments,” J. Acoust. Soc. Am. 122, 1138–1149.
2998 J. Acoust. Soc. Am., Vol. 131, No. 4, April 2012 Chen et al.: Enhancement of spectral changes in speech
Downloaded 13 Apr 2012 to 131.111.185.82. Redistribution subject to ASA license or copyright; see http://asadl.org/journals/doc/ASALIB-home/info/terms.jsp