effect of dietary omega3 fatty acids on retinal function of very-low-birth-weight neonates
TRANSCRIPT
0031-3998(90(2805-0485$02.00(0PEDIAT RIC RESEARCHCopyright © 1990 Internati onal Pediatric Research Foundation, Inc.
Vol. 28. No. 5, 1990Printed in U.S. A.
Effect of Dietary Omega-3 Fatty Acids on RetinalFunction of Very-Low-Birth-Weight Neonates'
RICARDO D. UAUY , DAVID G. BIRCH, EILEEN E. BIRCH, JO N E. TYSON, ANDDENNIS R. HOFFMAN
Department ofPediatrics [R.D. U; J.E. T.. D.R .H.} and Ophthalmology [D.G.B.. E.E.B.} and H uman Nutr itionCenter [R.D.U., D.R.H.} University of Texas South western Me dical Center, Dallas, Texas 75235-9063 and The
Retina Foundation ofthe So uthwest, Dallas, Texas 7523 1 [D.G.B., E.E.B.}
ABSTRACf. Retinal function was assessed by electroretinogram in 32 neonate s randomly assigned to formulas ofdifferent w-3 fatty acid content and in 10 infants fed humanmilk . All neonates had a birth weight of 1000-1500 g andwere fed study diets from d 10 to 45 or discharge. GroupA received formula containing predominantly 18:2 w-6.Group B received a balanced mix of 18:2 w-6 and 18:3 w3. Group C was given a formula containing both essentialfatty acids and supplemented with marine oil to provide22:6 w-3 content similar to that of human milk . The fattyacid composition of plasma and red blood cell (RBC) lipidswere similar for all groups on entry but marked dietinduced differences were found after feeding the studydiets. Group C was comparable to the human milk-fedgroup, but group A had lower 22:6 w-3 and w-3 long-chainpolyunsaturated fatty acids (LCPUFA) in plasma and RBCmembranes. Cone function was not affected by dietaryessential fatty acids. Rod electroretinogram thresholdswere significantly higher for group A relative to the humanmilk-fed group and group C and significantly correlatedwith RBC w-3 LCPUFA (r = -0.63, p < 0.0001); 44% ofthe variance could be explained by RBC and plasma w-3LCPUFA content. Rod electroretinogram amplitude wassignificantly lower for group A relative to the human milkfed group and group C and related to plasma 22:6 w-3 (r=0.55) and total w-3 LCPUF A (r =0.58) (both p <0.0001); 42% of the variance was explained by plasma w3 LCPUFA, the ratio of w-6/w-3 LCPUFA in RBC, andgestational age at birth. Our results support an essentialrole for w-3 fatty acids in retinal development. (PediatrRes 28: 485-492, 1990)
Abbreviations
18:2 w-6, linoleic acid18:3 w-3, a-linolenic acidEPA, eicosapentaenoic acid, 20:5 w-3DHA, docosahexaenoic acid, 22:6 w-3FA, fatt y acidEFA, essential fatty acidPUFA, polyunsaturated fatty acidLCPUFA, PUFA with greater than 18 carbon chain lengthERG, electroretinogramVLBW, very low birth weight
Received March 6, 1990: accepted May 31, 1990.Correspondence and reprin t requests: Ricardo Uauy, M.D., Ph.D., Depart ment
of Pediatrics, Uni versity of Texas South western Medical Center, 5323 Harry HinesBlvd., Dallas, TX 75235-9063.
Supported in part by National Institute of Child Health and Development GrantHD 22380 (RU), United Cerebral Palsy Research Foundation UCP R 375-87 (RU),and National Eye Institute G rants EY 05235 (DB), EY 05236 (EB), and GCRCCPediatric Subunit USPHS MOI-RR0063.
I Presented in part at FASEB 1989 Meeting, New Orleans. LA.
PTHM, preterrn human milkRBC, red blood cellCFF, critical fusion frequenc yANOVA, analy sis of variance
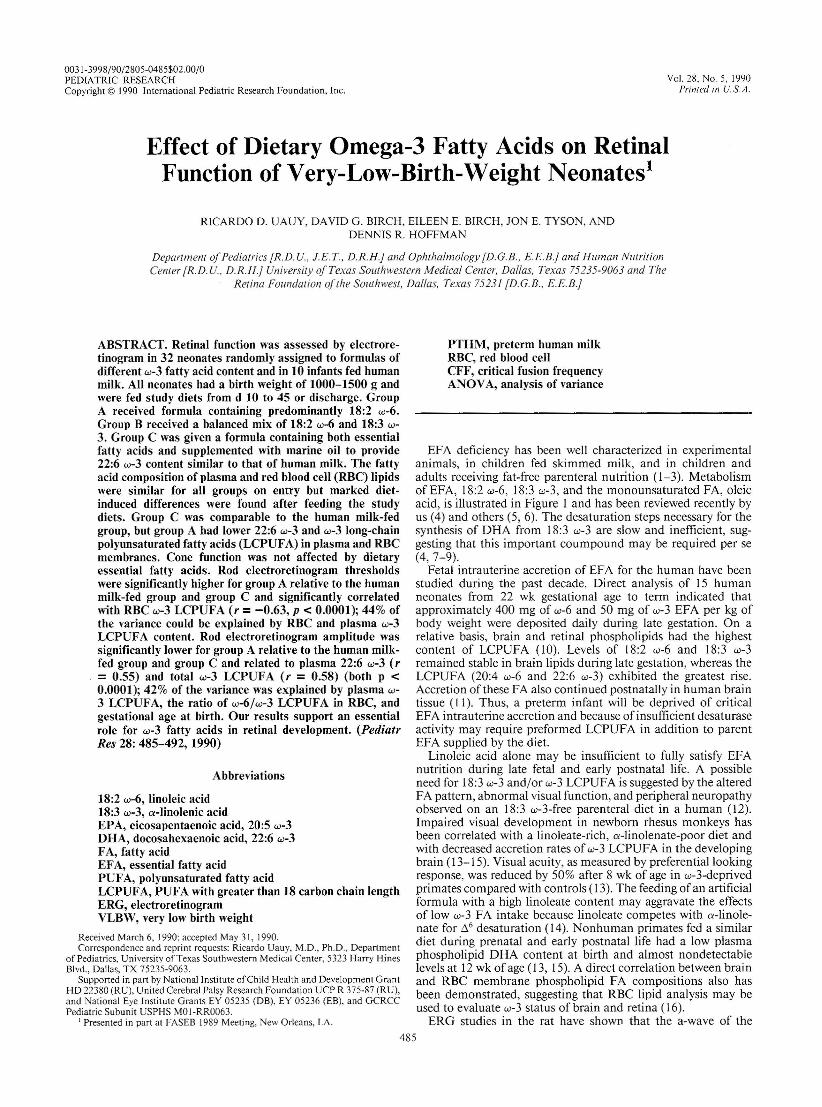
EFA deficiency has been well characterized in experime nta lanimals, in childre n fed skimmed milk, and in children andadults receiving fat-free parenteral nutrition (1-3). MetabolismofEFA, 18:2 w-6, 18:3 w-3 , and the monounsaturated FA, oleicacid, is illustrated in Figure I and has been reviewed recently byus (4) and others (5, 6). The desaturation steps necessary for thesynthesis of DBA from 18:3 w-3 are slow and inefficient, suggesting that this important coumpound may be required per se(4, 7- 9).
Fetal intrauterine accret ion of EFA for the human have beenstudied du ring the past decade. Direct anal ysis of 15 humanneonates from 22 wk gestational age to term indicated thatapproximately 400 mg of w-6 and 50 mg of w-3 EFA per kg ofbody weight were deposited daily during late gestation. On arelat ive basis, brain and retinal phospholipids had the highestcontent of LCPUFA (10). Levels of 18:2 w-6 and 18:3 w-3remained stable in brain lipids du ring late gestatio n, whereas theLCPUFA (20:4 w-6 and 22:6 w-3) exhibited the greatest rise.Accretion of these FA also continued postnatall y in human braintissue (11). Thus, a preterm infant will be deprived of criticalEFA intrauterine accretion and because of insufficient desaturaseactivity may requ ire preformed LCPUFA in addition to parentEFA suppli ed by th e diet.
Linoleic acid alone may be insufficient to fully satisfy EFAnutrition during late fetal and early postnatal life. A possibleneed for 18:3 w-3 and/ or w-3 LCPUFA is suggested by th e alteredFA patt ern , abn orm al visual func tion , and peripheral neuropathyobserved on an 18:3 w-3-free parenteral diet in a human (12) .Impaired visual development in newborn rhesu s monkeys hasbeen correlated with a linoleate-rich, o-lino lenate-poor diet andwith decreased accretion rates of w-3 LCPUFA in the developingbrain (13- 15). Visual acuity, as measured by preferential lookin gresponse , was reduced by 50% after 8 wk of age in w-3-deprivedprimates compared with controls (13). Th e feeding of an artificialformula with a high linoleate content may aggravate the effectsof low w-3 FA intake because linoleate competes with o-linolenate for !:>,6 desatu rat ion ( 14). Nonhuman primates fed a similardiet du ring prenatal and early postnatal life had a low plasmaphospholipid DBA content at birth and almost nondetectablelevels at 12 wk of age (13, 15). A direct cor relation between bra inand RBC membrane phospholipid FA compositions also hasbeen dem onstrated, suggesting that RBC lipid analysis may beused to evaluate w-3 status of brain and retina (16).
ERG studies in the rat have shown that th e a-wave of th e485
486 UA UY ET AL.
ENDOGENOUS FA 6 6 t }16:0-18:0 -18:1 - 18:2 -20:2 - 2 0:3 - 22:3
MATERIALS AND METHODS
Subjects. Newborns were eligible for the study if they had abirth weight of 1000- I500 g that was appropriate for gestationalage, if they were able to receive enteral feedings (70-120 kcal/kg), and if they were free of major neonatal morbidity by d 10.Ten infants fed PTH M (their own mother's milk) from birth
oleic
Fig. I. Metabol ic pathways for elongation and desaturation for bothw-3 (18:3, a -linolenic acid) and w-6 series (18:2, linoleic acid) dietaryparent EFA. Elongation occurs in two carb on units and Ll.-desaturases(Ll.6, Ll.5, M ) introduce dou ble bonds at carbons 6,5, and 4 from carboxytermi nus. FA 20:3 w-6, 20:4 w-6 (arachidoni c acid), and EPA are precursors of prostagland ins (PG) of I, 2, and 3 series, respectively. DHA is ofcritical significance in retinal and brain developm en t. The product ofendogenous FA metabolism is 16:0; it can be elongated to 18:0 anddesaturated to 18: I w-9 (oleic acid), which may also be derived from thediet(4).
ERG, primarily related to photorecep tor function, is significantlyreduced by EFA deficiency (17). The experimenta l group fed an18:2 w-6-enriched diet had part ial improvement relative to thegroup fed an EFA-deficient diet but was still 33% lower than thew-3 FA-supplemented group (17). Another relevant animal studyshowed superior learning capacity of rats fed soybean oil (18:2w-6/ 18:3 w-3 = 6) compared with those fed safflower oil (18:2 w6/ I8:3 w-3 = 258) (18). The former had higher levels of DHA inbrain lipids, supporting the essential role of w-3 FA in this tissue.Although the animal data are suggestive, no conclusive studysupports the need for w-3 FA in the human diet.
The VLBW infant has nearly absent peripheral adipose tissueand decreased reserves of EFA. Studies of VLBW infants givenfat-free glucose-amino acid mixtures show evidence of EFAdeficit in plasma phospholipids by postna tal d 5 (19). Theproblem of w-3 EFA deficit in infancy has not been fully addressed. However, considering that the elongation-desaturationpathways are most likely limited in early life, the dietary supplyofiong-chain w-3 PUFA will not match the intrauterine accretionrates unless the VLBW infant receives hum an milk (9- I I), Giventhe composition of preterm breast milk, an intake of 200 ml.zkgprovides the 1300-g neonate with 139 mg of total w-3 EFAincluding 70 mg w-3 LCPUFA per day (20). This provision ofEFA and LCPUFA meets the daily needs based on the accretionrates during development. Corn oil-based formula as comparedwith human milk is lower in oleic acid, higher in 18:2 w-6, andhas very little w-3 FA. Soy oil-based formula provides ample 18:3w-3 but contains no w-3 LCPUFA (4, 21).
The goal of our study was to evaluate whether w-3 FA areessential for the developing retina in hum ans by measuring theeffect of dietary EFA on rod and cone function in VLBWneonat es early in postnatal life. The diets used served to test ifthe 18:3 w-3, provided by replacing corn with soy oil in mediumchain triglyceride/coconut/corn oil-based formula, was necessaryfor optimal retinal development or if w-3 LCPUFA (EPA andDHA) from marine sources were also required. The human milkfed group was considered normative because the w-3 FA supplywas adequate to meet accretion needs.
served as controls. Formula groups were matched by birth weight(1000- 1249 and 1250-1 500 g) and sex. They were rand omlyassigned by d 10 of life to one of three test diets that werecontinued throughout the study until visual testing was completed at 36 wk postconception. Initial feedings before d 10consisted of diluted standard premature formul a or a smallvolume of breast milk for the hum an milk group supplementedby parenteral glucose and amino acids. Int ravenous lipids wereallowed up to d 7 of life. Infants were excluded for the followingtypes of significant neonatal morbidity likely to influence feedingor visual responses: respirator treatment for more than 7 d,congenital infection, any major malformation, bowel resection ,and grade III or IV intracranial hemorrhage. Infants were alsoexcluded for maternal factors such as abnormal dietary patterns,strict vegetarian or vegan diets, or metabolic disease that mayaffect EFA status of mother or fetus. All infants were checked at30-40 d by an ophth almologist for degree of retinopathy ofprematurity. Those with retinopathy grade 3 or greater (likely toproduce lasting visual impairment) were not included in thevisual response evaluation (22). Care was taken to avoid samplingblood within 48 h of blood transfusion, This time was consideredsufficient for a new equilibrium of plasma lipid FA composition.The project was approved by the Institutional Review Board ;parents were informed on the nature of the study and writtenconsent was obtained in all cases. All infants received vitaminand mineral supplements in accordance with the nursery routineto meet present recomme ndations for VLBW infants includingtaurine supplem entation. Practices in our unit include providingdaily multivitamins drops (A, C, and D) and vitamin E, 25 IVper day for 14 d after feedings are well tolerated. Iron-supplemented formula is given after 30 d of age.
VLBW neonates enrolled in this study from Ju ly 1987 to June1989 were monitored daily by a research nurse. Volume ofintake, feeding tolerance, and weight were recorded daily. Lengthand head circumference were measured weekly. Clinical care wasprovided by the atte nding neonatologist and resident physicianswho were familiar with the study but blinded to diet groupassignment.
Diets. The human milk group received refrigerated or prefrozen (gently thawed) PTHM supplemented with a standa rdizedhum an milk fortifier (Enfamil, Mead-Johnson Bristol-MyersComp any, Evansville, IN) to assure comparable macro- andmicronutrient intake. Pooled composite samples of PTHM obtained before feeding were stored at - 70°C and analyzed for totalfat and FA composition on d 10, 20, and 30. The human milkfed group received a mean of 75% of their intake as PTHM(range, 60- 100%); formu la C, containing LCPUFA of the w-3series, was used as a supplement if mothers were unable to fullyprovide for their infants' need. Groups A, B, and C were fedformulas adapted to the needs ofVLBW neonates with a proteincontent of 2.4 gjdL, whey:casein 60/40, carbohydrates 8.9 gjdL,lactose:glucose polymers 40/ 60, fat 4. I g/dl, with varyingamounts of EFA. Full details of the FA comp osition of theseformul as as compared with PTHM are given in Table I. FormulaA, low in all w-3 FA, corresponds to the fat comp osition ofEnfamil Premature (Mead-Johnson Bristol-Myers Co.) before1987. Formula B contains ample 18:3 w-3 but no w-3 LCPUFA.Formula C, supplemented with 18:3 w-3 and marine oils, is highin EPA and DHA. These formul ations were specially preparedfor this study by Mead Johnson Nutritio nal Division (Evansville,IN). All infants consumed study diets for at least 20 d and up to35 d before blood sampling as determined by discharge criteria(weight> 1800 g).
The vitamin and mineral content of the milk formula met therecommendations of the American Academy of Pediatrics forlow-birth-weight neonates. Vitamin E content was adjusted tosecure at least 2 mg of tocopherol per g of unsaturated FA in theformula, This has been shown to prevent FA peroxidation in theproduct for at least 24 mo.
ERG. Full-field ERG were obtained at 36 wk postconception
PG 1 PG 2
6 6 I 6 5 I 6 4
18:2 - 18 :3- 2 0: 3 - 2 0 :4 - 22:4 - 22:5l inoleic
PG 36 6 6 5 I 6 4
18:3 -18:4 -20:4 - 20:5-22:5 - 22:6linolenic
W3/
DIETARYEFA
--- W6
OMEGA-3 FATT Y ACIDS AND RETI NAL FUNCTION 487
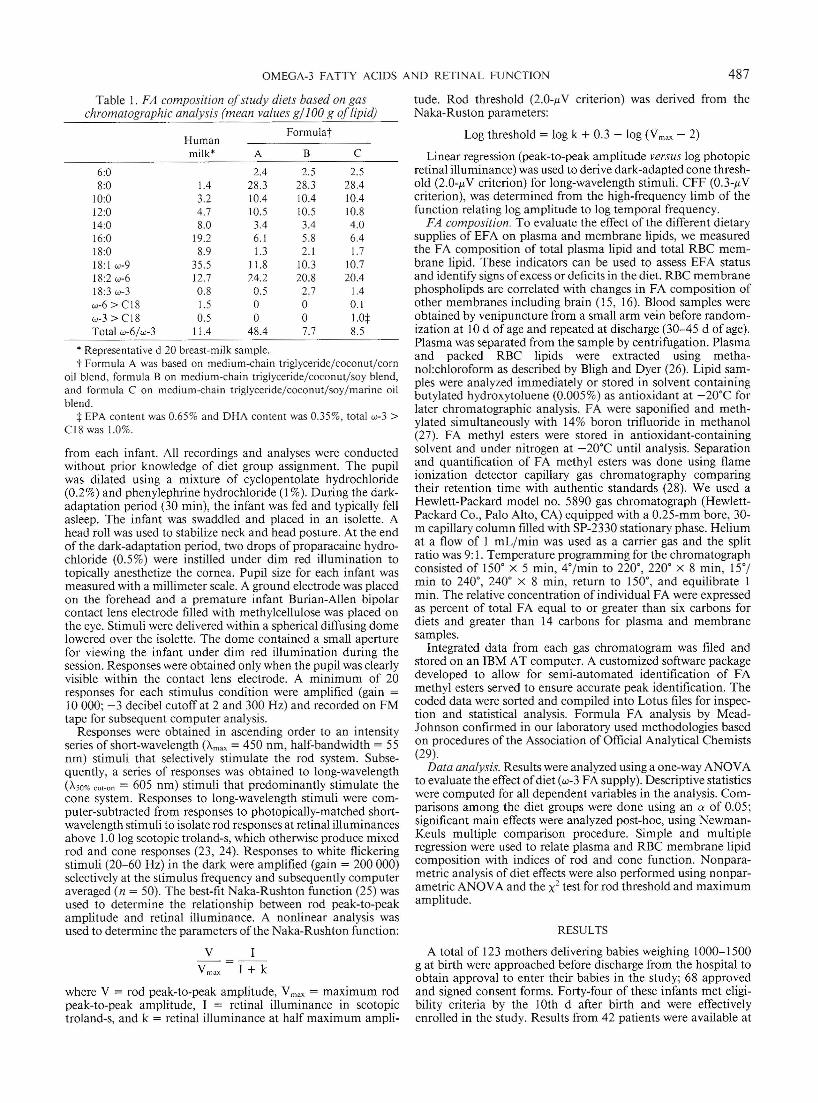
Table 1. FA composition ofstudy diets based on gaschromatographic analysis (mean values g/ 100 g oflipid)
tude. Rod thr eshold (2.0-11V criterion) was derived from theNaka-Ruston parameters:
V I--=--Vmax I + k
where V = rod peak-to-peak amplitude, Vmax = maximum rodpeak-to-peak amplitude, I = retinal illuminance in scotopictroland-s, and k = retinal illum inance at half maximum ampli-
* Representative d 20 breast-mi lk sam ple.t Formula A was based on medium-chain triglyceride/ coco nut/ corn
o il blend , formula B on medium-chain triglycer ide/ coconut / soy blend,and form ula C on med ium-chain triglyceride/ coconut/ soy/ marine oilblend.
:j: EPA conten t was 0.65% and DH A content was 0.35%, total w-3 >C 18 was 1.0%.
from each infant. All recordings and analyses were conductedwithout prior knowledge of diet group assignment. The pup ilwas dilated using a mixture of cyclopentolate hydrochloride(0.2%) and phenylephrine hydrochloride (I %). During the darkadaptation period (30 min ), the infant was fed and typically fellasleep. The infant was swaddled and placed in an isolette. Ahead roll was used to stabi lize neck and head posture . At the endof the dark-adaptation period, two drops of proparacaine hydrochloride (O. S%) were instilled under dim red illum ination totopically anesthetize the cornea. Pupil size for each infant wasmeasured with a millimeter scale. A ground electrode was placedon the forehead and a premature infant Burian-Allen bipolarcontact lens electrode filled with methylcellulose was placed onthe eye. Stimuli were delivered within a spherical diffusing domelowered over the isolette. The dome contained a small aperturefor viewing the infant under dim red illumination duri ng thesession. Responses were obtained only when the pupil was d earlyvisible within the contact lens electrode. A minimum of 20responses for each stimulus condition were amplified (gain =10 000; -3 decibel cutoff at 2 and 300 Hz) and recorded on FMtape for subsequent computer analysis.~esponses were obtained in ascending order to an intensity
sen es of short-wavelength (Amax = 4S0 nm, half-bandwidth = SSnm ) stimuli that selectively stimulate the rod system. Subsequently, a series of responses was obtained to long-wavelength(A50%cut-on = 60S nm) stimuli that predom inantly stimul ate thecone system. Responses to long-wavelength stimuli were computer-subtracted from responses to photopically-matched shortwavelength stimuli to isolate rod responses at retinal illumin ancesabove 1.0 log scotopic troland-s, which otherwise produce mixedrod and cone responses (23, 24). Responses to white flickeringstimuli (20- 60 Hz) in the dark were amplified (gain = 200000)selectively at the stimulus frequency and subsequently computeraveraged (n = SO). The best-fit Naka-Rushton function (2S)wasused to determine the relationship between rod peak-to-peakamplitude and retinal illuminance. A nonlin ear analysis wasused to determine the parameters of the Naka-Rushton function:
6:0 2.48:0 1.4 28.3
10:0 3.2 10.412:0 4.7 10.514:0 8.0 3.416:0 19.2 6.1[8:0 8.9 1.318: I w-9 35.5 11.818:2 w-6 12.7 24.218:3 w-3 0.8 0.5w-6 > C18 1.5 0w-3> C I8 0.5 0Tot al w-6/ w-3 11.4 48.4
RESULTS
A total of 123 mothers delivering babies weighing 1000- ISOOg at birth were approached before discharge from the hospital toobtain approval to enter their babies in the study ; 68 approvedand signed consent form s. Forty-four of these infants met eligibility criteria by the 10th d after birth and were effectivelyenrolled in the study. Results from 42 patients were available at
Log threshold = log k + 0.3 - log (Vmax - 2)
Linear regression (peak-to-peak amp litude versus log photopicretinal illuminance) was used to derive dark-adapted cone threshold (2.0-11V criterion) for long-wavelength stimuli. CFF (0.3-/-LVcriterion), was determined from the high-frequency limb of thefunction relating log amplitude to log temporal frequenc y.
FA .composition. To evaluate the effect of the different dietarysupplies of EFA on plasma and memb rane lipids, we measuredthe FA composition of total plasma lipid and total RBC membran e lipid. These indicators can be used to assess EFA statusand identify signs of excess or deficits in the diet. RBC membranephospholipds are corre lated with changes in FA composition ofother membranes includ ing brain (I S, 16). Blood samples wereobta ined by venipuncture from a small arm vein before randomization at 10 d of age and repeated at discharge (30-4S d of age).Plasma was separated from the sample by centrifugation. Plasmaand packed RBC lipids were extracted using methanol:chloroform as described by Bligh and Dyer (26). Lipid samples were analyzed imm ediately or stored in solvent containingbut ylated hydroxytoluene (O.OOS %) as antioxidant at - 20°C forlater chromatographic analysis. FA were saponified and methylated simultaneously with 14% boron trifluoride in methanol(27). FA methyl esters were stored in antioxidant-containingsolvent and under nitrogen at - 20°C unt il analysis. Separationand quantification of FA meth yl esters was don e using flameionization detecto r capillary gas chromatography comparingtheir retention time with authentic standards (28). We used aHewlett-Packard mod el no. 5890 gas chromatograph (HewlettPackard Co., Palo Alto, CA) equipped with a 0.2S-mm bore, 30m capillary column filled with SP-2330 stationary phase. Heliumat a flow of 1 ml. Zmin was used as a carrier gas and the splitratio was 9:I . Temperature programming for the chromatographconsisted of IS0° x S min, 4°/min to 220°, 220° x 8 min, l SO/m~n to 240°, 240° x 8 min, return to I SOo, and equilibrate 1mill. Th e relat ive concentration of individual FA were expressedas percent of total FA equal to or greater than six carbons fordiets and greater than 14 carbons for plasma and membranesamples.
Integrated data from each gas chromatogram was filed andstored on an IBM AT computer. A customized software packagedeveloped to allow for semi-automated identi fication of FAmethyl esters served to ensure accurate peak ident ificat ion. Th ecoded data were sorted and compiled into Lotus files for inspection and statistical analysis. Formul a FA anal ysis by MeadJohn son confirmed in our laboratory used meth odologies basedon procedures of the Association of Official Analytical Chemists(29).
Data analysis. Results were analyzed using a one-way ANOVAto evaluate the effect ofdiet (w-3 FA supply). Descript ive statist icswere computed for all dependent variables in the analysis. Comparisons among the diet groups were done using an a of O.OS·significant main effects were analyzed post-hoc, using NewmanKeuls .multiple com parison procedure. Simple and multipleregression were used to relate plasma and RBC membrane lipidcomposition with indices of rod and cone function . Nonparametric analysis of diet effects were also performed using nonparametric ANOVA and the x2 test for rod threshold and maximu mam plitud e.
2.528.410.410.84.06.41.7
10.720.4
1.40.11.0:j:8.5
C
2.528.310.410.53.45.82.1
10.320.8
2.7oo7.7
B
Formu la]
AHu manmilk*
488 UAUY ET AL.
th e time of this anal ysis because two of 44 patients were droppedfrom the study due to medical complicatio ns (one for necrotizi ngenterocolitis and one for patent ductus arteriosus requiring surgery). Information on the 42 infants is presented in Table 2.Comparability of subjects by diet group for the main interveningvariables was tested and is summarized. Subjects in the differentdiet groups had comparable birth weight , length, gestational age,weight at entry to the study, and gross energy intake throughoutth e study. The weight and postconceptional age at the time ofvisual testing were also similar. Information on the mean numberof days to reach 1800 g and anthropometry at 40 wk are alsoprovided for the stud y groups. Th e human milk group requiredsignificantly longer time to reach 1800 g as compared with eachof the three form ula groups (p < 0.05).
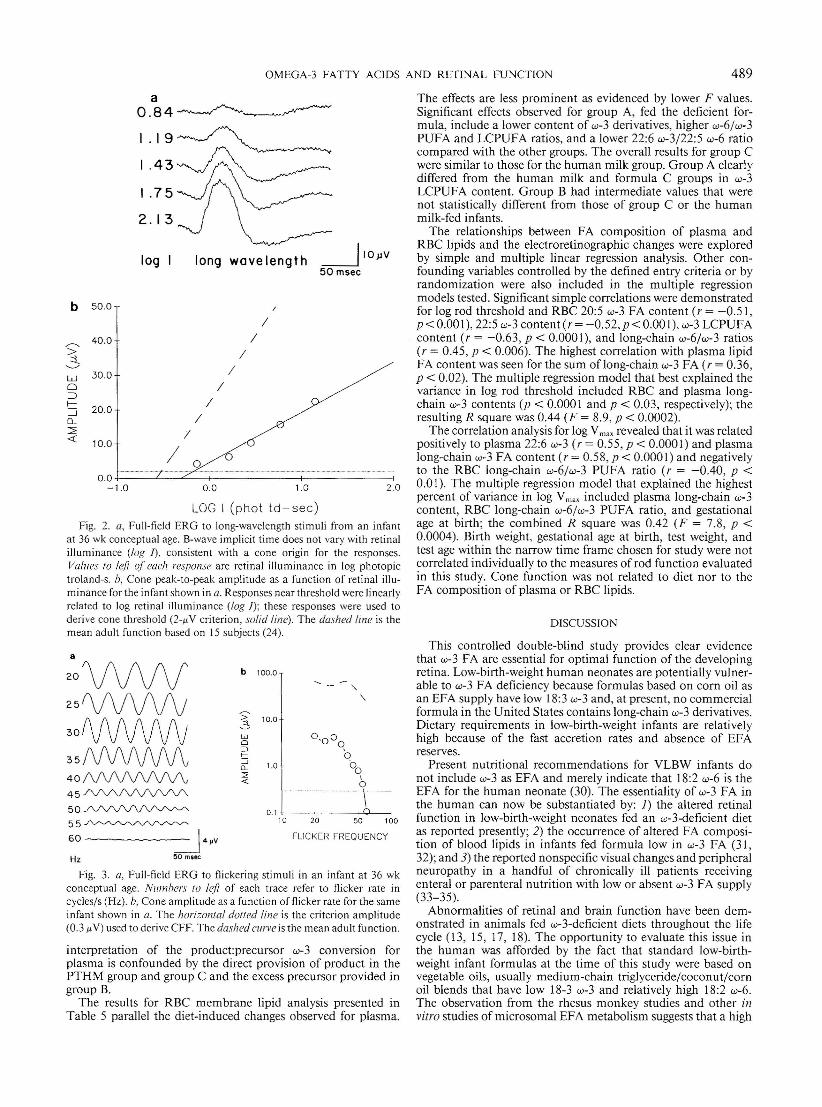
Responses from a dark-adapted infan t at 36 wk postconceptionto an ascend ing series of long-wavelength flashes are shown inFigure 2a. The cone origin of these responses is eviden t from therelatively short b-wave implicit times (time from stim ulus topositive peak) . As is the case in adults, cone b-wave imp licit timedoes not vary with retinal illuminance. Amplitudes as a functionof retina l illuminance are plotted in Figure 2b along with thebest-fit regression line (solid line) and the mean adult function(dotted line). A 2.0-j.tY criterion was used to determine conethreshold from the best-fit regression line for each infant. Although the slopes are clearly different, cone threshold in th isinfant was with in 0.3 log unit of mean adult values.
Cone responses to a series of flicker rates are shown for arepresentati ve 36-wk-old infant in Figure 3a. Ricker rates lessthan 20 Hz were not used because of possible rod intrusion. Ingeneral, cone amplitude decreased systematically with increas ingflicker rate and was nondetectab le by 60 Hz . Peak-to-peak amplitude is plott ed in Figure 3b (open circles) along with the meanadult function (dashed curve). CFF for each infant was definedas the frequency prod ucing a 0.3-,uV amplitude (do tted horizontal line). For this particular infant, CFF was 55 Hz. Mean ± SDcone thresholds and CFF for each dietary group are shown inTable 3. ANOV A showed no significant differences amonggroups.
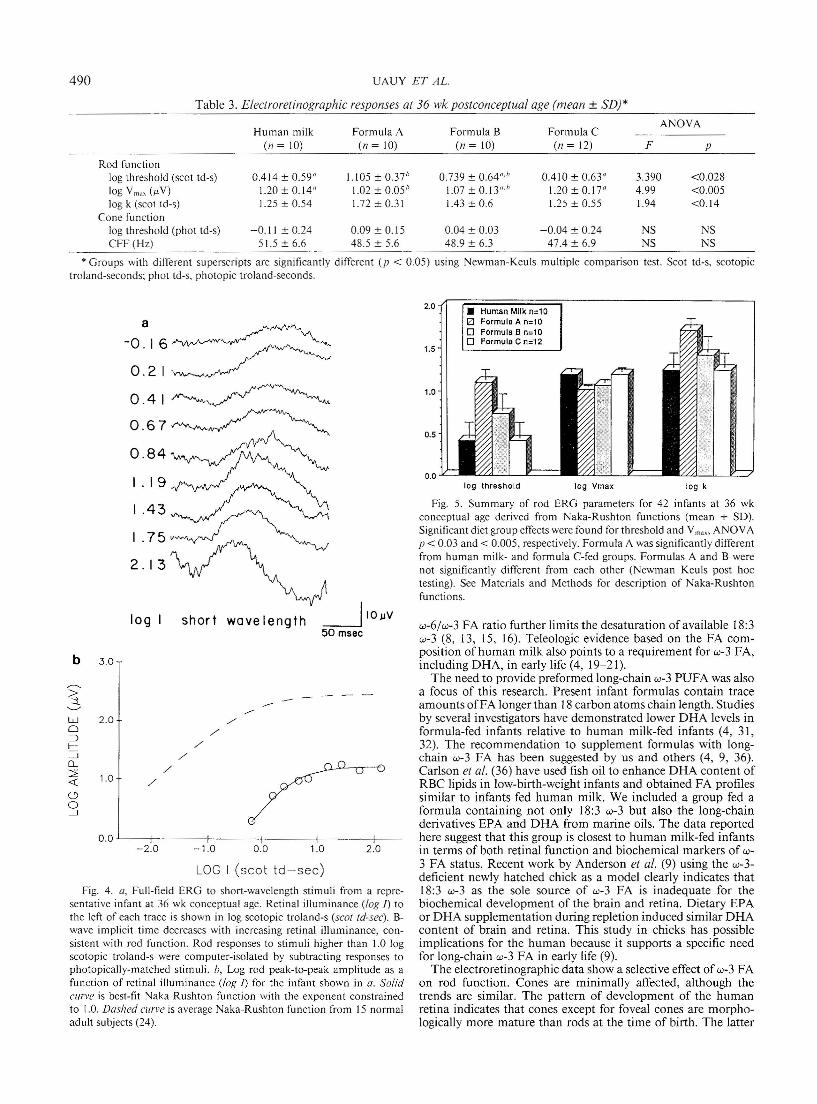
Responses from a dark-adapted 36-wk-old infant to a series ofshort-wavelength flashes are shown in Figure 4a. The rod originof respon ses to flashes less than 1.19 log scotopic troland-s isevident from the waveform , th e pro longed b-wave im plicit tim e,and the decrease in b-wave imp licit time with increasing retinalilluminance. For respon ses of 1.19 log scotopic troland-s andabove, the rod component of the respon se was isolated bycomputer-subtracting the response to a photometrically-matchedlong-wavelength stimulus (24). Log am plitud e is plotted as afunction of log retinal illuminance in Figure 4b (open circles)alon g with the best-fit Naka-Rushton function (solid curve).Relative to the mean adult function (da shed curve), infantsshowed mu ch lower values of Vmax (maximum b-wave amplitude) and much higher values of log k (measure of sensitivi ty).
Rod threshold was determined from the Naka-Rushton functionas the retinal illuminance necessary to produce a 2.0-J.LV response . Of 42 infants tested , 14 had nondetectab le rod ERG orrod responses over too limited a range for the Naka-Rus htonanalysis (one in the PTHM-fed group, two in group C, four ingroup B, and seven in group A). These infants were assignedvalues for log k and rod threshold of 1.9 and 1.3 log scotopictroland-s based on the maximum retinal illuminance available.Log Vmax was th en calculated from th e Naka-Rus hto n functionas 1.0 log J.LV.
Results for parameters of the Naka-Rush ton function areshown in Figure 5. ANOVA revealed significant differencesamong groups in log Vmax and rod threshold (Table 3). Rod bwave thre sholds were significan tly higher in the w-3 deficientgroup (formula A) than in the groups receiving long-chain w-3(human milk and formula C). Rod thres holds were virtuallyidentica l in infants receiving EPA + DHA suppleme nted formul a(formula C) and human milk-fed infants. Similarly, maxi mumamplitudes (log Vmax) were lowest in infants given formula A,which provided predominantly w-6 FA, and highest in infantsfed human milk or long-chai n w-3-enriched formula. Post-hoccomparisons of Vmax for group B receiving solely 18:3 w-3 versusthe human milk-fed group gave a p value of<0.05, and for groupB versus C gave a p value of <0.06. Ana lysis of the data bynonparametric ANOVA and x2 test gave a p value of < 0.02 forrod threshold and maximum amplitud e in the com parison ofdiet groups. Differences among groups in log k did not reachstatistica l significance.
The FA composition of plasma lipids on admission to thestudy (d 10) was similar in the four study groups (data not shown)except for a significant difference in oleic acid (18: I w-9) contentin the group receiving human milk: 27 g/IOO g oflipid versus 20g/100 g in the three formu la groups (ANOVA F = 7.4, p <0.00 1). FA composition of RBC lipids was similar in all fourgroups on d 10 (data not shown) .
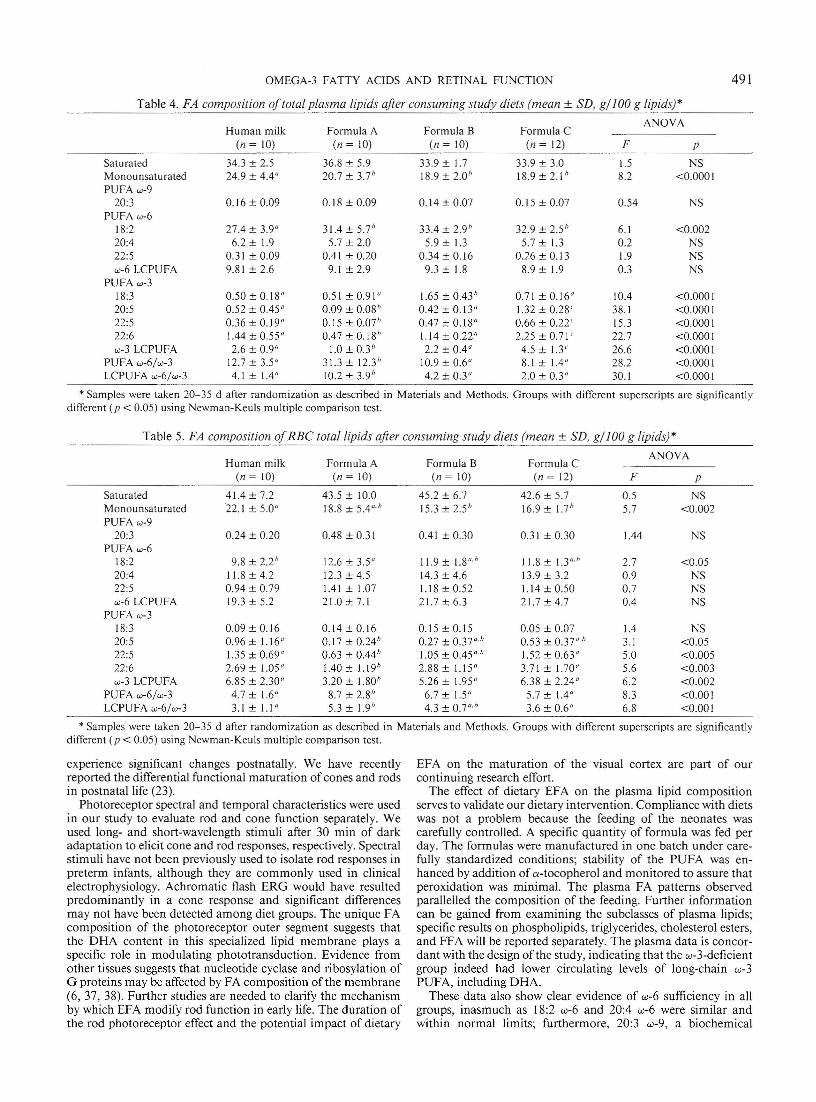
The results for plasma lipids after 20-35 d of consuming studydiets are shown in Table 4. Significant diet effects were demonstrable using ANOVA. The hum an milk-fed infants had a highermo nounsaturated FA and lower 18:2 w-6 content relative to allformula-fed groups. Group C, receiving long-chain w-3 PUFA,was similar to the human milk-fed grou p except for highercontent of EPA, 22:5 w-3, and DHA. The w-3 FA-deficient groupA had significantly lower w-3 derivatives including a substantia llylower DHA level. This group also had the highest PUFA w-6/PUFA w-3, LCPUFA w-6/w-3, and a significantly lower 22:6 w3/22:5 w-6 ratio . All are suggestive of w-3 LCPUFA insufficiency.In addition, a significan tly lower sum of w-3 LCPUFA wasobserved for group A. Group B had DHA values that wereintermediate between the deficient group and the grou ps receiving long-chain w-3 FA. Group B had the highest 18:3 w-3 content(ANOVA p < 0.0001), yet the DHA content (the end product ofits elongation and desaturation) was lower than in group C. The
Table 2. Comparability ofstudy groups (m ean ± SD)
Study gro up
Human m ilk Formula AVariable (n = 10) (n = 10)
Birth wt (g) 1308 ± 117 1340 ± 106Birth length (ern) 39.2 ± 1.9 39.0 ± 1.7Gestati on al age (wk) 30.4 ± 1. 1 30.9 ± 1.6Entry wt (g) 121 1 ± 86 1295 ± 144Age at visual testing (wk) 36.1 ± 1.7 35.2 ± 0.9Wt at visua l testing (g) 1944 ± 265 19 18 ± 147Days to 1800 g (d) 35.1 ± 4.2* 28.2 ± 4.7Wt at 40 wk (g) 299 8 ± 463 323 8 ± 463Leng th at 40 wk (ern) 48.0 ± 2.8 49 .6 ± 1.2Head circumference at 40 wk (em) 35 .0 ± 1.8 34.9 ± 0.5
* Human mil k significantly differen t from the th ree formula gro ups using ANOVA .
Formula B(n = 10)
1224 ± 9238.4 ± 1.529.6 ± 1.61173 ± 13035. 1 ± 1.0
2036 ± 20033.7 ± 6.2
3160 ± 32548.6 ± 235.4 ± 0.8
Formula C(n = 12)
1281 ± 10139.0 ± 1.730.7 ± 1.21241 ± 11835.3 ± 0.91998 ± 12030.0 ± 5.9
3055 ± 50648.0 ± 2.234.7 ± 1.0
p
NSNSNSNSNSNS
<0.05NSNSNS
OMEGA-3 FATTY ACIDS AND RETINA L FUNCTION 489
LOG I (phot td - sec )
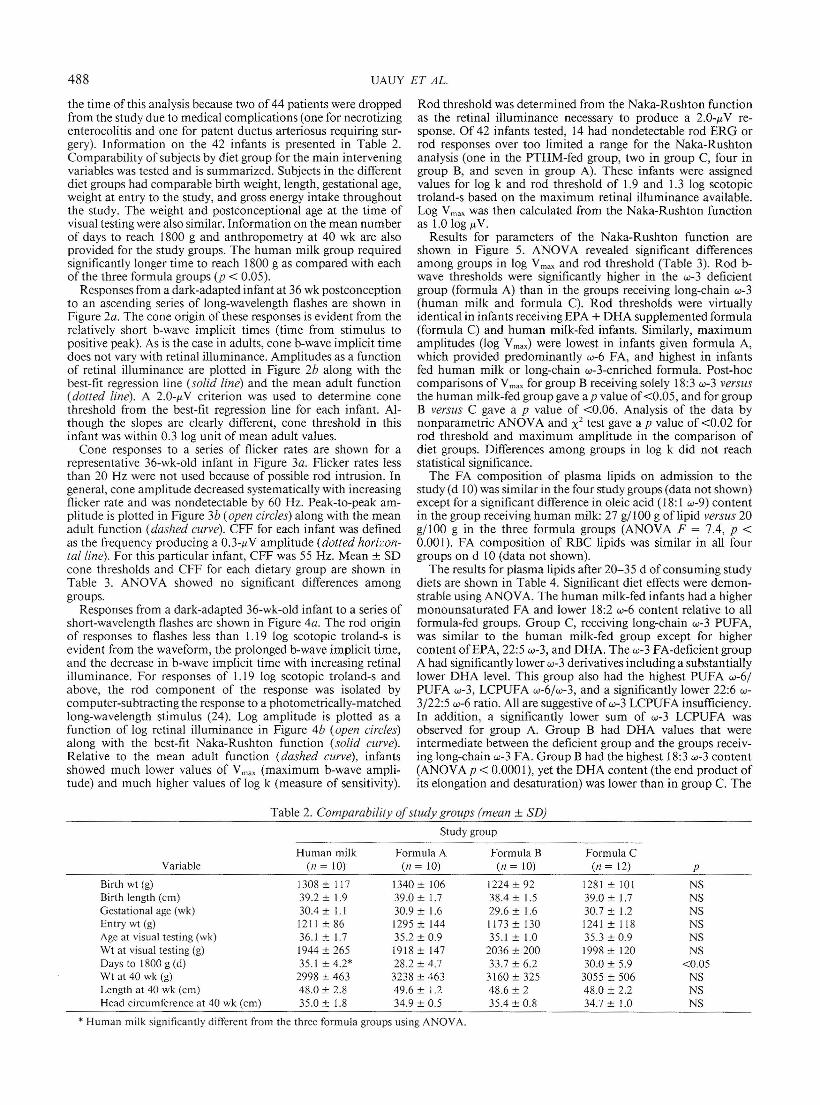
Fig. 2. a, Full-field ERG to long-wavelength stim uli from an infantat 36 wk conceptual age. B-wave impli cit time does not vary with ret inalilluminance (/o~ I) , consistent with a con e origin for the respo nses.Values 10 left of each response are retina l illumi nance in log photopictrol and -sob, Con e peak-to-peak amplitude as a function of retinal illuminance for the infant shown in a. Responses near thresho ld were linearlyrelated to log retina l illuminance tlog I) ; these responses were used toderive cone th reshold (2-p.V criterion, solid line). Th e dashed line is themean adult function based on 15 subjects (24).
Fig. 3. a, Full-field ERG to flickering stimuli in an infant at 36 wkconceptual age. Numbers 10 left of each trace refer to flicker rate incycles/s (Hz). b, Cone amplitude as a function of flicker rat e for the sameinfan t shown in a. The horizontal dolled /ine is the criterion amplitude(0.3 p.V) used to derive CFF. The dashed curve is the mean adu lt functio n.
interpretation of the productprecursor w-3 conversion forplasma is confou nded by the direct provision of product in thePTHM group and group C and the excess precursor provided ingroup B.
The results for RBC membrane lipid analysis presented inTab le 5 parallel the diet-induced changes observed for plasma.
The effects are less prominent as evidenced by lower F values.Significant effects observed for group A, fed the deficient formula, include a lower content of w-3 derivatives, higher w-6/w-3PUFA and LCPUFA ratios, and a lower 22:6 w-3/22:5 w-6 ratiocompared with the other groups. The overall results for group Cwere similar to those for the human milk group. Group A clearlydiffered from the human milk and formula C groups in w-3LCPUFA content. Gro up B had intermediate values that werenot statistically different from those of group C or the humanmilk-fed infants.
The relationships between FA composition of plasma andRBC lipids and the electroretinographic changes were exploredby simple and multiple linear regression analysis. Oth er confou nding variables contro lled by the defined entry criteria or byrand omization were also included in the mult iple regressionmodels tested. Significant simple correlations were demo nstratedfor log rod threshold and RBC 20:5 w-3 FA con tent ( r = -0.51,P< 0.001),22:5 w-3 content (r= - 0.52,p< 0.00 I), w-3 LCPUFAcontent (r = -0.63, p < 0.000 1), and long-chain w-6/w-3 ratios(r = 0,45, p < 0.006). The highest correlation with plasma lipidFA content was seen for the sum of long-chain w-3 FA ( r = 0.36,p < 0.02). The multiple regression model that best explained thevariance in log rod threshold included RBC and plasma longchain w-3 contents (p < 0.000 1 and p < 0.03, respectively); theresulting R square was 0,44 (F = 8.9, p < 0.0002).
The correlation analysis for log Vmax revealed that it was relatedpositively to plasma 22:6 w-3 (r = 0.55, p < 0.0001) and plasmalong-chain w-3 FA content (r = 0.58, p < 0.000 1) and negativelyto the RBC long-chain w-6/w-3 PUFA ratio ( r = -0,40, p <0.0 I). The multipl e regression model that explained the highestpercent of variance in log Vma x included plasma long-chain w-3content, RBC long-chain w-6/w-3 PU FA ratio, and gestationalage at birth ; the combined R square was 0,42 (F = 7.8, p <0.0004). Birth weight, gestational age at birth , test weight, andtest age within the narrow time frame chosen for study were notcorrelated individually to the measures of rod function evaluatedin this study. Cone funct ion was not related to diet nor to theFA composition of plasma or RBC lipids.
DISCUSS ION
This controlled doubl e-blind study provides clear evidencethat w-3 FA are essential for optimal function of the developin gretina. Low-birth -weight human neonates are potenti ally vulnerable to w-3 FA deficiency because formulas based on corn oil asan EFA supply have low 18:3 w-3 and, at present, no commercialformula in the United States contains long-chain w-3 derivatives.Dietary requirements in low-birth -weight infants are relat ivelyhigh because of the fast accretion rates and absence of EFAreserves.
Present nut ritional recommendations for VLBW infants donot include w-3 as EFA and merely indicate that 18:2 w-6 is theEFA for the hum an neonate (30). The essentiality of w-3 FA inthe hum an can now be substan tiated by: 1) the altered retinalfunction in low-birth-weight neon ates fed an w-3-deficient dietas reported presently; 2) the occurrence of altered FA com position of blood lipids in infan ts fed formula low in w-3 FA (31,32); and 3) the reported nonspecific visual changes and periph eralneuropath y in a handful of chronically ill patients receivingenteral or parenteral nut rition with low or absent w-3 FA supply(33- 35).
Abnormalities of retinal and brain function have been dem onstrated in animals fed w-3-deficient diets throughout the lifecycle (13, 15, 17, 18). The opportuni ty to evaluate this issue inthe hum an was afforded by the fact that standard low-birth weight infan t formulas at the time of th is study were based onvegetable oils, usually medium-chain triglyceride/coco nut /cornoil blends that have low 18-3 w-3 and relatively high 18:2 w-6.The observation from the rhesus monkey studies and other invitro studies of microsomal EFA metabolism suggests that a high
2 .0
1005020
1.0
0 .1 -f-- -.-JU------<
10
FLICKER FREQUENCY
b 100 .0
~ 10 .0
0.0
o
//
//
//
//
a
20VVW
25f\M1\fv
300J\f\NV\J35NVVVV\f\v4 0 /\/\I\1V\I\/\/'v45~
50..A.f\/\/\../\.-./'../',
55~
60 =J4~VHz 50 meec
b 50.0
»r--; 40 .0>::t.<::»
w 30 .00::Jf-
20.0::::i0-:2:« 10.0
/......,.,......." •.... _...-.
0 .0-1.0
490 UAU Y ET AL.
Table 3. Electroretinographic responses at 36 wk postconceptual age (m ean ± SD)*
Formula CANOYA
Human milk Formula A Formula B(11 = 10) (11 = 10) (11 = 10) (11 = 12) F p
Rod functionlog threshold (scot td-s) 0.414 ± 0.59" \.lOS ± 0.37 h 0.739 ± 0.64,,·h 0.410 ± 0.63 " 3.390 < 0.028log Y",,, (I'Y) 1.20 ± 0. 14" 1.02 ± 0.05h 1.07±0.lyh 1.20 ± 0.17" 4.99 < 0.005log k (scot td-s) 1.25 ± 0.54 1.72 ± 0.31 1.43 ± 0.6 1.25 ± 0.55 1.94 < 0.14
Cone functionlog threshold (phot td-s) - 0.11 ± 0.24 0.09 ± 0.15 0.04 ± 0.03 - 0.04 ± 0.24 NS NSCFF (Hz) 51.5 ± 6.6 48.5 ± 5.6 48.9 ± 6.3 47.4 ± 6.9 NS NS
* Groups with different superscripts are significantly different (p < 0.05) using Newman-Keuls multiple comparison test. Scot td-s, scotopictroland-seconds; phot td-s, photopic troland-seconds.
• Human Milk n=10I2'J Formula A n=10o Formula 8 n=10o Formula C n=12
0.0
0.5
2.0
1.0
1.5
w-6/w-3 FA ratio further lim its the dcsaturatio n of ava ilab le 18:3w-3 (8, 13, 15, 16). Teleologic evidence based on the FA composition of human milk also points to a requirement for w-3 FA,including DHA, in early life (4, 19-21).
The need to pro vide preformed long-chain w-3 PU FA was alsoa focus of this research. Presen t infant formulas co nta in traceamounts ofFA longer than 18carbon atoms chain length . Studiesby several investigators have dem onstrat ed lower DHA levels informu la-fed infants relative to human milk-fed in fants (4, 31,32). The recommendation to supplement form ulas with longchain w-3 FA has bee n suggested by us an d others (4, 9, 36) .Carlson et al. (36) have used fish oil to enhance DHA content ofRBC lipids in low-birth-weight infants and obtained FA profilessimilar to infants fed human mi lk. We included a group fed aformula containing not only 18:3 w-3 but also the long-chainderivat ives EPA and DHA from marine oils. The data reportedhere suggest th at this gro up is closest to human milk-fed infantsin terms of bo th retinal function and biochemical markers of w3 FA status. Recent work by Anderson et al. (9) using the w-3deficient newly hatched chick as a model clea rly indicates that18:3 w-3 as th e sole source of w-3 FA is inadequate for thebiochemical development of the brain and retina. Dietary EPAor DHA supplementati on duri ng rep letion induced simi lar DHAcontent of brain and retina. This study in chicks has possibleimplications for the human because it supports a specific needfor long-chain w-3 FA in early life (9).
The electro retinographic data show a selective effect of w-3 FAon rod function. Cones are minimally affected, alt ho ugh thetrends are similar. T he pattern of development of the humanretina indicates that cones except for fovea l cones are morphologically more mature than rods at th e time of birth. The latter
log thresho ld log Vmax log k
Fig. 5. Summary of rod ERG parameters for 42 infants at 36 wkconceptual age derived from Naka-Rushton functions (mean + SD).Significant diet group effects were found for threshold and Yrna" ANOYAP < 0.03 and < 0.005, respectively. Formula A wassignificantly differentfrom human milk- and formula C-fed groups. Formulas A and B werenot significantly different from each other (Newman Keuls post hoctesting). See Materials and Methods for description of Naka-Rushtonfunctions.
2 .01.00.0
LOG I (sco t td - sec)
- 1.0
//
short wavelength
/
//
-2 .0
log I
1.0
2.0
b 3 .0
O.O.L----j---- -+-----j- ---+----+--
Fig. 4 . a, Full-field ERG to short-wavelength stimuli from a representative infant at 36 wk conceptual age. Retinal illuminance (log l) tothe left of each trace is shown in log scotopic troland-s (sCOI td-seci. Bwave implicit time decreases with increasing retinal illuminance, consistent with rod function. Rod responses to stimuli higher than 1.0 logscotopic troland-s were computer-isolated by subtracting responses tophotopically-rnatched stimuli. b, Log rod peak-to-peak amplitude as afunction of retinal illuminance (log l) for the infant shown in a. Solidcurve is best-fit Naka-Rushton function with the exponent constrainedto 1.0. Dashed curve is average Naka-Rushton function from 15 normaladult subjects (24).
OMEGA-3 FATTY ACIDS AND RETINAL FUNCTION 49 1
Table 4. FA composition oftotal plasma lipids after consuming study diets (mean ± SD, gj 100 g lipids)"
Human milk Formula B Formula CANOYA
Formula A(n = 10) (n = 10) ( n = 10) (/I = 12) F p
Saturated 34.3 ± 2.5 36.8 ± 5.9 33.9 ± 1.7 33.9 ± 3.0 1.5 NSMonounsaturated 24.9 ± 4.4" 20.7 ± 3.7" 18.9 ±2.0" 18.9 ± 2.1" 8.2 <0 .0001PUFA w-9
20:3 0.16± 0.09 0.18 ± 0.09 0.14 ± 0.07 0.15 ± 0.07 0.54 NSPUFA w-6
18:2 27.4 ± 3.9" 31.4± 5.7" 33.4 ± 2.9" 32.9 ± 2.5" 6.1 <0.00220:4 6.2 ± 1.9 5.7 ± 2.0 5.9 ± 1.3 5.7 ± 1.3 0.2 NS22:5 0.31 ± 0.09 0.41 ± 0.20 0.34±0.16 0.26 ± 0.13 1.9 NSw-6 LCPUFA 9.81 ± 2.6 9.1 ± 2.9 9.3 ± 1.8 8.9 ± 1.9 0.3 NS
PUFA w-318:3 0.50 ± 0. 18" 0.51 ± 0.91" 1.65 ± 0.43" 0.71 ± 0.16" 10.4 <0 .000120:5 0.52 ± 0.45" 0.09 ± 0.08" 0.42±0.13" 1.32 ± 0.28' 38.1 <0 .000122:5 0.36 ± 0.19" 0.15 ± om" 0.47 ± 0.18" 0.66 ± 0.22' 15.3 <0.000122:6 1.44 ± 0.55" 0.47 ± 0.18" 1.1 4 ± 0.22" 2.25 ± 0.71' 22.7 <0 .0001w-3 LCPUFA 2.6 ± 0.9" 1.0 ± 0.3" 2.2 ± 0.4" 4.5 ± 1.3' 26.6 <0.0001
PUFA w-6/ w-3 12.7 ± 3.5" 31.3 ± 12.3" 10.9 ± 0.6" 8.1 ± 1.4" 28.2 <0 .0001LCPUFA w-6/w-3 4.1 ± 1.4" 10.2 ± 3.9" 4.2 ± 0.3" 2.0 ± 0.3" 30.1 <0 .0001
* Samples were taken 20-35 d after randomization as described in Materials and Methods. Groups with different superscripts are significantlydifferent ( p < 0.05) using Newman-Keuls multiple comparison test.
Table 5. FA composition ofRBC total lipids aft er consuming study diets (mean ± SD, gj 100 g lipids)"
Human milk Formula B Formula CANOYA
Formula A( n = (0) (n = 10) (n = 10) ( n = 12) F P
Saturated 41.4 ± 7.2 43.5 ± 10.0 45.2 ± 6.7 42.6 ± 5.7 0.5 NSMonounsaturated 22.1 ± 5.0" 18.8 ± 5.4"'" 15.3 ± 2.5" 16.9 ± 1.7" 5.7 <0 .002PUFA w-9
20:3 0.24 ± 0.20 0.48 ± 0.31 0.41 ± 0.30 0.31 ± 0.30 1.44 NSPUFA w-6
18:2 9.8 ± 2.2" 12.6 ± 3.5" 11.9 ± 1.8"'" 11.8 ± 1.3"'" 2.7 <0.0520:4 11.8 ± 4.2 12.3 ± 4.5 14.3 ± 4.6 13.9± 3.2 0.9 NS22:5 0.94 ± 0.79 1.41 ± 1.07 1.1 8 ± 0.52 1.14 ± 0.50 0.7 NSw-6 LCPUFA 19.3 ± 5.2 21.0± 7.1 21.7 ± 6.3 21.7 ± 4.7 0.4 NS
PUFA w-318:3 0.09±0.16 0.14 ± 0.16 0.15 ± 0.15 0.05 ± 0.07 1.4 NS20:5 0.96 ± 1.16" 0.17 ± 0.24" 0.27 ± 0.37"" 0.53 ± 0.37"'" 3.1 <0.0522:5 1.35 ± 0.69" 0.63 ± 0.44" 1.05 ± 0.45"" 1.52 ± 0.63" 5.0 <0 .00522:6 2.69 ± 1.05" 1.40 ± 1.19" 2.88 ± 1.15" 3.71 ± 1.70" 5.6 <0 .003w-3 LCPUFA 6.85 ± 2.30" 3.20 ± 1.80" 5.26 ± 1.95" 6.38 ± 2.24" 6.2 <0 .002
PUFA w-6/ w-3 4.7 ± 1.6" 8.7 ± 2.8" 6.7 ± 1.5" 5.7 ± 1.4" 8.3 <0 .001LCPUFA w-6/w-3 3.1 ± 1.1" 5.3 ± 1.9" 4.3 ± 0.7"'" 3.6 ± 0.6" 6.8 <0.001
* Samples were taken 20- 35 d after randomization as described in Materials and Methods. Groups with different superscripts are significantlydifferent (p < 0.05) using Newman-Keuls multiple comparison test.
experience significant changes postnatally. We have recen tlyreported the differential functional maturation of cones and rodsin postnatal life (23).
Photoreceptor spectral and temporal characteristics were usedin our study to eval uate rod and cone function separately. Weused long- and short-wave length stimuli after 30 mi n of darkadaptation to elicit cone and rod responses, respectively. Spectralstimuli have no t been previously used to isolate rod responses inpre term infants, although they are commonly used in clinicalelectrophysiology. Achromatic flash ERG would ha ve resultedpredominantly in a cone response and significant differencesmay not have been detected among diet groups. T he unique FAcomposition of the photoreceptor outer segment suggests thatth e DHA content in this specialized lipid membran e plays aspecific ro le in modulating phototransductio n. Evidence fromother tissues suggests th at nucleot ide cyclase and ribosylat ion ofG proteins may be affect ed by FA composition of the m em brane(6, 37, 38) . Further studies are needed to clarify the mechanismby which EFA m odify rod function in early life. The du ration ofthe rod photoreceptor effect and th e potential im pact of dietary
EFA on the maturation of the visual cortex are part of ourcontinuing research effort.
The effect of dietary EFA on the plasma lipid compositionserves to validate our dietary intervention. Compliance with die tswas not a problem because the feedi ng of the neonates wascarefully controlled. A specific quantity of formula was fed perday. The formulas were man ufa ctured in one batch under carefully standardized conditions; stability of the PU FA was enhanced by addition of a -tocophero l and monitored to assure thatperoxidation was minimal. The plasma FA patterns observedparallelled the composition of the feeding. Further informationcan be gained from examining the subclasses of plasma lipids;specific resu lts on phospholipids, triglycerides, cho lesterol esters,and FFA will be reported separate ly. The plasma data is concordant with the design of the study, indicating that th e w-3-deficientgroup indeed had lower circulating levels of long-chain w-3PUFA, including DHA.
T hese data also show clear evidence of w-6 sufficiency in allgroups, inasmuch as 18:2 w-6 and 20:4 w-6 were similar andwithin normal limits; furthermore, 20:3 w-9, a biochemical
492 UAUY ET AL.
marker of EFA deficiency (1-5, 19), was low in all groups,confirming adequacy of w-6 EFA supply. As expected, EPA inplasma was highest in the group fed marine oil, group C. Itappears that the metabolic conversion of EPA is unde r physiologic control because the EPA/DBA of the formula is higherthan that found in plasma of group C infants. The limitations ofcompositional data should be considered in interpreting themetabolic interrelations of the EFA and their derivatives. In vivostudies of EFA metabolism using labeled precursors are needed .The use of stable isotopes and the development of suitablymarked tracers to identify in vivo desaturation, elongation , andoxidation are challenges for the future.
The RBC membrane composition was less affected by dietthan was the plasma after 20-35 d of feeding the test formula s.This finding is explained by the fact that the RBC populationrepresents a combination of preexisting RBC and newly formedones. The degree of exchange of plasma and RBC membraneFA is not fully known. Yet, phospholipids within the membraneare constantly interchanged with plasma phospholipids and FFA.Because the composition of membranes is more tightly regulatedand less diet sensitive than plasma lipids, these results could beanti cipated. It is of interest that the relative content of 18:3 w-3in RBC lipids of group B shows no clear indication of enhanceddietary supply. EPA content is higher in the human milk-fedgroup and group C but does not appear to accumulate significantly in the membrane lipids. Th is confirm s the results ofAnderson et al. (9) demonstrating active conversion of EPA toDHA in early life; alternati vely, EPA content of membranes maybe under physiologic regulation . The low w-3 LCPUFA, 18:3 w3-derived compounds, in group A are of interest because thissuggests that other membranes with high w-3 FA content andfast turn over rates, such as rod outer segments, may exhibitparallel changes. Studies in the rat indicate that diet-inducedchanges in RBC membrane lipids are paralleled by the changesin brain and other tissue (16). Thus, a low w-3 content and ahigh long-chain w-6/w-3 PUFA ratio in RBC may serve as proxyindicators of poor w-3 supply to the retina. This is supp orted bythe highly significant correlations found for the markers of w-3FA status in plasma and RBC membranes with the indices ofrod function.
Our study clearly supports the view that w-3 FA should beconsidered essential nutrients in early life. The rod electroretinographic responses suggest that the parent EFA, 18:3 w-3, maybe insufficient to fully satisfy this requirement. Indeed, the resultsindicate that a supply of long-chain w-3 PUFA was necessary tosustain rod function similar to that found in the human milkfed group. The biochemical measurements provide further evidence documenting the alterations induced by a low 18:3 w-3diet.
Ackn owledgments. The auth ors thank the Mead-John son Nutritional Division for providing the infant formula products usedin this study. The expert nursing collaboration of Dawn Waidelich, R.N . and Mary Nickel, R.N., the laboratory assistance ofJoy Burns, Jane Anderson, and Helen Price, and the carefultyping of this manuscript by Mary Blanchett are gratefully acknowledged.
RE FERE NCES
I. Paulsrud JR . Pensler L. Whitten CF . Stewart S, Holm an RT 1972 Essent ialfatty acid deficien cy in in fan ts indu ced by fat -free int raveno us feeding. AmJ Clin Nutr 25:89 7-904
2. Ca ldwell MD . Joh nsso n HT. Othersen HB 1972 Essential fatty acid deficiencyin an in fant receiving prolonged pare nte ral alime ntatio n . J Pediatr 81:894898
3. White HB. Turner MD. Turner MS. Millcr RC 1973 Blood lipid alterati on s ininfa nts receiving intravenous fat-free alime ntation. J Pediatr 83:30 5-313
4. Ua uy R. Treen M. Hoffman DR 1989 Essential fatty acid metabolism andrequirements during devel opment. Semin Perinatol 13:118-130
5. Sprecher H 1981 Biochemistry of essen tia l fatty acids. Prog Lipid Res 20 :1322
6. Stub bs CD. Smi th AF 1984 Th e mod ificat io n of mamm alian polyu nsatu ratedfatt y ac id com position in relation to memb rane fluidity and funct io n.Bioch im Biophys Acta 779 :89- 137
7. Brenner RR, Peluffo RO 1966 Effect of saturated and unsat urated fatt y acidson the desa tu rat ion in vitro of palmitic, stearic , oleic, linoleic and linolenicacids. J Bioi Chern 24 1:52 13- 52 19
8. Brenn er RR , Peluffo RO 1969 Regulat ion of unsaturate d fatt y acid biosynthesis. Biochim Biophys Acta 176:47 1- 479
9. Ande rson GJ. Connor WE , Co rliss JD 1990 Docosahexaen oic acid is thepreferred dietary n-3 fatt y acid for the deve lopment of the brain and ret ina .Pediatr Res 27:89-97
10. Cland inin MT, Chappel J E, Heim T , Swyer PR , Chance G W 1981 Fatty acidut ilizat ion in perinatal de 110VO synthesi s of tissu es. Earl y Hum Dev 5:355 366
I I . Cland ini n MT, Chappe l J E, Leo ng S, Heim T, Swyer PR , Cha nce GW 1980Extra uter ine fatt y acid accretion in brai n: im plicat ion s for fatt y acid requirements. Ea rly Hum Dev 4:131- 138
12. Holman RT. John son SB, Hatch T F 1982 A case of human linolenic aciddefic iency in volving neurological ab normalities. Am J Clin Nu tr 35:6 17623
13. Neuringer M. Connor WE . Van Pett en C, Barstad L 1984 Dieta ry om ega-3fatty acid deficiency and visua l loss in infant rhesus monkeys. J Clin Invest73:272-276
14. Sanders TAB. Naismith DJ 1980 T he effect of altering the linol eic a -lino lenicacid ratio in the maternal diet on foetal brain lipids. Proc Nutr Soc39:80A(abstr)
15. Neuringer M. Connor W, Lin D. Barsted L. Luck S 1986 Biochemi cal andfunc t ional effects of pren atal and postna tal omega-S fatt y acid deficiency onretina and brain in rhesus mo nkeys. Proc Nat! Acad Sci USA 83:402 1- 4025
16. Carlson SE. Carver J D. Hou se SG 1986 High fat diets varying in rat ios ofpolyun satu rated to satu rat ed fatt y acid and linoleic to linoleni c ac id : Aco mparison of rat neur al and rat cell membran e phosph olipids. J Nu tr116:718-726
17. Wheeler TG, Benolken RM , And erso n RE 1975 Visua l mem bran es: specificityof fatt y ac id precursors for the electrical respo nse to illu mi natio n . Science188:1312- 1314
18. Lam ptey MS, Walker BL 1978 Learning behavior and brain lipid com positio nin rats subjected to EFA during gestat ion , lactation and growt h. J Nutr108:358- 367
19. Fried man Z 1980 Essential fatty acids revisited. Am J Dis Chi ld 134:397-40720. Heim T 1983 Energy and lipid req uireme nts of the fetus and the preterm
infant. J Pediat r Ga stroenterol Nutr 2(suppl):16- 4 12 I. Jensen RG . Hagerty MM. McM ahon KE 1978 Lip ids of human milk and
infant formulas: a review. Am J Ciin Nutr. 3 1:990- 10 1622. Flynn JT 1985 An internation al classificat ion of retinopathy of prematurit y.
In: Silverman W, Flyn n J (eds) Ret inopath y of Premat urit y. BlackwellScien tific Publi cat ion s, Boston , pp 1-1 9
23. Birch EE, Birch DG, Petri g B, Uauy R 1990 Ret inal and co rt ical fun ction o finfants at 36 and 57 weeks post-co nception . Ciin Visio n Sci 5:363- 373
24. Birch DG , Fish GE 1987 Ro d ERGs in retinitis pigm entosa and cone-roddegen eration. Invest Opt halmol Vis Sci 28: 140- 150
25 . Na ka KI . Rushton WAH 1966 S-pot entials from luminosity units in the reti naoffish (Cyprimidae). J Physiol (Lend) 185:536-599
26. Bligh EG , Dyer WJ 1954 A rapid method of total lipid extrac tion andpurification. Can J Biochem Ph ysioI 37:911-917
27. Morrison WR. Smith LM 1964 Preparation of fatly acid methyl este rs anddimethyl acetals from lipids with boron fluoride-methanol. J Lipid Res5:600- 608
28. Haon GJ. Van Der Heide S, Wolthers BG 1979 Analysis of fatl y acids fromhuman lipids by gas chro matograph y. J Chromatogr 162:26 1- 271
29. Horwit z W (ed) 1980 Official Method s of Ana lysis of the Association of OfficialAnalytical Chemists. 13th Ed . Association of Official Anal ytical Chemis ts,Washi ngto n, DC
30. Ame rica n Acade my of Pediat rics Co m mi ttee on Nutrition 1985 Nutri tio na lneed s of low-birth-weight in fan ts. Pediat rics 75:976-986
3 1. San ders T AB, Na ismi th DJ 1979 A co m pari son of the influence of breastfeed ing an d bottle feedi ng on the faty acid co m positio n of ery throcytes. Br JNutr 4:6 19-623
32. Carlson SE, Rh od es PG, Ferguson MG 1986 DH A sta tus of preterm infantsat birth an d followin g feeding with hum an mil k or form ula. Am J Ciin Nut r44:798- 804
33. Bjerve KS. Lovold Mo stad I, Thoresen L 1987 Alpha-lin olen ic acid defici en cyin pat ients on long-ter m gastric tube feeding: estimation of linolenic ac idand long-chain uns atur ated n-3 fatty acid requi rement in ma n. Am J ClinNutr 45:66-67
34. Bjer ve KS, Fisher S, Warn me r F, Egeland T 1989 Alp ha-l inolenic acid andlon g-chai n n-3 fatty acid sup plem enta tio n in th ree patient s ha ving n-3 fatt yacid defici ency. Effect o n lymphocyte function , plasm a and red cell lipids,and pros ta noid formation . Am J Cii n N utr 49: 290- 300
35. Holm an RT, Johnson SB, Hatch T 1982 A case of human linolen ic ac idde ficiency involving neu rological ab no rmali ties. Am J Ciin Nut r 35:6 17623
36. Carlson SE, Rh od es PG, Rao VS, G oldga r DE 1987 Effect of fish oil suppleme nta tio n on the n-3 fatty acid content of red blood cell membranes inpreterm infants. Pediat r Res 2 1:507- 5 10
37. Houslay MD , Dipple I, Elliott KRP 1980 Guanosine 5' -triphosph ate andguanosine 5'-[y-imido)-tr iph osph ate effect a collision coupling mecha nismbetween the glucag on receptor an d catalytic unit of adenylate cyclase .Biochem J 186:649-658
38. Ahmed SN. Alan BS. Alan SQ 1989 Dietary omega-S fatty acid s inc reasegua nine nucleotide bind ing pro teins and adenylate cyclase activity in ratsalivary glands. FASEB J 3:A948