eeg correlates of spontaneous self-referential thoughts: a cross-cultural study
TRANSCRIPT
AUTHOR QUERY FORM
Journal: INTPSY Please e-mail or fax your responses and any corrections to:E-mail: [email protected]: +1 619 699 6721
Article Number: 10527
Dear Author,
Please check your proof carefully and mark all corrections at the appropriate place in the proof (e.g., by using on-screen anno-tation in the PDF file) or compile them in a separate list. Note: if you opt to annotate the file with software other than AdobeReader then please also highlight the appropriate place in the PDF file. To ensure fast publication of your paper please returnyour corrections within 48 hours.
For correction or revision of any artwork, please consult http://www.elsevier.com/artworkinstructions.
Any queries or remarks that have arisen during the processing of your manuscript are listed below and highlighted by flags inthe proof. Click on the ‘Q’ link to go to the location in the proof.
Location in article Query / Remark: click on the Q link to goPlease insert your reply or correction at the corresponding line in the proof
Q1 Please confirm that given names and surnames have been identified correctly.
Q2 Citation “Congedo, 2006” has not been found in the reference list. Please supply full details for thisreference.
Q3 Uncited references: This section comprises references that occur in the reference list but not in thebody of the text. Please position each reference in the text or, alternatively, delete it. Thank you.
Please check this box if you have nocorrections to make to the PDF file. □
Thank you for your assistance.
Our reference: INTPSY 10527 P-authorquery-v11
Page 1 of 1
UNCO
RRECTED P
RO
OF
1 Highlights
2 International Journal of Psychophysiology xxx (2012) xxx–xxx
4
5 EEG correlates of spontaneous self-referential thoughts:6 A cross-cultural study7
8 Gennady G. Knyazev a,⁎, Alexander N. Savostyanov a, Nina V. Volf a, Michelle Liou b, Andrey V. Bocharov a
910
a Institute of Physiology, Siberian Branch of the Russian Academy of Medical Sciences, Novosibirsk, Russia11
b Institute of Statistical Science Academia Sinica, Taipei, Taiwan
1213► Self-referential thought (SRT) is associated with enhanced alpha activity in the DMN. ► In Russian subjects, this alpha activity prevails in the posterior DMN14hub. ► In Taiwanese subjects, it prevails in the anterior DMN hub. ► SRT is also associated with enhanced beta and diminished delta and theta activity.
15
16
International Journal of Psychophysiology xxx (2012) xxx
INTPSY-10527; No of Pages 1
0167-8760/$ – see front matter © 2012 Published by Elsevier B.V.http://dx.doi.org/10.1016/j.ijpsycho.2012.09.002
Contents lists available at SciVerse ScienceDirect
International Journal of Psychophysiology
j ourna l homepage: www.e lsev ie r .com/ locate / i jpsycho
Please cite this article as: Knyazev, G.G., et al., EEG correlates of spontaneous self-referential thoughts: A cross-cultural study, InternationalJournal of Psychophysiology (2012), http://dx.doi.org/10.1016/j.ijpsycho.2012.09.002
1
2Q1
34
5
6789101112131415161718192021
36
37
38
39
40
41
42
43
44
45
46
47
48
49
50
51
52
53
54
55
56
57
58
59
60
International Journal of Psychophysiology xxx (2012) xxx–xxx
INTPSY-10527; No of Pages 9
Contents lists available at SciVerse ScienceDirect
International Journal of Psychophysiology
j ourna l homepage: www.e lsev ie r .com/ locate / i jpsycho
F
EEG correlates of spontaneous self-referential thoughts: A cross-cultural study
Gennady G. Knyazev a,⁎, Alexander N. Savostyanov a, Nina V. Volf a, Michelle Liou b, Andrey V. Bocharov a
a Institute of Physiology, Siberian Branch of the Russian Academy of Medical Sciences, Novosibirsk, Russiab Institute of Statistical Science Academia Sinica, Taipei, Taiwan
⁎ Corresponding author at: Institute of Physiology, SB RA630117, Russia. Tel.: +7 383 333 48 65; fax: +7 383 332 4
E-mail address: [email protected] (G.G. Knyazev).
0167-8760/$ – see front matter © 2012 Published by Elhttp://dx.doi.org/10.1016/j.ijpsycho.2012.09.002
Please cite this article as: Knyazev, G.G., etJournal of Psychophysiology (2012), http://
O
a b s t r a c t
a r t i c l e i n f o22
23
24
25
26
27
28
29
30
31
32
33
Article history:Received 16 May 2012Received in revised form 29 August 2012Accepted 9 September 2012Available online xxxx
Keywords:Default mode networkEEGAlpha oscillationsSocial cognitionIndependent component analysissLORETA
D P
ROThe default mode network (DMN) has been mostly investigated using positron emission tomography and func-
tional magnetic resonance imaging (fMRI) and has received mixed support in electroencephalographic (EEG)studies. In this study, after sLORETA transformation of EEG data, we applied group spatial independent compo-nent analysis which is routinely used in fMRI research. In three large and diverse samples coming from two dif-ferent cultures (Russian and Taiwanese), spontaneous EEG data and retrospective questionnaire measures ofsubject's state, thoughts, and feelings during the EEG registration were collected. Regression analyses showedthat appearance of spontaneous self-referential thoughts was best predicted by enhanced alpha activity withinthe DMN. Diminished theta and delta activity in the superior frontal gyrus and enhanced beta activity in thepostcentral gyrus added to the prediction. The enhanced alpha activity prevailed in the posterior DMN hub inRussian, but in the anterior DMNhub in Taiwanese participants. Possible cross-cultural differences in personalityand attitudes underlying this difference are discussed.
© 2012 Published by Elsevier B.V.
3435
E
T61
62
63
64
65
66
67
68
69
70
71
72
73
74
75
76
77
78
79
80
81
82
83
84
UNCO
RREC1. Introduction
Till recently, the investigation of spontaneous mental processeswas beyond the scope of most neuroimaging studies. The situationhas changed drastically during the last decade. This became possibleowing to two parallel developments. Firstly, fMRI and PET studies ofsynchronized spontaneous low-frequency oscillations between thebrain's areas have revealed a number of so-called resting state net-works (RSNs) (Biswal et al., 1995; Lowe et al., 1998) whose possiblerole in spontaneous mental processes is hotly debated. Second devel-opment started after the discovery of the so-called default-mode net-work (DMN). The DMN concept comes from an emergent body ofevidence showing a consistent pattern of deactivation across a net-work of brain regions that occurs during the initiation of task-related activity (Raichle et al., 2001; Raichle and Snyder, 2007). TheDMN includes the precuneus/posterior cingulate cortex (PCC), themedial prefrontal cortex (MPFC), and medial, lateral, and inferior pa-rietal cortex (although some other brain regions, e.g., the medial tem-poral lobe, are also frequently included in the DMN). Althoughdeactivated during task performance, this network is active in theresting brain. A notable exception to this general pattern occurs in re-lation to tasks requiring self-referential thought and social cognition(Buckner et al., 2008; Mitchell, 2006; Raichle et al., 2001). Corre-spondingly, many authors suggested that the DMN is somehow
85
86
87
88
89
MS, Timakova str., 4, Novosibirsk2 54.
sevier B.V.
al., EEG correlates of spontandx.doi.org/10.1016/j.ijpsycho
involved in self-referential processes and social cognition (Boly etal., 2008; Christoff et al., 2003; David et al., 2007; Golland et al.,2007; Gusnard et al., 2001; Mitchell, 2006; Wicker et al., 2003). Thestudy of task-related activation/deactivation and studies of synchro-nized spontaneous low-frequency oscillations have converged in ad-mitting the DMN as one of RSNs (Raichle et al., 2001).
The quest to fully elucidate the function of DMN and other RSNs re-quires a solid understanding of the link between neuroimaging findingsand their electrophysiological underpinnings. Electroencephalogram(EEG) and fMRI represent different aspects of brain activity. Their rela-tionship can thus yield insights not available from onemodality alone. IfDMN is involved in self-referential processes, as existing fMRI evidenceappears to suggest, the study of EEG correlates of these processes maybring important information on how the same psychological processesare reflected in the EEG and fMRI domains. There could be different ap-proaches to the study of fMRI and EEGmanifestations of such phenom-enon as DMN. Firstly, because simultaneous registration of both signalsis now available, raw fMRI and EEG measures could be correlated witheach other. Secondly, instead of raw fMRI and EEG measures, patternsof temporally or spatially synchronized networks could be revealed inone or both domains and the correlations could be calculated betweenthese patterns. Lastly, measures of DMN-related behavioral or psycho-logical processes could be used as the criterion variable that could becorrelated with respective fMRI or EEG measures (Laufs, 2008).
Many simultaneous EEG–fMRI studies have noted correlations be-tween the DMN blood-oxygen-level-dependent (BOLD) signal andEEG gamma (Mantini et al., 2007), beta (Laufs et al., 2003b; Mantiniet al., 2007), alpha (Laufs et al., 2003a; Mantini et al., 2007), andtheta (Meltzer et al., 2007; Scheeringa et al., 2008) oscillations.
eous self-referential thoughts: A cross-cultural study, International.2012.09.002

T
90
91
92
93
94
95
96
97
98
99
100
101
102
103
104
105
106
107
108
109
110
111
112
113
114
115
116
117
118
119
120
121
122
123
124
125
126
127
128
129
130
131
132
133
134
135
136
137
138
139
140
141
142
143
144
145
146
147
148
149
150
151
152
153
154
155
156
157
158
159
160
161
162
163
164
165
166
167
168
169
170
171
172
173
174
175
176
177
178
179
180
181
182
183
184
185
186
187
188
189
190
191
192
193
194
195
196
197
198
199
200
201
202
203
204
205
206
207
208
209
210
211
212
213
214
215
216
217
218
219
220
221
2 G.G. Knyazev et al. / International Journal of Psychophysiology xxx (2012) xxx–xxx
UNCO
RREC
Most of the studies have found mainly negative correlations betweenEEG spectral power (particularly in alpha band of frequencies) andBOLD signal in cortical areas (see e.g., Laufs, 2008 for a review).Laufs (2008) notes that the failure across studies to identify an aver-age cortical BOLD signal pattern which is positively correlated withalpha power may be explained by nonuniform brain activity at thepopulation level during periods of prominent alpha oscillationswhich fMRI group analysis must fail to detect (Laufs et al., 2006).
In the study by de Munck et al. (2007, 2008), time variations of theoccipital alpha band amplitudes were correlated to the fMRI signalvariations to obtain insight into the hemodynamic correlates of theEEG alpha activity. It was found that: (1) the alpha band responsefunction of the thalamus ismainly positive. (2) The response functionsat the occipital and left and right parietal points are similar in ampli-tude and timing. (3) The peak time of the thalamus is a few secondsearlier than that of occipital and parietal cortex. A general negativecorrelation was found between heart beat intervals and alphapower, but inclusion of this confounder had a negligible effect toalpha-BOLD correlations.Wu et al. (2010) foundwidespread alpha he-modynamic responses and high functional connectivity during eyes-closed rest, while eyes open resting abolished many of the hemody-namic responses and markedly decreased functional connectivity.
Jann et al. (2010) note that when investigating BOLD correlates ofEEG rhythms, these correlates resembled the RSNs, suggesting thatthe different RSNs assemble through synchronization of electric activ-ity as measured by EEG. Namely, BOLD correlates of electrical activityin the alpha (8–12 Hz) and beta (17–23 Hz) frequency bandsdisplayed striking similarity with the DMN as it was described inother publications, suggesting that the RSNs may be organized byneuronal activity at specific frequencies. Martinez-Montes et al.(2004) demonstrated a method correlating EEG ‘atoms’ with fMRI‘atoms’ and identified the alpha-band atom to include parieto-occipital cortex, thalamus, and insula. Mantini et al. (2007) incorpo-rated into their analysis EEG bands between 1 and 50 Hz averagedacross the entire scalp and correlated with these bands the fMRItime courses of resting state networks identified by the use of inde-pendent component analysis (ICA). RSNs 1 (DMN) and 2 (dorsal at-tentional network) had stronger relationship with alpha and betarhythms, albeit in opposite directions, with RSN1 showing positivewhereas RSN2 showing negative correlation with alpha and betarhythms. Jann et al. (2009) show that the BOLD correlates of globalEEG synchronization in the alpha frequency band are located inbrain areas involved in the DMN. These results confirm the hypothe-sis that specific RSNs are organized by long-range synchronization atleast in the alpha frequency band (Jann et al., 2009). Jann et al. (2010)report on the topographic association of EEG spectral fluctuations andRSN dynamics using EEG covariance mapping. T-mapping of the co-variance maps indicated that the strongest effects were again in thealpha and beta bands. DMN activity was found to be associated withincreased alpha and beta1 band activity. Sadaghiani et al. (2010)showed that global field power of upper alpha band oscillations ispositively correlated with activity in a network overlapping withthe DMN and is negatively correlated with activity in the dorsal atten-tion network which is most prominently involved in selective spatialattention. Brookes et al. (2011) analyzed magnetoencephalographic(MEG) data using a unique combination of beamformer spatial filter-ing and independent component analysis. This method resulted inRSNs with significant similarity in their spatial structure comparedwith RSNs derived independently using fMRI. In this study, theDMN was identified using MEG data filtered into the alpha band.
In sum, this evidence suggests that alpha and beta oscillations ap-pear to positively correlatewith fMRI-DMNand negativelywith atten-tional networks (although, correlations with other frequency bandshave also been noted, e.g., Mantini et al., 2007; Meltzer et al., 2007;Scheeringa et al., 2008). Most of these studies correlated temporal dy-namics of averaged or ‘global’ spectral EEG variables with time courses
Please cite this article as: Knyazev, G.G., et al., EEG correlates of spontanJournal of Psychophysiology (2012), http://dx.doi.org/10.1016/j.ijpsych
ED P
RO
OF
of spatially correlated networks derived from spontaneous fluctua-tions of fMRI BOLD signal by means of ICA and similar techniques.The reported correlations imply that in resting condition, the sponta-neous fluctuations of ‘global’ EEG alpha and beta activity notably co-vary with spontaneous fluctuations of DMN's BOLD signal. Whateverimportant these observations may be, they in themselves do notspeak anything about behavioral or psychological processes underlyingthis covariance. As Laufs (2008) noted, of the neural processes reflectedin both EEG and fMRI there may be measurable behavioral manifesta-tions. It could be argued that from both theoretical and practical pointof view these behavioral manifestations are most important.
Unfortunately, studies investigating EEG correlates of self-referentialprocesses are very scarce and few of them did it in resting condition andanalyzed spectral EEG information. Mu and Han (2010) used waveletanalysis to calculate non-phase-locked time-frequency power associat-ed with encoding of trait adjectives referenced to the self or the familiarother. Relative to other-referential traits, self-referential traits inducedevent-related synchronization of theta-band activity over the frontalarea and of alpha-band activity over the central area. In contrast,event-related desynchronization associated with self-referential traitswas observed in beta-band activity over the central–parietal area andin gamma-band activity over the fronto-central area. eLORETA analysisduring eyes-closed rest and Transcendental Meditation identifiedsources of alpha activity in midline cortical regions that overlappedwith the DMN (Travis et al., 2010). Congedo et al. (2010) used groupICA of rest EEG data on large sample of subjects and found several com-ponents whose topography overlapped with DMN. Two componentswhich were characterized by clear peak in alpha frequencies had maxi-mal activity in posterior cortical regions including the cuneus/precuneusand PCC. The authors suggest that these components may represent ac-tivity involved in self-centered mental imagery, during both personalpast and personal future thinking.
It should be noted that differences in EEG and fMRI results couldbe partly explained by different analysis approaches that are tradi-tionally used in the two domains. Thus, blind source separation tech-niques are increasingly becoming popular both in EEG and in fMRIresearch, but there are several principal differences in how thesetechniques are applied in the two domains. In EEG research, temporalICA (TICA) is usually used, whereas in fMRI research, spatial ICA(SICA) is almost exclusively applied. There are several reasons forthis, of which the most important is that the spatial dimension ismuch larger than the temporal dimension in fMRI, whereas for EEG,the temporal dimension is much larger than the number of sources(Calhoun et al., 2001a). SICA and TICA yield similar results if there isone predictable task-related component or two components that areuncorrelated in both space and time. However, SICA and TICA divergeif the predictable components are highly correlated in space or time,respectively (Peterson et al., 2000). Another difference is that inEEG research, ICA is usually applied to each subject's data separately.Obtained independent components (ICs) are said to represent tempo-rally independent signal sources and have scalp maps that nearly per-fectly match the projection of a single equivalent brain dipole(Delorme and Makeig, 2004). Thus, such approach is perfectly suitedfor studying temporally uncorrelated spatially local processes thatcould be modeled by a single equivalent brain dipole, but it is lesssuitable for studying more spatially extended or temporally correlat-ed processes. Besides, following such ICA, there is no natural and easyway to identify a component from one subject with a componentfrom another subject (Makeig et al., 2004). A strategy that is most fre-quently used is to combine individual ICs across subjectswith clusteringtechniques (Esposito et al., 2005; Onton et al., 2006). In fMRI research,another approach, which is called group ICA, is mostly used. Aggregatedata containing observations from all subjects are created, then, a singleset of ICs is estimated and back-reconstructed in the individual data(Calhoun et al., 2001b; Schmithorst and Holland, 2004). Knyazev et al.(2011) used group SICA of sLORETA-transformed EEG data in rest and
eous self-referential thoughts: A cross-cultural study, Internationalo.2012.09.002
T
222
223
224
225
226
227
228
229
230
231
232
233
234
235
236
237
238
239
240
241
242
243
244
245
246
247
248
249
250
251
252
253
254
255
256
257
258
259
260
261
262
263
264
265
266
267
268
269
270
271
272
273
274
275
276
277
278
279
280
281
282
283
284
285
286
287
288
289
290
291
292
293
294
295
296
297
298
299
300
301
302
303
304
305
306
307
308
309
310
311
312
313
314
315
316
317
318
319
320
321
322
323
324
325
326
327
328
329
330
331
332
333
334
335
336
337
338
339
340
341
342
343
344
345
346
347
348
349
3G.G. Knyazev et al. / International Journal of Psychophysiology xxx (2012) xxx–xxx
UNCO
RREC
during two experimental tasks and found that alpha band spatial pat-terns simultaneously showed a considerable overlap with the DMNand high correlations with presumptive DMN function-related out-comes. It should be borne in mind however that comparative to fMRI,this method has much lower spatial resolution which stems from thelow spatial resolution of the EEG source imaging techniques. Thatmeans that localization of underlying processes might be erroneous ifthere are several closely spaced sources that correlate with each otherin space and/or time. Using MEG instead of EEG may partly overcomethis limitation. An excellent example of this gives the study byBrookes et al. (2011) who applied to MEG data a combination ofbeamformer spatial filtering and independent component analysis anddemonstrated the potential of MEG as a tool for understanding themechanisms that underlie RSNs and the nature of connectivity thatbinds network nodes.
In this study, we aimed to replicate the findings of the Knyazev etal.'s (2011) study using larger datasets and denser electrode arrays.Secondly, we aimed to compare observed effects in subjects of differ-ent cultures (Russian and Taiwanese). Because the self of each indi-vidual develops in a specific socio-cultural context, it may undergostrong modulations and form a particular style in order to efficientlyinteract with other individuals in social environments (Han andNorthoff, 2009). Social and cultural psychologists have shown ampleevidence for cultural difference in the self and self-related processing(Markus and Kitayama, 1991; Zhu andHan, 2008). Unlike theWesternphilosophy that emphasizes the unique dispositions to define the self,East Asian philosophy puts strong emphasis on human connectionswith each other in social contexts (Zhu and Han, 2008). Existing datashow that these cultural differences extend to the neural substratesunderlying the processing of self-related information. Thus, a directcomparison of English-speakingWesterners andmonolingual Chinesesubjects in an fMRI study shows that Chinese individuals use the samebrain structure (namely, themedial prefrontal cortex, MPFC) to repre-sent both the self and a close other, whereasWestern subjects use it torepresent exclusively the self (Zhu et al., 2007). Although Russia is nota typical European country and Russian culture consists of a mixture ofWestern and Eastern values, in terms of individualism–collectivism di-mension it seems to be closer toWestern than to Eastern cultures (Suhet al., 1998). We have not been able to find any study of cross-culturaldifferences in EEG correlates of self-referential processes. We alsowere not able to find any study thatwould compare self-referential pro-cesses in Russians in comparison with a typical Western or a typicalEastern population. Therefore, this study could be considered as a firstattempt to fill this gap.
2. Methods
2.1. Subjects
Resting EEG data were collected in three samples. First Russiansample included 60 participants (32 men and 28 women; agerange 17 to 30 years, mean=20.4, SD=2.5). A part of this sample(48 participants) was used in the Knyazev et al.'s (2011) study. Sec-ond Russian sample included 58 participants (37 men and 21women; age range 19 to 77 years, mean=41.2, SD=20.8). Taiwan-ese sample included 42 participants (26 men and 16 women; agerange 18 to 33 years, mean=27.1, SD=3.3). All samples consistedof healthy volunteers. The first Russian sample and the Taiwanesesample mostly included university students, whereas the secondRussian sample included participants of different occupations. Allapplicable subject protection guidelines and regulations werefollowed in the conduct of the research in accordance with the Dec-laration of Helsinki. All participants gave informed consent to thestudy. The study has been approved by the Institute of Physiology,Russia, and the Institute of Statistical Science, Academia Sinica,Taiwan ethical committees.
Please cite this article as: Knyazev, G.G., et al., EEG correlates of spontanJournal of Psychophysiology (2012), http://dx.doi.org/10.1016/j.ijpsycho
ED P
RO
OF
2.2. Instruments and procedures
Experimental study of internal mental life using introspectivemethods was started in the late 19th century by Wilhelm Wundtand was continued in 20th century in works by Singer, Antrobus,and others (see Buckner et al., 2008 for review). In the past decade,the study of spontaneous cognition has introduced novel experi-mental approaches to explore the content of people's internal men-tal states, such as thought sampling or experience sampling (seeSmallwood and Schooler, 2006 for review). A limitation of these lat-ter approaches is that they interfere with the spontaneous thought,most typically to terminate its occurrence (Giambra, 1995). This is areason as to why retrospective methods of thought sampling, suchas questionnaire measures, are still widely used (Smallwood et al.,2004). It has been argued that retrospective measures confoundmind-wandering with awareness/memory of mind wandering be-cause they depend on an individual's ability to monitor attention(Schooler et al., 2005). Generally, however, these two approaches(i.e., thought sampling and retrospective measures) are reliably cor-related (Smallwood and Schooler, 2006). In this study, we used a brief(35 items) retrospective Spontaneous Thoughts Questionnaire (STQ)which was designed to measure different aspects of subject's state,thoughts, and feelings during spontaneous EEG registration. All itemswere measured on a five-point Likert scale. The questionnaire was ini-tially created in Russian by the first author and was subsequently trans-lated into Chinese by a Taiwanese bilingual language expert. The facevalidity of the Chinese translation was examined and modified by a se-nior psychometrician who also interviewed a few volunteer subjects onthewordings of items in the questionnaire. Thefinal Chinese STQversionhad minor corrections based on the interview results. Additionally, se-lected items were translated into English by the fourth author and sentto the first author for evaluation. Factor analysis of all questionnaireitems (principal components factor analysis with varimax rotation)was conducted in the total sample of subjects (N=160). Examinationof the eigenvalues and scree plot for a principal component analysisrevealed that a four-factor solution best fitted the data. Accordingly,four scales were created that described nervousness/negative emotion/lack of positive emotion (NE, example items: “felt nervous”, “experiencednegative emotions”, “was calm and relaxed” — reverse scoring, “liked theprocedure” — reverse scoring, Cronbach's alpha=0.84); self-referentialthought (SRT, example items: “thought about something pleasant thatis going to happen to me in the near future”, “recollected episodesfrom my own life”, “most of the time, thoughts of my recent pastrecurred to me”, “most of the time, I was absorbed in my privatethoughts”, Cronbach's alpha=0.69); arousal level (example items: “wasalmost asleep” — reverse scoring, “was quiet and relaxed” — reverse scor-ing, “was somewhat heated”, “was very excited”, Cronbach's alpha=0.72); attention to environment (ATT, “my attention wasmostly directedto external stimuli”, “most of the time, I listened to sounds and skin sen-sations”, “did not pay any attention to external stimuli”— reverse scoring,Cronbach's alpha=0.65). The SRT scale (SRTS)was used tomeasure indi-vidual differences in mental processes presumably related to DMN'sactivity.
Participants were seated in a soundproof dimly illuminatedroom and did not receive any instruction. According to Gale(1983), experimental conditions consisting of rest with repeatedopening and closing of the eyes are rated ‘moderately arousing’and therefore optimum for the study of EEG correlates of mentalprocesses that are inherent to the subject. Our procedure consistedof 6 one-minute recordings (3 with eyes closed and 3 with eyesopen) alternating pseudo-randomly. Only the eyes closed conditionwas analyzed in this study because previous research has shownthat self-referential thoughts correlate with EEG spectral power inthe eyes closed, but not in the eyes open condition (Knyazev et al.,2011). Participants were asked to fill out the STQ questionnairejust after the spontaneous EEG registration.
eous self-referential thoughts: A cross-cultural study, International.2012.09.002
T
350
351
352
353
354
355
356
357
358
359
360
361
362
363
364
365
366
367
368
369
370
371
372
373
374
375
376
377
378
379
380
381
382
383
384
385
386
387
388
389
390
391
392
393
394
395
396
397
398
399
400
401
402
403
404
405
406
407
408
409
410
411Q2
412
413
414
415
416
417
418
419
420
421
422
423
424
425
426
427
428
429
430
431
432
433
434
435
436
437
438
439
440
441
442
443
444
445
446
447
448
449
450
451
452
453
4 G.G. Knyazev et al. / International Journal of Psychophysiology xxx (2012) xxx–xxx
REC
2.3. EEG recording
The sample 1 EEG data were recorded in Novosibirsk, Russia,using 32 silver–silver chloride electrodes mounted in an elasticcap on the positions of the international 10–20 system. The signalswere amplified with a multichannel biosignal amplifier with a gainof 250 and a bandpass 0.05–70 Hz, −6 dB/octave and continuouslydigitized at 300 Hz. The sample 2 (Novosibirsk, Russia) EEG datawere recorded using 64 silver–silver chloride electrodes positionedaccording to a modified version of the international 10/20 System(American Electroencephalographic Society, 1991). The EEG wasdigitized at a rate of 1000 Hz and amplified using “Neuroscan(USA)” amplifiers with a gain of 250 and a bandpass of 0 to 70 Hz.The sample 3 EEG data were recorded in Taiwan using 132 channels.The EEG electrodes were placed on 128 head sites according to theextended International 10–10 system. The Quik-Cap128 NSL wasused for electrode fixation. The signals were amplified using“Neuroscan (USA)” amplifiers, with 0.1–100 Hz analog bandpassfollowed by a 50-Hz notch filter and continuously digitized at1000 Hz. The actual positions of each electrode and the three fidu-ciary points (nasion and preauricular points) were recorded bymeans of a digitizer (Polhemus).
To compare the skull shape in Taiwanese and Russian partici-pants, we used data from our recent experiment in which the actualpositions of each electrode were recorded in a Russian samplewhich closely matched the sample 1 from the current study interms of ethnicity, age, and gender (35 subjects, 17 females, agerange 17 to 30 years, mean=20.2, SD=5.5). The cephalic indexwas calculated as 100×head breadth/head length. The headbreadth was the distance from the left preauricular point to theright preauricular point and the head length was the distancefrom nasion to Oz. In Russians, the cephalic index (SD) was 86(2.8). In Taiwanese, it was 84.5 (3.9). The difference was not signif-icant (T=1.66, p=.101).
All recordings were performed using a fronto-central electrode asground, and electronically linked mastoid electrodes as reference.The horizontal and vertical electrooculogram (EOG)was registered si-multaneously. Electrode impedances were at or below 5 kΩ for allelectrodes used in the analysis. EEG data were artifact-correctedusing ICA via EEGLAB toolbox (http://www.sccn.ucsd.edu/eeglab/)retaining minimally 20 out of 30 (for the first sample), 40 out of 60(for the second sample), and 100 out of 128 (for the third sample)components and recomputed to average reference.
R 454455
456
457
458
459
460
461
462
463
464
465
466
467
468
469
470
471
472
473
474
UNCO2.4. 3D source reconstruction
To determine the cortical sources of EEG activity, sLORETA(Pascual-Marqui, 2002) was applied to the data. The sLORETA is a lin-early distributed solution that is based on standardized values of thecurrent density estimates given by the minimum norm solution. ThesLORETA functions on the assumption that the EEGs measured onthe scalp are generated by highly synchronized post-synaptic poten-tials occurring in large clusters of neurons (Pascual-Marqui, 2002).The sLORETA uses a three-shell spherical head model registered tothe digitized Talairach and Tournoux (1988) atlas (Brain Imaging Cen-tre, Montreal Neurological Institute). The solution space is restrictedto cortical gray matter and parahippocampal areas. The sLORETAyields images of standardized current source density of a total of6430 voxels at 5-mm spatial resolution. Artifact-free epochs of 1.7 sduration were supplied for cross-spectrum calculation in sLORETA.The number of epochs varied in different subjects from 85 to 210. Sub-sequently current source densities of delta (2–4 Hz), theta (4–8 Hz),alpha (8–12 Hz), beta (12–30 Hz), and gamma (30–45 Hz) oscilla-tions were estimated in sLORETA. The regularization factor was setat 1/100 (Congedo, 2006).
Please cite this article as: Knyazev, G.G., et al., EEG correlates of spontanJournal of Psychophysiology (2012), http://dx.doi.org/10.1016/j.ijpsych
ED P
RO
OF
2.5. Independent component analysis
In this study,weused the groupSICA, because it directly estimatescomponents that are consistently expressed in the population, in-volves the least amount of user interaction and is straightforward tocompare with the existing framework for group ICA of fMRI data(Calhoun et al., 2001b). First, current source density estimates forthefiveEEG frequencybandswerecalculatedusingsLORETA. Second,group SICA was applied to sLORETA images in a fashion that is rou-tinely used in fMRI research (Knyazev et al., 2011, 2012). SICA wasperformed using the Group spatial ICA for fMRI Toolbox (GIFT, Ver-sion 1.3i; http://icatb.sourceforge.net/), using methods and algo-rithms described in Calhoun et al. (2001b, 2004). The number ofextracted components was initially estimated from the data usingtheminimumdescription length (MDL) criteria. Basing on these esti-mates, 20componentswere retained for theStudy1dataand40com-ponents for the Study 2 and 3 data.
One-sample T-tests in SPM8 were used to assess the statistical sig-nificance of each component. Each subject's respective componentimage (z-score spatial map) was entered into a second-level random-effects analysis and assessed statistically using a threshold of PFDR=0.05 (whole-brain corrected) andminimum cluster size of 8 contiguousvoxels. Only the components that were statistically significant acrosssubjects were used in further analyses. In our data, more than 90% ofcomponents were statistically significant. All positive voxel values in arespective independent component image (z-score spatial map) weresummed for each subject. These values were further used in regressionanalyses in SPSS, as is described below. This approach to capturinginter-individual differences is based on the following discussion. Afterinitial decomposition on all concatenated datasets at once, the compo-nents are back reconstructed in each individual subject. After that,each component is more pronounced in some subjects and may beweak or absent in others. If the component is strongly pronounced ina particular subject, brain areas in which this component has maximalactivity will, in this subject, have high values. After scaling of spatialmaps in z-scores, these areas will have, in this subject, high positivevalues. In some other subject, where this component is weak, theseareas will have small values. Therefore, summing and comparing acrosssubjects the positive values in z-transformed spatial maps of a compo-nent allows revealing individual differences in intensity of this compo-nent. This method is described in the paper by Allen et al. (2011a).
To reduce observer bias in identifying the independent componentpatterns with description in fMRI literature networks, we performed aspatial sorting analysis in GIFT. For each respective set of Group ICA re-sults, independent components were spatially correlated with an ana-tomically defined template and were ranked according to a ‘highestcorrelation’ criterion (Pearson's r) with this anatomy (for a similar ap-proach see Garrity et al., 2007; Greicius et al., 2004; Harrison et al.,2008). In this study, we used several templates that were generatedusing the Wake Forest Pick atlas toolbox. The anterior DMN hub(ADMN) template included the superior frontal gyrus (BAs 8/9/10) andthe anterior cingulate cortex (BAs 11/32). The posterior DMN hub(PDMN) template included the posterior parietal cortex (Brodmann'sarea 7), the occipitoparietal junction (Brodmann's area 39), the posteriorcingulate, and the precuneus. Both bilateral and unilateral (left and right)templates of these areas were created. The similarity indices with eachtemplate were computed based on positive (after Z-transformation)loads (Calhoun et al., 2001a).
2.6. Statistical analysis
Associations between IC scores and SRTS scores were analyzedusing stepwise multiple regression method in SPSS. Scores of all sta-tistically significant components in all frequency bands were simulta-neously entered in a regression equation as independent variables topredict SRTS scores. There are potential pitfalls in regression models
eous self-referential thoughts: A cross-cultural study, Internationalo.2012.09.002
T
475
476
477
478
479
480
481
482
483
484
485
486
487
488
489
490
491
492
493
494
495
496
497
498
499
500
501
502
503
504
505
506
507
508
509
510
511
512
513
514
515
516
517
518
519
520
521
522
523
524
525
526
527
528
529
530
531
532
533
534
535
536
537
538
539
540
541
542
543
544
545
546
547
548
549
550
551
552
553
554
555
556
557
558
559
560
561
562
563
564
565
566
567
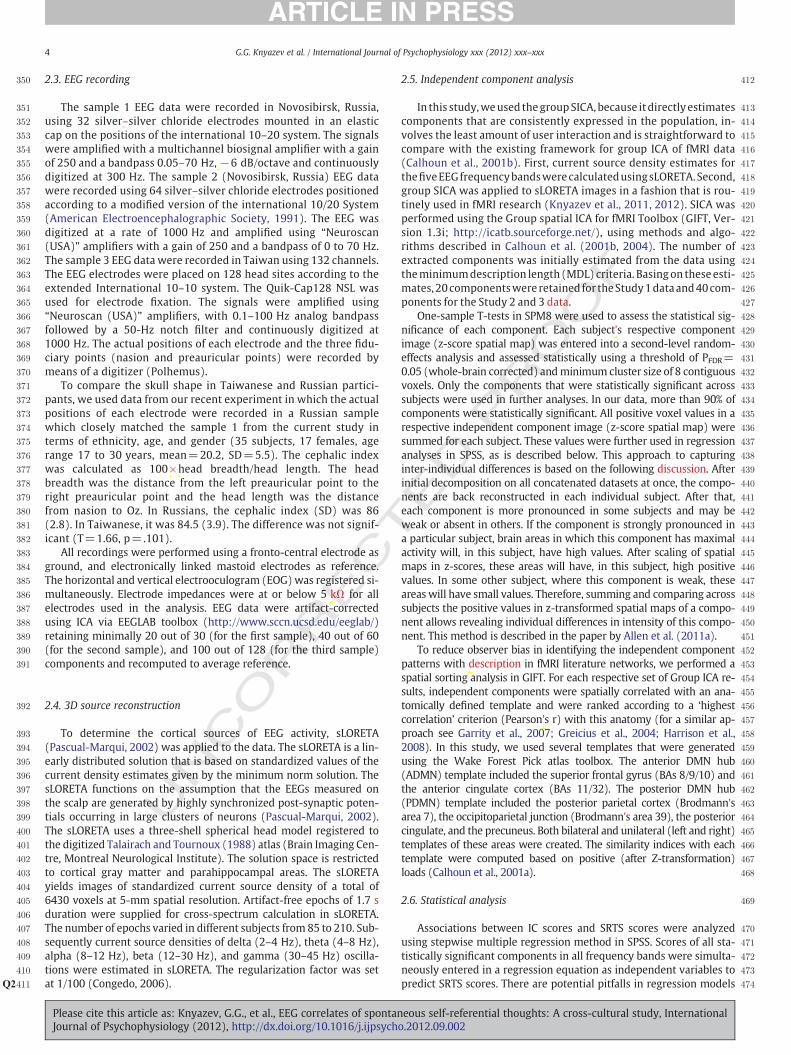
Fig. 1. Study 1. Anatomy of the alpha component that showed the strongest (positive) asso-ciation with SRTS scores and the largest spatial correlation with the PDMN template. Spatialmaps are scaled in z-scores.
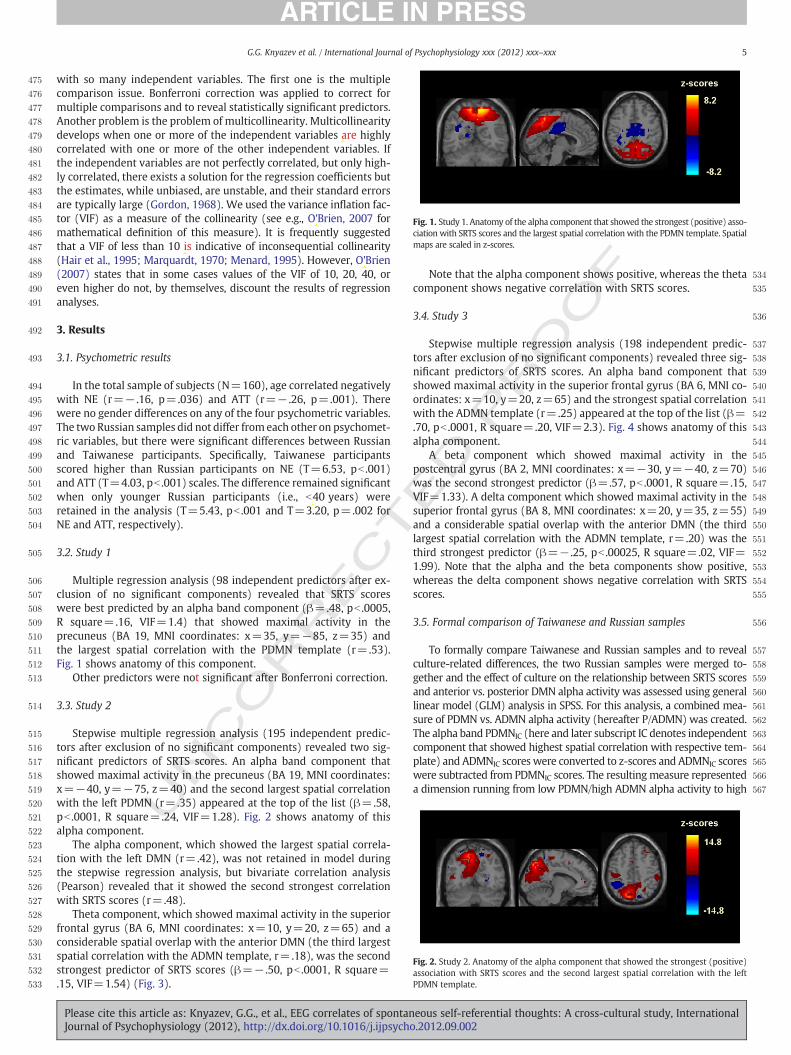
Fig. 2. Study 2. Anatomy of the alpha component that showed the strongest (positive)association with SRTS scores and the second largest spatial correlation with the leftPDMN template.
5G.G. Knyazev et al. / International Journal of Psychophysiology xxx (2012) xxx–xxx
UNCO
RREC
with so many independent variables. The first one is the multiplecomparison issue. Bonferroni correction was applied to correct formultiple comparisons and to reveal statistically significant predictors.Another problem is the problem of multicollinearity. Multicollinearitydevelops when one or more of the independent variables are highlycorrelated with one or more of the other independent variables. Ifthe independent variables are not perfectly correlated, but only high-ly correlated, there exists a solution for the regression coefficients butthe estimates, while unbiased, are unstable, and their standard errorsare typically large (Gordon, 1968). We used the variance inflation fac-tor (VIF) as a measure of the collinearity (see e.g., O'Brien, 2007 formathematical definition of this measure). It is frequently suggestedthat a VIF of less than 10 is indicative of inconsequential collinearity(Hair et al., 1995; Marquardt, 1970; Menard, 1995). However, O'Brien(2007) states that in some cases values of the VIF of 10, 20, 40, oreven higher do not, by themselves, discount the results of regressionanalyses.
3. Results
3.1. Psychometric results
In the total sample of subjects (N=160), age correlated negativelywith NE (r=− .16, p=.036) and ATT (r=− .26, p=.001). Therewere no gender differences on any of the four psychometric variables.The two Russian samples did not differ from each other on psychomet-ric variables, but there were significant differences between Russianand Taiwanese participants. Specifically, Taiwanese participantsscored higher than Russian participants on NE (T=6.53, pb .001)and ATT (T=4.03, pb .001) scales. The difference remained significantwhen only younger Russian participants (i.e., b40 years) wereretained in the analysis (T=5.43, pb .001 and T=3.20, p=.002 forNE and ATT, respectively).
3.2. Study 1
Multiple regression analysis (98 independent predictors after ex-clusion of no significant components) revealed that SRTS scoreswere best predicted by an alpha band component (β=.48, pb .0005,R square=.16, VIF=1.4) that showed maximal activity in theprecuneus (BA 19, MNI coordinates: x=35, y=−85, z=35) andthe largest spatial correlation with the PDMN template (r=.53).Fig. 1 shows anatomy of this component.
Other predictors were not significant after Bonferroni correction.
3.3. Study 2
Stepwise multiple regression analysis (195 independent predic-tors after exclusion of no significant components) revealed two sig-nificant predictors of SRTS scores. An alpha band component thatshowed maximal activity in the precuneus (BA 19, MNI coordinates:x=−40, y=−75, z=40) and the second largest spatial correlationwith the left PDMN (r=.35) appeared at the top of the list (β=.58,pb .0001, R square=.24, VIF=1.28). Fig. 2 shows anatomy of thisalpha component.
The alpha component, which showed the largest spatial correla-tion with the left DMN (r=.42), was not retained in model duringthe stepwise regression analysis, but bivariate correlation analysis(Pearson) revealed that it showed the second strongest correlationwith SRTS scores (r=.48).
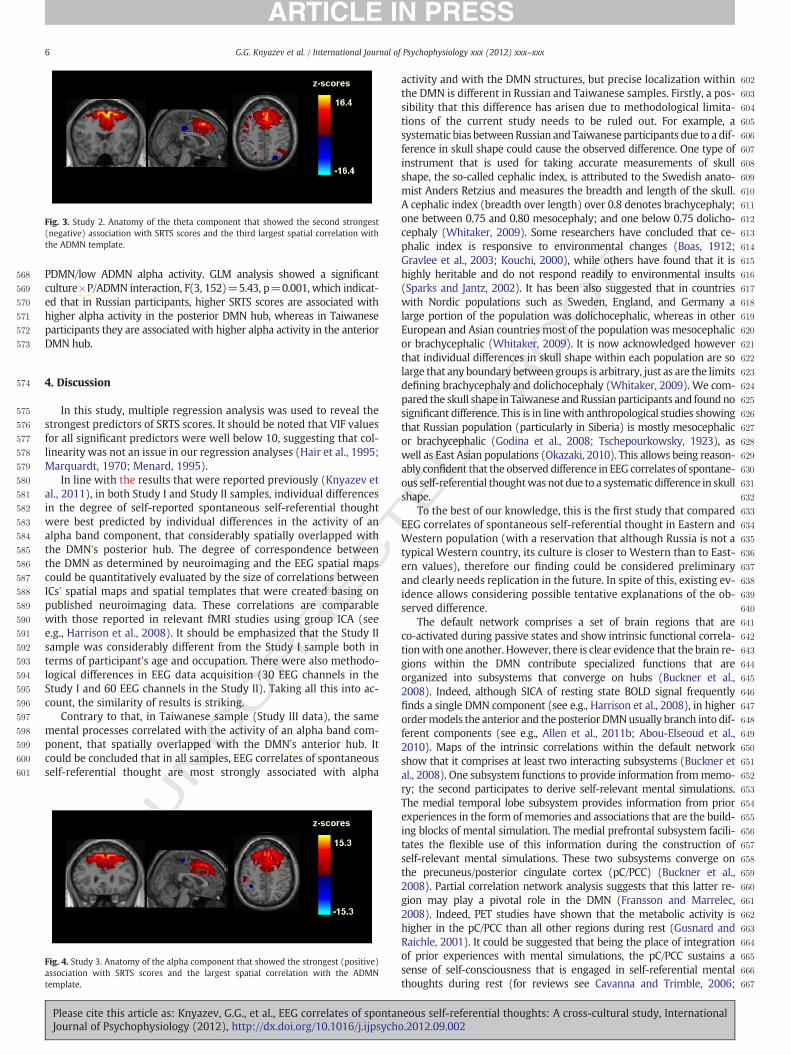
Theta component, which showed maximal activity in the superiorfrontal gyrus (BA 6, MNI coordinates: x=10, y=20, z=65) and aconsiderable spatial overlap with the anterior DMN (the third largestspatial correlation with the ADMN template, r=.18), was the secondstrongest predictor of SRTS scores (β=− .50, pb .0001, R square=.15, VIF=1.54) (Fig. 3).
Please cite this article as: Knyazev, G.G., et al., EEG correlates of spontanJournal of Psychophysiology (2012), http://dx.doi.org/10.1016/j.ijpsycho
ED P
RO
OFNote that the alpha component shows positive, whereas the theta
component shows negative correlation with SRTS scores.
3.4. Study 3
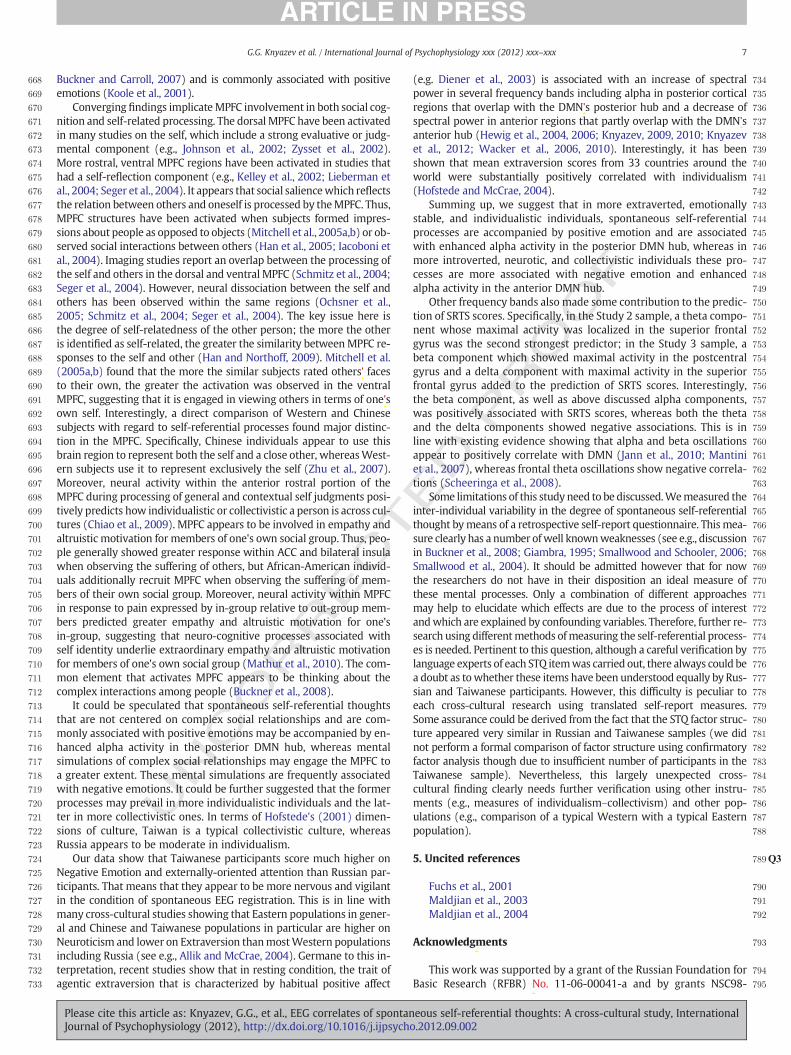
Stepwise multiple regression analysis (198 independent predic-tors after exclusion of no significant components) revealed three sig-nificant predictors of SRTS scores. An alpha band component thatshowed maximal activity in the superior frontal gyrus (BA 6, MNI co-ordinates: x=10, y=20, z=65) and the strongest spatial correlationwith the ADMN template (r=.25) appeared at the top of the list (β=.70, pb .0001, R square=.20, VIF=2.3). Fig. 4 shows anatomy of thisalpha component.
A beta component which showed maximal activity in thepostcentral gyrus (BA 2, MNI coordinates: x=−30, y=−40, z=70)was the second strongest predictor (β=.57, pb .0001, R square=.15,VIF=1.33). A delta component which showed maximal activity in thesuperior frontal gyrus (BA 8, MNI coordinates: x=20, y=35, z=55)and a considerable spatial overlap with the anterior DMN (the thirdlargest spatial correlation with the ADMN template, r=.20) was thethird strongest predictor (β=− .25, pb .00025, R square=.02, VIF=1.99). Note that the alpha and the beta components show positive,whereas the delta component shows negative correlation with SRTSscores.
3.5. Formal comparison of Taiwanese and Russian samples
To formally compare Taiwanese and Russian samples and to revealculture-related differences, the two Russian samples were merged to-gether and the effect of culture on the relationship between SRTS scoresand anterior vs. posterior DMN alpha activity was assessed using generallinear model (GLM) analysis in SPSS. For this analysis, a combined mea-sure of PDMN vs. ADMN alpha activity (hereafter P/ADMN) was created.The alpha band PDMNIC (here and later subscript IC denotes independentcomponent that showed highest spatial correlation with respective tem-plate) and ADMNIC scores were converted to z-scores and ADMNIC scoreswere subtracted from PDMNIC scores. The resultingmeasure representeda dimension running from low PDMN/high ADMN alpha activity to high
eous self-referential thoughts: A cross-cultural study, International.2012.09.002
568
569
570
571
572
573
574
575
576
577
578
579
580
581
582
583
584
585
586
587
588
589
590
591
592
593
594
595
596
597
598
599
600
601
602
603
604
605
606
607
608
609
610
611
612
613
614
615
616
617
618
619
620
621
Fig. 3. Study 2. Anatomy of the theta component that showed the second strongest(negative) association with SRTS scores and the third largest spatial correlation withthe ADMN template.
6 G.G. Knyazev et al. / International Journal of Psychophysiology xxx (2012) xxx–xxx
PDMN/low ADMN alpha activity. GLM analysis showed a significantculture×P/ADMN interaction, F(3, 152)=5.43, p=0.001, which indicat-ed that in Russian participants, higher SRTS scores are associated withhigher alpha activity in the posterior DMN hub, whereas in Taiwaneseparticipants they are associated with higher alpha activity in the anteriorDMN hub.
T622
623
624
625
626
627
628
629
630
631
632
633
634
635
636
637
638
639
640
641
642
643
644
645
646
647
648
649
650
651
652
CO
RREC
4. Discussion
In this study, multiple regression analysis was used to reveal thestrongest predictors of SRTS scores. It should be noted that VIF valuesfor all significant predictors were well below 10, suggesting that col-linearity was not an issue in our regression analyses (Hair et al., 1995;Marquardt, 1970; Menard, 1995).
In line with the results that were reported previously (Knyazev etal., 2011), in both Study I and Study II samples, individual differencesin the degree of self-reported spontaneous self-referential thoughtwere best predicted by individual differences in the activity of analpha band component, that considerably spatially overlapped withthe DMN's posterior hub. The degree of correspondence betweenthe DMN as determined by neuroimaging and the EEG spatial mapscould be quantitatively evaluated by the size of correlations betweenICs' spatial maps and spatial templates that were created basing onpublished neuroimaging data. These correlations are comparablewith those reported in relevant fMRI studies using group ICA (seee.g., Harrison et al., 2008). It should be emphasized that the Study IIsample was considerably different from the Study I sample both interms of participant's age and occupation. There were also methodo-logical differences in EEG data acquisition (30 EEG channels in theStudy I and 60 EEG channels in the Study II). Taking all this into ac-count, the similarity of results is striking.
Contrary to that, in Taiwanese sample (Study III data), the samemental processes correlated with the activity of an alpha band com-ponent, that spatially overlapped with the DMN's anterior hub. Itcould be concluded that in all samples, EEG correlates of spontaneousself-referential thought are most strongly associated with alpha
UN 653
654
655
656
657
658
659
660
661
662
663
664
665
666
667
Fig. 4. Study 3. Anatomy of the alpha component that showed the strongest (positive)association with SRTS scores and the largest spatial correlation with the ADMNtemplate.
Please cite this article as: Knyazev, G.G., et al., EEG correlates of spontanJournal of Psychophysiology (2012), http://dx.doi.org/10.1016/j.ijpsych
ED P
RO
OF
activity and with the DMN structures, but precise localization withinthe DMN is different in Russian and Taiwanese samples. Firstly, a pos-sibility that this difference has arisen due to methodological limita-tions of the current study needs to be ruled out. For example, asystematic bias betweenRussian andTaiwanese participants due to a dif-ference in skull shape could cause the observed difference. One type ofinstrument that is used for taking accurate measurements of skullshape, the so-called cephalic index, is attributed to the Swedish anato-mist Anders Retzius and measures the breadth and length of the skull.A cephalic index (breadth over length) over 0.8 denotes brachycephaly;one between 0.75 and 0.80 mesocephaly; and one below 0.75 dolicho-cephaly (Whitaker, 2009). Some researchers have concluded that ce-phalic index is responsive to environmental changes (Boas, 1912;Gravlee et al., 2003; Kouchi, 2000), while others have found that it ishighly heritable and do not respond readily to environmental insults(Sparks and Jantz, 2002). It has been also suggested that in countrieswith Nordic populations such as Sweden, England, and Germany alarge portion of the population was dolichocephalic, whereas in otherEuropean and Asian countries most of the population was mesocephalicor brachycephalic (Whitaker, 2009). It is now acknowledged howeverthat individual differences in skull shape within each population are solarge that any boundary between groups is arbitrary, just as are the limitsdefining brachycephaly and dolichocephaly (Whitaker, 2009). We com-pared the skull shape in Taiwanese andRussian participants and foundnosignificant difference. This is in linewith anthropological studies showingthat Russian population (particularly in Siberia) is mostly mesocephalicor brachycephalic (Godina et al., 2008; Tschepourkowsky, 1923), aswell as East Asian populations (Okazaki, 2010). This allows being reason-ably confident that the observed difference in EEG correlates of spontane-ous self-referential thoughtwas not due to a systematic difference in skullshape.
To the best of our knowledge, this is the first study that comparedEEG correlates of spontaneous self-referential thought in Eastern andWestern population (with a reservation that although Russia is not atypical Western country, its culture is closer to Western than to East-ern values), therefore our finding could be considered preliminaryand clearly needs replication in the future. In spite of this, existing ev-idence allows considering possible tentative explanations of the ob-served difference.
The default network comprises a set of brain regions that areco-activated during passive states and show intrinsic functional correla-tionwith one another. However, there is clear evidence that the brain re-gions within the DMN contribute specialized functions that areorganized into subsystems that converge on hubs (Buckner et al.,2008). Indeed, although SICA of resting state BOLD signal frequentlyfinds a single DMN component (see e.g., Harrison et al., 2008), in higherordermodels the anterior and the posterior DMNusually branch into dif-ferent components (see e.g., Allen et al., 2011b; Abou-Elseoud et al.,2010). Maps of the intrinsic correlations within the default networkshow that it comprises at least two interacting subsystems (Buckner etal., 2008). One subsystem functions to provide information frommemo-ry; the second participates to derive self-relevant mental simulations.The medial temporal lobe subsystem provides information from priorexperiences in the form of memories and associations that are the build-ing blocks of mental simulation. The medial prefrontal subsystem facili-tates the flexible use of this information during the construction ofself-relevant mental simulations. These two subsystems converge onthe precuneus/posterior cingulate cortex (pC/PCC) (Buckner et al.,2008). Partial correlation network analysis suggests that this latter re-gion may play a pivotal role in the DMN (Fransson and Marrelec,2008). Indeed, PET studies have shown that the metabolic activity ishigher in the pC/PCC than all other regions during rest (Gusnard andRaichle, 2001). It could be suggested that being the place of integrationof prior experiences with mental simulations, the pC/PCC sustains asense of self-consciousness that is engaged in self-referential mentalthoughts during rest (for reviews see Cavanna and Trimble, 2006;
eous self-referential thoughts: A cross-cultural study, Internationalo.2012.09.002
T
668
669
670
671
672
673
674
675
676
677
678
679
680
681
682
683
684
685
686
687
688
689
690
691
692
693
694
695
696
697
698
699
700
701
702
703
704
705
706
707
708
709
710
711
712
713
714
715
716
717
718
719
720
721
722
723
724
725
726
727
728
729
730
731
732
733
734
735
736
737
738
739
740
741
742
743
744
745
746
747
748
749
750
751
752
753
754
755
756
757
758
759
760
761
762
763
764
765
766
767
768
769
770
771
772
773
774
775
776
777
778
779
780
781
782
783
784
785
786
787
788
789Q3
790
791
792
793
794
795
7G.G. Knyazev et al. / International Journal of Psychophysiology xxx (2012) xxx–xxx
UNCO
RREC
Buckner and Carroll, 2007) and is commonly associated with positiveemotions (Koole et al., 2001).
Converging findings implicateMPFC involvement in both social cog-nition and self-related processing. The dorsal MPFC have been activatedin many studies on the self, which include a strong evaluative or judg-mental component (e.g., Johnson et al., 2002; Zysset et al., 2002).More rostral, ventral MPFC regions have been activated in studies thathad a self-reflection component (e.g., Kelley et al., 2002; Lieberman etal., 2004; Seger et al., 2004). It appears that social saliencewhich reflectsthe relation between others and oneself is processed by theMPFC. Thus,MPFC structures have been activated when subjects formed impres-sions about people as opposed to objects (Mitchell et al., 2005a,b) or ob-served social interactions between others (Han et al., 2005; Iacoboni etal., 2004). Imaging studies report an overlap between the processing ofthe self and others in the dorsal and ventral MPFC (Schmitz et al., 2004;Seger et al., 2004). However, neural dissociation between the self andothers has been observed within the same regions (Ochsner et al.,2005; Schmitz et al., 2004; Seger et al., 2004). The key issue here isthe degree of self-relatedness of the other person; the more the otheris identified as self-related, the greater the similarity betweenMPFC re-sponses to the self and other (Han and Northoff, 2009). Mitchell et al.(2005a,b) found that the more the similar subjects rated others' facesto their own, the greater the activation was observed in the ventralMPFC, suggesting that it is engaged in viewing others in terms of one'sown self. Interestingly, a direct comparison of Western and Chinesesubjects with regard to self-referential processes found major distinc-tion in the MPFC. Specifically, Chinese individuals appear to use thisbrain region to represent both the self and a close other, whereasWest-ern subjects use it to represent exclusively the self (Zhu et al., 2007).Moreover, neural activity within the anterior rostral portion of theMPFC during processing of general and contextual self judgments posi-tively predicts how individualistic or collectivistic a person is across cul-tures (Chiao et al., 2009). MPFC appears to be involved in empathy andaltruistic motivation for members of one's own social group. Thus, peo-ple generally showed greater response within ACC and bilateral insulawhen observing the suffering of others, but African-American individ-uals additionally recruit MPFC when observing the suffering of mem-bers of their own social group. Moreover, neural activity within MPFCin response to pain expressed by in-group relative to out-group mem-bers predicted greater empathy and altruistic motivation for one'sin-group, suggesting that neuro-cognitive processes associated withself identity underlie extraordinary empathy and altruistic motivationfor members of one's own social group (Mathur et al., 2010). The com-mon element that activates MPFC appears to be thinking about thecomplex interactions among people (Buckner et al., 2008).
It could be speculated that spontaneous self-referential thoughtsthat are not centered on complex social relationships and are com-monly associated with positive emotions may be accompanied by en-hanced alpha activity in the posterior DMN hub, whereas mentalsimulations of complex social relationships may engage the MPFC toa greater extent. These mental simulations are frequently associatedwith negative emotions. It could be further suggested that the formerprocesses may prevail in more individualistic individuals and the lat-ter in more collectivistic ones. In terms of Hofstede's (2001) dimen-sions of culture, Taiwan is a typical collectivistic culture, whereasRussia appears to be moderate in individualism.
Our data show that Taiwanese participants score much higher onNegative Emotion and externally-oriented attention than Russian par-ticipants. That means that they appear to be more nervous and vigilantin the condition of spontaneous EEG registration. This is in line withmany cross-cultural studies showing that Eastern populations in gener-al and Chinese and Taiwanese populations in particular are higher onNeuroticism and lower on Extraversion thanmostWestern populationsincluding Russia (see e.g., Allik and McCrae, 2004). Germane to this in-terpretation, recent studies show that in resting condition, the trait ofagentic extraversion that is characterized by habitual positive affect
Please cite this article as: Knyazev, G.G., et al., EEG correlates of spontanJournal of Psychophysiology (2012), http://dx.doi.org/10.1016/j.ijpsycho
ED P
RO
OF
(e.g. Diener et al., 2003) is associated with an increase of spectralpower in several frequency bands including alpha in posterior corticalregions that overlap with the DMN's posterior hub and a decrease ofspectral power in anterior regions that partly overlap with the DMN'santerior hub (Hewig et al., 2004, 2006; Knyazev, 2009, 2010; Knyazevet al., 2012; Wacker et al., 2006, 2010). Interestingly, it has beenshown that mean extraversion scores from 33 countries around theworld were substantially positively correlated with individualism(Hofstede and McCrae, 2004).
Summing up, we suggest that in more extraverted, emotionallystable, and individualistic individuals, spontaneous self-referentialprocesses are accompanied by positive emotion and are associatedwith enhanced alpha activity in the posterior DMN hub, whereas inmore introverted, neurotic, and collectivistic individuals these pro-cesses are more associated with negative emotion and enhancedalpha activity in the anterior DMN hub.
Other frequency bands also made some contribution to the predic-tion of SRTS scores. Specifically, in the Study 2 sample, a theta compo-nent whose maximal activity was localized in the superior frontalgyrus was the second strongest predictor; in the Study 3 sample, abeta component which showed maximal activity in the postcentralgyrus and a delta component with maximal activity in the superiorfrontal gyrus added to the prediction of SRTS scores. Interestingly,the beta component, as well as above discussed alpha components,was positively associated with SRTS scores, whereas both the thetaand the delta components showed negative associations. This is inline with existing evidence showing that alpha and beta oscillationsappear to positively correlate with DMN (Jann et al., 2010; Mantiniet al., 2007), whereas frontal theta oscillations show negative correla-tions (Scheeringa et al., 2008).
Some limitations of this study need to be discussed.Wemeasured theinter-individual variability in the degree of spontaneous self-referentialthought bymeans of a retrospective self-report questionnaire. This mea-sure clearly has a number ofwell knownweaknesses (see e.g., discussionin Buckner et al., 2008; Giambra, 1995; Smallwood and Schooler, 2006;Smallwood et al., 2004). It should be admitted however that for nowthe researchers do not have in their disposition an ideal measure ofthese mental processes. Only a combination of different approachesmay help to elucidate which effects are due to the process of interestandwhich are explained by confounding variables. Therefore, further re-search using differentmethods ofmeasuring the self-referential process-es is needed. Pertinent to this question, although a careful verification bylanguage experts of each STQ itemwas carried out, there always could bea doubt as towhether these items have been understood equally by Rus-sian and Taiwanese participants. However, this difficulty is peculiar toeach cross-cultural research using translated self-report measures.Some assurance could be derived from the fact that the STQ factor struc-ture appeared very similar in Russian and Taiwanese samples (we didnot perform a formal comparison of factor structure using confirmatoryfactor analysis though due to insufficient number of participants in theTaiwanese sample). Nevertheless, this largely unexpected cross-cultural finding clearly needs further verification using other instru-ments (e.g., measures of individualism–collectivism) and other pop-ulations (e.g., comparison of a typical Western with a typical Easternpopulation).
5. Uncited references
Fuchs et al., 2001Maldjian et al., 2003Maldjian et al., 2004
Acknowledgments
This work was supported by a grant of the Russian Foundation forBasic Research (RFBR) No. 11-06-00041-a and by grants NSC98-
eous self-referential thoughts: A cross-cultural study, International.2012.09.002
796
797
798
799
800
801
802
803804805806807808809810811812813814815816817818819820821822823824825826827828829830831832833834835836837838839840841842843844845846847848849850851852853854855856857858859860861862863864865866867868869870871872873874875
876877878879880881882883
8 G.G. Knyazev et al. / International Journal of Psychophysiology xxx (2012) xxx–xxx
2410-H-001-012-MY3 and NSC100-2811-H-001-005 from the Nation-al Science Council (Taiwan). The authors are grateful to Vince Calhounand Srinivas Rachakonda for helpful advices with the GIFT software.We are also grateful to J.Y. Slobodskoj-Plusnin, N.V. Dmitrienko, E.Yu.Privodnova, and N.A. Koneva for their help with data collection and toall the participants for their patience.
T
884885886887888889890891892893894895896897898899900901902903904905906907908909910911912913914915916917918919920921922923924925926927928929930931932933934935936937938939940941942943944945946947948949950951952953954955956957958959960961
UNCO
RREC
References
Abou-Elseoud, A., Starck, T., Remes, J., Nikkinen, J., Tervonen, O., Kiviniemi, V., 2010.The effect of model order selection in group PICA. Human Brain Mapping 31,1207–1216.
Allen, E.A., Erhardt, E.B., Wei, Y., Eichele, T., Calhoun, V.D., 2011a. Capturing inter-subject variability with group independent component analysis of fMRI data: asimulation study. NeuroImage 59, 4141–4159.
Allen, E.A., Erhardt, E.B., Damaraju, E., Gruner, W., Segall, J.M., Silva, R.S., et al., 2011b. Abaseline for the multivariate comparison of resting-state networks. Frontiers inSystems Neuroscience 5, 1–23.
Allik, J., McCrae, R.R., 2004. Toward a geography of personality traits: patterns of profilesacross 36 cultures. Journal of Cross-Cultural Psychology 35, 13–28.
American Electroencephalographic Society, 1991. Guidelines for standard electrodeposition nomenclature. Journal of Clinical Neurophysiology 8, 200–202.
Biswal, B., Yetkin, F.Z., Haughton, V.M., Hyde, J.S., 1995. Functional connectivity in themotor cortex of resting human brain using echo-planar MRI. Magnetic Resonancein Medicine 34, 537–541.
Boas, F., 1912. Changes in the Body Form of Descendants of Immigrants. Columbia UniversityPress, New York.
Boly, M., Phillips, C., Tshibanda, L., Vanhaudenhuyse, A., Schabus, M., Dang-Vu, T.T., etal., 2008. Intrinsic brain activity in altered states of consciousness: how consciousis the default mode of brain function? Annals of the New York Academy of Sciences1129, 119–129.
Brookes, M.J., Woolrich, M., Luckhoo, H., Price, D., Hale, J.R., Stephenson, M.C., et al.,2011. Investigating the electrophysiological basis of resting state networks usingmagnetoencephalography. Proceedings of the National Academy of Sciences ofthe United States of America 108, 16783–16788.
Buckner, R.L., Carroll, D.C., 2007. Self-projection and the brain. TICS 11, 49–57.Buckner, R.L., Andrews-Hanna, J.R., Schacter, D.L., 2008. The brain's default network:
anatomy, function, and relevance to disease. Annals of the New York Academy ofSciences 1124, 1–38.
Calhoun, V.D., Adali, T., Pearlson, G.D., Pekar, J.J., 2001a. Spatial and temporal independentcomponent analysis of functional MRI data containing a pair of task-related wave-forms. Human Brain Mapping 13, 43–53.
Calhoun, V.D., Adali, T., Pearlson, G.D., Pekar, J.J., 2001b. A method for making group in-ferences from functional MRI data using independent component analysis. HumanBrain Mapping 14, 140–151.
Calhoun, V.D., Adali, T., Pekar, J.J., 2004. A method for comparing group fMRI data usingindependent component analysis: application to visual, motor and visuomotortasks. Magnetic Resonance Imaging 22, 1181–1191.
Cavanna, A.E., Trimble, M.R., 2006. The precuneus: a review of its functional anatomyand behavioural correlates. Brain 129, 564–583.
Chiao, J.Y., Harada, T., Komeda, H., Zhang, L., Mano, Y., Saito, D.N., et al., 2009. Neuralbasis of individualistic and collectivistic views of self. Human Brain Mapping 30,2813–2829.
Christoff, K., Ream, J.M., Geddes, L.P.T., Gabrieli, J.D.E., 2003. Evaluating self-generatedinformation: anterior prefrontal contributions to human cognition. BehavioralNeuroscience 117, 1161–1168.
Congedo, M., John, R.E., De Ridder, D., Prichep, L., 2010. Group independent componentanalysis of resting state EEG in large normative samples. International Journal ofPsychophysiology 78, 89–99.
David, N., Cohen, M.X., Newen, A., Bewernick, B.H., Shah, N.J., Fink, G.R., et al., 2007. Theextrastriate cortex distinguishes between the consequences of one's own andothers' behavior. NeuroImage 36, 1004–1014.
de Munck, J.C., Gonçalves, C.I., Huijboom, L., Kuijer, J.P.A., Pouwels, P.J.W., Heethaar,R.M., Lopes da Silva, F.H., 2007. The hemodynamic response of the alpharhythm: an EEG/fMRI study. NeuroImage 35, 1142–1151.
de Munck, J.C., Gonçalves, C.I., Faes, T.J.C., Kuijer, J.P.A., Pouwels, P.J.W., Heethaar, R.M.,Lopes da Silva, F.H., 2008. A study of the brain's resting state based on alpha bandpower, heart rate and fMRI. NeuroImage 42, 112–121.
Delorme, A., Makeig, S., 2004. EEGLAB: an open source toolbox for analysis of single-trialEEG dynamics including independent component analysis. Journal of NeuroscienceMethods 134, 9–21.
Diener, E., Oishi, S., Lucas, R.E., 2003. Personality, culture, and subjective well-being:emotional and cognitive evaluation of life. Annual Review of Psychology 54,403–425.
Esposito, F., Scarabino, T., Hyvarinen, A., Himberg, J., Formisano, E., Comani, S.,Tedeschi, G., Goebel, R., Seifritz, E., Di Salle, F., 2005. Independent component anal-ysis of fMRI group studies by self-organizing clustering. NeuroImage 25, 193–205.
Fransson, P., Marrelec, G., 2008. The precuneus/posterior cingulate cortex plays a pivotal rolein the default mode network: evidence from a partial correlation network analysis.NeuroImage 42, 1178–1184.
Fuchs, M., Wagner, M., Kastner, J., 2001. Boundary element method volume conductormodels for EEG source reconstruction. Clinical Neurophysiology 112, 1400–1407.
Please cite this article as: Knyazev, G.G., et al., EEG correlates of spontanJournal of Psychophysiology (2012), http://dx.doi.org/10.1016/j.ijpsych
ED P
RO
OF
Gale, A., 1983. Electroencephalographic studies of extraversion–introversion: a casestudy in the psychophysiology of individual differences. Personality and IndividualDifferences 4, 371–380.
Garrity, A., Pearlson, G.D., McKiernan, K., Lloyd, D., Kiehl, K.A., Calhoun, V.D., 2007. Aberrantdefault mode functional connectivity in schizophrenia. American Journal of Psychiatry164, 450–457.
Giambra, L.M., 1995. A laboratory method for investigating influences on switching at-tention to task-unrelated imagery and thought. Consciousness and Cognition 4,1–21.
Godina, E.Z., Khomyakova, I.A., Purundzhan, A.L., Zadorozhnaya, L.V., 2008.Morphofunctional characteristics of the students of Moscow Suvorov MilitarySchool. Acta Medica Lituanica 15, 16–26.
Golland, Y., Bentin, S., Gelbard, H., Benjamini, Y., Heller, R., Nir, Y., et al., 2007. Extrinsicand intrinsic systems in the posterior cortex of the human brain revealed duringnatural sensory stimulation. Cerebral Cortex 17, 766–777.
Gordon, R.A., 1968. Issues in multiple regression. American Journal of Sociology 73,592–616.
Gravlee, C.C., Bernard, R.H., Leonard,W.R., 2003. Heredity, environment, and cranial form:a re-analysis of Boas's immigrant data. American Anthropologist 105, 125–138.
Greicius, M.D., Srivastava, G., Reiss, A.L., Menon, V., 2004. Default-mode network activitydistinguishes Alzheimer's disease from healthy aging: evidence from functional MRI.Proceedings of the National Academy of Sciences of the United States of America 101,4637–4642.
Gusnard, D.A., Raichle, M.E., 2001. Searching for a baseline: functional neuroimagingand the resting human brain. Nature Reviews. Neuroscience 3, 685–694.
Gusnard, D.A., Akbudak, E., Shulman, G.L., Raichle, M.E., 2001. Medial prefrontal cortexand self-referential mental activity: relation to a default mode of brain function.Proceedings of the National Academy of Sciences of the United States of America98, 4259–4264.
Hair Jr., J.F., Anderson, R.E., Tatham, R.L., Black, W.C., 1995. Multivariate Data Analysis,3rd edn. Macmillan, New York.
Han, S., Northoff, G., 2009. Understanding the self: a cultural neuroscience approach.Progress in Brain Research 178, 203–212.
Han, S., Jiang, Y., Humphreys, G.W., Zhou, T., Cai, P., 2005. Distinct neural substrates forthe perception of real and virtual visual worlds. NeuroImage 24, 928–935.
Harrison, B.J., Pujol, J., Lopez-Sola, M., Hernandez-Ribas, R., Deus, J., Ortiz, H., Soriano-Mas, C., Yucel, M., Pantelis, C., Cardoner, N., 2008. Consistency and functional spe-cialization in the default mode brain network. Proceedings of the National Acade-my of Sciences of the United States of America 105, 9781–9786.
Hewig, J., Hagemann, D., Seifert, J., Naumann, E., Bartussek, D., 2004. On the selectiverelation of frontal cortical asymmetry and anger-out versus anger-control. Journalof Personality and Social Psychology 87, 926–939.
Hewig, J., Hagemann, D., Seifert, J., Naumann, E., Bartussek, D., 2006. The relation of corticalactivity and BIS/BAS on the trait level. Biological Psychology 71, 42–53.
Hofstede, G., 2001. Culture's Consequences: Comparing Values, Behaviours, Institutions,and Organizations Across Nations, 2nd ed. Sage, Thousand Oaks, CA.
Hofstede, G., McCrae, R.R., 2004. Personality and culture revisited: linking traits and di-mensions of culture. Cross-Cultural Research 38, 52–88.
Iacoboni, M., Lieberman, M.D., Knowlton, B.J., Molnar‐Szakacs, I., Moritz, M., Throop, C.J.,et al., 2004. Watching social interactions produces dorsomedial prefrontal and medi-al parietal BOLD fMRI signal increases compared to a resting baseline. NeuroImage21, 1167–1173.
Jann, K., Dierks, T., Boesch, C., Kottlow, M., Strik, W., Koenig, T., 2009. BOLD correlates ofEEG alpha phase-locking and the fMRI default mode network. NeuroImage 45,903–916.
Jann, K., Kottlow, M., Dierks, T., Boesch, C., Koenig, T., 2010. Topographic electrophysiologicalsignatures of fMRI resting state networks. PLoS One 5, e12945.
Johnson, S.C., Baxter, L.C., Wilder, L.S., Pipe, J.G., Heiserman, J.E., Prigatano, G.P., 2002.Neural correlates of self-reflection. Brain 125, 1808–1814.
Kelley, W.M., Macrae, C.N., Wyland, C.L., Caglar, S., Inati, S., Heatherton, T.F., 2002. Findingthe self? An event‐related fMRI study. Journal of Cognitive Neuroscience 14, 785–794.
Knyazev, G.G., 2009. Is cortical distribution of spectral power a stable individual characteris-tic? International Journal of Psychophysiology 72, 123–133.
Knyazev, G.G., 2010. Antero-posterior spectral power gradient as a correlate of extra-version and behavioral inhibition. Open Neuroimaging Journal 4, 114–120.
Knyazev, G.G., Slobodskoj-Plusnin, J.Y., Bocharov, A.V., Pylkova, L.V., 2011. The defaultmode network and EEG alpha oscillations: an independent component analysis.Brain Research 1402, 67–79.
Knyazev, G.G., Bocharov, A.V., Pylkova, L.V., 2012. Extraversion and fronto-posterior EEGspectral power gradient: an independent component analysis. Biological Psychology89, 515–524.
Koole, S.L., Dijksterhuis, A., van Knippenberg, A., 2001. What's in a name: implicit self-esteem and the automatic self. Journal of Personality and Social Psychology 80,669–685.
Kouchi, M., 2000. Brachycephalization in Japan has ceased. American Journal of PhysicalAnthropology 112, 339–347.
Laufs, H., 2008. Endogenous brain oscillations and related networks detected by surfaceEEG-combined fMRI. Human Brain Mapping 29, 762–769.
Laufs, H., Kleinschmidt, A., Beyerle, A., Eger, E., Salek-Haddadi, A., Preibisch, C., Krakow, K.,2003a. EEG-correlated fMRI of human alpha activity. NeuroImage 19, 1463–1476.
Laufs, H., Krakow, K., Sterzer, P., Eger, E., Beyerle, A., Salek-Haddadi, A., Kleinschmidt,A., 2003b. Electroencephalographic signatures of attentional and cognitive defaultmodes in spontaneous brain activity at rest. Proceedings of the National Academyof Sciences of the United States of America 100, 11053–11058.
Laufs, H., Holt, J.L., Elfont, R., Krams, M., Paul, J.S., Krakow, K., Kleinschmidt, A., 2006.Where the BOLD signal goes when alpha EEG leaves. NeuroImage 31, 1408–1418.
eous self-referential thoughts: A cross-cultural study, Internationalo.2012.09.002
T
96296396496596696796896997097197297397497597697797897998098198298398498598698798898999099199299399499599699799899910001001100210031004100510061007100810091010101110121013101410151016101710181019102010211022
1023102410251026102710281029103010311032103310341035103610371038103910401041104210431044104510461047104810491050105110521053105410551056105710581059106010611062106310641065106610671068106910701071107210731074107510761077107810791080
1081
1082
9G.G. Knyazev et al. / International Journal of Psychophysiology xxx (2012) xxx–xxx
ORREC
Lieberman, M.D., Jarcho, J.M., Satpute, A.B., 2004. Evidence-based and intuition-basedself-knowledge: an fMRI study. Journal of Personality and Social Psychology 87,421–435.
Lowe, M.J., Mock, B.J., Sorenson, J.A., 1998. Functional connectivity in single andmultisliceechoplanar imaging using resting-state fluctuations. NeuroImage 7, 119–132.
Makeig, S., Delorme, A., Westerfield, M., Jung, T.-P., Townsend, J., Courchesne, E.,Sejnowski, T.J., 2004. Electroencephalographic brain dynamics following manuallyresponded visual targets. PLoS Biology 2, e176.
Maldjian, J.A., Laurienti, P.J., Burdette, J.B., Kraft, R.A., 2003. An automated method forneuroanatomic and cytoarchitectonic atlas-based interrogation of fMRI data sets.NeuroImage 19, 1233–1239.
Maldjian, J.A., Laurienti, P.J., Burdette, J.H., 2004. Precentral gyrus discrepancy in elec-tronic versions of the Talairach atlas. NeuroImage 21, 450–455.
Mantini, D., Perrucci, M.G., Del Gratta, D., Romani, G.L., Corbetta, M., 2007. Electrophysio-logical signatures of resting state networks in the human brain. Proceedings of theNational Academy of Sciences of the United States of America 104, 13170–13175.
Markus, H.R., Kitayama, S., 1991. Culture and the self: implication for cognition, emo-tion and motivation. Psychological Review 98, 224–253.
Marquardt, D.W., 1970. Generalized inverses, ridge regression, biased linear estima-tion, and nonlinear estimation. Technometrics 12, 591–612.
Martinez-Montes, E., Valdes-Sosa, P.A., Miwakeichi, F., Goldman, R.I., Cohen, M.S., 2004.Concurrent EEG/fMRI analysis by multiway partial least squares. NeuroImage 22,1023–1034.
Mathur, V.A., Harada, T., Lipke, T., Chiao, J.Y., 2010. Neural basis of extraordinary empa-thy and altruistic motivation. NeuroImage 51, 1468–1475.
Meltzer, J.A., Negishi, M., Mayes, L.C., Constable, R.T., 2007. Individual differences in EEGtheta and alpha dynamics during working memory correlate with fMRI responsesacross subjects. Clinical Neurophysiology 118, 2419–2436.
Menard, S., 1995. Applied Logistic Regression Analysis: Sage University Series on Quan-titative Applications in the Social Sciences. Sage, Thousand Oaks, CA.
Mitchell, J.P., 2006. Mentalizing and Marr: an information processing approach to thestudy of social cognition. Brain Research 1079, 66–75.
Mitchell, J.P., Banaji, M.R., Macrae, C.N., 2005a. The link between social cognition andself-referential thought in the medial prefrontal cortex. Journal of Cognitive Neuro-science 17, 1306–1315.
Mitchell, J.P., Neil Macrae, C., Banaji, M.R., 2005b. Forming impressions of people versusinanimate objects: social–cognitive processing in the medial prefrontal cortex.NeuroImage 26, 251–257.
Mu, Y., Han, S., 2010. Neural oscillations involved in self-referential processing. NeuroImage53, 757–768.
O'Brien, R.M., 2007. A caution regarding rules of thumb for variance inflation factors.Quality and Quantity 41, 673–690.
Ochsner, K.N., Beer, B.S., Robertson, E.R., Cooper, J.C., Gabrieli, J.D.E., Kihsltrom, J.F., etal., 2005. The neural correlates of direct and reflected self-knowledge. NeuroImage28, 797–814.
Okazaki, K., 2010. Developmental perspectives on neurocranial proportions in Japan.HOMO — Journal of Comparative Human Biology 61, 314–336.
Onton, J., Westerfield, M., Townsend, J., Makeig, S., 2006. Imaging human EEG dynamicsusing independent component analysis. Neuroscience and Biobehavioral Reviews30, 808–822.
Pascual-Marqui, R.D., 2002. Standardized low-resolution brain electromagnetic tomography(sLORETA): technical details. Methods and Findings in Experimental and Clinical Phar-macology 24 (Suppl. D), 5–12.
Peterson, K.S., Hansen, L.K., Kolenda, T., Rostrup, E., Strother, S.C., 2000. On the inde-pendent components of functional neuroimages. In: Pajunen, P., Karhunen, J.(Eds.), Proceedings ICA2000, Helsinki. Otamedia, Espoo, Finland.
Raichle, M.E., Snyder, A.Z., 2007. A default mode of brain function: a brief history of anevolving idea. NeuroImage 37, 1083–1090.
Raichle, M.E., MacLeod, A.M., Snyder, A.Z., Powers, W.J., Gusnard, D.A., Shulman, G.L.,2001. A default mode of brain function. Proceedings of the National Academy ofSciences of the United States of America 98, 676–682.
UNC
Please cite this article as: Knyazev, G.G., et al., EEG correlates of spontanJournal of Psychophysiology (2012), http://dx.doi.org/10.1016/j.ijpsycho
ED P
RO
OF
Sadaghiani, S., Scheeringa, R., Lehongre, K., Morillon, B., Giraud, A.L., Kleinschmidt, A.,2010. Intrinsic connectivity networks, alpha oscillations, and tonic alertness: a si-multaneous electroencephalography/functional magnetic resonance imagingstudy. Journal of Neuroscience 30, 10243–10250.
Scheeringa, R., Bastiaansen, M.C.M., Petersson, K.M., Oostenveld, R., Norris, D.G.,Hagoort, P., 2008. Frontal theta EEG activity correlates negatively with the defaultmode network in resting state. International Journal of Psychophysiology 67,242–251.
Schmithorst, V.J., Holland, S.K., 2004. Comparison of three methods for generatinggroup statistical inferences from independent component analysis of functionalmagnetic resonance imaging data. Journal of Magnetic Resonance Imaging 19,365–368.
Schmitz, T.W., Kawahara-Baccus, T.N., Johnson, S.C., 2004. Metacognitive evaluation,self-relevance, and the right prefrontal cortex. NeuroImage 22, 941–947.
Schooler, J.W., Reichle, E.D., Halpern, D.V., 2005. Zoning-out during reading: evidencefor dissociations between experience and meta-consciousness. In: Levin, D.T.(Ed.), Thinking and Seeing: Visual Metacognition in Adults and Children. MITPress, Cambridge, MA, pp. 204–226.
Seger, C.A., Stone, M., Keenan, J.P., 2004. Cortical activations during judgments aboutthe self and an other person. Neuropsychologia 42, 1168–1177.
Smallwood, J., Schooler, J.W., 2006. The restless mind. Psychological Bulletin 132,946–958.
Smallwood, J., O'Connor, R.C., Sudberry, M.V., Ballantyre, C., 2004. The consequences ofencoding information on the maintenance of internally generated images andthoughts: the role of meaning complexes. Consciousness and Cognition 4, 789–820.
Sparks, C.S., Jantz, R.L., 2002. A reassessment of human cranial plasticity: Boas revisited.Proceedings of the National Academy of Sciences of the United States of America99, 14636–14639.
Suh, M., Diener, E., Oishi, S., Triandis, H.C., 1998. The shifting basis of life satisfaction judg-ments across cultures: emotions versus norms. Journal of Personality and Social Psy-chology 74, 482–493.
Talairach, J., Tournoux, P., 1988. Co-planar Stereotaxic Atlas of the Human Brain.Thieme, New York.
Travis, F., Haaga, D.A.F., Hagelin, J., Tanner, M., Arenander, A., Nidich, S., Gaylord-King, C.,Grosswald, S., Rainforth, M., Schneider, R.H., 2010. A self-referential default brainstate: patterns of coherence, power, and eLORETA sources during eyes-closed restand Transcendental Meditation practice. Cognitive Processing 11, 21–30.
Tschepourkowsky, E., 1923. Biometrical studies on the anthropology of Russia.Biometrika 15, 254–270.
Wacker, J., Chavanon, M.L., Stemmler, G., 2006. Investigating the dopaminergic basis ofextraversion in humans: a multilevel approach. Journal of Personality and SocialPsychology 91, 171–187.
Wacker, J., Chavanon, M.L., Stemmler, G., 2010. Resting EEG signatures of agentic extra-version: new results and meta-analytic integration. Journal of Research in Person-ality 44, 167–179.
Whitaker, E.D., 2009. Troubling Typologies: Reflections on Race, Culture, and HumanVariation, MediAzioni 6. http://mediazioni.sitlec.unibo.it, ISSN 1974‐4382.
Wicker, B., Ruby, P., Royet, J.P., Fonlupt, P., 2003. A relation between rest and the self inthe brain? Brain Research Reviews 43, 224–230.
Wu, L., Eichele, T., Calhoun, V.D., 2010. Reactivity of hemodynamic responses and functionalconnectivity to different sates of alpha synchrony: a concurrent EEG–fMRI study.NeuroImage 52, 1252–1260.
Zhu, Y., Han, S., 2008. Cultural differences in the self: from philosophy to psychologyand neuroscience. Social and Personality Psychology Compass 2, 1799–1811.
Zhu, Y., Zhang, L., Fan, J., Han, S., 2007. Neural basis of cultural influence on self-representation. NeuroImage 34, 1310–1316.
Zysset, S., Huber, O., Ferstl, E., von Cramon, D.Y., 2002. The anterior frontomedian cortexand evaluative judgment: an fMRI study. NeuroImage 15, 983–991.
eous self-referential thoughts: A cross-cultural study, International.2012.09.002