education of nepal facts and figures, 2015
TRANSCRIPT

1

2
COUNTRY CONTEXT
1. GENERAL BACKGROUNDArea 147,181 Sq Km.Latitude 26o 22' N to 30o 27' NLongitude 80o04' E to 88o 12' E
2. POPULATION
Description Total Female Male2068 2058 2068 2058 2068 2058
Total 26494504 18491097 13645463 9270123 12849041 9220974In % 100 100 51.5 50.1 48.5 40.9
Deve
lopm
entR
egio
ns Eastern 26494504 4446749 13645463 2228589 12849041 2218160Central 5811555 6183955 3021072 3147894 2790483 3036061Western 9656985 3770678 4815361 1821499 4841624 1949179Mid-Western 4729133 241414 2522802 1200192 2206331 1210122Far-Western 3744314 1679301 1951598 822700 1792716 856601
Central Bureau of Statistics, Population Census 2001 & 2011.
3. SOCIAL GROUPSCaste/ Ethnics 125Language 123Religion 10
Central Bureau of Statistics, Population Census 2011.
4. GENERAL SOCIAL SCENARIOCrude Birth Rate 21.8 per 1000 population **Crude Death Rate 7.3 per 1000 Population**Total Fertility Rate 2.5 In person**Infant Mortality Rate 40.5 per 1000 live birth**Life Expectancy at Birth 66.6** yearsHuman Development Index 0.541*** ValuePopulation below poverty line 23.8*Gini Index of Income Inequality 0.328*Real GDP at Basic Prices (Constant) (2014/15P*) 690349 in Million Rs.Per capita Income (2013/14P) 717 In US $
*Economic Survey 2014/15, Ministry of Finance**Population census 2011, CBS***Human Development Report 2014, UNDP P = Preliminary, P* = Preliminary after earthquakeSource: Central Bureau of Statistics, 2015

3
OVERALL EDUCATION STATUS OF NEPAL
1. LITERACY RATE WITH EDUCATION ATTAINMENTDescription Total Female Male
Total Literates of 5+ Yrs 65.94 57.4 75.1
Educ
atio
nal A
ttain
men
t of
5+ Yrs Primary (1-5) 39.04 40.23 38.06
Lower Secondary (6-8) 20.29 20.61 20.03Secondary (9-10) 11.54 11.28 11.75SLC or Equivalent 10.16 9.69 10.55Intermediate or Equivalent 6.44 5.94 6.85Graduate or Equivalent 2.84 2.08 3.47Post Graduate or Equivalent 0.98 0.55 1.35Non-formal Literate 4.15 4.95 3.49
Central Bureau of Statistics, Population Census 2011
2. LITERACY RATE WITH AGE GROUPAge group Total Female MaleCensus Year 2068 2058 2068 2058 2068 20585+ yrs 65.94 53.74* 57.39 42.49* 75.14 65.08*15+ yrs 59.57 48.19 48.78 34.57 71.66 62.2115-24 yrs 84.72 70.04 80.16 60.13 89.85 80.61
Population Census 2001, 2011, and * for 6 years and above
3. LITERACY PROGRAM STATUS
Dev.Reg.
Illiterate Population Surveyed in 2067
Literacy Class Participants
FY 2069/70 (2013) FY 2070/071 (2014) FY 2071/072 (2015)Total Female Male T F M T F M T F M
Total 5173979 34353361738643 914141 727451 186690 1344866 1072351 272515 1409745 1086972 322773East 1130277 760868 369409 204626 160411 44215 230788 184116 46672 346243 273369 72874Cent 1876555 1184534 692021 221311 173679 47632 452214 346578 105636 691256 515181 176075West 834152 582569 251583 185343 152223 33120 218614 175113 43501 174171 138053 36118MW 758191 500982 257209 167654 124436 43218 257844 208634 49210 105823 80233 25590FW 574804 406383 168421 135207 116702 18505 185406 157910 27496 92252 80136 12116
Non-formal Education Center, 2015Note: East= Eastern, Cent=Central, West=Western, MW=Mid Western, FW=Far Western
4. INSTITUTIONSTypes Total Community Private ConstituentECD/PPCs 35121* 30034 5087Schools (G1-12) 34806* 29133 5673Higher Secondary Schools 3596* 2650 946Universities 9** 9Campuses 1369** 432 839 98Medical Institutions (Deemed Universities) 4 4 -
*Flash I 2014/15 (2071), DoE**University Grants Commission, 2015

4
5. ENROLMENTEducational Level Total Female MaleECD/PPC 1014339 488628 525711School Level (G1-12) 7488248 3822580 3719813University (all campuses + medical institutions) 458621 214598 244023Non Formal Literates in FY 2071/72 BS 1409745 1091445 318300
6. TEACHERInstitution Total Female MaleSchools( G1-12) 295951 1003583 1923368Universities (Constituent only) 9896
7. EDUCATION BUDGET Fiscal Year Budget Source % 2066/67 2067/68 2068/69 2069/70 2070/71 2071/72 2072/73
Govt Share in National Budget 69 77 76 78 77.84 80.11 74.87Foreign Share in National Budget 31 23 24 22 22.16 19.89 25.13Education Budget 16 17 17 16 15.65 13.92 12.04
Ministry of Finance, Red Books
SCHOOL EDUCATION1. SCHOOL a. Level-wise Total Schools by Development RegionsDev Reg
ECD/ PPC
Total P LS S HS Basic Secondary G1-12 G1-5 G 6-8 G 9-10 G11-12 G1-8 G9-12
Total 35121 34806 34335 14952 8825 3596 34506 9120East 8095 7547 7468 3121 1708 727 7493 1762Cent 10072 10149 9944 4732 3122 1232 9973 3294West 7381 7656 7563 3202 2012 845 7611 2057MW 5408 5451 5392 2129 1062 403 5440 1072FW 4165 4003 3968 1768 921 389 3989 935
Department of Education, Flash I, 2014/15Note: P=Primary Level, LS=Lower Secondary Level, S=Secondary Level, HS=Higher Secondary Level, G=Grade,
b. Level-wise Community Schools by Development RegionsDev Reg
ECD/ PPC
Total P LS S HS Basic SecondaryG1-12 G1-5 G 6-8 G 9-10 G11-12 G1-8 G9-12
Total 30034 29133 28980 11106 6011 2650 29131 6011East 7150 6425 6405 2433 1260 559 6425 1260Cent 8173 7799 7780 2994 1713 767 7798 1713West 6009 6412 6366 2292 1370 645 6412 1370MW 4973 4954 4905 1851 880 345 4953 880FW 3729 3543 3524 1536 788 334 3543 788
Department of Education, Flash I, 2014/15

5
c. Level-wise Institutional Schools by Development Regions
Dev Reg ECD/ PPC
Total P LS S HS Basic Secondary
G1-12 G1-5 G 6-8 G 9-10 G11-12 G1-8 G9-12
Total 5087 5673 5355 3846 2814 946 5375 3109
East 945 1122 1063 688 448 168 1068 502Cent 1899 2350 3264 1738 1409 465 2175 1581West 1372 1244 1197 910 642 200 1199 687MW 435 497 487 278 182 58 487 192FW 436 460 444 232 133 55 446 147
Department of Education, Flash I, 2014/15
d. Level wise Religious SchoolsMadarsa
Dev RegTotal P LS S HS Basic SecondaryG1-12 G1-5 G 6-8 G 9-10 G11-12 G1-8 G9-12
Total 745 718 14 9 4 732 13East 223 212 7 4 0 219 4Cent 186 185 0 1 0 185 1West 219 208 4 3 4 212 7MW 112 108 3 1 0 111 1FW 5 5 0 0 0 5 0
Gumba
Dev RegTotal P LS S HS Basic SecondaryG1-12 G1-5 G 6-8 G 9-10 G11-12 G1-8 G9-12
Total 78 71 6 1 0 77 1East 32 31 1 0 0 32 0Cent 31 29 2 0 0 31 0West 13 10 2 1 0 12 1MW 0 0 0 0 0 0 0FW 2 2 1 0 0 2 0
Aashram
Dev Reg Total P LS S HS Basic SecondaryG1-12 G1-5 G 6-8 G 9-10 G11-12 G1-8 G9-12
Total 72 56 9 5 2 65 7East 28 22 4 2 0 26 2Cent 33 31 2 0 0 33 0West 10 2 3 3 2 5 5MW 1 1 0 0 0 1 0 FW 0 0 0 0 0 0 0
Department of Education, Flash I, 2014/15
6
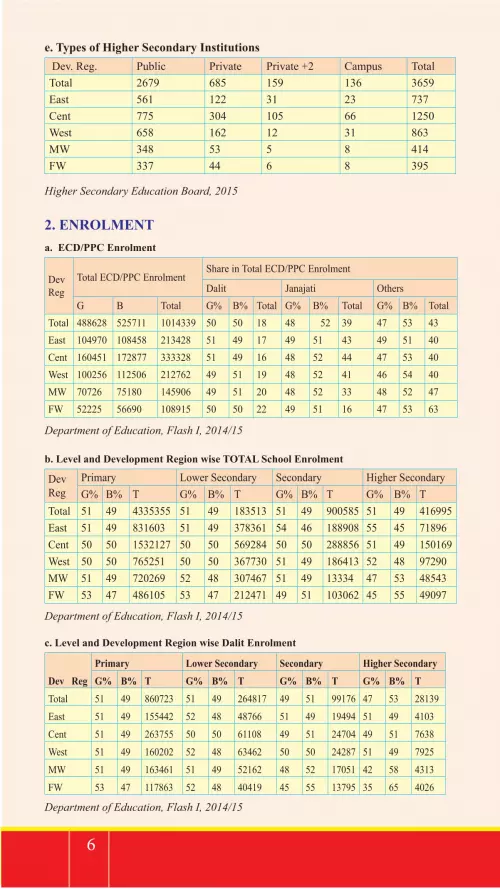
e. Types of Higher Secondary Institutions Dev. Reg. Public Private Private +2 Campus TotalTotal 2679 685 159 136 3659East 561 122 31 23 737Cent 775 304 105 66 1250West 658 162 12 31 863MW 348 53 5 8 414FW 337 44 6 8 395
Higher Secondary Education Board, 2015
2. ENROLMENTa. ECD/PPC Enrolment
Dev Reg
Total ECD/PPC EnrolmentShare in Total ECD/PPC Enrolment
Dalit Janajati OthersG B Total G% B% Total G% B% Total G% B% Total
Total 488628 525711 1014339 50 50 18 48 52 39 47 53 43East 104970 108458 213428 51 49 17 49 51 43 49 51 40Cent 160451 172877 333328 51 49 16 48 52 44 47 53 40West 100256 112506 212762 49 51 19 48 52 41 46 54 40MW 70726 75180 145906 49 51 20 48 52 33 48 52 47FW 52225 56690 108915 50 50 22 49 51 16 47 53 63
Department of Education, Flash I, 2014/15
b. Level and Development Region wise TOTAL School Enrolment
Dev Reg
Primary Lower Secondary Secondary Higher SecondaryG% B% T G% B% T G% B% T G% B% T
Total 51 49 4335355 51 49 183513 51 49 900585 51 49 416995East 51 49 831603 51 49 378361 54 46 188908 55 45 71896Cent 50 50 1532127 50 50 569284 50 50 288856 51 49 150169West 50 50 765251 50 50 367730 51 49 186413 52 48 97290MW 51 49 720269 52 48 307467 51 49 13334 47 53 48543FW 53 47 486105 53 47 212471 49 51 103062 45 55 49097
Department of Education, Flash I, 2014/15
c. Level and Development Region wise Dalit Enrolment
Dev Reg
Primary Lower Secondary Secondary Higher Secondary
G% B% T G% B% T G% B% T G% B% T
Total 51 49 860723 51 49 264817 49 51 99176 47 53 28139
East 51 49 155442 52 48 48766 51 49 19494 51 49 4103
Cent 51 49 263755 50 50 61108 49 51 24704 49 51 7638
West 51 49 160202 52 48 63462 50 50 24287 51 49 7925
MW 51 49 163461 51 49 52162 48 52 17051 42 58 4313
FW 53 47 117863 52 48 40419 45 55 13795 35 65 4026
Department of Education, Flash I, 2014/15

7
d. Level and Development Region wise Janajati
Dev RegPrimary Lower Secondary Secondary Higher SecondaryG% B% T G% B% T G% B% T G% B% T
Total 51 49 1467906 52 48 706673 53 47 347782 53 47 124231East 51 49 343880 53 47 178860 56 44 91099 56 44 30502Cent 50 50 559102 51 49 240245 52 48 122192 52 48 44316West 50 50 305095 52 48 155602 51 49 76025 52 48 32017MW 50 50 188949 53 47 9121 54 46 38656 50 50 10270FW 54 46 70880 56 44 40754 55 45 19147 50 50 7192
Department of Education, Flash I, 2014/15
e. Level and Development Region wise Disadvantaged Janajati
Dev RegPrimary Lower Secondary SecondaryG% B% T G% B% T G% B% T
Total 51 49 96333 53 47 31627 51 49 15409East 53 47 33133 54 46 13083 52 48 6340Cent 51 49 55178 52 48 16027 51 49 7968West 51 49 6584 53 47 1953 51 49 841MW 50 50 498 49 51 135 44 56 43FW 53 47 775 59 41 176 47 53 70
Department of Education, Flash I, 2014/15
f. Level and Development Regionwise Community School Enrolment
Dev Reg
Primary Lower Secondary Secondary Higher SecondaryG% B% T G% B% T G% B% T G% B% T
Total 52 48 3665659 52 48 1544239 53 47 728456 53 47 286559East 52 48 729716 51 49 342113 55 45 162801 56 44 54980Cent 51 49 1261216 51 49 426756 51 49 205326 55 45 89822West 52 48 574126 52 48 287886 53 47 144656 56 44 69371MW 52 48 648613 52 48 285418 52 48 121664 47 53 43329FW 54 46 451988 54 56 202066 51 49 94009 49 51 39057
Department of Education, Flash I, 2014/15
g. Level and Development Region wise Institutional School Enrolment
Dev Reg
Primary Lower Secondary Secondary Higher SecondaryG% B% T G% B% T G% B% T G% B% T
Total 43 57 669696 43 57 291074 44 56 172129 44 56 120436East 44 56 101887 44 56 36248 45 55 26107 50 50 16916Cent 46 54 270911 45 55 142528 46 54 83530 45 55 60347West 42 58 191125 42 58 79844 42 58 41757 44 56 120436MW 41 59 71656 42 58 22049 43 57 11682 44 56 5114FW 34 66 34117 32 68 10405 34 66 9053 34 66 10040
Department of Education, Flash I, 2014/15

8
h. Students with Different Disabilities by Level and Region
Dev Reg
Primary Lower Secondary Secondary Higher SecondaryG% B% T G% B% T G% B% T G% B% T
Total 48 52 47882 49 51 16465 48 52 6937 50 50 2285East 45 55 7367 49 51 2794 51 49 1150 48 52 340Cent 48 52 11461 48 52 3797 47 53 1706 49 51 446West 45 55 7597 49 51 3132 51 49 1382 48 52 526MW 49 51 8679 50 50 2553 47 53 980 55 45 390FW 49 51 12730 48 52 4246 46 54 1580 49 51 539
Department of Education, Flash I, 2014/15
NOTEDisadvantaged group: Bankaria, Baramu, Bote, Chepang, Danuwar, Dhanuk, Hayu, Jhagad, Kisan, Kusunda, Lepcha, Majhi, Meche, Mushibadiya, Raji, Raute, Satar, Singsa, Siyar, Surel ,Thami, Thunam.Disabilities: Here different disabilities cover physical (affecting mobility), intellectually impaired, hearing impaired, visually impaired, low vision, hearing and visually impaired, vocal and speech related disabilities.
3. TEACHERa. Level and Development Regionwise Total Teacher
Dev. Reg.
Total Primary LS Secondary HS
F% M% T F% M% T F% M% T F% M% T F% M% T
Total 35 65 295951 42 58 185562 28 72 52349 17 83 38861 16 84 19179
East 32 68 58853 40 60 38407 21 79 10387 12 88 7099 16 84 2960
Cent 40 60 96939 46 54 55965 39 61 18471 25 75 15538 18 82 6965
West 35 65 74466 45 55 46899 26 74 12465 13 87 9708 10 90 5394
MW 30 70 35891 36 64 24577 18 82 5914 13 87 3657 22 78 1743
FW 26 74 29802 32 68 19714 13 87 5112 10 90 2859 19 81 2117
Department of Education, Flash I, 2014/15
b. Total Teacher in Community Schools
Dev. Reg.
Total Primary LS Secondary HSF% M% T F% M% T F% M% T F% M% T F% M% T
Total 22 78 214370 38 62 139922 21 79 36771 14 86 24125 16 84 15120East 21 79 46294 38 62 30077 19 81 8288 12 88 5214 16 84 2715Cent 26 74 60472 39 61 38320 27 73 10022 20 80 7239 17 83 4891West 22 78 50769 43 57 32303 23 77 8464 12 88 6018 11 89 3984MW 21 79 30635 34 66 21010 16 84 5136 11 89 2956 23 77 1533FW 18 82 26200 31 69 16640 13 87 4862 9 91 2701 20 80 1997
Department of Education, Flash I, 2014/15
c. Total Teacher in Institutional Schools
Dev. Reg.
Total Primary LS Secondary HSF% M% T F% M% T F% M% T F% M% T F% M% T
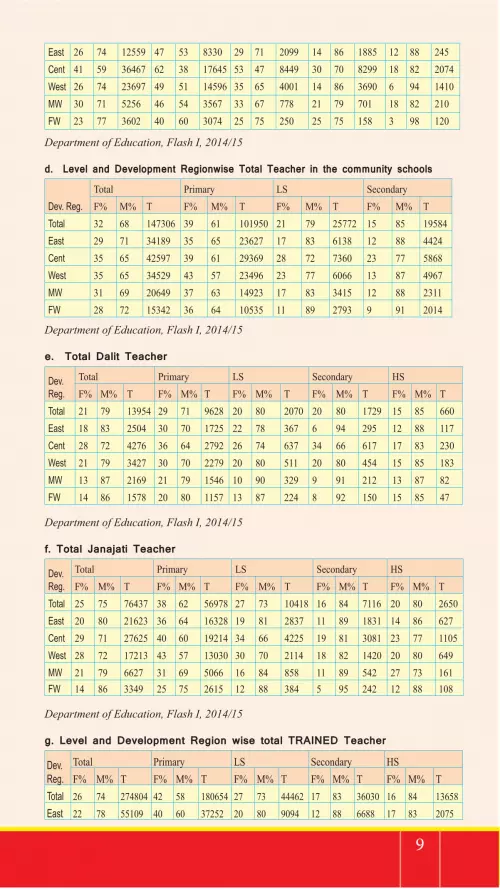
Total 33 67 81581 53 47 47762 44 56 15577 23 77 14733 13 87 4059
9
East 26 74 12559 47 53 8330 29 71 2099 14 86 1885 12 88 245Cent 41 59 36467 62 38 17645 53 47 8449 30 70 8299 18 82 2074West 26 74 23697 49 51 14596 35 65 4001 14 86 3690 6 94 1410MW 30 71 5256 46 54 3567 33 67 778 21 79 701 18 82 210FW 23 77 3602 40 60 3074 25 75 250 25 75 158 3 98 120
Department of Education, Flash I, 2014/15 d. Level and Development Regionwise Total Teacher in the community schools
Dev. Reg. Total Primary LS SecondaryF% M% T F% M% T F% M% T F% M% T
Total 32 68 147306 39 61 101950 21 79 25772 15 85 19584East 29 71 34189 35 65 23627 17 83 6138 12 88 4424Cent 35 65 42597 39 61 29369 28 72 7360 23 77 5868West 35 65 34529 43 57 23496 23 77 6066 13 87 4967MW 31 69 20649 37 63 14923 17 83 3415 12 88 2311FW 28 72 15342 36 64 10535 11 89 2793 9 91 2014
Department of Education, Flash I, 2014/15 e. Total Dalit Teacher
Dev. Reg.
Total Primary LS Secondary HSF% M% T F% M% T F% M% T F% M% T F% M% T
Total 21 79 13954 29 71 9628 20 80 2070 20 80 1729 15 85 660East 18 83 2504 30 70 1725 22 78 367 6 94 295 12 88 117Cent 28 72 4276 36 64 2792 26 74 637 34 66 617 17 83 230West 21 79 3427 30 70 2279 20 80 511 20 80 454 15 85 183MW 13 87 2169 21 79 1546 10 90 329 9 91 212 13 87 82FW 14 86 1578 20 80 1157 13 87 224 8 92 150 15 85 47
Department of Education, Flash I, 2014/15
f. Total Janajati Teacher
Dev. Reg.
Total Primary LS Secondary HSF% M% T F% M% T F% M% T F% M% T F% M% T
Total 25 75 76437 38 62 56978 27 73 10418 16 84 7116 20 80 2650East 20 80 21623 36 64 16328 19 81 2837 11 89 1831 14 86 627Cent 29 71 27625 40 60 19214 34 66 4225 19 81 3081 23 77 1105West 28 72 17213 43 57 13030 30 70 2114 18 82 1420 20 80 649MW 21 79 6627 31 69 5066 16 84 858 11 89 542 27 73 161FW 14 86 3349 25 75 2615 12 88 384 5 95 242 12 88 108
Department of Education, Flash I, 2014/15
g. Level and Development Region wise total TRAINED Teacher
Dev. Reg.
Total Primary LS Secondary HSF% M% T F% M% T F% M% T F% M% T F% M% T
Total 26 74 274804 42 58 180654 27 73 44462 17 83 36030 16 84 13658East 22 78 55109 40 60 37252 20 80 9094 12 88 6688 17 83 2075

10
Cent 32 68 88610 46 54 54050 38 62 15415 25 75 14154 17 83 4991West 24 76 69365 45 55 46065 26 74 10389 13 87 9018 11 89 3893MW 22 78 33690 35 65 23936 18 82 5085 13 87 3449 23 77 1220FW 18 82 28030 32 68 19351 13 87 4479 10 90 2721 18 82 1479
Department of Education, Flash I, 2014/15
h. FULL TRAINED Teacher in Community SchoolsDev. Reg.
Total Primary LS Secondary HSF% M% T F% M% T F% M% T F% M% T F% M% T
Total 22 78 193376 38 62 134828 21 79 30817 14 86 22615 14 86 16626East 20 80 43991 38 62 28607 19 81 7031 12 88 4896 12 88 3457Cent 27 73 56422 40 60 36286 27 73 8377 20 80 6768 19 81 4991West 23 77 39543 43 57 22603 23 77 7029 12 88 5687 12 88 4224MW 19 81 28898 34 66 20110 16 84 4208 12 88 2715 12 88 1865FW 16 84 24522 31 69 16251 13 87 4095 9 91 2442 9 91 1734
Department of Education, Flash I, 2014/15
i. FULL TRAINED Teacher in Institutional Schools
Dev. Reg.
Total Primary LS Secondary HSF% M% T F% M% T F% M% T F% M% T F% M% T
Total 36 64 75129 53 47 43366 44 56 11640 23 77 11987 22 78 8667East 26 74 11693 47 53 7513 30 70 1557 14 86 1492 12 88 1131Cent 43 57 33776 62 38 15823 53 47 6330 30 70 6842 28 72 4781West 28 72 21960 49 51 13765 36 64 2947 14 86 3004 14 86 2244MW 30 70 4621 46 54 3094 35 65 618 18 82 539 22 78 370FW 29 72 3079 40 60 2672 24 76 187 25 75 111 25 75 109
Department of Education, Flash I, 2014/15
4. SCHOOL LEVEL INDICATORSa. Gross Enrolment Rate (GER)
Dev. Reg.ECD/PPC Primary LS Secondary HS
G B T G B T G B T G B T G B TTotal 77.3 78.1 77.7 140.3 128.9 134.4 92.0 87.4 89.7 70.1 70.2 70.1 33.2 32.6 32.9East 80.6 81.3 80.9 128.8 117.5 123.0 89.4 84.9 87.2 72.4 64.8 68.7 28.7 24.5 26.6Cent 73.3 74.6 73.9 139.4 128.2 133.6 79.5 78.6 79.0 64.1 66.7 65.4 34.6 31.4 32.9West 85.7 87.8 86.8 142.1 135.1 138.5 98.3 94.9 96.6 76.3 77.9 77.1 41.6 39.7 40.7MW 72.9 73.3 73.1 150.1 140.3 145.1 108.6 100.1 104.3 70.9 70.8 70.8 25.2 30.6 27.8FW 77.9 76.1 77.0 148.8 127.0 137.6 105.5 91.3 98.3 72.6 78.5 75.4 33.5 43.8 38.4
Department of Education, Flash I, 2014/15
b. Net Enrolment Rate (NER)
Dev. Reg.Primary LS Secondary HS
G B T G B T G B T G B T
Total 95.7 96.6 96.2 75.5 73.8 74.6 55.9 56.3 56.1 13.3 12.9 13.1
East 95.9 96.4 96.2 76.2 74.2 75.2 59.1 56.5 57.8 14.7 12.2 13.5
Cent 95.8 96.9 96.4 66.3 66.2 66.2 52.5 52.9 52.7 12.4 10.7 11.5
11
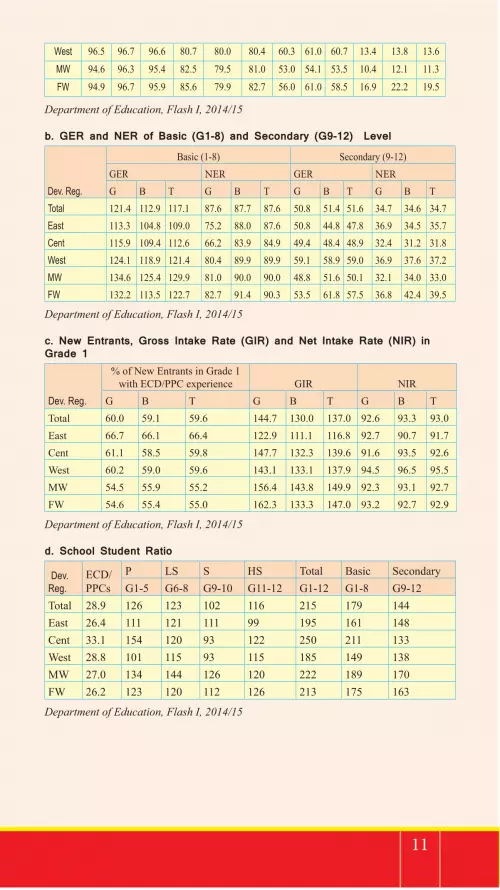
West 96.5 96.7 96.6 80.7 80.0 80.4 60.3 61.0 60.7 13.4 13.8 13.6
MW 94.6 96.3 95.4 82.5 79.5 81.0 53.0 54.1 53.5 10.4 12.1 11.3
FW 94.9 96.7 95.9 85.6 79.9 82.7 56.0 61.0 58.5 16.9 22.2 19.5
Department of Education, Flash I, 2014/15
b. GER and NER of Basic (G1-8) and Secondary (G9-12) Level
Dev. Reg.
Basic (1-8) Secondary (9-12)GER NER GER NERG B T G B T G B T G B T
Total 121.4 112.9 117.1 87.6 87.7 87.6 50.8 51.4 51.6 34.7 34.6 34.7East 113.3 104.8 109.0 75.2 88.0 87.6 50.8 44.8 47.8 36.9 34.5 35.7Cent 115.9 109.4 112.6 66.2 83.9 84.9 49.4 48.4 48.9 32.4 31.2 31.8West 124.1 118.9 121.4 80.4 89.9 89.9 59.1 58.9 59.0 36.9 37.6 37.2MW 134.6 125.4 129.9 81.0 90.0 90.0 48.8 51.6 50.1 32.1 34.0 33.0FW 132.2 113.5 122.7 82.7 91.4 90.3 53.5 61.8 57.5 36.8 42.4 39.5
Department of Education, Flash I, 2014/15
c. New Entrants, Gross Intake Rate (GIR) and Net Intake Rate (NIR) in Grade 1
Dev. Reg.
% of New Entrants in Grade 1 with ECD/PPC experience GIR NIR
G B T G B T G B TTotal 60.0 59.1 59.6 144.7 130.0 137.0 92.6 93.3 93.0East 66.7 66.1 66.4 122.9 111.1 116.8 92.7 90.7 91.7Cent 61.1 58.5 59.8 147.7 132.3 139.6 91.6 93.5 92.6West 60.2 59.0 59.6 143.1 133.1 137.9 94.5 96.5 95.5MW 54.5 55.9 55.2 156.4 143.8 149.9 92.3 93.1 92.7FW 54.6 55.4 55.0 162.3 133.3 147.0 93.2 92.7 92.9
Department of Education, Flash I, 2014/15
d. School Student Ratio
Dev. Reg.
ECD/ PPCs
P LS S HS Total Basic SecondaryG1-5 G6-8 G9-10 G11-12 G1-12 G1-8 G9-12
Total 28.9 126 123 102 116 215 179 144East 26.4 111 121 111 99 195 161 148Cent 33.1 154 120 93 122 250 211 133West 28.8 101 115 93 115 185 149 138MW 27.0 134 144 126 120 222 189 170FW 26.2 123 120 112 126 213 175 163
Department of Education, Flash I, 2014/15
12
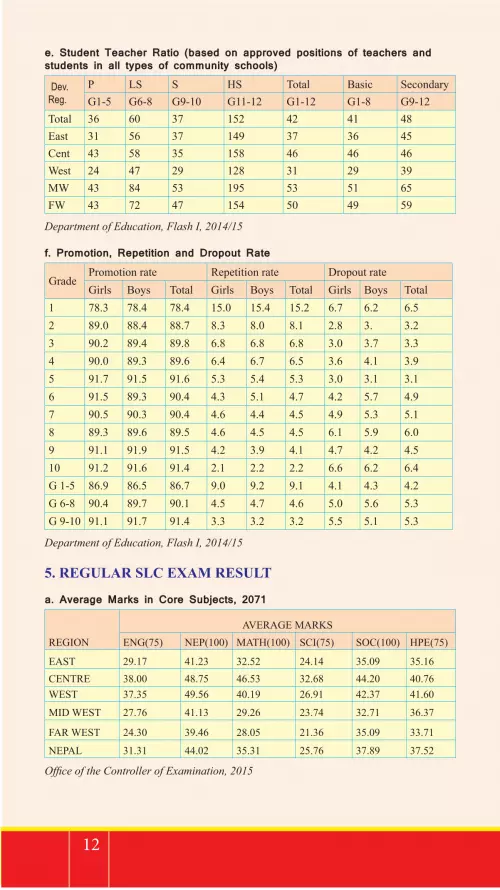
e. Student Teacher Ratio (based on approved positions of teachers and students in all types of community schools)
Dev. Reg.
P LS S HS Total Basic SecondaryG1-5 G6-8 G9-10 G11-12 G1-12 G1-8 G9-12
Total 36 60 37 152 42 41 48East 31 56 37 149 37 36 45Cent 43 58 35 158 46 46 46West 24 47 29 128 31 29 39MW 43 84 53 195 53 51 65FW 43 72 47 154 50 49 59
Department of Education, Flash I, 2014/15
f. Promotion, Repetition and Dropout Rate
GradePromotion rate Repetition rate Dropout rateGirls Boys Total Girls Boys Total Girls Boys Total
1 78.3 78.4 78.4 15.0 15.4 15.2 6.7 6.2 6.52 89.0 88.4 88.7 8.3 8.0 8.1 2.8 3. 3.23 90.2 89.4 89.8 6.8 6.8 6.8 3.0 3.7 3.34 90.0 89.3 89.6 6.4 6.7 6.5 3.6 4.1 3.95 91.7 91.5 91.6 5.3 5.4 5.3 3.0 3.1 3.16 91.5 89.3 90.4 4.3 5.1 4.7 4.2 5.7 4.97 90.5 90.3 90.4 4.6 4.4 4.5 4.9 5.3 5.18 89.3 89.6 89.5 4.6 4.5 4.5 6.1 5.9 6.09 91.1 91.9 91.5 4.2 3.9 4.1 4.7 4.2 4.510 91.2 91.6 91.4 2.1 2.2 2.2 6.6 6.2 6.4G 1-5 86.9 86.5 86.7 9.0 9.2 9.1 4.1 4.3 4.2G 6-8 90.4 89.7 90.1 4.5 4.7 4.6 5.0 5.6 5.3G 9-10 91.1 91.7 91.4 3.3 3.2 3.2 5.5 5.1 5.3
Department of Education, Flash I, 2014/15
5. REGULAR SLC EXAM RESULT
a. Average Marks in Core Subjects, 2071
REGIONAVERAGE MARKS
ENG(75) NEP(100) MATH(100) SCI(75) SOC(100) HPE(75)
EAST 29.17 41.23 32.52 24.14 35.09 35.16CENTRE 38.00 48.75 46.53 32.68 44.20 40.76WEST 37.35 49.56 40.19 26.91 42.37 41.60
MID WEST 27.76 41.13 29.26 23.74 32.71 36.37
FAR WEST 24.30 39.46 28.05 21.36 35.09 33.71
NEPAL 31.31 44.02 35.31 25.76 37.89 37.52
Office of the Controller of Examination, 2015

13
b. R
egion-wise
Total SL
C R
esult 20
71
DE
SC
EA
ST
CO
MM
UN
ITY
INST
ITU
TIO
NA
LA
LT/O
PEN
TOTA
L
BO
YG
IRL
TOTA
LB
OY
GIR
LTO
TAL
BO
YG
IRL
TOTA
LB
OY
GIR
LTO
TAL
APP
EAR
ED29
637
3614
265
779
1186
787
2920
596
481
563
1044
4198
545
434
8741
9PA
SSED
9183
7480
1666
310
606
7574
1818
010
887
195
1989
715
141
3503
8PA
SS %
30.9
820
.70
25.3
389
.37
86.7
788
.27
22.4
515
.45
18.6
847
.39
33.3
340
.08
DIS
TIN
CTI
ON
111
3814
912
4470
019
440
00
1355
738
2093
FIR
ST24
2515
1639
4171
7253
2812
500
95
1496
0668
4916
455
SEC
ON
D61
1754
7111
588
2168
1528
3696
9475
169
8379
7074
1545
3TH
IRD
530
455
985
2218
405
712
557
480
1037
WIT
HH
ELD
156
215
27
00
020
828
CA
NC
EL15
527
643
110
212
11
216
627
944
5EX
PELL
ED0
00
00
00
00
00
0
DE
SC
CE
NT
RA
L
CO
MM
UN
ITY
INST
ITU
TIO
NA
LA
LT/O
PEN
TOTA
L
BO
YG
IRL
TOTA
LB
OY
GIR
LTO
TAL
BO
YG
IRL
TOTA
LB
OY
GIR
LTO
TAL
APP
EAR
ED41
463
4516
886
631
2809
221
923
5001
518
1615
9634
1271
371
6868
714
0058
PASS
ED19
146
1653
235
678
2640
320
490
4689
351
239
690
846
061
3741
883
479
14
PASS
%46
.18
36.6
041
.18
93.9
993
.46
93.7
628
.19
24.8
126
.61
64.5
454
.48
59.6
0D
ISTI
NC
TIO
N53
231
584
775
6560
9513
660
12
380
9864
1214
510
FIR
ST70
7559
1612
991
1650
212
857
2935
913
148
179
2370
818
821
4252
9SE
CO
ND
1086
898
1220
680
2324
1524
3848
347
320
667
1353
911
656
2519
5TH
IRD
671
489
1160
1214
2633
2659
716
529
1245
WIT
HH
ELD
124
166
511
44
822
1335
CA
NC
EL13
821
51
61
12
1910
29EX
PELL
ED0
00
00
00
00
00
0
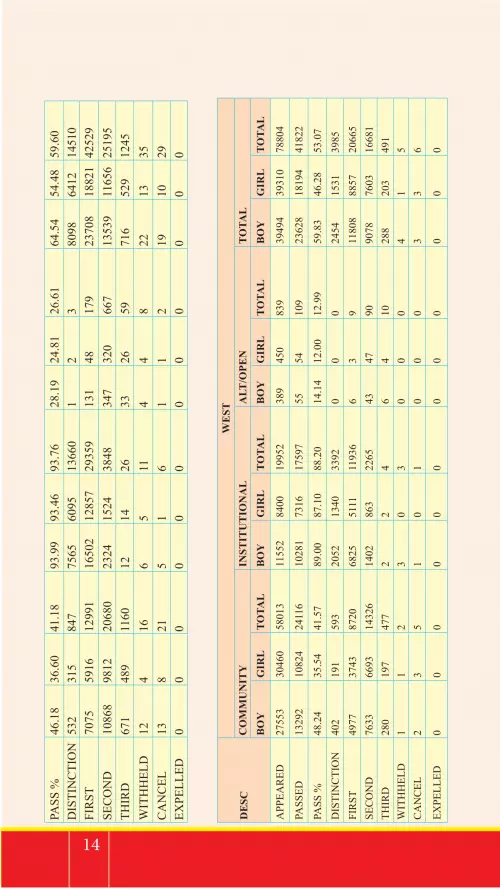
DE
SC
WE
STC
OM
MU
NIT
YIN
STIT
UT
ION
AL
ALT
/OPE
NTO
TAL
BO
YG
IRL
TOTA
LB
OY
GIR
LTO
TAL
BO
YG
IRL
TOTA
LB
OY
GIR
LTO
TAL
APP
EAR
ED27
553
3046
058
013
1155
284
0019
952
389
450
839
3949
439
310
7880
4
PASS
ED13
292
1082
424
116
1028
173
1617
597
5554
109
2362
818
194
4182
2
PASS
%48
.24
35.5
441
.57
89.0
087
.10
88.2
014
.14
12.0
012
.99
59.8
346
.28
53.0
7
DIS
TIN
CTI
ON
402
191
593
2052
1340
3392
00
024
5415
3139
85FI
RST
4977
3743
8720
6825
5111
1193
66
39
1180
888
5720
665
SEC
ON
D76
3366
9314
326
1402
863
2265
4347
9090
7876
0316
681
THIR
D28
019
747
72
24
64
1028
820
349
1W
ITH
HEL
D1
12
30
30
00
41
5C
AN
CEL
23
51
01
00
03
36
EXPE
LLED
00
00
00
00
00
00

15
DE
SC
MID
WE
ST
CO
MM
UN
ITY
INST
ITU
TIO
NA
LA
LT/O
PEN
TOTA
L
BO
YG
IRL
TOTA
LB
OY
GIR
LTO
TAL
BO
YG
IRL
TOTA
LB
OY
GIR
LTO
TAL
APP
EAR
ED22
961
2539
548
356
4076
3073
7149
393
484
877
2743
028
952
5638
2PA
SSED
8155
5712
1386
735
3024
6159
9189
9118
011
774
8264
2003
8PA
SS %
35.5
222
.49
28.6
886
.60
80.0
883
.80
22.6
518
.80
20.5
242
.92
28.5
435
.54
DIS
TIN
CTI
ON
7318
9131
914
045
90
00
392
158
550
FIR
ST18
0084
526
4524
2817
0741
3513
821
4241
2560
6801
SEC
ON
D57
6444
3710
201
778
605
1383
6065
125
6602
5107
1170
9TH
IRD
518
412
930
59
1416
1834
539
439
978
WIT
HH
ELD
227
290
00
40
426
733
CA
NC
EL49
4291
10
18
311
5845
103
EXPE
LLED
00
00
00
00
00
00
DE
SC
FAR
WE
ST
CO
MM
UN
ITY
INST
ITU
TIO
NA
LA
LT/O
PEN
TOTA
L
BO
YG
IRL
TOTA
LB
OY
GIR
LTO
TAL
BO
YG
IRL
TOTA
LB
OY
GIR
LTO
TAL
APP
EAR
ED18
554
1879
637
350
3302
1943
5245
8910
119
021
945
2084
042
785
PASS
ED60
7135
0595
7625
4312
4937
929
1524
8623
4769
1339
2
16
PASS
%32
.72
18.6
525
.64
77.0
164
.28
72.3
010
.11
14.8
512
.63
39.2
922
.88
31.3
0
DIS
TIN
CTI
ON
378
4526
163
324
00
029
871
369
FIR
ST15
0254
620
4814
8771
922
061
01
2990
1265
4255
SEC
ON
D41
9126
5968
5077
745
612
335
1015
4973
3125
8098
THIR
D34
129
263
318
1129
35
836
230
867
0W
ITH
HEL
D11
314
22
40
00
135
18C
AN
CEL
1511
261
12
00
016
1228
EXPE
LLED
00
00
00
00
00
00
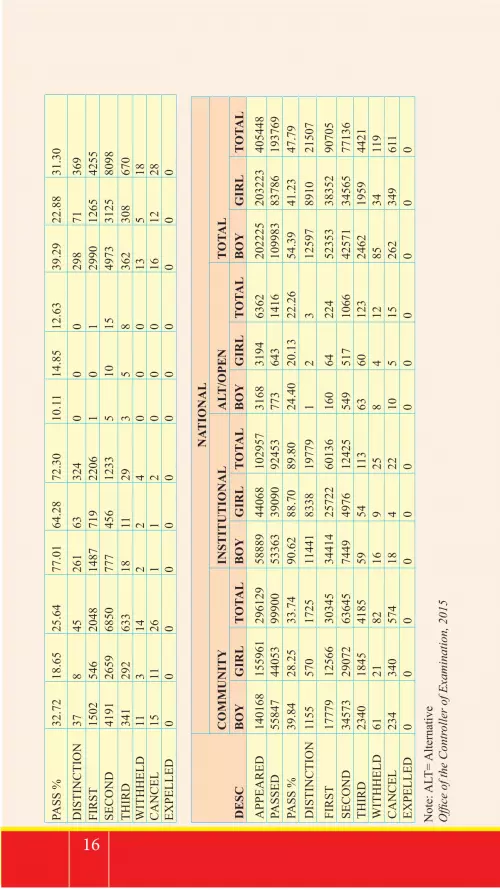
DE
SC
NAT
ION
AL
CO
MM
UN
ITY
INST
ITU
TIO
NA
LA
LT/O
PEN
TOTA
LB
OY
GIR
LTO
TAL
BO
YG
IRL
TOTA
LB
OY
GIR
LTO
TAL
BO
YG
IRL
TOTA
L
APP
EAR
ED14
0168
1559
6129
6129
5888
944
068
1029
5731
6831
9463
6220
2225
2032
2340
5448
PASS
ED55
847
4405
399
900
5336
339
090
9245
377
364
314
1610
9983
8378
619
3769
PASS
%39
.84
28.2
533
.74
90.6
288
.70
89.8
024
.40
20.1
322
.26
54.3
941
.23
47.7
9D
ISTI
NC
TIO
N11
5557
017
2511
441
8338
1977
91
23
1259
789
1021
507
FIR
ST17
779
1256
630
345
3441
425
722
6013
616
064
224
5235
338
352
9070
5SE
CO
ND
3457
329
072
6364
574
4949
7612
425
549
517
1066
4257
134
565
7713
6TH
IRD
2340
1845
4185
5954
113
6360
123
2462
1959
4421
WIT
HH
ELD
6121
8216
925
84
1285
3411
9C
AN
CEL
234
340
574
184
2210
515
262
349
611
EXPE
LLED
00
00
00
00
00
00
Not
e: A
LT=
Alte
rnat
ive
Offi
ce o
f the
Con
trolle
r of E
xam
inat
ion,
201
5

17
TEACHER MANAGEMENT
1. SELECTION OF PERMANENT TEACHERS IN 2071/72
Development Region Level TotalLower secondary Secondary
Total 1864 1385 3249Eastern 400 289 689Central 588 484 1072Western 514 342 856Mid-western 227 155 382Far-western 135 115 250
Teacher Service Commission, 2015[2072)
2. TEACHER PROMOTION (WORK PERFORMANCE AND INTERNAL COMPETITION) IN 2071/72
Devel-opment Region
LevelTotalPrimary Lower secondary Secondary
work perfor-mance
inter. comp.
work per-formance
inter. comp.
work perfor-mance
inter. comp.
work perfor-mance
inter. comp.
Total 692 225 205 78 227 74 1124 377
Eastern 203 66 43 17 55 18 301 101
Central 260 87 85 29 87 25 432 141
Western 115 38 37 16 48 15 200 69Mid-west-ern 71 17 30 10 25 10 126 37
Far-western 43 17 10 6 12 6 65 29
Teacher Service Commission, 2015 [2072)
3. TEACHER LICENSE RESULT IN 2071/72
Development Region
Level Total
Lower secondary Secondary
Appeared Passed Appeared Passed Appeared Passed
Total 180046 56584 55192 19776 235238 76360
Eastern 37366 10484 10343 4821 47709 15305
Central 51450 15594 21450 2443 72900 18037
Western 31720 12442 10358 5543 42078 17985
Mid-western 36526 10676 7482 4190 44008 14866Far-western 22984 7388 5559 2779 28544 10167
Teacher Service Commission, 2015 [2072)

18
NUMBER OF NO OBJECTION LETTER/CERTIFICATE ISSUED FOR ABROAD STUDY
S. No. CountryFY 2068/69 FY 2069/70 FY 2070/71 FY 2071/72Girls Total Girls Total Girls Total Girls Total
1 Japan 199 1310 803 4272 1917 7933 2723 92922 Australia 1398 3644 1770 4408 4142 11184 3473 85203 USA 296 849 281 809 485 1456 809 23634 India 220 812 251 1211 239 1003 338 10045 Malaysia 17 84 111 830 243 1190 230 9786 Bangladesh 77 307 123 377 146 473 273 8637 China 113 453 92 340 163 581 210 7198 Denmark 37 180 59 235 90 404 228 7359 Germany 41 275 51 412 57 366 62 38710 UK 233 577 276 627 163 438 140 303Others 286 1200 331 1699 538 2355 848 3599Total 3523 12025 5073 19477 9079 31224 9334 28763
Other Countries: Ireland, Armenia, Austria, Bahamas, Bahrain, Belarus, Belgium, Bosnia and Herzegovina, Bulgaria, Canada, Chile, Costarica, Cyprus, Czech Republic, Dubai, Egypt, Estonia, Fiji, Finland, France, Georgia, Greece, Guyana, Holland, Hong Kong, Hungary, Indonesia, Iran, Ireland, Israel, Italy, Jordan, Kenya, Korea, Kyrgyzstan, Latvia, Libya, Lithuania, Luxembourg, Macau, Malta, Mauritius, Mexico, Moldova, Netherland, New Zealand, Norway, Pakistan, Peru, Phillippines, Poland, Portugal, Qatar, Republic of Korea, Romania, Saint Lucia, Saudi Arabia, Scotland, Seychelles, Singapore, Slovakia, Slovenia, South Africa, South Korea, Spain, Sri Lanka, Sweden, Switzerland, Taiwan, Thailand, Turkey, UAE, Ukraine, Venezuela, Zambia. No Objection Certificate for Abroad Study Management Section/Ministry of
Education, 2015
19
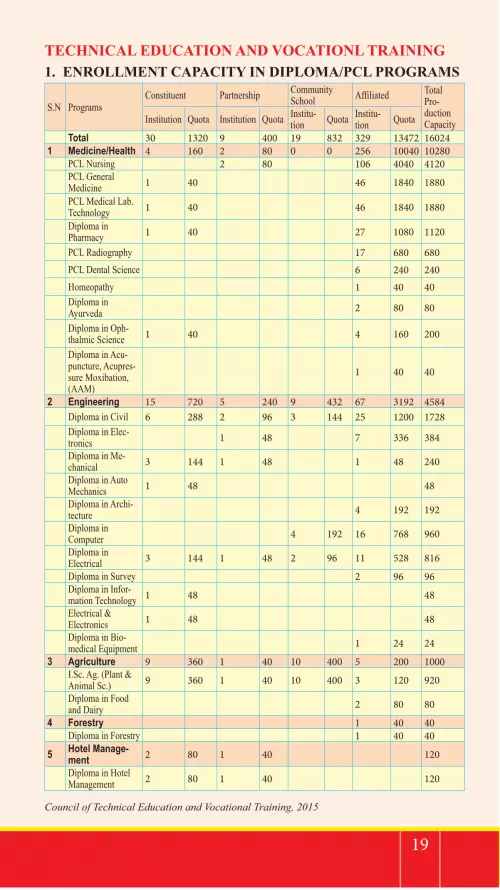
TECHNICAL EDUCATION AND VOCATIONL TRAINING1. ENROLLMENT CAPACITY IN DIPLOMA/PCL PROGRAMS
S.N ProgramsConstituent Partnership Community
School Affiliated Total Pro-duction CapacityInstitution Quota Institution Quota Institu-
tion Quota Institu-tion Quota
Total 30 1320 9 400 19 832 329 13472 160241 Medicine/Health 4 160 2 80 0 0 256 10040 10280
PCL Nursing 2 80 106 4040 4120PCL General Medicine 1 40 46 1840 1880
PCL Medical Lab. Technology 1 40 46 1840 1880
Diploma in Pharmacy 1 40 27 1080 1120
PCL Radiography 17 680 680PCL Dental Science 6 240 240Homeopathy 1 40 40Diploma in Ayurveda 2 80 80
Diploma in Oph-thalmic Science 1 40 4 160 200
Diploma in Acu-puncture, Acupres-sure Moxibation, (AAM)
1 40 40
2 Engineering 15 720 5 240 9 432 67 3192 4584Diploma in Civil 6 288 2 96 3 144 25 1200 1728Diploma in Elec-tronics 1 48 7 336 384
Diploma in Me-chanical 3 144 1 48 1 48 240
Diploma in Auto Mechanics 1 48 48
Diploma in Archi-tecture 4 192 192
Diploma in Computer 4 192 16 768 960
Diploma in Electrical 3 144 1 48 2 96 11 528 816
Diploma in Survey 2 96 96Diploma in Infor-mation Technology 1 48 48
Electrical & Electronics 1 48 48
Diploma in Bio-medical Equipment 1 24 24
3 Agriculture 9 360 1 40 10 400 5 200 1000I.Sc. Ag. (Plant & Animal Sc.) 9 360 1 40 10 400 3 120 920
Diploma in Food and Dairy 2 80 80
4 Forestry 1 40 40Diploma in Forestry 1 40 40
5 Hotel Manage-ment 2 80 1 40 120
Diploma in Hotel Management 2 80 1 40 120
Council of Technical Education and Vocational Training, 2015
20
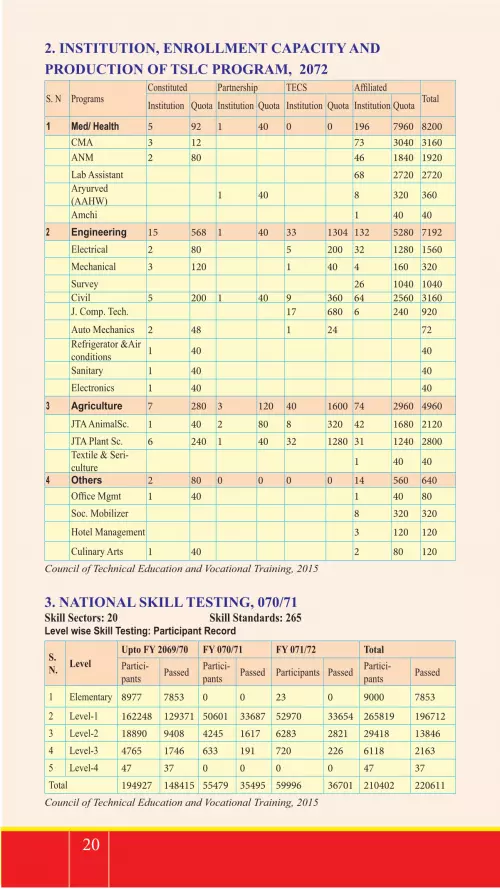
2. INSTITUTION, ENROLLMENT CAPACITY AND PRODUCTION OF TSLC PROGRAM, 2072
S. N ProgramsConstituted Partnership TECS Affiliated
TotalInstitution Quota Institution Quota Institution Quota Institution Quota
1 Med/ Health 5 92 1 40 0 0 196 7960 8200 CMA 3 12 73 3040 3160 ANM 2 80 46 1840 1920 Lab Assistant 68 2720 2720
Aryurved (AAHW) 1 40 8 320 360
Amchi 1 40 402 Engineering 15 568 1 40 33 1304 132 5280 7192 Electrical 2 80 5 200 32 1280 1560 Mechanical 3 120 1 40 4 160 320 Survey 26 1040 1040 Civil 5 200 1 40 9 360 64 2560 3160 J. Comp. Tech. 17 680 6 240 920
Auto Mechanics 2 48 1 24 72
Refrigerator &Air conditions 1 40 40
Sanitary 1 40 40 Electronics 1 40 40
3 Agriculture 7 280 3 120 40 1600 74 2960 4960
JTA AnimalSc. 1 40 2 80 8 320 42 1680 2120 JTA Plant Sc. 6 240 1 40 32 1280 31 1240 2800
Textile & Seri-culture 1 40 40
4 Others 2 80 0 0 0 0 14 560 640 Office Mgmt 1 40 1 40 80 Soc. Mobilizer 8 320 320
Hotel Management 3 120 120
Culinary Arts 1 40 2 80 120Council of Technical Education and Vocational Training, 2015
3. NATIONAL SKILL TESTING, 070/71 Skill Sectors: 20 Skill Standards: 265Level wise Skill Testing: Participant Record
S. N. Level
Upto FY 2069/70 FY 070/71 FY 071/72 TotalPartici-pants Passed Partici-
pants Passed Participants Passed Partici-pants Passed
1 Elementary 8977 7853 0 0 23 0 9000 7853
2 Level-1 162248 129371 50601 33687 52970 33654 265819 1967123 Level-2 18890 9408 4245 1617 6283 2821 29418 138464 Level-3 4765 1746 633 191 720 226 6118 21635 Level-4 47 37 0 0 0 0 47 37Total 194927 148415 55479 35495 59996 36701 210402 220611
Council of Technical Education and Vocational Training, 2015

21
HIGHER EDUCATION1. HIGHER EDUCATION INSTITUTIONS, 2072 Universities and Deemed Universities Constituent Community Private Total
Total 98 432 839 1369TU (1959) 60 424 639 1123NSU (1986) 14 2 2 18KU (1991) 6 0 15 21PU (1994) 5 6 120 131PokU(1997) 4 0 58 62LBU (2005) 1 0 5 6MWU (2012) 1 0 0 1AFU (2012) 2 0 0 2FWU (2012) 1 0 0 1BPKIHS (1993) 1 0 0 1NAMS (2002) 1 0 0 1PAHS(2009) 1 0 0 1KAHS 1 0 0 1
University Grants Commission, 2015
NOTE : UNIVERSITIESTU : Tribhuvan UniversityNSU : Nepal Sanskrit UniversityKU : Kathmandu UniversityPU : Purbanchal University,PoKU : Pokhara UniversityLBU : LumbiniBauddha UniversityMWU : Mid-western UniversityAFU : Agriculture and Forestry UniversityFWU : Far-western UniversityBPKIHS : B.P. Koirala Institute of Health Sciences (Medical Academy)NAMS : National Academy of Medical Sciences (Medical Academy)PAHS : Patan Academy of Health Sciences (Medical Academy)KAHS : Karnali Academy of Health Science (Medical Academy)

22
2. TYPE AND UNIVERSITY WISE HIGHER EDUCATION ENROLLMENT, 2072
Univer-sities
Grand Total Enrol-ment Share
Cam-puses Share
Community Constituent Private
Female Total Female Total Female Total Female Total
Total 214598 458621 100 100 88830 150344 58412 144008 67356 164269
TU 194898 384499 83.84 82.03 881881 149044 53809 126590 52908 108865NSU 831 3862 0.84 1.31 16 151 614 3387 201 324KU 6834 14550 3.17 1.53 0 0 2062 5476 4772 9074PU 10378 24441 5.33 9.57 633 1149 321 887 9424 22405PokU na 25254 5.51 4.53 0 00 0 1782 0 23472LBU 87 241 0.05 0.44 0 0 36 112 51 129MWU na 1944 0.42 0.07 0 0 0 1944 0 0AFU na 446 0.1 0.15 0 0 0 446 0 0FWU 1192 2461 0.54 0.07 0 0 1192 2461 0 0BPKI-HS 231 443 0.1 0.07 0 0 231 443 0 0
NAMS 60 245 0.05 0.07 0 0 60 245 0 0PAHS 87 235 0.05 0.07 0 0 87 235 0 0KAHS na na na 0.07 0 0 0 0 0 0
University Grants Commission, 2015
3. REGION AND UNIVERSITY WISE HIGHER EDUCATION ENROLLMENT, 2070Region AFU BPKIHS FWU KU LBU MWU NAMS NSU PAHS PoKU PU TU TotalEast 0 443 0 1090 0 0 0 169 0 0 8204 50630 60536Central 446 0 0 11039 129 0 245 2388 235 16093 14576 199719 245050
Western 0 0 0 1516 112 0 0 563 0 7784 1157 64027 75159
Mid-West-ern 0 0 0 0 1944 0 514 582 0 36992 40032
Western 0 0 2461 905 0 0 0 228 0 795 324 33131 37844Total 446 443 2461 14550 241 1944 245 3862 235 25254 24441 384499 458621
University Grants Commission, 2015
4. REGION AND CAMPUS TYPE WISE HIGHER EDUCATION ENROLLMENT, 2072
Campus Type Private Community Constituent TotalRegions Campuses Student Campuses Student Campuses Student Campuses StudentEastern 135 22295 72 23364 20 14877 227 60536Central 478 107738 156 50907 43 86405 677 245050Western 107 16003 119 34669 19 24487 245 75159Mid-western 71 8469 41 18358 10 13205 122 40032Far-western 48 9764 44 23046 6 5034 98 37844Total 839 164269 432 150344 98 144008 1369 458621
University Grants Commission, 2015

23
5. LEVEL AND CAMPUS TYPE WISE HIGHER EDUCATION ENROLLMENT, 2072Level Total Bachelor Masters PGD Mphil PHD
Campus Type
Female Total Female Total Female Total Female Total Female Total Female Total
Community 88830 150344 84212 141925 4618 8419
Constituent 58412 144008 41690 106070 16572 37324 70 97 61 334 19 183
Private 67356 164269 64028 150633 3286 13592 42 44
Total 214598 458621 189930 398628 24476 59335 112 141 61 334 19 183
University Grants Commission, 2015
6. LEVEL AND REGION WISE ENROLLMENT, 2072
Level Total Bachelor Masters PGD Mphil PHD
Region Female Total Female Total Female Total Female TotalFe-male
To-tal
Fe-male Total
Eastern 31922 60536 29596 55171 2326 5365
Central 106255 245050 89569 203277 16497 41149 112 141 61 334 16 149
Western 39672 75159 36172 68090 3497 7035 3 34Mid-Western 18732 40032 17792 37023 940 3009FarWest-ern 18017 37844 16801 35067 1216 2777
Total 214598 458621 189930 398628 24476 59335 112 141 61 334 19 183
University Grants Commission, 2015
7. LEVEL AND FACULTY WISE ENROLLMENT, 2072
FacultiesTotal Bachelor Masters PGD Mphil PHD
Female Total Female Total Female TotalFe-male
TotalFe-male
Total Female Total
Agriculture 405 1558 405 1470 0 78 0 10Animal Science 0 102 0 65 0 35 0 2
Buddhism 87 241 84 215 3 26
Education 98395 157793 89673 140919 8597 16439 66 71 52 279 7 85
Engineering 131 18216 110 15951 20 2256 1 9
Forestry 126 597 126 586 0 11
HSS 27407 57424 19903 39968 7500 17440 4 16
Law 1191 3832 1072 3378 119 454
Management 71384 168843 64162 150160 7167 18553 46 70 9 55 0 5
Medicine 7833 17857 7389 16733 444 1124
S&T 6808 28296 6259 25536 545 2730 4 30
Sanskrit 831 3862 831 3862
214598 458621 189930 398628 24476 59335 112 141 61 334 19 183
University Grants Commission, 2015
24
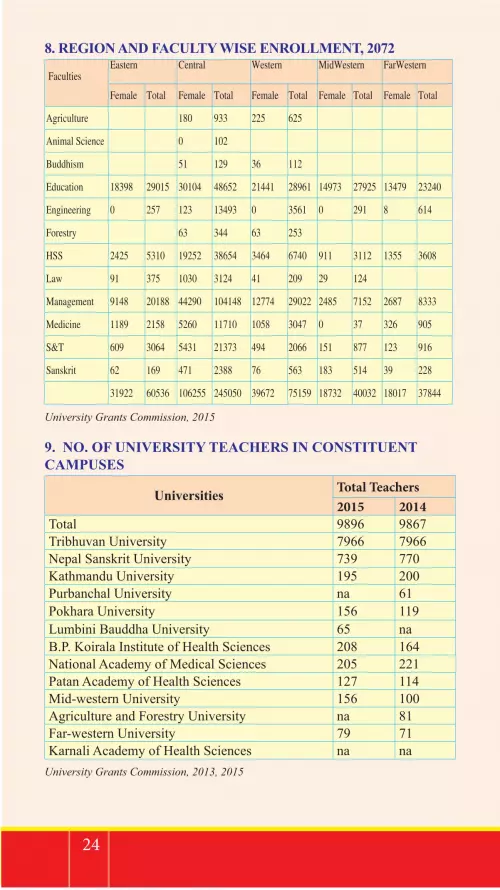
8. REGION AND FACULTY WISE ENROLLMENT, 2072
Faculties
Eastern
Central
Western
MidWestern
FarWestern
Female Total Female Total Female Total Female Total Female Total
Agriculture 180 933 225 625
Animal Science 0 102
Buddhism 51 129 36 112
Education 18398 29015 30104 48652 21441 28961 14973 27925 13479 23240
Engineering 0 257 123 13493 0 3561 0 291 8 614
Forestry 63 344 63 253
HSS 2425 5310 19252 38654 3464 6740 911 3112 1355 3608
Law 91 375 1030 3124 41 209 29 124
Management 9148 20188 44290 104148 12774 29022 2485 7152 2687 8333
Medicine 1189 2158 5260 11710 1058 3047 0 37 326 905
S&T 609 3064 5431 21373 494 2066 151 877 123 916
Sanskrit 62 169 471 2388 76 563 183 514 39 228
31922 60536 106255 245050 39672 75159 18732 40032 18017 37844
University Grants Commission, 2015
9. NO. OF UNIVERSITY TEACHERS IN CONSTITUENT CAMPUSES
Universities Total Teachers2015 2014
Total 9896 9867Tribhuvan University 7966 7966Nepal Sanskrit University 739 770Kathmandu University 195 200Purbanchal University na 61Pokhara University 156 119Lumbini Bauddha University 65 naB.P. Koirala Institute of Health Sciences 208 164National Academy of Medical Sciences 205 221Patan Academy of Health Sciences 127 114Mid-western University 156 100Agriculture and Forestry University na 81Far-western University 79 71Karnali Academy of Health Sciences na na
University Grants Commission, 2013, 2015
25
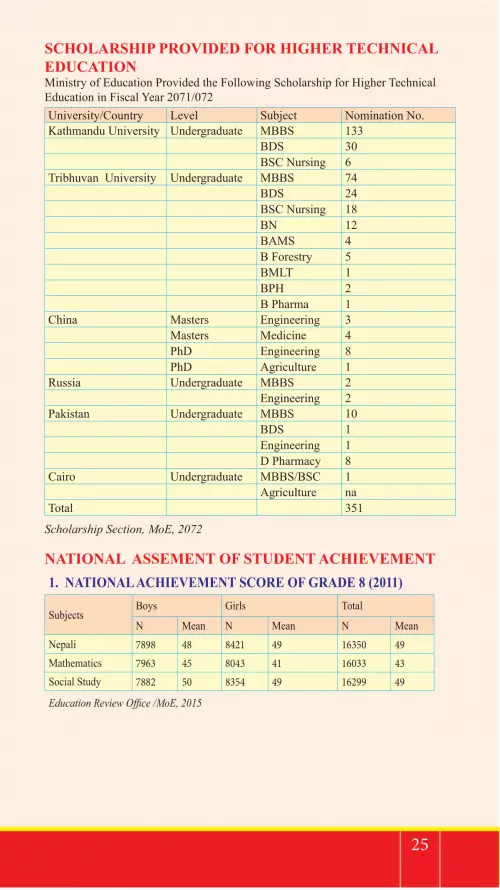
SCHOLARSHIP PROVIDED FOR HIGHER TECHNICAL EDUCATIONMinistry of Education Provided the Following Scholarship for Higher Technical Education in Fiscal Year 2071/072University/Country Level Subject Nomination No.Kathmandu University Undergraduate MBBS 133
BDS 30BSC Nursing 6
Tribhuvan University Undergraduate MBBS 74BDS 24BSC Nursing 18BN 12BAMS 4B Forestry 5BMLT 1BPH 2B Pharma 1
China Masters Engineering 3Masters Medicine 4PhD Engineering 8PhD Agriculture 1
Russia Undergraduate MBBS 2Engineering 2
Pakistan Undergraduate MBBS 10BDS 1Engineering 1D Pharmacy 8
Cairo Undergraduate MBBS/BSC 1Agriculture na
Total 351
Scholarship Section, MoE, 2072
NATIONAL ASSEMENT OF STUDENT ACHIEVEMENT1. NATIONAL ACHIEVEMENT SCORE OF GRADE 8 (2011)
SubjectsBoys Girls Total
N Mean N Mean N MeanNepali 7898 48 8421 49 16350 49Mathematics 7963 45 8043 41 16033 43Social Study 7882 50 8354 49 16299 49
Education Review Office /MoE, 2015

26
2. NATIONAL ACHIEVEMENT SCORE OF GRADE 5 (2012)
SubjectsBoys Girls TotalN Mean N Mean N Mean
Nepali 6449 59 6977 61 13971 60Mathematics 6570 54 6302 53 13714 53English 6598 55 6514 53 13794 54Education Review Office /MoE, 2015
3. NATIONAL ACHIEVEMENT SCORE OF GRADE 3 (2012)
SubjectsBoys Girls TotalN Mean N Mean N Mean
Nepali 8586 63 8861 64 19501 63Mathematics 8670 60 8305 60 19252 60Education Review Office /MoE, 2015
4. NATIONAL ACHIEVEMENT SCORE OF GRADE 8 (2013)
SubjectsBoys Girls Total
N Mean N Mean N MeanNepali 7210 48 7914 48 15336 48Mathematics 6837 38 7547 33 14500 35Science 6757 43 7314 39 14231 41
Education Review Office /MoE, 2015
27
REFERENCES
Central Bureau of Statistics. (2012). National Poupulation and Housing Census, 2011 (Vol. II). Kathmandu: National Planning Commission Secretariat.
Central Bureau of Statistics. (2012). Nepal in Figures 2014. Kathmandu: National Planning Commission Secretariat.
CTEVT. (2015). Enrolment Capacity in 2071. Sanothimi, Bhaktapur.
Department of Education. (2014/15). Flash I Report (2014-15). Sanothimi, Bhaktapur, Nepal.
Higher Secondary Education Board. (2015). Status of Higher Secondary Schools. Sanothimi Bhaktapur
Ministry of Education. (2015) Report of No Objection Letter Issued and Scholarship. Singhadurbar, Kathmandu.
Ministry of Finance. (various years). Red Books: FY 2061/62 to 2072/73. Kathmandu: Government of Nepal.
Education Review Office. 2072. Sanothimi, Bhaktapur.
Ministry of Finance. (2015). Economic Survey 2014/15. Kathmandu: Government of Nepal.
Office of Controller of Examination. (2015). Regular SLC Exam Result, 2071. Sanothimi, Bhaktapur.
Teacher Service Commission. (2015). Teacher License, Selection and Promotion in FY 2071/72. Sanothimi, Bhaktapur.
UNDP. (2014). Human Development Report 2014. Retrived from http://www.undp.org/content/dam/undp/library/corporate/HRD/2014HDR/HDR-2014-English.pdf
University Grants Commission. (2015). Sanothimi, Bhaktapur.

28
Government of Nepal
Ministry of EducationMonitoring Evaluation and Supervision DivisionEducational Information Management Section
Singhadurbar, Kathmandu, NepalPhone: 4200387
Website: www.moe.gov.np