education and growth: where all the education went
TRANSCRIPT

No. 16-02
2016
Education and Growth: Where All the
Education Went
Breton, Theodore R.; Siegel Breton, Andrew
1
Education and Growth: Where All the Education Went
Theodore R. Breton* and Andrew Siegel Breton
Universidad EAFIT
February 1, 2016
Abstract
We investigate why the economics literature often finds a negative relationship between
increased schooling and GDP growth over short periods. We show that increases in GDP in 98
countries during five-year intervals are correlated with the increases in adults´ average
schooling during the prior 40 years. We find that an additional year of schooling of the work
force raised GDP by 7% on average during 1980-2005, but its initial effect on GDP was much
smaller. The delayed effect of increased schooling on national productivity explains why recent
increases in schooling cannot explain near-term increases in GDP.
Key Words: Education; Economic Growth; Multi-country; Human Capital; Production Function
JEL Codes: O47; I25
2
I. Introduction
For over 25 years researchers have used cross-country data to estimate the relationship
between increased schooling and GDP growth. In recent studies researchers have presented
cross-sectional evidence showing that increases in average schooling attainment are associated
with increases in GDP that are substantially larger than the estimated effect of increased
schooling on workers’ earnings [Breton, 2013a, and 2015, Gennaioli, La Porta, Lopez-de-Silanes,
and Shleifer, 2013, and Sunde and Vischer, 2015].
But in studies within countries over five or ten-year periods, researchers consistently
find that there is no relationship or a negative relationship between increases in schooling and
changes in GDP/worker. Pritchett [2001] presented these results in his well-known article,
“Where Has All the Education Gone?”
Recently, Delgado, Henderson, and Parmeter [2014] used a non-parametric model to
analyze the relationship between changes in schooling and economic growth during five and
ten-year intervals. Over several time periods, with several data sets and with different groups
of countries, they again find either no relationship or a negative relationship between
additional schooling and growth.
Krueger and Lindahl [2001] investigated why cross-sectional and time-series estimates
of the effect of schooling are so different. They concluded that the national data for schooling
attainment (available at the time) had too much measurement error to permit the
identification of any effect over five-year intervals. They found that over such short intervals
differencing virtually eliminated any signal in the data.
Since that time Cohen and Soto [2007] and Barro and Lee [2013] have revised the cross-
country schooling data to reduce the measurement error. But Delgado, Henderson, and
Parmeter’s empirical results using these more recent data indicate that if measurement error is
the problem, these data revisions did not solve it.
Hanushek and Woessmann [2008] argue that the human capital measurement problem
is much bigger than simple mis-measurement of national levels of schooling. They argue that
schooling attainment is an inherently flawed measure because schooling quality varies
dramatically across countries.
But differences in schooling quality do not necessarily invalidate average schooling
attainment as a proxy for cross-country levels of human capital. As cited above, researchers
have shown that differences in average schooling across countries explain differences in levels
of GDP extremely well. Breton [2011 and 2013a] shows that across countries schooling quality
3
is correlated with average schooling attainment, so to some degree schooling attainment
explains differences in both the quantity and the quality of schooling.1
Even if schooling attainment did not account for differences in schooling quality across
countries, this limitation would not explain why researchers find no effect from increases in
schooling within countries. If human capital matters, schooling quality within countries should
be sufficiently stable to ensure a correlation between increases in a country’s level of adult
schooling and increases in GDP/worker over short periods of time.
We think there is a better explanation than inconsistent schooling quality for the
negative relationship between increased levels of adult schooling and GDP over short periods.
In all of the existing studies, researchers assume that the entire effect on GDP of an increase in
adults’ average schooling occurs immediately. As a consequence, they include only the recent
changes in adult’s average schooling when they estimate schooling’s relationship to GDP. If
increases in schooling affect GDP slowly over time, then studies that examine only the
immediate effect would find a small or negligible effect, even though the long run effect is
large.
In this article we test the hypothesis that national increases in adults’ average schooling
have a small initial effect on GDP and a much larger effect over time. Or expressed in another
way, we test the hypothesis that the GDP growth observed in the most recent five-year period
is due to the increases in adults’ average schooling that occurred over the prior 40 years.
The implication of our hypothesis is that a country’s average schooling attainment is a
poor measure of its human capital over short intervals because it does not account for how
long workers have had this level of schooling, and, therefore, for how many years their level of
education has interacted with experience to improve their productivity on the job. Countries
whose workers were educated only recently could have the same average schooling as
countries whose workers have been educated for a long time, but their level of human capital
would be lower.
Our analysis in this article is focused entirely on the effect of increases in schooling
quantity on growth. But it is important to point out that any delay between increased
schooling and increased worker productivity on the job would apply equally to the effect of
increases in students’ skills, such as those measured in international tests.2 Countries whose
1 Breton [2010, 2013a, and 2015] shows that across countries average schooling attainment is highly correlated
with PPP-adjusted cumulative investment in schooling, so it implicitly accounts for schooling quality differences to some degree. 2 It is important not to equate student test scores with school quality. Student test scores are substantially
affected by family characteristics and cultural practices (e.g., private tutoring) both within and across countries, so test scores cannot be attributed entirely to schooling quality [See Breton, 2015].
4
students achieved high test scores only recently would have less human capital than countries
whose students have had high test scores for a long time.
Delayed effects in macroeconomic analyses are usually estimated using VAR models.
But average schooling levels change so slowly and steadily that VAR models cannot identify the
time pattern for schooling’s effect. Estimates of schooling’s lagged effects in these models
exhibit oscillating patterns of positive and negative signs that change with the number of lagged
periods included in the model.
We employ an alternative strategy to identify the relationship between changes in
schooling and subsequent changes in GDP over time. The increase in workers’ earnings with
experience at different levels of schooling measures how schooling-related human capital
increases as workers obtain experience on the job. We use these relationships in workers’
earnings data to convert the average schooling of the work force to an experience-weighted
measure of human capital in each country. We then estimate the effect on GDP/worker of
changes in this measure of human capital and in physical capital/worker over five-year
intervals.
We show that increases in this experience-weighted measure of human capital during
five-year intervals are correlated with increases in GDP in 98 countries over the 1980-2005
period. We also show that after only minor adjustments to the experience weights, changes in
the human capital variable and changes in GDP are associated at the 1% level.
Our 2SLS estimates of a standard production function indicate that during the first five-
year interval, the effect of increased schooling on GDP is only 30% of its eventual effect, which
occurs after 35 years. These estimates indicate that an additional year of adult schooling
increases GDP by only 3% during the first five years, even though it increases GDP by 7% on
average over 40 years.
The implication of this finding is that schooling-based measures of human capital that
do not take into account the interactive effect of schooling and experience have considerable
measurement error. This error affects estimates of the effect of schooling on GDP to different
degrees, depending on the structure of the growth model, the statistical technique employed,
and the period of estimation. In OLS regressions using panel data and data differences over
short intervals, this measurement error severely attenuates or completely eliminates any
estimated effect of schooling.
The rest of this article is organized as follows: Section II presents data showing the
relationship between workers’ earnings and experience at different levels of schooling. Section
III presents the details of the methodology used in this study. Section IV presents the results.
5
Section V compares the estimates in this study to estimates in other studies. Section VI
concludes.
II. Schooling and Workers’ Earnings
Existing empirical studies of the effect of increased adult schooling on GDP assume the
entire effect is immediate, but they do not include any justification for this assumption. One
possible explanation is that this same assumption is used for the effect of physical capital, and it
greatly simplifies the analysis compared to an assumption that schooling has a lagged effect.
The more likely rationale behind this assumption is that it parallels the assumption in
the simplest version of the Mincer earnings model [Heckman, Lochner, and Todd, 2003]. In this
model the effects of schooling and experience are independent, so schooling´s entire effect on
earnings is immediate:
1) Log(earnings) = α0 + α1 schooling + α2 experience + α3 experience2
This model has been estimated throughout the world, and the empirical results for different
countries are remarkably similar and consistently statistically-significant [Montenegro and
Patrinos, 2014]. In these studies an additional year of schooling typically is associated with a 10
percent increase in earnings.
Even though the basic Mincer model provides consistent statistical results, its
assumption that schooling and experience are independent appears to be incorrect. There is
considerable evidence that earnings increase more with experience at higher levels of
schooling, which means that a conceptually-correct earnings model has a positive interactive
term between schooling and experience. In other words, some of the effect of additional
schooling on earnings is delayed. If workers’ earnings are related to their productivity on the
job, as assumed in neoclassical theory, then some fraction of the effect of additional schooling
on GDP also must be delayed.
Heckman, Lochner, and Todd [2003] present evidence for the U.S. that the effects of
schooling and experience on earnings were not independent in 1980 and 1990. Heckman,
Lockner, and Todd [2008] present evidence that experience has a greater effect on U.S.
workers’ incomes at higher levels of schooling. However, since incomes tend to rise with
experience at all levels of schooling, and all U.S. workers have some schooling, it is not clear
from the U.S. data whether the effect of experience on earnings is mostly related to schooling,
or whether it is mostly independent of schooling.
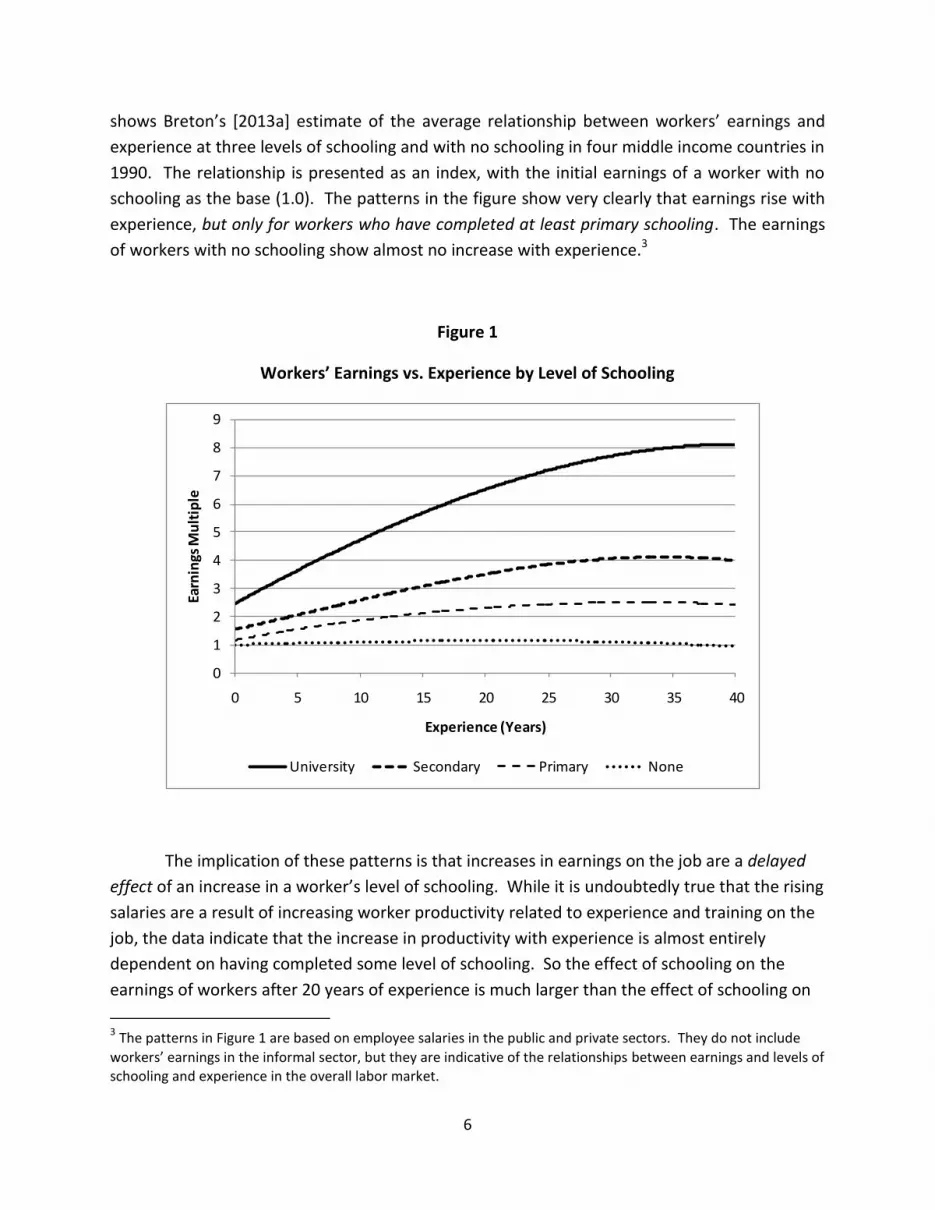
The magnitude of the interactive effect between schooling and experience can only be
ascertained in countries where a substantial share of the work force has no schooling. Figure 1
6
shows Breton’s [2013a] estimate of the average relationship between workers’ earnings and
experience at three levels of schooling and with no schooling in four middle income countries in
1990. The relationship is presented as an index, with the initial earnings of a worker with no
schooling as the base (1.0). The patterns in the figure show very clearly that earnings rise with
experience, but only for workers who have completed at least primary schooling. The earnings
of workers with no schooling show almost no increase with experience.3
Figure 1
Workers’ Earnings vs. Experience by Level of Schooling
The implication of these patterns is that increases in earnings on the job are a delayed
effect of an increase in a worker’s level of schooling. While it is undoubtedly true that the rising
salaries are a result of increasing worker productivity related to experience and training on the
job, the data indicate that the increase in productivity with experience is almost entirely
dependent on having completed some level of schooling. So the effect of schooling on the
earnings of workers after 20 years of experience is much larger than the effect of schooling on
3 The patterns in Figure 1 are based on employee salaries in the public and private sectors. They do not include
workers’ earnings in the informal sector, but they are indicative of the relationships between earnings and levels of schooling and experience in the overall labor market.
0
1
2
3
4
5
6
7
8
9
0 5 10 15 20 25 30 35 40
Earn
ings
Mu
ltip
le
Experience (Years)
University Secondary Primary None
7
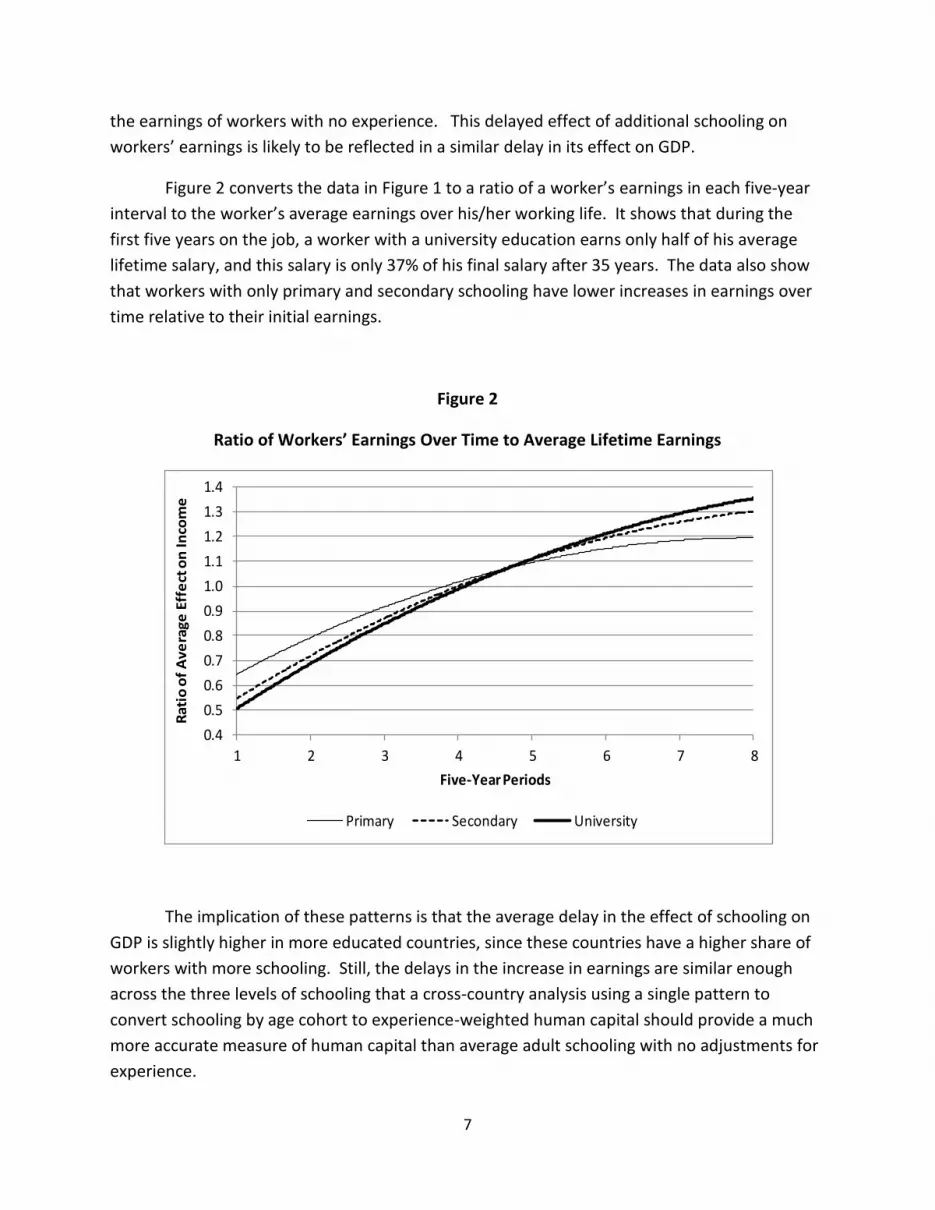
the earnings of workers with no experience. This delayed effect of additional schooling on
workers’ earnings is likely to be reflected in a similar delay in its effect on GDP.
Figure 2 converts the data in Figure 1 to a ratio of a worker’s earnings in each five-year
interval to the worker’s average earnings over his/her working life. It shows that during the
first five years on the job, a worker with a university education earns only half of his average
lifetime salary, and this salary is only 37% of his final salary after 35 years. The data also show
that workers with only primary and secondary schooling have lower increases in earnings over
time relative to their initial earnings.
Figure 2
Ratio of Workers’ Earnings Over Time to Average Lifetime Earnings
The implication of these patterns is that the average delay in the effect of schooling on
GDP is slightly higher in more educated countries, since these countries have a higher share of
workers with more schooling. Still, the delays in the increase in earnings are similar enough
across the three levels of schooling that a cross-country analysis using a single pattern to
convert schooling by age cohort to experience-weighted human capital should provide a much
more accurate measure of human capital than average adult schooling with no adjustments for
experience.
0.4
0.5
0.6
0.7
0.8
0.9
1.0
1.1
1.2
1.3
1.4
1 2 3 4 5 6 7 8
Rat
io o
f A
vera
ge E
ffe
ct o
n In
com
e
Five-Year Periods
Primary Secondary University
8
III. Methodology
The conceptual model used in the analysis is a standard Cobb-Douglas production
function, in which GDP/worker (Y/L) across countries is a function of the stocks of physical
capital/worker (K/L), human capital/worker (H/L), and total factor productivity (A0egt). We
estimate the model in log form:
2) log (Y/L)it = α log (K/L)it + β log (H/L)it (+ (1-α-β) log (A0) + (1-α-β)g t
We use either average schooling attainment or the experience-weighted average
attainment of the adult population (years) to represent the human capital of the work force,
assuming a log-linear relationship between human capital and either measure of schooling:
3) Log(H/L) = c + γ/β Schooling
Breton [2013 and 2015] shows that across countries the stock of human capital/adult (H/L)
estimated from cumulative investment in schooling fits this log-linear relationship with average
years of schooling extremely well. This relationship holds because the (average) unit costs of
schooling typically rise exponentially with increases in a country’s average level of schooling.4
Substitution of the relationship in (3) into (2) yields a log-linear “macro-Mincer”
production function [Krueger and Lindahl, 2001]:
4) Log(Y/L) = c + (1-α-β)g t + α log(K/L) + γ schooling + εi
Estimation of this model over different time periods does not provide consistent
estimates of α and γ. Log (K/L) and average schooling attainment are highly correlated across
countries (0.84 in this study), so measurement error in the variables changes the covariance
matrix in econometric estimations, which causes substantial variation in the estimated
coefficients.
Since estimates of K/L generally have less measurement error than the schooling proxy
for human capital, OLS estimates of (4) yield estimates of α that are biased upward and
estimates of γ that are biased downward. The downward bias in γ may be offset by upward
bias due to the endogeneity of schooling. Both types of bias can be reduced using instruments
for the physical capital and schooling variables.
Improvements in the accuracy of the schooling-based measure of human capital should
lead to less attenuation bias in the OLS estimate of γ, raising γ and reducing α. Our
4 It is this log-linear relationship between GDP and average schooling that permits cross-country analyses to find a
large effect of schooling on GDP even though the quality of schooling is higher in countries with higher average schooling attainment.

9
methodology relies on this phenomenon to determine whether the effect of increased adult
schooling on GDP is delayed and to identify the lag pattern. Superior specifications of the lag
pattern should increase the estimate of γ and reduce the variance in its estimate, particularly in
differenced estimates of the model over short time intervals.
We estimate the production function using data for GDP/adult, physical capital/adult
and schooling/adult for the period 1975-2005. The economic data are from Penn World Table
(PWT) 6.3 and 7.1 [Heston, Summers, and Aten, 2009 and 2012]. We calculate the physical
capital stock in 1975, 1985, 1990, 1995, 2000, and 2005 using the PWT investment rates (ci)
during the prior 25 years and a 0.05 annual depreciation rate. We limit the calculation period
for these stocks to 25 years because the investment data begin in 1950.
We create the experience-weighted human capital data from the Barro and Lee [2015]
data for the schooling of the population over age 25 during 1975-2005. We use these data
rather than the over age 15 data because in most countries many students are still in school
between the ages of 15 and 25.
Barro and Lee’s over-25 data are excellent for our purpose because they include the
average schooling in each five-year age cohort and the size of the cohort for the population
between the ages of 25 and 64 in five-year intervals. These data permit a very accurate
calculation of the experience-weighted level of human capital across countries as each five-year
cohort increases its productivity with experience on the job. We use the age 25-64 schooling
data to represent the schooling of the work force in each country over our estimation period.
Each five-year cohort’s human capital is estimated as its fraction of schooling’s eventual full
effect of schooling on its productivity. The fraction in the age 60-64 final cohort is equal to 1.0
and the fractions in the earlier, less-experienced cohorts are less than 1.0. This measure for the
population is an estimate of the relative human capital of the work force in each country
compared to a work force with the same average schooling composed entirely of workers with
35-40 years of experience.
We would not expect to find a statistically significant empirical relationship between
factor inputs and GDP in economies whose production is not determined primarily by profit
maximization with markets for inputs and outputs. For this reason we exclude countries from
the analysis that were not market economies throughout the period. We also exclude
countries that lacked sufficient data to calculate the physical capital stock during at least the
1985-2005 period or that were not included in the Barro and Lee [2015] data.
This left us with an unbalanced panel of 98 countries. Since PWT 6.3 and 7.1 do not
have investment rates for some low-income countries prior to 1960, only 57 of the 98 countries
10
in our panel have capital stock data in 1975 and only 66 have these data in 1980. The data are
complete for 1985-2005.
We began the analysis by specifying an experience-weighted pattern for human capital
similar to the pattern of observed increases in workers’ earnings in Figure 2. In this pattern the
human capital in each five-year cohort of workers is about 40, 55, 65, 75, 85, 93, 98, and 100
percent of the eventual level in the 60-64 age cohort for an average level of schooling. We
examined the effect of this measure on GDP and then examined the effect of slightly different
patterns until we identified a pattern that provides an estimate of the effect of additional
schooling on GDP with high statistical significance.
The earnings pattern in Figure 2 indicates that a worker’s productivity during the initial
five-year period is 40 percent of his/her eventual productivity.. We found that patterns
beginning with a lower fraction of eventual productivity have slightly larger estimated effects
on GDP and/or higher statistical significance than the observed pattern. We show the
statistical results for the observed pattern and for a pattern beginning with 30 percent of the
eventual level of productivity. Patterns with even lower initial fractions (20-25 percent) yield
similar statistical results.
We also performed an analysis using the over-25 schooling attainment data five years
earlier to represent the schooling of the age 20-24 cohort. We found that changes in the
schooling of this cohort do not explain the changes in GDP over the estimation period.
Since the experience-weighting calculation of human capital reduces the average years
of schooling in the first seven cohorts, the average values of the experience-weighted measures
of human capital are lower than a country’s average years of schooling. These lower average
values increase the estimated effect of a year of schooling in the regressions that use these
measures. We adjust the average effect of a year of schooling on GDP for the experience-
adjusted measures so the comparison with the effect of average schooling is comparable in the
results.
Economic time series typically are non-stationary of degree one. Although the number
of time periods in our panel is short, the time series components could have unit roots, which
could create bias in the estimated coefficients.
Since our interest is in examining whether changes in schooling within countries affect
GDP, we estimate our models in differences to eliminate the cross-sectional effects in the data.
This differencing has the added benefit that it eliminates any trends in the data that could bias
the estimated effects of physical capital and schooling. We tested the differenced data using
the Im-Pesaran-Shin test and confirmed that for the three variables in the model the null
hypothesis that all the data series contain a unit root is rejected at the 1% level.
11
Our physical capital and schooling variables could be endogenous, so we estimated the
with RE GLS and with 2SLS with instruments created from lagged values of the capital and
schooling variables. We performed our analysis first with PWT 6.3 data and then checked the
robustness of the results using PWT 7.1 data.
IV. Results
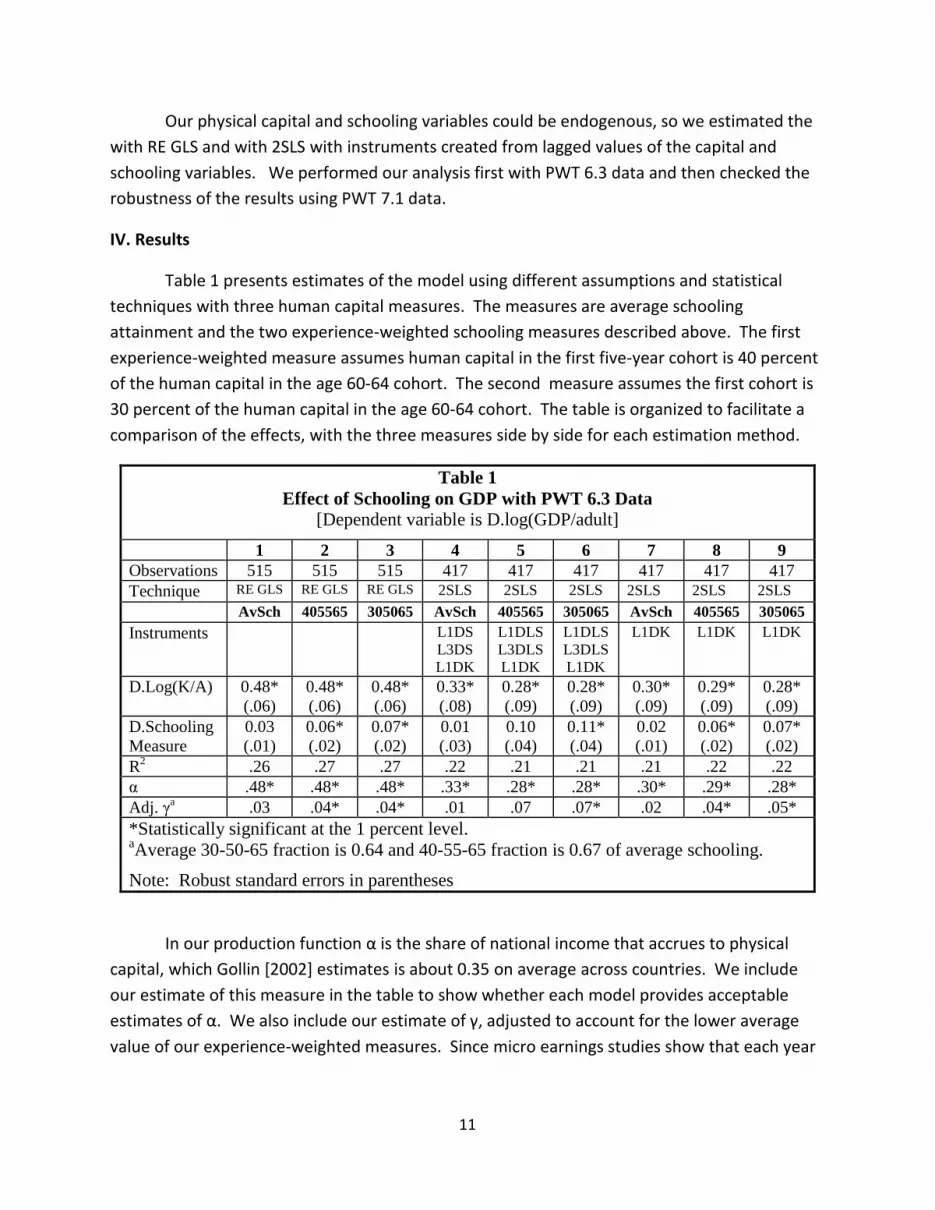
Table 1 presents estimates of the model using different assumptions and statistical
techniques with three human capital measures. The measures are average schooling
attainment and the two experience-weighted schooling measures described above. The first
experience-weighted measure assumes human capital in the first five-year cohort is 40 percent
of the human capital in the age 60-64 cohort. The second measure assumes the first cohort is
30 percent of the human capital in the age 60-64 cohort. The table is organized to facilitate a
comparison of the effects, with the three measures side by side for each estimation method.
Table 1
Effect of Schooling on GDP with PWT 6.3 Data
[Dependent variable is D.log(GDP/adult]
1 2 3 4 5 6 7 8 9
Observations 515 515 515 417 417 417 417 417 417
Technique RE GLS RE GLS RE GLS 2SLS 2SLS 2SLS 2SLS 2SLS 2SLS
AvSch 405565 305065 AvSch 405565 305065 AvSch 405565 305065
Instruments L1DS
L3DS
L1DK
L1DLS
L3DLS
L1DK
L1DLS
L3DLS
L1DK
L1DK L1DK L1DK
D.Log(K/A) 0.48*
(.06)
0.48*
(.06)
0.48*
(.06)
0.33*
(.08)
0.28*
(.09)
0.28*
(.09)
0.30*
(.09)
0.29*
(.09)
0.28*
(.09)
D.Schooling
Measure
0.03
(.01)
0.06*
(.02)
0.07*
(.02)
0.01
(.03)
0.10
(.04)
0.11*
(.04)
0.02
(.01)
0.06*
(.02)
0.07*
(.02)
R2 .26 .27 .27 .22 .21 .21 .21 .22 .22
α .48* .48* .48* .33* .28* .28* .30* .29* .28*
Adj. γa .03 .04* .04* .01 .07 .07* .02 .04* .05*
*Statistically significant at the 1 percent level. aAverage 30-50-65 fraction is 0.64 and 40-55-65 fraction is 0.67 of average schooling.
Note: Robust standard errors in parentheses
In our production function α is the share of national income that accrues to physical
capital, which Gollin [2002] estimates is about 0.35 on average across countries. We include
our estimate of this measure in the table to show whether each model provides acceptable
estimates of α. We also include our estimate of γ, adjusted to account for the lower average
value of our experience-weighted measures. Since micro earnings studies show that each year

12
of schooling raises workers’ earnings about 10%, and these earnings in the aggregate are 70%
of GDP, we expect adjusted γ to be at least 0.07.
The first three columns show the results for random effects generalized least squares.
The estimates of α are similar for all three measures (0.48), and they substantially exceed the
expected level of 0.35. The estimates of γ are all positive, but they are lower than the expected
level of 0.07. The effect with the two experience-weighted measures is larger (.04) than with
the average schooling measure, and both experience-weighted measures are statistically
significant at the 1% level.
The next three columns (4-6) show the results with 2SLS using the first lag of the change
in physical capital/adult and the first and third lags of the schooling measures as instruments.
We do not use the second lag of the schooling measures because a Sargan test showed that it is
not a valid instrument. Using the first lag of the capital variable as an instrument shortens the
estimation period by five years to 1980-2005, reducing the sample size from 515 to 417.
Including the lags for the schooling measures as instruments does not affect the sample size
because the schooling data are available for a longer historic period.
The 2SLS model provides much more acceptable values for α (0.28 -0.33), and these
estimates continue to be statistically significant. This model finds no effect from average
schooling attainment, but it finds the expected effect (0.07) for the experience-weighted
schooling measures. The estimate with the 40-55-65 measure is statistically significant at the
5% level, and the estimate with the 30-50-65 measure is statistically significant at the 1% level.
We interpret these results to indicate that the effect of increased schooling on GDP is
substantially delayed and the effect in the initial five-year interval is only 30% of its eventual
effect.
The standard STATA post-estimation tests for 2SLS estimation indicate that the physical
capital variable is endogenous and, somewhat surprisingly, the schooling-based variables are
not. The tests also indicate that the three instruments are strong (F>10) and that they are valid.
In theory the rejection of the null for the endogeneity of the schooling-based variables means
that they do not require instrumentation to control for endogeneity bias.
Columns 7-9 show the 2SLS results that include an instrument only for the physical
capital variable. The estimates of α are similar and statistically significant, but the estimates of
γ with the experience-based measures are lower (0.05) than the instrumented estimates. Again
the estimates using the experience-weighted measures are larger than with the average
schooling measure and statistically significant at the 1% level. The adjusted estimate of γ with
the 30-50-65 measure is larger than with the 40-55-65 measure, which we interpret to mean
13
that the 30-50-65 measure has less measurement error, so its estimated coefficient exhibits
less attenuation bias.
Since instruments reduce attenuation bias, we interpret the entire set of results to
indicate that the 30-50-65 experience-weighted measure is the most accurate measure of
human capital of the three measures and that the 2SLS estimate of its effect is the least biased.
This measure indicates than an additional year of schooling raises GDP by 7% over the working
life of a cohort of workers.
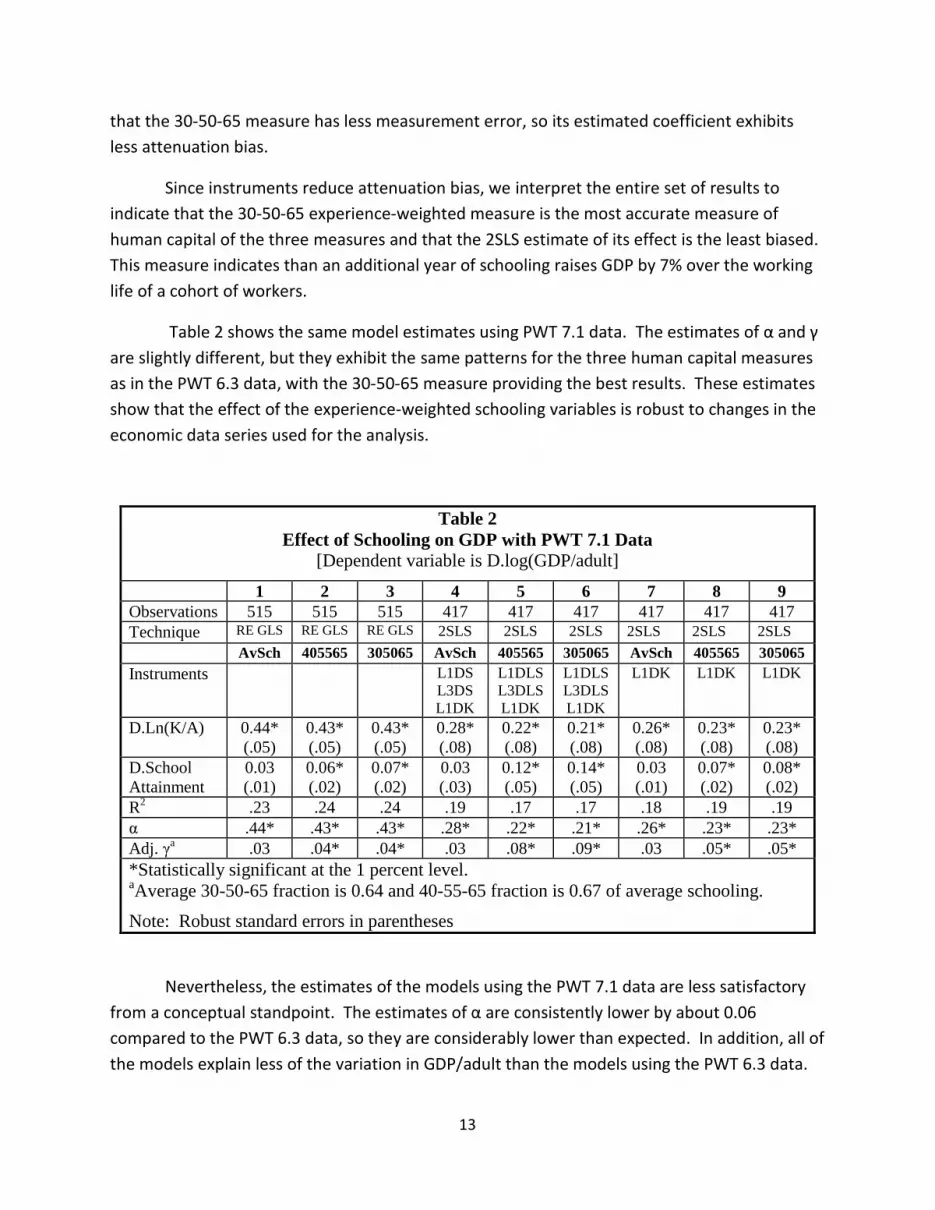
Table 2 shows the same model estimates using PWT 7.1 data. The estimates of α and γ
are slightly different, but they exhibit the same patterns for the three human capital measures
as in the PWT 6.3 data, with the 30-50-65 measure providing the best results. These estimates
show that the effect of the experience-weighted schooling variables is robust to changes in the
economic data series used for the analysis.
Table 2
Effect of Schooling on GDP with PWT 7.1 Data
[Dependent variable is D.log(GDP/adult]
1 2 3 4 5 6 7 8 9
Observations 515 515 515 417 417 417 417 417 417
Technique RE GLS RE GLS RE GLS 2SLS 2SLS 2SLS 2SLS 2SLS 2SLS
AvSch 405565 305065 AvSch 405565 305065 AvSch 405565 305065
Instruments L1DS
L3DS
L1DK
L1DLS
L3DLS
L1DK
L1DLS
L3DLS
L1DK
L1DK L1DK L1DK
D.Ln(K/A) 0.44*
(.05)
0.43*
(.05)
0.43*
(.05)
0.28*
(.08)
0.22*
(.08)
0.21*
(.08)
0.26*
(.08)
0.23*
(.08)
0.23*
(.08)
D.School
Attainment
0.03
(.01)
0.06*
(.02)
0.07*
(.02)
0.03
(.03)
0.12*
(.05)
0.14*
(.05)
0.03
(.01)
0.07*
(.02)
0.08*
(.02)
R2 .23 .24 .24 .19 .17 .17 .18 .19 .19
α .44* .43* .43* .28* .22* .21* .26* .23* .23*
Adj. γa .03 .04* .04* .03 .08* .09* .03 .05* .05*
*Statistically significant at the 1 percent level. aAverage 30-50-65 fraction is 0.64 and 40-55-65 fraction is 0.67 of average schooling.
Note: Robust standard errors in parentheses
Nevertheless, the estimates of the models using the PWT 7.1 data are less satisfactory
from a conceptual standpoint. The estimates of α are consistently lower by about 0.06
compared to the PWT 6.3 data, so they are considerably lower than expected. In addition, all of
the models explain less of the variation in GDP/adult than the models using the PWT 6.3 data.
14
The estimates of γ are higher using the PWT 7.1 data. In the 2SLS estimate of the 30-50-
65 experience-weighted measure, each additional year of schooling raises GDP by 9%. This
estimate appears to be biased upward, because the estimated coefficient on physical capital
(0.21) is so low that it must be biased downward.
There is considerable evidence that the PWT 7.1 data are less accurate than the PWT 6.3
data. In PWT 7.1 all of the national accounts data from 1950 to 2010 were adjusted using the
prices collected in ICP 2005, rather than the prices collected in earlier ICP surveys that
correspond in time to the data [Breton, 2012]. This change appears to have reduced the
accuracy of the data in PWT 7.1. In addition, construction prices appear to be underestimated
in many developing countries in ICP 2005, which causes an overestimate of investment rates
[Breton and Garcia, 2016]. Deaton and Aten [2014] identify other estimation problems that
biased the prices in ICP 2005. Since the ICP 2005 prices were used to adjust the entire 1950-
2010 period, they appear to substantially bias the PWT 7.1 data. Overall, we conclude that the
empirical results from the models using the PWT 6.3 data are more accurate.
V. Comparison with Cross-Sectional Estimates
Earlier we observed that cross-sectional estimates of the relationship between schooling
and GDP typically produce estimates that are larger than the effect of additional schooling on
workers’ earnings. But the estimates in the literature often are not comparable because their
magnitude is affected by the form of the income or growth model used for the estimation.
Reduced forms of the production function and models that do not include physical capital
provide larger estimates of the effect of schooling. These estimates must be adjusted to
compare them to the effect of schooling in the standard production function.
The estimated production functions in the literature are in two forms, the standard form
shown in (4) and a reduced form that is a function of the capital/output ratio:
5) Log(Y/L) = C + (1-α-β)g/(1-α) t + α/(1-α) log(K/Y) + γ/(1-α) schooling
In this model the coefficient on schooling is γ/1-α, so estimates using this function must be
reduced by the factor 1-α to compare them to the estimated coefficient in the standard
function.
Some analyses omit the physical capital variable altogether. These models are mis-
specified unless they have explanatory variables that substitute for physical capital. The
estimated coefficient on schooling in these models is biased upward because schooling is highly
correlated with the missing physical capital variable. In these models the estimated coefficient
on schooling is about 2γ. Mankiw, Romer, and Weil [1992]] show that when one type of capital

15
is excluded in a cross-sectional analysis, the estimated coefficient on the remaining capital
variable approximately doubles.
Table 3 presents the estimated coefficients on schooling in six recent cross-sectional
estimates of national income models. The period and form of the model used for these
estimates varies, but all of the estimates are cross-sectional or panel estimates that include the
cross-country relationship. As a consequence, all of these estimates implicitly estimate the
long-run effect of schooling.
Table 3
Estimated Coefficients on Schooling in Cross-Sectional Income Models
Study Period Coefficient Estimated Implied
γ γ/(1-α) 2γ γ
Cohen & Soto, 2007 1960-90 .13
.08
Gennaioli, et. al, 2013 2005
.24* .12
Breton, 2013a 1990 .12**
.12
Breton, 2013b 1910-2000 .16
.10
Sunde & Vischer, 2015 1970-2000 .13
.13
Breton, 2015 1985-2005 .09**
.09
*Adjusted down from 0.28 to account for their lower measure of schooling.
**Converted from estimates of β using γ/β = 0.32 [Breton, 2013a]
Gennaioli, et. al. [2013] found that each additional year of schooling is associated with a
28% increase in regional income. Their estimate is not comparable to the other estimates
because their measure of average schooling attainment only includes years related to
completion of a degree. Since their average schooling level is 16% lower than Cohen and Soto’s
estimate of average schooling, a comparable estimate of the effect of an additional year of
schooling on income in their study is 24%. Since they did not include physical capital in their
model, this estimate is about double the implied value of γ, which is about 0.12.
Breton [2013a and 2015] estimates the effect of investment in schooling (β), rather than
the effect of years of schooling (γ), but Breton [2013a] presents evidence that for the Cohen
and Soto [2007] schooling data, β/γ = 0.32. Using this conversion ratio his estimates of the
effect of a year of schooling are 0.09 and 0.11.
Cohen and Soto [2007] and Breton [2013b] estimated the reduced form model in (5), so
their estimated coefficients are higher by a factor of 1-α. The implied values of γ in these
estimates are not that different from the estimate in workers’ earnings studies.

16
So while estimated coefficients in the literature vary considerably, the implied values of
γ in these estimates all range from 0.08 to 0.13. These estimates are larger than the 0.07
estimate of the effect of schooling on GDP in workers’ earnings studies and in this study, but
they are relatively similar. This summary should counter the common belief that cross-
sectional estimates of the relationship between schooling and GDP are several times larger
than the estimates in workers’ earnings studies.
Overall the empirical research now indicates that an additional year of schooling,
holding physical capital/worker constant, increases GDP by about 3% in the short run and 7-
13% in the long run. This finding is a huge change from the situation a short time ago when
Pritchett [2001] concluded that on average across countries increased schooling reduces
economic growth.
VI. Conclusions
For over 20 years researchers have tried without success to find an effect on GDP from
increases in schooling over five-year periods. After performing one of these analyses and
finding only negative correlations, Pritchett [2001] famously asked, “Where has all the
education gone?” In this paper we provide an answer to this question.
The existing analyses that fail to find any effect assume that the entire effect of
schooling is immediate. We examine whether the effect of schooling on GDP may be
substantially delayed to determine whether this may explain the failure to find any effect.
We first present data showing that increases in schooling affect workers’ earnings
differently depending on their level of schooling. We also show that workers’ earnings in
middle income countries only increase with experience if they have prior schooling. We
conclude that increases in worker productivity and in earnings on the job are a delayed effect of
their prior schooling.
We then examine whether a pattern with a delayed effect similar to the one observed
for workers´ earnings may characterize the relationship between increased schooling and GDP.
We find that this pattern can explain changes in GDP. But we find that a pattern in which the
initial effect of schooling on GDP is slightly lower than in the earnings studies (30% of its
eventual effect) provides results that are more statistically significant. The clear implication is
that the increase in GDP during a five-year period is due to the increases in schooling during the
prior 40 years.
We find that an additional year of schooling in the population age 25-64 raises GDP by
7% on average over a 40-year period, but the effect associated with this additional year in the
17
initial five-year period is only 3%. Since average schooling typically increases by less than a year
over a five-year period, the initial effect of increased adult schooling on GDP is very small.
So this is where the education went. It had a small initial positive effect on GDP and
then contributed steadily to workers’ productivity as they gained experience over their working
lives. Even though their improvement in productivity occurred on the job, it was not
independent of their prior schooling. As a consequence, it is appropriate to consider the
productivity improvements on the job as a delayed effect of the workers’ earlier schooling.
The results in this article highlight the reality that increasing a country’s productivity
through education is a very long-term process. It begins by investing in children’s pre-schooling
and continues through primary, secondary, and post-secondary schooling. If there is any effect
on GDP during the schooling period, it is negative since students forego work to attend school.
Even if the students entering the work force have more schooling than the existing workers, the
positive effect of this additional schooling materializes slowly. In this study the initial effect did
not occur until after age 25 and then it continued to increase until age 65.
But the positive effects of additional adult schooling are not limited to this 40-year
period. There is considerable evidence that student achievement in school is positively affected
by their parents’ level of education [Fuchs and Woessmann, 2007]. In addition, students with
educated parents stay in school longer and eventually are more productive on the job
[Hanushek and Woessmann, 2008 ]. This continuing positive effect of additional schooling
beyond an adult’s working life may explain why the effect of schooling on GDP in cross-
sectional analyses is greater than the effect found in this study.
18
References
Barro, Robert J., and Lee, Jong-Wha, 2013, “A New Data Set of Educational Attainment in the
World,” Journal of Development Economics, v104, 184-198
Barro, Robert J., and Lee, Jong-Wha, 2015, Education Matters, Oxford University Press, New
York (The data set used in this analysis is entitled, “Educational Attainment for Total
Population,” % of Population 25 and Over, v2, June 2014)
Breton, Theodore R., 2010, “Schooling and National Income: How Large Are the Externalities?,”
Education Economics, v18, n1, 67-92
Breton, Theodore R., 2011, “The Quality vs. the Quantity of Schooling: What Drives Economic
Growth?” Economics of Education Review, 30, 765-773
Breton, Theodore R., 2012, “Penn World Table 7.0: Are the Data Flawed?” Economics Letters,
v117, n1, 208-210
Breton, Theodore R., 2013a, “Were Mankiw, Romer, and Weil Right? A Reconcilation of the
Micro and Macro Effects of Schooling on Income” Macroeconomic Dynamics, v17, n5, 1023-
1054
Breton, Theodore R., 2013b, “World Productivity Growth and the Steady-State Rate in the 20th
Century,” Economics Letters, v119, n3, 340-343
Breton, Theodore R., 2015, “Higher Test Scores or More Schooling? Another Look at the Causes
of Economic Growth,” Journal of Human Capital, v9, n2, 239-263
Breton, Theodore R., and Garcia, John J., 2016, “ICP 2005 Construction Prices: Are They
Underestimated in Developing Countries?” Review of Income and Wealth, forthcoming
Cohen, Daniel and Marcelo Soto, 2007, “Growth and human capital: good data, good results,”
Journal of Economic Growth, v12, n1, 51-76.
Deaton, Angus, and Aten, Bettina, 2014, “Trying to Understand the PPPs in ICP 2011: Why are
the Results So Different?,” NBER Working Paper 20244
Delgado, Michael S., Henderson, Daniel J., and Parmeter, Cristopher F., 2014, “Does Education
Matter for Growth?” Oxford Bulletin of Economics and Statistics, v73, n3, 334-359]
Fuchs, Thomas, and Woessmann, Ludger, 2007, “What Accounts for International Differences in
Student Performance? A Re-examination Using PISA Data, Empirical Economics, v32, 433-464
19
Gennaioli, Nicola, La Porta, Rafael, Lopez-de-Silanes, Florencio, and Shleifer, Andrei, 2013,
“Human Capital and Regional Development,” Quarterly Journal of Economics, v128, n1, 105-164
Gollin, Douglas, 2002, “Getting Income Shares Right,” Journal of Political Economy, v110, n2,
458-474
Hanushek, Eric A. and Woessmann, Ludger, 2008, “The Role of Cognitive Skills in Economic
Development,” Journal of Economic Literature, v46, n3, 607-668
Heckman, James J., Lochner, Lance J., and Todd, Petra E., 2003, “Fifty Years of Mincer Earnings
Regression,” NBER Working Paper 9732
Heckman, James J., Lochner, Lance J., and Todd, Petra E., 2008, “Earnings Functions and Rates
of Return,” NBER Working Paper 13780
Heston, Alan, Summers, Robert, and Aten, Bettina, 2009, Penn World Table Version 6.3, Center
for International Comparisons of Production, Income and Prices at the University of
Pennsylvania
Heston, Alan, Summers, Robert, and Aten, Bettina, 2012, Penn World Table Version 7.1, Center
for International Comparisons of Production, Income and Prices at the University of
Pennsylvania
Krueger, Alan B., and Lindahl, Mikael, 2001, “Education for Growth: Why and For Whom?,”
Journal of Economic Literature, v39, 1101-1136
Mankiw, N. Gregory, Romer, David, and Weil, David, 1992, “A contribution to the empirics of
economic growth,” Quarterly Journal of Economics, v107, n2, 407-437
Montenegro, Claudio E., and Patrinos, Harry A., 2014, “Comparable Estimates of Returns to
Schooling Around the World,” Policy Research Working Paper 7020, World Bank Group
Pritchett, Lant, 2001, Where Has All the Education Gone?, World Bank Economic Review, v15,
n3, 367-391
Sunde, Uwe, and Vischer, Thomas, 2015, “Human Capital and Growth: Specification Matters,”
Economica, v82, n326, 368-390