ecosystem impacts of the introduction of bycatch reduction devices in a tropical shrimp trawl...
TRANSCRIPT
Fisheries Research 77 (2006) 333–342
Ecosystem impacts of the introduction of bycatch reduction devicesin a tropical shrimp trawl fishery: Insights through simulation
Maria Isabel Criales-Hernandeza,∗, Luis O. Duartea,b, Camilo B. Garcıac, Luis Manjarresa
a Laboratorio de Investigaciones Pesqueras Tropicales, Universidad del Magdalena, AA 1690 Santa Marta, Colombiab Departamento de Oceanografıa, Universidad de Concepcion, Casilla 160-C, Concepcion, Chile
c Universidad Nacional de Colombia, Departamento de Biologıa, CECIMAR/INVEMAR, AA 1016 Santa Marta, Colombia
Received 28 January 2005; received in revised form 22 September 2005; accepted 17 October 2005
Abstract
ECOSIM simulations of the introduction of bycatch reduction devices (BRD) to a tropical industrial shrimp fishery resulted in moderate tostrong positive changes of biomass of selected bycatch functional groups, depending on the position of the BRD in the trawl net. The highestincreases in biomass after 20 years of simulation were predicted in the scenario with 12.70 cm× 30.48 cm football-shaped steel fisheye BRDpositioned with its center 15 meshes to the outside of top center and 30 meshes from the opening of the bag. In general, results are encouragingb model wash p yield att ted biomassi ntial benefitso nal groupst©
K
1
sarKilyta
SS
(
scaleangeild-
m-00
ton-
lob-
n thetrac-atch
r theented
0d
oth in terms of protection of selected functional groups and in socio-economic terms. Croakers, a group that in the Ecopath baseeavily impacted as part of bycatch in shrimp trawling, show significant rebuilding of biomass without substantially affecting shrim
he base fishing effort level. Similar rebuilding was also observed in other economically relevant groups, such as snappers. Predicncrements are conducive to larger captures by the long-line and artisanal fleets operating in the area. The results stress the potef the implementation of BRD and encourage its testing in Colombian waters. They also stress the need for careful choice of functio
o be protected.2005 Elsevier B.V. All rights reserved.
eywords: Bycatch; Tropical fish; Fisheries management; Simulation; Ecopath with ECOSIM; Caribbean Sea; Colombia
. Introduction
Ecosystems subject to active fishery exploitation typicallyuffer changes in structure and function. Most often expresseds changes in their food webs. Consequently, ecosystemesponses to exploitation are usually complex (Jennings andaiser, 1998; Hall, 1999). In this context, the main concern
s to assess the extent to which the fishery is jeopardizing theong-term viability of both affected populations and fisheryield. From a conservationist point view, the goal is to main-ain biodiversity and ecosystem integrity despite exploitation,s to maintain ecosystem functioning into the future (Pauly
∗ Corresponding author. Present address:Area de Evaluacion y Produccionecundaria, Instituto del Mar del Peru, Esquina de Gamarra y General Valle/N Chuchito Callao, Peru. Tel.: +57 5 4303368x248/+51 1 4296069x263.
E-mail addresses: [email protected], [email protected]. Criales-Hernandez).
et al., 2002). Thus, new approaches at the ecosystemhave been invoked for fisheries management, with a chof paradigm from building “sustainable” fisheries to “rebuing” of biomass within ecosystems (Pitcher, 2001).
The upwelling ecosystem in the Caribbean off Colobia (Fig. 1; Cabrera and Donoso, 1993; Andrade, 20),sustains industrial shrimp trawling (Viana et al., 2004), semi-industrial long-lining (boats of intermediate size and auomy between the industrial and the artisanal ones (Arevaloet al., 2004) and artisanal fisheries (Correa and Manjarres,2004a). These fisheries are mainly targeting shrimps,sters, pelagic and demersal fishes (Manjarres, 2004).
The industrial shrimp fleet exerts particular pressure odemersal community of the area not only due to the extion of relatively substantial amounts of shrimp (annual cduring 2000 of 337.3± 36.1 t,P = 95%,Viana et al., 2004),but also because of the high level of bycatch. Thus, foperiod 2000–2001, the target resource of the fleet repres
165-7836/$ – see front matter © 2005 Elsevier B.V. All rights reserved.oi:10.1016/j.fishres.2005.10.005
334 M.I. Criales-Hernandez et al. / Fisheries Research 77 (2006) 333–342
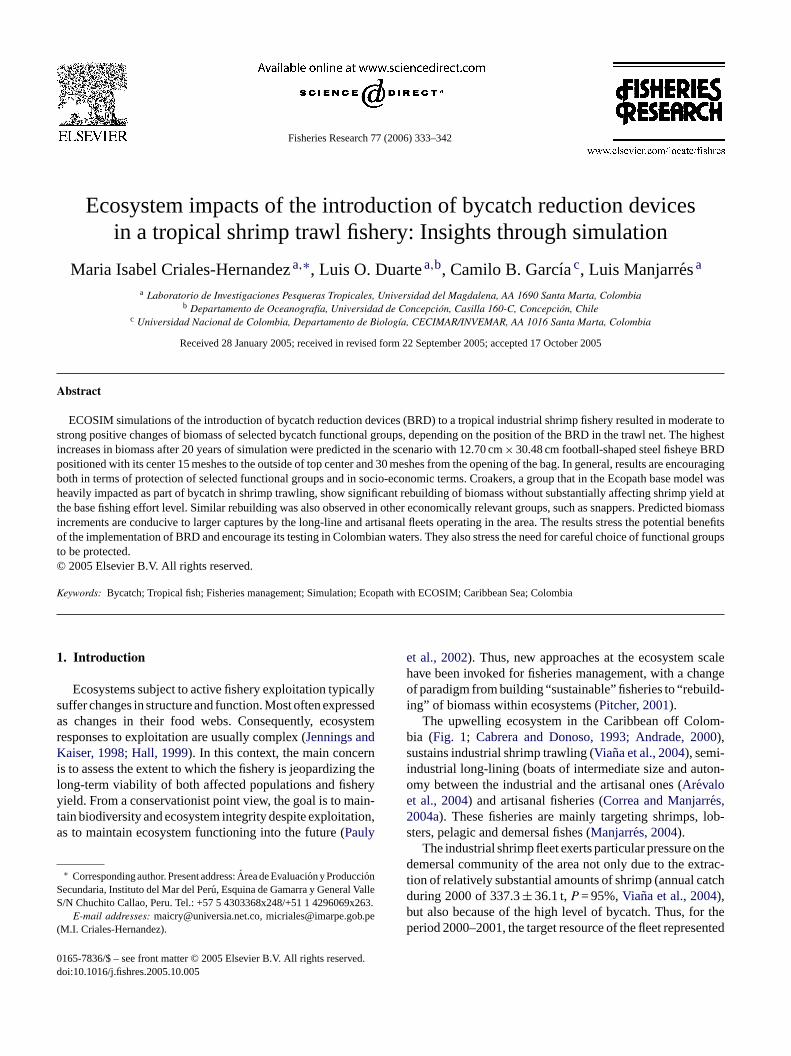
Fig. 1. Upwelling ecosystem off northern Colombia, Caribbean Sea. Study area comprises 4220 km2 of continental shelf indicated by the segmented lines.
only 11% of total catch by weight. Of the remaining 89%,28% were fishes and the rest invertebrates and algae (Viana etal., 2004). The bycatch problem is a recurrent issue in world-wide trawl fisheries (Alverson et al., 1994), calling for actionto reduce this collateral mortality imposed on non-target pop-ulations (FAO, 1996). A number of technological innovationsto alleviate this problem in trawl capture systems have beenproposed (Kennelly and Broadhurst, 2002), including, in par-ticular, bycatch reduction devices (BRDs) that operate fittedanterior to ahead of the codend of shrimp trawls. Indeed, ithas been found that BRDs can reduce bycatch of tropicalshrimp trawling by as much as 40–50% (Branstetter, 1997).
Introduction of BRDs in the shrimp trawl industry inColombian Caribbean waters is a foreseeable scenario inthe near future. Thus, it is of utmost interest to anticipatethe ecosystem effects of such a management action in termsof expected biomass restoration and to contrast this fore-casting with subsequent monitoring. The aim of this paperis to test whether the implementation of BRDs is a use-ful management alternative in the restoration of non-targetpopulations affected by industrial shrimp trawling in theupwelling ecosystem off Colombia. In order to anticipate andexplore plausible ecosystem responses, a dynamic trophicmodel (ECOSIM,Walters et al., 1997) was used to simu-late putative long-term dynamic changes in biomass levels ofselected functional groups within the ecosystem after inser-t
2
jira( km( theN d thew i.e.
the Caribbean Current (Andrade, 2000). The shelf is widebetween Cabo de La Vela and Riohacha and narrow in frontof Punta Gallinas. Sediments are sand–muddy from Cabo dela Vela to Punta Gallinas, and sandy with shells off Cabo dela Vela to Riohacha (Alvarez-Leon et al., 1995). This sys-tem is characterized by enhanced primary productivity inupwelled waters (Andrade, 2000), and supports the largestseagrass beds of the Colombian Caribbean Sea between Cabode la Vela to South of Riohacha (Dıaz et al., 2003). Theecosystem supports around 900 different species, some ofwhich are exploited by fisheries, such as shrimps, lobsters,snappers, groupers, croakers, pompanos, jacks and boni-tos. Oceanographic and meteorological conditions show verymarked changes due to the occurrence of Northeastern tradewinds and the migration of the intertropical convergence zone(ITCZ) (Muller-Karger and Aparicio, 1994).
3. Ecopath base model
Various data were gathered from a several projects, suchas the Catalogue of Macrofauna of INVEMAR 2001–2002,distribution and structure of seagrass (Dıaz et al., 2003),and used to construct this base model with Ecopath of thetropical upwelling ecosystem. Data published in papers,books, reports, and theses were used for the diet matrix (e.g.B 999;D 96;P 1993;S reaw rces( 98( po-s hes,fi hingl
ion of BRDs in the shrimp trawling gears.
. Study area
The tropical upwelling ecosystem at La GuaCaribbean Sea, Colombia) covers an area of 4220.662
Fig. 1). An Ekman-type coastal upwelling forced byortheastern trade winds characterize the system anind driven circulation dominates the flows of the area,
itter, 1984; Cortes and Criales, 1990; Duarte et al., 1e La Cruz-Aguero, 1993; Mendoza, 1993; Opitz, 19enchaszadeh and Lera, 1983; Sedberry and Cuellar,ierra et al., 1994). Fisheries statistics in the upwelling aere collected during 1999–2000 for demersal resou
Manjarres, 2004) and for small pelagics during 1997–19Viana et al., 1999). These data provided species comition lists, trawlable biomass, length and weight of fissh landings, fishing effort, and use and details on fisong-lines.
M.I. Criales-Hernandez et al. / Fisheries Research 77 (2006) 333–342 335
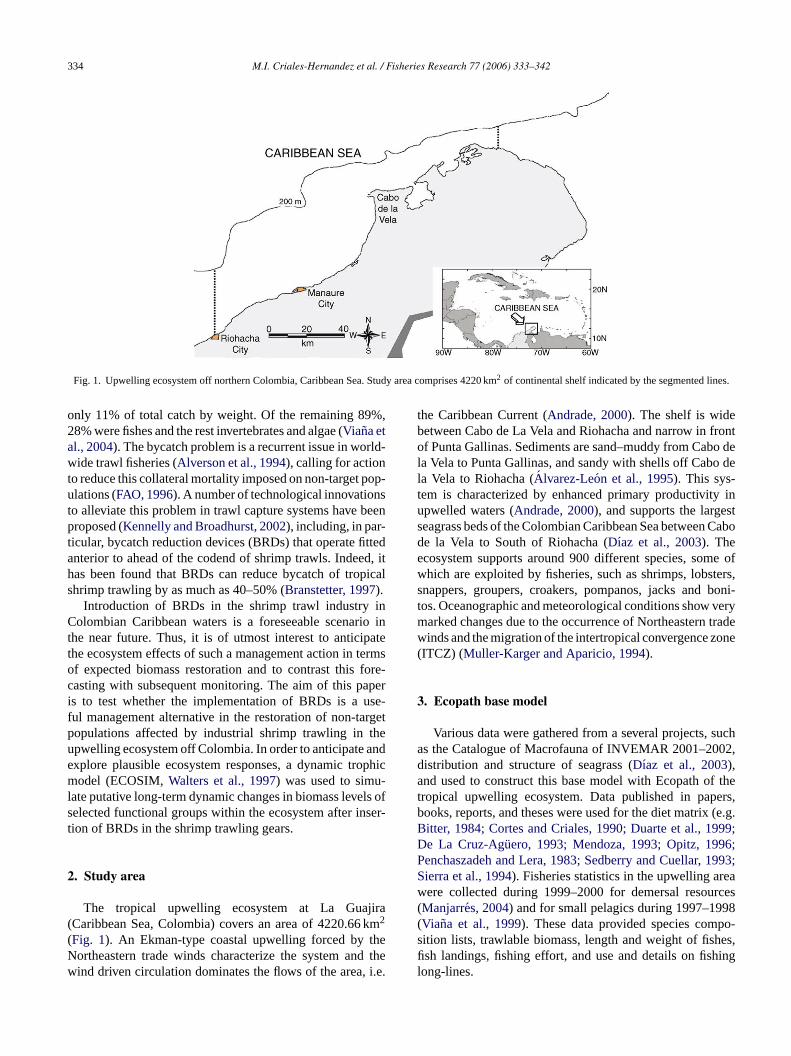
Fig. 2. Biomass flow diagram of the upwelling ecosystem off northern Colombia, Caribbean Sea. Flows are in t km−2 year−1. The surface area of the boxes isproportional to the logarithm of the biomass. The components of the system are structured along the vertical axis according to their trophic level defined as 1for primary producers and detritus and as 1 plus the weighted average of the prey’s trophic level for consumers.
Twenty-seven functional groups were defined in the sys-tem, including dolphins; sea birds; marine turtles; 11 groupsof fish include rays and sharks: 9 invertebrate groups; 3primary producers (phytoplankton, macro-algae and sea-grasses); and detritus (Fig. 2; Table 1). Fishing fleets wereincluded as predators groups within the model. The pedi-gree of the model was 0.549, i.e. intermediary betweendata not rooted locally (0) and data fully rooted locally (1)(Christensen et al., 2000). The fisheries were divided intoindustrial trawling, semi-industrial long-lining and artisanalfisheries (Table 2). The balance model represents the structureand potential dynamics of ecosystem. The groupings, param-eterizations and assessments of sources for this Ecopath basemodel are fully described inCriales-Hernandez (2004). Themodel was built using the Ecopath with ECOSIM (EwE)modeling approach (Christensen and Pauly, 1992; Walterset al., 1997) and describes the interactions between differentcomponents within the ecosystem (Fig. 2). The major partof the energy throughout is achieved from trophic levels Ito II (69.93%), where an important proportion of the totalflow originates from detritus (32%). Artisanal fleets had aspecial impact on trophic levels II and III, and they impact
on Pompano/Bonito/Jacks, while the semi-industrial long-lines affected snapper and groupers (trophic level III), andthe industrial shrimp trawling impacted specially the croak-ers group (trophic levels II and III).
The size of the ecosystem is moderate in terms oftotal biomass and total system throughput (68.3 t km−2 and3275 t km−2 year−1, respectively) compared to upwellingareas in subtropical and temperate waters, e.g. Benguela1990s, 231 t km−2 and 39304 t km−2 year−1 (Shannonet al., 2003), and California 1977–1985, 63.09 t km−2
and 7621 t km−2 year−1 (Jarre-Teichmann, 1998), but itis comparable to other upwelling ecosystems in thetropics, e.g. Northeastern Venezuela, 122.1 t km−2 and7621 t km−2 year−1 (Mendoza, 1993), and Gulf of Sala-manca, Colombia, 42.2 t km−2 and 3038 t km−2 year−1
(Duarte and Garcıa, 2002, 2004).
4. Material and methods
Mortality reduction due to the implementation of BRDson shrimp trawling gears has been documented for Gulf of
336 M.I. Criales-Hernandez et al. / Fisheries Research 77 (2006) 333–342
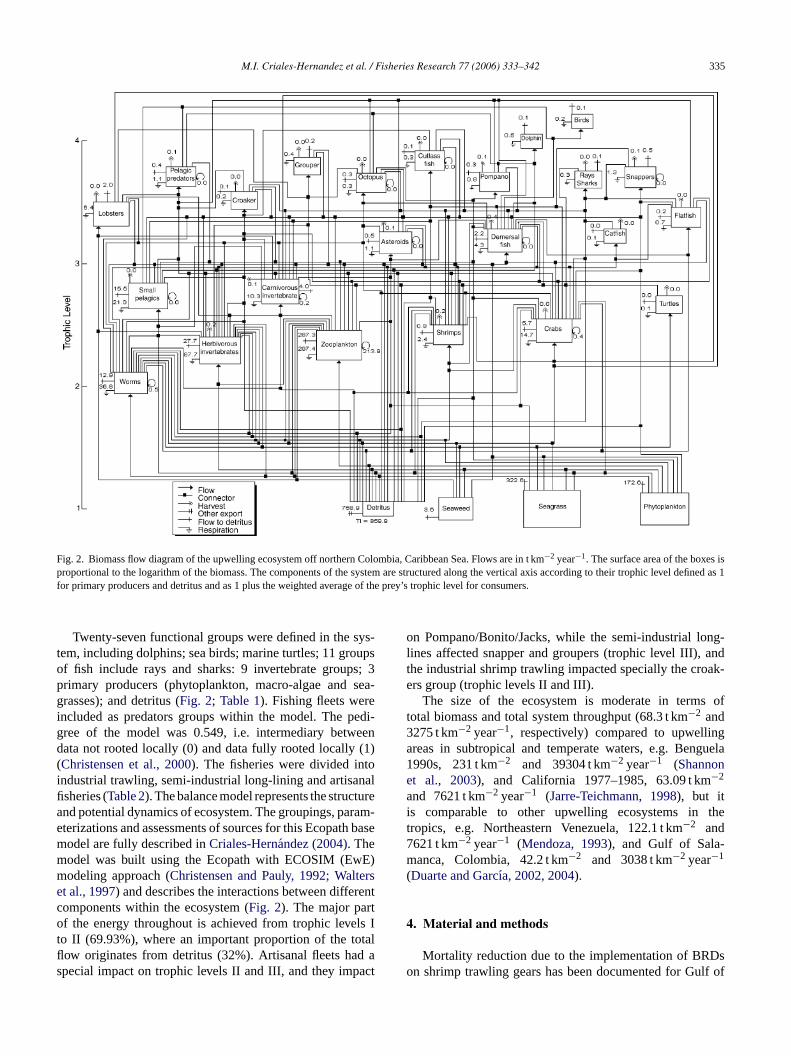
Table 1Basic input parameters of the mass balance model of the tropical upwelling ecosystem off northern Colombia, Caribbean Sea
Group Trophic level Biomass (t km−2) P/B (year−1) Q/B (year−1) Ecotrophic efficiency
Phytoplankton 1.00 (12.328) 70.000 – 0.800Seaweed 1.00 1.102 17.000 – (0.806)Seagrass 1.00 28.657 12.800 – (0.121)Worms 2.03 (0.751) 15.000 80.000 0.919Herbivorous invertebrates 2.29 4.500 3.800 29.100 (0.914)Zooplankton 2.33 9.680 40.000 (88.404) 0.700Crabs/others crustaceans 2.45 1.580 3.500 16.000 (0.881)Shrimps 2.42 0.160 5.100 25.000 (0.988)Turtles 2.67 0.040 0.300 3.500 (0.839)Small pelagic fish 2.74 2.730 4.00 14.600 (0.311)Carnivorous invertebrates 2.77 2.500 2.300 8.000 (0.992)Asteroids/ophiuroids 3.17 0.750 0.900 3.000 (0.961)Demersal fish 3.19 0.880 3.170 10.000 (0.849)Catfish 3.22 (0.013) 1.300 7.000 0.950Flatfish 3.38 0.140 0.830 7.500 (0.931)Lobsters 3.40 (1.404) 1.020 7.000 0.960Croakers 3.51 0.030 (1.830) 9.150 (0.622)Octopus/squids 3.66 0.110 2.300 8.000 (0.957)Pampano/jacks/bonitos 3.67 0.130 (2.412) 10.300 0.950Rays/sharks 3.68 0.090 0.620 5.300 (0.858)Snappers 3.70 0.430 0.560 4.500 (0.561)Pelagic predatory fish 3.71 0.170 1.950 10.300 (0.774)Groupers/large demersal fish 3.79 0.092 (1.320) 6.600 (0.616)Cutlassfish/anguilliformes 3.84 0.110 (0.749) 4.800 0.940Dolphins 4.00 0.021 0.050 28.000 0.000Birds 4.16 0.006 0.700 39.330 0.000Detritus 1.00 – – – 0.117
Values in brackets were estimated trough the Ecopath model.
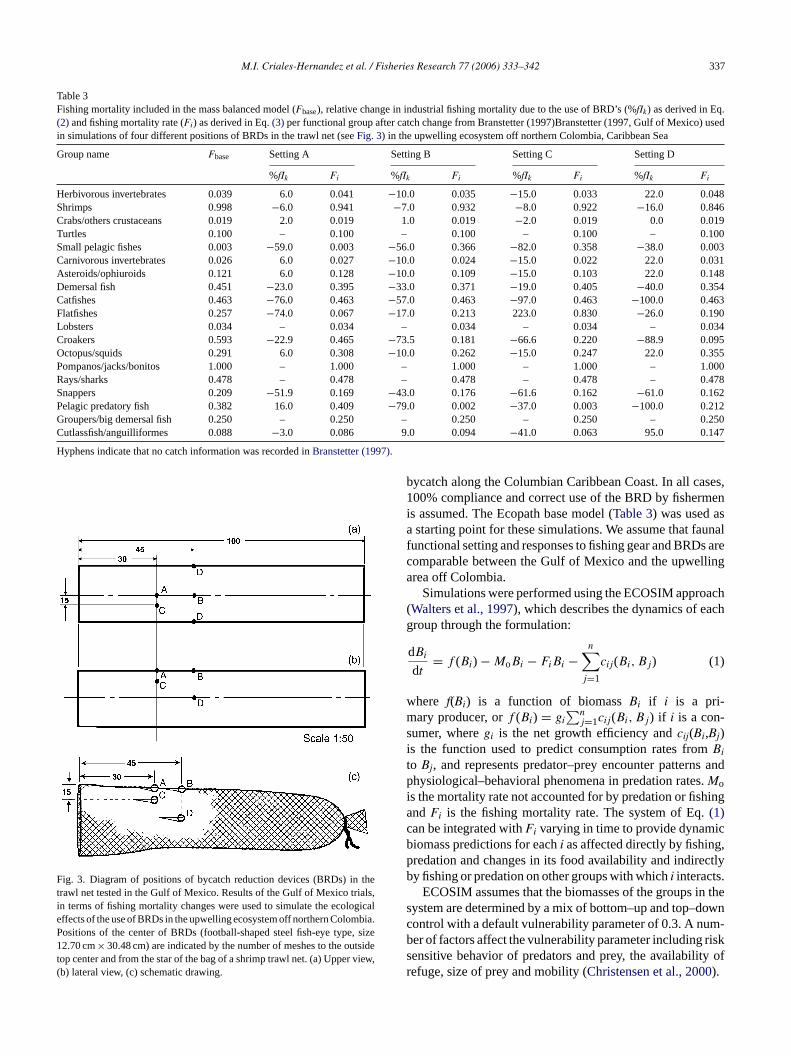
Mexico waters (Branstetter, 1997; Rogers et al., 1997; Engaaset al., 1999). BRDs fitted in several positions on gear havebeen tested, and results are available in terms of percent-age of reduction in bycatch (Branstetter, 1997; Table 3). TheBRD-type likely to be tested in Colombian Caribbean waters
is the ‘fisheye’. Thus, relative reductions observed in Gulfof Mexico bycatch by others using a 12.70 cm× 30.48 cmfootball-shaped steel fish-eye BRD fitted on the gear in fourselected positions (Fig. 3), was applied to our model andused to simulate the ecological effects of those reductions in
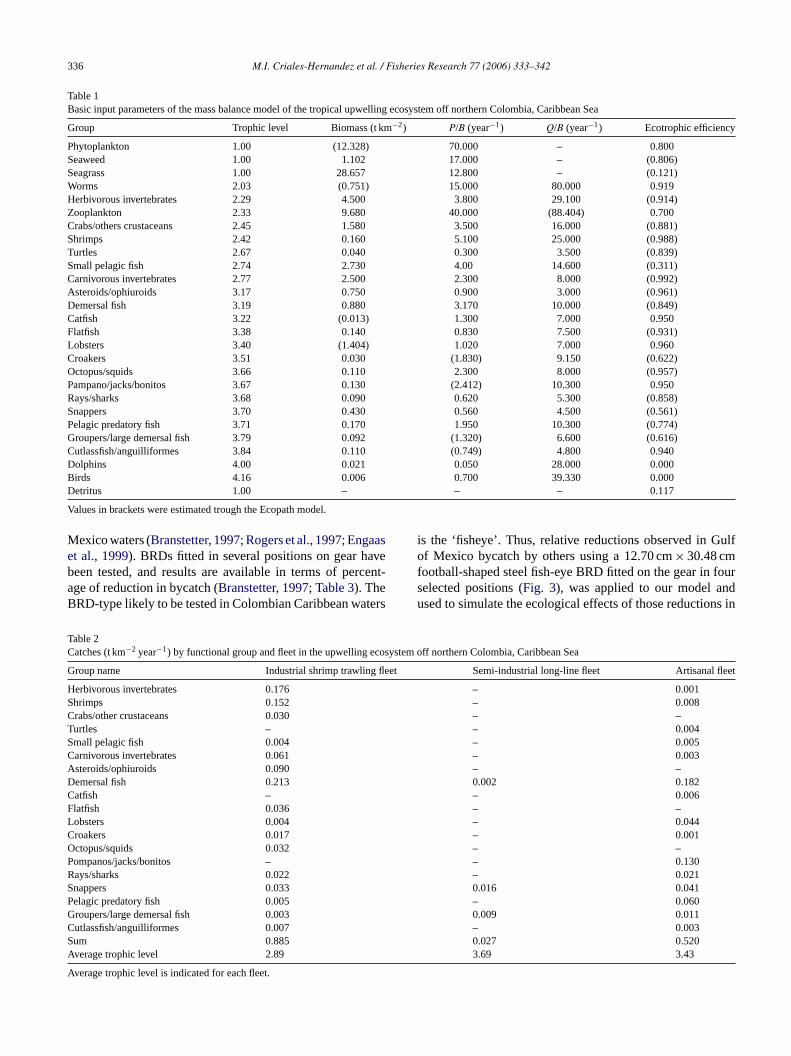
Table 2Catches (t km−2 year−1) by functional group and fleet in the upwelling ecosystem off northern Colombia, Caribbean Sea
Group name Industrial shrimp trawling fleet Semi-industrial long-line fleet Artisanal fleet
Herbivorous invertebrates 0.176 – 0.001Shrimps 0.152 – 0.008Crabs/other crustaceans 0.030 – –Turtles – – 0.004Small pelagic fish 0.004 – 0.005Carnivorous invertebrates 0.061 – 0.003Asteroids/ophiuroids 0.090 – –Demersal fish 0.213 0.002 0.182Catfish – – 0.006Flatfish 0.036 – –Lobsters 0.004 – 0.044Croakers 0.017 – 0.001Octopus/squids 0.032 – –Pompanos/jacks/bonitos – – 0.130Rays/sharks 0.022 – 0.021Snappers 0.033 0.016 0.041Pelagic predatory fish 0.005 – 0.060Groupers/large demersal fish 0.003 0.009 0.011Cutlassfish/anguilliformes 0.007 – 0.003SA
A
um 0.885verage trophic level 2.89
verage trophic level is indicated for each fleet.
0.027 0.5203.69 3.43
M.I. Criales-Hernandez et al. / Fisheries Research 77 (2006) 333–342 337
Table 3Fishing mortality included in the mass balanced model (Fbase), relative change in industrial fishing mortality due to the use of BRD’s (%fIk) as derived in Eq.(2) and fishing mortality rate (Fi) as derived in Eq.(3) per functional group after catch change from Branstetter (1997)Branstetter (1997, Gulf of Mexico) usedin simulations of four different positions of BRDs in the trawl net (seeFig. 3) in the upwelling ecosystem off northern Colombia, Caribbean Sea
Group name Fbase Setting A Setting B Setting C Setting D
%fIk Fi %fIk Fi %fIk Fi %fIk Fi
Herbivorous invertebrates 0.039 6.0 0.041 −10.0 0.035 −15.0 0.033 22.0 0.048Shrimps 0.998 −6.0 0.941 −7.0 0.932 −8.0 0.922 −16.0 0.846Crabs/others crustaceans 0.019 2.0 0.019 1.0 0.019 −2.0 0.019 0.0 0.019Turtles 0.100 – 0.100 – 0.100 – 0.100 – 0.100Small pelagic fishes 0.003 −59.0 0.003 −56.0 0.366 −82.0 0.358 −38.0 0.003Carnivorous invertebrates 0.026 6.0 0.027 −10.0 0.024 −15.0 0.022 22.0 0.031Asteroids/ophiuroids 0.121 6.0 0.128 −10.0 0.109 −15.0 0.103 22.0 0.148Demersal fish 0.451 −23.0 0.395 −33.0 0.371 −19.0 0.405 −40.0 0.354Catfishes 0.463 −76.0 0.463 −57.0 0.463 −97.0 0.463 −100.0 0.463Flatfishes 0.257 −74.0 0.067 −17.0 0.213 223.0 0.830 −26.0 0.190Lobsters 0.034 – 0.034 – 0.034 – 0.034 – 0.034Croakers 0.593 −22.9 0.465 −73.5 0.181 −66.6 0.220 −88.9 0.095Octopus/squids 0.291 6.0 0.308 −10.0 0.262 −15.0 0.247 22.0 0.355Pompanos/jacks/bonitos 1.000 – 1.000 – 1.000 – 1.000 – 1.000Rays/sharks 0.478 – 0.478 – 0.478 – 0.478 – 0.478Snappers 0.209 −51.9 0.169 −43.0 0.176 −61.6 0.162 −61.0 0.162Pelagic predatory fish 0.382 16.0 0.409 −79.0 0.002 −37.0 0.003 −100.0 0.212Groupers/big demersal fish 0.250 – 0.250 – 0.250 – 0.250 – 0.250Cutlassfish/anguilliformes 0.088 −3.0 0.086 9.0 0.094 −41.0 0.063 95.0 0.147
Hyphens indicate that no catch information was recorded inBranstetter (1997).
Fig. 3. Diagram of positions of bycatch reduction devices (BRDs) in thetrawl net tested in the Gulf of Mexico. Results of the Gulf of Mexico trials,in terms of fishing mortality changes were used to simulate the ecologicaleffects of the use of BRDs in the upwelling ecosystem off northern Colombia.Positions of the center of BRDs (football-shaped steel fish-eye type, size12.70 cm× 30.48 cm) are indicated by the number of meshes to the outsidetop center and from the star of the bag of a shrimp trawl net. (a) Upper view,(b) lateral view, (c) schematic drawing.
bycatch along the Columbian Caribbean Coast. In all cases,100% compliance and correct use of the BRD by fishermenis assumed. The Ecopath base model (Table 3) was used asa starting point for these simulations. We assume that faunalfunctional setting and responses to fishing gear and BRDs arecomparable between the Gulf of Mexico and the upwellingarea off Colombia.
Simulations were performed using the ECOSIM approach(Walters et al., 1997), which describes the dynamics of eachgroup through the formulation:
dBi
dt= f (Bi) − MoBi − FiBi −
n∑j=1
cij(Bi, Bj) (1)
where f(Bi) is a function of biomassBi if i is a pri-mary producer, orf (Bi) = gi
∑nj=1cij(Bi, Bj) if i is a con-
sumer, wheregi is the net growth efficiency andcij(Bi,Bj)is the function used to predict consumption rates fromBi
to Bj, and represents predator–prey encounter patterns andphysiological–behavioral phenomena in predation rates.Mois the mortality rate not accounted for by predation or fishingand Fi is the fishing mortality rate. The system of Eq.(1)can be integrated withFi varying in time to provide dynamicbiomass predictions for eachi as affected directly by fishing,predation and changes in its food availability and indirectlyby fishing or predation on other groups with whichi interacts.
in thes ownc m-b risks y ofr
ECOSIM assumes that the biomasses of the groupsystem are determined by a mix of bottom–up and top–dontrol with a default vulnerability parameter of 0.3. A nuer of factors affect the vulnerability parameter includingensitive behavior of predators and prey, the availabilitefuge, size of prey and mobility (Christensen et al., 2000).
338 M.I. Criales-Hernandez et al. / Fisheries Research 77 (2006) 333–342
The relative change in industrial fishing mortality appliedto the functional groupi due to the use of BRDs (%fIi) wascalculated by weighing the relative change in fishing mor-tality of the individual species that constitute the functionalgroup by their respective biomasses, viz.,
%fIi =∑n
i=1%fIkBk∑ni=1Bk
(2)
where %fIk is the relative change in industrial fishing mor-tality for speciesk (belonging to functional groupi) in theGulf of Mexico due to the use of BRDs andBk is the esti-mated biomass of speciesk in the upwelling ecosystem offColombia.
For each harvested groupi manipulated in the simulations,Fi was computed as:
Fi = fIi
(1 +
(%fIi
100
))+ fSIi + fAi (3)
wherefIi, fSIi andfAi are fishing mortality rates due to indus-trial, semi-industrial and artisanal fleets, respectively, in theEcopath base model.
Simulations were run for a period of 20 years in orderto assess the long-term impact of introducing BRDs. Wefocused particularly on simulating biomass trajectories ofshrimps, snappers, croakers, groupers/large demersal fishes,rays/sharks and octopus/squids, since they are either amongthose groups most impacted by shrimp trawling in the system,or are of particular economic importance.
5. Results
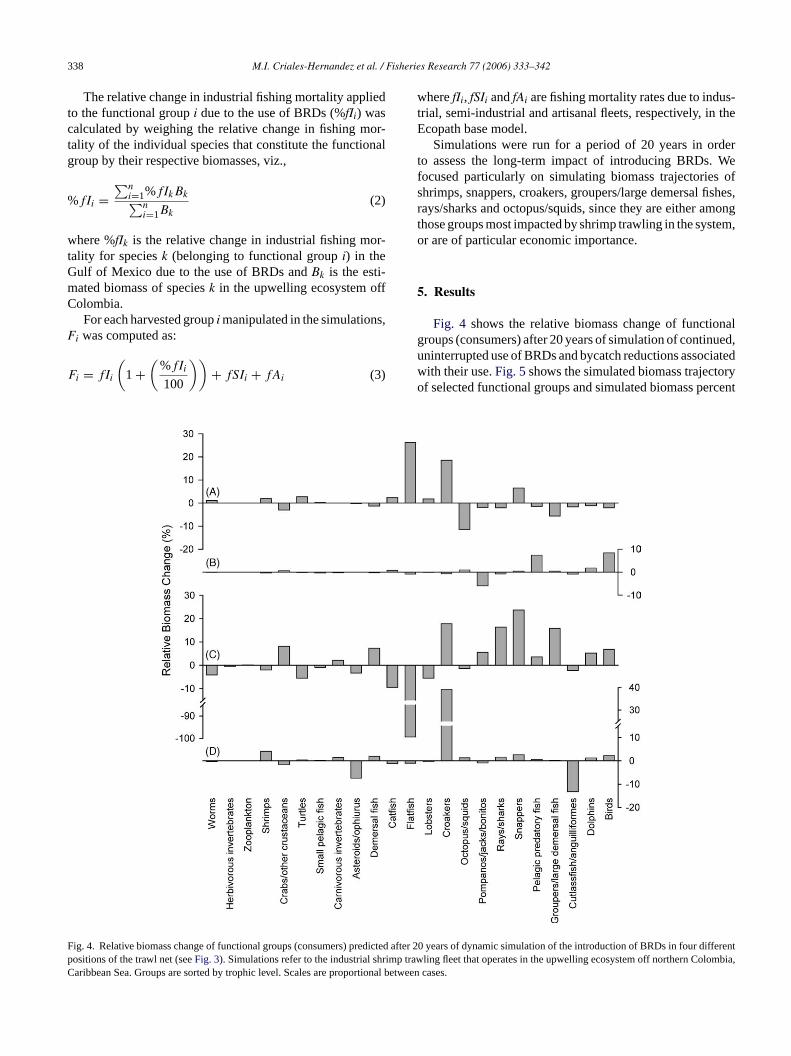
Fig. 4 shows the relative biomass change of functionalgroups (consumers) after 20 years of simulation of continued,uninterrupted use of BRDs and bycatch reductions associatedwith their use.Fig. 5shows the simulated biomass trajectoryof selected functional groups and simulated biomass percent
FpC
ig. 4. Relative biomass change of functional groups (consumers) predictedositions of the trawl net (seeFig. 3). Simulations refer to the industrial shrimparibbean Sea. Groups are sorted by trophic level. Scales are proportional b
after 20 years of dynamic simulation of the introduction of BRDs in four differenttrawling fleet that operates in the upwelling ecosystem off northern Colombia,etween cases.
M.I. Criales-Hernandez et al. / Fisheries Research 77 (2006) 333–342 339
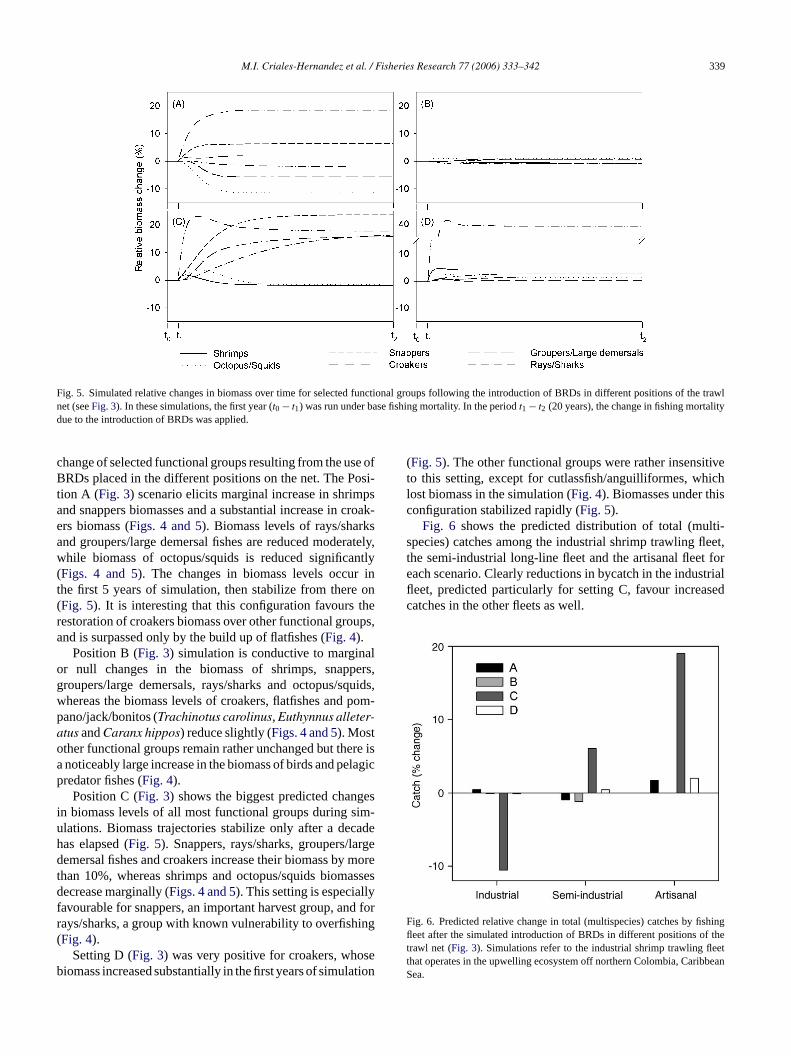
Fig. 5. Simulated relative changes in biomass over time for selected functional groups following the introduction of BRDs in different positions of the trawlnet (seeFig. 3). In these simulations, the first year (t0 − t1) was run under base fishing mortality. In the periodt1 − t2 (20 years), the change in fishing mortalitydue to the introduction of BRDs was applied.
change of selected functional groups resulting from the use ofBRDs placed in the different positions on the net. The Posi-tion A (Fig. 3) scenario elicits marginal increase in shrimpsand snappers biomasses and a substantial increase in croak-ers biomass (Figs. 4 and 5). Biomass levels of rays/sharksand groupers/large demersal fishes are reduced moderately,while biomass of octopus/squids is reduced significantly(Figs. 4 and 5). The changes in biomass levels occur inthe first 5 years of simulation, then stabilize from there on(Fig. 5). It is interesting that this configuration favours therestoration of croakers biomass over other functional groups,and is surpassed only by the build up of flatfishes (Fig. 4).
Position B (Fig. 3) simulation is conductive to marginalor null changes in the biomass of shrimps, snappers,groupers/large demersals, rays/sharks and octopus/squids,whereas the biomass levels of croakers, flatfishes and pom-pano/jack/bonitos (Trachinotus carolinus, Euthynnus alleter-atus andCaranx hippos) reduce slightly (Figs. 4 and 5). Mostother functional groups remain rather unchanged but there isa noticeably large increase in the biomass of birds and pelagicpredator fishes (Fig. 4).
Position C (Fig. 3) shows the biggest predicted changesin biomass levels of all most functional groups during sim-ulations. Biomass trajectories stabilize only after a decadehas elapsed (Fig. 5). Snappers, rays/sharks, groupers/largedemersal fishes and croakers increase their biomass by moret assesd lyf d forr ing(
seb ation
(Fig. 5). The other functional groups were rather insensitiveto this setting, except for cutlassfish/anguilliformes, whichlost biomass in the simulation (Fig. 4). Biomasses under thisconfiguration stabilized rapidly (Fig. 5).
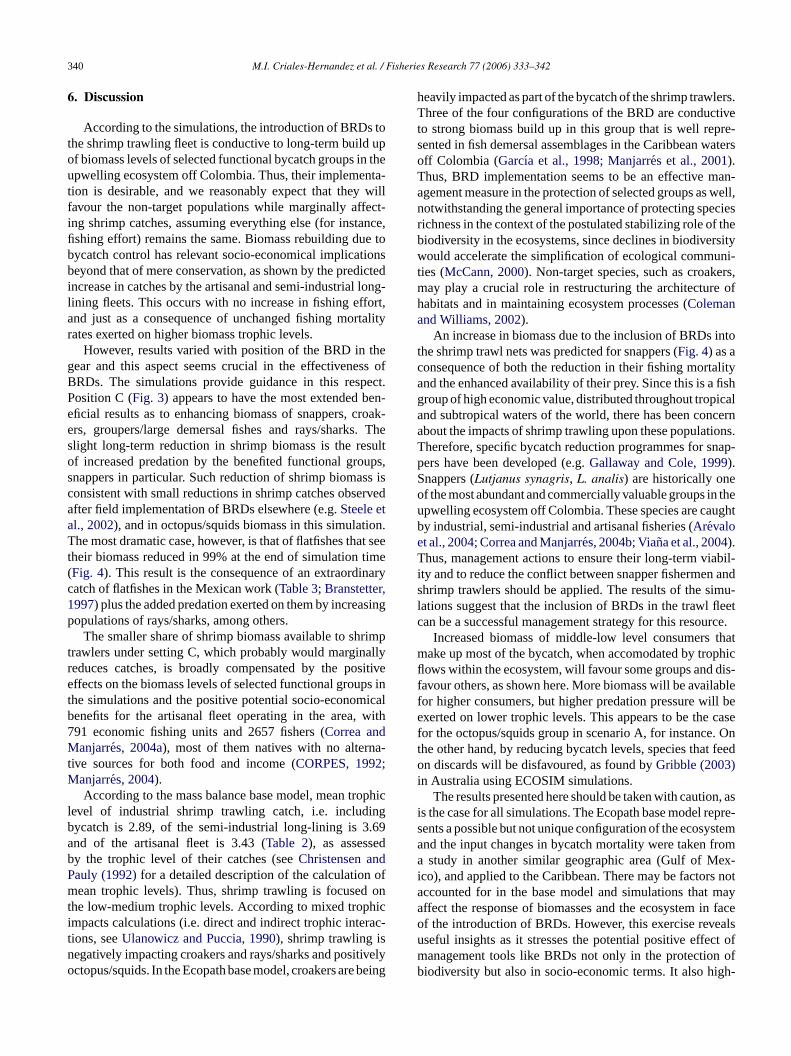
Fig. 6 shows the predicted distribution of total (multi-species) catches among the industrial shrimp trawling fleet,the semi-industrial long-line fleet and the artisanal fleet foreach scenario. Clearly reductions in bycatch in the industrialfleet, predicted particularly for setting C, favour increasedcatches in the other fleets as well.
F shingfl f thet eett beanS
han 10%, whereas shrimps and octopus/squids biomecrease marginally (Figs. 4 and 5). This setting is especial
avourable for snappers, an important harvest group, anays/sharks, a group with known vulnerability to overfishFig. 4).
Setting D (Fig. 3) was very positive for croakers, whoiomass increased substantially in the first years of simul
ig. 6. Predicted relative change in total (multispecies) catches by fieet after the simulated introduction of BRDs in different positions orawl net (Fig. 3). Simulations refer to the industrial shrimp trawling flhat operates in the upwelling ecosystem off northern Colombia, Caribea.
340 M.I. Criales-Hernandez et al. / Fisheries Research 77 (2006) 333–342
6. Discussion
According to the simulations, the introduction of BRDs tothe shrimp trawling fleet is conductive to long-term build upof biomass levels of selected functional bycatch groups in theupwelling ecosystem off Colombia. Thus, their implementa-tion is desirable, and we reasonably expect that they willfavour the non-target populations while marginally affect-ing shrimp catches, assuming everything else (for instance,fishing effort) remains the same. Biomass rebuilding due tobycatch control has relevant socio-economical implicationsbeyond that of mere conservation, as shown by the predictedincrease in catches by the artisanal and semi-industrial long-lining fleets. This occurs with no increase in fishing effort,and just as a consequence of unchanged fishing mortalityrates exerted on higher biomass trophic levels.
However, results varied with position of the BRD in thegear and this aspect seems crucial in the effectiveness ofBRDs. The simulations provide guidance in this respect.Position C (Fig. 3) appears to have the most extended ben-eficial results as to enhancing biomass of snappers, croak-ers, groupers/large demersal fishes and rays/sharks. Theslight long-term reduction in shrimp biomass is the resultof increased predation by the benefited functional groups,snappers in particular. Such reduction of shrimp biomass isconsistent with small reductions in shrimp catches observeda ta ion.T t seet time( naryc ,1 singp
rimpt allyr sitivee ps int icalb with7M a-tM
ophicl ngb .69a db dP ofm ont hici rac-tn tivelyo being
heavily impacted as part of the bycatch of the shrimp trawlers.Three of the four configurations of the BRD are conductiveto strong biomass build up in this group that is well repre-sented in fish demersal assemblages in the Caribbean watersoff Colombia (Garcıa et al., 1998; Manjarres et al., 2001).Thus, BRD implementation seems to be an effective man-agement measure in the protection of selected groups as well,notwithstanding the general importance of protecting speciesrichness in the context of the postulated stabilizing role of thebiodiversity in the ecosystems, since declines in biodiversitywould accelerate the simplification of ecological communi-ties (McCann, 2000). Non-target species, such as croakers,may play a crucial role in restructuring the architecture ofhabitats and in maintaining ecosystem processes (Colemanand Williams, 2002).
An increase in biomass due to the inclusion of BRDs intothe shrimp trawl nets was predicted for snappers (Fig. 4) as aconsequence of both the reduction in their fishing mortalityand the enhanced availability of their prey. Since this is a fishgroup of high economic value, distributed throughout tropicaland subtropical waters of the world, there has been concernabout the impacts of shrimp trawling upon these populations.Therefore, specific bycatch reduction programmes for snap-pers have been developed (e.g.Gallaway and Cole, 1999).Snappers (Lutjanus synagris, L. analis) are historically oneof the most abundant and commercially valuable groups in theu ughtbeT iabil-i n ands imu-l eetc rce.
thatm phicfl dis-f lablef ill bee casef . Ont t feedo )i
on, asi epre-s stema froma ex-i s nota maya n faceo ealsu ct ofm ofb igh-
fter field implementation of BRDs elsewhere (e.g.Steele el., 2002), and in octopus/squids biomass in this simulathe most dramatic case, however, is that of flatfishes tha
heir biomass reduced in 99% at the end of simulationFig. 4). This result is the consequence of an extraordiatch of flatfishes in the Mexican work (Table 3; Branstetter997) plus the added predation exerted on them by increaopulations of rays/sharks, among others.
The smaller share of shrimp biomass available to shrawlers under setting C, which probably would margineduces catches, is broadly compensated by the poffects on the biomass levels of selected functional grou
he simulations and the positive potential socio-economenefits for the artisanal fleet operating in the area,91 economic fishing units and 2657 fishers (Correa andanjarres, 2004a), most of them natives with no altern
ive sources for both food and income (CORPES, 1992;anjarres, 2004).According to the mass balance base model, mean tr
evel of industrial shrimp trawling catch, i.e. includiycatch is 2.89, of the semi-industrial long-lining is 3nd of the artisanal fleet is 3.43 (Table 2), as assessey the trophic level of their catches (seeChristensen anauly (1992)for a detailed description of the calculationean trophic levels). Thus, shrimp trawling is focused
he low-medium trophic levels. According to mixed tropmpacts calculations (i.e. direct and indirect trophic inteions, seeUlanowicz and Puccia, 1990), shrimp trawling isegatively impacting croakers and rays/sharks and posictopus/squids. In the Ecopath base model, croakers are
pwelling ecosystem off Colombia. These species are cay industrial, semi-industrial and artisanal fisheries (Arevalot al., 2004; Correa and Manjarres, 2004b; Viana et al., 2004).hus, management actions to ensure their long-term v
ty and to reduce the conflict between snapper fishermehrimp trawlers should be applied. The results of the sations suggest that the inclusion of BRDs in the trawl flan be a successful management strategy for this resou
Increased biomass of middle-low level consumersake up most of the bycatch, when accomodated by tro
ows within the ecosystem, will favour some groups andavour others, as shown here. More biomass will be avaior higher consumers, but higher predation pressure wxerted on lower trophic levels. This appears to be theor the octopus/squids group in scenario A, for instancehe other hand, by reducing bycatch levels, species than discards will be disfavoured, as found byGribble (2003
n Australia using ECOSIM simulations.The results presented here should be taken with cauti
s the case for all simulations. The Ecopath base model rents a possible but not unique configuration of the ecosynd the input changes in bycatch mortality were takenstudy in another similar geographic area (Gulf of M
co), and applied to the Caribbean. There may be factorccounted for in the base model and simulations thatffect the response of biomasses and the ecosystem if the introduction of BRDs. However, this exercise revseful insights as it stresses the potential positive effeanagement tools like BRDs not only in the protectioniodiversity but also in socio-economic terms. It also h
M.I. Criales-Hernandez et al. / Fisheries Research 77 (2006) 333–342 341
lights the need for careful definition of objectives as to whichfunctional groups should be enhanced or protected with mea-sures like the introduction of BRDs.
Acknowledgements
The authors thank Jairo Altamar, Jorge Viana, FabianEscobar and Julio Mazenet for gathering and processing inputdata. Thanks are also due to Professor Mathias Wolff at ZMT(Center for Tropical Marine Ecology), University of Bremenfor his suggestions to the paper and Dr. Ralf Schwamborn atAlfred Wagener Polar Institute (AWI) and Ph.D. Susan Smithfor editing the text and two anonymous referees for valu-able suggestions to improve an early version of this paper.This work was supported by COLCIENCIAS Grant 3135-09-11245 for the project “Dinamica Espacio Temporal delEcosistema de Afloramiento delArea Bocas de ceniza-PuntaEspada (Caribe colombiano) y sus implicaciones para unregimen de pesca responsable” and by Universidad del Mag-dalena, Instituto Nacional de Pesca y Acuicultura, Universi-dad Nacional and Instituto Colombiano de Desarrollo Rural.L.O. Duarte was partially supported by a Ph.D. scholarshipfrom Deutscher Akademischer Austaush Dient (DAAD).
R
A .,en
694.A . A
Tech.
A ianences,
A iibe de-
Mag-
BUniv.
B andries
C.
C lanc-Ecol.
C osim:bia,
C sys-7 (1),
Correa, F., Manjarres, L., 2004a. Inventario y caracterizacion general delas unidades economicas de pescas artesanales de La Guajira, MarCaribe de Colombia. In: Manjarres, L. (Ed.), Evaluacion de las pes-querıas demersales delarea norte del Caribe colombiano y parametrosbiologico-pesqueros y poblacionales del recurso pargo. Universidaddel Magdalena, Santa Marta, pp. 23–35.
Correa, F., Manjarres, L., 2004b. Recursos demersales explotados por laspesquerıas artesanales marıtimas de La Guajira, Caribe colombiano.In: Manjarres, L. (Ed.), Evaluacion de las pesquerıas demersales delarea norte del Caribe colombiano y parametros biologico-pesquerosy poblacionales del recurso pargo. Universidad del Magdalena, SantaMarta, pp. 77–92.
Consejo Regional de Planificacion de la costa Atlantica (CORPES), 1992.El Caribe colombiano. Realidad Ambiental y Desarrollo. Bogota, 275pp.
Criales-Hernandez, M.I., 2004. Flujos de energıa en el sistema de sur-gencia tropical en la penınsulaa de La Guajira, Caribe colombiano.M.Sc. Thesis. Universidad Nacional de Colombia, Santa Marta.
Cortes, M.L., Criales, M.M., 1990. Analisis del contenido estomacaldel camaron Titi Xiphopenaeus kroyeri (Seller) (Crustacea: Natantia:Penaedea). An. Inst. Invest. Mar y Costeras Punta de Betin 19–20,23–33.
De La Cruz-Aguero, G., 1993. A preliminary model of Mandinga Lagoon,Veracruz, Mexico 193–197. In: Christensen y, V., Pauly, D. (Eds.),Trophic Models of Aquatic Ecosystems. ICLARM Conference Pro-ceedings, vol. 26, 390 pp.
Dıaz, J.M., Barrios, L.M., Gomez, D.I., 2003. Las praderas de pastosmarinos en el Caribe colombiano: Distribucion y estructura de un eco-sistema estrategico. INVEMAR, Publicacion Especial No. 10, SantaMarta, 140 pp.
Duarte, L.O., Garcıa, C.B., Moreno, I., Melo, G., Navajas, P., Sandova,lesl,.
D helfca, anFish.
D es23–
E , I.,
ns
F bean:
G catchsh.
G sem-Sea).
G ofrimp)
. 65,
H Com-
J odelsuppl.
J osys-
K in the
eferences
´ lvarez-Leon, D.L., Aguilera-Quinonez, J., Andrade-Amaya, C.ANowak, P., 1995. Caracterizacion general de la zona de surgenciaLa Guajira colombiana. Rev. Acad. Colomb. Cienc. 19 (75), 679–
lverson, D.L., Freeberg, M.H., Murawski, S.A., Pope, J.G., 1994global assessment of fisheries bycatch and discards. FAO Fish.Pap. 339, 1–233.
ndrade, C.A., 2000. The circulation and variability of the Colombbasin in the Caribbean Sea. Ph.D. Thesis. School of Ocean SciUniversity of Wales, North Wales.
revalo, J., Melo, G., Manjarres, L., 2004. Inventario y caracterizacongeneral de la flota de lanchas “pargueras” de Taganga, Mar CarColombia. In: Manjarres, L. (Ed.), Evaluacion de las pesquerıas demersales delarea norte del Caribe colombiano y parametros biologico-pesqueros y poblacionales del recurso pargo. Universidad deldalena, Santa Marta, pp. 37–44.
itter, R., 1984. Composicion de la dieta deAstropecten marginatus(Echinodermata: Asteroidea). Bol. Inst. Oceanografia VenezuelaOriente 23 (1 y 2), 169–176.
ranstetter, S., 1997. Bycatch and Its Reduction in the Gulf of MexicoSouth Atlantic Shrimp Fisheries. Gulf and South Atlantic FisheDevelopment Foundation, Inc., Tampa, FL, 27 pp.
abrera, E., Donoso, M.C., 1993. Estudio de las caracterısticasoceanograficas del Caribe colombiano Region III, Zona 1, PDCTMBol. Cient. CIOH 13, 19–32.
hristensen, V., Pauly, D., 1992. Ecopath II: a software for baing steady-state models and calculating network characteristics.Model. 61, 169–185.
hristensen, V., Walters, C.J., Pauly, D., 2000. Ecopath with EcA User’s Guide. Fisheries Centre, University of British ColumVancouver, Canada and ICLARM, Penang, Malaysia, 130 pp.
oleman, F.C., Williams, S.L., 2002. Overexploiting marine ecotem engineers: potential consequences of biodiversity. TREE 140–44.
N., Von Schiller, D., 1999. Atlas demografico de los peces demersadel Golfo de Salamanca, Caribe colombiano. Dinamica poblacionadistribucion alimentacion y reproduccion. In: Libro digital. CD-ROMInvemar, Colciencias, Santa Marta, ISBN 95950-6-5.
uarte, L.O., Garcıa, C.B., 2002. Testing responses of a tropical secosystem to fisheries management strategies. Gulf of Salamanartisanal fishery example from the Colombian Caribbean Sea.Cen. Res. Rep. 10 (2), 142–149.
uarte, L.O., Garcıa, C.B., 2004. Trophic role of small pelagic fishin a tropical upwelling ecosystem. Ecol. Model. 172 (2–4), 3338.
ngaas, A., Foster, D., Hataway, B.D., Watson, J.W., Workman1999. The behavioural response of juvenile red snapper (Lutjanuscampechanus) to shrimp trawls that utilize water flow modificatioto induce escapement. Mar. Technol. Soc. J. 33 (2), 43–50.
AO, 1996. Fisheries and aquaculture in Latin America and Caribsituation and outlook in 1996. FAO Fish. Circ. 921, 1–2.
allaway, B., Cole, J.G., 1999. Reduction of juvenile red snapper byin the U.S. Gulf of Mexico shrimp trawl fishery. N. Am. J. FiManage. 19, 342–355.
arcıa, C.B., Duarte, L.O., von Schiller, D., 1998. Demersal fish asblages of the Gulf of Salamanca, Colombia (Southern CaribbeanMar. Ecol. Prog. Ser. 174, 13–25.
ribble, N.A., 2003. GRB-prawn: modelling ecosystem impactschanges in fisheries management of the commercial prawn (shtrawl fishery in the far northern Great Barrier Reef. Fish. Res493–506.
all, S.J., 1999. The Effects of Fishing on Marine Ecosystems andmunities. Blackwell Science, London.
arre-Teichmann, A., 1998. The potential role of mass balance mfor the management of upwelling ecosystems. Ecol. Appl. 8 (S1), 93–103.
ennings, S., Kaiser, M.J., 1998. The effects of fishing on marine ectems. Adv. Mar. Biol. 34, 201–352.
ennelly, S.J., Broadhurst, M.J., 2002. Bay-catch begone: changesphilosophy of fishing technology. Fish Fish. 3, 340–355.
342 M.I. Criales-Hernandez et al. / Fisheries Research 77 (2006) 333–342
Manjarres, L.M. (Ed.), 2004. Evaluacion de las pesquerıas demersalesdel area norte del Mar Caribe de Colombia y parametros biologico-pesqueros y poblacionales del recurso pargo. Universidad del Mag-dalena, Santa Marta, p. 318.
Manjarres, L., Garcıa, C.B., Acero, A., 2001. Caracterizacion ecologicade las asociaciones de peces demersales del Caribe colombiano nortecon enfasis en pargos (Lutjanidae). Bol. Inst. Inv. Mar. 30, 77–107.
McCann, K.S., 2000. The diversity–stability debate. Nature 405, 228–233.Mendoza, J., 1993. A preliminary biomass budget for the Northeast-
ern Venezuela shelf ecosystem. In: Christensen, V., Pauly, D. (Eds.),Trophic Models of Aquatic Ecosystems. ICLARM Conference Pro-ceedings, vol. 26, pp. 285–297.
Muller-Karger, F.E., Aparicio, R., 1994. Mesoscale proceses affectingphytoplankton abundance in the Southeastern Caribbean Sea. Cont.Shelf. Res. 14 (2–3), 199–221.
Opitz, S., 1996. Trophic interactions in Caribbean coral reefs. ICLARM.Tech Rep. 43, 341.
Pauly, D., Christensen, V., Guenette, S., Pitcher, T.J., Sumaila, U.S., Wal-ters, C.J., Watson, R., Zeller, D., 2002. Towards sustainability in worldfisheries. Nature 418, 689–695.
Penchaszadeh, P.E., Lera, M.E., 1983. Alimentacion de tres especiestropicales deLuidia (Echinodermata, Asteroidea) en Golfo Triste,Venezuela. Carb. J. Sci. 19, 1–2.
Pitcher, T., 2001. Fisheries managed to rebuild ecosystems. Reconstruct-ing the past to salvage the future. Ecol. Appl. 11 (2), 601–617.
Rogers, D.R., Rogers, B.D., de Silva, J.A., Wright, V.L., Watson, J.W.,1997. Evaluation of shrimp trawls equipped with bycatch reductiondevices in inshore waters of Louisiana. Fish. Res. 33, 55–72.
Sedberry, G.R., Cuellar, N., 1993. Planktonic and benthic feeding by thereef-associated vermilion snapper,Rhomboplites aurorubens (TeleosteiLutjanidae). Fish. Bull. 91, 699–709.
Shannon, L.J., Moloney, C.L., Jarre, A., Field, J.G., 2003. Trophic flowsin the southern Benguela during the 1980s and 1990s. J. Mar. Syst.39, 83–116.
Sierra, L.M., Claro, R., Popota, O.A., 1994. Alimentacion y relacionestroficas. In: Claro, R. (Ed.), Ecologıa de los Peces Marinos de Cuba.Instituto de Oceanologıa Academia de Ciencias de Cuba and Centrode Investigaciones de Quintana Roo. Mexico, pp. 263–284.
Steele, P., Bert, T.M., Johnson, K.H., Levett, S., 2002. Efficiency ofbycatch reduction devices in small otter trawls used in the Floridashrimp fishery. Fish. Bull. 100, 338–350.
Ulanowicz, R.E., Puccia, C.J., 1990. Mixed trophic impacts in ecosystems.Coenoses 5, 7–16.
Viana, J., Manjarres, L., Rodrıguez, G., Galvis, R., 1999. Analisis de losresultados de las campanas acusticas de evaluacion de peces pelagicospequenos en el Caribe colombiano-INPA-VECEP/UE/PELAG/97–98.
Viana, J., Medina, A., Barros, M., Manjarres, L., Altamar, J., Solano,M., 2004. Evaluacion de la ictiofauna demersal extraıda por lapesquerıa industrial de arrastre en elarea norte del Caribe colom-biano (enero/2000–junio/2001). In: Manjarres, L. (Ed.), Evaluacionde las pesquerıas demersales delarea norte del Caribe colombianoy parametros biologico-pesqueros y poblacionales del recurso pargo.Universidad del Magdalena, Santa Marta, pp. 115–151.
Walters, C., Christensen, V., Pauly, D., 1997. Structuring dynamic modelsof exploited ecosystems from trophic mass-balance assessments. Rev.Fish Biol. Fish. 7, 139–172.