ecg signal processing using dsk tms320c6713 - iosrjen
TRANSCRIPT
IOSR Journal of Engineering (IOSRJEN)
e-ISSN: 2250-3021, p-ISSN: 2278-8719, www.iosrjen.org Volume 2, Issue 10 (October 2012), PP 24-43
www.iosrjen.org 24 | P a g e
ECG Signal Processing Using DSK TMS320C6713
Indu Udai 1, Lekshmi P R
1, Sherin K Mathews
1, Tinu Maria Daie
1, Manu T S
2
1UG Scholars, Dept of Electronics and Communication Engineering, TKM Institute of Technology, Kollam,
affiliated to Cochin University of Science and Technology, Kerala, India. 2Asst. Professor, Dept. of Electronics and Communication Engineering, TKM Institute of Technology, Kollam,
affiliated to Cochin University of Science and Technology, Kerala, India.
Abstract–Electrocardiogram (ECG) is widely used for diagnosis of heart diseases. Good quality ECG is utilized
by physicians for interpretation and identification of physiological and pathological phenomena. However, in
real time, ECG recordings are often corrupted by noises and their presence can only be revealed after the
applications of appropriate signal processing tools. Dominant artifacts present in ECG recordings are high-
frequency noises caused by electromyogram induced noise, power line interferences, or mechanical forces
acting on the electrodes and baseline wander that may be due to respiration or the motion of the patients or the
instruments. These artifacts severely limit the utility of recorded ECGs and thus need to be removed for better
clinical evaluation. Various algorithms are available for ECG signal processing of which we adopt Pan-Tompkins algorithm, build in MATLAB. Further implementation can be done using Texas Instrument`s one of the
most powerful processors, TMS320C6713 DSK that offers fast computation capability.
Keywords - CC Studio, DSP, FDA tool, MATLAB, TMS320C6713 DSK
I. INTRODUCTION In recent years, ECG signal plays an important role in the primary diagnosis, prognosis and survival
analysis of heart diseases. The ECG signal contains an important amount of information that can be exploited in
different manners. It allows for the analysis of anatomic and physiologic aspects of the whole cardiac muscle.
However when an electrocardiogram is recorded, many kinds of noises are record. Noises in ECG include:
a) Baseline wandering, caused by the low pass noise
b) 50 Hz or 60 Hz power line interference
c) Electromyogram (EMG), which is an electrical signal caused by the muscle motion
d) Motion artifact, which comes from the variation of electrode – skin contact impedance produced by
electrode movement.
When ECG signal medical analysis is considered, the slight variations occurring due to these noises are
neglected. But these noises can make clinical diagnosis very difficult in the case of automated machines. For
automated machines the baseline must be clearly defined. So it is important to get ECG parameters without the
noise. The ECG signals being non-stationary in nature, it is very difficult to visually analyze them. Thus the need is there for computer based methods for ECG signal analysis. This unwanted information has to be
removed by a process known as denoising. In this project ECG signal denoising as well as detection is done by
using a DSP processor. The objective of ECG signal processing is manifold and comprises the improvement of
measurement accuracy and reproducibility (when compared with manual measurements) and the extraction of
information not readily available from the signal through visual assessment.
DSP techniques have been very successful because of the development of low-cost software and
hardware support. DSP processors are concerned primarily with real time signal processing. Real-time
processing requires the processing to keep pace with some external event, whereas non-real-time processing has
no such timing constraint. The external event to keep pace with is usually the analog input. Whereas analog-
based systems with discrete electronic components such as resistors can be more sensitive to temperature
changes, causing vital part losses. DSP-based systems are less affected by environmental conditions. Also, working of analog components under high frequency is unpredictable. As the DSP processors are designed and
optimized for implementation of various DSP algorithms, most processors share various common features to
support the high performance, repetitive, numeric intensive tasks.
The common features of DSP processors involves MACs and multiple execution units which is the
ability to perform one or more multiply-accumulate operation in a single instruction cycle, efficient memory
access, circular buffering which is used to store the most recent values of a continually updated signal, dedicated
address generation unit which speed up the performance of the arithmetic processing on DSP, specialized
instruction sets etc. Efficient memory capability involves the ability to complete several accesses to memory in a
Ecg Signal Processing Using Dsk Tms320c6713
www.iosrjen.org 25 | P a g e
single instruction cycle. Due to Harvard architecture in DSPs, i.e. physically separate storage and signal
pathways for instructions and data, and pipelined structure, the processor is able to fetch an instruction while
simultaneously fetching operands and/or storing the result of previous instruction to memory. DSP processors
utilize VLIW architectures, so that multiple instructions are issued and executed per cycle. Advantages of DSP‟s over analog Circuits are:
• Can implement complex linear or nonlinear algorithms.
• Can modify easily by changing software.
• Reduced parts count makes fabrication easier.
• High reliability
II. Electrocardiogram 2.1 Introduction
The heart, located in the mediastinum, is the central structure of the cardiovascular system. It is protected by the bony structures of the sternum anteriorly, the spinal column posteriorly, and the rib cage.
Sinoatrial (SA) node is the dominant pacemaker of the heart, located in upper portion of right atrium.
Atrioventricular (AV) node is a part of AV junctional tissue. It slows conduction, creating a slight delay before
impulses reach ventricles. ECG provides information regarding the state of heart. The most important job in
denoising the ECG is to extract the valid cardiac components and reject the rest of the background noise. The
process of extracting the required components while rejecting the background noise is called „Enhancement of
ECG signal‟.
2.2 ECG Signal Characteristics
ECG is a nearly periodic signal that reflects the activity of the heart. A lot of information on the normal
and pathological physiology of heart can be obtained from ECG.
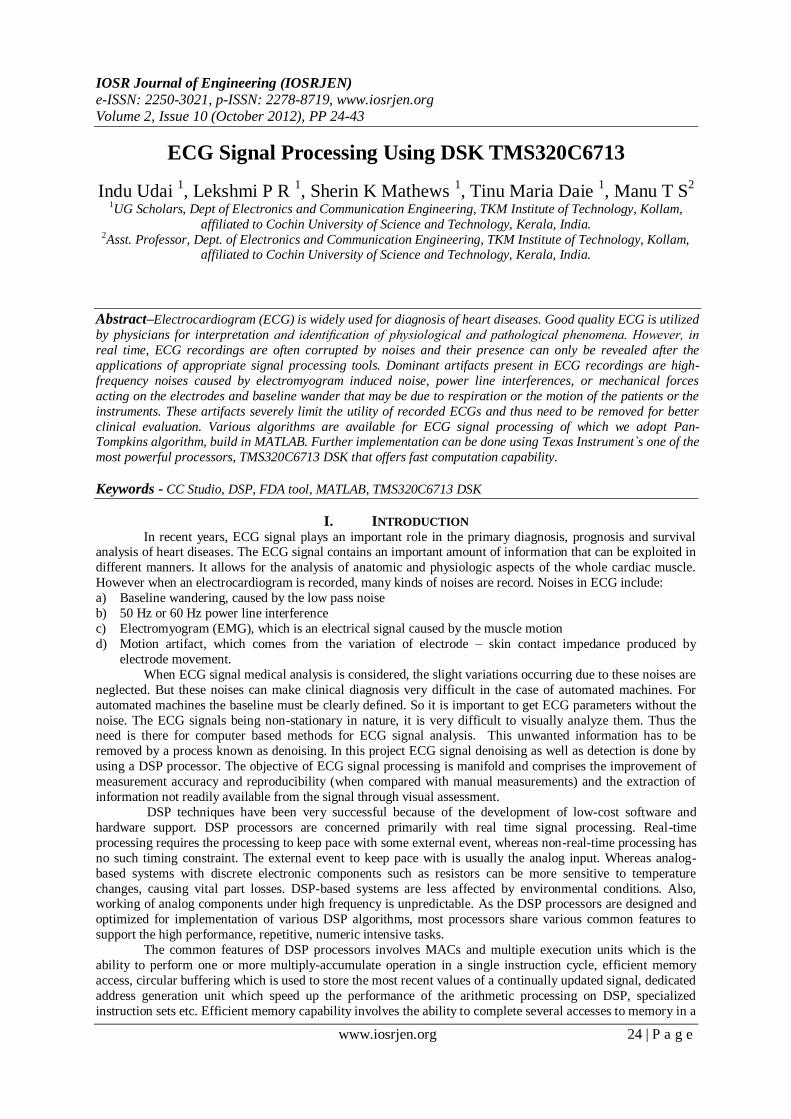
Fig.1.Normal ECG signal and various components.
The ECG signal is represented as PQRST waveform as seen in Fig.1. The first phase of cardiac muscle
activation is the stimulation of the right and left atria by an electrical signal generated from SA node. The
depolarization of atria appears as the P-wave on the ECG waveform. The electrical signal generated, originally
generated by the SA node, then spreads through the Atrioventricular (AV) node, the bundle of HIS, and the
Purkinje fibers to finally reach and stimulate the ventricles. The spread of electrical signal through ventricles
causes ventricular contraction.
Each cardiac cell is surrounded by and filled with solutions of Sodium (Na+), Potassium (K+), and
Calcium (Ca++). The interior of the cell membrane is considered to be negative with respect to outside during
resting conditions. When an electric impulse is generated in the heart, the interior part becomes positive with
respect to the exterior. This change of polarity is called depolarization. After depolarization the cell comes back
to its original state. This phenomenon is called repolarization. The ECG records the electrical signal of the heart and its properties are mentioned in Fig.1.The following is the description and significance of each deflection in
ECG:
P- Wave indicates atrial depolarization (contraction).
PR- Interval measures time during which a depolarization wave travels from the atria to the ventricles.
QRS- Interval includes three deflections following P wave which indicates ventricular depolarization (and
contraction). Q wave is the first negative deflection while R wave is the first positive deflection. S wave
indicates the first negative deflection after R wave.
ST- Segment measures the time between ventricular depolarization and beginning of repolarization.
T- Wave represents ventricular repolarization.
QT- Interval represents total ventricular activity.
Ecg Signal Processing Using Dsk Tms320c6713
www.iosrjen.org 26 | P a g e
ECG Properties
Mechanical
actions
Associated
wave
Wave frequency
(Hz)
Auricular
depolarization
P wave 10
Depolarization
of the ventricle
QRS
complex
20 – 50
Repolarisation of the ventricles
T wave 5
Repolarisation of the auricles Hidden wave
ECG analysis is an important method for monitoring patients. However, the efficiency of diagnosis
relies heavily upon accurate analysis of the signal. But the ECG signal that we obtain for analysis is not free
from noise. Transmission of ECG often results in the corruption of signal due to introduction of noise. Various
factors responsible for introduction of noise include poor channel conditions, baseline wander (caused by
respiration), 50 or 60 Hz power line interference etc. Analyzing such a noisy signal is bound to give erroneous
results.
2.3 Noises in ECG signal
i. Baseline wander
Removal of baseline wander is required in order to minimize changes in beat morphology that do not have cardiac origin, which is especially important when subtle changes in the „„low-frequency‟‟ ST segment are
analyzed for the diagnosis of ischemia, which may be observed, for example, during the course of a stress test.
The frequency content of baseline wander is usually in the range below 0.5 Hz; however, increased movement
of the body during the latter stages of a stress test further increases the frequency content of baseline wander.
ii. Powerline Interference
Electromagnetic fields caused by a powerline represent a common significant noise source in the ECG
that is characterized by 50 or 60 Hz sinusoidal interference, possibly accompanied by a number of harmonics.
Such narrowband noise renders the analysis and interpretation of the ECG more difficult, as the delineation of
low-amplitude waveforms becomes unreliable and spurious waveforms may be introduced. Although various
precautions can be taken to reduce the effect of PLI, for example, by selecting a recording location with few surrounding electrical devices or by appropriately shielding and grounding the location, it may still be necessary
to perform signal processing to remove such interference.
iii.Electrode Contact Noise
It is transient interference caused by loss of contact between the electrode and skin, which effectively
disconnects the measurement system.
iv.Motion Artifacts
Motion artifacts are transient baseline changes caused by changes in electrode-skin impedance with
electrode motion. The shape of base disturbance caused by motion artifacts can be assumed to be a biphasic
signal resembling one cycle of a sine wave.
v.Muscle contraction( EMG)
The baseline electromyogram is usually in microvolt range and therefore is usually insignificant.
vi. Noise generated by electronic devices used in signal processing
Artifacts generated by electronic devices in instrumentation system cannot be corrected by a QRS
detection algorithm. The input amplifiers get saturated and no information about ECG can reach the detector. In
this case an alarm must sound to alert the ECG technician to take corrective action.
However, the ECG signals being non-stationary in nature, it is very difficult to visually analyze them.
Thus the need is there for computer based methods for ECG signal analysis. Physiological signals like ECG are
considered to be quasi-periodic in nature. They are of finite duration and non stationary. Hence, a technique like
Fourier series (based on sinusoids of infinite duration) is inefficient for ECG. The filtering techniques are primarily used for preprocessing of the signal and have as such been implemented in a wide variety of systems
for ECG analysis. It should be remembered that filtering of the ECG is contextual and should be performed only
when the desired information remains undistorted.
Ecg Signal Processing Using Dsk Tms320c6713
www.iosrjen.org 27 | P a g e
III. Block Diagram And Algorithm 3.1 Introduction
Today signal processing is performed in the vast majority of systems for ECG analysis and
interpretation. Various contributions have been made in literature regarding beat detection of ECG .Most of
these use frequency or time domain representation of ECG signals. But the major problem faced by the coders is
the vast variations in the morphologies of ECG signals. Moreover, we have to consider the time constraints as
well. Thus our basic objective is to come up with a simple method having less computational time without
compromising with the efficiency.
3.2 Block Diagram
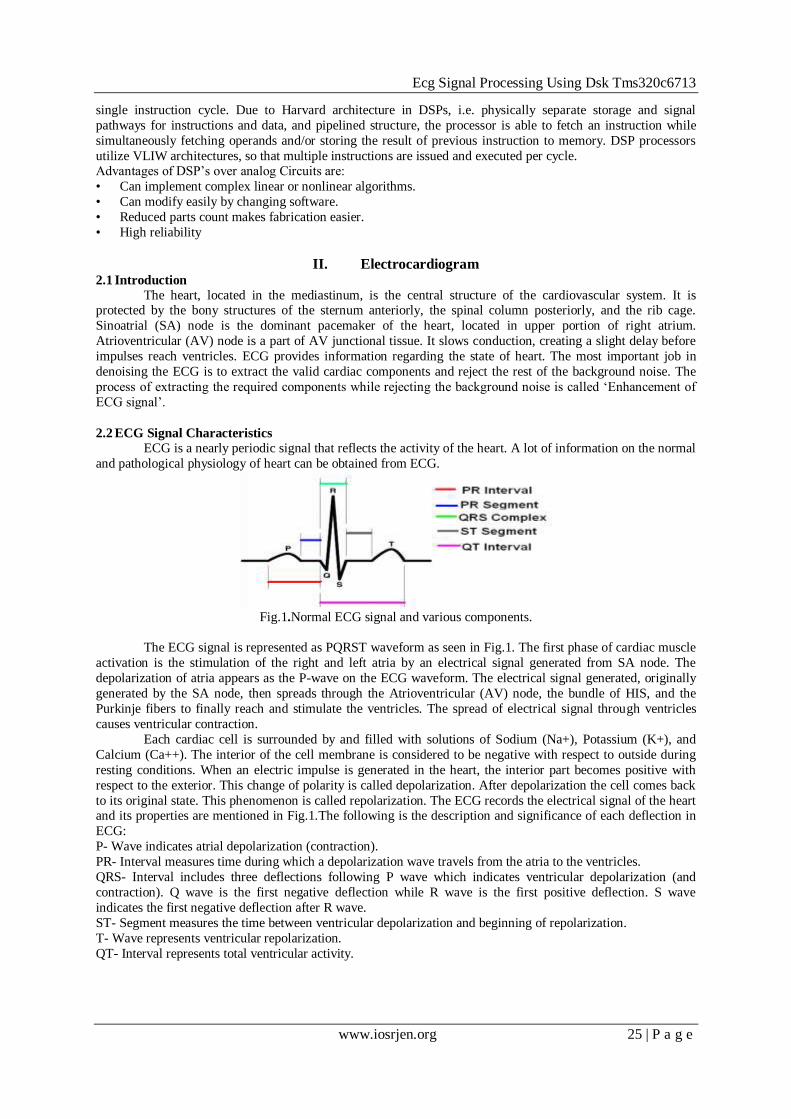
Typical applications using DSP techniques require at least the basic system shown in Fig 2 consisting
of analog input and output. Along the input path is an antialiasing filter for eliminating frequencies above the
Nyquist frequency, defined as one-half of the sampling frequency F. Otherwise, aliasing occurs, in which case a signal with a frequency higher than one-half F is disguised as a signal with a lower frequency. The sampling
theorem tells us that the sampling frequency must be at least twice the highest-frequency component f in a
signal, so that:
Fs > 2f (1)
which is also:
(1/TS) > 2(1/T) (2)
where T is the sampling period, or:
TS < T/2 (3)
Fig.2. DSP system with input and output
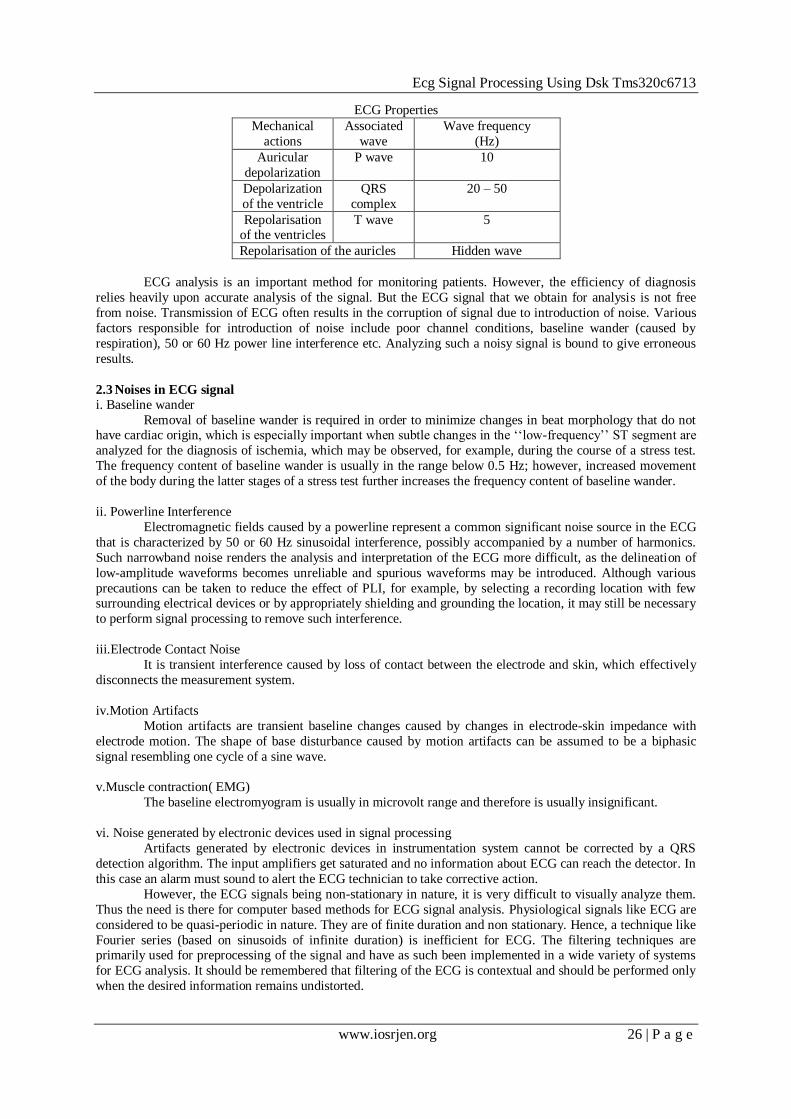
For real time ECG analysis, ECG signal is initially given to an ADC followed by a DSP. DSP is enabled by programs loaded from MATLAB and CC STUDIO. The digital output is given to a DAC to get
analog out as shown below in Fig.3.
Fig.3. General ECG processing diagram with TMS320C6713 DSK
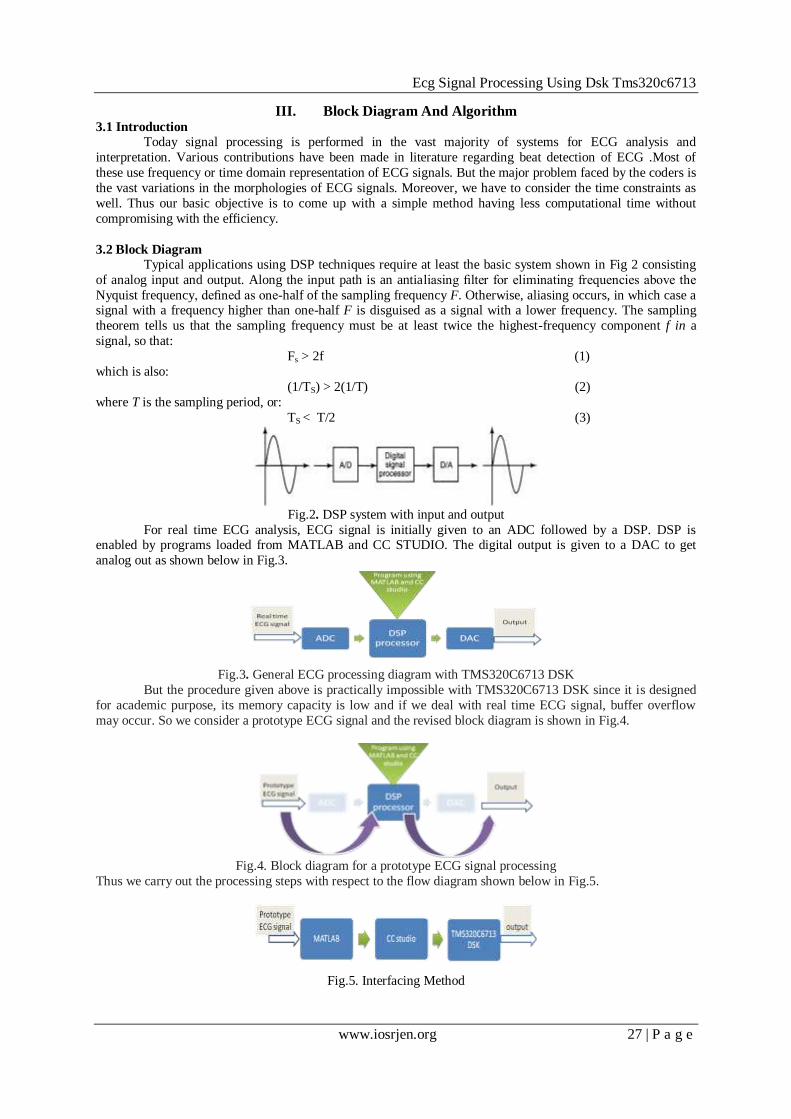
But the procedure given above is practically impossible with TMS320C6713 DSK since it is designed
for academic purpose, its memory capacity is low and if we deal with real time ECG signal, buffer overflow
may occur. So we consider a prototype ECG signal and the revised block diagram is shown in Fig.4.
Fig.4. Block diagram for a prototype ECG signal processing
Thus we carry out the processing steps with respect to the flow diagram shown below in Fig.5.
Fig.5. Interfacing Method
Ecg Signal Processing Using Dsk Tms320c6713
www.iosrjen.org 28 | P a g e
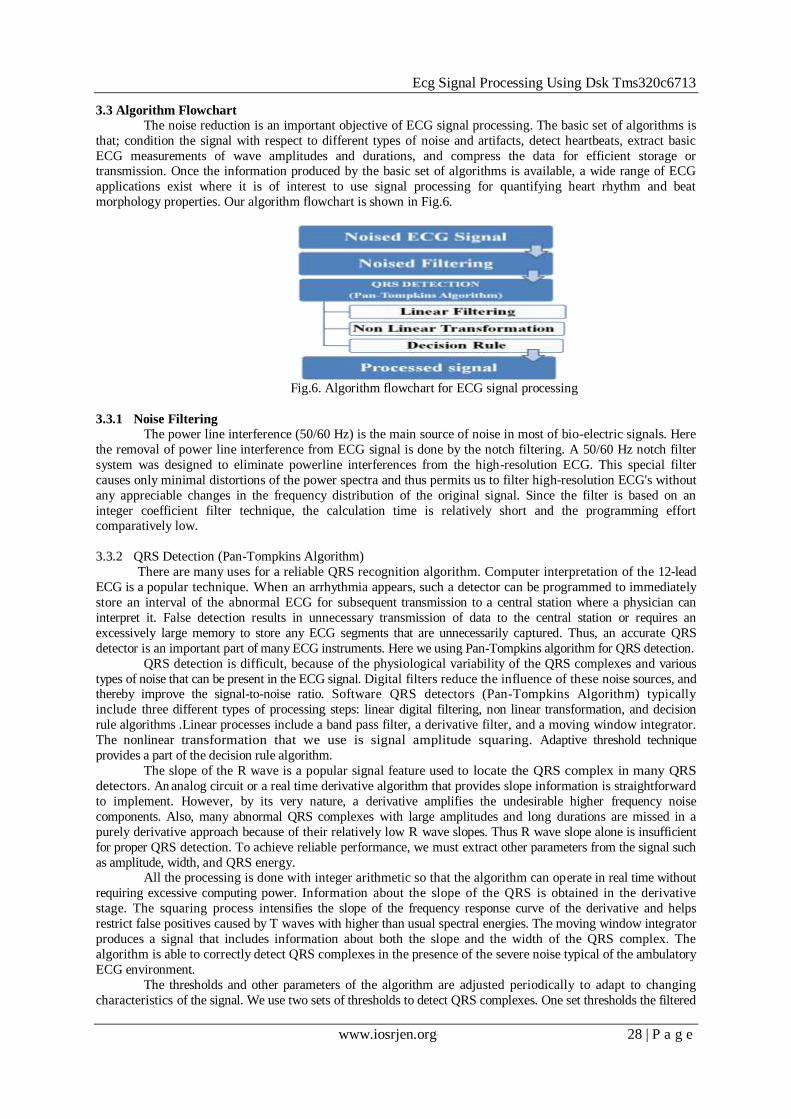
3.3 Algorithm Flowchart
The noise reduction is an important objective of ECG signal processing. The basic set of algorithms is
that; condition the signal with respect to different types of noise and artifacts, detect heartbeats, extract basic
ECG measurements of wave amplitudes and durations, and compress the data for efficient storage or transmission. Once the information produced by the basic set of algorithms is available, a wide range of ECG
applications exist where it is of interest to use signal processing for quantifying heart rhythm and beat
morphology properties. Our algorithm flowchart is shown in Fig.6.
Fig.6. Algorithm flowchart for ECG signal processing
3.3.1 Noise Filtering
The power line interference (50/60 Hz) is the main source of noise in most of bio-electric signals. Here
the removal of power line interference from ECG signal is done by the notch filtering. A 50/60 Hz notch filter
system was designed to eliminate powerline interferences from the high-resolution ECG. This special filter
causes only minimal distortions of the power spectra and thus permits us to filter high-resolution ECG's without
any appreciable changes in the frequency distribution of the original signal. Since the filter is based on an
integer coefficient filter technique, the calculation time is relatively short and the programming effort comparatively low.
3.3.2 QRS Detection (Pan-Tompkins Algorithm)
There are many uses for a reliable QRS recognition algorithm. Computer interpretation of the 12-lead
ECG is a popular technique. When an arrhythmia appears, such a detector can be programmed to immediately
store an interval of the abnormal ECG for subsequent transmission to a central station where a physician can
interpret it. False detection results in unnecessary transmission of data to the central station or requires an
excessively large memory to store any ECG segments that are unnecessarily captured. Thus, an accurate QRS
detector is an important part of many ECG instruments. Here we using Pan-Tompkins algorithm for QRS detection.
QRS detection is difficult, because of the physiological variability of the QRS complexes and various
types of noise that can be present in the ECG signal. Digital filters reduce the influence of these noise sources, and thereby improve the signal-to-noise ratio. Software QRS detectors (Pan-Tompkins Algorithm) typically
include three different types of processing steps: linear digital filtering, non linear transformation, and decision
rule algorithms .Linear processes include a band pass filter, a derivative filter, and a moving window integrator.
The nonlinear transformation that we use is signal amplitude squaring. Adaptive threshold technique
provides a part of the decision rule algorithm.
The slope of the R wave is a popular signal feature used to locate the QRS complex in many QRS
detectors. An analog circuit or a real time derivative algorithm that provides slope information is straightforward
to implement. However, by its very nature, a derivative amplifies the undesirable higher frequency noise
components. Also, many abnormal QRS complexes with large amplitudes and long durations are missed in a
purely derivative approach because of their relatively low R wave slopes. Thus R wave slope alone is insufficient
for proper QRS detection. To achieve reliable performance, we must extract other parameters from the signal such
as amplitude, width, and QRS energy. All the processing is done with integer arithmetic so that the algorithm can operate in real time without
requiring excessive computing power. Information about the slope of the QRS is obtained in the derivative
stage. The squaring process intensifies the slope of the frequency response curve of the derivative and helps
restrict false positives caused by T waves with higher than usual spectral energies. The moving window integrator
produces a signal that includes information about both the slope and the width of the QRS complex. The
algorithm is able to correctly detect QRS complexes in the presence of the severe noise typical of the ambulatory
ECG environment.
The thresholds and other parameters of the algorithm are adjusted periodically to adapt to changing
characteristics of the signal. We use two sets of thresholds to detect QRS complexes. One set thresholds the filtered
Ecg Signal Processing Using Dsk Tms320c6713
www.iosrjen.org 29 | P a g e
ECG and other set thresholds the signal produced by moving window integrator. Preprocessing the ECG with
digital band pass filter improves the signal-to-noise ratio and permits the use of lower thresholds than would be
possible on the unfiltered ECG. This increases the overall detection sensitivity. The detection thresholds float
over the noise that is sensed by the algorithm. This approach reduces the number of false positives caused by types of noise that mimic the characteristics of the QRS complex.
Once a valid QRS complex is recognized, there is a 200 ms refractory period before the next one can
be detected since QRS complexes cannot occur more closely than this physiologically. This refractory period
eliminates the possibility of a false detection such as multiple triggering on the same QRS complex during
this time interval. When a QRS detection occurs following the end of the refractory period but within 360 ms
of the previous complex, we must determine if it is a valid QRS complex or a T wave. In this case, we judge
the waveform with the largest slope to be the QRS complex.
i. Linear filtering
First is an integer coefficient band pass filter composed of cascaded low-pass and high-pass filters. Its
function is noise rejection. The other linear filters required for this algorithm are derivative filter and moving window integrator.
a) Band pass filter
The band pass filter for the QRS detection algorithm reduces noise in the ECG signal by matching the
spectrum of the average QRS complex while attenuating lower and higher frequencies. It is a linear digital
filtering process which increases signal to noise ratio. Thus, it attenuates noise due to muscle noise, 60-Hz
interference, baseline wander, and T-wave interference. The pass band that maximizes the QRS energy is
approximately in the 5–15 Hz range. The filter implemented in this algorithm is a recursive integer filter in
which poles are located to cancel the zeros on the unit circle of the z plane. This class of filters having poles and
zeros only on the unit circle permits limited pass band design flexibility.
i. Low-pass filter
The transfer function of the second-order low-pass filter is:
H (z) = (1 – z-6)2 / (1 – z-1)2 (4)
The difference equation of this filter is: y(nT) = 2y(nT – T) – y(nT – 2T) + x(nT) – 2x(nT – 6T) + x(nT – 12T) (5)
The cutoff frequency is about 11 Hz, the delay is five samples (or 25 ms for a sampling rate of 200 sps),
and the gain is 36. The filter processing delay is six samples. In order to avoid saturation, the output is divided by
32, the closest integer value to the gain of 36 that can be implemented with binary shift arithmetic.
ii. High Pass filter
The high-pass filter is implemented by subtracting a first order Low-pass filter from an all-pass filter with delay.
The low cutoff frequency of this filter is about 5 Hz. The low-pass filter is an Integer-coefficient filter with the
transfer function:
Hlp (z) =Y(z)/X(z) =(1 – z–32)/(1 – z–1) (6)
and the difference equation:
y(nT) = y(nT – T) + x(nT) – x(nT – 32T) (7) This filter has a dc gain of 32 and a delay of 15.5 samples. The high-pass filter is obtained by dividing
the output of the low-pass filter by its dc gain and then subtracting from the original signal.
The transfer function of the high-pass filter is:
Hhp (z) =P (z)/X (z) = z-16 – (Hlp (z)/32) (8)
The difference equation for this filter is:
p(nT) = x(nT – 16T) –1/32[ y(nT – T) + x(nT) – x(nT – 32T) ] (9)
b) Derivative filter
After the signal has been filtered, it is then differentiated to provide information about the slope of the QRS
complex. It is also a linear filtering process. A five-point derivative has the transfer function:
H(z ) = 0.1 (2 + z -1 – z-3 – 2z-4 ) (10)
This derivative is implemented with the difference equation: y(nT) =[2x(nT) + x(nT – T) – x(nT – 3T) – 2x(nT – 4T)] /8 (11) The fraction 1/8 is an approximation of the actual gain of 0.1. Throughout these filter designs; we
approximate parameters with power-of-two values to facilitate real-time operation. This derivative approximates
the ideal derivative in the dc through 30-Hz frequency range. The derivative has a filter delay of 2T (or 10 ms).
The amplitude response approximates that of a true derivative up to about 20 Hz. This is the important
frequency range since all higher frequencies are significantly attenuated by the band pass filter. Note that P and
T waves are further attenuated while the peak-to-peak signal corresponding to the QRS complex is further
enhanced.
Ecg Signal Processing Using Dsk Tms320c6713
www.iosrjen.org 30 | P a g e
c) Moving Window Integration
The purpose of moving-window integration is to obtain waveform feature information in addition to the slope of the
R wave. It is calculated from:
y(nT) = (l/N) [x(nT-(N - l)T)+x(nT- (N-2)T)+ x(nT)] (12) where, N is the number of samples in the width of the integration window.
This MWI is carried out after non linear transformation that is squaring. The number of samples N in the
moving window is important. Generally, the width of the window should be approximately the same as the
widest possible QRS complex. If the window is too wide, the integration waveform will merge the QRS and T
complexes together. If it is too narrow, some QRS complexes will produce several peaks in the integration
waveform. These can cause difficulty in subsequent QRS detection processes. The width of the window is
determined empirically. Here the window is 30 samples wide (150 ms).
That is:
y (n) = (1/30) (x[n] +x [n-1] +x [n-2]+ x [n-29]) (13)
i.Non linear transformation
The squaring function that the signal now passes through is a nonlinear operation which enhances the QRS complex in relation to the background noise .The equation that implements this operation is:
y(nT) = [x(nT)]2 (14)
This operation makes all data points in the processed signal positive, and it amplifies the output
derivative process nonlinearly. It emphasizes the higher frequencies in the signal, which are mainly due to the
QRS complex. A fact to note in this operation is that the output of this stage should band limited to a certain
maximum level corresponding to the number of bits used to represent the data type of the signal. This is a
memory less operation.
ii. Thresholding
The set of thresholds that Pan and Tompkins used for this stage of the QRS detection algorithm were set
such that signal peaks (i.e., valid QRS complexes) were detected. Signal peaks are defined as those of the QRS
complex, while noise peaks are those of the T waves, muscle noise, etc. After the ECG signal has passed through the band pass filter stages, its signal-to-noise ratio increases. This permits the use of thresholds that are
just above the noise peak levels and thus gradual changes in amplitude can be tracked. It improves the overall
sensitivity of the detector. The determination as to whether this pulse corresponds to a QRS complex (as
opposed to a high-sloped T-wave or a noise artifact) is performed with an adaptive thresholding operation i.e., if
peak during the second cycle exceeds the peak which was detected during first cycle then it is considered as a
new signal peak and other decision rules are outlined below.
When analyzing the amplitude of the MWI output, the algorithm uses two set of threshold values that
continuously adapt to changing ECG signal quality. The first pass through y[n] uses these thresholds to classify
the each non-zero sample as either signal or noise. The thresholds are automatically adjusted to float over the
noise. Low thresholds are possible because of the improvement of the signal-to-noise ratio by the band pass
filter. The higher of the two thresholds in each of the two sets is used for the first analysis of the signal. The lower threshold is used if no QRS is detected in a certain time interval.
The set of thresholds that is applied to the waveform from the moving window integrator is;
SPKI = 0.125 PEAKI + 0.875 SPK if PEAKI is the signal peak
NPKI = 0.125 PEAKI + 0.875 NPK if PEAKI is the noise peak
THRESHOLD I1 = NPKI + 0.25 (SPKI – NPKI)
THRESHOLD I2 = 0.5 THRESHOLD I1
where,
PEAKI is the overall peak.
SPKI is the running estimate of the signal peak.
NPKI is the running estimate of the noise peak.
THRESHOLD I1 is the first threshold applied.
THRESHOLD I2 is the second threshold applied.
A peak is determined when the signal changes direction within a certain time interval. Thus, SPKI is
the peak that the algorithm has learned to be that of the QRS complex, while NPKI peak is any peak that is not
related to the signal of interest. As can be seen from the equations, new values of thresholds are calculated from
previous ones, and thus the algorithm adapts to changes in the ECG signal from a particular person. Whenever a
new peak is detected, it must be categorized as a noise peak or a signal peak. If the peak level exceeds
THRESHOLD I1 during the first analysis of the signal, then it is a QRS peak. If the signal peak exceeds
THRESHOLDI2 it is to be classified as a QRS peak. If the QRS complex is found using this second threshold
level, then the peak value adjustment is twice as fast as usual:
SPKI = 0.25 PEAKI + 0.75 SPKI
Ecg Signal Processing Using Dsk Tms320c6713
www.iosrjen.org 31 | P a g e
The output of the final filtering stages, after the moving window integrator, must be detected for peaks.
A peak detector algorithm finds peaks and a detection algorithm stores the maximum levels at this stage of the
filtered signal since the last peak detection. A new peak is defined only when a level that is less than half the
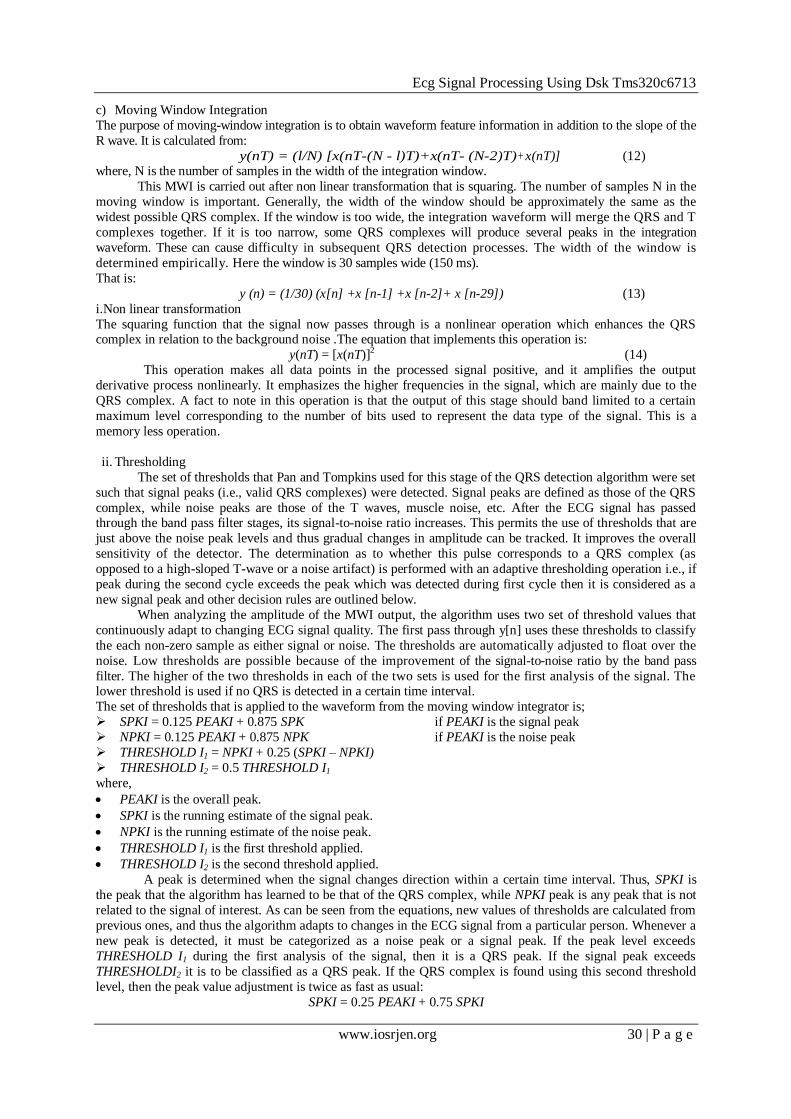
height of the peak level is reached. 3.4 Design Flow
Fig.7. Flow diagram
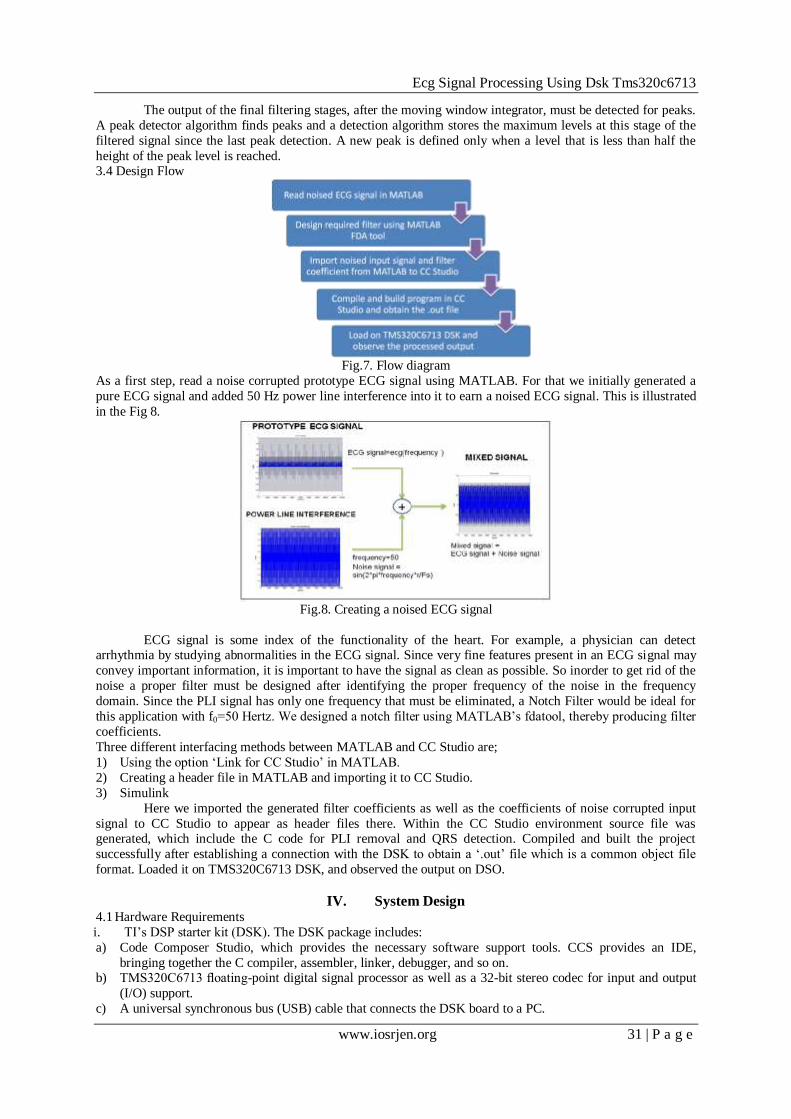
As a first step, read a noise corrupted prototype ECG signal using MATLAB. For that we initially generated a
pure ECG signal and added 50 Hz power line interference into it to earn a noised ECG signal. This is illustrated
in the Fig 8.
Fig.8. Creating a noised ECG signal
ECG signal is some index of the functionality of the heart. For example, a physician can detect arrhythmia by studying abnormalities in the ECG signal. Since very fine features present in an ECG signal may
convey important information, it is important to have the signal as clean as possible. So inorder to get rid of the
noise a proper filter must be designed after identifying the proper frequency of the noise in the frequency
domain. Since the PLI signal has only one frequency that must be eliminated, a Notch Filter would be ideal for
this application with f0=50 Hertz. We designed a notch filter using MATLAB‟s fdatool, thereby producing filter
coefficients.
Three different interfacing methods between MATLAB and CC Studio are;
1) Using the option „Link for CC Studio‟ in MATLAB.
2) Creating a header file in MATLAB and importing it to CC Studio.
3) Simulink
Here we imported the generated filter coefficients as well as the coefficients of noise corrupted input
signal to CC Studio to appear as header files there. Within the CC Studio environment source file was generated, which include the C code for PLI removal and QRS detection. Compiled and built the project
successfully after establishing a connection with the DSK to obtain a „.out‟ file which is a common object file
format. Loaded it on TMS320C6713 DSK, and observed the output on DSO.
IV. System Design 4.1 Hardware Requirements
i. TI‟s DSP starter kit (DSK). The DSK package includes:
a) Code Composer Studio, which provides the necessary software support tools. CCS provides an IDE,
bringing together the C compiler, assembler, linker, debugger, and so on. b) TMS320C6713 floating-point digital signal processor as well as a 32-bit stereo codec for input and output
(I/O) support.
c) A universal synchronous bus (USB) cable that connects the DSK board to a PC.
Ecg Signal Processing Using Dsk Tms320c6713
www.iosrjen.org 32 | P a g e
d) A 5V power supply for the DSK board.
ii. An compatible PC: The DSK board connects to the USB port of the PC through the USB cable included
with the DSK package.
iii. An oscilloscope, signal generator and speakers. A signal/spectrum analyzer is optional. Shareware utilities are available that utilize the PC and a sound card to create a virtual instrument such as an
oscilloscope, a function generator, or a spectrum analyzer.
4.1.1 TMS320C6713 DSK
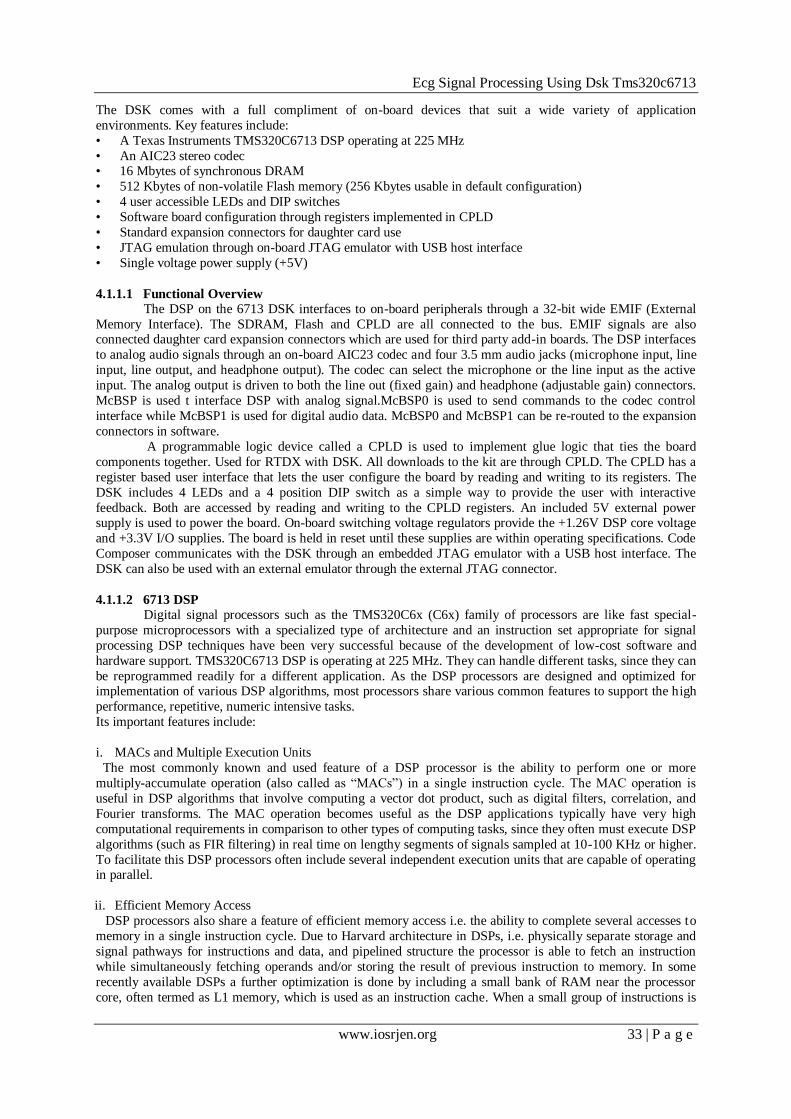
The DSK package is powerful, yet relatively inexpensive, with the necessary hardware and software
support tools for real-time signal processing. It is a complete DSP system. The DSK board, with an approximate
size of 5 × 8 in. shown in Fig.10, includes the C6713 floating-point digital signal processor and a 32-bit stereo
codec TLV320AIC23 (AIC23) for input and output. The onboard codec AIC23 uses a sigma–delta technology
that provides ADC and DAC. It connects to a 12-MHz system clock. Variable sampling rates from 8 to 96 kHz
can be set readily. A daughter card expansion is also provided on the DSK board. Two 80-pin connectors
provide for external peripheral and external memory interfaces. The external memory interface (EMIF) with light-emitting diodes (LEDs) and liquid-crystal displays (LCDs) for spectrum display.
The DSK board includes 16 MB (megabytes) of synchronous dynamic random access memory
(SDRAM) and 256kB (kilobytes) of flash memory. Four connectors on the board provide input and output: MIC
IN for microphone input, LINE IN for line input, LINE OUT for line output, and HEADPHONE for a
headphone output (multiplexed with line output). The status of the four user dip switches on the DSK board can
be read from a program and provides the user with a feedback control interface. The DSK operates at 225MHz.
Also onboard the DSK are voltage regulators that provide 1.26 V for the C6713 core and 3.3 V for its memory
and peripherals.
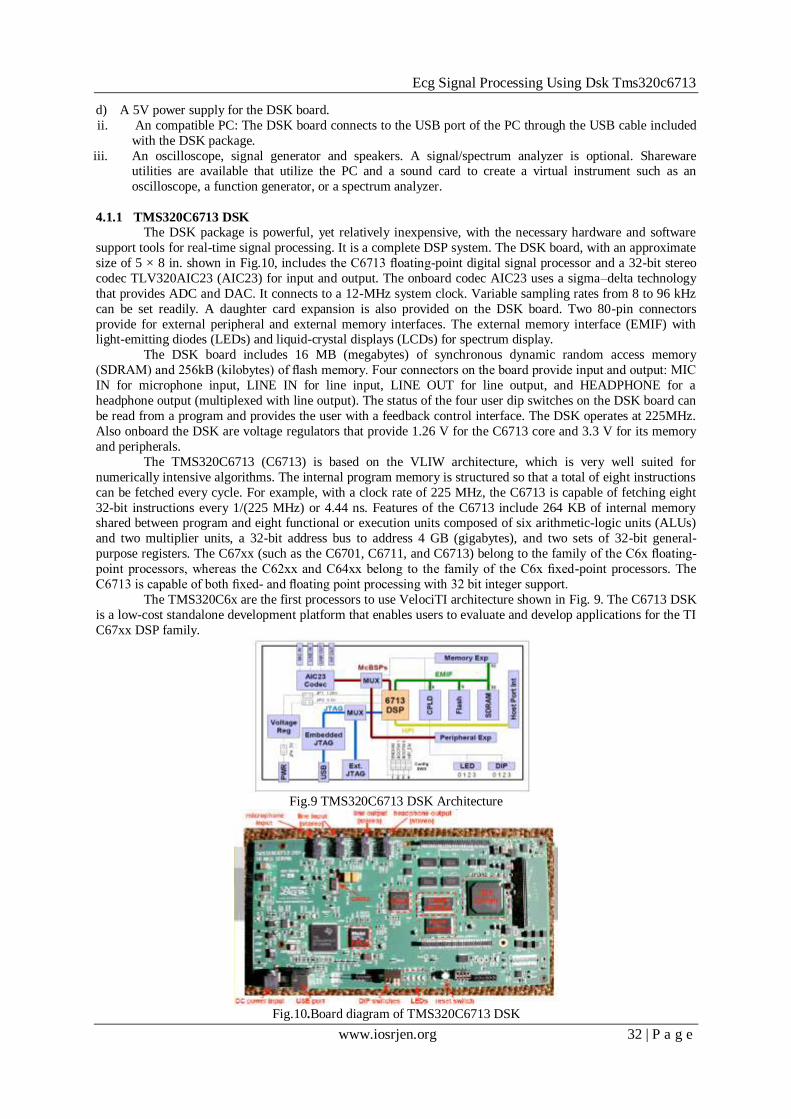
The TMS320C6713 (C6713) is based on the VLIW architecture, which is very well suited for
numerically intensive algorithms. The internal program memory is structured so that a total of eight instructions
can be fetched every cycle. For example, with a clock rate of 225 MHz, the C6713 is capable of fetching eight
32-bit instructions every 1/(225 MHz) or 4.44 ns. Features of the C6713 include 264 KB of internal memory shared between program and eight functional or execution units composed of six arithmetic-logic units (ALUs)
and two multiplier units, a 32-bit address bus to address 4 GB (gigabytes), and two sets of 32-bit general-
purpose registers. The C67xx (such as the C6701, C6711, and C6713) belong to the family of the C6x floating-
point processors, whereas the C62xx and C64xx belong to the family of the C6x fixed-point processors. The
C6713 is capable of both fixed- and floating point processing with 32 bit integer support.
The TMS320C6x are the first processors to use VelociTI architecture shown in Fig. 9. The C6713 DSK
is a low-cost standalone development platform that enables users to evaluate and develop applications for the TI
C67xx DSP family.
Fig.9 TMS320C6713 DSK Architecture
Fig.10.Board diagram of TMS320C6713 DSK
Ecg Signal Processing Using Dsk Tms320c6713
www.iosrjen.org 33 | P a g e
The DSK comes with a full compliment of on-board devices that suit a wide variety of application
environments. Key features include:
• A Texas Instruments TMS320C6713 DSP operating at 225 MHz
• An AIC23 stereo codec • 16 Mbytes of synchronous DRAM
• 512 Kbytes of non-volatile Flash memory (256 Kbytes usable in default configuration)
• 4 user accessible LEDs and DIP switches
• Software board configuration through registers implemented in CPLD
• Standard expansion connectors for daughter card use
• JTAG emulation through on-board JTAG emulator with USB host interface
• Single voltage power supply (+5V)
4.1.1.1 Functional Overview
The DSP on the 6713 DSK interfaces to on-board peripherals through a 32-bit wide EMIF (External
Memory Interface). The SDRAM, Flash and CPLD are all connected to the bus. EMIF signals are also connected daughter card expansion connectors which are used for third party add-in boards. The DSP interfaces
to analog audio signals through an on-board AIC23 codec and four 3.5 mm audio jacks (microphone input, line
input, line output, and headphone output). The codec can select the microphone or the line input as the active
input. The analog output is driven to both the line out (fixed gain) and headphone (adjustable gain) connectors.
McBSP is used t interface DSP with analog signal.McBSP0 is used to send commands to the codec control
interface while McBSP1 is used for digital audio data. McBSP0 and McBSP1 can be re-routed to the expansion
connectors in software.
A programmable logic device called a CPLD is used to implement glue logic that ties the board
components together. Used for RTDX with DSK. All downloads to the kit are through CPLD. The CPLD has a
register based user interface that lets the user configure the board by reading and writing to its registers. The
DSK includes 4 LEDs and a 4 position DIP switch as a simple way to provide the user with interactive
feedback. Both are accessed by reading and writing to the CPLD registers. An included 5V external power supply is used to power the board. On-board switching voltage regulators provide the +1.26V DSP core voltage
and +3.3V I/O supplies. The board is held in reset until these supplies are within operating specifications. Code
Composer communicates with the DSK through an embedded JTAG emulator with a USB host interface. The
DSK can also be used with an external emulator through the external JTAG connector.
4.1.1.2 6713 DSP
Digital signal processors such as the TMS320C6x (C6x) family of processors are like fast special-
purpose microprocessors with a specialized type of architecture and an instruction set appropriate for signal
processing DSP techniques have been very successful because of the development of low-cost software and
hardware support. TMS320C6713 DSP is operating at 225 MHz. They can handle different tasks, since they can
be reprogrammed readily for a different application. As the DSP processors are designed and optimized for implementation of various DSP algorithms, most processors share various common features to support the high
performance, repetitive, numeric intensive tasks.
Its important features include:
i. MACs and Multiple Execution Units
The most commonly known and used feature of a DSP processor is the ability to perform one or more
multiply-accumulate operation (also called as “MACs”) in a single instruction cycle. The MAC operation is
useful in DSP algorithms that involve computing a vector dot product, such as digital filters, correlation, and
Fourier transforms. The MAC operation becomes useful as the DSP applications typically have very high
computational requirements in comparison to other types of computing tasks, since they often must execute DSP
algorithms (such as FIR filtering) in real time on lengthy segments of signals sampled at 10-100 KHz or higher.
To facilitate this DSP processors often include several independent execution units that are capable of operating in parallel.
ii. Efficient Memory Access
DSP processors also share a feature of efficient memory access i.e. the ability to complete several accesses to
memory in a single instruction cycle. Due to Harvard architecture in DSPs, i.e. physically separate storage and
signal pathways for instructions and data, and pipelined structure the processor is able to fetch an instruction
while simultaneously fetching operands and/or storing the result of previous instruction to memory. In some
recently available DSPs a further optimization is done by including a small bank of RAM near the processor
core, often termed as L1 memory, which is used as an instruction cache. When a small group of instructions is
Ecg Signal Processing Using Dsk Tms320c6713
www.iosrjen.org 34 | P a g e
executed repeatedly, the cache is loaded with these instructions thus making the bus available for data fetches,
instead of instruction fetches.
iii. Circular Buffering The need of processing the digital signals in real time, where in the output (processed samples) have to be
produced at the same time at which the input samples are being acquired, evolves the concept of Circular
Buffering. For instance this is needed in telephone communication, hearing aids, radars etc. Circular buffers are
used to store the most recent values of a continually updated signal. Circular buffering allows processors to
access a block of data sequentially and then automatically wrap around to the beginning address exactly the
pattern used to access coefficients in FIR filter. Circular buffering also very helpful in implementing first-in,
first-out buffers, commonly used for I/O and for FIR delay lines.
iv. Specialized Instruction Sets
The instruction sets of the digital signal processors are designed to make maximum use of the
processors‟ resources and at the same time minimize the memory space required to store the instructions. Maximum utilization of the DSPs‟ resources ensures the maximum efficiency and minimizing the storage space
ensures the cost effectiveness of the overall system. To ensure the maximum use of the underlying hardware of
the DSP, the instructions are designed to perform several parallel operations in a single instruction, typically
including fetching of data in parallel with main arithmetic operation. For achieving minimum storage
requirements the DSPs‟ instructions are kept short by restricting which register can be used with which
operations and which operations can be combined in an instruction. Some of the latest processors use VLIW
(very long instruction word) architectures, where in multiple instructions are issued and executed per cycle. The
instructions in such architectures are short and designed to perform much less work compared to those of
conventional DSPs thus requiring less memory and increased speed because of the VLIW architecture.
4.1.1.3 Peripherals of TMS320C6713 DSK
The TMS320C67x devices contain peripherals for communication with off-chip memory, co-processors, host processors and serial devices. The following subsections discuss the peripherals of „C6713
processor.
i. Enhanced DMA
The enhanced direct memory access (EDMA) controller transfers data between regions in the memory
map without interference by the CPU. The EDMA provides transfers of data to and from internal memory,
internal peripherals, or external devices in the background of CPU operation. The EDMA has sixteen
independently programmable channels allowing sixteen different contexts for operation. The EDMA can read
or write data element from source or destination location respectively in memory. EDMA also provides
combined transfers of data elements such as frame transfer and block transfer. Each EDMA channel has an
independently programmable number of data elements per frame and number of frames per block.
The EDMA has following features. • Background operation: The DMA operates independently of the CPU.
• High throughput: Elements can be transferred at the CPU clock rate.
• Sixteen channels: The EDMA can keep track of the contexts of sixteen independent transfers.
• Split operation: A single channel may be used simultaneously to perform both receive and transmit element
transfers to or from two peripherals and memory.
• Programmable priority: Each channel has independently programmable priorities versus the CPU.
• Each channel‟s source and destination address registers can have configurable indexes for each read and
write transfer. The address may remain constant, increment, decrement, or be adjusted by a programmable
value.
• Programmable-width transfers: Each channel can be independently configured to transfer bytes, 16-bit half
words, or 32-bit words.
• Authentication: Once a block transfer is complete, an EDMA channel may automatically reinitialize itself for the next block transfer.
• Linking: Each EDMA channel can be linked to a subsequent transfer to perform after completion.
• Event synchronization: Each channel is initiated by a specific event. Transfers may be either synchronized
by element or by frame.
ii. Host Port Interface
The Host-Port Interface (HPI) is a 16-bit wide parallel port through which a host processor can directly
access the CPUs memory space. The host device functions as a master to the interface, which increases ease of
access. The host and CPU can exchange information via internal or external memory. The host also has direct
access to memory-mapped peripherals. The HPI is connected to the internal memory via a set of registers.
Ecg Signal Processing Using Dsk Tms320c6713
www.iosrjen.org 35 | P a g e
Either the host or the CPU may use the HPI Control register (HPIC) to configure the interface. The host can
access the host address register (HPIA) and the host data register (HPID) to access the internal memory space of
the device. The host accesses these registers using external data and interface control signals. The HPIC is a
memory-mapped register, which allows the CPU access. The data transactions are performed within the EDMA, and are invisible to the user.
iii. External Memory Interface
The external memory interface (EMIF) supports an interface to several external devices, allowing
additional data and program memory space beyond that which is included on-chip. The types of memories
supported include
• Synchronous burst SRAM (SBSRAM)
• Synchronous DRAM (SDRAM)
• Asynchronous devices, including asynchronous SRAM, ROM, and FIFOs. The EMIF provides highly
programmable timings to these interfaces.
• External shared-memory devices. For all memory types, the address is internally shifted to compensate for memory widths of less than 32 bits.
iv. Multichannel Buffered Serial Port
The C62x/C67x McBSP is based on the standard serial port interface found on the TMS320C2000 and
C5000 platforms. The standard serial port interface provides:
Full-duplex communication
Double-buffered data registers, which allow a continuous data stream
Independent framing and clocking for reception and transmission
Direct interface to industry-standard codecs,
analog interface chips (AICs), and other serially connected A/D and D/A devices
External shift clock generation or an internal programmable frequency shift clock and multichannel transmission and reception of up to 128 channels.
An element sizes of 8-, 12-, 16-, 20-, 24-, or 32-bit.
8-bit data transfers with LSB or MSB first.
Highly programmable internal clock and frame generation.
Data communication between McBSP and the devices interfaced takes place via two different pins for
transmission and reception – data transmit (DX) and data receive (RX) respectively. Control information in the
form of clocking and frame synchronization is communicated via CLKX, CLKR, FSX, and FSR. 32-bit wide
control registers are used to communicate McBSP with peripheral devices through internal peripheral bus. CPU
or DMA write the DATA to be transmitted to the Data transmit register (DXR) which is shifted out to DX via
the transmit shift register (XSR). Similarly, receive data on the DR pin is shifted into the receive shift register
(RSR) and copied into the receive buffer register (RBR). RBR is then copied to DRR, which can be read by the CPU or the DMA controller. This allows internal data movement and external data communications
simultaneously.
v. Timers
The ‟C67x has two 32-bit general-purpose timers that can be used to.
• Time events
• Count events
• Generate pulses
• Interrupt the CPU
• Send synchronization events to the DMA controller
The timer works in one of the two signaling modes depending on whether clocked by an internal or an
external source. The timer has an input pin (TINP) and an output pin (TOUT). The TINP pin can be used as a general purpose input, and the TOUT pin can be used as a general-purpose output. When an internal clock is
provided, the timer generates timing sequences to trigger peripheral or external devices such as DMA controller
or A/D converter respectively. When an external clock is provided, the timer can count external events and
interrupt the CPU after a specified number of events.
vi. Power Down Logic
Most of the operating power of CMOS logic is dissipated during circuit switching, from one logic state
to another. By preventing some or all of the chip‟s logic from switching, significant power savings can be
realized without losing any data or operational context. Power-down mode PD1 blocks the internal clock inputs
at the boundary of the CPU, preventing most of its logic from switching, effectively shutting down the CPU.
Ecg Signal Processing Using Dsk Tms320c6713
www.iosrjen.org 36 | P a g e
Additional power savings are accomplished in power-down mode PD2, in which the entire on chip clock
structure (including multiple buffers) is halted at the output of the PLL. Power-down mode PD3 shuts down the
entire internal clock tree (like PD2) and also disconnects the external clock source (CLKIN) from reaching the
PLL. Wake-up from PD3 takes longer than wake-up from PD2 because the PLL needs to be relocked, just as it does following power up.
4.2 SOFTWARE REQUIREMENTS
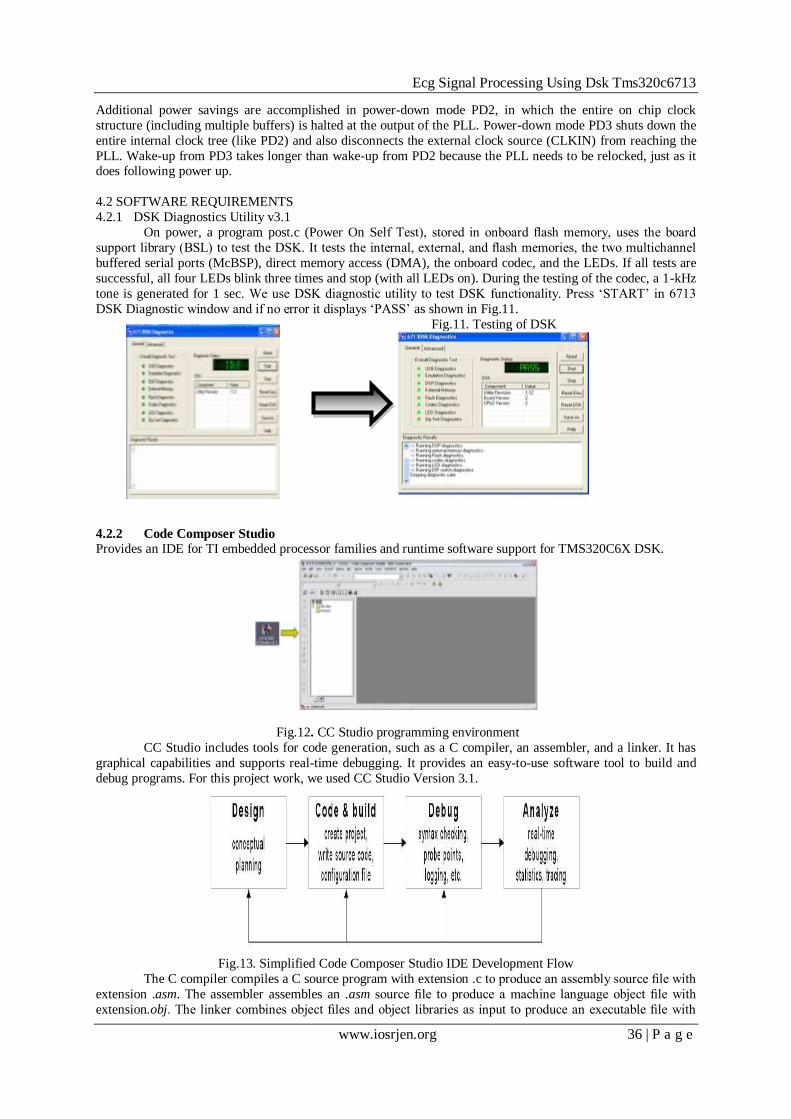
4.2.1 DSK Diagnostics Utility v3.1
On power, a program post.c (Power On Self Test), stored in onboard flash memory, uses the board
support library (BSL) to test the DSK. It tests the internal, external, and flash memories, the two multichannel
buffered serial ports (McBSP), direct memory access (DMA), the onboard codec, and the LEDs. If all tests are
successful, all four LEDs blink three times and stop (with all LEDs on). During the testing of the codec, a 1-kHz
tone is generated for 1 sec. We use DSK diagnostic utility to test DSK functionality. Press „START‟ in 6713
DSK Diagnostic window and if no error it displays „PASS‟ as shown in Fig.11.
Fig.11. Testing of DSK
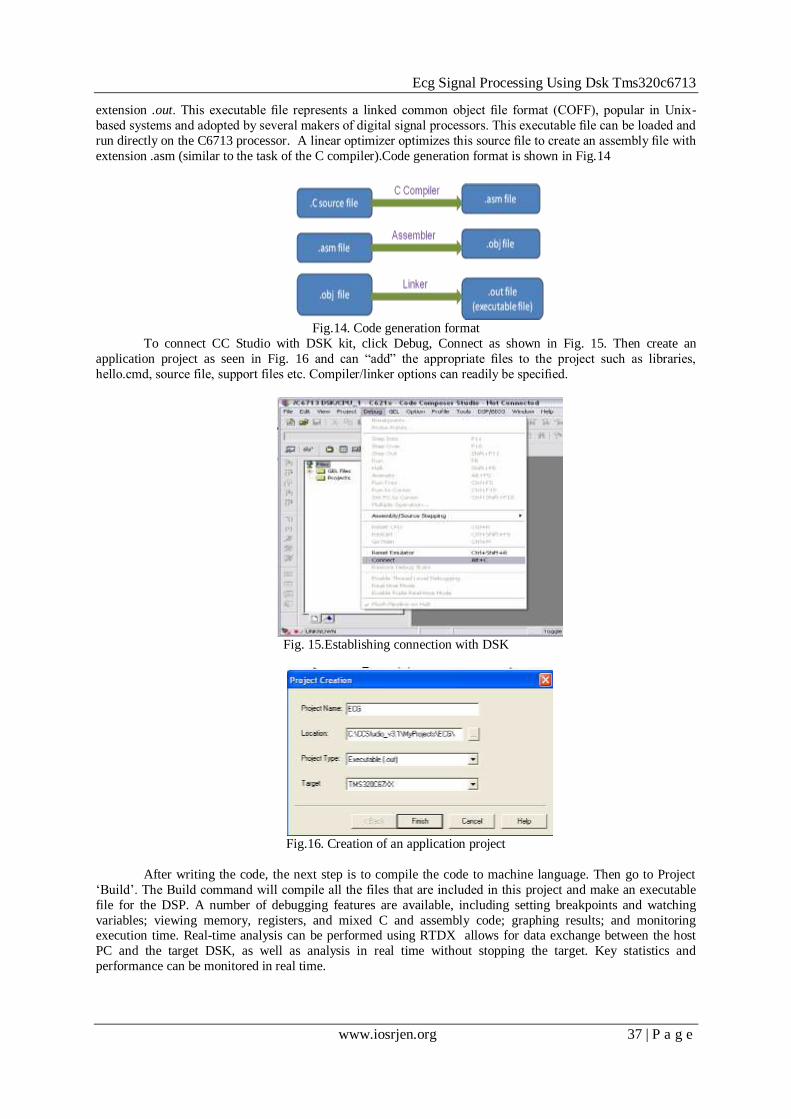
4.2.2 Code Composer Studio
Provides an IDE for TI embedded processor families and runtime software support for TMS320C6X DSK.
Fig.12. CC Studio programming environment
CC Studio includes tools for code generation, such as a C compiler, an assembler, and a linker. It has
graphical capabilities and supports real-time debugging. It provides an easy-to-use software tool to build and
debug programs. For this project work, we used CC Studio Version 3.1.
Fig.13. Simplified Code Composer Studio IDE Development Flow
The C compiler compiles a C source program with extension .c to produce an assembly source file with
extension .asm. The assembler assembles an .asm source file to produce a machine language object file with
extension.obj. The linker combines object files and object libraries as input to produce an executable file with
Ecg Signal Processing Using Dsk Tms320c6713
www.iosrjen.org 37 | P a g e
extension .out. This executable file represents a linked common object file format (COFF), popular in Unix-
based systems and adopted by several makers of digital signal processors. This executable file can be loaded and
run directly on the C6713 processor. A linear optimizer optimizes this source file to create an assembly file with
extension .asm (similar to the task of the C compiler).Code generation format is shown in Fig.14
Fig.14. Code generation format
To connect CC Studio with DSK kit, click Debug, Connect as shown in Fig. 15. Then create an
application project as seen in Fig. 16 and can “add” the appropriate files to the project such as libraries,
hello.cmd, source file, support files etc. Compiler/linker options can readily be specified.
Fig. 15.Establishing connection with DSK
Fig.16. Creation of an application project
After writing the code, the next step is to compile the code to machine language. Then go to Project
„Build‟. The Build command will compile all the files that are included in this project and make an executable
file for the DSP. A number of debugging features are available, including setting breakpoints and watching
variables; viewing memory, registers, and mixed C and assembly code; graphing results; and monitoring execution time. Real-time analysis can be performed using RTDX allows for data exchange between the host
PC and the target DSK, as well as analysis in real time without stopping the target. Key statistics and
performance can be monitored in real time.
Ecg Signal Processing Using Dsk Tms320c6713
www.iosrjen.org 38 | P a g e
4.2.2.1 Useful Types of Files
1. file.pjt: to create and build a project named file.
2. file.c: C source program.
3. file.asm: assembly source program created by the user, by the C compiler, or by the linear optimizer. 4. file.sa: linear assembly source program. The linear optimizer uses file.sa as input to produce an assembly
program file.asm
5. file.h: header support file.
6. file.lib: library file, such as the run-time support library file rts6700.lib
7. file.cmd: linker command file that maps sections to memory.
8. file.obj: object file created by the assembler.
9. file.out: executable file created by the linker to be loaded and run on the C6713 processor.
10. file.cdb: configuration file when using DSP/BIOS.
4.2.2.2 Support files
1. C6713dskinit.c: contains functions to initialize the DSK, the codec, the serial ports, and for I/O. It is not included with CC Studio.
2. C6713dskinit.h: header file with function prototypes. Features such as those used to select the mic input in
lieu of line input (by default), input gain, and so on are obtained from this header file.
3. C6713dsk.cmd: sample linker command file. This generic file can be changed when using external memory
instead of internal memory.
4. Vectors_intr.asm: a modified version of a vector file included with CCS to handle interrupts. Twelve
interrupts, INT4 through INT15, are available, and INT11 is selected within this vector file. They are used
for interrupt-driven programs.
5. Vectors_poll.asm: vector file for programs using polling.
6. rts6700.lib, dsk6713bsl.lib, csl6713.lib: run-time, board, and chip support library files, respectively. These
files are included with CCS and are located in C6000\cgtools\lib, C6000\dsk6713\lib, and c6000\bios\lib
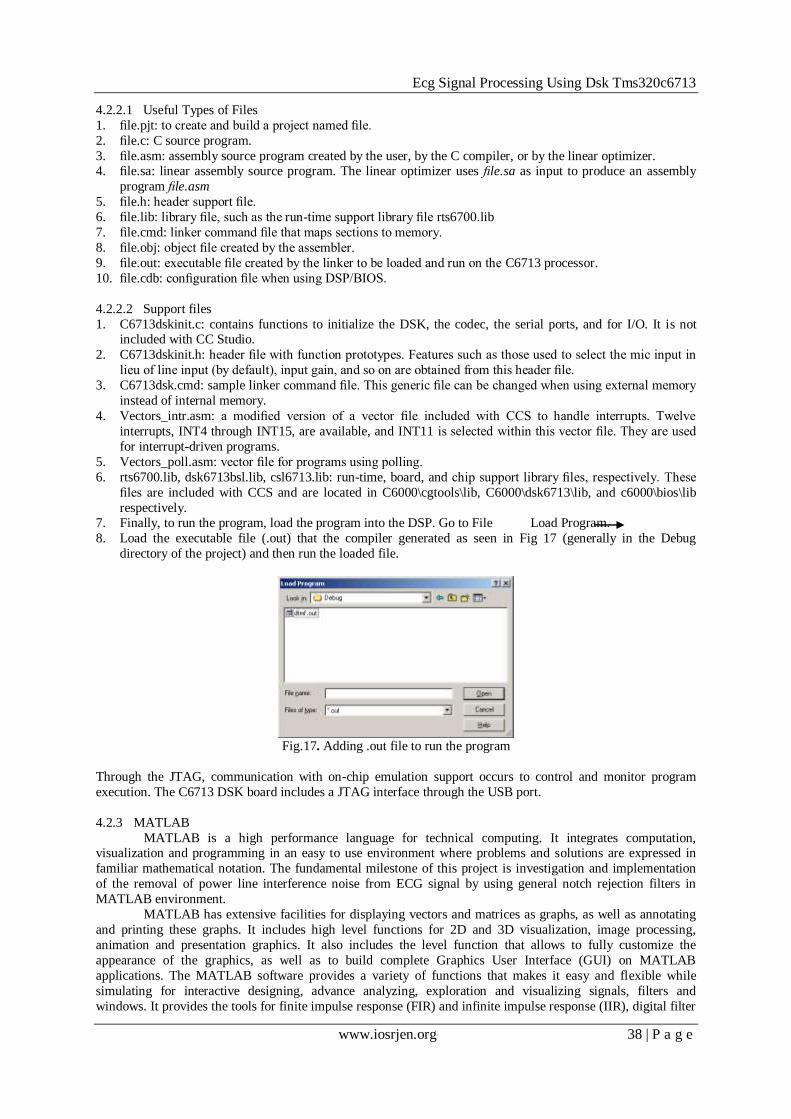
respectively. 7. Finally, to run the program, load the program into the DSP. Go to File Load Program.
8. Load the executable file (.out) that the compiler generated as seen in Fig 17 (generally in the Debug
directory of the project) and then run the loaded file.
Fig.17. Adding .out file to run the program
Through the JTAG, communication with on-chip emulation support occurs to control and monitor program
execution. The C6713 DSK board includes a JTAG interface through the USB port.
4.2.3 MATLAB
MATLAB is a high performance language for technical computing. It integrates computation, visualization and programming in an easy to use environment where problems and solutions are expressed in
familiar mathematical notation. The fundamental milestone of this project is investigation and implementation
of the removal of power line interference noise from ECG signal by using general notch rejection filters in
MATLAB environment.
MATLAB has extensive facilities for displaying vectors and matrices as graphs, as well as annotating
and printing these graphs. It includes high level functions for 2D and 3D visualization, image processing,
animation and presentation graphics. It also includes the level function that allows to fully customize the
appearance of the graphics, as well as to build complete Graphics User Interface (GUI) on MATLAB
applications. The MATLAB software provides a variety of functions that makes it easy and flexible while
simulating for interactive designing, advance analyzing, exploration and visualizing signals, filters and
windows. It provides the tools for finite impulse response (FIR) and infinite impulse response (IIR), digital filter
Ecg Signal Processing Using Dsk Tms320c6713
www.iosrjen.org 39 | P a g e
design, implementation and analysis. It also provides the toolbox for application such as speech & audio
processing, medical imaging & instruction, wired & wireless communication and financial modeling & analysis.
MATLAB has set of construct for plotting scientific graphs from raw or computed data. It is a high performance
language, most productive development and interactive environment for engineering and technology implementations software package. MATLAB enables to perform different functions which includes, electronic
programming, technical computing applications, scientific & engineering graphical illustration, accurate
numerical calculation, algorithm development, application development including graphical user interface
building, graph and report or software simulation etc. Here, for our project work, MATLAB (R2010a) software
was used.
4.2.3.1 FDA TOOL
MATLAB‟s filter design and analysis tool can be invoked by typing „>>FDATool’
This tool is used to;
Design filters
Quantize filters (with Filter Design Toolbox software installed)
Analyze filters
Modify existing filter designs
Create multirate filters (with Filter Design Toolbox software installed)
Realize Simulink models of quantized, direct-form, FIR filters (with Filter Design Toolbox software
installed)
Perform digital frequency transformations of filters (with Filter Design Toolbox software installed)
With Filter Design Toolbox software installed, FDATool lets you to design and analyze quantized filters, as
well as convert quantized filters to various filter structures, transform filters, design multirate filters, and realize
models of filters.
Filter coefficients are exported to our project in CCS by generating an ANSI C header file that contains
those coefficients. The header file defines global arrays for the filter coefficients. When you link the project to the header file, the linker allocates the global arrays in static memory locations in processor memory. Loading
the executable file, the processor allocates enough memory to store the exported filter coefficients in its memory
and writes the coefficients to the allocated memory. Use the following steps to export filter coefficients from
FDATool to the CCS IDE text editor:
1. Start FDATool by entering fdatool at the MATLAB command prompt.
2. Design a filter with the same structure, length, design method, specifications and data type that you done in
your source code filter algorithm.
3. Click Store Filter to store your filter design. Storing the filter allows you to recall the design to modify it.
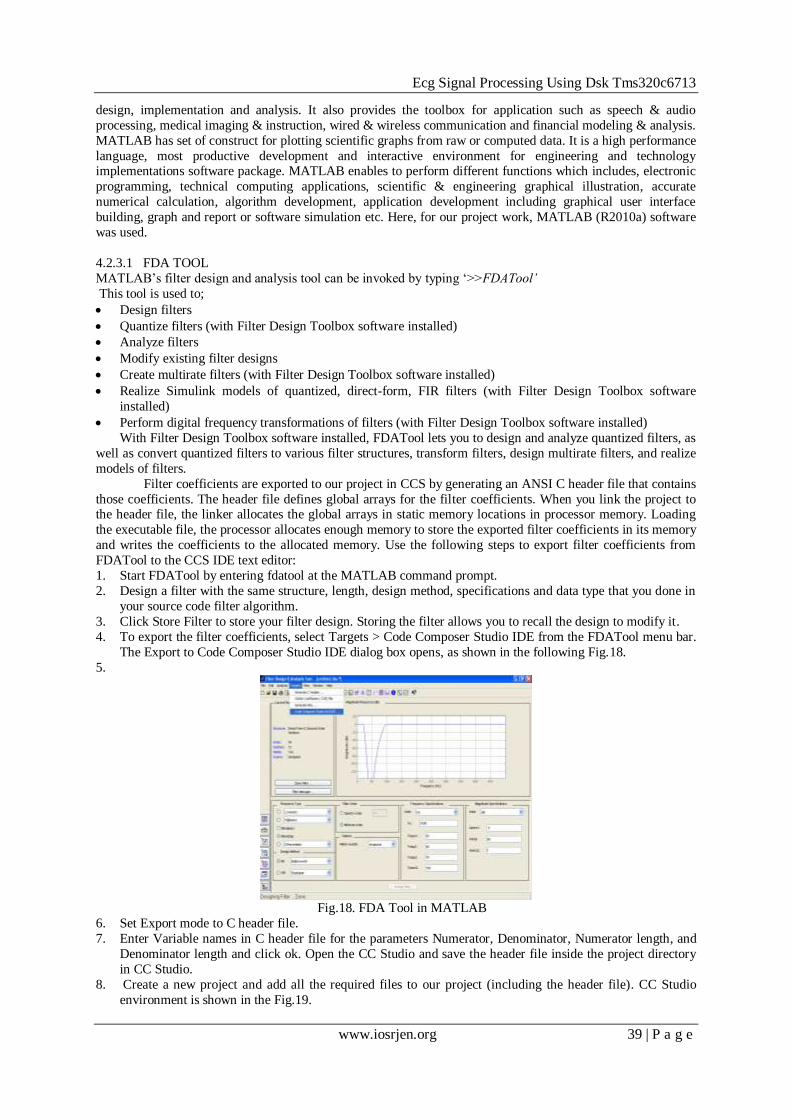
4. To export the filter coefficients, select Targets > Code Composer Studio IDE from the FDATool menu bar.
The Export to Code Composer Studio IDE dialog box opens, as shown in the following Fig.18.
5.
Fig.18. FDA Tool in MATLAB
6. Set Export mode to C header file.
7. Enter Variable names in C header file for the parameters Numerator, Denominator, Numerator length, and
Denominator length and click ok. Open the CC Studio and save the header file inside the project directory
in CC Studio.
8. Create a new project and add all the required files to our project (including the header file). CC Studio
environment is shown in the Fig.19.
Ecg Signal Processing Using Dsk Tms320c6713
www.iosrjen.org 40 | P a g e
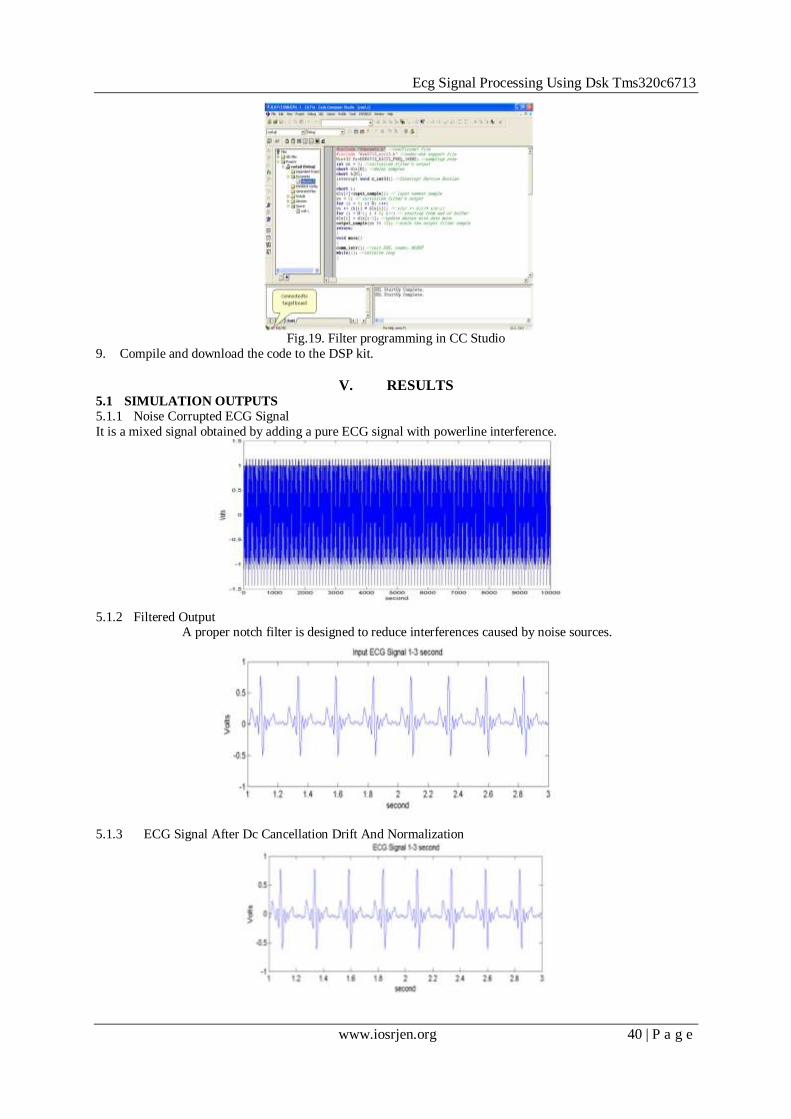
Fig.19. Filter programming in CC Studio
9. Compile and download the code to the DSP kit.
V. RESULTS 5.1 SIMULATION OUTPUTS
5.1.1 Noise Corrupted ECG Signal
It is a mixed signal obtained by adding a pure ECG signal with powerline interference.
5.1.2 Filtered Output
A proper notch filter is designed to reduce interferences caused by noise sources.
5.1.3 ECG Signal After Dc Cancellation Drift And Normalization
Ecg Signal Processing Using Dsk Tms320c6713
www.iosrjen.org 41 | P a g e
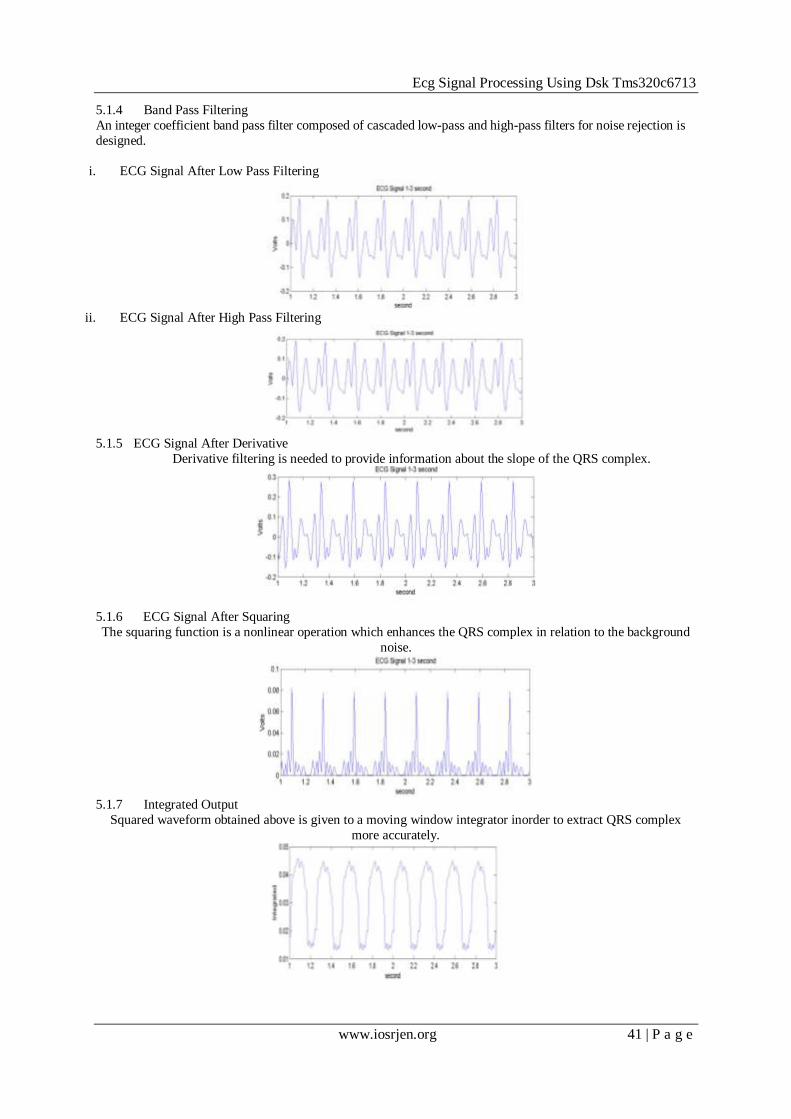
5.1.4 Band Pass Filtering
An integer coefficient band pass filter composed of cascaded low-pass and high-pass filters for noise rejection is
designed.
i. ECG Signal After Low Pass Filtering
ii. ECG Signal After High Pass Filtering
5.1.5 ECG Signal After Derivative
Derivative filtering is needed to provide information about the slope of the QRS complex.
5.1.6 ECG Signal After Squaring
The squaring function is a nonlinear operation which enhances the QRS complex in relation to the background
noise.
5.1.7 Integrated Output
Squared waveform obtained above is given to a moving window integrator inorder to extract QRS complex
more accurately.
Ecg Signal Processing Using Dsk Tms320c6713
www.iosrjen.org 42 | P a g e
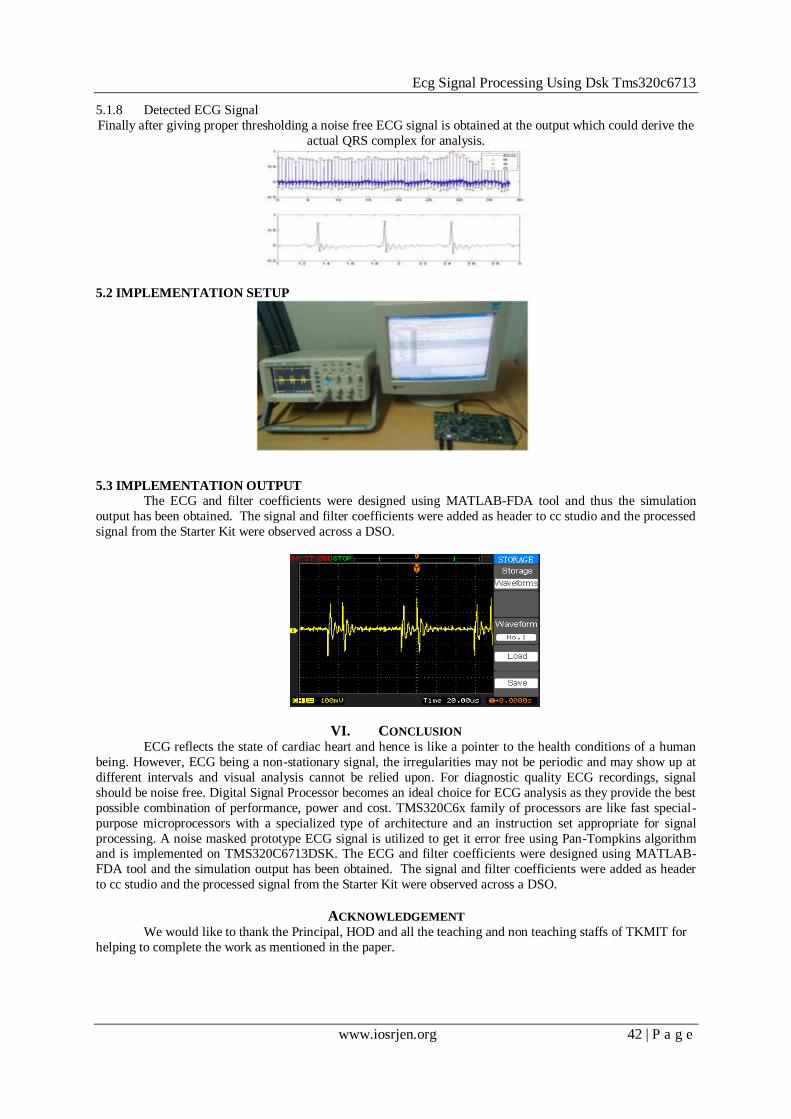
5.1.8 Detected ECG Signal
Finally after giving proper thresholding a noise free ECG signal is obtained at the output which could derive the
actual QRS complex for analysis.
5.2 IMPLEMENTATION SETUP
5.3 IMPLEMENTATION OUTPUT
The ECG and filter coefficients were designed using MATLAB-FDA tool and thus the simulation
output has been obtained. The signal and filter coefficients were added as header to cc studio and the processed
signal from the Starter Kit were observed across a DSO.
VI. CONCLUSION ECG reflects the state of cardiac heart and hence is like a pointer to the health conditions of a human
being. However, ECG being a non-stationary signal, the irregularities may not be periodic and may show up at
different intervals and visual analysis cannot be relied upon. For diagnostic quality ECG recordings, signal
should be noise free. Digital Signal Processor becomes an ideal choice for ECG analysis as they provide the best
possible combination of performance, power and cost. TMS320C6x family of processors are like fast special-
purpose microprocessors with a specialized type of architecture and an instruction set appropriate for signal
processing. A noise masked prototype ECG signal is utilized to get it error free using Pan-Tompkins algorithm and is implemented on TMS320C6713DSK. The ECG and filter coefficients were designed using MATLAB-
FDA tool and the simulation output has been obtained. The signal and filter coefficients were added as header
to cc studio and the processed signal from the Starter Kit were observed across a DSO.
ACKNOWLEDGEMENT We would like to thank the Principal, HOD and all the teaching and non teaching staffs of TKMIT for
helping to complete the work as mentioned in the paper.
Ecg Signal Processing Using Dsk Tms320c6713
www.iosrjen.org 43 | P a g e
REFERENCES Book:
[1] Rulph Chassaing,Digital signal processing and application with the C6713 DSK(Wiley Interscience, 2005 edition,volume III.)
Theses: [2] Abdullah A Wardak, Practical guidelines and examples for the Users of TMS320C6713 DSK, World academy of
Science, engineering and technology.
Papers: [3] Jiapu Pan and Willis J Tompkins, A real time QRS detection algorithm,IEEE transaction on Biomedical Engineering,
Vol.bme 32, March 1985.
[4] E. Punnamchandar, K. Reddy,Denoising and QRS detection of ECG signals using Empirical Mode Decomposition, IEEE International Conference 2011, Communications and Signal Processing (ICCSP).
[5] Geoffrey Green, Implementation of algorithms for QRS detection from ECG signals using TMS320C6713 processor platform,April 2009.
[6] Pablo Laguna, Leif Sornmo,Electrocardiogram (ECG) Signal Processing,Lund University Sweden, Zaragoza University Spain.
[7] Hejjel L ,Suppression of Power-Line Interference by Analog Notch Filtering in the ECG Signal for Heart Rate Variability Analysis, Med Science Monit,Jan 2004.
[8] Sander A,Voss A., Griessbach G, An Optimized Filter System for Eliminating 50 Hz Interference from High Resolution ECG , Biomed Tech Berl., 1995 Apr.
[9] Dotsinsky,Stoyanov T ,Power-Line Interference Cancellation in ECG Signals, Biomed Instrum Techno., 2005 Mar-Apr.
[10] Choy TT, Leung P Real Time Microprocessor-Based 50 Hz Notch Filter for ECG, Biomed Eng. 1988 May.