early succession on lahars spawned by mount st. helens
TRANSCRIPT

American Journal of Botanv 85(6): 820-828. 1998.
Eanr,v succEssroN oN LAHARS spAwNED ByMouNr Sr. Hnr,BNSl
Rocrn oBL MoRRr-2
Department of Botany, University of Washington, Box 355325,Seatt le, Washineton 98195-5325
The effects of isolation on primary succession are poorly documented. I monitored vegetation recovery on two MountSt. Helens lahars (mud flows) with different degrees of isolation using contiguous plots. Seventeen years after the eruption,species r ichness was stable, but cover cont inued to increase. That isolat ion af fects community st ructure was conf i rmed inseveral ways. The dominance hierarchies of the lahars differed sharply. Detrended correspondence analysis on Lahar Ishowed a trend related to distance from an adjacent woodland, whereas vegetation on Lahar II was relatively homogeneous.Spectra of growth forms and dispersal types also differed. Lahar I was dominated by species with modest dispersal ability,while I-ahar II was dominated by species with better dispersal. Variation between plots should decline through time, aprediction confirmed on Lahar II. Lahar I remained heterogendous despite having developed significantly highercover. Here,the increasing distance fiom the fbrest has prevented plots from becoming more homogeneous. At this stage of early primarysuccession, neither lahar is converging towards the species composition of adjacent vegetation. This study shows thatisolation and differential dispersal ability combine to determine initial vegetation structure. Stochastic efTects resulting fromdispersal limitations may resist the more deterrninistic effects of competition that could lead to floristic convergence.
Key words: d ispersal ; landscape ef fects; lahars; Mount St . Helens; pr imary succession; vcgetat ion structure; volcanoes.
The 1980 eruption of Mount St. Helens created newhabitats (del Moral and Bliss, 1993) that included lahars(mud flows). Lahars, caused by rapidly melting ice (Fran-cis, 1993), can devastate huge areas. Halpern and Har-mon (1983) described initial invasion on the Muddy Riv-er lahar on the east side of Mount St. Helens. They foundthat richness and cover declined with distance from ad-jacent forests. Such results suggest that short distancescan affect colonization. I have studied two small laharson the southwest side of Mount St. Helens since 1980.By 1982 there were only five sparsely distributed species(del Moral and Wood, 1988). By 1985 strong cover gra-dients had developed along transects perpendicular towoodland vegetation (Wood and del Moral, 1988).
This paper describes primary succession on these la-hars. Two themes animate this paper. The first concernsrecovefy patterns and the second concerns the role ofisolation on community structure and development. Ex-ploratory analyses suggested three hypotheses; (1) spe-cies composition depends on the degree of isolation fromsources of colonists; (2) community development grad-ually reduces compositional heterogeneity; and (3) veg-etation structure converges towards that of adjacent veg-etation. Tests of each hypothesis are described below.
I Manuscr ipt receivcd 3 March 1997; revis ion accepted 2l October1997.
The author thanks R. N. Ful lcr , J . S. Harpole, D. E, . Riege, J. H.Tj tus, and reviewers James O. Luken, Joseph Antos, and David R. Peartfbr their cogent suggest ions to improve the manuscr ipt ; S. C. Bard, S.Crawtbrd, K. M. Dlugosch, R. N. Ful ler , L. B. McMul lan, R. R. Ro-bohm, R. Siems, J. H. Ti tus, M. Tu, S. I . Wi lson, B. Wime, and D. M.Wood for excel lent f ie ld assistance and companionship ovcr the lastdecade. J. S. Harpole produced Fig. t . The Mount St . Helens Nat ionalVolcanic Monument StafT permitted these studies to be undertaken.Funds for this study were provided by N. S. P grants BSR-89-06544and DEB-94-06987.
: E-mai l address: moral @l u.washinston.edu
MATERIALS AND METHODS
Study area-Two lahars. fbrmed during the 1980 eruption of MountSt. Helens (Cummans, l98l) , were moni tored. ' Ihey are on the south-west f lank of the volcano. Lahar I is located between 1415 and 1445m at lat i tude N 46"10'-56", longi tude lZZ" l3 ' l ' . Lahar I I is located be-tween 11430 and 1475 m at lat i tude N 46'12'06", longi tude 122"13'36'(Fig. l ) . Both lahars exper ience summer drought and provide l imi tednutrients. Lahar I is moderately protected from wind, while Lahar II ismore exposed. Limited seed trapping in 1989 revealed that both laharsreceived < 3 seeds rn I .yr I and had a s imi lar seed ra in composi t ion(Wood and del Moral, unpublished data).
The vegetation near these iahars developed on lahars at least 3O0 yrold. Vegetation includes meadows dominated by Agro.stis diegoen.sis,open woodlands dominated by Abies losiocarpa (Hook.) Nutt. and Pi-nus conlorta Dougl. var. latifolia Engelm. with a variety of herbs, anddense conifer forests with a sparsc hcrb layer. Del Moral and Bliss(1993) descr ibed vegetat ion, soi ls , and c l imate in barren zones of MountSt. Helens more fully.
Two comparison sites, located on the Pumice Plain (del Mora1, Titus,and Cook, 1995) and the Abraham Plain (del Moral and Wood, 1993),were used. The Pumice Plain is on the north slope of the volcano be-tween 1060 and 1080 m lat i tude (N 46"15'05' , longi tude l22" lO'42' ) .It received a seed rain larger than any other site discussed here (D. M.Wood, unpublished data). The Abraham Plain is on the east flank at1280 m (N 46'12'58", longi tude 122"08'15") . I t is near ly smooth andreceived a seed input larger than that of the lahars (D. M. Wood, un-published data).
Vascular plant nomenclature is based on Hitchcock and Cronquist( 1913).
Sampling-Grids of permanent plots offer several advantages forsuccession studies (Austin, l98O). Spatial patterns can be analyzed,sampling problems are minimized, assumptions associated with chro-nosequences are mitigated, and invasion patterns can be explored (delMoral and Wood, 1993). In 1987, I establ ished a gr id of 175 l0 x lOm plots (15 rows of ten plots and five rows of five plots) on Lahar I.The southern edge was uphill, but near a meadow-woodland complex.The distance of the eastern edge to the adjacent woodland increasedfrom 2 to 3O m (Fig. l ) . Also in 1987, a gr id of 317 lO X 10 m plots
820

June 19981 DEL MORAL-EERIY SUCCESSION ON LAHARS 82r
Fig. 1. Location of lahar grids in relationship to intact meadows,open woodland, and fbrest.
(17 rows of 16 plots and three rows of 15 plots) was established onLahar II. This lahar is isolated by deep canyons to the east and west.The lahar killed most vegetation within 90 m below the grid, but stand-ing dead trees occur to within 40 m. No vegetation survived within 200m above the grid. Sources of colonists for Lahar II are over 200 m
downhill of the grid (Fig. 1). The Pumice Plain grid consisted of 180plots and the Abraham Plain grid consisted of 400 plots (del Moral andWood, 1993).
I used a cover index to estimate dominance. The index is: I : oneto five plants; 2 : six to 2O plants; 3 : over 2O plants or O.25 to O.5Vacover; 4 : 0.51 to 1.Oqa coveri 5 : l.Ol to zEa covert 6 : 2.Ol to 4Vacover; and 7 - 4.O1 to 87o cover. Cover estimates over 87o were re-
corded directly. Cover takes precedence over density (e.g., one plant
cover ing 1.5 m2 would score 5) .Lahar I was sampled annually fiom 1987 ro 1992, and in 1994 and
1996. Lahar I I was sampled annual ly f rom 1987 to 1991, and in 1993and 1995. Species richness, total index score, and diversity (11') basedon the index scores were calculated fbr each plot. Total percent coverwas estimated by backtransformations. Scores of I and 2 were con-verted based on the size of the species. For example, a score of I was
converted to O.O6Vo for a small species and to O.lzEo fbr a large one.
Index scores from 3 to 7 were backtransformed to the midpoint of the
index range. For example, index scores of 6 were transformed to 37o.
Data analyses-Percentage similarity (PS) robustly determines eco-
logical distance among vegetation samples (Faith, Minchin, and Belbin,
1987). PS was calculated with the MVSP program (Kovach, 1993) and
was used to compare data sets within and between years.
PS, : 269 11 min (X,*, X)Dt (X* + X), (l)
where I and j are two samples of k species, X,r and Xip are the covers
of species ft in each sample, and min - the minimum of these two
values.
I calculated the Sorensen matching coefficient (Kovach, 1993):
5 , . , : 2 a / ( 2 a + b + c ) ' ( 2 )
where a is the number of species shared, and h and c are the number
of species in samples i and j, respectively.
I used detrended correspondence analysis (DCA, Hill and Gauch,
1980), an indirect ordination method, to describe temporal vegetation
change on the grids and to estimate differences among composite sam-
ples (blocks) from the most recent sampling dates. These blocks con-
sisted of 16 100-m2 plots in a4 x 4 array. There were nine blocks on
Lahar I arrayed to maximize coverage on the grid (.144 of the 175 plots
were used). There were 20 blocks on Lahar II arrayed such that all 317
plots were used (block 2O had 13 plots). A DCA of all 29 blocks was
conducted without either transformations or down-weighting of rare
species.Changes in the relative abundance of representative species on each
lahar were compared. The mean index score is the total score of each
species, divided by the number of plots. Frequency is the percentage of
plots occupied by the species. Relative cover is the total index score of
the species divided by the total index score of the grid. Mean index
and frequency describe development of a species, while relative cover
describes vegetation dynamrcs.
Comparisons of all structural indices, species abundance, and DCA
scores between years were made using one-way analysis of variance,
followed by a comparison of means using the Bonferroni method. This
multiple range test is very conservative since the t value increases with
the number of comparisons (Analytical Software, 1994). l determined
linear regressions of DCA axis scores with sample position on the grid
using linear regression (Analytical Software, 1994).
RESULTS
Community structure-In Tables I and 2,I summarizestructural changes that occurred on the lahars between1987 and 1995-96. One-way AOV of each structuraltrend on both lahars showed significant changes P <0.0001). All reported differences among means were de-termined using the Bonferroni comparison of means (P< 0.05) .
Mean richness per 100 m2 increased significantly on
Te.slt-n l. Development of community structure on Lahar l, 198'7-1996. Means of 175 100-m'�contiguous plots near an open Abies lasiocarpa-Pinus contorta woodland. One-way AOV indicated that all structural measures tested changed significantly (P < 0.05). Row values with thesame superscript letter are not significantly different using the Bonferoni comparison of means (P < 0.05).
r99 I | 996Charaeter isr ic 1 9 8 8 t992
Total richnessMean richnessMean cover indexMean cover percentDivers i ty (H')
- l l
8.4"l 3.6,1 .5 '7^1 .19"
359 .8b
17 . ] b2.39^bt .79^
351 1 . 3 "20.8.3.22^b1.84 .
4 I12 .9d25.2d4.08b1 . 9 1 ,
4815.0 .31 .8"8.74,1 .75^
4915 .9 f38 .9 f10 .03d
1 .80 "
5 l16.4f52.3824.O4.
1 . 3 8 b
822 Avpnrc,qN JouRNar- oF BorANy [Vol. 85
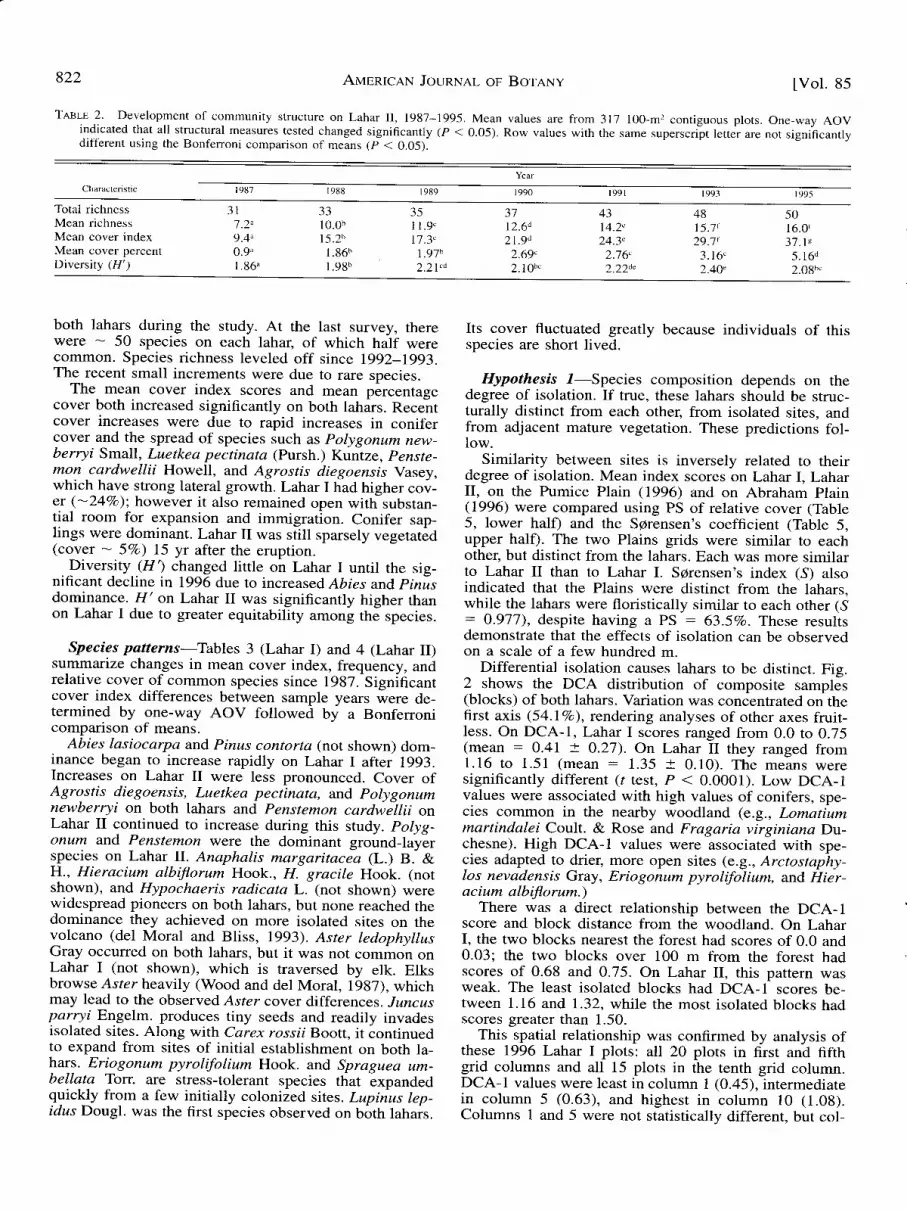
Tn'sl-s 2. Development of community structure on Lahar II, 1987-1995. Mean values are from 317 100-m, contiguous plots. One-way AOVindicated that all structural measures tested changed significantly (P < 0.05). Row values with the same superscript letter are not significantlydifferent using the Bonferroni comparison of means (p < 0.05).
, -== , --r, t"u'
Characteristic I 987 r 988 | 9 9 11 989 r 990 | 995
Total richnessMean richnessMean cover indexMean cover percentDiversity (11')
3 l1 .2^9.4"0.9"1 .86"
3310.0b15 .2b
l � g 6 bl . ggb
-1 -)
1 1 . 9 .17.3,
1 .97b2.21"d
12.6d21.9d2.69,2.10b.
4314.2"24.3,2.76"2.22d,
4815. '7t29.]t3 . r6 .2.40.
5016.0i3 7 . l e
5 . 1 6 d2.08h
both lahars during the study. At the last survey, therewere - 50 species on each lahar, of which half werecommon. Species richness leveled off since 1992-1993.The recent small increments were due to rare species.
The mean cover index scores and mean percentagecover both increased significantly on both lahars. Recentcover increases were due to rapid increases in conifercover and the spread of species such as polygonum new-berryi Small, Luetkea pectinata (Pursh.) Kuntze, penste-mon cardwellii Howell, and Agrostis diegoensis Vasey,which have strong lateral growth. Lahar I had higher cov-er (-24Vo); however it also remained open with substan-tial room for expansion and immigration. Conifer sap-lings were dominant. Lahar II was still sparsely vegetated(cover - 5Vo) 15 yr after the eruption.
Diversity (F1) changed little on Lahar I until rhe sig-nificant decline in 1996 due to increased Abies and pinisdominance. H'on Lahar II was significantly higher thanon Lahar I due to greater equitability among the species.
Species patterns-Tables 3 (Lahar I) and 4 (Lahar II)su,mmarize changes in mean cover index, frequency, andrelative cover of common species since 1987. Significantcover index differences between sample years ;ere de-termined by one-way AOV followed by a Bonferronicomparison of means.
Abies lasiocarpa and Pinus contort(t (not shown) dom-inance began to increase rapidly on Lahar I after 1993.Increases on Lahar II were less pronounced. Cover ofAgrostis diegoensis, Luetkea pectinota, and polygonumnewberryi on both lahars and penstemon cardwillii onLahar II continued to increase during this study. potyg-onum and Penstemon were the dominant ground-layerspecies on Lahar II. Anaphalis margaritacea (L.) B. &H., Hieracium albiflorum Hook., H. gracile Hook. (notshown), and Hypochaeris radicata L. (not shown) werewidespread pioneers on both lahars, but none reached thedominance they achieved on more isolated sites on thevolcano (del Moral and Bliss, 1993). Aster ledophyilusGray occurred on both lahars, but it was not common onI ahar I (not shown), which is traversed by elk. Elksbrowse Asterheavlly (Wood and del Moral, I98j), whichmay lead to the observed Aster cover differences. Juncusparryi Engelm. produces tiny seeds and readily invadesisolated sites. Along wittr Carex ro.r.ril Boott, it iontinuedto expand from sites of initial establishment on both la-hars. Eriogonum pyrolifolium Hook. and Spraguea um-bellata Torr. are stress-tolerant species that expandedquickly from a few initially colonized sites. Lupiius lep-idus Dougl. was the first species observed on both lahars.
Its cover fluctuated greatly because individuals of thisspecies are short lived.
Hypothesis /-Species composition depends on thedegree of isolation. If true, these lahars should be struc-turally distinct from each other, from isolated sites, andfrom adjacent mature vegetation. These predictions fol-low.
Similarity between sites is inversely related to theirdegree of isolation. Mean index scores on Lahar I, LaharII, on the Pumice Plain (1996) and on Abraham Plain(1996) were compared using PS of relative cover (Table5, lower halfl and the Sgrensen's coefficient (Table 5.upper hal0. The two Plains grids were similar to eachother, but distinct from the lahars. Each was more similarto Lahar II than to Lahar I. Sorensen's index (S) alsoindicated that the Plains were distinct from the lahars,while the lahars were floristically similar to each other (S: 0.977), despite having a PS : 63.5Vo. These resultsdemonstrate that the effects of isolation can be observedon a scale of a few hundred m.
Differential isolation causes lahars to be distinct. Fis.2 shows the DCA distribution of composite samplJs(blocks) of both lahars. Variation was concentrated on thefirst axis (54.lVo), rendering analyses of other axes fruit-less. On DCA-I, Lahar I scores ranged from 0.0 to 0.75(mean = O.4I -t 0.27). On Lahar II thev ransed from1.16 to 1.51 (mean : 1.35 -f 0.10). The meins weresignificantly different (r test, P < 0.0001). Low DCA-Ivalues were associated with high values of conifers, spe-cies common in the nearby woodland (e.g., Lomatiummartindalei Coult. & Rose and Frctgaria virginiana Du-chesne). High DCA-I values were associated with spe-cies adapted to drier, more open sites (e.g., Arctostaphy-los nevadensis Gray, Eriogonum pyrolifulium, and Hier-acium albiflorum.)
There was a direct relationship between the DCA-Iscore and block distance from the woodland. On LaharI, the two blocks nearest the forest had scores of 0.0 and0.03; the two blocks over 100 m from the forest hadscores of 0.68 and 0.75. On Lahar II, this pattern wasweak. The least isolated blocks had DCA-1 scores be-tween 1.16 and 1.32, while the most isolated blocks hadscores greater than 1.50.
This spatial relationship was confirmed by analysis ofthese 1996 Lahar I plots: all 20 plots in first and fifthgrid columns and all 15 plots in the tenth grid column.DCA-1 values were least in column 1 (0.45), intermediatein column 5 (0.63), and highest in column l0 (1.08).Columns 1 and 5 were not statistically different, but col-

June 19981
Tnelr 3. Changes in mean cover index, frequency, and relative coverfor l2 common species on Lahar I. (Sample size : 175 contiguous100-m'� plots.) One-way AOV indicated that all species changedsignificantly (P < 0.05). Index values with the same superscriptletter are not significantly different using the Bonferroni compari-son of means (P < 0.05).
823
T,q.eI-s 4. Changes in mean cover index, frequency, and relative coverfor l3 common species on Lahar II. (Sample size: 317 contiguous100-mr plots.) One-way AOV indicated that all species changedsignificantly (P < 0.05). Index values with the same superscriptletter are not significantly different using the Bonferroni compari-son of means (P < 0.05).
DEL MORAL-Bappy SUCCESSION ON LAHARS
YcarSpecies,
Attr ibutes I 989 1992Species,
Attr ibutes r 987 | 989 1993 1995
Abies ktsiocarpa
Mean index scoreFrequencyRelative cover
Agrostis diegoensis
Mean index scoreFrequencyRelative cover
Anaphalis margaritacea
Mean index scoreFrequencyRelative cover
Carex rossii
Mean index scoreFrequencyRelative cover
Eriogonum pyrolifulium
Mean index scoreFrequencyRelative cover
Hieracium albiflorum
Mean index scoreFrequencyRelative cover
Juncus parryi
Mean index scoreFrequencyRelative cover
Luetkea pectinata
Mean index scoreFrequencyRelative cover
Lupinus lepidus
Mean index scoreFrequencyRelative cover
Penstemon cardwellii
Mean index scoreFrequencyRelative cover
Polygonum newberry i
Mean index scoreFrequencyRelative cover
Spraguea umbellata
Mean index scoreFrequencyRelative cover
3. t2^ 4 .00b99 9922.71 t9.20
o.44^ O-72^42 62
3.23 3 .46
0.5" 0.85b46 66
3.69 4.O9
0.45" 0.60b43 60
3.2'7 2.88
o.49" 0.61^47 5l
3 .60 3 .21
o.25^ 0.36"24 36
1 . 8 0 1 . 1 3
0.78, 1 . 19b70 835.70 5 .73
1.48" 2.21b92 9'710.85 10 .59
1.13^ 1 .95 .89 94r2 .6s 9 .38
0.26^ 0.33"22 28
1.93 1 .56
1.03^ 1 .93b60 83
1 .54 9.27
0.14" O.44b1 4 3 61 . 0 1 2 . 1 1
6.63" 6.74,100 100t9.25 17.34
t .28b 1 .73 .80 824.05 4.45
1.11 , 1 .03"d79 16
3.68 2.26
0.90. o.92"80 822.82 2.36
I .05b 1.38"76 813.29 2.54
0.71b 0 .ggb67 832.24 2.51
1 .81 . 2 .56d95 975.69 6.58
3.54, 3.83d98 991 1 . 1 3 9 . 8 6
2.59b 1.67.91 9'7
8 . 1 3 4 . 3 0
0.85b 1.24,5 1 5 82 . 6 8 3 . 1 9
2.39b 3.06"91 94'7.50 7.81
1.13 . t .94d72 803.55 4.99
Abies lasiocttrpa
Mean index scoreFrequencyRelative cover
Agrostis diegoensis
Mean index scoreFrequencyRelative cover
Anap hali s margaritacea
Mean index scoreFrequencyRelative cover
Aster ledophyllus
Mean index scoreFrequencyRelative cover
Carex rossii
Mean index scoreFrequencyRelative cover
Erio gonum py rolifolium
Mean index scoreFrequencyRelative cover
Hieracium albiforum
Mean index scoreFrequencyRelative cover
Juncus parryi
Mean index scoreFrequencyRelative cover
Luetkea pectinata
Mean index scoreFrequencyRelative cover
Lupinus lepidus
Mean index scoreFrequencyRelative cover
Penstemon cardwellii
Mean index scoreFrequencyRelative cover
Polygonum newberryi
Mean index scoreFrequencyRelative cover
Spraguea umbellata
Mean index scoreFrequencyRelative cover
1 3 . 8 1 d100t - ) . - )+
2.O6t82
3.94
1.64d86
3 . 1 4
0.86"82
1 .65
1.43.82
l . l l .80
2 . 1 3
2.47d96
4. l0dqq
7.83
2.35h984.49
1 . 3 1 .622 . 5 1
3.64d
976.96
l . 1 g d
823.42
LL 19, 1.47b 1 .83. 2.56d 2.88"88 95 98 99 9812.70 8.49 1.51 8.62 7.76
0.36" 0.69b 1.09. 1.68d 1.97,33 59 7'7 92 933.86 3 .97 4 .49 5 .66 5 .3 r
0.50" 0.94b 1 . 14" 1.36d 1.11.34 67 81 89 935.34 5 .43 4 .68 4 .59 4 .16
0.66" 0.99b 1 .33" 1.28. 1.29,41 70 18 85 85
1.O2 5.7 5.47 1.32 3.46
o.44^ 0.67b 0.70b. o.85" 0.86"31 54 61 60 614.64 3 .88 2 .89 2 .85 2 .31
0.76. l .Olb 1.61, 2.39d 3.41"6'7 81 91 97 97
8. 13 s .83 6 .81 8 .25 9 .17
0.26" 0.60b 0.88b 1-21" I .34d26 51 81 97 972.76 3.44 3.60 1.06 3.60
0.55" 0.99b 1.07b 1.84. 2.08d49 69 18 95 95
s .81 s .74 4 .4 r 6 .19 5 .60
o.44^ 1 .04b 1 .51" t .74 , 2 .6V40 '78 86 91 93
4.64 5.99 6.21 5.88 '7.O3
1.11 , 2 .156 2 .83d 1 .9 ' �7 , 2 .15b76 96 99 99 9911.83 12 .44 1r .64 6 .63 5 .7 '7
O.19^ 1.32b 2.42' 3.0.1d 4.33'68 79 89 100 100
8.41 1.64 9.96 10.25 11.66
1.23^ 2 .46b 2 .98 . 3 .30d 5 . t l .s9 97 9s 99 9913.07 14 .19 12 .2 '7 11 .11 13 .76
o . t 1^ 0 .65b 1 .26 , l . 8 l d 1 .95 "16 55 82 95 96
l . 8 l 3 . 15 5 .20 6 .09 5 .24
umn 10 was different from both (r test, P <0.02). Themultiple regression of DCA-1 vs. X and Y was highlysignificant (R2 : 0.72; F : 61.49: P < 0.0001). Theregression equation is DCA-1 : -0.016 + 0.049x *O.O67y.

824 AuEnrcRN JounNar- oF BoTANY [Vol. 85
through time, due to the vegetative expansion of Agrostisdiegoensis. Good dispersers were initially abundant, buttheir relative abundance declined on Lahar I. Proportionsof other groups did not change dramatically.
There were marked differences between the lahars.Modest dispersers were twice as abundant on Lahar I ason Lahar II, while moderate, good, and excellent dis-persers all were more abundant on Lahar II. The mostcommon species on Lahar I were modest dispersers, themost common on Lahar II were good dispersers.
Dispersal type spectra differ more strikingly betweenthe four grids (Table 7). Abraham Plain was dominatedby excellent dispersers, while good and excellent dis-persers dominated the Pumice Plain.
Results at both scales support the prediction that iso-lation forms a selective dispersal barrier thus affectingthe dispersal type spectrum.
Hypothe sis 2-Community development reduces com-positional heterogeneity. Through time, more plants es-tablish from distant sources, established plants spread,and locally producad seeds disperse to adjacent plots. Thetests involve successive measurements of between-sam-ple variation.
DCA axis scores become less variable through time.The 29 blocks described above were analyzed forchanges in variation through time. The nine Lahar Iblocks were analyzed in 1987, 1988, 1991, 1994, and1996; the 2O Lahar II blocks were analyzed in 1987,1988, 1991, 1993, and 1995. The mean (-f SD) DCA-Iand DCA-2 scores were calculated. In Table 8, Bonfer-roni comparison of means was used to assess differencesbetween means (P < 0.05).
Both the mean DCA-I and DCA-2 scores for Lahar Ishowed a small significant increase through time. How-ever, homogeneity, determined by reduced standard de-viations, did not increase on either axis. Lahar II showedsignificant increasing DCA-1 scores and declining vari-ability on both axes. On both lahars, the shifts in meanDCA positions correlated with increases in more meso-phytic species such as Carex phaeocephalaPiper, C. lim-nophila Herman, Danthonia intermedia Vasey, Juncusmertensianus Bong., Lupinus latifulius Agaradh., ferns,and mosses.
On Lahar II plots are becoming homogeneous, such
Tenlr 5. Percentage similarity (lower half) and Sgrensen's Index (tophalf') among Lahar, Abraham Plain, and Pumice Plain grids thatdiff'er in their degrees of isolation. Similarity is based on relativecomposition. Sites are arrayed in order of decreasing isolation.
AP 96 PP 96 Lahar II Lahar I
PA-96PP-96Lahar IILahar I
61.37o38.1Vo26.67o
0.9,X I
43.9Vo32.17o
0.8350 . 8 3 1
6O.7Vo
0 . 8 1 00.805o.91'7
These results are consistent with the prediction thatdifferential isolation affects species composition differ-ences between lahars. Differences on Lahar I suggest thatcomposition may be affected by distances of <50 m.
Isolation affects growth form spectra. Lahar I shouldhave more species with strong vegetative growth becausesuch species typically have inefficient seed dispersal(Tsuyuzaki and del Moral, 1995; Tilman, Lehman, andYin, 1997). Lahar II should be dominated by compositesand graminoids with better dispersal abilities. Speciesfrom the two lahars were aggregated into nine growthforms, omitting species with less than five occurrences.The mean cover indices of growth forms on the two la-hars from 1987 to 1996 are shown in Table 6. The abun-dance of each growth form increased sequentially. How-ever, growth form proportions differed between lahars.Conifers dominated Lahar I, but not Lahar II, where theAsteraceae/Onagraceae category was more abundant. Theother forb category was dominated by species with stronglateral spread, such as Polygonum, and by stress-tolerantspecies such as Eriogonum. This category was mostabundant on Lahar II. The absolute covers of other cat-egories were similar. These patterns agreed with the pre-diction that growth form spectra would be affected byisolation.
Isolation affects the dispersal ability spectmm. Whilegrowth forms are unambiguous, they are not directly re-lated to dispersal ability. I categorized the species usedabove into five dispersal ability categories (poor, modest,moderate, good, and excellent) based on frequency inseed traps (D. M. Wood, unpublished data) and seed sizes(Wood and del Moral, 1987; Tsuyuzaki and del Moral,1995). These results are summarized in Fig. 3. On bothlahars, the small poor dispersal group increased slightly
0.6'ul
L-8 I
r L-3
L-l
r L-5
.L -2. L-4
Lohor
L-5
Lohor 2
6 o'3o
0:0 0:4-
o:8 1:2
DCA-Ile
Fig. 2- DCA of nine composite 1996 Lahar I plots (L-n) and 20 composite 1995 Lahar II plots (Lahar II).

IJune 19981 DEL MORAL-Pnp1y SUCCESSIoN oN LAHARS 825
Teell 6. Mean cover index, by growth form, based on species with at least four occurrences. Percentages are based on the totals for the speciesused (N is the number of species in each growth form).
CoverGrowth
torm | 987 t 99 r r 992 199.1 | 99.1 | 995-l 996
Percentages
l r r5 r r%
Trees
Evergreen shrubs
Deciduous shrubs
Asteraceae/Onagraceae
Other forbs
Poaceae
Other graminoids
Ferns
Mosses
22332I8877315522II
Lahar ILahar IILahar ILahar IILahar ILahar IILahar ILahar IILahar ILahar IILahar ILahar IILahar ILahar IILahar ILahar IILahar ILahar II
5.O21 . 4 81 . 1 9t . z )0.030 .01t . t 41 . 1 3- t - o )
3.42o.4604. I1 . 3 1o.200o.0000.00
6.661 . 8 82 . 6 1l . - to
0.050.04, ! . - 1 J
3.135.646.58o.750.91r . 9 31 . 7 20.010.00o0.00
8.872.so4.863940 . 1 30.093 . 1 14.948 . 1 19 . 1 11.411 . 5 52.941 . 9 3o . 1 70.003o.230.02
l l . l l3 .50-').:) /4.790 . r 80 . l 3.1.085.549 . r 0
10.081 . 9 82.533.862.77o. t80.006o.250.03
20.614.365.976.950 . 3 10 . 1 54.696-21
10.471 3 . 1 62.373.033.733.05o.230 . 0 1 5o.290.08
42.3I 1 . 812.31 8 . 80 .6o.49 .6
1 6 . 821.5-J-) -f)
4.98 .27 .18 .20.5
<o.10.6o.2
that DCA scores became less variable. In contrast, onLahar I systematic changes in species composition asso-ciated with distance from the woodland appeared to over-ride tendencies towards homogenization. Samples fromopposite ends of the grid typically remain as distinct asthey had been initially.
Small-scale heterogeneity declines through time.Changing heterogeneity on the lahars was determined at
0.60
0.15
YearFig. 3. Proportions of each of five dispersal categories on both la-
hars. The categories are poor, modest, moderate, good, and excellentdispersers.
a smaller scale using PS from two sets of 20 100-m2 plotson each grid. The first set was determined randomly, pro-vided that no selected plot was within two plots of an-other. Each plot of the second set was next to one of thefirst set, selected randomly from the four possibilities soas to avoid contact with any other plot. The mean PS ofeach plot compared to all others on each lahar in eachyear was calculated and PS differences between yearsdetermined by the Bonferroni comparison of means (P (0.05). Increased similarity implies reduced heterogeneity(Table 9).
The results of "random" and "next" plots were sim-ilar. On Lahar I, similarity increased initially, but changedinconsistently thereafter. On Lahar II, similarity increasedsteadily. Early Lahar II samples were more heterogeneousthan those of Lahar I (45 vs. 58Vo), while the latest sam-ples were more homogeneous (72 vs. 657o). There rc-mains substantial variation on Lahar I that may be dueto dispersal effects. All samples on Lahar II were suffi-ciently isolated that they were essentially equidistantfrom sources and are becoming more homogeneous.
Resemblance among lahar samples decreases with timebetween sample dates. If samples become more similar,the most recent sample should be less similar to the firstsample than to the next most recent sample. Lahar Ishowed this trend except in 1996 (Table 10). The results
TABLE 7. Percentage of each dispersal ability category on grids, basedon the most recent sampling period. (Pumice Plain and AbrahamPlain based on unpublished data.) Boldfaced values highlight mod-al categories.
Dispersalcalegory Lahar I Lahar I I Pumice Abraham
coEg 0.30oo.
PoorModestModerateGoodExcellent
6.858.51 .1
1 6 . 0i 1 . 5
6 .8,.| ,1 8 . 032.11 6 . 6
5 . 11 9 . 514.823.936.7
8 .820.76 .7
1 3 . 850.0
Lahar 2-Good

-'1
826 Aur,nrcaN JounNer- oF BoTANY lVol. 85
Tenln 8. Mean (+ SD) DCA positions for nine blocks (composite samples) from Lahar I and for 20 blocks from Lahar II in the years indicated.All species were employed in these analyses. Values in the same column with the same superscript letter are not significantly different usingthe Bonferroni comparison of means (P < 0.05). "Variance" is the explained variance associated with each axis. (Values are times 1000.)
Lahar I Lahar I I
DCA I DCA-2 Year DCA- I
1987I 988I 9 9 11994r996
Variance
1 9 1 +202 +z9'7 +363 +360 1:
169 +1 8 0 +378 +602 +503 +
175.128,132^b235b1 g7b
1 12^l 30,b204"b124b121^b
1987l 988199119931995
I 86"l 59"I 68"17 5^t04^
260 +336 +327 +288 +252 +
9.18 .6
244 + 138^1 9 3 + l 1 8 .363 + 128b576 + 106.606 + 52,
17.830.2
from Lahar II agreed with the prediction. The highestsimilarity occured between the two most recent samples.
Most tests supported predictions based on the hypoth-esis that compositional heterogeneity declines throughtime. The exception occured where steep dispersal gra-dients sustained differences among plots of the Lahar Igrid.
Hypothe sis 3-Vegetation structure converges towardsthat of adjacent vegetation. Peer (1992) suggested that ifthis was true, then intersite compositional differencesshould decline through time. A fair test on these laharsmust wait for conifer dominance to shade the site andalter soils. The lahars were compared to adjacent vege-tation to illuminate an aspect of succession and providea baseline for future studies.
Two meadows south and west of Lahar I (sampled in1994), open woodland vegetation south of Lahar I(1994), and two denser woodlands east of Lahar I (1995)were each sampled with 20 100-m2 plots. Table 11 sum-marizes the PS between each lahar over time and the fivemature vegetation samples.
All mature vegetation was impacted by up to 15 cmof coarse tephra in 1980, but by no other significant vol-canic impacts since - ITOO when large lahars coveredthese areas (del Moral, 1983). Nearby permanent plotvegetation has been stable since 1984 (del Moral, 1993).
Similarity of Lahar I to the woodlands was moderate,but its similarity to the meadow vegetation was low. Sim-ilarity to the closed woodland may be increasing due toincreasing conifer dominance. Similarity to the openwoodland was stable.
Lahar II was more similar to the meadows than towoodlands, but was not converging. The increasing im-portance of conifers, shrubs, and certain forbs argues
T,q.sLE 9. Mean percentage similarity among 20 randomly selected100-m'�plots on each lahar and among 20 plots next to those ran-dom plots. (The same plots were used in each year.) Values in thesame column with the same superscript letter are not significantlydifferent using the Bonfenoni comparison of means (P < 0.05).
Random
against convergence to meadows. Similarity to the closedwoodland was low and stable. Data from Lahar II do notsupporl Hypothesis 3.
DISCUSSION
These analyses support the general hypothesis that spa-tial relationships affect early species composition in plantcommunities. Spatial effects were manifested within 50m (cf. Primack and Miao, 1992) and may constitute asource of unexplained variation in mature communities(cf. McCune and Allen, i985). Dispersal gradients in-crease spatial variation within a "treatment" (in this caseone lahar; see Hurlbert, 1984; Hefner, Butler, and Reilly,1996).In this study, spatial effects were found at the scaleof plots (10 m), blocks (40 m), and grids (over 200 m).
The pace of colonization, estimated from species ac-cumulation, is slackening (cf. Christensen and Peet, 1984;van der Maarel, 1988; Peet, 1992; Myster and Pickett,1994). Mean species richness is nearly stable, despitecontinued secondary dispersal from established plants.Strong vegetative growth and secondary dispersal havecombined to produce continued cover increases. The veg-etation structure of Lahar I will change dramatically asconifers alter environmental conditions and attract birds,thus facilitating dispersal. Species adapted to open con-ditions will decline, while shade-tolerant species such asPedicularis rdcemosa Dougl. will begin colonization.Species such as Lupinus latifulius, Phyllodoce empetri-formis Sw. D. Don., and Vaccinium membranaceumDougl. will become more abundant. Current dominantswill persist in gaps until the conifer canopy is nearlyclosed. This may require several decades on Lahar I andover a century on Lahar II.
Spatial efficts on species composition-The DCA ofblocks with 1995/1996 data showed Lahar I to be struc-turally distinct from Lahar II. Within-lahar variation was
Tesr-E 10. Percentage similarity among composite grids, based on rel-ative species composition to emphasize changes in relative posi-t ions.
Lahar I
Lahar I l9a'7 1988 1991 Lahar I I 1987
Next Nexl
l 988t987r 98919921994r996
56.8"64.5.64.5,6 1 . 9 b65.7"
60.4"63 .8b68.3.65 .3b64.8b
t981l 989t99 lr993r995
4 5 . 1 "60.8b63.2b68.8.'73.4d
44.5^54.2b57 .3b67.6,10.2,
r 988 92.51991 87 .8 87 .01994 80 .8 8 t .q 86 .91996 85.0 90.1 82.8 85.4
r 988 88 .6t991 86.6 9 t.41993 83 .7 8 t .5 85 . .11995 80.7 79.4 84.2 92.4
Lahar I Lahar II

June 19981 DEL MoRAL-P4p1y SUCCESSION ON LAHARS 827
TAsr-s 11. Percentage similarity between intact vegetation and Lahar I and Lahar II, based on relative scores in each set of data. Adjacent
vegetation is nearby mature vegetation sampled in 2 100-m'� plots.
Lahar I Lahar IIAdjacent
vegetation 194'7 I 987r 988 I 988 1 993
Meadow IMeadow 2Woods 1Woods 2Woods 3
39.142.6:) -t -:)
53.9:) /_r,
38 .743.758.658.760.2
43.146.947.748. I55.7
38.24 1 . 84 8 . 1s0. I6 1 . 5
34.537.460.960.659.9
48.754.932.4J J . I
5 1 . 9
48.0s2.328.930.55 1 . 3
50.153.426.528.1.48 . I
47.O51.728.531.7sl.2
44.O48.728.230.849.1
Nole: Woods I and 2 are closed woods. while Woods 3 is more open.
much greater on Lahar I than on Lahar II. This spatialvariation suggested that distances < 50 m are sufficientto alter community structure. On Lahar II, spatial trendswere not evident, suggesting that isolation by canyons,elevation, and a distance ofover 200 m from seed sourcesresulted in each plot having nearly equal (and low) prob-abilities of receiving colonists.
The four grids form an isolation gradient. The propor-tions of the five dispersal types imply that isolation af-fects species types. The lahars re at higher elevationsand are less isolated than either the Pumice Plain or theAbraham Plain. Pumice Plain is at the lowest elevation,receives more long-distance dispersers, and is near smallrefugia (del Moral, Titus, and Cook, 1995). AbrahamPlain is the most stressful and isolated of the grids (delMoral and Wood, 1993). Some of the floristic and struc-tural differences must relate to differences in stress, butthe floristic, growth form (Table 6), and dispersal typepatterns observed suggest that isolation also is important.The lahars differed from each other in ways that agreewith predictions based on differential isolation. Lahar Iwas dominated by modest dispersers, while Lahar II wasdominated by moderate to excellent dispersers.
Heterogeneity-Yegetation in the early stages of pri-mary succession develops by species accrual and by bio-mass accumulation. Initially, local habitat variation andchance produce variable samples. As some speciesachieve dominance, sample variation should decline (cf.Myster and Pickett, 1994). No decline should occur ifenvironmental gradients or distance effects predominate.
Temporal changes in vegetation heterogeneity were es-timated on these lahars from mean DCA scores in blocksand mean percentage similarity among plots. Among-block variation on Lahar I did not decline, while on LaharII it did. The standard deviation of Lahar II DCA-I scoreswas always less than that of Lahar I. There were no ap-parent environmental differences at the scale of theseplots. The Lahar I result implies that distance within thegrid alone maintains between-plot heterogeneity sincedistances are large relative to distances from colonistsources.
Mean PS values substantiate this pattern. Despite in-creasing conifer dominance. percentage similarity on La-har I did not increase, while on Lahar II it did. Further,in the last sample year, PS among Lahar II plots waslarger than that of Lahar I plots. There do not appear tobe large spatial or environmental gradients operatingwithin Lahar II.
Conv ergence-Both convergence and divergence havebeen observed during succession (Glenn-Lewin and vander Maarel, 1992; Inouye and Tilman, 1995). Evidencefrom the lahars related to this hypothesis is equivocal dueto the early stage of succession. The lack of convergencedoes not preclude future convergence. Lahar I may bestarting to become more similar to the adjacent woodlandas conifers become dominant, and appears to be diverg-ing from the surrounding meadow vegetation. Lahar IIwas more similar to the meadows than to the woods, butno convergence was observed. The vegetation is devel-oping under novel biogeographic conditions that includelahar size, proximity to potential colonists, and the pres-ence of exotic species. This vegetation may remain dis-tinct from both meadow and woodlands indefinitely be-cause most of the colonists are persistent (cf. Gray, 1993).Lahar II vegetation continues to develop, but at a slowingrate. Because its structure differs significantly from thaton Lahar I, this vegetation appears to be on another suc-cession track.
This study demonstrated that even short distances froma pool of potential colonists significantly affects the poolof potential colonists. This effect has been observed inhabitats as different as glacial forelands (Mathews andWhittaker, 1987),lava flows (Thgawa, 1965), industrialwaste heaps (Ash, Gemmell, and Bradshaw, 1994), andvacant lots (Primack and Miao, 1992). Other explanationsfor the observed patterns, such as inappropriate habitats,physical barriers, or unsuitable germination conditions,do not explain these patterns. The results of this studysuggest the following.
1) The dispersal ability of most species is limited.Therefore, dispersal rates may not keep pace with cli-matic change. Habitat fragmentation may further impedemigration. Extinction, reduced habitat diversity and lessefficient ecosystems will result. Dominant species maybe most prone to this effect if deterministic models de-veloped by Tilman and May (Tilman, 1994,1997; Tilmanet al., 1994) are valid. Human intervention may becomenecessary to disperse and promote the establishment ofmost. not just a few, species.
2) Initial species composition, partially determined bystochastic factors due to isolation, can persist. Strong de-terministic relationships between environmental factorsand species patterns may not develop, thus frustratinganalyses of plant-environment relationships.
3) The mass effect (Shmida and Ellner, 1984) predictsthat populations near their environmental limits are main-tained by chronic recruitment from adjacent populations.
828 AuBnrcaN JounNnl oF BorANy [Vol. 85
[eds.], Primary succession on land, 179-191. Blackweli ScientificPublications. London.
Har-pEnN, C. 8., .qxn M. E. HARMoN. 1983. Early plant succession onthe Muddy River mudflow, Mount St. Helens. American MidlandNaturalist I 10: 97-106.
HEFNER, R. A., M. J. BurLER, aNo C. K. Rnu-ly. 1996. Pseudoreplica-tion revisited. Ecology 77 : 2558-2562.
Htr-1, M. O., e.No H. G. Gaucn, Jn. 1980. Detrended correspondenceanalysis, an improved ordination technique. Vegetatio 42: 47-58.
HncHcocx, C. L., aNo A. CnoNeursr. 1973. Flora of the Pacific North-west. University of Washington Press, Seattle, WA.
Huzu-unnr, S. H. 1984. Pseudoreplication and the design of ecologicalfield experiments. Ecological Monographs 51: 187-211.
INouyE, R. S., eNo D. TILMAN. 1995. Convergence and divergence ofold-field vegetation after I I year's nitrogen addition. Ecologv 76:l 872- l 887.
KovecH, W. L. 1993. Multivariate statistical package (MVSP Plus 2.1).Institute of Earth Studies, Aberystwyth, Wales.
MarHsws, J. A., eNo R. J. WHrrrAKrn. 1987. Vegetation succession onthe Storbreen glacier foreland, Jotunheimen, Norway: a review.Arctic and Alpine Researcft l9: 385-395.
McCuNu, B., aNo T, E H. ALLEN. 1985. Will similar forests develop onsimilar sites? Canadian Journal of Botany 63:36'7-376.
Mr'srER, R. W., eNo S. T, A. Prcrsrr. 1994. A comparison of successionover l8 years in 10 contrasting old fields. Ecoktgy 75:387-392.
Pnnr, R. K. 1992. Community structure and ecosystem function. 1n D.C. Glenn-Lewin, R. K. Peet, and T. T. Veblen [eds.], Plant succes-s ion: theory and pract ice, 103-151. Chapman and Hal l , London.
PBrnacr, R. B., eNo S. L. MrAo. 1992. Dispersal can limit local plantdistribution. Consen,ation Biology 6: 513-519.
SHMTDA, A., eNo S. ELLNER. 198.1. Coexistence of plant species withsimilar niches. Vegetatio 58: 29-5-5.
T,ccewl, H. 1965. A study of volcanic vegetation in Sakurajima, south-west Japan. II. Distributional pattern and succcssion. Japan Journalof Botary, 19: 121-148.
Tr-ueN, D. 1994. Competition and biodiversity in spatially structuredhabi tats. Ecologv 75: 2-16.
1997. Community invasibility, recruirment limitation, andgrassland biodiversity. Ecology 78: 8l-92.
C. L. Lsnr,rau, .cNo C. YrN. 1997. Habitat destruction, dispersal,and deterministic extinction in competitive communities. AmericanNaturalist 149: 1O'7-435.
R. M. MAy, C. L. LTIHMAN, AND M. A. Nowar. 1994. Habitatdestruction and the extinction debt. Nature 371:65-66.
Tsuvuzarr, S., ,q.No R. oEr- Monal. 1995. Species attributes in earlyprimary succession. Journal of Vegetation Science 6: 517-522.
vAN DER Maensl, E. 1988. Vegetation dynamics: patterns in time andspace. Vegetatio 77 : 7-19.
Wooo, D. M., aNo R. DEL MoRAL. 1987. Mechanisms of early primarysuccession in subalpine habitats on Mount St. Helens. Ecologv 68:180,790.
AND -. 1988. Colonizing plants on the Pumice Plains,Mount St. Helens, Washington. American Journal oJ Botany 75:1228-1231.
This important effect may be restricted in fragmentedlandscapes where dispersal barriers accentuate the effectsof limited dispersal rates.
Additional questions result from this study. Do bioticprocesses eventually dominate community structure? Ifso, is heterogeneity ever fully suppressed? Finally, areearly stochastic effects ever fully erased?
LITERATURE CITED
ANeLyrcaL SoFTwARE. 1994. Statistix 4.1 for Windows-User's Man-ual. Analytical Software, Tallahassee, FL.
AsH, H. J., R. P Gnmranr-r-, aNo A. D. BnensHaw. 1994. The introduc-tion of native plant species on industrial waste heaps: a test ofimmigration and other factors affecting primary succession. ./al.rr-nal oJ Applied Ecology 3l:'14-84.
AusrIN, M. P 1980. Permanent quadrats: an interface for theory andpractice. Vegetatio 46: 1-10.
CunrsrtNssN, N. L., aNo R. K. PEET. 1984. Convergence during sec-ondary forest succession. Journal of Ecology 72:25-36.
CuvuaNs, J. 1981. Mud flows resulting fiom the May 18, 1980, erup-tion of Mount St. Helens, Washington. U. S. Geological SurveyCircular 850-8.
DEL MoRAL, R. 1983. Initial recovery of subalpine vegetation on MountSt. Helens. American Midland Naturalist lO9: i2-8O.
1993. Mechanisms of primary succession on volcanoes: a viewfrom Mount St. Helens. 1n J. Miles and D. H. Walton [eds.], pri-mary succession on land, 79-100. Blackwell Scientific publica-tions, London.
eNo L. C. Br-rss. 1993. Mechanisms of primary succession:insights resulting from the eruption of Mount St. Helens. Advancesin Ecological Research 24: 1-66.
J. H. Trrus, eNl A. M. CooK. 1995. Early primary successionon Mount St. Helens, Washington, IJSA. Journal of VegetationScience 6: 1O1-12O.
auo D. M. Wooo. 1988. Dynamics of herbaceous vegetationrecovery on Mount St. Helens, Washington, USA, afier a volcaniceruption. Vegetatio 74: l1-2'7.
AND - . 1993. Ear ly pr imary succession on a barren vol-canic plain at Mount St. Helens, Washington. American Journal ofBotany 80: 981-992.
F,q.rrH, D. P., P R. MrNcHrN, eNo L. BnLsrN. 1987. Compositional dis-similarity as a robust measure of ecological distance. Vegetatio 69:57-68.
FRANCIS, P 1993. Volcanoes, a planetary perspective. Clarendon press,Oxford.
GlsNN-LpwrN, D. C., eNo E. vAN DER Maannl. 1992. pattern and oro-cesses of vegetation dynamics. In D. C. Glenn-Lewin, R. K. peet,and T. T. Veblen [eds.], Plant succession: theory and practice, 1l-59. Chapman and Hall, London.
Gnev, A. J. 1993. The vascular plant pioneers of primary successions:persistence and phenotypic plasticity. In J. Miles and D. H. Walton