early spontaneous hyperperfusion after stroke
TRANSCRIPT
Brain (1996), 119, 409-419
Early spontaneous hyperperfusion after strokeA marker of favourable tissue outcome?\Gilles Marchal,1-2 Mauro Furlan,125 Vincent Beaudouin,13 Patrice Rioux,2 Jean Louis Hauttement,4
Carlo Serrati,1-2-5 Vincent de la Sayette,2-4 Francois Le Doze,24 Fausto Viader,2-4 Jean Michel Derlon14
and Jean Claude Baron12
'Cyceron Centre, 2INSERM U320, 3CEA DSV/DRM,4CHRU Cote de Nacre, University of Caen, Caen, Franceand the 5Clinica Neurologica Dell' Universita di Genova,Italy
Correspondence to: Jean Claude Baron, INSERM U320,Centre Cyceron, Bd Becquerel, BP 5229, 14074 CaenCedex, France
SummaryTo clarify the relationships between early hyperperfusion (i.e.the hallmark of early, efficient recanalization in animal strokemodels) and ultimate infarction, we have compared acute-stage perfusion PET images and chronic-stage CT scans inpatients with middle cerebral artery (MCA) stroke. We usedPET and the oxygen-15 (I5O) equilibrium method to obtaincerebral blood flow (CBF), cerebral blood volume (CBV),oxygen extraction fraction (OEF) and cerebral metabolicrate of oxygen consumption (CMR02) parametric images in30 consecutive, still symptomatic, first-ever MCA territorystroke patients without sign of haemorrhage at admission CTscan. Each subject was studied twice, first within 5-18 h ofstroke onset, and, in survivors, ~1 month later; a plain CTscan (co-registered with PET) was performed ~1 month afteronset. Following initial screening based on acute-stageperfusion images, 10 survivors with focal hyperperfusion inthe appropriate MCA territory confirmed by computer weredeclared eligible. In each patient, the topography and volumeof both hyperperfusion and infarction (delineated on late CTscan) were recorded, and all PET parameters were obtainedfor both areas and both times. The hyperperfused areasaffected the cortical MCA territory, often widely so and in a
patchy fashion; they were topographically distinct from, andconsistently larger than (P < 0.01, Wilcoxon sign test) thefinal infarcts, which were small and generally deep-seated.In none of the nine patients in whom it was successfullyperformed did transcranial Doppler reveal MCA stemocclusion. In the hyperperfused regions, the acute-stageperfusion, blood volume and oxygen consumption weresignificantly increased, and the OEF significantly reduced,while all these variables had significantly returned towardnormality in the chronic-stage PET study. The ultimatelyinfarcted area did not exhibit significant hyperperfusion inthe acute stage. The areas with acute-stage hyperperfusionexhibited haemodynamic and metabolic abnormalitiesconsistent with post-recanalization hyperperfusion, i.e. vaso-dilatation and 'luxury perfusion'. Increased oxidativemetabolism, previously reported only in animals, presumablyreflects an overshoot of protein synthesis. The fact that theareas with hyperperfusion, though extensive, were topo-graphically distinct from the infarcted region, suggests thatspontaneous non-haemorrhagic hyperperfusion, whendocumented 5-18 h after onset, is a harmless and evenperhaps beneficial phenomenon. These results haveimplications for clinical trials.
Keywords: cerebral ischaemia; PET; cerebral blood flow; cerebral metabolism; oxygen-15
Abbreviations: CBF = cerebral blood flow; CBV = cerebral blood volume; CMRO2 = cerebral metabolic rate of oxygenconsumption; MCA = middle cerebral artery; 15O = oxygen-15; OEF = oxygen extraction fraction; rCBF = regional cerebralblood flow; RI = recovery index; SPECT = single photon emission tomography; "Tc-HMPAO = technetium-99mhexamethylpropyleneamine oxime
Oxford University Press 1996
by guest on February 19, 2013http://brain.oxfordjournals.org/
Dow
nloaded from
410 G. Marchal et al.
IntroductionFocal cerebral hyperperfusion after stroke in man has longbeen documented (Lassen, 1966) and is a frequent, yetpoorly understood, phenomenon. Two-dimensional studies ofregional cerebral blood flow (rCBF) with Xenon-133 haveshown that hyperperfusion, early after stroke onset can beassociated with reversible deficit (Hartmann, 1985), whilelack of angiographically detectable occlusion is a consistentfinding (Paulson et al, 1970). The latter would be consistentwith animal experiments which show that following a periodof ischaemia, restoration of cerebral perfusion pressureconsistently results in a marked and variably prolongedhyperperfusion (Lassen, 1966; Tamura et al., 1980;Tasdemiroglu et al., 1992). Xenon-133 studies have alsoshown a frequent occurrence of focal hyperperfusion at latertimes, days to weeks after stroke onset; this kind of subacutehyperperfusion has been more often equated with infarction,though there appeared to be exceptions to this (Olsen et al.,1981, Olsen and Lassen, 1984; Sugiyama et al., 1986). Inthe classic studies of Olsen (Olsen et al., 1981; Olsen andLassen, 1984), however, the relationships between hyper-perfusion and infarction were made uncertain by the two-dimensional and unilateral nature of the rCBF studies. PETis presently the method of reference to assess focalhyperperfusion after stroke because it allows quantitative,simultaneously bilateral and high-resolution tomographicimaging of both CBF and oxygen consumption (Baron,1991). However, and despite these advantageous features,the relationships between hyperperfusion and tissue outcomehave remained unclear. Several PET studies documented thatsubacute hyperperfusion was almost always associated withtissue necrosis (Baron et al., 1981; Lenzi et al, 1982; Baron,1987; Hakim et al, 1987; Ackerman et al, 1989; Fink et al,1993), while acute-stage hyperperfusion unassociated withextensive severe hypometabolism always heralded excellentclinical outcome (Marchal et al, 1993, 1995). Theseapparently conflicting findings would, however, be consistentwith recent studies which show that the time of occurrenceof reperfusion after MCA occlusion in the rat might be acritical factor for tissue outcome (Memezawa et al, 1992;Minematsu et al, 1993). As of today, no study has assessedin a three-dimensional way the topographical relationshipsbetween acute-stage hyperperfusion and ultimate braininfarction in man.
The aims of the present study were thus: (i) to establish,by means of combined PET and CT scanning, the relationshipsbetween early spontaneous hyperperfusion and tissueoutcome; (ii) to analyse the pathophysiological basis ofsuch relationships by measuring the combined alterations incerebral haemodynamics and oxygen consumption in thehyperperfused and the infarcted brain regions.
Patients and methodsPatientsPatients, aged > 18 years, with first-ever acute MCA territoryischaemia/infarction, diagnosed on clinical and CT grounds
<18 h from onset, were selected among all stroke patientsadmitted in the Medical Emergency Department of the CaenUniversity Hospital over the period between 1990 and 1993.All patients had a full neurological assessment by one of theauthors (G.M.) at admission. Patients symptom-free at thetime of PET study or with haemorrhage on admission CTscan or with marked obtundation of consciousness, typicallacunar syndrome, recent myocardial infarction, or otherorgan failure were excluded from the study. After informedconsent was obtained from the patient or his/her nearestrelatives, enrolled patients were not given cerebrovascular-directed therapies (e.g. calcium channel blockers); arterialhypertension was treated only if systolic blood pressureexceeded 220 mmHg. We used the Orgogozo's MCA strokescale (Orgogozo and Dartigues, 1991) to quantify theneurological deficits just before the PET study (day 0) andat 2 months (day 60) follow-up; this validated scale rangesfrom 0 to 100, with a score of 100 being normal neurologicalstatus. The percentage of neurological recovery was assessedusing Martinez-Vila's recovery index (RI): RI = (day 60-day 0)/( 100-day 0) (Martinez-Vila et al, 1990). A cervicaland a transcranial doppler ultrasound study was performedafter PET and within the first 48 h after onset. Blood sampleswere withdrawn for usual blood tests, particularly bloodsugar levels. In survivors, PET studies were repeated ~1month later; a late CT scan was also performed {see below).
PET scanning procedure (for details, seeMarchal et aL, 1992)Patients were scanned on a LETI TTV03 camera, which hasa high physical spatial resolution (5.5X5.5X9 mm), andallows seven brain transversal slices. We used the classicalI5O steady-state inhalation technique with CI5O2, CI5O andI5O2 to measure CBF, CBV, OEF and CMR02. Followingnoise filtering, the lateral (x, y) resolution in the reconstructedimages was ~11 mm. Measured OEF was corrected for theunextracted label remaining in the vascular space, accordingto a published procedure (Baron et al, 1989). We used theFox method (Fox et al, 1985) for head positioning (andrepositioning) at both PET studies; this stereotaxic approach,based on the glabella—inion line seen on a lateral skull X-ray, was also used for late CT scanning procedures. Theseven transverse slices cut the brain, parallel to the glabella-inion line at levels: -4, +8, +20, +32, +44, +56 and +68mm from this line. A transmission scan with an externalsource of germanium-68 was performed before each studyfor attenuation correction. Arterial whole blood and plasmaI5O activity, blood gases, haemoglobin and pH were measuredwith six arterial blood samples (1 ml each) for each acquisitionperiod. Heart rate and blood pressure were monitoredcontinuously. Studies were performed at rest with eyes closed,ears partially blocked and in a quiet environment with dimmedlight. C'5O2,
I5O2 and CI5O matrices were transformed pixel-
by guest on February 19, 2013http://brain.oxfordjournals.org/
Dow
nloaded from
Hyperperfusion and tissue outcome after stroke 411
by-pixel into CBF, OEF, CMRO2 and CBV images bymeans of well-validated equations (Frackowiak et al., 1980).Parametric images from both PET studies were exactlyrealigned and late CT was co-registered with PET. The PETprocedure has been approved by the Ethics Committeeof Caen.
Brain CT scanWe used a CGR CE 12-000 model scanner (CompagnieGe'ne'rale de Radiologie, Buc, France; resolution:1.5X 1.5X5.0 mm, x, y, z). A CT scan was performed in eachsubject twice (both unenhanced), once at admission to excludehaemorrhage or other non-ischaemic brain disease, and thenrepeated in survivors 30-60 days later to evaluate tissueoutcome and obtain an index of infarct volume, if present.At this second CT study, we used the same stereotaxicpositioning procedure and studied the same seven planes asfor both PET scanning sessions (see above).
Eligibility of patientsAmong all consecutive patients evaluated by PET accordingto the above criteria and procedure, patients with earlyspontaneous hyperperfusion were selected according to thetwo following criteria: (i) early spontaneous hyperperfusionon CBF images; (ii) availability of late CT scan to assesstissue outcome. The former criterion entailed a selection ofpatients according to a two-step procedure, as follows. First,the sets of CBF images for all patients were displayed usinga 17 level-colour scale (Fig. 1A), and three neurologists withexperience in PET imaging (V.d.l.S., F.V. and J.C.B.), unawareof clinical and CT scan data, but aware of the clinicallyaffected side, were asked independently to select thosepatients with possible hyperperfusion on any PET plane butwithin the clinically appropriate MCA territory, relative tothe unaffected side. Then, the PET images from all patientswith possible hyperperfusion identified by any one of thesethree observers were subjected to an objective image analysisprocedure to establish or disprove the presence ofhyperperfusion (see below); as a quality control, the patientsnot selected by the visual procedure were also subjected tothe computerized analysis. Regarding the second criterion(i.e. the availability of a late CT scan), it implied that onlystroke survivors would be potentially eligible in the final stage.
parametric values in the acutely hyperperfused regions aswell as in the ultimately infarcted region both in the acuteand in the chronic stage. This procedure ran as follows.
Delineation of hyperperfused regionsThe hyperperfused regions in the relevant MCA territorywere delineated plane by plane by a computer-generatedpercentage isocontour routine. This was done on the fiveupper PET planes (i.e. glabella-inion +20 to glabella-inion+68 mm), which contain the MCA territory. The finallyapplied value (in percent of peak voxel value) was selectedaccording to a trial-and-error, real-time user-interactiveprocedure, such that the CBF in all the 1X1X9 mm voxelsincluded in each final isocontour lay above the maximumvoxel value in the homologous contralateral isocontour(s)(Fig. IB). This conservative procedure generated one orseveral 'functional' regions-of-interest, together with theirmirror regions on the contralateral hemisphere (Fig. IB). Theintegrated surface of all hyperperfusion regions of interestwere then computed for each PET plane and summed acrossall PET slices to obtain an index of hyperperfused tissuevolume (in square centimetres).
Delineation of the infarct region of interestUsing the same software, the contours of hypodensity werevisually delineated plane-by-plane on day 30-60 plain CTscans, and, then, projected onto corresponding co-registeredand matrix realigned PET cuts for topographical comparisonto the hyperperfusion regions of interest. Infarct areas werecalculated and summed as above to obtain an index ofinfarcted tissue volume (also in square centimetres).
Calculation of PET variablesFor each variable (i.e. CBF, CMR02, OEF, CBV and CBF/CBV) the mean value for all the 1X1X9 mm voxels includedin the regions of interest with hyperperfusion and theircontralateral mirror regions of interest (defined on the CBFimages) was calculated. This was also applied to the sameregions of interest projected onto co-registered late PETimages (Fig. 1C). The same procedure was used to obtainthe parametric values for the infarct regions of interest.
Parametric image analysisThe strategy for image analysis was specially designed forthe following purposes: (i) to formally establish or disprovethe presence of focal hyperperfusion on acute-stage CBFimages by means of an objective method which entailedcomputer-delineation of the hyperperfused areas; (ii) tocompare the topography and volume of these hyperperfusedregions with those of the infarcted area, as defined on co-registered late CT scan (see below); (iii) to measure the PET
Statistical analysisThe volume indices for the hyperperfusion and for the infarctregions of interest were compared, using the non-parametricWilcoxon sign test for paired samples. The PET physiologicalvalues in these regions of interest were compared to thosein their mirror regions of interest by means of the non-parametric Wilcoxon signed rank test (BMDP software). Thevalues for each variable at the first PET study were comparedwith those in the same regions of interest at the second PET
by guest on February 19, 2013http://brain.oxfordjournals.org/
Dow
nloaded from
412 G. Marchal et al.
Fig. 1
Fig. 2
by guest on February 19, 2013http://brain.oxfordjournals.org/
Dow
nloaded from
Hyperperfusion and tissue outcome after stroke 413
study by means of the same test. Statistical significance wasaccepted if two-tailed P values were < 0.05.
ResultsClinical materialFrom our sample of 30 consecutive MCA stroke patients(mean age±SD: 73 ±10 years), all studied with PET within5-18 h after the onset of clinical signs, 13 patients withpossible hyperperfusion in the appropriate MCA territorywere selected based on the independent visual assessment ofthe three observers (full agreement for five patients, two outof three agreements for three patients, and one out of threefor five patients). Of these 13 patients, three (all belongingto the latter group) were secondarily rejected, two in whomhyperperfusion could not be confirmed objectively with thecomputerized analysis, and one because early death fromextensive infarction at day 10 prevented assessment of tissueoutcome (an autopsy was refused; see Discussion for furtherdescription of this case); in none of the 17 patients notselected by the visual procedure did the computerized analysisdocument hyperperfusion. Thus, focal hyperperfusion wasconfirmed objectively in 10 patients in whom a late CT scanwas available, and these 10 patients were declared eligible.Their clinical and ultrasound data are summarized in Table 1(they have been reported previously as 'pattern III'; Marchalet ai, 1993, 1995). They did not differ from our generalstroke population by either age (72±9 years) or intervalbetween clinical onset and PET study (mean±SD: 10.1 ±4.5h); the gender ratio was 5:5. There was a possible cardiacsource of embolism in five cases. The Doppler ultrasoundexaminations showed an unoccluded MCA stem in ninepatients (no temporal bone window was found in one patient);MCA branch occlusion was suspected in two cases, whilecarotid artery stenosis or occlusion at the cervical level wasfound in three patients. In Patient 10, the study disclosedreduced distal vascular resistance and increased MCA branch
systolic velocities on the affected side, suggesting'vasoplegia' (see below). Overall, therefore, an embolicmechanism for stroke could be suspected in all 10 patients.They all had mild to moderate initial neurological impairment,with MCA scores ranging from 55 to 95. Nine subjects werestill symptomatic after 24 h, but all 10 had an excellentoutcome/recovery after 2 months follow-up (MCA scorerange: 95-100, RI > 88%). Admission CT scan was normalin all or showed trivial age-related mild atrophy.
Biological and physiological dataNo patient was diabetic and admission blood sugar levelswere within the normal physiological limits in all. ArterialpCO2, assessed at both PET studies remained within normallimits in all patients.
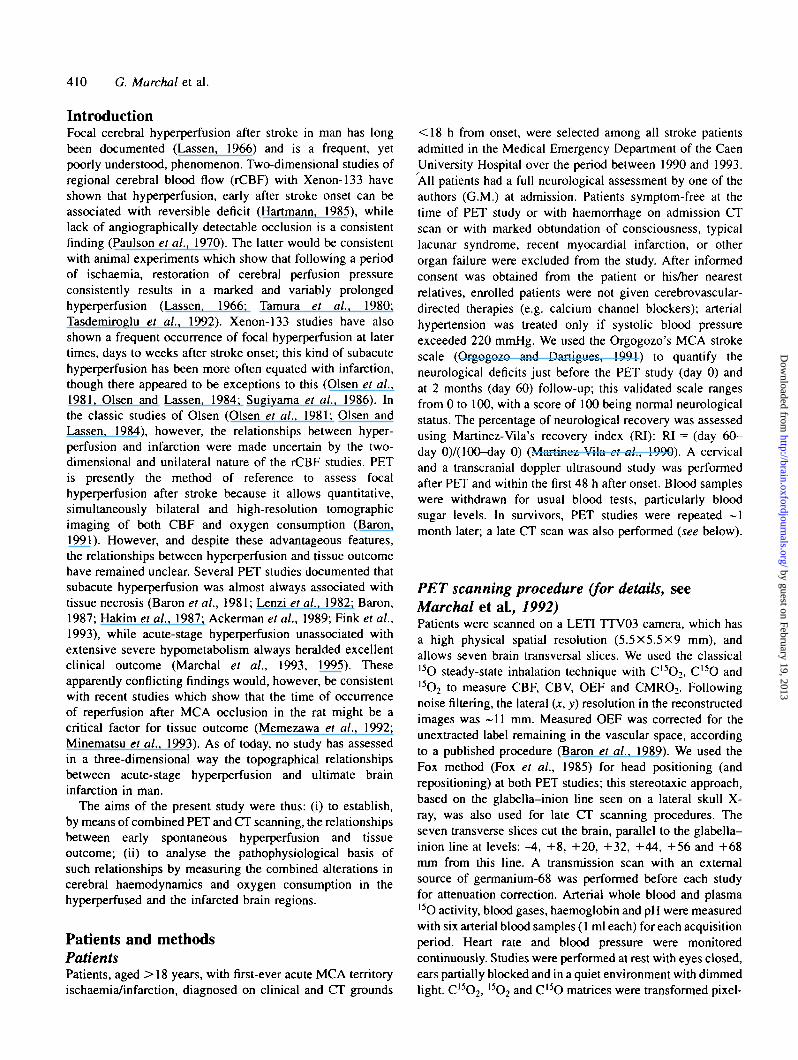
Late CT scanChronic-stage CT scans, performed according to theprocedure described in Patients and methods, wereunremarkable in two patients (1 and 2) and showed smallinfarcts in the remaining eight (<4 cm, in largest diameter);in seven of these eight cases, the hypodensity was deep-seated in the MCA territory, while it affected the parietalcortex in the last case (Patient 8) (see Figs 2 and 3).
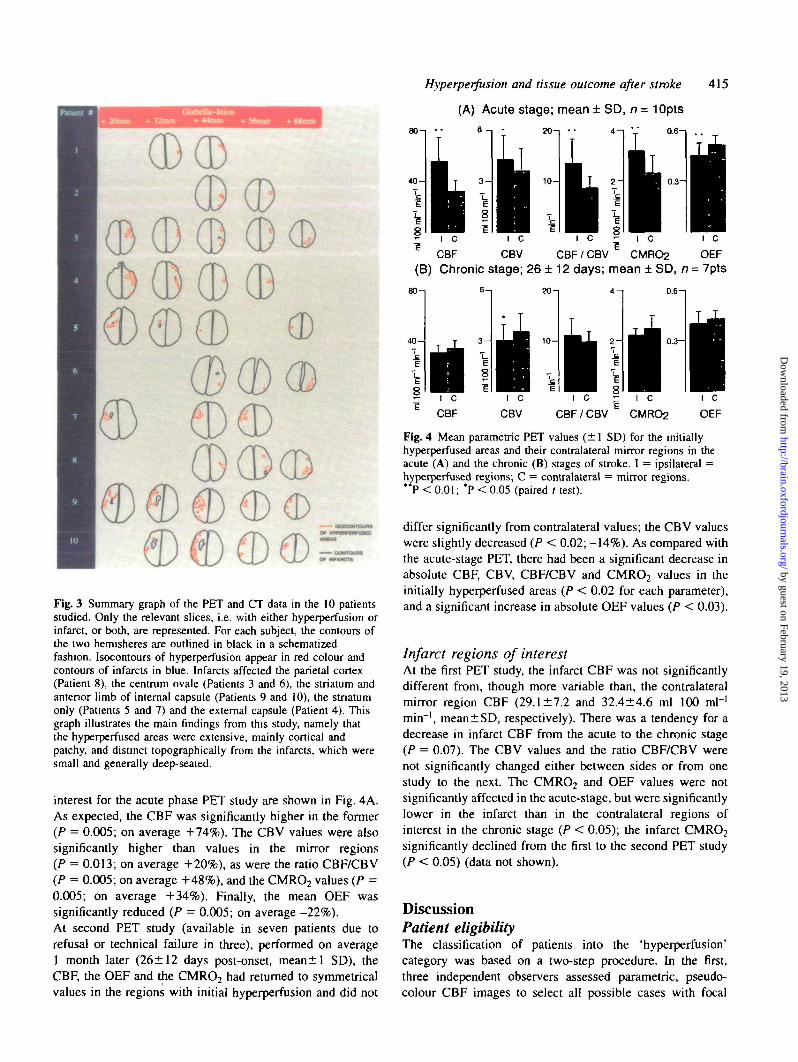
Topography of the hyperperfusion regions ofinterest and comparison to the infarct regionsof interestThe topography of the hyperperfusion and the infarct regionsof interest are illustrated for one patient in Fig. 2 and sketchedfor all 10 patients in Fig. 3. In contrast to the infarcts,the regions with hyperperfusion were often extensive andwidespread, generally patchy, and clearly predominantly
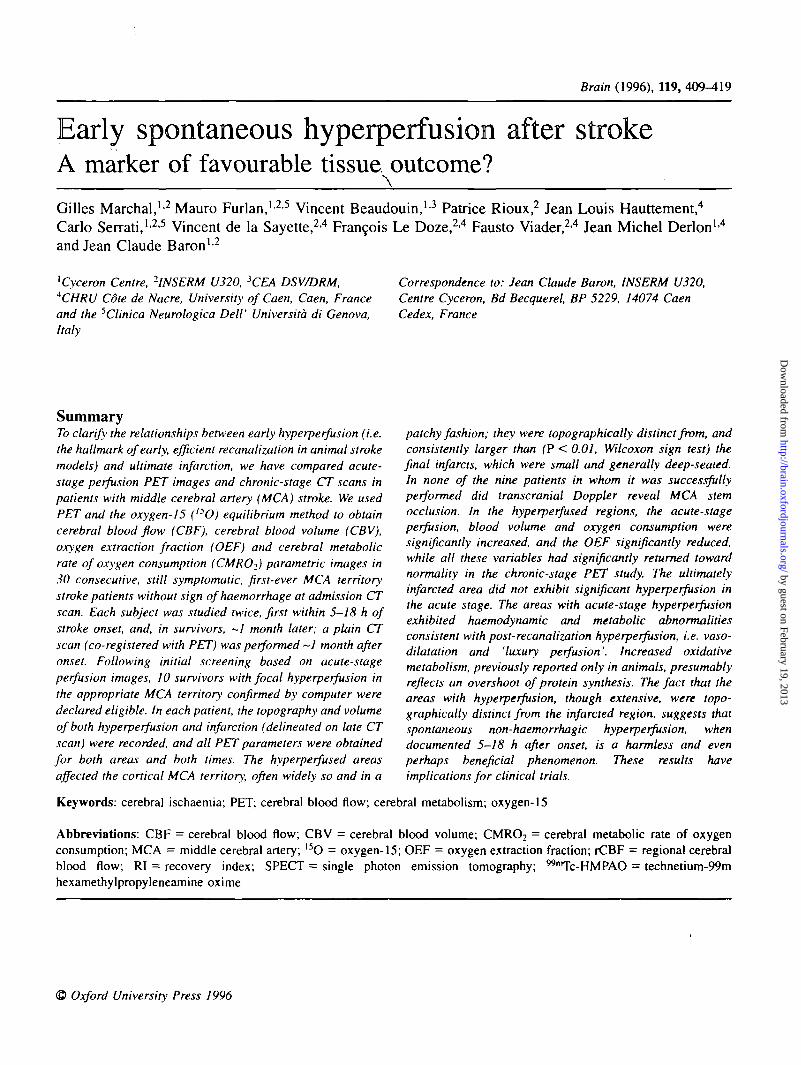
Fig. 1 (A) Illustrative parametric CBF image (obtained parallel to and 44 mm above the glabella-inion line) showing clearcut areas ofhyperperfusion (arrows) in the right middle cerebral artery (MCA) territory, as compared to the left MCA territory. The colour scalingwas adapted by a non-observer (G.M.) such that patches of maximum pixel values were displayed in white for all patients. In this case(Patient 9), disjointed hyperperfused areas are distributed throughout most of the affected MCA territory; the white patches visibleoutside the MCA territory near the midline represent normal findings and were considered neither for the visual nor for the computerizedimage analysis. (B) Areas of hyperperfusion were delineated with computer-generated isocontours based on a percentage of the peakvoxel value. The latter was adjusted interactively so that all the final isocontour(s) in the MCA territory included only voxels with CBFvalues above the maximum pixel value in the contralateral homologous regions (see Patients and methods). Once defined, theseisocontour(s) were registered one by one as regions-of-interest, and were then copied by symmetry onto the contralateral hemisphere.Note that this method is conservative, as the final isocontours tend to underestimate the extent of hyperperfusion as apparent visually.(C) The regions-of-interest defined on both hemispheres on the acute-stage PET images were then projected upon the corresponding co-registered PET planes obtained in the chronic stage. This case (Patient 9) illustrates the disappearance of acute-stage hyperperfusion atthe chronic stage, with return to essentially symmetrical CBF (within normal noise limits).
Fig. 2 Illustrative co-registered PET CBF and corresponding CT images obtained in Patient 9, 13 h and 30 days after stroke onset,respectively. The PET CBF image is presented according to a pseudo-colour scale with pixel values ranging from 0-70 ml 100 ml"'min~'. Hyperperfused areas (delineated by white isocontours—see Patients and methods and Fig. IB) are patchy and widely distributedover the entire cortical MCA territory, and show virtually no overlap with the infarct (shown on the CT images), which is small andrestricted to the deep MCA territory (a questionable area of periventricular hypodensity on plane +44 mm was not considered evidenceof infarction; note also the dilated sylvian fissure overlying the subcortical cavitary infarct).
by guest on February 19, 2013http://brain.oxfordjournals.org/
Dow
nloaded from
414 G. Marchal et al.
Table 1 Clinical and ultrasound data
Patient Age/ Stroke to PENo. gender Interval (h)
Past medicalhistory
MI
HBP
HBP
Pace-makerHBPAF
MI
HBP, MI
HBP,dyslipemia
Symptoms
Aphasia,apraxiaAphasia,R hemiparesisR hemisensorydeficitAphasia,R hemiparesisL hemiparesis,visual neglectAphasia
Aphasia,L hemiparesis,L hemianopiaAphasia
L hemiparesis,L hemisensorydeficitL hemiparesis,neglect
MCA
Day 0
95
85
95
90
90
90
55
95
55
75
score*
Day 60
100
100
100
100
100
100
100
100
95
100
Doppler
Normal
L distal MCAocclusionNormal
Normal
R carotidstenosisNormal
R carotidocclusion
L carotidstenosisR distal MCAocclusion
RMCA'vasoplegia'
1
2
3
4
5
6
7
67/F
85/F
64/F
69/F
73/F
89/M
61/M
8
5
5
15
18
8
14
10
76/M
67/M
71/M
13
F = female; M = male; MI = myocardial infarction; R = right;AF = atria! fibrillation; TCD not feasible in patient 5. *Score onscale of Orgogozo et al. (1991).
L = left; HBP = high blood pressure;the middle cerebral artery (MCA)
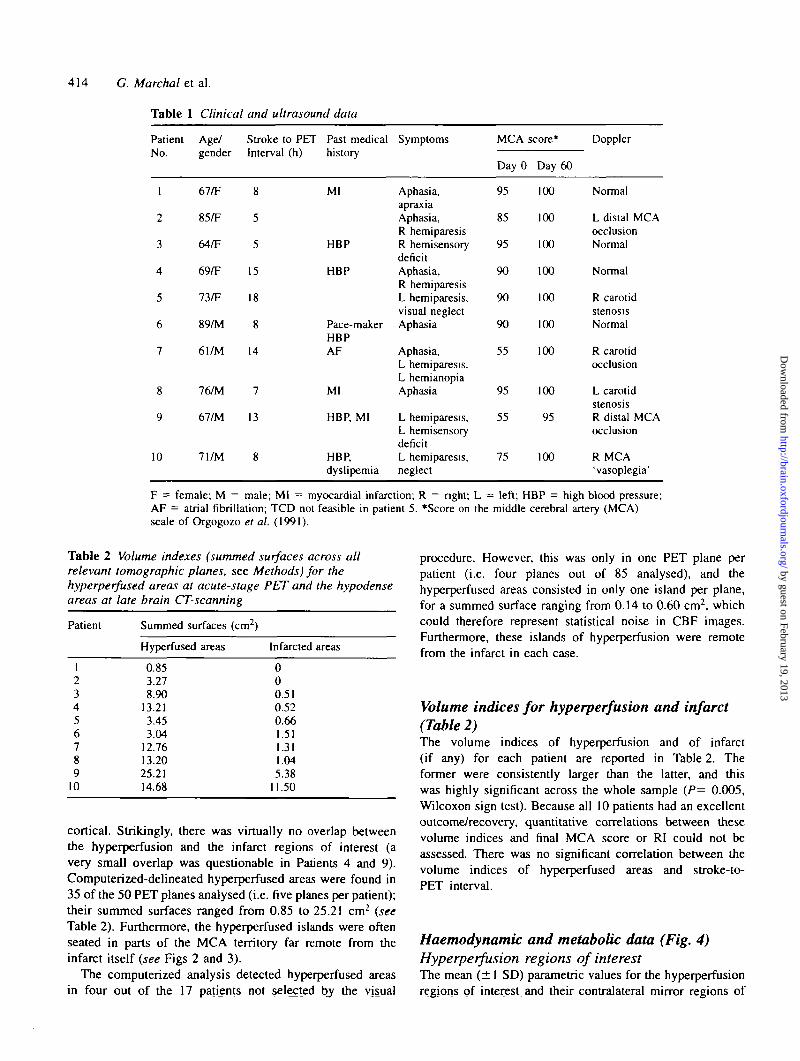
Table 2 Volume indexes (summed surfaces across allrelevant tomographic planes, see Methods) for thehyperperfused areas at acute-stage PET and the hypodenseareas at late brain CT-scanning
Patient
123456789
10
Summed surfaces (cm2)
Hyperfused areas
0.853.278.90
13.213.453.04
12.7613.2025.2114.68
Infarcted areas
000.510.520.661.511.311.045.38
11.50
cortical. Strikingly, there was virtually no overlap betweenthe hyperperfusion and the infarct regions of interest (avery small overlap was questionable in Patients 4 and 9).Computerized-delineated hyperperfused areas were found in35 of the 50 PET planes analysed (i.e. five planes per patient);their summed surfaces ranged from 0.85 to 25.21 cm2 (seeTable 2). Furthermore, the hyperperfused islands were oftenseated in parts of the MCA territory far remote from theinfarct itself (see Figs 2 and 3).
The computerized analysis detected hyperperfused areasin four out of the 17 patients not selected by the visual
procedure. However, this was only in one PET plane perpatient (i.e. four planes out of 85 analysed), and thehyperperfused areas consisted in only one island per plane,for a summed surface ranging from 0.14 to 0.60 cm2, whichcould therefore represent statistical noise in CBF images.Furthermore, these islands of hyperperfusion were remotefrom the infarct in each case.
Volume indices for hyperperfusion and infarct(Table 2)The volume indices of hyperperfusion and of infarct(if any) for each patient are reported in Table 2. Theformer were consistently larger than the latter, and thiswas highly significant across the whole sample (P= 0.005,Wilcoxon sign test). Because all 10 patients had an excellentoutcome/recovery, quantitative correlations between thesevolume indices and final MCA score or RI could not beassessed. There was no significant correlation between thevolume indices of hyperperfused areas and stroke-to-PET interval.
Haemodynamic and metabolic data (Fig. 4)Hyperperfusion regions of interestThe mean (± 1 SD) parametric values for the hyperperfusionregions of interest and their contralateral mirror regions of
by guest on February 19, 2013http://brain.oxfordjournals.org/
Dow
nloaded from
(D(D(DO
Ct) CD CD CD
(D(D(D(D<D
Fig. 3 Summary graph of the PET and CT data in the 10 patientsstudied. Only the relevant slices, i.e. with either hyperperfusion orinfarct, or both, are represented. For each subject, the contours ofthe two hemisheres are outlined in black in a schematizedfashion. Isocontours of hyperperfusion appear in red colour andcontours of infarcts in blue. Infarcts affected the parietal cortex(Patient 8), the centrum ovale (Patients 3 and 6), the striatum andanterior limb of internal capsule (Patients 9 and 10), the stratumonly (Patients 5 and 7) and the external capsule (Patient 4). Thisgraph illustrates the main findings from this study, namely thatthe hyperpcrfused areas were extensive, mainly cortical andpatchy, and distinct topographically from the infarcts, which weresmall and generally deep-seated.
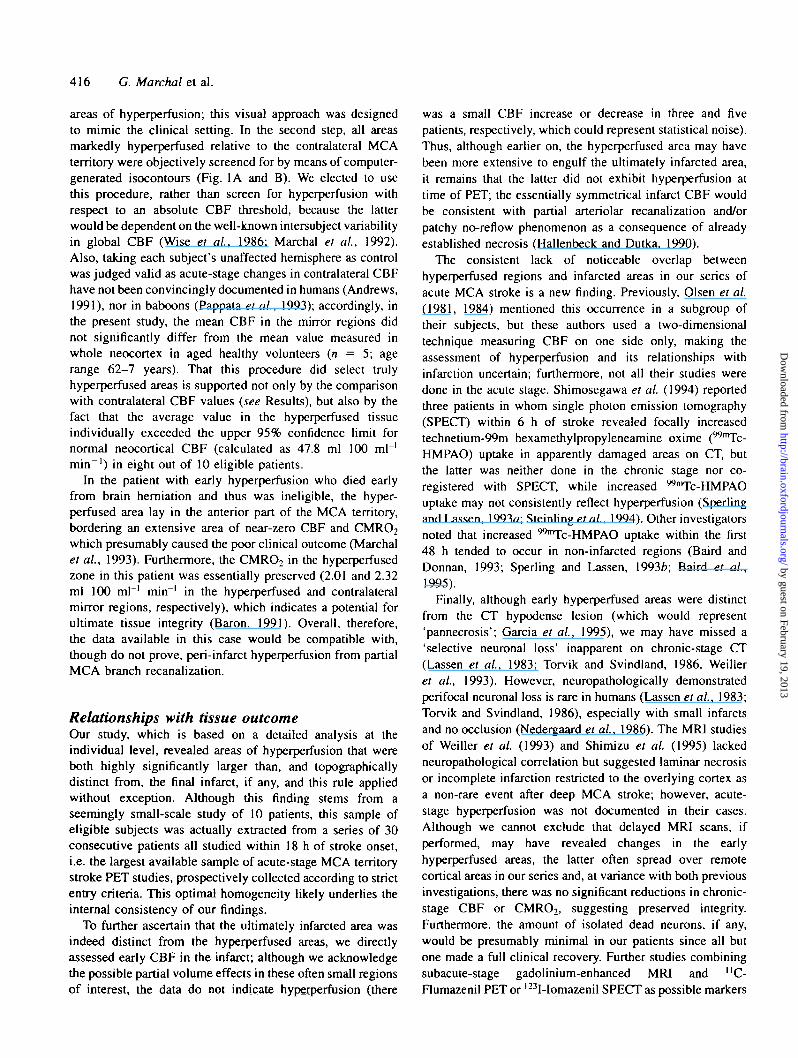
interest for the acute phase PET study are shown in Fig. 4A.As expected, the CBF was significantly higher in the former(P = 0.005; on average +74%). The CBV values were alsosignificantly higher than values in the mirror regions(P = 0.013; on average +20%), as were the ratio CBF/CBV(P = 0.005; on average +48%), and the CMRO2 values (P =0.005; on average +34%). Finally, the mean OEF wassignificantly reduced (P = 0.005; on average -22%).At second PET study (available in seven patients due torefusal or technical failure in three), performed on average1 month later (26±12 days post-onset, mean±l SD), theCBF, the OEF and the CMRO2 had returned to symmetricalvalues in the regions with initial hyperperfusion and did not
Hyperperfusion and tissue outcome after stroke
(A) Acute stage; mean ± SD, n = 10pts
415
80-1
4 0 -
20-i
1 0 -
0.6-1
03-
CBF/CBV
(B) Chronic stage; 26 ± 12 days; mean ± SD, n = 7pts
•20 - i
•° I C1 CBF
I i III C I C ^ I C I C
CBV CBF/CBV E CMRO2 OEF
0.6-.
Fig. 4 Mean parametric PET values (±1 SD) for the initiallyhyperperfused areas and their contralateral mirror regions in theacute (A) and the chronic (B) stages of stroke. I = ipsilateral =hyperperfused regions; C = contralateral = mirror regions.
P < 0.01; *P < 0.05 (paired 1 test).
differ significantly from contralateral values; the CBV valueswere slightly decreased (P < 0.02; -14%). As compared withthe acute-stage PET, there had been a significant decrease inabsolute CBF, CBV, CBF/CBV and CMRO2 values in theinitially hyperperfused areas (P < 0.02 for each parameter),and a significant increase in absolute OEF values (P < 0.03).
Infarct regions of interestAt the first PET study, the infarct CBF was not significantlydifferent from, though more variable than, the contralateralmirror region CBF (29.1 ±7.2 and 32.4±4.6 ml 100 ml"1
min~', mean±SD, respectively). There was a tendency for adecrease in infarct CBF from the acute to the chronic stage(P = 0.07). The CBV values and the ratio CBF/CBV werenot significantly changed either between sides or from onestudy to the next. The CMR02 and OEF values were notsignificantly affected in the acute-stage, but were significantlylower in the infarct than in the contralateral regions ofinterest in the chronic stage (P < 0.05); the infarct CMR02
significantly declined from the first to the second PET study(P < 0.05) (data not shown).
DiscussionPatient eligibilityThe classification of patients into the 'hyperperfusion'category was based on a two-step procedure. In the first,three independent observers assessed parametric, pseudo-colour CBF images to select all possible cases with focal
by guest on February 19, 2013http://brain.oxfordjournals.org/
Dow
nloaded from
416 G. Marchal et al.
areas of hyperperfusion; this visual approach was designedto mimic the clinical setting. In the second step, all areasmarkedly hyperperfused relative to the contralateral MCAterritory were objectively screened for by means of computer-generated isocontours (Fig. 1A and B). We elected to usethis procedure, rather than screen for hyperperfusion withrespect to an absolute CBF threshold, because the latterwould be dependent on the well-known intersubject variabilityin global CBF (Wise et al, 1986; Marchal et al, 1992).Also, taking each subject's unaffected hemisphere as controlwas judged valid as acute-stage changes in contralateral CBFhave not been convincingly documented in humans (Andrews,1991), nor in baboons (Pappata et al., 1993); accordingly, inthe present study, the mean CBF in the mirror regions didnot significantly differ from the mean value measured inwhole neocortex in aged healthy volunteers {n = 5; agerange 62-7 years). That this procedure did select trulyhyperperfused areas is supported not only by the comparisonwith contralateral CBF values {see Results), but also by thefact that the average value in the hyperperfused tissueindividually exceeded the upper 95% confidence limit fornormal neocortical CBF (calculated as 47.8 ml 100 ml"1
min~') in eight out of 10 eligible patients.
In the patient with early hyperperfusion who died earlyfrom brain hemiation and thus was ineligible, the hyper-perfused area lay in the anterior part of the MCA territory,bordering an extensive area of near-zero CBF and CMR02
which presumably caused the poor clinical outcome (Marchalet al, 1993). Furthermore, the CMR02 in the hyperperfusedzone in this patient was essentially preserved (2.01 and 2.32ml 100 ml"1 min"1 in the hyperperfused and contralateralmirror regions, respectively), which indicates a potential forultimate tissue integrity (Baron, 1991). Overall, therefore,the data available in this case would be compatible with,though do not prove, peri-infarct hyperperfusion from partialMCA branch recanalization.
Relationships with tissue outcomeOur study, which is based on a detailed analysis at theindividual level, revealed areas of hyperperfusion that wereboth highly significantly larger than, and topographicallydistinct from, the final infarct, if any, and this rule appliedwithout exception. Although this finding stems from aseemingly small-scale study of 10 patients, this sample ofeligible subjects was actually extracted from a series of 30consecutive patients all studied within 18 h of stroke onset,i.e. the largest available sample of acute-stage MCA territorystroke PET studies, prospectively collected according to strictentry criteria. This optimal homogeneity likely underlies theinternal consistency of our findings.
To further ascertain that the ultimately infarcted area wasindeed distinct from the hyperperfused areas, we directlyassessed early CBF in the infarct; although we acknowledgethe possible partial volume effects in these often small regionsof interest, the data do not indicate hyperperfusion (there
was a small CBF increase or decrease in three and fivepatients, respectively, which could represent statistical noise).Thus, although earlier on, the hyperperfused area may havebeen more extensive to engulf the ultimately infarcted area,it remains that the latter did not exhibit hyperperfusion attime of PET; the essentially symmetrical infarct CBF wouldbe consistent with partial arteriolar recanalization and/orpatchy no-reflow phenomenon as a consequence of alreadyestablished necrosis (Hallenbeck and Dutka, 1990).
The consistent lack of noticeable overlap betweenhyperperfused regions and infarcted areas in our series ofacute MCA stroke is a new finding. Previously, Olsen et al.(1981, 1984) mentioned this occurrence in a subgroup oftheir subjects, but these authors used a two-dimensionaltechnique measuring CBF on one side only, making theassessment of hyperperfusion and its relationships withinfarction uncertain; furthermore, not all their studies weredone in the acute stage. Shimosegawa et al (1994) reportedthree patients in whom single photon emission tomography(SPECT) within 6 h of stroke revealed focally increasedtechnetium-99m hexamethylpropyleneamine oxime (WnTc-HMPAO) uptake in apparently damaged areas on CT, butthe latter was neither done in the chronic stage nor co-registered with SPECT, while increased "Tc-HMPAOuptake may not consistently reflect hyperperfusion (Sperlingand Lassen, 1993a; Steinling et al, 1994). Other investigatorsnoted that increased ""Tc-HMPAO uptake within the first48 h tended to occur in non-infarcted regions (Baird andDonnan, 1993; Sperling and Lassen, 1993b; Baird et al,1995).
Finally, although early hyperperfused areas were distinctfrom the CT hypodense lesion (which would represent'pannecrosis'; Garcia et al, 1995), we may have missed a'selective neuronal loss' inapparent on chronic-stage CT(Lassen et al., 1983; Torvik and Svindland, 1986, Weilleret al, 1993). However, neuropathologically demonstratedperifocal neuronal loss is rare in humans (Lassen et al, 1983;Torvik and Svindland, 1986), especially with small infarctsand no occlusion (Nedergaard et al, 1986). The MRI studiesof Weiller et al (1993) and Shimizu et al (1995) lackedneuropathological correlation but suggested laminar necrosisor incomplete infarction restricted to the overlying cortex asa non-rare event after deep MCA stroke; however, acute-stage hyperperfusion was not documented in their cases.Although we cannot exclude that delayed MRI scans, ifperformed, may have revealed changes in the earlyhyperperfused areas, the latter often spread over remotecortical areas in our series and, at variance with both previousinvestigations, there was no significant reductions in chronic-stage CBF or CMRO2, suggesting preserved integrity.Furthermore, the amount of isolated dead neurons, if any,would be presumably minimal in our patients since all butone made a full clinical recovery. Further studies combiningsubacute-stage gadolinium-enhanced MRI and "C-Flumazenil PET or l23I-Iomazenil SPECT as possible markers
by guest on February 19, 2013http://brain.oxfordjournals.org/
Dow
nloaded from
Hyperperfusion and tissue outcome after stroke 417
of neuronal death (Sette et al, 1993; Nakagawara et al.,1995) may clarify this issue.
Pathophysiological considerationsIn his classic CBF studies with angiographic data, Paulson(Paulson, 1970; Paulson et al, 1970) found that earlyhyperperfusion always correlated with normal carotidangiograms, while MCA occlusion was always associatedwith reduced flow in the early stage (within 24 h of onset).Consistent with this, in none of our cases was there evidenceof MCA main stem occlusion on early post-PET transcranialDoppler studies (successful in nine of 10 patients; as westudied essentially elderly subjects with mild to moderateneurological deficit, an angiogram was not clinicallyindicated). There are several suggestions from our data infavour of spontaneous MCA recanalization which occurredat some undefined point in time before the PET study, earlyafter stroke onset, and caused the observed hyperperfusion(thus far, other mechanisms for early hyperperfusion, e.g.inflammation, have not been documented). First, embolismwas the clinically suspected stroke mechanism in each of our10 patients, and embolic occlusions are especially prone toearly recanalization (Fieschi et al., 1989). Secondly, ourincidence of early hyperperfusion (about one in three)corresponds well to the known rate of occurrence ofangiographically proven spontaneous recanalization (Hakimet al, 1987; Fieschi et al., 1989). Thirdly, the small size anddeep location of the infarct in seven out of eight patientswould be consistent with lenticulostriate artery mouthocclusion during transient MCA embolism (Minematsu et al.,1992; Ringelstein et al, 1992; Baird et al, 1995). Fourthly,the often widespread extent of hyperperfusion over the entirelateral cortical ribbon would be consistent with prior MCAstem occlusion. This interpretation would also be consistentwith classic studies in animals, which have long documentedthat recirculation after a period of arterial occlusion inducesan abrupt tissue hyperperfusion (Tamura et al, 1980;Tasdemiroglu et al, 1992), whose amplitude and durationare proportional to both the severity and length of priorischaemia (Gourley and Heistad, 1984) and can exceed atwo-fold increase from normal level and last several hours(Tamura et al, 1980). Two additional pieces of evidencefrom the PET variables further support the idea that weobserved the equivalent of such early post-ischaemichyperperfusion: (i) the finding of a significant increase inCBV, consistent with abnormal vasodilatation in the faceof restored perfusion pressure ('vasoplegia'; Lassen, 1966;Paulson et al, 1970), a phenomenon previously onlydocumented in animal stroke models (Tasdemiroglu et al,1992), and in which several biochemical processes triggeredby ischaemia and/or reperfusion have been implicated(Macfarlane et al, 1991; Dawson et al, 1992; Nelson et al,1992); (ii) the finding of a significant decrease in the OEF('luxury perfusion'; Lassen, 1966).
A paradoxical finding was that, while the OEF was low,
the CMRO2 was significantly increased in the hyperperfusedregions. This enhanced oxidative metabolism may havecontributed to the development of hyperperfusion, super-imposed on the 'vasoparalysis' mechanism. A prolongedovershoot of energy metabolism and brain oxygenconsumption after recirculation has been previously reportedin gerbils (Levy and Duffy, 1977) and cats (Hossmann et al,1976; Nemoto et al, 1981). Thus, the increased CMRO2
may reflect a stimulation of protein synthesis and proteinphosphorylation, shown in animals to follow ischemia-induced inhibition and to be associated with tissue viability(Bergstedt et al, 1993). This process mainly affects thecerebral cortex (Bergstedt et al, 1993) and may be triggeredby increased transcripts of growth factors, stress proteins orprotooncogene products during reperfusion (Bergstedt et al,1993; Krause and Tiffany, 1993). Consistent with thishypothesis, Heiss et al (1993), using PET in five acute strokepatients, reported an increased "C-aminoacid (L-methionine)uptake in 'penumbral' tissue surrounding infarction andexperiencing reversible ischaemia.
At follow-up PET study, ~1 month later, the CBF, theCBV, the OEF and the CMR02 of previously hyperperfusedareas, had all largely returned to normal values, consistentwith a transient (post-ischaemic) event; the slight reductionin mean CBV and CMRO2 presumably reflects corticaldeafferentation due to small deep infarct (Baron, 1991).
Clinical implicationsIf our interpretation that the observed hyperperfusion reflectsa post-ischaemic phenomenon is indeed correct, then ourfindings would agree with the concept of the ischaemic'penumbra' (Jones et al, 1981), according to which, up to acertain time point which counts in hours, reperfusion isharmless, and actually beneficial. Independent from thisinterpretation, however, our findings indicate that, whenobserved 5—18 h after stroke onset, early hyperperfusion(especially if associated with increased CMRO2) is a markerof favourable tissue outcome. This may have practicalimplications in future management, notably for therapeutictrials of acute stroke, where more readily available perfusionimaging techniques could be used to depict hyperperfusion.
AcknowledgementsThe authors wish to thank the physicians of the EmergencyDepartment, the cyclotron and computer science staff, andthe radiographers of Cyceron for their help in this project.This work was supported by CNAM-INSERM grant 82/90to G.M. and J.C.B.
ReferencesAckerman RH, Lev MH, Mackay BC, Katz PM, Babikian VL,Alpert NM, et al. PET studies in acute stroke: findings and relevanceto therapy. J Cereb Blood Flow Metab 1989; 9 Suppl 1: 359.
by guest on February 19, 2013http://brain.oxfordjournals.org/
Dow
nloaded from
418 G. Marchal et al.
Andrews RJ. Transhemispheric diaschisis. A review and comment.[Review]. Stroke 1991; 22: 943-9.
Baird AE, Donnan GA. Increased " " T c - HMPAO uptake inischemic stroke [letter; comment]. Stroke 1993; 24: 1261-2.Comment on: Stroke 1993; 24: 193-4.
Baird AE, Donnan GA, Austin MC, McKay WJ. Early reperfusionin the 'spectacular shrinking deficit' demonstrated by single-photonemission computed tomography. Neurology 1995; 45: 1335-9.
Baron JC. Ischemic stroke studied by l5O-labeled compounds:misery perfusion and luxury perfusion. In: Heiss WD, Pawlik G,Herholz K, Wienhard K, editors. Clinical efficacy of positronemission tomography. Dordrecht: Martinus Nijhoff, 1987: 15—23.
Baron JC. Pathophysiology of acute cerebral ischemia: PET studiesin humans. Cerebrovasc Dis 1991; 1 Suppl 1: 22-31.
Baron JC, Bousser MG, Comar D, Soussaline F, Castaigne P.Noninvasive tomographic study of cerebral blood flow and oxygenmetabolism in vivo. Eur Neurol 1981; 20: 273-84.
Baron JC, Frackowiak RSJ, Herholz K, Jones T, Lammertsma AA,Mazoyer B, et al. Use of PET methods for measurement of cerebralenergy metabolism and hemodynamics in cerebrovascular disease.[Review], J Cereb Blood Flow Metab 1989; 9: 723-42.
Bergstedt K, Hu BR, Wieloch T. Postischaemic changes in proteinsynthesis in the rat brain: effects of hypothermia. Exp Brain Res1993; 95: 91-9.
Dawson TM, Dawson VL, Snyder SH. A novel neuronal messengermolecule in brain: the free radical, nitric oxide [see comments].[Review]. Ann Neurol 1992; 32: 297-311. Comment in: Ann Neurol1993; 33: 422.
Fieschi C, Argentino C, Lenzi GL, Sacchetti ML, Toni D, BozzaoL. Clinical and instrumental evaluation of patients with ischemicstroke within the first six hours. J Neurol Sci 1989; 91: 311-21.
Fink GR, Herholz K, Pietrzyk U, Huber M, Heiss WD. Peri-infarctperfusion in human ischemia: its relation to tissue metabolism,morphology, and clinical outcome. J Stroke Cerebrovasc Dis 1993;3: 123-31.
Fox PT, Perlmutter JS, Raichle ME. A stereotactic method ofanatomical localization for positron emission tomography. J ComputAssist Tomogr 1985; 9: 141-53.
Frackowiak RSJ, Lenzi GL, Jones T, Heather JD. Quantitativemeasurement of regional cerebral blood flow and oxygen metabolismin man using 150 and positron emission tomography: theory,procedure, and normal values. J Comput Assist Tomogr 1980; 4:727-36.
Garcia JH, Wagner S, Liu K-F, Hu X-J. Neurological deficit andextent of neuronal necrosis attributable to middle cerebral arteryocclusion in rats. Statistical validation. Stroke 1995; 26: 627-35.
Gourley JK, Heistad DD. Characteristics of reactive hyperemia inthe cerebral circulation. Am J Physiol 1984; 246: H52-8.
Hakim AM, Pokrupa RP, Villanueva J, Diksic M, Evans AC,Thompson CJ, et al. The effect of spontaneous reperfusion onmetabolic function in early human cerebral infarcts. Ann Neurol1987; 21: 279-89.
Hallenbeck JM, Dutka AJ. Background review and current conceptsof reperfusion injury [published erratum appears in Arch Neurol1991; 48: 811]. [Review]. Arch Neurol 1990; 47: 1245-54.
Hartmann A. Prolonged disturbances of regional cerebral bloodflow in transient ischemic attacks. Stroke 1985; 16: 932-9.
Heiss WD, Herholz K, Jacobs A, Duncan D, Bauer B, Huber M,et al. Increased amino-acid uptake in acute reversible focal ischemia.J Cereb Blood Flow Metab 1993; 13 Suppl 1: S564.
Hossmann KA, Sakaki S, Kimoto K. Cerebral uptake of glucoseand oxygen in the cat brain after prolonged ischemia. Stroke 1976;7: 301-5.
Jones TH, Morawetz RB, Crowell RM, Marcoux FW, FitzGibbonSJ, De Girolami U, et al. Thresholds of focal cerebral ischemia inawake monkeys. J Neurosurg 1981; 54: 773-82.
Krause GS, Tiffany BR. Suppression of protein synthesis in thereperfused brain. [Review]. Stroke 1993; 24: 747-56.
Lassen NA. The luxury-perfusion syndrome and its possible relationto acute metabolic acidosis localised within the brain. Lancet 1966;2: 1113-15.
Lassen NA, Olsen TS, Hojgaard K, Skriver E. Incomplete infarction:a CT-negative irreversible ischemic brain lesion. J Cereb BloodFlow Metab 1983; 3 Suppl 1: S602-S603.
Lenzi GL, Frackowiak RSJ, Jones T. Cerebral oxygen metabolismand blood flow in human cerebral ischemic infarction. J CerebBlood Flow Metab 1982; 2: 321-35.
Levy DE, Duffy TE. Cerebral energy metabolism during transientischemia and recovery in the gerbil. J Neurochem 1977; 28: 63-70.
Macfarlane R, Moskowitz MA, Sakas DE, Tasdemiroglu E, WeiEP, Kontos HA. The role of neuroeffector mechanisms in cerebralhyperperfusion syndromes. [Review]. J Neurosurg 1991; 75: 845—55.
Marchal G, Rioux P, Petit-Tabou6 MC, Sette G, Travere JM, LePoec C, et al. Regional cerebral oxygen consumption, blood flow,and blood volume in healthy human aging. Arch Neurol 1992; 49:1013-20.
Marchal G, Serrati C, Rioux P, Petit-Tabou6 MC, Viader F, de laSayette V, et al. PET imaging of cerebral perfusion and oxygenconsumption in acute ischaemic stroke: relation to outcome [seecomment]. The Lancet 1993; 341: 925-7. Comment in: Lancet1993; 342: 742.
Marchal G, Rioux P, Serrati C, Furlan M, Derlon JM, Viader F, et al.Value of acute-stage positron emission tomography in predictingneurological outcome after ischemic stroke: further assessment[letter]. Stroke 1995; 26: 524-5.
Martinez-Vila E, Guillen F, Villanueva JA, Matias-Guiu J, BigorraJ, Gil P, et al. Placebo-controlled trial of nimodipine in the treatmentof acute ischemic cerebral infarction. Stroke 1990; 21: 1023-8.
Memezawa H, Smith ML, SiesjO BK. Penumbral tissues salvagedby reperfusion following middle cerebral artery occlusion in rats.Stroke 1992; 23: 552-9.
Minematsu K, Yamaguchi T, Omae T. 'Spectacular shrinking deficit':rapid recovery from a major hemispheric syndrome by migrationof an embolus. Neurology 1992; 42: 157-62.
by guest on February 19, 2013http://brain.oxfordjournals.org/
Dow
nloaded from
Hyperperfusion and tissue outcome after stroke 419
Minematsu K, Fisher M, Li L, Sotak CH. Diffusion and perfusionmagnetic resonance imaging studies to evaluate a noncompetitiveN-methyl-D-aspartate antagonist and reperfusion in experimentalstroke in rats. Stroke 1993; 24: 2074-81.
Nakagawara J, Sperling B, Takeda R, Suematsu K, Nakamura J,Lassen NA. Incomplete brain infarction of early reperfused, CXIMR] intact cortex in embolic stroke: in vivo evidence by I23I-iomazenil SPECT. J Cereb Blood Flow Metab 1995; 15 Suppl1: S131.
Nedergaard M, Vorstrup S, Astrup J. Cell density in the borderzone around old small human brain infarcts. Stroke 1986; 17:1129-37.
Nelson CW, Wei EP, Povlishock JT, Kontos HA, Moskowitz MA.Oxygen radicals in cerebral ischemia. Am J Physiol 1992; 263:HI 356-62.
Nemoto EM, Hossmann KA, Cooper HK. Post-ischemichypermetabolism in cat brain. Stroke 1981; 12: 666-76.
Olsen TS, Lassen NA. A dynamic concept of middle cerebral arteryocclusion and cerebral infarction in the acute state based oninterpreting severe hyperemia as a sign of embolic migration. Stroke1984; 15:458-68.
Olsen TS, Larsen B, Skriver EB, Heming M, Enevoldsen E,Lassen NA. Focal cerebral hyperemia in acute stroke. Incidence,pathophysiology and clinical significance. Stroke 1981; 12: 598-607.
Orgogozo JM, Dartigues JF. Methodology of clinical trials in acutecerebral ischemia. Cerebrovasc Dis 1991; 1 Suppl 1: 100-11.
Pappata S, Fiorelli M, Rommel T, Hartmann A, Dettmers C,Yamaguchi T, et al. PET study of changes in local brainhemodynamics and oxygen metabolism after unilateral middlecerebral artery occlusion in baboons. J Cereb Blood Flow Metab1993; 13:416-24.
Paulson OB. Regional cerebral blood flow in apoplexy due toocclusion of the middle cerebral artery. Neurology 1970; 20: 63-77.
Paulson OB, Lassen NA, Skinhoj E. Regional cerebral blood flowin apoplexy without arterial occlusion. Neurology 1970; 20: 125-38.
Ringelstein EB, Biniek R, WeillerC, Ammeling B, Nolte PN, ThronA. Type and extent of hemispheric brain infarctions and clinicaloutcome in early and delayed middle cerebral artery recanalization.Neurology 1992; 42: 289-98.
Sette G, Baron JC, Young AR, Miyazawa H, Tillet I, Barre' L, et al.In vivo mapping of brain benzodiazepine receptor changes by
positron emission tomography after focal ischemia in theanesthetized baboon. Stroke 1993; 24: 2046-58.
Shimizu T, Naritomi H, Kakuda W, Sakaguchi M, Miyashita K,Sawada T. PET and MRI studies on delayed cortical laminarischemic changes following brief embolic stroke. J Cereb BloodFlow Metab 1995; 15 Suppl 1: S670.
Shimosegawa E, Hatazawa J, Inugami A, Fujita H, Ogawa T,Aizawa Y, et al. Cerebral infarction within six hours of onset:prediction of completed infarction with technetium-99m-HMPAOSPECT. J Nucl Med 1994; 35: 1097-103.
Sperling B, Lassen NA. Hyperfixation of HMPAO in subacuteischemic stroke leading to spuriously high estimates of cerebralblood flow by SPECT [see comments]. Stroke 1993a; 24: 193-4.Comment in: Stroke 1993; 24: 1099-100, Comment in: Stroke1993; 24: 1261-2.
Sperling B, Lassen NA. Increased "Tc-HMPAO uptake in ischemicstroke [letter]. Stroke 1993b; 24: 1262.
Steinling M, Huglo D, Kolesnikov H, Vergnes R, Rousseaux M.'Normal' "Tc-HmPAO distribution in large subacute middlecerebral artery infarct [letter] [see comments]. Stroke 1994; 25:2507-8. Comment in: Stroke 1995; 26: 707-8.
Sugiyama H, Christensen J, Olsen TS, Lassen NA. Monitoring CBFin clinical routine by dynamic single photon emission tomography(SPECT) of inhaled xenon-133. Stroke 1986; 17: 1179-82.
Tamura A, Asano T, Sano K. Correlation between rCBF andhistological changes following temporary middle cerebral arteryocclusion. Stroke 1980; 11: 487-93.
Tasdemiroglu E, Macfarlane R, Wei EP, Kontos HA, MoskowitzMA. Pial vessel caliber and cerebral blood flow become dissociatedduring ischemia-reperfusion in cats. Am J Physiol 1992; 263:H533-6.
Torvik A, Svindland A. Is there a transitional zone between braininfarcts and the surrounding brain? A histological study. Acta NeurolScand 1986; 74: 365-70.
Weiller C, Willmes K, Reiche W, Thron A, Isensee C, Buell U,et al. The case of aphasia or neglect after striatocapsular infarction.Brain 1993; 116: 1509-25.
Wise R, Gibbs J, Frackowiak R, Marshall J, Jones T. No evidencefor transhemispheric diaschisis after human cerebral infarction.Stroke 1986; 17: 853-61.
Received June 28, 1995. Revised October 12, 1995.Accepted October 31, 1995
by guest on February 19, 2013http://brain.oxfordjournals.org/
Dow
nloaded from