dynamical evolution of rotating stellar systems: fokker–planck and n-body
TRANSCRIPT
arX
iv:a
stro
-ph/
0402
478v
1 2
0 Fe
b 20
04Mon. Not. R. Astron. Soc. 000, 000–000 (0000) Printed 2 February 2008 (MN LATEX style file v1.4)
Dynamical Evolution of Rotating Stellar Systems: III. The
Effect of Mass Spectrum
Eunhyeuk Kim1,2⋆, Hyung Mok Lee1†, and Rainer Spurzem3 ‡1Astronomy Program, SEES, Seoul National University, Seoul 151-742, Korea2Harvard-Smithsonian Center for Astrophysics, 60 Garden Street, Cambridge, MA 02138, USA3Astronomisches Rechen-Institut, Monchhof-Strasse 12-14, 69120 Heidelberg, Germany
2 February 2008
ABSTRACT
We have studied the dynamical evolution of rotating star clusters with mass spectrumusing a Fokker-Planck code. As a simplest multi-mass model, we first investigatedthe two-component clusters. Rotation is found to accelerate the dynamical evolutionthrough the transfer of angular momentum outward, as well as from the high masses tothe low masses. However, the degree of acceleration depends sensitively on the assumedinitial mass function since dynamical friction, which generates mass segregation, alsotends to accelerate the evolution, and the combined effect of both is not linear or mul-tiplicative. As long as dynamical friction dominates in the competition with angularmomentum exchange the heavy masses lose random energy and angular momentum,sink towards the centre, but their remaining angular momentum is sufficient to speedthem up rotationally. This is gravo-gyro instability. As a consequence, we find that thehigh mass stars in the central parts rotate faster than low mass stars. This leads tothe suppression of mass segregation compared to the non-rotating clusters. From thestudy of multi-component models, we observe similar trends to the two-componentmodels in almost all aspects. The mass function changes less drastically for clusterswith rotation. Unlike non-rotating clusters, the mass function depends on R and z.Our models are the only ones that can predict mass function and other quantities tobe compared with new observations.
Key words: celestial mechanics, stellar dynamics – globular clusters: general
1 INTRODUCTION
Since the pioneering studies of Lupton & Gunn (1987) andits subsequent applications to fit actual globular cluster ob-servations it is evident that galactic globular clusters exhibitsome degree of rotation, and that there is also a consis-tent amount of observed flattening of their shapes (White &Shawl 1987). More recently, van Leeuwen et al. (2000) andAnderson & King (2003) measure globular cluster rotationin proper motion, in order to derive the true direction of itsrotational axis. Though not dominant the amount of rota-tional energy could also not be neglected on the other handside, as was seen by the models of Einsel & Spurzem, whichshowed that even a moderate fraction of rotational energyin a cluster leads to significantly faster core evolution.
This is the third in a series of studies on the dynamical
⋆ e-mail: [email protected]† e-mail: [email protected]‡ e-mail: [email protected]
evolution of rotating stellar system by using orbit-averaged2D Fokker-Planck (FP) models that include the effects ofinitial rotation. In the previous two papers, pre-collapse evo-lution (Einsel & Spurzem 1999, Paper I) and the evolutionafter core-collapse (Kim et al. 2002, Paper II) of rotatingclusters composed of equal mass stars were studied. In thepresent study we explore the dynamical evolution of the ro-tating stellar systems with mass spectrum as a natural ex-tension to the previous works. We expect that the exchangeof angular momentum between different mass species wouldsignificantly affect the course of dynamical evolution, as theenergy exchange is known to play important role in the evo-lution of multi-mass clusters.
Direct integration of the Fokker-Planck equation is usedas a statistical method. Comparisons between results ob-tained with FP method and results from N-body simulationshow that the approximations and assumptions which wereused in FP models are reasonable, but need to be checkedcarefully by comparison of different methods. The simplestimplementation of an FP model is a one-dimensional (1D)FP model where the distribution function f is assumed to
c© 0000 RAS

2 Eunhyeuk Kim1,2e-mail: [email protected], Hyung Mok Lee1e-mail: [email protected], and Rainer Spurzem
depend only on the energy E of stars. All physical prop-erties depend on the distance from the cluster center only(Cohn 1980; Lee, Fahlman & Richer 1991). The use of 1Dmodels is inspired by the fact that the shape of globular clus-ters is approximately spherical, but it ignores the anisotropyof the velocity dispersion. Observations of globular clustersand theoretical models suggested that there exists a differ-ence in the velocity dispersion between radial and tangen-tial direction, especially for stars in the outer regions of theclusters (Takahashi 1995, 1996, 1997). The two-dimensionalFP model where distribution function depends on energyand angular momentum with spherical geometry has beenpioneered by Cohn (1979) but studied extensively only re-cently because of difficulties in numerical integration of theequations (Takahashi, Lee & Inagaki 1997, Takahashi & Lee2001). In our case, modelling axisymmetric systems withonly two integrals requires a careful check in particular. Anythird integral is neglected here completely, which means thatthe diffusion properties of orbits in the axisymmetric poten-tial are treated as a function of two integrals only.
Although there are successes in previous FP models toexplain the dynamical evolution of star clusters, only few ofthem considered the natural and important physical prop-erty of the existence of an initial angular momentum in thestar cluster. Kim et al. (2002) have reviewed briefly the pre-vious studies where the initial rotation is considered. Theypresented the first post-core collapse studies on the evolutionof rotating stellar systems and found that the global shapeof the rotational structure of the globular cluster changeslittle, though the strength of the rotation (measured usingthe magnitude of the rotational velocity or the z-componentof the angular momentum) decreases continuously with timedue to the outward transfer of the angular momentum. Anincorporation of mass loss and enhanced two-body relax-ation processes accelerated the evolution of the star clusternot only in core-collapse time, but also the dissolution timeof the cluster. They found an approach to self-similar evo-lution in late core-collapse.
The previous studies where the initial rotation is consid-ered, assumed a star cluster with equal mass stars. Inclusionof the initial mass spectrum known to change the evolu-tion of star clusters significantly, shortening of core-collapsetimes for example (Lee, Fahlman & Richer 1991). We alsoexpect that there may be important physical processes be-tween different mass species concerning the exchanges of theangular momentum. Until now, no study has been done onrotating star clusters with mass spectrum except for one pre-liminary work by Spurzem & Einsel (1998). In this paper,thus we present the study of dynamical evolution of the ro-tating star cluster with the initial mass function (IMF here-after). We first investigate the evolution of two-componentmodels as a simplest extension of the single mass models.Then we extend our study to the multi-mass models repre-sented by ten different mass species. The difference of ourmodels as compared to the preliminary work by Spurzem &Einsel (1998) is that first our improved code includes moreaccurate numerical integration and discretisation proceduresas described in Paper II, and here we do an extensive pa-rameter study, which did not exist before.
The outline of the present paper is as follows; In section2, the FP equations for the multi-mass system and the initialmodels are presented. We concentrate on the evolution up
to the core collapse of two component models in section 3and multi-mass models in section 4. We further discuss theevolution beyond the core collapse for both two-componentand multi-component models section 5. We summarize ourmain results in section 6.
2 THE MODELS
2.1 Fokker-Planck Equations
We have constructed a computational scheme to study thedynamical evolution of rotating stellar systems with massspectrums in detail with higher accuracy both for pre- andpost-collapse. The framework of the method is essentiallyan extension of the method used in Paper II. The multi-mass FP equation under a fixed potential can be written ina flux-conserving form as follows:
P (E,Jz)∂fi
∂t= −
∂FEi
∂E−
∂FJz,i
∂Jz(1)
where P (E,Jz) is the phase space volume accessible forstars with E and Jz, and fi, FEi
and FJz,iare the dis-
tribution function and the particle flux in energy (E) andz-component of angular momentum (Jz) of the i-th compo-nent, respectively. The expression for phase space volume isgiven in Paper I. The particle fluxes FEi
and FJz,ican be
expressed as follows:
−FEi= DEE,i
∂fi
∂E+ DEJz,i
∂fi
∂Jz+ DE,ifi,
(2)
−FJz,i= DJzJz,i
∂fi
∂Jz+ DJzE,i
∂fi
∂E+ DJz,i
fi.
where DEE,i, DEJz,i, etc are the diffusion coefficients andare given in the Appendix of Paper I for single componentmodels. The extention to the multi-mass models can be sim-ply done by applying the distribution function of the i-thcomponent in the expression of these coefficients.
It is necessary to add energy source to explore the evo-lution after core-collapse. Primordial binaries and massivestars are important energy sources, since they can delaysignificantly the core-collapse time and change the earlyevolution of stellar systems (Gao et al. 1991, Giersz &Spurzem 2000). However, the specification of primordial bi-naries could introduce many more model parameters. Thetreatment of such binaries in FP code is not so trivial ei-ther. Since we are mainly concerned with the general effectsof rotation on the dynamical evolution of star clusters, welimit ourselves to simplest cases. As a way to follow the dy-namical evolution beyond the core collapse, we have onlyconsidered the heating effect of binaries formed by three-body processes. Heating formula for three-body binaries ofLee, Fahlman & Richer (1991) is used in our models (seealso Takahashi 1997 for the discussion of this formula). Intheir formulation, the total heating rate per unit volume isgiven by
Etot = CbG5
(
∑
i
nim2i
σ3i
)3
σ20 (3)
c© 0000 RAS, MNRAS 000, 000–000

Dynamical Evolution of Rotating Stellar Systems: III. The Effect of Mass Spectrum 3
where ni, mi, and σi are the number density, stellar mass,and one-dimensional velocity dispersion, respectively, of thei-th component, and σ0 is the mass density-weighted centralone-dimensional velocity dispersion. The standard value ofCb = 90 is used for present study. Heating rate for each masscomponent is obtained by distributing the total heating ratesuch that
Etot,i =ρi
ρtotEtot (4)
where ρi and ρtot represent mass density of each componentand total density. Giersz & Spurzem (1997) have demon-strated that such a simple approximations work very wellfor modelling the post-collapse evolution of globular clus-ters.
2.2 Multi-Mass Initial Models
We employ the rotating King models as initial models fol-lowing Lupton & Gunn (1987). We assume that there isno initial mass segregation among different mass species.Our present initial models are, therefore simple extensionof the initial models used in Papers I and II. These modelsare characterized by two parameters: dimensionless centralpotential W0 and rotational parameter ω0. We have stud-ied the evolution of clusters with W0 = 6 and W0 = 3,respectively. Model clusters are assumed to rotate in circu-lar orbits around mother galaxy, so that the mean densitywithin the tidal radius (rt) remains a constant throughoutthe evolution. We examined the evolution of clusters withvarious amount of the initial rotations (see Tables 1 and2 for the list of the initial models of two component, andmulti-component, respectively).
First, we considered the models with two-componentmass species. Two-component models are expected to pro-vide us with understanding the essential features of the evo-lution of the multi-component clusters (for example, thetransfer of angular momentum between two mass compo-nents). We have examined the wide range of individual stel-lar mass ratio µ := m2/m1 and total mass ratio M1/M2 =(1 − q)/q, where q := M2/(M1 + M2). The quantities µand q can be compared with the work of Khalisi (2002) andFregeau et al. (2002).
Next, we considered clusters which have continuousmass spectra. We choose simple power-law mass functionfor convenience. The number of stars in a mass interval(m, m + dm) is given by
dN(m) = Cmαdm, mmin ≤ m ≤ mmax (5)
where mmin and mmax denote the minimum and the maxi-mum masses, respectively. The dynamic range of mass spec-trum, expressed as mmax/mmin is 10 for present study.
We have studied the evolution of clusters with threedifferent shapes of mass function: α= −1.20,−2.35 and−3.50, where α = −2.35 represents Salpeter-type mass func-tion. We list the parameters of the models with continuousmass spectrum in Tables 1 and 2. For models of post core-collapse, we consider only a model with a mass function withα = −2.35.
The number of mass groups used in present study isten. The mass of each group is assigned such that
Table 1. Initial Models of clusters with W0 = 6.
Model m2/m1 M1/M2 α0 ω0 Tr/Tk(0) Phase[%]
0.0 0.00 Pre0.2 3.40 Pre0.3 7.06 Pre0.4 11.35 Pre0.6 20.17 Pre
M2A 2 5 − 0.8 27.96 Pre1.0 34.23 Pre1.2 39.13 Pre1.4 42.93 Pre1.6 45.88 Pre
0.0 0.00 PreM2B 2 10 − 0.3 7.06 Pre
0.6 20.17 Pre
0.0 0.00 PostM2C 5 10 − 0.3 7.06 Post
0.6 20.17 Post
0.0 0.00 PreM2D 5 100 − 0.3 7.06 Pre
0.6 20.17 Pre
0.0 0.00 PreM2E 10 10 − 0.3 7.06 Pre
0.6 20.17 Pre
0.0 0.00 PreM2F 10 100 − 0.3 7.06 Pre
0.6 20.17 Pre
0.0 0.00 PreMCA − − −1.20 0.3 7.06 Pre
0.6 20.17 Pre
0.0 0.00 PostMCB − − −2.35 0.3 7.06 Post
0.6 20.17 Post
0.0 0.00 PreMCC − − −3.50 0.3 7.06 Pre
0.6 20.17 Pre
Tr: total rotational energyTk: total kinetic energy
mi = mmin
(
mmax
mmin
)(i− 12)/10
, (i = 1, 2, ...10). (6)
The total mass of ith mass group is
Mi =
mi+ 1
2∫
mi− 1
2
N(m) mdm. (7)
If the initial density distribution and the initial massfunction including mmin and mmax are fixed, the only freeparameter for the model is the number of stars (or totalmass if the masses of stars are given in physical units). Thegeneral behavior of the core collapse does not depend onthe number of stars. However, the core stops to collapse andbegins to expand when the central density exceeds a cer-tain value which depends on the total number of stars in
c© 0000 RAS, MNRAS 000, 000–000
4 Eunhyeuk Kim1,2e-mail: [email protected], Hyung Mok Lee1e-mail: [email protected], and Rainer Spurzem
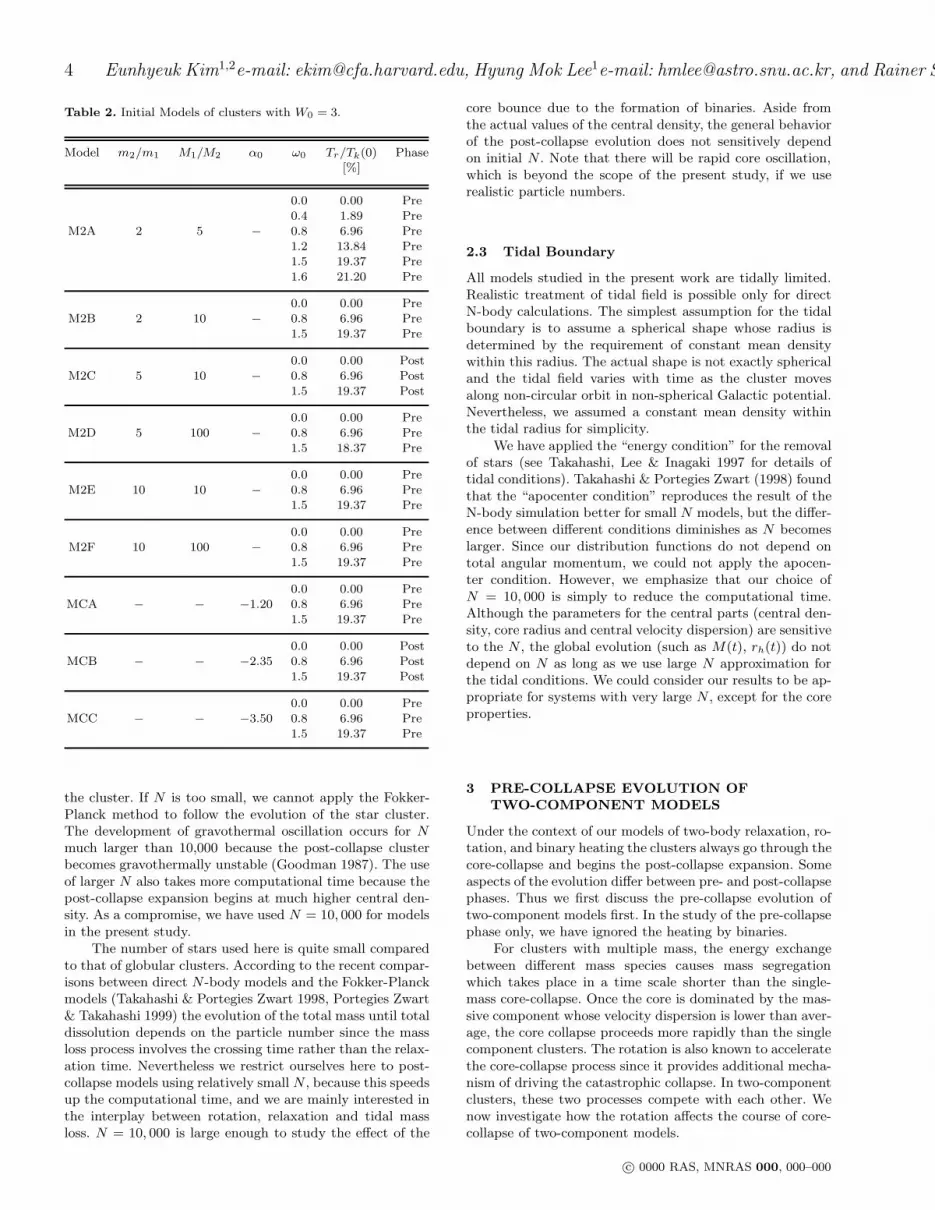
Table 2. Initial Models of clusters with W0 = 3.
Model m2/m1 M1/M2 α0 ω0 Tr/Tk(0) Phase[%]
0.0 0.00 Pre0.4 1.89 Pre
M2A 2 5 − 0.8 6.96 Pre1.2 13.84 Pre1.5 19.37 Pre1.6 21.20 Pre
0.0 0.00 PreM2B 2 10 − 0.8 6.96 Pre
1.5 19.37 Pre
0.0 0.00 PostM2C 5 10 − 0.8 6.96 Post
1.5 19.37 Post
0.0 0.00 PreM2D 5 100 − 0.8 6.96 Pre
1.5 18.37 Pre
0.0 0.00 PreM2E 10 10 − 0.8 6.96 Pre
1.5 19.37 Pre
0.0 0.00 PreM2F 10 100 − 0.8 6.96 Pre
1.5 19.37 Pre
0.0 0.00 PreMCA − − −1.20 0.8 6.96 Pre
1.5 19.37 Pre
0.0 0.00 PostMCB − − −2.35 0.8 6.96 Post
1.5 19.37 Post
0.0 0.00 PreMCC − − −3.50 0.8 6.96 Pre
1.5 19.37 Pre
the cluster. If N is too small, we cannot apply the Fokker-Planck method to follow the evolution of the star cluster.The development of gravothermal oscillation occurs for Nmuch larger than 10,000 because the post-collapse clusterbecomes gravothermally unstable (Goodman 1987). The useof larger N also takes more computational time because thepost-collapse expansion begins at much higher central den-sity. As a compromise, we have used N = 10, 000 for modelsin the present study.
The number of stars used here is quite small comparedto that of globular clusters. According to the recent compar-isons between direct N-body models and the Fokker-Planckmodels (Takahashi & Portegies Zwart 1998, Portegies Zwart& Takahashi 1999) the evolution of the total mass until totaldissolution depends on the particle number since the massloss process involves the crossing time rather than the relax-ation time. Nevertheless we restrict ourselves here to post-collapse models using relatively small N , because this speedsup the computational time, and we are mainly interested inthe interplay between rotation, relaxation and tidal massloss. N = 10, 000 is large enough to study the effect of the
core bounce due to the formation of binaries. Aside fromthe actual values of the central density, the general behaviorof the post-collapse evolution does not sensitively dependon initial N . Note that there will be rapid core oscillation,which is beyond the scope of the present study, if we userealistic particle numbers.
2.3 Tidal Boundary
All models studied in the present work are tidally limited.Realistic treatment of tidal field is possible only for directN-body calculations. The simplest assumption for the tidalboundary is to assume a spherical shape whose radius isdetermined by the requirement of constant mean densitywithin this radius. The actual shape is not exactly sphericaland the tidal field varies with time as the cluster movesalong non-circular orbit in non-spherical Galactic potential.Nevertheless, we assumed a constant mean density withinthe tidal radius for simplicity.
We have applied the “energy condition” for the removalof stars (see Takahashi, Lee & Inagaki 1997 for details oftidal conditions). Takahashi & Portegies Zwart (1998) foundthat the “apocenter condition” reproduces the result of theN-body simulation better for small N models, but the differ-ence between different conditions diminishes as N becomeslarger. Since our distribution functions do not depend ontotal angular momentum, we could not apply the apocen-ter condition. However, we emphasize that our choice ofN = 10, 000 is simply to reduce the computational time.Although the parameters for the central parts (central den-sity, core radius and central velocity dispersion) are sensitiveto the N , the global evolution (such as M(t), rh(t)) do notdepend on N as long as we use large N approximation forthe tidal conditions. We could consider our results to be ap-propriate for systems with very large N , except for the coreproperties.
3 PRE-COLLAPSE EVOLUTION OF
TWO-COMPONENT MODELS
Under the context of our models of two-body relaxation, ro-tation, and binary heating the clusters always go through thecore-collapse and begins the post-collapse expansion. Someaspects of the evolution differ between pre- and post-collapsephases. Thus we first discuss the pre-collapse evolution oftwo-component models first. In the study of the pre-collapsephase only, we have ignored the heating by binaries.
For clusters with multiple mass, the energy exchangebetween different mass species causes mass segregationwhich takes place in a time scale shorter than the single-mass core-collapse. Once the core is dominated by the mas-sive component whose velocity dispersion is lower than aver-age, the core collapse proceeds more rapidly than the singlecomponent clusters. The rotation is also known to acceleratethe core-collapse process since it provides additional mecha-nism of driving the catastrophic collapse. In two-componentclusters, these two processes compete with each other. Wenow investigate how the rotation affects the course of core-collapse of two-component models.
c© 0000 RAS, MNRAS 000, 000–000
Dynamical Evolution of Rotating Stellar Systems: III. The Effect of Mass Spectrum 5
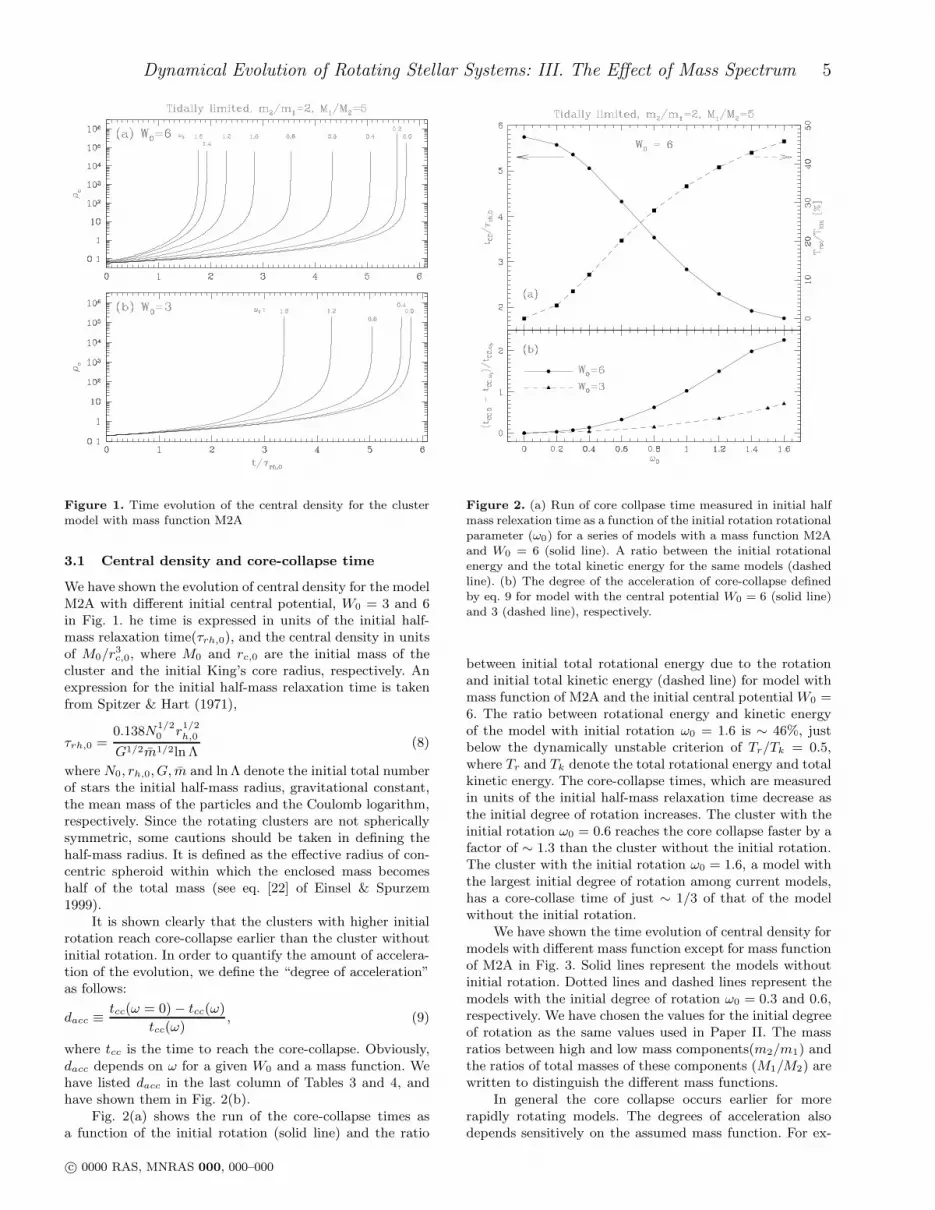
Figure 1. Time evolution of the central density for the clustermodel with mass function M2A
3.1 Central density and core-collapse time
We have shown the evolution of central density for the modelM2A with different initial central potential, W0 = 3 and 6in Fig. 1. he time is expressed in units of the initial half-mass relaxation time(τrh,0), and the central density in unitsof M0/r3
c,0, where M0 and rc,0 are the initial mass of thecluster and the initial King’s core radius, respectively. Anexpression for the initial half-mass relaxation time is takenfrom Spitzer & Hart (1971),
τrh,0 =0.138N
1/20 r
1/2h,0
G1/2m1/2ln Λ(8)
where N0, rh,0, G, m and ln Λ denote the initial total numberof stars the initial half-mass radius, gravitational constant,the mean mass of the particles and the Coulomb logarithm,respectively. Since the rotating clusters are not sphericallysymmetric, some cautions should be taken in defining thehalf-mass radius. It is defined as the effective radius of con-centric spheroid within which the enclosed mass becomeshalf of the total mass (see eq. [22] of Einsel & Spurzem1999).
It is shown clearly that the clusters with higher initialrotation reach core-collapse earlier than the cluster withoutinitial rotation. In order to quantify the amount of accelera-tion of the evolution, we define the “degree of acceleration”as follows:
dacc ≡tcc(ω = 0) − tcc(ω)
tcc(ω), (9)
where tcc is the time to reach the core-collapse. Obviously,dacc depends on ω for a given W0 and a mass function. Wehave listed dacc in the last column of Tables 3 and 4, andhave shown them in Fig. 2(b).
Fig. 2(a) shows the run of the core-collapse times asa function of the initial rotation (solid line) and the ratio
Figure 2. (a) Run of core collpase time measured in initial halfmass relexation time as a function of the initial rotation rotationalparameter (ω0) for a series of models with a mass function M2Aand W0 = 6 (solid line). A ratio between the initial rotationalenergy and the total kinetic energy for the same models (dashedline). (b) The degree of the acceleration of core-collapse definedby eq. 9 for model with the central potential W0 = 6 (solid line)and 3 (dashed line), respectively.
between initial total rotational energy due to the rotationand initial total kinetic energy (dashed line) for model withmass function of M2A and the initial central potential W0 =6. The ratio between rotational energy and kinetic energyof the model with initial rotation ω0 = 1.6 is ∼ 46%, justbelow the dynamically unstable criterion of Tr/Tk = 0.5,where Tr and Tk denote the total rotational energy and totalkinetic energy. The core-collapse times, which are measuredin units of the initial half-mass relaxation time decrease asthe initial degree of rotation increases. The cluster with theinitial rotation ω0 = 0.6 reaches the core collapse faster by afactor of ∼ 1.3 than the cluster without the initial rotation.The cluster with the initial rotation ω0 = 1.6, a model withthe largest initial degree of rotation among current models,has a core-collase time of just ∼ 1/3 of that of the modelwithout the initial rotation.
We have shown the time evolution of central density formodels with different mass function except for mass functionof M2A in Fig. 3. Solid lines represent the models withoutinitial rotation. Dotted lines and dashed lines represent themodels with the initial degree of rotation ω0 = 0.3 and 0.6,respectively. We have chosen the values for the initial degreeof rotation as the same values used in Paper II. The massratios between high and low mass components(m2/m1) andthe ratios of total masses of these components (M1/M2) arewritten to distinguish the different mass functions.
In general the core collapse occurs earlier for morerapidly rotating models. The degrees of acceleration alsodepends sensitively on the assumed mass function. For ex-
c© 0000 RAS, MNRAS 000, 000–000

6 Eunhyeuk Kim1,2e-mail: [email protected], Hyung Mok Lee1e-mail: [email protected], and Rainer Spurzem
Figure 3. Time evolution of the central density for the clustermodel with two-component mass functions and W0 = 6 exceptfor a mass function of M2A.
ample, dacc of the model with the initial rotation ω0 = 0.6and mass function of M2B is much larger than that of themodel with mass function M2E, which has the same initialdegree of rotation. The main difference between these twomodels is the ratio of the individual mass: m2/m1 = 2 forM2B and 10 for M2E. The larger difference in individualmass means larger amount of energy exchange and thus thesignificant amount of acceleration of core collapse due tothis effect alone. There appears not enough room for theacceleration due to the initial rotation for such cases. Fora given m2/m1, the degree of acceleration also depends onM1/M2. If the total mass in high mass component is rela-tively large (i.e., smaller values for M1/M2), the accelerationdue to rotation is small. Such trend can be seen from thecomparison between M2C and M2D or M2E and M2F. Formodels with relatively small M1/M2, the acceleration dueto mass segregation is already significant and the role ofrotation is relatively less important.
Time evolution of total mass of the clusters with massfunction M2A is displayed in Fig. 4. The total mass of eachmass component is normalized by their initial total massMi,0. The dashed lines represent the total mass of lightercomponent and the solid lines for massive component, re-spectively. The total mass of lighter component decreasesmore rapidly than the that of massive stars, irrespective ofthe initial degree of rotations. The cluster with a initiallyhigher rotation loses mass more efficiently than the clusterswith lower initial rotation. The higher moss-loss rate of clus-ter with the higher initial rotation was known in previousworks for single mass models (Papers I and II). The ratioof total masses at a time of core-collapse between two masscomponents varies with different initial degree of rotations.For the model with initial rotation of ω0 = 1.6, the totalmass of the low mass component at the time of core-collapse
Figure 4. Evolution the total masses retained in a cluster formodel with W0 = 6 and mass function M2A. The total mass ofthe individual component is normalized by its initial total massMi,0. Solid lines represent the evolution for the massive stars anddashed lines for the less massive stars, respectively.
is ∼ 10 % of its initial value. On the other hand, ∼ 30 %of the initial mass still remains for massive component. Theratio of total mass at a time of core-collapse between thehigh and low mass components for model without the initialrotation is ∼ 1.1, which is much lower than the value ob-tained for cluster model with the initial rotation ω0 = 1.6.It implies that the mass function of rotating cluster whichhas the same initial mass function will follow different evo-lution according to their initial rotation. The evolution ofmass function, especially the power law index α, for modelswith initially power-law mass function is explained in detailin Sect. 5.4.
3.2 Central velocity dispersion and central
angular speed
Einsel & Spurzem (1999) argued in their single mass modelthat the acceleration of core-collapse time for models withthe initial rotation compared to the model without the initialrotation is accompanied by a rapid increase of the centralvelocity dispersion in rotating models. We have checked ifthis is also true for two component models. Fig. 5 shows theevolution of mass density weighted central one-dimensionalvelocity dispersion (σc) for models with the central potentialW0 = 6 and mass function model of M2A. The initial rota-tional parameters (ω0) are written in front of the startingpoints of evolution.
The evolution of σc measured in the total central den-sity (ρc) shows a rather complex behavior. For models withlarge initial rotation, σc increases in the very early phase ofevolution and then decrease until it reaches broad minimum.
c© 0000 RAS, MNRAS 000, 000–000

Dynamical Evolution of Rotating Stellar Systems: III. The Effect of Mass Spectrum 7
Figure 5. Evolution of the mass-weighted central 1D velocitydispersion with respect to the central density for cluster modelswith W0 = 6 and M2A for a mass function. The values of initialrotational parameter (ω0) are written ahead of the starting pointsof the evolution.
Eventually, σc increases with ρc monotonically toward thecore collapse.
The initial rise of σc is caused by the initial collapse andsubsequent heating by contraction. The decrease of σc afterthe local maximum is due to the loss of energy of high massstars to low mass stars. Since there are more low mass starsin the early phase in the central parts, the mass-weightedvelocity dispersion decreases. The subsequent increase of σc
after the broad minimum occurs when the central part isdominated by high mass stars. The stars in the central partslose energy to stars in the outer parts and the velocity dis-persion increases because of the negative specific heat.
The evolutionary path reaches self-similar collapsephase when the central density increases by 2 ∼ 3 ordersof magnitude. The evolution of self-similar collapse can becharacterized by a parameter given by
γ =d ln σ2
c
d ln ρc. (10)
For single mass system, Einsel & Spurzem (1999) obtainedan average value of γ = 0.109, independent of the initial de-gree of rotation. It is expected that γ for present two compo-nent models is very similar to that of the single componentsystem, since the central part of cluster is dominated by highmass stars. We derive an average value of γ = 0.105, whichis very similar to what was obtained for single mass model.
Another feature of Fig. 5 is the initial evolution of ofσc depends on the amount of initial rotation. The minimaoccur at higher central density for models with larger initialrotation. The enhanced two-body relaxation process due torotation will eventually cause more rapid increase the central
Figure 6. Evolution of the central angular speed of the individualmass species with respect to the total central density for clustermodels with W0 = 6 and M2A for a mass function. The centralrotational speed of the massive stars (solid lines) increases veryfast during the early evolutionary stage, while that of the lighterstars (dashed lines) shows an moderate increase.
density. This results in the acceleration of the core-collapsefor rapidly rotating systems.
Fig. 6 displays the run of central angular speed (Ωc) asa function of the total central density for the model withthe mass function of M2A. The solid lines and the dashedlines represent Ωc of high mass and low mass components,respectively. It is shown clearly that Ωc of the higher masscomponent increases very quickly only during early phase ofevolution. For the models rotating slowly (ω0 = 0.2 and 0.4)Ωc of lower mass component decreases by a small amount.For rapidly rotating clusters, however, Ωc increases with in-crease of central density. The rapid increase of Ωc of highmass component in the early phase is a caused by rapid col-lapse of the high mass stars: as they lose energy, they rotatefaster.
The mass weighted angular speeds in the core as a func-tion of ρc for the models in Fig. 6 are shown in Fig. 7. Duringearly evolution, Ωc increases rapidly for models with largerotation, then it grows slowly with increase of central den-sity, reaching self-similar phase in evolutionary path. Einsel& Spurzem (1999) introduced the parameter δ which char-acterizes the self-similar evolution of central angular speedas follows,
δ =d lnΩc
d ln ρc. (11)
The calculated values of δ for the present two-component models are listed in Table 3. On average, δ ≈
0.110 with weak dependence on the initial rotation for model
c© 0000 RAS, MNRAS 000, 000–000
8 Eunhyeuk Kim1,2e-mail: [email protected], Hyung Mok Lee1e-mail: [email protected], and Rainer Spurzem
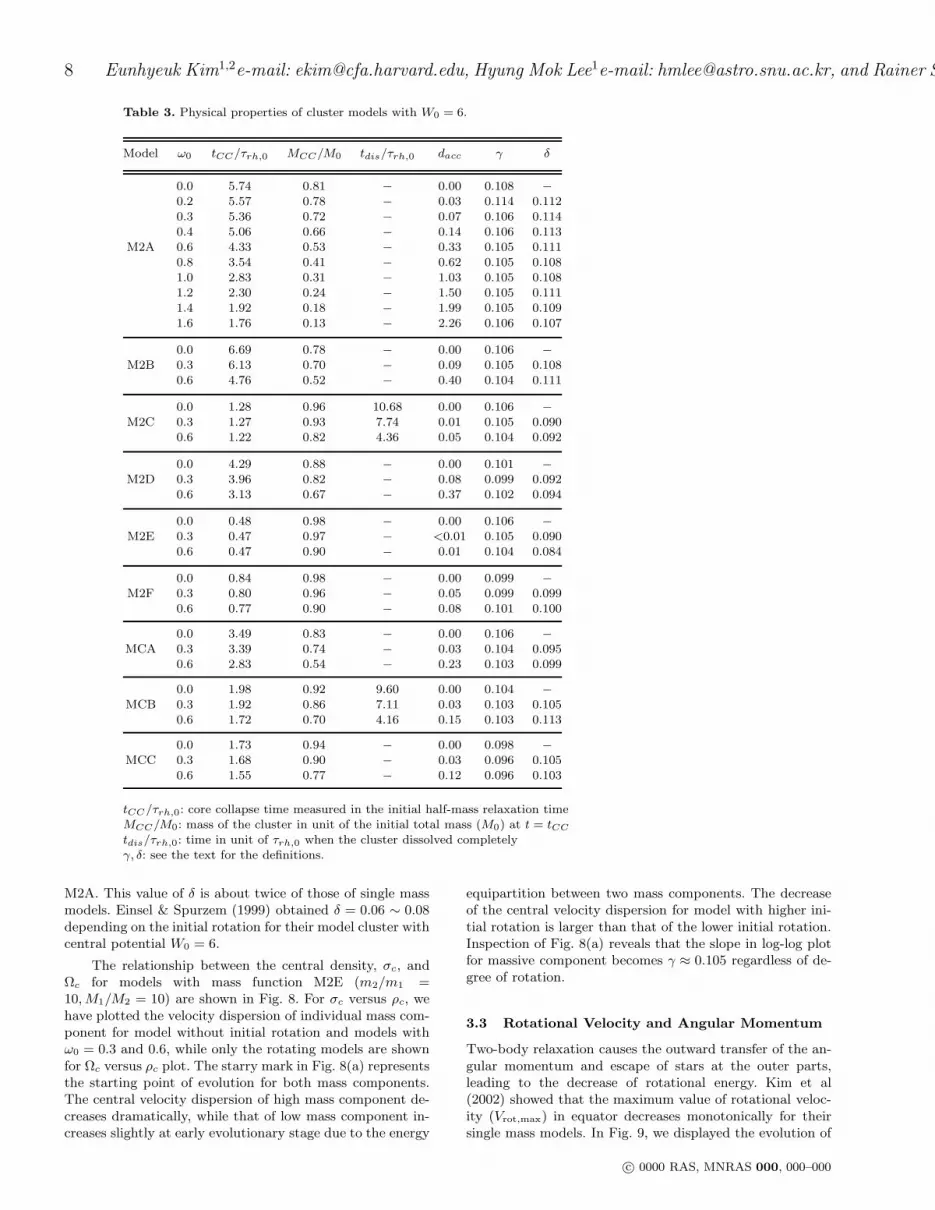
Table 3. Physical properties of cluster models with W0 = 6.
Model ω0 tCC/τrh,0 MCC/M0 tdis/τrh,0 dacc γ δ
0.0 5.74 0.81 − 0.00 0.108 −
0.2 5.57 0.78 − 0.03 0.114 0.1120.3 5.36 0.72 − 0.07 0.106 0.1140.4 5.06 0.66 − 0.14 0.106 0.113
M2A 0.6 4.33 0.53 − 0.33 0.105 0.1110.8 3.54 0.41 − 0.62 0.105 0.1081.0 2.83 0.31 − 1.03 0.105 0.1081.2 2.30 0.24 − 1.50 0.105 0.1111.4 1.92 0.18 − 1.99 0.105 0.1091.6 1.76 0.13 − 2.26 0.106 0.107
0.0 6.69 0.78 − 0.00 0.106 −
M2B 0.3 6.13 0.70 − 0.09 0.105 0.1080.6 4.76 0.52 − 0.40 0.104 0.111
0.0 1.28 0.96 10.68 0.00 0.106 −
M2C 0.3 1.27 0.93 7.74 0.01 0.105 0.0900.6 1.22 0.82 4.36 0.05 0.104 0.092
0.0 4.29 0.88 − 0.00 0.101 −
M2D 0.3 3.96 0.82 − 0.08 0.099 0.0920.6 3.13 0.67 − 0.37 0.102 0.094
0.0 0.48 0.98 − 0.00 0.106 −
M2E 0.3 0.47 0.97 − <0.01 0.105 0.0900.6 0.47 0.90 − 0.01 0.104 0.084
0.0 0.84 0.98 − 0.00 0.099 −
M2F 0.3 0.80 0.96 − 0.05 0.099 0.0990.6 0.77 0.90 − 0.08 0.101 0.100
0.0 3.49 0.83 − 0.00 0.106 −
MCA 0.3 3.39 0.74 − 0.03 0.104 0.0950.6 2.83 0.54 − 0.23 0.103 0.099
0.0 1.98 0.92 9.60 0.00 0.104 −
MCB 0.3 1.92 0.86 7.11 0.03 0.103 0.1050.6 1.72 0.70 4.16 0.15 0.103 0.113
0.0 1.73 0.94 − 0.00 0.098 −
MCC 0.3 1.68 0.90 − 0.03 0.096 0.1050.6 1.55 0.77 − 0.12 0.096 0.103
tCC/τrh,0: core collapse time measured in the initial half-mass relaxation timeMCC/M0: mass of the cluster in unit of the initial total mass (M0) at t = tCC
tdis/τrh,0: time in unit of τrh,0 when the cluster dissolved completelyγ, δ: see the text for the definitions.
M2A. This value of δ is about twice of those of single massmodels. Einsel & Spurzem (1999) obtained δ = 0.06 ∼ 0.08depending on the initial rotation for their model cluster withcentral potential W0 = 6.
The relationship between the central density, σc, andΩc for models with mass function M2E (m2/m1 =10, M1/M2 = 10) are shown in Fig. 8. For σc versus ρc, wehave plotted the velocity dispersion of individual mass com-ponent for model without initial rotation and models withω0 = 0.3 and 0.6, while only the rotating models are shownfor Ωc versus ρc plot. The starry mark in Fig. 8(a) representsthe starting point of evolution for both mass components.The central velocity dispersion of high mass component de-creases dramatically, while that of low mass component in-creases slightly at early evolutionary stage due to the energy
equipartition between two mass components. The decreaseof the central velocity dispersion for model with higher ini-tial rotation is larger than that of the lower initial rotation.Inspection of Fig. 8(a) reveals that the slope in log-log plotfor massive component becomes γ ≈ 0.105 regardless of de-gree of rotation.
3.3 Rotational Velocity and Angular Momentum
Two-body relaxation causes the outward transfer of the an-gular momentum and escape of stars at the outer parts,leading to the decrease of rotational energy. Kim et al(2002) showed that the maximum value of rotational veloc-ity (Vrot,max) in equator decreases monotonically for theirsingle mass models. In Fig. 9, we displayed the evolution of
c© 0000 RAS, MNRAS 000, 000–000
Dynamical Evolution of Rotating Stellar Systems: III. The Effect of Mass Spectrum 9
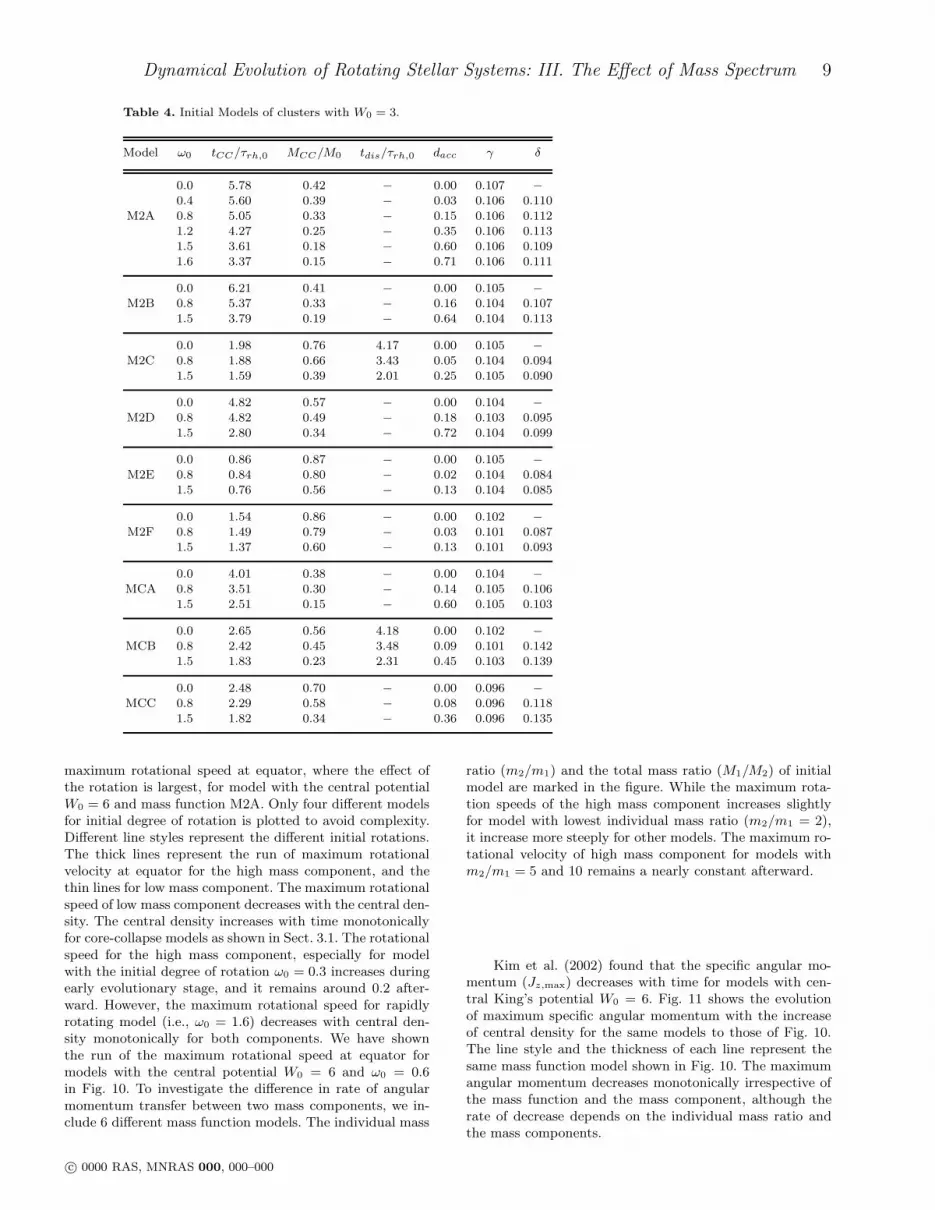
Table 4. Initial Models of clusters with W0 = 3.
Model ω0 tCC/τrh,0 MCC/M0 tdis/τrh,0 dacc γ δ
0.0 5.78 0.42 − 0.00 0.107 −
0.4 5.60 0.39 − 0.03 0.106 0.110M2A 0.8 5.05 0.33 − 0.15 0.106 0.112
1.2 4.27 0.25 − 0.35 0.106 0.1131.5 3.61 0.18 − 0.60 0.106 0.1091.6 3.37 0.15 − 0.71 0.106 0.111
0.0 6.21 0.41 − 0.00 0.105 −
M2B 0.8 5.37 0.33 − 0.16 0.104 0.1071.5 3.79 0.19 − 0.64 0.104 0.113
0.0 1.98 0.76 4.17 0.00 0.105 −
M2C 0.8 1.88 0.66 3.43 0.05 0.104 0.0941.5 1.59 0.39 2.01 0.25 0.105 0.090
0.0 4.82 0.57 − 0.00 0.104 −
M2D 0.8 4.82 0.49 − 0.18 0.103 0.0951.5 2.80 0.34 − 0.72 0.104 0.099
0.0 0.86 0.87 − 0.00 0.105 −
M2E 0.8 0.84 0.80 − 0.02 0.104 0.0841.5 0.76 0.56 − 0.13 0.104 0.085
0.0 1.54 0.86 − 0.00 0.102 −
M2F 0.8 1.49 0.79 − 0.03 0.101 0.0871.5 1.37 0.60 − 0.13 0.101 0.093
0.0 4.01 0.38 − 0.00 0.104 −
MCA 0.8 3.51 0.30 − 0.14 0.105 0.1061.5 2.51 0.15 − 0.60 0.105 0.103
0.0 2.65 0.56 4.18 0.00 0.102 −
MCB 0.8 2.42 0.45 3.48 0.09 0.101 0.1421.5 1.83 0.23 2.31 0.45 0.103 0.139
0.0 2.48 0.70 − 0.00 0.096 −
MCC 0.8 2.29 0.58 − 0.08 0.096 0.1181.5 1.82 0.34 − 0.36 0.096 0.135
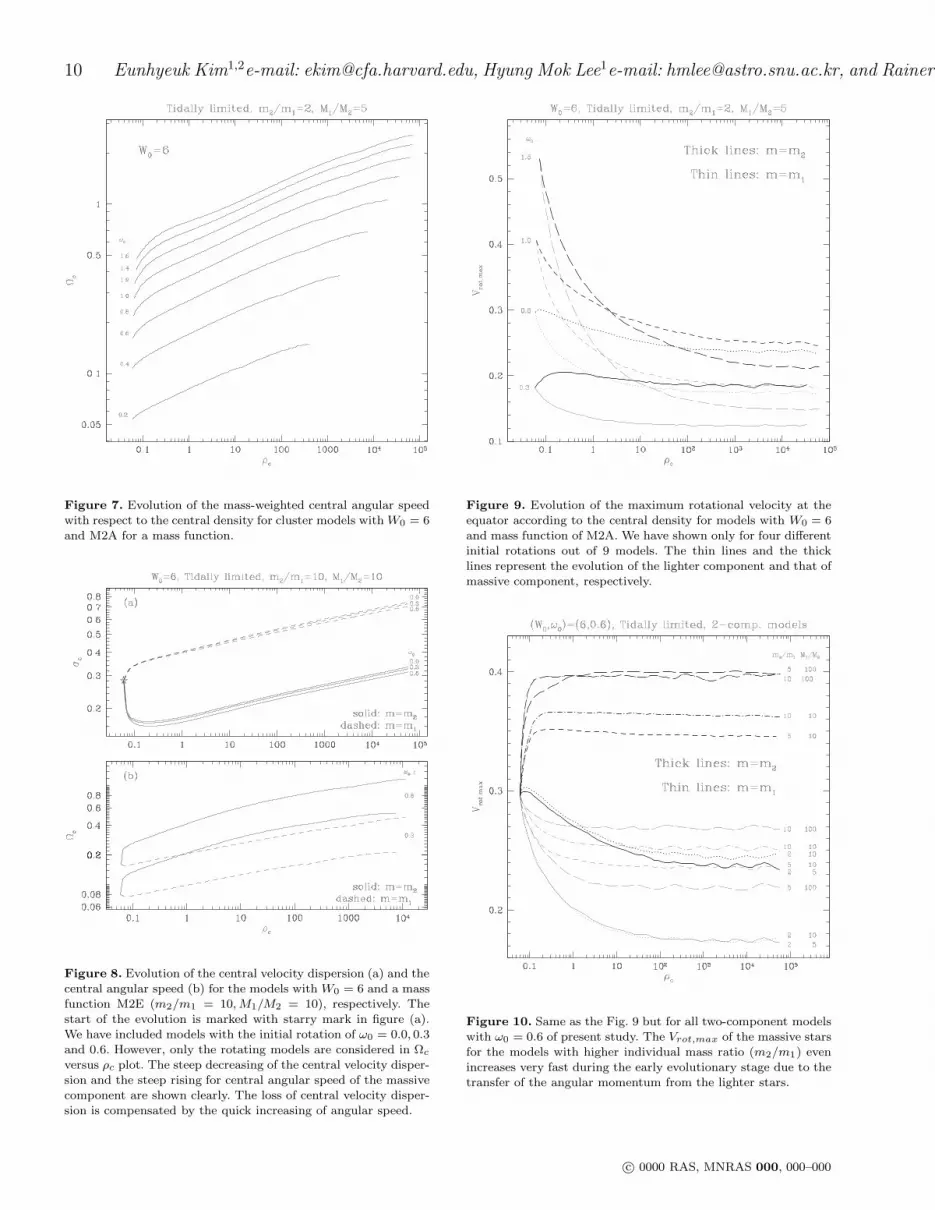
maximum rotational speed at equator, where the effect ofthe rotation is largest, for model with the central potentialW0 = 6 and mass function M2A. Only four different modelsfor initial degree of rotation is plotted to avoid complexity.Different line styles represent the different initial rotations.The thick lines represent the run of maximum rotationalvelocity at equator for the high mass component, and thethin lines for low mass component. The maximum rotationalspeed of low mass component decreases with the central den-sity. The central density increases with time monotonicallyfor core-collapse models as shown in Sect. 3.1. The rotationalspeed for the high mass component, especially for modelwith the initial degree of rotation ω0 = 0.3 increases duringearly evolutionary stage, and it remains around 0.2 after-ward. However, the maximum rotational speed for rapidlyrotating model (i.e., ω0 = 1.6) decreases with central den-sity monotonically for both components. We have shownthe run of the maximum rotational speed at equator formodels with the central potential W0 = 6 and ω0 = 0.6in Fig. 10. To investigate the difference in rate of angularmomentum transfer between two mass components, we in-clude 6 different mass function models. The individual mass
ratio (m2/m1) and the total mass ratio (M1/M2) of initialmodel are marked in the figure. While the maximum rota-tion speeds of the high mass component increases slightlyfor model with lowest individual mass ratio (m2/m1 = 2),it increase more steeply for other models. The maximum ro-tational velocity of high mass component for models withm2/m1 = 5 and 10 remains a nearly constant afterward.
Kim et al. (2002) found that the specific angular mo-mentum (Jz,max) decreases with time for models with cen-tral King’s potential W0 = 6. Fig. 11 shows the evolutionof maximum specific angular momentum with the increaseof central density for the same models to those of Fig. 10.The line style and the thickness of each line represent thesame mass function model shown in Fig. 10. The maximumangular momentum decreases monotonically irrespective ofthe mass function and the mass component, although therate of decrease depends on the individual mass ratio andthe mass components.
c© 0000 RAS, MNRAS 000, 000–000
10 Eunhyeuk Kim1,2e-mail: [email protected], Hyung Mok Lee1e-mail: [email protected], and Rainer
Figure 7. Evolution of the mass-weighted central angular speedwith respect to the central density for cluster models with W0 = 6and M2A for a mass function.
Figure 8. Evolution of the central velocity dispersion (a) and thecentral angular speed (b) for the models with W0 = 6 and a massfunction M2E (m2/m1 = 10, M1/M2 = 10), respectively. Thestart of the evolution is marked with starry mark in figure (a).We have included models with the initial rotation of ω0 = 0.0, 0.3and 0.6. However, only the rotating models are considered in Ωc
versus ρc plot. The steep decreasing of the central velocity disper-sion and the steep rising for central angular speed of the massivecomponent are shown clearly. The loss of central velocity disper-sion is compensated by the quick increasing of angular speed.
Figure 9. Evolution of the maximum rotational velocity at theequator according to the central density for models with W0 = 6and mass function of M2A. We have shown only for four differentinitial rotations out of 9 models. The thin lines and the thicklines represent the evolution of the lighter component and that ofmassive component, respectively.
Figure 10. Same as the Fig. 9 but for all two-component modelswith ω0 = 0.6 of present study. The Vrot,max of the massive starsfor the models with higher individual mass ratio (m2/m1) evenincreases very fast during the early evolutionary stage due to thetransfer of the angular momentum from the lighter stars.
c© 0000 RAS, MNRAS 000, 000–000

Dynamical Evolution of Rotating Stellar Systems: III. The Effect of Mass Spectrum 11
Figure 11. Evolution of the maximum specific angular momen-tum at the equator for the cluster model with two-componentmass functions. The meaning of the line styles are the same tothose of Fig. 3-10.
4 CLUSTERS WITH CONTINUOUS MASS
SPECTRUMS
4.1 Evolution of central properties
Fig. 12(a) and (b) shows the time evolution of the totalcentral density for cluster models with mass functions MCA,MCB and MCC. For each mass function three models withthe different initial rotation are plotted together. Since weselect the continuous mass function of the power-law typeand the index of power-law varies with time due to differencein mass evaporation rates among different mass groups, wedistinguish the initial power-law index (α0) with the power-law index (α) at time t. The values of the initial power-lawindex are shown in figure and the models with the samemass function are connected with lines for clarity.
Like single component or two-component models, themodels with the higher initial rotation evolve more rapidlythan the those with lower initial rotation. Among the modelswith the same amount of the initial rotation the cluster withthe flatter initial mass function (α0 = −1.20) has a longercollapse time, when the time is measured in the initial half-mass relaxation time. For models without initial rotation itis known that the core-collapse time for cluster with steepermass function is shorter than that for the cluster with shal-lower mass function (e.g., Lee, Fahlman & Richer 1991; Lee& Goodman 1995; Takahashi 1997).
We have shown the evolution of the central one dimen-sional velocity dispersions and the central angular speeds ofindividual mass components for the with (W0, ω0) = (6, 0.6)and the initial power-law slope α0 = −2.35 in Fig. 13. Theevolution starts at lower left corner as marked by a starrypoint in each figure. The individual mass of each mass groupdecreases upward in σc versus ρc, and vice versa for Ωc ver-
Figure 12. Time evolution of the central density for the clustermodel with the central concentration W0 = 6 (a) and 3 (b) andcontinuous mass function (10 mass components). Three differentinitial rotation are considered. The cluster models with the samemass function and different initial rotation is connected with aline. The acceleration of the core-collapse due to the initial rota-tion is shown clearly for all models.
sus ρc as shown in Fig. 13. The parameters γ and δ whichcharacterize the core-collapse phase as defined in Eqs. (10)and (11) are γ = 0.103 and δ = 0.113.
The effects of the initial mass function on the centralvelocity dispersion and the central angular speed are shownin Figs. 14 15, respectively. We keep the scales of the hori-zontal axis and the vertical axis to be the same for all panels.The direction for the increase of mass of each mass group isindicated by arrows in the figures. For most massive com-ponent as α0 decreases σc decreases more rapidly, drivingmore rapid evolution of the cluster as indicated by earliercore-collapse. The development of the mass segregation is es-tablished more quickly for the model with the steeper massfunction. For Ωc versus ρc (Fig. 15) we have shown only theearly stage of evolution since the rotation affects mainly dur-ing the initial period. It is evident that the development ofself-similar core-collapse phase occurs earlier for the modelwith the steeper mass function than that with flatter massfunction. The central angular speed at a given central den-sity is larger for the model with the steeper mass function.The rapid increase of the central angular speed for the high-est mass group and the slow decrease for the lowest massgroup for the model with α0 = −3.50 is a consequence ofthe rapid development of mass segregation. The steep de-crease of central velocity dispersion drives the increase ofthe central angular speed because of negative specific mo-ment of inertia.
c© 0000 RAS, MNRAS 000, 000–000

12 Eunhyeuk Kim1,2e-mail: [email protected], Hyung Mok Lee1e-mail: [email protected], and Rainer
Figure 13. Evolution of the 1D central velocity dispersion (a)and the central angular speed (b) of the individual mass compo-nents for a cluster model with (W0, ω0) = (6, 0.6) and a power-lawmass function with index α0 = −2.35. The staray marks denotethe start of evolution. Not only the velocity dispersion, but thecentral angular speed shows a self-similar behaviour.
4.2 Rotational properties
Fig. 17 displays the evolution of the maximum rotationalvelocities of individual mass components at the equator forthe model with (W0, ω0) = (6, 0.3). We included the mod-els with mass functions MCA, MCB and MCC together.The total mass of each mass group increases along the ar-row shown in Fig. 17(a). The evolution of rotational speedfor the cluster with the continuous mass function is simi-lar to that of the two component models. For the modelwith α0 = −3.50 the maximum rotational speed of the masscomponent of m5 remains nearly a constant. Since the ra-dius where the rotational velocity becomes maximum at theequator decreases with the time, the mass group with m5
rotates faster with time.The constant behaviour of the max-imum rotational speed occurs for the mass group of m7 formodel with α0 = −2.35 and mass group m9 for model withα0 = −1.20, respectively. Fig. 16(a) and (b) show the evo-lution of the maximum rotational speed and the evolutionof the maximum angular momentum at equator for modelwith (W0, ω0) = (6, 0.6) and mass function with α0 = −2.35.The maximum rotational speed of the lower mass groupsdecreases more than the cluster rotating slowly (see Fig.17(b) for comparison). While the high mass component ro-tates faster, the angular momentum decreases continuouslythrough whole evolutionary phase. Since the outward trans-fer of angular momentum for each mass species is closelyrelated with the two-body relaxation process, the evolutionof the maximum of the angular momentum reaches a plateauwhen it is measured in the central density.
Figure 14. Evolution of the 1D central velocity dispersion forcluster models with (W0, ω0) = (6, 0.3) and a power-law massfunction for power-law index (a) α0 = −1.20, (b) α0 = −2.35and (c) α0 = −3.50, respectively. As the slope of mass functionincreases the central velocity dispersion of the most massive starsdrops faster compared to the other mass function models. Thebehaviour of σc on ρc shows a self-similarity regardless of theindividual mass.
5 EVOLUTION AFTER CORE-COLLAPSE
So far we have concentrated our discussion until the core-collapse. We now discuss the evolution beyond the core col-lapse.
5.1 Central density and mass loss
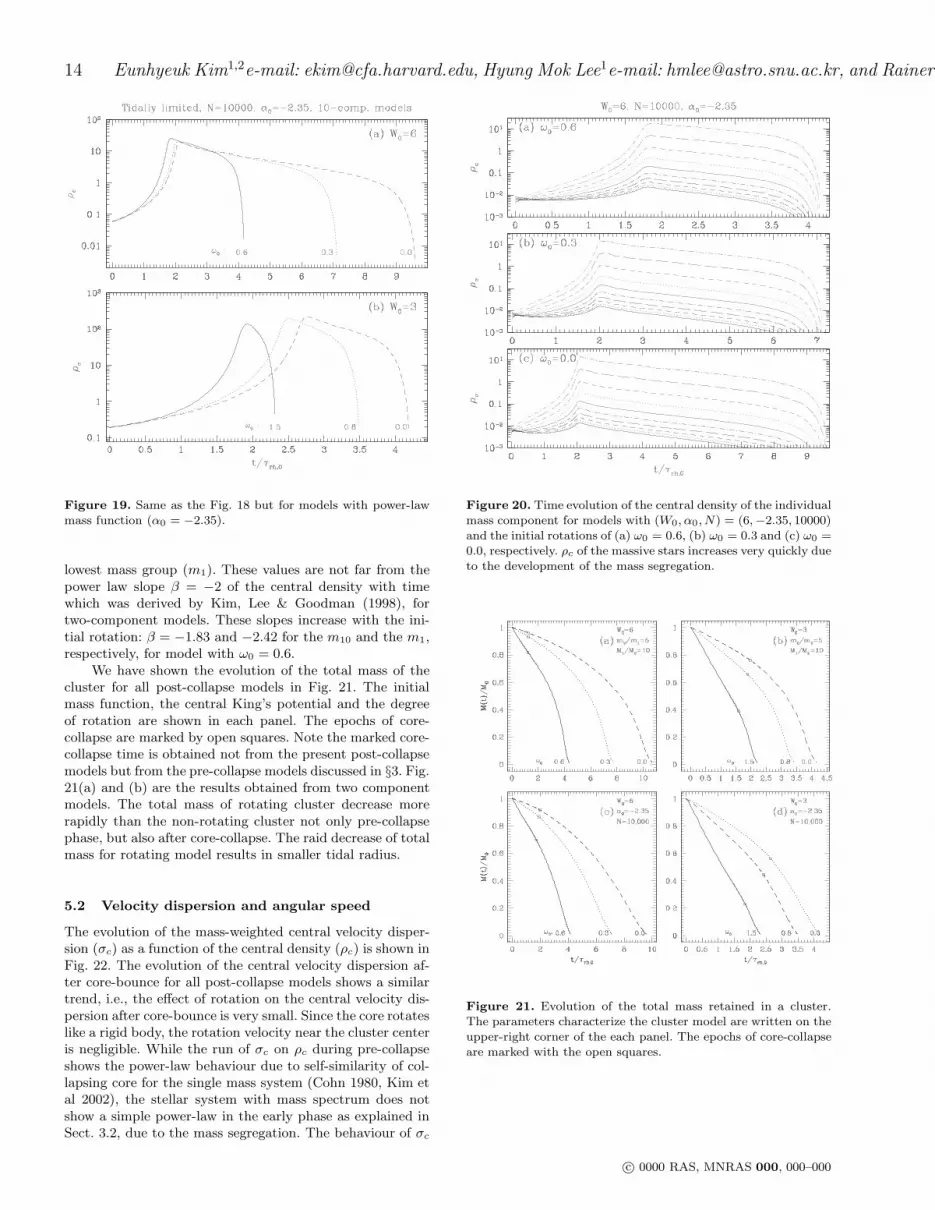
Figs. 18 and 19 show the time evolution of the central densityof the rotating stellar systems beyond the core collapse. Theevolutions for two component models with the central poten-tial W0 = 6 (Fig. 18(a)) and 3 (Fig. 18(b)) are displayed forclusters with three different initial rotations (ω0 = 0.0, 0.3and 0.6 for W0 = 6, and ω0 = 0.0, 0.8 and 1.5 for W0 = 3).For two component clusters we employed the mass functionM2C, while the mass function MCB for the continuous massspectrum is included. The models with the largest initial ro-tation (solid lines) reach the collapse earlier than the modelswith smaller initial rotation (dashed and dotted lines). Wecan clearly see the acceleration of the evolution during preand post collapse phases due to initial rotation.
Fig. 20 displays the run of the individual central den-sity for models with the continuous mass spectrum. Themass segregation due to the energy equipartition during theearly stage is shown clearly for all the present models. Therun of the central density after core bounce roughly fol-lows a power-law of ρc ∝ tβ, for all mass groups. The in-dex of power-law tends to be smaller for lower mass com-ponents. For the non-rotating model we find β = −1.54for the highest mass group (m10) and β = −1.88 for the
c© 0000 RAS, MNRAS 000, 000–000

Dynamical Evolution of Rotating Stellar Systems: III. The Effect of Mass Spectrum 13
Figure 15. Evolution of the central angular speed for clustermodels with (W0, ω0) = (3, 0.8) and a power-law mass functionfor power-law index (a) α0 = −1.20, (b) α0 = −2.35 and (c) α0 =−3.50, respectively. Evolutions during the early stage are shownsince the initial rotation affects largely on the cluster dynamicsduring the early times.
Figure 16. Evolution of the maximum rotational velocity atequator for cluster models with (W0, ω0) = (6, 0.3) and a power-law mass function for power-law index (a) α0 = −1.20, (b)α0 = −2.35 and (c) α0 = −3.50, respectively. For the steepestmass function (α0 = −3.50), Vrot,max of the massive stars in-crease much than that of the other models with slowly increasingmass functions.
Figure 17. Evolutions of (a) the maximum rotational veloc-ity (Vrot,max) and (b) the maximum specific angular momen-tum (Jz,max) at the equator for a model with (W0, ω0, α0) =(6, 0.6,−2.35). While Vrot,max of the massive stars increases withtime (i.e., increasing ρc), Jz,max decreases monotonically due tothe outward transfer of the angular momentum.
Figure 18. Evolution of the central density for the cluster modelswith the central potential (a) W0 = 6 and (b) W0 = 3 for massfunction (m2/m1, M1/M2) = (5, 10). The initial number of starsin a cluster is N = 10000 for different initial rotational parametersas indicated in the figure.
c© 0000 RAS, MNRAS 000, 000–000
14 Eunhyeuk Kim1,2e-mail: [email protected], Hyung Mok Lee1e-mail: [email protected], and Rainer
Figure 19. Same as the Fig. 18 but for models with power-lawmass function (α0 = −2.35).
lowest mass group (m1). These values are not far from thepower law slope β = −2 of the central density with timewhich was derived by Kim, Lee & Goodman (1998), fortwo-component models. These slopes increase with the ini-tial rotation: β = −1.83 and −2.42 for the m10 and the m1,respectively, for model with ω0 = 0.6.
We have shown the evolution of the total mass of thecluster for all post-collapse models in Fig. 21. The initialmass function, the central King’s potential and the degreeof rotation are shown in each panel. The epochs of core-collapse are marked by open squares. Note the marked core-collapse time is obtained not from the present post-collapsemodels but from the pre-collapse models discussed in §3. Fig.21(a) and (b) are the results obtained from two componentmodels. The total mass of rotating cluster decrease morerapidly than the non-rotating cluster not only pre-collapsephase, but also after core-collapse. The raid decrease of totalmass for rotating model results in smaller tidal radius.
5.2 Velocity dispersion and angular speed
The evolution of the mass-weighted central velocity disper-sion (σc) as a function of the central density (ρc) is shown inFig. 22. The evolution of the central velocity dispersion af-ter core-bounce for all post-collapse models shows a similartrend, i.e., the effect of rotation on the central velocity dis-persion after core-bounce is very small. Since the core rotateslike a rigid body, the rotation velocity near the cluster centeris negligible. While the run of σc on ρc during pre-collapseshows the power-law behaviour due to self-similarity of col-lapsing core for the single mass system (Cohn 1980, Kim etal 2002), the stellar system with mass spectrum does notshow a simple power-law in the early phase as explained inSect. 3.2, due to the mass segregation. The behaviour of σc
Figure 20. Time evolution of the central density of the individualmass component for models with (W0, α0, N) = (6,−2.35, 10000)and the initial rotations of (a) ω0 = 0.6, (b) ω0 = 0.3 and (c) ω0 =0.0, respectively. ρc of the massive stars increases very quickly dueto the development of the mass segregation.
Figure 21. Evolution of the total mass retained in a cluster.The parameters characterize the cluster model are written on theupper-right corner of the each panel. The epochs of core-collapseare marked with the open squares.
c© 0000 RAS, MNRAS 000, 000–000

Dynamical Evolution of Rotating Stellar Systems: III. The Effect of Mass Spectrum 15
Figure 22. Evolution of the mass-weighted 1D central velocitydispersion on the central density. The model clusters shown hereare the same to the models displayed in Fig. 3-21. The behaviourof σc on ρc after core-bounce shows a power-law signature irre-spective of the amount of the initial rotation.
on ρc after core-bounce can be, however approximated as asimple power-law even for the multi-mass systems becausethe mass-segregation was already established at the timeof the beginning of the expansion. The power-law index γcan be predicted by applying energy balance argument (Kimet al. 2002). Inspection of Fig. 22 shows γ ∼ 0.42, slightlysmaller than the power-law index of ∼ 0.33 obtained for thesingle mass system.
In Fig. 23, we have shown the run of the mass-weightedcentral angular rotational speed (Ωc) on the central density(ρc) for the whole post-collapse models which have the initialrotation. The angular speed also appears to follow roughlypower law on ρc during both pre- and post-collapse, exceptfor the early evolutionary stage in the pre-collapse phase forthe models with W0 = 3. The evolutions of Ωc on ρc afterthe very early stage shows a similar trend irrespective of thedegree of the initial rotation. It implies that the effect ofthe initial rotation for the cluster center disappears quickly.The evolutions of σc and Ωc on ρc of the individual masscomponent for models with the continuous mass spectrumis displayed in Fig. 24. The run of σc is represented well by asimple power-law. The higher the stellar mass, the shallowerthe power-law index. While the mass-weighted central angu-lar rotation speed appears to show the power-law behaviouron ρc, Ωc of the low mass stars deviates from the power-lawtype evolutionary behaviour during post-collapse phase. Itshows much steeper decrease than higher mass components,though the contribution of the lower mass component on thetotal Ωc is negligible.
Figure 23. Same as the Fig. 22, but for mass-weighted centralangular speed on the central density. Only rotating models areshown here. A small spike shown in figure (c) is mainly due tothe numerical error.
Figure 24. Evolution of the central velocity dispersion (a,b)andthe central angular speed (c,d) of the individual mass componentfor model clusters with the fastest initial rotation (ω0 = 0.6 forW0 = 6 and ω0 = 1.5 for W0 = 3). In σc on ρc plots, the indi-vidual mass component show a power-law behaviour, though theindex of the power-law depends on the mass of the individual star.The direction increasing individual mass is denoted with arrowsin panel (a) and (c), respectively.
c© 0000 RAS, MNRAS 000, 000–000

16 Eunhyeuk Kim1,2e-mail: [email protected], Hyung Mok Lee1e-mail: [email protected], and Rainer
Figure 25. Radial profiles of the rotational velocities at afew selected epochs for a cluster model with (W0, ω0, α0) =(6, 0.6,−2.35). Half-mass radii (rh) at corresponding epochs aremarked with open squares. At the initial time, the rotational in-side rh follows a rigid body rotation. Note that the radii is mea-sured with the current core radii.
5.3 Rotational profiles
In Figs. 25 and 26, we have shown the radial profiles of therotational velocity at equator for model with (W0, ω0) =(6, 0.6) and continuous mass spectrum with α0 = −2.35.The run of the rotational velocity for the selected mass com-ponents (m1, m4, m7, m10) is displayed in Fig. 26. Epochsshown in this plot are t/τrh,0 = 0.00, 1.50, 1.84, 3.24 and3.90, where the core-collapse occurs at t/τrh,0 = 1.84. Att/τrh,0 = 3.90 the cluster is nearly completely dissolved. Thehalf-mass radii at these each evolutionary times are markedwith open squares and the direction with increasing timesis shown with arrow in Fig. 25. Note that x-axis, i.e., radiusof cylindrical coordinate is measured in units of the currentcore radius.
Total rotational velocity decreases continuously withtime due to the loss of the angular momentum through thecluster boundary. The outward transfer of the angular mo-mentum causes the increase of the radius when it is mea-sured in units of current core radius, where the rotationalvelocity becomes the maximum. The radius of maximumrotational velocity decreases after core bounce due to thehigher mass-loss. While the changes of angular momentumdue to the outward transfer and the loss through the clus-ter boundary changes the structure of the velocity profilebeyond the half-mass radii, the shape of rotational velocityinside the cluster core remains to be rigid body rotation.
Figure 26. Same as the Fig. 25 but for a few selected masscomponents, (a) the lowest mass component m1, (b) m4, (c) m7
and (d) m10, the most massive star. The rotational structure ofthe massive stars extends farther than that of the less massivestars.
5.4 Evolution of mass function
Mass segregation drives the concentration of the higher massstars in the cluster center while the lower mass stars go tothe outer halo of the cluster. This leads to the preferen-tial evaporation of lower mass stars through the the tidalboundary. Therefore, low mass stars are selectively depletedfrom the initial mass function, resulting a change of the massfunction with time. Near the end of the evolution, the massfunction can even be inverted, i.e., there are more high massstars than lower mass stars. The global mass function φ(m)at several selected epochs for four different models with thecontinuous mass spectrum is displayed in Fig. 27. We includethe non-rotating models and the rapidly rotating models inorder to study the effect of the initial rotation on the massfunction. The shape of the mass function at the time ofcore-collapse is distinguished by dashed line from the massfunction at the other epochs. The evolution of power-law in-dex (α(M)) for whole post-collapse models with the contin-uous mass spectrum is shown is Fig. 28. The mass functiondeviates from the power-law as a result of mass-dependentevaporation rates. In Fig. 28, we have shown the typical errorof the fitted power-law index for the models which has thehighest initial rotation. The epochs where the core-collapseoccurs is marked with open squares. In the figures, we havechosen M/M0 for the abscissa instead of time because thelife-time of clusters are significantly different for differentmodels.
It is evident that the behavior of α does not dependsensitively on the degree of rotation, although the rotationcauses less change of α. Although the effect is small, the rota-tion causes slower changes in α as a function of M/M0. The
c© 0000 RAS, MNRAS 000, 000–000

Dynamical Evolution of Rotating Stellar Systems: III. The Effect of Mass Spectrum 17
Figure 27. Mass functions of the several selected epochs for thecluster models with the continuous initial mass function with apower-law index α0 = −2.35. For a comparison clusters with-out the initial rotation (Figs. a and b) and the clusters with thehighest rotation (Figs. c and d) for a given central potential aredisplayed. The epochs where the core-collapse happened are dis-tinguished with dashed lines from the other evolutionary epochs.The change of mass function measured by the power-law index asa function of the cluster mass in units of initial mass is shown innext figure Fig. 28).
angular momentum exchange among different mass speciesappears to act against the mass segregation.
The mass function also becomes dependent on the lo-cation as the mass segregation proceeds. The existence ofinitial rotation and its outward transfer also affect the en-ergy exchange process that causes mass segregation. In or-der to see the role of rotation on the mass segregation, wehave compared the evolution of α at four different loca-tions in Fig. 29. The different locations are chosen such thatr < rc, r < rh, rh < r < 2rh and 2rh < r < 3rh. The slopeof mass function inside the core (Fig 29a) increases withtime during pre-collapse evolution. At the time of the core-collapse the shape of the mass spectrum become inverted forall models. The power-law index α at this evolutionary stageremains ∼ 1.3 with a weak dependence on the the degree ofthe initial rotation. The mass function within the half-massradius is flattened continuously with the decrease of totalmass. The model without the initial rotation has a rathershallower mass function at fixed total mass compared to thatof the cluster rotating fast. Initial rotation plays an impor-tant role in removing the stars through the tidal boundaryincluding both the lower and higher mass stars. Comparedto non-rotating models, high mass stars in rotating modelsappear to have higher chance of evaporation. Thus the massfunction changes more slowly for rotating models than non-rotating models. Since the effect of the initial rotation re-mains in region rh < r < 2rh, it is expected that the shapes
Figure 28. Evolution of the power-law index αM on the totalcluster mass for whole post-collapse models with a continuousmass function. Open squares represent the core collapse timesfor each cluster model. The errorbar on each panel represent thetypical errorbar of the fastest rotating model when performing alinear least square fitting for a double logarithm plot such as thepanels in Fig. 27. The slope of the power-law mass function for acluster with the fastest initial rotation is slightly lower than thatof non-rotating model.
of mass function in this region shows significant dependenceon rotation. The concentration of the high mass componentin the cluster center drives the steepening of the mass func-tion near the half-mass radius. When the development ofmass segregation is settled in, the slope of the mass func-tion decreases with time due to the selective evaporation ofthe lower mass stars through the tidal radius. The evolutionof α for the highly rotating model shows a different profilecompared to that of non-rotating model at this radial region.While there is a central concentration of the massive stars,the angular momentum which has the maximum around rh
pushes the high mass stars outward. Therefore, there is onlya little change in α during the early evolutionary stage forrapidly rotating models.
6 CONCLUSION AND DISCUSSION
We have studied the dynamical evolution of the rotatingstellar systems with the mass spectrum by solving the orbit-averaged 2D FP equation in (E, Jz) space. Numerical simu-lations are performed both for simple two component clus-ters and for clusters with a power-law mass function repre-sented by ten mass species. In order to explore the evolu-tion after core collapse we add the heating by three-bodyprocesses. We have employed rotating King models as ini-tial models, where the velocity dispersions for all mass com-ponents are equal, i.e., no mass segregation at the begin-
c© 0000 RAS, MNRAS 000, 000–000

18 Eunhyeuk Kim1,2e-mail: [email protected], Hyung Mok Lee1e-mail: [email protected], and Rainer
Figure 29. Same as the Fig. 28 but for four different radial re-gions of cluster models with the central concentration W0 = 3,(a) r < rc, (b) r < rh, , (c) rh < r < 2rh and (d) 2rh < r < 3rh ,respectively. A combined effect due to the mass segregation andthe initial rotation is shown clearly in panels (c) and (d).
ning. The rotating King models are characterized by two pa-rameters: initial central potential (W0) and degree of initialrotation (ω0). Clusters with two different central potentialW0 = 6 and 3 are studied extensively. For models only untilcore-collapse, we have studied the evolution of the clusterswith six different mass functions for two-component models,while three models are studied for clusters with a continuousmass function (power-law). For models where the evolutionbeyond the core-collapse are explored, we consider clusterswith a mass function M2C (m2/m1 = 5, M1/M2 = 10) forthe two component model and clusters with α0 = −2.35 forthe model with continuous mass spectrum.
Our results show that, as in equal mass system, thepresence of the initial rotation accelerates the dynamicalevolution as manifested by rapid core collapse and dissolu-tion. The degree of the acceleration depends on the amountof the initial rotation and the shape of mass function. Asthe ratio of the mass (m2/m1) increases the degree of theacceleration decreases for two component models since bothmass segregation and the rotation compete in acceleration ofcore-collapse. If m2/m1 is very large, the mass segregationalone could significantly reduce the core-collapse time andthere is not much room for rotation to accelerate further.For models with the power-law mass function, the acceler-ation rate of core-collapse due to the rotation is larger forthe model with a steeper slope of the mass function for agiven initial rotation parameter (ω0). The shortening of thelife-time (dissolution of cluster) due to the rotation is ob-served far beyond the core bounce. The increase of massloss rate, resulting from the enhanced two-body relaxationprocess causes the faster dissolution of cluster.
The evolution of σc on ρc can be approximated by a
Figure 30. Comparison of observed radial profile of the rota-tional velocity over 1D velocity dispersion for the galactic glob-ular cluster M15 (data provided by Gebhardt 2002) with the re-sult of a selected two-component model with (W0, ω0) = (6, 0.6),(m2/m1, M1/M2) = (5, 10).
power-law except for the early evolutionary stage regardlessof the degree of rotation both for pre- and post-collapse. Themeasured power law index γ for pre-collapse is very close tothe value obtained for single mass system, while we haveobtained a slightly shallower slope for post-collapse phase.The development of mass segregation, a consequence of theevolution of the multi-mass system is visible clearly both fornon-rotating and rotating models. The evolution of Ωc on ρc
shows a power-law behaviour, too. The slope of the power-law is, however, larger than that obtained for the single masscluster. While the angular momentum is transferred onlyoutward for the equal mass system, the exchange of the an-gular momentum between different mass species occurs forthe multi-mass system, resulting a faster increase of Ωc onρc. Due to a cooperation of the central concentration of themassive stars (mass segregation) and the transfer of angu-lar momentum from high mass to low mass stars, the radiiwhere Vrot reaches the maximum value goes outward. Themaximum rotation of the most massive stars even increasesat the early times, while it shows a monotonic decrease forthe single mass system.
There are a few observations regarding the direct mea-surement of the rotation parameter (Vrot) (Gebhardt et al.1995). Recently Gerssen et al. (2002) reported the kinemat-ical study of the central part of the globular cluster M15,including Vrot. M15 is known as the globular cluster whichcontains a collapsed core. The radial profile of Vrot/σ (ro-tational velocity over one dimensional velocity dispersion)shows a steep increase and a rapid decline followed by aslow rise. The steep rise of Vrot/σ near the cluster centercan not be explained by a single mass model (Kim et al.2002). We have shown the run of Vrot/σ for two compo-
c© 0000 RAS, MNRAS 000, 000–000
Dynamical Evolution of Rotating Stellar Systems: III. The Effect of Mass Spectrum 19
nent model in Fig. 30 at two selected epochs, one in pre-collapse (t/τrh,0 = 0.42) and the other after core bounce(t/τrh,0 = 2.41), together with the observed data by Geb-hardt (2002). The radius is measured in current half-massradius. It is evident that cluster loose the angular momen-tum through the tidal boundary. The behaviour of the mass-weighted Vrot/σ (Fig. 30(a)) are roughly similar to that ofobserved profile of M15 except for the central region. Notethat the known half-mass radius of M15 is ∼ 3
′
.09 (Djor-govski 1993). For the high mass component, Vrot,i/σi wherei represents the individual mass component, at t = 2.41 ishigher than that obtained at t = 0.42, especially beyond rh.It is mainly due to the lower velocity dispersion after corebounce, not due to the higher value of the rotation veloci-ties. The highly rotating central region of M15 is, as in sin-gle mass system, not explained with the current multi-massmodels, although there is difference in rotational structurebetween the single mass and the multi-mass systems. Fromthe kinematical study of the central region of M15, Gerssenet al. (2002) proposed the presence of intermediate massblack hole (IMBH) with M = 3.9 × 10³M⊙. On the con-trary, Baumgardt et al. (2002) demonstrated that the riseof velocity dispersion into the center can be explained withthe clustering of the remnant stars, which are expected tobe overwhelmingly populated in the cluster core than thenormal stars. However, they did not rule out the possibilityof the presence of IMBH. It may be necessary to include theremnant stars and the IMBH in current 2DFP models toinvestigate the role of the initial rotation on the observedstrong increasing of Vrot/σ near the center of M15.
The models presented here still neglect many importantphysical processes occurring in real star clusters. The stellarevolution and primordial binaries are known to affect theearly evolution of globular clusters. The possible existenceof intermediate mass black hole in the center could also affectthe course of dynamical evolution. These will be the task offuture works.
This work was supported by the Korea Research Foun-dation Grant No. D00268 in 2001 to HML and by SFB439to RS.
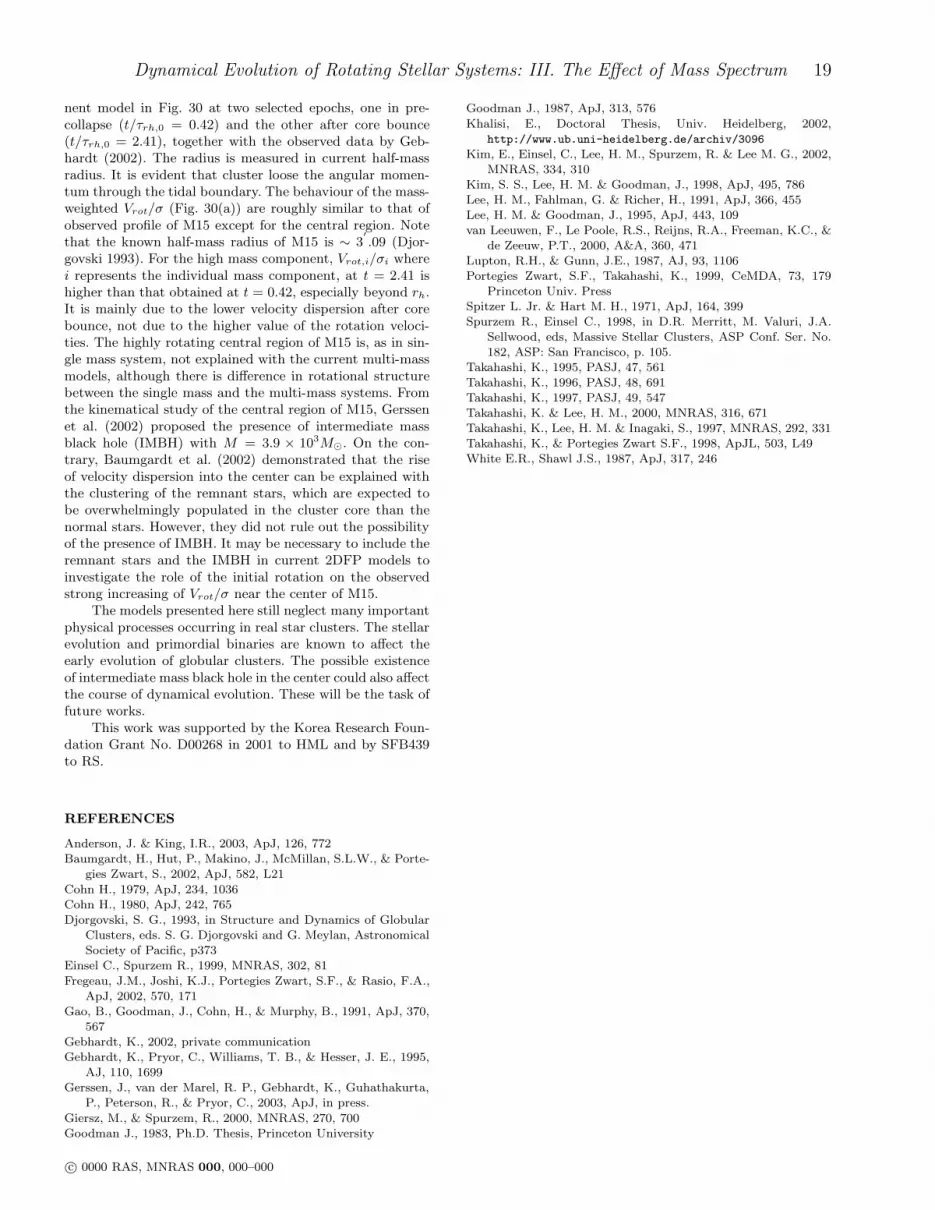
REFERENCES
Anderson, J. & King, I.R., 2003, ApJ, 126, 772Baumgardt, H., Hut, P., Makino, J., McMillan, S.L.W., & Porte-
gies Zwart, S., 2002, ApJ, 582, L21
Cohn H., 1979, ApJ, 234, 1036Cohn H., 1980, ApJ, 242, 765Djorgovski, S. G., 1993, in Structure and Dynamics of Globular
Clusters, eds. S. G. Djorgovski and G. Meylan, AstronomicalSociety of Pacific, p373
Einsel C., Spurzem R., 1999, MNRAS, 302, 81
Fregeau, J.M., Joshi, K.J., Portegies Zwart, S.F., & Rasio, F.A.,ApJ, 2002, 570, 171
Gao, B., Goodman, J., Cohn, H., & Murphy, B., 1991, ApJ, 370,567
Gebhardt, K., 2002, private communicationGebhardt, K., Pryor, C., Williams, T. B., & Hesser, J. E., 1995,
AJ, 110, 1699Gerssen, J., van der Marel, R. P., Gebhardt, K., Guhathakurta,
P., Peterson, R., & Pryor, C., 2003, ApJ, in press.
Giersz, M., & Spurzem, R., 2000, MNRAS, 270, 700Goodman J., 1983, Ph.D. Thesis, Princeton University
Goodman J., 1987, ApJ, 313, 576
Khalisi, E., Doctoral Thesis, Univ. Heidelberg, 2002,http://www.ub.uni-heidelberg.de/archiv/3096
Kim, E., Einsel, C., Lee, H. M., Spurzem, R. & Lee M. G., 2002,MNRAS, 334, 310
Kim, S. S., Lee, H. M. & Goodman, J., 1998, ApJ, 495, 786Lee, H. M., Fahlman, G. & Richer, H., 1991, ApJ, 366, 455Lee, H. M. & Goodman, J., 1995, ApJ, 443, 109van Leeuwen, F., Le Poole, R.S., Reijns, R.A., Freeman, K.C., &
de Zeeuw, P.T., 2000, A&A, 360, 471Lupton, R.H., & Gunn, J.E., 1987, AJ, 93, 1106Portegies Zwart, S.F., Takahashi, K., 1999, CeMDA, 73, 179
Princeton Univ. PressSpitzer L. Jr. & Hart M. H., 1971, ApJ, 164, 399Spurzem R., Einsel C., 1998, in D.R. Merritt, M. Valuri, J.A.
Sellwood, eds, Massive Stellar Clusters, ASP Conf. Ser. No.182, ASP: San Francisco, p. 105.
Takahashi, K., 1995, PASJ, 47, 561Takahashi, K., 1996, PASJ, 48, 691Takahashi, K., 1997, PASJ, 49, 547Takahashi, K. & Lee, H. M., 2000, MNRAS, 316, 671Takahashi, K., Lee, H. M. & Inagaki, S., 1997, MNRAS, 292, 331Takahashi, K., & Portegies Zwart S.F., 1998, ApJL, 503, L49White E.R., Shawl J.S., 1987, ApJ, 317, 246
c© 0000 RAS, MNRAS 000, 000–000