dynamic resource allocation for beyond 3g cellular networks
TRANSCRIPT
Wireless Pers Commun (2007) 43:1727–1740DOI 10.1007/s11277-007-9339-3
Dynamic Resource Allocation for Beyond 3G CellularNetworks
Dinh Thuy Phan Huy · Jonathan Rodriguez ·Atílio Gameiro · Rahim Tafazolli
Received: 31 October 2006 / Accepted: 13 June 2007 / Published online: 20 July 2007© Springer Science+Business Media, LLC 2007
Abstract The Multicarrier CDMA TransmissionTechniques for Integrated Broadband Cellular Systems(MATRICE) project addresses a candidate solution fora Beyond 3G (B3G) air-interface based on Multi-Car-rier Code Division Multiple Access (MC-CDMA). Itinvestigates dynamic resource allocation strategies atthe Medium Access Control (MAC) layer to support thetransport of Internet Protocol (IP) packets over the air-interface in a cost effective manner and maximise thecell capacity with a target QoS. A candidate DynamicResource Allocation (DRA) protocol architecture isproposed that is based on cross-layer signalling to pro-vide reactive resource allocation according to the fastchannel and traffic variations. In-line with B3G expec-tations, the proposed DRA handles a very large numberof users with inherent flexibility and granularity neces-sary to support heterogeneous traffic, and still with lim-ited complexity. Thanks to the modular architecture ofthe DRA, various scheduling policies are investigatedand compared in terms of capacity and reactivity tothe system environment. Simulation results have shownthat the MATRICE system has the potential to deliver
D. T. Phan HuyFrance Télécom R&D, Issy-Les-Moulineaux 92794, Francee-mail: [email protected]
J. Rodriguez (B) · A. GameiroInstituto Telec./Univ. Aveiro, Aveiro 3810-193, Portugale-mail: [email protected]
R. TafazolliCCSR/Univ. of Surrey, Guildford, Surrey, GU2 7XH, UKe-mail: [email protected]
broadband heterogenous services in a cost-effectivemanner, and emerge as a propespective candidateair-interface for B3G cellular networks.
Keywords Dynamic resource allocation ·Beyond3G · MC-CDMA · LTE · Scheduling
1 Introduction
Universal Mobile Telecommunications Systems (UMTS) is a global attempt to focus on a common mobilestandard that would provide dedicated voice connec-tions and a slim-down packet service to the end user,whilst ensuring global roaming. However, UMTS wasintentionally optimised for voices services, and the needfor high speed non-real time packet services led tothe evolution of High Speed Downlink Packet Access(HSDPA) [1]. It is considered an enhancement to R99,to cater for non-delay constrained services with errorfree packet transport requirements. Currently, both sys-tems are dimensioned to deliver a peak bit rate of2 Mbps, and around 10 Mbps respectively. However,mobile communications are now evolving towardsBeyond 3G (B3G) systems. The tentative definition ofB3G scenario envisages a network of systems whereany user can have a network connection to any sys-tem at any time in a cost effective manner, which hasprovided the impetus for research on cross-layer andcross-system optimisation, end-to-end system recon-figurability [2] and system on chip (SoC) design [3].
123
1728 D. T. Phan Huy et al.
The International Telecommunication Union Radio-communication Sector (ITU-R), responsible for settingthe evolutionary roadmap towards B3G, has defined thenext milestone [4]: a beyond International Mobile Tele-communications (IMT) 2000 system that can supportup to 100 Mbps peak bit rate in high mobility scenarios.The Multicarrier CDMA Transmission Techniques forIntegrated Broadband Cellular Systems (MATRICE)project [5] addresses a candidate solution for a B3Gair-interface based on Multi-Carrier Code Division Mul-tiple Access (MC-CDMA). It investigates advancedMC-CDMA signal processing detection techniques andDynamic Resource Allocation (DRA) at the MediumAccess Control (MAC) layer to support the transferof Internet Protocol (IP) packets over the air-interface.Furthermore, the MATRICE air interface parametershave been defined in accordance to a B3G scenario [5].It is envisaged that during the first stages of deploy-ment, the new cellular system may not provide com-plete coverage as expected with UMTS. Therefore,interoperability requirements with UMTS have beenstrongly taken into account in the design of the newsystem. Moreover, based on preliminary traffic esti-mation, system efficiency assumptions and spectrumavailability, a bandwidth requirement of 50 MHz at the5 GHz band has been considered as a good candidateto welcome the new radio interface. Concerning theduplex mode, the Time Division Duplex (TDD) modehas been selected mainly because of its expected advan-tages in terms of asymmetry, and to support the benefitsof channel reciprocity at the physical layer.
In addition to this general framework, a commonscenario for physical and system level simulations hasbeen defined to facilitate interaction. An urban deploy-ment model and its associated channel models havebeen specified as it is more likely that the new inter-face will be deployed in urban areas first. Additionally,video traffic model has been selected to assess the per-formance of the proposed interface as it is assumed tobe a widespread application.
Therefore the objective of this paper is to present anovel DRA architecture based on a cross-layer designapproach and to evaluate its performance as part ofa MATRICE integrated system. In-line with packet-based systems, this DRA scheme is also located in theMAC layer and uses physical layer information, packetscheduling, link adaptation, and re-transmissions, inorder to react to channel and traffic variations. How-ever, as the considered B3G system band is very large,
new challenges arise: the number of users and sharedresources are so large that the requirements of highgranularity and flexibility can rapidly lead to very com-plex DRA solutions.
This paper is structured as follows: Sect. 2 presentsthe physical layer interface; Sect. 3 details the MAT-RICE MAC layer protocol, where several candidateDRA algorithms are proposed; Sect. 4 presents thecommon system level simulation methodology; Sect.5 outlines the link to system level simulation interface;Sect. 6 presents the MATRICE system level simulationresults whilst Sect. 7 concludes this paper.
2 Physical Layer Interface
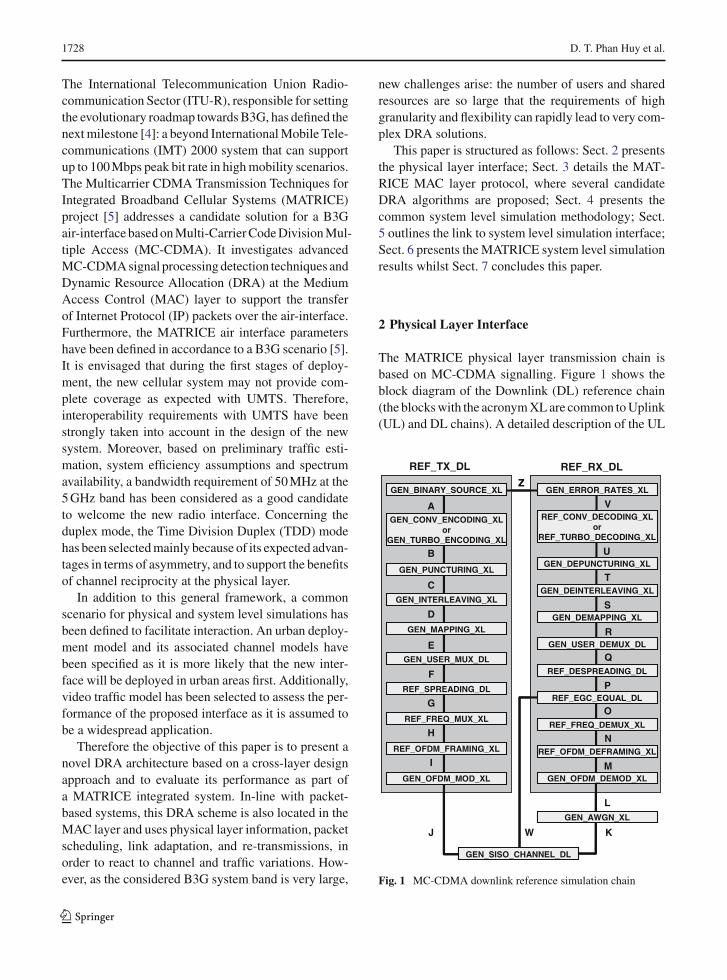
The MATRICE physical layer transmission chain isbased on MC-CDMA signalling. Figure 1 shows theblock diagram of the Downlink (DL) reference chain(the blocks with the acronym XL are common to Uplink(UL) and DL chains). A detailed description of the UL
REF_FREQ_MUX_XL
GEN_BINARY_SOURCE_XL
GEN_PUNCTURING_XL
GEN_INTERLEAVING_XL
GEN_MAPPING_XL
GEN_CONV_ENCODING_XLor
GEN_TURBO_ENCODING_XL
GEN_USER_MUX_DL
REF_SPREADING_DL
REF_OFDM_FRAMING_XL
GEN_OFDM_MOD_XL GEN_OFDM_DEMOD_XL
REF_OFDM_DEFRAMING_XL
REF_FREQ_DEMUX_XL
REF_EGC_EQUAL_DL
REF_DESPREADING_DL
GEN_USER_DEMUX_DL
GEN_DEMAPPING_XL
REF_CONV_DECODING_XLor
REF_TURBO_DECODING_XL
GEN_DEPUNCTURING_XL
GEN_DEINTERLEAVING_XL
GEN_SISO_CHANNEL_DL
GEN_AWGN_XL
GEN_ERROR_RATES_XL
A
B
C
D
E
F
G
H
I
J
V
U
S
R
Q
P
O
N
M
L
K
T
W
REF_TX_DL
Z
REF_FREQ_MUX_XL
GEN_BINARY_SOURCE_XL
GEN_PUNCTURING_XL
GEN_INTERLEAVING_XL
GEN_MAPPING_XL
GEN_CONV_ENCODING_XLor
GEN_TURBO_ENCODING_XL
GEN_USER_MUX_DL
REF_SPREADING_DL
REF_OFDM_FRAMING_XL
GEN_OFDM_MOD_XL GEN_OFDM_DEMOD_XL
REF_OFDM_DEFRAMING_XL
REF_FREQ_DEMUX_XL
REF_EGC_EQUAL_DL
REF_DESPREADING_DL
GEN_USER_DEMUX_DL
GEN_DEMAPPING_XL
REF_CONV_DECODING_XLor
REF_TURBO_DECODING_XL
GEN_DEPUNCTURING_XL
GEN_DEINTERLEAVING_XL
GEN_SISO_CHANNEL_DL
GEN_AWGN_XL
GEN_ERROR_RATES_XL
A
B
C
D
E
F
G
H
I
V
U
S
R
Q
P
O
N
M
T
Z
REF_RX_DL
Fig. 1 MC-CDMA downlink reference simulation chain
123
Dynamic Resource Allocation for Beyond 3G Cellular Networks 1729
Table 1 Main simulations parameters
Layer 1 parameters Value
Occupied bandwidth 41.6 MHz
FFT size 1024
Sampling frequency 57.6 MHz
Number of available carriers 736
Guard interval 200
Number of null carriers 144 (left),143 (right)
Slot duration 0.666 ms
Number of OFDM symbols per slot 30
Carrier frequency 5.0 GHz
and DL link level simulation platforms are presentedin [6].
Elaborating on Fig. 1, the spreading module usesWalsh–Hadamard spreading sequences. The frequencymultiplexing module distributes the chips of one datasymbol on the available sub-channels to maximise theuse of frequency diversity during the de-spreadingprocess. The DL or UL Single Input Single Output(SISO) channel model is synthesized by a tap-delayline model, where each tap is a Rayleigh fading channelin which the Doppler effect is taken into account. Atthe receiver, the equalization module performs phaseequalization or Equal Gain Combining (EGC) of thereceived samples for each sub-carrier. The main phys-ical layer configuration parameters are summarized inTable 1.
The available set of Modulation and Coding Schemes(MCS) with their corresponding instantaneous data ratesDMCS are presented in Table 2, where DMCS for a givenMCS is defined as the ratio of the number of data bitsNMCS that can be mapped onto one slot, using all thecodes and the entire frequency band, over the slot dura-tion Tslot.
3 MATRICE MAC Layer
In this section we address the DRA protocol that exploitscross-layer information to provide efficient mappingof data onto radio resource within the MAC layer andensure seamless connectivity for broadband services.Thanks to frequent signalling interaction between theBase Station (BS) and the Mobile Station (MS), theDRA can rapidly adapt the downlink packet transmis-
Table 2 Data rates
MCS Modulation Coding rate DMCS (Mbps)
1 QPSK 1/2 25.344
2 2/3 34.176
3 3/4 38.592
4 16QAM 1/2 51.84
5 2/3 69.504
6 3/4 78.336
7 64QAM 1/2 78.336
8 2/3 104.832
9 3/4 118.08
sion to the dynamic propagation conditions, interfer-ence and traffic demand. Furthermore, we considerthree candidate solutions for Packet Scheduling withinthe proposed DRA architecture.
3.1 Basic Resource Parameters
We assume a TDD frame with duration Tframe (alsocalled Transmission Time Interval (TTI)) of 2 ms. Thisshort frame has been selected because it enables fastinteraction between the BS and the MS and thus ensuresvery good link adaptability to the changing environ-ment, as illustrated by HSDPA system [7] which usesthe same frame length. This frame is composed of threetimeslots, two in DL and one in UL, as we assume thatfuture traffic demand will be asymmetric in favour ofDL services; the switching point between DL and ULtransmission in the TDD frame is fixed. In the DL, twocodes are reserved for control signalling: one code isallocated to a sensing common channel called the Com-mon Pilot Channel (CPICH); whilst the other code isallocated to a downlink Broadcast Signalling Channel(BCH). The 30 remaining codes are used for data trans-mission. We assume that the BS can transmit with fullpower Pmax in each sector. A ratio ρdata of this poweris allocated to data transmission, with an equal powerrepartition per data code. The remaining power givenby (1 −ρdata)× Pmax, is for the common control chan-nels. The CPICH channel is transmitted with constantpower PCPICH. In order to allow code multiplexing ofusers and to achieve a good radio resource granularity,we define 10 High Speed Downlink Shared Channels(HS-DSCH). Each HS-DSCH is mapped onto three
123
1730 D. T. Phan Huy et al.
PSHSDSCH
0
MS0
MSN
HSDSCHM
AMC andData Block Creation
HARQ Process Buffer
Mapping of Data Block onto selected HARQ process
HSDSCH0
HSDSCHM
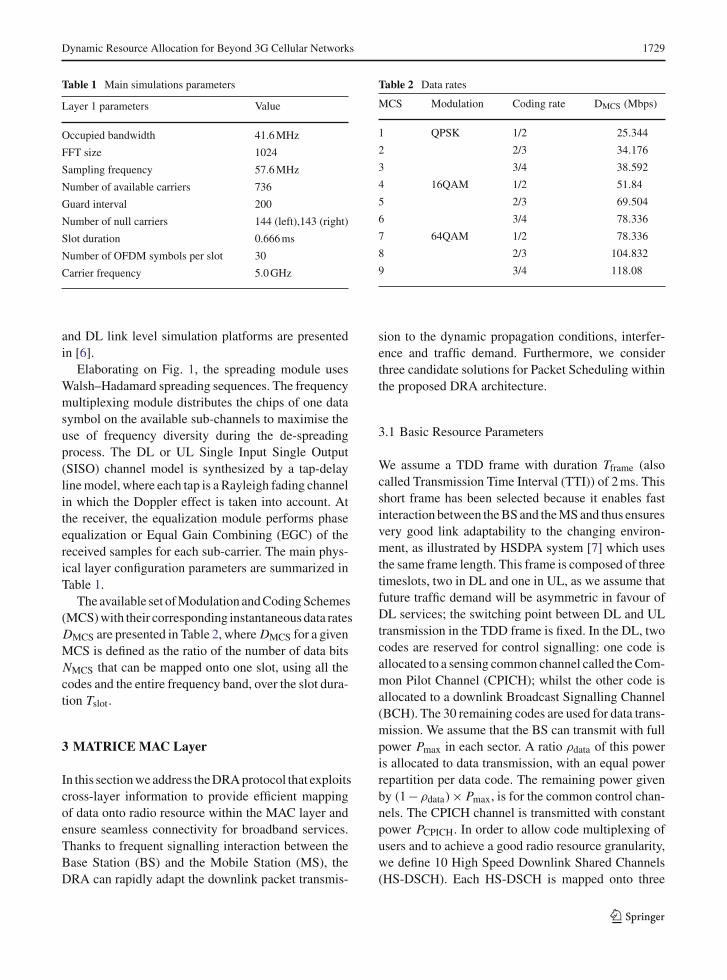
Fig. 2 DRA architecture
codes and two downlink slots; and is allocated a fixtransmission power PHSDSCH, equal to ρdata×Pmax/10.Consequently, the maximum DL throughput T ptmax isequal to 118 Mbps× (2/3)× (30/32) (i.e., 73.8 Mbps).
3.2 DRA Architecture
The DRA architecture is summarized in Fig. 2.The presented DRA scheme combines Packet Sched-
uling, Hybrid Automatic Repeat Request (H-ARQ)Chase Combining, and Adaptive Modulation and Cod-ing (AMC).
For each TTI, the aim of the DRA is to allocateeach HS-DSCH to one user in an efficient way. Weassume two different HS-DSCH channels can be allo-cated to two different users within the same frame. EachIP packet having arrived at the BS from the Core Net-work (CN), is stored in the First In First Out (FIFO)waiting queue dedicated to the MS to which it mustbe sent. When a MS is selected by the DRA for DLtransmission over a HS-DSCH channel, the DRA with-draws the required data bits from the queue in order tobuild one Data Block, which is concatenated with pad-ding bits if necessary, processed and mapped onto the3 codes and 2 slots of the HS-DSCH.
During each TTI n, for each HS-DSCH channel, theDRA updates the priority list of users having bits wait-ing for first transmission or re-transmission; selects theuser having the best selection metric according to the
Packet Scheduler described in Sect. 3.2.4, selects oneH-ARQ process defined in Sect. 3.2.2 for this user, andupdates the selected user waiting queue. Re-transmis-sions and first transmissions have the same priority. Forthe first transmission of one data block, the requiredMCS is selected according to the AMC mechanismdescribed in Sect. 3.2.3. During frame (n + 1), the BSbroadcasts on the BCH the identity of the scheduledMS, the selected MCS, and all information requiredto enable the target MS to demodulate the HS-DSCH.On frame (n + 2), the data block is sent to the targetMS, and processed according to the H-ARQ mecha-nism described in Sect. 3.2.2. On frame (n + 3), thetarget MS sends an Acknowledgement (ACK) or Neg-ative Acknowledgement (NACK) message.
3.2.1 User Quality Tracking
Periodically, for each user MSi , the measurement of theSignal To Interference Ratio (SIR) yn(MSi ) performedon the CPICH is reported, and it is available at the BSat nTCQI (TCQI is the reporting period). The Base Sta-tion can then predict the expected value wn(MSi ) of theSIR that could be achieved by the user on a HS-DSCHchannel:
wn(MSi ) = yn(MSi )PHSDSCH
PCPICH(1)
where PHSDSCH is the transmission power per HS-DSCHand PCPICH is the power allocated to the CPICH chan-nel. The quality of the channel associated to each MS istracked by a parameter called Channel Quality Indica-tor (CQI) which is updated every TCQI combining thepast information and value wn provided by the mea-surements, according to the following time-smoothingformula:
CQIn(MSi ) = 0.7wn(MSi ) + 0.3CQIn−1(MSi ) (2)
where CQIk(MSi ) is the value of the metric for time[kTCQI, (k + 1)TCQI
[. This parameter reflects the cur-
rent MS channel conditions and is used by both theAMC and the Packet Scheduler.
3.2.2 Asynchronous H-ARQ
Each MS has 4 simultaneous asynchronous stop-and-wait H-ARQ processes per HS-DSCH [7]. Each H-ARQprocess is statically associated with one HS-DSCH, andonly transmits over this HS-DSCH. A H-ARQ process
123
Dynamic Resource Allocation for Beyond 3G Cellular Networks 1731
is in charge of the transmission and re-transmissionsof one Data Block until this Data Block is successfullyreceived. On the reception of one version of the DataBlock, the MS combines the current version with previ-ous versions using Chase Combining [7]. Each H-ARQprocess is associated with one buffer in the BS to storea copy of the sent radio block, and one buffer in theMS to store the result of the combination of successiveversions. Buffers are freed when the radio block is suc-cessfully received or when the maximum number ofallowable re-transmissions Nretrans has been achieved.Once an H-ARQ process has been selected for trans-mission, the DRA must wait for an ACK/NACK mes-sage from the MS before selecting the H-ARQ processagain. Due to the time required for signalling (refer toSect. 3.2), the minimum time interval between two suc-cessive re-transmissions for a particular H-ARQprocess is four frames.
3.2.3 AMC Mechanism
When the DRA schedules a MS, and if this correspondsto the first transmission of new bits, the AMC selects themost spectrally efficient MCS (i.e., the one that maxi-mises the achievable bit rate) that guarantees a BlockError Rate (BLER) at the first transmission lower thana fix BLER threshold: BL E Rthres. The actual BLERexpected for a given MSi with a given MCS j is esti-mated using the current CQI value of MSi and is derivedfrom Look-Up Tables stored in the BS. If packet re-transmissions are needed, the same MCS used for thefirst transmission will be used. If a user is selected for afirst transmission, and if the achievable BLER is largerthan BL E Rthres even with the most power efficientMCS, the user data block is still sent with the mostpower efficient MCS. Though this may induce a lotof re-transmissions, this is supported so as to provideservice to users at the cell edge.
3.2.4 Scheduling Policy
There is one Packet Scheduler per HS-DSCH, and allthe schedulers are independent. For each frame, eachPacket Scheduler selects one user within the list ofwaiting users, and one H-ARQ process of the user
(among the four H-ARQ processes which are associ-ated with the HS-DSCH channel handled by the consid-ered Packet Scheduler). The Packet Scheduler selectsthe user that maximises the selection metric. We con-sider three different widespread scheduling algorithms:Max C/I (CI); Max Relative C/I (RCI) and Round Robin(RR) [8,9]. For user MSi and the nth TTI, the selectionmetrics mi,CI(n) and mi,RCI(n) of CI and RCI, respec-tively, are defined by:
mi,CI(n) = CQIn(MSi ) (3)
mi,RCI(n) = CQIn(MSi )/CQIn(MSi ) (4)
where CQIn(MSi ) is the SIR measured by user i andreported to its serving BS, and available at the BS atTTI n; CQIn(MSi ) is the CQI of MSi averaged over aperiod of Tav. At TTI n, CQIn(MSi ) is computed as:
CQIn(MSi ) = λ × CQIn−1(MSi )
+(1 − λ) × CQIn(MSi ) (5)
where λ is equal to 1 − T T I/Tav. For RR scheduling,no metric is used: the Packet Scheduler selects eachuser in turn, following the order of the list (orderedaccording to the users IDs).
During one frame, the DRA calls the Packet Sched-uler of each HS-DSCH channel in turn. Between twosuccessive calls of two distinct Packet Schedulers, theDRA updates the waiting queues of all users and updatesthe list of waiting users; this precaution is necessary toavoid the Packet Scheduler selecting a user having anempty waiting queue.
We can compare these three scheduling algorithmsunder the criteria of fairness and efficiency: RR is fairas it guarantees that each user is scheduled at least once;CI scheduling is efficient but not fair, as it only allo-cates the resources to the user experiencing the bestradio conditions; RCI scheduling is also efficient as itschedules users experiencing their best radio conditionsrelatively to their average radio conditions, and is alsofair as all users are scheduled at least once. CI andRCI scheduling algorithms are well-known becausethey exploit Multi-User Diversity [8,9]. Indeed, withthese schedulers, the larger the number of users com-peting for the resources, the greater the probability toschedule on the peak of its channel, and thus leadingto a large Multi-User Diversity Gain.
123
1732 D. T. Phan Huy et al.
4 System Level Simulation Methodology
4.1 Combined Snapshot-Dynamic Modeand Performance Metric
The system level performance evaluation methodologyis based on the 3GPP performance evaluation method-ology for HSDPA [7,10,11]. The simulator has beenvalidated against 3GPP simulation results [12].Simulations are carried out using a combined snap-shot-dynamic mode. More precisely, one simulation isconstituted of Nrun independent dynamic runs of Trun
real time. At the beginning of each run, MSs are createdand remain active throughout the simulation duration.These users are randomly uniformly distributed over ahexagonal network of tri-sectored cells. Let Nuser bethe average number of MSs per sector. The simulatednetwork is constituted of 57 sectors (3 tiers of 19 BSswith 3 sectors). The antenna pattern implemented inthe simulator for each sector is specified as:
A (θ) = −min[12 × (
θ/θ3 dB)2
, Am
](6)
where −180 ≤ θ < 180; min[ ] is the minimum func-tion, θ3dB is the 3 dB beamwidth; and Am is the max-imum attenuation. For each MS–BS pair, a randomshadowing value is drawn whilst mobile positions, shad-owing and path loss values are kept constant for thewhole simulation run duration. Then for each frameinterval, the following events are performed: packetsare generated according to the traffic model; the fastfading channel is updated; DRA executed, and packetquality detection is performed. During the packet qual-ity detection, the received block SIR of the packet iscomputed and mapped to the corresponding BLER usingthe link level interface. Then a random variable u uni-formly distributed between 0 and 1 is drawn. If u <
BLER, then the block is considered erroneous and aNACK message is signalled to the BS on the next frame,otherwise, the block is considered error free and anACK message is transmitted. We assume a full loadscenario: the number of users per sector is large enoughso as to assume that all BSs are transmitting continu-ously with maximum power. Consequently, only thecentral BS is simulated; other Base Stations are usedfor DL interference generation only. At the end of runi , the Service Throughput (S) for sector j , S(i,j), iscomputed. S(i,j) is defined as the ratio of the numberof correct data bits received in sector j over the runduration. The Average Service Throughput per Sector
is obtained by averaging the S(i,j) throughputs over allsectors and all runs.
4.2 Channel Models
The fast fading is generated using a modified Jakesmodel for fast generation of independent Rayleigh fad-ers [13]. The multi-path channel model E [5,14] is usedfor the serving sector, while a flat fading was assumedfor the neighbouring cells. Bi-dimensional log-normalshadowing is generated at the beginning of each run i .The shadowing SH(x,y,j) in dB between one MS(x,y)and one BS j is the sum of two variables:
SH(x, y, j) = √0.5 × (
F0(x, y) + Fj (x, y))
(7)
where F0(.) and Fj (.) are spatial functions generatedusing the method described in [15]. F0(.) and Fj (.)
have a Gaussian distribution with zero mean and σshad
standard deviation, and a spatial correlation given by:
R(d) = e− ln(2)×d/Decorr Length (8)
where d is the distance between two points on the net-work, and DecorrLength is the shadowing de-correla-tion length (shadowing inter-site correlation is 0.5). Thepath loss model is derived from initial measurementscarried out at 3.5 GHz in small urban areas [16] andshifted to the 5 GHz frequency band. The expressionof the path loss L(d) in dB is given by:
L(d) = 141.52 + 28 × log10(dkm) (9)
4.3 Traffic Models
Widespread traffic models have been used: the FullQueue (FQ) and the Near Real Time Video (NRTV)[10]. In the FQ traffic model, for each user, there isan infinite amount of bits waiting in the queue. Thistraffic model is particularly interesting to assess themaximum capacity of a network, and it is very similarto users downloading extremely large files. The NRTVtraffic model is a bursty traffic model with an averagesource bit rate of 64 Kbps.
4.4 Simplifying Assumptions
In order to minimize simulation time and to evaluatesystem capacity, we have omitted simulating dedicated
123
Dynamic Resource Allocation for Beyond 3G Cellular Networks 1733
signalling channels. Signalling is assumed to be error-free but the transmission delay is modelled. Further-more, all BSs are assumed to be synchronized andthe guard time between UL and DL transmission isassumed to be large enough so that the DL signal isonly interfered by DL interference. Furthermore, weonly simulate the DL in MATRICE, as the asymmetricnature of the traffic towards the DL raises the need foran adaptive high speed downlink connection.
5 Link to System Level Simulations Interface
To have an accurate evaluation of the system capac-ity, the link level performance needs to be taken intoaccount. However, the computational time arising witha heterogeneous simulation platform supporting bothbit and frame transmissions would be prohibitive.Therefore the system capacity evaluations exploit asimplified interface, using as inputs a reduced set ofparameters provided by the link level simulator to eval-uate received radio packet quality.
The Actual Value Interface (AVI) [17] has beenemployed, as the channel is assumed to be constantover a frame duration, which is valid for low speeds.The AVI approach is based on Look-Up Tables (LUT)that map block SIR to the BLER. The interface func-tionality is distributed where the BLER statistics areobtained by the MATRICE PHY layer platform, andthe received packet quality is measured within the sys-tem level evaluation platform. Specifically, the instan-taneous SIR, SIR(i, j), when a user i receives a datablock from sector j is given by:
SIR(i, j) =g(i, j) × PHSDSCH × SH(i, j) ×
Npath∑
l=1|h(i, l)|2
PL(i, j) ×(
Pnoise +Nsectors∑
k=1,k �= j
(g(i, j) × Pmax × SH(i, k) × |γ (i, k)|2) /PL(i, k)
) (10)
where PHSDSCH is the transmit power of the data block(as defined in Sect. 3); Pnoise is the thermal noise powerat the receiver; PL(i, j) is the path loss between MSi
and the BS of sector j ; SH(i, j) is the shadowing lossbetween MSi and the BS of sector j ; g(i, j) is the BSantenna gain in the direction of MSi in the sector j ;Nsectors is the number of sectors; h(i, l) is the ampli-tude of the lth path between MSi and sector j ; Npath isthe number of paths in the multi-path channel model
of the serving sector j ; γ (i, k) is the path loss betweenMSi and the BS of neighbouring sector k.
The link level simulations assume a SISO multi-pathchannel with Additive White Gaussian Noise (AWGN).Additionally, we have assumed perfect InterferenceCancellation (IC), and that inter-cell interference canbe modelled by Gaussian process [18]. For the H-ARQChase Combining described in Sect. 3.2.4, the SIR of acombined data block has been modelled as the sumof the SIRs associated with each transmission. Fur-ther details on the link level interface methodology andvalidity of assumptions stated herewith can be foundin [18].
6 Simulation Results
In this section, we present performance results of theDRA specified in Sect. 3, based on the methodologyand the link-to-system level interface described in Sects.1 and 5, respectively. Section 4 compares the perfor-mance of MATRICE system and 3GPP Long TermEvolution (LTE) [21].
6.1 Simulation Parameters
The input parameters of the simulations are recalledand listed in Table 3, where Dintersite is the inter-sitedistance, Fc is the carrier frequency, W0 is the systemband, Wnoise is the noise bandwidth, Pmax is the maxi-mum transmission power of the BS, ρdata is the fractionof power allocated to data transmission, N0 is the noisepower spectrum density, FMS is the mobile noise fig-ure, Tframe is the frame duration, Tmean is the averaging
window, Tslot is the slot duration, TCQIdelay is the delaybetween the beginning of the measurement of a CQIand the end of its report, TCQI is the CQI report period,Nretrans is the maximum number of retransmissionsallowed, GMS is the MS antenna Gain, GBS is the BSantenna gain in the main pointing direction, �3dB is theangle for which there is an a 3 dB loss, σshad is the shad-owing variance, BL E Rthres is the maximum thresholdfor link adaptation.
123
1734 D. T. Phan Huy et al.
Table 3 System simulation parameters
Parameter Value
Speed 3 kmph
Channel E
Dintersite 900 m
Fc 5 GHz
W0 50 MHz
Wnoise 41.46 MHz
Pmax 44 dBm
ρdata 0.8
N0 −174 dBm/Hz
FMS 9 dB
Tframe 2 ms
Tmean 1.5 s
Tslot 0.667 ms
TCQIdelay 2 frames
TCQI 2 frames
Nretrans 14
GMS 0 d Bi
GBS 14 dB
�3dB 70◦
σshad 8 dB
DecorrLength 20 m
BLERthres 1%
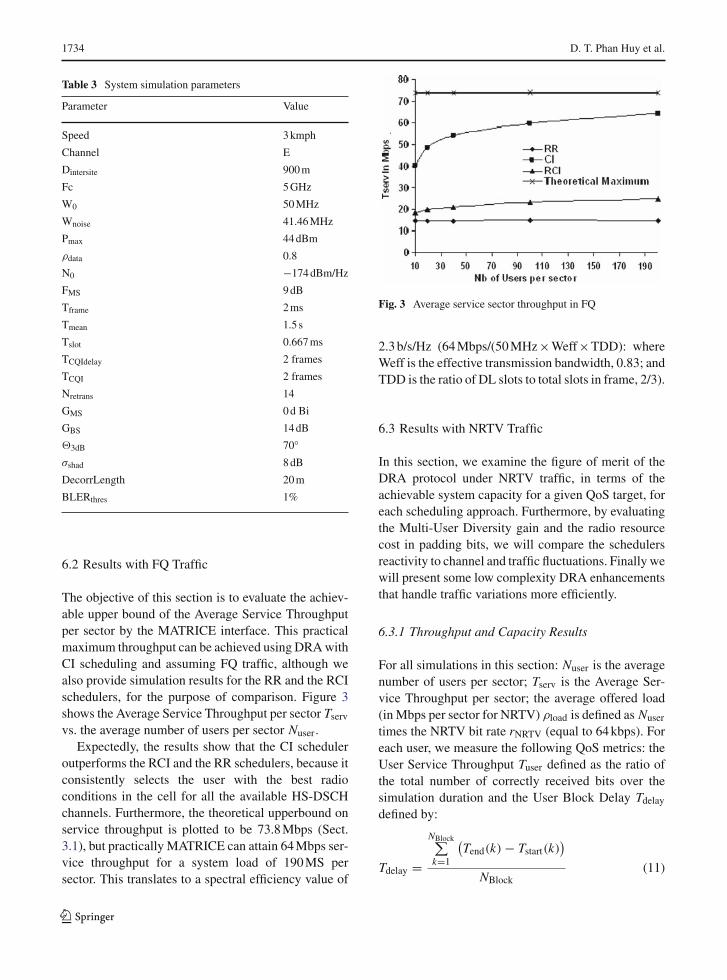
6.2 Results with FQ Traffic
The objective of this section is to evaluate the achiev-able upper bound of the Average Service Throughputper sector by the MATRICE interface. This practicalmaximum throughput can be achieved using DRA withCI scheduling and assuming FQ traffic, although wealso provide simulation results for the RR and the RCIschedulers, for the purpose of comparison. Figure 3shows the Average Service Throughput per sector Tserv
vs. the average number of users per sector Nuser.Expectedly, the results show that the CI scheduler
outperforms the RCI and the RR schedulers, because itconsistently selects the user with the best radioconditions in the cell for all the available HS-DSCHchannels. Furthermore, the theoretical upperbound onservice throughput is plotted to be 73.8 Mbps (Sect.3.1), but practically MATRICE can attain 64 Mbps ser-vice throughput for a system load of 190 MS persector. This translates to a spectral efficiency value of
Fig. 3 Average service sector throughput in FQ
2.3 b/s/Hz (64 Mbps/(50 MHz×Weff×TDD): whereWeff is the effective transmission bandwidth, 0.83; andTDD is the ratio of DL slots to total slots in frame, 2/3).
6.3 Results with NRTV Traffic
In this section, we examine the figure of merit of theDRA protocol under NRTV traffic, in terms of theachievable system capacity for a given QoS target, foreach scheduling approach. Furthermore, by evaluatingthe Multi-User Diversity gain and the radio resourcecost in padding bits, we will compare the schedulersreactivity to channel and traffic fluctuations. Finally wewill present some low complexity DRA enhancementsthat handle traffic variations more efficiently.
6.3.1 Throughput and Capacity Results
For all simulations in this section: Nuser is the averagenumber of users per sector; Tserv is the Average Ser-vice Throughput per sector; the average offered load(in Mbps per sector for NRTV) ρload is defined as Nuser
times the NRTV bit rate rNRTV (equal to 64 kbps). Foreach user, we measure the following QoS metrics: theUser Service Throughput Tuser defined as the ratio ofthe total number of correctly received bits over thesimulation duration and the User Block Delay Tdelay
defined by:
Tdelay =
NBlock∑
k=1
(Tend(k) − Tstart(k)
)
NBlock(11)
123
Dynamic Resource Allocation for Beyond 3G Cellular Networks 1735
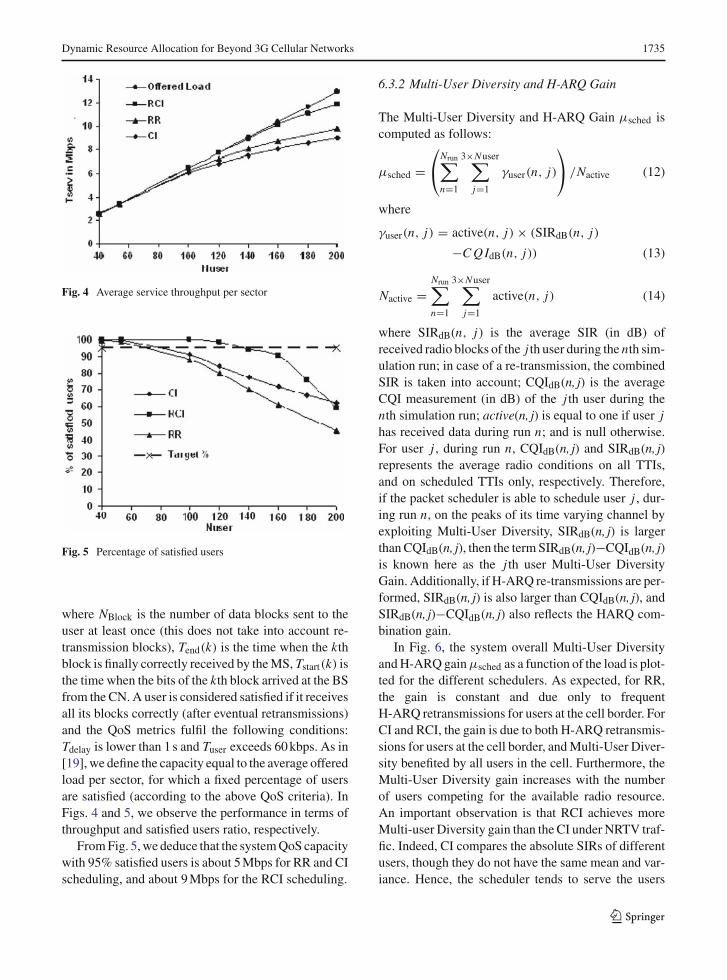
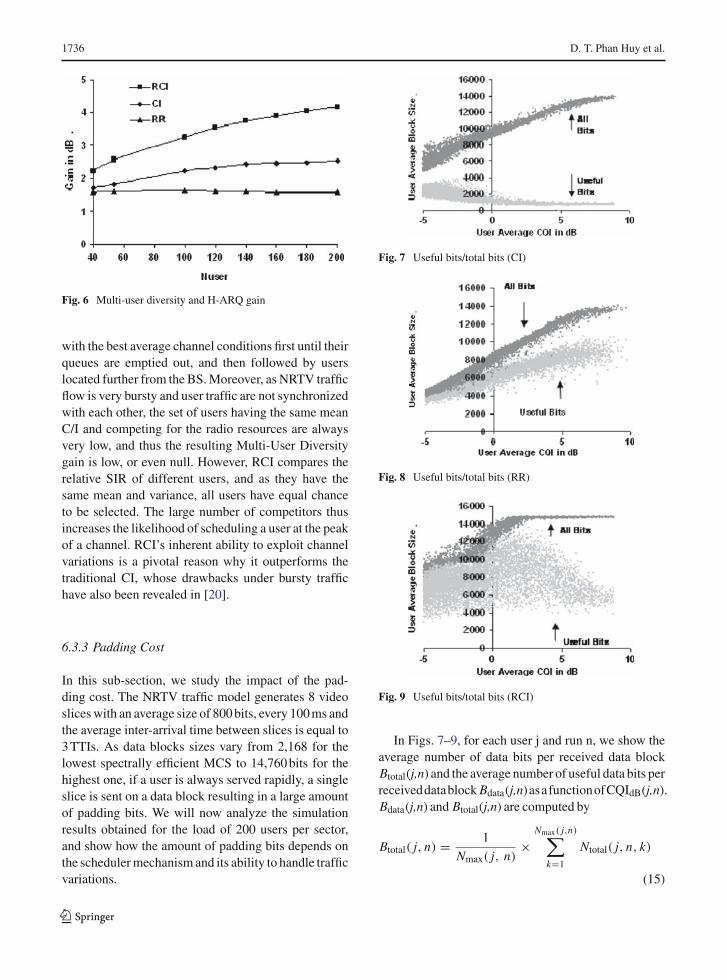
Fig. 4 Average service throughput per sector
Fig. 5 Percentage of satisfied users
where NBlock is the number of data blocks sent to theuser at least once (this does not take into account re-transmission blocks), Tend(k) is the time when the kthblock is finally correctly received by the MS, Tstart(k) isthe time when the bits of the kth block arrived at the BSfrom the CN. A user is considered satisfied if it receivesall its blocks correctly (after eventual retransmissions)and the QoS metrics fulfil the following conditions:Tdelay is lower than 1 s and Tuser exceeds 60 kbps. As in[19], we define the capacity equal to the average offeredload per sector, for which a fixed percentage of usersare satisfied (according to the above QoS criteria). InFigs. 4 and 5, we observe the performance in terms ofthroughput and satisfied users ratio, respectively.
From Fig. 5, we deduce that the system QoS capacitywith 95% satisfied users is about 5 Mbps for RR and CIscheduling, and about 9 Mbps for the RCI scheduling.
6.3.2 Multi-User Diversity and H-ARQ Gain
The Multi-User Diversity and H-ARQ Gain µsched iscomputed as follows:
µsched =⎛
⎝Nrun∑
n=1
3×Nuser∑
j=1
γuser(n, j)
⎞
⎠ /Nactive (12)
where
γuser(n, j) = active(n, j) × (SIRdB(n, j)
−C Q IdB(n, j)) (13)
Nactive =Nrun∑
n=1
3×Nuser∑
j=1
active(n, j) (14)
where SIRdB(n, j) is the average SIR (in dB) ofreceived radio blocks of the j th user during the nth sim-ulation run; in case of a re-transmission, the combinedSIR is taken into account; CQIdB(n, j) is the averageCQI measurement (in dB) of the j th user during thenth simulation run; active(n, j) is equal to one if user jhas received data during run n; and is null otherwise.For user j , during run n, CQIdB(n, j) and SIRdB(n, j)represents the average radio conditions on all TTIs,and on scheduled TTIs only, respectively. Therefore,if the packet scheduler is able to schedule user j , dur-ing run n, on the peaks of its time varying channel byexploiting Multi-User Diversity, SIRdB(n, j) is largerthan CQIdB(n, j), then the term SIRdB(n, j)−CQIdB(n, j)is known here as the j th user Multi-User DiversityGain. Additionally, if H-ARQ re-transmissions are per-formed, SIRdB(n, j) is also larger than CQIdB(n, j), andSIRdB(n, j)−CQIdB(n, j) also reflects the HARQ com-bination gain.
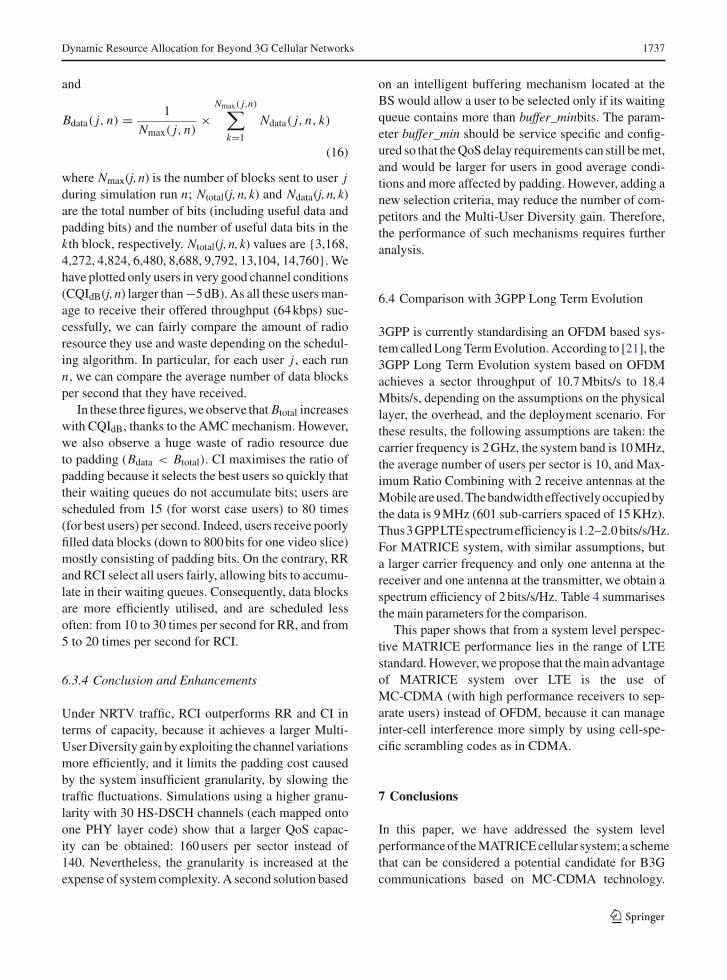
In Fig. 6, the system overall Multi-User Diversityand H-ARQ gain µsched as a function of the load is plot-ted for the different schedulers. As expected, for RR,the gain is constant and due only to frequentH-ARQ retransmissions for users at the cell border. ForCI and RCI, the gain is due to both H-ARQ retransmis-sions for users at the cell border, and Multi-User Diver-sity benefited by all users in the cell. Furthermore, theMulti-User Diversity gain increases with the numberof users competing for the available radio resource.An important observation is that RCI achieves moreMulti-user Diversity gain than the CI under NRTV traf-fic. Indeed, CI compares the absolute SIRs of differentusers, though they do not have the same mean and var-iance. Hence, the scheduler tends to serve the users
123
1736 D. T. Phan Huy et al.
Fig. 6 Multi-user diversity and H-ARQ gain
with the best average channel conditions first until theirqueues are emptied out, and then followed by userslocated further from the BS. Moreover, as NRTV trafficflow is very bursty and user traffic are not synchronizedwith each other, the set of users having the same meanC/I and competing for the radio resources are alwaysvery low, and thus the resulting Multi-User Diversitygain is low, or even null. However, RCI compares therelative SIR of different users, and as they have thesame mean and variance, all users have equal chanceto be selected. The large number of competitors thusincreases the likelihood of scheduling a user at the peakof a channel. RCI’s inherent ability to exploit channelvariations is a pivotal reason why it outperforms thetraditional CI, whose drawbacks under bursty traffichave also been revealed in [20].
6.3.3 Padding Cost
In this sub-section, we study the impact of the pad-ding cost. The NRTV traffic model generates 8 videoslices with an average size of 800 bits, every 100 ms andthe average inter-arrival time between slices is equal to3 TTIs. As data blocks sizes vary from 2,168 for thelowest spectrally efficient MCS to 14,760 bits for thehighest one, if a user is always served rapidly, a singleslice is sent on a data block resulting in a large amountof padding bits. We will now analyze the simulationresults obtained for the load of 200 users per sector,and show how the amount of padding bits depends onthe scheduler mechanism and its ability to handle trafficvariations.
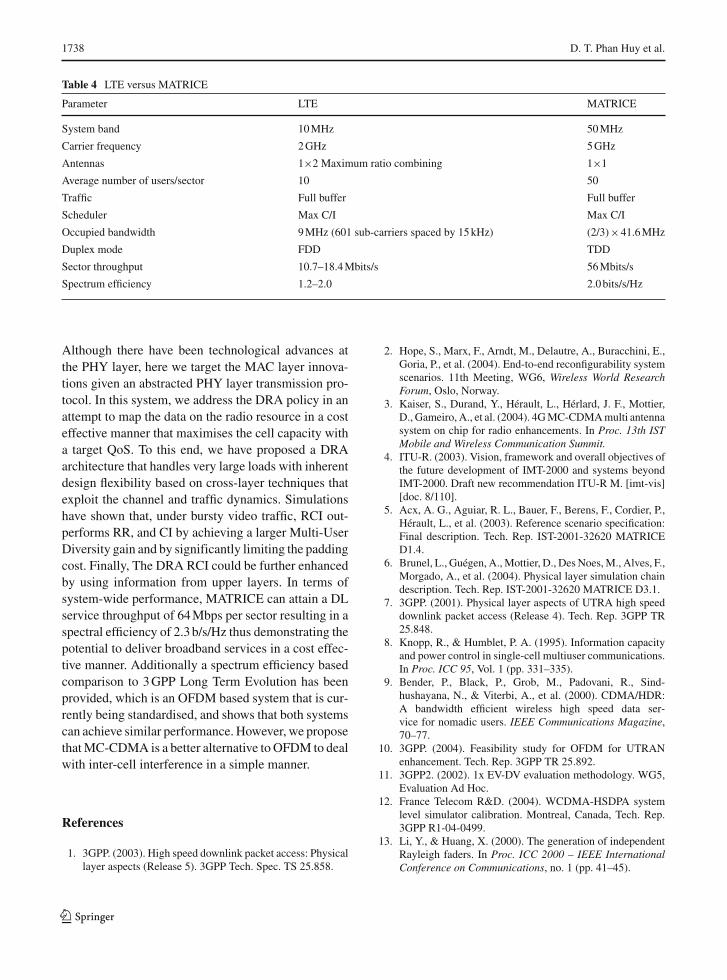
Fig. 7 Useful bits/total bits (CI)
Fig. 8 Useful bits/total bits (RR)
Fig. 9 Useful bits/total bits (RCI)
In Figs. 7–9, for each user j and run n, we show theaverage number of data bits per received data blockBtotal(j,n) and the average number of useful data bits perreceiveddatablock Bdata(j,n)asafunctionofCQIdB(j,n).Bdata(j,n) and Btotal(j,n) are computed by
Btotal( j, n) = 1
Nmax( j, n)×
Nmax( j,n)∑
k=1
Ntotal( j, n, k)
(15)
123
Dynamic Resource Allocation for Beyond 3G Cellular Networks 1737
and
Bdata( j, n) = 1
Nmax( j, n)×
Nmax( j,n)∑
k=1
Ndata( j, n, k)
(16)
where Nmax(j, n) is the number of blocks sent to user jduring simulation run n; Ntotal(j, n, k) and Ndata(j, n, k)are the total number of bits (including useful data andpadding bits) and the number of useful data bits in thekth block, respectively. Ntotal(j, n, k) values are {3,168,4,272, 4,824, 6,480, 8,688, 9,792, 13,104, 14,760}. Wehave plotted only users in very good channel conditions(CQIdB(j, n) larger than −5 dB). As all these users man-age to receive their offered throughput (64 kbps) suc-cessfully, we can fairly compare the amount of radioresource they use and waste depending on the schedul-ing algorithm. In particular, for each user j , each runn, we can compare the average number of data blocksper second that they have received.
In these three figures, we observe that Btotal increaseswith CQIdB, thanks to the AMC mechanism. However,we also observe a huge waste of radio resource dueto padding (Bdata < Btotal). CI maximises the ratio ofpadding because it selects the best users so quickly thattheir waiting queues do not accumulate bits; users arescheduled from 15 (for worst case users) to 80 times(for best users) per second. Indeed, users receive poorlyfilled data blocks (down to 800 bits for one video slice)mostly consisting of padding bits. On the contrary, RRand RCI select all users fairly, allowing bits to accumu-late in their waiting queues. Consequently, data blocksare more efficiently utilised, and are scheduled lessoften: from 10 to 30 times per second for RR, and from5 to 20 times per second for RCI.
6.3.4 Conclusion and Enhancements
Under NRTV traffic, RCI outperforms RR and CI interms of capacity, because it achieves a larger Multi-User Diversity gain by exploiting the channel variationsmore efficiently, and it limits the padding cost causedby the system insufficient granularity, by slowing thetraffic fluctuations. Simulations using a higher granu-larity with 30 HS-DSCH channels (each mapped ontoone PHY layer code) show that a larger QoS capac-ity can be obtained: 160 users per sector instead of140. Nevertheless, the granularity is increased at theexpense of system complexity. A second solution based
on an intelligent buffering mechanism located at theBS would allow a user to be selected only if its waitingqueue contains more than buffer_minbits. The param-eter buffer_min should be service specific and config-ured so that the QoS delay requirements can still be met,and would be larger for users in good average condi-tions and more affected by padding. However, adding anew selection criteria, may reduce the number of com-petitors and the Multi-User Diversity gain. Therefore,the performance of such mechanisms requires furtheranalysis.
6.4 Comparison with 3GPP Long Term Evolution
3GPP is currently standardising an OFDM based sys-tem called Long Term Evolution. According to [21], the3GPP Long Term Evolution system based on OFDMachieves a sector throughput of 10.7 Mbits/s to 18.4Mbits/s, depending on the assumptions on the physicallayer, the overhead, and the deployment scenario. Forthese results, the following assumptions are taken: thecarrier frequency is 2 GHz, the system band is 10 MHz,the average number of users per sector is 10, and Max-imum Ratio Combining with 2 receive antennas at theMobileareused.Thebandwidtheffectivelyoccupiedbythe data is 9 MHz (601 sub-carriers spaced of 15 KHz).Thus3 GPPLTEspectrumefficiencyis1.2–2.0 bits/s/Hz.For MATRICE system, with similar assumptions, buta larger carrier frequency and only one antenna at thereceiver and one antenna at the transmitter, we obtain aspectrum efficiency of 2 bits/s/Hz. Table 4 summarisesthe main parameters for the comparison.
This paper shows that from a system level perspec-tive MATRICE performance lies in the range of LTEstandard. However, we propose that the main advantageof MATRICE system over LTE is the use ofMC-CDMA (with high performance receivers to sep-arate users) instead of OFDM, because it can manageinter-cell interference more simply by using cell-spe-cific scrambling codes as in CDMA.
7 Conclusions
In this paper, we have addressed the system levelperformance of the MATRICE cellular system; a schemethat can be considered a potential candidate for B3Gcommunications based on MC-CDMA technology.
123
1738 D. T. Phan Huy et al.
Table 4 LTE versus MATRICE
Parameter LTE MATRICE
System band 10 MHz 50 MHz
Carrier frequency 2 GHz 5 GHz
Antennas 1×2 Maximum ratio combining 1×1
Average number of users/sector 10 50
Traffic Full buffer Full buffer
Scheduler Max C/I Max C/I
Occupied bandwidth 9 MHz (601 sub-carriers spaced by 15 kHz) (2/3)×41.6 MHz
Duplex mode FDD TDD
Sector throughput 10.7–18.4 Mbits/s 56 Mbits/s
Spectrum efficiency 1.2–2.0 2.0 bits/s/Hz
Although there have been technological advances atthe PHY layer, here we target the MAC layer innova-tions given an abstracted PHY layer transmission pro-tocol. In this system, we address the DRA policy in anattempt to map the data on the radio resource in a costeffective manner that maximises the cell capacity witha target QoS. To this end, we have proposed a DRAarchitecture that handles very large loads with inherentdesign flexibility based on cross-layer techniques thatexploit the channel and traffic dynamics. Simulationshave shown that, under bursty video traffic, RCI out-performs RR, and CI by achieving a larger Multi-UserDiversity gain and by significantly limiting the paddingcost. Finally, The DRA RCI could be further enhancedby using information from upper layers. In terms ofsystem-wide performance, MATRICE can attain a DLservice throughput of 64 Mbps per sector resulting in aspectral efficiency of 2.3 b/s/Hz thus demonstrating thepotential to deliver broadband services in a cost effec-tive manner. Additionally a spectrum efficiency basedcomparison to 3 GPP Long Term Evolution has beenprovided, which is an OFDM based system that is cur-rently being standardised, and shows that both systemscan achieve similar performance. However, we proposethat MC-CDMA is a better alternative to OFDM to dealwith inter-cell interference in a simple manner.
References
1. 3GPP. (2003). High speed downlink packet access: Physicallayer aspects (Release 5). 3GPP Tech. Spec. TS 25.858.
2. Hope, S., Marx, F., Arndt, M., Delautre, A., Buracchini, E.,Goria, P., et al. (2004). End-to-end reconfigurability systemscenarios. 11th Meeting, WG6, Wireless World ResearchForum, Oslo, Norway.
3. Kaiser, S., Durand, Y., Hérault, L., Hérlard, J. F., Mottier,D., Gameiro, A., et al. (2004). 4G MC-CDMA multi antennasystem on chip for radio enhancements. In Proc. 13th ISTMobile and Wireless Communication Summit.
4. ITU-R. (2003). Vision, framework and overall objectives ofthe future development of IMT-2000 and systems beyondIMT-2000. Draft new recommendation ITU-R M. [imt-vis][doc. 8/110].
5. Acx, A. G., Aguiar, R. L., Bauer, F., Berens, F., Cordier, P.,Hérault, L., et al. (2003). Reference scenario specification:Final description. Tech. Rep. IST-2001-32620 MATRICED1.4.
6. Brunel, L., Guégen, A., Mottier, D., Des Noes, M., Alves, F.,Morgado, A., et al. (2004). Physical layer simulation chaindescription. Tech. Rep. IST-2001-32620 MATRICE D3.1.
7. 3GPP. (2001). Physical layer aspects of UTRA high speeddownlink packet access (Release 4). Tech. Rep. 3GPP TR25.848.
8. Knopp, R., & Humblet, P. A. (1995). Information capacityand power control in single-cell multiuser communications.In Proc. ICC 95, Vol. 1 (pp. 331–335).
9. Bender, P., Black, P., Grob, M., Padovani, R., Sind-hushayana, N., & Viterbi, A., et al. (2000). CDMA/HDR:A bandwidth efficient wireless high speed data ser-vice for nomadic users. IEEE Communications Magazine,70–77.
10. 3GPP. (2004). Feasibility study for OFDM for UTRANenhancement. Tech. Rep. 3GPP TR 25.892.
11. 3GPP2. (2002). 1x EV-DV evaluation methodology. WG5,Evaluation Ad Hoc.
12. France Telecom R&D. (2004). WCDMA-HSDPA systemlevel simulator calibration. Montreal, Canada, Tech. Rep.3GPP R1-04-0499.
13. Li, Y., & Huang, X. (2000). The generation of independentRayleigh faders. In Proc. ICC 2000 – IEEE InternationalConference on Communications, no. 1 (pp. 41–45).
123
Dynamic Resource Allocation for Beyond 3G Cellular Networks 1739
14. Medbo, J., Anderson, H., Scramm, P., Asplud, H., & Berg,J. E. et al. (1998). Channel models for HIPERLAN/2 indifferent indoor scenarios. Tech. Rep. COST259 TD(98),Bradford, UK.
15. Cai, X., & Giannakis, G. B. et al. (2003). IEEE, A two-dimensional channel simulation model for shadowing pro-cesses. IEEE Transactions on Vehicular Technology, 52(6).
16. Siaud, I., & Morin, B. (1999). Investigations on radio propa-gation channel measurements at 2.2 GHz and 3.5 GHz for thefixed wireless access in an urban areas. Annales des Télécom-munications, 54, N◦9–10.
17. Hämäläinen, S., Slanina, P., Hartman, M., Lappetelainen,A. & Holma, H. et al. (1997). A novel interface betweenlink and system level simulations. In Proc. ACTS MobileTelecommunications Summit, (pp. 599–604).
18. Bauer, F., Berens, F., Phan Huy, D. T., Rodriguez, J., &Yang, X. (2004). System level simulation results—multi-cell environment. Tech. Rep. IST-2001-32620 MATRICED4.6.
19. ETSI. (1998). Universal mobile telecommunications system(UMTS); selection procedures for the choice of radio trans-mission technologies of the UMTS. Tech Rep TR101 112UMTS 30.03 v3.2.0.
20. Bonald, T. (2004). A score-based opportunistic schedulerfor fading radio channels. In Proc. European Wireless.
21. 3GPP. (2006). Physical layer aspects for evolved Universalterrestrial radio access (Release 7). 3GPP Tech. Rep. TS25.814.
Dinh Thuy Phan Huy wasborn in 1977 in Paris,France. She received herMasters degree of Electri-cal and Computer Engineer-ing from Supelec in 2001.In 2001, she has workedon UMTS in Alcatel as atrainee engineer. Since 2001she is with France Tele-com as a research and devel-opment engineer. She hasbeen actively contributing tosystem level design and per-
formance evaluation for both downlink and uplink directions,in several IST projects, namely, MATRICE, 4MORE andWINNER. She has been leading Beyond 3G scenario defini-tion activities in MATRICE project. She has participated to3GPP standardization on HSDPA system level simulation andperformance comparison of OFDM and WCDMA, and is cur-rently France Telecom/Orange RAN1 delegate at the 3GPP. Herresearch interests include mobile radio networks for 3G andbeyond 3G, with emphasis on joint MAC-physical layer design,dynamic resource allocation and inter-cell interference avoid-ance, system simulation methodologies for both downlink anduplink, system performance comparisons of HSDPA, HSUPA,3GPP Long Term Evolution and Mobile WiMAX standards.
Jonathan Rodriguez rece-ived his Masters degreein Electronic and Electri-cal engineering and Ph.Dfrom the University of Sur-rey, in 1998 and 2004 respec-tively. In 2002, he becamea Research Fellow at theCentre for CommunicationSystems Research at Surrey.He has been actively lead-ing system level technicalactivities in the IST MAT-RICE ,4MORE and MAG-NET projects. Since 2005, heis a Senior Researcher at the
Instituto de Telecomunicações, Pólo de Aveiro. He is authorof several conference and journal publications, and has carriedout consultancy for major manufacturers participating in DVB-T and HS-UPA standardization. His research interests includeRadio Access Networks for current and beyond3G systemswith specific emphasis on Radio Resource Management, systemlevel simulation methodologies, Cross-Layer and Cross-systemdesign, and Channel Estimation and signal processing techniquesfor UMTS and MC-SS-MA (Multi Carrier-Spread Spectrum-Multiple Access) techniques.
Atílio Gameiro receivedhis Licenciatura (five yearscourse) and his PhD fromthe University of Aveiro in1985 and 1993 respectively.He is currently a Professor inthe Department of Electron-ics and Telecommunicationsof the University of Aveiro,and a researcher at the In-stituto de Telecomunicações- Pólo de Aveiro, where heis head of group. His maininterests lie in signal pro-
cessing techniques for digital communications and communi-cation protocols. Within this research line he has done work foroptical and mobile communications, either at the theoretical andexperimental level, and has published over 100 technical papersin International Journals and conferences. His current researchactivities involve space-time-frequency algorithms for the broad-band component of 4G systems and joint design of layers 1 and 2.
123
1740 D. T. Phan Huy et al.
Rahim Tafazolli is a Pro-fessor of Mobile/Personalcommunications and Headof mobile CommunicationsResearch Group of CCSR,the University of Surrey,UK. He has been active inresearch for over 20 yearsand has authored and co-authored more than 300papers in refereed interna-tional journals and confer-ences. Professor Tafazollihas been consultant to many
mobile companies, lectured, Chaired and being invited as key-
note speaker to a number of IEE Summer schools and IEEEworkshops and conferences. He has been technical advisor tomany mobile companies, Home Office and European Union allin the field of mobile communications. He is the Founder andpast Chairman of IEE International Conference on 3rd Genera-tion Mobile Communications. He is member of Motorola Vision-ary Board, Chairman of EU Expert Group on Mobile Platform,past chairman of WG 3 of WWRF, and editor of Book of Vision2004. He is nationally and internationally known in the filed ofmobile communications and acts as external examiner for Nany-ang Technological University (Singapore), University of Lim-erick (Ireland), King’s College London, University of Birming-ham (UK), University of Southampton (UK) and British TelecomMSc Course.
123