3g ran parameter testing reference quide (r99)
TRANSCRIPT
3G Radio OptimizationParameter Testing Guide
Version 2.0
2/102 GS MS NPO Network Planning & Optimization Capability
RAN Parameter Testing Guide10/11/2022
Copyright 2007 Nokia Siemens Networks.All rights reserved.
DOCUMENT DESCRIPTION
Title and version
3G Radio Optimization Parameter Testing Guide
ReferenceTarget Group RadioTechnology and SW release
3G RAN
Related Service ItemsService Item number
When applicable
Author Pekka Ranta , Seema GyanwaliDate 06 June 2005Approver Florian Reymond
CHANGE RECORD
This section provides a history of changes made to this document
VERSION DATE EDITED BY SECTION/S COMMENTS
2.0 7. 11.2008
Poon ChiKeong ALL
3/102 GS MS NPO Network Planning & Optimization Capability
RAN Parameter Testing Guide10/11/2022
Copyright 2007 Nokia Siemens Networks.All rights reserved.
Copyright © Nokia Siemens Networks. This material, including documentation and any related computer programs, is protected by copyright controlled by Nokia Siemens Networks. All rights are reserved. Copying, including reproducing, storing, adapting or translating, any or all of this material requires the prior written consent of Nokia Siemens Networks. This material also contains confidential information which may not be disclosed to others without the prior written consent of Nokia Siemens Networks.
4/102 GS MS NPO Network Planning & Optimization Capability
RAN Parameter Testing Guide10/11/2022
Copyright 2007 Nokia Siemens Networks.All rights reserved.
Table of contents
1. Purpose and Scope...............................10
2. Tools & Procedures..............................11
2.1 Tools...........................................11
2.2 Test Procedures.................................112.2.1 Parameter sets................................................112.2.2 Drive Test....................................................11
3. Call setup performance..........................13
3.1 Idle Mode Performance...........................133.1.1 Parameters....................................................143.1.2 Testing Scenarios.............................................153.1.3 Example Results...............................................163.1.4 Conclusions for this network..................................21
3.2 RRC Connection Establishment Performance........223.2.1 Parameters....................................................233.2.2 Example Results...............................................26
3.3 RAB Establishment/RAB Completion Performance. . . .293.3.1 Parameters....................................................293.3.2 Testing Scenarios.............................................313.3.3 Example results...............................................32
3.4 Call Setup Success Rate (CSSR) & Time...........343.4.1 Parameters....................................................343.4.2 Testing Scenarios.............................................353.4.3 Example Results...............................................36
4. SHO Performance.................................41
4.1 Parameters......................................42
4.2 Testing Scenario................................43
4.3 Example Results.................................45SHO Tuning: CPICH Ec/No Filter Coefficient.............................45
5/102 GS MS NPO Network Planning & Optimization Capability
RAN Parameter Testing Guide10/11/2022
Copyright 2007 Nokia Siemens Networks.All rights reserved.
SHO Tuning: Addition and Drop Time.....................................46SHO Tuning: Replacement Window and Drop Window.........................47SHO Tuning: Add Window and Drop Window.................................47
5. PS DATA PERFORMANCE.............................49
5.1 Cell Throughput.................................495.1.1 Parameters....................................................495.1.2 Testing Scenarios.............................................515.1.3 Example Results...............................................52
5.2 Dynamic Link Optimisation.......................555.2.1 Parameters....................................................575.2.2 Testing Scenarios.............................................585.2.3 Example Results...............................................58
6. Inter-system handover...........................62
6.1 3G to GSM Handover..............................626.1.1 Parameters....................................................626.1.2 Testing Scenarios.............................................636.1.3 Example results...............................................65
6.2 GSM to 3G handover..............................686.2.1 GSM to 3G HO (Before BSS S13).................................686.2.2 GSM to 3G Handover (BSS S13)..................................686.2.3 Parameters....................................................716.2.4 Testing Scenarios.............................................71
6.3 3G to GSM cell Reselection......................726.3.1 Parameters....................................................726.3.2 Testing Scenarios.............................................72
6.4 GSM to 3G Cell Reselection......................756.4.1 Parameters....................................................766.4.2 Testing Scenarios.............................................78
7. Summary of Parameter Testing List...............83
8. References......................................84
9. Acronyms/Glossary...............................85
6/102 GS MS NPO Network Planning & Optimization Capability
RAN Parameter Testing Guide10/11/2022
Copyright 2007 Nokia Siemens Networks.All rights reserved.
10. Annex A.........................................86
List of tables
Table 1: Parameter test set example....................................11
Table 2 Cell reselection Parameters with default values................15
Table 3: RSCP based intra-frequency cell ranking parameter.............15
Table 4 Different parameter sets to be tested in different environment.16
Table 5: RU 10: Different parameter set testing for RSCP cell ranking(intra-frequency)......................................................16
Table 6 Needed EcNo and RSCP for good CSSR and BLERs...................21
Table 7 Open loop PC parameters with default values....................24
Table 8 UE power parameter set example................................28
Table 9 Parameters having impact to the RAB access.....................30
Table 10 Different parameter sets to test RAB establishment............31
Table 11: CPICHRefRABoffset & PCrangeDL parameter test set.............31
Table 12 : N313 and T313 parameter test................................31
Table 13 Proposed set to test ATO and TOAWS/TOAWE_XXX parameter........35
Table 14 : NSN recommendation on MSC/VLR Authentication setting........40
Table 15 Main SHO parameters with default values.......................43
7/102 GS MS NPO Network Planning & Optimization Capability
RAN Parameter Testing Guide10/11/2022
Copyright 2007 Nokia Siemens Networks.All rights reserved.
Table 16 Set of CPICH Ec/No filter coefficient parameters..............45
Table 17 Parameters to be tested for cell PS throughput................50
Table 18 Test sets for DL traffic volume parameter.....................52
Table 19 Link budget examples for cell range...........................56
Table 20 Link budget example for downgrade estimation..................56
Table 21 The calculation for PtXDLAbsMax based on link budget..........57
Table 22 Main DyLo Parameters with default values......................58
Table 23 Different testing scenarios to be tested......................58
Table 24 Main DyLo sets to be tested...................................58
Table 25 Example of total time spend on different bitrate with differentparameter sets.........................................................61
Table 26 Example set of parameters for EcNo, RSCP and UeTxPwr thresholdswith AMR...............................................................63
Table 27 Set of different filtering and time hysteresis parameters forAMR....................................................................64
Table 28 Set of different UeTxPwer and DL DCH power parameters for PSdata...................................................................64
Table 29: 2G to 3G cell reselection RSCP criteria......................75
Table 30 Mapping of Fdd_Qmin...........................................78
Table 31 : Fdd_Qmin_Offset Parameter Value.............................78
Table 32 : FDD_RSCPmin Parameter Value.................................80
List of figures
Figure 1 Good call setup time performance..............................13
Figure 2 Bad call setup time performance..............................13
Figure 3 Cell reselection during RRC connection setup..................14
8/102 GS MS NPO Network Planning & Optimization Capability
RAN Parameter Testing Guide10/11/2022
Copyright 2007 Nokia Siemens Networks.All rights reserved.
Figure 4 Scanner measurements for best server and second best server...17
Figure 5 Call setup statistics with different idle mode parameters.....18
Figure 6 Call setup statistics with different idle mode parameters.....19
Figure 7 BLER results with different idle mode parameters..............19
Figure 8 Idle mode test results in Urban environment...................20
Figure 9 Idle mode test results in Rural environment...................20
Figure 10 Idle mode test results in Highway............................21
Figure 11 UE Power ramping process.....................................24
Figure 12 RRC Setup KPI................................................26
Figure 13 RRC setup repeat PI..........................................26
Figure 14: Cell re-selection time......................................26
Figure 15 # RRC Connection Request Messages per call setup.............27
Figure 16 CSSR and Call setup delay....................................27
Figure 17 CPICH RSCP vs. last preample power...........................28
Figure 18: PrxTarget Parameter Tuning..................................28
Figure 19 Performance with different N312..............................29
Figure 20 Maximum and minimum DL power per connection..................30
Figure 21 Example of RAB setup results with different parameter sets...32
Figure 22: represents drop call rate (DCR). There is noticeableimprovement in DCR during trial week...................................32
Figure 23 : Absolute DL transmitted power per RL slightly increasedduring the trial.......................................................33
Figure 24 : Call drop rate improved by T313 & N313.....................33
Figure 25 The mapping of signalling delay offset with diffent procedures& SRB bitrates.........................................................35
9/102 GS MS NPO Network Planning & Optimization Capability
RAN Parameter Testing Guide10/11/2022
Copyright 2007 Nokia Siemens Networks.All rights reserved.
Figure 26 Result for CCSR vs. CPICH EcNo...............................36
Figure 27 Impact of ATO for AMR Call setup time........................37
Figure 28 Signalling flow for AMR call setup...........................37
Figure 29 Impact of ATO for UDI call setup failure & time..............37
Figure 30 AMR & PS call setup time in different with different SRB(ATO=700ms)............................................................38
Figure 31 Impact of SRB for RRC connection success rate................38
Figure 32: TOAWS Parameter Tuning......................................39
Figure 33 : Authentication Time per MOC/MTC calls......................40
Figure 34 SHO overhead (OH) example (%)................................41
Figure 35 Different UL and DL covereage scenario.......................44
Figure 36 Two mechanisms to improve SHO success: impact to all ADJ oronly for certain ADJ...................................................44
Figure 37 Minimum Set of SHO parameters to be tested...................45
Figure 38 Performance with different CPICH EcNo filter coefficientparameters.............................................................46
Figure 39 Performance with Different SHO addition time and drop time...46
Figure 40 Performance with different SHO replacement window and dropwindow.................................................................47
Figure 41: Performance with different Add window and Drop Window.......47
Figure 42: SHO Success rate for RT & NRT with single parameter set.....48
Figure 43: Example Recommended RT & NRT SHO different parameter set...48
Figure 44 RRC states & parameters......................................49
Figure 45: Downlink/Uplink Inactivity timer parameter value set........51
Figure 46: Downlink/Uplink Inactivity timer tuning.....................52
10/102 GS MS NPO Network Planning & Optimization Capability
RAN Parameter Testing Guide10/11/2022
Copyright 2007 Nokia Siemens Networks.All rights reserved.
Figure 47 The results for small data with different DL traffic volumeparameters.............................................................53
Figure 48 Average download time results for all kind of pages..........53
Figure 49: MMS and FTB results for bigger data........................54
Figure 50 OSS statistics for RAB holding time & sum of bitrate usage...55
Figure 51 Example between Bitrate and CPICH EcNo.......................59
Figure 52 Example between PtxDCH, RSCP, Ec/No, Bit Rate and Throughput.60
Figure 53 Example between PtxDCH and EcNo.............................61
Figure 54 3G -> 2G Handover Process & parameters.......................62
Figure 55 Example results for EcNo filtering and time hysteresisparameters.............................................................65
Figure 56 Example results for RSCP filtering and time hysteresisparameters.............................................................66
Figure 57 Example results for UE Tx Pwr filtering and time hysteresisparameters.............................................................66
Figure 58: OSS KPI ISHO measurement failure rate.......................67
Figure 59: T309 Parameter Tuning.......................................67
Figure 60: GSM to 3G handover process (Before BSS S13).................68
Figure 61: GSM to 3G Handover (BSS S13)................................69
Figure 62: FDD_Reporting_Threshold 2...................................69
Figure 63: Scenario 2G to 3G HO not triggered in good 3G coverage (badGSM coverage)..........................................................70
Figure 64: Benefits of coverage based ISHO for Voice...................70
Figure 65 3G to GSM cell reselection process...........................72
Figure 66: Call setup success Vs Ecno distribution....................73
Figure 67: Call Setup Success Vs RSCP distribution.....................74
11/102 GS MS NPO Network Planning & Optimization Capability
RAN Parameter Testing Guide10/11/2022
Copyright 2007 Nokia Siemens Networks.All rights reserved.
Figure 68: 3G coverage border EcNo Vs RSCP.............................74
Figure 69 Example of 3G to GSM cell reselection parameters.............75
Figure 70 GSM to 3G cell reselection process based on 3GPP Release5....76
Figure 71 The meaning of different values for qsearch I (P)...........77
Figure 72 Mapping of Fdd_Qoffset.......................................77
Figure 73: The relation between Fdd_Qmin to the Qqualmin + Ssearch_RAT.78
Figure 74: Hysterisis between 2G & 3G from 2dB -> 6dB..................79
Figure 75: WCDMA Neighbor Cell Reporting Enhancement...................80
Figure 76: Hyteresis between 3G & 2G cell reselection with RSCP threshold.......................................................................80
Figure 77 Reselection scenarios from GSM to 3G in outdoor..............81
Figure 78 Reselection scenarios from GSM to 3G in indoor...............81
Figure 79 Example of GSM to 3G cell reselection parameters.............82
12/102 GS MS NPO Network Planning & Optimization Capability
RAN Parameter Testing Guide10/11/2022
Copyright 2007 Nokia Siemens Networks.All rights reserved.
1. Purpose and Scope The aim of this document is to describe all relevant 3G radio parameters,how to test those with tools & give general testing procedures for thosewith different sets. Mainly RRC and R99/R4 idle & connected modeparameters are covered, but not HSDPA parameters. The parameters arecovered until RAS06 and RU10 release, but also some BSS13 parametersrelated to interworking. The test procedures are based both on drivetests and OSS counters.
Most radio parameters fall in two categories:
1. Most parameters have a unique optimal value, set either as NokiaRAN default or documented in the doc RNW_Recommended parameters_forWCDMA RAN releases.
2. Another set of parameter is dependent on operator planning choices,radio environment, clutter types, Ue capabilities or traffic mixes.
The parameter tests in the document are related to the following callphases:
RRC Setup & Access Performance
RAB Setup & Access Performance
Call Setup Time Performance
RAB Completion Performance
SHO Performance
PS Throughput Performance
3G to 2G Inter-RAT cell reselection and Intersystem Handover
2G to 3G Inter-RAT cell reselection and Intersystem Handover
At the end of the document there is a list of main parameters to betested.
13/102 GS MS NPO Network Planning & Optimization Capability
RAN Parameter Testing Guide10/11/2022
Copyright 2007 Nokia Siemens Networks.All rights reserved.
2. Tools & Procedures 2.1 ToolsParameter testing and performance evaluation basically involving:
NetAct Application Tools like Radio Access Configuration (RAC) for mass parameter modification in RNC areas or cluster areas
RNC Nemu Object Browser (OBR) to modify single or few parameters. e.g.RNC object parameter
NetAct Reporting Suite to monitor OSS KPI performance before and afterparameter change
Drive Test tool to check end users performance
Any drive test tool can be used, however recommended tools is Anite NemoOutdoor. See more information about the tool from [10].
In many cases, it is necessary to have both ride test and OSS performancecheck to be done together. The reason is some UEs might performdifferently with certain parameter. Therefore, ride test with just fewUEs might not be a good justification over the UE population in the wholenetwork. Due to this, OSS KPI performance check is necessary.
2.2 Test Procedures2.2.1 Parameter setsFor each network performance KPI, there could be few parameters thatcould affect the same KPI performance. In some situation, it is necessaryonly to modify a single parameter in a parameter set to see which one hasthe bigger impacts in terms of the performance, e.g. N312/T312.
However, there is some scenario that parameter test sets must correlatewith two or more parameters. For example, when tuning SHO performance, itis usually to change add window in correspondence with drop window asbelow:
ParameterDefaultSet Set 1 Set 2 Set 3
Add Window (dB) 4 1.5 3 6Drop Window (dB) 6 3 5 8Table 1: Parameter test set example
In all test cases, current default network parameter setting must beincluded in the test for comparison purposes.
14/102 GS MS NPO Network Planning & Optimization Capability
RAN Parameter Testing Guide10/11/2022
Copyright 2007 Nokia Siemens Networks.All rights reserved.
2.2.2 Drive TestEnough call samples have to be made to make the measurement statisticallyvalid:
In a 50 call sample one dropped call will cause a change in performance of -2%
In a 500 call sample one dropped call will cause a change in performance of -0.2%.
Call length should be defined at the beginning. It can be set differentcall testing patterns for different optimization techniques as Shortcalls (for Call setup performance and delay) and Long calls (for Dropcall performance and SHO performance), but to save post processing timeand resources it is recommended to use only one call type as suggestedfurther.
2.2.2.1 Call patterns
It is recommended to perform measurement with the following test patterns:
Voice and Video Mobile Originated (MOC) and Mobile Terminated (MTC)calls:
5 seconds idle. 60 seconds call timeWhen testing ISHO, UE should be in Dual mode (2G/3G) to see possible
handover areas. PS Call:
GPRS Attach.
PDP Context Activation.
FTP Download (example 4MB file)/FTP Upload (example 2 MB file).
PDP Context Deactivation.
GPRS Detach.
5 sec idle time.
UE should be in Dual mode (2G/3G) to see possible handover areas.
15/102 GS MS NPO Network Planning & Optimization Capability
RAN Parameter Testing Guide10/11/2022
Copyright 2007 Nokia Siemens Networks.All rights reserved.
3. Call setup performance3.1 Idle Mode PerformanceInitial cell selection to a good cell and subsequent cell reselections tobetter cells is essential to increase the call setup success rate (CSSR)and speed up the call setup time. This should be tested in differentenvironment.
Poor cell reselection can lead to poor call setup time distribution (asUE needs to send several RRC Connection Requests).
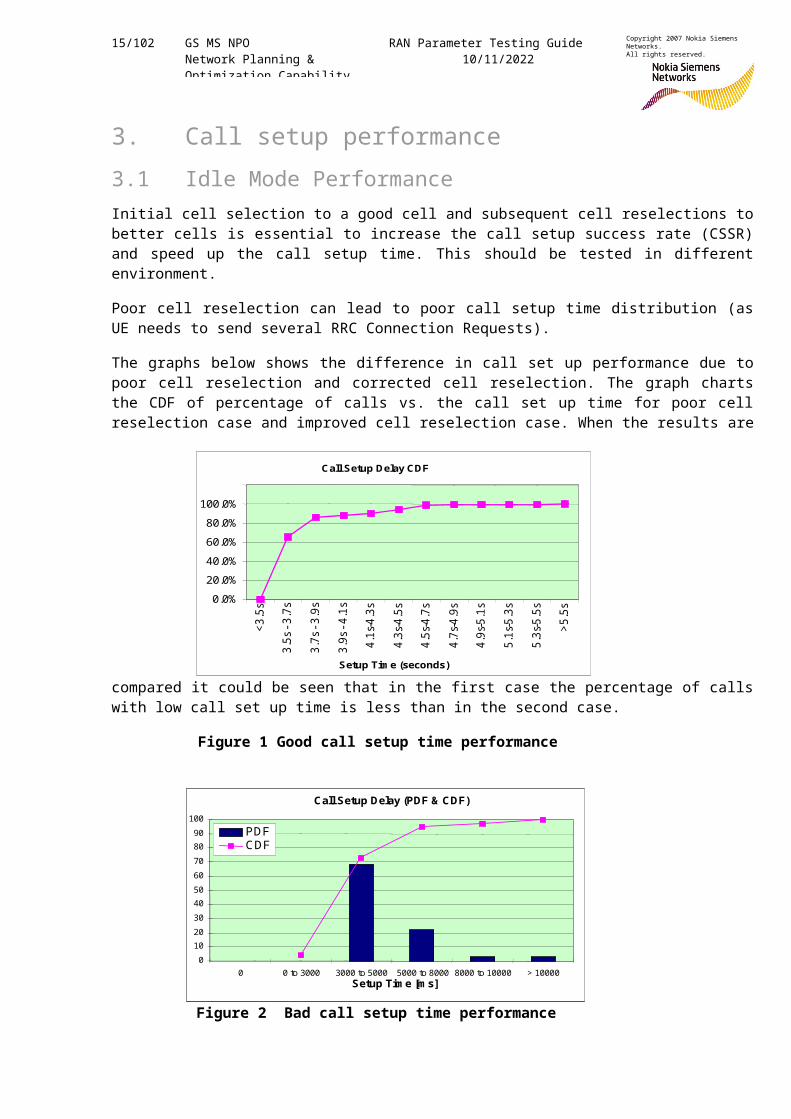
The graphs below shows the difference in call set up performance due topoor cell reselection and corrected cell reselection. The graph chartsthe CDF of percentage of calls vs. the call set up time for poor cellreselection case and improved cell reselection case. When the results are
compared it could be seen that in the first case the percentage of callswith low call set up time is less than in the second case.
Figure 1 Good call setup time performance
Figure 2 Bad call setup time performance
Call Setup Delay (PDF & CDF)
0102030405060708090100
0 0 to 3000 3000 to 5000 5000 to 8000 8000 to 10000 > 10000Setup Tim e [m s]
PDFCDF
Call Setup Delay (PDF & CDF)
0102030405060708090100
0 0 to 3000 3000 to 5000 5000 to 8000 8000 to 10000 > 10000Setup Tim e [m s]
PDFCDF
0.0%20.0%40.0%60.0%80.0%100.0%
<3.5s
3.5s -3
.7s
3.7s -3
.9s
3.9s -4
.1s
4.1s-4.3s
4.3s-4.5s
4.5s-4.7s
4.7s-4.9s
4.9s-5.1s
5.1s-5.3s
5.3s-5.5s
>5.5s
Setup Tim e (seconds)
Call Setup Delay CDF
0.0%20.0%40.0%60.0%80.0%100.0%
<3.5s
3.5s -3
.7s
3.7s -3
.9s
3.9s -4
.1s
4.1s-4.3s
4.3s-4.5s
4.5s-4.7s
4.7s-4.9s
4.9s-5.1s
5.1s-5.3s
5.3s-5.5s
>5.5s
Setup Tim e (seconds)
Call Setup Delay CDF
16/102 GS MS NPO Network Planning & Optimization Capability
RAN Parameter Testing Guide10/11/2022
Copyright 2007 Nokia Siemens Networks.All rights reserved.
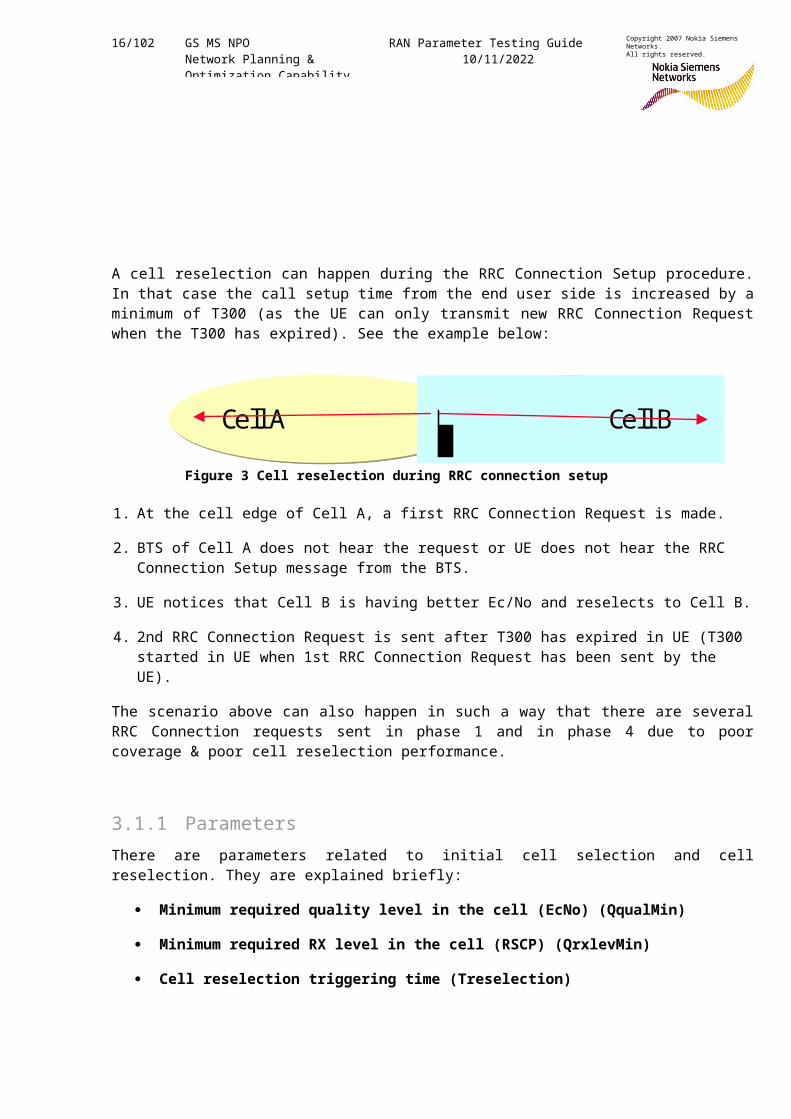
A cell reselection can happen during the RRC Connection Setup procedure.In that case the call setup time from the end user side is increased by aminimum of T300 (as the UE can only transmit new RRC Connection Requestwhen the T300 has expired). See the example below:
Figure 3 Cell reselection during RRC connection setup
1. At the cell edge of Cell A, a first RRC Connection Request is made.
2. BTS of Cell A does not hear the request or UE does not hear the RRC Connection Setup message from the BTS.
3. UE notices that Cell B is having better Ec/No and reselects to Cell B.
4. 2nd RRC Connection Request is sent after T300 has expired in UE (T300 started in UE when 1st RRC Connection Request has been sent by the UE).
The scenario above can also happen in such a way that there are severalRRC Connection requests sent in phase 1 and in phase 4 due to poorcoverage & poor cell reselection performance.
3.1.1 Parameters There are parameters related to initial cell selection and cellreselection. They are explained briefly:
Minimum required quality level in the cell (EcNo) (QqualMin)
Minimum required RX level in the cell (RSCP) (QrxlevMin)
Cell reselection triggering time (Treselection)
Cell A Cell BCell A Cell B
17/102 GS MS NPO Network Planning & Optimization Capability
RAN Parameter Testing Guide10/11/2022
Copyright 2007 Nokia Siemens Networks.All rights reserved.
With Treselection parameter of 0 s the cell reselection could takeplace immediately when the UE notices that there is differencebetween the cells’ Ec/No values.
Cell reselection hysteresis 2 (Qhyst2)
This will add some hysteresis to the neighboring cell evaluation (target for the cell reselection).
Note that Qhyst1 is used only in case the cell selection and re-selection quality measure is set to CPICH RSCP (default is CPICHEc/No so Qhyst 1 is not used in intra-FDD reselection).
Cell Re-selection Quality Offset 2 (AdjsQoffset2)
This parameter is used in the cell re-selection and ranking betweenWCDMA cells. The value of this parameter is subtracted from themeasured CPICH Ec/No of the neighbor cell before the UE comparesthe quality measure with the cell re-selection/ ranking criteria.
S intrasearch (Sintrasearch)
This parameter is used by the UE to calculate the threshold (CPICHEc/No) to start intra frequency (SHO) measurements (Sintrasearch aboveQqualMin value)
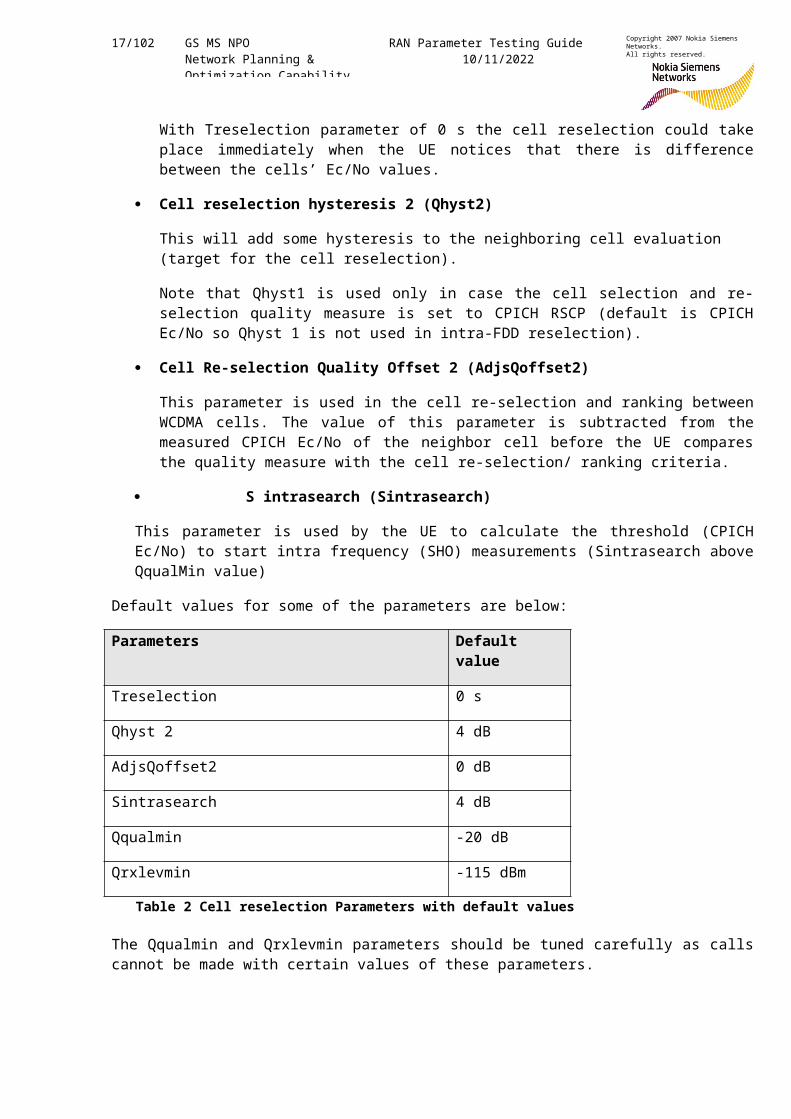
Default values for some of the parameters are below:
Parameters Default value
Treselection 0 s
Qhyst 2 4 dB
AdjsQoffset2 0 dB
Sintrasearch 4 dB
Qqualmin -20 dB
Qrxlevmin -115 dBm
Table 2 Cell reselection Parameters with default values
The Qqualmin and Qrxlevmin parameters should be tuned carefully as callscannot be made with certain values of these parameters.
18/102 GS MS NPO Network Planning & Optimization Capability
RAN Parameter Testing Guide10/11/2022
Copyright 2007 Nokia Siemens Networks.All rights reserved.
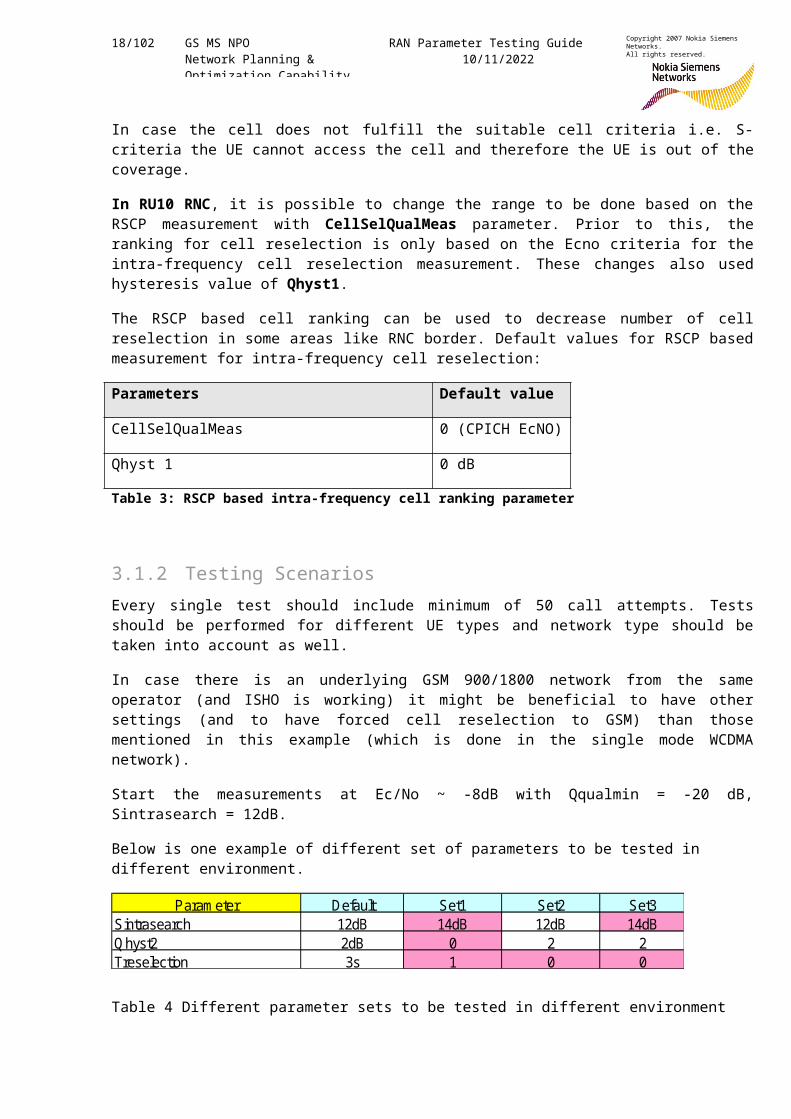
In case the cell does not fulfill the suitable cell criteria i.e. S-criteria the UE cannot access the cell and therefore the UE is out of thecoverage.
In RU10 RNC, it is possible to change the range to be done based on theRSCP measurement with CellSelQualMeas parameter. Prior to this, theranking for cell reselection is only based on the Ecno criteria for theintra-frequency cell reselection measurement. These changes also usedhysteresis value of Qhyst1.
The RSCP based cell ranking can be used to decrease number of cellreselection in some areas like RNC border. Default values for RSCP basedmeasurement for intra-frequency cell reselection:
Parameters Default value
CellSelQualMeas 0 (CPICH EcNO)
Qhyst 1 0 dB
Table 3: RSCP based intra-frequency cell ranking parameter
3.1.2 Testing ScenariosEvery single test should include minimum of 50 call attempts. Testsshould be performed for different UE types and network type should betaken into account as well.
In case there is an underlying GSM 900/1800 network from the sameoperator (and ISHO is working) it might be beneficial to have othersettings (and to have forced cell reselection to GSM) than thosementioned in this example (which is done in the single mode WCDMAnetwork).
Start the measurements at Ec/No ~ -8dB with Qqualmin = -20 dB,Sintrasearch = 12dB.
Below is one example of different set of parameters to be tested in different environment.
Table 4 Different parameter sets to be tested in different environment
Param eter Default Set1 Set2 Set3Sintrasearch 12dB 14dB 12dB 14dBQ hyst2 2dB 0 2 2Treselection 3s 1 0 0
19/102 GS MS NPO Network Planning & Optimization Capability
RAN Parameter Testing Guide10/11/2022
Copyright 2007 Nokia Siemens Networks.All rights reserved.
These sets should be tested in different environment like: Urban, rural,high-speed train, highway area and possibly with and without the borderof two RNCs (including registration due to Location update).
Slow moving conditions (walking speed)
Average speed conditions (<50km/h)
Fast speed conditions (~100km/h)
High speed trains if exist (~200km/h)
Inter RNC and Intra RNC cases where applicable
In areas where frequent cell reselection occurring can affect the call setup success and call setup time performance. In addition, frequent cell reselections need more network capacity in terms of Iub bandwidth and nodeB CEs due to registration activities in RNC borders.
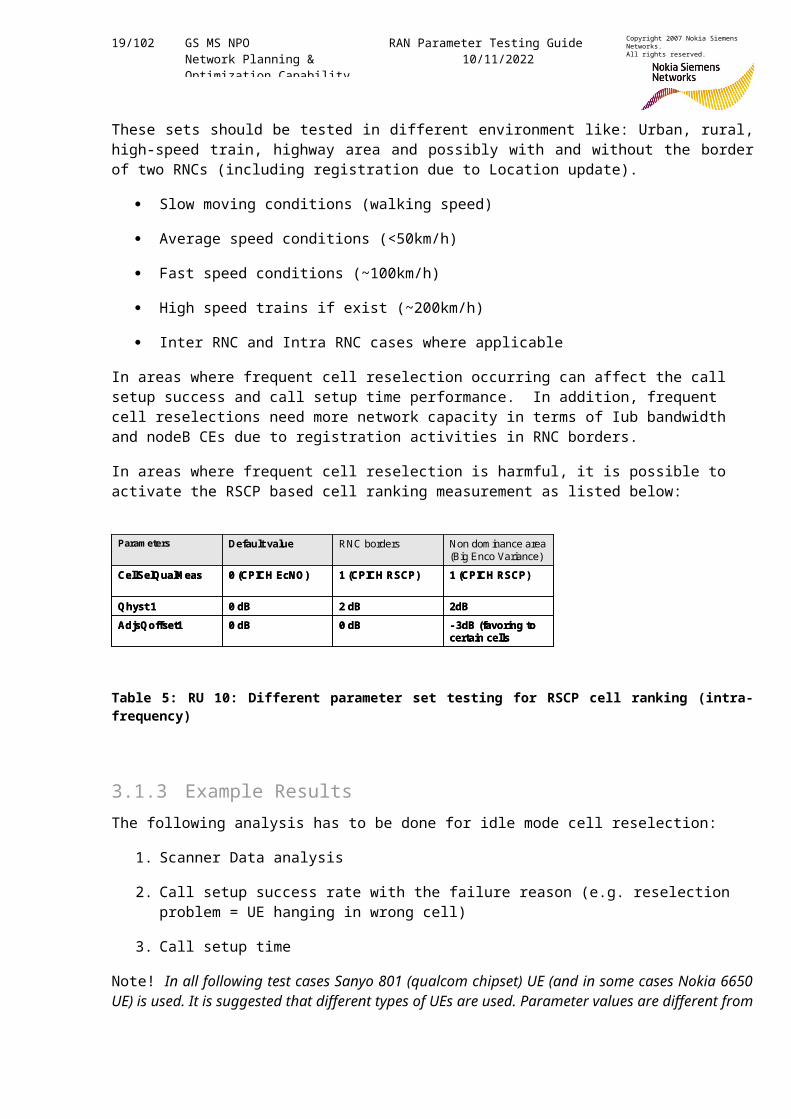
In areas where frequent cell reselection is harmful, it is possible to activate the RSCP based cell ranking measurement as listed below:
Table 5: RU 10: Different parameter set testing for RSCP cell ranking (intra-frequency)
3.1.3 Example ResultsThe following analysis has to be done for idle mode cell reselection:
1. Scanner Data analysis
2. Call setup success rate with the failure reason (e.g. reselection problem = UE hanging in wrong cell)
3. Call setup time
Note! In all following test cases Sanyo 801 (qualcom chipset) UE (and in some cases Nokia 6650UE) is used. It is suggested that different types of UEs are used. Parameter values are different from
2dB2 dB0 dBQhyst1AdjsQoffset1
CellSelQualM eas
Param eters
0 dB
0 (CPICH EcNO)
Default value
0 dB
1 (CPICH RSCP)
RNC borders
-3dB (favoring to certain cells
1 (CPICH RSCP)
Non dom inance area (Big Enco Variance)
2dB2 dB0 dBQhyst1AdjsQoffset1
CellSelQualM eas
Param eters
0 dB
0 (CPICH EcNO)
Default value
0 dB
1 (CPICH RSCP)
RNC borders
-3dB (favoring to certain cells
1 (CPICH RSCP)
Non dom inance area (Big Enco Variance)

20/102 GS MS NPO Network Planning & Optimization Capability
RAN Parameter Testing Guide10/11/2022
Copyright 2007 Nokia Siemens Networks.All rights reserved.
network to network due to NW plan and therefore all these parameters should be tuned in everynetwork!
3.1.3.1 Scanner data analysisChart from scanner data below shows best server’s Ec/No value vs. percentage of samples where second best server is x dB lower than best
server.
Figure 4 Scanner measurements for best server and second best server
With common channel setting in this network: Base Ec/No (own cell) isaround -4 dB so there is only 1 cell at Ec/No > -4 dB.
From the scanner data chart it is found that in the case where the cellreselection happens at about Ec/No –8dB, there is 95% possibility thatsecond best server will have EcNo value more than 2dB lower than the bestserver. In other words, at EcNo –8 dB the neighboring cell having EcNoless than 2 dB from the serving cell is only 5 % and 95 % will havedifference of EcNo from the serving cell more than 2 dB. This means thatthe cell reselection has 95% probability not to lead to ping-pong.
If the reselection is done at about –16dB there is only 30% possibilitythat the second best server is more than 2dB lower than best server (thisdoes not leave enough room for deviation between best and second bestserver).
At Ecno= -8dB, 95% of 2nd best server < best server with at
21/102 GS MS NPO Network Planning & Optimization Capability
RAN Parameter Testing Guide10/11/2022
Copyright 2007 Nokia Siemens Networks.All rights reserved.
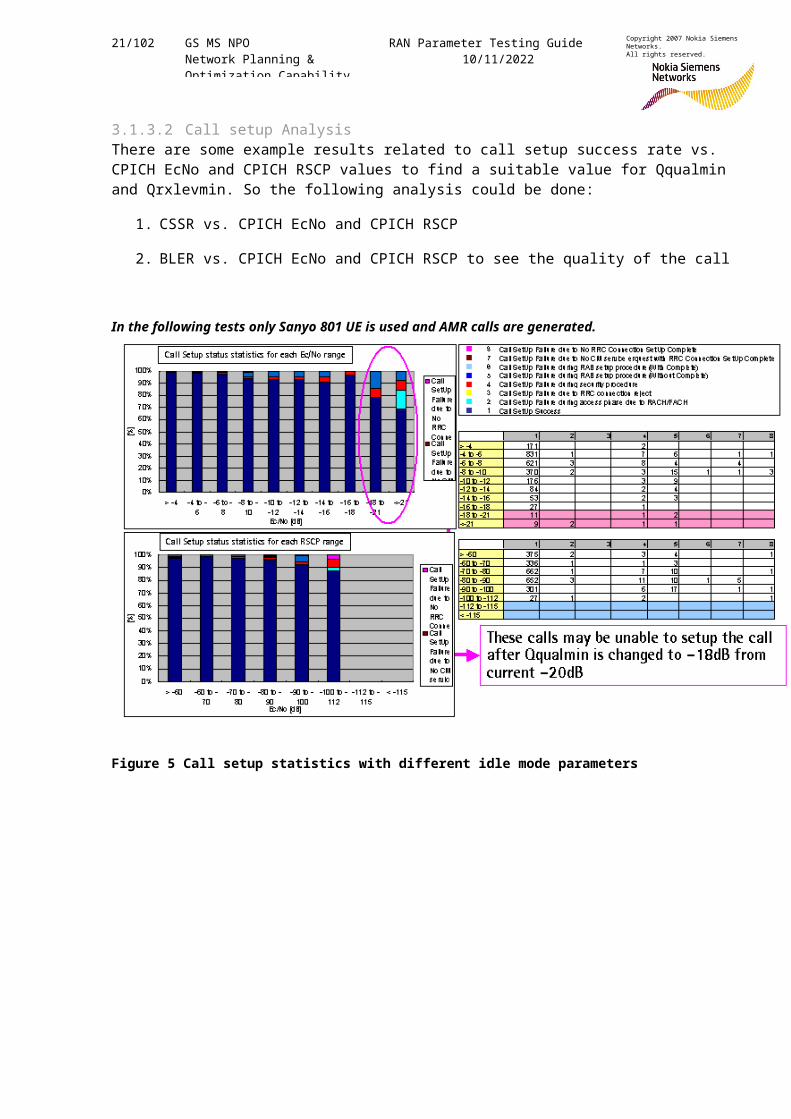
3.1.3.2 Call setup AnalysisThere are some example results related to call setup success rate vs. CPICH EcNo and CPICH RSCP values to find a suitable value for Qqualmin and Qrxlevmin. So the following analysis could be done:
1. CSSR vs. CPICH EcNo and CPICH RSCP
2. BLER vs. CPICH EcNo and CPICH RSCP to see the quality of the call
In the following tests only Sanyo 801 UE is used and AMR calls are generated.
Figure 5 Call setup statistics with different idle mode parameters
22/102 GS MS NPO Network Planning & Optimization Capability
RAN Parameter Testing Guide10/11/2022
Copyright 2007 Nokia Siemens Networks.All rights reserved.
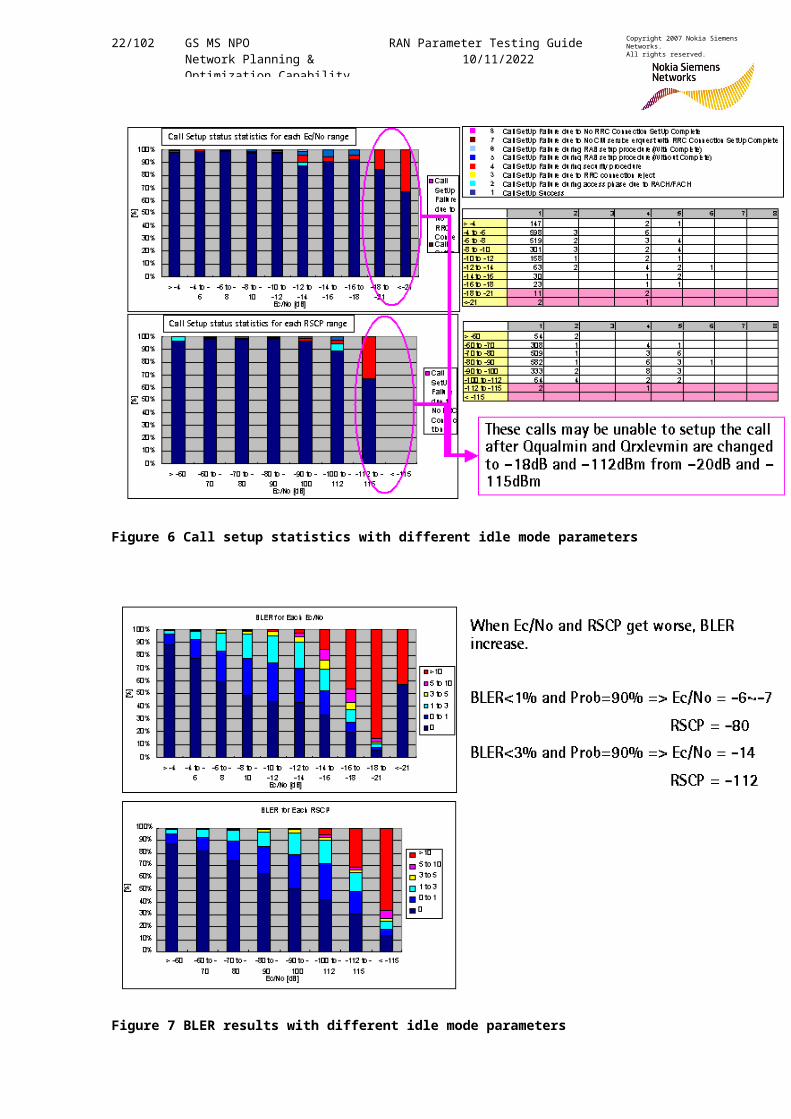
Figure 6 Call setup statistics with different idle mode parameters
Figure 7 BLER results with different idle mode parameters
23/102 GS MS NPO Network Planning & Optimization Capability
RAN Parameter Testing Guide10/11/2022
Copyright 2007 Nokia Siemens Networks.All rights reserved.
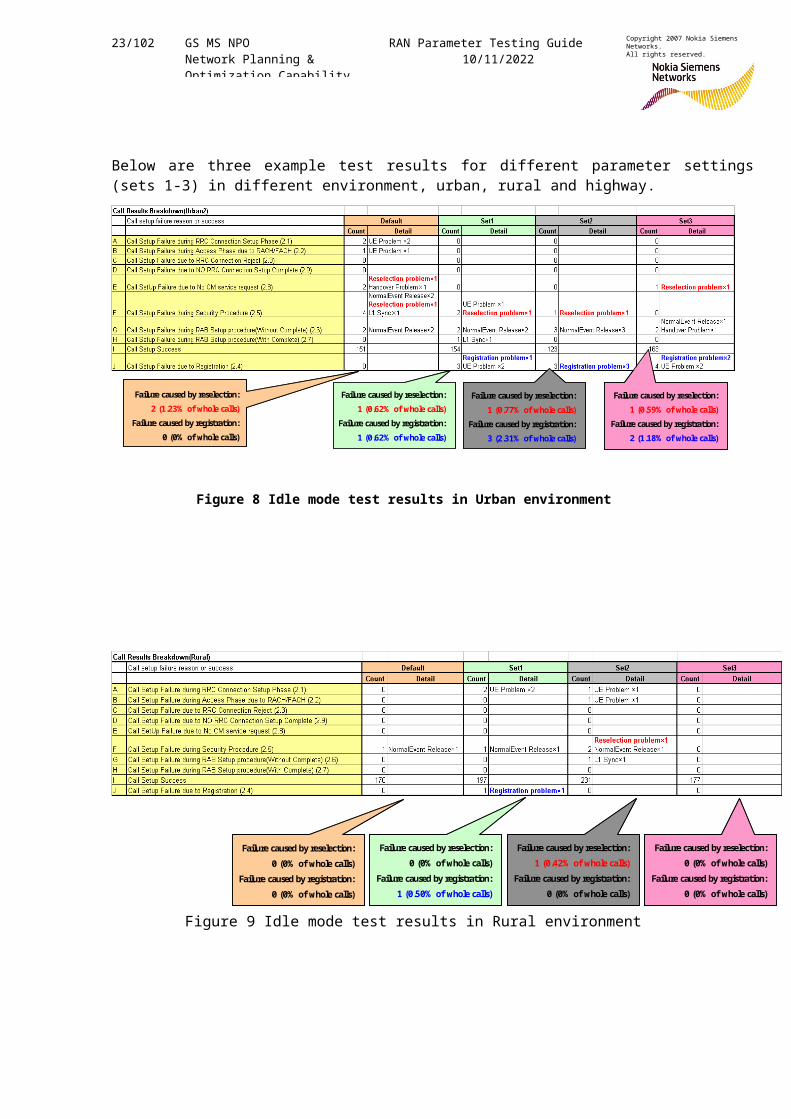
Below are three example test results for different parameter settings(sets 1-3) in different environment, urban, rural and highway.
Figure 8 Idle mode test results in Urban environment
Figure 9 Idle mode test results in Rural environment
Failure caused by reselection:2 (1.23% of whole calls)
Failure caused by registration:0 (0% of whole calls)
Failure caused by reselection:1 (0.62% of whole calls)
Failure caused by registration:1 (0.62% of whole calls)
Failure caused by reselection:1 (0.77% of whole calls)
Failure caused by registration:3 (2.31% of whole calls)
Failure caused by reselection:1 (0.59% of whole calls)
Failure caused by registration:2 (1.18% of whole calls)
Failure caused by reselection:0 (0% of whole calls)
Failure caused by registration:0 (0% of whole calls)
Failure caused by reselection:0 (0% of whole calls)
Failure caused by registration:1 (0.50% of whole calls)
Failure caused by reselection:1 (0.42% of whole calls)
Failure caused by registration:0 (0% of whole calls)
Failure caused by reselection:0 (0% of whole calls)
Failure caused by registration:0 (0% of whole calls)
Failure caused by reselection:0 (0% of whole calls)
Failure caused by registration:0 (0% of whole calls)
Failure caused by reselection:0 (0% of whole calls)
Failure caused by registration:1 (0.50% of whole calls)
Failure caused by reselection:1 (0.42% of whole calls)
Failure caused by registration:0 (0% of whole calls)
Failure caused by reselection:0 (0% of whole calls)
Failure caused by registration:0 (0% of whole calls)
24/102 GS MS NPO Network Planning & Optimization Capability
RAN Parameter Testing Guide10/11/2022
Copyright 2007 Nokia Siemens Networks.All rights reserved.
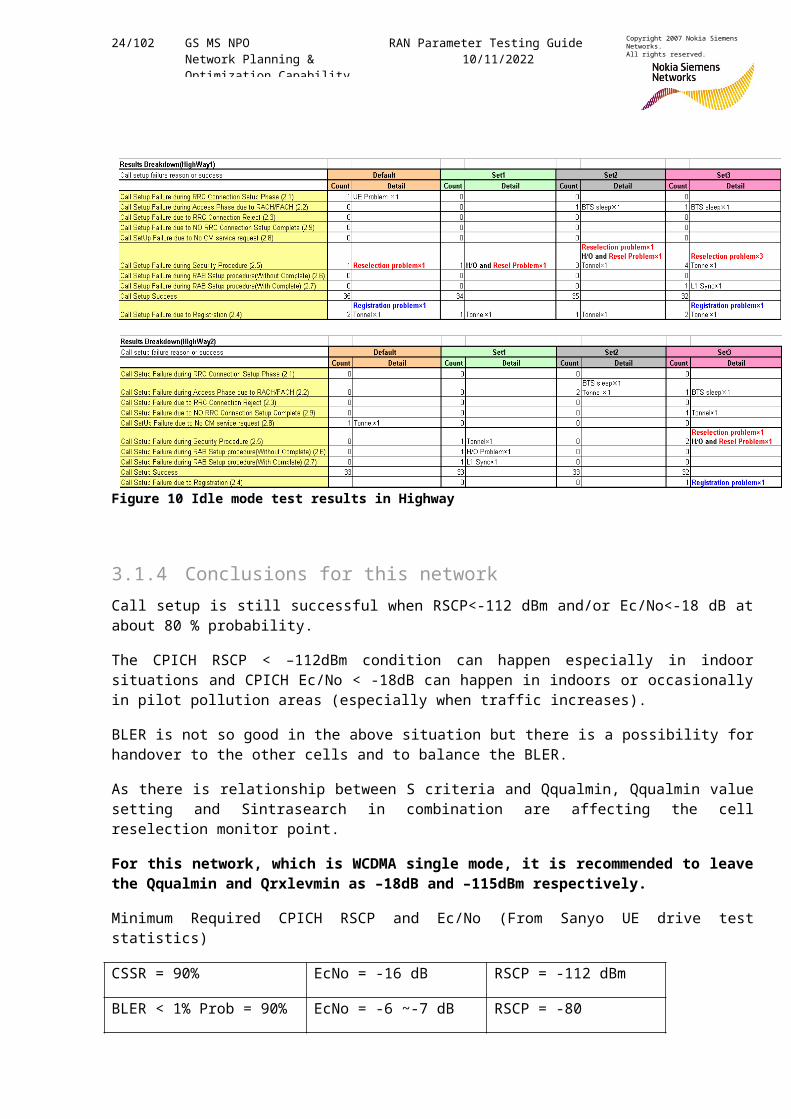
Figure 10 Idle mode test results in Highway
3.1.4 Conclusions for this networkCall setup is still successful when RSCP<-112 dBm and/or Ec/No<-18 dB atabout 80 % probability.
The CPICH RSCP < –112dBm condition can happen especially in indoorsituations and CPICH Ec/No < -18dB can happen in indoors or occasionallyin pilot pollution areas (especially when traffic increases).
BLER is not so good in the above situation but there is a possibility forhandover to the other cells and to balance the BLER.
As there is relationship between S criteria and Qqualmin, Qqualmin valuesetting and Sintrasearch in combination are affecting the cellreselection monitor point.
For this network, which is WCDMA single mode, it is recommended to leavethe Qqualmin and Qrxlevmin as –18dB and –115dBm respectively.
Minimum Required CPICH RSCP and Ec/No (From Sanyo UE drive teststatistics)
CSSR = 90% EcNo = -16 dB RSCP = -112 dBm
BLER < 1% Prob = 90% EcNo = -6 ~-7 dB RSCP = -80
Kyoto to IbarakiKyoto to Ibaraki
25/102 GS MS NPO Network Planning & Optimization Capability
RAN Parameter Testing Guide10/11/2022
Copyright 2007 Nokia Siemens Networks.All rights reserved.
BLER <3% Prob= 90% EcNo = -14 dB RSCP = -112 dBm
Table 6 Needed EcNo and RSCP for good CSSR and BLERs
For Urban area (Urban 1 and 2) where the UE is slow moving with speedless than 50km/h, the cell reselection should be slower in case of interRNC reselection -> for LA/RA borders it is recommended to have slowerreselection (in this test case Qhyst2 = 2dB, Treselection = 3s). Forintra RNC reselection case all the tested parameter sets work more orless the same but set 1 is recommended.
For Rural area where the UE speed is somewhere between 50km/h and 100km/hthe call setup performance is more or less the same for all the cases butin terms of CPICH distribution and number of cell reselections point ofview the set 1 is recommended (set 1 clearly reduces the ping pong inpoor dominance environments)
For high speed train from call setup performance point of view the set 1performs clearly the best. Also from number of cell reselections andCPICH Ec/No distribution point of view set 1 is recommended.
For high way case the set 1 performs the best from call setup successrate point of view and from number of reselections and CPICH Ec/Nodistribution point of view the set 1 is recommended.
Set 1 is recommended for all types of area except at LAC boundary, slowercell reselection (default) should be used.
3.2 RRC Connection Establishment PerformanceIn RRC Connection Establishment Success rate, the emphasis should be on:
RRC Setup performance and RRC Connection Access Success. In both cases the testing is concentrated on RRC Setup success rate, and the number of RRC Connection Requests sent.
The impact of minimal UE tx power (preamble power) to the cell capacity.
Different UE performance (in the following test examples Nokia 6650and Sanyo 801 UEs are used).
Call setup delay
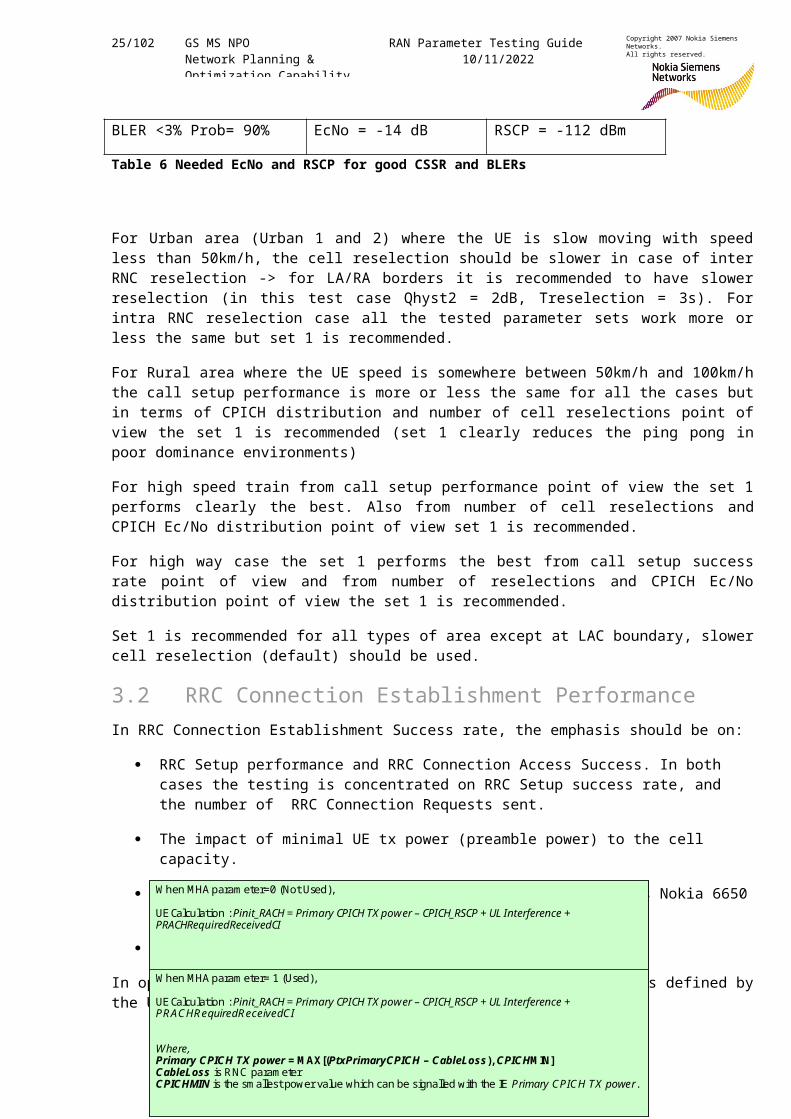
In open loop power control the Initial PRACH preamble power is defined bythe UE according to the formula below in RAS06:
W hen MHA param eter=0 (Not Used),
UECalculation : Pinit_RACH = Primary CPICH TX power – CPICH_RSCP + UL Interference + PRACHRequiredReceivedCI
W hen MHA param eter= 1 (Used),
UECalculation : Pinit_RACH = Primary CPICH TX power – CPICH_RSCP + UL Interference + PR AC HR equiredR eceivedCI
Where,Primary CPICH TX power = M AX[(PtxPrimaryCPICH – CableLoss), CPICHM IN]CableLoss is RNC param eterCPICHMIN is the sm allest power value which can be signalled with the IE Primary CPIC H TX power.
26/102 GS MS NPO Network Planning & Optimization Capability
RAN Parameter Testing Guide10/11/2022
Copyright 2007 Nokia Siemens Networks.All rights reserved.
Equation 1 : Open loop power control, initial preample power
In case the BTS doesn’t hear the preamble the UE resends the preamblewith PowerRampStepPRACHpreamble higher power. In one PRACH cycle thepower can be incremented PRACH_preamble_retrans times.
If the PRACH cycle fails it will be repeated up-to RACH_tx_Max times.Potential CPICH RSCP measurement inaccuracies in the UEs are causing thepre-ample cycle(s) to fail with certain probability, which is dependanton the radio conditions and the parameter settings in the network.
It has been assumed that the measurement inaccuracies are more severeright after the UE wakes up from sleep in idle mode.
In case PRACH procedure was initiated in order to set-up a RRCconnection, and it fails RRC connection set-up will be retried N300 timeswith an interval of T300.
With N300 (3) and T300 (3s) parameters one may define how many times theUE is allowed to try to establish an RRC connection and what’s theinterval between the attempts.
Too low values may cause RRC connection setup difficulties
Too high values may bias the RRC statistics to look too bad. N300 *T300 should be reasonable (for example <=6s). Note: meaningful onlyin cases where RNC has received the RRC connection setup requestmessage.
Core network paging parameters may be considered as well so thatit’s guaranteed that RRC connection setup attempt always endsbefore the last page is sent from CN (9 s).
27/102 GS MS NPO Network Planning & Optimization Capability
RAN Parameter Testing Guide10/11/2022
Copyright 2007 Nokia Siemens Networks.All rights reserved.
3.2.1 ParametersRRC Connection Setup performance can be improved by tuning mainly theopen loop power control (OLPC) parameters.
The parameters are listed below:
N300, RRC CONNECTION REQUEST retransmission counter (MS counter).
This parameter is part of System Information Block 1.
T300, RRC CONNECTION REQUEST retransmission timer (MS timer).
This parameter is part of System Information Block 1.
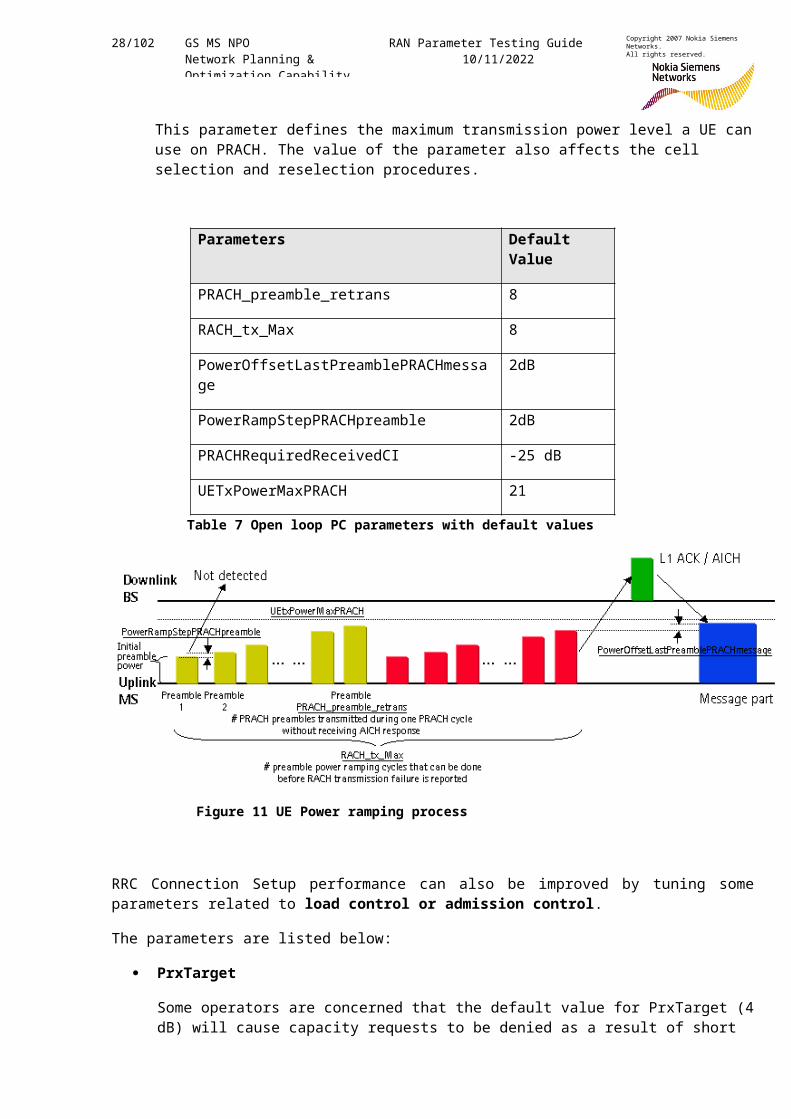
PRACH Preamble Retrans Max (PRACH_preamble_retrans)
The maximum number of preambles allowed in one preamble ramping cycle. PRACH Preamble Retrans Max is part of "PRACH power offset".
RACH maximum number of preamble cycles (RACH_tx_Max)
Maximum number of RACH preamble cycles defines how many times the PRACH pre-amble ramping procedure can be repeated before UE MAC reports a failure on RACH transmission to higher layers.
Power offset last preamble and PRACH message (PowerOffsetLastPreamblePRACHmessage )
The power offset between the last transmitted preamble and the control part of the PRACH message (added to the preamble power to receive the power of the message control part).
Power ramp step on PRACH preamble (PowerRampStepPRACHpreamble)
The power ramp step on PRACH preamble when no acquisition indicator (AI) is detected by the UE.
Required received C/I on PRACH (PRACHRequiredReceivedCI)
This UL required received C/I value is used by the UE to calculate the initial output power on PRACH according to the Open loop power control procedure. If this value is too low then the PRACH preamble ramping up takes too long time. If it is too high then it may cause blocking or high noise rise at BS since the UE measurement on RSCP has a poor accuracy.
Maximum UE transmission power on PRACH (UETxPowerMaxPRACH)
28/102 GS MS NPO Network Planning & Optimization Capability
RAN Parameter Testing Guide10/11/2022
Copyright 2007 Nokia Siemens Networks.All rights reserved.
This parameter defines the maximum transmission power level a UE canuse on PRACH. The value of the parameter also affects the cell selection and reselection procedures.
Parameters Default Value
PRACH_preamble_retrans 8
RACH_tx_Max 8
PowerOffsetLastPreamblePRACHmessage
2dB
PowerRampStepPRACHpreamble 2dB
PRACHRequiredReceivedCI -25 dB
UETxPowerMaxPRACH 21
Table 7 Open loop PC parameters with default values
Figure 11 UE Power ramping process
RRC Connection Setup performance can also be improved by tuning someparameters related to load control or admission control.
The parameters are listed below:
PrxTarget
Some operators are concerned that the default value for PrxTarget (4dB) will cause capacity requests to be denied as a result of short
29/102 GS MS NPO Network Planning & Optimization Capability
RAN Parameter Testing Guide10/11/2022
Copyright 2007 Nokia Siemens Networks.All rights reserved.
term increases in uplink interference. There is a tendancy to increase PrxTarget to 30 dB to effectively disable uplink air-interface admission control to admit more users and thus improve RRCsetup performance. Other operators have aligned PrxTarget with the interference margin assumed during their link budget analysis
PtxTarget
The default value for PtxTarget is viewed as being relatively low, i.e. 40 dBm represents only 50 % of the Node B transmit power capability (assuming a 20 W Node B). Increasing the value of PtxTarget increases the downlink air-interface capacity of the Node B. This helps to ensure that capacity requests are not denied while there is unused transmit power
WaitTimeRRCRegistration
A setting of 5s is commonly used, and this reduces the rate at whichUEs will re-send the RRC connection request in cases of network congestion, thus aiding the congestion recovery process. It is likely that RRC set-up success rate statistics are also improved dueto the reduced rate of failure.
The RRC Connection Access success is highly depending on the used UEs soall the used UEs should be tested carefully before making any changes.
The RRC Connection Access phase can be affected by tuning the timer T312and counter N312 (both in UE) as explained below:
If we configure longer the time (T312 high and high N312) for the UE toestablish the L1 synchronization, then there is higher probability forsuccessful physical channel establishment and call set up success rate isbetter. However, longer the time for L1 synchronisation results in longercall setup time.
T312
The timer for supervising successful establishment of a physical channel (MS timer used in idle and connected mode).
N312
This parameter defines the maximum number of "in sync" indications received from L1 during the establishment of a physical channel (UE counter used in idle and connected mode).
30/102 GS MS NPO Network Planning & Optimization Capability
RAN Parameter Testing Guide10/11/2022
Copyright 2007 Nokia Siemens Networks.All rights reserved.
The recommended value for T312 is 6s minimum with which the RRC Connection Access success is highest and the call setup delay is minimized.
N312 is recommended to be tested with the values of 4 and 2 at least to see the impact on call setup success rate and call set up time (also certain UEs can work better with N312 = 2).
All the above mentioned parameters can be tuned to improve the RRC Connection Setup performance. However, it should be noted that some of the UEs (especially the ones with qualcom chipset) have fixed values for some of those parameters. An example from Sanyo is given:
PRACH_preamble_retrans & RACH_tx_Max = 8 & 8
PowerOffsetLastPreamblePRACHmessage = not fixed
PowerRampStepPRACHpreamble = 3dB
PRACHRequiredReceivedCI = not fixed
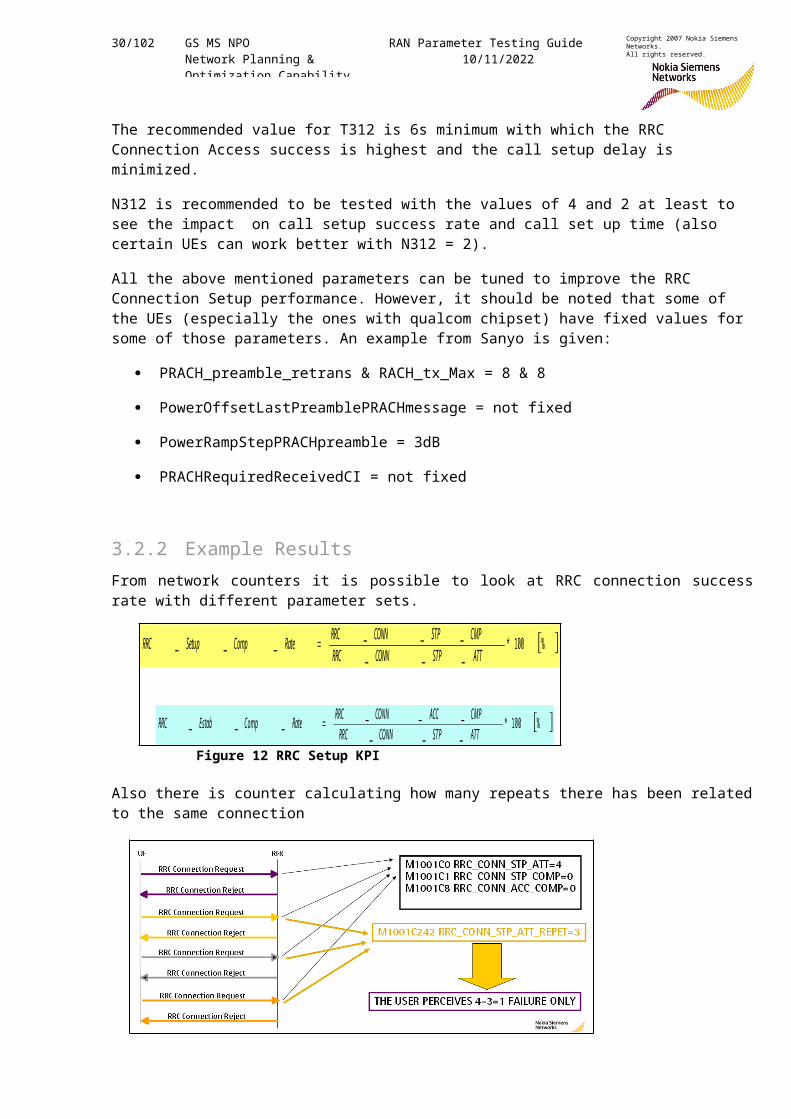
3.2.2 Example ResultsFrom network counters it is possible to look at RRC connection successrate with different parameter sets.
Figure 12 RRC Setup KPI
Also there is counter calculating how many repeats there has been relatedto the same connection
%100*_________
ATTSTPCONNRRCCMPSTPCONNRRCRateCompSetupRRC
%100*_________
ATTSTPCONNRRCCMPACCCONNRRCRateCompEstabRRC
31/102 GS MS NPO Network Planning & Optimization Capability
RAN Parameter Testing Guide10/11/2022
Copyright 2007 Nokia Siemens Networks.All rights reserved.
Figure 13 RRC setup repeat PI
Also it is possible to look at cell reselection time to estimate how frequent cell reselection is done.
Figure 14: Cell re-selection time
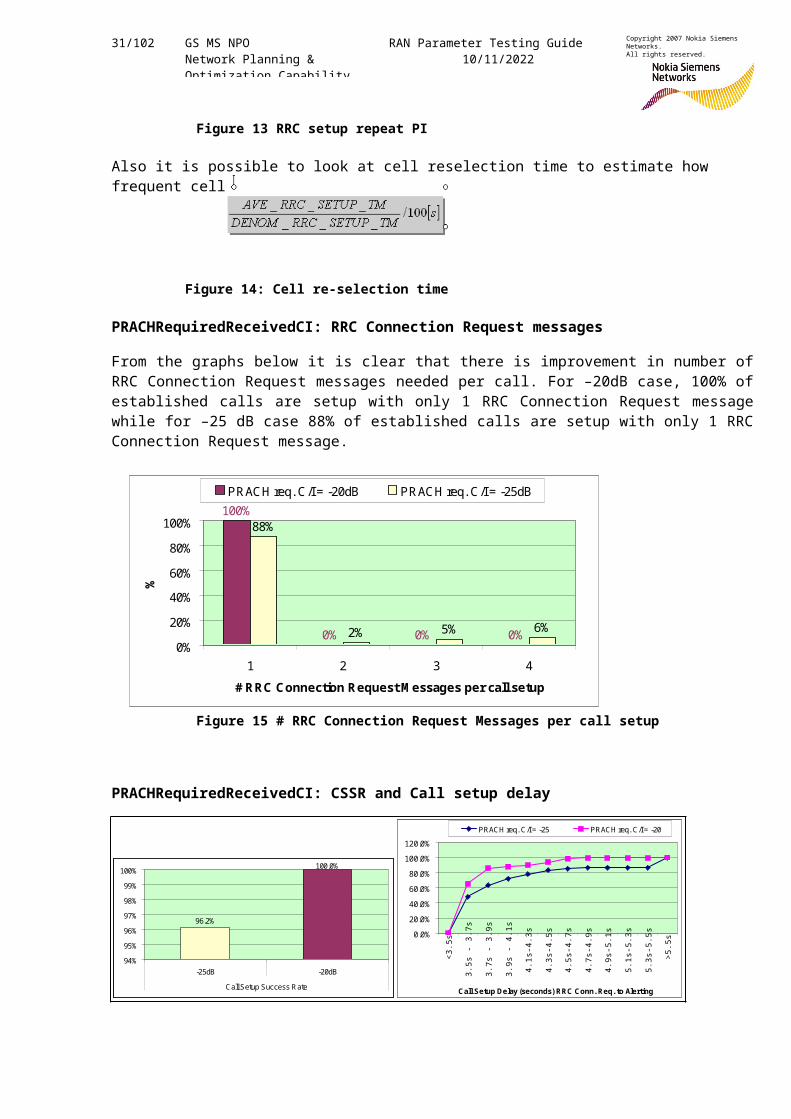
PRACHRequiredReceivedCI: RRC Connection Request messages
From the graphs below it is clear that there is improvement in number ofRRC Connection Request messages needed per call. For –20dB case, 100% ofestablished calls are setup with only 1 RRC Connection Request messagewhile for –25 dB case 88% of established calls are setup with only 1 RRCConnection Request message.
Figure 15 # RRC Connection Request Messages per call setup
PRACHRequiredReceivedCI: CSSR and Call setup delay
100%
0% 0% 0%
88%
2% 5% 6%0%20%40%60%80%100%
1 2 3 4# RRC Connection Request M essages per call setup
%
PRACH req. C/I = -20dB PRACH req. C/I = -25dB
96.2%
100.0%
94%95%96%97%98%99%100%
-25dB -20dBCall Setup Success Rate
0.0%20.0%40.0%60.0%80.0%100.0%120.0%
<3.5
s
3.5s
- 3
.7s
3.7s
- 3
.9s
3.9s
- 4
.1s
4.1s
-4.3
s
4.3s
-4.5
s
4.5s
-4.7
s
4.7s
-4.9
s
4.9s
-5.1
s
5.1s
-5.3
s
5.3s
-5.5
s
>5.5
s
Call Setup Delay (seconds) RRC Conn. Req. to Alerting
PRACH req. C/I = -25 PRACH req. C/I = -20
32/102 GS MS NPO Network Planning & Optimization Capability
RAN Parameter Testing Guide10/11/2022
Copyright 2007 Nokia Siemens Networks.All rights reserved.
Figure 16 CSSR and Call setup delay
From the graph above it is seen that there is improvement in call setupdelay for –20dB case. Nearly 65% of the established calls are throughwith only 3.5 – 3.7s delay and the more than 5.5s delay “tail” disappears(in this case). It is also noticed that call setup success rate is 100%with -20dB than 96.2% using -25dB.
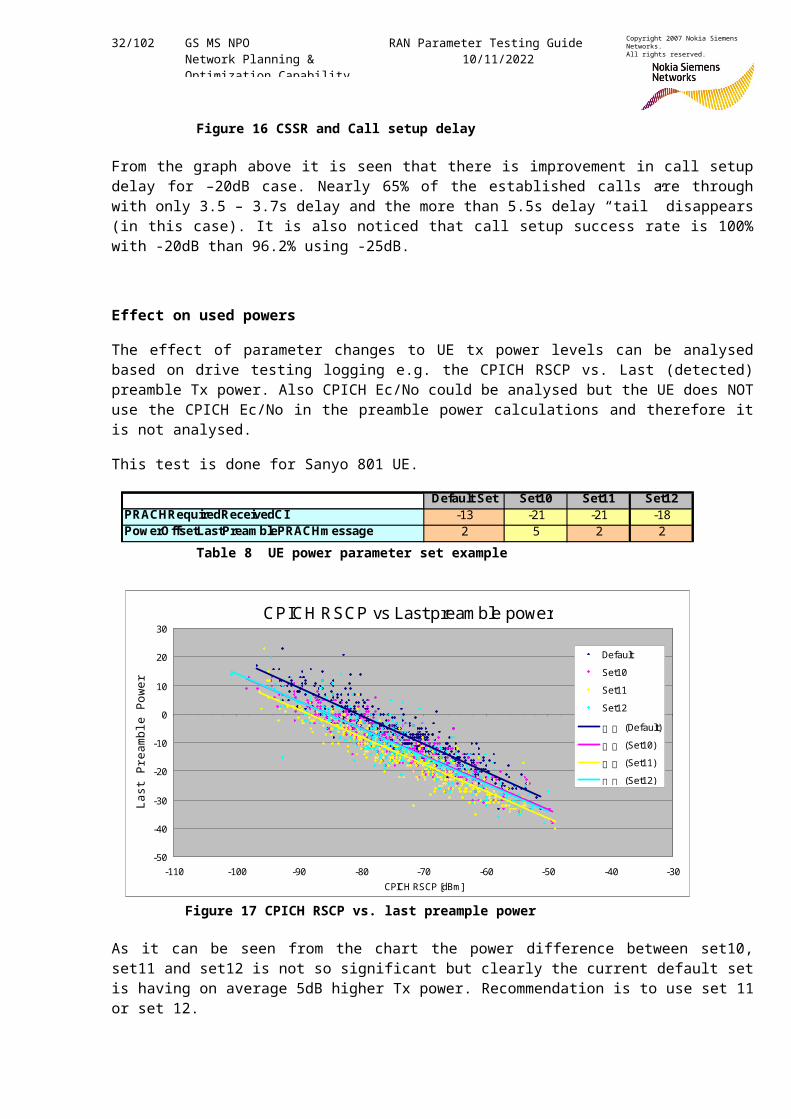
Effect on used powers
The effect of parameter changes to UE tx power levels can be analysedbased on drive testing logging e.g. the CPICH RSCP vs. Last (detected)preamble Tx power. Also CPICH Ec/No could be analysed but the UE does NOTuse the CPICH Ec/No in the preamble power calculations and therefore itis not analysed.
This test is done for Sanyo 801 UE.
Table 8 UE power parameter set example
Figure 17 CPICH RSCP vs. last preample power
As it can be seen from the chart the power difference between set10,set11 and set12 is not so significant but clearly the current default setis having on average 5dB higher Tx power. Recommendation is to use set 11or set 12.
CPICH RSCP vs Last pream ble power
-50
-40
-30
-20
-10
0
10
20
30
-110 -100 -90 -80 -70 -60 -50 -40 -30CPICH RSCP [dBm]
Last
Pre
ambl
e Po
wer[
dBm] Default
Set10Set11Set12
線 線 (Default)線 線 (Set10)線 線 (Set11)線 線 (Set12)
Default Set Set10 Set11 Set12PRACHRequiredReceivedCI -13 -21 -21 -18Pow erO ffsetLastPream blePRACHm essage 2 5 2 2
Default Set Set10 Set11 Set12PRACHRequiredReceivedCI -13 -21 -21 -18Pow erO ffsetLastPream blePRACHm essage 2 5 2 2
33/102 GS MS NPO Network Planning & Optimization Capability
RAN Parameter Testing Guide10/11/2022
Copyright 2007 Nokia Siemens Networks.All rights reserved.
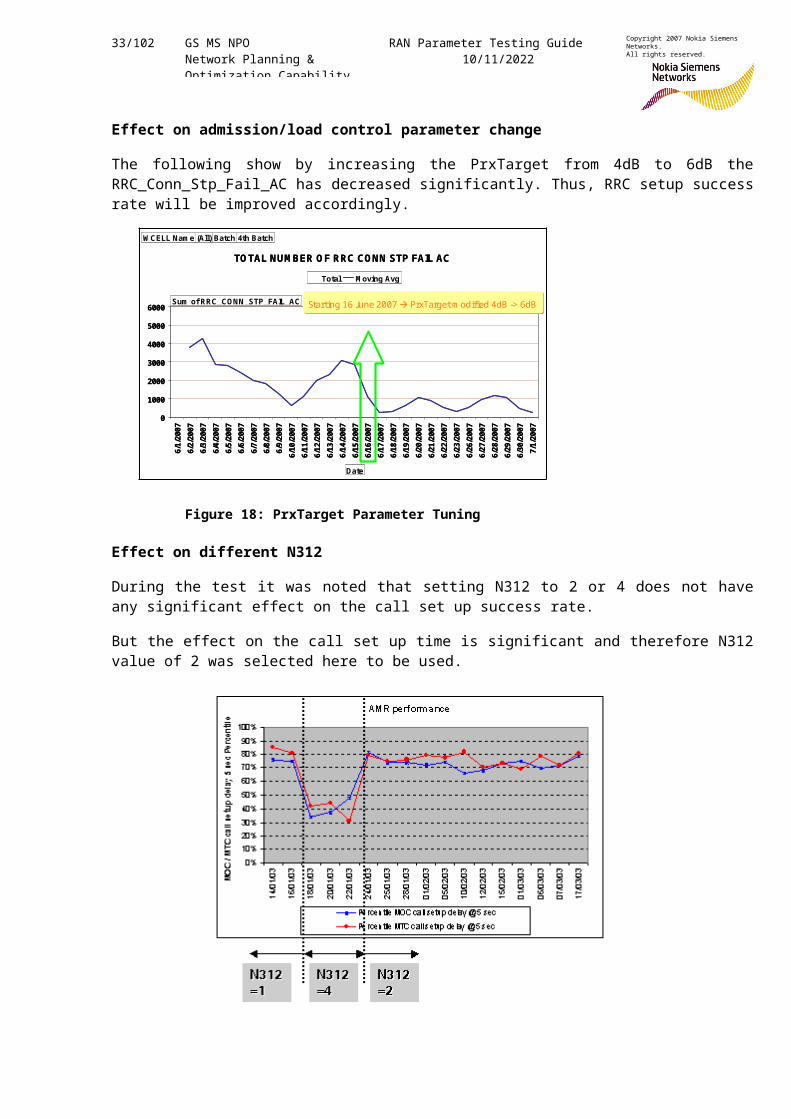
Effect on admission/load control parameter change
The following show by increasing the PrxTarget from 4dB to 6dB theRRC_Conn_Stp_Fail_AC has decreased significantly. Thus, RRC setup successrate will be improved accordingly.
Figure 18: PrxTarget Parameter Tuning
Effect on different N312
During the test it was noted that setting N312 to 2 or 4 does not haveany significant effect on the call set up success rate.
But the effect on the call set up time is significant and therefore N312value of 2 was selected here to be used.
TO TAL NUM BER O F RRC CONN STP FAIL AC
0
1000
2000
3000
4000
5000
6000
6/1/2007
6/2/2007
6/3/2007
6/4/2007
6/5/2007
6/6/2007
6/7/2007
6/8/2007
6/9/2007
6/10/2007
6/11/2007
6/12/2007
6/13/2007
6/14/2007
6/15/2007
6/16/2007
6/17/2007
6/18/2007
6/19/2007
6/20/2007
6/21/2007
6/22/2007
6/23/2007
6/26/2007
6/27/2007
6/28/2007
6/29/2007
6/30/2007
7/1/2007
Total M oving Avg
W CELL Nam e (All)Batch 4th Batch
Sum of RRC_CONN_STP_FAIL_AC
Date
Starting 16 June 2007 PrxTargetm odified 4dB -> 6dB
34/102 GS MS NPO Network Planning & Optimization Capability
RAN Parameter Testing Guide10/11/2022
Copyright 2007 Nokia Siemens Networks.All rights reserved.
Figure 19 Performance with different N312
3.3 RAB Establishment/RAB Completion PerformanceDuring RAB establishment procedure Admission Control will calculate themaximum power what is possible to be used for that radio link. It couldhelp in some cases to increase the maximum DL DCH power in poor RSCP orEcNo conditions. This could help also certain UE types to have better RABsuccess.
3.3.1 ParametersRelated to RAB access and completion, there are some parameters which could be tested, listed below:
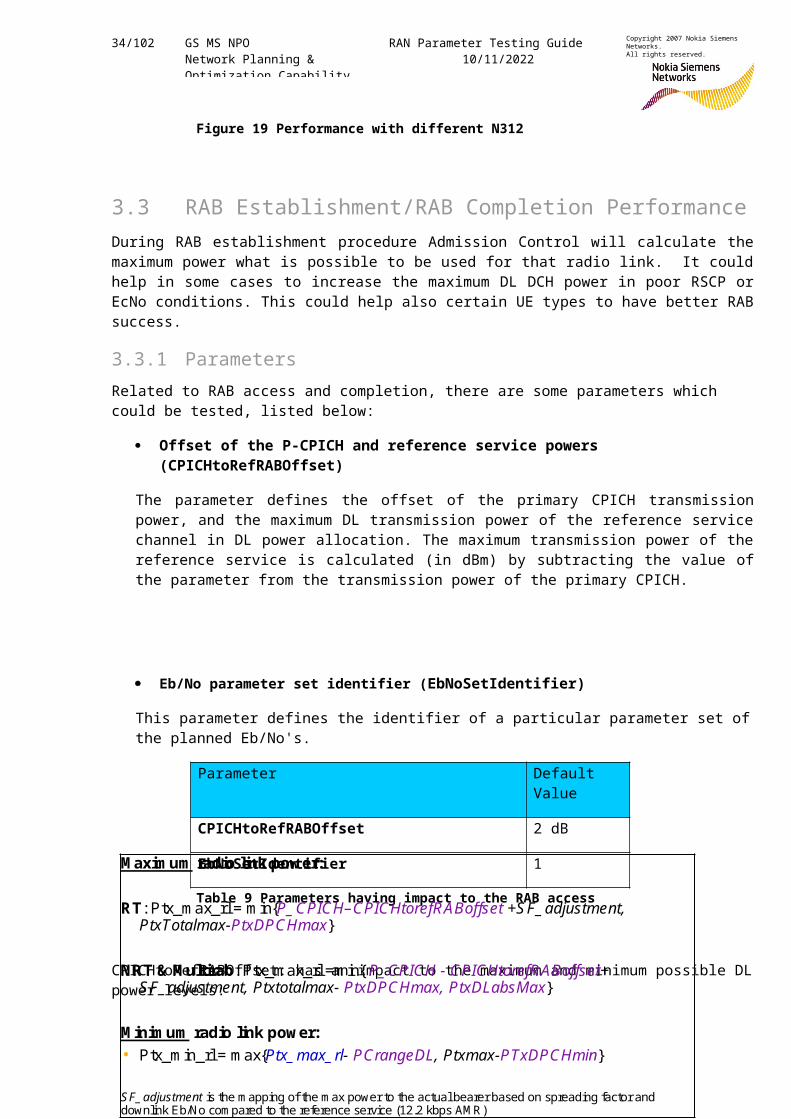
Offset of the P-CPICH and reference service powers (CPICHtoRefRABOffset)
The parameter defines the offset of the primary CPICH transmissionpower, and the maximum DL transmission power of the reference servicechannel in DL power allocation. The maximum transmission power of thereference service is calculated (in dBm) by subtracting the value ofthe parameter from the transmission power of the primary CPICH.
Eb/No parameter set identifier (EbNoSetIdentifier)
This parameter defines the identifier of a particular parameter set ofthe planned Eb/No's.
Parameter Default Value
CPICHtoRefRABOffset 2 dB
EbNoSetIdentifier 1
Table 9 Parameters having impact to the RAB access
CPICHtoRefRABOffset: has an impact to the maximum and minimum possible DLpower levels:
M axim um radio link pow er:
RT: Ptx_m ax_rl= m in{P_ CPIC H–CPIC HtorefR ABoffset +S F _ adjustment, PtxTotalmax-PtxDPCHmax}
NRT & M ultirab: Ptx_m ax_rl=m in{ P_ CPIC H - C PICHtorefR ABoffset+ S F _ adjustment, Ptxtotalmax- PtxDPCHmax, PtxDLabsMax}
M inim um radio link pow er:• Ptx_m in_rl= m ax{Ptx_ max_ rl- PCrangeDL, Ptxmax-PTxDPCHmin}
S F_ adjustment is the m apping of the m ax power to the actual bearer based on spreading factor and downlink Eb/No com pared to the reference service (12.2 kbps AM R)
35/102 GS MS NPO Network Planning & Optimization Capability
RAN Parameter Testing Guide10/11/2022
Copyright 2007 Nokia Siemens Networks.All rights reserved.
Figure 20 Maximum and minimum DL power per connection
However, it should be noted that the minimum power is increased as well (as the minimum power is Max power – DL PC Range) which might lead to thesituation where too high powers are allocated even in the good coverage conditions as a result power is wasted.
The power requirement per service is highly UE type dependent!
EbNoSetIdentifier
Another parameter that could have some impact is theEbNoSetIdentifier. It indicates the used EbNo set (2-way diversity=> 1, no diversity => 2 and 4-way diversity => 3).
However, it should be noted that DL Eb/Nos are the same for each case; therefore the EbNoSetIdentifier parameter has impact only on UL performance.
In UL the set one has 3dB lower Eb/No than set 2 and set 3 has 1dB lower Eb/No that set 1. Therefore with Set 2 the UL initial power should be the highest.
In case there are a lot of UL AC rejections all the following parameterscan have impact but only in the case where the interference is spiky innature.
3.3.2 Testing ScenariosDifferent sets of parameters having an impact to the RAB establishmentcould be tested as follows:
36/102 GS MS NPO Network Planning & Optimization Capability
RAN Parameter Testing Guide10/11/2022
Copyright 2007 Nokia Siemens Networks.All rights reserved.
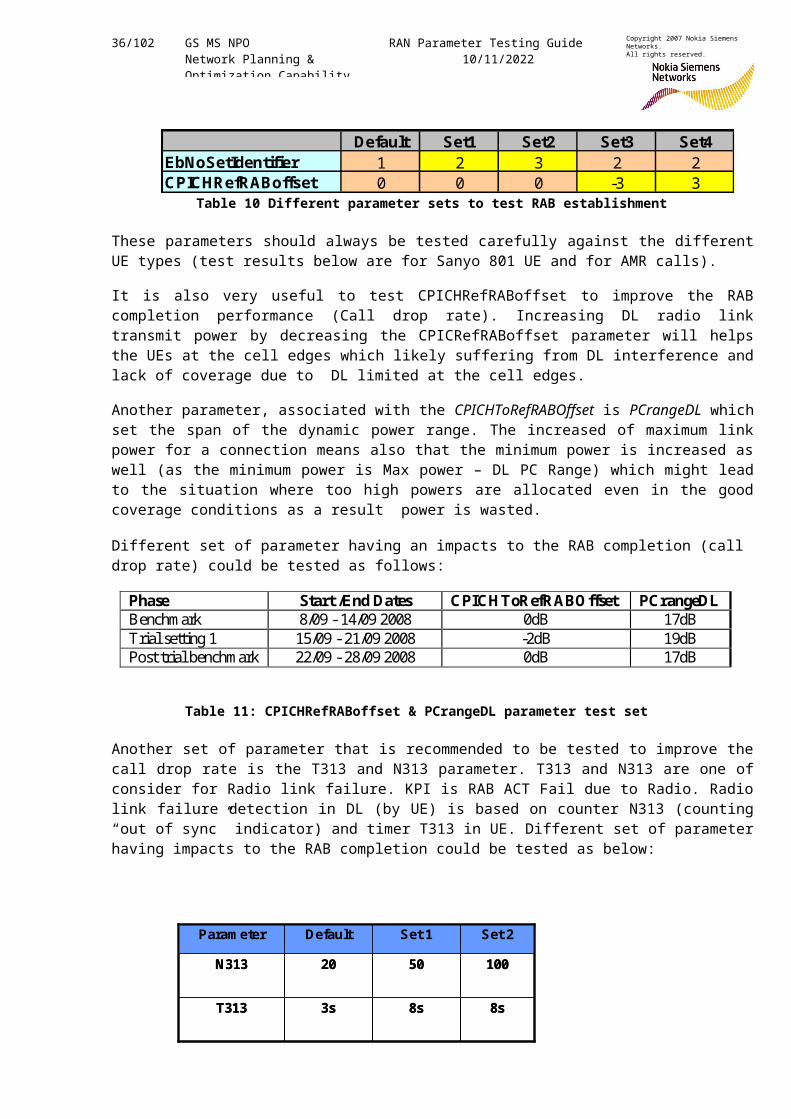
Table 10 Different parameter sets to test RAB establishment
These parameters should always be tested carefully against the differentUE types (test results below are for Sanyo 801 UE and for AMR calls).
It is also very useful to test CPICHRefRABoffset to improve the RABcompletion performance (Call drop rate). Increasing DL radio linktransmit power by decreasing the CPICRefRABoffset parameter will helpsthe UEs at the cell edges which likely suffering from DL interference andlack of coverage due to DL limited at the cell edges.
Another parameter, associated with the CPICHToRefRABOffset is PCrangeDL whichset the span of the dynamic power range. The increased of maximum linkpower for a connection means also that the minimum power is increased aswell (as the minimum power is Max power – DL PC Range) which might leadto the situation where too high powers are allocated even in the goodcoverage conditions as a result power is wasted.
Different set of parameter having an impacts to the RAB completion (call drop rate) could be tested as follows:
Phase Start /End Dates CPICH ToRefRABO ffset PCrangeDL Benchmark 8/09 - 14/09 2008 0dB 17dB Trial setting 1 15/09 - 21/09 2008 -2dB 19dB Post trial benchmark 22/09 - 28/09 2008 0dB 17dB
Table 11: CPICHRefRABoffset & PCrangeDL parameter test set
Another set of parameter that is recommended to be tested to improve thecall drop rate is the T313 and N313 parameter. T313 and N313 are one ofconsider for Radio link failure. KPI is RAB ACT Fail due to Radio. Radiolink failure detection in DL (by UE) is based on counter N313 (counting“out of sync” indicator) and timer T313 in UE. Different set of parameterhaving impacts to the RAB completion could be tested as below:
Default Set1 Set2 Set3 Set4EbNoSetIdentifier 1 2 3 2 2CPICHRefRABoffset 0 0 0 -3 3
1005020N313
8s
Set 2
8s3sT313
Set 1Default Param eter
1005020N313
8s
Set 2
8s3sT313
Set 1Default Param eter
37/102 GS MS NPO Network Planning & Optimization Capability
RAN Parameter Testing Guide10/11/2022
Copyright 2007 Nokia Siemens Networks.All rights reserved.
Table 12 : N313 and T313 parameter test
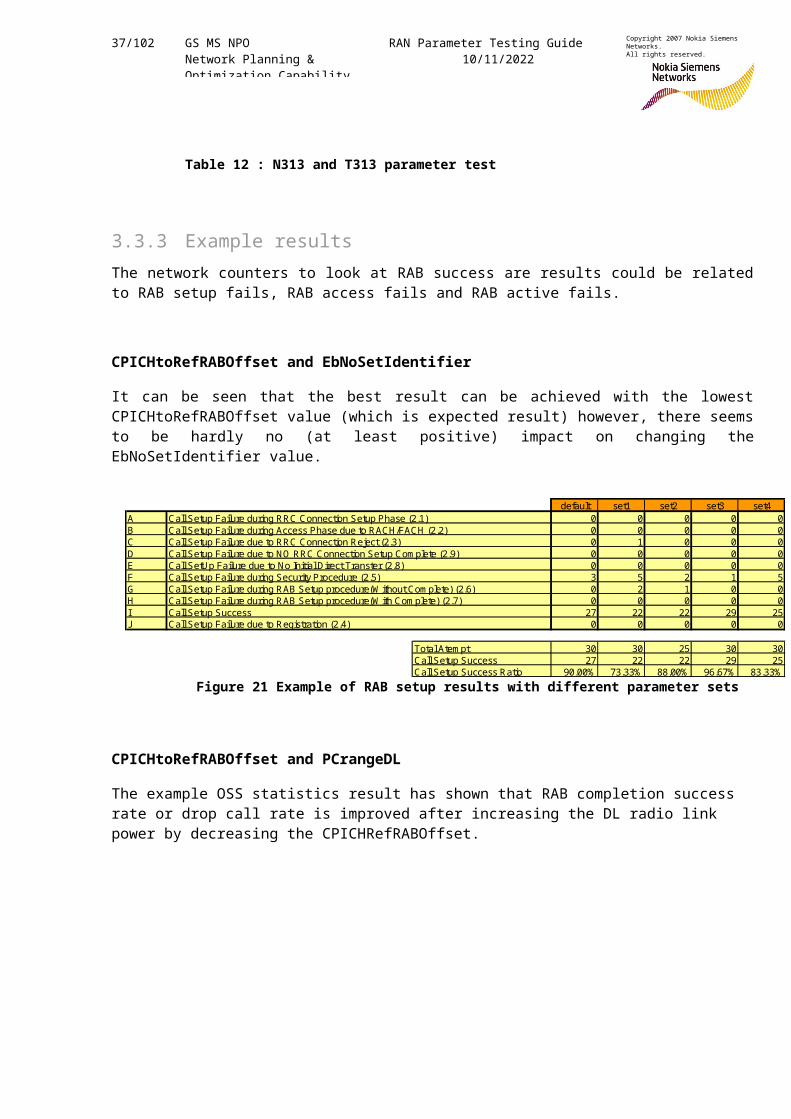
3.3.3 Example resultsThe network counters to look at RAB success are results could be relatedto RAB setup fails, RAB access fails and RAB active fails.
CPICHtoRefRABOffset and EbNoSetIdentifier
It can be seen that the best result can be achieved with the lowestCPICHtoRefRABOffset value (which is expected result) however, there seemsto be hardly no (at least positive) impact on changing theEbNoSetIdentifier value.
Figure 21 Example of RAB setup results with different parameter sets
CPICHtoRefRABOffset and PCrangeDL
The example OSS statistics result has shown that RAB completion success rate or drop call rate is improved after increasing the DL radio link power by decreasing the CPICHRefRABOffset.
default set1 set2 set3 set4A Call Setup Failure during RRC Connection Setup Phase (2.1) 0 0 0 0 0B Call Setup Failure during Access Phase due to RACH/FACH (2.2) 0 0 0 0 0C Call Setup Failure due to RRC Connection Reject (2.3) 0 1 0 0 0D Call Setup Failure due to NO RRC Connection Setup Com plete (2.9) 0 0 0 0 0E Call SetUp Failure due to No Initial Direct Transter (2.8) 0 0 0 0 0F Call Setup Failure during Security Procedure (2.5) 3 5 2 1 5G Call Setup Failure during RAB Setup procedure(W ithout Com plete) (2.6) 0 2 1 0 0H Call Setup Failure during RAB Setup procedure(W ith Com plete) (2.7) 0 0 0 0 0I Call Setup Success 27 22 22 29 25J Call Setup Failure due to Registration (2.4) 0 0 0 0 0
Total Atem pt 30 30 25 30 30Call Setup Success 27 22 22 29 25Call Setup Success Ratio 90.00% 73.33% 88.00% 96.67% 83.33%
38/102 GS MS NPO Network Planning & Optimization Capability
RAN Parameter Testing Guide10/11/2022
Copyright 2007 Nokia Siemens Networks.All rights reserved.
DCR
0.00%
0.10%
0.20%
0.30%
0.40%
0.50%
0.60%
0.70%
0.80%01
/09/20
08
02/09/20
08
03/09/20
08
04/09/20
08
05/09/20
08
06/09/20
08
07/09/20
08
08/09/20
08
09/09/20
08
10/09/20
08
11/09/20
08
12/09/20
08
13/09/20
08
14/09/20
08
15/09/20
08
16/09/20
08
17/09/20
08
18/09/20
08
19/09/20
08
20/09/20
08
21/09/20
08
22/09/20
08
23/09/20
08
24/09/20
08
25/09/20
08
26/09/20
08
27/09/20
08
28/09/20
08
29/09/20
08
30/09/20
08
DCR
Trial w eek
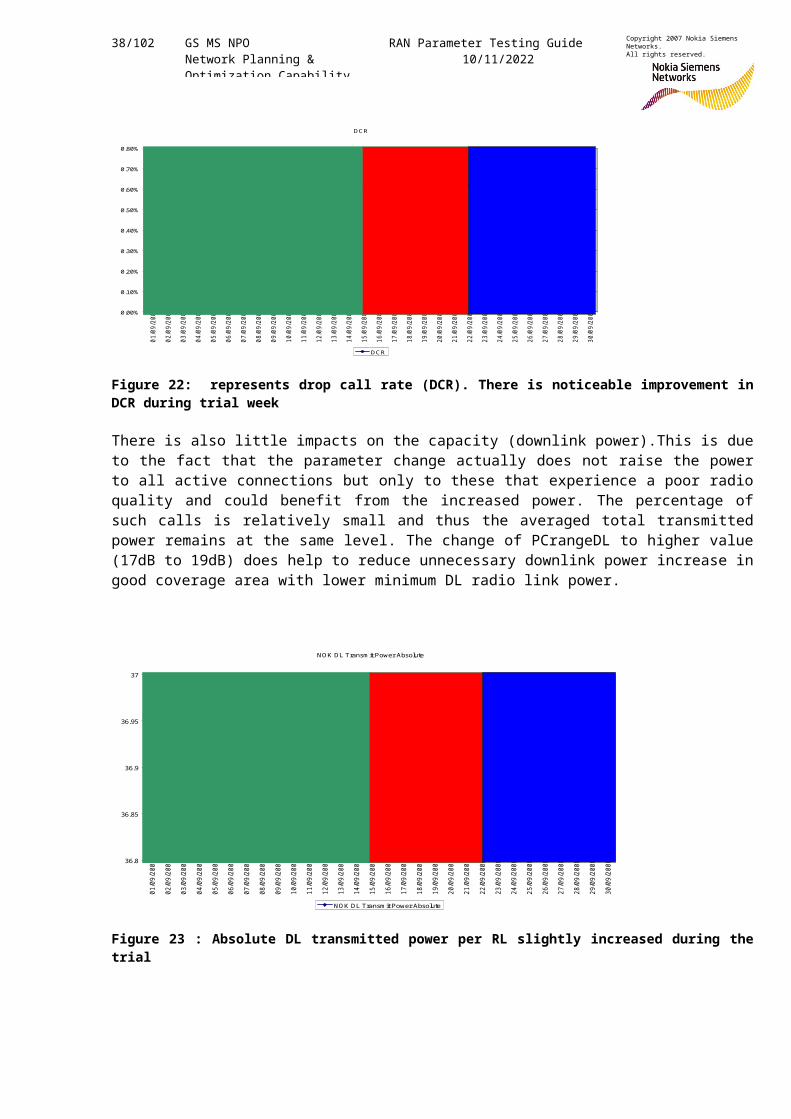
Figure 22: represents drop call rate (DCR). There is noticeable improvement inDCR during trial week
There is also little impacts on the capacity (downlink power).This is dueto the fact that the parameter change actually does not raise the powerto all active connections but only to these that experience a poor radioquality and could benefit from the increased power. The percentage ofsuch calls is relatively small and thus the averaged total transmittedpower remains at the same level. The change of PCrangeDL to higher value(17dB to 19dB) does help to reduce unnecessary downlink power increase ingood coverage area with lower minimum DL radio link power.
NOK DL Transm it Power Absolute
36.8
36.85
36.9
36.95
37
01/09/20
08
02/09/20
08
03/09/20
08
04/09/20
08
05/09/20
08
06/09/20
08
07/09/20
08
08/09/20
08
09/09/20
08
10/09/20
08
11/09/20
08
12/09/20
08
13/09/20
08
14/09/20
08
15/09/20
08
16/09/20
08
17/09/20
08
18/09/20
08
19/09/20
08
20/09/20
08
21/09/20
08
22/09/20
08
23/09/20
08
24/09/20
08
25/09/20
08
26/09/20
08
27/09/20
08
28/09/20
08
29/09/20
08
30/09/20
08
NOK DL Transm it Power Absolute
Trial w eek
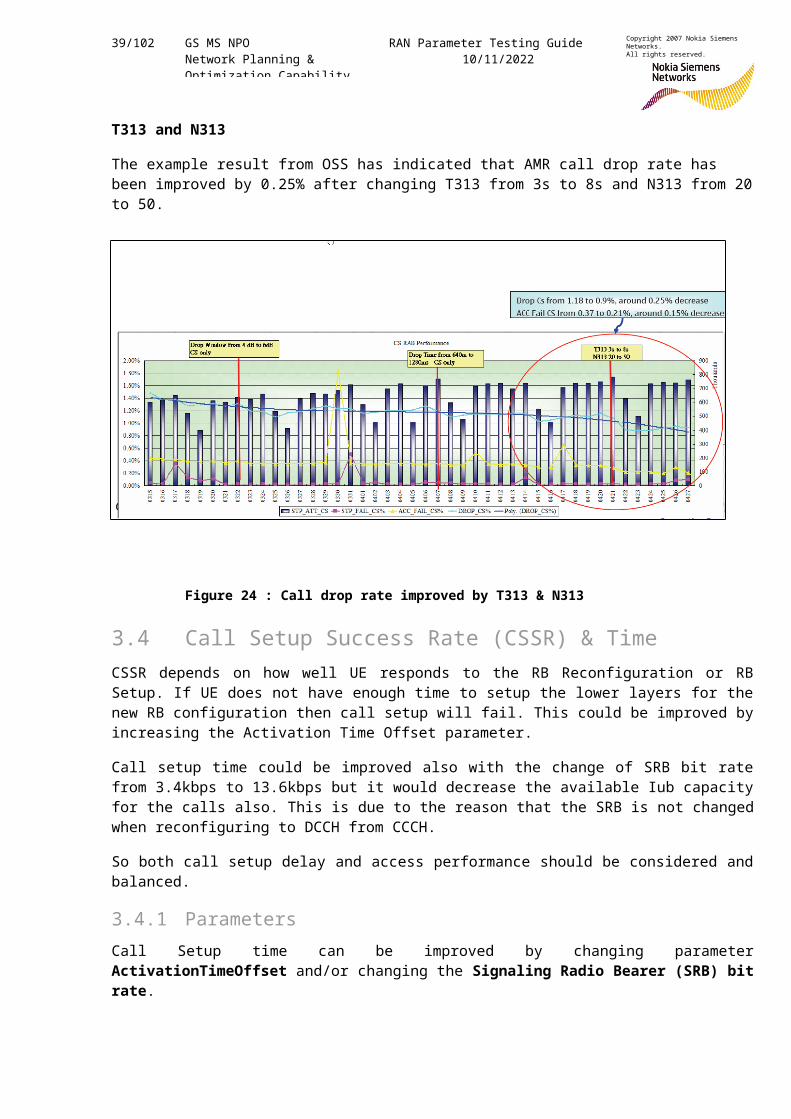
Figure 23 : Absolute DL transmitted power per RL slightly increased during thetrial
39/102 GS MS NPO Network Planning & Optimization Capability
RAN Parameter Testing Guide10/11/2022
Copyright 2007 Nokia Siemens Networks.All rights reserved.
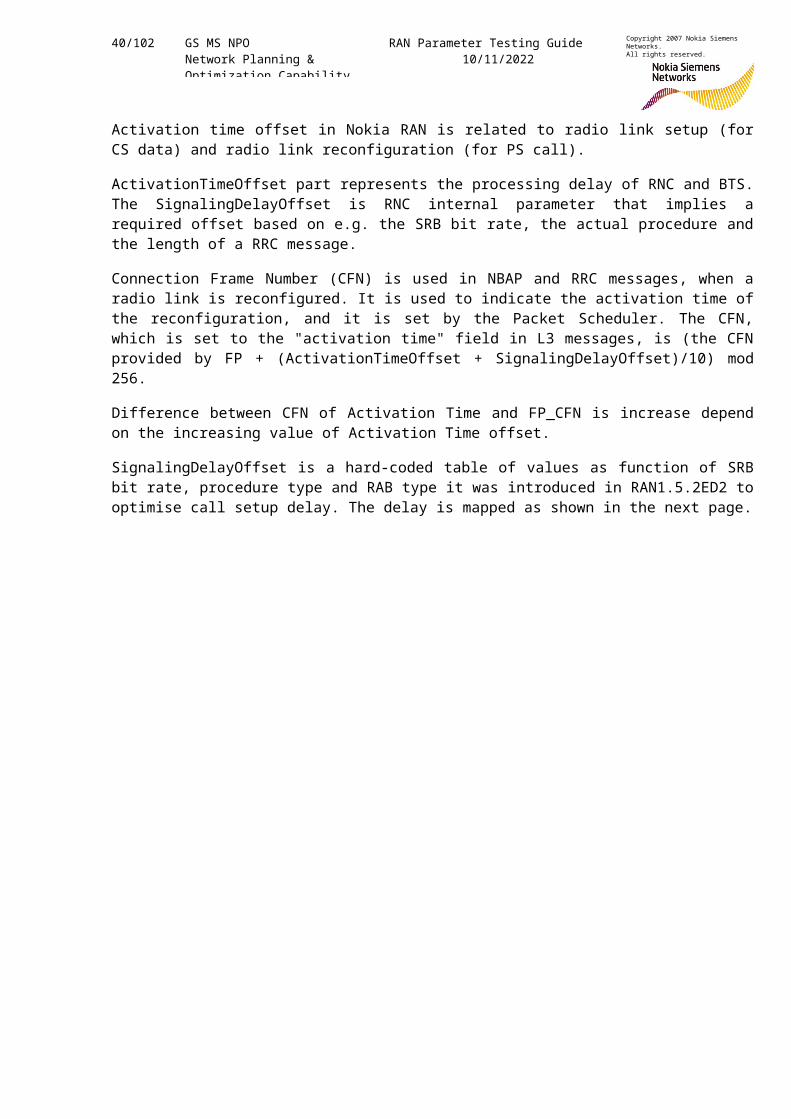
T313 and N313
The example result from OSS has indicated that AMR call drop rate has been improved by 0.25% after changing T313 from 3s to 8s and N313 from 20to 50.
Figure 24 : Call drop rate improved by T313 & N313
3.4 Call Setup Success Rate (CSSR) & TimeCSSR depends on how well UE responds to the RB Reconfiguration or RBSetup. If UE does not have enough time to setup the lower layers for thenew RB configuration then call setup will fail. This could be improved byincreasing the Activation Time Offset parameter.
Call setup time could be improved also with the change of SRB bit ratefrom 3.4kbps to 13.6kbps but it would decrease the available Iub capacityfor the calls also. This is due to the reason that the SRB is not changedwhen reconfiguring to DCCH from CCCH.
So both call setup delay and access performance should be considered andbalanced.
3.4.1 ParametersCall Setup time can be improved by changing parameterActivationTimeOffset and/or changing the Signaling Radio Bearer (SRB) bitrate.
40/102 GS MS NPO Network Planning & Optimization Capability
RAN Parameter Testing Guide10/11/2022
Copyright 2007 Nokia Siemens Networks.All rights reserved.
Activation time offset in Nokia RAN is related to radio link setup (forCS data) and radio link reconfiguration (for PS call).
ActivationTimeOffset part represents the processing delay of RNC and BTS.The SignalingDelayOffset is RNC internal parameter that implies arequired offset based on e.g. the SRB bit rate, the actual procedure andthe length of a RRC message.
Connection Frame Number (CFN) is used in NBAP and RRC messages, when aradio link is reconfigured. It is used to indicate the activation time ofthe reconfiguration, and it is set by the Packet Scheduler. The CFN,which is set to the "activation time" field in L3 messages, is (the CFNprovided by FP + (ActivationTimeOffset + SignalingDelayOffset)/10) mod256.
Difference between CFN of Activation Time and FP_CFN is increase dependon the increasing value of Activation Time offset.
SignalingDelayOffset is a hard-coded table of values as function of SRBbit rate, procedure type and RAB type it was introduced in RAN1.5.2ED2 tooptimise call setup delay. The delay is mapped as shown in the next page.
41/102 GS MS NPO Network Planning & Optimization Capability
RAN Parameter Testing Guide10/11/2022
Copyright 2007 Nokia Siemens Networks.All rights reserved.
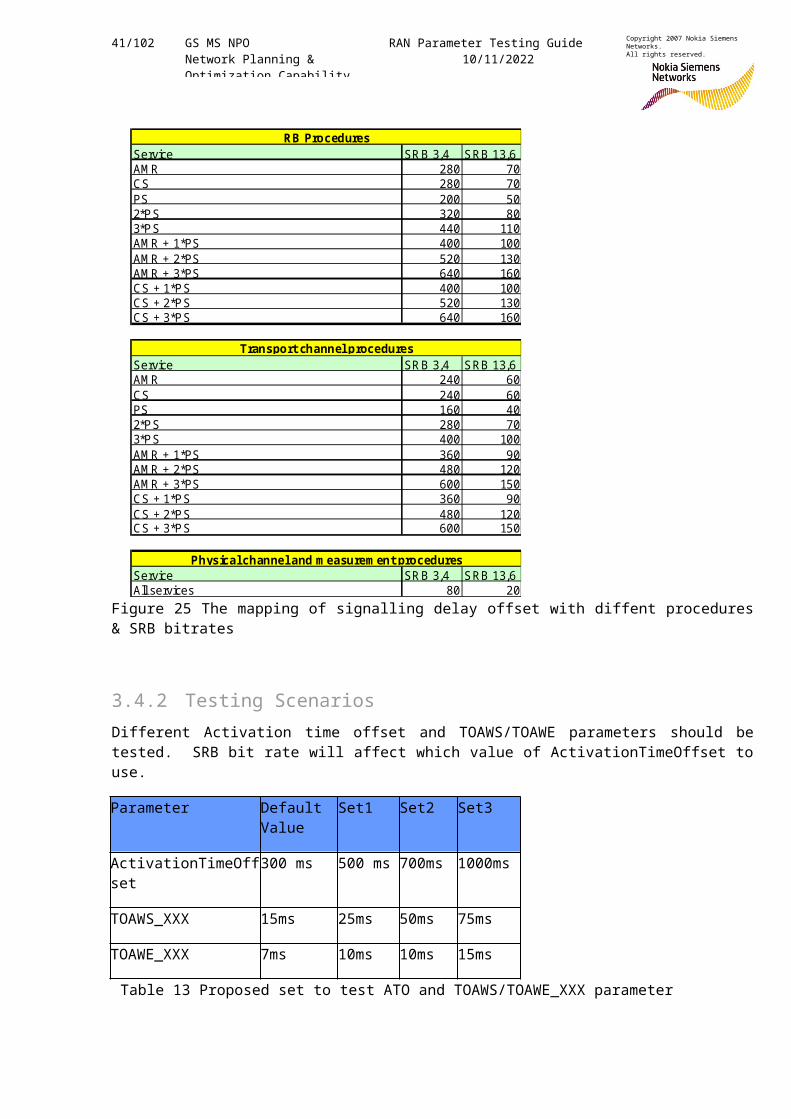
Figure 25 The mapping of signalling delay offset with diffent procedures& SRB bitrates
3.4.2 Testing ScenariosDifferent Activation time offset and TOAWS/TOAWE parameters should betested. SRB bit rate will affect which value of ActivationTimeOffset touse.
Parameter DefaultValue
Set1 Set2 Set3
ActivationTimeOffset
300 ms 500 ms 700ms 1000ms
TOAWS_XXX 15ms 25ms 50ms 75ms
TOAWE_XXX 7ms 10ms 10ms 15ms
Table 13 Proposed set to test ATO and TOAWS/TOAWE_XXX parameter
Service SR B 3,4 SRB 13,6AM R 280 70CS 280 70PS 200 502*PS 320 803*PS 440 110AM R + 1*PS 400 100AM R + 2*PS 520 130AM R + 3*PS 640 160CS + 1*PS 400 100CS + 2*PS 520 130CS + 3*PS 640 160
Service SR B 3,4 SRB 13,6AM R 240 60CS 240 60PS 160 402*PS 280 703*PS 400 100AM R + 1*PS 360 90AM R + 2*PS 480 120AM R + 3*PS 600 150CS + 1*PS 360 90CS + 2*PS 480 120CS + 3*PS 600 150
Service SR B 3,4 SRB 13,6All services 80 20
RB Procedures
Transport channel procedures
Physical channel and m easurem ent procedures
42/102 GS MS NPO Network Planning & Optimization Capability
RAN Parameter Testing Guide10/11/2022
Copyright 2007 Nokia Siemens Networks.All rights reserved.
It should be noted that ActivationTimeOffset parameter value change requires that the UEs can support the shorter time period to send the response to e.g. :
Radio Bearer Setup
Radio Bearer Reconfiguration
Physical Channel Reconfiguration, etc.
ActivationTimeOffset tests has to be done for several different UEs infield conditions to see that all the UEs can respond within specifiedtimers. Also the impact of cell reselection during the radio bearer setupshould be verified.
In case certain UEs are having problems in responding to RB Setup (CS) orRB Reconfiguration (PS), the problem can be seen as increase in PMIticket : radio_connection_lost_c, timer_expired_c and counters:RAB_ACC_FAIL … MS (RB Setup) and RRC_CONN_ACT_FAIL_RNC (RB setup).
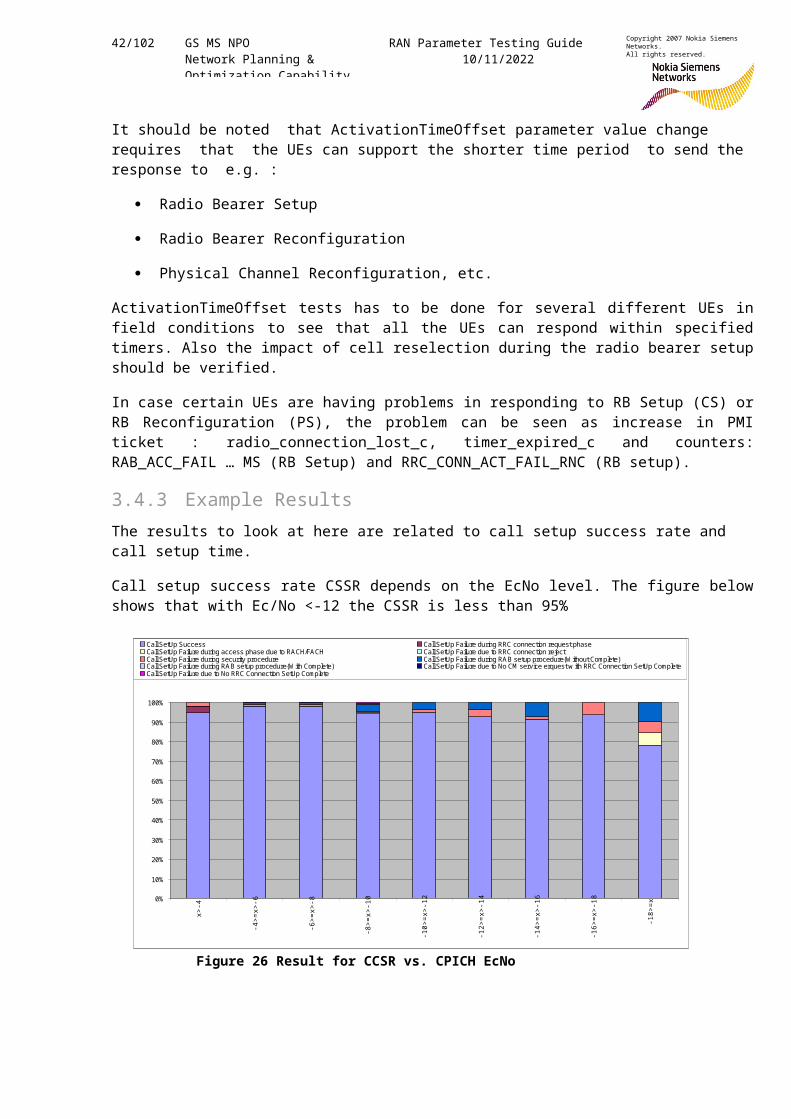
3.4.3 Example ResultsThe results to look at here are related to call setup success rate and call setup time.
Call setup success rate CSSR depends on the EcNo level. The figure belowshows that with Ec/No <-12 the CSSR is less than 95%
Figure 26 Result for CCSR vs. CPICH EcNo
0%
10%
20%
30%
40%
50%
60%
70%
80%
90%
100%
x>-4
-4>=
x>-6
-6>=
x>-8
-8>=
x>-1
0
-10>
=x>-
12
-12>
=x>-
14
-14>
=x>-
16
-16>
=x>-
18
-18>
=xCall SetUp Success Call SetUp Failure during RRC connection request phaseCall SetUp Failure during access phase due to RACH/FACH Call SetUp Failure due to RRC connection rejectCall SetUp Failure during security procedure Call SetUp Failure during RAB setup procedure(W ithout Complete)Call SetUp Failure during RAB setup procedure(W ith Complete) Call SetUp Failure due to No CM service erquest w ith RRC Connection SetUp CompleteCall SetUp Failure due to No RRC Connection SetUp Complete
43/102 GS MS NPO Network Planning & Optimization Capability
RAN Parameter Testing Guide10/11/2022
Copyright 2007 Nokia Siemens Networks.All rights reserved.
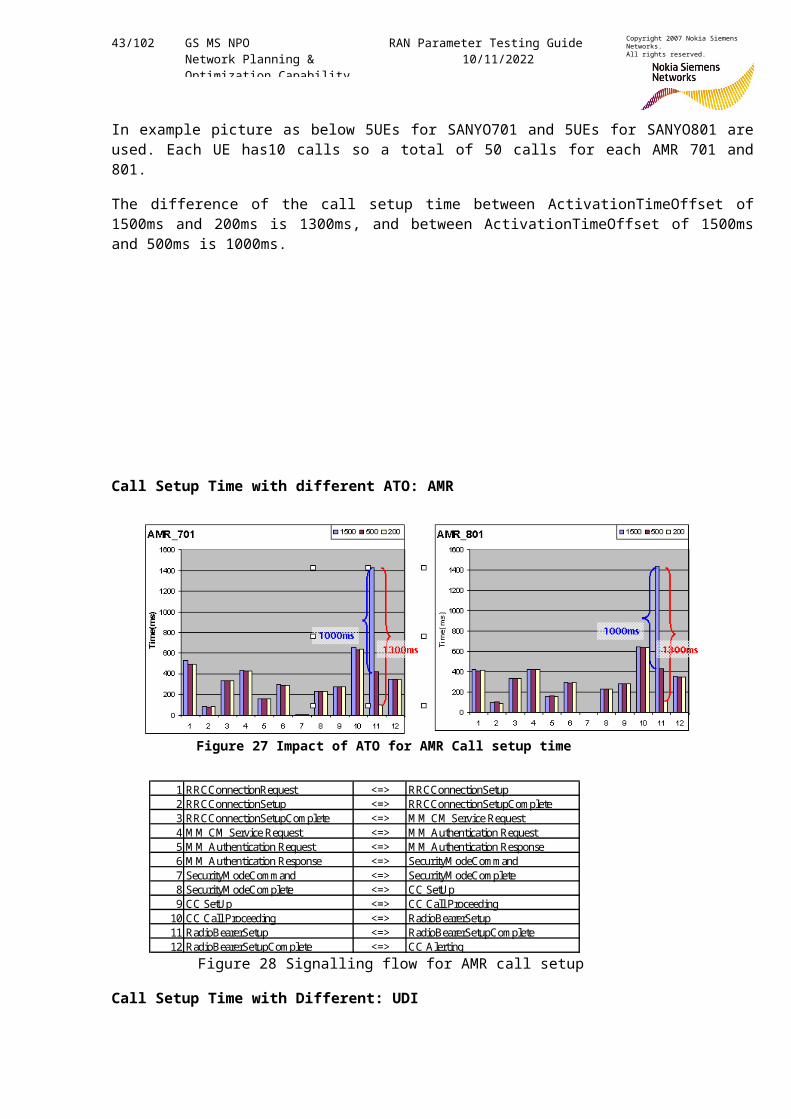
In example picture as below 5UEs for SANYO701 and 5UEs for SANYO801 areused. Each UE has10 calls so a total of 50 calls for each AMR 701 and801.
The difference of the call setup time between ActivationTimeOffset of1500ms and 200ms is 1300ms, and between ActivationTimeOffset of 1500msand 500ms is 1000ms.
Call Setup Time with different ATO: AMR
Figure 27 Impact of ATO for AMR Call setup time
Figure 28 Signalling flow for AMR call setup
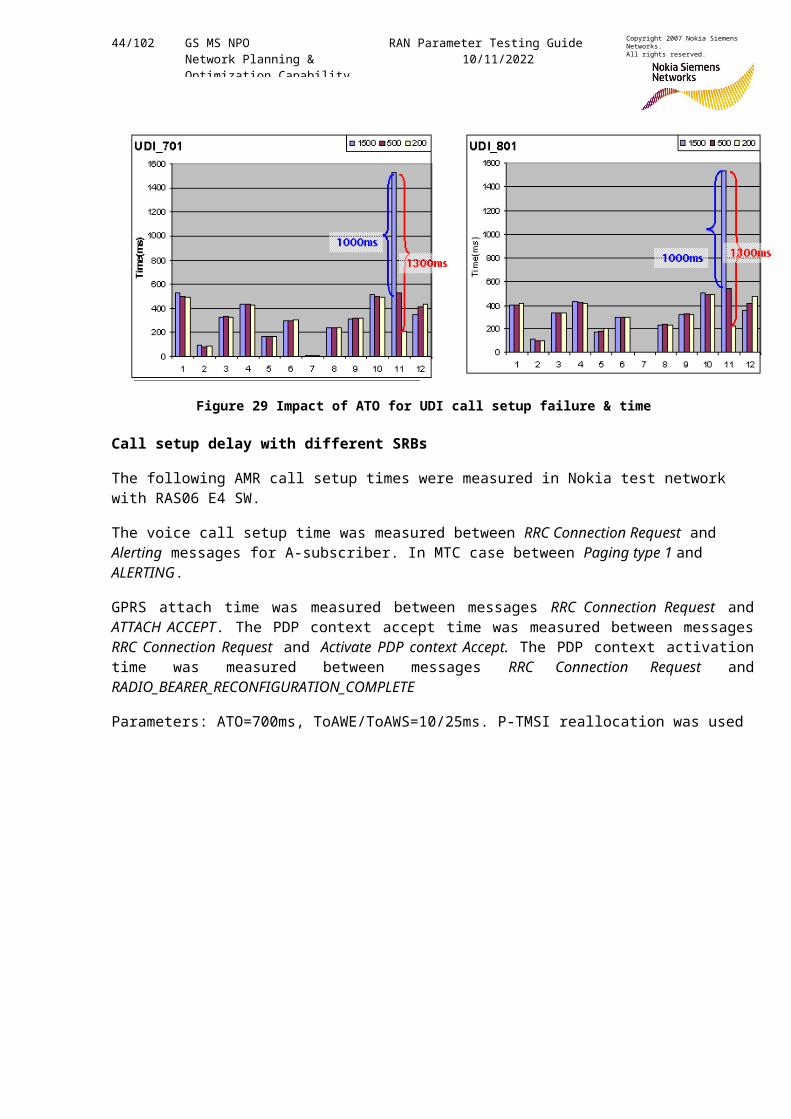
Call Setup Time with Different: UDI
1 RRCConnectionRequest <=> RRCConnectionSetup2 RRCConnectionSetup <=> RRCConnectionSetupComplete3 RRCConnectionSetupComplete <=> M M CM Service Request4 M M CM Service Request <=> M M Authentication Request5 M M Authentication Request <=> M M Authentication Response6 M M Authentication Response <=> SecurityM odeCommand7 SecurityM odeCommand <=> SecurityM odeComplete8 SecurityM odeComplete <=> CC SetUp9 CC SetUp <=> CC Call Proceeding10 CC Call Proceeding <=> RadioBearerSetup11 RadioBearerSetup <=> RadioBearerSetupComplete12 RadioBearerSetupComplete <=> CC Alerting
44/102 GS MS NPO Network Planning & Optimization Capability
RAN Parameter Testing Guide10/11/2022
Copyright 2007 Nokia Siemens Networks.All rights reserved.
Figure 29 Impact of ATO for UDI call setup failure & time
Call setup delay with different SRBs
The following AMR call setup times were measured in Nokia test network with RAS06 E4 SW.
The voice call setup time was measured between RRC Connection Request and Alerting messages for A-subscriber. In MTC case between Paging type 1 and ALERTING.
GPRS attach time was measured between messages RRC Connection Request andATTACH ACCEPT. The PDP context accept time was measured between messagesRRC Connection Request and Activate PDP context Accept. The PDP context activationtime was measured between messages RRC Connection Request andRADIO_BEARER_RECONFIGURATION_COMPLETE
Parameters: ATO=700ms, ToAWE/ToAWS=10/25ms. P-TMSI reallocation was used
45/102 GS MS NPO Network Planning & Optimization Capability
RAN Parameter Testing Guide10/11/2022
Copyright 2007 Nokia Siemens Networks.All rights reserved.
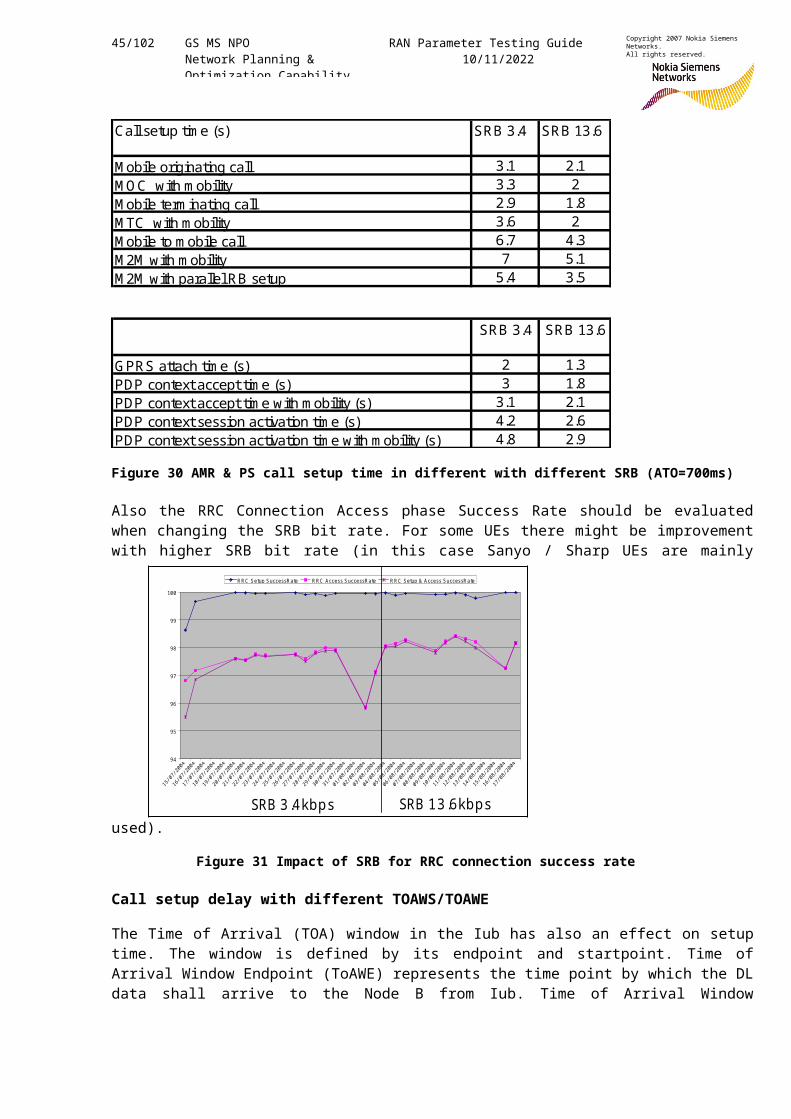
Call setup tim e (s) SRB 3.4 SRB 13.6
M obile originating call 3.1 2.1M OC with m obility 3.3 2M obile term inating call 2.9 1.8M TC with m obility 3.6 2M obile to m obile call 6.7 4.3M 2M with m obility 7 5.1M 2M with parallel RB setup 5.4 3.5
SRB 3.4 SRB 13.6
GPRS attach tim e (s) 2 1.3PDP context accept tim e (s) 3 1.8PDP context accept tim e with m obility (s) 3.1 2.1PDP context session activation tim e (s) 4.2 2.6PDP context session activation tim e with m obility (s) 4.8 2.9
Figure 30 AMR & PS call setup time in different with different SRB (ATO=700ms)
Also the RRC Connection Access phase Success Rate should be evaluatedwhen changing the SRB bit rate. For some UEs there might be improvementwith higher SRB bit rate (in this case Sanyo / Sharp UEs are mainly
used).
Figure 31 Impact of SRB for RRC connection success rate
Call setup delay with different TOAWS/TOAWE
The Time of Arrival (TOA) window in the Iub has also an effect on setuptime. The window is defined by its endpoint and startpoint. Time ofArrival Window Endpoint (ToAWE) represents the time point by which the DLdata shall arrive to the Node B from Iub. Time of Arrival Window
94
95
96
97
98
99
100
R R C Setup SuccessR ate R R C Access SuccessR ate R R C Setup & Access SuccessR ate
SRB 13.6kbpsSRB 3.4kbps

46/102 GS MS NPO Network Planning & Optimization Capability
RAN Parameter Testing Guide10/11/2022
Copyright 2007 Nokia Siemens Networks.All rights reserved.
Startpoint (ToAWS) is defined as the amount of milliseconds from theToAWE.
Actually ToAWE defines the delay margin before the Latest Time of Arrivalwhich is determined from the Node B internal delay. Too small value maycause lost messages when Iur connections are in use (different delays forbranches) or adjacent sites have different transport delay on Iub. SHOsuccess rate may be used for monitoring this effect.
If ToAWE is decreased the data may in some cases arrive in time to betransmitted without the need of timing adjustment which reduces the setuptime.
An example of the result of tuning the TOAWS from 75ms to 15ms achieved0.2sec faster call setup time.
Figure 32: TOAWS Parameter Tuning
Call setup delay with number of Network Authentication
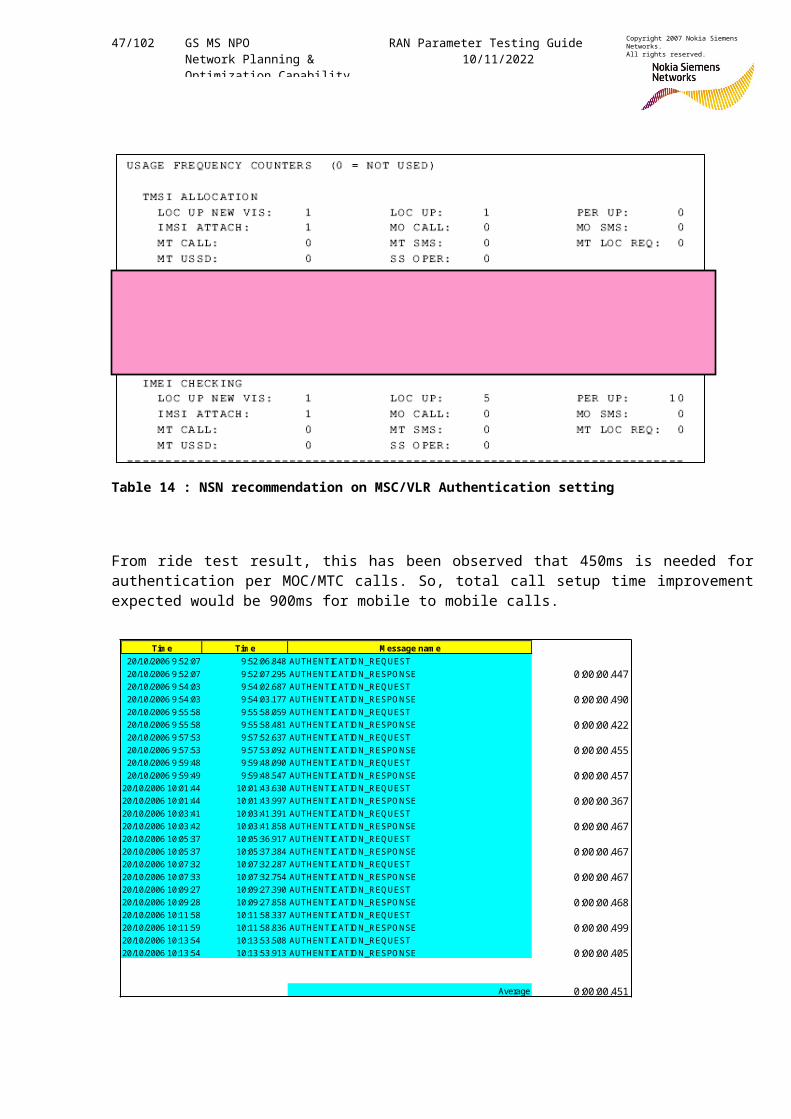
In some network, network authentication has been set that every MOC orMTC calls has to performed authentication within the network. However,NSN recommendation in MSC/VLR authentication setting is to have only oneauthentication per 10 MOC/MTC calls.
00.1
0.20.3
0.40.50.6
0.70.8
0.91
RRC_Req
RRC_Setup
RRC_Set_C
om
CC_serv_req
AUTHE_Req
AUTHE_Resp
CC_SETUP
IDENTITY_REQ
IDENTITY_RESP
CALL PROCEED
ING
RB_setup
RB_setup_com
Meas_cont
Time_between_msg [s]
0
0.5
1
1.5
2
2.5
3
3.5
Cumu
lative [s]
TOAW S15_ATO300 TOAW S75_ATO300 TOAW S75_ATO700
TOAW S15_ATO300(Cum ulative) TOAW S75_ATO300(Cum ulative) TOAW S75_ATO700(Cum ulative)
Param eter Optim isation• For exam ple, TOAW S & ATO changes result in 0.8 sec faster call setup tim e.
00.1
0.20.3
0.40.50.6
0.70.8
0.91
RRC_Req
RRC_Setup
RRC_Set_C
om
CC_serv_req
AUTHE_Req
AUTHE_Resp
CC_SETUP
IDENTITY_REQ
IDENTITY_RESP
CALL PROCEED
ING
RB_setup
RB_setup_com
Meas_cont
Time_between_msg [s]
0
0.5
1
1.5
2
2.5
3
3.5
Cumu
lative [s]
TOAW S15_ATO300 TOAW S75_ATO300 TOAW S75_ATO700
TOAW S15_ATO300(Cum ulative) TOAW S75_ATO300(Cum ulative) TOAW S75_ATO700(Cum ulative)
Param eter Optim isation• For exam ple, TOAW S & ATO changes result in 0.8 sec faster call setup tim e.
Param eter Optim isation• For exam ple, TOAW S & ATO changes result in 0.8 sec faster call setup tim e.
47/102 GS MS NPO Network Planning & Optimization Capability
RAN Parameter Testing Guide10/11/2022
Copyright 2007 Nokia Siemens Networks.All rights reserved.
Table 14 : NSN recommendation on MSC/VLR Authentication setting
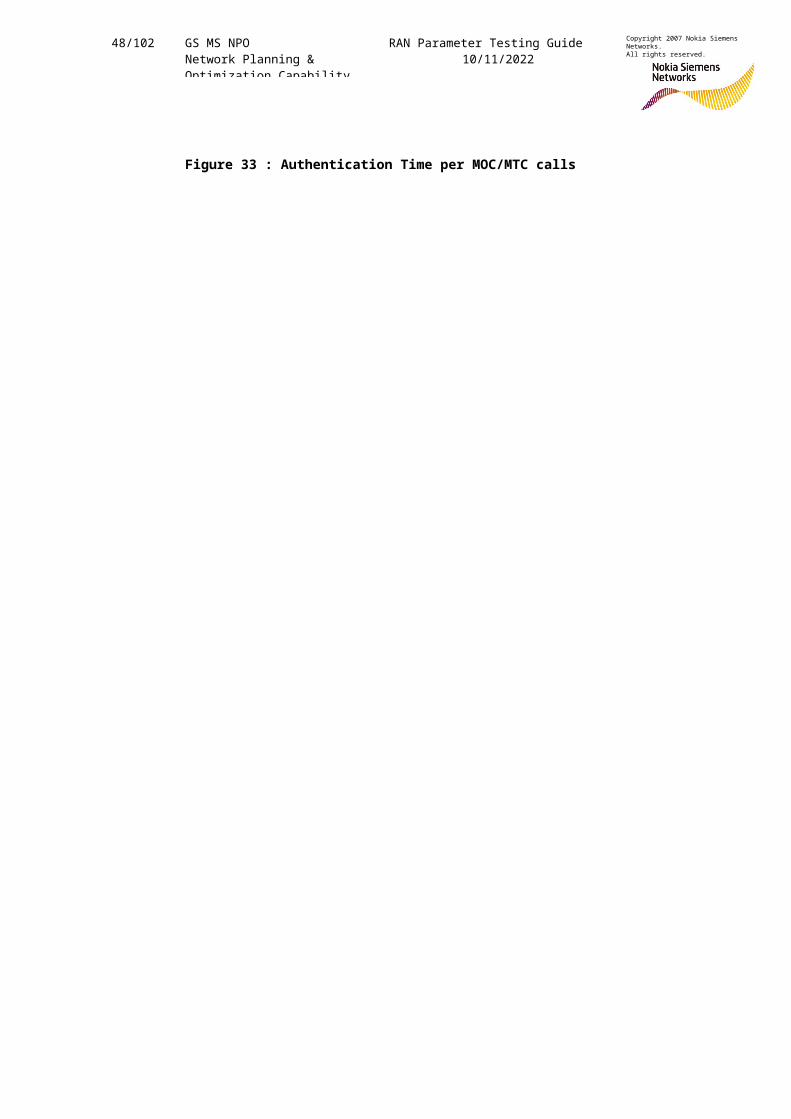
From ride test result, this has been observed that 450ms is needed forauthentication per MOC/MTC calls. So, total call setup time improvementexpected would be 900ms for mobile to mobile calls.
Tim e Tim e M essage nam e20/10/2006 9:52:07 9:52:06.848 AUTHENTICATIO N_REQ UEST20/10/2006 9:52:07 9:52:07.295 AUTHENTICATIO N_RESPO NSE 0:00:00.44720/10/2006 9:54:03 9:54:02.687 AUTHENTICATIO N_REQ UEST20/10/2006 9:54:03 9:54:03.177 AUTHENTICATIO N_RESPO NSE 0:00:00.49020/10/2006 9:55:58 9:55:58.059 AUTHENTICATIO N_REQ UEST20/10/2006 9:55:58 9:55:58.481 AUTHENTICATIO N_RESPO NSE 0:00:00.42220/10/2006 9:57:53 9:57:52.637 AUTHENTICATIO N_REQ UEST20/10/2006 9:57:53 9:57:53.092 AUTHENTICATIO N_RESPO NSE 0:00:00.45520/10/2006 9:59:48 9:59:48.090 AUTHENTICATIO N_REQ UEST20/10/2006 9:59:49 9:59:48.547 AUTHENTICATIO N_RESPO NSE 0:00:00.45720/10/2006 10:01:44 10:01:43.630 AUTHENTICATIO N_REQ UEST20/10/2006 10:01:44 10:01:43.997 AUTHENTICATIO N_RESPO NSE 0:00:00.36720/10/2006 10:03:41 10:03:41.391 AUTHENTICATIO N_REQ UEST20/10/2006 10:03:42 10:03:41.858 AUTHENTICATIO N_RESPO NSE 0:00:00.46720/10/2006 10:05:37 10:05:36.917 AUTHENTICATIO N_REQ UEST20/10/2006 10:05:37 10:05:37.384 AUTHENTICATIO N_RESPO NSE 0:00:00.46720/10/2006 10:07:32 10:07:32.287 AUTHENTICATIO N_REQ UEST20/10/2006 10:07:33 10:07:32.754 AUTHENTICATIO N_RESPO NSE 0:00:00.46720/10/2006 10:09:27 10:09:27.390 AUTHENTICATIO N_REQ UEST20/10/2006 10:09:28 10:09:27.858 AUTHENTICATIO N_RESPO NSE 0:00:00.46820/10/2006 10:11:58 10:11:58.337 AUTHENTICATIO N_REQ UEST20/10/2006 10:11:59 10:11:58.836 AUTHENTICATIO N_RESPO NSE 0:00:00.49920/10/2006 10:13:54 10:13:53.508 AUTHENTICATIO N_REQ UEST20/10/2006 10:13:54 10:13:53.913 AUTHENTICATIO N_RESPO NSE 0:00:00.405
Average 0:00:00.451
48/102 GS MS NPO Network Planning & Optimization Capability
RAN Parameter Testing Guide10/11/2022
Copyright 2007 Nokia Siemens Networks.All rights reserved.
Figure 33 : Authentication Time per MOC/MTC calls
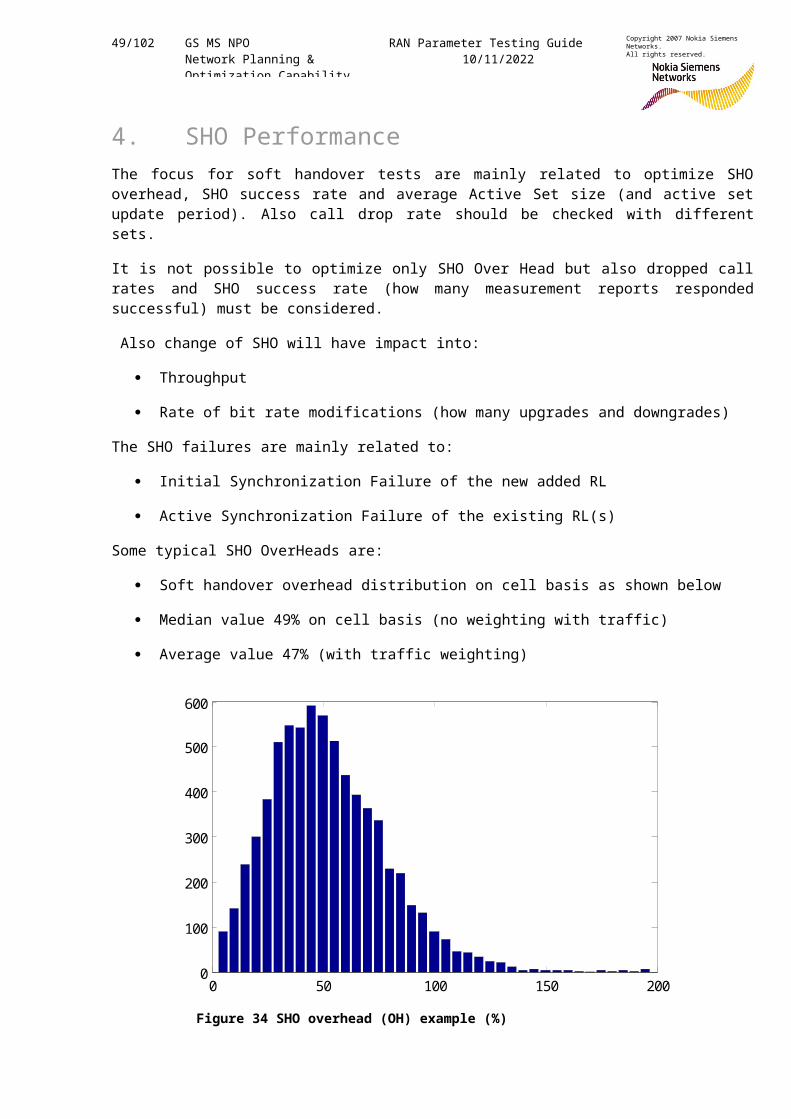
49/102 GS MS NPO Network Planning & Optimization Capability
RAN Parameter Testing Guide10/11/2022
Copyright 2007 Nokia Siemens Networks.All rights reserved.
4. SHO PerformanceThe focus for soft handover tests are mainly related to optimize SHOoverhead, SHO success rate and average Active Set size (and active setupdate period). Also call drop rate should be checked with differentsets.
It is not possible to optimize only SHO Over Head but also dropped callrates and SHO success rate (how many measurement reports respondedsuccessful) must be considered.
Also change of SHO will have impact into:
Throughput
Rate of bit rate modifications (how many upgrades and downgrades)
The SHO failures are mainly related to:
Initial Synchronization Failure of the new added RL
Active Synchronization Failure of the existing RL(s)
Some typical SHO OverHeads are:
Soft handover overhead distribution on cell basis as shown below
Median value 49% on cell basis (no weighting with traffic)
Average value 47% (with traffic weighting)
Figure 34 SHO overhead (OH) example (%)
0 50 100 150 2000
100
200
300
400
500
600
Soft handover overhead [% ]
50/102 GS MS NPO Network Planning & Optimization Capability
RAN Parameter Testing Guide10/11/2022
Copyright 2007 Nokia Siemens Networks.All rights reserved.
It should be noted that during RAB Assignment procedure (i.e. between RABAssignment Request and RAB Assignment Response) the SHO activation is notpossible -> measurement reports are rejected (e1a and e1c) or buffered(e1b); from UE logs point of view between CALL PROCEEDING and ALERTING.
This known restriction (parallel procedure not allowed) is not taken intoaccount by the counters i.e. all the Measurement Report repetitioncounters for SHO are updated as failures.
4.1 ParametersThe parameters related to SHO performance are listed below:
CPICH EcNo Filter Coefficient (EcNoFilterCoefficient)
In the CELL_DCH state the UE physical layer measurement period forintra frequency CPICH Ec/No measurements is 200 ms. The FilterCoefficient parameter controls the higher layer filtering ofphysical layer CPICH Ec/No measurements before the event evaluationand measurement reporting is performed by the UE.
Addition Window (AdditionWindow)
Addition Window determines the relative threshold (A_Win) used bythe UE to calculate the reporting range of event 1A.
Addition Time (AdditionTime)
When a monitored cell enters the reporting range (addition window),the cell must continuously stay within the reporting range for agiven period of time before the UE can send a Measurement Report tothe RNC in order to add the cell into the active set (event 1A).
Drop Window (Drop Window)
Drop Window determines the relative threshold (D_Win), which is usedby the UE to calculate the reporting range of event 1B.
Drop Time (DropTime)
When an active set cell leaves the reporting range (drop window),the cell must continuously stay outside the reporting range for agiven period of time before the UE can send a Measurement Report tothe RNC in order to remove the cell from the active set (event 1B).
Replacement Window (ReplacementWindow)
When the number of cells in the active set has reached the maximumspecified by the parameter MaxActiveSetSize and a monitored cell
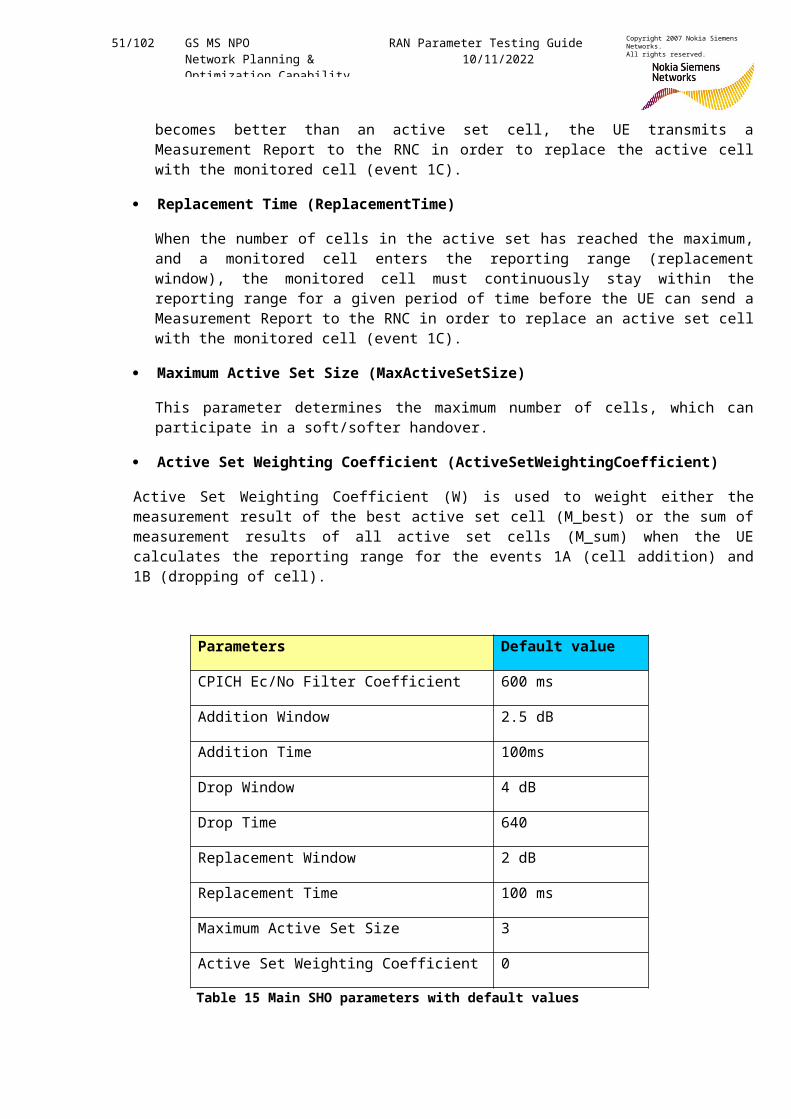
51/102 GS MS NPO Network Planning & Optimization Capability
RAN Parameter Testing Guide10/11/2022
Copyright 2007 Nokia Siemens Networks.All rights reserved.
becomes better than an active set cell, the UE transmits aMeasurement Report to the RNC in order to replace the active cellwith the monitored cell (event 1C).
Replacement Time (ReplacementTime)
When the number of cells in the active set has reached the maximum,and a monitored cell enters the reporting range (replacementwindow), the monitored cell must continuously stay within thereporting range for a given period of time before the UE can send aMeasurement Report to the RNC in order to replace an active set cellwith the monitored cell (event 1C).
Maximum Active Set Size (MaxActiveSetSize)
This parameter determines the maximum number of cells, which canparticipate in a soft/softer handover.
Active Set Weighting Coefficient (ActiveSetWeightingCoefficient)
Active Set Weighting Coefficient (W) is used to weight either themeasurement result of the best active set cell (M_best) or the sum ofmeasurement results of all active set cells (M_sum) when the UEcalculates the reporting range for the events 1A (cell addition) and1B (dropping of cell).
Parameters Default value
CPICH Ec/No Filter Coefficient 600 ms
Addition Window 2.5 dB
Addition Time 100ms
Drop Window 4 dB
Drop Time 640
Replacement Window 2 dB
Replacement Time 100 ms
Maximum Active Set Size 3
Active Set Weighting Coefficient 0
Table 15 Main SHO parameters with default values
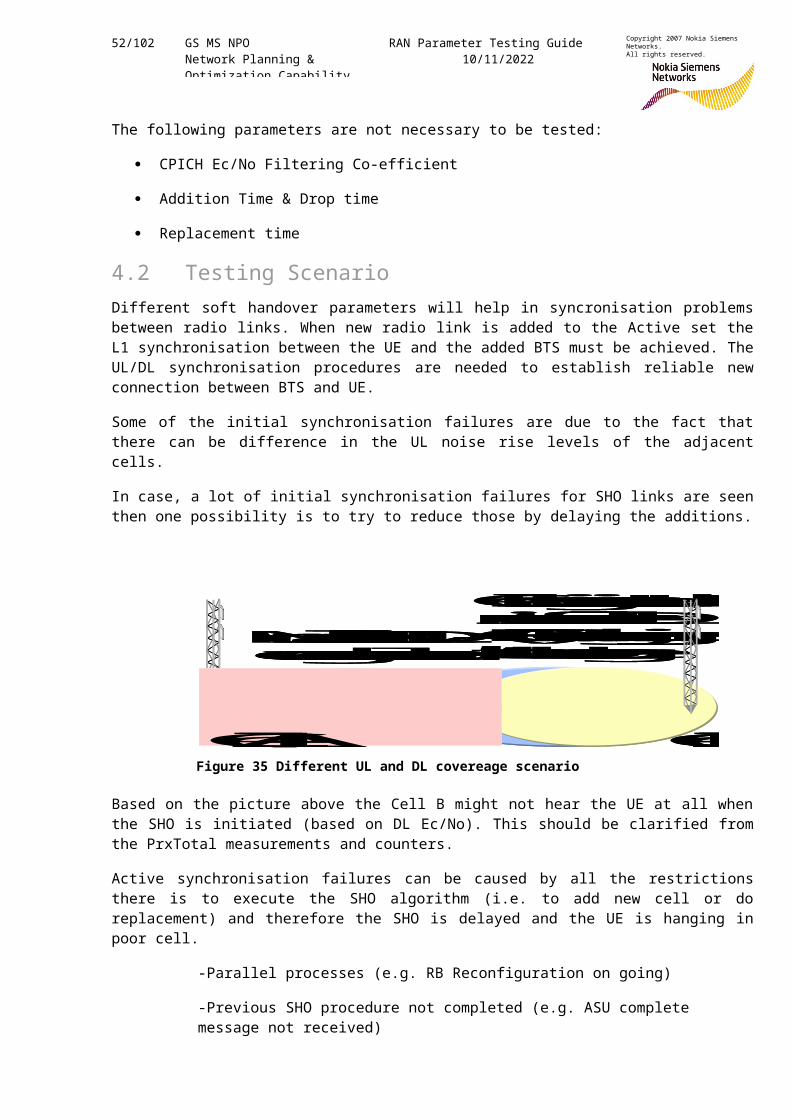
52/102 GS MS NPO Network Planning & Optimization Capability
RAN Parameter Testing Guide10/11/2022
Copyright 2007 Nokia Siemens Networks.All rights reserved.
The following parameters are not necessary to be tested:
CPICH Ec/No Filtering Co-efficient
Addition Time & Drop time
Replacement time
4.2 Testing ScenarioDifferent soft handover parameters will help in syncronisation problemsbetween radio links. When new radio link is added to the Active set theL1 synchronisation between the UE and the added BTS must be achieved. TheUL/DL synchronisation procedures are needed to establish reliable newconnection between BTS and UE.
Some of the initial synchronisation failures are due to the fact thatthere can be difference in the UL noise rise levels of the adjacentcells.
In case, a lot of initial synchronisation failures for SHO links are seenthen one possibility is to try to reduce those by delaying the additions.
Figure 35 Different UL and DL covereage scenario
Based on the picture above the Cell B might not hear the UE at all whenthe SHO is initiated (based on DL Ec/No). This should be clarified fromthe PrxTotal measurements and counters.
Active synchronisation failures can be caused by all the restrictionsthere is to execute the SHO algorithm (i.e. to add new cell or doreplacement) and therefore the SHO is delayed and the UE is hanging inpoor cell.
-Parallel processes (e.g. RB Reconfiguration on going)
-Previous SHO procedure not completed (e.g. ASU complete message not received)
Normal cell = UL & DL coverage are balanced
Cell having increased UL interference level = DL (CPICH) coverage bigger than UL coverage
Cell A Cell B
Normal cell = UL & DL coverage are balanced
Cell having increased UL interference level = DL (CPICH) coverage bigger than UL coverage
Cell A Cell B
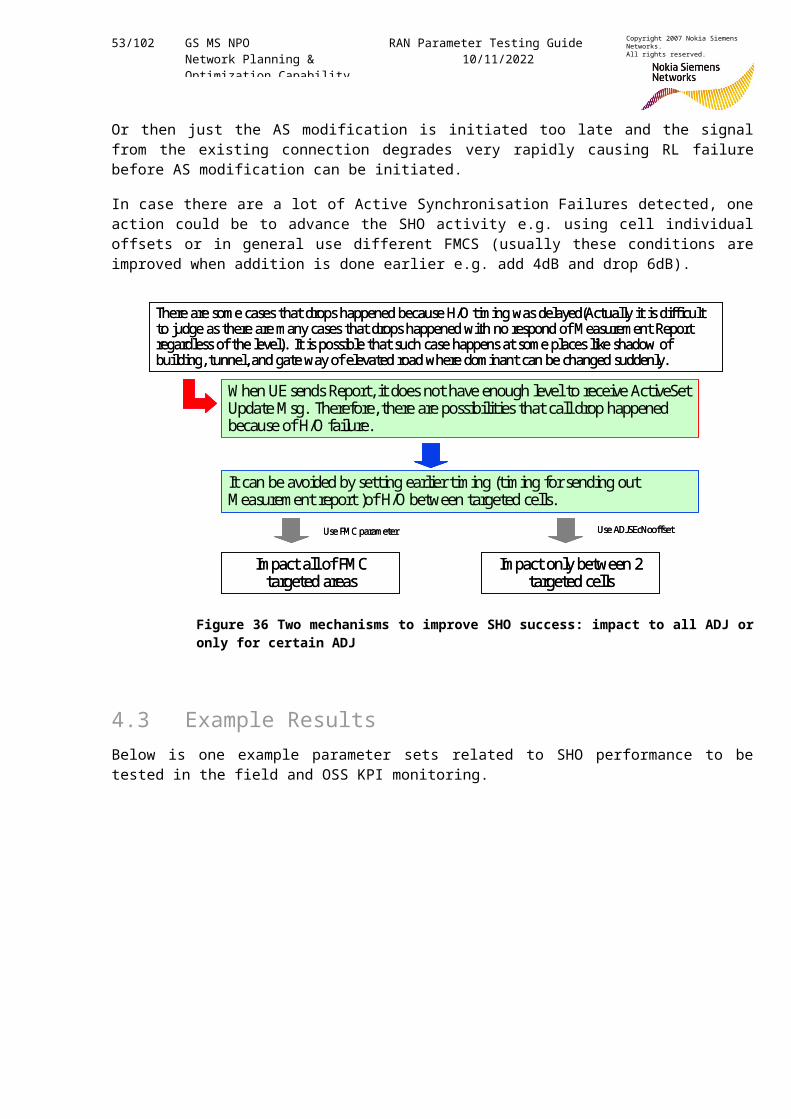
53/102 GS MS NPO Network Planning & Optimization Capability
RAN Parameter Testing Guide10/11/2022
Copyright 2007 Nokia Siemens Networks.All rights reserved.
Or then just the AS modification is initiated too late and the signalfrom the existing connection degrades very rapidly causing RL failurebefore AS modification can be initiated.
In case there are a lot of Active Synchronisation Failures detected, oneaction could be to advance the SHO activity e.g. using cell individualoffsets or in general use different FMCS (usually these conditions areimproved when addition is done earlier e.g. add 4dB and drop 6dB).
Figure 36 Two mechanisms to improve SHO success: impact to all ADJ oronly for certain ADJ
4.3 Example ResultsBelow is one example parameter sets related to SHO performance to betested in the field and OSS KPI monitoring.
There are some cases that drops happened because H/O timing was delayed(Actually it is difficult to judge as there are many cases that drops happened with no respond of M easurement Report regardless of the level). It is possible that such case happensat some places like shadow of building, tunnel, and gate way of elevated road where dominant can be changed suddenly.
W hen UE sends Report, it does not have enough level to receive ActiveSetUpdate M sg. Therefore, there are possibilities that call drop happened because of H/O failure.
It can be avoided by setting earlier timing (timing for sending out M easurement report )of H/O between targeted cells.
Use FM C parameter Use ADJSEcNooffset
Impact all of FM C targeted areas
Impact only between 2 targeted cells
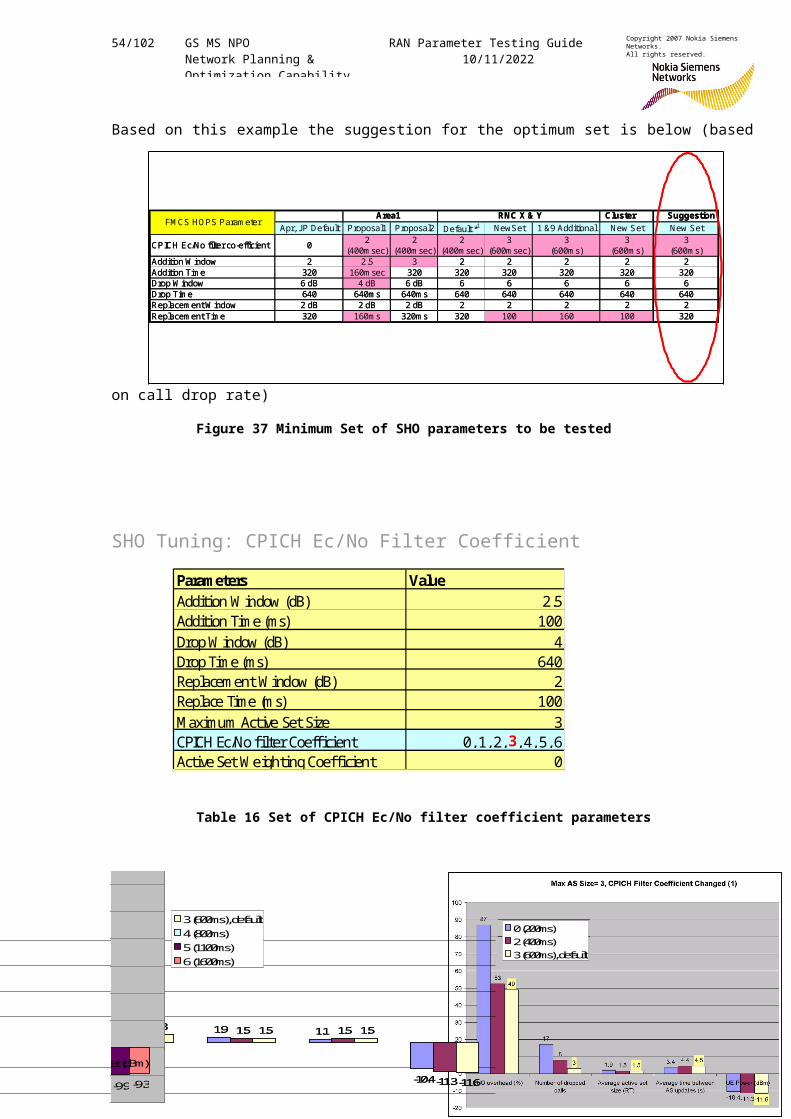
54/102 GS MS NPO Network Planning & Optimization Capability
RAN Parameter Testing Guide10/11/2022
Copyright 2007 Nokia Siemens Networks.All rights reserved.
Based on this example the suggestion for the optimum set is below (based
on call drop rate)
Figure 37 Minimum Set of SHO parameters to be tested
SHO Tuning: CPICH Ec/No Filter Coefficient
Table 16 Set of CPICH Ec/No filter coefficient parameters
Parameters ValueAddition W indow (dB) 2.5Addition Time (ms) 100Drop W indow (dB) 4Drop Time (ms) 640Replacement W indow (dB) 2Replace Time (ms) 100Maximum Active Set Size 3CPICH Ec/No filter Coefficient 0, 1, 2, 3, 4, 5, 6Active Set W eighting Coefficient 0Max AS Size= 3, CPICH Filter Coefficient Changed (1)
87
17
1.9 1.1
-10.4
53
81.5 1.5
-11.3
49
3 1.5 1.5
-11.6-20
-10
0
10
20
30
40
50
60
70
80
90
100
SHO overhead (%) Number of dropped calls Average active set size(RT)
Average time betweenAS updates (s)
UE Power (dBm)
0 (200ms)2 (400ms)3 (600ms), default
By comparing the results of different parameter sets, the default value3should be the optimal one---
highest SHO gain, good KPIs and proper SHO overhead.
-9.9-9.3-20
-10
0
10
20
30
40
50
60
70
80
90
100
SHO overhead (%) Number of dropped calls Average active set size(RT)
Average time betweenAS updates (s)
UE Power (dBm)
3 (600ms), default4 (800ms)5 (1100ms)6 (1600ms)
By comparing the results of different parameter sets, the default value3should be the optimal one---highest SHO gain, good KPIs and proper SHO overhead.
Max AS Size= 3, CPICH Filter Coefficient Changed (1)
87
17
1.9 1.1
-10.4
53
81.5 1.5
-11.3
49
3 1.5 1.5
-11.6-20
-10
0
10
20
30
40
50
60
70
80
90
100
SHO overhead (%) Number of dropped calls Average active set size(RT)
Average time betweenAS updates (s)
UE Power (dBm)
0 (200ms)2 (400ms)3 (600ms), default
By comparing the results of different parameter sets, the default value3should be the optimal one---
highest SHO gain, good KPIs and proper SHO overhead.
-9.9-9.3-20
-10
0
10
20
30
40
50
60
70
80
90
100
SHO overhead (%) Number of dropped calls Average active set size(RT)
Average time betweenAS updates (s)
UE Power (dBm)
3 (600ms), default4 (800ms)5 (1100ms)6 (1600ms)
By comparing the results of different parameter sets, the default value3should be the optimal one---highest SHO gain, good KPIs and proper SHO overhead.
Cluster SuggestionApr, JP Default Proposal1 Proposal2 Default *1 NewSet 1 &9 Additional New Set New Set
CPICH Ec/No filter co-efficient 0 2(400m sec)
2(400m sec)
2(400m sec)
3(600m sec)
3(600m s)
3(600m s)
3(600m s)
Addition W indow 2 2.5 3 2 2 2 2 2Addition Tim e 320 160m sec 320 320 320 320 320 320Drop W indow 6 dB 4 dB 6 dB 6 6 6 6 6Drop Tim e 640 640m s 640m s 640 640 640 640 640Replacem ent W indow 2 dB 2 dB 2 dB 2 2 2 2 2Replacem ent Tim e 320 160m s 320m s 320 100 160 100 320
FM CS HOPS Param eter Area1 RNC X & Y Cluster SuggestionApr, JP Default Proposal1 Proposal2 Default *1 NewSet 1 &9 Additional New Set New Set
CPICH Ec/No filter co-efficient 0 2(400m sec)
2(400m sec)
2(400m sec)
3(600m sec)
3(600m s)
3(600m s)
3(600m s)
Addition W indow 2 2.5 3 2 2 2 2 2Addition Tim e 320 160m sec 320 320 320 320 320 320Drop W indow 6 dB 4 dB 6 dB 6 6 6 6 6Drop Tim e 640 640m s 640m s 640 640 640 640 640Replacem ent W indow 2 dB 2 dB 2 dB 2 2 2 2 2Replacem ent Tim e 320 160m s 320m s 320 100 160 100 320
FM CS HOPS Param eter Area1 RNC X & Y
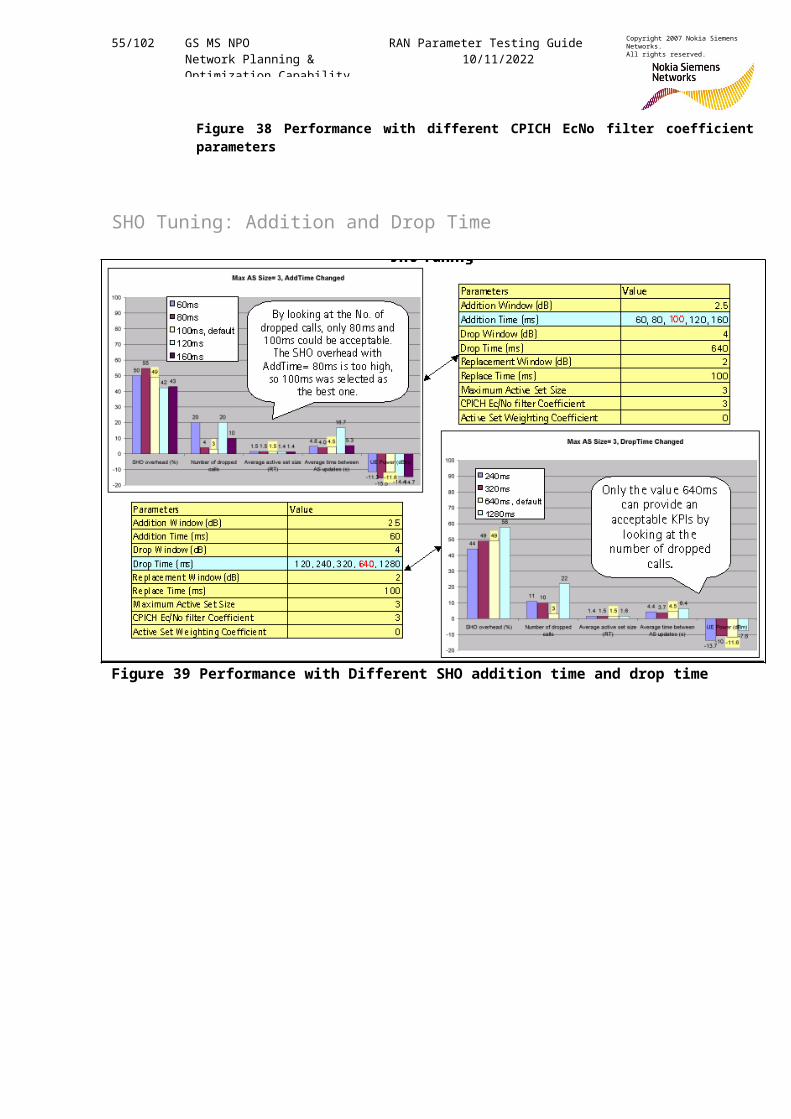
55/102 GS MS NPO Network Planning & Optimization Capability
RAN Parameter Testing Guide10/11/2022
Copyright 2007 Nokia Siemens Networks.All rights reserved.
Figure 38 Performance with different CPICH EcNo filter coefficientparameters
SHO Tuning: Addition and Drop Time
Figure 39 Performance with Different SHO addition time and drop time
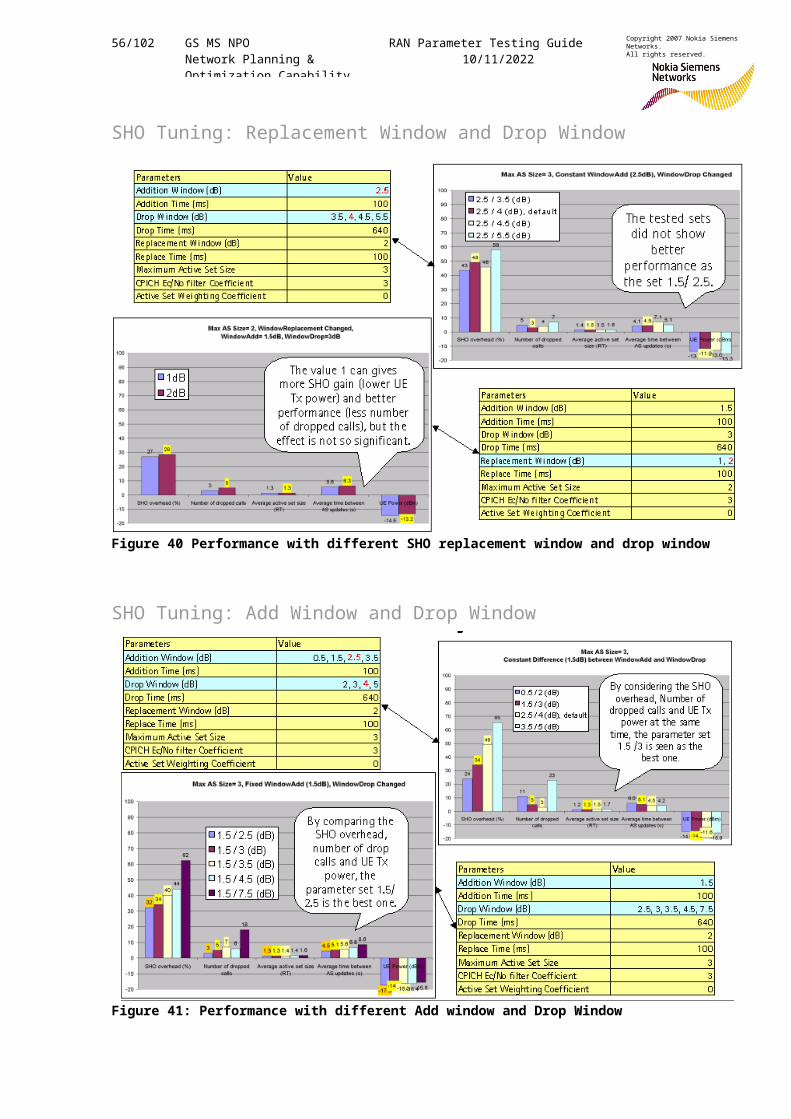
56/102 GS MS NPO Network Planning & Optimization Capability
RAN Parameter Testing Guide10/11/2022
Copyright 2007 Nokia Siemens Networks.All rights reserved.
SHO Tuning: Replacement Window and Drop Window
Figure 40 Performance with different SHO replacement window and drop window
SHO Tuning: Add Window and Drop Window
Figure 41: Performance with different Add window and Drop Window
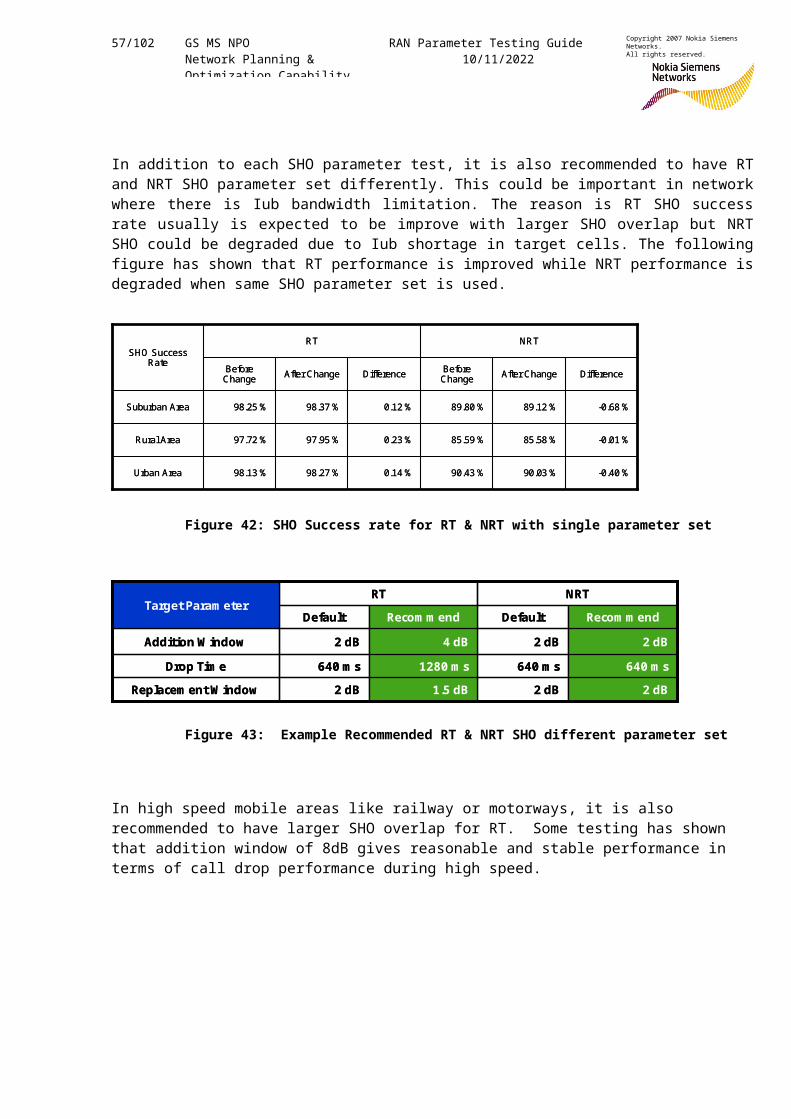
57/102 GS MS NPO Network Planning & Optimization Capability
RAN Parameter Testing Guide10/11/2022
Copyright 2007 Nokia Siemens Networks.All rights reserved.
In addition to each SHO parameter test, it is also recommended to have RTand NRT SHO parameter set differently. This could be important in networkwhere there is Iub bandwidth limitation. The reason is RT SHO successrate usually is expected to be improve with larger SHO overlap but NRTSHO could be degraded due to Iub shortage in target cells. The followingfigure has shown that RT performance is improved while NRT performance isdegraded when same SHO parameter set is used.
Figure 42: SHO Success rate for RT & NRT with single parameter set
Figure 43: Example Recommended RT & NRT SHO different parameter set
In high speed mobile areas like railway or motorways, it is also recommended to have larger SHO overlap for RT. Some testing has shown that addition window of 8dB gives reasonable and stable performance in terms of call drop performance during high speed.
-0.40 %
-0.01 %
-0.68 %
Difference
90.03 %
85.58 %
89.12 %
After Change
0.14 %
0.23 %
0.12 %
Difference
98.27 %
97.95 %
98.37 %
After Change Before Change
Before Change
90.43 %98.13 %Urban Area
85.59 %97.72 %Rural Area
89.80 %98.25 %Suburban Area
NRTRTSHO Success
Rate
-0.40 %
-0.01 %
-0.68 %
Difference
90.03 %
85.58 %
89.12 %
After Change
0.14 %
0.23 %
0.12 %
Difference
98.27 %
97.95 %
98.37 %
After Change Before Change
Before Change
90.43 %98.13 %Urban Area
85.59 %97.72 %Rural Area
89.80 %98.25 %Suburban Area
NRTRTSHO Success
Rate
Recom m endRecom m end DefaultDefault
2 dB640 m s
2 dB
1.5 dB1280 m s
4 dB
2 dB2 dBReplacem ent W indow640 m s640 m sDrop Tim e
2 dB2 dBAddition W indow
NRTRTTarget Param eter
Recom m endRecom m end DefaultDefault
2 dB640 m s
2 dB
1.5 dB1280 m s
4 dB
2 dB2 dBReplacem ent W indow640 m s640 m sDrop Tim e
2 dB2 dBAddition W indow
NRTRTTarget Param eter
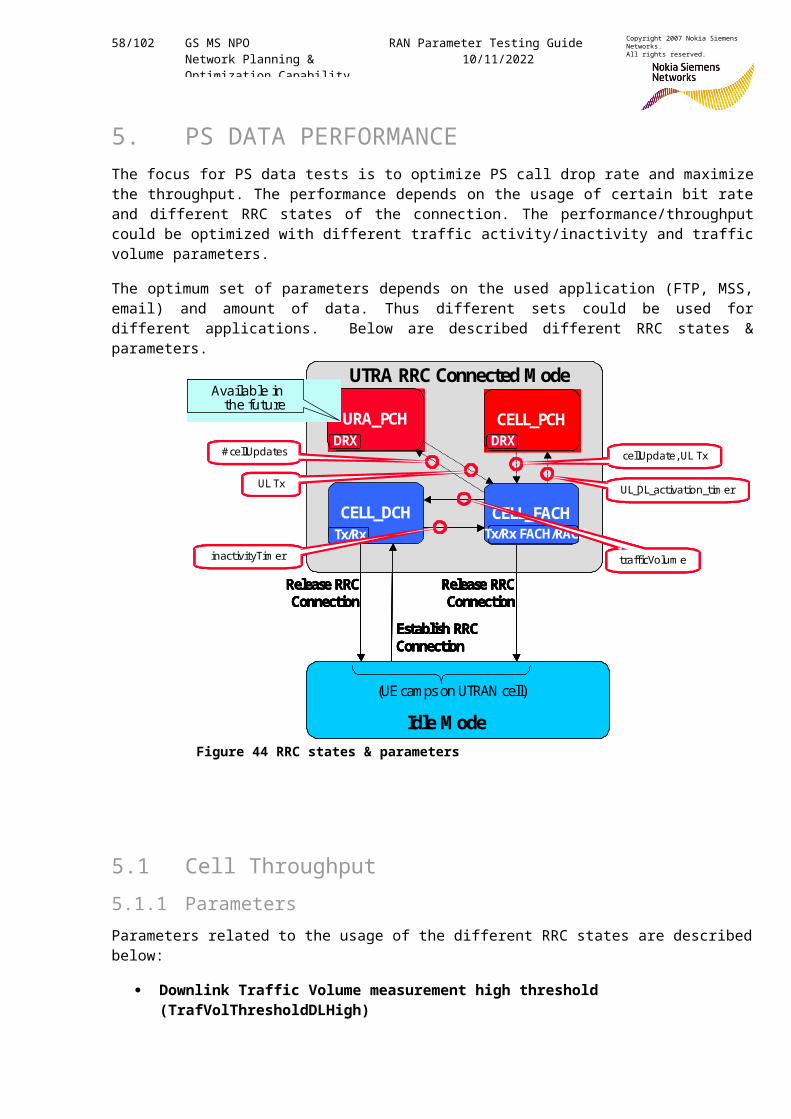
58/102 GS MS NPO Network Planning & Optimization Capability
RAN Parameter Testing Guide10/11/2022
Copyright 2007 Nokia Siemens Networks.All rights reserved.
5. PS DATA PERFORMANCEThe focus for PS data tests is to optimize PS call drop rate and maximizethe throughput. The performance depends on the usage of certain bit rateand different RRC states of the connection. The performance/throughputcould be optimized with different traffic activity/inactivity and trafficvolume parameters.
The optimum set of parameters depends on the used application (FTP, MSS,email) and amount of data. Thus different sets could be used fordifferent applications. Below are described different RRC states ¶meters.
Figure 44 RRC states & parameters
5.1 Cell Throughput5.1.1 ParametersParameters related to the usage of the different RRC states are describedbelow:
Downlink Traffic Volume measurement high threshold (TrafVolThresholdDLHigh)
Release RRCConnection
Release RRCConnection
URA_PCH
CELL_DCH CELL_FACH
CELL_PCH
Establish RRCConnection
UTRA RRC Connected M ode
Idle M ode(UE camps on UTRAN cell)
Available in RAN’04
cellUpdate, UL Tx
UL_DL_activation_tim er
#cellUpdates
UL Tx
DRX DRX
Tx/RxinactivityTim er
Tx/Rx FACH/RACHtrafficVolum e
Release RRCConnection
Release RRCConnection
URA_PCH
CELL_DCH CELL_FACH
CELL_PCH
Establish RRCConnection
UTRA RRC Connected M ode
Idle M ode(UE camps on UTRAN cell)
Available in the future
cellUpdate, UL Tx
UL_DL_activation_tim er
#cellUpdates
UL Tx
DRX DRX
Tx/RxinactivityTim er
Tx/Rx FACH/RACHtrafficVolum e
Release RRCConnection
Release RRCConnection
URA_PCH
CELL_DCH CELL_FACH
CELL_PCH
Establish RRCConnection
UTRA RRC Connected M ode
Idle M ode(UE camps on UTRAN cell)
Available in RAN’04
cellUpdate, UL Tx
UL_DL_activation_tim er
#cellUpdates
UL Tx
DRX DRX
Tx/RxinactivityTim er
Tx/Rx FACH/RACHtrafficVolum e
Release RRCConnection
Release RRCConnection
URA_PCH
CELL_DCH CELL_FACH
CELL_PCH
Establish RRCConnection
UTRA RRC Connected M ode
Idle M ode(UE camps on UTRAN cell)
Available in the future
cellUpdate, UL Tx
UL_DL_activation_tim er
#cellUpdates
UL Tx
DRX DRX
Tx/RxinactivityTim er
Tx/Rx FACH/RACHtrafficVolum e
59/102 GS MS NPO Network Planning & Optimization Capability
RAN Parameter Testing Guide10/11/2022
Copyright 2007 Nokia Siemens Networks.All rights reserved.
This parameter defines the threshold of data in the RLC buffer ofRB in bytes which triggers downlink traffic volume measurementreport (capacity request) on MAC, when UE is in a Cell_DCH stateand the initial bit rate DCH is allocated for the radio bearer
Uplink Traffic Volume measurement low threshold (TrafVolThresholdULLow)
This parameter defines, in bytes, the threshold of data in the RLCbuffers of SRB0, SRB1, SRB2, SRB3, SRB4 and all NRT RBs thattriggers the uplink traffic volume measurement report, when the UEis in Cell_FACH state.
Uplink traffic volume measurement time to trigger (TrafVolTimeToTriggerUL)
This parameter defines in ms, the period of time between the time ofevent detection and the time of sending a traffic volume measurementreport.
Uplink traffic volume measurement pending time after trigger (TrafVolPendingTimeUL)
This parameter indicates the period of time, in seconds, duringwhich it is forbidden to send any new traffic volume measurementreports with the same measurement ID, even if the triggeringcondition is fulfilled again.
UL/DL Activation Timer
This timer is used on MAC -c to detect idle periods on datatransmission (NRT RBs and SRBs) for the UE, which is in Cell_FACHstate. Based on this timer the MAC -c shall give the No_Dataindication to the RRC, which further can change the state of the RRCfrom Cell_FACH state to the Cell_PCH state (or URA_PCH state).
InactivityTimerDownlinkDCHxxx (xxx= 8, 16,32,64,128,256,384 kbits/s)
The time indicating how long the radio and transmission resources are reserved after silence detection on downlink DCH before release procedures.
The Cell_PCH to Idle mode state transitions can be controlled by two parameters:
MSActivitySupervision timer
And periodical cell update timer T305
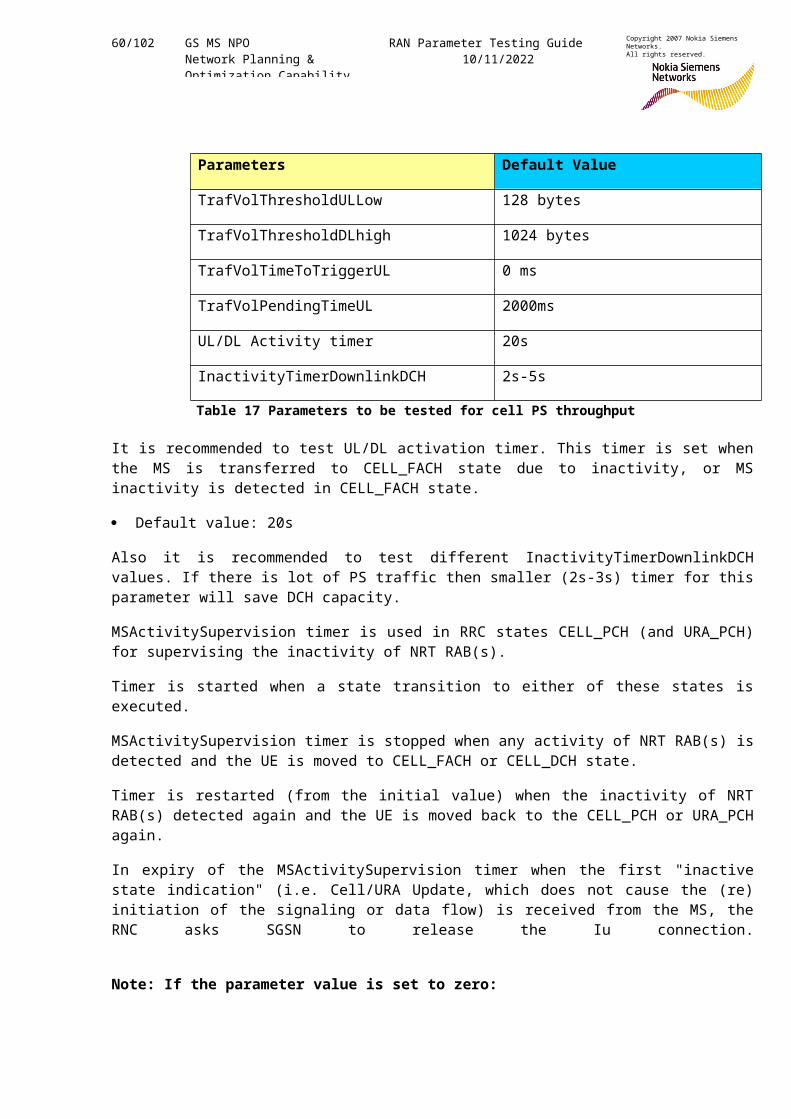
60/102 GS MS NPO Network Planning & Optimization Capability
RAN Parameter Testing Guide10/11/2022
Copyright 2007 Nokia Siemens Networks.All rights reserved.
Parameters Default Value
TrafVolThresholdULLow 128 bytes
TrafVolThresholdDLhigh 1024 bytes
TrafVolTimeToTriggerUL 0 ms
TrafVolPendingTimeUL 2000ms
UL/DL Activity timer 20s
InactivityTimerDownlinkDCH 2s-5s
Table 17 Parameters to be tested for cell PS throughput
It is recommended to test UL/DL activation timer. This timer is set whenthe MS is transferred to CELL_FACH state due to inactivity, or MSinactivity is detected in CELL_FACH state.
Default value: 20s
Also it is recommended to test different InactivityTimerDownlinkDCHvalues. If there is lot of PS traffic then smaller (2s-3s) timer for thisparameter will save DCH capacity.
MSActivitySupervision timer is used in RRC states CELL_PCH (and URA_PCH)for supervising the inactivity of NRT RAB(s).
Timer is started when a state transition to either of these states isexecuted.
MSActivitySupervision timer is stopped when any activity of NRT RAB(s) isdetected and the UE is moved to CELL_FACH or CELL_DCH state.
Timer is restarted (from the initial value) when the inactivity of NRTRAB(s) detected again and the UE is moved back to the CELL_PCH or URA_PCHagain.
In expiry of the MSActivitySupervision timer when the first "inactivestate indication" (i.e. Cell/URA Update, which does not cause the (re)initiation of the signaling or data flow) is received from the MS, theRNC asks SGSN to release the Iu connection.
Note: If the parameter value is set to zero:
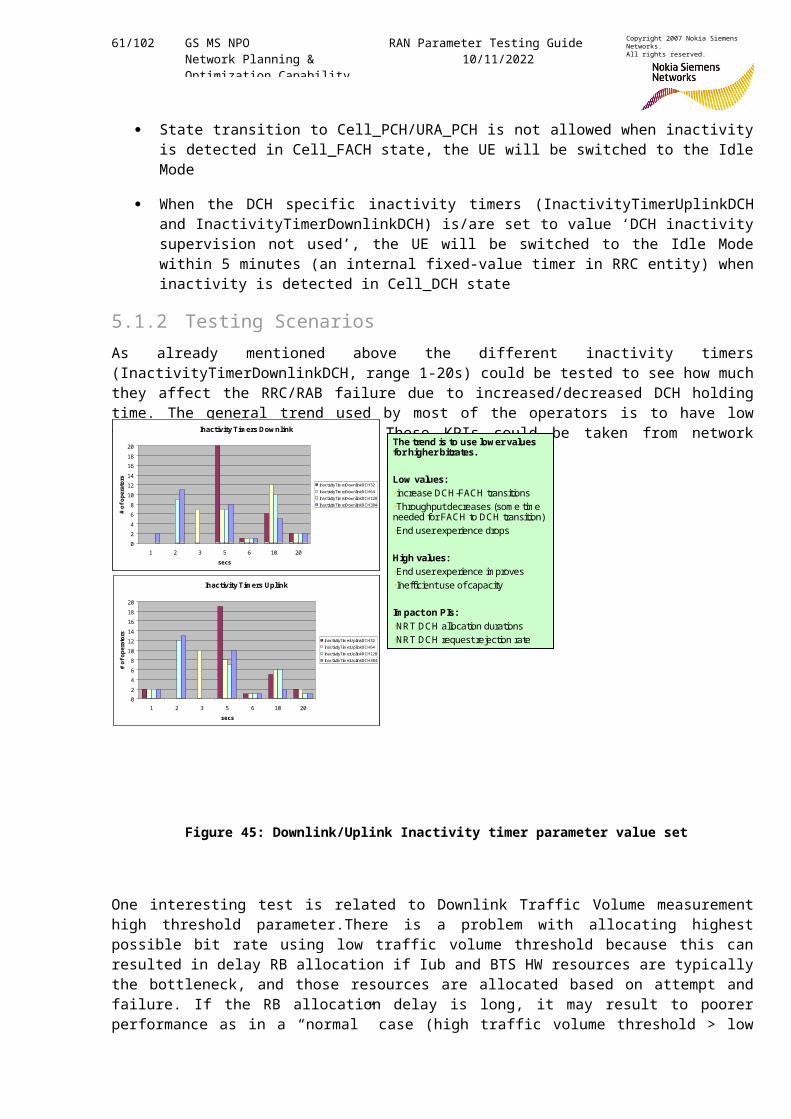
61/102 GS MS NPO Network Planning & Optimization Capability
RAN Parameter Testing Guide10/11/2022
Copyright 2007 Nokia Siemens Networks.All rights reserved.
State transition to Cell_PCH/URA_PCH is not allowed when inactivityis detected in Cell_FACH state, the UE will be switched to the IdleMode
When the DCH specific inactivity timers (InactivityTimerUplinkDCHand InactivityTimerDownlinkDCH) is/are set to value ‘DCH inactivitysupervision not used’, the UE will be switched to the Idle Modewithin 5 minutes (an internal fixed-value timer in RRC entity) wheninactivity is detected in Cell_DCH state
5.1.2 Testing ScenariosAs already mentioned above the different inactivity timers(InactivityTimerDownlinkDCH, range 1-20s) could be tested to see how muchthey affect the RRC/RAB failure due to increased/decreased DCH holdingtime. The general trend used by most of the operators is to have lowvalue for higher bit rates. These KPIs could be taken from networkstatistics.
Figure 45: Downlink/Uplink Inactivity timer parameter value set
One interesting test is related to Downlink Traffic Volume measurementhigh threshold parameter.There is a problem with allocating highestpossible bit rate using low traffic volume threshold because this canresulted in delay RB allocation if Iub and BTS HW resources are typicallythe bottleneck, and those resources are allocated based on attempt andfailure. If the RB allocation delay is long, it may result to poorerperformance as in a “normal” case (high traffic volume threshold > low
Inactivity Tim ers Dow nlink
02468101214161820
1 2 3 5 6 10 20secs
# of operators
InactivityTim erDownlinkDCH32InactivityTim erDownlinkDCH64InactivityTim erDownlinkDCH128InactivityTim erDownlinkDCH384
Inactivity Tim ers Uplink
02468101214161820
1 2 3 5 6 10 20secs
# of operators
InactivityTim erUplinkDCH32InactivityTim erUplinkDCH64InactivityTim erUplinkDCH128InactivityTim erUplinkDCH384
The trend is to use low er values for higher bitrates.
Low values:•increase DCH-FACH transitions•Throughput decreases (som e tim e needed for FACH to DCH transition)•End user experience drops
High values:•End user experience im proves•Inefficient use of capacity
Im pact on PIs:•NRT DCH allocation durations•NRT DCH request rejection rate
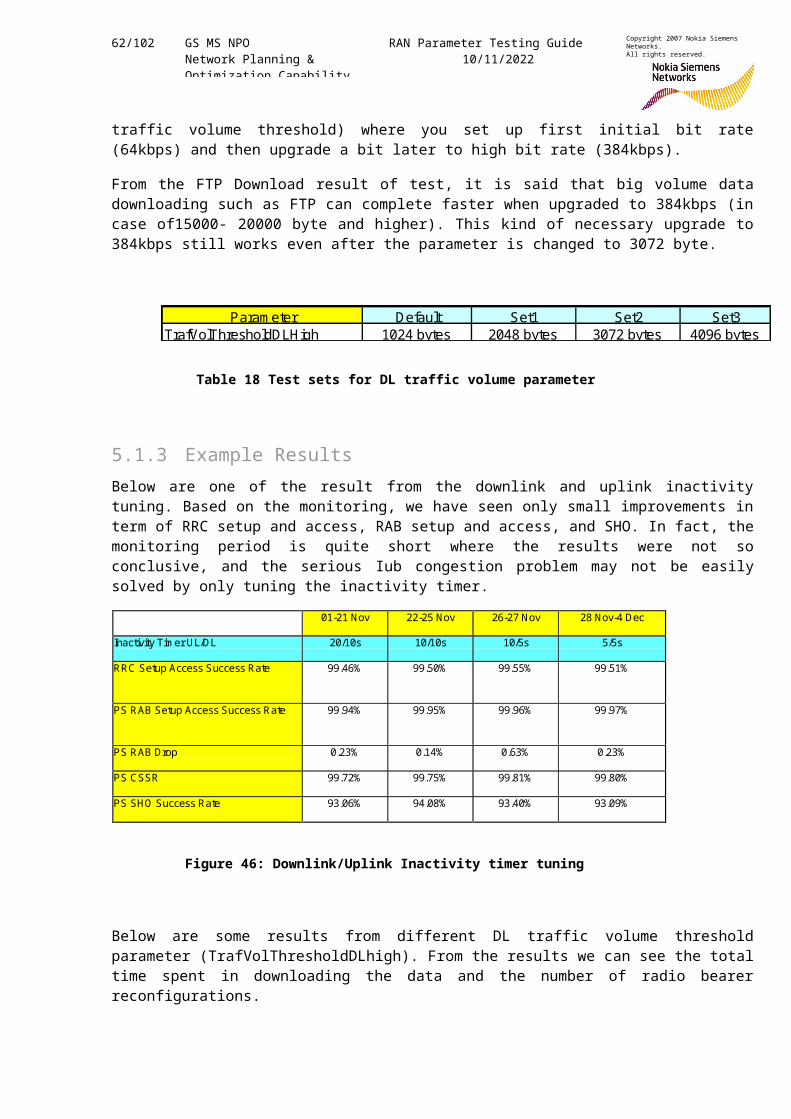
62/102 GS MS NPO Network Planning & Optimization Capability
RAN Parameter Testing Guide10/11/2022
Copyright 2007 Nokia Siemens Networks.All rights reserved.
traffic volume threshold) where you set up first initial bit rate(64kbps) and then upgrade a bit later to high bit rate (384kbps).
From the FTP Download result of test, it is said that big volume datadownloading such as FTP can complete faster when upgraded to 384kbps (incase of15000- 20000 byte and higher). This kind of necessary upgrade to384kbps still works even after the parameter is changed to 3072 byte.
Table 18 Test sets for DL traffic volume parameter
5.1.3 Example ResultsBelow are one of the result from the downlink and uplink inactivitytuning. Based on the monitoring, we have seen only small improvements interm of RRC setup and access, RAB setup and access, and SHO. In fact, themonitoring period is quite short where the results were not soconclusive, and the serious Iub congestion problem may not be easilysolved by only tuning the inactivity timer.
01-21 Nov 22-25 Nov 26-27 Nov 28 Nov-4 Dec
Inactivity Tim er UL/DL 20/10s 10/10s 10/5s 5/5s
RRC Setup Access Success Rate 99.46% 99.50% 99.55% 99.51%
PS RAB Setup Access Success Rate 99.94% 99.95% 99.96% 99.97%
PS RAB Drop 0.23% 0.14% 0.63% 0.23%
PS CSSR 99.72% 99.75% 99.81% 99.80%
PS SHO Success Rate 93.06% 94.08% 93.40% 93.09%
Figure 46: Downlink/Uplink Inactivity timer tuning
Below are some results from different DL traffic volume thresholdparameter (TrafVolThresholdDLhigh). From the results we can see the totaltime spent in downloading the data and the number of radio bearerreconfigurations.
Param eter Default Set1 Set2 Set3TrafVolThresholdDLHigh 1024 bytes 2048 bytes 3072 bytes 4096 bytes
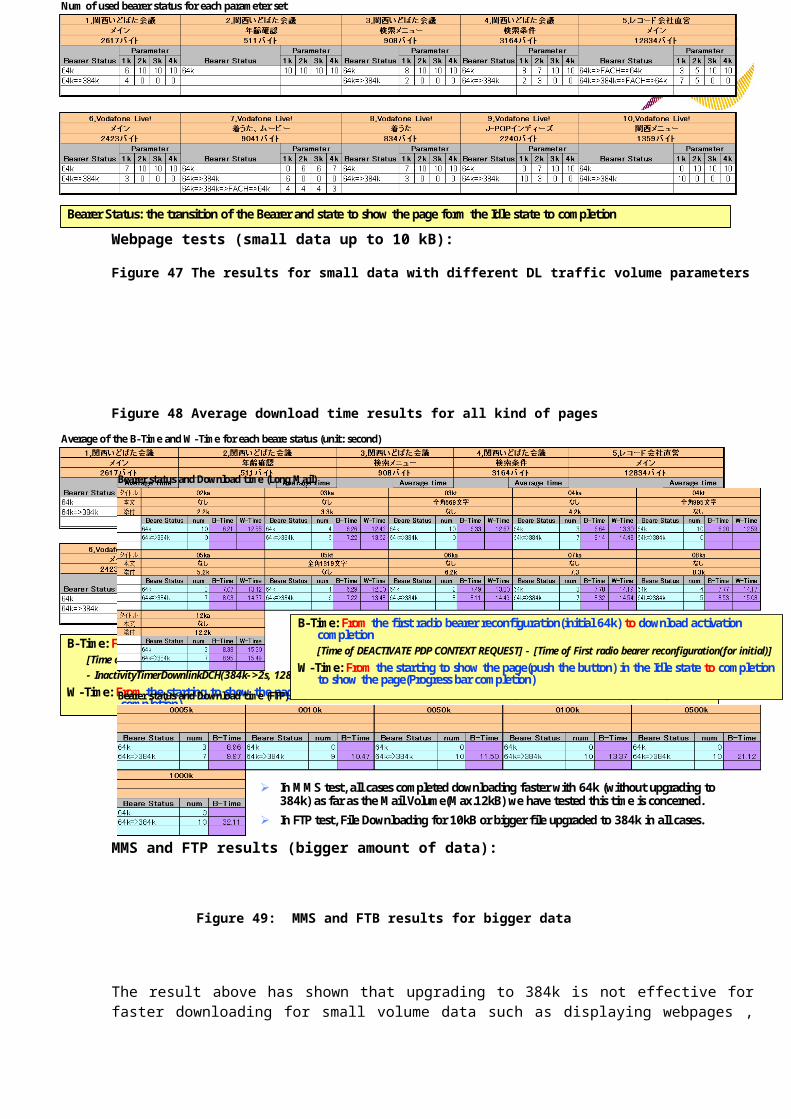
63/102 GS MS NPO Network Planning & Optimization Capability
RAN Parameter Testing Guide10/11/2022
Copyright 2007 Nokia Siemens Networks.All rights reserved.
Webpage tests (small data up to 10 kB):
Figure 47 The results for small data with different DL traffic volume parameters
Figure 48 Average download time results for all kind of pages
MMS and FTP results (bigger amount of data):
Figure 49: MMS and FTB results for bigger data
The result above has shown that upgrading to 384k is not effective forfaster downloading for small volume data such as displaying webpages ,
Average of the B-Time and W -Time for each bearestatus (unit: second)
B-Time: From the first radio bearer reconfiguration(initial 64k) to download activation completion[Time of radio bearer reconfiguration(for cell- FACH) after download completion] - [Time of First radio bearer reconfiguration(for initial)]- InactivityTimerDownlinkDCH(384k- >2s, 128k- >2s, 64k->3s)
W -Time: From the starting to show the page(push the button) in the Idle stateto completion to show the page(Progress bar completion)
Num of used bearer status for each parameter set
Bearer Status: the transition of the Bearer and state to show the page form the Idle state to completion
Bearer status and Download time (Long M ail)
Bearer status and Download time (FTP)
B-Time: From the first radio bearer reconfiguration(initial 64k) to download activation completion[Time of DEACTIVATE PDP CONTEXT REQUEST] - [Time of First radio bearer reconfiguration(for initial)]
W -Time: From the starting to show the page(push the button) in the Idle stateto completion to show the page(Progress bar completion)
In M M S test, all cases completed downloading faster with 64k (without upgrading to 384k) as far as the M ail Volume(M ax.12kB) we have tested this time is concerned.
In FTP test, File Downloading for 10kB or bigger file upgraded to 384k in all cases.
64/102 GS MS NPO Network Planning & Optimization Capability
RAN Parameter Testing Guide10/11/2022
Copyright 2007 Nokia Siemens Networks.All rights reserved.
MMS(Volume differs depending on attached files). Keeping 64k withoutupgrading can complete downloading faster instead.
Also from the FTP Download result, it is said that big volume datadownloading such as FTP can complete faster when upgraded to 384kbps(incase of15000- 20000 byte and higher).
From OSS statisctics , bearer ratio for PS 384kbps reduced by half from 29% to 15% after TrafVolThresholdDLHigh change to 3072 byte. Judging fromthe results above, we consider that the amount of 384kbps reduced this time was for low Volume Users, which means efficiency of Download time and Capacity greatly improved.
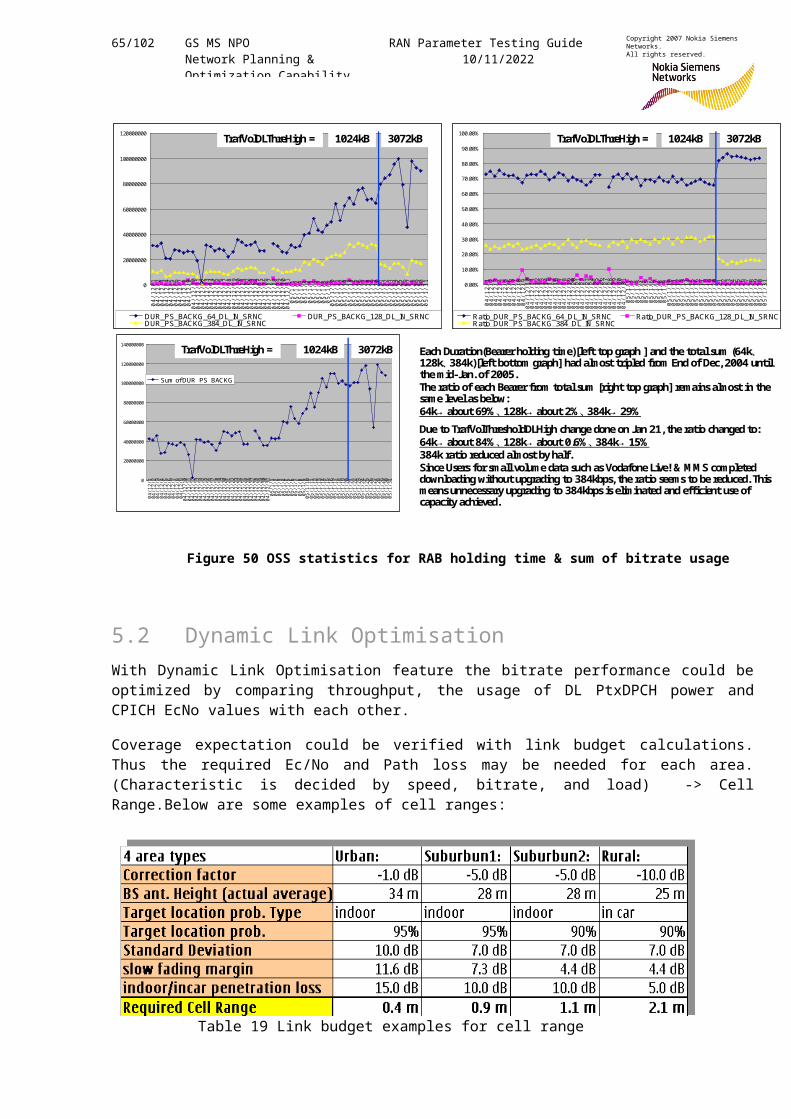
65/102 GS MS NPO Network Planning & Optimization Capability
RAN Parameter Testing Guide10/11/2022
Copyright 2007 Nokia Siemens Networks.All rights reserved.
Figure 50 OSS statistics for RAB holding time & sum of bitrate usage
5.2 Dynamic Link OptimisationWith Dynamic Link Optimisation feature the bitrate performance could beoptimized by comparing throughput, the usage of DL PtxDPCH power andCPICH EcNo values with each other.
Coverage expectation could be verified with link budget calculations.Thus the required Ec/No and Path loss may be needed for each area.(Characteristic is decided by speed, bitrate, and load) -> CellRange.Below are some examples of cell ranges:
Table 19 Link budget examples for cell range
0.00%
10.00%
20.00%
30.00%
40.00%
50.00%
60.00%
70.00%
80.00%
90.00%
100.00%
04/1
2/1
04/1
2/2
04/1
2/3
04/1
2/4
04/1
2/5
04/1
2/6
04/1
2/7
04/1
2/8
04/1
2/9
04/1
2/10
04/1
2/11
04/1
2/12
04/1
2/13
04/1
2/14
04/1
2/15
04/1
2/16
04/1
2/17
04/1
2/18
04/1
2/19
04/1
2/20
04/1
2/21
04/1
2/22
04/1
2/23
04/1
2/24
04/1
2/25
04/1
2/26
04/1
2/27
04/1
2/28
04/1
2/29
04/1
2/30
04/1
2/31
05/1
/105
/1/2
05/1
/305
/1/4
05/1
/505
/1/6
05/1
/705
/1/8
05/1
/905
/1/1
005
/1/1
105
/1/1
205
/1/1
305
/1/1
405
/1/1
505
/1/1
605
/1/1
705
/1/1
805
/1/1
905
/1/2
005
/1/2
105
/1/2
205
/1/2
305
/1/2
405
/1/2
505
/1/2
605
/1/2
705
/1/2
805
/1/2
905
/1/3
005
/1/3
1
Ratio_DUR_PS_BACKG_64_DL_IN_SRNC Ratio_DUR_PS_BACKG_128_DL_IN_SRNCRatio_DUR_PS_BACKG_384_DL_IN_SRNC
0
20000000
40000000
60000000
80000000
100000000
120000000
04/1
2/1
04/1
2/2
04/1
2/3
04/1
2/4
04/1
2/5
04/1
2/6
04/1
2/7
04/1
2/8
04/1
2/9
04/1
2/10
04/1
2/11
04/1
2/12
04/1
2/13
04/1
2/14
04/1
2/15
04/1
2/16
04/1
2/17
04/1
2/18
04/1
2/19
04/1
2/20
04/1
2/21
04/1
2/22
04/1
2/23
04/1
2/24
04/1
2/25
04/1
2/26
04/1
2/27
04/1
2/28
04/1
2/29
04/1
2/30
04/1
2/31
05/1
/105
/1/2
05/1
/305
/1/4
05/1
/505
/1/6
05/1
/705
/1/8
05/1
/905
/1/1
005
/1/1
105
/1/1
205
/1/1
305
/1/1
405
/1/1
505
/1/1
605
/1/1
705
/1/1
805
/1/1
905
/1/2
005
/1/2
105
/1/2
205
/1/2
305
/1/2
405
/1/2
505
/1/2
605
/1/2
705
/1/2
805
/1/2
905
/1/3
005
/1/3
1
DUR_PS_BACKG_64_DL_IN_SRNC DUR_PS_BACKG_128_DL_IN_SRNCDUR_PS_BACKG_384_DL_IN_SRNC
0
20000000
40000000
60000000
80000000
100000000
120000000
140000000
04/1
2/1
04/1
2/2
04/1
2/3
04/1
2/4
04/1
2/5
04/1
2/6
04/1
2/7
04/1
2/8
04/1
2/9
04/1
2/10
04/1
2/11
04/1
2/12
04/1
2/13
04/1
2/14
04/1
2/15
04/1
2/16
04/1
2/17
04/1
2/18
04/1
2/19
04/1
2/20
04/1
2/21
04/1
2/22
04/1
2/23
04/1
2/24
04/1
2/25
04/1
2/26
04/1
2/27
04/1
2/28
04/1
2/29
04/1
2/30
04/1
2/31
05/1
/105
/1/2
05/1
/305
/1/4
05/1
/505
/1/6
05/1
/705
/1/8
05/1
/905
/1/1
005
/1/1
105
/1/1
205
/1/1
305
/1/1
405
/1/1
505
/1/1
605
/1/1
705
/1/1
805
/1/1
905
/1/2
005
/1/2
105
/1/2
205
/1/2
305
/1/2
405
/1/2
505
/1/2
605
/1/2
705
/1/2
805
/1/2
905
/1/3
005
/1/3
1Sum of DUR_PS_BACKG
Each Duration(Bearer holding time)[left top graph ] and the total sum (64k、128k、384k)[left bottom graph] had almost tripled from End of Dec, 2004 until the mid-Jan. of 2005. The ratio of each Bearer from total sum [right top graph] remains almost in the same level as below:64k→ about 69%、128k→ about 2%、384k→ 29%Due to TrafVolThresholdDLHigh change done on Jan 21, the ratio changed to:64k→ about 84%、128k→ about 0.6%、384k→ 15%384k ratio reduced almost by half. Since Users for small volume data such as Vodafone Live! & M M S completed downloading without upgrading to 384kbps, the ratio seems to be reduced. This means unnecessary upgrading to 384kbps is eliminated and efficient use of capacity achieved.
1024kB 3072kBTrafVolDLThreHigh = 1024kB 3072kBTrafVolDLThreHigh =
1024kB 3072kBTrafVolDLThreHigh =
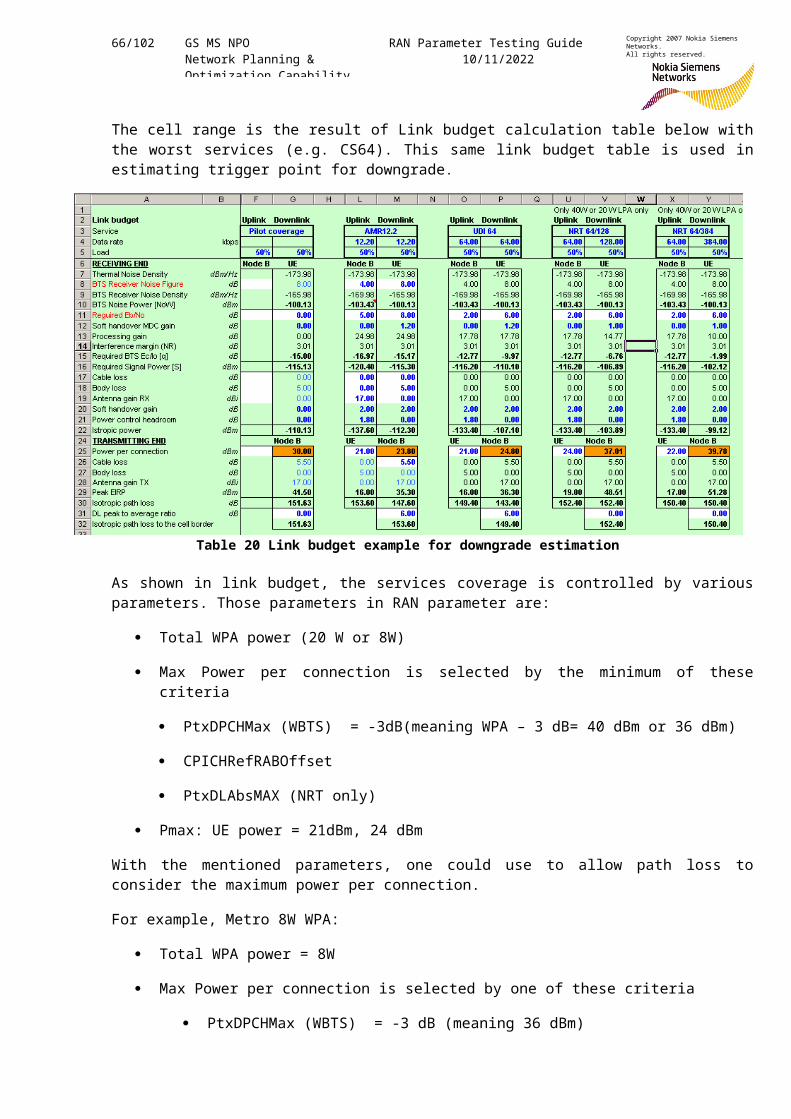
66/102 GS MS NPO Network Planning & Optimization Capability
RAN Parameter Testing Guide10/11/2022
Copyright 2007 Nokia Siemens Networks.All rights reserved.
The cell range is the result of Link budget calculation table below withthe worst services (e.g. CS64). This same link budget table is used inestimating trigger point for downgrade.
Table 20 Link budget example for downgrade estimation
As shown in link budget, the services coverage is controlled by variousparameters. Those parameters in RAN parameter are:
Total WPA power (20 W or 8W)
Max Power per connection is selected by the minimum of thesecriteria
PtxDPCHMax (WBTS) = -3dB(meaning WPA – 3 dB= 40 dBm or 36 dBm)
CPICHRefRABOffset
PtxDLAbsMAX (NRT only)
Pmax: UE power = 21dBm, 24 dBm
With the mentioned parameters, one could use to allow path loss toconsider the maximum power per connection.
For example, Metro 8W WPA:
Total WPA power = 8W
Max Power per connection is selected by one of these criteria
PtxDPCHMax (WBTS) = -3 dB (meaning 36 dBm)
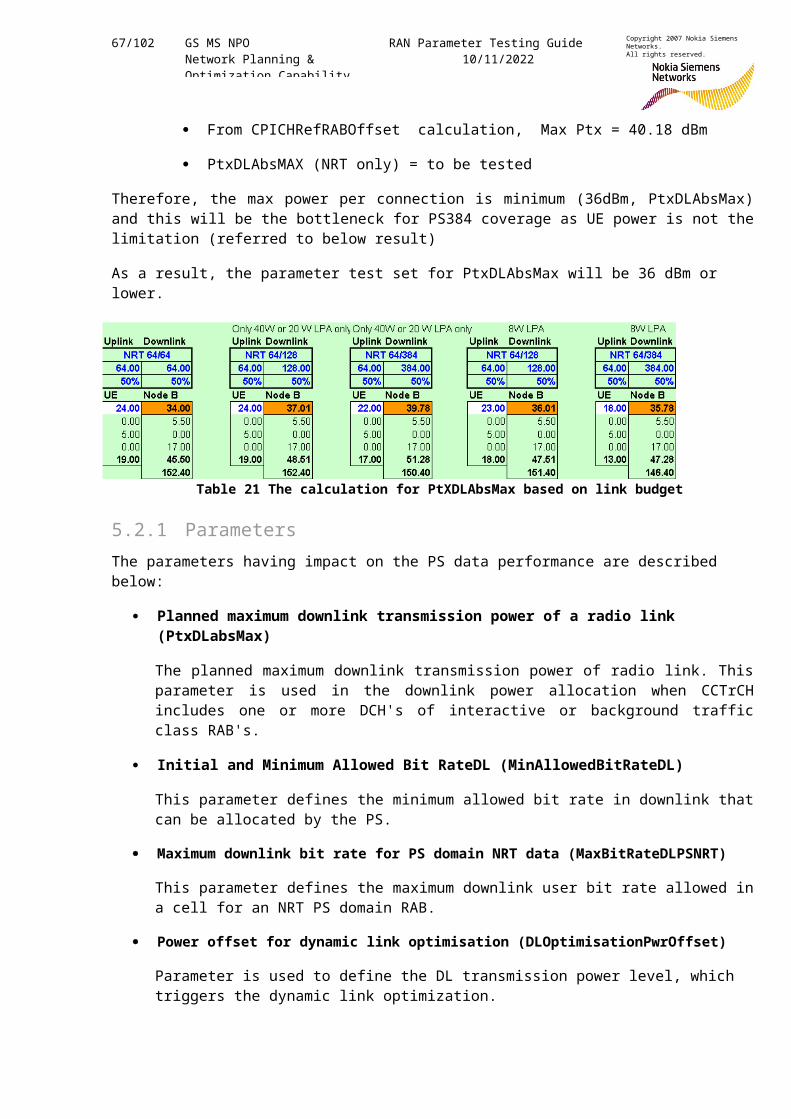
67/102 GS MS NPO Network Planning & Optimization Capability
RAN Parameter Testing Guide10/11/2022
Copyright 2007 Nokia Siemens Networks.All rights reserved.
From CPICHRefRABOffset calculation, Max Ptx = 40.18 dBm
PtxDLAbsMAX (NRT only) = to be tested
Therefore, the max power per connection is minimum (36dBm, PtxDLAbsMax)and this will be the bottleneck for PS384 coverage as UE power is not thelimitation (referred to below result)
As a result, the parameter test set for PtxDLAbsMax will be 36 dBm or lower.
Table 21 The calculation for PtXDLAbsMax based on link budget
5.2.1 ParametersThe parameters having impact on the PS data performance are described below:
Planned maximum downlink transmission power of a radio link (PtxDLabsMax)
The planned maximum downlink transmission power of radio link. Thisparameter is used in the downlink power allocation when CCTrCHincludes one or more DCH's of interactive or background trafficclass RAB's.
Initial and Minimum Allowed Bit RateDL (MinAllowedBitRateDL)
This parameter defines the minimum allowed bit rate in downlink thatcan be allocated by the PS.
Maximum downlink bit rate for PS domain NRT data (MaxBitRateDLPSNRT)
This parameter defines the maximum downlink user bit rate allowed ina cell for an NRT PS domain RAB.
Power offset for dynamic link optimisation (DLOptimisationPwrOffset)
Parameter is used to define the DL transmission power level, which triggers the dynamic link optimization.
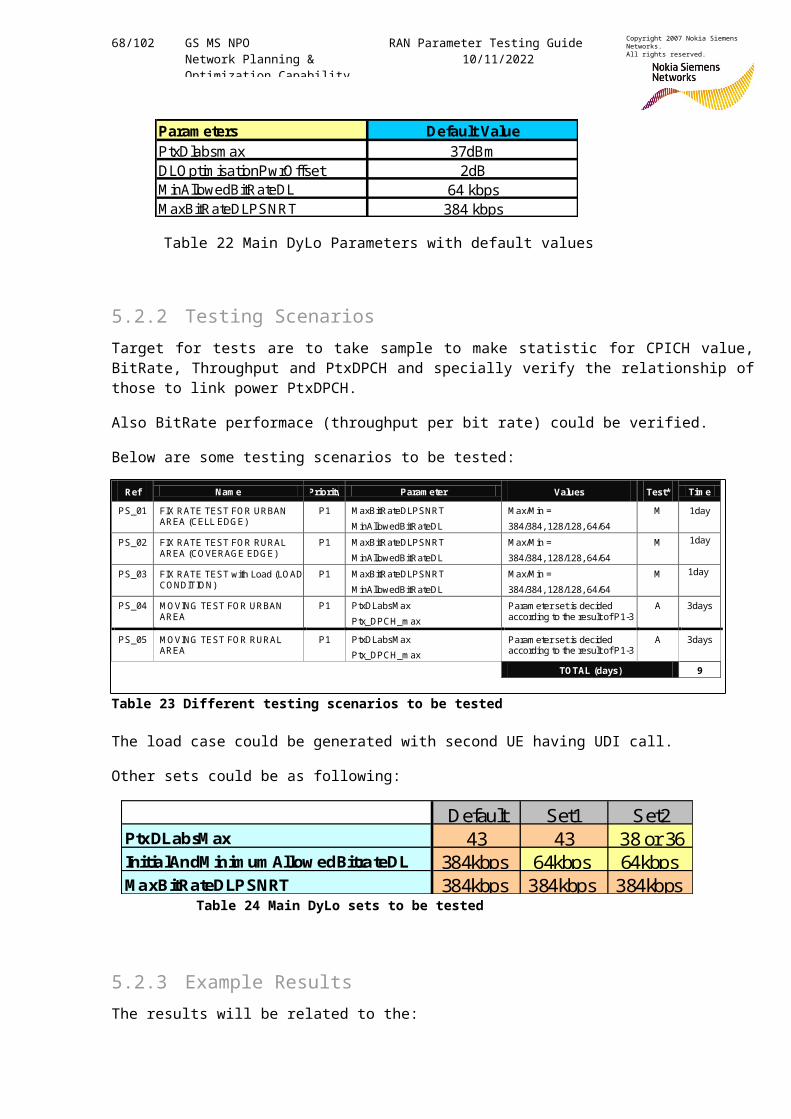
68/102 GS MS NPO Network Planning & Optimization Capability
RAN Parameter Testing Guide10/11/2022
Copyright 2007 Nokia Siemens Networks.All rights reserved.
Param eters Default ValuePtxDlabsm ax 37dBmDLO ptim isationPwrOffset 2dBM inAllowedBitRateDL 64 kbpsM axBitRateDLPSNRT 384 kbps
Table 22 Main DyLo Parameters with default values
5.2.2 Testing ScenariosTarget for tests are to take sample to make statistic for CPICH value,BitRate, Throughput and PtxDPCH and specially verify the relationship ofthose to link power PtxDPCH.
Also BitRate performace (throughput per bit rate) could be verified.
Below are some testing scenarios to be tested:
Table 23 Different testing scenarios to be tested
The load case could be generated with second UE having UDI call.
Other sets could be as following:
Table 24 Main DyLo sets to be tested
5.2.3 Example ResultsThe results will be related to the:
Default Set1 Set2PtxDLabsM ax 43 43 38 or 36InitialAndM inim um Allow edBitrateDL 384kbps 64kbps 64kbps MaxBitRateDLPSNRT 384kbps 384kbps 384kbps
Ref Nam e Priority Param eter Values Test* Tim e PS_01 FIX RATE TEST FOR URBAN
AREA (CELL EDGE) P1 M axBitRateDLPSNRT
M inAllowedBitRateDL M ax/M in = 384/384, 128/128, 64/64
M 1day
PS_02 FIX RATE TEST FOR RURAL AREA (CO VERAGE EDGE)
P1 M axBitRateDLPSNRT M inAllowedBitRateDL
M ax/M in = 384/384, 128/128, 64/64
M 1day
PS_03 FIX RATE TEST with Load (LOAD CONDITION)
P1 M axBitRateDLPSNRT M inAllowedBitRateDL
M ax/M in = 384/384, 128/128, 64/64
M 1day
PS_04 M OVING TEST FOR URBAN AREA
P1 PtxDLabsM ax Ptx_DPCH_m ax
Param eter set is decided according to the result of P1-3
A 3days
PS_05 M OVING TEST FOR RURAL AREA
P1 PtxDLabsM ax Ptx_DPCH_m ax
Param eter set is decided according to the result of P1-3
A 3days
TOTAL (days) 9
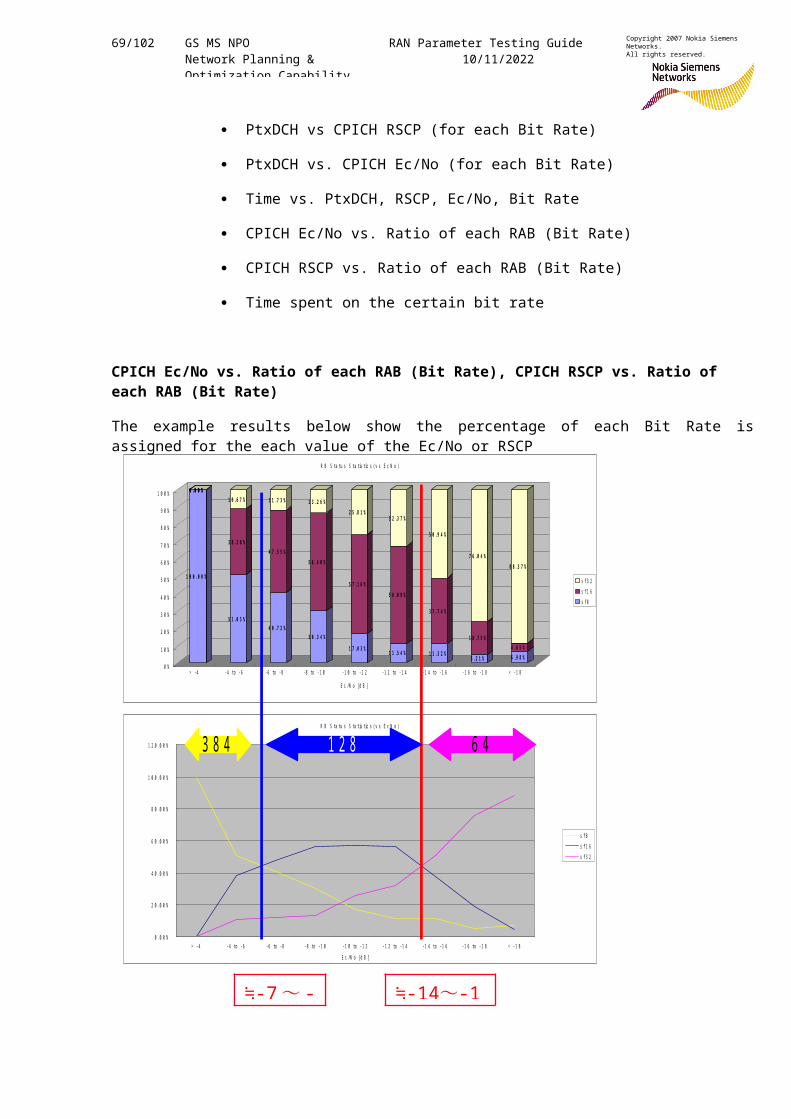
69/102 GS MS NPO Network Planning & Optimization Capability
RAN Parameter Testing Guide10/11/2022
Copyright 2007 Nokia Siemens Networks.All rights reserved.
PtxDCH vs CPICH RSCP (for each Bit Rate)
PtxDCH vs. CPICH Ec/No (for each Bit Rate)
Time vs. PtxDCH, RSCP, Ec/No, Bit Rate
CPICH Ec/No vs. Ratio of each RAB (Bit Rate)
CPICH RSCP vs. Ratio of each RAB (Bit Rate)
Time spent on the certain bit rate
CPICH Ec/No vs. Ratio of each RAB (Bit Rate), CPICH RSCP vs. Ratio of each RAB (Bit Rate)
The example results below show the percentage of each Bit Rate isassigned for the each value of the Ec/No or RSCP
R B S ta tu s S ta tis tic s (v s E c N o )
0 .0 0 %
2 0 .0 0 %
4 0 .0 0 %
6 0 .0 0 %
8 0 .0 0 %
1 0 0 .0 0 %
1 2 0 .0 0 %
> -4 -4 to -6 -6 to -8 -8 to -1 0 -1 0 to -1 2 -1 2 to -1 4 -1 4 to -1 6 -1 6 to -1 8 < -1 8E c /N o [d B ]
s f8s f1 6s f3 2
1 0 0 .0 0 %
0 .0 0 %0 .0 0 %
5 1 .0 3 %
3 8 .3 0 %
1 0 .6 7 %
4 0 .7 2 %
4 7 .5 5 %
1 1 .7 3 %
3 0 .3 4 %
5 6 .4 0 %
1 3 .2 6 %
1 7 .0 3 %
5 7 .1 6 %
2 5 .8 1 %
1 1 .5 4 %
5 6 .0 9 %
3 2 .3 7 %
1 1 .3 2 %
3 7 .7 4 %
5 0 .9 4 %
5 .2 1 %
1 8 .7 5 %
7 6 .0 4 %
6 .9 8 %4 .6 5 %
8 8 .3 7 %
0 %
1 0 %
2 0 %
3 0 %
4 0 %
5 0 %
6 0 %
7 0 %
8 0 %
9 0 %
1 0 0 %
> -4 -4 to -6 -6 to -8 -8 to -1 0 -1 0 to -1 2 -1 2 to -1 4 -1 4 to -1 6 -1 6 to -1 8 < -1 8
E c /N o [d B ]
R B S ta tu s S ta tis tic s (v s E c N o )
s f3 2s f1 6s f8
3 8 4 1 2 8 6 4
≒-7~ - ≒-14~-1
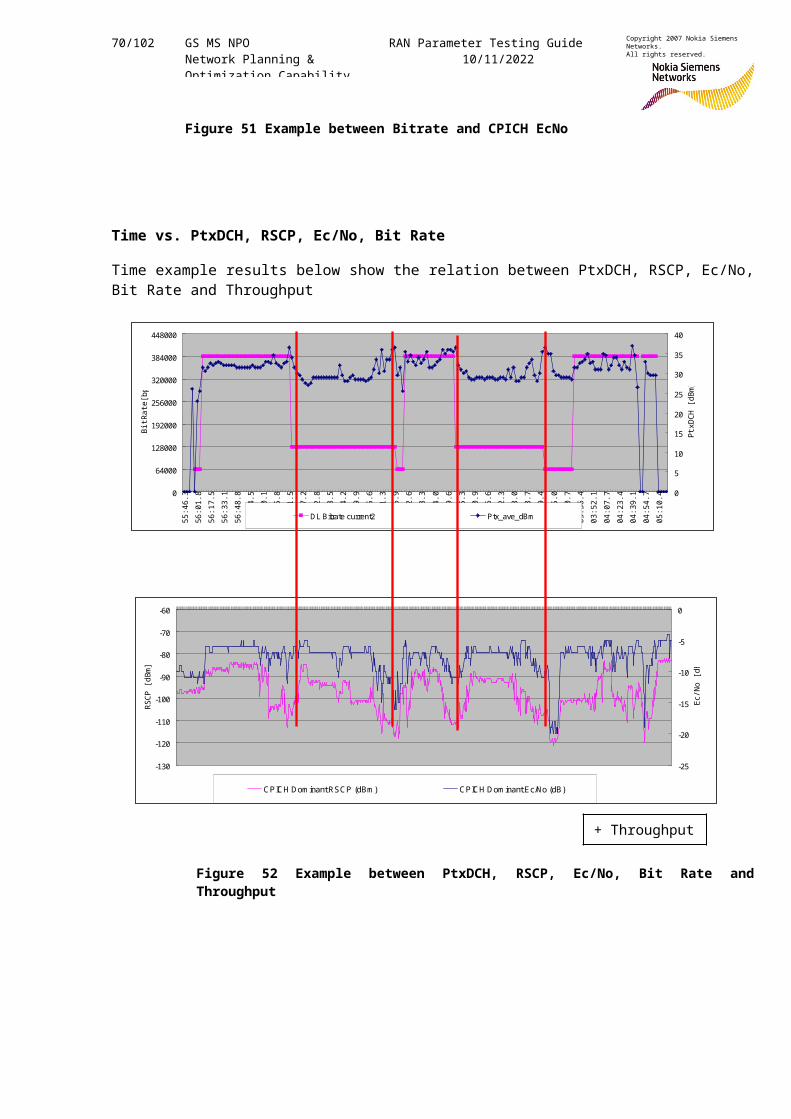
70/102 GS MS NPO Network Planning & Optimization Capability
RAN Parameter Testing Guide10/11/2022
Copyright 2007 Nokia Siemens Networks.All rights reserved.
Figure 51 Example between Bitrate and CPICH EcNo
Time vs. PtxDCH, RSCP, Ec/No, Bit Rate
Time example results below show the relation between PtxDCH, RSCP, Ec/No,Bit Rate and Throughput
Figure 52 Example between PtxDCH, RSCP, Ec/No, Bit Rate andThroughput
0
64000
128000
192000
256000
320000
384000
448000
55:46.3
56:01.8
56:17.5
56:33.1
56:48.8
57:04.5
57:20.1
57:35.8
57:51.5
58:07.2
58:22.8
58:38.5
58:54.2
59:09.9
59:25.6
59:41.3
59:56.9
00:12.6
00:28.3
00:44.0
00:59.6
01:15.3
01:30.9
01:46.6
02:02.3
02:18.0
02:33.7
02:49.4
03:05.0
03:20.7
03:36.4
03:52.1
04:07.7
04:23.4
04:39.1
04:54.7
05:10.4
BitRate[bps]
0
5
10
15
20
25
30
35
40
PtxDCH [dBm]
D L Bitrate current2 Ptx_ave_dBm
-130
-120
-110
-100
-90
-80
-70
-60
RSCP [dBm]
-25
-20
-15
-10
-5
0
Ec/No [dB]
CPICH Dom inant RSCP (dBm ) CPICH Dom inant Ec/No (dB)
+ Throughput
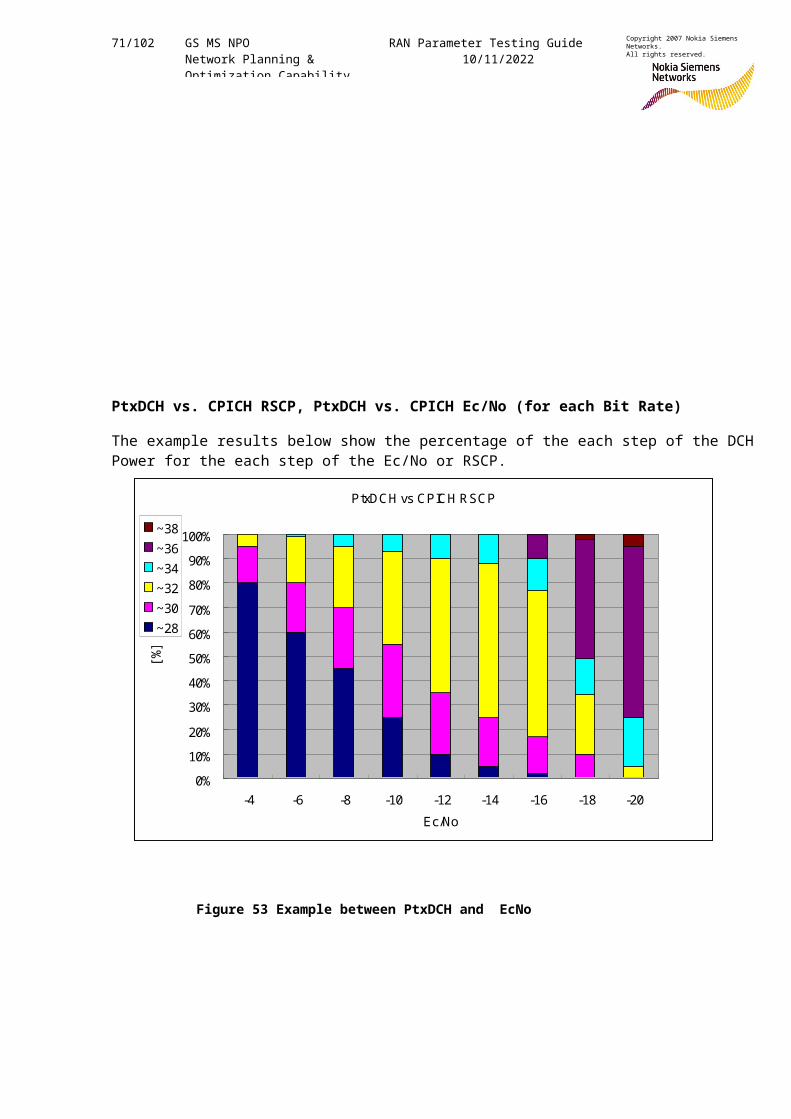
71/102 GS MS NPO Network Planning & Optimization Capability
RAN Parameter Testing Guide10/11/2022
Copyright 2007 Nokia Siemens Networks.All rights reserved.
PtxDCH vs. CPICH RSCP, PtxDCH vs. CPICH Ec/No (for each Bit Rate)
The example results below show the percentage of the each step of the DCHPower for the each step of the Ec/No or RSCP.
Figure 53 Example between PtxDCH and EcNo
PtxDCH vs CPICH RSCP
0%10%20%30%40%50%60%70%80%90%100%
-4 -6 -8 -10 -12 -14 -16 -18 -20Ec/No
[%]
~38~36~34~32~30~28
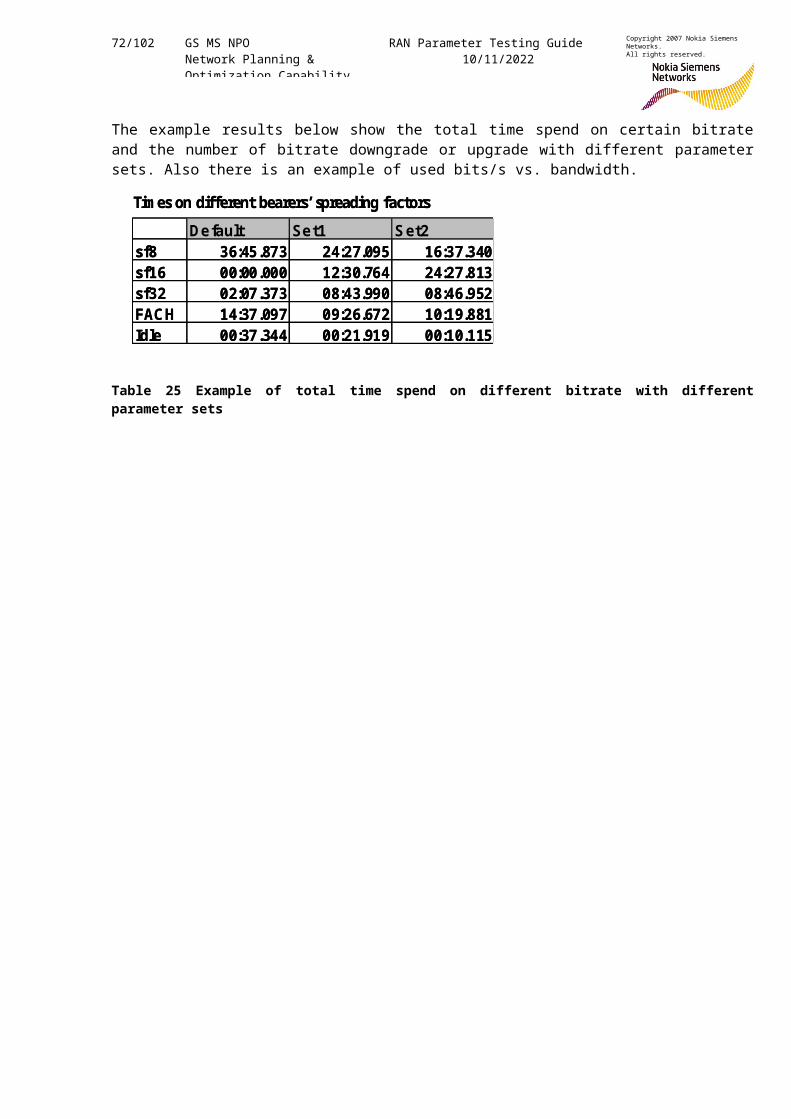
72/102 GS MS NPO Network Planning & Optimization Capability
RAN Parameter Testing Guide10/11/2022
Copyright 2007 Nokia Siemens Networks.All rights reserved.
The example results below show the total time spend on certain bitrateand the number of bitrate downgrade or upgrade with different parametersets. Also there is an example of used bits/s vs. bandwidth.
Table 25 Example of total time spend on different bitrate with differentparameter sets
Tim es on different bearers’spreading factorsDefault Set1 Set2
sf8 36:45.873 24:27.095 16:37.340sf16 00:00.000 12:30.764 24:27.813sf32 02:07.373 08:43.990 08:46.952FACH 14:37.097 09:26.672 10:19.881Idle 00:37.344 00:21.919 00:10.115
Tim es on different bearers’spreading factorsDefault Set1 Set2
sf8 36:45.873 24:27.095 16:37.340sf16 00:00.000 12:30.764 24:27.813sf32 02:07.373 08:43.990 08:46.952FACH 14:37.097 09:26.672 10:19.881Idle 00:37.344 00:21.919 00:10.115
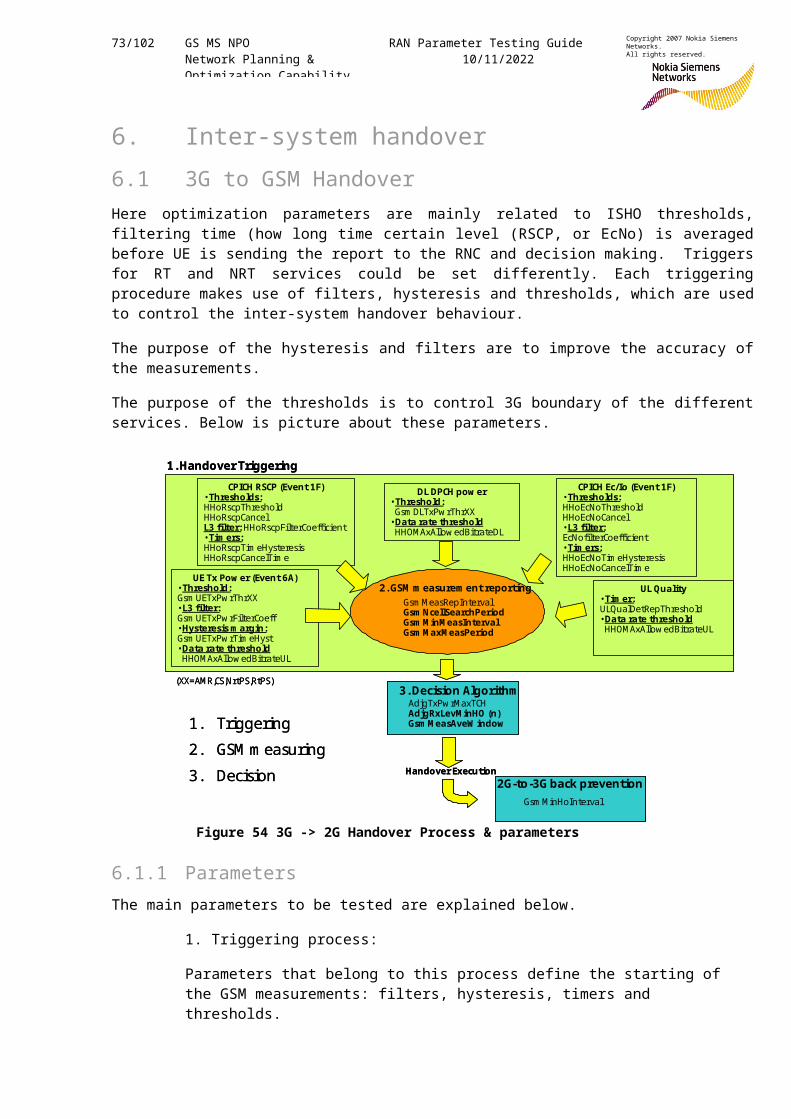
73/102 GS MS NPO Network Planning & Optimization Capability
RAN Parameter Testing Guide10/11/2022
Copyright 2007 Nokia Siemens Networks.All rights reserved.
6. Inter-system handover6.1 3G to GSM HandoverHere optimization parameters are mainly related to ISHO thresholds,filtering time (how long time certain level (RSCP, or EcNo) is averagedbefore UE is sending the report to the RNC and decision making. Triggersfor RT and NRT services could be set differently. Each triggeringprocedure makes use of filters, hysteresis and thresholds, which are usedto control the inter-system handover behaviour.
The purpose of the hysteresis and filters are to improve the accuracy ofthe measurements.
The purpose of the thresholds is to control 3G boundary of the differentservices. Below is picture about these parameters.
Figure 54 3G -> 2G Handover Process & parameters
6.1.1 ParametersThe main parameters to be tested are explained below.
1. Triggering process:
Parameters that belong to this process define the starting of the GSM measurements: filters, hysteresis, timers and thresholds.
3. Decision Algorithm
UE Tx Pow er (Event 6A)•Threshold:Gsm UETxPw rThrXX •L3 filter:Gsm UETxPw rFilterCoeff•Hysteresism argin:Gsm UETxPw rTim eHyst•Data rate thresholdHHOMAxAllow edBitrateUL
UL Quality•Tim er:ULQualDetRepThreshold•Data rate thresholdHHOMAxAllow edBitrateUL
DL DPCH pow er•Threshold:Gsm DLTxPw rThrXX•Data rate thresholdHHOMAxAllow edBitrateDL
(XX=AMR,CS,NrtPS,RtPS)
CPICH RSCP (Event 1F)•Thresholds:HHoRscpThreshold HHoRscpCancelL3 filter:HHoRscpFilterCoefficient•Tim ers:HHoRscpTim eHysteresisHHoRscpCancelTim e
CPICH Ec/Io (Event 1F)•Thresholds:HHoEcNoThresholdHHoEcNoCancel•L3 filter:EcNofilterCoefficient•Tim ers:HHoEcNoTim eHysteresisHHoEcNoCancelTim e
AdjgTxPw rMaxTCHAdjgRxLevM inHO (n)Gsm M easAveW indow
Gsm MeasRepIntervalGsm NcellSearchPeriodGsm M inM easIntervalGsm M axM easPeriod
1. Handover Triggering
Handover Execution2G-to-3G back prevention
Gsm MinHoInterval
2. GSM m easurem ent reporting
1. Triggering2. GSM m easuring3. Decision
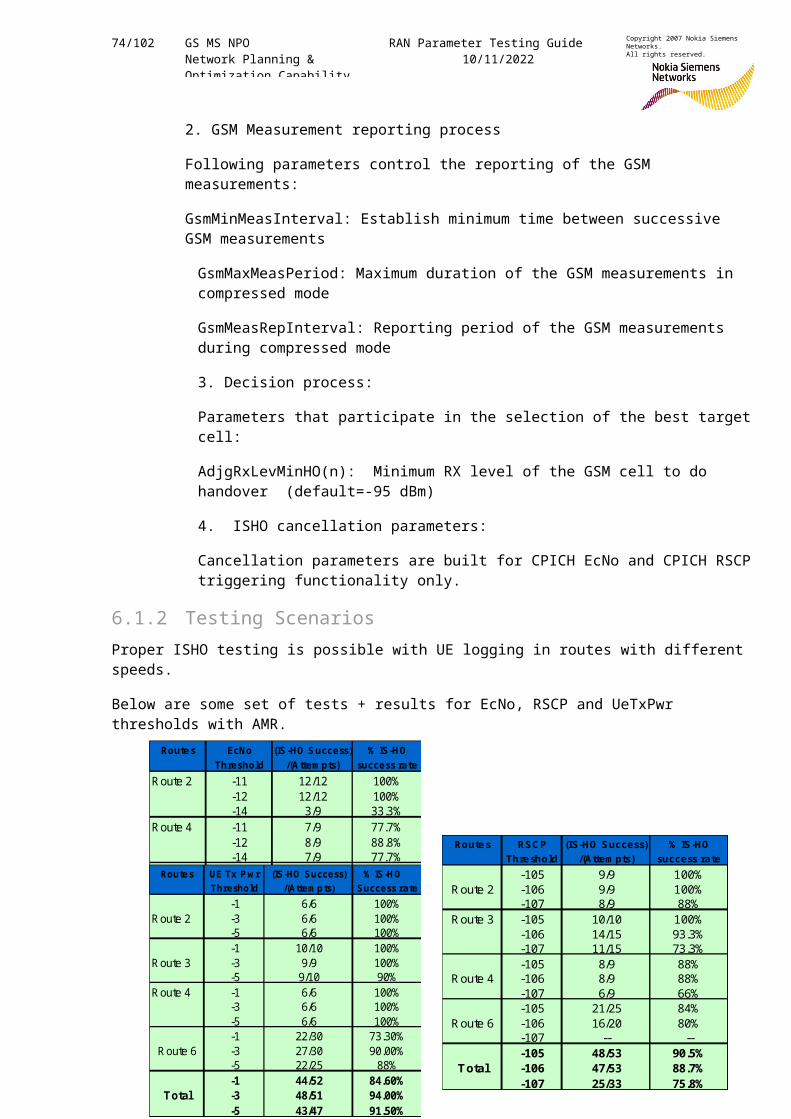
74/102 GS MS NPO Network Planning & Optimization Capability
RAN Parameter Testing Guide10/11/2022
Copyright 2007 Nokia Siemens Networks.All rights reserved.
2. GSM Measurement reporting process
Following parameters control the reporting of the GSM measurements:
GsmMinMeasInterval: Establish minimum time between successive GSM measurements
GsmMaxMeasPeriod: Maximum duration of the GSM measurements in compressed mode
GsmMeasRepInterval: Reporting period of the GSM measurements during compressed mode
3. Decision process:
Parameters that participate in the selection of the best targetcell:
AdjgRxLevMinHO(n): Minimum RX level of the GSM cell to do handover (default=-95 dBm)
4. ISHO cancellation parameters:
Cancellation parameters are built for CPICH EcNo and CPICH RSCPtriggering functionality only.
6.1.2 Testing ScenariosProper ISHO testing is possible with UE logging in routes with different speeds.
Below are some set of tests + results for EcNo, RSCP and UeTxPwr thresholds with AMR.
Routes EcNo (IS-HO S uccess) % IS-H OThreshold /(A ttem pts) success rate
Route 2 -11 12/12 100%-12 12/12 100%-14 3/9 33.3%
Route 4 -11 7/9 77.7%-12 8/9 88.8%-14 7/9 77.7%
Route 6 -11 13/16 81.25%-12 13/16 81.25%-14 9/20 45%-11 32/37 86.50%
Total -12 33/37 89.20%-14 19/38 50%
Routes RSC P (IS-HO Success) % IS-HOThreshold /(Attem pts) success rate-105 9/9 100%
Route 2 -106 9/9 100%-107 8/9 88%
Route 3 -105 10/10 100%-106 14/15 93.3%-107 11/15 73.3%-105 8/9 88%
Route 4 -106 8/9 88%-107 6/9 66%-105 21/25 84%
Route 6 -106 16/20 80%-107 -- ---105 48/53 90.5%
Total -106 47/53 88.7%-107 25/33 75.8%
Routes UE Tx P w r (IS-HO Success) % IS-H O Threshold /(Attem pts) Success rate
-1 6/6 100%R oute 2 -3 6/6 100%
-5 6/6 100%-1 10/10 100%
R oute 3 -3 9/9 100%-5 9/10 90%
R oute 4 -1 6/6 100%-3 6/6 100%-5 6/6 100%-1 22/30 73.30%
R oute 6 -3 27/30 90.00%-5 22/25 88%-1 44/52 84.60%
Total -3 48/51 94.00%-5 43/47 91.50%
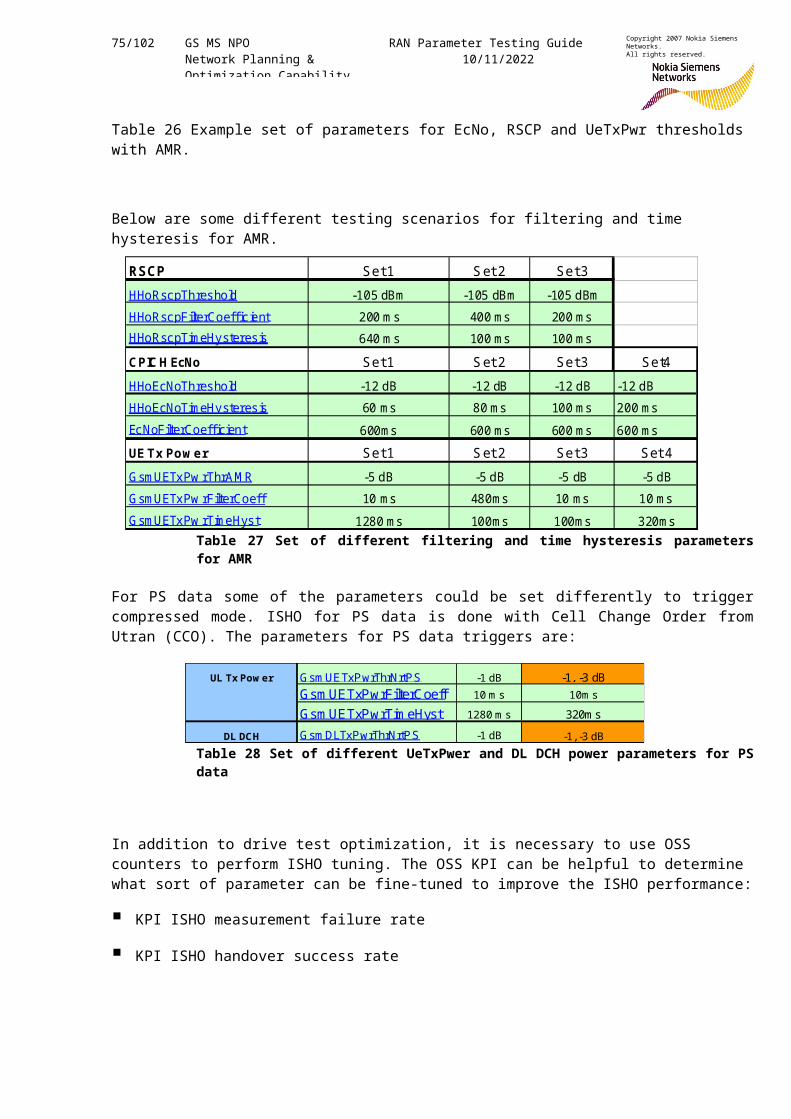
75/102 GS MS NPO Network Planning & Optimization Capability
RAN Parameter Testing Guide10/11/2022
Copyright 2007 Nokia Siemens Networks.All rights reserved.
Table 26 Example set of parameters for EcNo, RSCP and UeTxPwr thresholds with AMR.
Below are some different testing scenarios for filtering and time hysteresis for AMR.
Table 27 Set of different filtering and time hysteresis parametersfor AMR
For PS data some of the parameters could be set differently to triggercompressed mode. ISHO for PS data is done with Cell Change Order fromUtran (CCO). The parameters for PS data triggers are:
Table 28 Set of different UeTxPwer and DL DCH power parameters for PSdata
In addition to drive test optimization, it is necessary to use OSS counters to perform ISHO tuning. The OSS KPI can be helpful to determine what sort of parameter can be fine-tuned to improve the ISHO performance:
KPI ISHO measurement failure rate
KPI ISHO handover success rate
RSCP Set 1 Set 2 Set 3HHoRscpThreshold -105 dBm -105 dBm -105 dBmHHoRscpFilterCoefficient 200 m s 400 ms 200 msHHoRscpTimeHysteresis 640 m s 100 ms 100 msCPIC H EcNo Set 1 Set 2 Set 3 Set4HHoEcNoThreshold -12 dB -12 dB -12 dB -12 dBHHoEcNoTimeHysteresis 60 ms 80 ms 100 ms 200 msEcNoFilterCoefficient 600ms 600 ms 600 ms 600 msUE Tx Pow er Set 1 Set 2 Set 3 Set 4GsmUETxPw rThrAM R -5 dB -5 dB -5 dB -5 dBGsmUETxPw rFilterCoeff 10 ms 480ms 10 ms 10 msGsmUETxPw rTimeHyst 1280 ms 100ms 100ms 320ms
UL Tx Pow er Gsm UETxPwrThrNrtPS -1 dB -1, -3 dBGsm UETxPwrFilterCoeff 10 m s 10m sGsm UETxPwrTim eHyst 1280 m s 320m s
DL DCH Gsm DLTxPwrThrNrtPS -1 dB -1, -3 dB
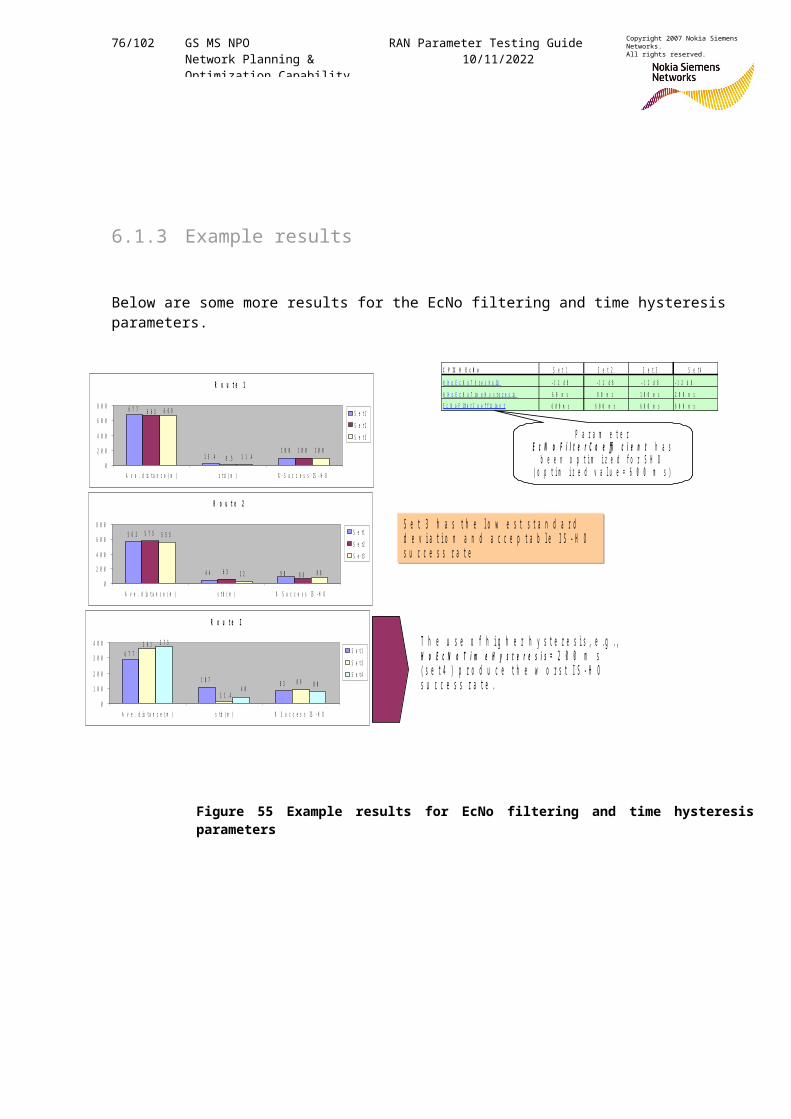
76/102 GS MS NPO Network Planning & Optimization Capability
RAN Parameter Testing Guide10/11/2022
Copyright 2007 Nokia Siemens Networks.All rights reserved.
6.1.3 Example results
Below are some more results for the EcNo filtering and time hysteresis parameters.
Figure 55 Example results for EcNo filtering and time hysteresisparameters
R o u t e 1
1 3 . 41 0 0 1 0 0 1 0 0
6 7 7
8 . 5
6 6 3
1 1 .4
6 6 9
0
2 0 0
4 0 0
6 0 0
8 0 0
A v e . d is t a n c e ( m ) s t d ( m ) % S u c c e s s I S - H O
S e t 1S e t 2S e t 3
R o u t e 2
5 6 2
4 4
5 7 5
6 3
5 5 5
2 2 9 0 8 8 8 80
2 0 0
4 0 0
6 0 0
8 0 0
A v e . d is t a n c e ( m ) s t d ( m ) % S u c c e s s IS - H O
S e t1S e t2S e t3
R o u t e 2
1 0 7 8 3 8 9 8 0
6 7 73 6 1
1 1 . 4
3 7 5
4 0
0
1 0 0
2 0 0
3 0 0
4 0 0
A v e . d is t a n c e ( m ) s td ( m ) % S u c c e s s IS - H O
S e t 1S e t 3S e t 4
C P IC H E c N o S e t 1 S e t 2 S e t 3 S e t 4H H o E c N o T h r e s h o ld - 1 2 d B - 1 2 d B - 1 2 d B - 1 2 d BH H o E c N o T im e H y s t e r e s is 6 0 m s 8 0 m s 1 0 0 m s 2 0 0 m sE c N o F ilt e r C o e f f ic ie n t 6 0 0 m s 6 0 0 m s 6 0 0 m s 6 0 0 m s
S e t 3 h a s t h e l o w e s t s t a n d a r d d e v i a t i o n a n d a c c e p t a b l e I S - H O s u c c e s s r a t e
T h e u s e o f h i g h e r h y s t e r e s i s , e .g ., H o E c N o T i m e H y s t e r e s i s = 2 0 0 m s ( s e t 4 ) p r o d u c e t h e w o r s t I S - H O s u c c e s s r a t e .
P a r a m e t e r E c N o F i l t e r C o e ffi c i e n t h a s
b e e n o p t i m i z e d f o r S H O ( o p t i m i z e d v a l u e = 6 0 0 m s )
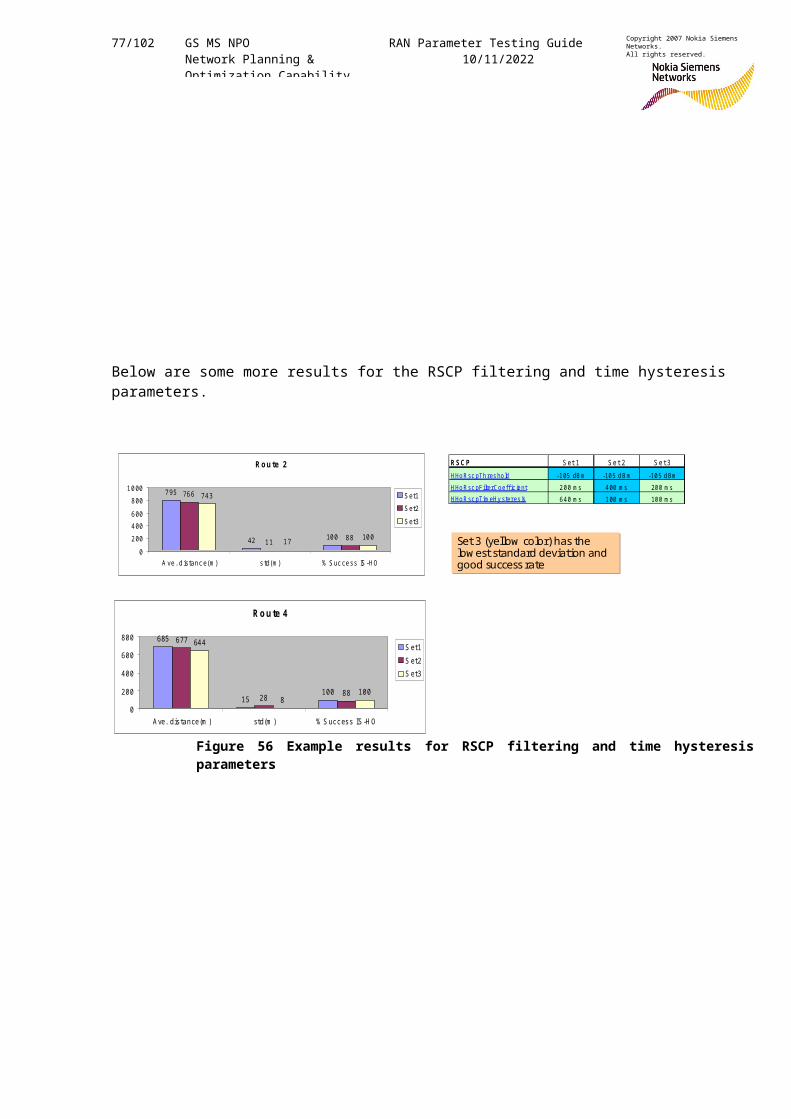
77/102 GS MS NPO Network Planning & Optimization Capability
RAN Parameter Testing Guide10/11/2022
Copyright 2007 Nokia Siemens Networks.All rights reserved.
Below are some more results for the RSCP filtering and time hysteresis parameters.
Figure 56 Example results for RSCP filtering and time hysteresisparameters
R S C P S et 1 S et 2 S et 3H HoR scpThreshold -105 dB m -105 dB m -105 dBmH HoR scpFilterC oefficient 200 m s 400 m s 200 m sH HoR scpTim eH ysteresis 640 m s 100 m s 100 m s
R o u te 2
795
42 100
766
11 88
743
17 1000
200400600800
1000
A ve. distance(m ) std(m ) % S uccess IS -H O
S et1S et2S et3
R o ute 4
685
15100
677
28 88
644
8100
0
200
400
600
800
A ve. distance(m ) std(m ) % S uccess IS -H O
S et1S et2S et3
Set 3 (yellow color) has the low est standard deviation and good success rate
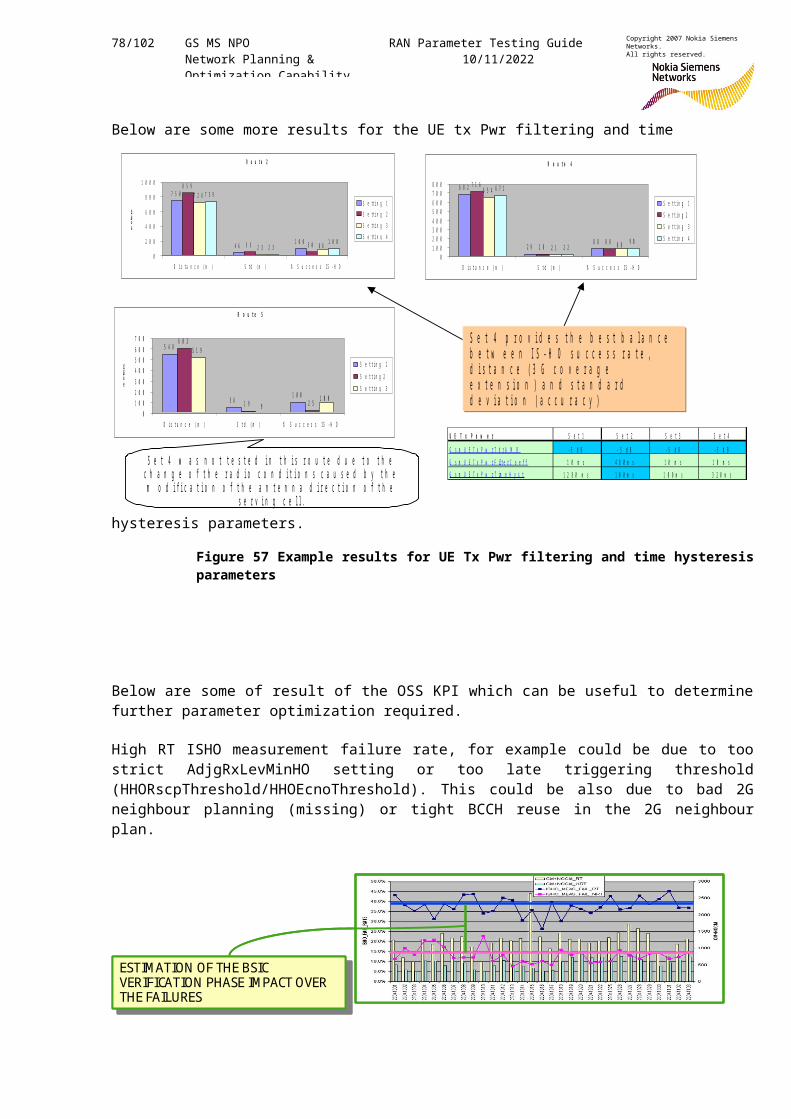
78/102 GS MS NPO Network Planning & Optimization Capability
RAN Parameter Testing Guide10/11/2022
Copyright 2007 Nokia Siemens Networks.All rights reserved.
Below are some more results for the UE tx Pwr filtering and time
hysteresis parameters.
Figure 57 Example results for UE Tx Pwr filtering and time hysteresisparameters
Below are some of result of the OSS KPI which can be useful to determinefurther parameter optimization required.
High RT ISHO measurement failure rate, for example could be due to toostrict AdjgRxLevMinHO setting or too late triggering threshold(HHORscpThreshold/HHOEcnoThreshold). This could be also due to bad 2Gneighbour planning (missing) or tight BCCH reuse in the 2G neighbourplan.
R o u t e 2
7 5 0
4 6 1 0 0
8 5 9
5 3 5 0
7 2 6
2 3
7 3 9
2 31 0 08 8
0
2 0 0
4 0 0
6 0 0
8 0 0
1 0 0 0
D i s t a n c e ( m ) S t d ( m ) % S u c c e s s I S - H O
meters
S e t t i n g 1S e t t i n g 2S e t t i n g 3S e t t i n g 4
R o u t e 4
6 8 2
2 9 8 8
7 1 6
2 8 8 8
6 5 4
2 1
6 7 1
2 29 08 8
01 0 02 0 03 0 04 0 05 0 06 0 07 0 08 0 0
D i s t a n c e ( m ) S t d ( m ) % S u c c e s s I S - H O
S e t t i n g 1S e t t i n g 2S e t t i n g 3S e t t i n g 4
R o u t e 5
5 4 8
5 6 1 0 0
6 0 3
1 9 2 5
5 1 9
1 0 09
01 0 02 0 03 0 04 0 05 0 06 0 07 0 0
D i s t a n c e ( m ) S t d ( m ) % S u c c e s s I S - H O
meters S e t t i n g 1
S e t t i n g 2S e t t i n g 3
U E T x P o w e r S e t 1 S e t 2 S e t 3 S e t 4G s m U E T x P w r T h r A M R - 5 d B - 5 d B - 5 d B - 5 d BG s m U E T x P w r F ilt e r C o e f f 1 0 m s 4 8 0 m s 1 0 m s 1 0 m sG s m U E T x P w r T im e H y s t 1 2 8 0 m s 1 0 0 m s 1 0 0 m s 3 2 0 m s
S e t 4 w a s n o t t e s t e d i n t h i s r o u t e d u e t o t h e c h a n g e o f t h e r a d i o c o n d i t i o n s c a u s e d b y t h e m o d i f i c a t i o n o f t h e a n t e n n a d i r e c t i o n o f t h e
s e r v i n g c e l l .
S e t 4 p r o v i d e s t h e b e s t b a l a n c e b e t w e e n I S - H O s u c c e s s r a t e , d i s t a n c e ( 3 G c o v e r a g e e x t e n s i o n ) a n d s t a n d a r d d e v i a t i o n ( a c c u r a c y )
ESTIMATION OF THE BSIC VERIFICATION PHASE IMPACT OVER THE FAILURES
ESTIMATION OF THE BSIC VERIFICATION PHASE IMPACT OVER THE FAILURESESTIMATION OF THE BSIC VERIFICATION PHASE IMPACT OVER THE FAILURES
ESTIMATION OF THE BSIC VERIFICATION PHASE IMPACT OVER THE FAILURES
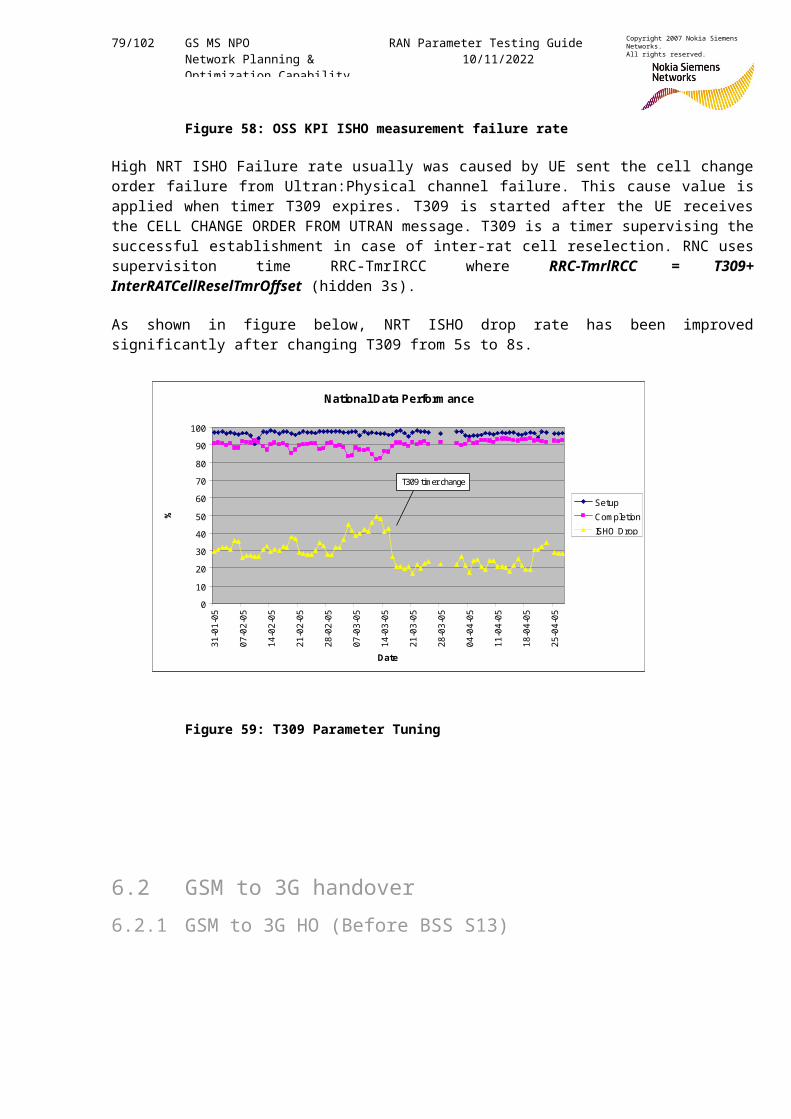
79/102 GS MS NPO Network Planning & Optimization Capability
RAN Parameter Testing Guide10/11/2022
Copyright 2007 Nokia Siemens Networks.All rights reserved.
Figure 58: OSS KPI ISHO measurement failure rate
High NRT ISHO Failure rate usually was caused by UE sent the cell changeorder failure from Ultran:Physical channel failure. This cause value isapplied when timer T309 expires. T309 is started after the UE receivesthe CELL CHANGE ORDER FROM UTRAN message. T309 is a timer supervising thesuccessful establishment in case of inter-rat cell reselection. RNC usessupervisiton time RRC-TmrIRCC where RRC-TmrlRCC = T309+InterRATCellReselTmrOffset (hidden 3s).
As shown in figure below, NRT ISHO drop rate has been improvedsignificantly after changing T309 from 5s to 8s.
Figure 59: T309 Parameter Tuning
6.2 GSM to 3G handover6.2.1 GSM to 3G HO (Before BSS S13)
National Data Perform ance
0102030405060708090100
31-01-05
07-02-05
14-02-05
21-02-05
28-02-05
07-03-05
14-03-05
21-03-05
28-03-05
04-04-05
11-04-05
18-04-05
25-04-05
Date
%
SetupCompletionISHO Drop
T309 timer change
National Data Perform ance
0102030405060708090100
31-01-05
07-02-05
14-02-05
21-02-05
28-02-05
07-03-05
14-03-05
21-03-05
28-03-05
04-04-05
11-04-05
18-04-05
25-04-05
Date
%
SetupCompletionISHO Drop
T309 timer change
National Data Perform ance
0102030405060708090100
31-01-05
07-02-05
14-02-05
21-02-05
28-02-05
07-03-05
14-03-05
21-03-05
28-03-05
04-04-05
11-04-05
18-04-05
25-04-05
Date
%
SetupCompletionISHO Drop
T309 timer change
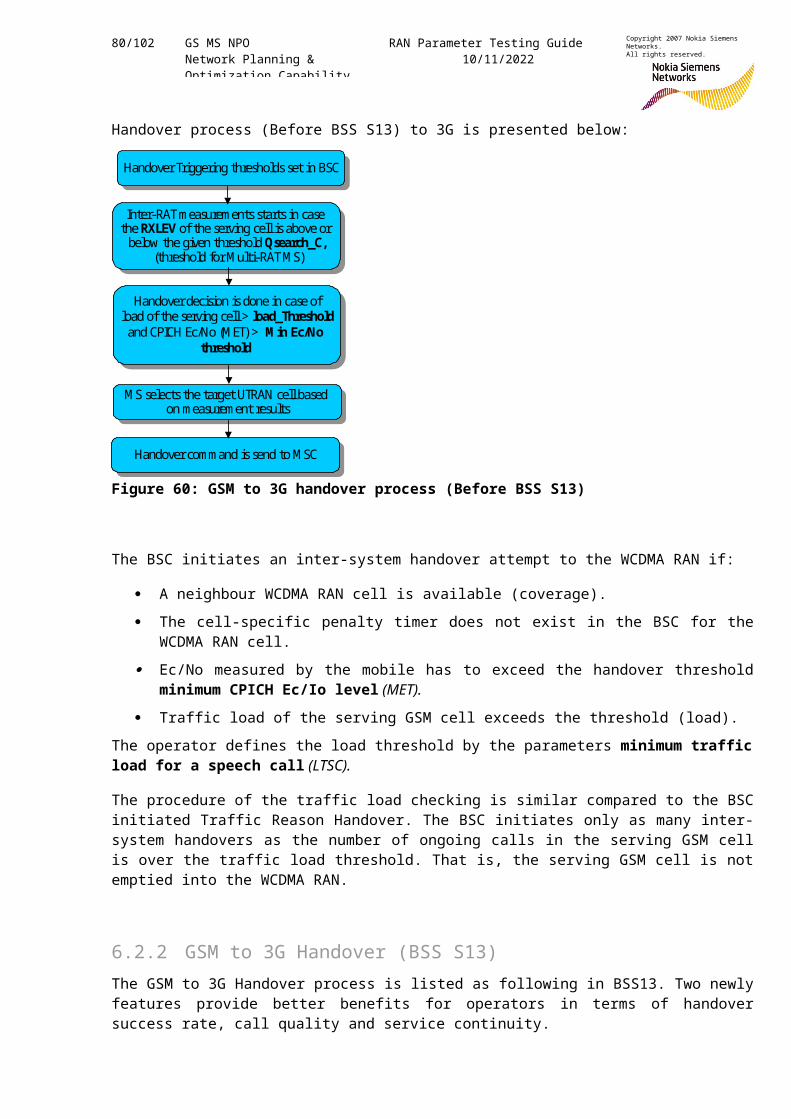
80/102 GS MS NPO Network Planning & Optimization Capability
RAN Parameter Testing Guide10/11/2022
Copyright 2007 Nokia Siemens Networks.All rights reserved.
Handover process (Before BSS S13) to 3G is presented below:
Figure 60: GSM to 3G handover process (Before BSS S13)
The BSC initiates an inter-system handover attempt to the WCDMA RAN if:
A neighbour WCDMA RAN cell is available (coverage). The cell-specific penalty timer does not exist in the BSC for the
WCDMA RAN cell. Ec/No measured by the mobile has to exceed the handover threshold
minimum CPICH Ec/Io level (MET).
Traffic load of the serving GSM cell exceeds the threshold (load).The operator defines the load threshold by the parameters minimum trafficload for a speech call (LTSC).
The procedure of the traffic load checking is similar compared to the BSCinitiated Traffic Reason Handover. The BSC initiates only as many inter-system handovers as the number of ongoing calls in the serving GSM cellis over the traffic load threshold. That is, the serving GSM cell is notemptied into the WCDMA RAN.
6.2.2 GSM to 3G Handover (BSS S13)The GSM to 3G Handover process is listed as following in BSS13. Two newlyfeatures provide better benefits for operators in terms of handoversuccess rate, call quality and service continuity.
Handover Triggering thresholds set in BSCHandover Triggering thresholds set in BSC
Inter-RAT measurements starts in case the RXLEV of the serving cell is above or below the given threshold Qsearch_C,
(threshold for M ulti-RAT M S)
Inter-RAT measurements starts in case the RXLEV of the serving cell is above or below the given threshold Qsearch_C,
(threshold for M ulti-RAT M S)
Handover decision is done in case ofload of the serving cell > load_Thresholdand CPICH Ec/No (M ET) > M in Ec/No
threshold
Handover decision is done in case ofload of the serving cell > load_Thresholdand CPICH Ec/No (M ET) > M in Ec/No
threshold
M S selects the target UTRAN cell based on measurement results
M S selects the target UTRAN cell based on measurement results
Handover command is send to M SCHandover command is send to M SC
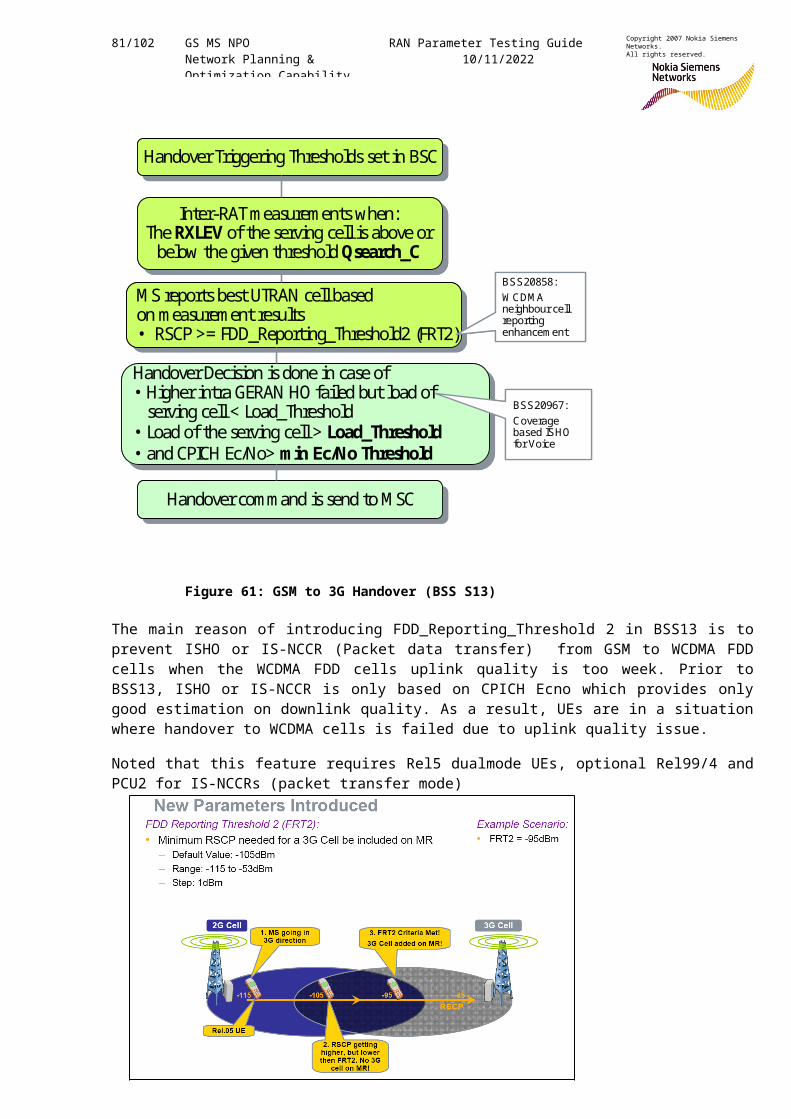
81/102 GS MS NPO Network Planning & Optimization Capability
RAN Parameter Testing Guide10/11/2022
Copyright 2007 Nokia Siemens Networks.All rights reserved.
Figure 61: GSM to 3G Handover (BSS S13)
The main reason of introducing FDD_Reporting_Threshold 2 in BSS13 is toprevent ISHO or IS-NCCR (Packet data transfer) from GSM to WCDMA FDDcells when the WCDMA FDD cells uplink quality is too week. Prior toBSS13, ISHO or IS-NCCR is only based on CPICH Ecno which provides onlygood estimation on downlink quality. As a result, UEs are in a situationwhere handover to WCDMA cells is failed due to uplink quality issue.
Noted that this feature requires Rel5 dualmode UEs, optional Rel99/4 andPCU2 for IS-NCCRs (packet transfer mode)
Handover Triggering Thresholds set in BSCHandover Triggering Thresholds set in BSC
Inter-RAT measurements when: The RXLEV of the serving cell is above or below the given threshold Qsearch_C
Inter-RAT measurements when: The RXLEV of the serving cell is above or below the given threshold Qsearch_C
Handover Decision is done in case of•Higher intra GERAN HO failed but load of serving cell < Load_Threshold
•Load of the serving cell > Load_Threshold•and CPICH Ec/No> min Ec/No Threshold
Handover Decision is done in case of•Higher intra GERAN HO failed but load of serving cell < Load_Threshold
•Load of the serving cell > Load_Threshold•and CPICH Ec/No> min Ec/No Threshold
M S reports best UTRAN cell based on measurement results• RSCP>= FDD_Reporting_Threshold2 (FRT2)
M S reports best UTRAN cell based on measurement results• RSCP>= FDD_Reporting_Threshold2 (FRT2)
Handover command is send to M SCHandover command is send to M SC
BSS20858:W CDM Aneighbourcell reporting enhancem ent
BSS20967:Coverage based ISHOfor Voice
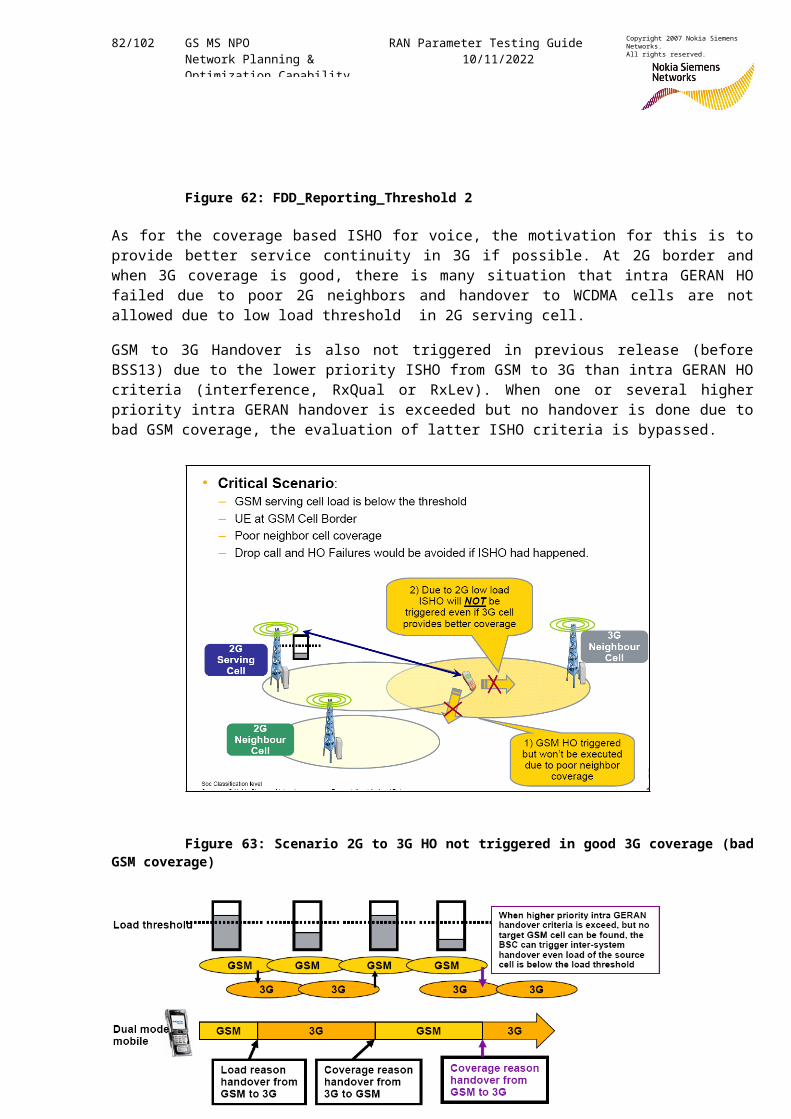
82/102 GS MS NPO Network Planning & Optimization Capability
RAN Parameter Testing Guide10/11/2022
Copyright 2007 Nokia Siemens Networks.All rights reserved.
Figure 62: FDD_Reporting_Threshold 2
As for the coverage based ISHO for voice, the motivation for this is toprovide better service continuity in 3G if possible. At 2G border andwhen 3G coverage is good, there is many situation that intra GERAN HOfailed due to poor 2G neighbors and handover to WCDMA cells are notallowed due to low load threshold in 2G serving cell.
GSM to 3G Handover is also not triggered in previous release (beforeBSS13) due to the lower priority ISHO from GSM to 3G than intra GERAN HOcriteria (interference, RxQual or RxLev). When one or several higherpriority intra GERAN handover is exceeded but no handover is done due tobad GSM coverage, the evaluation of latter ISHO criteria is bypassed.
Figure 63: Scenario 2G to 3G HO not triggered in good 3G coverage (badGSM coverage)
83/102 GS MS NPO Network Planning & Optimization Capability
RAN Parameter Testing Guide10/11/2022
Copyright 2007 Nokia Siemens Networks.All rights reserved.
Figure 64: Benefits of coverage based ISHO for Voice
6.2.3 ParametersThe main parameters to optimize GSM handover to 3G are:
1. MET (Min. EcNo threshold)
MET tuning implies a compromise between blocked calls (GSM) and dropped calls (3G).
MET should be higher than CPICH EcNo threshold for IS-HO 3G->GSM (default=–12 dB), in order to avoid ping-pongs and dropped calls.
At least 3dB difference between MET and CPICH EcNo threshold is suggested. Proposed MET value is –9 dB.
2. FRT 2 (FDD_Reporting_Threshold 2)
FRT 2 is important able to improve ISHO or IS-NCCRs success rate and end users perceived quality.
FRT 2 should be higher than CPICH RSCP threshold for 3G to 2G ISHO (HHoRSCPThreshold =-105dBm) in order to avoid ping-poing handovers.
3. Qsearch_C
Qsearch_C implies a compromise between the lifetime battery and theavailability of the terminal to handover to 3G.
It would be good to know the 3G coverage levels so that IS-HO can happen quickly.
In the other hand, UE may unnecessarily measure 3G cells when thereis no need for ISHO.
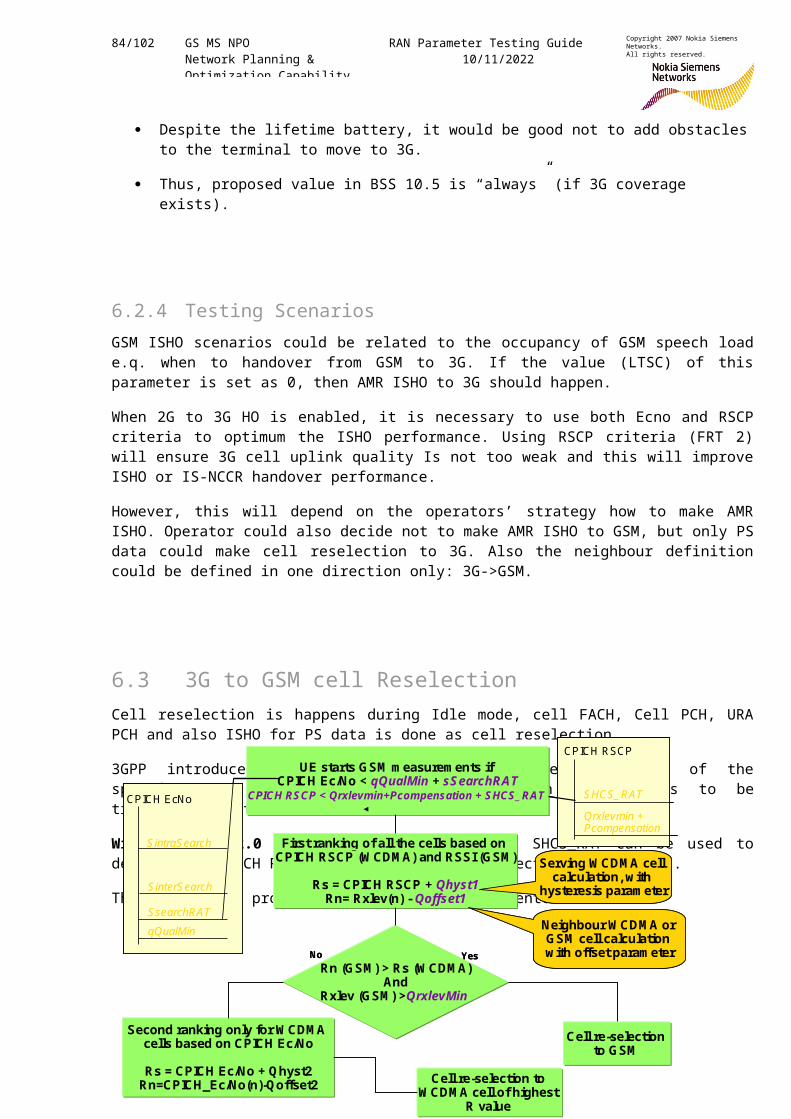
84/102 GS MS NPO Network Planning & Optimization Capability
RAN Parameter Testing Guide10/11/2022
Copyright 2007 Nokia Siemens Networks.All rights reserved.
Despite the lifetime battery, it would be good not to add obstaclesto the terminal to move to 3G.
Thus, proposed value in BSS 10.5 is “always” (if 3G coverage exists).
6.2.4 Testing ScenariosGSM ISHO scenarios could be related to the occupancy of GSM speech loade.q. when to handover from GSM to 3G. If the value (LTSC) of thisparameter is set as 0, then AMR ISHO to 3G should happen.
When 2G to 3G HO is enabled, it is necessary to use both Ecno and RSCPcriteria to optimum the ISHO performance. Using RSCP criteria (FRT 2)will ensure 3G cell uplink quality Is not too weak and this will improveISHO or IS-NCCR handover performance.
However, this will depend on the operators’ strategy how to make AMRISHO. Operator could also decide not to make AMR ISHO to GSM, but only PSdata could make cell reselection to 3G. Also the neighbour definitioncould be defined in one direction only: 3G->GSM.
6.3 3G to GSM cell ReselectionCell reselection is happens during Idle mode, cell FACH, Cell PCH, URAPCH and also ISHO for PS data is done as cell reselection.
3GPP introduced a change within the release 5 version of thespecifications which allows cell re-selection measurements to betriggered by both CPICH Ec/Io and CPICH RSCP.
With RN2.2 CD2.0 or RAS06 software release, SHCS_RAT can be used todefine this CPICH RSCP inter-system cell reselection measurement.
The reselection process from 3G to GSM is presented below.
First ranking of all the cells based on CPICH RSCP (W CDM A) and RSSI (GSM )
Rs = CPICH RSCP + Qhyst1Rn= Rxlev(n) -Qoffset1
Rn (GSM ) > Rs (W CDM A)And
Rxlev (GSM ) >QrxlevMin
YesNo
Cell re-selection to GSM
Neighbour W CDM A or GSM cell calculation w ith offset param eter
Serving W CDM A cell calculation, w ith
hysteresis param eter
UE starts GSM m easurem ents if CPICH Ec/No < qQualMin + sS earchRAT
CPICH RS CP < Qrxlevmin+Pcompensation + S HCS _ RAT
S intraS earch
S interS earch
S searchR AT
CPICH EcNo
qQualMin
Second ranking only for W CDM A cells based on CPICH Ec/No
Rs = CPICH Ec/No + Qhyst2Rn=CPICH_Ec/No(n)-Qoffset2 Cell re-selection to
W CDM A cell of highest R value
S HC S _ R AT
CPICH RSCP
Qrxlevmin + Pcompensation
First ranking of all the cells based on CPICH RSCP (W CDM A) and RSSI (GSM )
Rs = CPICH RSCP + Qhyst1Rn= Rxlev(n) -Qoffset1
Rn (GSM ) > Rs (W CDM A)And
Rxlev (GSM ) >QrxlevMin
YesNo
Cell re-selection to GSM
Neighbour W CDM A or GSM cell calculation w ith offset param eter
Serving W CDM A cell calculation, w ith
hysteresis param eter
UE starts GSM m easurem ents if CPICH Ec/No < qQualMin + sS earchRAT
CPICH RS CP < Qrxlevmin+Pcompensation + S HCS _ RAT
S intraS earch
S interS earch
S searchR AT
CPICH EcNo
qQualMin
S intraS earch
S interS earch
S searchR AT
CPICH EcNo
qQualMin
Second ranking only for W CDM A cells based on CPICH Ec/No
Rs = CPICH Ec/No + Qhyst2Rn=CPICH_Ec/No(n)-Qoffset2 Cell re-selection to
W CDM A cell of highest R value
S HC S _ R AT
CPICH RSCP
Qrxlevmin + Pcompensation
S HC S _ R AT
CPICH RSCP
Qrxlevmin + Pcompensation
85/102 GS MS NPO Network Planning & Optimization Capability
RAN Parameter Testing Guide10/11/2022
Copyright 2007 Nokia Siemens Networks.All rights reserved.
Figure 65 3G to GSM cell reselection process
6.3.1 ParametersThe most important parameters are mentioned already above:
Qhyst1 (hysteresis between GSM RSSI and 3G RSCP)
AdjgOffset1 (offset to be extracted from GSM RSSI)
qQualMin +sSearchRAT (start of Inter-System measurements using EcNo)
Qrxlevmin +Pcompensation +SHCS_RAT (start of inter-system neighbour measurement using RSCP )
6.3.2 Testing ScenariosWhen to trigger the cell reselection to 2G depends greatly on:
how much the 3G network is requested to be utilised (time on 3G)
target is to maximise the utilisation of WCDMA network but…
what is the desired CSSR
at the same time maximise the quality
minimise the possibility of ping – pong
There is a trade off between 3G utilization (time on 3G) and call setupSuccess rate in 3G. The following shows how to find the optimum settingon the balance between 3G utilization and CSSR in urban area.
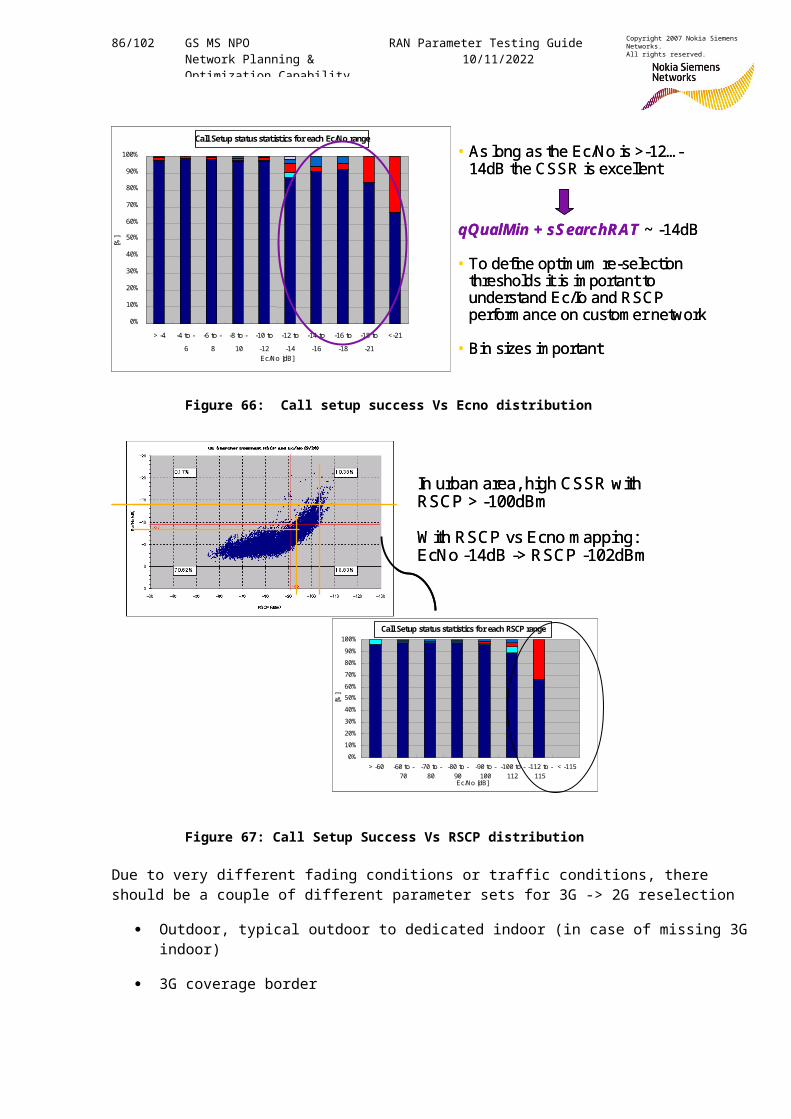
86/102 GS MS NPO Network Planning & Optimization Capability
RAN Parameter Testing Guide10/11/2022
Copyright 2007 Nokia Siemens Networks.All rights reserved.
Figure 66: Call setup success Vs Ecno distribution
Figure 67: Call Setup Success Vs RSCP distribution
Due to very different fading conditions or traffic conditions, there should be a couple of different parameter sets for 3G -> 2G reselection
Outdoor, typical outdoor to dedicated indoor (in case of missing 3Gindoor)
3G coverage border
0%
10%
20%
30%
40%
50%
60%
70%
80%
90%
100%
> -4 -4 to -6
-6 to -8
-8 to -10
-10 to-12
-12 to-14
-14 to-16
-16 to-18
-18 to-21
<-21
Ec/No [dB]
[%]
Call Setup status statistics for each Ec/No range• As long as the Ec/No is >-12…-14dB the CSSR is excellent
qQualMin + sS earchRAT ~ -14dB
•To define optim um re-selection thresholds it is im portant to understand Ec/Io and RSCP perform ance on custom er network
•Bin sizes im portant0%
10%
20%
30%
40%
50%
60%
70%
80%
90%
100%
> -4 -4 to -6
-6 to -8
-8 to -10
-10 to-12
-12 to-14
-14 to-16
-16 to-18
-18 to-21
<-21
Ec/No [dB]
[%]
Call Setup status statistics for each Ec/No range
0%
10%
20%
30%
40%
50%
60%
70%
80%
90%
100%
> -4 -4 to -6
-6 to -8
-8 to -10
-10 to-12
-12 to-14
-14 to-16
-16 to-18
-18 to-21
<-21
Ec/No [dB]
[%]
Call Setup status statistics for each Ec/No range
0%
10%
20%
30%
40%
50%
60%
70%
80%
90%
100%
> -4 -4 to -6
-6 to -8
-8 to -10
-10 to-12
-12 to-14
-14 to-16
-16 to-18
-18 to-21
<-21
Ec/No [dB]
[%]
Call Setup status statistics for each Ec/No range• As long as the Ec/No is >-12…-14dB the CSSR is excellent
qQualMin + sS earchRAT ~ -14dB
•To define optim um re-selection thresholds it is im portant to understand Ec/Io and RSCP perform ance on custom er network
•Bin sizes im portant
0%10%20%30%40%50%60%70%80%90%100%
> -60 -60 to -70
-70 to -80
-80 to -90
-90 to -100
-100 to -112
-112 to -115
< -115
Ec/No [dB]
[%]
Call Setup status statistics for each RSCP range
In urban area, high CSSR with RSCP > -100dBm
W ith RSCP vsEcno m apping: EcNo -14dB -> RSCP -102dBm
0%10%20%30%40%50%60%70%80%90%100%
> -60 -60 to -70
-70 to -80
-80 to -90
-90 to -100
-100 to -112
-112 to -115
< -115
Ec/No [dB]
[%]
Call Setup status statistics for each RSCP range
0%10%20%30%40%50%60%70%80%90%100%
> -60 -60 to -70
-70 to -80
-80 to -90
-90 to -100
-100 to -112
-112 to -115
< -115
Ec/No [dB]
[%]
Call Setup status statistics for each RSCP range
In urban area, high CSSR with RSCP > -100dBm
W ith RSCP vsEcno m apping: EcNo -14dB -> RSCP -102dBm
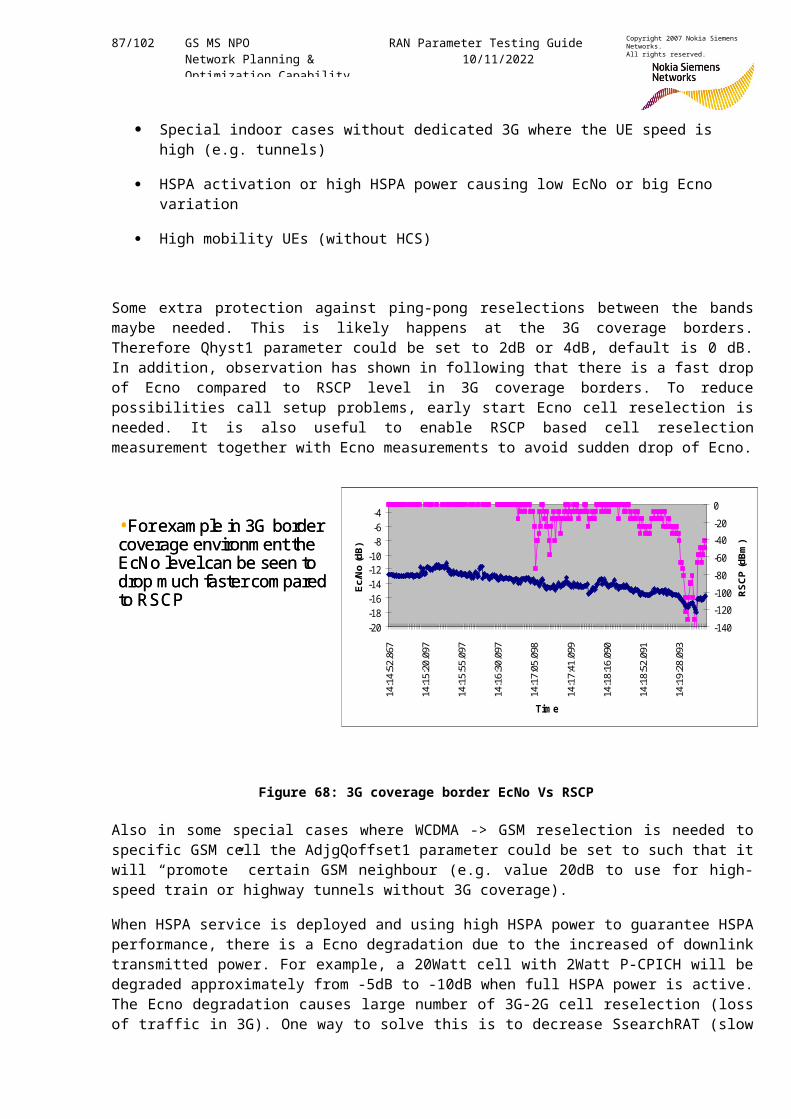
87/102 GS MS NPO Network Planning & Optimization Capability
RAN Parameter Testing Guide10/11/2022
Copyright 2007 Nokia Siemens Networks.All rights reserved.
Special indoor cases without dedicated 3G where the UE speed is high (e.g. tunnels)
HSPA activation or high HSPA power causing low EcNo or big Ecno variation
High mobility UEs (without HCS)
Some extra protection against ping-pong reselections between the bandsmaybe needed. This is likely happens at the 3G coverage borders.Therefore Qhyst1 parameter could be set to 2dB or 4dB, default is 0 dB.In addition, observation has shown in following that there is a fast dropof Ecno compared to RSCP level in 3G coverage borders. To reducepossibilities call setup problems, early start Ecno cell reselection isneeded. It is also useful to enable RSCP based cell reselectionmeasurement together with Ecno measurements to avoid sudden drop of Ecno.
Figure 68: 3G coverage border EcNo Vs RSCP
Also in some special cases where WCDMA -> GSM reselection is needed tospecific GSM cell the AdjgQoffset1 parameter could be set to such that itwill “promote” certain GSM neighbour (e.g. value 20dB to use for high-speed train or highway tunnels without 3G coverage).
When HSPA service is deployed and using high HSPA power to guarantee HSPAperformance, there is a Ecno degradation due to the increased of downlinktransmitted power. For example, a 20Watt cell with 2Watt P-CPICH will bedegraded approximately from -5dB to -10dB when full HSPA power is active.The Ecno degradation causes large number of 3G-2G cell reselection (lossof traffic in 3G). One way to solve this is to decrease SsearchRAT (slow
•For exam ple in 3G border coverage environm ent the EcNo level can be seen to drop m uch faster com pared to RSCP
-20-18-16-14-12-10-8-6-4
14:14:52.867
14:15:20.097
14:15:55.097
14:16:30.097
14:17:05.098
14:17:41.099
14:18:16.090
14:18:52.091
14:19:28.093
Tim e
Ec/No (dB)
-140-120-100-80-60-40-200
RSCP
(dBm
)
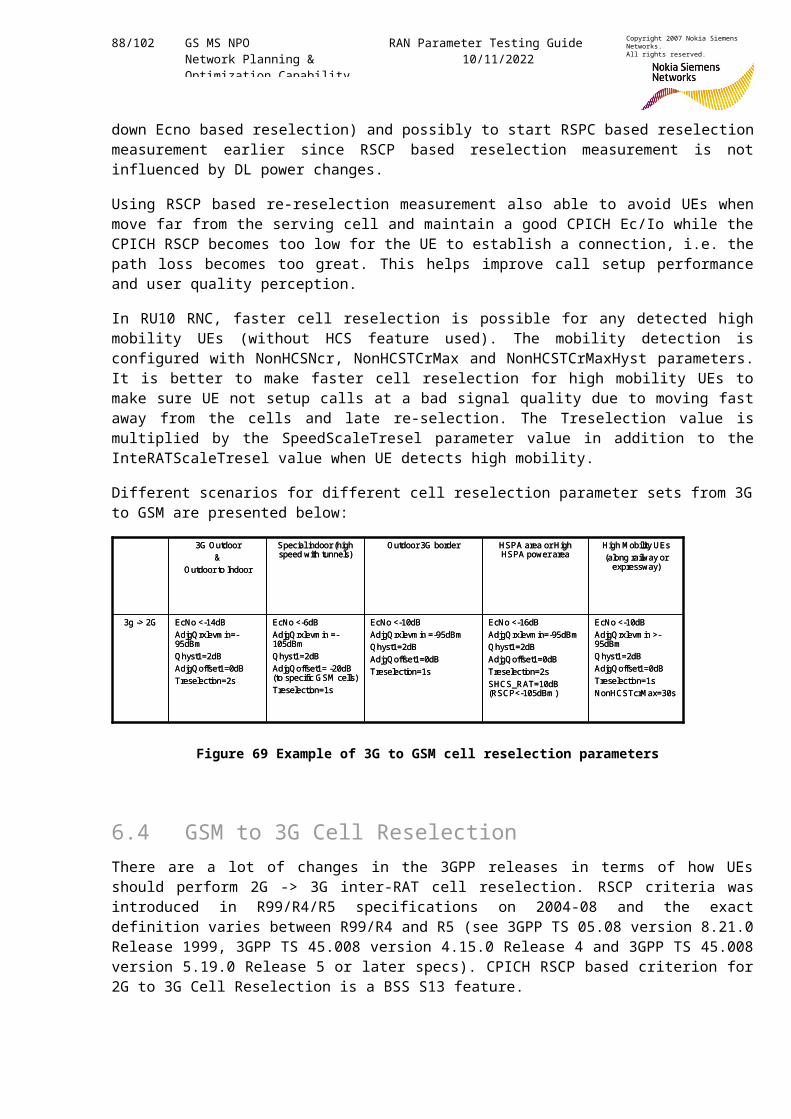
88/102 GS MS NPO Network Planning & Optimization Capability
RAN Parameter Testing Guide10/11/2022
Copyright 2007 Nokia Siemens Networks.All rights reserved.
down Ecno based reselection) and possibly to start RSPC based reselectionmeasurement earlier since RSCP based reselection measurement is notinfluenced by DL power changes.
Using RSCP based re-reselection measurement also able to avoid UEs whenmove far from the serving cell and maintain a good CPICH Ec/Io while theCPICH RSCP becomes too low for the UE to establish a connection, i.e. thepath loss becomes too great. This helps improve call setup performanceand user quality perception.
In RU10 RNC, faster cell reselection is possible for any detected highmobility UEs (without HCS feature used). The mobility detection isconfigured with NonHCSNcr, NonHCSTCrMax and NonHCSTCrMaxHyst parameters.It is better to make faster cell reselection for high mobility UEs tomake sure UE not setup calls at a bad signal quality due to moving fastaway from the cells and late re-selection. The Treselection value ismultiplied by the SpeedScaleTresel parameter value in addition to theInteRATScaleTresel value when UE detects high mobility.
Different scenarios for different cell reselection parameter sets from 3Gto GSM are presented below:
Figure 69 Example of 3G to GSM cell reselection parameters
6.4 GSM to 3G Cell ReselectionThere are a lot of changes in the 3GPP releases in terms of how UEsshould perform 2G -> 3G inter-RAT cell reselection. RSCP criteria wasintroduced in R99/R4/R5 specifications on 2004-08 and the exactdefinition varies between R99/R4 and R5 (see 3GPP TS 05.08 version 8.21.0Release 1999, 3GPP TS 45.008 version 4.15.0 Release 4 and 3GPP TS 45.008version 5.19.0 Release 5 or later specs). CPICH RSCP based criterion for2G to 3G Cell Reselection is a BSS S13 feature.
EcNo <-16dBAdjgQrxlevm in=-95dBmQ hyst1=2dBAdjgQoffset1=0dBTreselection=2sSHCS_RAT=10dB (RSCP<-105dBm )
HSPA area or High HSPA power area
EcNo <-10dBAdjgQrxlevm in >-95dBmQ hyst1=2dBAdjgQoffset1=0dBTreselection=1sNonHCSTcrM ax=30s
EcNo <-10dBAdjgQrxlevm in =-95dBmQhyst1=2dBAdjgQoffset1=0dBTreselection=1s
EcNo <-6dBAdjgQrxlevm in =-105dBmQhyst1=2dBAdjgQoffset1= -20dB (to specific G SM cells)Treselection=1s
EcNo <-14dBAdjgQrxlevm in=-95dBmQhyst1=2dBAdjgQoffset1=0dBTreselection=2s
3g -> 2G
High M obility UEs(along railway or expressway)
Outdoor 3G borderSpecial indoor (high speed with tunnels)
3G Outdoor &
O utdoor to Indoor
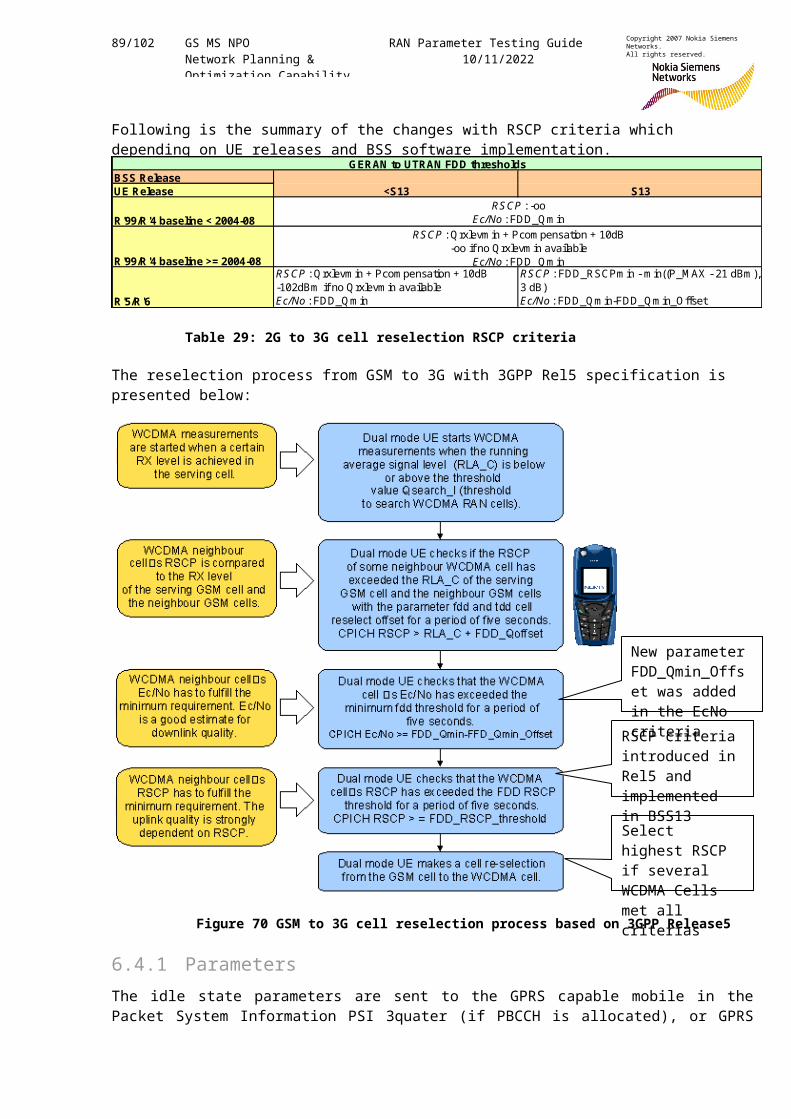
89/102 GS MS NPO Network Planning & Optimization Capability
RAN Parameter Testing Guide10/11/2022
Copyright 2007 Nokia Siemens Networks.All rights reserved.
Following is the summary of the changes with RSCP criteria which depending on UE releases and BSS software implementation.
Table 29: 2G to 3G cell reselection RSCP criteria
The reselection process from GSM to 3G with 3GPP Rel5 specification is presented below:
Figure 70 GSM to 3G cell reselection process based on 3GPP Release5
6.4.1 ParametersThe idle state parameters are sent to the GPRS capable mobile in thePacket System Information PSI 3quater (if PBCCH is allocated), or GPRS
BSS ReleaseUE Release
R'99/R'4 baseline < 2004-08
R'99/R'4 baseline >= 2004-08
R'5/R'6
R S C P : Qrxlevm in + Pcom pensation + 10dB-102dBm if no Q rxlevm in availableE c/No: FDD_Q m in
R S C P : FDD_RSCPm in - m in((P_M AX - 21 dBm ), 3 dB)E c/No: FDD_Qm in-FDD_Qm in_Offset
GERAN to UTRAN FDD thresholds
R S C P : -ooE c/No: FDD_Qm in
R S C P : Qrxlevm in + Pcom pensation + 10dB-oo if no Qrxlevm in available
E c/No: FDD_Qm in
<S13 S13
Select highest RSCP if several WCDMA Cells met all criterias
RSCP criteria introduced in Rel5 and implemented in BSS13
New parameter FDD_Qmin_Offset was added in the EcNo criteria
90/102 GS MS NPO Network Planning & Optimization Capability
RAN Parameter Testing Guide10/11/2022
Copyright 2007 Nokia Siemens Networks.All rights reserved.
and non-GRPS capable UEs with SI 2quater (if PBCCH is not allocated)messages on the PBCCH or BCCH.
The cell re-selection parameters that are sent on SI 2quater messagesare:
- threshold to search WCDMA RAN cells (qSearchI, qSearchP for GPRS enabled mobiles)
- cell reselect offset (FddQoffset)
- minimum fdd threshold (FddQmin)
- minimum fdd threshold offset (Fdd_Qmin_offset) from BSS13
- minimum RSCP threshold (FDD_RSCPmin) from BSS13
The set below is repeated for every neighbour WCDMA RAN cell:
- WCDMA downlink carrier frequency
- downlink transmission diversity
- scrambling code
Please be noted that PBCCH feature has been removed in BSS S13 (PCU2),therefore only SI 2quater is used to broadcast messages to non-GPRS andGPRS capable UEs. Also, GFDD_Qoffset and GFDD_Qmin are not used.
Re-selection measurements are controlled by the parameter qSearchI(qSearchP). The parameter defines a threshold and also indicates whetherthese measurements are performed when RSSI (a running average of receivedsignal level) of the serving GSM cell is below or above the threshold,see the picture below.
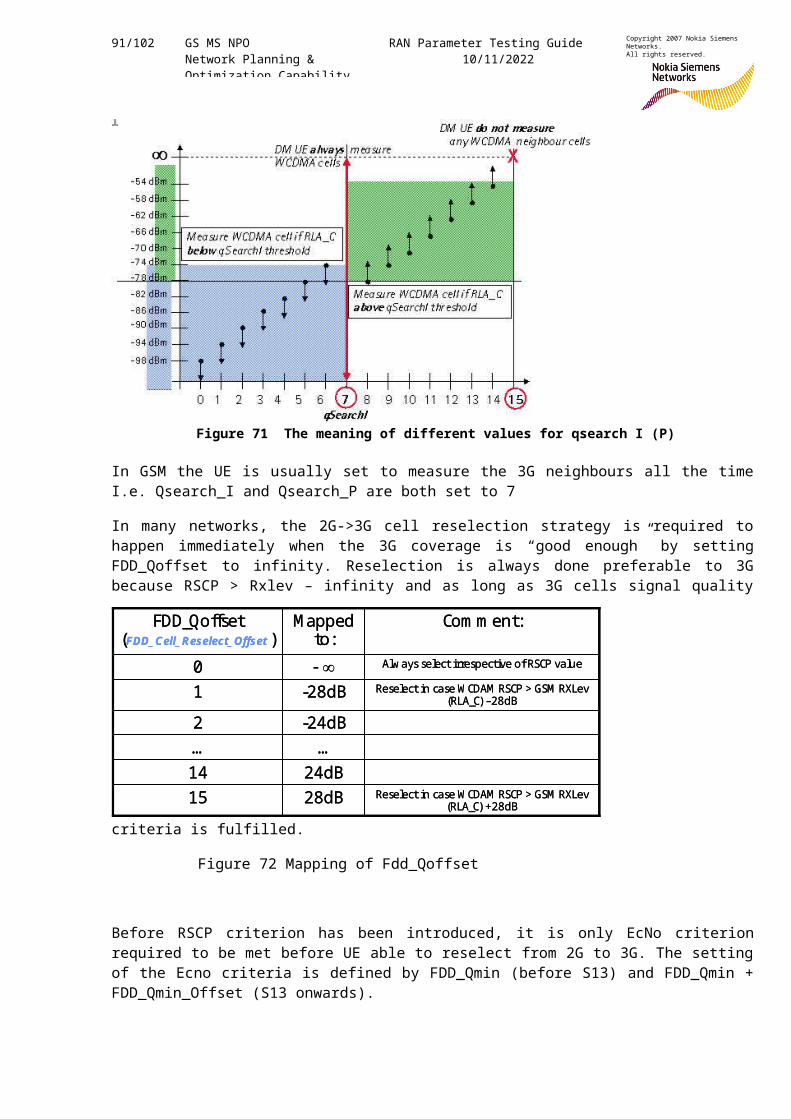
91/102 GS MS NPO Network Planning & Optimization Capability
RAN Parameter Testing Guide10/11/2022
Copyright 2007 Nokia Siemens Networks.All rights reserved.
Figure 71 The meaning of different values for qsearch I (P)
In GSM the UE is usually set to measure the 3G neighbours all the timeI.e. Qsearch_I and Qsearch_P are both set to 7
In many networks, the 2G->3G cell reselection strategy is required tohappen immediately when the 3G coverage is “good enough” by settingFDD_Qoffset to infinity. Reselection is always done preferable to 3Gbecause RSCP > Rxlev – infinity and as long as 3G cells signal quality
criteria is fulfilled.
Figure 72 Mapping of Fdd_Qoffset
Before RSCP criterion has been introduced, it is only EcNo criterionrequired to be met before UE able to reselect from 2G to 3G. The settingof the Ecno criteria is defined by FDD_Qmin (before S13) and FDD_Qmin +FDD_Qmin_Offset (S13 onwards).
Reselect in case W CDAM RSCP > GSM RXLev(RLA_C) +28dB28dB15
24dB14……
-24dB2
Reselect in case W CDAM RSCP > GSM RXLev(RLA_C) –28dB-28dB1
Alw ays select irrespective of RSCP value 0
Com m ent:Mapped to:
FDD_Qoffset (FDD_ Cell_ Reselect_ Offset )
Reselect in case W CDAM RSCP > GSM RXLev(RLA_C) +28dB28dB15
24dB14……
-24dB2
Reselect in case W CDAM RSCP > GSM RXLev(RLA_C) –28dB-28dB1
Alw ays select irrespective of RSCP value 0
Com m ent:Mapped to:
FDD_Qoffset (FDD_ Cell_ Reselect_ Offset )
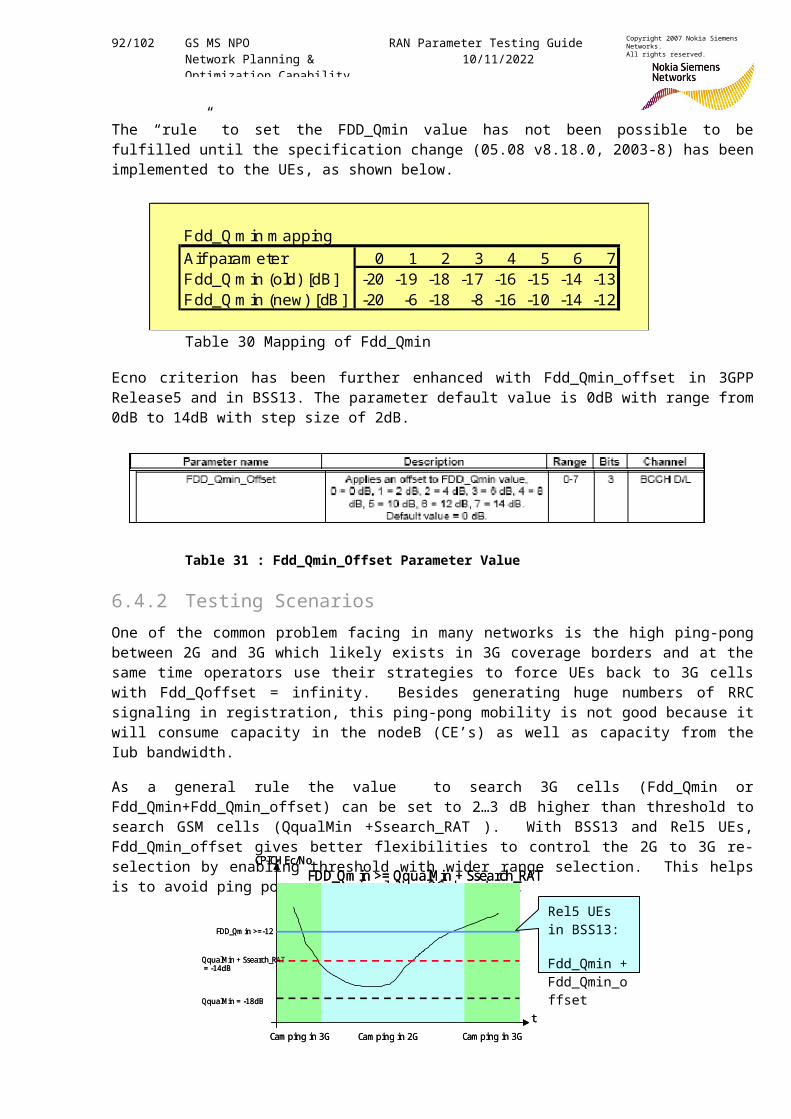
92/102 GS MS NPO Network Planning & Optimization Capability
RAN Parameter Testing Guide10/11/2022
Copyright 2007 Nokia Siemens Networks.All rights reserved.
The “rule” to set the FDD_Qmin value has not been possible to befulfilled until the specification change (05.08 v8.18.0, 2003-8) has beenimplemented to the UEs, as shown below.
Table 30 Mapping of Fdd_Qmin
Ecno criterion has been further enhanced with Fdd_Qmin_offset in 3GPPRelease5 and in BSS13. The parameter default value is 0dB with range from0dB to 14dB with step size of 2dB.
Table 31 : Fdd_Qmin_Offset Parameter Value
6.4.2 Testing ScenariosOne of the common problem facing in many networks is the high ping-pongbetween 2G and 3G which likely exists in 3G coverage borders and at thesame time operators use their strategies to force UEs back to 3G cellswith Fdd_Qoffset = infinity. Besides generating huge numbers of RRCsignaling in registration, this ping-pong mobility is not good because itwill consume capacity in the nodeB (CE’s) as well as capacity from theIub bandwidth.
As a general rule the value to search 3G cells (Fdd_Qmin orFdd_Qmin+Fdd_Qmin_offset) can be set to 2…3 dB higher than threshold tosearch GSM cells (QqualMin +Ssearch_RAT ). With BSS13 and Rel5 UEs,Fdd_Qmin_offset gives better flexibilities to control the 2G to 3G re-selection by enabling threshold with wider range selection. This helpsis to avoid ping pong scenario like 3G borders.
Fdd_Q m in m appingAif param eter 0 1 2 3 4 5 6 7Fdd_Q m in (old) [dB] -20 -19 -18 -17 -16 -15 -14 -13Fdd_Q m in (new) [dB ] -20 -6 -18 -8 -16 -10 -14 -12
QqualMin = -18dB
QqualMin + Ssearch_RAT= -14dB
FDD_Qm in >=-12
Cam ping in 3G Cam ping in 2G Cam ping in 3G
CPICH Ec/No
t
FDD_Qm in >= QqualMin + Ssearch_RAT
QqualMin = -18dB
QqualMin + Ssearch_RAT= -14dB
FDD_Qm in >=-12
Cam ping in 3G Cam ping in 2G Cam ping in 3G
CPICH Ec/No
t
FDD_Qm in >= QqualMin + Ssearch_RAT
Rel5 UEs in BSS13:
Fdd_Qmin + Fdd_Qmin_offset
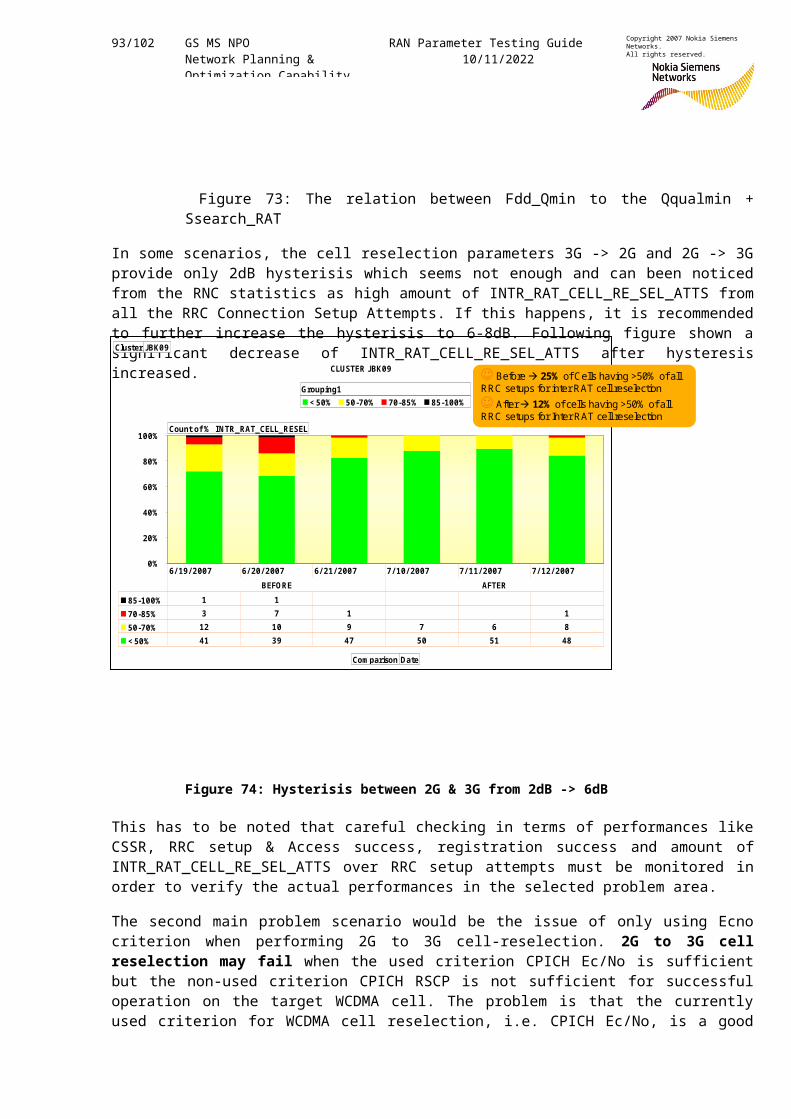
93/102 GS MS NPO Network Planning & Optimization Capability
RAN Parameter Testing Guide10/11/2022
Copyright 2007 Nokia Siemens Networks.All rights reserved.
Figure 73: The relation between Fdd_Qmin to the Qqualmin +Ssearch_RAT
In some scenarios, the cell reselection parameters 3G -> 2G and 2G -> 3Gprovide only 2dB hysterisis which seems not enough and can been noticedfrom the RNC statistics as high amount of INTR_RAT_CELL_RE_SEL_ATTS fromall the RRC Connection Setup Attempts. If this happens, it is recommendedto further increase the hysterisis to 6-8dB. Following figure shown asignificant decrease of INTR_RAT_CELL_RE_SEL_ATTS after hysteresisincreased.
Figure 74: Hysterisis between 2G & 3G from 2dB -> 6dB
This has to be noted that careful checking in terms of performances likeCSSR, RRC setup & Access success, registration success and amount ofINTR_RAT_CELL_RE_SEL_ATTS over RRC setup attempts must be monitored inorder to verify the actual performances in the selected problem area.
The second main problem scenario would be the issue of only using Ecnocriterion when performing 2G to 3G cell-reselection. 2G to 3G cellreselection may fail when the used criterion CPICH Ec/No is sufficientbut the non-used criterion CPICH RSCP is not sufficient for successfuloperation on the target WCDMA cell. The problem is that the currentlyused criterion for WCDMA cell reselection, i.e. CPICH Ec/No, is a good
CLUSTER JBK09
0%
20%
40%
60%
80%
100%
< 50% 50-70% 70-85% 85-100%
85-100% 1 170-85% 3 7 1 150-70% 12 10 9 7 6 8< 50% 41 39 47 50 51 48
6/19/2007 6/20/2007 6/21/2007 7/10/2007 7/11/2007 7/12/2007BEFORE AFTER
Cluster JBK09
Count of % INTR_RAT_CELL_RESEL
Com parison Date
Grouping1☺ Before 25% of Cells having >50% of all RRC setups for inter RAT cell reselection☺ After 12% of cells having >50% of all RRC setups for Inter RAT cell reselection
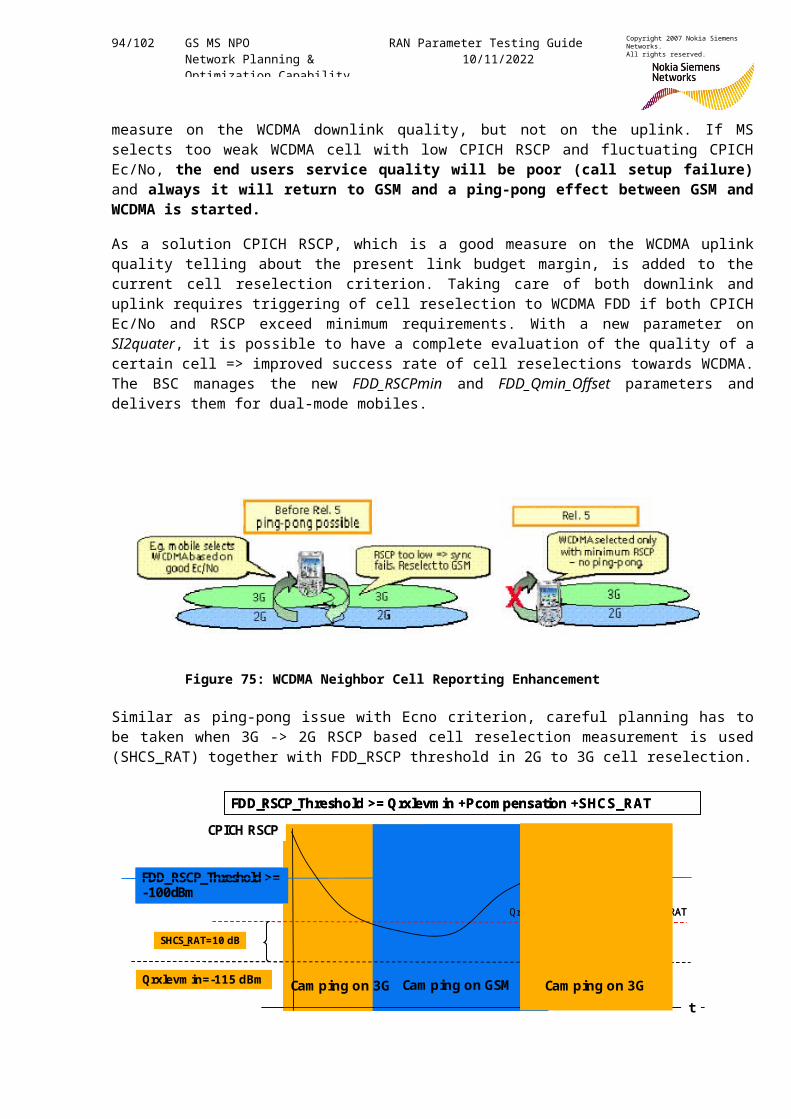
94/102 GS MS NPO Network Planning & Optimization Capability
RAN Parameter Testing Guide10/11/2022
Copyright 2007 Nokia Siemens Networks.All rights reserved.
measure on the WCDMA downlink quality, but not on the uplink. If MSselects too weak WCDMA cell with low CPICH RSCP and fluctuating CPICHEc/No, the end users service quality will be poor (call setup failure)and always it will return to GSM and a ping-pong effect between GSM andWCDMA is started.
As a solution CPICH RSCP, which is a good measure on the WCDMA uplinkquality telling about the present link budget margin, is added to thecurrent cell reselection criterion. Taking care of both downlink anduplink requires triggering of cell reselection to WCDMA FDD if both CPICHEc/No and RSCP exceed minimum requirements. With a new parameter onSI2quater, it is possible to have a complete evaluation of the quality of acertain cell => improved success rate of cell reselections towards WCDMA.The BSC manages the new FDD_RSCPmin and FDD_Qmin_Offset parameters anddelivers them for dual-mode mobiles.
Figure 75: WCDMA Neighbor Cell Reporting Enhancement
Similar as ping-pong issue with Ecno criterion, careful planning has tobe taken when 3G -> 2G RSCP based cell reselection measurement is used(SHCS_RAT) together with FDD_RSCP threshold in 2G to 3G cell reselection.
FDD_RSCP_Threshold >= Qrxlevm in +Pcom pensation +SHCS_RAT
Qrxlevm in=-115 dBm
SHCS_RAT=10 dB
CPICH RSCP
FDD_RSCP_Threshold >= -100dBm
Qrxlevm in+Pcom pensation +SHCS_RAT
tCam ping on 3G Cam ping on GSM Cam ping on 3G
FDD_RSCP_Threshold >= Qrxlevm in +Pcom pensation +SHCS_RAT
Qrxlevm in=-115 dBm
SHCS_RAT=10 dB
CPICH RSCP
FDD_RSCP_Threshold >= -100dBm
Qrxlevm in+Pcom pensation +SHCS_RAT
tCam ping on 3G Cam ping on GSM Cam ping on 3G
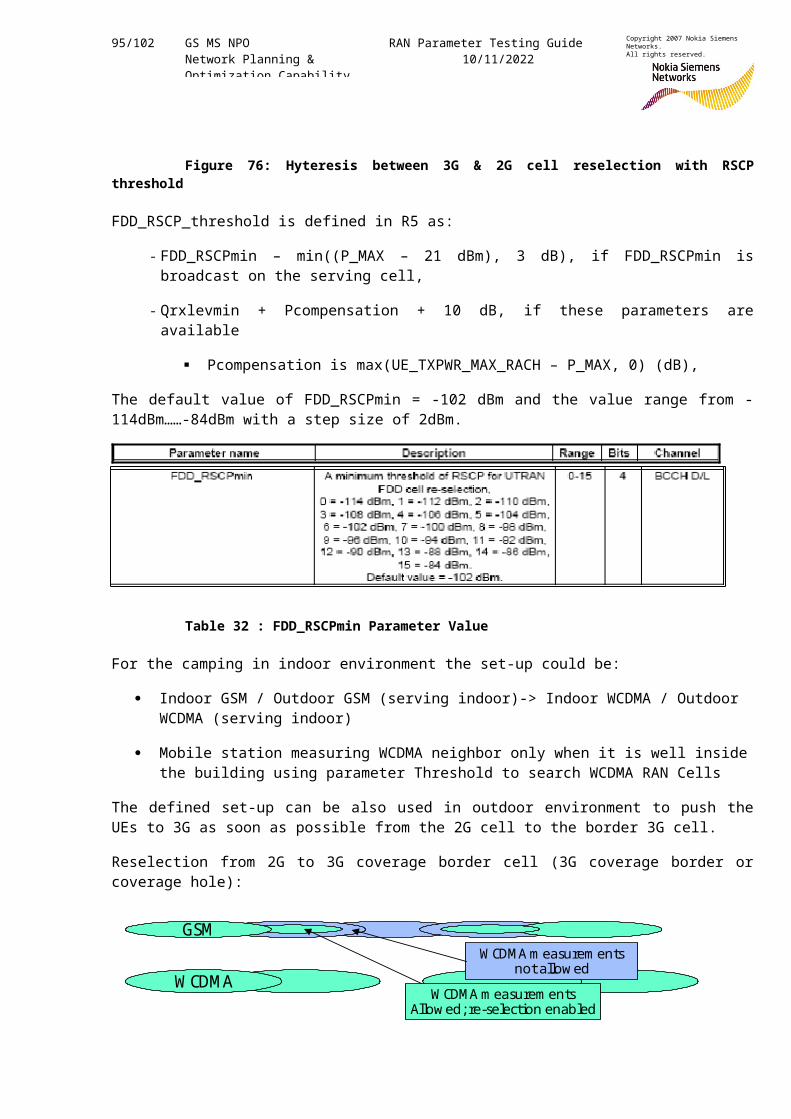
95/102 GS MS NPO Network Planning & Optimization Capability
RAN Parameter Testing Guide10/11/2022
Copyright 2007 Nokia Siemens Networks.All rights reserved.
Figure 76: Hyteresis between 3G & 2G cell reselection with RSCPthreshold
FDD_RSCP_threshold is defined in R5 as:
- FDD_RSCPmin – min((P_MAX – 21 dBm), 3 dB), if FDD_RSCPmin isbroadcast on the serving cell,
- Qrxlevmin + Pcompensation + 10 dB, if these parameters areavailable
Pcompensation is max(UE_TXPWR_MAX_RACH – P_MAX, 0) (dB),
The default value of FDD_RSCPmin = -102 dBm and the value range from -114dBm……-84dBm with a step size of 2dBm.
Table 32 : FDD_RSCPmin Parameter Value
For the camping in indoor environment the set-up could be:
Indoor GSM / Outdoor GSM (serving indoor)-> Indoor WCDMA / Outdoor WCDMA (serving indoor)
Mobile station measuring WCDMA neighbor only when it is well insidethe building using parameter Threshold to search WCDMA RAN Cells
The defined set-up can be also used in outdoor environment to push theUEs to 3G as soon as possible from the 2G cell to the border 3G cell.
Reselection from 2G to 3G coverage border cell (3G coverage border orcoverage hole):
W CDMA m easurem entsnot allow ed
W CDMA m easurem entsAllow ed; re-selection enabled
W CDMA
GSM
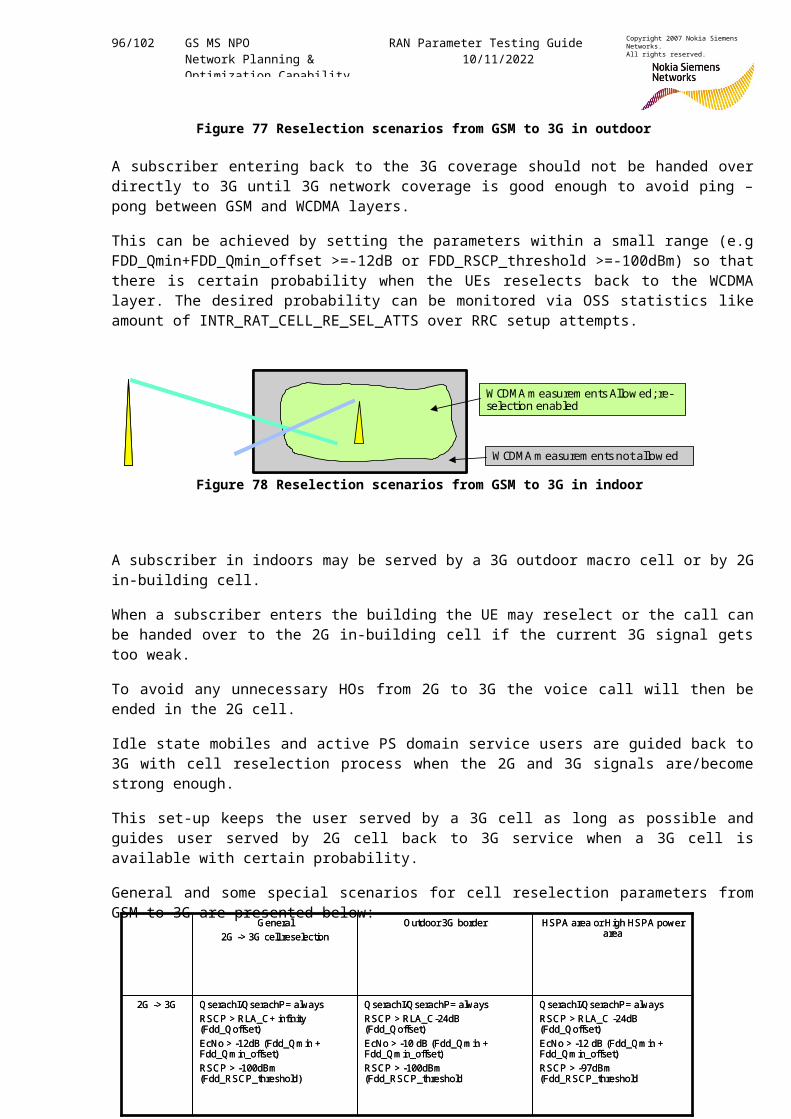
96/102 GS MS NPO Network Planning & Optimization Capability
RAN Parameter Testing Guide10/11/2022
Copyright 2007 Nokia Siemens Networks.All rights reserved.
Figure 77 Reselection scenarios from GSM to 3G in outdoor
A subscriber entering back to the 3G coverage should not be handed overdirectly to 3G until 3G network coverage is good enough to avoid ping –pong between GSM and WCDMA layers.
This can be achieved by setting the parameters within a small range (e.gFDD_Qmin+FDD_Qmin_offset >=-12dB or FDD_RSCP_threshold >=-100dBm) so thatthere is certain probability when the UEs reselects back to the WCDMAlayer. The desired probability can be monitored via OSS statistics likeamount of INTR_RAT_CELL_RE_SEL_ATTS over RRC setup attempts.
Figure 78 Reselection scenarios from GSM to 3G in indoor
A subscriber in indoors may be served by a 3G outdoor macro cell or by 2Gin-building cell.
When a subscriber enters the building the UE may reselect or the call canbe handed over to the 2G in-building cell if the current 3G signal getstoo weak.
To avoid any unnecessary HOs from 2G to 3G the voice call will then beended in the 2G cell.
Idle state mobiles and active PS domain service users are guided back to3G with cell reselection process when the 2G and 3G signals are/becomestrong enough.
This set-up keeps the user served by a 3G cell as long as possible andguides user served by 2G cell back to 3G service when a 3G cell isavailable with certain probability.
General and some special scenarios for cell reselection parameters fromGSM to 3G are presented below:
W CDMA m easurem ents Allow ed; re-selection enabled
W CDMA m easurem ents not allow ed
Q serachI/QserachP= alwaysRSCP > RLA_C -24dB (Fdd_Qoffset)EcNo > -12 dB (Fdd_Qm in + Fdd_Qm in_offset)RSCP > -97dBm (Fdd_RSCP_threshold
HSPA area or High HSPA power area
Q serachI/QserachP= alwaysRSCP > RLA_C-24dB (Fdd_Q offset)EcNo > -10 dB (Fdd_Qm in + Fdd_Qm in_offset)RSCP > -100dBm (Fdd_RSCP_threshold
QserachI/QserachP= alwaysRSCP > RLA_C+ infinity (Fdd_Qoffset)EcNo > -12dB (Fdd_Qm in + Fdd_Qm in_offset)RSCP > -100dBm (Fdd_RSCP_threshold)
2G -> 3G
O utdoor 3G borderGeneral 2G -> 3G cell reselection
97/102 GS MS NPO Network Planning & Optimization Capability
RAN Parameter Testing Guide10/11/2022
Copyright 2007 Nokia Siemens Networks.All rights reserved.
Figure 79 Example of GSM to 3G cell reselection parameters
98/102 GS MS NPO Network Planning & Optimization Capability
RAN Parameter Testing Guide10/11/2022
Copyright 2007 Nokia Siemens Networks.All rights reserved.
7. Summary of Parameter Testing ListAttached is the summary of the main parameters (RAS06/RU10) related to Rel99 RT and NRT performance in the aspect of:
RRC Setup & Access Performance
RAB Setup & Access Performance
Call Setup Time Performance
RAB Completion Performance
SHO Performance
PS Throughput Performance
3G to 2G Inter-RAT cell reselection and Intersystem Handover
2G to 3G Inter-RAT cell reselection and Intersystem Handover
99/102 GS MS NPO Network Planning & Optimization Capability
RAN Parameter Testing Guide10/11/2022
Copyright 2007 Nokia Siemens Networks.All rights reserved.
8. References1. Nokia Japan: Parameter Testing Reports for Vodafone KK2. Nokia Singapore : Parameter Testing Reports for M1 & StarHub3. Nokia Taiwan: Parameter Testing for CHT4. Hagedorn Thorsten: Tmobile Parameter Testing5. ISHO verification and Optimisation in NTN6. SIG Parameter Report V1.07. RANOP1_M5_ISHO_RAS06_v.07072008.ppt8. RANOP1_M6_Parameter Optimisation_RAS06_v07072008.ppt9. Celcom RAN Opti Acceptance Final Report v1.0.doc
10. RAS06_Pre-Optimization_Guide_update_0508.doc11. 3G_Radio_Network_Planning_Guideline_v.1.0_RU10.doc12. BSS 13 FUD.pdf13. Coverage_Based_ISHO_in_Dedicated_Mode_v2.pdf14. GSM_to_WCDMA_Advanced_Cell_Reselection_v2.pdf15. WCDMA_Neighbour_Cell_Reporting_Enhancement_v2.pdf16. S13_BSS20477_RSCP_AdvCellReselection_v1.doc
100/102 GS MS NPO Network Planning & Optimization Capability
RAN Parameter Testing Guide10/11/2022
Copyright 2007 Nokia Siemens Networks.All rights reserved.
9. Acronyms/Glossary
- 3G Third Generation- 2G Second Generation- BER Bite Error Rate - BH Busy Hour- kbps Kilo Bites per Second- BTS Base Transmitter Station- CE Channel Elements- CSSR Call Set-up Success Rate- dB Decibel Bell- dBi Decibel Isotropic- dBm Decibel Millie Volts- DL Down Link- Eb/No Energy per bit per Hertz of noise spectral density- Ec/Io Chip Energy over Interference- Erl Erlang- EIRP Effective Isotropic Radiated Power dBm- HW Hard Ware- Hz Hertz- Kbps Kilobits Per Second- Km KiloMeters- LNA Low Noise Amplifier- S seconds- m Meters- Mbytes Mega Bytes- MHz Mega Hertz- MS Mobile Station- RF Radio Frequency- RX Receives- RUR Rural- SHO Soft Handoff- TCH Traffic Channel- TX Transmitter- UL Up Link- DL Downlink- ISHO Inter System Handover- AMR Adaptive Multirate - PS Packet Scheduler- ISCU Interface Signaling Control Unit- RNC Radio Network Controller- RSCP Received Signal Code Power- Ecno Carrier energy over thermal noise ratio
101/102 GS MS NPO Network Planning & Optimization Capability
RAN Parameter Testing Guide10/11/2022
Copyright 2007 Nokia Siemens Networks.All rights reserved.
- UE User Equipment - ATO Activation Time Offset- RAN Radio Access Network- BSS Base Station Subsystem
102/102 GS MS NPO Network Planning & Optimization Capability
RAN Parameter Testing Guide10/11/2022
Copyright 2007 Nokia Siemens Networks.All rights reserved.
10. Annex A