dynamic changes in energy metabolism upon embryonic stem cell differentiation support developmental...
TRANSCRIPT

Toxicology 324 (2014) 76–87
Dynamic changes in energy metabolism upon embryonic stem celldifferentiation support developmental toxicant identification
Dorien A.M. van Dartel a,*, Sjors H. Schulpen b,c, Peter T. Theunissen b,Annelies Bunschoten a, Aldert H. Piersma b,c, Jaap Keijer a
aHuman and Animal Physiology, Wageningen University, P.O. Box 338, 6700 AH Wageningen, The Netherlandsb Laboratory for Health Protection Research, National Institute for Public Health and the Environment (RIVM), P.O. Box 1, 3720 BA Bilthoven, The Netherlandsc Institute for Risk Assessment Sciences, Faculty of Veterinary Medicine, Utrecht University, P.O. Box 80.163, 3508 TD Utrecht, The Netherlands
A R T I C L E I N F O
Article history:Received 24 June 2014Received in revised form 24 July 2014Accepted 24 July 2014Available online 30 July 2014
Keywords:Energy metabolismEmbryonic stem cellsEmbryonic stem cell test (EST)ToxicologyTranscriptomics
A B S T R A C T
Embryonic stem cells (ESC) are widely used to study embryonic development and to identifydevelopmental toxicants. Particularly, the embryonic stem cell test (EST) is well known as in vitro modelto identify developmental toxicants. Although it is clear that energy metabolism plays a crucial role inembryonic development, the modulation of energy metabolism in in vitro models, such as the EST, is notyet described. The present study is among the first studies that analyses whole genome expression datato specifically characterize metabolic changes upon ESC early differentiation. Our transcriptomicanalyses showed activation of glycolysis, truncated activation of the tricarboxylic acid (TCA) cycle,activation of lipid synthesis, as well as activation of glutaminolysis during the early phase of ESCdifferentiation. Taken together, this energy metabolism profile points towards energy metabolismreprogramming in the provision of metabolites for biosynthesis of cellular constituents. Next, we defineda gene set that describes this energy metabolism profile. We showed that this gene set could besuccessfully applied in the EST to identify developmental toxicants known to modulate cellularbiosynthesis (5-fluorouracil and methoxyacetic acid), while other developmental toxicants or thenegative control did not modulate the expression of this gene set. Our description of dynamic changes inenergy metabolism during early ESC differentiation, as well as specific identification of developmentaltoxicants modulating energy metabolism, is an important step forward in the definition of theapplicability domain of the EST.
ã 2014 Elsevier Ireland Ltd. All rights reserved.
Contents lists available at ScienceDirect
Toxicology
journal homepa ge: www.elsev ier .com/locate / tox icol
1. Introduction
Embryonic stem cells (ESC) are derived from the inner cell massof the pre-implementation embryo, and are considered theprototypical stem cells (Evans and Kaufman, 1981). These cellscan be cultured for a prolonged period without losing theirpluripotent characteristics, and can be induced to differentiate intoall foetal and adult cell types. In vitro, it has been shown that ESCcan originate a wide variety of cell types, including cardiomyocyte,neural and hepatic cells. These in vitro models can provide apowerful model system to study embryonic development on thelevel of embryonic cell differentiation. Experiments comparinggene expression profiles of in vivo embryonic development and invitro ESC differentiation have shown significant overlap in the
* Corresponding author. Tel.: +31 317 484136.E-mail addresses: [email protected], [email protected]
(D.A.M. van Dartel).
http://dx.doi.org/10.1016/j.tox.2014.07.0090300-483X/ã 2014 Elsevier Ireland Ltd. All rights reserved.
regulation of genes annotated to developmental processes (Hettneet al., 2013; Robinson et al., 2011).
The good correlation between modulation of processes in vivoand in vitro explains the successful initiatives of ESC differentia-tion-based in vitro approaches for identification of developmentaltoxic compounds (Wobus and Loser, 2011). The best knownexample of these approaches is the embryonic stem cell test (EST)(Spielmann et al., 1997). Initially, identification of developmentaltoxicants was based on disturbance of ESC differentiation intocardiomyocytes. Later, more objective molecular endpoint meas-ures were introduced (Osman et al., 2010; Seiler et al., 2004; vanDartel et al., 2009a), which improved the efficiency, objectivity,and accuracy of the EST.
Gene expression changes upon ESC differentiation generallyshow enrichment of three processes: cell cycling, development andmetabolism (van Dartel et al., 2010b). The first two themes haveoften been identified to be regulated upon ESC differentiation,whereas altered energy metabolism has been less extensivelydescribed. Recently, a de novo analysis of ESC differentiation

D.A.M. van Dartel et al. / Toxicology 324 (2014) 76–87 77
transcriptomics data has shown a network of genes that are clearlyenriched for energy metabolism (Pennings et al., 2011). This studyindicated that altered energy metabolism is a common finding inESC differentiation studies. Although this study has shownregulation of common genes involved in energy metabolism, itdid not provide direct insight into the type of physiologicalalterations in energy metabolism that take place upon ESCdifferentiation.
Energy metabolism is pivotal during mammalian development.For example, during early mammalian development, embryos areadapted for glycolytic energy production, but acquire the depen-dence on oxidative metabolism at several times during pre- andpost-implantation development (Knudsen and Green, 2004). In invitro studies, this shift from anaerobic (glycolytic) metabolism toaerobic (oxidative phosphorylation) metabolism has also beenobserved during differentiation of stem cells (Varum et al., 2011).Moreover, energy metabolism can also be adapted for generation ofbuilding blocks for growth, a process characteristic for cells withhigh proliferative capacity (Lunt and Vander Heiden, 2011). So far,most studies that evaluated alterations of energy metabolism uponESC differentiation compared mitochondrial activities of stem cellswith that of fully differentiated cell types. Although these studiesgave important insight into changes of metabolism-relatedprocesses upon stem cell differentiation, these studies were limitedby the relatively late stages of differentiation that were studied, aswell as by their predefined end point measurements. Although it isclear that energy metabolism is one of the major regulatedprocesses during development, a detailed description of the typeof changes in energy metabolism upon early ESC differentiation iscurrently lacking. An improved description of the biologicalprocesses that are active during ESC differentiation, includingenergy metabolism, will contribute to an improved description ofthe applicability domain of the EST, which is essential for moreaccurate identification of developmental toxicants.
Whole genome gene expression analysis is a technique thatdoes not necessarily require prior mechanistic knowledge andprovides an integral platform for identification of effects betweengroups. It is ideally suited to genome-wide describe developmentalchanges in detail. In this study, we have used this attractive tool toelucidate the shift in energy metabolism upon ESC differentiationduring an early and broad time span. Our results show that energymetabolism is altered during early ESC differentiation to favor cellgrowth. Moreover, we demonstrate that altered gene expression ofan energy metabolism based gene-set can successfully be used toidentify developmental toxicants. This study contributes to animproved description of the applicability domain of the EST, and tomechanism-based identification of developmental toxicants usingthe EST.
2. Materials and methods
2.1. Data set selection
We used the largest data repository ArrayExpress (Parkinsonet al., 2011), which encompasses over 50.000 MIAME-compliantexperiments, to select data sets for our analyses. The search term:‘stem cell’ AND ‘differentiation’ was used to identify potentialusable data sets. Data sets that were not available when we startedour analyses (August 7, 2013) were excluded. We reasoned that astudy should include at least 12 samples in order to representsufficient time points to reflect dynamic temporal changes and toobtain sufficient statistical power. Only data derived from humanor mouse ESC were included. Finally, the study design of eachremaining study was evaluated for inclusion.
In this work, gene expression data of our previously publishedwork on neuronal differentiation of ES-ES-D3 ESC was used to
validate the findings of the de novo analysis. The raw data of thisstudy have been deposited in EBI’s ArrayExpress (http://www.ebi.ac.uk/arrayexpress) and are accessible through ArrayExpressaccession number E-MTAB-1108. Methods and data regardingculture conditions and gene expression profiling have beendescribed in full detail by Theunissen et al. (Theunissen et al., 2011).
2.2. Data analysis and statistics
All selected studies forouranalyses used the Affymetrix platform.Raw data were downloaded from ArrayExpress and the AffymetrixCEL files were normalizedusing the Robust Multichip Average (RMA)algorithm (Irizarry et al., 2003) using RMAexpress (Bolstad et al.,2003). For probe to gene mapping, a custom Common Data Format(CDF) was performed as we described previously (van Dartel et al.,2010a). In total, 16,346 probe sets were used in our analyses.
Statistical analyses were carried out using the R statisticalsoftware environment (http://www.r-project.org) using ln-trans-formed values. Maximal fold ratios (FR) in individual geneexpression between the experimental groups were determinedby comparing the average normalized signal values per group.Genes that were significantly differentially expressed between anyof the experimental groups were identified by a one-way ANOVAon the normalized data, using the cut-off criterium FDR < 0.01.Arrangement of the samples was achieved by hierarchicalclustering using GeneMaths XT based on Euclidian clustering incombination with Ward linkage (Applied Maths, Sint-Martens-Latem, Belgium).
To study similarities in differentiation progression between theselected data sets we compared the gene expression profiles of apreviously identified set of genes that have been previouslyidentified to be related to pluripotency (Assou et al., 2007).Additionally, we selected marker genes for to evaluate similaritiesin proliferation, pluripotency and differentiation. Initially, weselected 3–4 marker genes per process based on scientificliterature (all processes) and on our own historic data (differenti-ation). Marker genes were included in the analysis if these geneswere present on all platforms used in our analyses and if thesegenes were present in the work data set for data analyses. Forproliferation we used Ccnd1, Ccne1, and Pcna (Kanehisa and Goto,2000; Stacey, 2003), for pluripotency we used Pou5f1 and Sox2(Chambers and Tomlinson, 2009), and for differentiation we usedCyp26a1, Gata4, Vegfa, and Rbp4 (Hescheler et al., 2006).
To evaluate enrichment of biological process, molecularfunction or cellular component of the gene clusters, DAVID EASEwas used (http://david.abcc.ncifcrf.gov) (Huang da et al., 2009).This annotation was performed using only terms to which maximal300 genes are annotated, to exclude terms that are too general forfunctional interpretation. Terms with an enrichment score >5 wereused to describe the enrichment of the gene clusters.
Gene set enrichment analysis (GSEA) was performed to discoverdifferential expression of sets of genes that are related to energymetabolism (Subramanian et al., 2005). For the GSEA, we refinedthe publicly available C5 gene set collection for energy metabo-lism-related gene sets by only including the child terms of the term‘metabolic process’. Gene sets were considered being significantlyaffected if p < 0.05. GSEA was followed by molecular conceptanalysis, in which the regulated gene sets are visualized within anetwork based on their overlap in genes, as we describedpreviously (van Dartel et al., 2009b).
Analysis of glucose levels in ES-ES-D3 ESC tissue culture medium
Glucose levels were analyzed in medium samples of pluripotentES-D3 ESC and ES-D3 ESC differentiation cultures at day 3, 5 and 7,using three biological replicates. Cells were cultured as we described

Data should be availableData sets: 357
Total samples in study ≥12Data sets: 187
Commonly used speciesData sets: 177
Relevant study design - first screeningData sets: 25
Relevant study design - second screeningData sets: 5
Meta-data availableData sets: 5
Search term: ‘stem cell’ differentiationData sets: 475
Fig. 1. Number of data sets that fulfilled the selection criteria for the de novoanalysis of the present study.
78 D.A.M. van Dartel et al. / Toxicology 324 (2014) 76–87
previously (Theunissen et al., 2010). For glucose analysis, we used anautomated enzymatic/colorimetric-based analysis method, which isprimarily used to determine whole blood glucose levels (Freestyle,Abbott Diabetes Care, Hoofddorp, The Netherlands). Medium wasrefreshed 24 h prior to medium sampling, and the difference inglucose concentration was calculated and corrected for proteincontent as determined using a micro BCA assay (Thermo FisherScientific, Breda, The Netherlands). A technical triplicate of eachmeasure was included. To confirm the accuracy of this device onmeasuring glucose concentration in tissue culture medium samples,medium-based glucose calibration curves were analyzed, whichshowed to be linear up to 20 mM glucose (data not shown).Significant differences on glucose levels were identified using one-way ANOVA and Dukey’s post-hoc test. Results were consideredstatistically significant if p-value < 0.05.
2.3. Analysis of citrate synthase activity in ES-D3 ESC tissue culturemedium
Citrate synthase (CS) activity was analyzed in pluripotent ES-D3ESC and ES-D3 ESC differentiation cultures at day 3, 5 and 7, usingthree biological replicates. The CS assay kit (Sigma–Aldrich,Zwijndrecht, The Netherlands) was used to determine CS activityaccording to the manufacturer’s protocol. Total protein concentra-tion was determined using a micro BCA assay, and equal proteinconcentrations were used for the CS activity determination. Atechnical triplicate of each measure was included. Significantdifferences on CS activity were identified using one-way ANOVAand Dukey’s post-hoc test. Results were considered statisticallysignificant if p-value < 0.05.
2.4. Identification of developmental toxicants that modulate energymetabolism
To identify developmental toxicants that specifically modulatecellularbiosynthesis,ageneset wasdefined thatcomprise genesthatare annotated to the identified processes of energy metabolism thatare altered to favor cellular growth. Next, we used this gene set tovisualize ESC differentiation using PCA as we described previously(van Dartel et al., 2010c). Our previously published whole genomegene expression data (deposited in EBI’s ArrayExpress and availablevia accession number E-TABM-903). This data sets includes controlESC differentiation cultures isolated at 0 h, 24 h, and 48 h afterdifferentiation induction (corresponding with culture day 3, 4, and5), as well as ESC differentiation cultures exposed for 24 h from theonset of differentiation (embryoid body stage at day 3) to selected(non-) developmental toxicants (0.45 mM 5-fluorouracil, 5 mMlithium chloride, 8.5 mM methoxyacetic acid, 1.4 mM monobutyl
Table 1Main characteristics of data sets included in the analyses of the present study.
Author cell line(species)
PubmedID
Dataaccessionnumber
Platform n (pergroup)
n(total)
Diff
Hailesellasse-Sene et al.
R1(Musmusculus)
17394647 E-GEOD-2972
AffymetrixMOE430 Aen B
3 33 Emabsnor
Hailesellasse-Sene et al.
V6.5(Musmusculus)
17394647 E-GEOD-3231
AffymetrixMOE430 Aen B
3 33 Emabsnor
Hailesellasse-Sene et al.
J1(Musmusculus)
17394647 E-GEOD-3749
AffymetrixMOE430 Aen B
3 33 Emabsnor
Theunissenet al.
ES-D3(Musmusculus)
21613230 E-TABM-1108
AffymetrixMouseGenome430 2.0
8 64 Emof aadd
phthalate, 1.1 mM penicillin G, 12 nM retinoic acid, 0.8 mM valproicacid). Concentrations were calculated to inhibit ESC differentiationwith 50% compared to control cultures. For each compound-exposedgroup, coordinates along the first and second principal componentwere calculated and deviation of the groups from their time-matched control on these coordinates was analysed by a t-test onboth the first and second principal component. Cultures wereconsidered to deviate statistically significant from their time-matched controls if p-value < 0.05.
3. Results
3.1. Data set selection
Five out of 475 data sets related to stem cell differentiationfulfilled all our inclusion criteria (Fig. 1). Of these five data sets,three data sets were published by Hailesellasse-Sene et al. Thesedata sets consist of whole genome gene expression data of three
erentiation protocol Main cell typespresent at end ofdifferentiationprotocol
Sampling(day)
bryoid body culture with LIF removal andence of murine embryonic feeder cells,moxic
Meso-, ecto-, andendodermaloriginated cells
0, 0.25, 0.5,0.75, 1, 1.5,2, 4, 7, 9,14
bryoid body culture with LIF removal andence of murine embryonic feeder cells,moxic
Meso-, ecto-, andendodermaloriginated cells
0, 0.25, 0.5,0.75, 1, 1.5,2, 4, 7, 9,14
bryoid body culture with LIF removal andence of murine embryonic feeder cells,moxic
Meso-, ecto-, andendodermaloriginated cells
0, 0.25, 0.5,0.75, 1, 1.5,2, 4, 7, 9,14
bryoid body culture with LIF removal, additionll-trans retinoic acid, serum deprivation, andition of neural growth factors, normoxic
Ectodermaloriginated cells
0, 3, 4, 5, 7

-10 0 10 20
-15
-10
-50
510
1520
PC1 (56.9%)
PC
2 (1
4.7%
)
d0.25
d0
d0.5
d0.75d1
36h
48h 4d7d 14d
d9
d0.25
d0
d0.5
d0.75
d1
d1.5
d2
d4
d7 d14d9
d0.25 d0
d0.5 d0.75
d1
d1.5
d2
d4
d7
d14
d9
R1 V6.5J1
-4 -2 +1 2 4_
V6.5
Ccnd1Ccne1Pcna
Pou5f1Sox2
Pluripotency-related
Cyp26a1
Gata4
Vegfa
Rbp4
Differentiation-related Proliferation-related
R1
0 1 2 3 4 5 6 7 8 9 10 11 12 13 14-8
-4
-2
+1
2
4
8
16
J1
Gen
e ex
pres
sion
(a
vera
ge fo
ld c
hang
e)
Differentiation duration (days)
t=d0
t=d0
.25
t=d0
.5t=
d0.7
5t=
d1t=
d1.5
t=2d
t=d4
t=d7
t=d9
t=d1
4
V6.5
t=d0
t=d0
.25
t=d0
.5t=
d0.7
5t=
d1t=
d1.5
t=2d
t=d4
t=d7
t=d9
t=d1
4
R1
t=d0
t=d0
.25
t=d0
.5t=
d0.7
5t=
d1t=
d1.5
t=2d
t=d4
t=d7
t=d9
t=d1
4
J10 1 2 3 4 5 6 7 8 9 10 11 12 13 14
-8
-4
-2
+1
2
4
8
16
Gen
e ex
pres
sion
(a
vera
ge fo
ld c
hang
e)
Differentiation duration (days)
0 1 2 3 4 5 6 7 8 9 10 11 12 13 14-8
-4
-2
+1
2
4
8
16G
ene
expr
essi
on
(ave
rage
fold
cha
nge)
Differentiation duration (days)
A
B
C
Fig. 2. Identification of similarities and differences of basic cell differentiation characteristics between the R1, J1 and V6.5 data sets. PCA-based differentiation tracks based on2834 significantly regulated genes (A). Gene expression profiles of pluripotency-related genes (B). Gene expression regulation of marker genes for proliferation, pluripotency,and differentiation (C).
D.A.M. van Dartel et al. / Toxicology 324 (2014) 76–87 79
cell lines, namely mouse R1, J1, and V6.5 ESC, each representing aunique data set (Hailesellasse Sene et al., 2007). The fourth data setdescribed transcription profiling of mouse CGR8 ESC, which wasobtained by Hescheler and co-workers and was published as partof the FunGenES database study (Schulz et al., 2009). The fifth dataset is one of our own, which we included as validation data set apriori, and describes neuronal differentiation of ES-D3 ESC(Theunissen et al., 2011a).
Initially, we aimed to include one data set for our mainanalyses. However, since we identified that three data setsobtained by the same research group were available, we selectedthese three data sets for our main analyses. These three datasetsare from three distinct cell lines, which provides the necessarybiological robustness to the analysis. As decided in advance, thedata set of Theunissen et al. was used to validate our findings. Themain characteristics of the selected data sets are summarizedin Table 1.
3.2. Gene expression analyses – impression of selected data sets
Our first analyses focused on identifying similarities and differ-ences of cell differentiation routes and associated basic character-istics between the J1, R1 and V6.5 data sets, which is essential forinterpretation of our subsequent data analyses. Principal componentanalysis (PCA)-based differentiation track analysis has proven to be auseful strategy for this (van Dartel et al., 2010c). Fig. 2A shows thedifferentiation tracks of the three data sets based on 2834 genes thatwere significantly regulated (FDR < 0.01) in at least two out of thethree data sets. The PCA showed that 71.6% of all variance betweenexperimental groups could be described using only the first andsecond principal components of the PCA analysis. The remainingprincipal components had minor contributions to total geneexpression variance and produced no significant shifts betweenexperimental groups. The PCA-based differentiation tracks can beregarded as continuous representation of ESC differentiation, since

t=d0
t=d0
.25
t=d0
.5
t=d0
.75
t=d1
t=d1
.5
t=2d
t=d4
t=d7
t=d9
t=d1
4
A
B
CERAMIDE METABOLIC PROCESSORGANIC ACID METABOLIC PROCESS
MEMBRANE LIPID METABOLIC PROCESSLIPID METABOLIC PROCESS
ALCOHOL METABOLIC PROCESS
PHOSPHOLIPID METABOLIC PROCESS
GLUTAMINE METABOLIC PROCESS
CARBOHYDRATE METABOLIC PROCESS
TRICARBOXYLIC ACID CYCLE_LITERATURE
GLUCOSE CATABOLIC PROCESSGLYCOLYSIS_LITERATURE
GLUCOSE METABOLIC PROCESS
Lipid metabolism Glucose metabolism Other metabolism
Fig. 3. Hierarchical clustering of all experimental groups of the R1 data sets basedon 6688 significantly regulated genes (A). Molecular concept analysis of regulatedgene sets after 24 h of differentiation versus oh. The size of the gene set correspondswith the size of the node, and the width of the connecting lines indicates the degreeof overlap between the respective gene sets (B).
80 D.A.M. van Dartel et al. / Toxicology 324 (2014) 76–87
for each cell line samples appear mostly in chronological order in thePCA. This differentiation track analysis for each cell line follows itsown unique route of differentiation, but overall the routes arerelatively similar, since most deviation is seen on PC2 that onlydescribes 14.7% of all variance.
Genes previously identified to be related to pluripotency (Assouet al., 2007) show temporal changes for all three data sets (Fig. 2B).Moreover, these patterns of gene expression alterations are highlyidentical for these data sets. Next, we evaluated temporal changes inmarker genes of proliferation (Ccnd1, Ccne1, Pcna), pluripotency(Pou5f1, Sox2), and differentiation (Cyp26a1, Gata4, Vegfa, Rbp4)(Fig. 2C). As expected, expression levels of the proliferation andpluripotency markers decreased with time for all three data sets.Little variation in the onset of decreased expression of proliferationand pluripotencymarkersbetweenthethreedatasetswasobserved.The R1 and J1 cell line showed decreased expression of pluripotencyand proliferation markers 24 h after differentiation induction, andthis was 48 h for the V6.5 cell line. In line with this finding,differentiation markers increased with time for all three data sets.The onset of increased expression of differentiation markers was24 h after differentiation induction for the R1 and J1 cell line, and48 h after differentiation induction for the V6.5 cell line. Thevariation in this data was limited with a median relative standarddeviation (95% CI) of 4.8% (0.2–23.8%), 4.9% (0.2–23.3%), 5.6% (0.2–30.3%), and 2.0% (0.3–7.2%) for respectively R1, J1, V6.5 and ES-D3.
3.3. Gene expression analyses – identification regulation energymetabolism
To study changes in energy metabolism upon ESC differentia-tion, we first identified which time interval should be used to study
early alterations in energy metabolism. As described above, thegene expression alterations of the three data sets were very similar,therefore we continued our detailed analyses with only the R1 dataset. Hierarchical clustering on all significantly regulated genes(FDR < 0.01, 6688 genes) showed a clear grouping of early (0–24 h),mid (36–48 h) and late sampled cultures (4–14 days) (Fig. 3A).Because both data as shown in Fig. 2C and Fig. 3A point towardsinduction of differentiation after 24 h of ESC differentiationculturing, and first changes in metabolism are expected to occurpreviously or simultaneously to development-related changes(Rehman, 2010), our further analyses focused on gene expressionchanges in the first 24 h of differentiation. To verify if this timeinterval was correctly selected, process enrichment of significantlyregulated genes after 24 h and 48 h was studied. Indeed, theseenrichment analyses showed clear induction of differentiation-related processes and proliferation after 48 h of differentiation,while this was much less pronounced after 24 h differentiationinduction (data not shown).
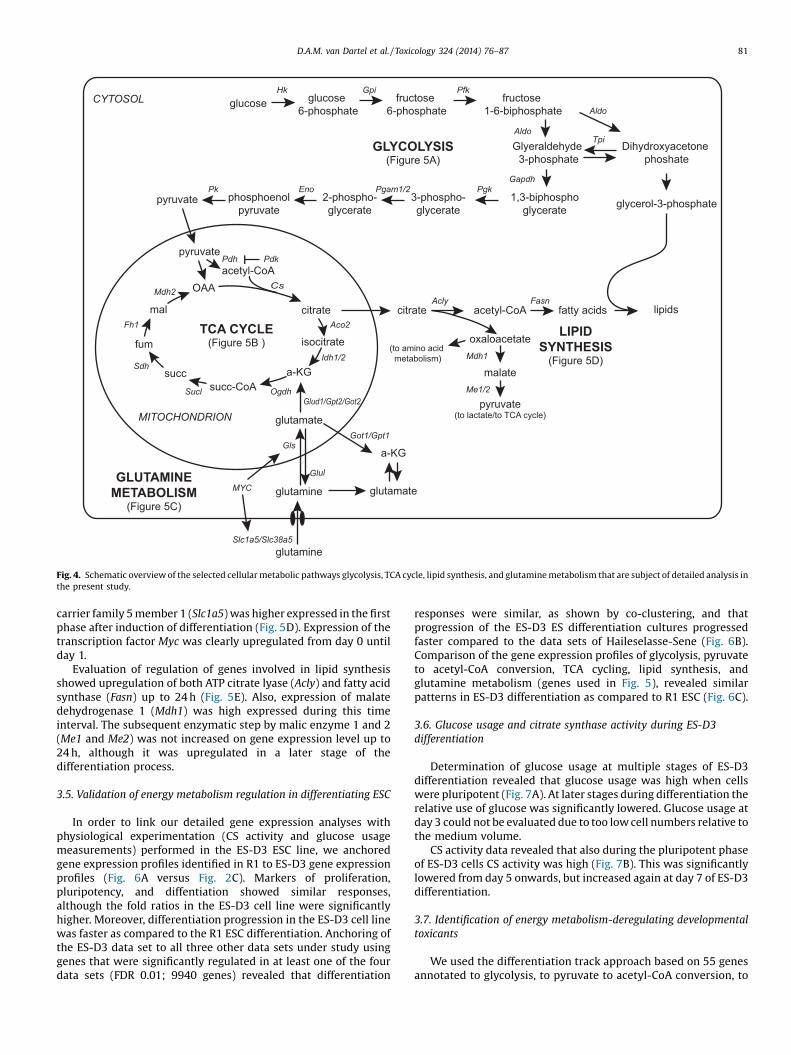
Molecular concepts analysis of GSEA on metabolic process-related terms showed the interactions among the significantlyregulated gene sets at 24 h compared to 0 h. Clearly, two themesappeared to be enriched: glucose metabolism, and lipid metabo-lism (Fig. 3B). These GSEA results were subsequently used tofurther study energy metabolism-related processes in detail. Theprocesses glycolysis and lipid synthesis, as well as the linkingprocesses tricarboxylic acid (TCA) cycle, and glutamine metabo-lism were selected for detailed analyses on the individual geneexpression level (Fig. 4).
3.4. Gene expression regulation of selected metabolic pathways
Detailed analysis of all genes annotated to glycolysis revealedhigh gene expression values of every step of the glycolysis process,which suggests active glycolysis and pyruvate production duringthe complete differentiation procedure. Nevertheless, three geneexpression profiles could be discriminated (Fig. 5A). In the initialphase, 0, and 6 h after differentiation induction, gene expressionwas relatively low as compared to later time points. At 12 and 18 hafter differentiation induction, overall gene expression of glycoly-sis-annotated genes was increased, indicating an increasedglycolytic flux. From day 1 after differentiation induction onwards,the expression of the latter steps of glycolysis, namely Phospho-glycerate 1/2 (Pgam1/2), Enolase 1/2/3 (Eno1/2/3), and Pyruvatekinase (muscle, and liver and red blood cell; Pkm, Pklr) becamerelatively downregulated.
Pyruvate dehydrogenase (Pdh) is rate limiting in the conversionof pyruvate to acetylCoA (Fig. 4), and was high expressed up to day1 (Pdha1, Pdha2, Pdhb; Fig. 5B). Accordingly, most pyruvatedehydrogenase kinases (Pdk1/2/4), inhibitors of Pdh activity,showed low expression at these early stages (Fig. 5B), althoughPdk3 behaved differently.
Acetyl-CoA can be further metabolized in the tricarboxylic acid(TCA) cycle (Fig. 4). Genes annotated to the TCA cycle wereupregulated up to 24 h after differentiation induction, withexception of the probes annotated to aconitase (Aco2) andisocitrate dehydrogenase (Idh1, Idh2, Idh3a) (Fig. 5C). This TCAgene expression profile suggests that up to 24 h after differentia-tion induction, the TCA cycle is truncated after the formation ofcitrate up to and including the formation of a-ketoglutarate. Fromday 2 onwards, this truncated profile disappeared and overall theexpression of TCA-annotated genes become downregulated.
Oxidative glutamine metabolism can function as substrate togenerate a-ketoglutarate for further metabolisation in the TCAcycle (Fig. 4). Indeed, expression of genes that catalyze the reactionfrom glutamine to a-ketoglutarate were upregulated, albeit in asubtle way. Also, the expression of the glutamine importer solute
glucose
pyruvate
glutamate
citratecitrate
Pdkacetyl-CoA
pyruvatePdh
acetyl-CoA fatty acids lipids
glutamine
oxaloacetate
Gls
a-KG
MYC
GLYCOLYSIS(Figure 5A)
TCA CYCLE(Figure 5B )
GLUTAMINEMETABOLISM
(Figure 5C)
LIPIDSYNTHESIS
(Figure 5D)
Acly
Mdh1
Me1/2
malate
pyruvate(to lactate/to TCA cycle)
Fasn
(to amino acid metabolism)
isocitrate
succ-CoAsucc
fum
mal
OAA Cs
Aco2
Idh1/2
OgdhSucl
Sdh
Fh1
Mdh2
3-phospho-glycerate
1,3-biphosphoglycerate
Glyeraldehyde 3-phosphate
fructose 1-6-biphosphate
fructose 6-phosphate
glucose 6-phosphate
2-phospho-glycerate
Hk Gpi Pfk
Aldo
Tpi
GapdhPgkEno Pgam1/2
Dihydroxyacetone phoshate
Aldo
Glud1/Gpt2/Got2
glutamine
CYTOSOL
MITOCHONDRION
Slc1a5/Slc38a5
a-KG
Got1/Gpt1
Glul
glycerol-3-phosphatephosphoenolpyruvate
Pk
glutamate
Fig. 4. Schematic overview of the selected cellular metabolic pathways glycolysis, TCA cycle, lipid synthesis, and glutamine metabolism that are subject of detailed analysis inthe present study.
D.A.M. van Dartel et al. / Toxicology 324 (2014) 76–87 81
carrier family 5 member 1 (Slc1a5) was higher expressed in the firstphase after induction of differentiation (Fig. 5D). Expression of thetranscription factor Myc was clearly upregulated from day 0 untilday 1.
Evaluation of regulation of genes involved in lipid synthesisshowed upregulation of both ATP citrate lyase (Acly) and fatty acidsynthase (Fasn) up to 24 h (Fig. 5E). Also, expression of malatedehydrogenase 1 (Mdh1) was high expressed during this timeinterval. The subsequent enzymatic step by malic enzyme 1 and 2(Me1 and Me2) was not increased on gene expression level up to24 h, although it was upregulated in a later stage of thedifferentiation process.
3.5. Validation of energy metabolism regulation in differentiating ESC
In order to link our detailed gene expression analyses withphysiological experimentation (CS activity and glucose usagemeasurements) performed in the ES-D3 ESC line, we anchoredgene expression profiles identified in R1 to ES-D3 gene expressionprofiles (Fig. 6A versus Fig. 2C). Markers of proliferation,pluripotency, and diffentiation showed similar responses,although the fold ratios in the ES-D3 cell line were significantlyhigher. Moreover, differentiation progression in the ES-D3 cell linewas faster as compared to the R1 ESC differentiation. Anchoring ofthe ES-D3 data set to all three other data sets under study usinggenes that were significantly regulated in at least one of the fourdata sets (FDR 0.01; 9940 genes) revealed that differentiation
responses were similar, as shown by co-clustering, and thatprogression of the ES-D3 ES differentiation cultures progressedfaster compared to the data sets of Haileselasse-Sene (Fig. 6B).Comparison of the gene expression profiles of glycolysis, pyruvateto acetyl-CoA conversion, TCA cycling, lipid synthesis, andglutamine metabolism (genes used in Fig. 5), revealed similarpatterns in ES-D3 differentiation as compared to R1 ESC (Fig. 6C).
3.6. Glucose usage and citrate synthase activity during ES-D3differentiation
Determination of glucose usage at multiple stages of ES-D3differentiation revealed that glucose usage was high when cellswere pluripotent (Fig. 7A). At later stages during differentiation therelative use of glucose was significantly lowered. Glucose usage atday 3 could not be evaluated due to too low cell numbers relative tothe medium volume.
CS activity data revealed that also during the pluripotent phaseof ES-D3 cells CS activity was high (Fig. 7B). This was significantlylowered from day 5 onwards, but increased again at day 7 of ES-D3differentiation.
3.7. Identification of energy metabolism-deregulating developmentaltoxicants
We used the differentiation track approach based on 55 genesannotated to glycolysis, to pyruvate to acetyl-CoA conversion, to

Hk1Hk2Gpi1Pfkfb3AldoaAldocAldobTpi1GapdhPgk1Pgk2Pgam1Pgam2Eno1Eno2Eno3PkmPklr
A
t=d0
t=d0
.25
t=d0
.5t=
d0.7
5t=
d1t=
d1.5
t=2d
t=d4
t=d7
t=d9
t=d1
4
-4 -2 +1 2 4_
CsAco2Idh1Idh2Idh3aogdhSucla2Suclg1SdhaSdhaf1Sdhaf2SdhbSdhcSdhdFh1Mdh2
Pdha1Pdha2PdhbPdk1Pdk2Pdk3Pdk4
DB
C
t=d0
t=d0
.25
t=d0
.5t=
d0.7
5t=
d1t=
d1.5
t=2d
t=d4
t=d7
t=d9
t=d1
4
Glud1Gpt1Gpt2Got1Got2
Slc1a5Slc38a5Myc
t=d0
t=d0
.25
t=d0
.5t=
d0.7
5t=
d1t=
d1.5
t=2d
t=d4
t=d7
t=d9
t=d1
4Me1Me2
AclyFasnMdh1
t=d0
t=d0
.25
t=d0
.5t=
d0.7
5t=
d1t=
d1.5
t=2d
t=d4
t=d7
t=d9
t=d1
4
t=d0
t=d0
.25
t=d0
.5t=
d0.7
5t=
d1t=
d1.5
t=2d
t=d4
t=d7
t=d9
t=d1
4
E
Glul
Fig. 5. Gene expression profiles of the R1 data sets of genes annotated to glycolysis (A), to pyruvate to acetyl-CoA conversion (B), to TCA cycling (C), to glutamine metabolism(D), and to lipid synthesis (E).
0 1 2 3 4 5 6 7
D3
Ccnd1Ccne1Pcna
Pou5f1Sox2
Pluripotency-related
Cyp26a1
Gata4
Vegfa
Rbp4
Differentiation-related Proliferation-related
-8
-4
-2
+1
2
4
8
16
Gen
e ex
pres
sion
(a
vera
ge fo
ld c
hang
e)
Differentiation duration (days)
A B
C
D3_
d0D
3_d3
R1_
d0J1
_d0.
25R
1_d0
.25
R1_
d0.5
J1_d
0.5
J1_d
0V
6.5_
d0V
6.5_
d0.2
5V
6.5_
d0.5
V6.
5_d0
.75
V6.
5_d1
R1_
d0.7
5R
1_d1
V6.
5_d1
.5J1
_d0.
75J1
_d1
D3_
d4D
3_d5
R1_
d1.5
V6.
5_d2
R1_
d2J1
_d1.
5V
.5_d
4R
1_d4
J1_d
7J1
_4J1
_d14
V6.
5_d9
J1_d
2J1
_d9
R1_
d7R
1_d9
R1_
d14
V6.
5_d7
V6.
5_d1
4D
3_d6
D3_
d7
R1_
0
R1_
0.25
R1_
1
R1_
0.5
R1_
0.75
D3_
d6
D3_
d7
D3_
d4
R1_
7
R1_
9
R1_
14
D3_
d5
R1_
4
R1_
1.5
R1_
2
D3_
d0
D3_
d3
Fig. 6. Gene expression profile anchoring of ESC differentiation ES-D3 data. Gene expression regulation of marker genes for proliferation, pluripotency, and differentiation inthe ES-D3 data set (A). Hierarchical clustering of all experimental groups of the R1, J1, V6.5 and ES-D3 data sets based on 9940 significantly regulated genes (B). Clustering ofgene expression profiles of the experimental groups of the R1 and ES-D3 data sets of genes annotated to glycolysis, pyruvate to acetyl-CoA conversion, TCA cycling, lipidsynthesis, and glutamine metabolism (genes used in Fig. 5) (C).
82 D.A.M. van Dartel et al. / Toxicology 324 (2014) 76–87

0.004
0.008
0.012
0.016
0.020
ESC day 3 day 5 day 6 day 7
Citr
ate
synt
hase
act
ivity
(μ
mol
e/m
l/min
/ug)
**
* ** ** **
0.000
0.050
0.100
0.150
0.200
0.250
0.300
0.350
ESC day 5 day 7
Glu
cose
usa
ge
(μm
ole
gluc
ose
/ug
prot
ein/
24h)
B
A
0.000
*****
Fig. 7. Glucose usage (A). and citrate synthase activity (B) during ES-D3 ESCdifferentiation. Error bars indicate sd.
D.A.M. van Dartel et al. / Toxicology 324 (2014) 76–87 83
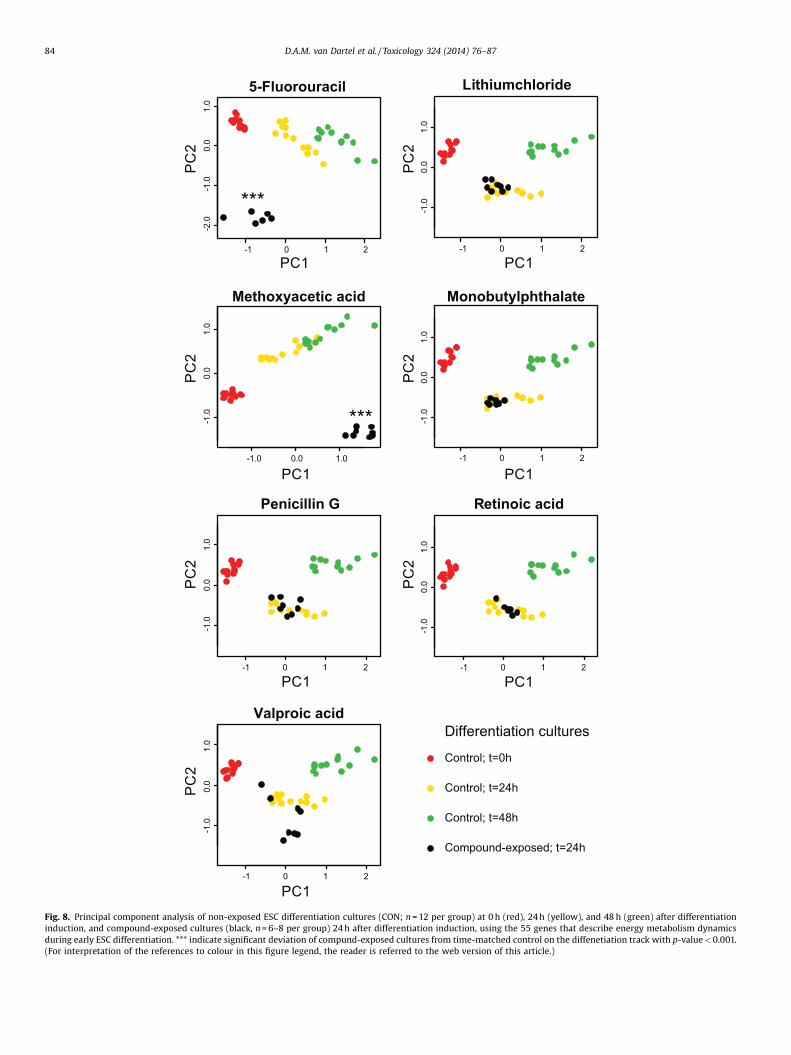
TCA cycling, to glutamine metabolism, and to lipid synthesis(summarized in Supplementary Table 1) to identify developmen-tal toxicants that disturb early energy metabolism dynamics. Thedevelopmental toxicants that are known to disturb this process,namely 5-fluorouracil and methoxyacetic acid, were identifiedbecause these samples deviated significantly from their time-matched control in the PCA (Fig. 8; Table 2), with a p-value of1.57E-7, and 4.17E-11, respectively (Table 2). As expected, thesamples of other compounds, including the non-developmentaltoxicant penicillin G, and the developmental toxicants lithiumchloride, monobutylphthalate, retinoic acid and valproic acid, didnot significantly deviate from their time-matched controls.
4. Discussion
Over the past several decades, embryonic stem cell differentia-tion has been increasingly used as an in vitro model to studyembryonic development and cancer cell reprogramming. Intoxicology, ESC differentiation has been studied as a tool topredict developmental toxicity (van Dartel and Piersma, 2011b;Wobus and Loser, 2011). A myriad of studies have investigatedmolecular regulation of differentiation and pluripotency (Fathiet al., 2014; Niwa et al., 2000; Pardo et al., 2010), processes that arewell reflected in toxicological ESC-based assays (van Dartel andPiersma, 2011a). This is of great importance to define theapplicability domain of these assays, and to further improve theiraccuracy (Hartung et al., 2004). Recently, advanced progress instudies on metabolic reprogramming in ESC differentiation has
deepened our understanding on the crucial role of energymetabolism in directing cellular differentiation. It appears thatspecific metabolic requirements are needed to maintain stem cellself-renewal, and that modulation of metabolic pathways canmodulate self-renewal and lineage specification (Shyh-Changet al., 2013). This opened a new avenue for ESC-based identificationof developmental toxicants. Here, this was explored and wedefined an energy metabolism-focused gene set that can faithfullybe used to identify compounds that may display specificdevelopmental toxicity.
Our study is among the first studies that analyze whole genomeexpression data to specifically characterize metabolic changesupon ESC early differentiation. So far, most studies compareddifferentiated gene signatures with pluripotent signatures toidentify metabolic alterations. Very recently, Gaspar et al. usedtranscriptome analysis to identify metabolic changes during theESC into cardiomyocyte differentiation process in order to furtherelucidate the role of metabolic signatures in pluripotency anddifferentiation (Gaspar et al., 2014). Using various data sets of theirlab, mostly using whole gene expression analysis of samples takenafter lineage selection, they suggested active anaplerosis via aminoacid metabolism in order to resupply the TCA cycle withintermediates for biosynthetic pathways, regretfully the authorsdid not specifically elaborate on this finding.
Our data analyses specifically focused on dynamic alterationsof early stage ESC differentiation, since it has been shown thatmetabolic alterations occur simultaneously or even precede theinduction of differentiation (Folmes et al., 2012). For our initialanalyses, three data sets were selected that were obtained by thesame research group. These data provided a solid basis for ourstudy, since we reasoned that regardless of the ESC line that wasused, similar alterations in key physiological processes thataccompany ESC differentiation can be expected. Our resultsconfirmed that the dynamic gene expression changes of the threedata sets were significantly comparable. Our detailed analysesusing the R1 data set clearly revealed enrichment of glucose andlipid metabolism in the early stage of ESC differentiation. Thesimultaneous regulation of both these processes pointed towardsthe function of energy metabolism in the provision of metabolitesfor biosynthesis of cellular constituents, as was indicated byGaspar et al. In this respect, upregulation of glycolysis is to beexpected, since this allows for ATP production and for funnelinginto the pentose phosphate pathway to generate NADPH for lipidsynthesis and ribose-6-phosphate for nucleotide biosynthesis(Lunt and Vander Heiden, 2011). Furthermore, pyruvate, thepenultimate product of glycolysis, can enter mitochondria andfeed into the TCA cycle, after conversion into acetyl-CoA. The TCAcycle plays a key role in providing proliferating cells withbiosynthetic precursors, by functioning as a hub for amino acidand, especially, lipid synthesis (Keijer and van Dartel, 2013; Luntand Vander Heiden, 2011). Activation of this process results incataplerosis, the continuous efflux of intermediates. This isdifferent from the role of the TCA in non-proliferating cells, wherethe main function is full oxidation of acetyl-CoA to generatemaximal ATP production. Our detailed data analyses on the R1data set indeed revealed that glycolysis was highly active duringthe complete differentiation process as indicated by highexpression values, particularly in the early stages of ESCdifferentiation.
Hierarchical clustering of the expression of these genes of theR1 data set with the ES-D3 data set revealed that a similar patternwas observed for ES-D3 ESC differentiation. Here, overall highexpression of glycolysis genes was shown in cells at a pluripotentstage, namely at day 0 and 3. At later stages, only increasedexpression of genes that function in the first part of glycolysis wasidentified, suggesting reduced glycolysis. Additional physiological
-1 0 1 2
-2.0
-1.0
0.0
1.0
5-Fluorouracil
PC1
PC
2
-1 0 1 2
-1.0
0.0
1.0
Lithiumchloride
PC1
PC
2
-1.0 0.0 1.0
-1.0
0.0
1.0
Methoxyacetic acid
PC1
PC
2
-1 0 1 2
-1.0
0.0
1.0
Monobutylphthalate
PC1
PC
2
-1 0 1 2
-1.0
0.0
1.0
Penicillin G
PC1
PC
2
-1 0 1 2
-1.0
0.0
1.0
Retinoic acid
PC1
PC
2
-1 0 1 2
-1.0
0.0
1.0
Valproic acid
PC1
PC
2
Differentiation cultures
Control; t=48h
Control; t=0h
Control; t=24h
Compound-exposed; t=24h
***
***
Fig. 8. Principal component analysis of non-exposed ESC differentiation cultures (CON; n = 12 per group) at 0 h (red), 24 h (yellow), and 48 h (green) after differentiationinduction, and compound-exposed cultures (black, n = 6–8 per group) 24 h after differentiation induction, using the 55 genes that describe energy metabolism dynamicsduring early ESC differentiation. *** indicate significant deviation of compund-exposed cultures from time-matched control on the diffenetiation track with p-value < 0.001.(For interpretation of the references to colour in this figure legend, the reader is referred to the web version of this article.)
84 D.A.M. van Dartel et al. / Toxicology 324 (2014) 76–87

Table 2Significance values of deviation from the PCA-based differentiation track (Fig. 8) ofcompound-exposed differentiation cultures using the 55 genes that describe energymetabolism dynamics during early ESC differentiation.
Compound p-value
5-Fluorouracil 1.57E-07Lithium chloride 0.08Methoxyacetic acid 4.17E-11Monobutyl phthalate 0.08Penicillin G 0.47Retinoic acid 0.90Valproic acid 0.06
D.A.M. van Dartel et al. / Toxicology 324 (2014) 76–87 85
experimentation in ES-D3 ESC confirmed that glucose usage washigh in undifferentiated ESC, and was significantly lower at day 5and 7 after differentiation induction. These data confirm ourhypothesis that glucose is used as a substrate for generatingbiosynthetic precursors when cells are in a pluripotent state. ForES-D3 cells, one of the most commonly used ESC line intoxicological research, a metabolic profile that favors cellularbiosynthesis was particularly active during the first three days ofthe differentiation protocol. This data corresponds with ourprevious data in which we discuss that at the first phase of ES-D3 differentiation cells predominantly proliferate, and thatdifferentiation is induced from day 3 onwards (van Dartel et al.,2009b).
A truncated TCA cycle as indicated by up-regulation of part ofthe TCA cycle genes is characteristic for TCA-based cellularbiosynthesis, and this profile was identified during early stagesof differentiation in our gene expression analyses. The TCA-geneexpression profile between the R1 and ES-D3 cell line showed highsimilarity, with a truncated TCA cluster during early stages ofdifferentiation, and relatively low TCA-related gene expression inthe mid-phase of differentiation. Since the differentiation progres-sion of ES-D3 cells showed to run significantly faster, also a thirdcluster was identified in the ES-D3 data set, which showed relativeup-regulation of the first part of the TCA cycle, and an overall highexpression of the TCA-annotated genes. Additional CS activitymeasurements confirmed our gene expression findings. A plausi-ble explanation for the reactivation of CS at the late differentiationstage (day 7) in ES-D3 differentiation cultures is to activate thefunction of the TCA cycle for ATP generation, in agreement withreturn to a post-glycolytic state. Furthermore, it has previouslybeen shown for ES-D3 differentiation to cardiomyocytes thatdifferentiated cells start contracting at day 7 (van Dartel et al.,2009b), a process that definitely requires substantial amountsof ATP.
In line with the increased expression of glycolysis genes thatsupport cellular biosynthesis, expression of genes that function inthe conversion of pyruvate into acetyl-CoA (Pdh) and its inhibitors(Pdk) were regulated. We studied the expression levels of all fourPdk genes (Pdk1–4) in our analyses, although recent researchshowed that specifically Pdk2 and Pdk4 functions in regulating Pdhactivity in stem cells (Takubo et al., 2013). This data most likelyexplains the, at first unexpected, upregulation of Pdk3 from day 0–2 in the R1 data set. Our analyses also showed strong up regulationof the transcription factor Myc. This transcription factor facilitatesreprogramming of metabolism for growth, similarly as we describein the present study: boost of glycolytic metabolism, and inducedglutaminolysis (Dang 2013). This result thus further supports ourconclusion of reprogrammed energy metabolism to support cellgrowth and proliferation.
Our finding that ESC before differentiation induction and in theearly stage of differentiation have a predominantly glycolytic andtruncated TCA cycle metabolic profile fits with the observation that
ESC at these stages contain ‘immature’ mitochondria (Cho et al.,2006; Ramalho-Santos et al., 2009; Varum et al., 2011). It has beendescribed that upon differentiation, when metabolism changes tomitochondrial-dependent ATP production using oxidative phos-phorylation, mitochondrial density concomitant with the appear-ance of cristae dense morphology and increased mitochondrialmembrane potential. Our observation that pluripotent ESC have aglycolytic signature, even under conditions of sufficient oxygensupply, has been considered characteristic for ESC as well as otherrapidly growing cells, including cancer cells (DeBerardinis et al.,2008; Zhou et al., 2012).
In the data sets used in the present study, ESC were culturedunder normoxic conditions. It has been discussed, however, thatmaintenance of pluripotency and induction of differentiation isfavored when pluripotent ESC are cultured under hypoxicconditions. This will contribute to stabilization of the transcriptionfactor hypoxia inducible factor alpha (HIF1A) and the subsequentexpression of stemness factors (Mandal et al., 2011; Yanes et al.,2010; Yoshida et al., 2009). HIF1A has been implicated in regulatingmany genes to support aerobic glycolysis (Denko, 2008), as alsoobserved in pluripotent ESC. Although we used data of ESCdifferentiation cultured under normoxic conditions, our analysesshowed increased expression of HIF1a as well as genes down-stream of HIF1a during early differentiation in our data sets. Mostlikely, a hypoxic environment was created under normoxicconditions via the 3D-culturing procedure of cells in embryoidbodies. However, to improve standardization of ESC differentia-tion-based assays it might be useful to adapt oxygen levels duringdifferent stages of the differentiation process.
Our previous research has shown that specific gene sets can beused within the same assay to identify process- or compoundclass-specific dysregulation (van Dartel et al., 2011a; van Dartelet al., 2011b). Also, we showed that the accuracy of the gene sets toidentify developmental toxicant was optimal when the geneexpression modulation was evaluated within the most dynamicpart of ES differentiation, which appeared to be at day 3–5 of theEST protocol (0–48 h after differentiation induction) (van Dartelet al., 2010a). Here, we revealed that in this same timeframe alsoenergy metabolism-related changes are dynamically changing.Indeed, a first test showed that a gene set that describes energymetabolism alterations in the early stage of ESC differentiation wassuccessful in identification of developmental toxicants that areknown to affect this process. Further optimization of such a geneset could further improve identification of developmental tox-icants that affect ESC differentiation-specific metabolicrequirements.
5. Conclusion
In conclusion, the present study shows metabolic reprog-ramming from a cellular biosynthesis profile to an ATPgeneration profile in differentiating embryonic stem cells, aphenomenon that was identified in multiple cell lines. Theseenergy metabolism features are also activated in processes suchas embryonic development and cancer cell growth, whichjustifies the use of ESC and ESC differentiation as an in vitromodel in these areas of research. Particularly ES-D3 ESC appearto be useful as in vitro model, because of their relativehomogeneous response as compared to the other ESC linesevaluated in the present study. Moreover, we showed that a geneset that comprises genes annotated to the metabolic processesregulated during early differentiation could be used to identifydevelopmental toxicants that specifically modulate this process.This is an important step forward in defining the applicabilitydomain of the EST.

86 D.A.M. van Dartel et al. / Toxicology 324 (2014) 76–87
Conflict of interests
The authors declare that there are no conflicts of interest.
Transparency document
The Transparency document associated with this article can befound in the online version.
Acknowledgements
The authors gratefully acknowledge Kagnew Hailesellasse Seneand colleagues for making their transcriptomic data sets publiclyavailable. In addition, we thank our colleagues Jeroen Pennings andEvert van Schothorst for their helpful suggestions and discussions.
Appendix A. Supplementary data
Supplementary data associated with this article can be found, inthe online version, at http://dx.doi.org/10.1016/j.tox.2014.07.009.
References
Assou, S., Le Carrour, T., Tondeur, S., Strom, S., Gabelle, A., Marty, S., Nadal, L.,Pantesco, V., Reme, T., Hugnot, J.P., Gasca, S., Hovatta, O., Hamamah, S., Klein, B.,De Vos, J., 2007. A meta-analysis of human embryonic stem cells transcriptomeintegrated into a web-based expression atlas. Stem Cells 25, 961–973.
Bolstad, B.M., Irizarry, R.A., Astrand, M., Speed, T.P., 2003. A comparison ofnormalization methods for high density oligonucleotide array data based onvariance and bias. Bioinformatics 19, 185–193.
Chambers, I., Tomlinson, S.R., 2009. The transcriptional foundation of pluripotency.Development 136, 2311–2322.
Cho, Y.M., Kwon, S., Pak, Y.K., Seol, H.W., Choi, Y.M., Park do, J., Park, K.S., Lee, H.K.,2006. Dynamic changes in mitochondrial biogenesis and antioxidant enzymesduring the spontaneous differentiation of human embryonic stem cells.Biochem. Biophys. Res. Commun. 348, 1472–1478.
Dang, C.V., 2013. MYC, metabolism, cell growth, and tumorigenesis. Cold SpringHarb. Perspect. Med. 3, .
DeBerardinis, R.J., Lum, J.J., Hatzivassiliou, G., Thompson, C.B., 2008. The biology ofcancer: metabolic reprogramming fuels cell growth and proliferation. CellMetab. 7, 11–20.
Denko, N.C., 2008. Hypoxia, HIF1 and glucose metabolism in the solid tumour. Nat.Rev. Cancer 8, 705–713.
Evans, M.J., Kaufman, M.H., 1981. Establishment in culture of pluripotential cellsfrom mouse embryos. Nature 292, 154–156.
Fathi, A., Hatami, M., Vakilian, H., Han, C.L., Chen, Y.J., Baharvand, H., Salekdeh, G.H.,2014. Quantitative proteomics analysis highlights the role of redox hemostasisand energy metabolism in human embryonic stem cell differentiation to neuralcells. J. Proteomics 101, 1–16.
Folmes, C.D., Dzeja, P.P., Nelson, T.J., Terzic, A., 2012. Metabolic plasticity in stem cellhomeostasis and differentiation. Cell Stem Cell 11, 596–606.
Gaspar, J.A., Doss, M.X., Hengstler, J.G., Cadenas, C., Hescheler, J., Sachinidis, A., 2014.Unique metabolic features of stem cells, cardiomyocytes, and their progenitors.Circ. Res. 114, 1346–1360.
Hailesellasse Sene, K., Porter, C.J., Palidwor, G., Perez-Iratxeta, C., Muro, E.M.,Campbell, P.A., Rudnicki, M.A., Andrade-Navarro, M.A., 2007. Gene function inearly mouse embryonic stem cell differentiation. BMC Genomics 8, 85.
Hartung, T., Bremer, S., Casati, S., Coecke, S., Corvi, R., Fortaner, S., Gribaldo, L.,Halder, M., Hoffmann, S., Roi, A.J., Prieto, P., Sabbioni, E., Scott, L., Worth, A.,Zuang, V., 2004. A modular approach to the ECVAM principles on test validity.Altern. Lab. Anim. 32, 467–472.
Hescheler, J., Sachinidis, A., Chen, S., Winkler, J., 2006. The FunGenES consortium:functional genomics in engineered embryonic stem cells. Stem Cell Rev. 2, 1–4.
Hettne, K.M., Boorsma, A., van Dartel, D.A., Goeman, J.J., de Jong, E., Piersma, A.H.,Stierum, R.H., Kleinjans, J.C., Kors, J.A., 2013. Next-generation text-miningmediated generation of chemical response-specific gene sets for interpretationof gene expression data. BMC Med. Genomics 6, 2.
Huang da, W., Sherman, B.T., Lempicki, R.A., 2009. Bioinformatics enrichment tools:paths toward the comprehensive functional analysis of large gene lists. NucleicAcids Res. 37, 1–13.
Irizarry, R.A., Hobbs, B., Collin, F., Beazer-Barclay, Y.D., Antonellis, K.J., Scherf, U.,Speed, T.P., 2003. Exploration, normalization, and summaries of high densityoligonucleotide array probe level data. Biostatistics 4, 249–264.
Kanehisa, M., Goto, S., 2000. KEGG: kyoto encyclopedia of genes and genomes.Nucleic Acids Res. 28, 27–30.
Keijer, J., van Dartel, D.A., 2013. Reprogrammed Metabolism of Cancer Cells as aPotential Therapeutic Target. Current Pharmaceutical Design.
Knudsen, T.B., Green, M.L., 2004. Response characteristics of the mitochondrial DNAgenome in developmental health and disease. Birth Defects Res. C EmbryoToday 72, 313–329.
Lunt, S.Y., Vander Heiden, M.G., 2011. Aerobic glycolysis: meeting the metabolicrequirements of cell proliferation. Ann. Rev. Cell Dev. Biol. 27, 441–464.
Mandal, S., Lindgren, A.G., Srivastava, A.S., Clark, A.T., Banerjee, U., 2011.Mitochondrial function controls proliferation and early differentiation potentialof embryonic stem cells. Stem Cells 29, 486–495.
Niwa, H., Miyazaki, J., Smith, A.G., 2000. Quantitative expression of Oct-3/4 definesdifferentiation, dedifferentiation or self-renewal of ES cells. Nat. Genet. 24,372–376.
Osman, A.M., van Dartel, D.A.M., Zwart, E., Blokland, M., Pennings, J.L.A., Piersma, A.H., 2010. Proteome profiling of mouse embryonic stem cells to define markersfor cell differentiation and embryotoxicity. Reprod. Toxicol. 30, 322–332.
Pardo, M., Lang, B., Yu, L., Prosser, H., Bradley, A., Babu, M.M., Choudhary, J., 2010. Anexpanded Oct4 interaction network: implications for stem cell biology,development, and disease. Cell Stem Cell 6, 382–395.
Parkinson, H., Sarkans, U., Kolesnikov, N., Abeygunawardena, N., Burdett, T., Dylag,M., Emam, I., Farne, A., Hastings, E., Holloway, E., Kurbatova, N., Lukk, M.,Malone, J., Mani, R., Pilicheva, E., Rustici, G., Sharma, A., Williams, E., Adamusiak,T., Brandizi, M., Sklyar, N., Brazma, A., 2011. ArrayExpress update – an archive ofmicroarray and high-throughput sequencing-based functional genomicsexperiments. Nucleic Acids Res. 39, D1002–1004.
Pennings, J.L.A., van Dartel, D.A.M., Pronk, T.E., Hendriksen, P.J., Piersma, A.H., 2011.Identification by gene co-regulation mapping of novel genes involved inembryonic stem cell differentiation. Stem Cells Dev. 20, 115–126.
Ramalho-Santos, J., Varum, S., Amaral, S., Mota, P.C., Sousa, A.P., Amaral, A., 2009.Mitochondrial functionality in reproduction: from gonads and gametes toembryos and embryonic stem cells. Hum. Reprod. Update 15, 553–572.
Rehman, J., 2010. Empowering self-renewal and differentiation: the role ofmitochondria in stem cells. J. Mol. Med. 88, 981–986.
Robinson, J.F., Theunissen, P.T., van Dartel, D.A., Pennings, J.L., Faustman, E.M.,Piersma, A.H., 2011. Comparison of MeHg-induced toxicogenomic responsesacross in vivo and in vitro models used in developmental toxicology. Reprod.Toxicol. 32, 180–188.
Schulz, H., Kolde, R., Adler, P., Aksoy, I., Anastassiadis, K., Bader, M., Billon, N., Boeuf, H.,Bourillot, P.Y., Buchholz, F., Dani, C., Doss, M.X., Forrester, L., Gitton, M., Henrique,D., Hescheler, J., Himmelbauer, H., Hubner, N., Karantzali, E., Kretsovali, A., Lubitz,S., Pradier, L., Rai, M.,Reimand, J.,Rolletschek,A., Sachinidis, A., Savatier, P., Stewart,F., Storm, M.P., Trouillas, M., Vilo, J., Welham, M.J., Winkler, J., Wobus, A.M.,Hatzopoulos, A.K., 2009. The FunGenES database: a genomics resource for mouseembryonic stem cell differentiation. PLoS One 4, e6804.
Seiler, A., Visan, A., Buesen, R., Genschow, E., Spielmann, H., 2004. Improvement ofan in vitro stem cell assay for developmental toxicity: the use of molecularendpoints in the embryonic stem cell test. Reprod. Toxicol. 18, 231–240.
Shyh-Chang, N., Daley, G.Q., Cantley, L.C., 2013. Stem cell metabolism in tissuedevelopment and aging. Development 140, 2535–2547.
Spielmann, H., Pohl, I., Doring, B., Liebsch m. Moldenbauer, F., 1997. The embryonicstem cell test (EST), an in vitro embryotoxicity test using two permanent celllines: 3T3 fibroblasts and embryonic stem cells. In vitro Toxicol. 10, 119–127.
Stacey, D.W., 2003. Cyclin D1 serves as a cell cycle regulatory switch in activelyproliferating cells. Curr. Opin. Cell Biol. 15, 158–163.
Subramanian, A., Tamayo, P., Mootha, V.K., Mukherjee, S., Ebert, B.L., Gillette, M.A.,Paulovich, A., Pomeroy, S.L., Golub, T.R., Lander, E.S., Mesirov, J.P., 2005. Gene setenrichment analysis: a knowledge-based approach for interpreting genome-wide expression profiles. Proc. Natl. Acad. Sci. U. S. A 102, 15545–15550.
Takubo, K., Nagamatsu, G., Kobayashi, C.I., Nakamura-Ishizu, A., Kobayashi, H., Ikeda,E., Goda, N., Rahimi, Y., Johnson, R.S., Soga, T., Hirao, A., Suematsu, M., Suda, T.,2013. Regulation of glycolysis by Pdk functions as a metabolic checkpoint forcell cycle quiescence in hematopoietic stem cells. Cell Stem Cell 12, 49–61.
Theunissen, P.T., Pennings, J.L., Robinson, J.F., Claessen, S.M., Kleinjans, J.C., Piersma,A.H., 2011a. Time-response evaluation by transcriptomics of methylmercuryeffects on neural differentiation of murine embryonic stem cells. Toxicol. Sci.122, 437–447.
Theunissen, P.T., Pennings, J.L., Robinson, J.F., Claessen, S.M., Kleinjans, J.C., Piersma,A.H., 2011. Time-response evaluation by transcriptomics of methylmercuryeffects on neural differentiation of murine embryonic stem cells. Toxicol. Sci. .
Theunissen, P.T., Schulpen, S.H., van Dartel, D.A.M., Hermsen, S.A.B., van Schooten, F.J., Piersma, A.H., 2010. An abbreviated protocol for multilineage neuraldifferentiation of murine embryonic stem cells and its perturbation by methylmercury. Reprod. Toxicol. 29, 383–392.
van Dartel, D.A., Pennings, J.L., de la Fonteyne, L.J., Brauers, K.J., Claessen, S., vanDelft, J.H., Kleinjans, J.C., Piersma, A.H., 2011a. Concentration-dependent geneexpression responses to flusilazole in embryonic stem cell differentiationcultures. Toxicol. Appl. Pharmacol. 251, 110–118.
van Dartel, D.A., Pennings, J.L., Hendriksen, P.J., van Schooten, F.J., Piersma, A.H.,2009a. Early gene expression changes during embryonic stem cell differentia-tion into cardiomyocytes and their modulation by monobutyl phthalate.Reprod. Toxicol. 27, 93–102.
van Dartel, D.A., Pennings, J.L., Robinson, J.F., Kleinjans, J.C., Piersma, A.H., 2011b.Discriminating classes of developmental toxicants using gene expressionprofiling in the embryonic stem cell test. Toxicol. Lett. 201, 143–151.
van Dartel, D.A., Pennings, J.L., van Schooten, F.J., Piersma, A.H., 2010a. Tran-scriptomics-based identification of developmental toxicants through theirinterference with cardiomyocyte differentiation of embryonic stem cells.Toxicol. Appl. Pharmacol. 243, 420–428.

D.A.M. van Dartel et al. / Toxicology 324 (2014) 76–87 87
van Dartel, D.A., Piersma, A.H., 2011a. The embryonic stem cell test combined withtoxicogenomics as an alternative testing model for the assessment ofdevelopmental toxicity. Reprod. Toxicol. 32, 235–244.
van Dartel, D.A., Zeijen, N.J., de la Fonteyne, L.J., van Schooten, F.J., Piersma, A.H.,2009b. Disentangling cellular proliferation and differentiation in the embryonicstem cell test, and its impact on the experimental protocol. Reprod. Toxicol. 28,254–261.
van Dartel, D.A.M., Pennings, J.L.A., de la Fonteyne, L.J.J., van Herwijnen, M., vanDelft, J.H., van Schooten, F.J., Piersma, A.H., 2010b. Monitoring developmentaltoxicity in the embryonic stem cell test using differential gene expression ofdifferentiation-related genes. Toxicol. Sci. 116, 130–139.
van Dartel, D.A.M., Pennings, J.L.A., van Schooten, F.J., Piersma, A.H., 2010c.Transcriptomics-based identification of developmental toxicants through theirinterference with cardiomyocyte differentiation of embryonic stem cells.Toxicol. Appl. Pharmacol. 243, 420–428.
van Dartel, D.A.M., Piersma, A.H., 2011b. The embryonic stem cell test combinedwith toxicogenomics as an alternative testing model for the assessment ofdevelopmental toxicity. Reprod. Toxicol. 32, 235–244.
Varum, S., Rodrigues, A.S., Moura, M.B., Momcilovic, O., Easley C.A.T. Ramalho-Santos, J., Van Houten, B., Schatten, G., 2011. Energy metabolism in humanpluripotent stem cells and their differentiated counterparts. PLoS One 6,e20914.
Wobus, A.M., Loser, P., 2011. Present state and future perspectives of usingpluripotent stem cells in toxicology research. Arch. Toxicol. 85, 79–117.
Yanes, O., Clark, J., Wong, D.M., Patti, G.J., Sanchez-Ruiz, A., Benton, H.P., Trauger, S.A.,Desponts, C., Ding, S., Siuzdak, G., 2010. Metabolic oxidation regulatesembryonic stem cell differentiation. Nat. Chem. Biol. 6, 411–417.
Yoshida, Y., Takahashi, K., Okita, K., Ichisaka, T., Yamanaka, S., 2009. Hypoxiaenhances the generation of induced pluripotent stem cells. Cell Stem Cell 5,237–241.
Zhou, W., Choi, M., Margineantu, D., Margaretha, L., Hesson, J., Cavanaugh, C., Blau, C.A., Horwitz, M.S., Hockenbery, D., Ware, C., Ruohola-Baker, H., 2012. HIF1alphainduced switch from bivalent to exclusively glycolytic metabolism during ESC-to-EpiSC/hESC transition. EMBO J. 31, 2103–2116.