during autophagy mitochondria elongate, are spared from degradation and sustain cell viability
TRANSCRIPT
ART I C L E S
During autophagy mitochondria elongate, are sparedfrom degradation and sustain cell viabilityLigia C. Gomes1,2,3, Giulietta Di Benedetto2,4 and Luca Scorrano1,2,5,6
A plethora of cellular processes, including apoptosis, depend on regulated changes in mitochondrial shape and ultrastructure. Therole of mitochondria and of their morphology during autophagy, a bulk degradation and recycling process of eukaryotic cells’constituents, is not well understood. Here we show that mitochondrial morphology determines the cellular response tomacroautophagy. When autophagy is triggered, mitochondria elongate in vitro and in vivo. During starvation, cellular cyclic AMPlevels increase and protein kinase A (PKA) is activated. PKA in turn phosphorylates the pro-fission dynamin-related protein 1(DRP1), which is therefore retained in the cytoplasm, leading to unopposed mitochondrial fusion. Elongated mitochondria arespared from autophagic degradation, possess more cristae, increased levels of dimerization and activity of ATP synthase, andmaintain ATP production. Conversely, when elongation is genetically or pharmacologically blocked, mitochondria consume ATP,precipitating starvation-induced death. Thus, regulated changes in mitochondrial morphology determine the fate of the cellduring autophagy.
Mitochondria are crucial organelles for energy production, regulationof cell signalling and amplification of apoptosis. This functionalversatility is matched by their morphological and structural variety.During the lifetime of a cell, the mitochondrial network is continuouslyshaped by fission and fusion events1. The dynamin-related GTPasesoptic atrophy 1 (OPA1) of the inner mitochondrial membrane2,and mitofusins (MFN) 1 and 2 of the outer membrane3, regulatemitochondrial fusion in mammalian cells. Mitochondrial fissionis controlled by cytosolic DRP1 (ref. 4). Translocation of DRP1to mitochondria is an essential step in the fragmentation ofthe organelle and depends on dephosphorylation of the Ser 637residue by calcineurin5. Conversely, phosphorylation of Ser 637 byPKA promotes mitochondrial elongation6,7. Once on mitochondria,resident small ubiquitin-like modifier (SUMO) ligases, such asmitochondrial-anchored protein ligase9 (MAPL), can stabilize DRP1by SUMOylation8, demonstrating how dynamic regulation of fissionadaptsmitochondrialmorphology to the changing needs of the cell.The availability of genetic tools has allowed investigation of the
role of mitochondrial morphology in complex cellular processes. Forexample, remodelling of mitochondrial cristae10 and fragmentationof the organellar network11,12 participate in the progression ofapoptosis. More recently, Ca2+ signalling13, formation of dendriticspines14, migration of lymphocytes15, cell cycle16, and even lifespan inPodospora anserina and Saccharomyces cerevisiae17 have been found to
1Dulbecco-Telethon Institute, Via Orus 2, 35129 Padova, Italy. 2Venetian Institute of Molecular Medicine, Via Orus 2, 35129 Padova, Italy. 3PhD Programme inExperimental Biology and Biomedicine, Center for Neuroscience and Cell Biology, University of Coimbra, 3004-517 Coimbra, Portugal. 4CNR Institute forNeurosciences, Section of Padova, Via G. Colombo 3, 35129 Padova, Italy. 5Department of Cell Physiology and Medicine, University of Geneva, 1 Rue M. Servet, 1211Geneve, Switzerland.6Correspondence should be addressed to L.S. (e-mail: [email protected])
Received 24 May 2010; accepted 31 January 2011; published online 10 April 2011; DOI: 10.1038/ncb2220
depend on regulated changes in mitochondrial morphology. Finally,mitophagy, a particular form of selective autophagy of mitochondria,requires fragmentation of the mitochondrial network to segregate thedysfunctional units to be removed18,19.Autophagy is a self-degradation process induced, for example, when
nutrients are limited20. During autophagy, pre-autophagosomal struc-tures engulf components of the cytosol, including entire organelles, giv-ing rise to autophagosomes that ultimately fuse with lysosomes, wherebreakdown of cellular components takes place21. For many years, au-tophagy has been regarded as an unselective process, but it is now clearthat under certain conditions specific cargoes are selectively targetedto autophagy, including aggregated proteins22, invading bacteria23
and superfluous or damaged organelles, such as peroxisomes24,endoplasmic reticulum membranes25 and mitochondria26. Not onlycan organelles be selectively eliminated by autophagy, but they alsoparticipate in the different steps of macroautophagy, ranging from theformation of the autophagosomal membrane27, to the amplificationof the process, in which mitochondria-derived reactive oxygen speciesseem to play a role28. Mitochondria may also serve as dockingsites for the formation of the autophagosomes29 in a process thatdepends on the tethering of the mitochondria to the endoplasmicreticulum30. However, many questions on the morphology as wellas on the functional role of mitochondria during autophagy remainopen. For example, it is unclear whether mitochondria fragment,
NATURE CELL BIOLOGY VOLUME 13 | NUMBER 5 | MAY 2011 589
© 2011 Macmillan Publishers Limited. All rights reserved.
ART I C L E S
s.d
. o
f m
tPA
GF
P f
luo
rescen
ce
(no
rmaliz
ed
to
in
itia
l valu
e)
Time (min)
Untreated
Starvation s.d
. o
f m
tPA
GF
P f
luo
rescen
ce
(no
rmaliz
ed
to
in
itia
l valu
e)
Time (min)
Untreated
15'
30'
Starvation
Mfn2–/–
Mfn2–/–
Mfn2–/–
DMF–/–
DMF–/–
Starvation
Opa1–/–
Opa1–/–
Wild type Wild type
Wild type
Drp1–/–
Drp1–/–
Cells
with e
long
ate
d m
ito
cho
nd
ria
(perc
enta
ge o
f tr
ansfe
cte
d)
Scram
ble
mTOR siRNA1
mTOR siRNA2
Cells
with e
long
ate
d m
ito
cho
nd
ria
(perc
enta
ge o
f tr
ansfe
cte
d)
Scra
mb
le
mTO
R s
iRN
A1
mTO
R s
iRN
A2
Time (h)
0
20
40
60
80
100
0 1 2 3 4 5 6
Anti-mTOR
Anti-complex-II
Scramble
0.65
0.70
0.75
0.80
0.85
0.90
0.95
1.00
1.05
0 5 10 15 20 25 30
0.65
0.70
0.75
0.80
0.85
0.90
0.95
1.00
1.05
0 5 10 15 20 25 30
40
50
60
70
80a
e f
b c
g h
d
Fasting
Starvation
mTOR siRNA1 mTOR siRNA2
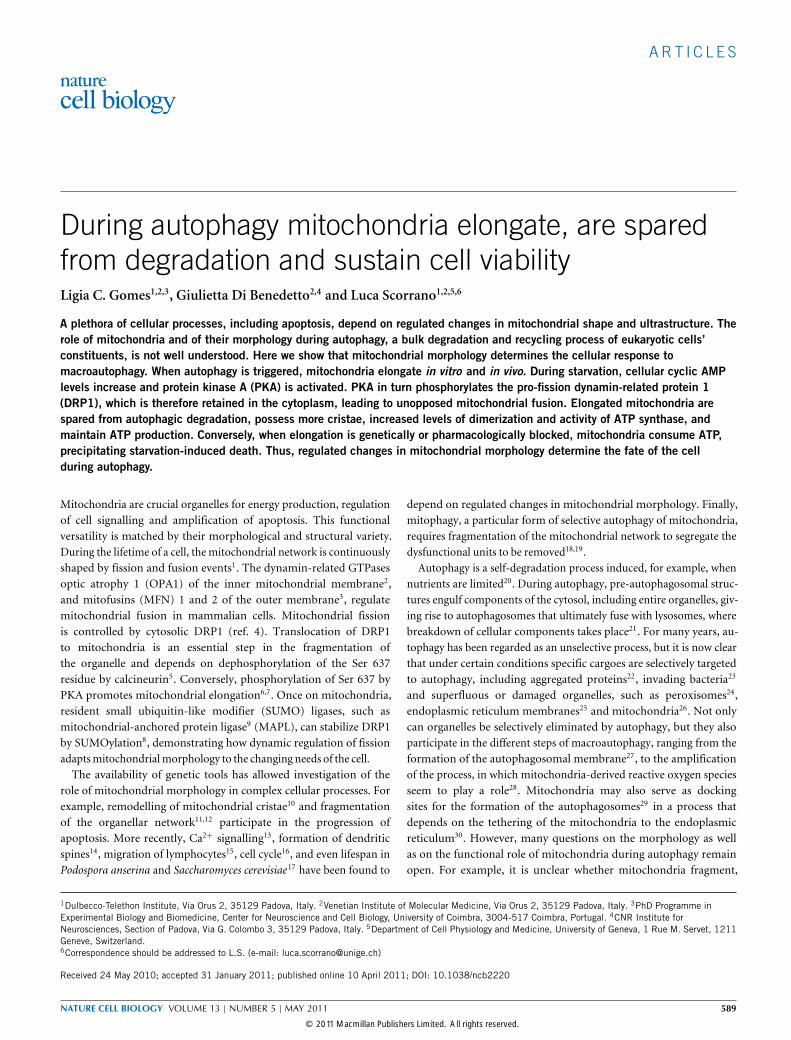
Figure 1 Mitochondrial elongation in response to autophagy.(a) Representative confocal micrographs of mitochondrial morphologyin MEFs of the indicated genotype 24h after transfection with mtYFP. Whereindicated, cells were starved for 2.5 h. Scale bar, 20 µm. (b) Morphometricanalysis of mitochondrial shape. Experiments were carried out as in a. Datarepresent mean ± s.e.m. of three independent experiments (n =100 cellsper condition in each experiment). (c) Top left, 48 h after transfectionwith the indicated siRNA, MEFs were lysed and 25 µg samples of proteinswere separated by SDS–polyacrylamide gel electrophoresis (PAGE) andimmunoblotted with the indicated antibodies. Top right and bottom,representative images show mitochondrial morphology of MEFs transfectedwith the indicated siRNA and after 24 h with mtYFP. After a further 24h,confocal micrographs were acquired. Scale bar, 20 µm. Uncropped imagesof blots are shown in Supplementary Fig. S8. (d) Morphometric analysis of
mitochondrial shape. Experiments were carried out as in c. Data representmean ± s.e.m. of five independent experiments (n=100 cells per conditionin each experiment). (e) Representative images of mitochondrial fusionover time (indicated in min). MEFs were co-transfected with mtPAGFP andmtRFP and after 24 h, mtPAGFP was photoactivated in a region of interestand cells were imaged by real-time confocal microscopy. Where indicated,MEFs were starved for 2.5 h. Scale bar, 20 µm. See also SupplementaryMovies S1 and S2. (f,g) Quantification of mitochondrial fusion in MEFs ofthe indicated genotype. Experiments were carried out as in e. Data representmean ± s.e.m. of four independent experiments. (h) Representative electronmicrographs of muscle (longitudinal sections; four top micrographs) andliver (four bottom micrographs) from CD1 mice. Where indicated, mice werefasted for 12 h. The outlined regions of micrographs from muscle samplesare magnified ×7 in the images below. Scale bars, 2 µm.
if they are randomly targeted to autophagosomes and if the finaloutcome of autophagy is influenced by changes in mitochondrialmorphology. Here we show that mitochondria unexpectedly elongateduring macroautophagy. Mitochondrial elongation is triggered byPKA-mediated inhibition of DRP1 and is required to sustain cellularATP levels and viability. Our results indicate that mitochondrial shapedetermines cellular fate during macroautophagy.
RESULTSMitochondria elongate on induction of autophagyWe assessed whether mitochondrial morphology is modified duringautophagy. Confocal microscopy of wild-typemouse embryonic fibrob-lasts (MEFs) expressing a mitochondrially targeted yellow fluorescentprotein (mtYFP) showed that induction of autophagy by starvation led
to an early elongation of mitochondria resulting in a network of highlyinterconnected organelles (Fig. 1a,b). Elongation was observed as soonas 1 h after nutrient deprivation, was maintained for up to 48 h (datanot shown) and occurred in all of the cell lines tested (mouse C2C12myoblasts, human HeLa epithelial and HepG2 hepatocarcinoma cells),as well as in primary mouse hepatocytes (Supplementary Fig. S1a).Inactivation of the mammalian target of rapamycin (mTOR)metabolicsensor is another classical stimulus of autophagy. Efficient knockdownof mTOR mediated by short RNA interference also triggered mito-chondrial elongation (Fig. 1c,d). Next, cells were co-transfected withmitochondrially targeted photoactivatable green fluorescent protein(mtPAGFP) and mitochondrially targeted red fluorescent protein(mtRFP). The dilution rate of mtPAGFP is proportional to productivefusion events31. The dilution rate increased on starvation in wild-type
590 NATURE CELL BIOLOGY VOLUME 13 | NUMBER 5 | MAY 2011
© 2011 Macmillan Publishers Limited. All rights reserved.
ART I C L E S
Immunoprecipitated
anti-DRP1
0 1 2.5 5
DMF–/–
Anti-DRP1
Anti-FIS1
Anti-actin
Anti-OPA1
0 2.5 5 0 2.5 5 0 2.5 5
Wild type Opa1–/–
Anti-OPA1
Anti-MFN2
Anti-MFN2
Anti-DRP1
Anti-DRP1
Anti-FIS1
Anti-FIS1
Anti-actin
Anti-actin
Anti-MFN1
Anti-MFN1
0 2.5 5
Mfn2–/–
Anti-OPA1
Anti-MFN1
Anti-DRP1
Anti-FIS1
Anti-actin
2.510 5
DR
P1
(p
-S6
37
)/D
RP
1
Time (h)
Anti-p-S637
Anti-DRP1
Anti-β-tubulin
FRSK
mTO
R
Scram
ble
FRSK
Rapamycin (h)
3 6 15
Anti-p-S637
Anti-DRP1
Anti-β-tubulin
0
Anti-DRP1
Starv. (h)
Starv. (h) Starv. (h) Starv. (h)Starv. (h)
Starv. (h)
Anti-TOM20
Anti-DRP1
Anti-p-S637
1.0
1.5
2.0
2.5
3.0
3.5
4.0
0 2 4 6
a d
h
i
b
e g
f
c
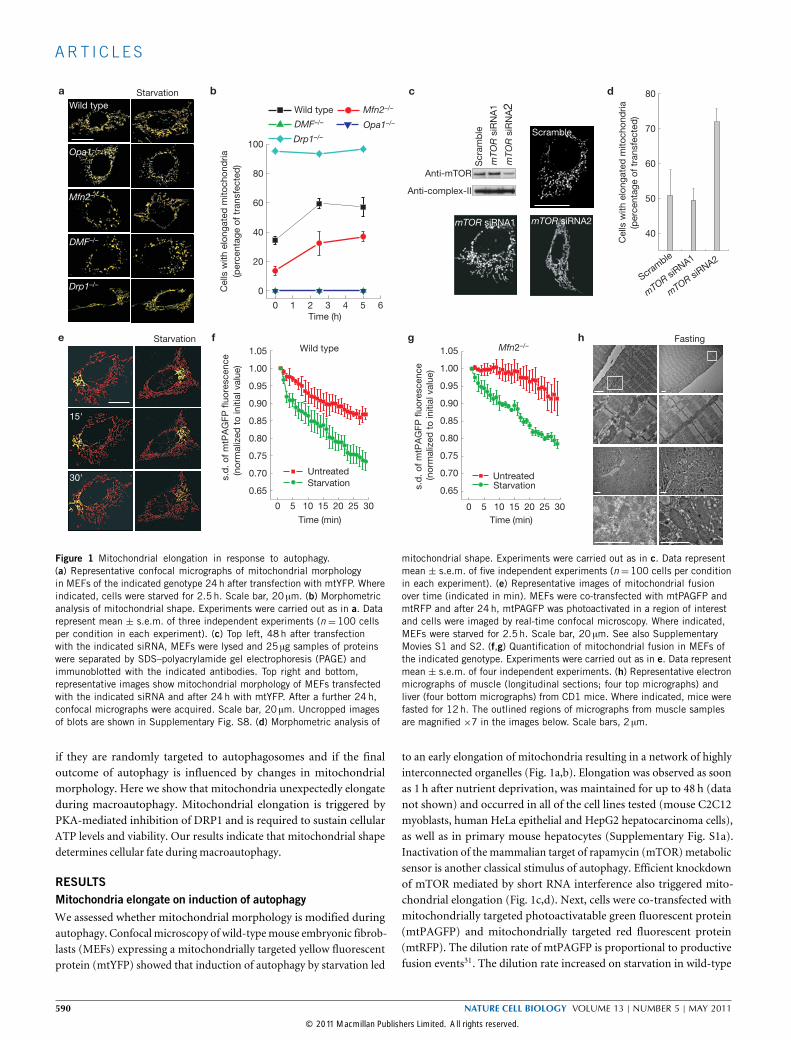
Figure 2 Increased phosphorylation of Ser 637 of DRP1 during autophagy.(a–d) Levels of mitochondria-shaping proteins during starvation. Proteinsamples (20 µg) from MEFs of the indicated genotype were separatedby SDS–PAGE and immunoblotted with the indicated antibodies. Cellswere starved for the indicated times. (e) Association of DRP1 withmitochondria during starvation. Mitochondria were isolated from MEFsstarved for the indicated times and 25 µg samples of proteins wereseparated by SDS–PAGE and immunoblotted with the indicated antibodies.(f) Levels of Ser 637 phosphorylation of DRP1 during starvation.Equal amounts of cell lysates from wild-type MEFs starved for theindicated times were immunoprecipitated with the indicated antibodyand the immunoprecipitated proteins were separated by SDS–PAGE and
immunoblotted with the indicated antibodies. (g) Quantitative analysisof Ser 637 phosphorylation of DRP1 during starvation. Experiments werecarried out as in f. Data are normalized to total levels of DRP1 and representthe mean ± s.e.m. of three independent experiments. (h) MEFs weretreated for the indicated times with 100nM rapamycin or with 25 µMforskolin (FRSK) for 0.5 h, lysed and equal amounts (50 µg) of proteinswere separated by SDS–PAGE and immunoblotted using the indicatedantibodies. (i) HeLa cells were transfected for 2 days with the indicatedsiRNA or treated with 25 µM forskolin for 0.5 h and lysed. Equal amounts(50 µg) of proteins were separated by SDS–PAGE and immunoblotted usingthe indicated antibodies. Uncropped images of all blots in this figure areshown in Supplementary Fig. S8.
as well as Mfn2−/− cells (Fig. 1e–g and Supplementary Movie S1).Accordingly, induction of autophagy led to mitochondrial elongationin Mfn2−/−, but not in Opa1−/− (ref. 32) and Mfn1−/−Mfn2−/−
(DMF−/−; ref. 33) MEFs, which lack the core components of the mito-chondrial fusion machinery, and mitochondria remained elongated inDrp1−/− cells, in which fission is genetically impaired34 (Fig. 1a,b). BAX(B-cell lymphoma 2 (BCL2)-associated X protein) and BAK (BCL2antagonist killer 1) are necessary for fusion of mitochondria18 and intheir absence autophagy is enhanced as a default deathmechanism19. Inresponse to starvation, the Bax−/−Bak−/− punctiform mitochondriaalso elongated (Supplementary Fig. S1c,d), indicating that BAX andBAK are not essential for elongation during induction of autophagy.In all of the MEFs tested, autophagic flux measured in the presence ofbafilomycin A1 was comparable, as judged by processing of cytosoliclight chain 3 (LC3-I) to the membrane bound form (LC3-II) and bydegradation of p62 (Supplementary Fig. S2). In addition, mitochon-drial elongation during starvation was still observed when proximal
autophagic signalling was blocked by wortmannin (Supplementary Fig.S3) and in cells lacking the key component of the autophagicmachinery,autophagy protein 5 (ATG5; data not shown). When autophagy wasinduced in vivo by fasting mice for 12 h, electron microscopy ofmuscle and liver revealed similar changes inmitochondrialmorphology.Longitudinal sections of tibialis anterior from fasted mice showedthat intermyofibrillar mitochondria were retrieved as one elongatedorganelle, no longer surrounded by glycogen granules; also in liver, per-inuclear mitochondria were clearly elongated in fasted mice (Fig. 1h).In sum, mitochondrial elongation requires the core mitochondrialfusion machinery and is not dependent on autophagosome formation,which is conversely independent frommitochondrial elongation.
Mitochondrial elongation during autophagy depends on DRP1phosphorylation by PKAMitochondrial hyperfusion can be triggered by a panoply of stressstimuli and depends on changes in OPA1 forms20. In response to
NATURE CELL BIOLOGY VOLUME 13 | NUMBER 5 | MAY 2011 591
© 2011 Macmillan Publishers Limited. All rights reserved.
ART I C L E S
-
Starv
atio
n
Starv
atio
n-
Cells
with e
long
ate
d m
ito
cho
nd
ria
(perc
enta
ge o
f tr
ansfe
cte
d)
Cells
with e
long
ate
d m
ito
cho
nd
ria
(perc
enta
ge o
f tr
ansfe
cte
d)
Cells
with e
long
ate
d m
ito
cho
nd
ria
(perc
enta
ge o
f tr
ansfe
cte
d)
H89
Starvation FRSKStarv. (h)
Anti-CREB
Anti-p-CREB Anti-p-ATF1
Wild type
FR
SK
- H89
H89
1 2.5
Anti-Tubulin
Anti-CREB
Anti-p-CREB
Anti-p-ATF1
Anti-β-tubulin
– Starv. FRSK
– Starv. FRSK
Anti-p-CREB
Anti-p-ATF1
Anti-β-tubulin
Anti-CREB
Anti-p-CREB
Anti-p-ATF1
Anti-β-tubulin
Anti-CREB
Opa1–/–
- Starv. FRSK
Starvation
Starvation+H89
H89
Starvation
H89
Starvation+H89
Starved 25'
Starved 2'
FRSK
0
1.5
-
Starv
atio
n
Starv
atio
n
Starv
. + H
89
Starv
. + H
89
Empty vectorEmpty vector DRP1S637A
-
40
50
60
70
80
90
DRP1Drp1–/–
+DRP1S637A DRP1S637A
–YFP+DRP1–YFP
Starvation Starvation
Starv.+H89 Starv.+H89
Wild type
+DRP1S637A
–YFP
Starvation Starvation
Starv.+H89 Starv.+H89
1.00
1.04
1.08
1.12
F 1/F
0
1.16
1.20
0 20Time (min)
40 60 80
Mfn2–/–
DMF–/–
Mfn2–/–
Mfn2–/–
Wild type
Wild type
10
20
30
40
50
60
70
80
20
30
40
50
60
70
80
a b c
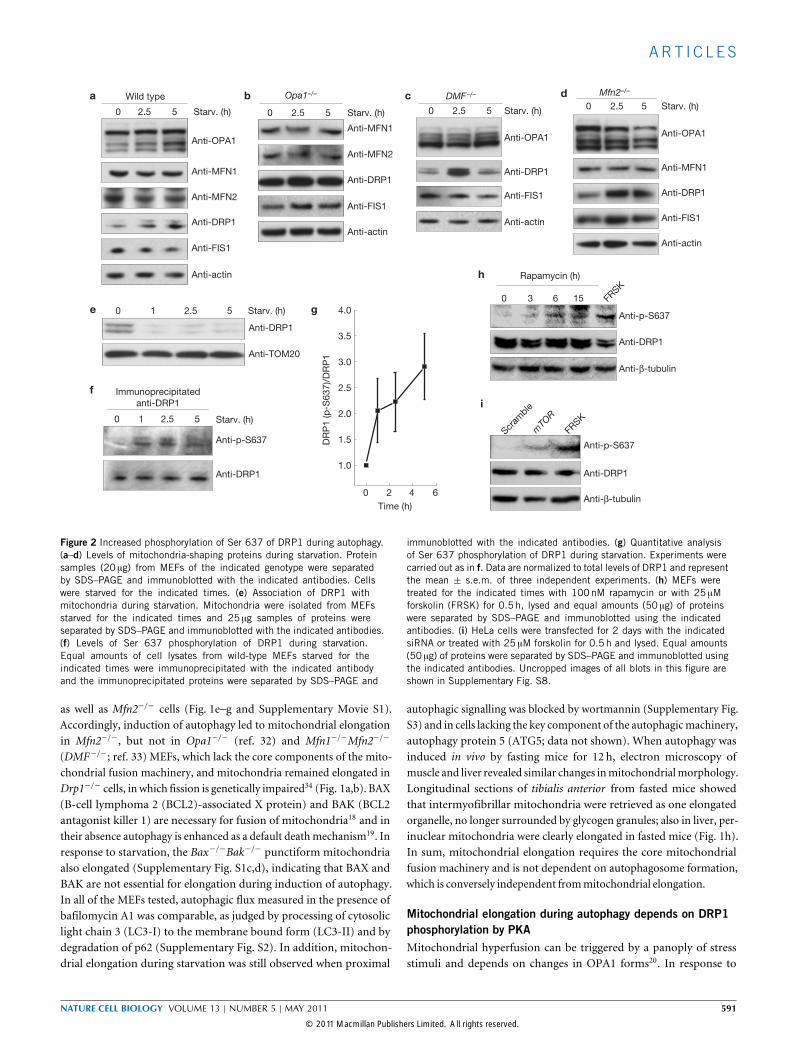
d e f g h i
Figure 3 Mitochondrial elongation during starvation is mediated by thecAMP–PKA axis. (a) Pseudocolour-coded images of EPACI–camps FRETfrom real-time imaging of wild-type MEFs transfected with EPACI–camps.Where indicated, cells were perfused with the starvation solution forthe indicated times (in min) or with 25 µM forskolin (FRSK). Scale bar,20 µm. Colour scale indicates F 1/F 0 ratio. See also SupplementaryMovie S3. (b) Quantitative analysis of CFP/YFP FRET ratio. Experimentswere carried out as in a. Where indicated, cells were perfused withthe starvation solution or with 25 µM forskolin. Data represent mean± s.e.m. of 13 independent experiments. (c) Lysate samples (50 µg)from MEFs of the indicated genotypes were analysed by SDS–PAGEand immunoblotting using the indicated antibodies. Where indicated,MEFs were starved, or treated with 25 µM forskolin. Where indicated,20 µM H89 was added during starvation. Uncropped images of all blotsin this figure are shown in Supplementary Fig. S8. (d) Representativeimages of the effect of H89 on mitochondrial morphology on starvation.Wild-type and Mfn2−/−MEFs were transfected with mtYFP, and after 24 hconfocal micrographs were acquired. Where indicated, cells were starved
for 2.5 h and 20 µM H89 was added. Scale bar, 20 µm. (e) Morphometricanalysis. Experiments were carried out as in d. Data represent mean ±s.e.m. of five independent experiments (n = 100 cells per condition).(f) Starvation-induced mitochondrial elongation depends on Ser 637 ofDRP1. Representative confocal micrographs of mitochondrial morphologyof wild-type MEFs co-transfected with mtRFP and the indicated plasmids.At 24h after transfection, where indicated cells were starved for 2.5 hand imaged. Where indicated, 20 µM H89 was present during starvation.Scale bar, 20 µm. (g) Morphometric analysis of mitochondrial shape.Experiments were carried out as in f. Data represent mean ± s.e.m. of fiveindependent experiments (n=50 cells per condition). (h) Representativeconfocal micrographs of mitochondrial morphology of Drp1−/− MEFsco-transfected with mtRFP and the indicated plasmids. At 24h aftertransfection, where indicated cells were starved for 2.5 h and imaged.Where indicated, 20 µM H89 was present during starvation. Scale bar,20 µm. (i) Morphometric analysis of mitochondrial shape. Experimentswere carried out as in h. Data represent mean ± s.e.m. of five independentexperiments (n=50 cells per condition).
starvation, however, levels of total as well as of individual forms ofOPA1were stable, similarly to those ofMFN1,MFN2 and FIS1 (fission 1homologue). The total amount of the fission protein DRP1 was slightlyincreased (Fig. 2a–d), but less DRP1 was associated with mitochondriaduring starvation (Fig. 2e). This result indicates that during starvationmitochondrial fusion is left unopposed. The kinase PKA and thephosphatase calcineurin regulate phosphorylation of the Ser 637 residueof DRP1, its translocation to mitochondria and therefore the intensityof mitochondrial fission5. Notably, during starvation the level ofDRP1 Ser 637 phosphorylation was increased (Fig. 2f,g). Similarly,pharmacologic inhibition or silencing of mTOR resulted in anincreased level of Ser 637 phosphorylation (Fig. 2h,i). Increased levelsof phosphorylation could result from PKA activation or calcineurininhibition: we therefore examined levels of the proximal PKA activator
cAMP in response to starvation using a genetically encoded EPAC(exchange protein directly activated by cAMP)-based fluorescenceresonance energy transfer (FRET) probe (EPACI–camps). Real-timeimaging showed that there was a robust increase in cAMP levels whenMEFs were switched from a nutrient-rich to ‘starvation’ medium(Fig. 3a,b). This increase resulted in the downstream activation ofPKA, as measured by the phosphorylation of the PKA targets CREB(cAMP-response element-binding protein) and ATF1 (activatingtranscription factor 1). Phosphorylation of CREB and AFT1 wassensitive to H89, a pharmacological inhibitor of PKA (Fig. 3c).Activation of PKA was detected in all of the other cell lines (mouseC2C12, human HeLa and HepG2), in which starvation inducedmitochondrial elongation (Supplementary Fig. S1b). PKA activationwas comparable in cells in which mitochondria did (wild-type and
592 NATURE CELL BIOLOGY VOLUME 13 | NUMBER 5 | MAY 2011
© 2011 Macmillan Publishers Limited. All rights reserved.
ART I C L E S
Anti-MnSOD
Anti-PMP70
Anti-actin
Anti-cyclophilin D
Anti-complex-II
Starvation (h)
Starv. Starv.
Wo
rtm
.
Wo
rtm
.
Wo
rtm
.
Wo
rtm
.
Anti-MnSOD
Anti-PMP70
Anti-actin
Anti-cyclophilin D
Anti-complex-II
4
5
Cyclo
phili
n D
/PM
P70
0 5 8 10 0 5 8 10 0 5 8 10 0 5 8 10 0 5 8 10 0 5 8 10
DMF–/–
DMF–/–
Opa1–/–
Opa1–/–Opa1–/–
Wild type Wild type Wild type
Wild type Wild type
Drp1–/–
Drp1–/–
0.0
0.2
0.4
0.6
0.8
1.0
1.2
1.4
0 3
Time (h)
6 9
a
d e
b c
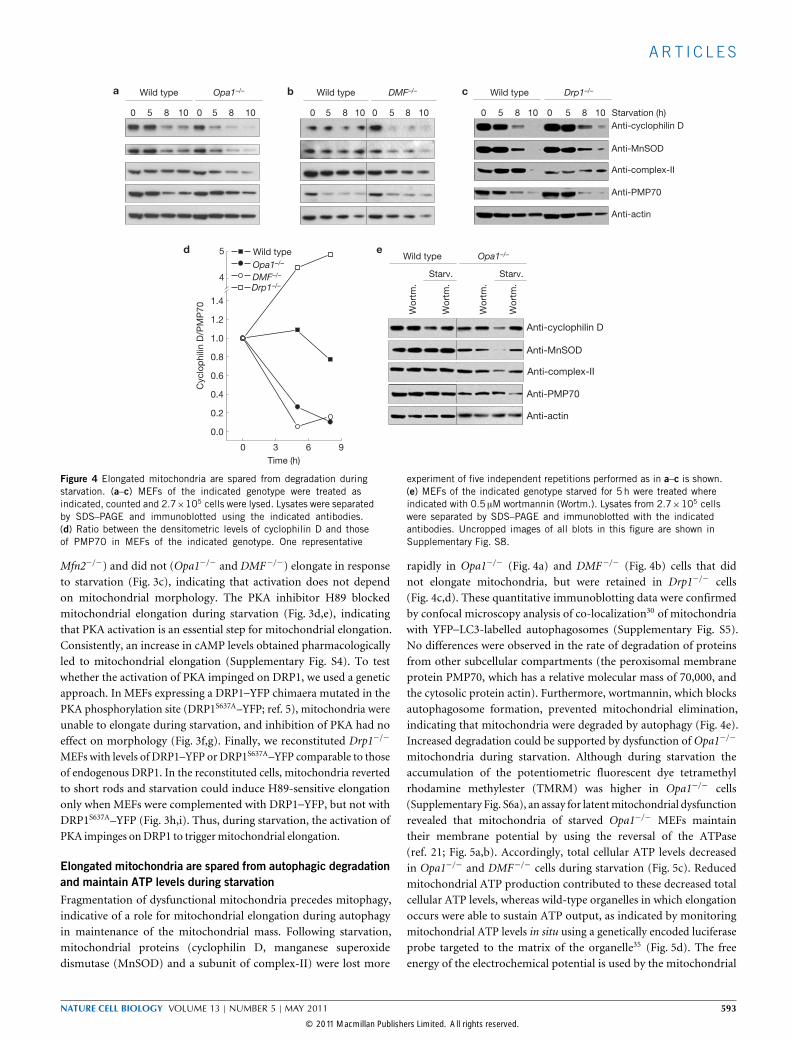
Figure 4 Elongated mitochondria are spared from degradation duringstarvation. (a–c) MEFs of the indicated genotype were treated asindicated, counted and 2.7×10⁵ cells were lysed. Lysates were separatedby SDS–PAGE and immunoblotted using the indicated antibodies.(d) Ratio between the densitometric levels of cyclophilin D and thoseof PMP70 in MEFs of the indicated genotype. One representative
experiment of five independent repetitions performed as in a–c is shown.(e) MEFs of the indicated genotype starved for 5 h were treated whereindicated with 0.5 µM wortmannin (Wortm.). Lysates from 2.7×10⁵ cellswere separated by SDS–PAGE and immunoblotted with the indicatedantibodies. Uncropped images of all blots in this figure are shown inSupplementary Fig. S8.
Mfn2−/−) and did not (Opa1−/− and DMF−/−) elongate in responseto starvation (Fig. 3c), indicating that activation does not dependon mitochondrial morphology. The PKA inhibitor H89 blockedmitochondrial elongation during starvation (Fig. 3d,e), indicatingthat PKA activation is an essential step for mitochondrial elongation.Consistently, an increase in cAMP levels obtained pharmacologicallyled to mitochondrial elongation (Supplementary Fig. S4). To testwhether the activation of PKA impinged on DRP1, we used a geneticapproach. In MEFs expressing a DRP1–YFP chimaera mutated in thePKA phosphorylation site (DRP1S637A–YFP; ref. 5), mitochondria wereunable to elongate during starvation, and inhibition of PKA had noeffect on morphology (Fig. 3f,g). Finally, we reconstituted Drp1−/−
MEFs with levels of DRP1–YFP or DRP1S637A–YFP comparable to thoseof endogenous DRP1. In the reconstituted cells, mitochondria revertedto short rods and starvation could induce H89-sensitive elongationonly when MEFs were complemented with DRP1–YFP, but not withDRP1S637A–YFP (Fig. 3h,i). Thus, during starvation, the activation ofPKA impinges onDRP1 to triggermitochondrial elongation.
Elongated mitochondria are spared from autophagic degradationand maintain ATP levels during starvationFragmentation of dysfunctional mitochondria precedes mitophagy,indicative of a role for mitochondrial elongation during autophagyin maintenance of the mitochondrial mass. Following starvation,mitochondrial proteins (cyclophilin D, manganese superoxidedismutase (MnSOD) and a subunit of complex-II) were lost more
rapidly in Opa1−/− (Fig. 4a) and DMF−/− (Fig. 4b) cells that didnot elongate mitochondria, but were retained in Drp1−/− cells(Fig. 4c,d). These quantitative immunoblotting data were confirmedby confocal microscopy analysis of co-localization30 of mitochondriawith YFP–LC3-labelled autophagosomes (Supplementary Fig. S5).No differences were observed in the rate of degradation of proteinsfrom other subcellular compartments (the peroxisomal membraneprotein PMP70, which has a relative molecular mass of 70,000, andthe cytosolic protein actin). Furthermore, wortmannin, which blocksautophagosome formation, prevented mitochondrial elimination,indicating that mitochondria were degraded by autophagy (Fig. 4e).Increased degradation could be supported by dysfunction of Opa1−/−
mitochondria during starvation. Although during starvation theaccumulation of the potentiometric fluorescent dye tetramethylrhodamine methylester (TMRM) was higher in Opa1−/− cells(Supplementary Fig. S6a), an assay for latentmitochondrial dysfunctionrevealed that mitochondria of starved Opa1−/− MEFs maintaintheir membrane potential by using the reversal of the ATPase(ref. 21; Fig. 5a,b). Accordingly, total cellular ATP levels decreasedin Opa1−/− and DMF−/− cells during starvation (Fig. 5c). Reducedmitochondrial ATP production contributed to these decreased totalcellular ATP levels, whereas wild-type organelles in which elongationoccurs were able to sustain ATP output, as indicated by monitoringmitochondrial ATP levels in situ using a genetically encoded luciferaseprobe targeted to the matrix of the organelle35 (Fig. 5d). The freeenergy of the electrochemical potential is used by the mitochondrial
NATURE CELL BIOLOGY VOLUME 13 | NUMBER 5 | MAY 2011 593
© 2011 Macmillan Publishers Limited. All rights reserved.
ART I C L E S
0 5 10 15 20 25
20
30
40
50
60
70
80
90
100
Via
bili
ty
(p
erc
en
tag
e o
f an
nexin
-V–,
PI–
cells
)
Via
bili
ty
(p
erc
en
tag
e o
f an
nexin
-V–,
PI–
cells
)
Via
bili
ty
(p
erc
en
tag
e o
f an
nexin
-V–,
PI–
cells
)
Via
bili
ty
(p
erc
en
tag
e o
f an
nexin
-V–,
PI–
cells
)
Via
bili
ty
(p
erc
en
tag
e o
f an
nexin
-V–,
PI–
cells
)
Via
bili
ty
(p
erc
en
tag
e o
f an
nexin
-V–,
PI–
cells
)
–
Starvation –
Starvation
30
40
50
60
70
80
90
100
Oligomycin
–
Starvation –
Starvation
30
40
50
60
70
80
90
100 H89
TM
RM
flu
ore
scen
ce
(perc
en
tag
e o
f in
itia
l valu
e)
Time (min)
Time (h) Time (h)
Time (min)
Untreated
Starvation
Wild type
FCCP FCCP
TM
RM
flu
ore
scen
ce
(perc
en
tag
e o
f in
itia
l valu
e)
Untreated
Starvation
–
Starvation –
Starvation
Oligomycin
Time (h)
Mito
ch
on
drial A
TP
(m
ito
ch
on
drial
lucifera
se a
ctivity,
no
rmaliz
ed
to
in
itia
l valu
e)
Cell
death
(perc
en
tag
e o
f Y
FP
+,
PI+
cells
)
DRP1–YFP
DRP1 S637A –YFP
To
tal A
TP
levels
( perc
en
tag
e o
f in
itia
l valu
e)
Time (h)
Oligomycin
20
40
60
80
100
120Oligomycin
20
40
60
80
100
120
0 50 100 150 200 0 50 100 150 200
40
60
80
100
120
0 1 2 3 4 5 6
Time (h)
0.5
0.6
0.7
0.8
0.9
1.0
1.1
1.2
1.3
DMF–/–
DMF–/–
DMF–/–
DMF–/–
Opa1–/–
Opa1–/–
Opa1–/–
Opa1–/–
Opa1–/–
Drp1–/–
Opa1–/–
Wild type
Wild type
Wild type
Wild type
Wild type
Wild typeWild type
Wild type
20
30
40
50
60
70
80
90
100
0 5 10 15 20 25
30
40
50
60
70
80
90
100
0 5 10 15 20 25
– Starvation
10
20
30
40
50
60
30
40
50
60
70
80
90
100
a
e
h i j k
f g
b c d
0 1 2 3 4 5 6
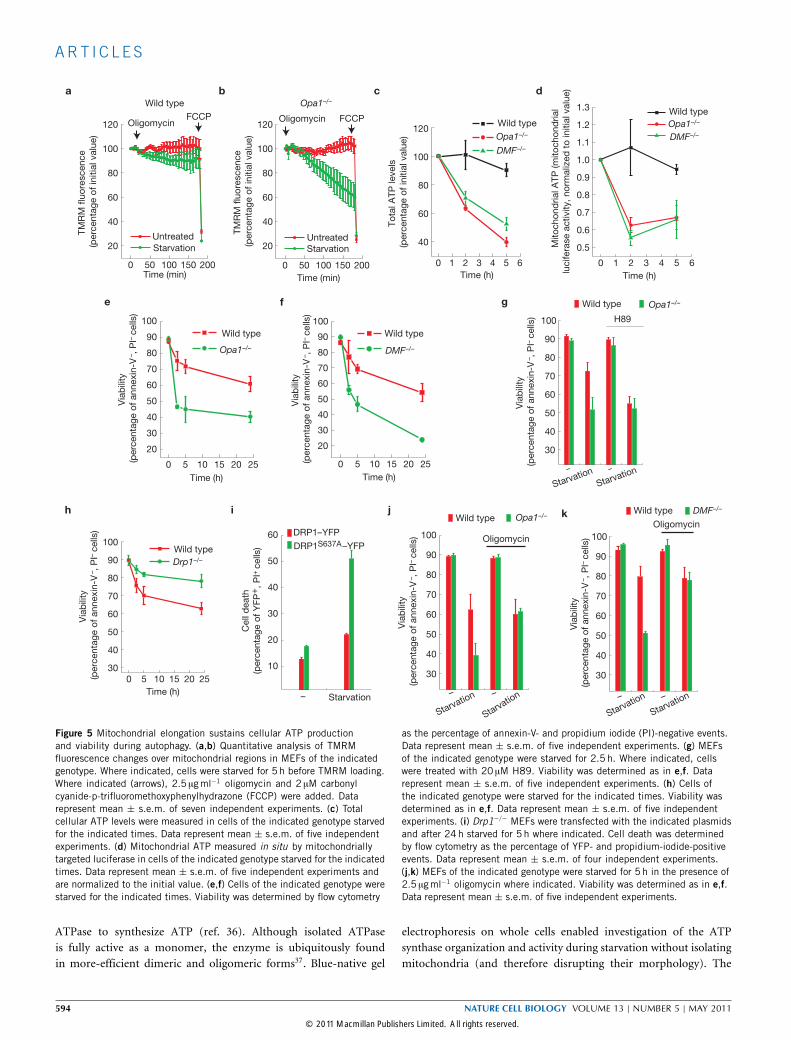
Figure 5 Mitochondrial elongation sustains cellular ATP productionand viability during autophagy. (a,b) Quantitative analysis of TMRMfluorescence changes over mitochondrial regions in MEFs of the indicatedgenotype. Where indicated, cells were starved for 5 h before TMRM loading.Where indicated (arrows), 2.5 µgml−1 oligomycin and 2 µM carbonylcyanide-p-trifluoromethoxyphenylhydrazone (FCCP) were added. Datarepresent mean ± s.e.m. of seven independent experiments. (c) Totalcellular ATP levels were measured in cells of the indicated genotype starvedfor the indicated times. Data represent mean ± s.e.m. of five independentexperiments. (d) Mitochondrial ATP measured in situ by mitochondriallytargeted luciferase in cells of the indicated genotype starved for the indicatedtimes. Data represent mean ± s.e.m. of five independent experiments andare normalized to the initial value. (e,f) Cells of the indicated genotype werestarved for the indicated times. Viability was determined by flow cytometry
as the percentage of annexin-V- and propidium iodide (PI)-negative events.Data represent mean ± s.e.m. of five independent experiments. (g) MEFsof the indicated genotype were starved for 2.5 h. Where indicated, cellswere treated with 20 µM H89. Viability was determined as in e,f. Datarepresent mean ± s.e.m. of five independent experiments. (h) Cells ofthe indicated genotype were starved for the indicated times. Viability wasdetermined as in e,f. Data represent mean ± s.e.m. of five independentexperiments. (i) Drp1−/− MEFs were transfected with the indicated plasmidsand after 24 h starved for 5 h where indicated. Cell death was determinedby flow cytometry as the percentage of YFP- and propidium-iodide-positiveevents. Data represent mean ± s.e.m. of four independent experiments.(j,k) MEFs of the indicated genotype were starved for 5 h in the presence of2.5 µgml−1 oligomycin where indicated. Viability was determined as in e,f.Data represent mean ± s.e.m. of five independent experiments.
ATPase to synthesize ATP (ref. 36). Although isolated ATPaseis fully active as a monomer, the enzyme is ubiquitously foundin more-efficient dimeric and oligomeric forms37. Blue-native gel
electrophoresis on whole cells enabled investigation of the ATPsynthase organization and activity during starvation without isolatingmitochondria (and therefore disrupting their morphology). The
594 NATURE CELL BIOLOGY VOLUME 13 | NUMBER 5 | MAY 2011
© 2011 Macmillan Publishers Limited. All rights reserved.

ART I C L E S
0 02 5 2 5
Activity
Anti-ATPase, α
Anti-ATPase, α
Dimer
Monomer
Dimer
Monomer
Starvation (h)
0 02 5 2 5Starvation (h)
Dim
er/
mo
no
mer
AT
Pase a
ctivity
(no
rmaliz
ed
to
in
itia
l valu
e)
Dim
er/
mo
no
mer
AT
Pase level
(no
rmaliz
ed
to
in
itia
l valu
e)
Time (h)
Activity
0 1 2 3 4 5 6
Time (h)
Opa1–/–Opa1–/–
Opa1–/–
Wild type
Wild type
Wild type
Wild type
DMF– /–
0.5
1.0
1.5
2.0
2.5
3.0
0 1 2 3 4 5 6
Dimer
Monomer
Dimer
Monomer
a
c
d
b
1
2
3
4
5
6
7
Figure 6 Mitochondrial elongation during starvation is associated withdimerization and activation of ATPase. (a) Blue-native electrophoresisanalysis of ATPase dimerization and activity. Cells of the indicated genotypewere treated as indicated and 500 µg of total cell extract was solubilizedwith 4% digitonin and proteins were separated by blue-native PAGE. ATPaseactivity was measured in-gel (top) and ATPase levels were measured by
immunoblotting for the indicated antibody (bottom). (b,c) Quantitativeanalysis of the ratio of levels (b) and activity (c) between dimeric andmonomeric forms of ATPase, assessed by densitometric analysis of gelsfrom experiments performed as in a. Data represent mean ± s.e.m. of fiveindependent experiments. (d) Experiments were carried out as in a, but withcells of the indicated genotype.
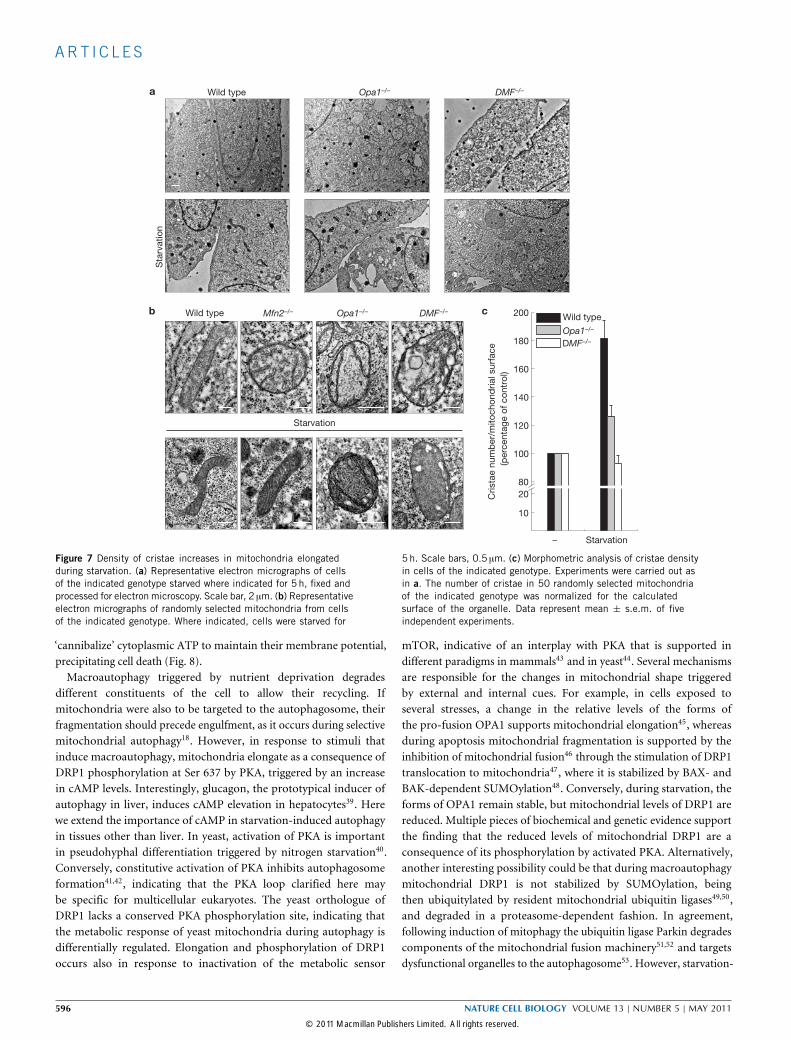
total levels of ATP synthase increased on starvation as indicatedby specific immunoblotting (Supplementary Fig. S6b). In wild-type,but not Opa1−/− or DMF−/−, MEFs the ratio between the dimericand the monomeric form of the ATPase was higher already innon-starved cells and increased during starvation, as demonstratedby a specific in-gel activity assay for ATPase activity (Fig. 6).Dimerization of ATPase correlates with formation of cristae37,38.However, the opposite can also be true, that increased cristae surfacearea favours oligomerization of the ATPase. Electron microscopy andmorphometric analysis showed that the number of cristae per unit ofmitochondrial surface increased during starvation in wild-type andMfn2−/− mitochondria that elongate, whereas it remained stable inOpa1−/− and DMF−/− mitochondria that do not (Fig. 7a–c). Thus,during starvation mitochondrial elongation correlates with increasedcristae surface area, oligomerization of the ATPase and maintenance ofmitochondrial ATP production.
Mitochondrial elongation protects cells from deathduring starvationNext, we addressed the role of starvation-induced elongation inthe cellular response to nutrient depletion. Opa1−/− and DMF−/−
as well as cells in which PKA was inhibited (Fig. 5e–g) died more
rapidly, whereas Drp1−/− MEFs were less susceptible to starvation(Fig. 5h). The increased level of death by starvation of cells treatedwith H89 was phenocopied in Drp1−/− MEFs reconstituted with theDRP1S637A mutant (Fig. 5i). Knockdown of OPA1 in HeLa cells alsoaccelerated starvation-induced cell death (Supplementary Fig. S7a,b).Death of Opa1−/− and DMF−/− MEFs was prevented by the ATPaseinhibitor oligomycin (Fig. 5j,k), in accordance with the fact thatmitochondria unable to elongate during starvation maintain theirmembrane potential by hydrolysing and consuming cellular ATP(Fig. 5b,c). In conclusion, mitochondria unable to elongate duringnutrient deprivation consume cellular ATP, leading to cell death.
DISCUSSIONWe have demonstrated that during starvation mitochondria elongateand that this is a critical component of the cellular response toautophagy. In starving cells, a rapid increase in cAMP levels activatesPKA, which in turn phosphorylates DRP1, keeping it in the cytosol andallowing unopposed mitochondrial fusion. Elongated mitochondriaare protected from autophagic elimination and have a higher densityof cristae, which favours oligomerization of ATPase to maintain ATPproduction and to allow survival of starving cells. On the contrary,if elongation is blocked, mitochondria become dysfunctional and
NATURE CELL BIOLOGY VOLUME 13 | NUMBER 5 | MAY 2011 595
© 2011 Macmillan Publishers Limited. All rights reserved.
ART I C L E S
Sta
rvatio
n
Starvation
Starvation–
Cri
sta
e n
um
ber/
mito
ch
on
dri
al su
rface
(perc
en
tag
e o
f co
ntr
ol)
DMF–/–
DMF–/–
Opa1–/–
Opa1–/–
Wild type
Wild typeWild type Mfn2–/– DMF–/–Opa1–/–
10
20
80
100
120
140
160
180
200
a
b c
Figure 7 Density of cristae increases in mitochondria elongatedduring starvation. (a) Representative electron micrographs of cellsof the indicated genotype starved where indicated for 5 h, fixed andprocessed for electron microscopy. Scale bar, 2 µm. (b) Representativeelectron micrographs of randomly selected mitochondria from cellsof the indicated genotype. Where indicated, cells were starved for
5 h. Scale bars, 0.5 µm. (c) Morphometric analysis of cristae densityin cells of the indicated genotype. Experiments were carried out asin a. The number of cristae in 50 randomly selected mitochondriaof the indicated genotype was normalized for the calculatedsurface of the organelle. Data represent mean ± s.e.m. of fiveindependent experiments.
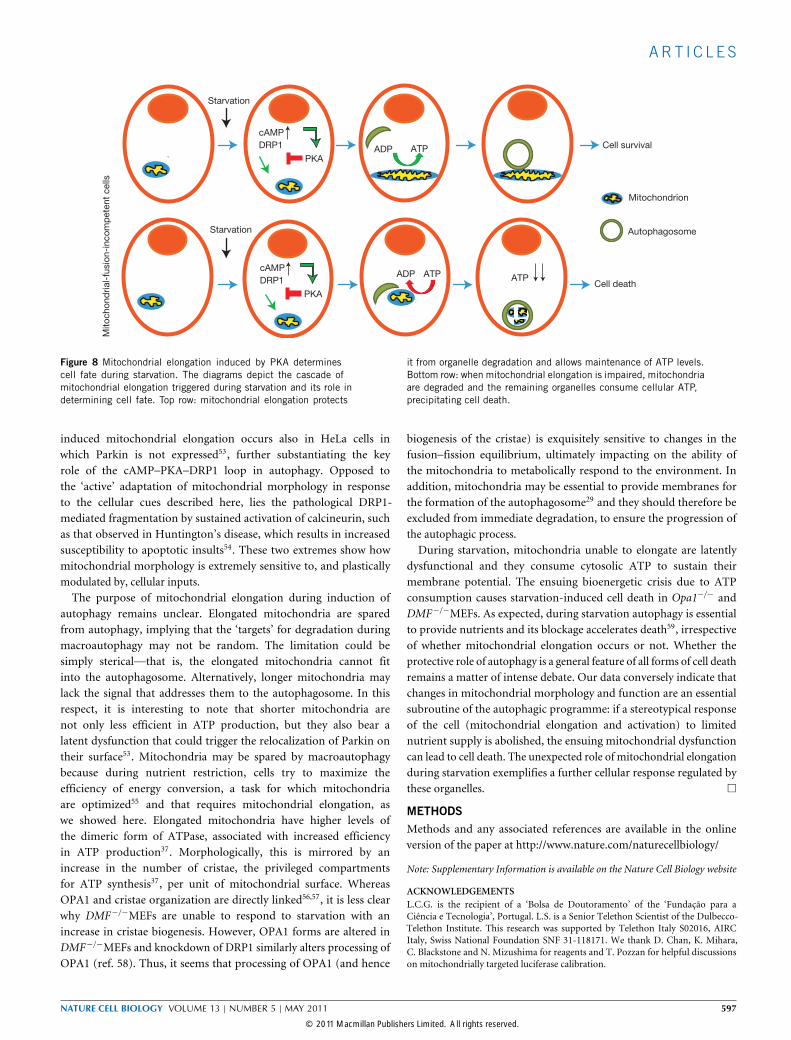
‘cannibalize’ cytoplasmic ATP to maintain their membrane potential,precipitating cell death (Fig. 8).Macroautophagy triggered by nutrient deprivation degrades
different constituents of the cell to allow their recycling. Ifmitochondria were also to be targeted to the autophagosome, theirfragmentation should precede engulfment, as it occurs during selectivemitochondrial autophagy18. However, in response to stimuli thatinduce macroautophagy, mitochondria elongate as a consequence ofDRP1 phosphorylation at Ser 637 by PKA, triggered by an increasein cAMP levels. Interestingly, glucagon, the prototypical inducer ofautophagy in liver, induces cAMP elevation in hepatocytes39. Herewe extend the importance of cAMP in starvation-induced autophagyin tissues other than liver. In yeast, activation of PKA is importantin pseudohyphal differentiation triggered by nitrogen starvation40.Conversely, constitutive activation of PKA inhibits autophagosomeformation41,42, indicating that the PKA loop clarified here maybe specific for multicellular eukaryotes. The yeast orthologue ofDRP1 lacks a conserved PKA phosphorylation site, indicating thatthe metabolic response of yeast mitochondria during autophagy isdifferentially regulated. Elongation and phosphorylation of DRP1occurs also in response to inactivation of the metabolic sensor
mTOR, indicative of an interplay with PKA that is supported indifferent paradigms in mammals43 and in yeast44. Several mechanismsare responsible for the changes in mitochondrial shape triggeredby external and internal cues. For example, in cells exposed toseveral stresses, a change in the relative levels of the forms ofthe pro-fusion OPA1 supports mitochondrial elongation45, whereasduring apoptosis mitochondrial fragmentation is supported by theinhibition of mitochondrial fusion46 through the stimulation of DRP1translocation to mitochondria47, where it is stabilized by BAX- andBAK-dependent SUMOylation48. Conversely, during starvation, theforms of OPA1 remain stable, but mitochondrial levels of DRP1 arereduced. Multiple pieces of biochemical and genetic evidence supportthe finding that the reduced levels of mitochondrial DRP1 are aconsequence of its phosphorylation by activated PKA. Alternatively,another interesting possibility could be that during macroautophagymitochondrial DRP1 is not stabilized by SUMOylation, beingthen ubiquitylated by resident mitochondrial ubiquitin ligases49,50,and degraded in a proteasome-dependent fashion. In agreement,following induction of mitophagy the ubiquitin ligase Parkin degradescomponents of the mitochondrial fusion machinery51,52 and targetsdysfunctional organelles to the autophagosome53. However, starvation-
596 NATURE CELL BIOLOGY VOLUME 13 | NUMBER 5 | MAY 2011
© 2011 Macmillan Publishers Limited. All rights reserved.
ART I C L E S
Starvation
Starvation
ADP
ADP ATP ATP
ATP Cell survival
cAMP
PKA
PKA
DRP1
cAMP
DRP1
Mito
cho
nd
rial-
fusio
n-i
nco
mp
ete
nt
cells
Cell death
Mitochondrion
Autophagosome
Figure 8 Mitochondrial elongation induced by PKA determinescell fate during starvation. The diagrams depict the cascade ofmitochondrial elongation triggered during starvation and its role indetermining cell fate. Top row: mitochondrial elongation protects
it from organelle degradation and allows maintenance of ATP levels.Bottom row: when mitochondrial elongation is impaired, mitochondriaare degraded and the remaining organelles consume cellular ATP,precipitating cell death.
induced mitochondrial elongation occurs also in HeLa cells inwhich Parkin is not expressed53, further substantiating the keyrole of the cAMP–PKA–DRP1 loop in autophagy. Opposed tothe ‘active’ adaptation of mitochondrial morphology in responseto the cellular cues described here, lies the pathological DRP1-mediated fragmentation by sustained activation of calcineurin, suchas that observed in Huntington’s disease, which results in increasedsusceptibility to apoptotic insults54. These two extremes show howmitochondrial morphology is extremely sensitive to, and plasticallymodulated by, cellular inputs.The purpose of mitochondrial elongation during induction of
autophagy remains unclear. Elongated mitochondria are sparedfrom autophagy, implying that the ‘targets’ for degradation duringmacroautophagy may not be random. The limitation could besimply sterical—that is, the elongated mitochondria cannot fitinto the autophagosome. Alternatively, longer mitochondria maylack the signal that addresses them to the autophagosome. In thisrespect, it is interesting to note that shorter mitochondria arenot only less efficient in ATP production, but they also bear alatent dysfunction that could trigger the relocalization of Parkin ontheir surface53. Mitochondria may be spared by macroautophagybecause during nutrient restriction, cells try to maximize theefficiency of energy conversion, a task for which mitochondriaare optimized55 and that requires mitochondrial elongation, aswe showed here. Elongated mitochondria have higher levels ofthe dimeric form of ATPase, associated with increased efficiencyin ATP production37. Morphologically, this is mirrored by anincrease in the number of cristae, the privileged compartmentsfor ATP synthesis37, per unit of mitochondrial surface. WhereasOPA1 and cristae organization are directly linked56,57, it is less clearwhy DMF−/−MEFs are unable to respond to starvation with anincrease in cristae biogenesis. However, OPA1 forms are altered inDMF−/−MEFs and knockdown of DRP1 similarly alters processing ofOPA1 (ref. 58). Thus, it seems that processing of OPA1 (and hence
biogenesis of the cristae) is exquisitely sensitive to changes in thefusion–fission equilibrium, ultimately impacting on the ability ofthe mitochondria to metabolically respond to the environment. Inaddition, mitochondria may be essential to provide membranes forthe formation of the autophagosome29 and they should therefore beexcluded from immediate degradation, to ensure the progression ofthe autophagic process.During starvation, mitochondria unable to elongate are latently
dysfunctional and they consume cytosolic ATP to sustain theirmembrane potential. The ensuing bioenergetic crisis due to ATPconsumption causes starvation-induced cell death in Opa1−/− andDMF−/−MEFs. As expected, during starvation autophagy is essentialto provide nutrients and its blockage accelerates death59, irrespectiveof whether mitochondrial elongation occurs or not. Whether theprotective role of autophagy is a general feature of all forms of cell deathremains a matter of intense debate. Our data conversely indicate thatchanges in mitochondrial morphology and function are an essentialsubroutine of the autophagic programme: if a stereotypical responseof the cell (mitochondrial elongation and activation) to limitednutrient supply is abolished, the ensuing mitochondrial dysfunctioncan lead to cell death. The unexpected role of mitochondrial elongationduring starvation exemplifies a further cellular response regulated bythese organelles. �
METHODSMethods and any associated references are available in the onlineversion of the paper at http://www.nature.com/naturecellbiology/
Note: Supplementary Information is available on the Nature Cell Biology website
ACKNOWLEDGEMENTSL.C.G. is the recipient of a ‘Bolsa de Doutoramento’ of the ‘Fundação para aCiência e Tecnologia’, Portugal. L.S. is a Senior Telethon Scientist of the Dulbecco-Telethon Institute. This research was supported by Telethon Italy S02016, AIRCItaly, Swiss National Foundation SNF 31-118171. We thank D. Chan, K. Mihara,C. Blackstone and N. Mizushima for reagents and T. Pozzan for helpful discussionson mitochondrially targeted luciferase calibration.
NATURE CELL BIOLOGY VOLUME 13 | NUMBER 5 | MAY 2011 597
© 2011 Macmillan Publishers Limited. All rights reserved.
ART I C L E S
AUTHOR CONTRIBUTIONSL.C.G. and L.S. conceived research, analysed data and wrote the manuscript. L.C.G.,G.D.B. and L.S. carried out experiments and analysed data.
COMPETING FINANCIAL INTERESTSThe authors declare no competing financial interests.
Published online at http://www.nature.com/naturecellbiologyReprints and permissions information is available online at http://npg.nature.com/reprintsandpermissions/
1. Bereiter-Hahn, J. & Voth, M. Dynamics of mitochondria in living cells: shapechanges, dislocations, fusion, and fission of mitochondria. Microsc. Res. Tech. 27,198–219 (1994).
2. Cipolat, S., de Brito, O. M., Dal Zilio, B. & Scorrano, L. OPA1 requiresmitofusin 1 to promote mitochondrial fusion. Proc. Natl Acad. Sci. USA 101,15927–15932 (2004).
3. Santel, A. & Fuller, M. T. Control of mitochondrial morphology by a human mitofusin.J. Cell Sci. 114, 867–874 (2001).
4. Smirnova, E., Griparic, L., Shurland, D. L. & van der Bliek, A. M. Dynamin-related protein Drp1 is required for mitochondrial division in mammalian cells.Mol. Biol. Cell 12, 2245–2256 (2001).
5. Cereghetti, G. M. et al. Dephosphorylation by calcineurin regulates translocation ofDrp1 to mitochondria. Proc. Natl Acad. Sci. USA 105, 15803–15808 (2008).
6. Cribbs, J. T. & Strack, S. Reversible phosphorylation of Drp1 by cyclic AMP-dependent protein kinase and calcineurin regulates mitochondrial fission and celldeath. EMBO Rep. 8, 939–944 (2007).
7. Chang, C. R. & Blackstone, C. Cyclic AMP-dependent protein kinase phosphorylationof Drp1 regulates its GTPase activity and mitochondrial morphology. J. Biol. Chem.282, 21583–21587 (2007).
8. Harder, Z., Zunino, R. & McBride, H. Sumo1 conjugates mitochondrial substratesand participates in mitochondrial fission. Curr. Biol. 14, 340–345 (2004).
9. Braschi, E., Zunino, R. & McBride, H. M. MAPL is a new mitochondrial SUMO E3ligase that regulates mitochondrial fission. EMBO Rep. 10, 748–754 (2009).
10. Scorrano, L. et al. A distinct pathway remodels mitochondrial cristae and mobilizescytochrome c during apoptosis. Dev. Cell 2, 55–67 (2002).
11. Martinou, I. et al. The release of cytochrome c from mitochondria during apoptosisof NGF-deprived sympathetic neurons is a reversible event. J. Cell Biol. 144,883–889 (1999).
12. Frank, S. et al. The role of dynamin-related protein 1, a mediator of mitochondrialfission, in apoptosis. Dev. Cell 1, 515–525 (2001).
13. Szabadkai, G. et al. Drp-1-dependent division of the mitochondrial network blocksintraorganellar Ca2+ waves and protects against Ca2+-mediated apoptosis. Mol. Cell16, 59–68 (2004).
14. Li, Z., Okamoto, K., Hayashi, Y. & Sheng, M. The importance of dendriticmitochondria in the morphogenesis and plasticity of spines and synapses. Cell 119,873–887 (2004).
15. Campello, S. et al. Orchestration of lymphocyte chemotaxis by mitochondrialdynamics. J. Exp. Med. 203, 2879–2886 (2006).
16. Mitra, K., Wunder, C., Roysam, B., Lin, G. & Lippincott-Schwartz, J. A hyperfusedmitochondrial state achieved at G1-S regulates cyclin E buildup and entry into Sphase. Proc. Natl Acad. Sci. USA 106, 11960–11965 (2009).
17. Scheckhuber, C. Q. et al. Reducing mitochondrial fission results in increased lifespan and fitness of two fungal ageing models. Nat. Cell Biol. 9, 99–105 (2007).
18. Twig, G. et al. Fission and selective fusion govern mitochondrial segregation andelimination by autophagy. EMBO J. 27, 433–446 (2008).
19. Gomes, L. C. & Scorrano, L. High levels of Fis1, a pro-fission mitochondrial protein,trigger autophagy. Biochim. Biophys. Acta 1777, 860–866 (2008).
20. Klionsky, D. J. & Emr, S. D. Autophagy as a regulated pathway of cellular degradation.Science 290, 1717–1721 (2000).
21. Cecconi, F. & Levine, B. The role of autophagy in mammalian development: cellmakeover rather than cell death. Dev. Cell 15, 344–357 (2008).
22. Ravikumar, B., Duden, R. & Rubinsztein, D. C. Aggregate-prone proteins withpolyglutamine and polyalanine expansions are degraded by autophagy. Hum.Mol. Genet. 11, 1107–1117 (2002).
23. Zheng, Y. T. et al. The adaptor protein p62/SQSTM1 targets invading bacteria to theautophagy pathway. J. Immunol. 183, 5909–5916 (2009).
24. Tuttle, D. L., Lewin, A. S. & Dunn, W. A. Jr Selective autophagy of peroxisomes inmethylotrophic yeasts. Eur. J. Cell Biol. 60, 283–290 (1993).
25. Bernales, S., McDonald, K. L. & Walter, P. Autophagy counterbalances endoplasmicreticulum expansion during the unfolded protein response. PLoS Biol. 4,e423 (2006).
26. Elmore, S. P., Qian, T., Grissom, S. F. & Lemasters, J. J. The mitochondrialpermeability transition initiates autophagy in rat hepatocytes. FASEB J. 15,2286–2287 (2001).
27. Tooze, S. A. & Yoshimori, T. The origin of the autophagosomal membrane.Nat. Cell Biol. 12, 831–835 (2010).
28. Scherz-Shouval, R. et al. Reactive oxygen species are essential for autophagy andspecifically regulate the activity of Atg4. EMBO J. 26, 1749–1760 (2007).
29. Hailey, D. W. et al. Mitochondria supply membranes for autophagosome biogenesisduring starvation. Cell 141, 656–667 (2010).
30. de Brito, O. M. & Scorrano, L. Mitofusin 2 tethers endoplasmic reticulum tomitochondria. Nature 456, 605–610 (2008).
31. Karbowski, M. et al. Quantitation of mitochondrial dynamics by photolabelling ofindividual organelles shows that mitochondrial fusion is blocked during the Baxactivation phase of apoptosis. J. Cell Biol. 164, 493–499 (2004).
32. Song, Z., Chen, H., Fiket, M., Alexander, C. & Chan, D. C. OPA1 processing controlsmitochondrial fusion and is regulated by mRNA splicing, membrane potential, andYme1L. J. Cell Biol. 178, 749–755 (2007).
33. Chen, H., Chomyn, A. & Chan, D. C. Disruption of fusion results in mitochondrialheterogeneity and dysfunction. J. Biol. Chem. 280, 26185–26192 (2005).
34. Ishihara, N. et al. Mitochondrial fission factor Drp1 is essential for embryonicdevelopment and synapse formation in mice. Nat. Cell Biol. 11, 958–966 (2009).
35. Jouaville, L. S., Pinton, P., Bastianutto, C., Rutter, G. A. & Rizzuto, R. Regulation ofmitochondrial ATP synthesis by calcium: evidence for a long-term metabolic priming.Proc. Natl Acad. Sci. USA 96, 13807–13812 (1999).
36. Rich, P. Chemiosmotic coupling: the cost of living. Nature 421, 583 (2003).37. Strauss, M., Hofhaus, G., Schroder, R. R. & Kuhlbrandt, W. Dimer ribbons
of ATP synthase shape the inner mitochondrial membrane. EMBO J. 27,1154–1160 (2008).
38. Giraud, M. F. et al. Is there a relationship between the supramolecular organization ofthe mitochondrial ATP synthase and the formation of cristae? Biochim. Biophys. Acta1555, 174–180 (2002).
39. Unger, R. H. Glucagon physiology and pathophysiology in the light of new advances.Diabetologia 28, 574–578 (1985).
40. Pan, X. & Heitman, J. Cyclic AMP-dependent protein kinase regulates pseudohyphaldifferentiation in Saccharomyces cerevisiae.Mol. Cell Biol. 19, 4874–4887 (1999).
41. Budovskaya, Y. V., Stephan, J. S., Reggiori, F., Klionsky, D. J. & Herman, P. K.The Ras/cAMP-dependent protein kinase signalling pathway regulates an earlystep of the autophagy process in Saccharomyces cerevisiae. J. Biol. Chem. 279,20663–20671 (2004).
42. Stephan, J. S., Yeh, Y. Y., Ramachandran, V., Deminoff, S. J. & Herman, P. K. TheTor and PKA signalling pathways independently target the Atg1/Atg13 protein kinasecomplex to control autophagy. Proc. Natl Acad. Sci. 106, 17049–17054 (2009).
43. Mavrakis, M., Lippincott-Schwartz, J., Stratakis, C. A. & Bossis, I. Depletion of typeIA regulatory subunit (RIalpha) of protein kinase A (PKA) in mammalian cells andtissues activates mTOR and causes autophagic deficiency. Hum. Mol. Genet. 15,2962–2971 (2006).
44. Slattery, M. G., Liko, D. & Heideman, W. Protein kinase A, TOR, and glucosetransport control the response to nutrient repletion in Saccharomyces cerevisiae.Eukaryot. Cell 7, 358–367 (2008).
45. Tondera, D. et al. SLP-2 is required for stress-induced mitochondrial hyperfusion.EMBO J. 28, 1589–1600 (2009).
46. Karbowski, M. & Youle, R. J. Dynamics of mitochondrial morphology in healthy cellsand during apoptosis. Cell Death Differ. 10, 870–880 (2003).
47. Cereghetti, G. M., Costa, V. & Scorrano, L. Inhibition of Drp1-dependentmitochondrial fragmentation and apoptosis by a polypeptide antagonist ofcalcineurin. Cell Death Differ. 17, 1785–1794 (2010).
48. Wasiak, S., Zunino, R. & McBride, H. M. Bax/Bak promote sumoylation of DRP1and its stable association with mitochondria during apoptotic cell death. J. Cell Biol.177, 439–450 (2007).
49. Nakamura, N., Kimura, Y., Tokuda, M., Honda, S. & Hirose, S. MARCH-V is a novelmitofusin 2- and Drp1-binding protein able to change mitochondrial morphology.EMBO Rep. 7, 1019–1022 (2006).
50. Karbowski, M., Neutzner, A. & Youle, R. J. The mitochondrial E3 ubiquitin ligaseMARCH5 is required for Drp1 dependent mitochondrial division. J. Cell Biol. 178,71–84 (2007).
51. Tanaka, A. et al. Proteasome and p97 mediate mitophagy and degradation ofmitofusins induced by Parkin. J. Cell Biol. 191, 1367–1380 (2010).
52. Ziviani, E., Tao, R. N. & Whitworth, A. J. Drosophila parkin requires PINK1 formitochondrial translocation and ubiquitinates mitofusin. Proc. Natl Acad. Sci. USA107, 5018–5023 (2010).
53. Narendra, D., Tanaka, A., Suen, D. F. & Youle, R. J. Parkin is recruited selectivelyto impaired mitochondria and promotes their autophagy. J. Cell Biol. 183,795–803 (2008).
54. Costa, V. et al. Mitochondrial fission and cristae disruption increase the responseof cell models of Huntington’s disease to apoptotic stimuli. EMBO Mol. Med. 2,490–503 (2010).
55. Brown, G. C. Control of respiration and ATP synthesis in mammalian mitochondriaand cells. Biochem. J. 284, 1–13 (1992).
56. Frezza, C. et al. OPA1 controls apoptotic cristae remodeling independently frommitochondrial fusion. Cell 126, 177–189 (2006).
57. Meeusen, S. et al. Mitochondrial inner-membrane fusion and crista maintenancerequires the dynamin-related GTPase Mgm1. Cell 127, 383–395 (2006).
58. Mopert, K. et al. Loss of Drp1 function alters OPA1 processing andchanges mitochondrial membrane organization. Exp. Cell Res. 315,2165–2180 (2009).
59. Kuma, A. et al. The role of autophagy during the early neonatal starvation period.Nature 432, 1032–1036 (2004).
598 NATURE CELL BIOLOGY VOLUME 13 | NUMBER 5 | MAY 2011
© 2011 Macmillan Publishers Limited. All rights reserved.
DOI: 10.1038/ncb2220 METHODS
METHODSMolecular biology. pEYFP-Mito (mtYFP), mito-dsRED (mtRFP), DRP1–YFPand DRP1S637A–YFP were described previously5. mtPAGFP (ref. 46) was from M.Karbowski (University of Maryland, USA). EPACI–camps60 was from M. Lohse(University ofWürzburg, Germany).Mitochondrially targeted luciferase35 was fromR. Rizzuto (University of Padova, Italy).
Two short interfering RNAs (siRNAs) against the following target sequencesfrommousemTORwere synthesized: 5′-GCGGAUGGCUCCUGACUAU-3′ and 5′-CCAAGGUGCUACAGUACUA-3′. An siRNA against the following target sequencefrom human mTOR was synthesized: 5′-UAACAGGUUCGAGAUAAG-3′. Thescrambled control was used at the same final concentration (Dharmacon). ThesiRNA against human OPA1 targeted the 5′-GGACCUUAGUGAAUAUAAA-3′
sequence (Ambion).
Cell culture. Simian virus 40 (SV40)-transformed wild-type, Mfn1−/−, Mfn2−/−
and DMF−/− MEFs were from D. Chan (California Institute of Technology, USA)and cultured as described previously61. SV40-transformed Opa1−/− and wild-typeMEFs were a gift fromC. Alexander (Max-Delbrück-Center forMolecularMedicine,Berlin, Germany) and cultured as described previously32. SV40-transformed wild-type andDrp1−/−MEFswere fromK.Mihara (TokyoMedical andDentalUniversity,Japan) and cultured as previously described34. Wild-type and Bax−/−Bak−/− MEFswere cultured as described previously62. Transfection ofMEFs withDNAwas carriedout using Transfectin (Biorad), with siRNA using Oligofectamine (Invitrogen)according to themanufacturer’s instructions.When indicated, cells were transfectedwith siRNA 24 h after seeding on glass coverslips and with mtYFP 48 h afterplating. HeLa, HepG2 and C2C12 cells were gifts from C. Montecucco, A. Albertiand M. Sandri (University of Padova, Italy) and were cultured in Dulbecco’sModified Eagle Medium (DMEM, Invitrogen) supplemented with 10% fetal bovineserum (FBS, Invitrogen), 2mM l-glutamine, non-essential amino acids (0.89 g l−1 l-alanine, 1.32 g l−1 l-asparagine, 1.33 g l−1 l-aspartic acid, 1.47 g l−1 l-glutamicacid, 0.75 g l−1 glycine, 1.15 g l−1 l-proline and 1.05 g l−1 l-serine, Invitrogen),75Uml−1 penicillin and 50 µgml−1 streptomycin (Invitrogen) at 37 ◦C in a 5%CO2
atmosphere. Transfectionwith siRNAs andDNAwas carried outwith Lipofectamine2000 (Invitrogen) according to the manufacturer’s protocol.
Primary hepatocytes were isolated as described previously63 and cultured inDMEM (Invitrogen) supplemented with 10% FBS (Invitrogen), 1 nM insulin(Sigma), 2mM l-glutamine, non-essential amino acids (Invitrogen), 75Uml−1
penicillin, 50 µgml−1 streptomycin (Invitrogen) and Fungizone (Invitrogen) at37 ◦C in a 5% CO2 atmosphere.
To trigger starvation, cells were washed four times and then incubated in Hanksbalanced salt solution (HBSS) supplemented with 10mMHEPES at pH 7.4, at 37 ◦Cfor the indicated time.
Fasting. Animal studies were carried out in compliance with local animal welfareregulations. CD1 mice were fasted for 12 h with free access to water.
Imaging. For confocal microscopy imaging of live cells, 1.8×10⁵ cells seeded onto24-mm round glass coverslips transfected and treated as indicated were placedon the stage of a Nikon Eclipse TE300 inverted microscope equipped with aPerkinElmer Ultraview LCI confocal system, a piezoelectric z-axis motorized stage(Pifoc, Physik Instrumente) and an Orca ER 12-bit CCD (charge-coupled device)camera (Hamamatsu Photonics). Cells expressing mtYFP or mtRFP were excitedusing the 488 nm or the 543 nm line of a HeNe laser (PerkinElmer) with a ×60,1.4NA Plan Apo objective (Nikon).
For quantification of the mitochondrial fusion rate, 2× 10⁵ cells seeded onto24-mm round glass coverslips were co-transfected with mtRFP and mito-pAGFP.After 24 h, cells were treated as indicated and placed on the stage of a laser scanningmicroscope (TCS SP5, Leica). Using the LasAF software (Leica), regions of interestto be photoactivated were manually defined. To activate the pAGFP fluorescence, 1z plane was activated using 100% of the power of the 413 nm laser line with a ×63,1.4NA objective. Frames were then acquired each minute using the 488 nm and the563 laser lines for 30min. Standard deviation of the green fluorescence in the wholecell was measured and normalized for the intensity of the mtRFP fluorescence usingthe Multi Measure plug-in of ImageJ (NIH).
For FRET imaging, 2× 10⁵ MEFs seeded onto 24-mm round glass coverslipswere transfected with EPACI–camps and after 24 h placed on a thermostaticallycontrolled chamber at 37 ◦C and maintained in complete medium on the stageof an Olympus inverted microscope equipped with a CellR imaging system and abeam-splitter optical device (Multispec Microimager; Optical Insights). Sequentialimages of the 545 nm fluorescence emission on excitation at 430 and 480 nm wereacquired every second with a ×40, 1.4NA objective (Olympus) using the CellRsoftware and then processed using the Multi Measure plug-in of Image J (NIH)following background subtraction and expressed as FRET 430/480 ratio.
Real-time imaging of the mitochondrial membrane potential was carried outon 1× 10⁵ MEFs seeded onto 24-mm round glass coverslips and loaded with
TMRM, using the Olympus CellR imaging system. Imaging and analysis of TMRMfluorescence over mitochondrial regions of interest was carried out as describedpreviously62.
Immunofluorescence microscopy. Primary hepatocytes were seeded onto 13-mm round glass coverslips coated with laminin. After 48 h, cells were treated asindicated and fixed for 30min at room temperature with 3.7% (w/v) formaldehyde,permeabilized for 20min with ice-cold Nonidet P40 (GIBCO) and incubated withrabbit anti-TOM20 (1:200, Santa Cruz Biotechnology). Staining was revealed withgoat anti-rabbit IgG conjugated to fluorescein isothiocyanate (FITC) using a NikonEclipse TE300 inverted confocal microscope and a ×60, 1.4NA Plan Apo objective(Nikon). Stacks of 50 images separated by 0.2 µm along the z axis were acquired.Three-dimensional reconstruction and volume rendering of the stacks were carriedout with the appropriate plug-in of ImageJ (NIH).
Electron microscopy. MEFs of the indicated genotypes and treated as indicatedwere fixed with 1.25% (v/v) glutaraldehyde in 0.1M sodium cacodylate at pH 7.4for 1 h at room temperature. Muscle and liver specimens from mice treated asindicated were fixed in 2% formaldehyde, 2.5% (v/v) glutaraldehyde in 0.1Msodium cacodylate at pH 7.4 for 2 h at room temperature and then overnight at 4 ◦C.Electron microscopy was carried out as described previously10.
Morphometric and co-localization analysis. Morphometric analysis of mito-chondrial shapewas carried out as described previously2. Formorphometric analysisof cristae biogenesis, mitochondria were randomly selected from coded samples andthe number of cristae was counted and normalized for the surface of the organellecalculated by fitting a region of interest on the selected organelle using the MultiMeasure plug-in of Image J (NIH). Co-localization between autophagosomes andmitochondria was quantified using Manders’ coefficient30.
Isolation of mitochondria. Cells plated in 500 cm2 plates were treated after 48 has indicated and mitochondria were isolated as described previously64. Proteinconcentration was determined by Bradford analysis.
Cell lysis. Cells (106) were collected and disrupted in Triton X-100 lysis buffer (1%Triton X-100, 150mMNaCl and 50mMTris, at pH 7.4) in the presence of completeprotease-inhibitor cocktail (Sigma) and phosphatase inhibitor cocktail 1 (Sigma).Protein concentration was determined by BCA assay (Pierce).
Immunoprecipitation. For immunoprecipitation, 150 µg of total cellular extractwas dissolved in Triton X-100 lysis buffer and pre-cleared by centrifugation at14,000g . A 50µl volume of dynabeads (Invitrogen) conjugated with protein-G wasincubated with anti-DRP1 (1:50, BD Transduction) for 2 h at room temperature.Following three washes, cleared extracts were added and incubated overnight at 4 ◦C.Beads were washed three times and boiled in NuPage loading buffer (Invitrogen).
Immunoblotting. The indicated amounts of proteins were separated by 4–12%Bis-Tris, 12%Bis-Tris or 7%Tris-acetate gels (NuPAGE, Invitrogen) and transferredonto polyvinylidene difluoride (PVDF, BioRad) membranes. The followingantibodies were used: anti-OPA1 (1:1,000, BD Transduction), anti-MFN1 (1:1,000,Abcam), anti-MFN2 (1:1,000, Abcam), anti-DRP1 (1:1,000, BDTransduction), anti-Fis1 (1:1,000, Alexis), anti-actin (1:30,000, Chemicon), anti-TOM20 (1:5,000, SantaCruz Biotechnology), anti-phospho-Ser637-DRP1 (ref. 5; 1:1,000), anti-phospho-CREB-Ser133 (1:1,000, Cell Signalling), anti-CREB (1:1,000, Cell Signalling), anti-β-tubulin (1:200, Santa Cruz Biotechnology), anti-cyclophilin-D, anti-MnSOD(1:5,000, Stressgen), anti-complex-II, subunit 70Mr (K) (1:1,000, MitoSciences),anti-PMP70 (1:1,000, Sigma), anti-ATPase, α subunit (1:1,000, MitoSciences),anti-mTOR (1:1,000, Cell Signalling), anti-LC3 (1:200, Anaspec) and anti-p62(1:5,000, Progen).
Blue-native polyacrylamide gel electrophoresis. Cells (500 µg) were resus-pended in 50 µl of native loading buffer (Invitrogen) containing 4% digitonin(Sigma) and protease-inhibitor cocktail (Sigma). After 30min at 4 ◦C, the lysatewas spun at 22,000g for 30min at 4 ◦C. A 4 µl volume of native additive G2505% (Invitrogen) was added to the supernatant and 30 µg of protein was loadedonto a 3–12% native gel (Invitrogen). Transfer of native gels was carried out asdescribed above.
In-gel ATPase activity assay. ATPase activity was measured according to ref. 65and ATPase activity was followed for up to 4 h at room temperature. Gels werewashed in water to stop the reaction.
ATP measurement. Total ATP levels were measured by chemiluminescenceusing the ATP detection assay system ATPlite (PerkinElmer), according to themanufacturer’s protocol. ATP levels were normalized by total protein concentration.
NATURE CELL BIOLOGY
© 2011 Macmillan Publishers Limited. All rights reserved.
METHODS DOI: 10.1038/ncb2220
To measure mitochondrial ATP levels during starvation, cells grown on13-mm round glass coverslips at 50% confluence were transfected with mitochon-drially targeted luciferase and after 24 h luminescence was measured as describedpreviously35. Basal luminescence was recorded in the absence of luciferin and thencells were perfused with 20 µM luciferin to record mitochondrial luminescence,which was then calibrated to the maximal luminescence emitted by the mitochon-drially targeted luciferase by perfusing each sample with 10mMATP in the presenceof 100 µM digitonin.
Flow cytometry. For analysis of cell death, 4×10⁴ MEFs of the indicated genotypegrown in 12-well plates were treated as indicated 24 h after seeding. When indicated,cells were collected and stained with propidium iodide and annexin-V-FLUOS(BenderMedSystems) according to the manufacturer’s protocol. Cell viability wasmeasured by flow cytometry (FACSCalibur, BD Biosciences) as the percentage ofannexin-V- and propidium-iodide-negative events.
For evaluation of membrane potential, 4×10⁴ MEFs of the indicated genotypewere grown in 12-well plates and indicated treatments (starvation) were started36 h after seeding. At the indicated times, cells were collected, washed with PBS,resuspended in HBSS supplemented with 10mMHEPES at pH 7.4 and loaded with20 nM TMRM (Molecular Probes) in the presence of 2mgml−1 cyclosporine H,
a P-glycoprotein inhibitor, for 30min at 37 ◦C. Cells were then analysed by flowcytometry (FACSCalibur, BD Biosciences).
Statistical tests. In each graph, unless noted, data represent mean ± s.e.m. ofthe indicated number (n) of independent experiments. If indicated, statisticalsignificance has been calculated by a two-tailed Student t -test between the indicatedsamples. P values are indicated in the legends.
60. Nikolaev, V. O., Bünemann, M., Hein, L., Hannawacker, A. & Lohse, M. J. Novelsingle chain cAMP sensors for receptor-induced signal propagation. J. Biol. Chem.279, 37215–37218 (2004).
61. de Brito, O. M. & Scorrano, L. Mitofusin 2 tethers endoplasmic reticulum tomitochondria. Nature 456, 605–610 (2008).
62. Scorrano, L. et al. BAX and BAK regulation of endoplasmic reticulum Ca2+: a controlpoint for apoptosis. Science 300, 135–139 (2003).
63. Danial, N. N. et al. BAD and glucokinase reside in a mitochondrial complex thatintegrates glycolysis and apoptosis. Nature 424, 952–956 (2003).
64. Frezza, C., Cipolat, S. & Scorrano, L. Organelle isolation: functional mitochondriafrom mouse liver, muscle and cultured fibroblasts. Nat. Protoc. 2, 287–295 (2007).
65. Alirol, E. et al. The mitochondrial fission protein hFis1 requires the endoplasmicreticulum gateway to induce apoptosis. Mol. Biol. Cell 17, 4593–4605 (2006).
NATURE CELL BIOLOGY
© 2011 Macmillan Publishers Limited. All rights reserved.
S U P P L E M E N TA RY I N F O R M AT I O N
WWW.NATURE.COM/NATURECELLBIOLOGY 1
DOI: 10.1038/ncb2220
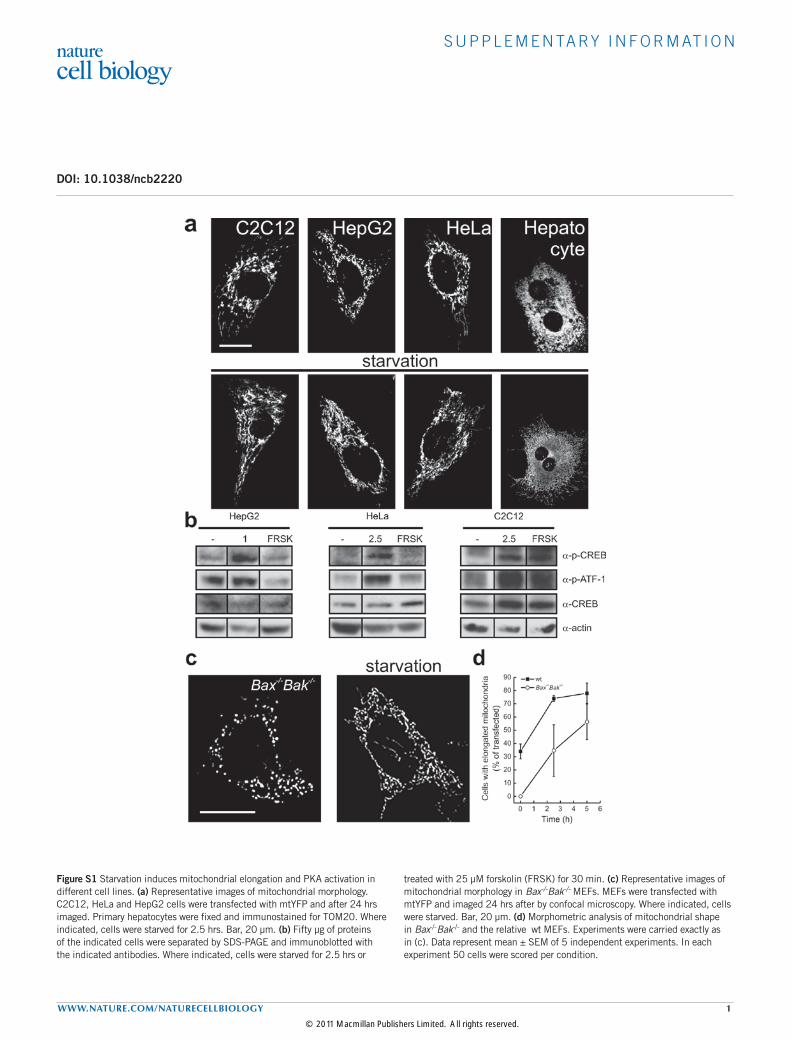
Figure S1 Starvation induces mitochondrial elongation and PKA activation in different cell lines. (a) Representative images of mitochondrial morphology. C2C12, HeLa and HepG2 cells were transfected with mtYFP and after 24 hrs imaged. Primary hepatocytes were fixed and immunostained for TOM20. Where indicated, cells were starved for 2.5 hrs. Bar, 20 µm. (b) Fifty µg of proteins of the indicated cells were separated by SDS-PAGE and immunoblotted with the indicated antibodies. Where indicated, cells were starved for 2.5 hrs or
treated with 25 µM forskolin (FRSK) for 30 min. (c) Representative images of mitochondrial morphology in Bax-/-Bak-/- MEFs. MEFs were transfected with mtYFP and imaged 24 hrs after by confocal microscopy. Where indicated, cells were starved. Bar, 20 µm. (d) Morphometric analysis of mitochondrial shape in Bax-/-Bak-/- and the relative wt MEFs. Experiments were carried exactly as in (c). Data represent mean ± SEM of 5 independent experiments. In each experiment 50 cells were scored per condition.
© 2011 Macmillan Publishers Limited. All rights reserved.
S U P P L E M E N TA RY I N F O R M AT I O N
2 WWW.NATURE.COM/NATURECELLBIOLOGY
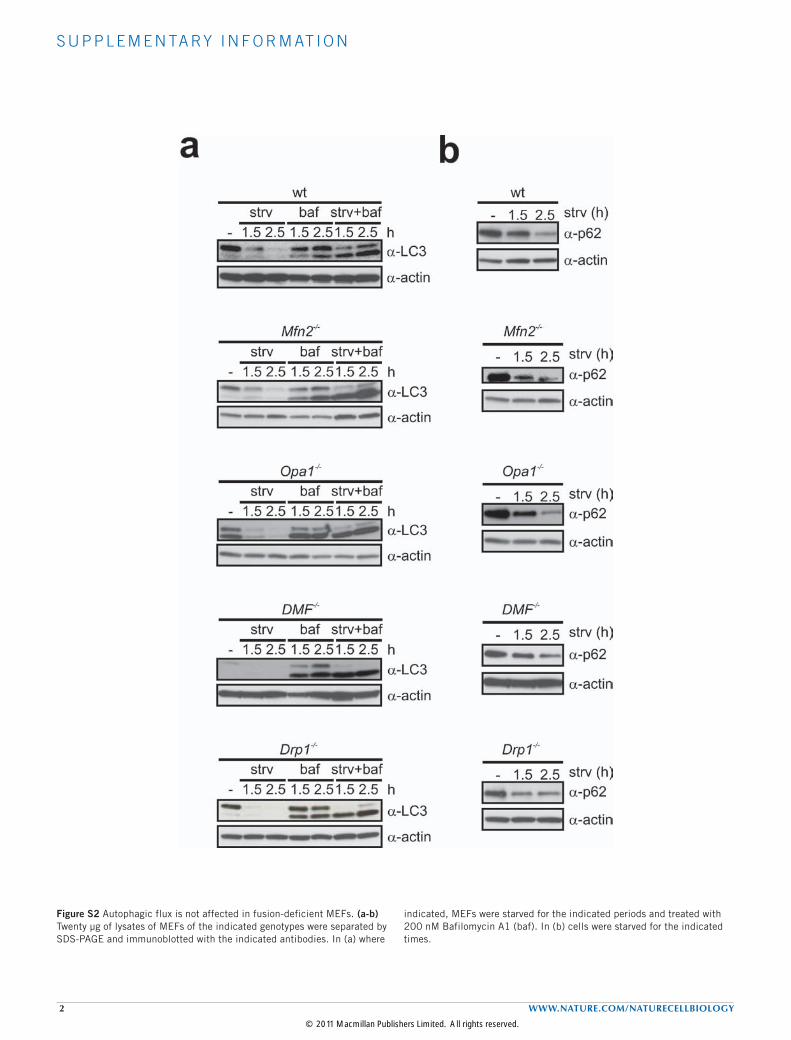
Figure S2 Autophagic flux is not affected in fusion-deficient MEFs. (a-b) Twenty µg of lysates of MEFs of the indicated genotypes were separated by SDS-PAGE and immunoblotted with the indicated antibodies. In (a) where
indicated, MEFs were starved for the indicated periods and treated with 200 nM Bafilomycin A1 (baf). In (b) cells were starved for the indicated times.
© 2011 Macmillan Publishers Limited. All rights reserved.
S U P P L E M E N TA RY I N F O R M AT I O N
WWW.NATURE.COM/NATURECELLBIOLOGY 3
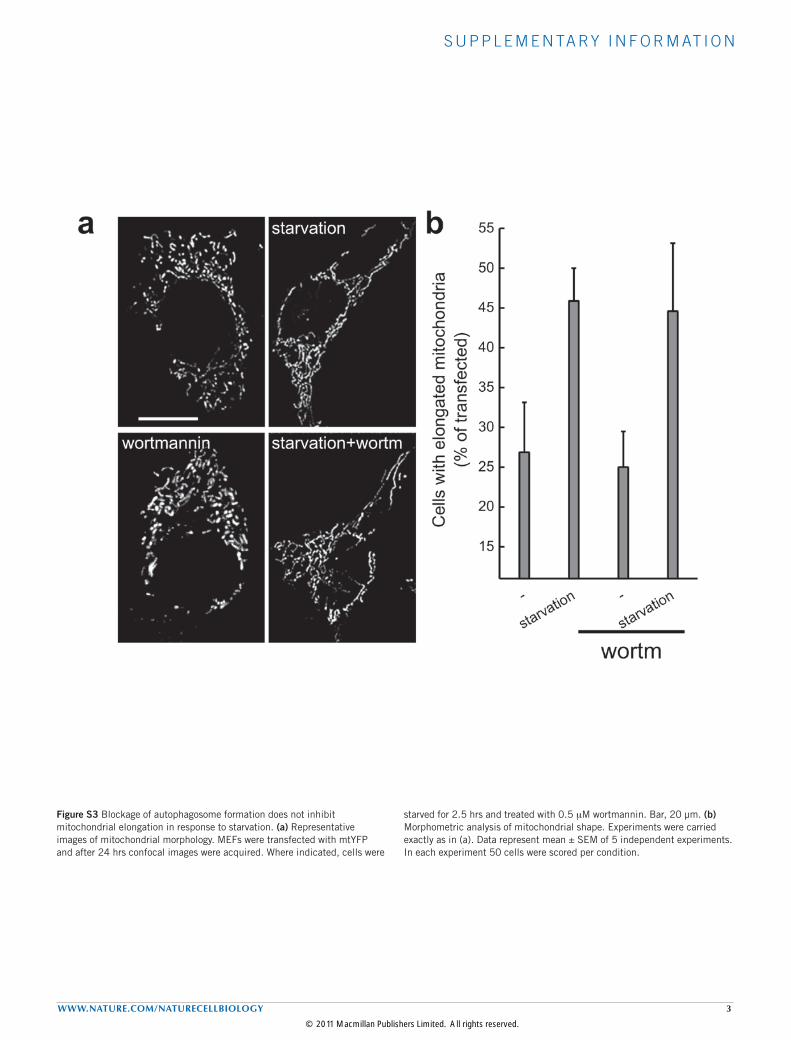
Figure S3 Blockage of autophagosome formation does not inhibit mitochondrial elongation in response to starvation. (a) Representative images of mitochondrial morphology. MEFs were transfected with mtYFP and after 24 hrs confocal images were acquired. Where indicated, cells were
starved for 2.5 hrs and treated with 0.5 mM wortmannin. Bar, 20 µm. (b) Morphometric analysis of mitochondrial shape. Experiments were carried exactly as in (a). Data represent mean ± SEM of 5 independent experiments. In each experiment 50 cells were scored per condition.
© 2011 Macmillan Publishers Limited. All rights reserved.

S U P P L E M E N TA RY I N F O R M AT I O N
4 WWW.NATURE.COM/NATURECELLBIOLOGY
Figure S4 Pharmacological PKA activation leads to mitochondrial elongation. (a) Representative images of mitochondrial morphology. MEFs were transfected with mtYFP and after 24 hrs imaged by confocal microscopy. Where indicated, cells were starved for 2.5 hrs or treated with forskolin
(FRSK) plus IBMX for 30 min. Bar, 20 µm. (b) Morphometric analysis of mitochondrial shape. Experiments were carried exactly as in (a). Data represent mean ± SEM of 5 independent experiments. In each experiment 50 cells were scored per condition.
© 2011 Macmillan Publishers Limited. All rights reserved.
S U P P L E M E N TA RY I N F O R M AT I O N
WWW.NATURE.COM/NATURECELLBIOLOGY 5
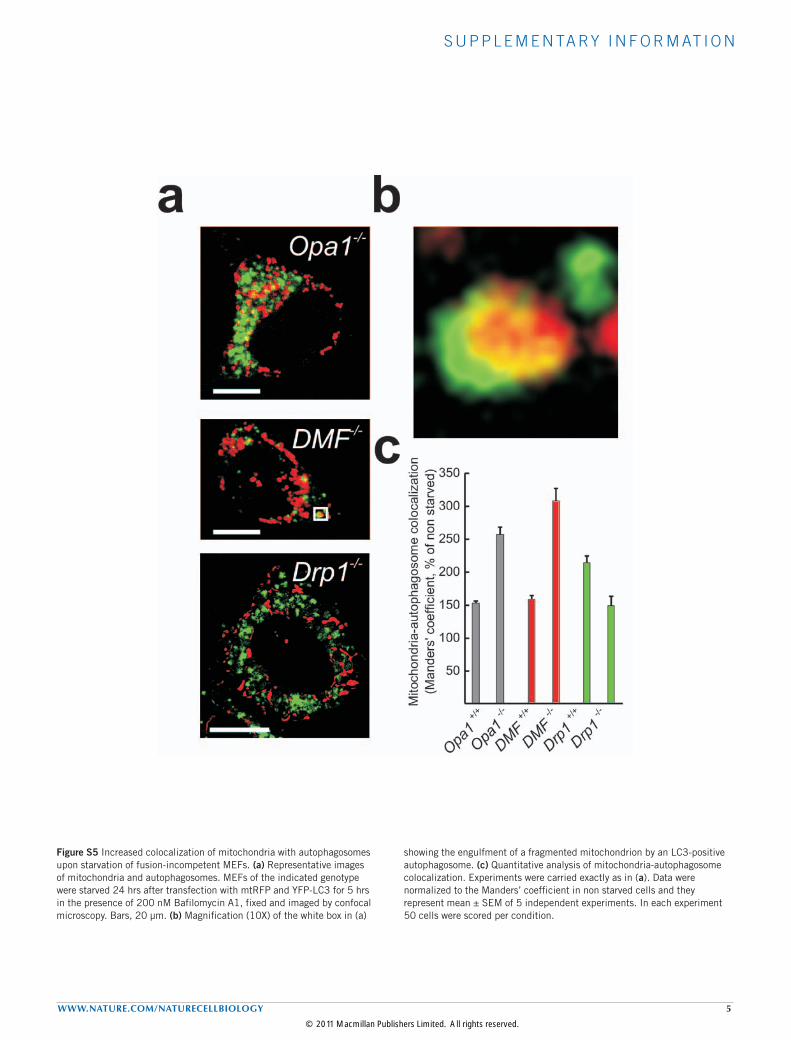
Figure S5 Increased colocalization of mitochondria with autophagosomes upon starvation of fusion-incompetent MEFs. (a) Representative images of mitochondria and autophagosomes. MEFs of the indicated genotype were starved 24 hrs after transfection with mtRFP and YFP-LC3 for 5 hrs in the presence of 200 nM Bafilomycin A1, fixed and imaged by confocal microscopy. Bars, 20 µm. (b) Magnification (10X) of the white box in (a)
showing the engulfment of a fragmented mitochondrion by an LC3-positive autophagosome. (c) Quantitative analysis of mitochondria-autophagosome colocalization. Experiments were carried exactly as in (a). Data were normalized to the Manders’ coefficient in non starved cells and they represent mean ± SEM of 5 independent experiments. In each experiment 50 cells were scored per condition.
© 2011 Macmillan Publishers Limited. All rights reserved.

S U P P L E M E N TA RY I N F O R M AT I O N
6 WWW.NATURE.COM/NATURECELLBIOLOGY
Figure S6 Mitochondrial membrane potential and ATPase levels during starvation. (a) Flow cytometric analysis of TMRM uptake during starvation. MEFs of the indicated genotype were starved for the indicated periods of time, harvested and stained with TMRM. Uptake of TMRM was determined by flow cytometry. Data represent the mean ± SEM of
5 independent experiments. (b) Mitochondrial ATPase levels during starvation. Twenty five µg of lysates of MEFs of the indicated genotypes were analyzed by SDS-PAGE/immunoblotting using the indicated antibodies. Where indicated, MEFs were starved for the indicated periods.
© 2011 Macmillan Publishers Limited. All rights reserved.
S U P P L E M E N TA RY I N F O R M AT I O N
WWW.NATURE.COM/NATURECELLBIOLOGY 7
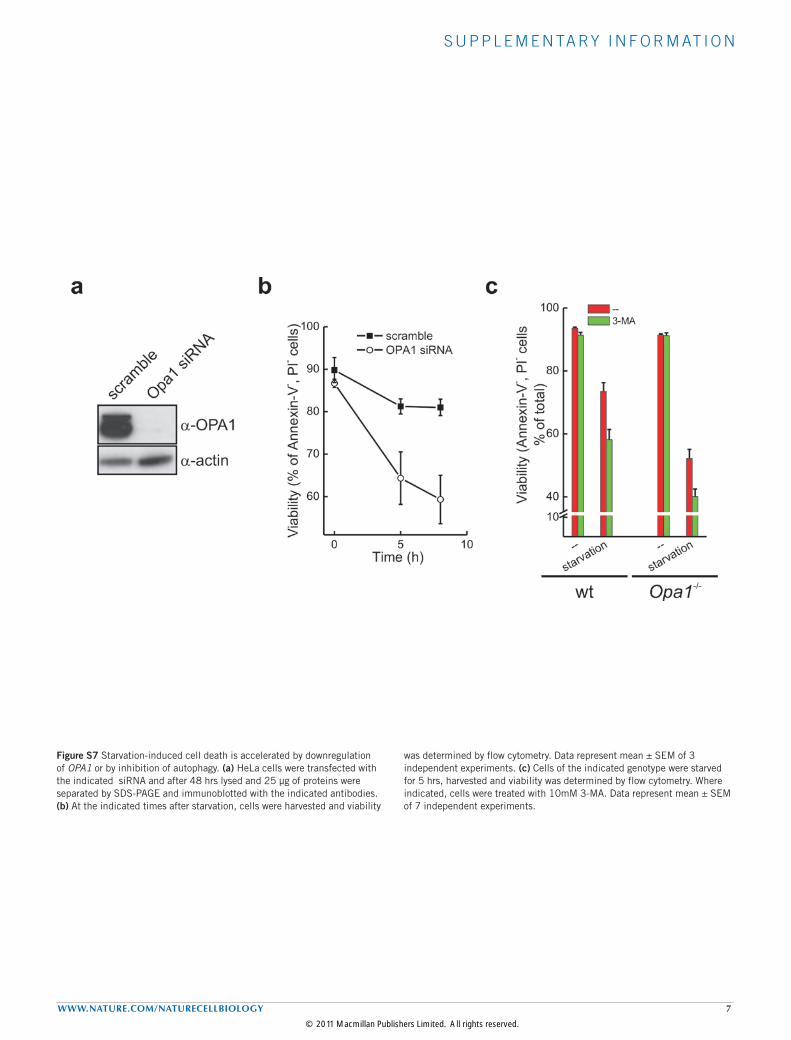
Figure S7 Starvation-induced cell death is accelerated by downregulation of OPA1 or by inhibition of autophagy. (a) HeLa cells were transfected with the indicated siRNA and after 48 hrs lysed and 25 µg of proteins were separated by SDS-PAGE and immunoblotted with the indicated antibodies. (b) At the indicated times after starvation, cells were harvested and viability
was determined by flow cytometry. Data represent mean ± SEM of 3 independent experiments. (c) Cells of the indicated genotype were starved for 5 hrs, harvested and viability was determined by flow cytometry. Where indicated, cells were treated with 10mM 3-MA. Data represent mean ± SEM of 7 independent experiments.
© 2011 Macmillan Publishers Limited. All rights reserved.

S U P P L E M E N TA RY I N F O R M AT I O N
8 WWW.NATURE.COM/NATURECELLBIOLOGY
Figure S8 Full scans of key Western blot data. In many experiments, membranes were cut prior to probing each strip with a separate antibody. When unspecific bands are present, the band that corresponds to the molecular weight of the protein probed is indicated by an (x). Crossed
lanes represent lanes that were cut out from the Western-blots in the main figures where this has been indicated by vertical bars. The orientation of the samples is the same as in the main figures except when specified.
© 2011 Macmillan Publishers Limited. All rights reserved.

S U P P L E M E N TA RY I N F O R M AT I O N
WWW.NATURE.COM/NATURECELLBIOLOGY 9
Supplementary Movie Legends
Movie S1 Real time imaging of mito-pAGFP diffusion in wt MEFs. MEFs were cotransfected with mtRFP and mito-pAGFP. After 24 hrs mito-pAGFP was photoactivated in a ROI of fixed dimension as described and real time images of GFP and RFP fluorescence were acquired each min as described. The movie shows a composite image of GFP (green) and RFP (red) fluorescence.
Movie S2 Real time imaging of mito-pAGFP diffusion in starved wt MEFs. The experiment is exactly as in Movie S1, except that cells were starved for 2.5 hrs.
Movie S3 Real time FRET imaging demonstrate an increase in cAMP levels during starvation. MEFs transfected with Epac-Cl. After 24 hrs real time imaging of Epac-Cl FRET was performed as described. The movie shows the pseudocolor-coded FRET ratio of Epac-Cl (red, higher, blue, lower FRET). Where indicated, cells were perfused with the starvation medium or with Forskolin+IBMX.
© 2011 Macmillan Publishers Limited. All rights reserved.