duration of self-employment in developing countries: evidence from small enterprises in zimbabwe
TRANSCRIPT
Duration of Self-employment inDeveloping Countries: Evidence from
Mudziviri NziramasangaSmall Enterprises in Zimbabwe Minsoo Lee
Small Business Economics
17: 239–253, 2001. 2001 Kluwer Academic Publishers. Printed in the Netherlands.
ABSTRACT. The duration of self-employment is an impor-tant policy consideration in developing countries. We use datafrom a sample of the self-employed in Zimbabwe to computehazard rates by location and economic sector of the activity.We partition the data by date of entry to assess the impact ofeconomic liberalization measures. Our results show that costof finance, along with location and sector to be importantvariables in explaining duration. We then partition our samplein order to control for the effects of location, year of entry andtype of activity. Our sub-samples thus consist of individualsfacing the same history of macroeconomic trends in similarlocations and activities. The results show that personal char-acteristics are significant in explaining differences betweenindividuals in the duration of self-employment.
1. Introduction
Successful self-employment is important, par-ticularly in developing countries where alleviationof unemployment is a major policy goal. Thispaper uses a unique data set to examine factorsunderlying the duration of self-employment inZimbabwe during the period 1988 to 1996.
Empirical studies in developed countries haveconcentrated on the decision to enter self-employ-ment.1 This limitation has been imposed by the
availability of data. One of the most importantdeterminants of entry is an initial bequest, eitherin the form of a going concern or cash. This roleof a bequest in overcoming liquidity constraintswould seem to point to the importance of the costsof borrowing in determining duration of self-employment. A bequest, after all, is a non-interestbearing, non-repayable loan. This should be evenmore important in developing countries wherecapital markets are not perfect. In addition, if netrevenue maximization is a goal for the selfemployed then it is also necessary to include, asexplanatory variables, demand for their output.Demand and costs of production are in turn afunction of macroeconomic conditions andpolicies. The duration of self-employment there-fore is a direct function of factors affectingeconomic growth.
Lack of data has also limited the inclusion ofindustry/sector characteristics in duration models.One exception is Bates (1990, 1999). Logit regres-sion results in the 1990 paper showed that the dateof entry, age and educational level of the managerhad a significant impact on the duration of self-employment. In the second study he includedfactor intensity and type of clientele, along withhuman capital as independent variables inexplaining the duration of self-employment amongAsian immigrants into the United States. Heobserved a difference in skill levels and prof-itability of firm groups by time of establishmentand type of industry. Evans and Leighton (1989)found personal characteristics such as workexperience, education and marital status to beinsignificant in explaining the duration of the firm.McPherson (1995) used cross-country data toexplain the growth rate of small-scale firms. Themost significant explanatory factors were the
Final version accepted on May 4, 2001
Mudziviri NziramasangaDepartment of EconomicsWashington State UniversityPullman, Washington 99164-4741U.S.A.E-Mail: [email protected]
Minsoo LeeDepartment of EconomicsCommerce DivisionLincoln UniversityNew ZealandE-Mail: [email protected]

country dummy variables that, the author suggests,could be proxies for differences in economicconditions.
The results seem to suggest that both personalcharacteristics and macroeconomic conditionshave a role in determining the duration of self-employment. Changes over time in the macro-economic conditions determine the rate of exitfrom self-employment. Differences in personalcharacteristics and endowments, on the other hand,determine those individuals most likely to exitself-employment from a group facing the samemacroeconomic environment. The most efficientway of determining the impact of each variablewould be to include all of them in a single model.This requires a measure of duration (the depen-dent variable) for each firm that also varies overtime. An example might be monthly net revenues.We do not have such a measure and have to resortto a dual approach. We therefore use hazard ratesto establish a relationship over time betweenchanges in macro economic conditions on theprobability of failure for a given cohort of smallfirms. We then use regression analysis to estimatethe impact on duration of differences in personalcharacteristics among the self-employed in thesame cohort and facing the same macroeconomicenvironment over time. In the first model thedependent variable is the hazard rate which wecompute by date of entry into self-employment,location (urban or rural) and by industry (com-mercial or non-commercial). We relate changes inthe different hazard rates over time to knownchanges in macroeconomic conditions such aseconomic reform and a decline in national incomescaused by the 1991/92 drought. In the secondmodel we use the actual duration of self-employ-ment as the dependent variable. Since the firmsin such a sub-sample were charged the samelending rate and faced the same macro environ-ment the results should tell us the role of indi-vidual-specific variables on duration under givenmacro conditions. We use data for a sample ofindividuals who were tracked as they entered self-employment between 1988 and 1993, left it, orwere still in it by the end of 1996.
In Section 2 we describe the sample. In Section3 we briefly summarize the policy and macro-economic environment of the period. Then inSection 4 we estimate the Kaplan-Meier hazard
rates. In Section 5 we obtain regression estimatesof the duration rate as a function of personal andsector characteristics. Section 6 contains thesummary and conclusions.
2. The data
We have a unique data set drawn from Zimbabwe.It consists of small enterprises registered with astate agency, the Small Enterprise DevelopmentCorporation (SEDCO), between 1984 and 1996.Few employed wage labor. SEDCO was created topromote the establishment and growth of small-scale enterprises in both rural and urban areas byproviding technical and financial assistance for afee. The sample included individuals who obtainedstart-up loans or business skills, or both, oncondition the activities were owner-operated. Thesize of the loan was registered, but not the typeor extent of business services. SEDCO registeredthe date of entry and exit of each individual byarea and economic sector, as well as the usualpersonal information - age, marital status, numberof dependents and the initial investment of ownfunds and loans.
The sample size obviously varied by year, butaveraged 2,500 firms from 1989 to 1996. Thelargest number of entries was during 1988 and thelargest number of exits in 1991–92. Figure 1shows the time profile of entries by location of theactivity. Initially, the predominant entries were inthe rural areas, a reflection of the importance ofagriculture in both the population distribution andeconomic activity. By 1991, however, the twoareas had the same attraction for the self-employed. This reflects the impact of urbanizationand the structural transformation of the economy.Figure 2 shows most of the activities of the newentrants to be commercial. However, this sharedeclined monotonically. This is in line with acommercial sector that supplied basic goods. Mostof the rural self-employed were in the retail andpassenger transportation sectors. Figure 3 showsthe distribution, by type of activity, of all the exitsfrom self-employment from 1984 to 1996. Until1987 the majority were from commercial activi-ties but thereafter the distribution was fairly even.
Table I summarizes the mean values of thepersonal characteristics of our sample. Associatedwith the decline in the share of rural entrants is a
240 Mudziviri Nziramasanga and Minsoo Lee

Duration of Self-employment in Developing Countries 241
Figure 1. New entrants by location, 1984–90 (percent of all entrants).
Figure 2. New entrants by sector, 1984–96 (percent of all entrants).
Figure 3. Exits by sector, 1984–96 (percent of all total).

change in the profile of the self-employed. After1989 the new entrants are relatively younger witha mean age of 38.3 years compared to 44.7. Theyhave more years of secondary schooling and alonger history of wage employment prior to beingself-employed. They invested about the sameamount of their own real savings ($32,998compared to $32,652 at 1990 prices). The averageweighted loan size increased after 1989, so thatthe ratio of own equity to total initial capital outlayincreased from 51 percent in 1989 to 64 percentin 1992. Finally, the new entrants had fewerdependents.
When the sample is divided by location andsector the urban self-employed have on averagemore years of education (12.5 years) compared totheir rural counterparts (9.7). They are younger(38.52 years compared to 42.0) and have fewerdependents (2.77, compared to 3.86). There is agreater variance in the initial investment bylocation. Investments in commercial activities inthe rural areas required the least amount of capital(Z$23,124), followed by their urban counterparts(Z$43,657) and urban non-commercial invest-ments (Z$50,938).
3. Policy and macroeconomic background
During the sample period Zimbabwe initiated atrade liberalization program which was to be
implemented over five years (1990–95).2 A majorresult was a 35 percent decline in the exchangerate in the third quarter of 1991 and by 47 percentover the whole year.3 The U.S. dollar value ofimports fell by 6.7 percent while prices increased37.0 percent. The lack of adequate fiscal prudencecaused severe inflationary pressures that were stillevident at the end of the sample period.
Interest rates were deregulated in January 1993.Until then the real lending rate had been negative.In addition, those self-employed in rural areaswere charged a rate lower than their urban coun-terparts. The impact of the deregulation was a 16.6percent increase in urban nominal borrowing rates.The urban/rural differential was also eliminated,resulting in a 25 percent increase for rural firms.The real rate, however, remained negative.
Figure 5 gives annual changes in the consumerprice index and real GDP from 1980 to 1996. Thereal GDP scarcely changed during the sampleperiod (1988–96). There was no significantdownturn in response to the introduction of tradeliberalization in 1991. The overvalued exchangerate and the ensuing excess demand for importsprior to 1991 had been accompanied by rationingof imports of intermediate inputs and quotas onfinished goods. There was excess capacity, par-ticularly in the industrial sector. Data from the1994 Census of Industrial Production shows thatimporters anticipated the reform program and builtup stocks of raw materials throughout 1990,thereby raising the U.S. dollar value of imports by13.4 percent above the 1989 level. Bilateral com-modity aid programs, intended to ease the balanceof payments effects of liberalization, financedmost of these imports. When the reform programstarted in 1991 the U.S. dollar value of importsfell 4.2 percent but there was also a decline in rawmaterial inventories equivalent to 8.9 percent ofannual imports. Capacity utilization increased.Data from the International Financial Statistics ofthe IMF show a 9.0 percent decline in real GDPin 1992. This was a result of the 1991/92 droughtthat was the severest on record. It reduced thevalue of agricultural sales from the communalagricultural areas by 58.5 percent. Most of therural based self-employed in the sample arelocated in those areas. Output from the export-oriented large-scale commercial agriculturedeclined by 17.4 percent. Total domestic con-
242 Mudziviri Nziramasanga and Minsoo Lee
TABLE IPersonal characteristics of the self-empoloyed
Variable 1984–89 1990–96
Age 44.667 38.343(7.69) (8.29)
Education 10.22 12.03(3.64) (3.25)
Wage employment 10.049 11.741(years) (8.76) (7.88)
Equity 32,652 32,998(32,783) (35,679)
Cash 1,244.50 1,721.7(2,481) (4,990)
Dependents 4.4524 3.189(3.90) (2.54)
The figures in parenthesis are the standard errors.Equity and cash are denoted in current Zimbabwe dollars.

sumption fell 22 percent, but the impact washeaviest in rural areas. The key macroeconomicvariables for our analysis therefore are the tradeliberalization in 1991, interest rate deregulationin January 1993, and the 1991/92 drought thatreduced aggregate demand from July 1992 to June1993.
Theoretically, the expected impact of thedrought on the hazard rate is straightforward. Wewould expect a decline in consumption, but theimpact on small firms would depend on theincome elasticity of demand for their products.Those who entered self-employment in 1988 arelikely to fare better than later entrants because theyprobably had more cash reserves and smaller loanrepayment costs. The impact of trade liberaliza-tion on the self-employed on the other hand couldhave been a double-edged sword. The economicrents that had previously accrued to licensedimporters would disappear. At the same timederegulation could be expected to allow for a morecompetitive environment in the domestic market,a situation that could support entry into self-employment but reduce duration. The deregulationof interest rates would theoretically mean the endof credit rationing which is usually biased againstthe small, self-employed entrepreneur. However,the easier access to credit finance would beaccompanied by an increase in the costs ofborrowing. This would erode profitability, to thedisadvantage of a late entrant with a relativelylarge outstanding loan. The total effect of thesechanges can only be determined empirically. We
use restricted hazard rates for the 1988, 1990, and1991/92 and 1993 entrants to isolate the impactof the trade reforms, interest rate deregulation andthe drought.
4. Hazard rates
Self-employment is usually characterized by highturnover. We first computed the duration of thoseleaving self-employment for any reason andregardless of location or the year of exit. Thenumber of failures increased and reached theirmaximum by the second year (Figure 4).Thereafter, exits declined monotonically. Thiswould suggest an increased probability of survivalafter the second year.
With this general trend in mind, we computedthe non-parametric 12-month moving averagehazard rates using the Kaplan-Meier (1958)product-limit estimation technique. We did not useparametric models because they could distort theestimated hazard rates by imposing too restrictivea structure on the data. The Kaplan-Meier tech-nique is an empirical approach and gives theconditional probability of failure at each monthassuming the self-employed survived the previousperiod.
Let fi be the number of enterprises that failedbetween ti and ti + 1 for i = 1, . . . , T. If
σi and ηi
are the number of those still in business by the endof 1996 (i.e. the right censored observations) andnew entries between ti and ti + 1, respectively, thenthe total number of enterprises in the risk set at
Duration of Self-employment in Developing Countries 243
Figure 4. Exits from self-employment, by duration.

duration ti is mi = σi + ηi + fi. A generalized hazardrate at duration ti is then defined as
The corresponding Kaplan-Meier product limitsurvival function is
We compute two types of hazard rates. The gen-eralized hazard rate allows for entry into the initialrisk set, whereas the restricted hazard rate tracksa given cohort of entrants over time and does notallow for new entrants. Comparing the two hazardrates should provide an insight into the impact ofchanging macro conditions on those already self-employed and new entrants.
4.1. The impact of trade liberalization
The results (Figures 6 through 13) indicate thattrade liberalization and increasing costs of financeadversely affect all the self-employed, but theeffect is more severe for newer entrants. Figure 6gives the hazard rate for the sample restricted to1988 entrants and that which allows for entrantsafter 1988. Both rates have a similar reaction totrade liberalization in 1991. The two hazardrates were almost identical until January 1993.Thereafter, the unrestricted rate is almost 40
percent higher, implying that entrants after 1993exited at a higher rate than those already in self-employment.
We next control our samples for the impact oflocation (Figures 7 and 8). Those self-employedsince 1988 in the urban areas were more nega-tively affected by the import liberalizationmeasures. The hazard rate for the urban 1988cohort more than doubled during 1991, while thatof the 1990 urban entrants increased 33 percent.The rural hazard rates were relatively unaffected.The suggestion is that imports, or goods with ahigh import content, had a quality advantage overthe output of the self-employed in urban areas.The impact on the rural cohort was subduedbecause they sell largely basic products with rel-atively little import content.
The results indicate that import liberalizationincreases production costs particularly for the self-employed in the manufacturing sector in urbanmarkets. The impact on duration is negative. Theself-employed in commercial activities are lessvulnerable because they can import the finishedproduct and compete on the basis of price. Wewere unable to observe the impact on exportersbecause there were none in our sample.
4.2. Drought and interest rate deregulation
After January 1993 the unrestricted hazard ratewas almost 40 percent higher than that of thesample restricted to 1988 entrants (Figure 6).
244 Mudziviri Nziramasanga and Minsoo Lee
Figure 5. GP growth rate and changes in consumer prices, 1980–96.
H(ti) =fi
mi. (1)
S(ti) =mj – fj
mj∏i
j = 1 ( ) . (2)

Duration of Self-employment in Developing Countries 245
Figure 6. 12-month moving average hazard rates.
Figure 7. Restricted hazard rates for 1988 entrants.
Figure 8. Hazard rates for 1990 entrants, by location.

Those who entered self-employment after 1989were more affected by the interest rate deregula-tion, most probably because they still had largeroutstanding loan balances. The impact also seemsto be long-term. When we control for location itis clear the urban self-employed were moreseverely affected, although the differential impactlargely disappeared by 1995 (Figures 7 and 8).
A comparison of the 1989, 1990 and 1993cohorts show no significant difference in themagnitude of the change in the urban hazard rates.These estimates are not included but are availableon request from the authors. The 1993 rural hazardrates however, were higher than those of any othergroup at any point in their respective histories(Figure 9). The 1993 rural hazard rate was more
than twice as high in 1994 as those of the 1990cohort were in 1991. We attribute this to theavailability of credit that increased the reliance onloans for this group as a whole. The 1993 ruralcohort also had to compete on the basis of pricewith the 1988 and 1990 cohorts that had lowerloan repayment costs and had until then enjoyedhigher interest rate subsidies.
It is not possible to separate the effects ofderegulation and the drought in the absence oftime series regression estimates. The two eventsoverlapped in time. The estimates for the 1992entrants into self-employment (Figure 10) showthat the hazard rate for rural firms rose faster thanthat of their urban counterparts in the aftermath ofthe drought and deregulation. The 1989, 1990, and
246 Mudziviri Nziramasanga and Minsoo Lee
Figure 10. Hazard rates for new entrants in 1992, by location.
Figure 9. Hazard rates for entrants in 1988, 1990 and 1993, rural areas.
1991 cohorts reveal no such pattern. The disparityin hazard rates for the 1992–93 period partlyreflects the greater impact of the drought on ruralenterprises. The results also reflect a greaterreliance on loan finance by the 1992 rural cohort.Loans constituted 64 percent of project finance forthese entrants, compared to 51 percent in 1988 and59 percent for those who entered in 1993. The1992 rural entrants therefore faced a greater liq-uidity constrain as a result of the combined effectsof the drought and higher lending rates.
4.3. Hazard rates by type of activity
We divided our sample by type of activity. Thosein the commercial sector generally owned retailoutlets or provided customized services. Non-commercial activities mainly involved the manu-facture of basic household goods for the domesticmarket.
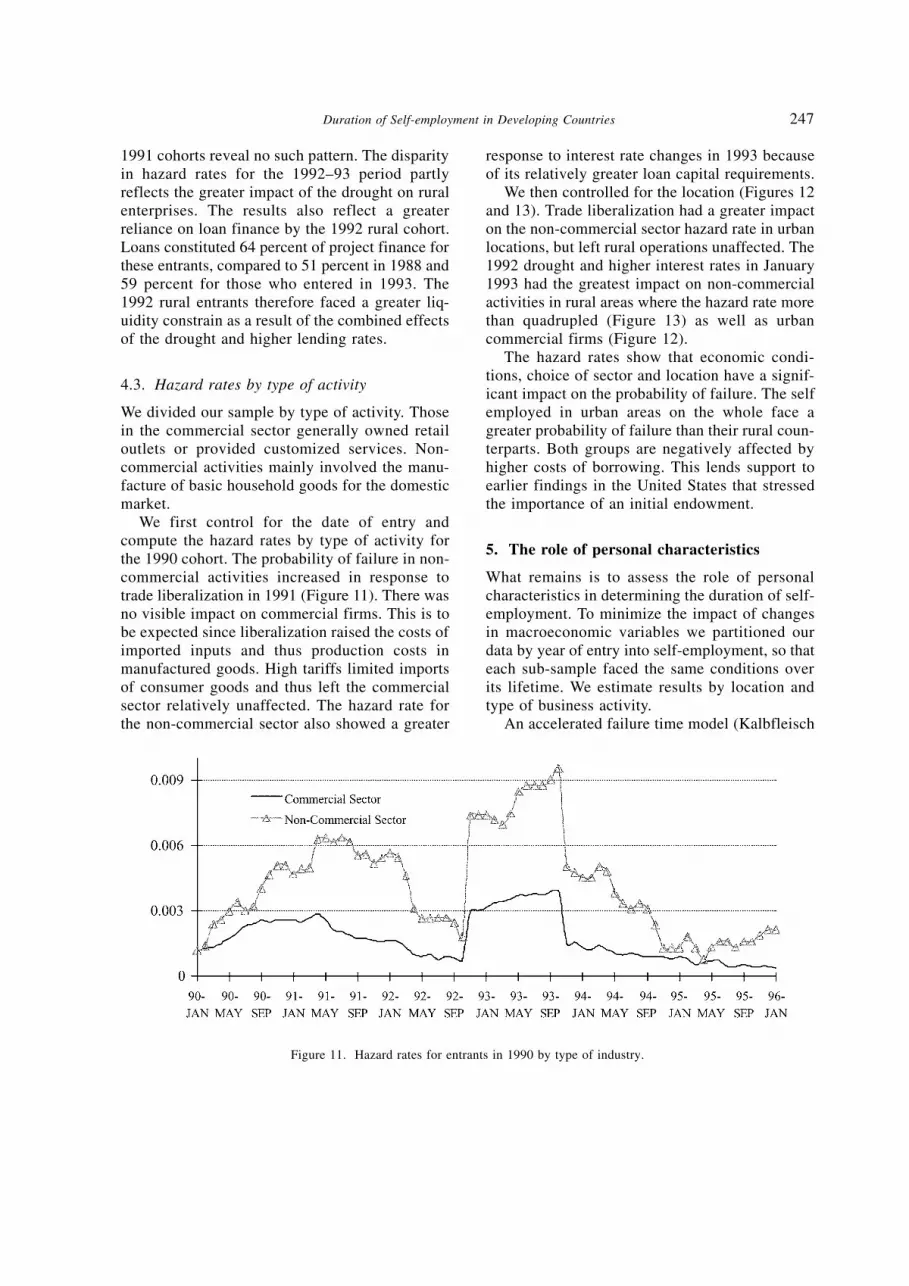
We first control for the date of entry andcompute the hazard rates by type of activity forthe 1990 cohort. The probability of failure in non-commercial activities increased in response totrade liberalization in 1991 (Figure 11). There wasno visible impact on commercial firms. This is tobe expected since liberalization raised the costs ofimported inputs and thus production costs inmanufactured goods. High tariffs limited importsof consumer goods and thus left the commercialsector relatively unaffected. The hazard rate forthe non-commercial sector also showed a greater
response to interest rate changes in 1993 becauseof its relatively greater loan capital requirements.
We then controlled for the location (Figures 12and 13). Trade liberalization had a greater impacton the non-commercial sector hazard rate in urbanlocations, but left rural operations unaffected. The1992 drought and higher interest rates in January1993 had the greatest impact on non-commercialactivities in rural areas where the hazard rate morethan quadrupled (Figure 13) as well as urbancommercial firms (Figure 12).
The hazard rates show that economic condi-tions, choice of sector and location have a signif-icant impact on the probability of failure. The selfemployed in urban areas on the whole face agreater probability of failure than their rural coun-terparts. Both groups are negatively affected byhigher costs of borrowing. This lends support toearlier findings in the United States that stressedthe importance of an initial endowment.
5. The role of personal characteristics
What remains is to assess the role of personalcharacteristics in determining the duration of self-employment. To minimize the impact of changesin macroeconomic variables we partitioned ourdata by year of entry into self-employment, so thateach sub-sample faced the same conditions overits lifetime. We estimate results by location andtype of business activity.
An accelerated failure time model (Kalbfleisch
Duration of Self-employment in Developing Countries 247
Figure 11. Hazard rates for entrants in 1990 by type of industry.

and Prentice, 1980; Lancaster, 1979; Lynch, 1985;Nickell, 1979) is used to assess factors influencingthe duration of a respondent’s self-employment.This model captures the multiplicative effects ofindependent variables on an event’s time distrib-ution. The response variable is the duration of self-employment. This time period (T ) is uncensoredfor those who exited self-employment during thesample period, but is “right-censored” for thosewho were still in self-employment after the endof sample period, in this case December 1996. Wepostulate that the duration will be
T = exp(x′β)E, (3)
where E is the duration sampled from the baselinedistribution corresponding to the covariates. Thisnonlinear model can be transformed into log-linearform
y = Xβ + αε, (4)
where y = ln(T ), ε = ln(E ), and α is a scale para-meter to be estimated. The parameter ε is a vectorof errors with survival distribution functionΨ(t) = PROB(εj > t), cumulative distributionfunction F(t) = PROB(εj ≤ t), and the densityfunction f(t) = dπ(t)/dt, where εj is an element ofε.
248 Mudziviri Nziramasanga and Minsoo Lee
Figure 12. Hazard rates for entrants in 1990 by type of industry, urban areas.
Figure 13. Hazard rates for entrants in 1990 by type of industry, rural areas.

The log-likelihood, L is written as
where ξi = (yi – xi′β)/α. The first term of the log-likelihood is the sum over the uncensoredobservations and the second term the sum over theright censored observations. The coefficient esti-mates obtained after the log-linear transformationin Equation (5) can be interpreted as elasticitieswith respect to the individual variable.
Several sources (Cox and Oakes, 1985;Kalbfleisch and Prentice, 1980; and Lancaster,1990) explain possible choices of distributions forduration models. These are normal, inverseGaussian, log-normal, gamma, and Weibull.Which distribution is the best for any specificapplication, however, cannot be determined apriori. We tried all five but found that there wereno major differences in the results. We settled onthe Weibull distribution as yielding the best resultsoverall. The regression results with other distrib-utions can be provided upon request.
The dependent variable is duration of self-employment, measured as the log of the actualnumber of days. The explanatory variables (alsoin their log form in Equation (5)) included the sizeof the initial capital loan, the owner’s equitycontribution. The personal characteristics are theage of the proprietor, his level of education inyears of schooling (and their squared values toaccount for the presence of diminishing impor-tance), their sex and number of dependents.
We can expect some correlation among theexplanatory variables such as the size of the loangranted and the owner’s equity contribution.Table II presents the matrix of Pearson correlationcoefficients for the independent variables by sectorand year of entry into self-employment. Weinclude only those coefficients where the ρ-valuesindicated significance at least at the 10 percentlevel. As would be expected, age and the lengthof previous wage employment are positivelyrelated in all the sub-samples (except for the urbancommercial and non-commercial sectors for 1988and 1993 entrants, respectively. The number ofdependents increases with age for all the cate-gories. The number of dependents also is posi-tively correlated with the length of previous wageemployment for five of the twelve sub-samples,
but decreases with the level of education. Thelevel of education also had a positive impact onloan size, but this correlation was significant onlyin half of the sub-samples. Finally, the size of theequity contribution by the owner had a positiveeffect on the magnitude of loan finance.
There are some mixed relationships. Prior wageemployment had a positive effect on loan size forthose entering self-employment in the rural non-commercial sector in 1988. The impact wasnegative otherwise. Years of education were pos-itively correlated with the length of prior wageemployment in 1988. The effect was negative inlater years. This reflects an increase in years ofeducation among the younger age groups that alsohave a shorter work history. The strong correla-tion likely diluted the explanatory power ofindividual coefficients in some equations. Sincethe correlation coefficients were significant in onlysome of the samples, however, we could notexclude variables from the equations.
The regression estimates themselves are shownin Table III. The gender coefficient is the largest.Males are more likely to stay longer in self-employment in the urban commercial sector (1988cohort) and the whole rural sector (1993 entrants).The elasticities ranged from 0.82 to 2.426. Thereare negative coefficients, but most are not signif-icantly different from zero. The exception is theurban, non-commercial sector for the 1990entrants. The gender variable is probably a proxyfor such market imperfections as gender prefer-ences in educational opportunities and wageemployment. We have no evidence of similar pref-erences in the provision of loans, but we cannotdiscount them.
The level of education has a negative impact onduration, but the magnitude declines with moreyears of schooling. The sign of the coefficient forthe squared log of years of formal education ispositive. This suggests a decline in the importanceeducation to duration after 12.3 years for 1988entrants and 17.5 years for the 1993 group, periodsfar longer than the respective sample weightedaverages. Prior wage employment also has anegative effect on duration although the coeffi-cient is significantly greater than zero only for theurban commercial sector in 1988 and the ruralnon-commercial sector in all three years. A longhistory of formal employment, most likely in an
Duration of Self-employment in Developing Countries 249
( )L = ∑logi
f(ξi)α + ∑log(Ψ(ξi)), (5)
i

urban setting, does not necessarily provide suitabletraining for self-employment in a rural environ-ment. Another interpretation is that the educatedand those with experience in formal wage employ-ment have a higher opportunity cost when inself-employment and will always have an eye onthe formal job market. The estimated coefficientsget larger over time, an indication that this oppor-tunity cost has risen as real wages have risen.
The owner’s equity contribution to total projectcosts has a positive impact on duration of self-employment, but the coefficient was significantonly in urban commercial sector for the 1988 and
1990 entrants, and the rural commercial sector for1993. Again, the results confirm the importanceof liquidity and lower loan costs. The sign for theloan variable itself is negative and significant inonly two sectors (rural commercial sector in 1988and urban commercial sector in 1990). The sign ispositive and significant for those who entered theurban commercial sector in 1993 but is notsignificantly different from zero elsewhere. Thischange of signs for the urban commercial sectorover time probably indicates a more efficientutilization of loan finance as the interest rates werederegulated. The magnitudes of the elasticities
250 Mudziviri Nziramasanga and Minsoo Lee
TABLE II Pearson correlation coefficients matrix, by sector and year
Loan size Age Education Employment Equity Dependents
Loan size 1 0.476 rnc 1993 –0.471 unc 1988 –0.621 rnc 1988 0.458 rc 1988 –0.142 unc 1990–0.322 uc 1990 –0.429 unc 1993 0.563 rnc 1988 –0.333 rc 1993–0.215 unc 1990 –0.134 unc 1990 0.287 rc 1990–0.471 rc 1993 –0.429 rc 1993 0.545 rnc 1990–0.242 uc 1993 –0.150 rnc 1993 0.461 uc 1990–0.197 unc 1993 0.453 unc 1990
0.467 rnc 19930.527 uc 19930.456 unc 1993
Age 1 –0.256 rc 1990 –0.232 rc 1988 0.608 rnc 1988 –0.402 rc 1988–0.229 rnc 1990 –0.627 rnc 1988 0.191 uc 1990 –0.458 rnc 1988–0.224 uc 1993 –0.421 unc 1988 0.130 unc 1990 –0.447 uc 1988
–0.450 rc 1990 –0.384 unc 1988–0.427 rnc 1990 –0.369 rc 1990–0.542 uc 1990 –0.470 rnc 1990–0.499 unc 1990 –0.531 uc 1990–0.421 rc 1993 –0.383 unc 1990–0.771 uc 1993 –0.384 rc 1993–0.583 unc 1993 –0.394 rnc 1993
–0.595 uc 1993–0.400 unc 1993
Education –1 –0.349 unc 1988 0.267 rc 1988 –0.353 rc 1988–0.285 unc 1990 0.241 rc 1990 –0.285 rc 1990–0.349 rc 1993 0.351 uc 1993 –0.386 rnc 1993–0.316unc 1993 –0.185 unc 1993
Employment –1 0.558 rnc 1988 –0.130 rc 19900.227 uc 1990 –0.351 unc 1990
–0.521 rc 1993–0.530 uc 1993–0.264 unc 1993
Equity 1
Dependents –1
rc: Rural commercial sector; rnc: Rural non-commercial sector; uc: Urban commercial sector; unc: Urban non-commercial sector.

with respect to both the loan size and owner equityare relatively small, ranging from 0.001 to 0.012.
The age of the self-employed has a largelypositive and significant impact on duration, but themagnitude decreases over time. It is possible thisvariable is a proxy for experience. Dependents aresupposed to be a net drain on resources and thevariable had a mostly negative impact across allsectors and over time. However, the coefficient
was significant only in the rural sector in 1988.This is to be expected since the average numberof dependents declined over time (Table I).
A comparison of similar sectors (commercialand noncommercial) by location (urban and rural)in the same year and across years yields a decid-edly mixed picture. It is clear there are differencesin the impact of the explanatory variables onduration and the signs depend not only on the
Duration of Self-employment in Developing Countries 251
TABLE IIIa The estimates of duration models for entrants in 1988a
Independent variables Commercial in Commercial in Non-commercial Non-commercial rural area urban area in rural area in urban area
Constant –6.599** (0.0001) –4.915** (0.028) –9.659** (0.0001) –6.886** (0.0005)Sex –0.002** (0.994) –0.822** (0.006) –0.299** (0.302) –0.138** (0.662)Loan –0.012** (0.007) –0.009** (0.004) –0.007** (0.198) –0.004** (0.097)Age –0.053** (0.065) –0.264** (0.023) –0.119** (0.315) –0.079** (0.515)Age2 –0.001** (0.175) –0.003** (0.055) –0.002** (0.178) –0.001** (0.701)Education –0.026** (0.716) –0.293** (0.147) –0.016** (0.847) –0.115** (0.307)Education2 –0.002** (0.602) –0.014** (0.079) –0.003** (0.600) –0.007** (0.225)Employment –0.017** (0.463) –0.003** (0.019) –0.184** (0.018) –0.004** (0.936)Employment2 –0.001** (0.380) –0.003** (0.027) –0.010** (0.013) –0.001** (0.583)Equity –0.001** (0.164) –0.005** (0.038) –0.005** (0.547) –0.003** (0.360)Dependents –0.001** (0.972) –0.194** (0.008) –0.043** (0.472) –0.101** (0.122)
Log Likelihood for Weibull –62.148 –0.972 –3.049 –37.869Mean of duration rates 3,902.1 3,811.3 3,816.5 3,775.7
a Age1, Employment1 and Education1 are coefficients for the squared log of the respective variable. The mean duration rates havebeen derived from the mean log values.The figures in parenthesis are p-values.
TABLE IIIb The estimates of duration models for entrants in 1990
Independent variables Commercial in Commercial in Non-commercial Non-commercial rural area urban area in rural area in urban area
Constant –6.393** (0.0001) –9.041** (0.006) –5.305** (0.002) –6.534** (0.0006)Sex –0.107** (0.705) –0.108** (0.756) –0.119** (0.723) –0.419** (0.034)Loan –0.004** (0.021) –0.003** (0.053) –0.001** (0.445) –0.001** (0.066)Age –0.086** (0.114) –0.064** (0.641) –0.153** (0.055) –0.095** (0.398)Age2 –0.001** (0.202) –0.0005* (0.7789) –0.002** (0.041) –0.001** (0.543)Education –0.134** (0.098) –0.251** (0.255) –0.063** (0.565) –0.044** (0.652)Education2 –0.009** (0.067) –0.011** (0.225) –0.004** (0.423) –0.002** (0.661)Employment –0.006** (0.767) –0.128** (0.108) –0.093** (0.089) –0.075** (0.138)Employment2 –0.0001* (0.874) –0.003** (0.242) –0.003** (0.142) –0.003** (0.140)Equity –0.005** (0.154) –0.005** (0.086) –0.004** (0.247) –0.001** (0.494)Dependents –0.012** (0.587) –0.168** (0.048) –0.020** (0.616) –0.079** (0.061)
Log Likelihood for Weibull –185.281 –66.856 –46.031 –172.070Mean of duration rates 2,192.1 1,583.9 2,062.7 1,586.3
The figures in parenthesis are p-values.

sector but vary over time. We could not com-pletely control for the macroeconomic conditions.Aggregating observations over a year makes thisimpossible. However, the relatively large numberof insignificant coefficients would indicate thatthose personal characteristics do not have much ofan impact on duration.
6. Summary and conclusions
We used our unique sample to compute non-parametric hazard rates that show the impact oflocation, type of economic activity, costs of bor-rowing and a more competitive environment onthe probability of exit from self-employment.
Our results show the importance of location.The probability of failure was higher for urbanthan for rural- based self employed. This may bedue to lower levels of competition in rural areasand also a smaller debt burden in times of risinginterest rates.
Our results are also relatively insensitive topersonal characteristics, except for the rural areas.Age is consistently significant and we believe it isa proxy for other sources of non-credit finance,such as transfer payments. This may explain forthe significance of all personal characteristics inthe case of those in commercial rural activities.They are on average older than all the other groupsand could therefore have better access to bequests
from employed children. Unfortunately we couldnot measure for this effect directly.
Access to loan finance by itself is not anadvantage. Our results show that the size of theloan, given high market lending rates, is nega-tively related to duration of self-employment. Thisis consistent with earlier work elsewhere.However, the relatively small elasticity suggeststhat market demand conditions facing each pro-prietor in their respective location and sector mayplay a larger role in determining who stays in self-employment. Partial economic reforms that do notreduce the inflation rate will not necessarilybenefit the small entrepreneur in a developingcountry.
When we partitioned our sample to control foryear of entry into self-employment loan size stillhad a negative effect on duration. This suggeststhe impact of liquidity constraints on entrepreneurswho otherwise faced similar conditions but haddifferent levels of indebtedness. Results from onesub-sample suggested that subsidized rates mightencourage this inefficient utilization of loanfinance. As real interest rates became positive loanfinance also had a positive impact on duration.
A major contribution from our results has beento demonstrate the impact of economic conditionson duration through our analysis of hazard rates.Aggregate demand seems to be the most impor-tant factor with regards to the rate of exit from
252 Mudziviri Nziramasanga and Minsoo Lee
TABLE IIIc The estimates of duration models for entrants in 1993
Independent variables Commercial in Commercial in Non-commercial Non-commercial rural area urban area in rural area in urban area
Constant –9.184** (0.0001) –6.731** (0.036) 20.354** (0.028) –1.215** (0.621)Sex –1.151** (0.043) –0.041** (0.886) –2.426** (0.067) –0.199** (0.266)Loan –0.008** (0.158) –0.003** (0.097) –0.001** (0.666) –0.0001* (0.990)Age –0.053** (0.594) –0.062** (0.595) –0.227** (0.324) –0.425** (0.001)Age2 –0.0004* (0.725) –0.0006* (0.642) –0.002** (0.368) –0.005** (0.0006)Education –0.299** (0.300) –0.239** (0.338) –0.368** (0.373) –0.155** (0.344)Education2 –0.015** (0.299) –0.007** (0.455) –0.007** (0.648) –0.006** (0.354)Employment –0.145** (0.015) –0.062** (0.538) –0.554** (0.080) –0.072** (0.301)Employment2 –0.004** (0.029) –0.002** (0.536) –0.016** (0.083) –0.003** (0.175)Equity –0.012** (0.059) –0.0006* (0.858) –0.012** (0.164) –0.0003* (0.799)Dependents –0.028** (0.469) –0.006** (0.952) –0.028** (0.734) –0.071** (0.251)
Log Likelihood for Weibull –47.255 –31.191 –11.270 –73.177Mean of duration rates 1,237.0 970.0 1,126.4 985.5
The figures in parenthesis are p-values.

self-employment over time. Economic reforms andderegulation have been touted as conducive to thegrowth of small business. Our results show thatpartial reforms that do not reduce inflation orgenerate growth are unlikely to promote durationin self-employment in a developing country. Wealso showed that personal attributes do play a rolein determining who exits self-employment from acohort facing the same macroeconomic environ-ment. Their impact, however, seems relativelylimited. Local conditions facing each entrepreneurmay probably play a much larger role in thisregard. Unfortunately, the level of aggregation ofour data by sector and location does not allow usto take these local conditions into effect and thismay be a direction for further research.
Notes1 See, among others, Harrison and Leamer (1997), Evans andJovanovich (1989), Blanchflower and Oswald (1998) andFairlie (1999).2 For the complete program description, see Zimbabwe(1991).3 The rates, in U.S. currency per Zimbabwe dollar: January1991 (0. 3876), June, 0.3108, September, 0.2011, December,0.1980.
References
Bates, Timothy, 1990, ‘Entrepreneur Human Capital Inputsand Small Business Longevity’, Review of Economics andStatistics 72(4), 551–559.
Bates, Timothy, 1999, ‘Exiting Self-Employment: An analysisof Asian Immigrant-Owned Small Businesses’, SmallBusiness Economics 13(3), 171–183.
Blanchflower, David and Andrew Oswald, 1998, ‘What Makesan Entrepreneur?’, Journal of Labor Economics 16(1),26–60.
Cox, D. and D. Oakes, 1985, Analysis of Survival Data, NewYork: Chapman and Hall.
Evans, David and Boyan Jovanovic, 1989, ‘An EstimatedModel of Entrepreneurial Choice Under LiquidityConstraints’, Journal of Political Economy 97(4), 808–827.
Evans, David S. and Linda S. Leighton, 1989, ‘SomeEmpirical Aspects of Entrepreneurship’, AmericanEconomic Review 79(3), 519–535.
Fairlie, R. W., 1999, ‘The Absence of African-AmericanOwned Business: An Analysis of the Dynamics of Self-Employment’, Journal of Labor Economics 17(1), 80–108
Harrison, A. and E. Leamer, 1997, ‘Labor Markets inDeveloping Countries: An Agenda for Research’, Journalof Labor Economics 15(3) Part 2, S1–S19.
Kalbfleisch, J. D. and R. L. Prentice, 1980, The StatisticalAnalysis of Failure Time Data, New York: John Wiley &Sons, Inc.
Kaplan, E. L., and Paul Meier, 1958, ‘NonparametricEstimation from Incomplete Observations’, AmericanStatistical Association Journal, 457–481.
Lancaster, T., 1979, ‘Econometric Methods for the Durationof Unemployment’, Econometrica 47(4), 939–956.
Lancaster, T., 1990, The Analysis of Transition Data, NewCambridge University Press.
Lynch, L., 1985, ‘State Dependency in Youth Unemployment:A Lost Generation?’, Journal of Econometrics 28, 71–84.
Nickell, Stephen, 1979, ‘Estimating the Probability of LeavingUnemployment’, Econometrica 47(5), 1249–1266.
Government of Zimbabwe, Zimbabwe: A Framework forEconomic Reform, 1991–95, Government Printers, January1991.
Duration of Self-employment in Developing Countries 253