dso-6202 dual-channel series digital storage ... - conrad
TRANSCRIPT

i
DSO-6202 Dual-Channel SeriesDigital Storage Oscilloscopes
User Manual
ii
Table of Contents1. General Safety Requirements.......................................................................................... 1
2. Safety Terms and Symbols................................................................................................2
3. Junior User Guidebook....................................................................................................4
Introduction to the Structure of the Oscilloscope......................................................................5Front Panel.................................................................................................................................................5Front Panel Menu Buttons......................................................................................................................... 6Rear Panel.................................................................................................................................................. 6Control Area...............................................................................................................................................7
User Interface Introduction.........................................................................................................8
How to Implement the General Inspection.............................................................................. 10
How to Implement the Function Inspection.............................................................................10
How to Implement the Probe Compensation........................................................................... 11
How to Set the Probe Attenuation Coefficient.........................................................................12
How to Use the Probe Safely......................................................................................................13
How to Implement Self-calibration...........................................................................................14
Introduction to the Vertical System..........................................................................................14
Introduction to the Horizontal System..................................................................................... 15
Introduction to the Trigger System.......................................................................................... 16
Touchscreen Controls.................................................................................................................16Operate the Menu through Touchscreen..................................................................................................17Gestures in Normal Mode........................................................................................................................17Gestures in Wave Zoom Mode................................................................................................................ 21Other Operations Using Touchscreen......................................................................................................23
Magnifier Function.....................................................................................................................24
4. Advanced User Guidebook............................................................................................. 26
How to Set the Vertical System................................................................................................. 27
Use Mathematical Manipulation Function...............................................................................29Waveform math....................................................................................................................................... 31User defined function...............................................................................................................................31Digital Filter.............................................................................................................................................32Using FFT function..................................................................................................................................32
Use Vertical Position and Scale Knobs..................................................................................... 34
How to Set the Horizontal System.............................................................................................35Zoom the Waveform................................................................................................................................ 35
How to Set the Trigger/Decoding System.................................................................................36
iii
Single Trigger.......................................................................................................................................... 37Alternate Trigger (Trigger mode: Edge)..................................................................................................46Logic Trigger........................................................................................................................................... 46Bus Trigger.............................................................................................................................................. 47Bus Decoding...........................................................................................................................................53
How to Operate the Function Menu......................................................................................... 57How to Implement Sampling Setup.........................................................................................................57How to Set the Display System............................................................................................................... 59How to Save and Recall a Waveform...................................................................................................... 62How to Record/Playback Waveforms......................................................................................................69How to Clone and Recall a waveform..................................................................................................... 73How to Implement the Auxiliary System Function Setting.....................................................................77How to Update your Instrument Firmware..............................................................................................80How to Measure Automatically............................................................................................................... 82How to Measure with Cursors................................................................................................................. 86How to Use Autoscale............................................................................................................................. 89How to Use Built-in Help........................................................................................................................ 91How to Use Executive Buttons................................................................................................................ 91How to Print the Screen Image................................................................................................................ 93
5. Use theArbitraryFunctionGenerator (Optional).............................................................. 94
Output Connection..................................................................................................................... 94
To Set Channels.......................................................................................................................... 94
To Set Signals.............................................................................................................................. 95To Output Sine Signals............................................................................................................................ 95
To Set the Frequency............................................................................................................................................. 95
To Set the Period....................................................................................................................................................96
To Set the Start Phase............................................................................................................................................ 96
To Set the Amplitude............................................................................................................................................. 96
To Set the Offset.................................................................................................................................................... 96
To Set the High Level............................................................................................................................................ 96
To Set the Low Level.............................................................................................................................................96
To Output Square Signals........................................................................................................................ 96To Output Ramp Signals..........................................................................................................................96
To Set the Symmetry of Ramp...............................................................................................................................97
To Output Pulse Signals...........................................................................................................................97To Set the Pulse Width of Pulse.............................................................................................................................97
To Set the Duty Cycle of Pulse..............................................................................................................................97
To Output Arbitrary Signals.................................................................................................................... 97Create a New Waveform........................................................................................................................................97
File Browse............................................................................................................................................................99
Built-in Waveform................................................................................................................................................. 99
Frequency Response Analysis..................................................................................................101
6. Use the Multimeter (Optional).....................................................................................103
iv
Input Terminals........................................................................................................................ 103
DMMMenu...............................................................................................................................103
DMM Information Window.................................................................................................... 104
Making Multimeter Measurements........................................................................................ 105Measuring AC or DC Current................................................................................................................105Measuring AC or DC Voltage............................................................................................................... 106Measuring Resistance............................................................................................................................ 106Testing Diodes....................................................................................................................................... 106Testing for Continuity............................................................................................................................106Measuring Capacitance..........................................................................................................................106
Multimeter Features.................................................................................................................107Data Hold Mode.....................................................................................................................................107Making Relative Measurements............................................................................................................ 107Information Display...............................................................................................................................107Auto or Manual Range...........................................................................................................................107
Multimeter Recorder................................................................................................................107
7. Communication with PC.............................................................................................. 111
Using USB Port......................................................................................................................... 111
Using LAN Port........................................................................................................................ 112Connect directly.....................................................................................................................................112Connect through a router....................................................................................................................... 113
8. Demonstration.............................................................................................................. 116
Example 1: Measurement a Simple Signal.............................................................................116
Example 2: Gain of a Amplifier in a Metering Circuit......................................................... 117
Example 3: Capturing a Single Signal....................................................................................118
Example 4: Analyze the Details of a Signal............................................................................119
Example 5: Application of X-Y Function............................................................................... 121
Example 6: Video Signal Trigger............................................................................................ 122
9. Troubleshooting............................................................................................................124
10. Technical Specifications.............................................................................................125
Oscilloscope............................................................................................................................... 125Trigger....................................................................................................................................................127
Waveform Generator (optional)..............................................................................................129
Multimeter (optional)............................................................................................................... 129
General Technical Specifications............................................................................................ 130
11. Appendix..................................................................................................................... 131
Appendix A: Enclosure............................................................................................................ 131
Appendix B: General Care and Cleaning...............................................................................131

v
Appendix C: Optional Battery Using Guide.......................................................................... 132
Appendix D: Multimeter (optional) Fuse Replacement........................................................133
Appendix E: Line Fuse Replacement......................................................................................133

1.General Safety Requirements
1
1. General Safety RequirementsBefore use, please read the following safety precautions to avoid any possible bodilyinjury and to prevent this product or any other connected products from damage. Inorder to avoid any contingent danger, ensure this product is only used within therange specified.
Only the qualified technicians can implement the maintenance.
To avoid Fire or Personal Injury:
Connect the probe correctly. The grounding end of the probe corresponds to thegrounding phase. Please don't connect the grounding end to the positive phase.
Use Proper Power Cord. Use only the power cord supplied with the product andcertified to use in your country.
Connect or Disconnect Correctly. When the probe or test lead is connected to avoltage source, please do not connect and disconnect the probe or test lead at random.
Product Grounded. This instrument is grounded through the power cord groundingconductor. To avoid electric shock, the grounding conductor must be grounded. Theproduct must be grounded properly before any connection with its input or outputterminal.
When powered by AC power, it is not allowed to measure AC power sourcedirectly, because the testing ground and power cord ground conductor areconnected together, otherwise, it will cause short circuit.
When powered by battery, the product must ground connection. To avoid electricshock, there must be a ground wire connect between ground and the ground port(on the back of product panel).
Check all Terminal Ratings. To avoid fire or shock hazard, check all ratings andmarkers of this product. Refer to the user's manual for more information about ratingsbefore connecting to the instrument.
Do not operate without covers. Do not operate the instrument with covers or panelsremoved.
Use Proper Fuse. Use only the specified type and rating fuse for this instrument.
Avoid exposed circuit. Do not touch exposed junctions and components when theinstrument is powered.
Do not operate if in any doubt. If you suspect damage occurs to the instrument, haveit inspected by qualified service personnel before further operations.
Use your Oscilloscope in a well-ventilated area. Make sure the instrument installedwith proper ventilation, refer to the user manual for more details.
Do not operate in wet conditions.
Do not operate in an explosive atmosphere.
Keep product surfaces clean and dry.

2.Safety Terms and Symbols
2
2. Safety Terms and SymbolsSafety TermsTerms in this manual. The following terms may appear in this manual:
Warning: Warning indicates the conditions or practices that could result ininjury or loss of life.
Caution: Caution indicates the conditions or practices that could result indamage to this product or other property.
Terms on the product. The following terms may appear on this product:
Danger: It indicates an injury or hazard may immediately happen.
Warning: It indicates an injury or hazard may be accessible potentially.
Caution: It indicates a potential damage to the instrument or other property might occur.
Safety SymbolsSymbols on the product. The following symbol may appear on the product:
Hazardous Voltage Refer to Manual
Protective Earth Terminal Chassis Ground
Test Ground
To avoid body damage and prevent product and connected equipment damage, carefullyread the following safety information before using the test tool. This product can only beused in the specified applications.
Warning:The two channels of the oscilloscope are not electrically isolated. The channels shouldadopt a common ground during measuring. To prevent short circuits, the 2 probegrounds must not be connected to 2 different non-isolated DC levels.
2.Safety Terms and Symbols
3
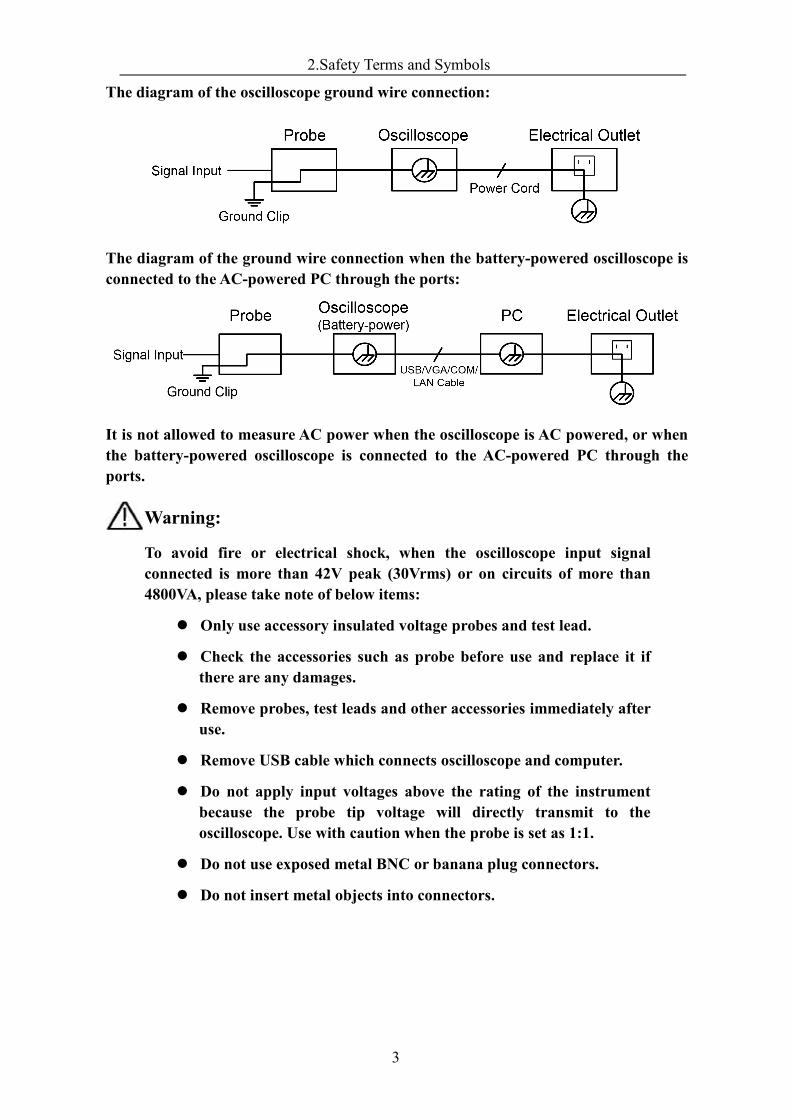
The diagram of the oscilloscope ground wire connection:
The diagram of the ground wire connection when the battery-powered oscilloscope isconnected to the AC-powered PC through the ports:
It is not allowed to measure AC power when the oscilloscope is AC powered, or whenthe battery-powered oscilloscope is connected to the AC-powered PC through theports.
Warning:
To avoid fire or electrical shock, when the oscilloscope input signalconnected is more than 42V peak (30Vrms) or on circuits of more than4800VA, please take note of below items:
Only use accessory insulated voltage probes and test lead.
Check the accessories such as probe before use and replace it ifthere are any damages.
Remove probes, test leads and other accessories immediately afteruse.
Remove USB cable which connects oscilloscope and computer.
Do not apply input voltages above the rating of the instrumentbecause the probe tip voltage will directly transmit to theoscilloscope. Use with caution when the probe is set as 1:1.
Do not use exposed metal BNC or banana plug connectors.
Do not insert metal objects into connectors.

3.Junior User Guidebook
4
3. Junior User GuidebookThis chapter deals with the following topics mainly:
Introduction to the structure of the oscilloscope Introduction to the user interface How to implement the general inspection How to implement the function inspection How to make a probe compensation How to set the probe attenuation coefficient How to use the probe safely How to implement an auto-calibration Introduction to the vertical system Introduction to the horizontal system Introduction to the trigger system Touchscreen Controls
3.Junior User Guidebook
5
Introduction to the Structure of the Oscilloscope
This chapter makes a simple description of the operation and function of the front panel ofthe oscilloscope, enabling you to be familiar with the use of the oscilloscope in theshortest time.
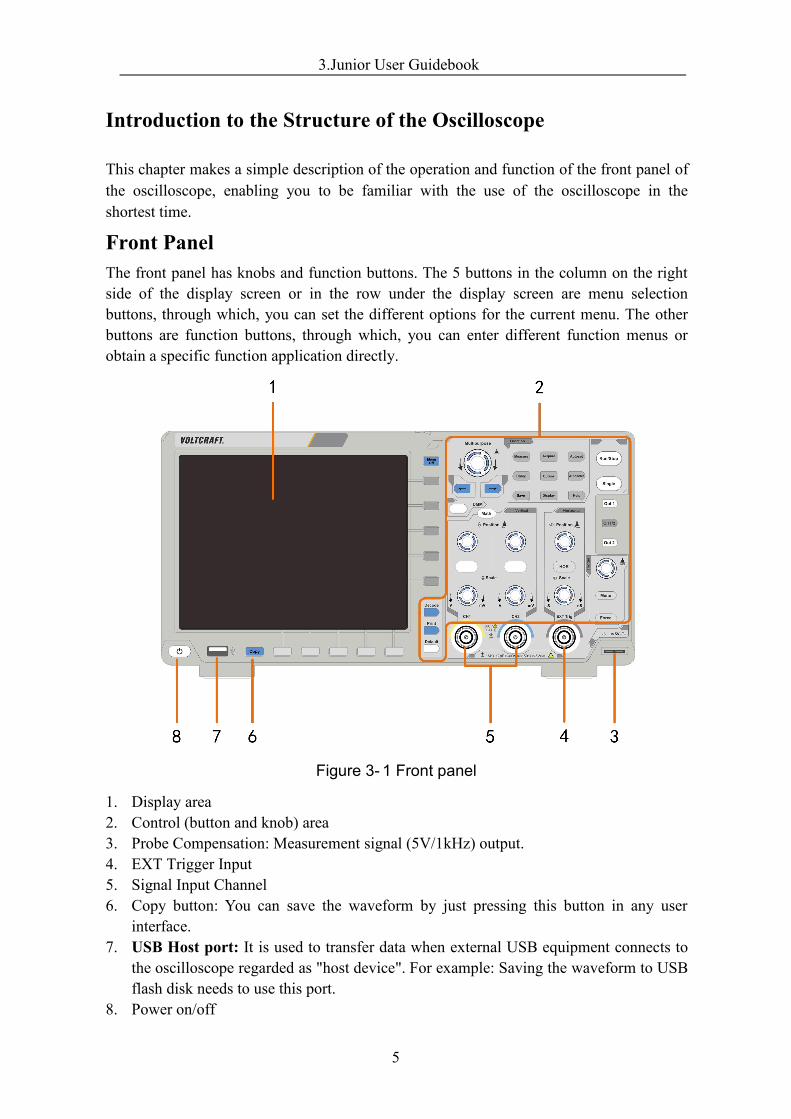
Front PanelThe front panel has knobs and function buttons. The 5 buttons in the column on the rightside of the display screen or in the row under the display screen are menu selectionbuttons, through which, you can set the different options for the current menu. The otherbuttons are function buttons, through which, you can enter different function menus orobtain a specific function application directly.
Figure 3- 1 Front panel
1. Display area2. Control (button and knob) area3. Probe Compensation: Measurement signal (5V/1kHz) output.4. EXT Trigger Input5. Signal Input Channel6. Copy button: You can save the waveform by just pressing this button in any user
interface.7. USB Host port: It is used to transfer data when external USB equipment connects to
the oscilloscope regarded as "host device". For example: Saving the waveform to USBflash disk needs to use this port.
8. Power on/off
3.Junior User Guidebook
6
Backlight of this button:Red light: The oscilloscope is turned off (connects with AC Power);Green light: The oscilloscope is turned on.
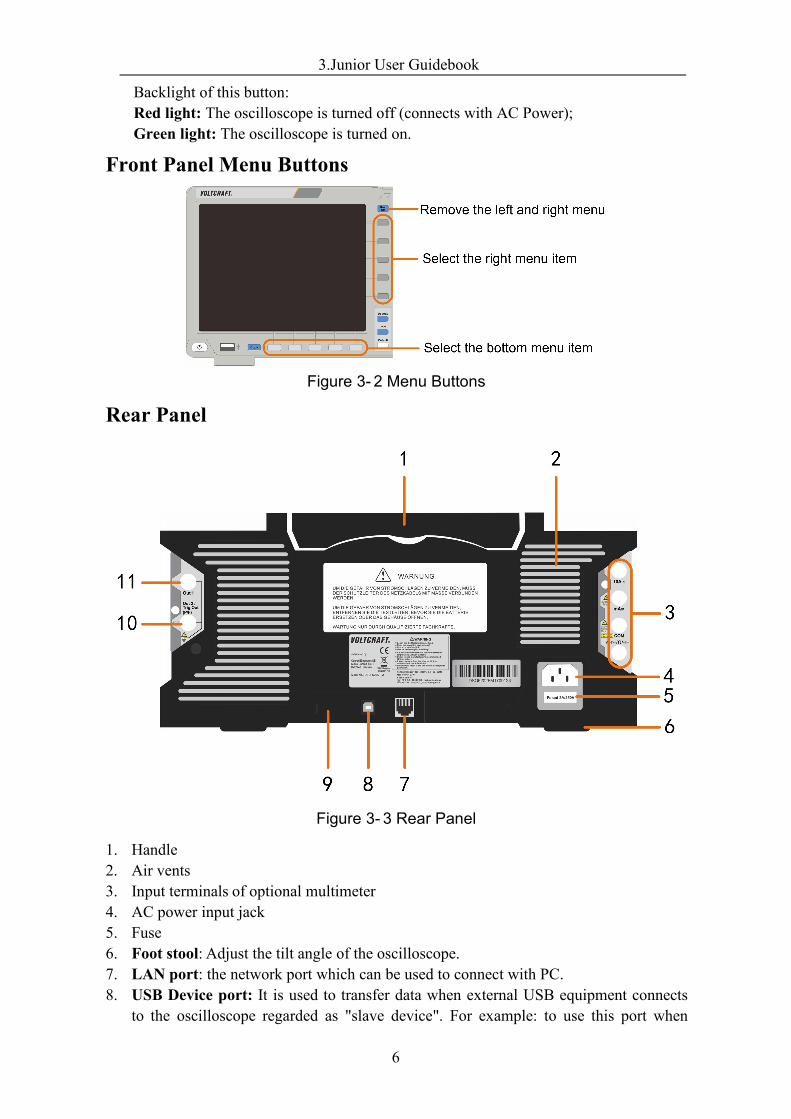
Front Panel Menu Buttons
Figure 3- 2 Menu Buttons
Rear Panel
Figure 3- 3 Rear Panel
1. Handle2. Air vents3. Input terminals of optional multimeter4. AC power input jack5. Fuse6. Foot stool: Adjust the tilt angle of the oscilloscope.7. LAN port: the network port which can be used to connect with PC.8. USB Device port: It is used to transfer data when external USB equipment connects
to the oscilloscope regarded as "slave device". For example: to use this port when
3.Junior User Guidebook
7
connect PC to the oscilloscope by USB.9. Lock Hole: You can lock the oscilloscope to a fixed location using the security lock
(please buy it yourself) to secure the oscilloscope.10. Trig Out(P/F) port: Trigger signal output or Pass/Fail output, also can be used as the
port of CH2 Output of optional dual-channel waveform generator. The output type canbe set on the menu (Utility menu→Output→Output).
11. Out 1 port: CH1 Output of optional dual-channel waveform generator.
Control Area
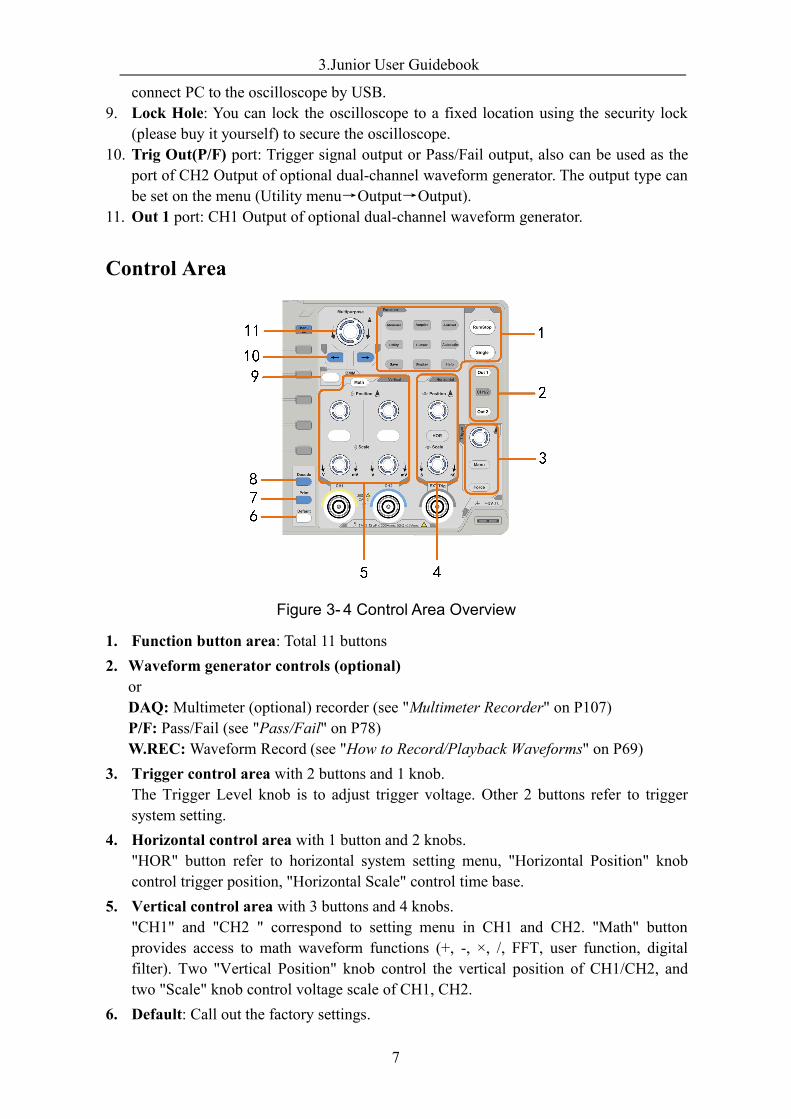
Figure 3- 4 Control Area Overview
1. Function button area: Total 11 buttons2. Waveform generator controls (optional)
orDAQ:Multimeter (optional) recorder (see "Multimeter Recorder" on P107)P/F: Pass/Fail (see "Pass/Fail" on P78)W.REC:Waveform Record (see "How to Record/Playback Waveforms" on P69)
3. Trigger control area with 2 buttons and 1 knob.The Trigger Level knob is to adjust trigger voltage. Other 2 buttons refer to triggersystem setting.
4. Horizontal control area with 1 button and 2 knobs."HOR" button refer to horizontal system setting menu, "Horizontal Position" knobcontrol trigger position, "Horizontal Scale" control time base.
5. Vertical control area with 3 buttons and 4 knobs."CH1" and "CH2 " correspond to setting menu in CH1 and CH2. "Math" buttonprovides access to math waveform functions (+, -, ×, /, FFT, user function, digitalfilter). Two "Vertical Position" knob control the vertical position of CH1/CH2, andtwo "Scale" knob control voltage scale of CH1, CH2.
6. Default: Call out the factory settings.
3.Junior User Guidebook
8
7. Print: Print an image of what appears on the instrument screen.8. Decode: Turn on/off Decode function.9. DMM (optional Digital Multimeter) or Snapshot (Shortcut button for measurement
snapshot)10. Direction key:Move the cursor of the focused parameter.11. M knob (Multipurpose knob): when a symbol appears on the menu, it indicates
you can turn the M knob to select the menu or set the value. You can push it to closethe menu on the left and right.
User Interface Introduction
Figure 3- 5 Illustrative Drawing of Display Interfaces
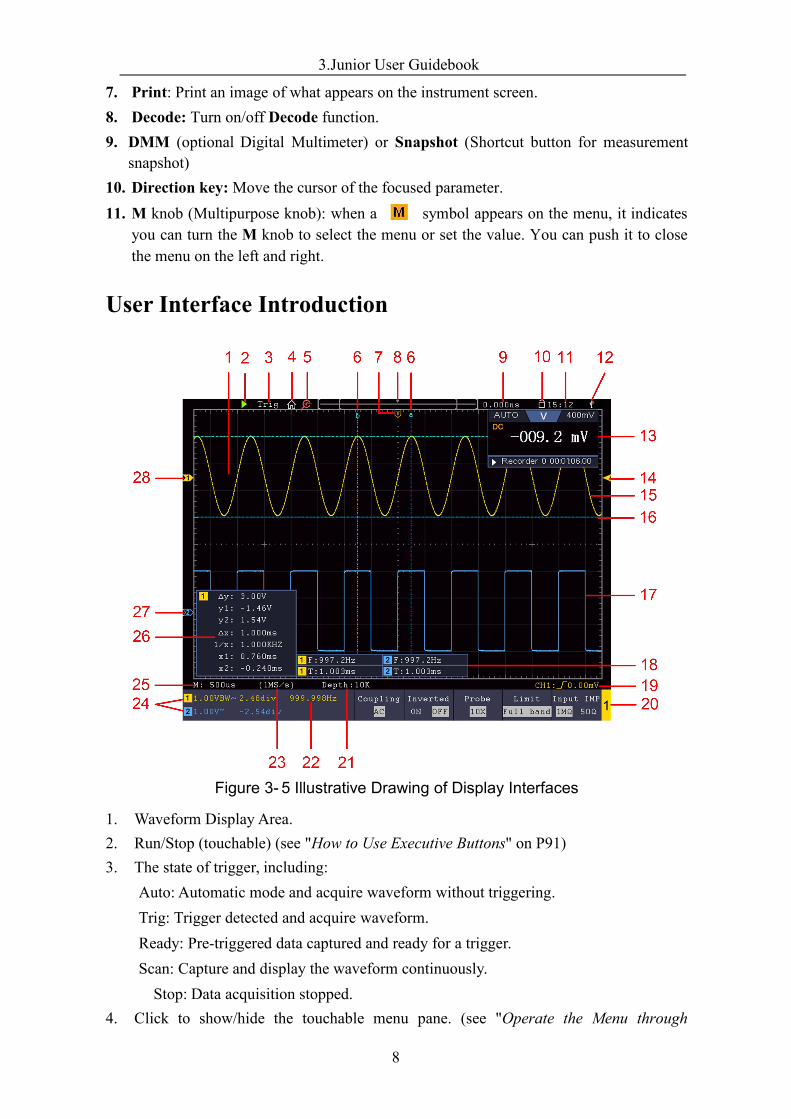
1. Waveform Display Area.2. Run/Stop (touchable) (see "How to Use Executive Buttons" on P91)3. The state of trigger, including:
Auto: Automatic mode and acquire waveform without triggering.Trig: Trigger detected and acquire waveform.Ready: Pre-triggered data captured and ready for a trigger.Scan: Capture and display the waveform continuously.Stop: Data acquisition stopped.
4. Click to show/hide the touchable menu pane. (see "Operate the Menu through
3.Junior User Guidebook
9
Touchscreen" on P17)5. Turn on/off the magnifier function.6. The two blue dotted lines indicates the vertical position of cursor measurement.7. The T pointer indicates the horizontal position for the trigger.8. The pointer indicates the trigger position in the record length.9. It shows present triggering value and displays the site of present window in internal
memory.10. Touchable icon is to enable ( ) or disable ( ) the touchscreen controls.11. It shows setting time (see "Config" on P77).12. It indicates that there is a USB disk connecting with the oscilloscope.13. Multimeter window.14. The pointer shows the trigger level position.15. The waveform of CH1.16. The two blue dotted lines indicate the horizontal position of cursor measurement.17. The waveform of CH2.18. It indicates the measured type and value of the corresponding channel. "T" means
period, "F" means frequency, "V" means the average value, "Vp" the peak-peak value,"Vr" the root-mean-square value, "Ma" the maximum amplitude value, "Mi" theminimum amplitude value, "Vt" the Voltage value of the waveform's flat top value,"Vb" the Voltage value of the waveform's flat base, "Va" the amplitude value, "Os"the overshoot value, "Ps" the Preshoot value, "RT" the rise time value, "FT" the falltime value, "PW" the +width value, "NW" the -Width value, "+D" the +Duty value,"-D" the -Duty value, "PD" the Delay A->B value, "ND" the Delay A->B value,"TR" the Cycle RMS, "CR" the Cursor RMS, "WP" the Screen Duty, "RP" the Phase,"+PC" the +Pulse count, "-PC" the - Pulse count, "+E" the Rise edge count, "-E" theFall edge count, "AR" the Area, "CA" the Cycle area.
19. The icon shows the selected trigger type, e.g. represents triggering on the risingedge for an Edge trigger. The reading shows the trigger level value of thecorresponding channel.
20. Channel identifier of current bottom menu.21. The readings show the record length.22. The frequency of the trigger signal.23. The readings show current sample rate.24. The readings indicate the corresponding Voltage Division and the Zero Point positions
of the channels. "BW" indicates bandwidth limit.The icon shows the coupling mode of the channel.
"—" indicates direct current coupling
"~" indicates AC coupling" " indicates GND coupling
25. The reading shows the setting of main time base.26. It is cursor measure window, showing the absolute values and the readings of the
3.Junior User Guidebook
10
cursors.27. The blue pointer indicates the grounding datum point (zero point position) of the
waveform of the CH2 channel. If the pointer is not displayed, it means that thischannel is not opened.
28. The yellow pointer indicates the grounding datum point (zero point position) of thewaveform of the CH1 channel. If the pointer is not displayed, it means that thechannel is not opened.
How to Implement the General Inspection
After you get a new oscilloscope, it is recommended that you should make a check on theinstrument according to the following steps:
1. Check whether there is any damage caused by transportation.
If it is found that the packaging carton or the foamed plastic protection cushion hassuffered serious damage, do not throw it away first till the complete device and itsaccessories succeed in the electrical and mechanical property tests.
2. Check the Accessories
The supplied accessories have been already described in the "Appendix A: Enclosure"of this Manual. You can check whether there is any loss of accessories with referenceto this description. If it is found that there is any accessory lost or damaged, please getin touch with our distributor responsible for this service or our local offices.
3. Check the Complete Instrument
If it is found that there is damage to the appearance of the instrument, or theinstrument can not work normally, or fails in the performance test, please get in touchwith our distributor responsible for this business or our local offices. If there isdamage to the instrument caused by the transportation, please keep the package. Withthe transportation department or our distributor responsible for this business informedabout it, a repairing or replacement of the instrument will be arranged by us.
How to Implement the Function Inspection
Make a fast function check to verify the normal operation of the instrument, according tothe following steps:
1. Connect the power cord to a power source. Long press the button on thebottom left of the instrument.
The instrument carries out all self-check items and shows the Boot Logo. Push theUtility button, select Function in the bottom menu. Select Adjust in the left menu,select Default in the bottom menu. The default attenuation coefficient set value of theprobe in the menu is 10X.
3.Junior User Guidebook
11
2. Set the Switch in the Oscilloscope Probe as 10X and Connect the Oscilloscopewith CH1 Channel.
Align the slot in the probe with the plug in the CH1 connector BNC, and then tightenthe probe with rotating it to the right side.
Connect the probe tip and the ground clamp to the connector of the probecompensator.
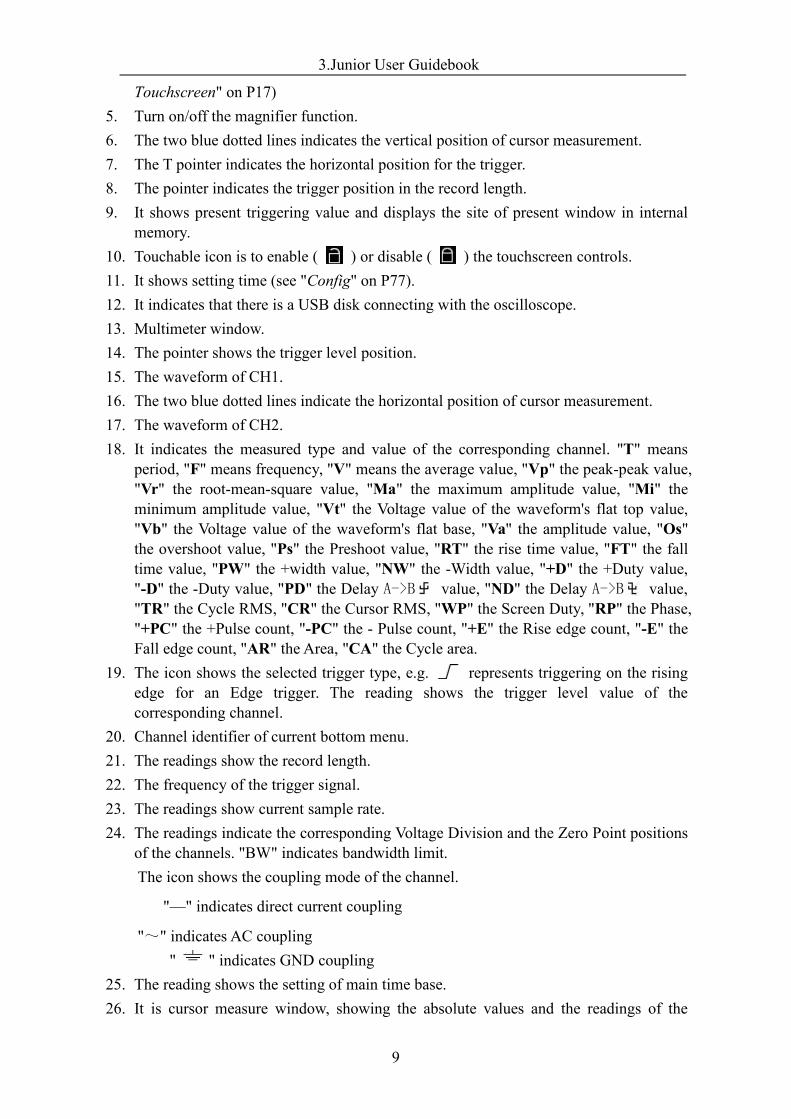
3. Push the Autoset Button on the front panel.
The square wave of 1 KHz frequency and 5V peak-peak value will be displayed inseveral seconds (see Figure 3- 6).
Figure 3- 6 Auto set
Check CH2 by repeating Step 2 and Step 3.
How to Implement the Probe Compensation
When connect the probe with any input channel for the first time, make this adjustment tomatch the probe with the input channel. The probe which is not compensated or presents acompensation deviation will result in the measuring error or mistake. For adjusting theprobe compensation, please carry out the following steps:
1. Set the attenuation coefficient of the probe in the menu as 10X and that of the switchin the probe as 10X (see "How to Set the Probe Attenuation Coefficient" on P12), andconnect the probe with the CH1 channel. If a probe hook tip is used, ensure that itkeeps in close touch with the probe. Connect the probe tip with the signal connectorof the probe compensator and connect the reference wire clamp with the ground wireconnector of the probe connector, and then push the Autoset button on the frontpanel.
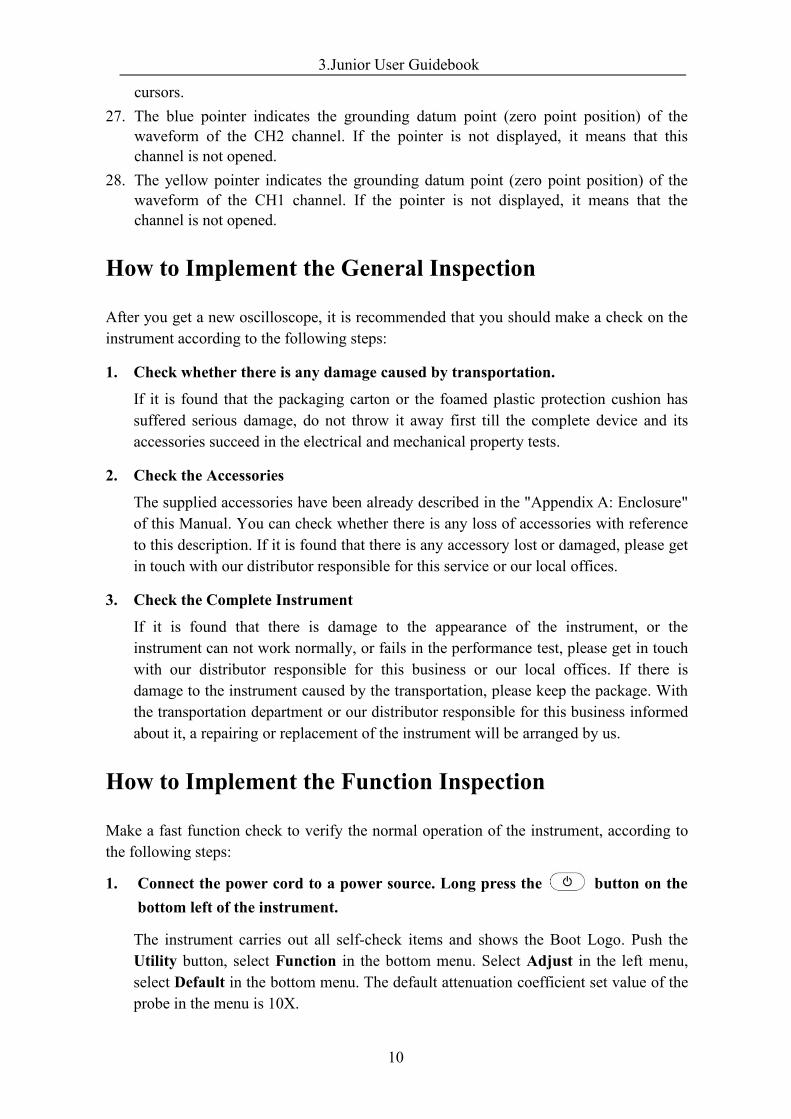
2. Check the displayed waveforms and regulate the probe till a correct compensation is
3.Junior User Guidebook
12
achieved (see Figure 3- 7 and Figure 3- 8).
Overcompensated Compensated correctly Under compensatedFigure 3- 7 Displayed Waveforms of the Probe Compensation
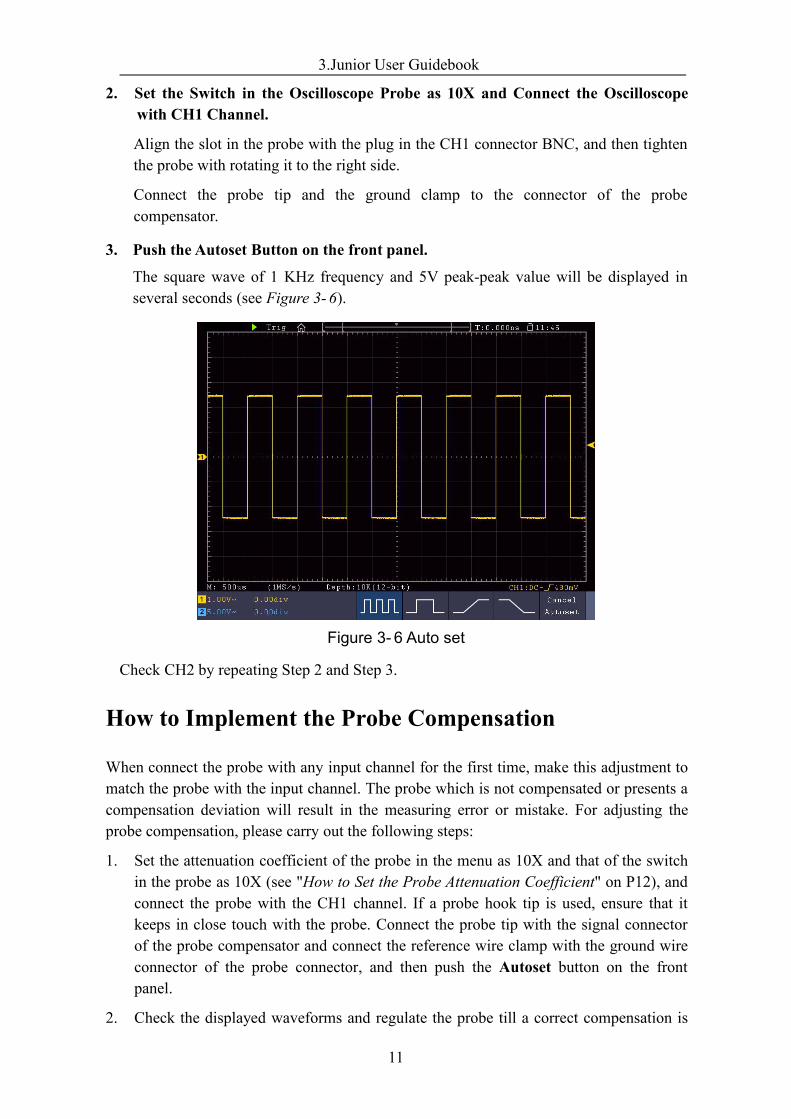
3. Repeat the steps mentioned if needed.
Figure 3- 8 Adjust Probe
How to Set the Probe Attenuation Coefficient
The probe has several attenuation coefficients, which will influence the vertical scalefactor of the oscilloscope.
To change or check the probe attenuation coefficient in the menu of oscilloscope:
(1) Push the function menu button of the used channels (CH1 or CH2 button).
(2) Select Probe in the bottom menu; select Attenu in the right menu, turn theM knob toselect the proper value corresponding to the probe.
This setting will be valid all the time before it is changed again.
Caution:
The default attenuation coefficient of the probe on the instrument is preset to10X.Make sure that the set value of the attenuation switch in the probe is thesame as the menu selection of the probe attenuation coefficient in theoscilloscope.
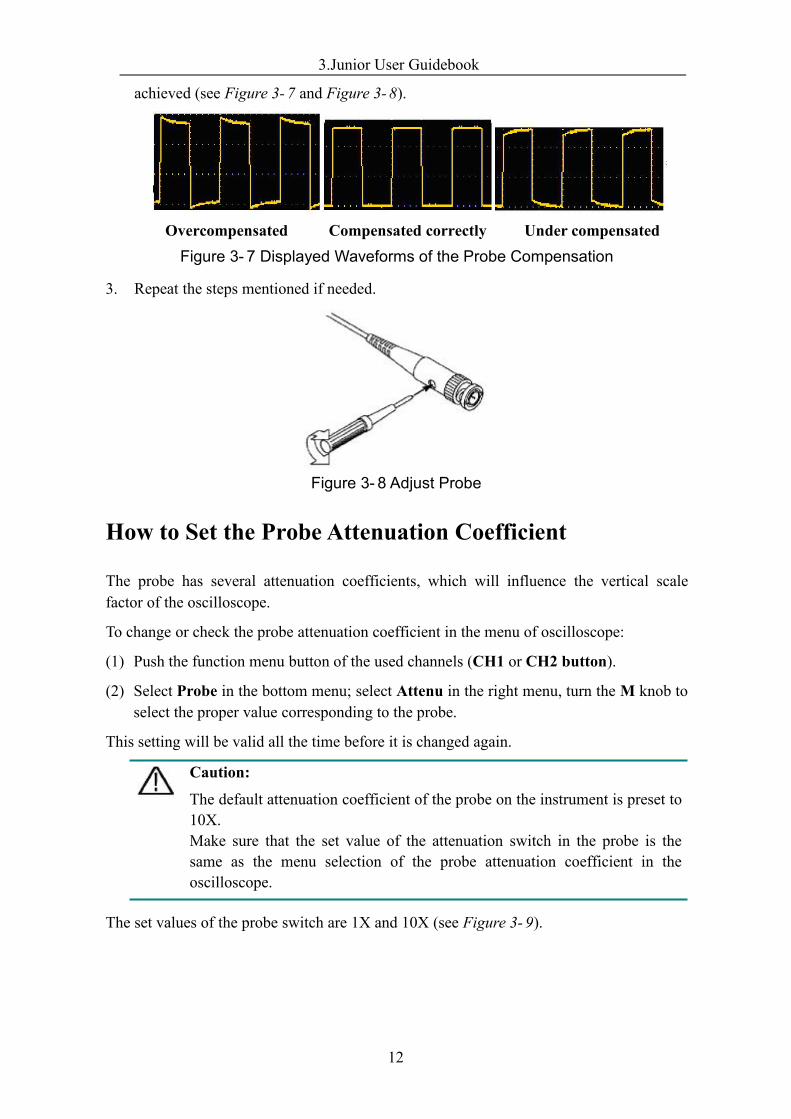
The set values of the probe switch are 1X and 10X (see Figure 3- 9).
3.Junior User Guidebook
13
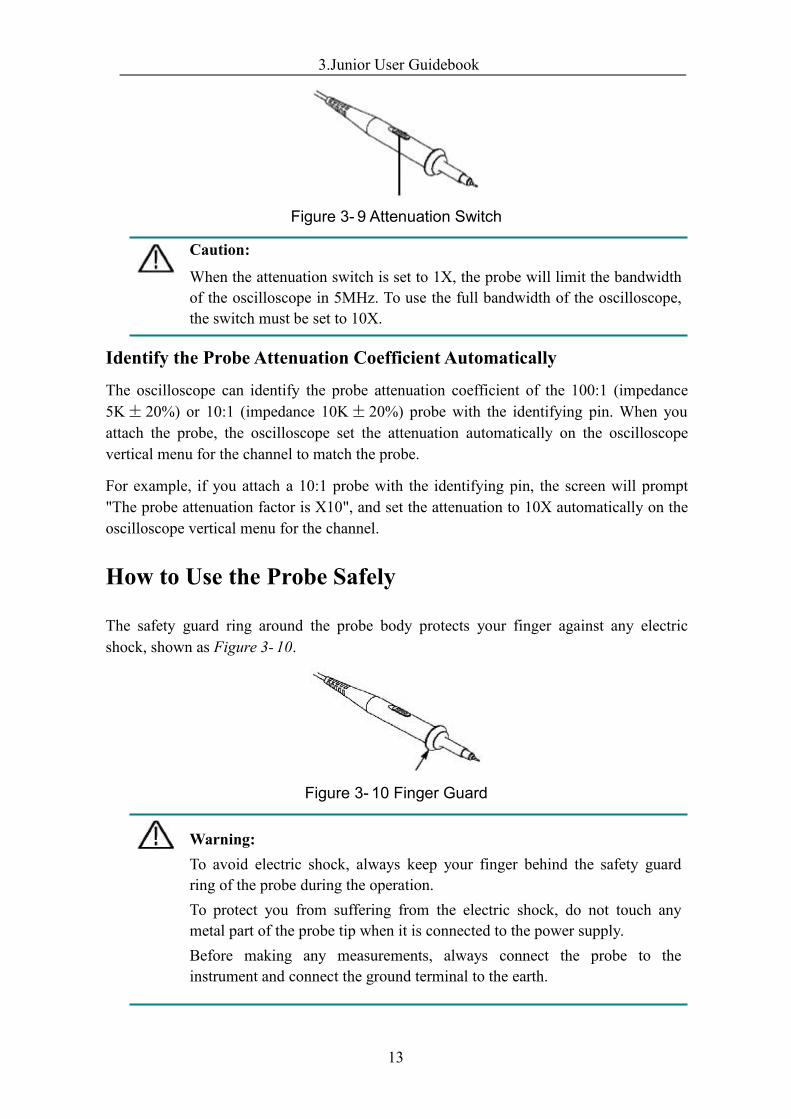
Figure 3- 9 Attenuation Switch
Caution:
When the attenuation switch is set to 1X, the probe will limit the bandwidthof the oscilloscope in 5MHz. To use the full bandwidth of the oscilloscope,the switch must be set to 10X.
Identify the Probe Attenuation Coefficient Automatically
The oscilloscope can identify the probe attenuation coefficient of the 100:1 (impedance5K±20%) or 10:1 (impedance 10K±20%) probe with the identifying pin. When youattach the probe, the oscilloscope set the attenuation automatically on the oscilloscopevertical menu for the channel to match the probe.
For example, if you attach a 10:1 probe with the identifying pin, the screen will prompt"The probe attenuation factor is X10", and set the attenuation to 10X automatically on theoscilloscope vertical menu for the channel.
How to Use the Probe Safely
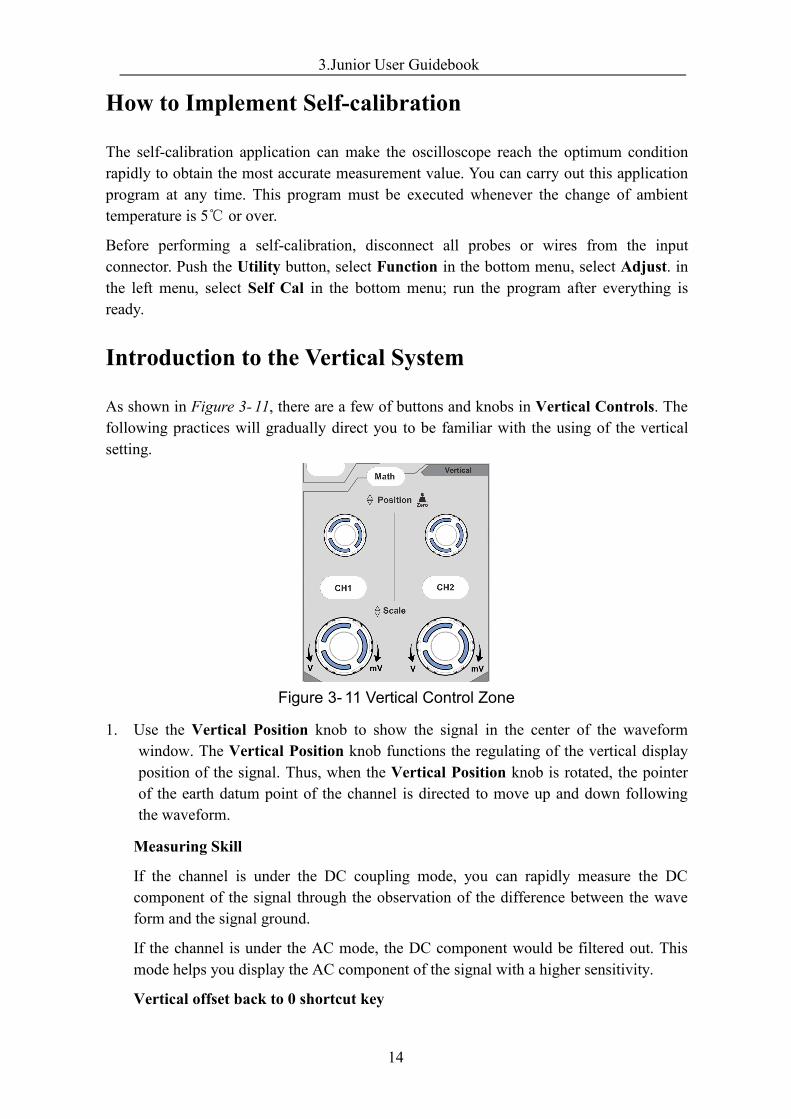
The safety guard ring around the probe body protects your finger against any electricshock, shown as Figure 3- 10.
Figure 3- 10 Finger Guard
Warning:To avoid electric shock, always keep your finger behind the safety guardring of the probe during the operation.To protect you from suffering from the electric shock, do not touch anymetal part of the probe tip when it is connected to the power supply.Before making any measurements, always connect the probe to theinstrument and connect the ground terminal to the earth.
3.Junior User Guidebook
14
How to Implement Self-calibration
The self-calibration application can make the oscilloscope reach the optimum conditionrapidly to obtain the most accurate measurement value. You can carry out this applicationprogram at any time. This program must be executed whenever the change of ambienttemperature is 5℃ or over.
Before performing a self-calibration, disconnect all probes or wires from the inputconnector. Push the Utility button, select Function in the bottom menu, select Adjust. inthe left menu, select Self Cal in the bottom menu; run the program after everything isready.
Introduction to the Vertical System
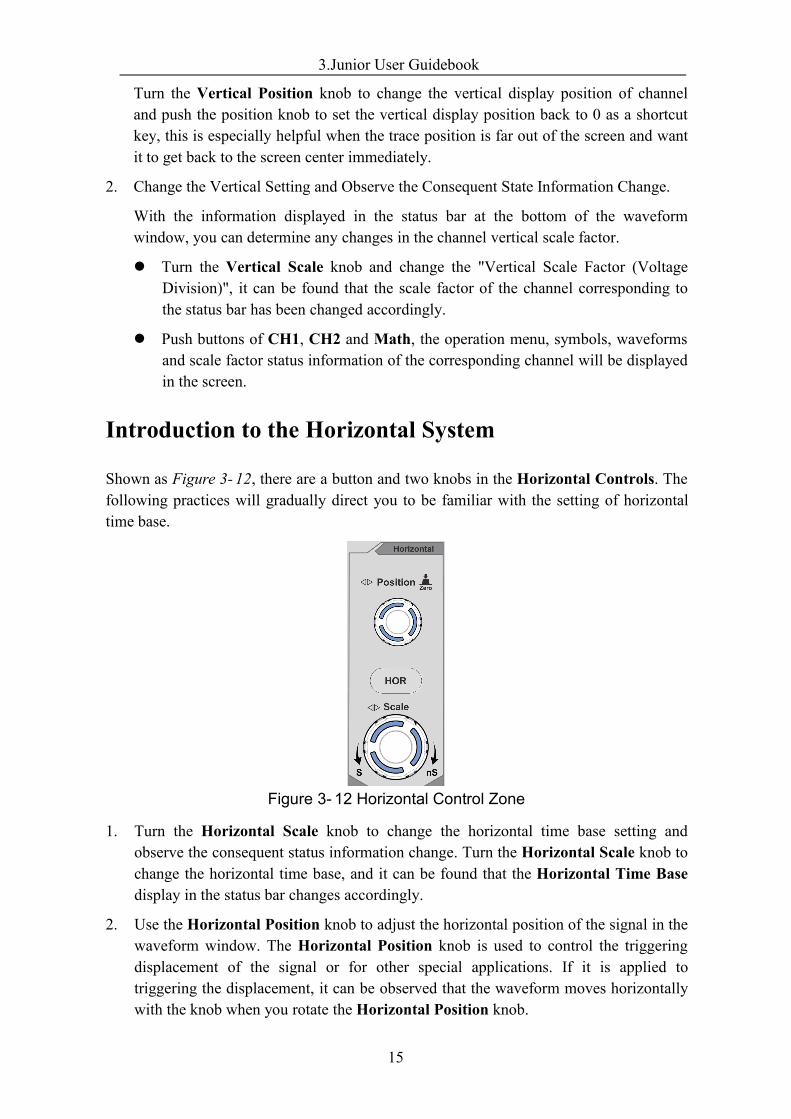
As shown in Figure 3- 11, there are a few of buttons and knobs in Vertical Controls. Thefollowing practices will gradually direct you to be familiar with the using of the verticalsetting.
Figure 3- 11 Vertical Control Zone
1. Use the Vertical Position knob to show the signal in the center of the waveformwindow. The Vertical Position knob functions the regulating of the vertical displayposition of the signal. Thus, when the Vertical Position knob is rotated, the pointerof the earth datum point of the channel is directed to move up and down followingthe waveform.
Measuring Skill
If the channel is under the DC coupling mode, you can rapidly measure the DCcomponent of the signal through the observation of the difference between the waveform and the signal ground.
If the channel is under the AC mode, the DC component would be filtered out. Thismode helps you display the AC component of the signal with a higher sensitivity.
Vertical offset back to 0 shortcut key
3.Junior User Guidebook
15
Turn the Vertical Position knob to change the vertical display position of channeland push the position knob to set the vertical display position back to 0 as a shortcutkey, this is especially helpful when the trace position is far out of the screen and wantit to get back to the screen center immediately.
2. Change the Vertical Setting and Observe the Consequent State Information Change.
With the information displayed in the status bar at the bottom of the waveformwindow, you can determine any changes in the channel vertical scale factor.
Turn the Vertical Scale knob and change the "Vertical Scale Factor (VoltageDivision)", it can be found that the scale factor of the channel corresponding tothe status bar has been changed accordingly.
Push buttons of CH1, CH2 and Math, the operation menu, symbols, waveformsand scale factor status information of the corresponding channel will be displayedin the screen.
Introduction to the Horizontal System
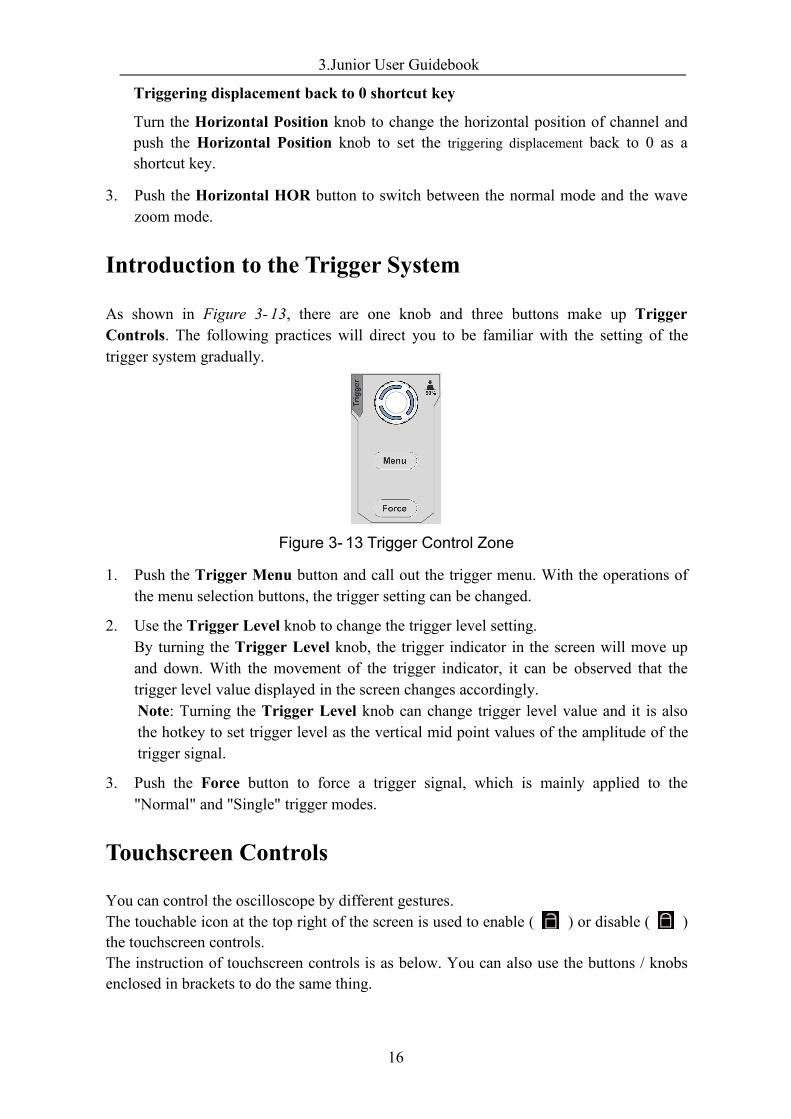
Shown as Figure 3- 12, there are a button and two knobs in the Horizontal Controls. Thefollowing practices will gradually direct you to be familiar with the setting of horizontaltime base.
Figure 3- 12 Horizontal Control Zone
1. Turn the Horizontal Scale knob to change the horizontal time base setting andobserve the consequent status information change. Turn the Horizontal Scale knob tochange the horizontal time base, and it can be found that the Horizontal Time Basedisplay in the status bar changes accordingly.
2. Use the Horizontal Position knob to adjust the horizontal position of the signal in thewaveform window. The Horizontal Position knob is used to control the triggeringdisplacement of the signal or for other special applications. If it is applied totriggering the displacement, it can be observed that the waveform moves horizontallywith the knob when you rotate the Horizontal Position knob.
3.Junior User Guidebook
16
Triggering displacement back to 0 shortcut key
Turn the Horizontal Position knob to change the horizontal position of channel andpush the Horizontal Position knob to set the triggering displacement back to 0 as ashortcut key.
3. Push the Horizontal HOR button to switch between the normal mode and the wavezoom mode.
Introduction to the Trigger System
As shown in Figure 3- 13, there are one knob and three buttons make up TriggerControls. The following practices will direct you to be familiar with the setting of thetrigger system gradually.
Figure 3- 13 Trigger Control Zone
1. Push the Trigger Menu button and call out the trigger menu. With the operations ofthe menu selection buttons, the trigger setting can be changed.
2. Use the Trigger Level knob to change the trigger level setting.By turning the Trigger Level knob, the trigger indicator in the screen will move upand down. With the movement of the trigger indicator, it can be observed that thetrigger level value displayed in the screen changes accordingly.Note: Turning the Trigger Level knob can change trigger level value and it is alsothe hotkey to set trigger level as the vertical mid point values of the amplitude of thetrigger signal.
3. Push the Force button to force a trigger signal, which is mainly applied to the"Normal" and "Single" trigger modes.
Touchscreen Controls
You can control the oscilloscope by different gestures.The touchable icon at the top right of the screen is used to enable ( ) or disable ( )the touchscreen controls.The instruction of touchscreen controls is as below. You can also use the buttons / knobsenclosed in brackets to do the same thing.
3.Junior User Guidebook
17
Operate the Menu through Touchscreen Select a menu item: Touch the menu items in the bottom menu, or in the right menu,
or in the left menu.
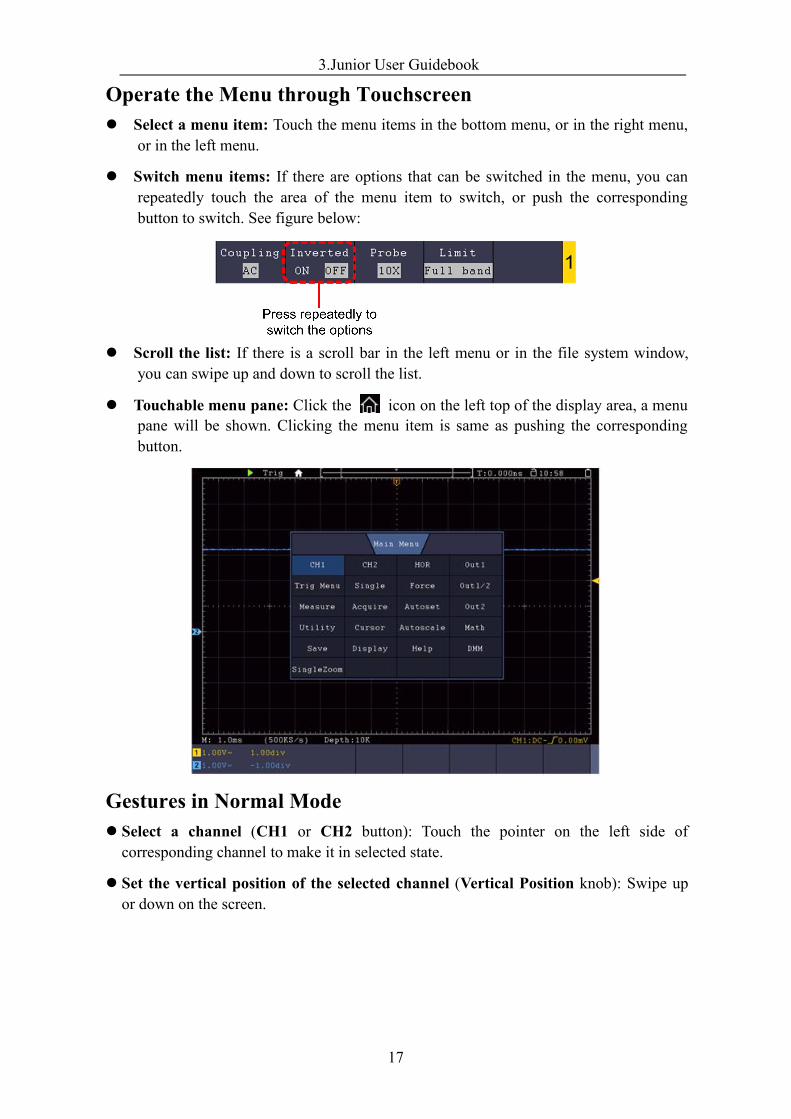
Switch menu items: If there are options that can be switched in the menu, you canrepeatedly touch the area of the menu item to switch, or push the correspondingbutton to switch. See figure below:
Scroll the list: If there is a scroll bar in the left menu or in the file system window,you can swipe up and down to scroll the list.
Touchable menu pane: Click the icon on the left top of the display area, a menupane will be shown. Clicking the menu item is same as pushing the correspondingbutton.
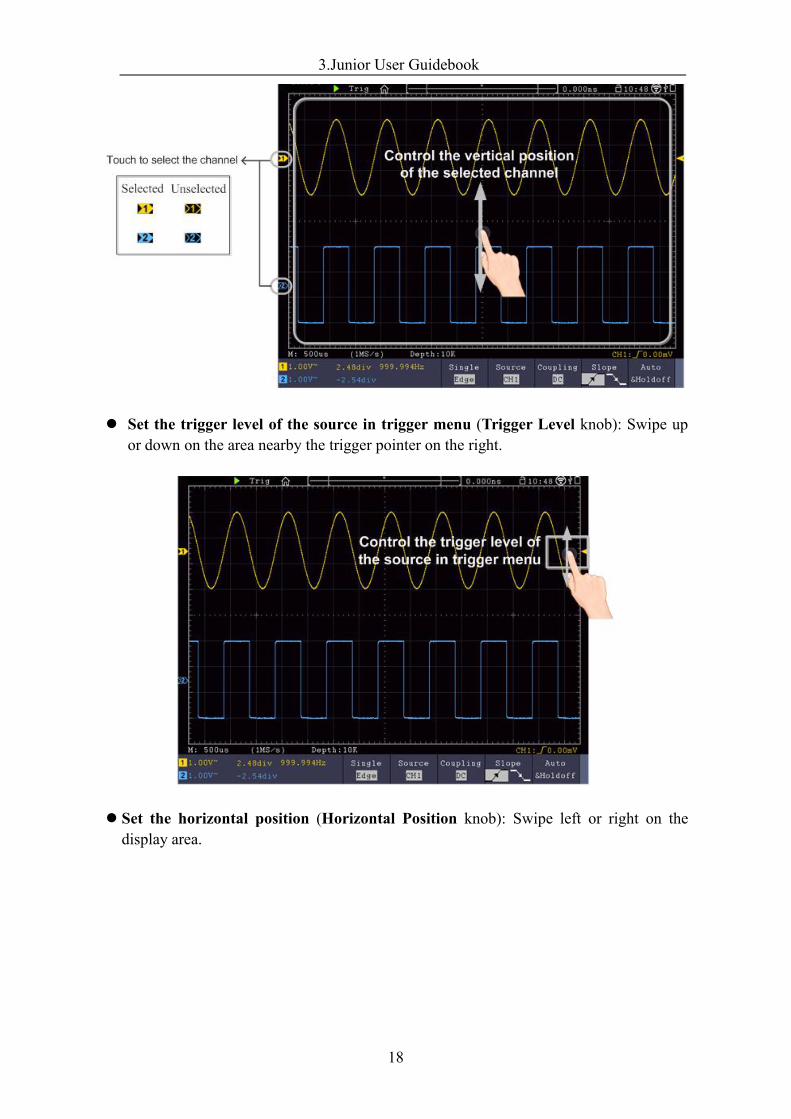
Gestures in Normal Mode Select a channel (CH1 or CH2 button): Touch the pointer on the left side ofcorresponding channel to make it in selected state.
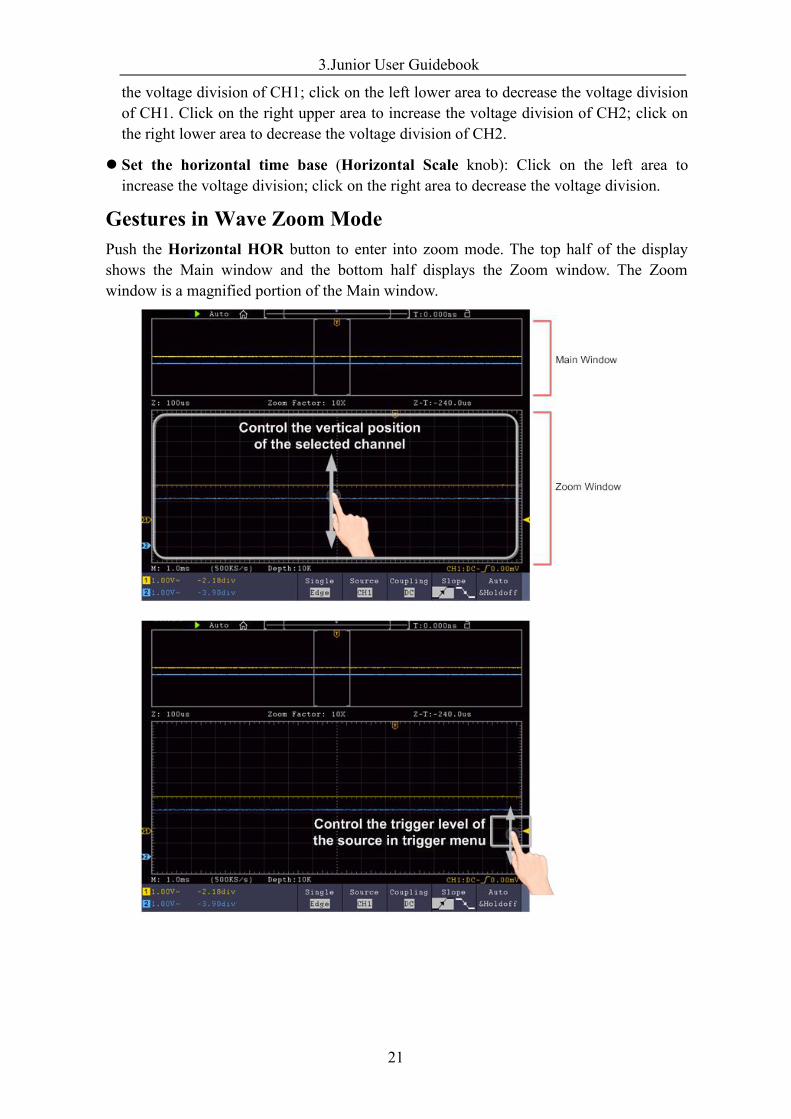
Set the vertical position of the selected channel (Vertical Position knob): Swipe upor down on the screen.
3.Junior User Guidebook
18
Set the trigger level of the source in trigger menu (Trigger Level knob): Swipe upor down on the area nearby the trigger pointer on the right.
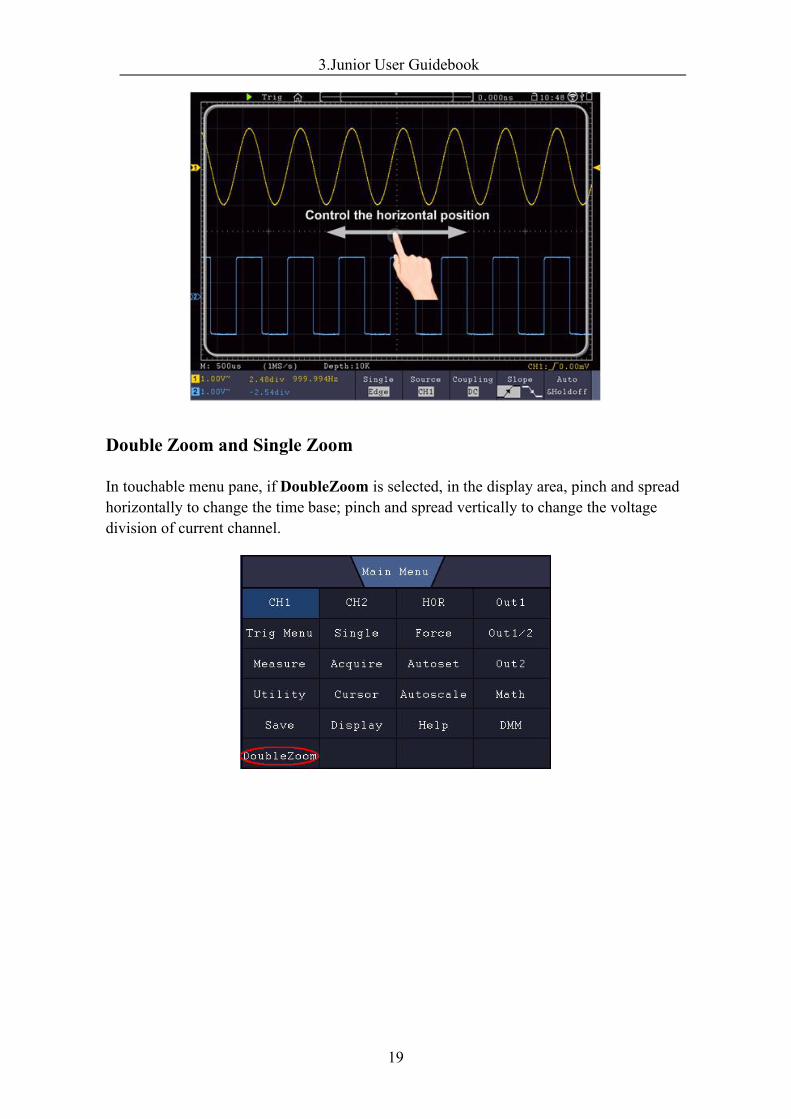
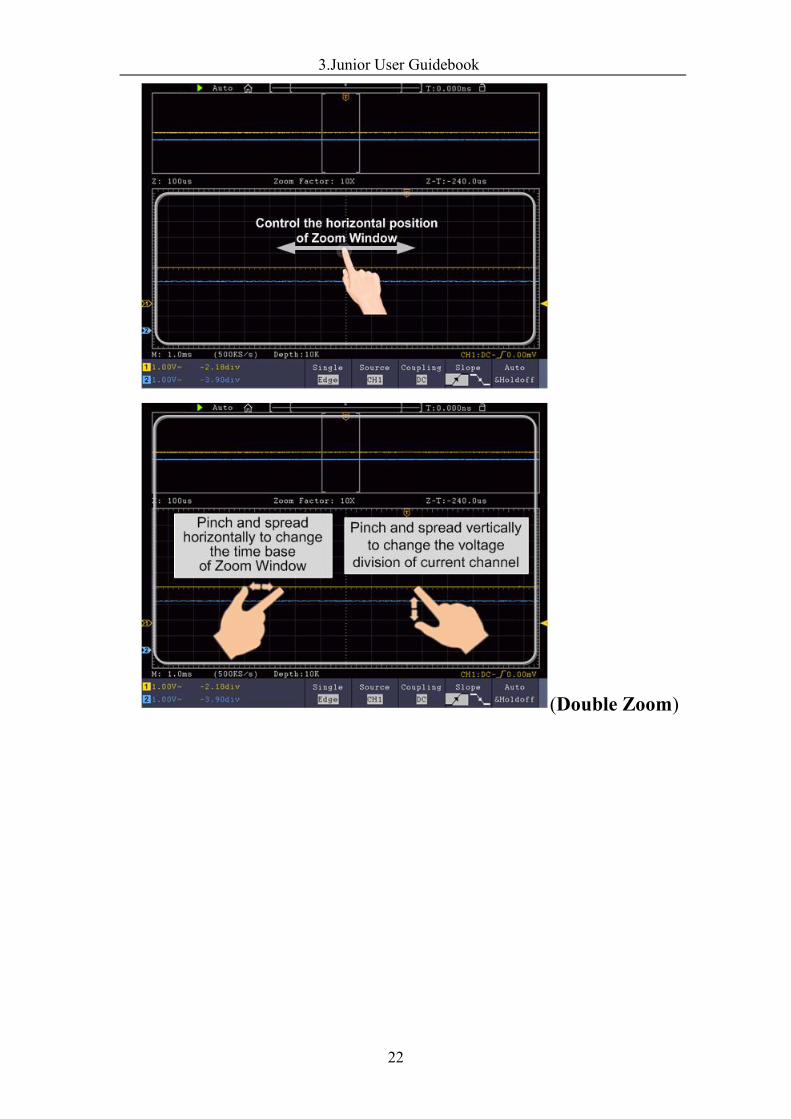
Set the horizontal position (Horizontal Position knob): Swipe left or right on thedisplay area.
3.Junior User Guidebook
19
Double Zoom and Single Zoom
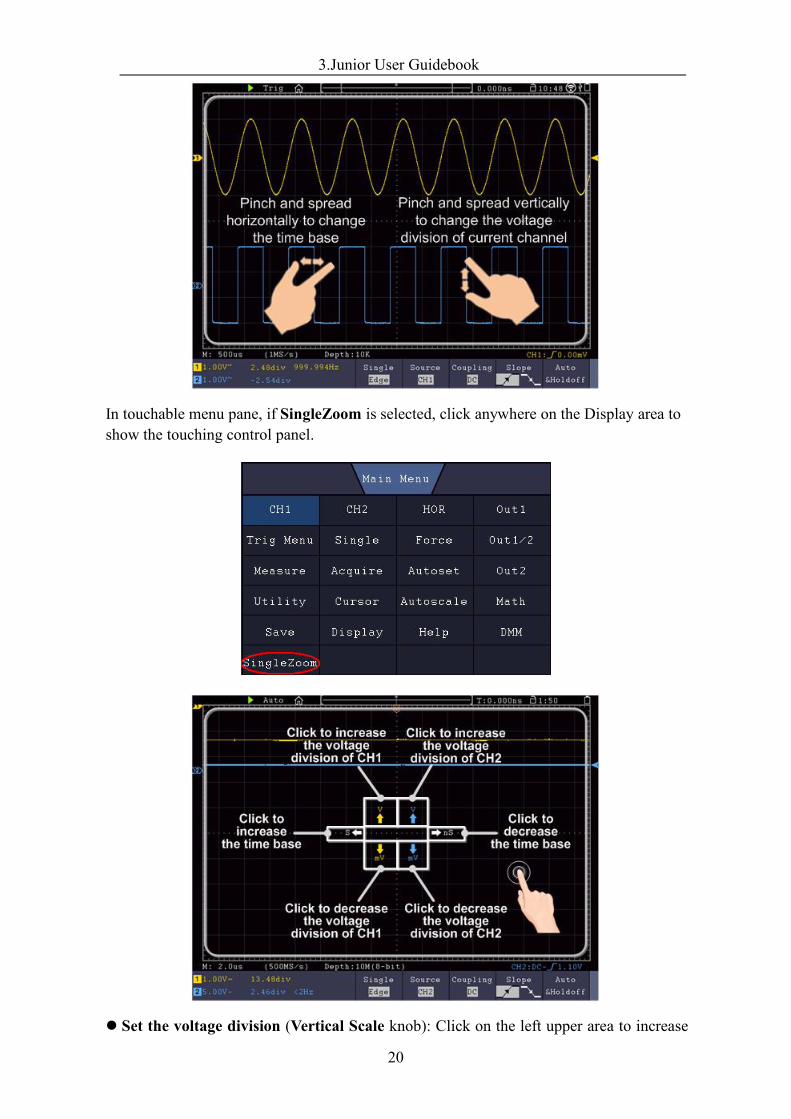
In touchable menu pane, if DoubleZoom is selected, in the display area, pinch and spreadhorizontally to change the time base; pinch and spread vertically to change the voltagedivision of current channel.
3.Junior User Guidebook
20
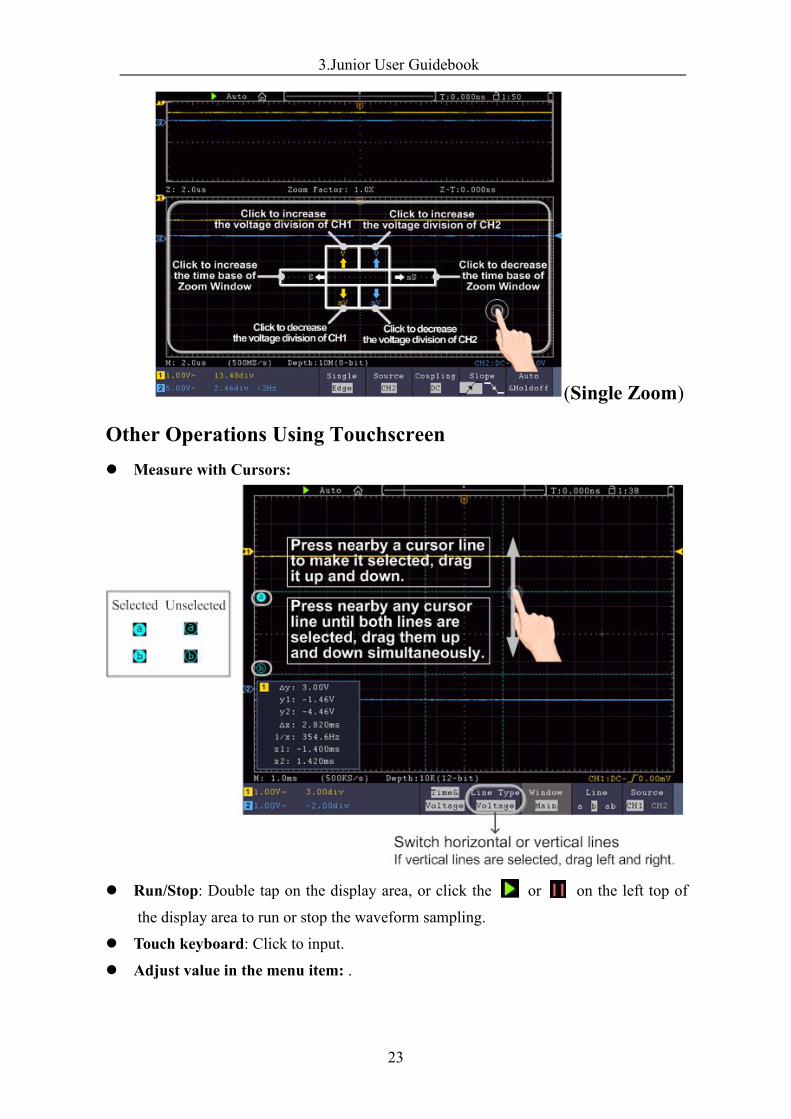
In touchable menu pane, if SingleZoom is selected, click anywhere on the Display area toshow the touching control panel.
Set the voltage division (Vertical Scale knob): Click on the left upper area to increase
3.Junior User Guidebook
21
the voltage division of CH1; click on the left lower area to decrease the voltage divisionof CH1. Click on the right upper area to increase the voltage division of CH2; click onthe right lower area to decrease the voltage division of CH2.
Set the horizontal time base (Horizontal Scale knob): Click on the left area toincrease the voltage division; click on the right area to decrease the voltage division.
Gestures in Wave Zoom ModePush the Horizontal HOR button to enter into zoom mode. The top half of the displayshows the Main window and the bottom half displays the Zoom window. The Zoomwindow is a magnified portion of the Main window.
3.Junior User Guidebook
22
(Double Zoom)
3.Junior User Guidebook
23
(Single Zoom)
Other Operations Using Touchscreen Measure with Cursors:
Run/Stop: Double tap on the display area, or click the or on the left top of
the display area to run or stop the waveform sampling.
Touch keyboard: Click to input.
Adjust value in the menu item: .
3.Junior User Guidebook
24
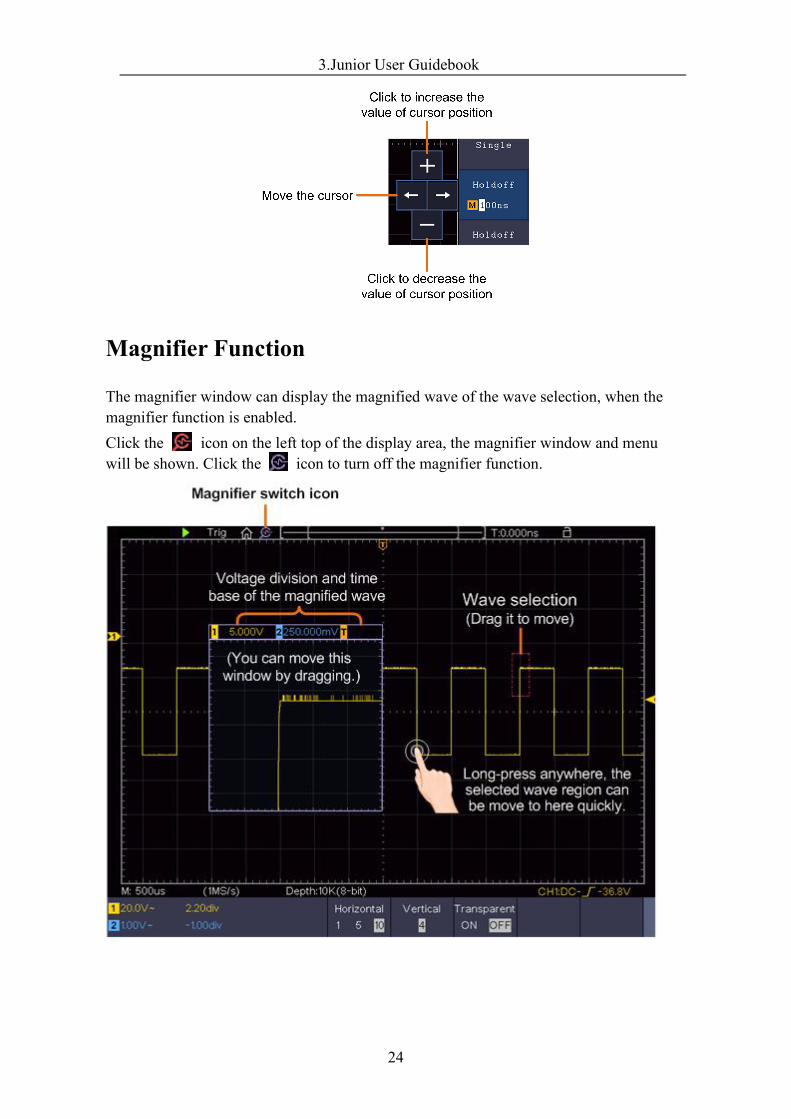
Magnifier Function
The magnifier window can display the magnified wave of the wave selection, when themagnifier function is enabled.Click the icon on the left top of the display area, the magnifier window and menuwill be shown. Click the icon to turn off the magnifier function.
3.Junior User Guidebook
25
The description of theMagnifier menu is shown as follows:
Function Menu Setting Description
Horizontal1510
Horizontal magnification factor. The size ofthe magnifier window is fixed. Therefor, thegreater this value, the shorter the horizontallength of the wave selection.
Vertical
12481632
Vertical magnification factor. The size of themagnifier window is fixed. Therefor, thegreater this value, the shorter the verticalheight of the wave selection.
Transparent ONOFF
Make the magnifier window transparent ornot.
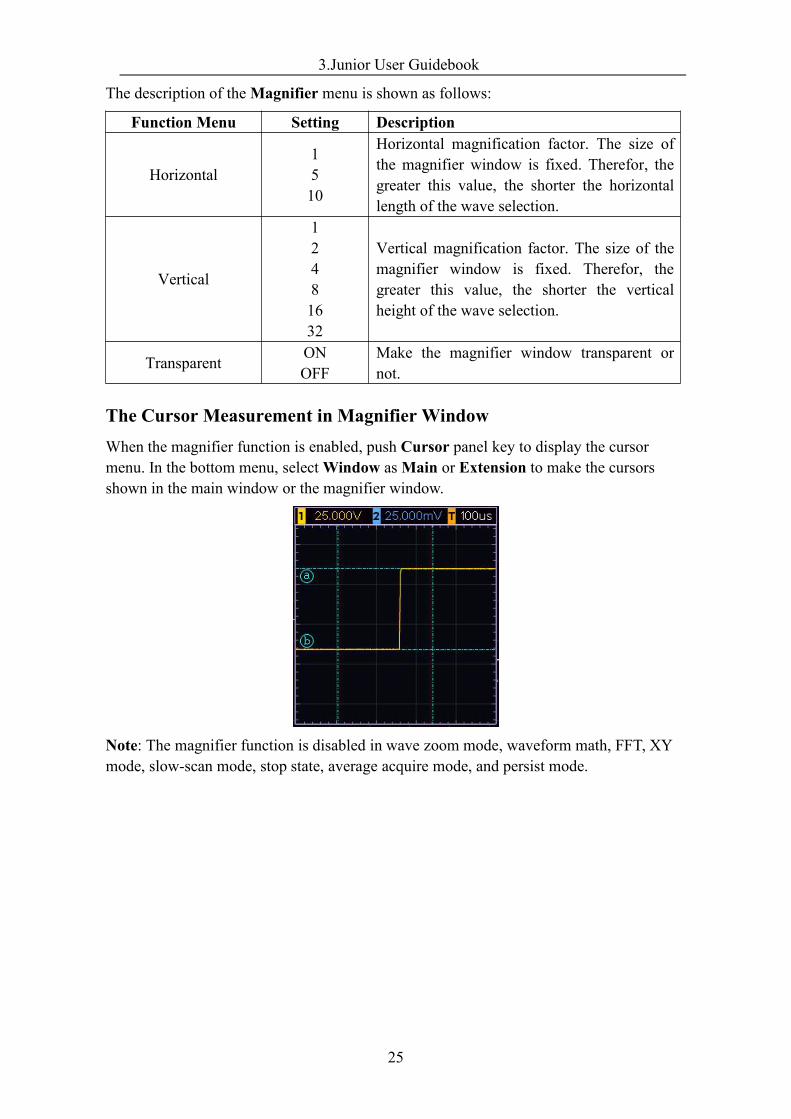
The Cursor Measurement in Magnifier WindowWhen the magnifier function is enabled, push Cursor panel key to display the cursormenu. In the bottom menu, selectWindow asMain or Extension to make the cursorsshown in the main window or the magnifier window.
Note: The magnifier function is disabled in wave zoom mode, waveform math, FFT, XYmode, slow-scan mode, stop state, average acquire mode, and persist mode.
4.Advanced User Guidebook
26
4. Advanced User GuidebookUp till now, you have already been familiar with the basic operations of the function areas,buttons and knobs in the front panel of the oscilloscope. Based the introduction of theprevious Chapter, the user should have an initial knowledge of the determination of thechange of the oscilloscope setting through observing the status bar. If you have not beenfamiliar with the above-mentioned operations and methods yet, we advise you to read thesection of Chapter 3 "Junior User Guidebook".
This chapter will deal with the following topics mainly:
How to Set the Vertical System
How to Set the Horizontal System
How to Set the Trigger/Decoding System
How to Implement the Sampling Setup
How to Set the Display System
How to Save and Recall Waveform
How to Record/Playback Waveforms
How to Clone and Recall a waveform
How to Implement the Auxiliary System Function Setting
How to Update your Instrument Firmware
How to Measure Automatically
How to Measure with Cursors
How to Use Autoscale
How to Use Built-in Help
How to Use Executive Buttons
How to Print the Screen Image
It is recommended that you read this chapter carefully to get acquainted the variousmeasurement functions and other operation methods of the oscilloscope.
4.Advanced User Guidebook
27
How to Set the Vertical System
The VERTICAL CONTROLS includes three menu buttons such as CH1, CH2 andMath, and four knobs such as Vertical Position, Vertical Scale for each channel.
Setting of CH1 and CH2
Each channel has an independent vertical menu and each item is set respectively based onthe channel.
To turn waveforms on or off (channel, math)Pushing the CH1, CH2, orMath buttons have the following effect:
• If the waveform is off, the waveform is turned on and its menu is displayed.• If the waveform is on and its menu is not displayed, its menu will be displayed.• If the waveform is on and its menu is displayed, the waveform is turned off and its menugoes away.
The description of the Channel Menu is shown as the following list:
FunctionMenu
Setting Description
CouplingDCACGROUND
Pass both AC and DC components of the input signal.Block the DC component of the input signal.Disconnect the input signal.
Inverted ONOFF
Display inverted waveform.Display original waveform.
Probe
Attenu0.001Xto1000X
Step by 1 – 2 – 5. Match this to the probe attenuationfactor to have an accurate reading of vertical scale.
MeasCurr YESNO
If you are measuring current by probing the voltagedrop across a resistor, choose YES.
A/V (mA/V)V/A (mV/A)
Turn the M knob to set the Amps/Volts ratio. Therange is 100 mA/V - 1 KA/V.Amps/Volts ratio = 1/Resistor valueVolts/Amp ratio is automatically calculated.
LimitFull band20M
Get full bandwidth.Limit the channel bandwidth to 20MHz to reducedisplay noise.
Input IMP 1MΩ50Ω
To reduce the circuit load caused by the interactionof the oscilloscope and the circuit to be tested.
1. To set channel coupling
Taking the Channel 1 for example, the measured signal is a square wave signal containing
4.Advanced User Guidebook
28
the direct current bias. The operation steps are shown as below:(1) Push the CH1 button to show the CH1 SETUP menu.(2) Select Coupling in the bottom menu.(3) Select DC in the right menu. Both DC and AC components of the signal are passed.(4) Select AC in the right menu. The direct current component of the signal is blocked.
2. To adjust the probe attenuation
For correct measurements, the attenuation coefficient settings in the operating menu of theChannel should always match what is on the probe (see "How to Set the Probe AttenuationCoefficient" on P12). If the attenuation coefficient of the probe is 1:1, the menu setting ofthe input channel should be set to X1.
Take the Channel 1 as an example, the attenuation coefficient of the probe is 10:1, theoperation steps are shown as follows:
(1) Push the CH1 button to show the CH1 SETUP menu.
(2) Select Probe in the bottom menu. Select Attenu in the right menu, turn theM knob toset it as 10×.
3. To measure current by probing the voltage drop across a resistor
Take the Channel 1 as an example, if you are measuring current by probing the voltagedrop across a 1Ω resistor, the operation steps are shown as follows:
(1) Push the CH1 button to show CH1 SETUP menu.
(2) Select Probe in the bottom menu. In the right menu, set MeasCurr as YES, the A/Vradio menu will appear below. Select it; turn theM knob to set the Amps/Volts ratio.Amps/Volts ratio = 1/Resistor value. Here the A/V radio should be set to 1.
4. To invert a waveform
Waveform inverted: the displayed signal is turned 180 degrees against the phase of theearth potential.
Taking the Channel 1 for example, the operation steps are shown as follows:
(1) Push the CH1 button to show the CH1 SETUP menu.
(2) Select Inverted in the bottom menu, switch to ON. the waveform is inverted. Pushagain to switch to OFF, the waveform goes back to its original one.
5. To set bandwidth limit
When high frequency components of a waveform are not important to its analysis, thebandwidth limit control can be used to reject frequencies above 20 MHz.
Taking the Channel 1 for example, the operation steps are shown as below:
(1) Push the CH1 button to show CH1 SETUPmenu.
(2) Select Limit in the bottom menu.
(3) Select Full band in the right menu. The high frequency of the signal will be allowedto pass.
4.Advanced User Guidebook
29
(4) Select 20M in the right menu. The bandwidth is limited to 20 MHz. The frequenciesabove 20MHz will be rejected.
6. To set the input impedance
To reduce the circuit load caused by the interaction of the oscilloscope and the circuit tobe tested, you can set the input impedance.
Taking the Channel 1 for example, the operation steps are shown as below:
(1) Push the CH1 button to show CH1 SETUPmenu.
(2) Select Input IMP in the bottom menu, push to select 1MΩ or 50Ω.1MΩ: The input impedance of the oscilloscope is rather high and the current flowinginto the oscilloscope from the circuit under test can be ignored.50Ω: Match the oscilloscope with a device with 50 Ω output impedance. The maxinput voltage cannot exceed 5 Vrms.
Use Mathematical Manipulation Function
The Mathematical Manipulation function is used to show the results of the addition,multiplication, division and subtraction operations between two channels, the FFToperation for a channel, advanced math feature including Intg, Diff, Sqrt, user definedfunction, and digital filter. Press theMath button to display the menu on the bottom.
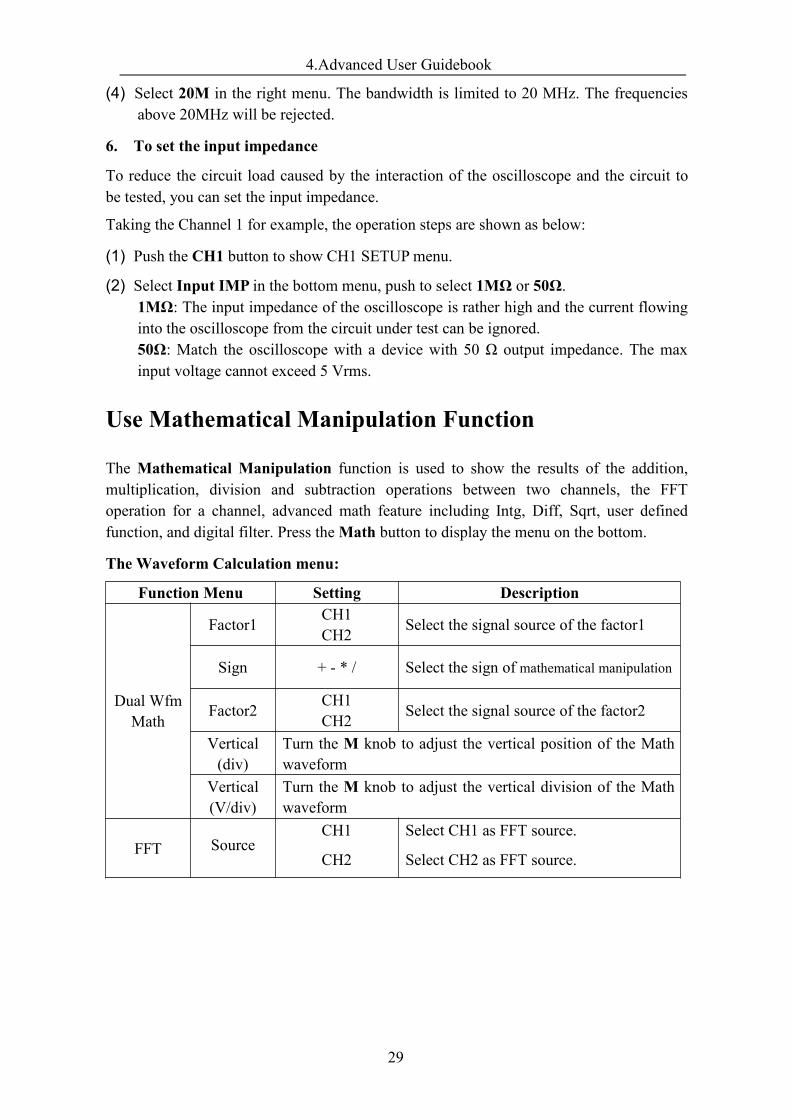
The Waveform Calculation menu:
Function Menu Setting Description
Dual WfmMath
Factor1 CH1CH2 Select the signal source of the factor1
Sign + - * / Select the sign of mathematical manipulation
Factor2 CH1CH2 Select the signal source of the factor2
Vertical(div)
Turn the M knob to adjust the vertical position of the Mathwaveform
Vertical(V/div)
Turn the M knob to adjust the vertical division of the Mathwaveform
FFT SourceCH1
CH2
Select CH1 as FFT source.
Select CH2 as FFT source.
4.Advanced User Guidebook
30
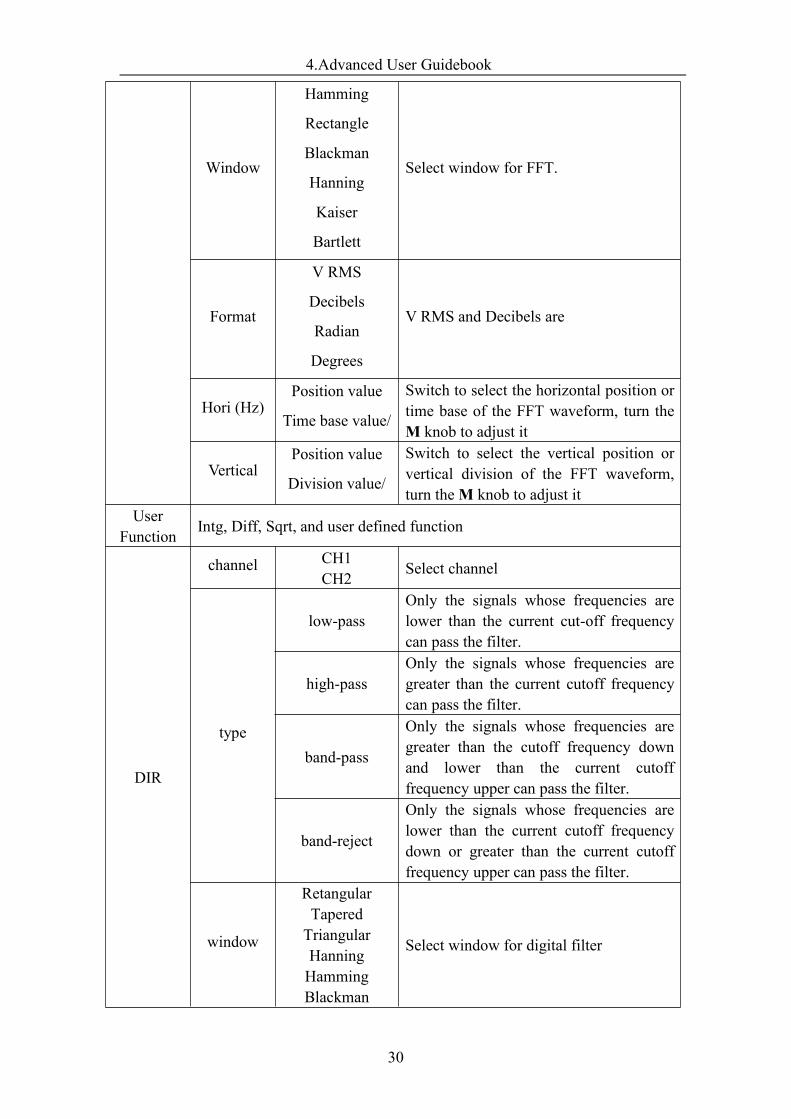
Window
Hamming
Rectangle
Blackman
Hanning
Kaiser
Bartlett
Select window for FFT.
Format
V RMS
Decibels
Radian
Degrees
V RMS and Decibels are
Hori (Hz)Position value
Time base value/
Switch to select the horizontal position ortime base of the FFT waveform, turn theM knob to adjust it
VerticalPosition value
Division value/
Switch to select the vertical position orvertical division of the FFT waveform,turn theM knob to adjust it
UserFunction Intg, Diff, Sqrt, and user defined function
DIR
channel CH1CH2 Select channel
type
low-passOnly the signals whose frequencies arelower than the current cut-off frequencycan pass the filter.
high-passOnly the signals whose frequencies aregreater than the current cutoff frequencycan pass the filter.
band-pass
Only the signals whose frequencies aregreater than the cutoff frequency downand lower than the current cutofffrequency upper can pass the filter.
band-reject
Only the signals whose frequencies arelower than the current cutoff frequencydown or greater than the current cutofffrequency upper can pass the filter.
window
RetangularTaperedTriangularHanningHammingBlackman
Select window for digital filter
4.Advanced User Guidebook
31
cut-off freor
upper downTurn theM knob to set cut-off frequency
Vertical(div)
Turn theM knob to adjust the verticalposition of Math waveform
FFT Peak ONOFF
Enable or disable FFT peak search.Dynamic marker ▽ marks the FFTpeak.
Waveform mathTaking the additive operation between Channel 1 and Channels 2 for example, theoperation steps are as follows:
1. Press the Math button to display the math menu in the bottom. The pink M waveformappears on the screen.
2. Select Dual Wfm Math in the bottom menu.
3. In the right menu, select Factor1 as CH1.
4. Select Sign as + in the right menu.
5. In the right menu, select Factor2 as CH2.
6. Select Vertical (div) in the right menu, turn the M knob to adjust the vertical positionof Math waveform.
7. Select Vertical (V/div) in the right menu, turn theM knob to adjust the vertical divisionof Math waveform.
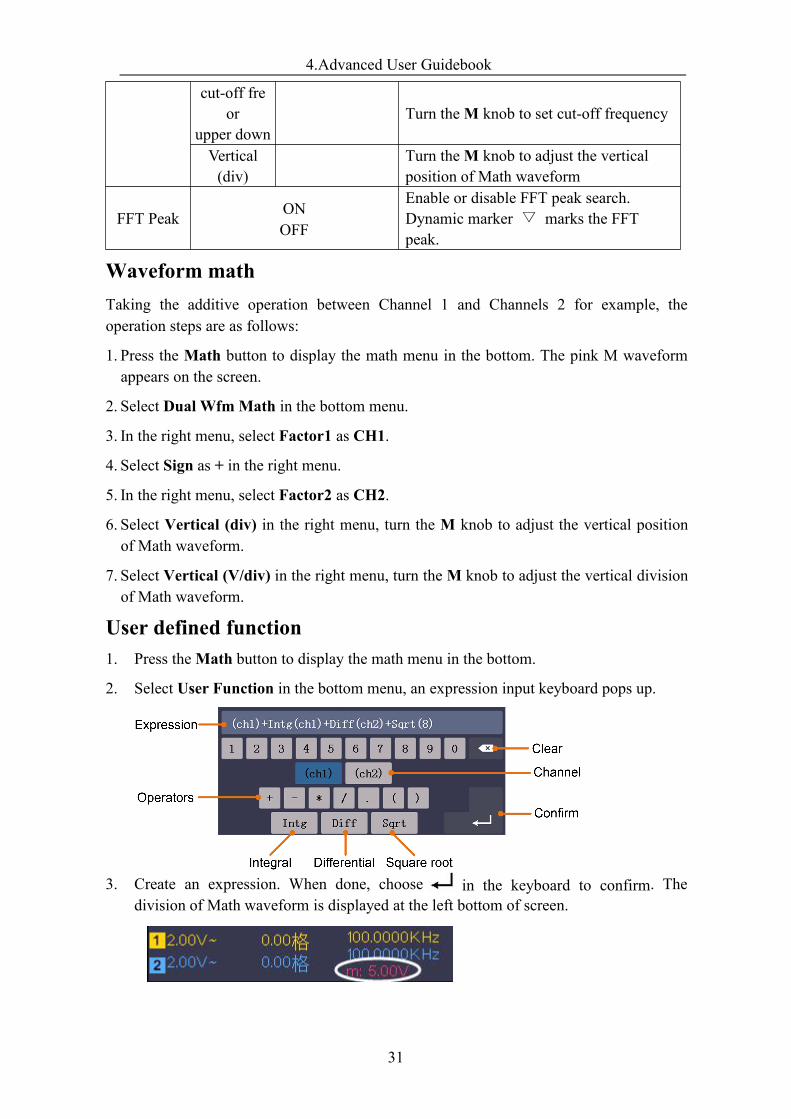
User defined function1. Press theMath button to display the math menu in the bottom.
2. Select User Function in the bottom menu, an expression input keyboard pops up.
3. Create an expression. When done, choose in the keyboard to confirm. Thedivision of Math waveform is displayed at the left bottom of screen.
4.Advanced User Guidebook
32
Digital FilterDigital filter provides 4 types of filters (low pass, high pass, band pass and band reject).The specified frequencies can be filtered by setting the cut-off frequency.1. Press theMath button to display the math menu in the bottom.
2. Select DIR in the bottom menu.
3. In the right menu, select channel as CH1 or CH2.
4. In the right menu, select type, select the desired filter type.
5. In the right menu, select window, select the desired window.
6. When low-pass or high-pass type is selected, select cut-off fre in the right menu.When band-pass or band-reject type is selected, select upper or down in the rightmenu. TurnM knob to adjust the frequency.
7. In the right menu, select Vertical (div), turn M knob to adjust the vertical position ofMath waveform. The voltage division of Math waveform is the same as the selectedchannel.
Note: On the Scan format, digital filter is disabled.
Using FFT functionThe FFT (fast Fourier transform) math function mathematically converts a time-domainwaveform into its frequency components. It is very useful for analyzing the input signal onOscilloscope. You can match these frequencies with known system frequencies, such assystem clocks, oscillators, or power supplies.
FFT function in this oscilloscope transforms 8192 data points of the time-domain signalinto its frequency components mathematically (the record length should be 10K or above).The final frequency contains 4096 points ranging from 0Hz to Nyquist frequency.
Taking the FFT operation for example, the operation steps are as follows:
1. Press theMath button to display the math menu in the bottom.2. Select FFT in the bottom menu.3. In the right menu, select Source as CH1.4. In the right menu, select Window. In the left menu, turn the M knob to select the
proper window type.5. In the right menu, select Format. In the left menu, turn the M knob to select
amplitude unit (V RMS, Decibels) or phase unit (Radian, Degrees).6. Select Hori (Hz) in the right menu; select repeatedly to make the symbol in front
of the horizontal position value (the upper one), turn the M knob to adjust thehorizontal position of FFT waveform; then select to make the symbol in front ofthe time base value below, turn theM knob to adjust the time base of FFT waveform.
7. Select Vertical in the right menu; do the same operations as above to set the verticalposition and vertical division.
4.Advanced User Guidebook
33
To select the FFT window
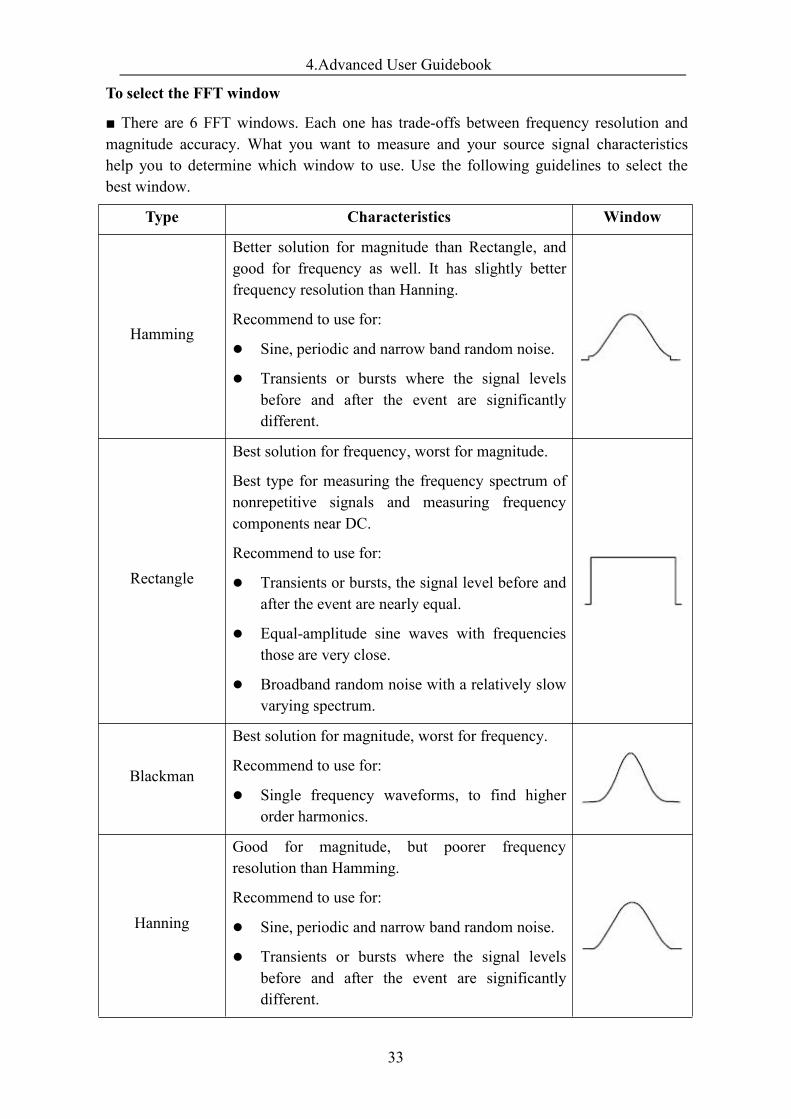
■ There are 6 FFT windows. Each one has trade-offs between frequency resolution andmagnitude accuracy. What you want to measure and your source signal characteristicshelp you to determine which window to use. Use the following guidelines to select thebest window.
Type Characteristics Window
Hamming
Better solution for magnitude than Rectangle, andgood for frequency as well. It has slightly betterfrequency resolution than Hanning.
Recommend to use for:
Sine, periodic and narrow band random noise.
Transients or bursts where the signal levelsbefore and after the event are significantlydifferent.
Rectangle
Best solution for frequency, worst for magnitude.
Best type for measuring the frequency spectrum ofnonrepetitive signals and measuring frequencycomponents near DC.
Recommend to use for:
Transients or bursts, the signal level before andafter the event are nearly equal.
Equal-amplitude sine waves with frequenciesthose are very close.
Broadband random noise with a relatively slowvarying spectrum.
Blackman
Best solution for magnitude, worst for frequency.
Recommend to use for:
Single frequency waveforms, to find higherorder harmonics.
Hanning
Good for magnitude, but poorer frequencyresolution than Hamming.
Recommend to use for:
Sine, periodic and narrow band random noise.
Transients or bursts where the signal levelsbefore and after the event are significantlydifferent.
4.Advanced User Guidebook
34
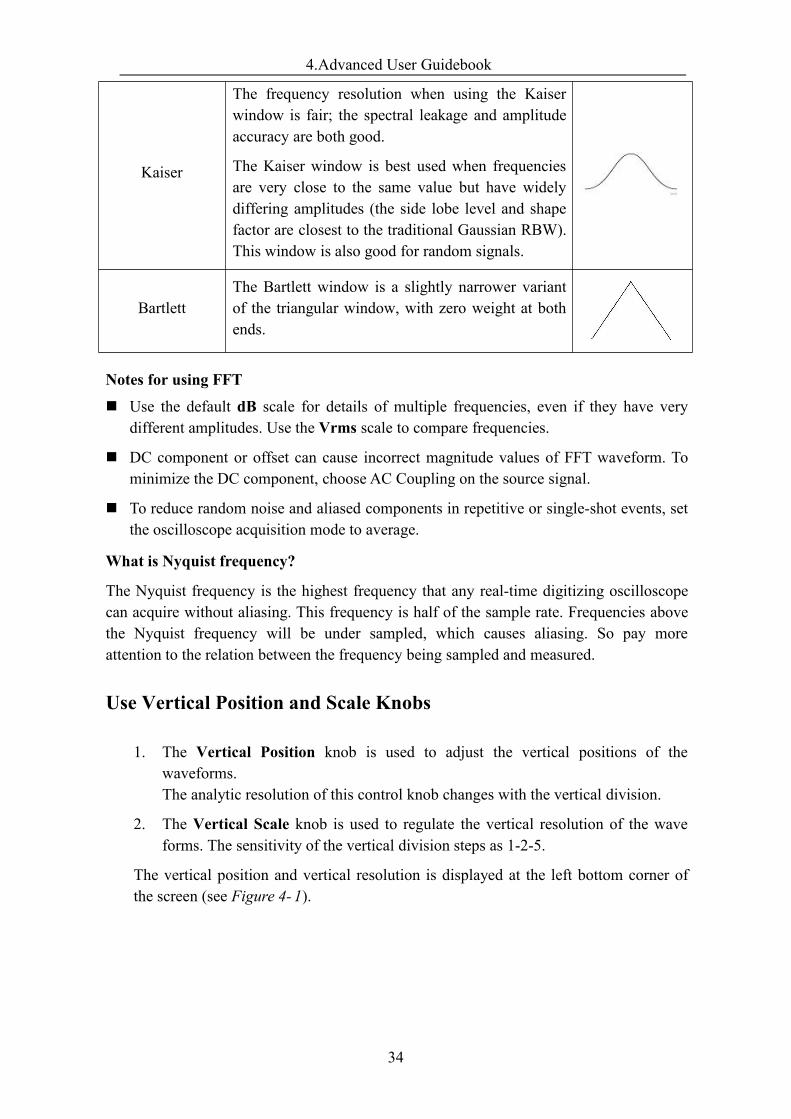
Kaiser
The frequency resolution when using the Kaiserwindow is fair; the spectral leakage and amplitudeaccuracy are both good.
The Kaiser window is best used when frequenciesare very close to the same value but have widelydiffering amplitudes (the side lobe level and shapefactor are closest to the traditional Gaussian RBW).This window is also good for random signals.
BartlettThe Bartlett window is a slightly narrower variantof the triangular window, with zero weight at bothends.
Notes for using FFT
Use the default dB scale for details of multiple frequencies, even if they have verydifferent amplitudes. Use the Vrms scale to compare frequencies.
DC component or offset can cause incorrect magnitude values of FFT waveform. Tominimize the DC component, choose AC Coupling on the source signal.
To reduce random noise and aliased components in repetitive or single-shot events, setthe oscilloscope acquisition mode to average.
What is Nyquist frequency?
The Nyquist frequency is the highest frequency that any real-time digitizing oscilloscopecan acquire without aliasing. This frequency is half of the sample rate. Frequencies abovethe Nyquist frequency will be under sampled, which causes aliasing. So pay moreattention to the relation between the frequency being sampled and measured.
Use Vertical Position and Scale Knobs
1. The Vertical Position knob is used to adjust the vertical positions of thewaveforms.The analytic resolution of this control knob changes with the vertical division.
2. The Vertical Scale knob is used to regulate the vertical resolution of the waveforms. The sensitivity of the vertical division steps as 1-2-5.
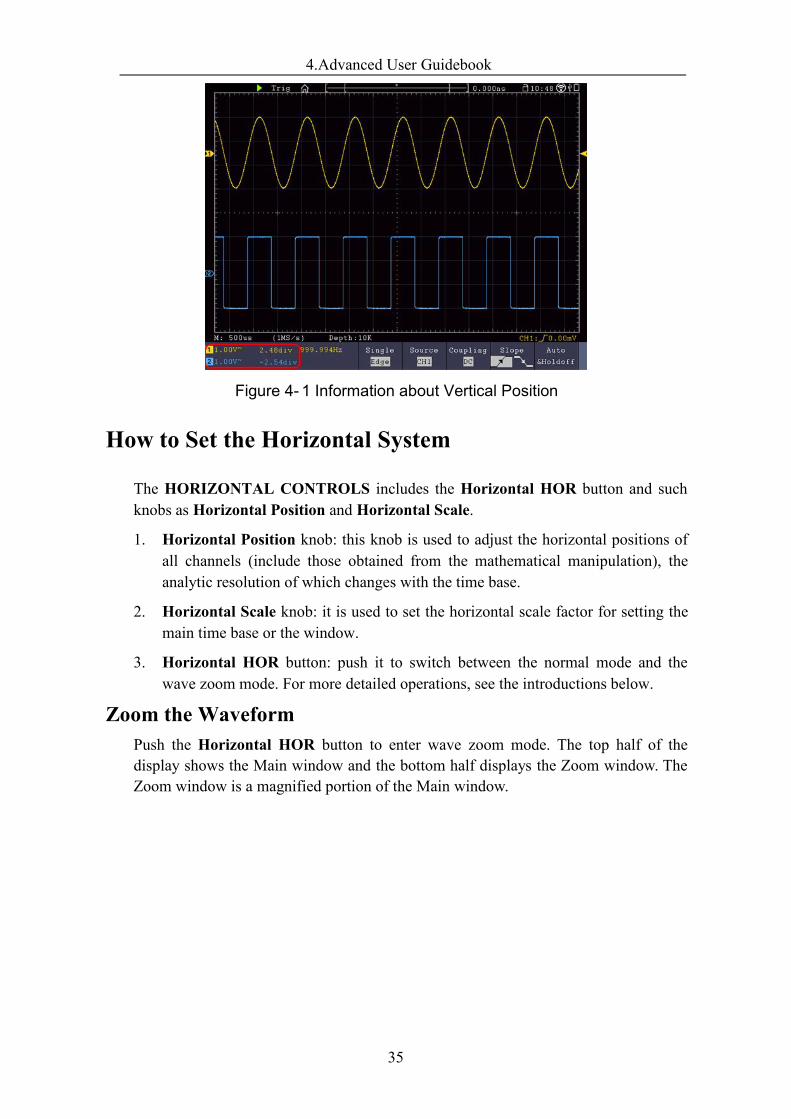
The vertical position and vertical resolution is displayed at the left bottom corner ofthe screen (see Figure 4- 1).
4.Advanced User Guidebook
35
Figure 4- 1 Information about Vertical Position
How to Set the Horizontal System
The HORIZONTAL CONTROLS includes the Horizontal HOR button and suchknobs as Horizontal Position and Horizontal Scale.
1. Horizontal Position knob: this knob is used to adjust the horizontal positions ofall channels (include those obtained from the mathematical manipulation), theanalytic resolution of which changes with the time base.
2. Horizontal Scale knob: it is used to set the horizontal scale factor for setting themain time base or the window.
3. Horizontal HOR button: push it to switch between the normal mode and thewave zoom mode. For more detailed operations, see the introductions below.
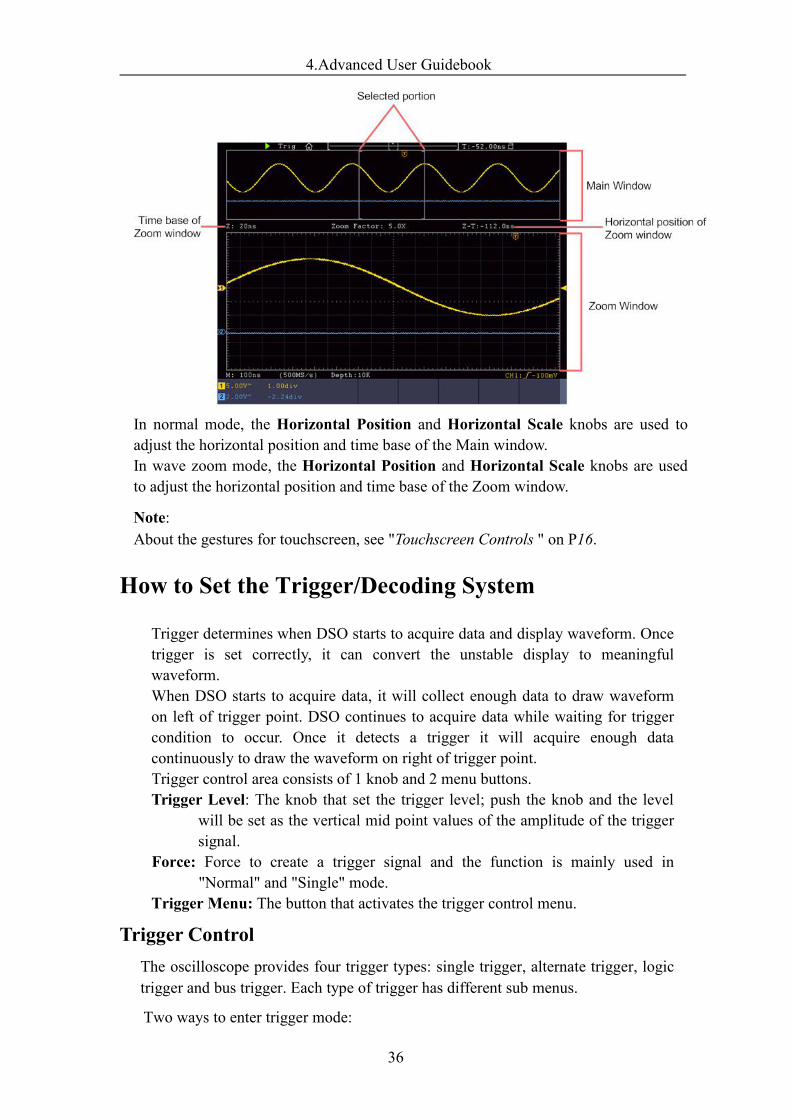
Zoom the WaveformPush the Horizontal HOR button to enter wave zoom mode. The top half of thedisplay shows the Main window and the bottom half displays the Zoom window. TheZoom window is a magnified portion of the Main window.
4.Advanced User Guidebook
36
In normal mode, the Horizontal Position and Horizontal Scale knobs are used toadjust the horizontal position and time base of the Main window.In wave zoom mode, the Horizontal Position and Horizontal Scale knobs are usedto adjust the horizontal position and time base of the Zoom window.
Note:About the gestures for touchscreen, see "Touchscreen Controls " on P16.
How to Set the Trigger/Decoding System
Trigger determines when DSO starts to acquire data and display waveform. Oncetrigger is set correctly, it can convert the unstable display to meaningfulwaveform.When DSO starts to acquire data, it will collect enough data to draw waveformon left of trigger point. DSO continues to acquire data while waiting for triggercondition to occur. Once it detects a trigger it will acquire enough datacontinuously to draw the waveform on right of trigger point.Trigger control area consists of 1 knob and 2 menu buttons.Trigger Level: The knob that set the trigger level; push the knob and the level
will be set as the vertical mid point values of the amplitude of the triggersignal.
Force: Force to create a trigger signal and the function is mainly used in"Normal" and "Single" mode.
Trigger Menu: The button that activates the trigger control menu.
Trigger ControlThe oscilloscope provides four trigger types: single trigger, alternate trigger, logictrigger and bus trigger. Each type of trigger has different sub menus.
Two ways to enter trigger mode:

4.Advanced User Guidebook
37
Key operation: Press TriggerMenu panel button, then bottom menu Trigger Type,select Single, ALT, Logic or Bus Trigger on the popup rightmenus, rotate M knob to choose different trigger types.
Touch operation: Click Main menu icon on the left top of the screen, select TrigMenu, click bottom button Trigger Type, choose Single, ALT,Logic or Bus Trigger on the popup right menus, click to choosedifferent trigger types。
Single trigger: Use a trigger level to capture stable waveforms in two channelssimultaneously.
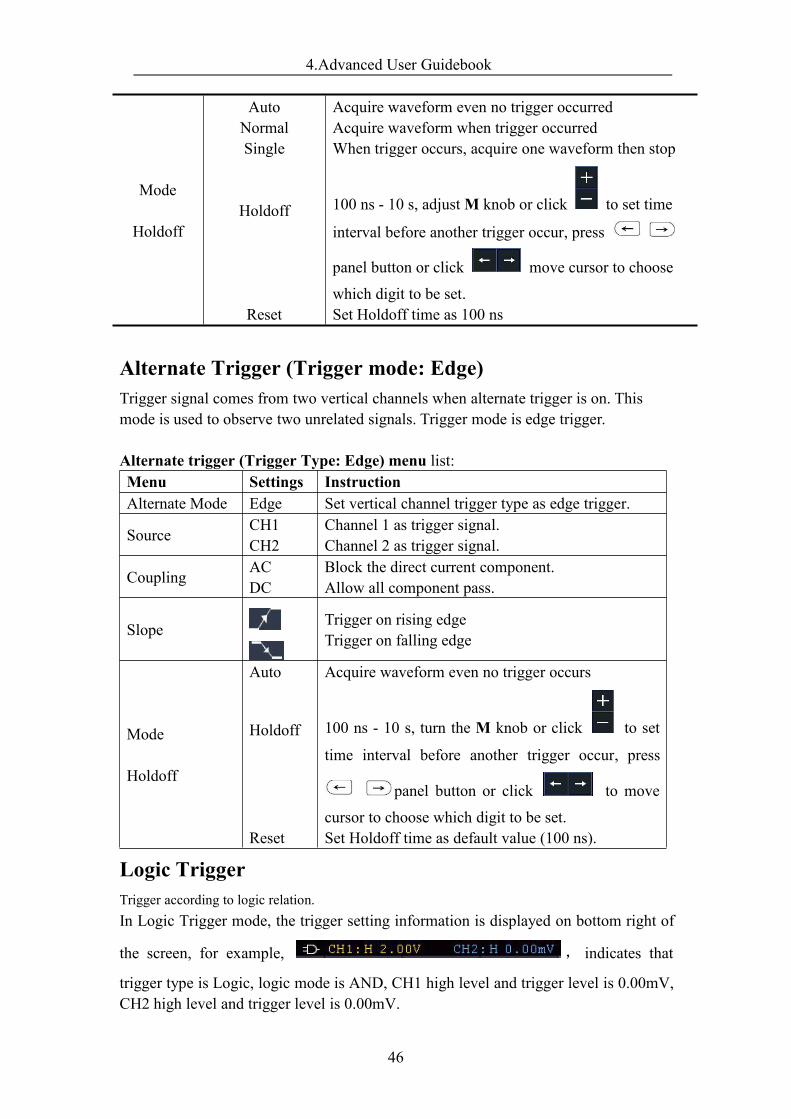
Alternate trigger: Trigger on non-synchronized signals.
Logic trigger: Trigger the signal according to the condition of logic relationship.
Bus trigger: Set bus timing trigger.
The Single Trigger, Alternate Trigger, Logic Trigger and Bus Trigger menusare described respectively as follows:
Single TriggerSingle trigger has eight types: edge trigger, video trigger, slope trigger, pulse trigger,runt trigger, windows trigger, timeout trigger and Nth edge trigger.
Edge Trigger: It occurs when the trigger input passes through a specified voltagelevel with the specified slope.
Video Trigger: Trigger on fields or lines for standard video signal.
Slope Trigger: The oscilloscope begins to trigger according to the signal rising orfalling speed.
Pulse Trigger: Find pulses with certain widths.Runt Trigger: Trigger pulses that pass through one trigger level but fail to pass
through the other trigger level.Windows Trigger: Provide a high trigger level and low trigger level, the oscilloscope
triggers when the input signal passes through the high trigger level orthe low trigger level.
Timeout Trigger: The oscilloscope triggers when the time interval from when therising edge (or the falling edge) passes through the trigger level towhen the neighbouring falling edge (or the rising edge) passesthrough the trigger level is greater than the timeout time set.
Nth Edge Trigger: The oscilloscope triggers on the Nth edge that appears on thespecified idle time.
The eight trigger modes in Single Trigger are described respectively as follows:
1. Edge Trigger
4.Advanced User Guidebook
38
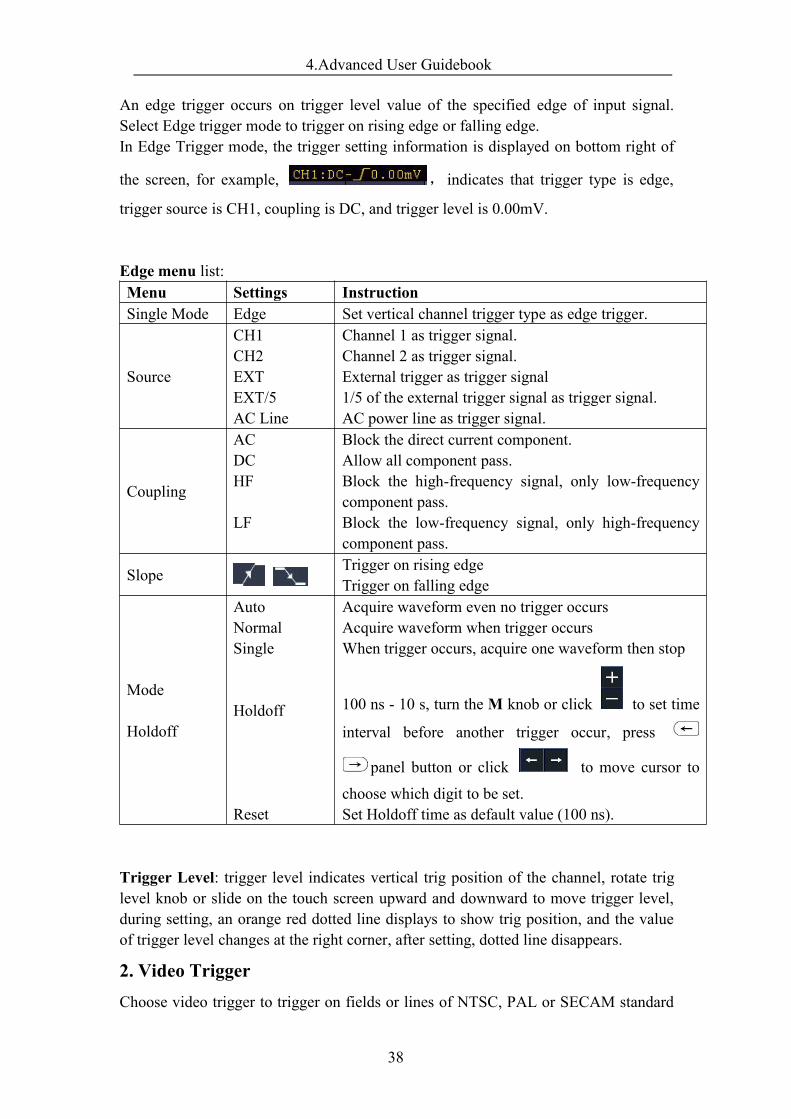
An edge trigger occurs on trigger level value of the specified edge of input signal.Select Edge trigger mode to trigger on rising edge or falling edge.In Edge Trigger mode, the trigger setting information is displayed on bottom right of
the screen, for example, , indicates that trigger type is edge,
trigger source is CH1, coupling is DC, and trigger level is 0.00mV.
Edge menu list:Menu Settings InstructionSingle Mode Edge Set vertical channel trigger type as edge trigger.
Source
CH1CH2EXTEXT/5AC Line
Channel 1 as trigger signal.Channel 2 as trigger signal.External trigger as trigger signal1/5 of the external trigger signal as trigger signal.AC power line as trigger signal.
Coupling
ACDCHF
LF
Block the direct current component.Allow all component pass.Block the high-frequency signal, only low-frequencycomponent pass.Block the low-frequency signal, only high-frequencycomponent pass.
Slope Trigger on rising edgeTrigger on falling edge
Mode
Holdoff
AutoNormalSingle
Holdoff
Reset
Acquire waveform even no trigger occursAcquire waveform when trigger occursWhen trigger occurs, acquire one waveform then stop
100 ns - 10 s, turn theM knob or click to set time
interval before another trigger occur, press
panel button or click to move cursor to
choose which digit to be set.Set Holdoff time as default value (100 ns).
Trigger Level: trigger level indicates vertical trig position of the channel, rotate triglevel knob or slide on the touch screen upward and downward to move trigger level,during setting, an orange red dotted line displays to show trig position, and the valueof trigger level changes at the right corner, after setting, dotted line disappears.
2. Video TriggerChoose video trigger to trigger on fields or lines of NTSC, PAL or SECAM standard
4.Advanced User Guidebook
39
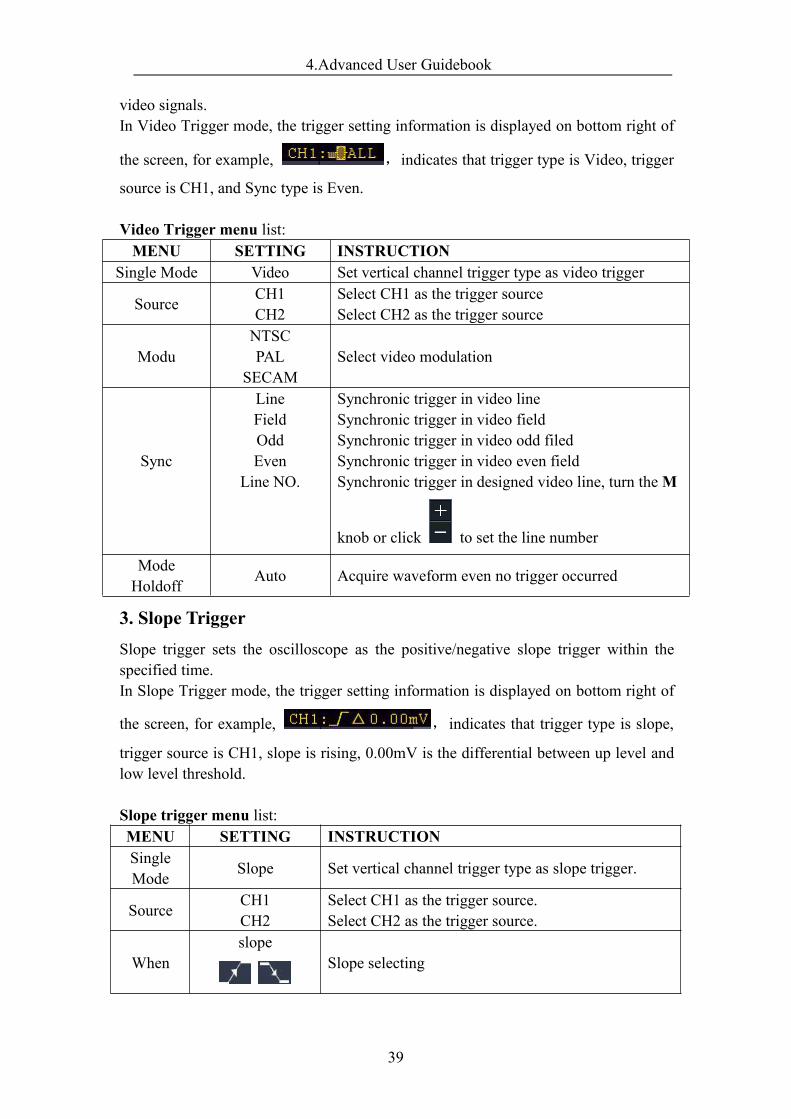
video signals.In Video Trigger mode, the trigger setting information is displayed on bottom right of
the screen, for example, ,indicates that trigger type is Video, trigger
source is CH1, and Sync type is Even.
Video Trigger menu list:MENU SETTING INSTRUCTION
Single Mode Video Set vertical channel trigger type as video trigger
Source CH1CH2
Select CH1 as the trigger sourceSelect CH2 as the trigger source
ModuNTSCPAL
SECAMSelect video modulation
Sync
LineFieldOddEven
Line NO.
Synchronic trigger in video lineSynchronic trigger in video fieldSynchronic trigger in video odd filedSynchronic trigger in video even fieldSynchronic trigger in designed video line, turn theM
knob or click to set the line number
ModeHoldoff Auto Acquire waveform even no trigger occurred
3. Slope TriggerSlope trigger sets the oscilloscope as the positive/negative slope trigger within thespecified time.In Slope Trigger mode, the trigger setting information is displayed on bottom right of
the screen, for example, ,indicates that trigger type is slope,
trigger source is CH1, slope is rising, 0.00mV is the differential between up level andlow level threshold.
Slope trigger menu list:MENU SETTING INSTRUCTIONSingleMode Slope Set vertical channel trigger type as slope trigger.
Source CH1CH2
Select CH1 as the trigger source.Select CH2 as the trigger source.
Whenslope
Slope selecting
4.Advanced User Guidebook
40
Set slope condition; turn the M knob or click to
set slope time, press panel button or click
to move cursor to choose which digit to be
set.
Threshold&SlewRate
High levelLow levelSlew rate
AdjustM knob to set the High level upper limit.AdjustM knob to set Low level lower limit.Slew rate = (High level - Low level) / Settings
Mode
Holdoff
AutoNormalSingle
Holdoff
Reset
Acquire waveform even no trigger occurredAcquire waveform when trigger occurredWhen trigger occurs, acquire one waveform then stop
100 ns – 10 s, turn theM knob or click to set
time interval before another trigger occur, press
panel button or click to move cursor to
choose which digit to be set.Set Holdoff time as 100 ns
4. Pulse Width TriggerPulse trigger occurs according to the width of pulse. The abnormal signals can bedetected through setting up the pulse width condition.
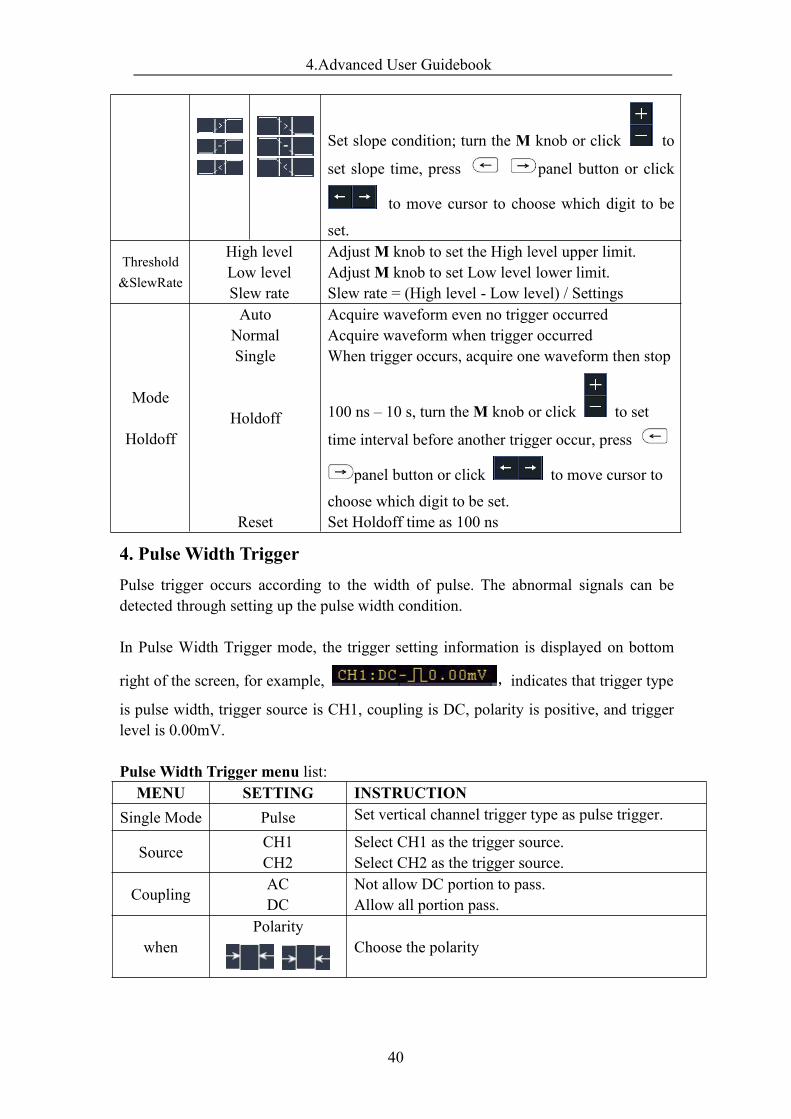
In Pulse Width Trigger mode, the trigger setting information is displayed on bottom
right of the screen, for example, ,indicates that trigger type
is pulse width, trigger source is CH1, coupling is DC, polarity is positive, and triggerlevel is 0.00mV.
Pulse Width Trigger menu list:MENU SETTING INSTRUCTION
Single Mode Pulse Set vertical channel trigger type as pulse trigger.
Source CH1CH2
Select CH1 as the trigger source.Select CH2 as the trigger source.
Coupling ACDC
Not allow DC portion to pass.Allow all portion pass.
whenPolarity
Choose the polarity
4.Advanced User Guidebook
41
Select pulse width condition and adjust the M knob
or click to set time, press panel
button or click to move cursor to choose
which digit to be set.
Mode
Holdoff
AutoNormalSingle
Holdoff
Reset
Acquire waveform even no trigger occurredAcquire waveform when trigger occurredWhen trigger occurs, acquire one waveform then stop
100 ns - 10 s, adjustM knob or click to set time
interval before another trigger occur, press
panel button or click to move cursor to
choose which digit to be set.Set Holdoff time as 100 ns
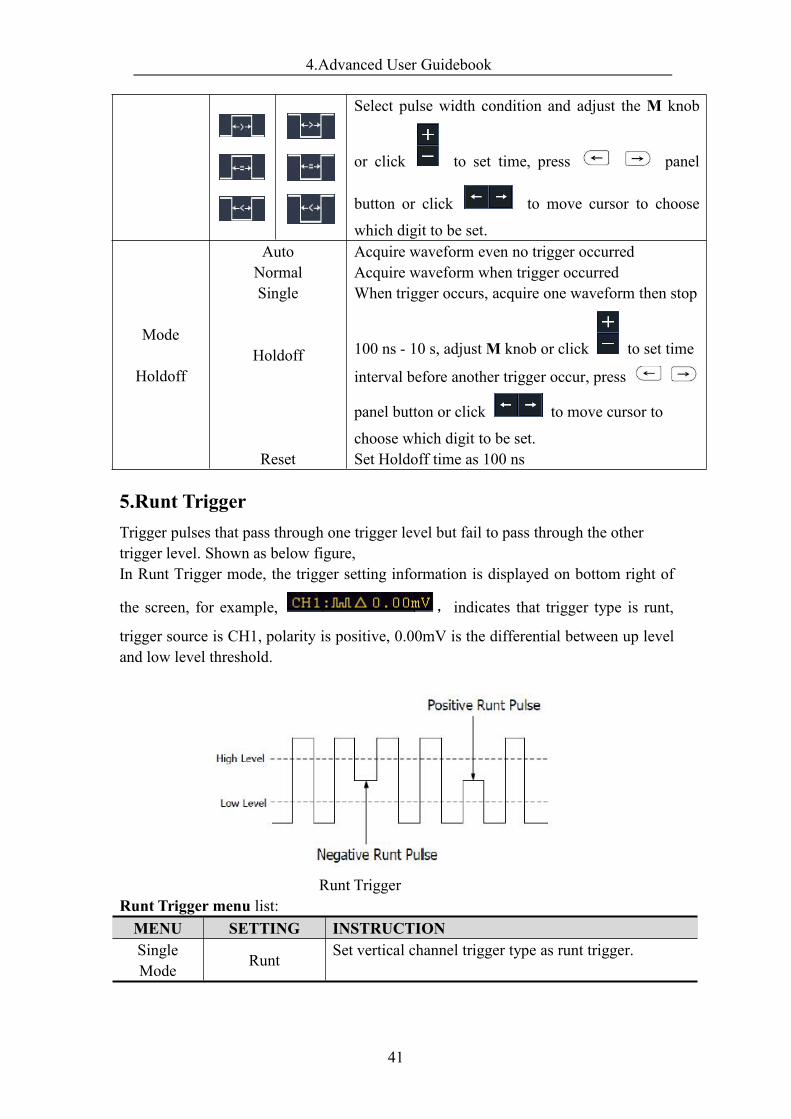
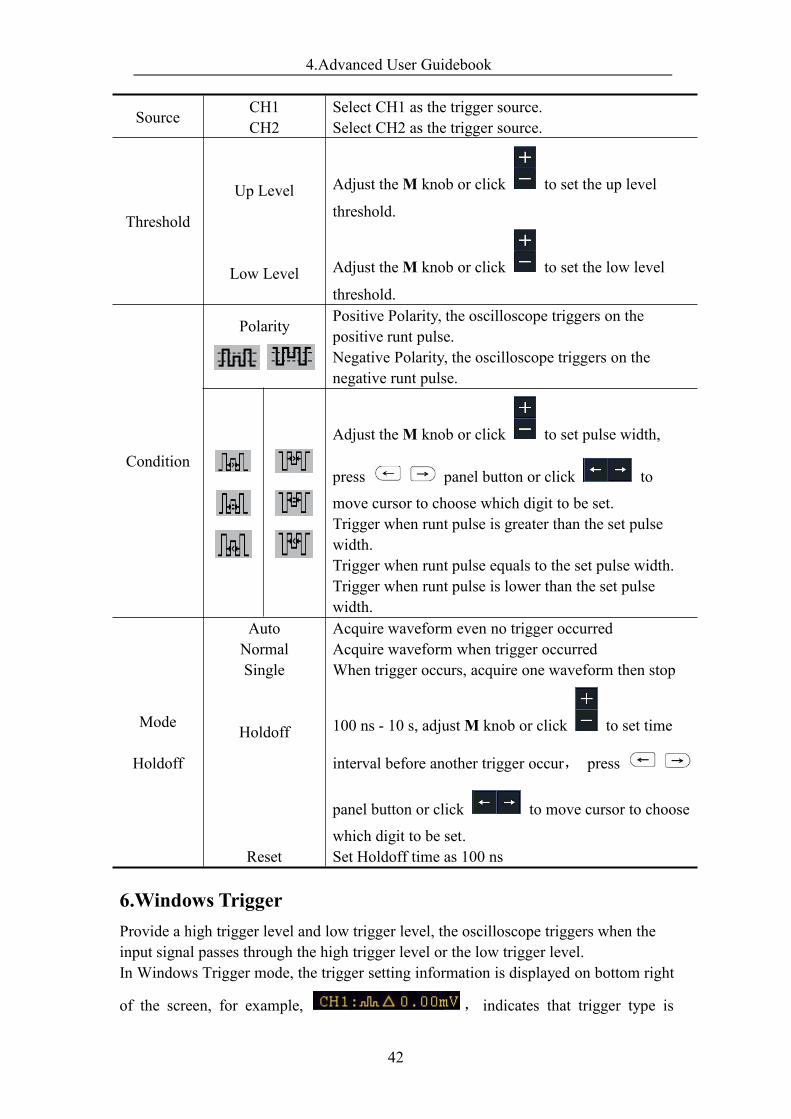
5.Runt TriggerTrigger pulses that pass through one trigger level but fail to pass through the othertrigger level. Shown as below figure,In Runt Trigger mode, the trigger setting information is displayed on bottom right of
the screen, for example, , indicates that trigger type is runt,
trigger source is CH1, polarity is positive, 0.00mV is the differential between up leveland low level threshold.
Runt TriggerRunt Trigger menu list:MENU SETTING INSTRUCTIONSingleMode Runt Set vertical channel trigger type as runt trigger.
4.Advanced User Guidebook
42
Source CH1CH2
Select CH1 as the trigger source.Select CH2 as the trigger source.
Threshold
Up Level
Low Level
Adjust theM knob or click to set the up level
threshold.
Adjust theM knob or click to set the low level
threshold.
Condition
Polarity Positive Polarity, the oscilloscope triggers on thepositive runt pulse.Negative Polarity, the oscilloscope triggers on thenegative runt pulse.
Adjust theM knob or click to set pulse width,
press panel button or click to
move cursor to choose which digit to be set.Trigger when runt pulse is greater than the set pulsewidth.Trigger when runt pulse equals to the set pulse width.Trigger when runt pulse is lower than the set pulsewidth.
Mode
Holdoff
AutoNormalSingle
Holdoff
Reset
Acquire waveform even no trigger occurredAcquire waveform when trigger occurredWhen trigger occurs, acquire one waveform then stop
100 ns - 10 s, adjustM knob or click to set time
interval before another trigger occur, press
panel button or click to move cursor to choose
which digit to be set.Set Holdoff time as 100 ns
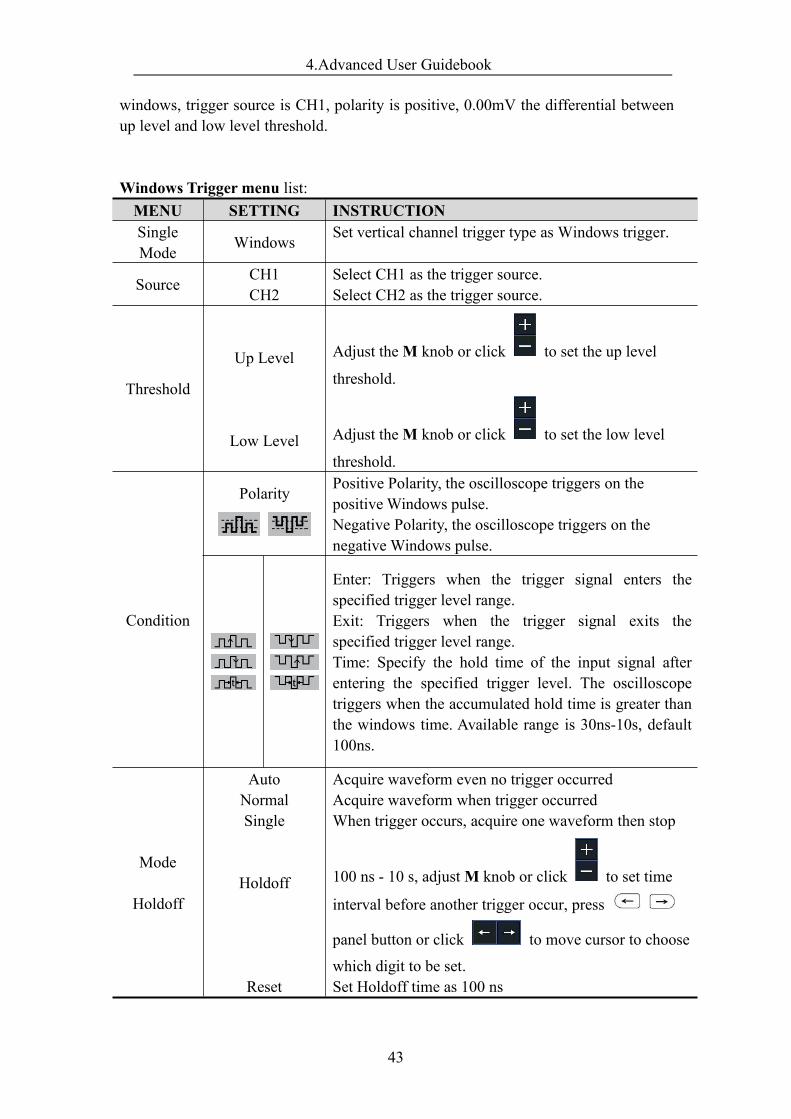
6.Windows TriggerProvide a high trigger level and low trigger level, the oscilloscope triggers when theinput signal passes through the high trigger level or the low trigger level.In Windows Trigger mode, the trigger setting information is displayed on bottom right
of the screen, for example, , indicates that trigger type is
4.Advanced User Guidebook
43
windows, trigger source is CH1, polarity is positive, 0.00mV the differential betweenup level and low level threshold.
Windows Trigger menu list:MENU SETTING INSTRUCTIONSingleMode Windows Set vertical channel trigger type as Windows trigger.
Source CH1CH2
Select CH1 as the trigger source.Select CH2 as the trigger source.
Threshold
Up Level
Low Level
Adjust theM knob or click to set the up level
threshold.
Adjust theM knob or click to set the low level
threshold.
Condition
Polarity Positive Polarity, the oscilloscope triggers on thepositive Windows pulse.Negative Polarity, the oscilloscope triggers on thenegative Windows pulse.
Enter: Triggers when the trigger signal enters thespecified trigger level range.Exit: Triggers when the trigger signal exits thespecified trigger level range.Time: Specify the hold time of the input signal afterentering the specified trigger level. The oscilloscopetriggers when the accumulated hold time is greater thanthe windows time. Available range is 30ns-10s, default100ns.
Mode
Holdoff
AutoNormalSingle
Holdoff
Reset
Acquire waveform even no trigger occurredAcquire waveform when trigger occurredWhen trigger occurs, acquire one waveform then stop
100 ns - 10 s, adjustM knob or click to set time
interval before another trigger occur, press
panel button or click to move cursor to choose
which digit to be set.Set Holdoff time as 100 ns
4.Advanced User Guidebook
44
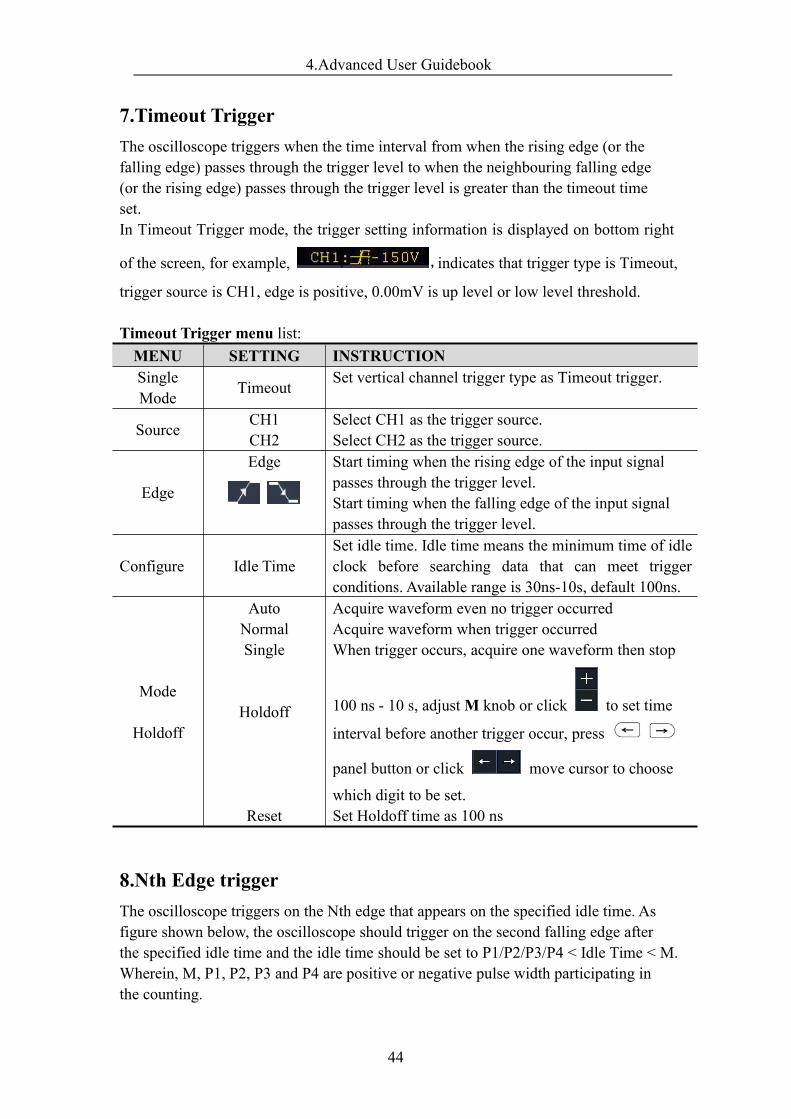
7.Timeout TriggerThe oscilloscope triggers when the time interval from when the rising edge (or thefalling edge) passes through the trigger level to when the neighbouring falling edge(or the rising edge) passes through the trigger level is greater than the timeout timeset.In Timeout Trigger mode, the trigger setting information is displayed on bottom right
of the screen, for example, ,indicates that trigger type is Timeout,
trigger source is CH1, edge is positive, 0.00mV is up level or low level threshold.
Timeout Trigger menu list:MENU SETTING INSTRUCTIONSingleMode Timeout Set vertical channel trigger type as Timeout trigger.
Source CH1CH2
Select CH1 as the trigger source.Select CH2 as the trigger source.
Edge
Edge Start timing when the rising edge of the input signalpasses through the trigger level.Start timing when the falling edge of the input signalpasses through the trigger level.
Configure Idle TimeSet idle time. Idle time means the minimum time of idleclock before searching data that can meet triggerconditions. Available range is 30ns-10s, default 100ns.
Mode
Holdoff
AutoNormalSingle
Holdoff
Reset
Acquire waveform even no trigger occurredAcquire waveform when trigger occurredWhen trigger occurs, acquire one waveform then stop
100 ns - 10 s, adjustM knob or click to set time
interval before another trigger occur, press
panel button or click move cursor to choose
which digit to be set.Set Holdoff time as 100 ns
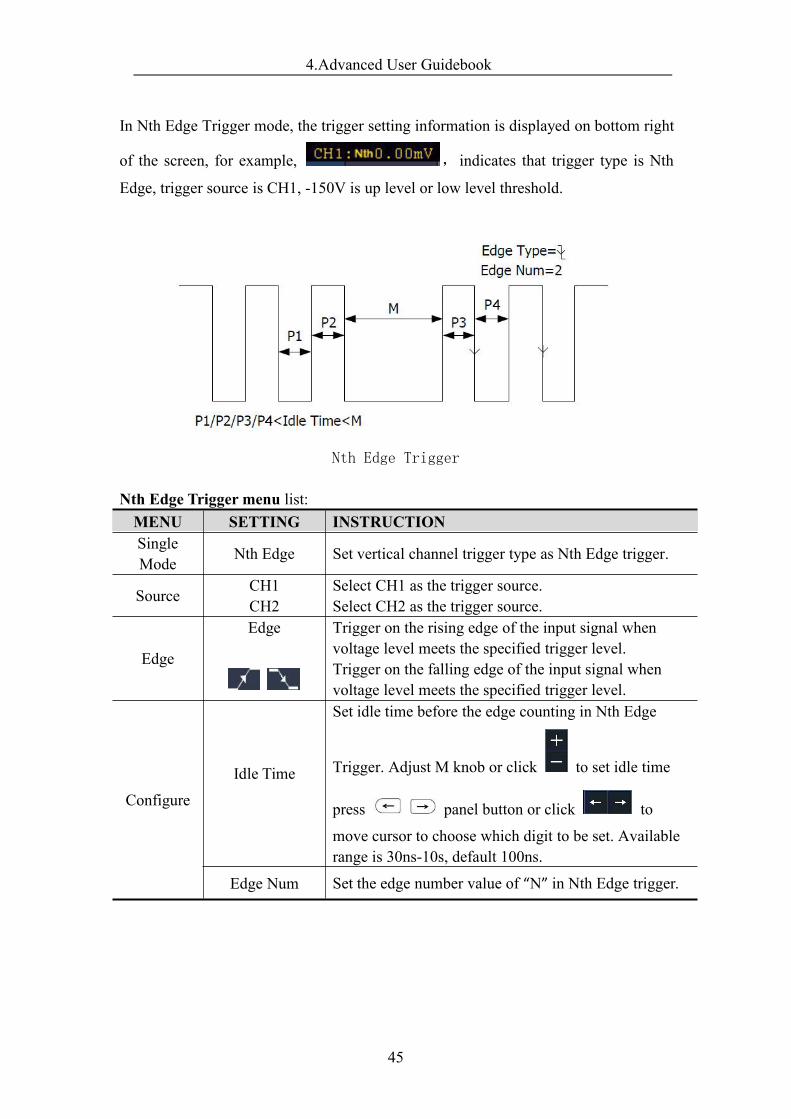
8.Nth Edge triggerThe oscilloscope triggers on the Nth edge that appears on the specified idle time. Asfigure shown below, the oscilloscope should trigger on the second falling edge afterthe specified idle time and the idle time should be set to P1/P2/P3/P4 < Idle Time < M.Wherein, M, P1, P2, P3 and P4 are positive or negative pulse width participating inthe counting.
4.Advanced User Guidebook
45
In Nth Edge Trigger mode, the trigger setting information is displayed on bottom right
of the screen, for example, , indicates that trigger type is Nth
Edge, trigger source is CH1, -150V is up level or low level threshold.
Nth Edge Trigger
Nth Edge Trigger menu list:MENU SETTING INSTRUCTIONSingleMode Nth Edge Set vertical channel trigger type as Nth Edge trigger.
Source CH1CH2
Select CH1 as the trigger source.Select CH2 as the trigger source.
Edge
Edge Trigger on the rising edge of the input signal whenvoltage level meets the specified trigger level.Trigger on the falling edge of the input signal whenvoltage level meets the specified trigger level.
Configure
Idle Time
Set idle time before the edge counting in Nth Edge
Trigger. Adjust M knob or click to set idle time
press panel button or click to
move cursor to choose which digit to be set. Availablerange is 30ns-10s, default 100ns.
Edge Num Set the edge number value of “N” in Nth Edge trigger.
4.Advanced User Guidebook
46
Mode
Holdoff
AutoNormalSingle
Holdoff
Reset
Acquire waveform even no trigger occurredAcquire waveform when trigger occurredWhen trigger occurs, acquire one waveform then stop
100 ns - 10 s, adjustM knob or click to set time
interval before another trigger occur, press
panel button or click move cursor to choose
which digit to be set.Set Holdoff time as 100 ns
Alternate Trigger (Trigger mode: Edge)Trigger signal comes from two vertical channels when alternate trigger is on. Thismode is used to observe two unrelated signals. Trigger mode is edge trigger.
Alternate trigger (Trigger Type: Edge) menu list:Menu Settings InstructionAlternate Mode Edge Set vertical channel trigger type as edge trigger.
Source CH1CH2
Channel 1 as trigger signal.Channel 2 as trigger signal.
Coupling ACDC
Block the direct current component.Allow all component pass.
Slope Trigger on rising edgeTrigger on falling edge
Mode
Holdoff
Auto
Holdoff
Reset
Acquire waveform even no trigger occurs
100 ns - 10 s, turn the M knob or click to set
time interval before another trigger occur, press
panel button or click to move
cursor to choose which digit to be set.Set Holdoff time as default value (100 ns).
Logic TriggerTrigger according to logic relation.In Logic Trigger mode, the trigger setting information is displayed on bottom right of
the screen, for example, , indicates that
trigger type is Logic, logic mode is AND, CH1 high level and trigger level is 0.00mV,CH2 high level and trigger level is 0.00mV.
4.Advanced User Guidebook
47
Logic Trigger menu list:MENU SETTING INSTRUCTIONMode Logic Set vertical channel trigger type as Logic trigger.
LogicMode
ANDOR
XNORXOR
Set logic mode as AND.Set logic mode as OR.Set logic mode as XNOR.Set logic mode as XOR.
Input Mode
CH1
CH2
Set CH1 as High Level, Low level, high or low level,Rise and Fall.Set CH2 as High Level, Low level, high or low level,Rise and Fall.Note:When input mode of one channel is set as Rise orFall, the other channel could not be set as Rise and Fallat the same time.
Out Mod
Goes True Trigger when condition turns True from False.Trigger when condition turns False from True.Trigger when the time of true condition is more thanthe set timeTrigger when the time of true condition is lower thanthe set timeTrigger when the time of true condition is equal to theset time
Goes FalseIs True >
Is True <
Is True =
Mode
Holdoff
AutoNormalSingle
Holdoff
Reset
Acquire waveform even no trigger occurredAcquire waveform when trigger occurredWhen trigger occurs, acquire one waveform then stop
100 ns - 10 s, adjustM knob or click to set time
interval before another trigger occur, press
panel button or click move cursor to choose
which digit to be set.Set Holdoff time as 100 ns
Bus Trigger
1. RS232 TriggerRS232 is a serial communication mode used in the data transmission between PCs orbetween PC and Terminal. A character is transmitted as a frame of data which consistof 1bit start bit, 5-8bits data bits, 1bit check bit and 1-2 stop bits.In RS232 bus trigger mode, the trigger setting information is displayed on bottom
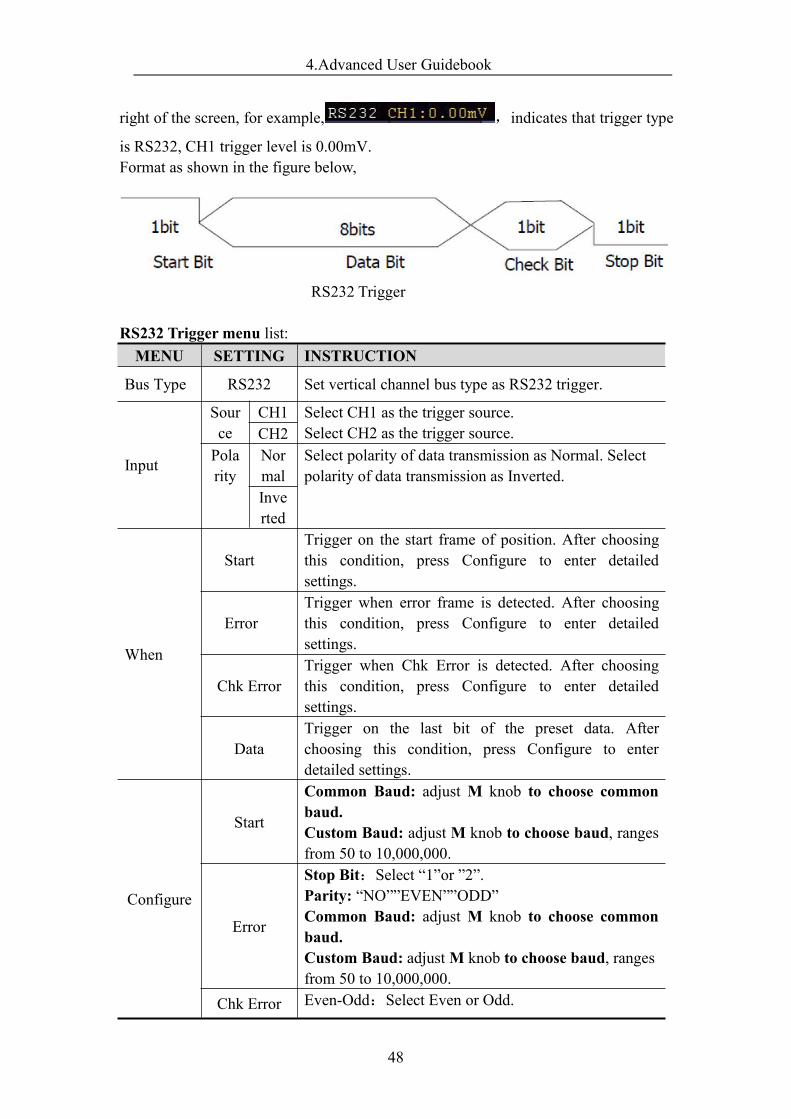
4.Advanced User Guidebook
48
right of the screen, for example, ,indicates that trigger type
is RS232, CH1 trigger level is 0.00mV.Format as shown in the figure below,
RS232 Trigger
RS232 Trigger menu list:MENU SETTING INSTRUCTION
Bus Type RS232 Set vertical channel bus type as RS232 trigger.
Input
Source
CH1 Select CH1 as the trigger source.Select CH2 as the trigger source.CH2
Polarity
Normal
Select polarity of data transmission as Normal. Selectpolarity of data transmission as Inverted.
Inverted
When
StartTrigger on the start frame of position. After choosingthis condition, press Configure to enter detailedsettings.
ErrorTrigger when error frame is detected. After choosingthis condition, press Configure to enter detailedsettings.
Chk ErrorTrigger when Chk Error is detected. After choosingthis condition, press Configure to enter detailedsettings.
DataTrigger on the last bit of the preset data. Afterchoosing this condition, press Configure to enterdetailed settings.
Configure
Start
Common Baud: adjust M knob to choose commonbaud.Custom Baud: adjust M knob to choose baud, rangesfrom 50 to 10,000,000.
Error
Stop Bit:Select “1”or ”2”.Parity: “NO””EVEN””ODD”Common Baud: adjust M knob to choose commonbaud.Custom Baud: adjustM knob to choose baud, rangesfrom 50 to 10,000,000.
Chk Error Even-Odd:Select Even or Odd.
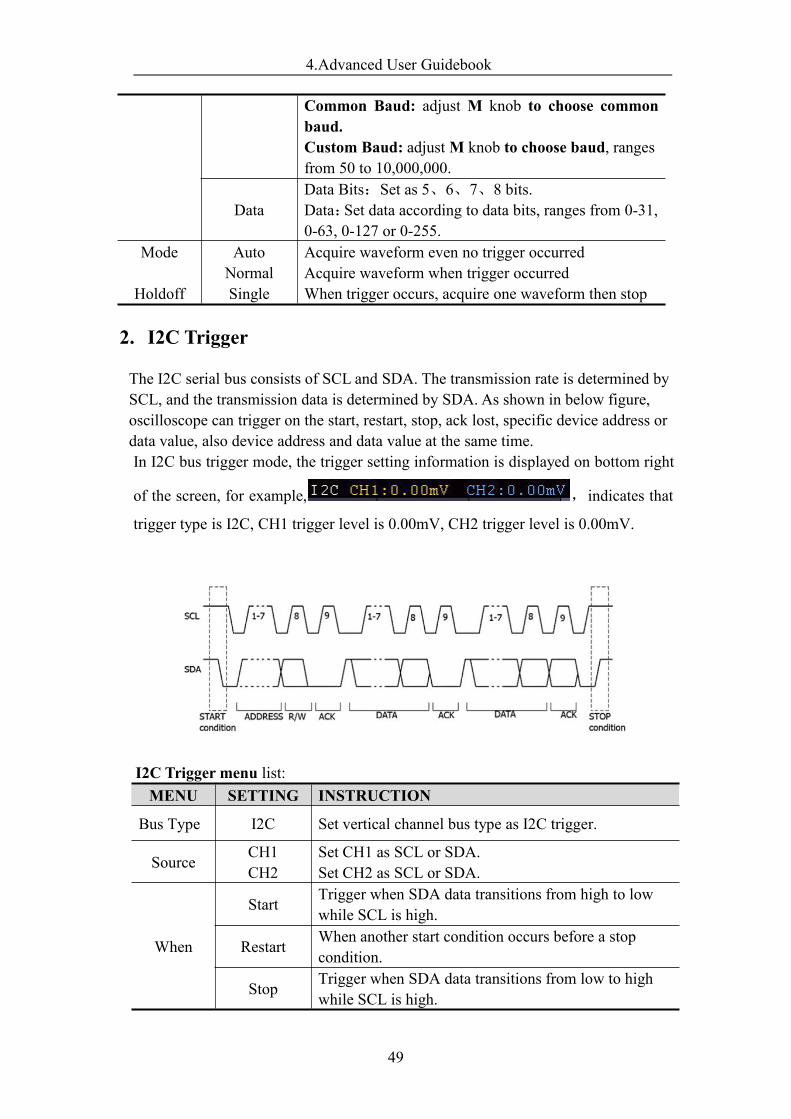
4.Advanced User Guidebook
49
Common Baud: adjust M knob to choose commonbaud.Custom Baud: adjustM knob to choose baud, rangesfrom 50 to 10,000,000.
DataData Bits:Set as 5、6、7、8 bits.Data:Set data according to data bits, ranges from 0-31,0-63, 0-127 or 0-255.
Mode
Holdoff
AutoNormalSingle
Acquire waveform even no trigger occurredAcquire waveform when trigger occurredWhen trigger occurs, acquire one waveform then stop
2. I2C Trigger
The I2C serial bus consists of SCL and SDA. The transmission rate is determined bySCL, and the transmission data is determined by SDA. As shown in below figure,oscilloscope can trigger on the start, restart, stop, ack lost, specific device address ordata value, also device address and data value at the same time.In I2C bus trigger mode, the trigger setting information is displayed on bottom right
of the screen, for example, ,indicates that
trigger type is I2C, CH1 trigger level is 0.00mV, CH2 trigger level is 0.00mV.
I2C Trigger menu list:MENU SETTING INSTRUCTION
Bus Type I2C Set vertical channel bus type as I2C trigger.
Source CH1CH2
Set CH1 as SCL or SDA.Set CH2 as SCL or SDA.
When
Start Trigger when SDA data transitions from high to lowwhile SCL is high.
Restart When another start condition occurs before a stopcondition.
Stop Trigger when SDA data transitions from low to highwhile SCL is high.
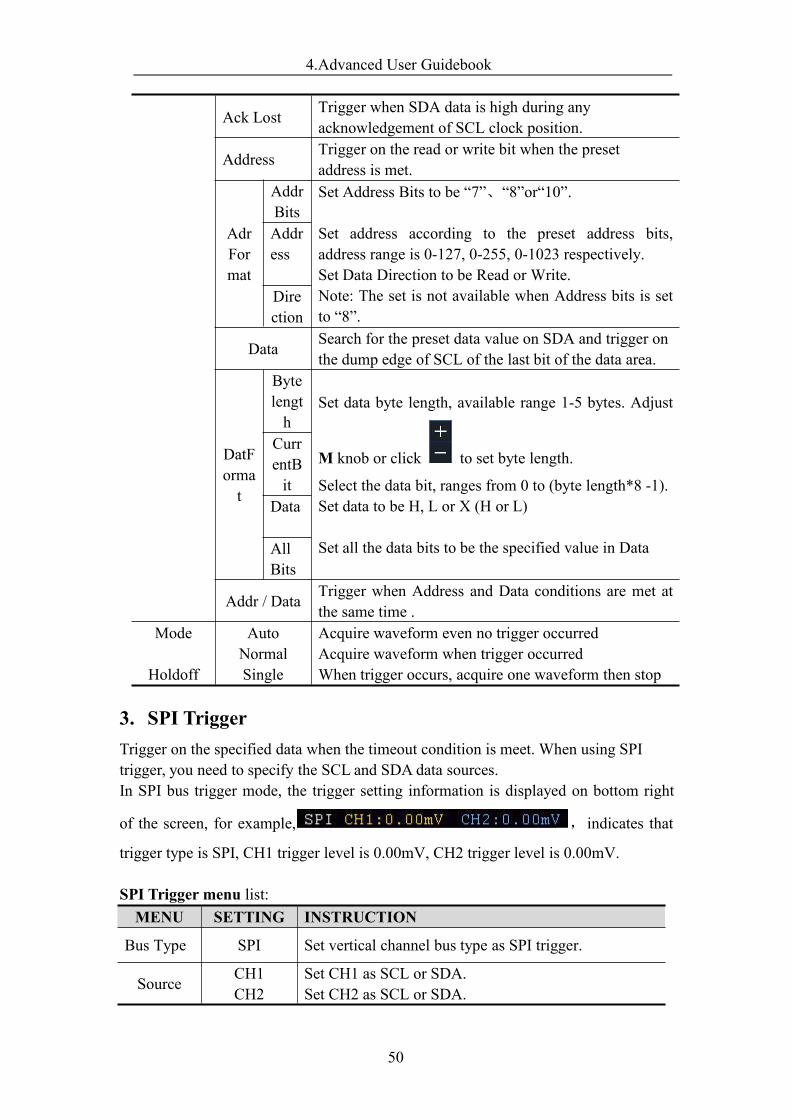
4.Advanced User Guidebook
50
Ack Lost Trigger when SDA data is high during anyacknowledgement of SCL clock position.
Address Trigger on the read or write bit when the presetaddress is met.
AdrFormat
AddrBits
Set Address Bits to be “7”、“8”or“10”.
Set address according to the preset address bits,address range is 0-127, 0-255, 0-1023 respectively.Set Data Direction to be Read or Write.Note: The set is not available when Address bits is setto “8”.
Address
Direction
Data Search for the preset data value on SDA and trigger onthe dump edge of SCL of the last bit of the data area.
DatFormat
Bytelength
Set data byte length, available range 1-5 bytes. Adjust
M knob or click to set byte length.
Select the data bit, ranges from 0 to (byte length*8 -1).Set data to be H, L or X (H or L)
Set all the data bits to be the specified value in Data
CurrentBit
Data
AllBits
Addr / Data Trigger when Address and Data conditions are met atthe same time .
Mode
Holdoff
AutoNormalSingle
Acquire waveform even no trigger occurredAcquire waveform when trigger occurredWhen trigger occurs, acquire one waveform then stop
3. SPI TriggerTrigger on the specified data when the timeout condition is meet. When using SPItrigger, you need to specify the SCL and SDA data sources.In SPI bus trigger mode, the trigger setting information is displayed on bottom right
of the screen, for example, , indicates that
trigger type is SPI, CH1 trigger level is 0.00mV, CH2 trigger level is 0.00mV.
SPI Trigger menu list:MENU SETTING INSTRUCTION
Bus Type SPI Set vertical channel bus type as SPI trigger.
Source CH1CH2
Set CH1 as SCL or SDA.Set CH2 as SCL or SDA.
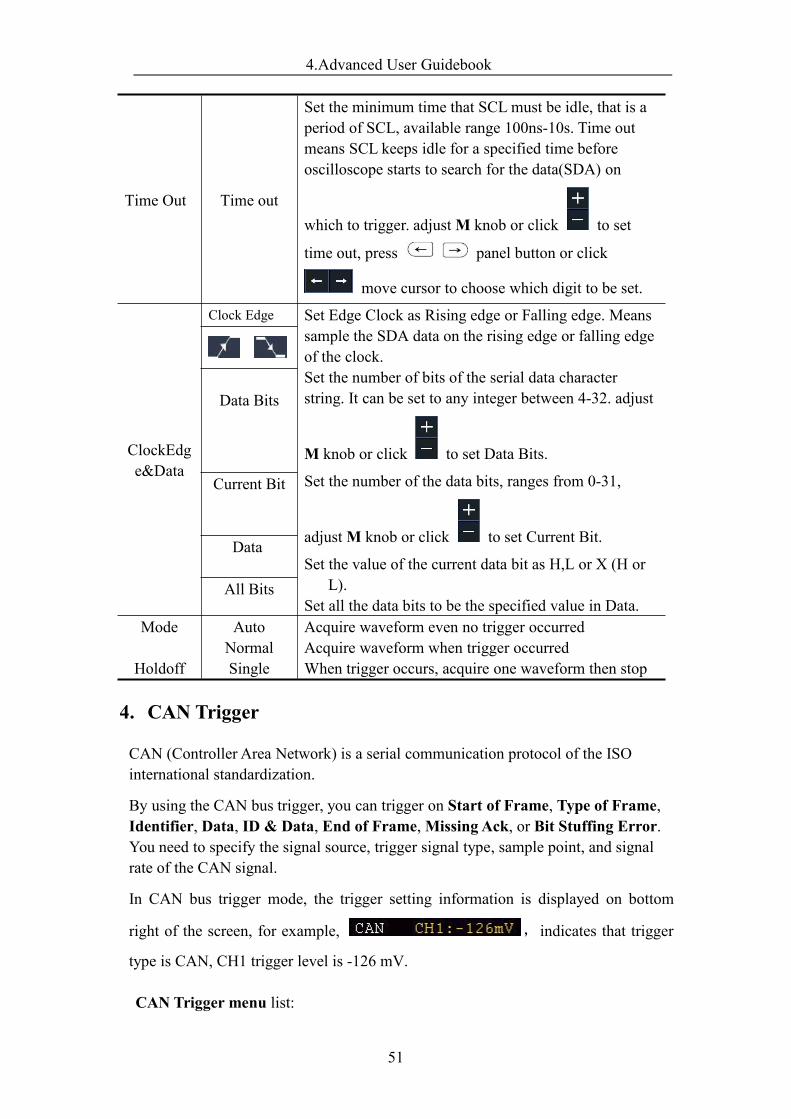
4.Advanced User Guidebook
51
Time Out Time out
Set the minimum time that SCL must be idle, that is aperiod of SCL, available range 100ns-10s. Time outmeans SCL keeps idle for a specified time beforeoscilloscope starts to search for the data(SDA) on
which to trigger. adjustM knob or click to set
time out, press panel button or click
move cursor to choose which digit to be set.
ClockEdge&Data
Clock Edge Set Edge Clock as Rising edge or Falling edge. Meanssample the SDA data on the rising edge or falling edgeof the clock.Set the number of bits of the serial data characterstring. It can be set to any integer between 4-32. adjust
M knob or click to set Data Bits.
Set the number of the data bits, ranges from 0-31,
adjustM knob or click to set Current Bit.
Set the value of the current data bit as H,L or X (H orL).
Set all the data bits to be the specified value in Data.
Data Bits
Current Bit
Data
All Bits
Mode
Holdoff
AutoNormalSingle
Acquire waveform even no trigger occurredAcquire waveform when trigger occurredWhen trigger occurs, acquire one waveform then stop
4. CAN Trigger
CAN (Controller Area Network) is a serial communication protocol of the ISOinternational standardization.
By using the CAN bus trigger, you can trigger on Start of Frame, Type of Frame,Identifier, Data, ID & Data, End of Frame,Missing Ack, or Bit Stuffing Error.You need to specify the signal source, trigger signal type, sample point, and signalrate of the CAN signal.
In CAN bus trigger mode, the trigger setting information is displayed on bottom
right of the screen, for example, ,indicates that trigger
type is CAN, CH1 trigger level is -126 mV.
CAN Trigger menu list:
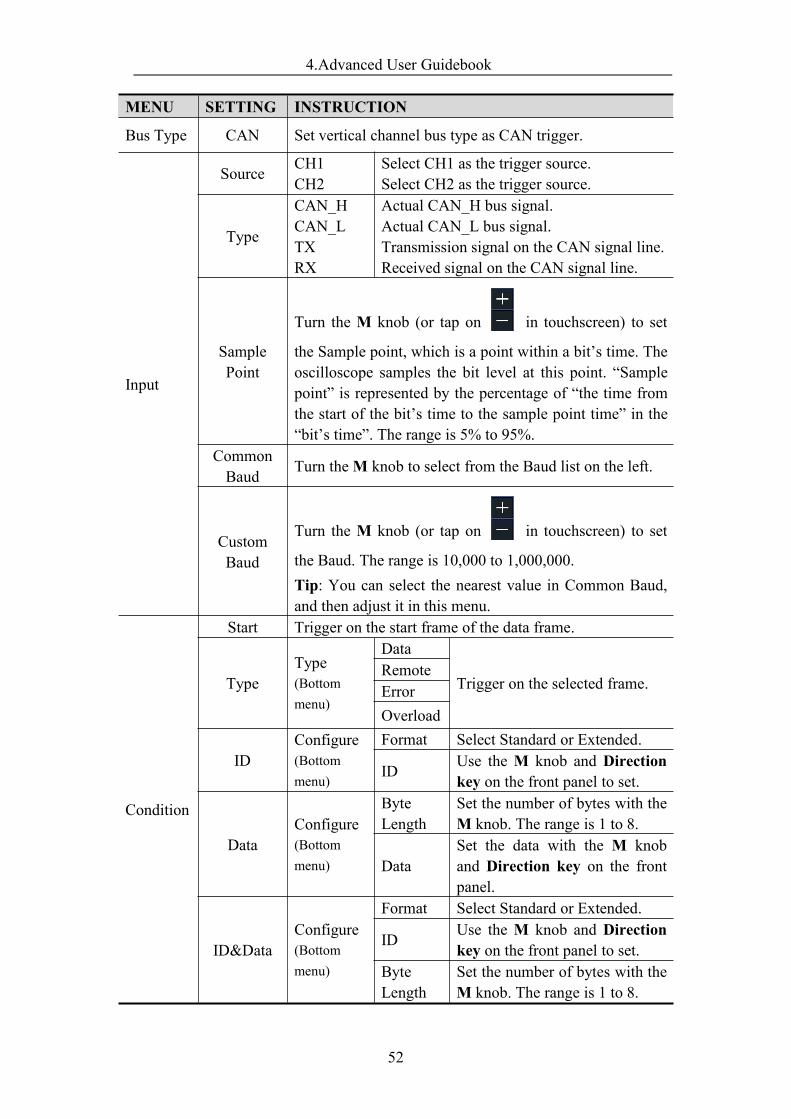
4.Advanced User Guidebook
52
MENU SETTING INSTRUCTION
Bus Type CAN Set vertical channel bus type as CAN trigger.
Input
Source CH1CH2
Select CH1 as the trigger source.Select CH2 as the trigger source.
Type
CAN_HCAN_LTXRX
Actual CAN_H bus signal.Actual CAN_L bus signal.Transmission signal on the CAN signal line.Received signal on the CAN signal line.
SamplePoint
Turn the M knob (or tap on in touchscreen) to set
the Sample point, which is a point within a bit’s time. Theoscilloscope samples the bit level at this point. “Samplepoint” is represented by the percentage of “the time fromthe start of the bit’s time to the sample point time” in the“bit’s time”. The range is 5% to 95%.
CommonBaud Turn theM knob to select from the Baud list on the left.
CustomBaud
Turn the M knob (or tap on in touchscreen) to set
the Baud. The range is 10,000 to 1,000,000.Tip: You can select the nearest value in Common Baud,and then adjust it in this menu.
Condition
Start Trigger on the start frame of the data frame.
TypeType(Bottommenu)
Data
Trigger on the selected frame.RemoteErrorOverload
IDConfigure(Bottommenu)
Format Select Standard or Extended.
ID Use the M knob and Directionkey on the front panel to set.
DataConfigure(Bottommenu)
ByteLength
Set the number of bytes with theM knob. The range is 1 to 8.
DataSet the data with the M knoband Direction key on the frontpanel.
ID&DataConfigure(Bottommenu)
Format Select Standard or Extended.
ID Use the M knob and Directionkey on the front panel to set.
ByteLength
Set the number of bytes with theM knob. The range is 1 to 8.
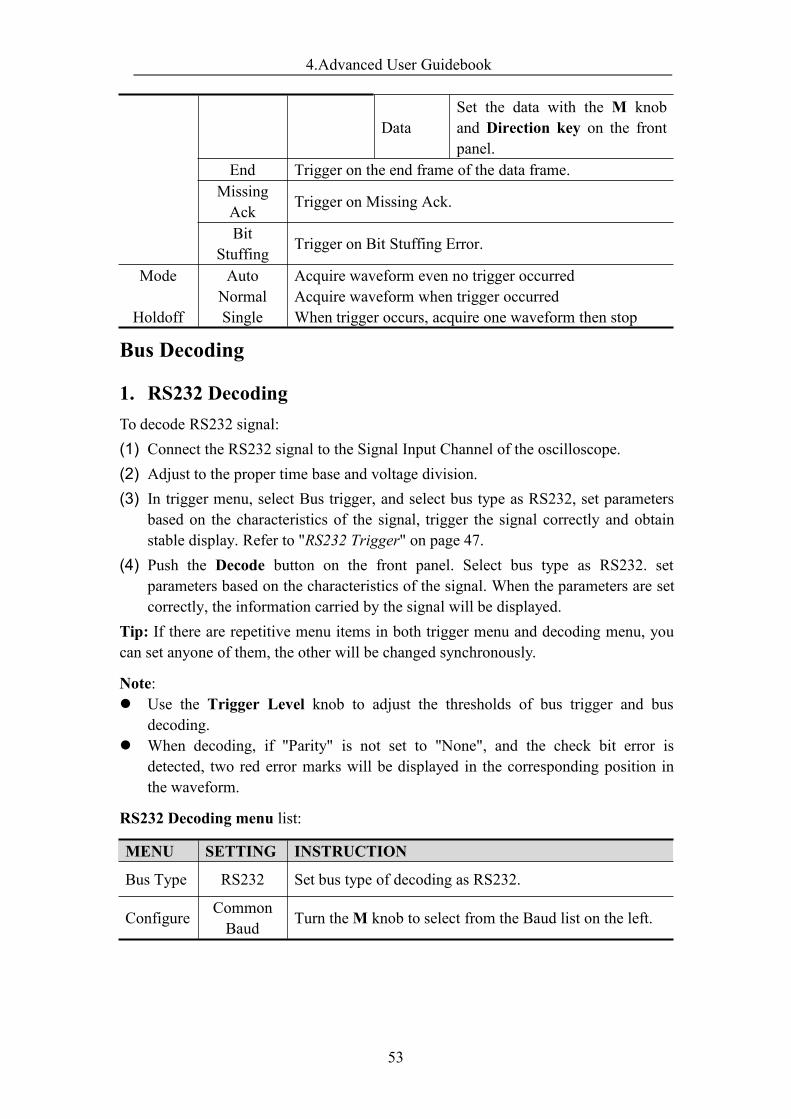
4.Advanced User Guidebook
53
DataSet the data with the M knoband Direction key on the frontpanel.
End Trigger on the end frame of the data frame.MissingAck Trigger on Missing Ack.
BitStuffing Trigger on Bit Stuffing Error.
Mode
Holdoff
AutoNormalSingle
Acquire waveform even no trigger occurredAcquire waveform when trigger occurredWhen trigger occurs, acquire one waveform then stop
Bus Decoding
1. RS232 DecodingTo decode RS232 signal:(1) Connect the RS232 signal to the Signal Input Channel of the oscilloscope.(2) Adjust to the proper time base and voltage division.(3) In trigger menu, select Bus trigger, and select bus type as RS232, set parameters
based on the characteristics of the signal, trigger the signal correctly and obtainstable display. Refer to "RS232 Trigger" on page 47.
(4) Push the Decode button on the front panel. Select bus type as RS232. setparameters based on the characteristics of the signal. When the parameters are setcorrectly, the information carried by the signal will be displayed.
Tip: If there are repetitive menu items in both trigger menu and decoding menu, youcan set anyone of them, the other will be changed synchronously.
Note: Use the Trigger Level knob to adjust the thresholds of bus trigger and bus
decoding. When decoding, if "Parity" is not set to "None", and the check bit error is
detected, two red error marks will be displayed in the corresponding position inthe waveform.
RS232 Decoding menu list:
MENU SETTING INSTRUCTION
Bus Type RS232 Set bus type of decoding as RS232.
Configure CommonBaud Turn theM knob to select from the Baud list on the left.
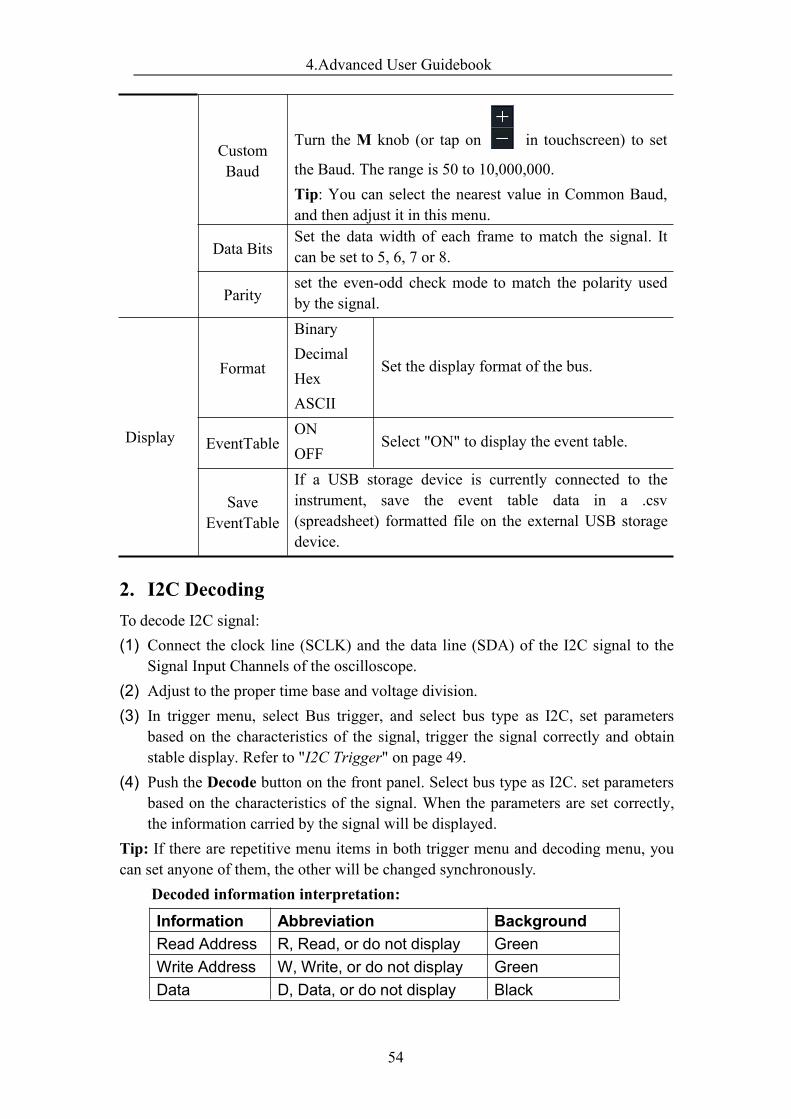
4.Advanced User Guidebook
54
CustomBaud
Turn the M knob (or tap on in touchscreen) to set
the Baud. The range is 50 to 10,000,000.Tip: You can select the nearest value in Common Baud,and then adjust it in this menu.
Data BitsSet the data width of each frame to match the signal. Itcan be set to 5, 6, 7 or 8.
Parityset the even-odd check mode to match the polarity usedby the signal.
Display
Format
BinaryDecimalHexASCII
Set the display format of the bus.
EventTableONOFF
Select "ON" to display the event table.
SaveEventTable
If a USB storage device is currently connected to theinstrument, save the event table data in a .csv(spreadsheet) formatted file on the external USB storagedevice.
2. I2C DecodingTo decode I2C signal:(1) Connect the clock line (SCLK) and the data line (SDA) of the I2C signal to the
Signal Input Channels of the oscilloscope.(2) Adjust to the proper time base and voltage division.(3) In trigger menu, select Bus trigger, and select bus type as I2C, set parameters
based on the characteristics of the signal, trigger the signal correctly and obtainstable display. Refer to "I2C Trigger" on page 49.
(4) Push the Decode button on the front panel. Select bus type as I2C. set parametersbased on the characteristics of the signal. When the parameters are set correctly,the information carried by the signal will be displayed.
Tip: If there are repetitive menu items in both trigger menu and decoding menu, youcan set anyone of them, the other will be changed synchronously.
Decoded information interpretation:
Information Abbreviation BackgroundRead Address R, Read, or do not display GreenWrite Address W, Write, or do not display GreenData D, Data, or do not display Black
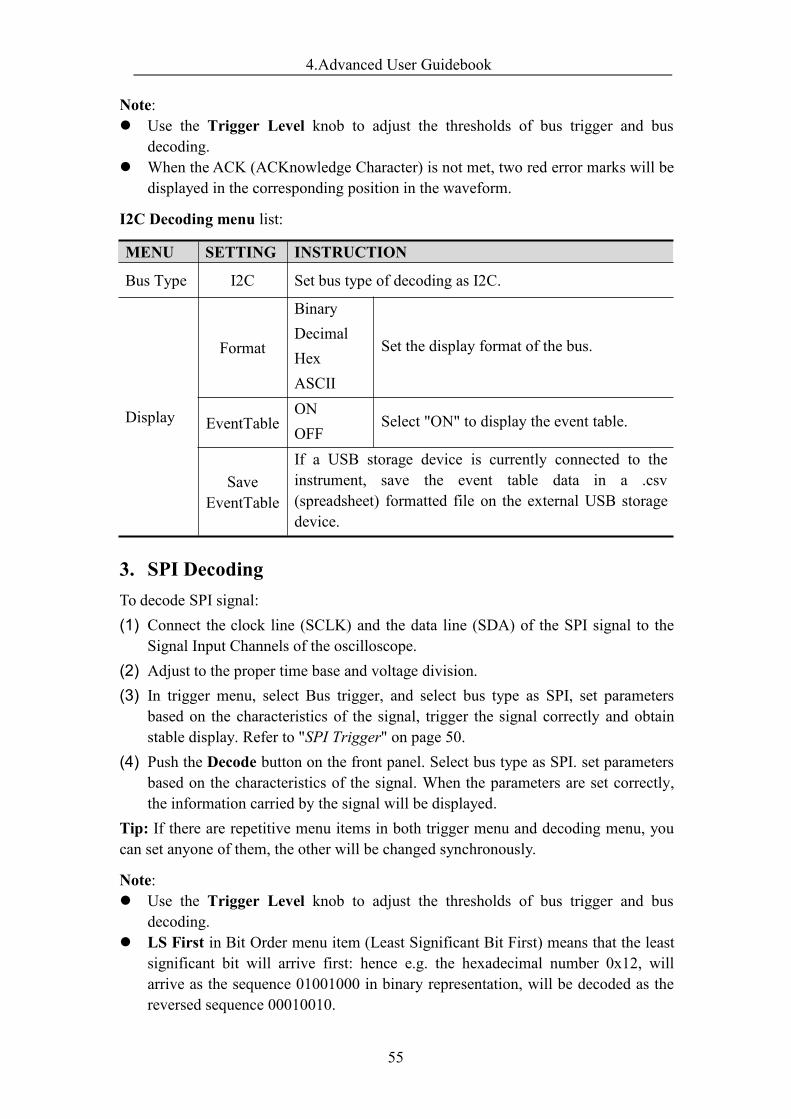
4.Advanced User Guidebook
55
Note: Use the Trigger Level knob to adjust the thresholds of bus trigger and bus
decoding. When the ACK (ACKnowledge Character) is not met, two red error marks will be
displayed in the corresponding position in the waveform.
I2C Decoding menu list:
MENU SETTING INSTRUCTION
Bus Type I2C Set bus type of decoding as I2C.
Display
Format
BinaryDecimalHexASCII
Set the display format of the bus.
EventTableONOFF
Select "ON" to display the event table.
SaveEventTable
If a USB storage device is currently connected to theinstrument, save the event table data in a .csv(spreadsheet) formatted file on the external USB storagedevice.
3. SPI DecodingTo decode SPI signal:(1) Connect the clock line (SCLK) and the data line (SDA) of the SPI signal to the
Signal Input Channels of the oscilloscope.(2) Adjust to the proper time base and voltage division.(3) In trigger menu, select Bus trigger, and select bus type as SPI, set parameters
based on the characteristics of the signal, trigger the signal correctly and obtainstable display. Refer to "SPI Trigger" on page 50.
(4) Push the Decode button on the front panel. Select bus type as SPI. set parametersbased on the characteristics of the signal. When the parameters are set correctly,the information carried by the signal will be displayed.
Tip: If there are repetitive menu items in both trigger menu and decoding menu, youcan set anyone of them, the other will be changed synchronously.
Note: Use the Trigger Level knob to adjust the thresholds of bus trigger and bus
decoding. LS First in Bit Order menu item (Least Significant Bit First) means that the least
significant bit will arrive first: hence e.g. the hexadecimal number 0x12, willarrive as the sequence 01001000 in binary representation, will be decoded as thereversed sequence 00010010.
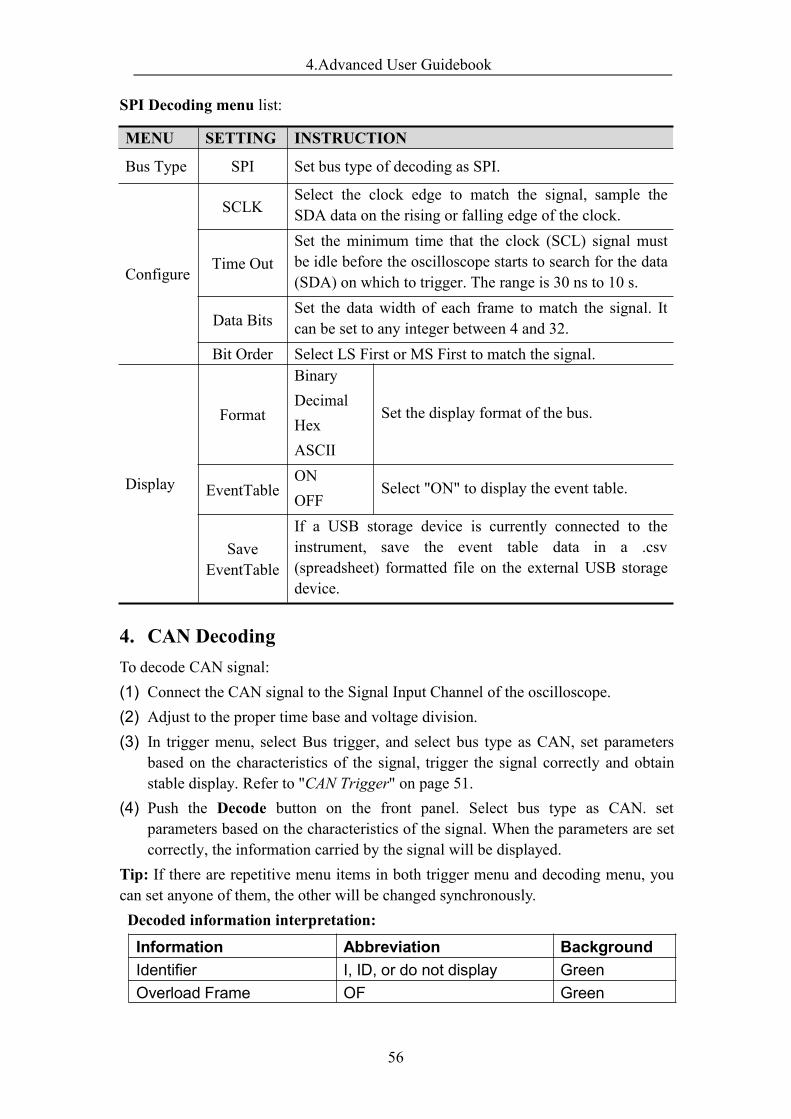
4.Advanced User Guidebook
56
SPI Decoding menu list:
MENU SETTING INSTRUCTION
Bus Type SPI Set bus type of decoding as SPI.
Configure
SCLKSelect the clock edge to match the signal, sample theSDA data on the rising or falling edge of the clock.
Time OutSet the minimum time that the clock (SCL) signal mustbe idle before the oscilloscope starts to search for the data(SDA) on which to trigger. The range is 30 ns to 10 s.
Data BitsSet the data width of each frame to match the signal. Itcan be set to any integer between 4 and 32.
Bit Order Select LS First or MS First to match the signal.
Display
Format
BinaryDecimalHexASCII
Set the display format of the bus.
EventTableONOFF
Select "ON" to display the event table.
SaveEventTable
If a USB storage device is currently connected to theinstrument, save the event table data in a .csv(spreadsheet) formatted file on the external USB storagedevice.
4. CAN DecodingTo decode CAN signal:(1) Connect the CAN signal to the Signal Input Channel of the oscilloscope.(2) Adjust to the proper time base and voltage division.(3) In trigger menu, select Bus trigger, and select bus type as CAN, set parameters
based on the characteristics of the signal, trigger the signal correctly and obtainstable display. Refer to "CAN Trigger" on page 51.
(4) Push the Decode button on the front panel. Select bus type as CAN. setparameters based on the characteristics of the signal. When the parameters are setcorrectly, the information carried by the signal will be displayed.
Tip: If there are repetitive menu items in both trigger menu and decoding menu, youcan set anyone of them, the other will be changed synchronously.Decoded information interpretation:
Information Abbreviation BackgroundIdentifier I, ID, or do not display GreenOverload Frame OF Green
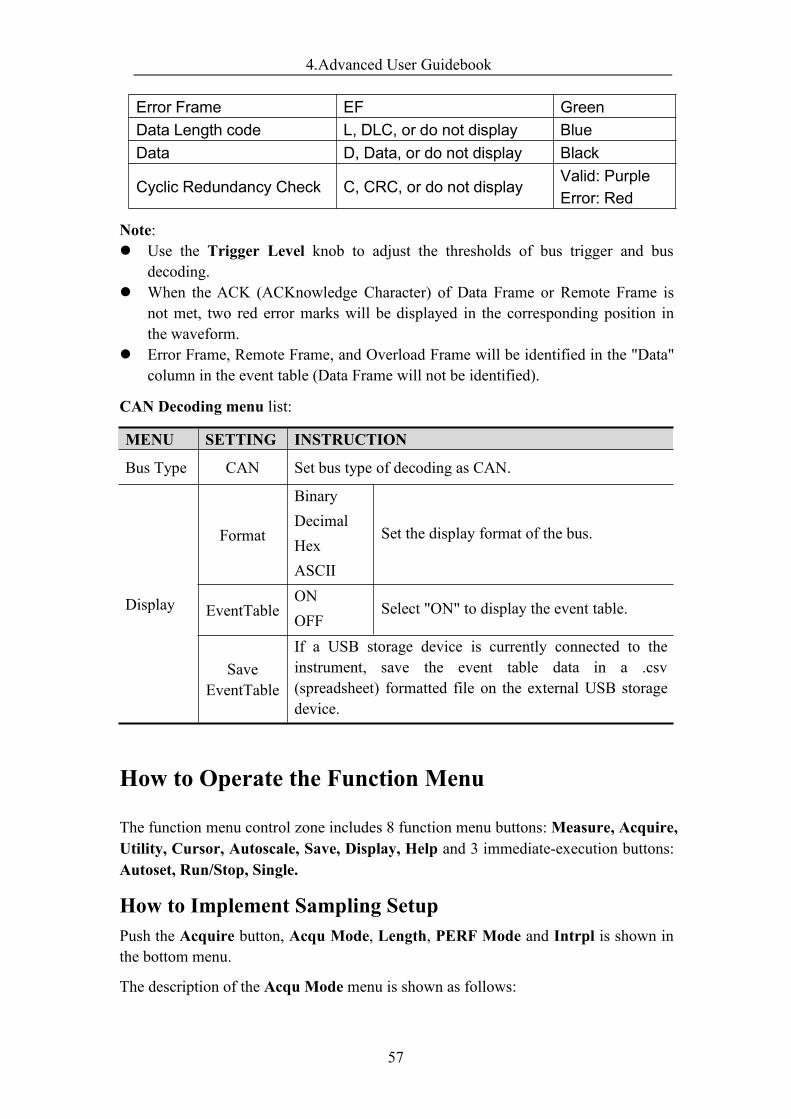
4.Advanced User Guidebook
57
Error Frame EF GreenData Length code L, DLC, or do not display BlueData D, Data, or do not display Black
Cyclic Redundancy Check C, CRC, or do not displayValid: PurpleError: Red
Note: Use the Trigger Level knob to adjust the thresholds of bus trigger and bus
decoding. When the ACK (ACKnowledge Character) of Data Frame or Remote Frame is
not met, two red error marks will be displayed in the corresponding position inthe waveform.
Error Frame, Remote Frame, and Overload Frame will be identified in the "Data"column in the event table (Data Frame will not be identified).
CAN Decoding menu list:
MENU SETTING INSTRUCTION
Bus Type CAN Set bus type of decoding as CAN.
Display
Format
BinaryDecimalHexASCII
Set the display format of the bus.
EventTableONOFF
Select "ON" to display the event table.
SaveEventTable
If a USB storage device is currently connected to theinstrument, save the event table data in a .csv(spreadsheet) formatted file on the external USB storagedevice.
How to Operate the Function Menu
The function menu control zone includes 8 function menu buttons:Measure, Acquire,Utility, Cursor, Autoscale, Save, Display, Help and 3 immediate-execution buttons:Autoset, Run/Stop, Single.
How to Implement Sampling SetupPush the Acquire button, Acqu Mode, Length, PERF Mode and Intrpl is shown inthe bottom menu.
The description of the Acqu Mode menu is shown as follows:
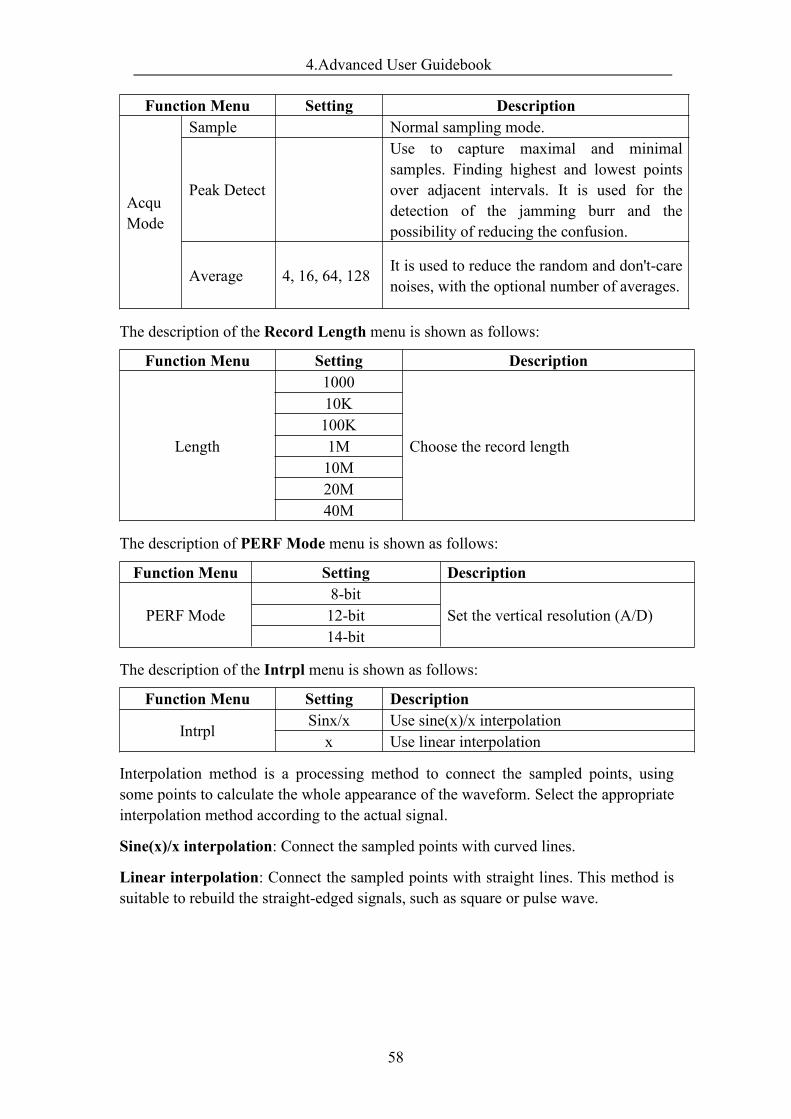
4.Advanced User Guidebook
58
Function Menu Setting Description
AcquMode
Sample Normal sampling mode.
Peak Detect
Use to capture maximal and minimalsamples. Finding highest and lowest pointsover adjacent intervals. It is used for thedetection of the jamming burr and thepossibility of reducing the confusion.
Average 4, 16, 64, 128 It is used to reduce the random and don't-carenoises, with the optional number of averages.
The description of the Record Length menu is shown as follows:
Function Menu Setting Description
Length
1000
Choose the record length
10K100K1M10M20M40M
The description of PERF Mode menu is shown as follows:
Function Menu Setting Description
PERF Mode8-bit
Set the vertical resolution (A/D)12-bit14-bit
The description of the Intrpl menu is shown as follows:
Function Menu Setting Description
IntrplSinx/x Use sine(x)/x interpolationx Use linear interpolation
Interpolation method is a processing method to connect the sampled points, usingsome points to calculate the whole appearance of the waveform. Select the appropriateinterpolation method according to the actual signal.
Sine(x)/x interpolation: Connect the sampled points with curved lines.
Linear interpolation: Connect the sampled points with straight lines. This method issuitable to rebuild the straight-edged signals, such as square or pulse wave.
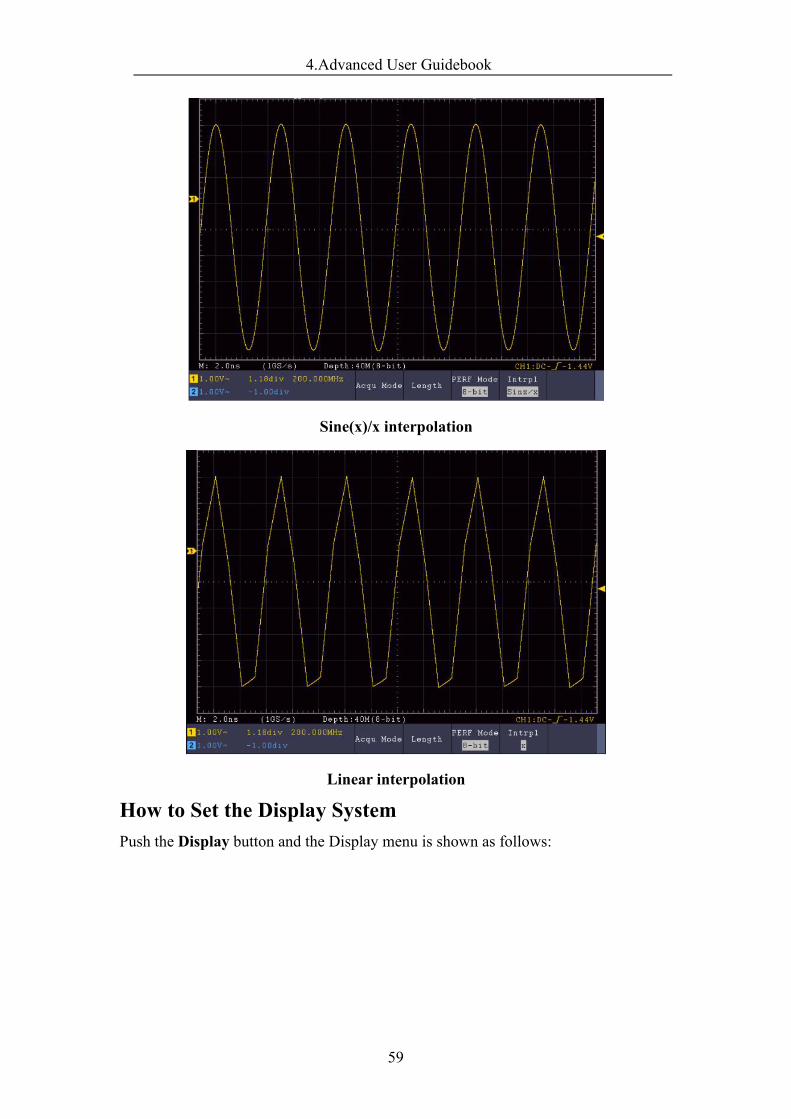
4.Advanced User Guidebook
59
Sine(x)/x interpolation
Linear interpolation
How to Set the Display SystemPush the Display button and the Display menu is shown as follows:
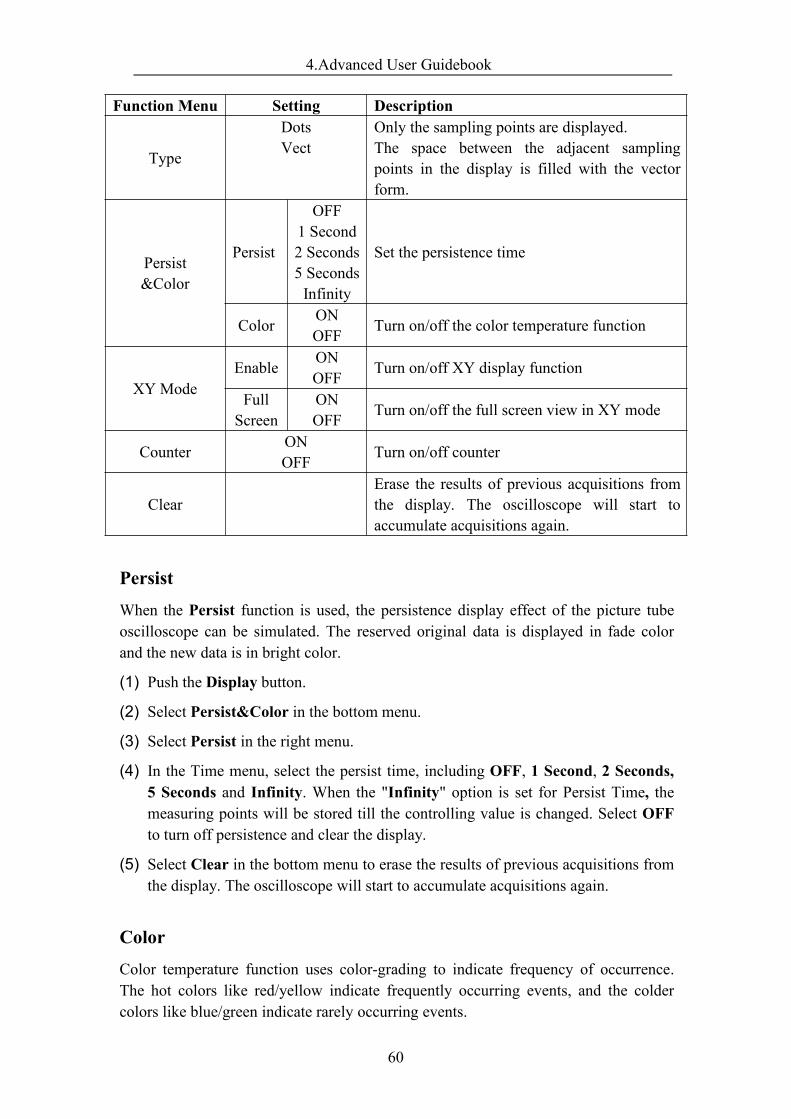
4.Advanced User Guidebook
60
Persist
When the Persist function is used, the persistence display effect of the picture tubeoscilloscope can be simulated. The reserved original data is displayed in fade colorand the new data is in bright color.
(1) Push the Display button.
(2) Select Persist&Color in the bottom menu.
(3) Select Persist in the right menu.
(4) In the Time menu, select the persist time, including OFF, 1 Second, 2 Seconds,5 Seconds and Infinity. When the "Infinity" option is set for Persist Time, themeasuring points will be stored till the controlling value is changed. Select OFFto turn off persistence and clear the display.
(5) Select Clear in the bottom menu to erase the results of previous acquisitions fromthe display. The oscilloscope will start to accumulate acquisitions again.
Color
Color temperature function uses color-grading to indicate frequency of occurrence.The hot colors like red/yellow indicate frequently occurring events, and the coldercolors like blue/green indicate rarely occurring events.
Function Menu Setting Description
Type
DotsVect
Only the sampling points are displayed.The space between the adjacent samplingpoints in the display is filled with the vectorform.
Persist&Color
Persist
OFF1 Second2 Seconds5 SecondsInfinity
Set the persistence time
Color ONOFF Turn on/off the color temperature function
XY ModeEnable ON
OFF Turn on/off XY display function
FullScreen
ONOFF Turn on/off the full screen view in XY mode
Counter ONOFF Turn on/off counter
ClearErase the results of previous acquisitions fromthe display. The oscilloscope will start toaccumulate acquisitions again.
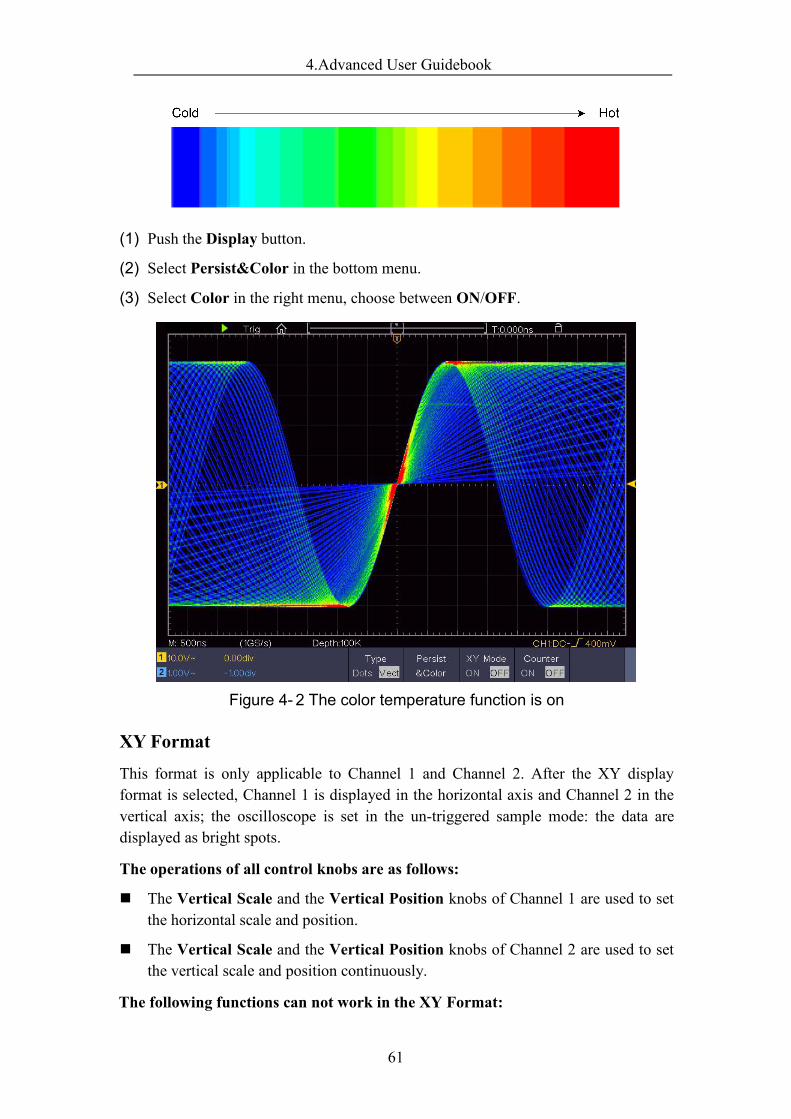
4.Advanced User Guidebook
61
(1) Push the Display button.
(2) Select Persist&Color in the bottom menu.
(3) Select Color in the right menu, choose between ON/OFF.
Figure 4- 2 The color temperature function is on
XY Format
This format is only applicable to Channel 1 and Channel 2. After the XY displayformat is selected, Channel 1 is displayed in the horizontal axis and Channel 2 in thevertical axis; the oscilloscope is set in the un-triggered sample mode: the data aredisplayed as bright spots.
The operations of all control knobs are as follows:
The Vertical Scale and the Vertical Position knobs of Channel 1 are used to setthe horizontal scale and position.
The Vertical Scale and the Vertical Position knobs of Channel 2 are used to setthe vertical scale and position continuously.
The following functions can not work in the XY Format:
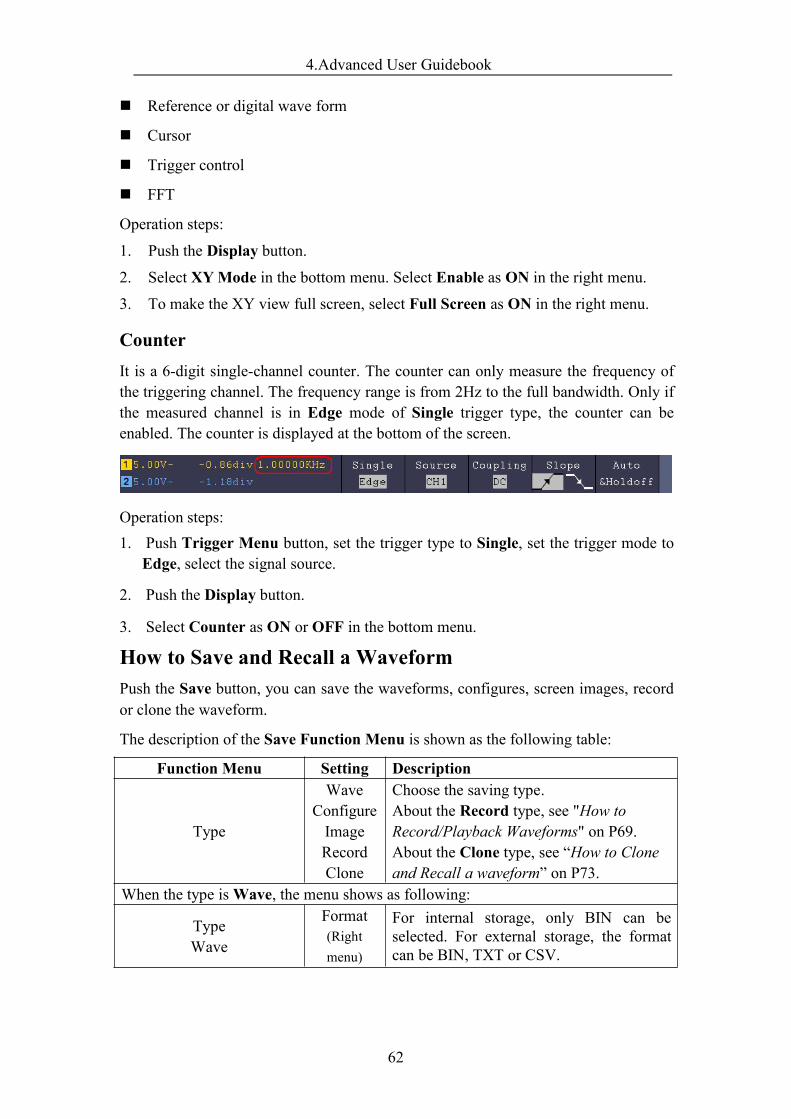
4.Advanced User Guidebook
62
Reference or digital wave form
Cursor
Trigger control
FFT
Operation steps:
1. Push the Display button.
2. Select XYMode in the bottom menu. Select Enable as ON in the right menu.
3. To make the XY view full screen, select Full Screen as ON in the right menu.
CounterIt is a 6-digit single-channel counter. The counter can only measure the frequency ofthe triggering channel. The frequency range is from 2Hz to the full bandwidth. Only ifthe measured channel is in Edge mode of Single trigger type, the counter can beenabled. The counter is displayed at the bottom of the screen.
Operation steps:1. Push Trigger Menu button, set the trigger type to Single, set the trigger mode to
Edge, select the signal source.
2. Push the Display button.
3. Select Counter as ON or OFF in the bottom menu.
How to Save and Recall a WaveformPush the Save button, you can save the waveforms, configures, screen images, recordor clone the waveform.
The description of the Save Function Menu is shown as the following table:
Function Menu Setting Description
Type
WaveConfigureImageRecordClone
Choose the saving type.About the Record type, see "How toRecord/Playback Waveforms" on P69.About the Clone type, see “How to Cloneand Recall a waveform” on P73.
When the type isWave, the menu shows as following:
TypeWave
Format(Rightmenu)
For internal storage, only BIN can beselected. For external storage, the formatcan be BIN, TXT or CSV.
4.Advanced User Guidebook
63
Source
CH1CH2MathAll
Choose the waveform to be saved. (Ifcertain channel is off, the correspondingmenu item will be disabled.)(Choose All to save all the waveforms thatare turned on. You can save into thecurrent internal object address, or into USBstorage as a single file.)
Object & Show
Object 0 - 99 Choose the address which the waveform issaved to or recall from.
Show ONOFF
Recall or close the waveform stored in thecurrent object address. When the show isON, if the current object address has beenused, the stored waveform will be shown,the address number and relevantinformation will be displayed at the top leftof the screen; if the address is empty, itwill prompt "None is saved".
Close All Close all the waveforms stored in theobject address.
Save
Save the waveform of the source to theselected address. Whatever the Type ofsave menu is set, you can save thewaveform by just pressing the Copy panelbutton in any user interface.Select Type in the bottom menu, in theright Format menu, you can select thestorage format.
Storage InternalExternal
Save to internal storage or USB storage.When External is selected, save thewaveform according to the current recordlength (see "Record Length menu" on P58);the file name is editable. The BINwaveform file could be open by waveformanalysis software (on the supplied CD).
When the type is Configure, the menu shows as following:
Configure
Setting0…..
Setting19The setting address
Save Save the current oscilloscope configure tothe internal storage
Load Recall the configure from the selectedaddress
When the type is Image, the menu shows as following:
4.Advanced User Guidebook
64
Save
Save the current display screen. The filecan be only stored in a USB storage, so aUSB storage must be connected first. Thefile name is editable. The file is stored inBMP format.
Save and Recall the Waveform
The oscilloscope can store 100 waveforms, which can be displayed with the currentwaveform at the same time. The stored waveform called out can not be adjusted.
In order to save the waveform of CH1, CH2 and Math into the address 1, theoperation steps should be followed:
1. Turn on CH1, CH2 and Math channels.
2. Push the Save button.
3. Saving: Select Type in the bottom menu, selectWave in the left menu.
4. Select Storage in the bottom menu, select Internal in the right menu.
5. Select Source in the bottom menu, select All in the right menu for Source.
6. Select Object & Show in the bottom menu, select 1 as object address in the leftmenu.
7. Select Save in the bottom menu to save the waveform.
8. Recalling: Select Object & Show in the bottom menu, select 1 in the left menu.In the right menu, select Show as ON, the waveform stored in the address will beshown, the address number and relevant information will be displayed at the topleft of the screen.
In order to save the waveform of CH1 and CH2 into the USB storage as a BIN file,the operation steps should be followed:
1. Turn on CH1 and CH2 channels, turn off the Math channel.
2. Push the Save button.
3. Saving: Select Type in the bottom menu, selectWave in the left menu.
4. Select Storage in the bottom menu, select External in the right menu.
5. Select Type in the bottom menu, select BIN in the right menu as the storageformat.
6. Select Source in the bottom menu, select All in the right menu for Source.
7. Select Save in the bottom menu, an input keyboard used to edit the file name willpop up. The default name is current system date and time. Select the key inthe keyboard to confirm.
4.Advanced User Guidebook
65
8. Recalling: The BIN waveform file could be open by waveform analysis software(on the supplied CD).
Tip:
Whatever the Type of save menu is set, you can save the waveform by just pressingthe Copy panel button in any user interface. If the Storage of the save menu is set as"External", you should install the USB disk. Please refer to the contents below toinstall the USB disk and name the file to be saved.
Save the current screen image:
The screen image can only be stored in USB disk, so you should connect a USB diskwith the instrument.
1. Install the USB disk: Insert the USB disk into the "USB Host port" of "Figure3- 1 Front panel". If an icon appears on the top right of the screen, the USBdisk is installed successfully. If the USB disk cannot be recognized, format theUSB disk according to the methods in "USB disk Requirements" on P65.
2. After the USB disk is installed, push the Save panel button, the save menu isdisplayed at the bottom of the screen.
3. Select Type in the bottom menu, select Image in the left menu.
4. Select Save in the bottom menu, an input keyboard used to edit the file name willpop up. The default name is current system date and time. Select the key inthe keyboard to confirm.
USB disk RequirementsThe supported format of the USB disk: FAT32 file system, the allocation unit sizecannot exceed 4K, mass storage USB disk is also supported. If the USB disk doesn'twork properly, format it into the supported format and try again. Follow any of thefollowing two methods to format the USB disk: using system-provided function andusing the formatting tools. (The USB disk of 8 G or 8 G above can only be formattedusing the second method – using the formatting tools.)
Use system-provided function to format the USB disk1. Connect the USB disk to the computer.2. Right click Computer-Manage to enter Computer Management interface.3. Click Disk Management menu, and information about the USB disk will display
on the right side with red mark 1 and 2.
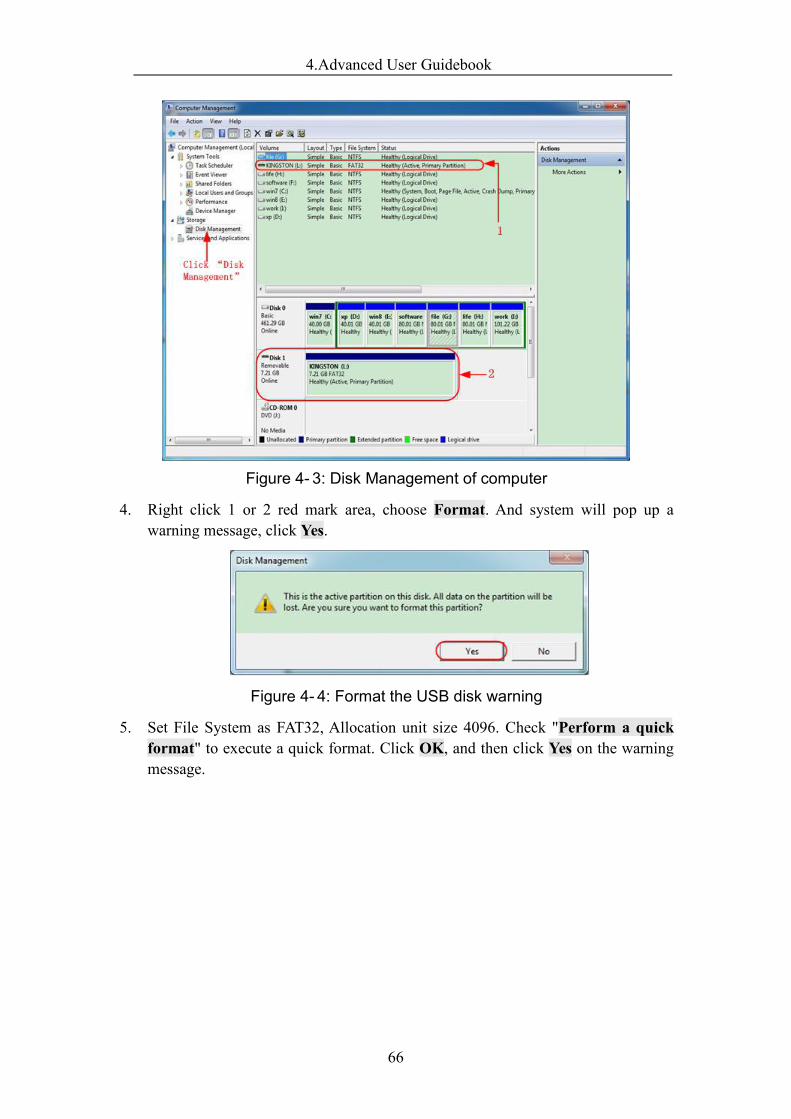
4.Advanced User Guidebook
66
Figure 4- 3: Disk Management of computer
4. Right click 1 or 2 red mark area, choose Format. And system will pop up awarning message, click Yes.
Figure 4- 4: Format the USB disk warning
5. Set File System as FAT32, Allocation unit size 4096. Check "Perform a quickformat" to execute a quick format. Click OK, and then click Yes on the warningmessage.
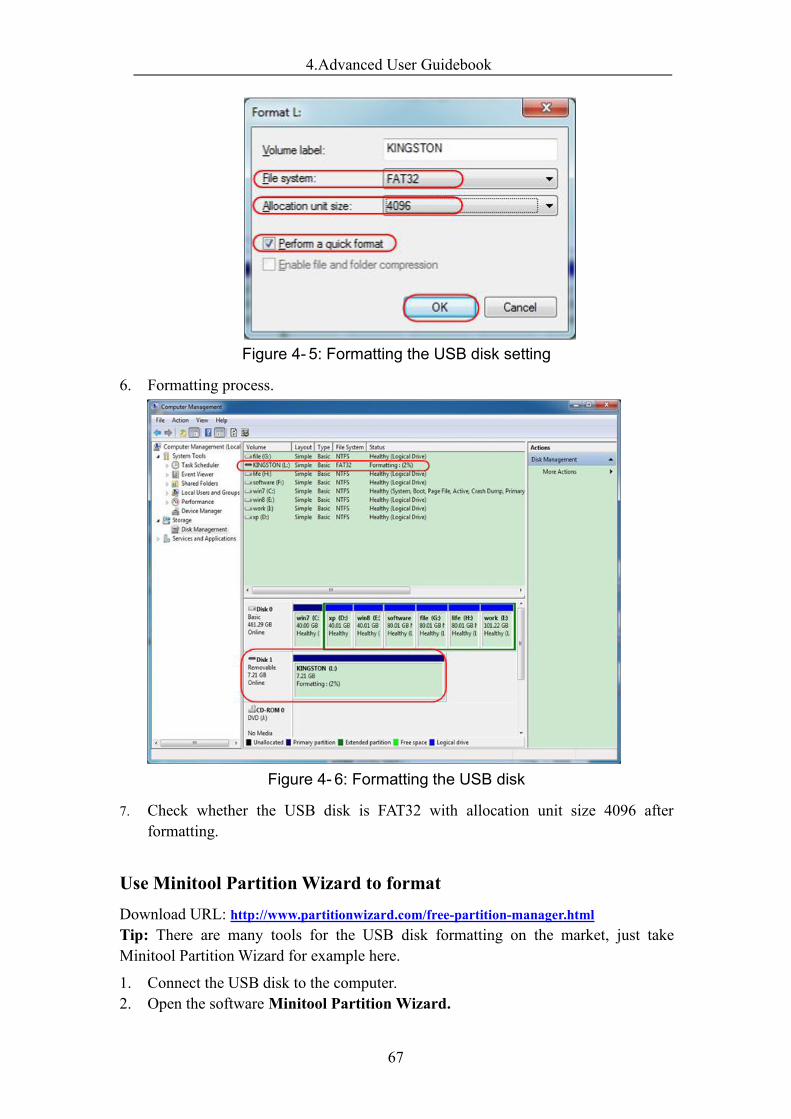
4.Advanced User Guidebook
67
Figure 4- 5: Formatting the USB disk setting
6. Formatting process.
Figure 4- 6: Formatting the USB disk
7. Check whether the USB disk is FAT32 with allocation unit size 4096 afterformatting.
Use Minitool PartitionWizard to formatDownload URL: http://www.partitionwizard.com/free-partition-manager.htmlTip: There are many tools for the USB disk formatting on the market, just takeMinitool Partition Wizard for example here.
1. Connect the USB disk to the computer.2. Open the softwareMinitool Partition Wizard.
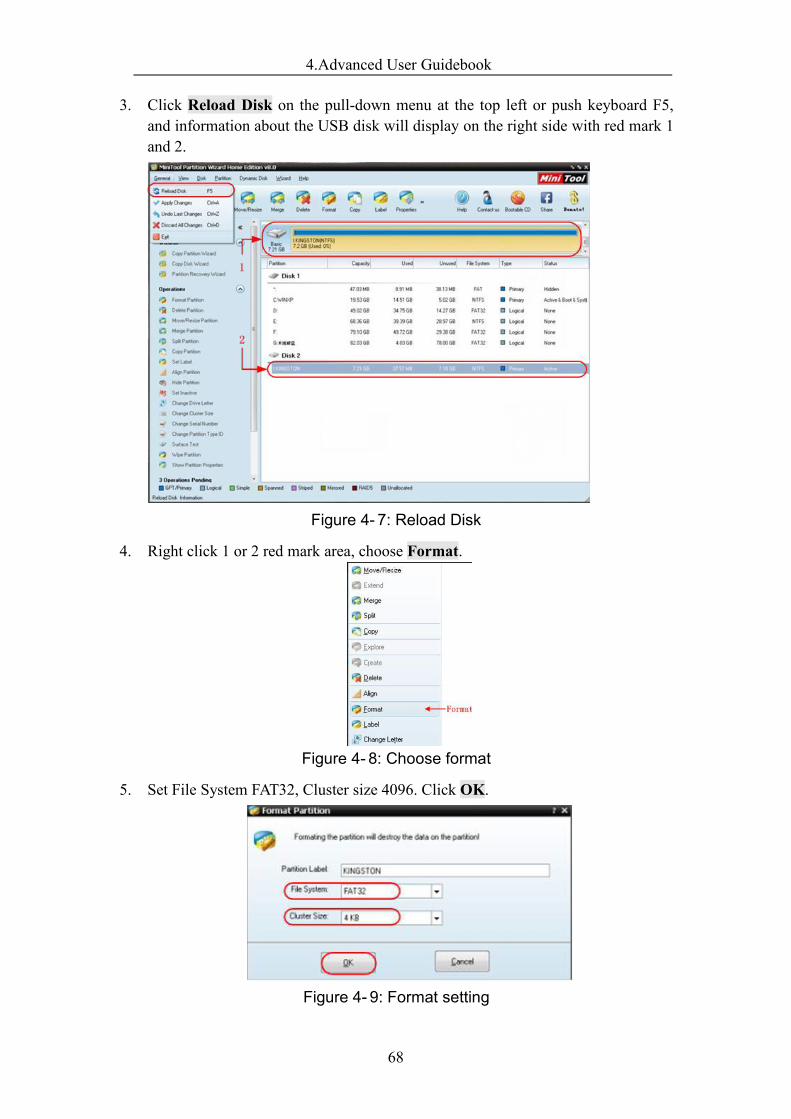
4.Advanced User Guidebook
68
3. Click Reload Disk on the pull-down menu at the top left or push keyboard F5,and information about the USB disk will display on the right side with red mark 1and 2.
Figure 4- 7: Reload Disk
4. Right click 1 or 2 red mark area, choose Format.
Figure 4- 8: Choose format
5. Set File System FAT32, Cluster size 4096. Click OK.
Figure 4- 9: Format setting
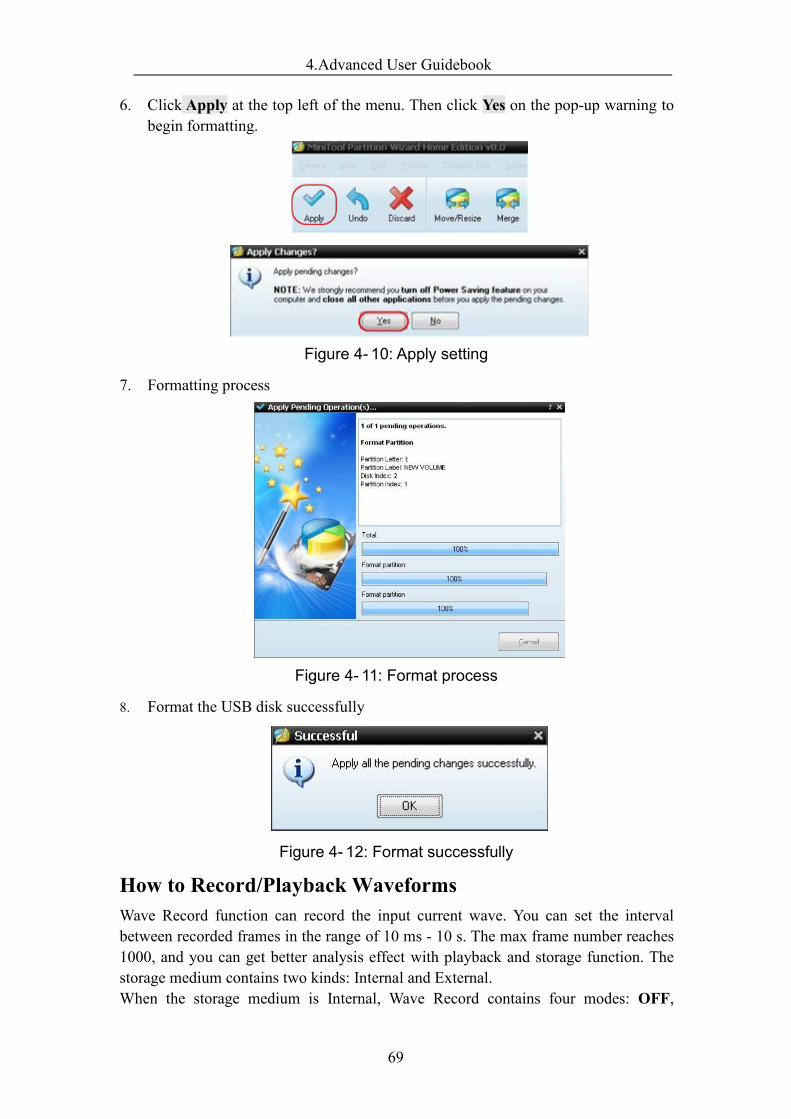
4.Advanced User Guidebook
69
6. Click Apply at the top left of the menu. Then click Yes on the pop-up warning tobegin formatting.
Figure 4- 10: Apply setting
7. Formatting process
Figure 4- 11: Format process
8. Format the USB disk successfully
Figure 4- 12: Format successfully
How to Record/Playback WaveformsWave Record function can record the input current wave. You can set the intervalbetween recorded frames in the range of 10 ms - 10 s. The max frame number reaches1000, and you can get better analysis effect with playback and storage function. Thestorage medium contains two kinds: Internal and External.When the storage medium is Internal, Wave Record contains four modes: OFF,
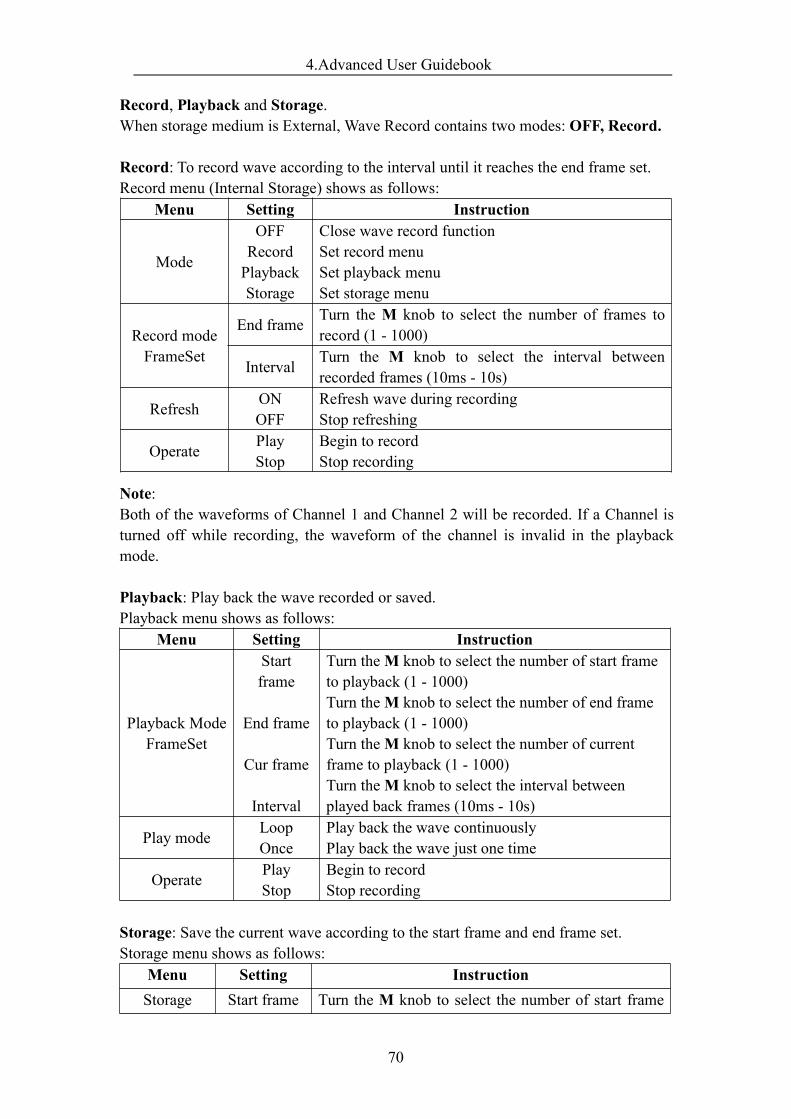
4.Advanced User Guidebook
70
Record, Playback and Storage.When storage medium is External, Wave Record contains two modes: OFF, Record.
Record: To record wave according to the interval until it reaches the end frame set.Record menu (Internal Storage) shows as follows:
Menu Setting Instruction
Mode
OFFRecordPlaybackStorage
Close wave record functionSet record menuSet playback menuSet storage menu
Record modeFrameSet
End frame Turn the M knob to select the number of frames torecord (1 - 1000)
Interval Turn the M knob to select the interval betweenrecorded frames (10ms - 10s)
Refresh ONOFF
Refresh wave during recordingStop refreshing
Operate PlayStop
Begin to recordStop recording
Note:Both of the waveforms of Channel 1 and Channel 2 will be recorded. If a Channel isturned off while recording, the waveform of the channel is invalid in the playbackmode.
Playback: Play back the wave recorded or saved.Playback menu shows as follows:
Menu Setting Instruction
Playback ModeFrameSet
Startframe
End frame
Cur frame
Interval
Turn theM knob to select the number of start frameto playback (1 - 1000)Turn theM knob to select the number of end frameto playback (1 - 1000)Turn theM knob to select the number of currentframe to playback (1 - 1000)Turn theM knob to select the interval betweenplayed back frames (10ms - 10s)
Play mode LoopOnce
Play back the wave continuouslyPlay back the wave just one time
Operate PlayStop
Begin to recordStop recording
Storage: Save the current wave according to the start frame and end frame set.Storage menu shows as follows:
Menu Setting InstructionStorage Start frame Turn the M knob to select the number of start frame
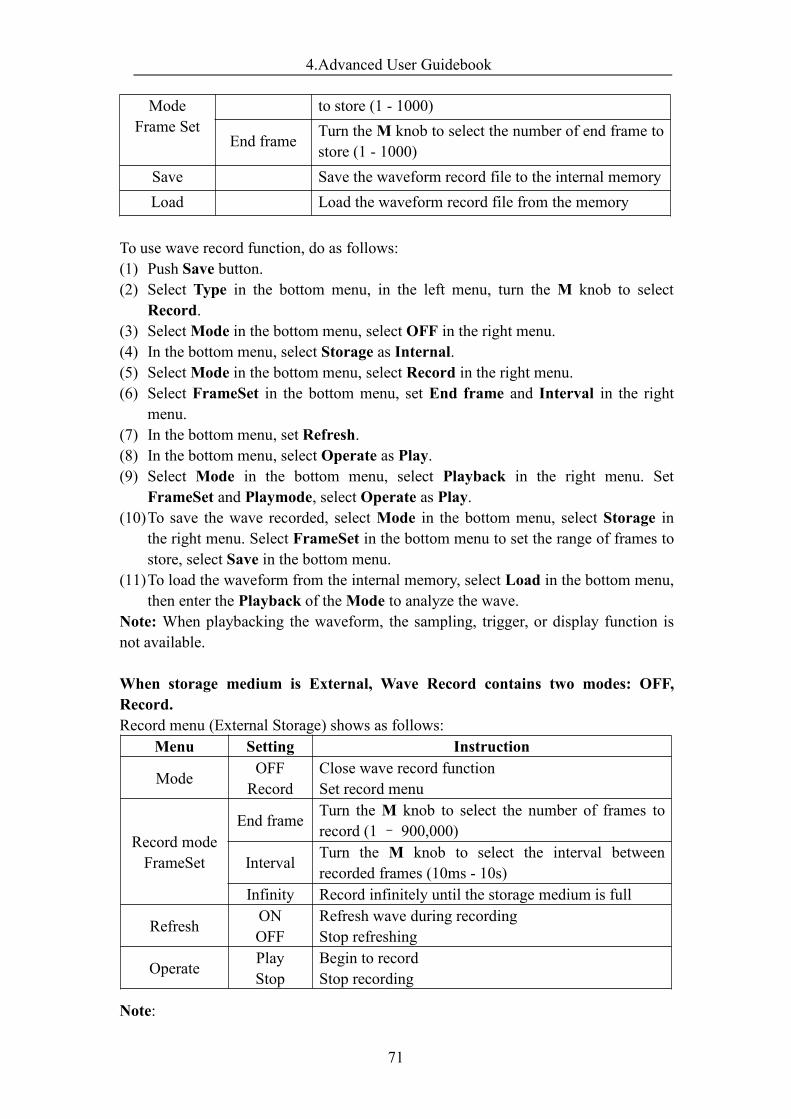
4.Advanced User Guidebook
71
ModeFrame Set
to store (1 - 1000)
End frame Turn theM knob to select the number of end frame tostore (1 - 1000)
Save Save the waveform record file to the internal memoryLoad Load the waveform record file from the memory
To use wave record function, do as follows:(1) Push Save button.(2) Select Type in the bottom menu, in the left menu, turn the M knob to select
Record.(3) SelectMode in the bottom menu, select OFF in the right menu.(4) In the bottom menu, select Storage as Internal.(5) SelectMode in the bottom menu, select Record in the right menu.(6) Select FrameSet in the bottom menu, set End frame and Interval in the right
menu.(7) In the bottom menu, set Refresh.(8) In the bottom menu, select Operate as Play.(9) Select Mode in the bottom menu, select Playback in the right menu. Set
FrameSet and Playmode, select Operate as Play.(10)To save the wave recorded, select Mode in the bottom menu, select Storage in
the right menu. Select FrameSet in the bottom menu to set the range of frames tostore, select Save in the bottom menu.
(11)To load the waveform from the internal memory, select Load in the bottom menu,then enter the Playback of theMode to analyze the wave.
Note: When playbacking the waveform, the sampling, trigger, or display function isnot available.
When storage medium is External, Wave Record contains two modes: OFF,Record.Record menu (External Storage) shows as follows:
Menu Setting Instruction
Mode OFFRecord
Close wave record functionSet record menu
Record modeFrameSet
End frame Turn the M knob to select the number of frames torecord (1– 900,000)
Interval Turn the M knob to select the interval betweenrecorded frames (10ms - 10s)
Infinity Record infinitely until the storage medium is full
Refresh ONOFF
Refresh wave during recordingStop refreshing
Operate PlayStop
Begin to recordStop recording
Note:
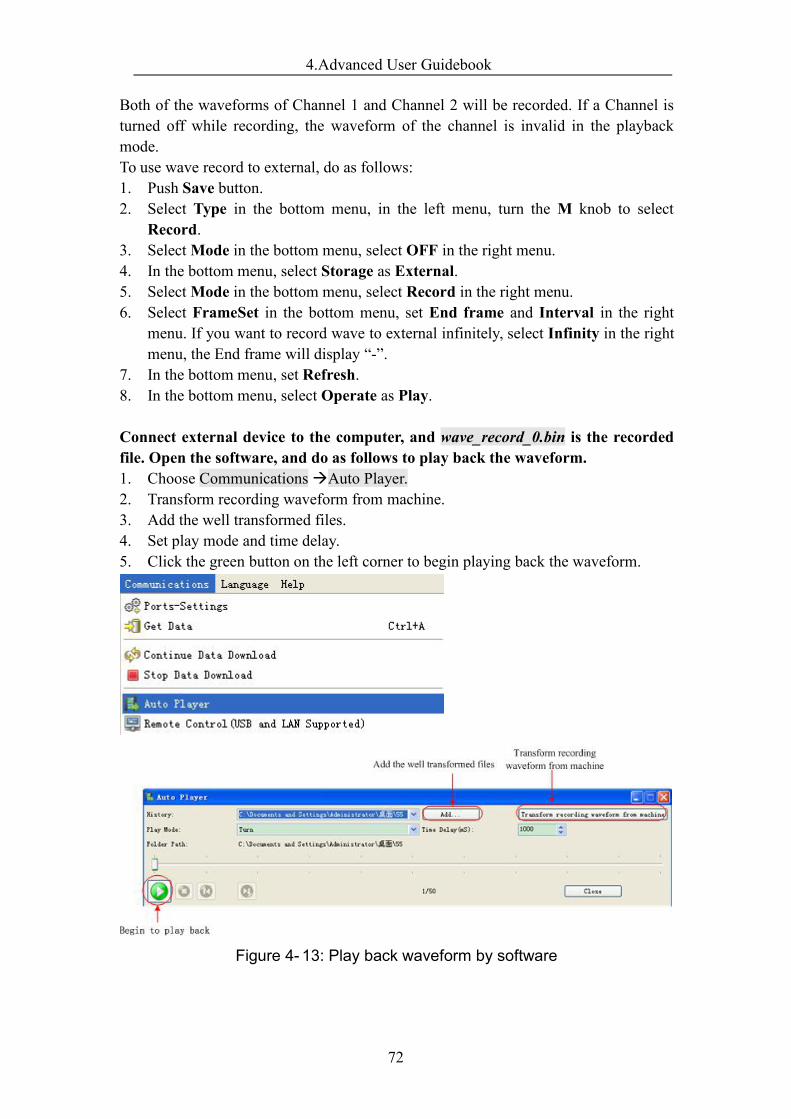
4.Advanced User Guidebook
72
Both of the waveforms of Channel 1 and Channel 2 will be recorded. If a Channel isturned off while recording, the waveform of the channel is invalid in the playbackmode.To use wave record to external, do as follows:1. Push Save button.2. Select Type in the bottom menu, in the left menu, turn the M knob to select
Record.3. SelectMode in the bottom menu, select OFF in the right menu.4. In the bottom menu, select Storage as External.5. SelectMode in the bottom menu, select Record in the right menu.6. Select FrameSet in the bottom menu, set End frame and Interval in the right
menu. If you want to record wave to external infinitely, select Infinity in the rightmenu, the End frame will display “-”.
7. In the bottom menu, set Refresh.8. In the bottom menu, select Operate as Play.
Connect external device to the computer, and wave_record_0.bin is the recordedfile. Open the software, and do as follows to play back the waveform.1. Choose CommunicationsAuto Player.2. Transform recording waveform from machine.3. Add the well transformed files.4. Set play mode and time delay.5. Click the green button on the left corner to begin playing back the waveform.
Figure 4- 13: Play back waveform by software
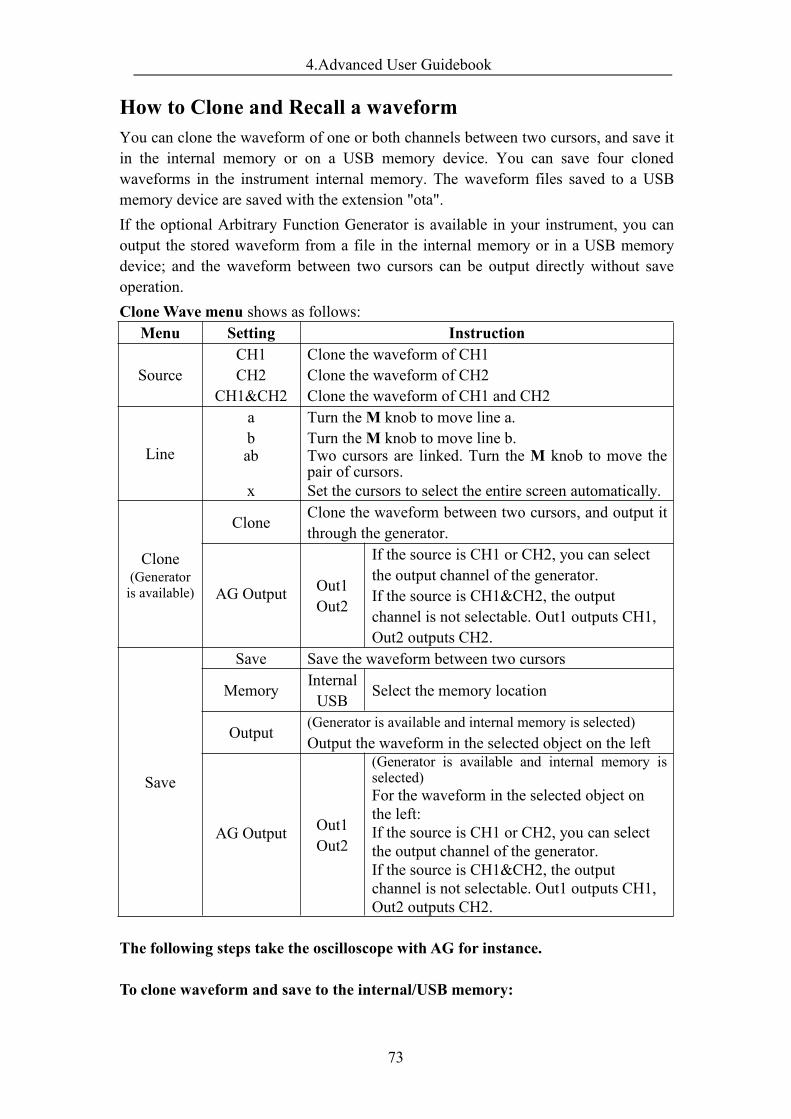
4.Advanced User Guidebook
73
How to Clone and Recall a waveformYou can clone the waveform of one or both channels between two cursors, and save itin the internal memory or on a USB memory device. You can save four clonedwaveforms in the instrument internal memory. The waveform files saved to a USBmemory device are saved with the extension "ota".If the optional Arbitrary Function Generator is available in your instrument, you canoutput the stored waveform from a file in the internal memory or in a USB memorydevice; and the waveform between two cursors can be output directly without saveoperation.Clone Wave menu shows as follows:
Menu Setting Instruction
SourceCH1CH2
CH1&CH2
Clone the waveform of CH1Clone the waveform of CH2Clone the waveform of CH1 and CH2
Line
abab
x
Turn theM knob to move line a.Turn theM knob to move line b.Two cursors are linked. Turn the M knob to move thepair of cursors.Set the cursors to select the entire screen automatically.
Clone(Generatoris available)
Clone Clone the waveform between two cursors, and output itthrough the generator.
AG Output Out1Out2
If the source is CH1 or CH2, you can selectthe output channel of the generator.If the source is CH1&CH2, the outputchannel is not selectable. Out1 outputs CH1,Out2 outputs CH2.
Save
Save Save the waveform between two cursors
Memory InternalUSB Select the memory location
Output(Generator is available and internal memory is selected)Output the waveform in the selected object on the left
AG Output Out1Out2
(Generator is available and internal memory isselected)For the waveform in the selected object onthe left:If the source is CH1 or CH2, you can selectthe output channel of the generator.If the source is CH1&CH2, the outputchannel is not selectable. Out1 outputs CH1,Out2 outputs CH2.
The following steps take the oscilloscope with AG for instance.
To clone waveform and save to the internal/USB memory:
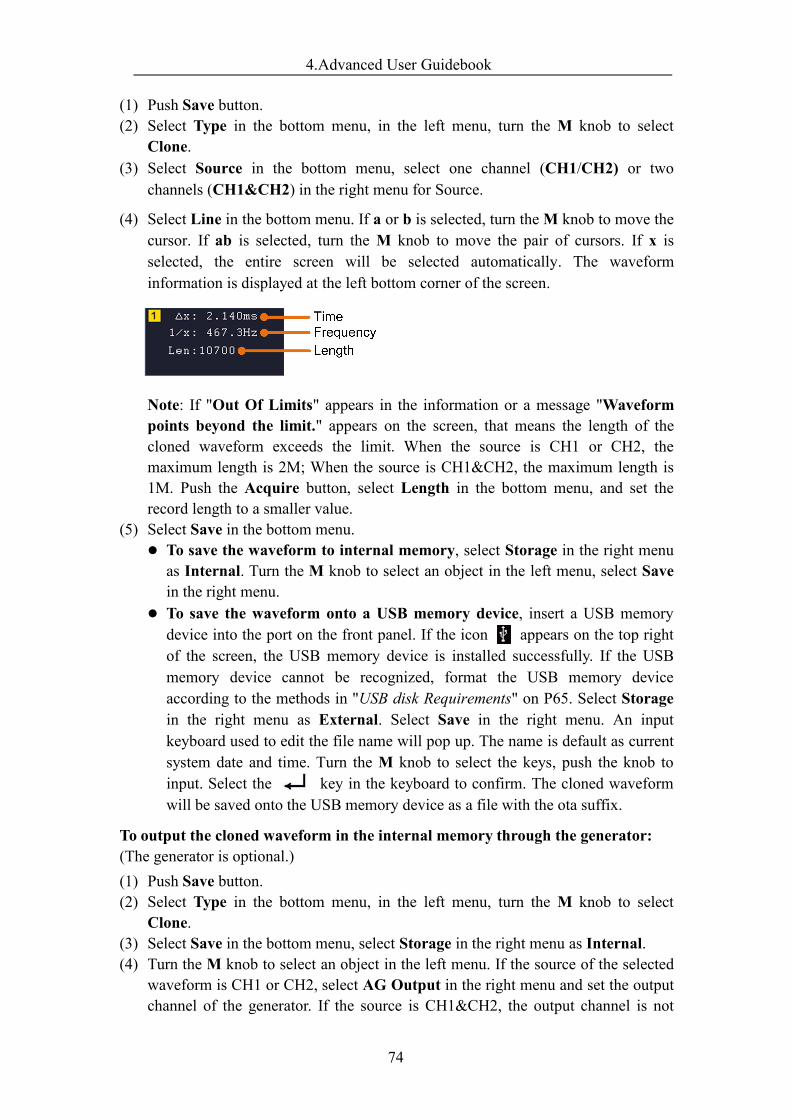
4.Advanced User Guidebook
74
(1) Push Save button.(2) Select Type in the bottom menu, in the left menu, turn the M knob to select
Clone.(3) Select Source in the bottom menu, select one channel (CH1/CH2) or two
channels (CH1&CH2) in the right menu for Source.
(4) Select Line in the bottom menu. If a or b is selected, turn theM knob to move thecursor. If ab is selected, turn the M knob to move the pair of cursors. If x isselected, the entire screen will be selected automatically. The waveforminformation is displayed at the left bottom corner of the screen.
Note: If "Out Of Limits" appears in the information or a message "Waveformpoints beyond the limit." appears on the screen, that means the length of thecloned waveform exceeds the limit. When the source is CH1 or CH2, themaximum length is 2M; When the source is CH1&CH2, the maximum length is1M. Push the Acquire button, select Length in the bottom menu, and set therecord length to a smaller value.
(5) Select Save in the bottom menu. To save the waveform to internal memory, select Storage in the right menu
as Internal. Turn the M knob to select an object in the left menu, select Savein the right menu.
To save the waveform onto a USB memory device, insert a USB memorydevice into the port on the front panel. If the icon appears on the top rightof the screen, the USB memory device is installed successfully. If the USBmemory device cannot be recognized, format the USB memory deviceaccording to the methods in "USB disk Requirements" on P65. Select Storagein the right menu as External. Select Save in the right menu. An inputkeyboard used to edit the file name will pop up. The name is default as currentsystem date and time. Turn the M knob to select the keys, push the knob toinput. Select the key in the keyboard to confirm. The cloned waveformwill be saved onto the USB memory device as a file with the ota suffix.
To output the cloned waveform in the internal memory through the generator:(The generator is optional.)(1) Push Save button.(2) Select Type in the bottom menu, in the left menu, turn the M knob to select
Clone.(3) Select Save in the bottom menu, select Storage in the right menu as Internal.(4) Turn the M knob to select an object in the left menu. If the source of the selected
waveform is CH1 or CH2, select AG Output in the right menu and set the outputchannel of the generator. If the source is CH1&CH2, the output channel is not
4.Advanced User Guidebook
75
selectable.(5) Select Output in the right menu.
To output the cloned waveform in the USB memory device through the generator:(The generator is optional.)
(1) Push button to set the output channel of the generator.(2) Select Arb in the bottom menu, select Others in the right menu, and select File
Browse.(3) select Memory in the right menu as USB. The instrument lists a directory of the
folders and files on the USB memory device. Select a folder or file using the Mknob to scroll up and down the list. To enter the current folder, select Change Dirin the right menu, select it again to return to the upper directory.
(4) Select the desired ota file, select Read in the right menu.
To output the selected waveform through the generator directly:(The generator is optional.)(1) Push Save button.(2) Select Type in the bottom menu, in the left menu, turn the M knob to select
Clone.(3) Select Source in the bottom menu, select one channel (CH1/CH2) or two
channels (CH1&CH2) in the right menu for Source.
(4) Select Line in the bottom menu. Select the cursor and move it to select thedesired waveform.
(5) Select Clone in the bottom menu. If the source is CH1 or CH2, select AGOutput in the right menu and set the output channel of the generator. If thesource is CH1&CH2, the output channel is not selectable.
(6) Select Clone in the right menu. The generator will output the waveform betweentwo cursors.
Move the cursors by gestures
About the gestures for moving cursors, you can refer to "Other Operations UsingTouchscreen" on P23.
Data format description of OTA waveform file
If the source is CH1 or CH2, OTA file consists of two parts: the file header and the data. If thesource is CH1&CH2, OTA file consists of three parts: file header, CH1data, and CH2 data. Thefile header represents the parameter of file data, which is expressed in "parameter name + value".Each parameter name is a case-sensitive string of 4 bytes. The parameter value is at least 4 bytes.
1.Format description of the file header:1) HEAD
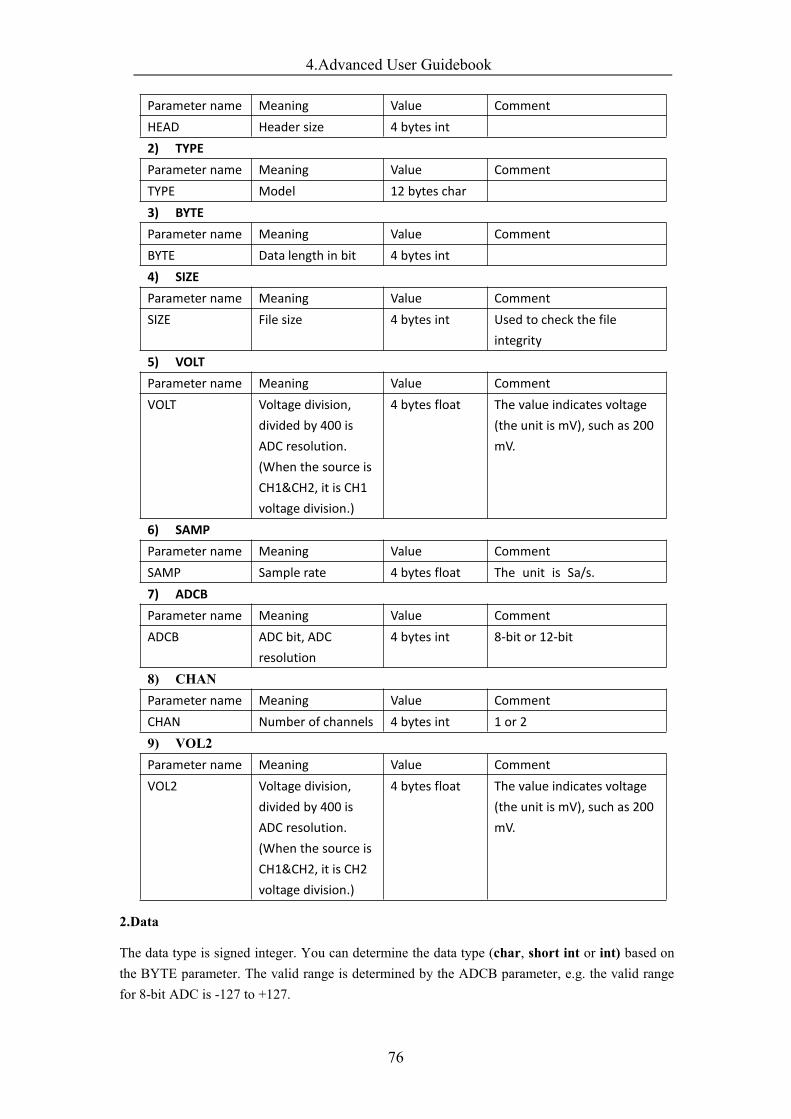
4.Advanced User Guidebook
76
Parameter name Meaning Value CommentHEAD Header size 4 bytes int2) TYPEParameter name Meaning Value CommentTYPE Model 12 bytes char3) BYTEParameter name Meaning Value CommentBYTE Data length in bit 4 bytes int4) SIZEParameter name Meaning Value CommentSIZE File size 4 bytes int Used to check the file
integrity5) VOLTParameter name Meaning Value CommentVOLT Voltage division,
divided by 400 isADC resolution.(When the source isCH1&CH2, it is CH1voltage division.)
4 bytes float The value indicates voltage(the unit is mV), such as 200mV.
6) SAMPParameter name Meaning Value CommentSAMP Sample rate 4 bytes float The unit is Sa/s.7) ADCBParameter name Meaning Value CommentADCB ADC bit, ADC
resolution4 bytes int 8-bit or 12-bit
8) CHANParameter name Meaning Value CommentCHAN Number of channels 4 bytes int 1 or 29) VOL2Parameter name Meaning Value CommentVOL2 Voltage division,
divided by 400 isADC resolution.(When the source isCH1&CH2, it is CH2voltage division.)
4 bytes float The value indicates voltage(the unit is mV), such as 200mV.
2.Data
The data type is signed integer. You can determine the data type (char, short int or int) based onthe BYTE parameter. The valid range is determined by the ADCB parameter, e.g. the valid rangefor 8-bit ADC is -127 to +127.
4.Advanced User Guidebook
77
How to Implement the Auxiliary System Function Setting
●Config
Push the Utility button, select Function in the bottom menu, select Configure inthe left menu.The description of Configure Menu is shown as the follows:
●Display
Push the Utility button, select Function in the bottom menu, select Display in theleft menu.The description of Display Menu is shown as the follows:
●Adjust
Push the Utility button, select Function in the bottom menu, select Adjust in theleft menu.The description of Adjust Menu is shown as the follows:
Function Menu Setting Description
Language Choose the display language of the operatingsystem.
Set Time
Display ONOFF On/Off the date display
Hour Min Setting Hour/MinuteDay Month Setting Date/Month
Year Setting Year
KeyLockLock all keys. Unlock method: push TriggerMenu button in trigger control area, then pushForce button, repeat 3 times.
About Version number and serial number showing
Function Menu Setting DescriptionBackLight 0% - 100% Turn theM knob to adjust the backlight.
Graticule Select the grid type
Battery ONOFF Turn on or off the battery display
Menu Time OFF, 5s - 30s Set the disappear time of menu
4.Advanced User Guidebook
78
Function Menu DescriptionSelf Cal Carry out the self-calibration procedure.Default Call out the factory settings.ProbeCh. Check whether probe attenuation is good.
Do Self Cal (Self-Calibration)The self-calibration procedure can improve the accuracy of the oscilloscope underthe ambient temperature to the greatest extent. If the change of the ambienttemperature is up to or exceeds 5℃, the self-calibration procedure should beexecuted to obtain the highest level of accuracy.
Before executing the self-calibration procedure, disconnect all probes or wires fromthe input connector. Push the Utility button, select Function in the bottom menu,the function menu will display at the left, select Adjust. If everything is ready,select Self Cal in the bottom menu to enter the self-calibration procedure of theinstrument.
Probe checkingTo check whether probe attenuation is good. The results contain three circumstances:Overflow compensation, Good compensation, Inadequate compensation. According tothe checking result, users can adjust probe attenuation to the best. Operation steps areas follows:1. Connect the probe to CH1, adjust the probe attenuation to the maximum.2. Push the Utility button, select Function in the bottom menu, select Adjust in the
left menu.3. Select ProbeCh. in the bottom menu, tips about probe checking shows on the
screen.4. Select ProbeCh. again to begin probe checking and the checking result will occur
after 3s; push any other key to quit.
● Pass/FailThe Pass/Fail function monitors changes of signals and output pass or fail signals bycomparing the input signal that is within the pre-defined mask.
Push the Utility button, select Function in the bottom menu, select Pass/fail in theleft menu.
4.Advanced User Guidebook
79
The description of Pass/fail Menu is shown as the follows:
Pass/Fail test:Detect whether the input signal is within the limits of the rule, if it exceeds limits ofthe rule, it is "Fail"; otherwise it is "Pass". Also it can output fail or pass signal bybuilt-in and configurable output port. To run the test, read the following steps:1. Push the Utility button, select Function in the bottom menu, select Pass/fail in the
left menu.2. Enable switch on: Select Operate in the bottom menu, select Enable in the right
menu as ON.3. Create rule: Select Rule in the bottom menu. Select Source in the right menu,
select the source in the left menu. Set Horizontal tolerance and Vertical tolerancein the right menu. Select Create in the right menu to create the rule.
4. Set output type: Select Output in the bottom menu to enter output option setting.Choose any one or two of the options "Pass", "Fail" or "Beep". "Pass" and "Fail"are mutually exclusive options, which could not be chosen simultaneously. "Stop"means stop once the condition satisfies your setting.
5. Begin to test: Select Operate in the bottom menu, select Operate in the rightmenu as Start, the test will begin.
6. Save rule: Select SaveRule in the bottom menu. Select the save location in theleft menu, and then select Save in the right menu to save the rules, which could becalled up at once when need. Select Load to call up the rule saved.
Note:1. When Pass/Fail is ON, if XY or FFT is ready to run, then Pass/Fail will be closed;
under the mode of XY or FFT, Pass/Fail is unable.2. Under the mode of Factory, Auto Scale and Auto Set, Pass/Fail will be closed.3. When no save setting left in the rule save, tip will be given to show "NO RULE
SAVED".
Function Menu Setting Description
operate EnableOperate
Control enable switchControl operate switch
Output
PassFailBeepStopInfo
Signal tested corresponds with the ruleSignal tested not correspond with the ruleBeep when it satisfies the ruleStop once satisfying the ruleControl the display status of info frame
Rule
SourceHorizontal
Vertical
Create
Select source CH1, CH2 or MathChange the Horizontal tolerance value by turning theM knobChange the Vertical tolerance value by turning the MknobUse the rule set as testing rule
SaveRuleNumberSaveLoad
Select any one from Rule1 - Rule8 as your rule nameSelect Save to save the ruleLoad some rule as the testing rule
4.Advanced User Guidebook
80
4. Under the status of stop, data comparing will stop, and when it goes on running,the number of Pass/Fail will increase from the former number, not from zero.
5. When the waveform playback mode is on, Pass/Fail is used to test theplayed-back waveform specially.
● OutputPush the Utility button, select Function in the bottom menu, select Output in the leftmenu.
Output menu item in the bottom menu sets the output type of Trig Out(P/F) port inFigure 3- 3 Rear Panel on P6. In the bottom menu, select Output. The description ofOutput menu is shown as the follows:
Device and Print Setup menu items set the print output, refer to "How to Print theScreen Image" on page 93.
● LAN SetUsing the LAN port, the oscilloscope can be connected with a computer.
● UpdateUse the front-panel USB port to update your instrument firmware using a USBmemory device. Refer to "How to Update your Instrument Firmware" on page 80.
● DAQYou can use the multimeter data recorder to record the measurements whenmeasuring current/voltage by multimeter (optional). Refer to "Multimeter Recorder"on page 107.
● FRA (Frequency Response Analysis)If there is a built-in arbitrary function generator (optional), you can use the frequencyresponse analysis. Refer to "Frequency Response Analysis" on page 101.
How to Update your Instrument FirmwareUse the front-panel USB port to update your instrument firmware using a USB
FunctionMenu Setting Description
Type
Trig level Output trig signal synchronouslyPass/fail Output High Level when Pass , and Low Level when FailAG
OutputCH2 Output of dual-channel waveform generator(optional)
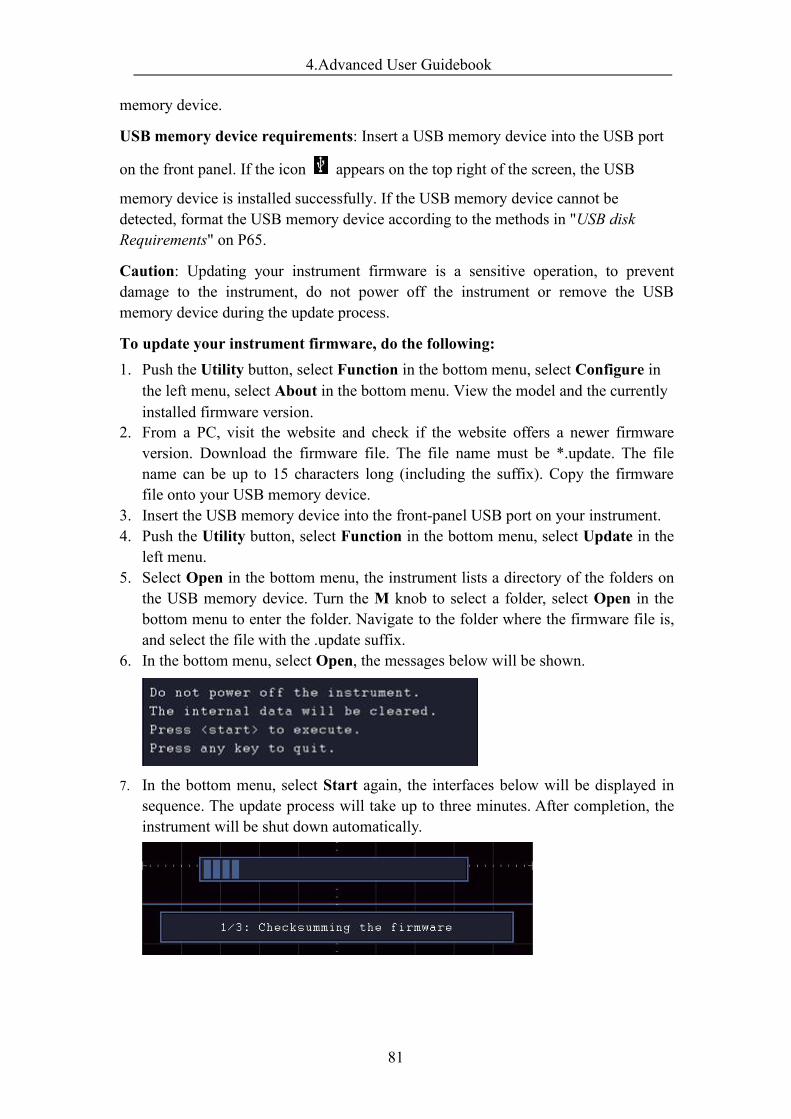
4.Advanced User Guidebook
81
memory device.
USB memory device requirements: Insert a USB memory device into the USB port
on the front panel. If the icon appears on the top right of the screen, the USB
memory device is installed successfully. If the USB memory device cannot bedetected, format the USB memory device according to the methods in "USB diskRequirements" on P65.
Caution: Updating your instrument firmware is a sensitive operation, to preventdamage to the instrument, do not power off the instrument or remove the USBmemory device during the update process.
To update your instrument firmware, do the following:1. Push the Utility button, select Function in the bottom menu, select Configure in
the left menu, select About in the bottom menu. View the model and the currentlyinstalled firmware version.
2. From a PC, visit the website and check if the website offers a newer firmwareversion. Download the firmware file. The file name must be *.update. The filename can be up to 15 characters long (including the suffix). Copy the firmwarefile onto your USB memory device.
3. Insert the USB memory device into the front-panel USB port on your instrument.4. Push the Utility button, select Function in the bottom menu, select Update in the
left menu.5. Select Open in the bottom menu, the instrument lists a directory of the folders on
the USB memory device. Turn the M knob to select a folder, select Open in thebottom menu to enter the folder. Navigate to the folder where the firmware file is,and select the file with the .update suffix.
6. In the bottom menu, select Open, the messages below will be shown.
7. In the bottom menu, select Start again, the interfaces below will be displayed insequence. The update process will take up to three minutes. After completion, theinstrument will be shut down automatically.
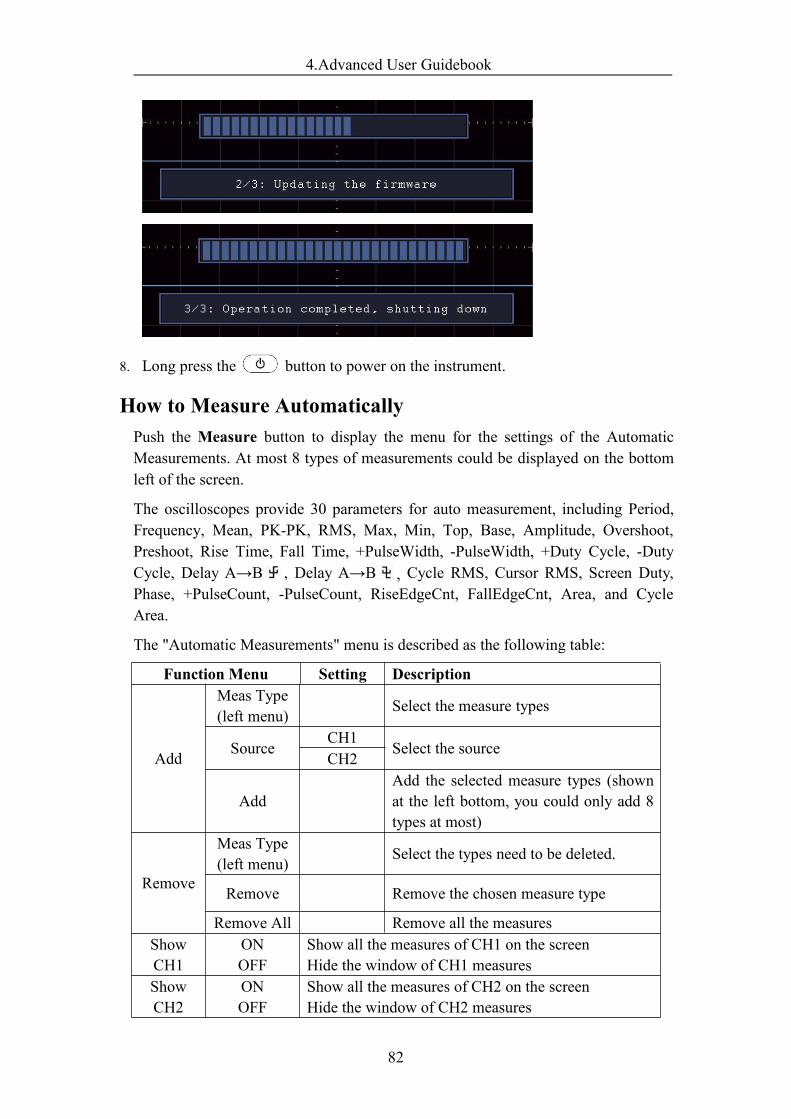
4.Advanced User Guidebook
82
8. Long press the button to power on the instrument.
How to Measure AutomaticallyPush the Measure button to display the menu for the settings of the AutomaticMeasurements. At most 8 types of measurements could be displayed on the bottomleft of the screen.
The oscilloscopes provide 30 parameters for auto measurement, including Period,Frequency, Mean, PK-PK, RMS, Max, Min, Top, Base, Amplitude, Overshoot,Preshoot, Rise Time, Fall Time, +PulseWidth, -PulseWidth, +Duty Cycle, -DutyCycle, Delay A→B , Delay A→B , Cycle RMS, Cursor RMS, Screen Duty,Phase, +PulseCount, -PulseCount, RiseEdgeCnt, FallEdgeCnt, Area, and CycleArea.
The "Automatic Measurements" menu is described as the following table:
Function Menu Setting Description
Add
Meas Type(left menu) Select the measure types
SourceCH1
Select the sourceCH2
AddAdd the selected measure types (shownat the left bottom, you could only add 8types at most)
Remove
Meas Type(left menu) Select the types need to be deleted.
Remove Remove the chosen measure type
Remove All Remove all the measuresShowCH1
ONOFF
Show all the measures of CH1 on the screenHide the window of CH1 measures
ShowCH2
ONOFF
Show all the measures of CH2 on the screenHide the window of CH2 measures
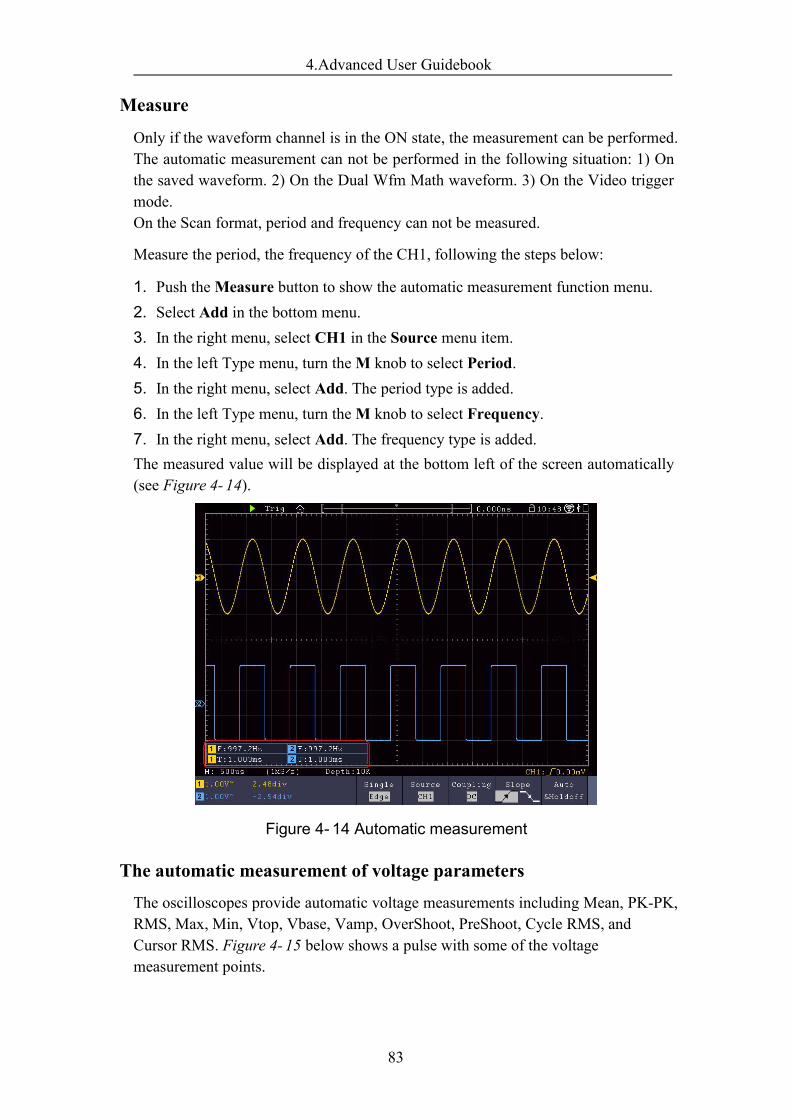
4.Advanced User Guidebook
83
Measure
Only if the waveform channel is in the ON state, the measurement can be performed.The automatic measurement can not be performed in the following situation: 1) Onthe saved waveform. 2) On the Dual Wfm Math waveform. 3) On the Video triggermode.On the Scan format, period and frequency can not be measured.
Measure the period, the frequency of the CH1, following the steps below:
1. Push theMeasure button to show the automatic measurement function menu.2. Select Add in the bottom menu.3. In the right menu, select CH1 in the Source menu item.4. In the left Type menu, turn theM knob to select Period.5. In the right menu, select Add. The period type is added.6. In the left Type menu, turn theM knob to select Frequency.7. In the right menu, select Add. The frequency type is added.The measured value will be displayed at the bottom left of the screen automatically(see Figure 4- 14).
Figure 4- 14 Automatic measurement
The automatic measurement of voltage parameters
The oscilloscopes provide automatic voltage measurements including Mean, PK-PK,RMS, Max, Min, Vtop, Vbase, Vamp, OverShoot, PreShoot, Cycle RMS, andCursor RMS. Figure 4- 15 below shows a pulse with some of the voltagemeasurement points.
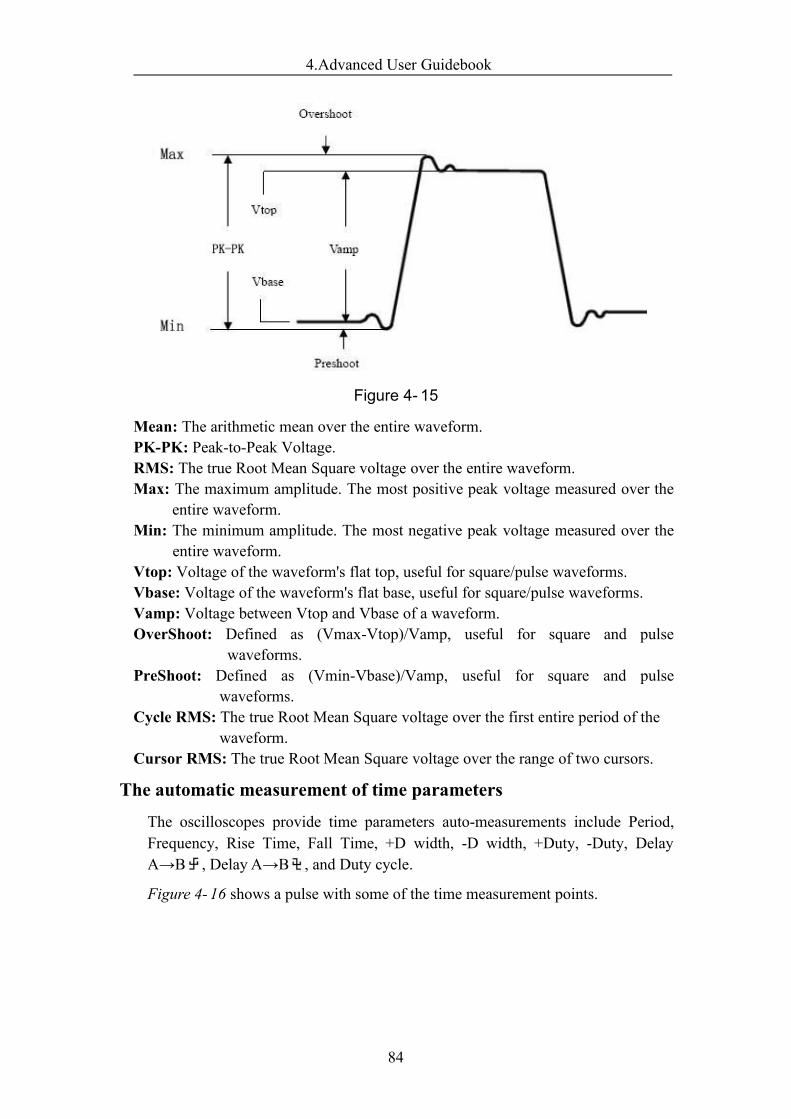
4.Advanced User Guidebook
84
Figure 4- 15
Mean: The arithmetic mean over the entire waveform.PK-PK: Peak-to-Peak Voltage.RMS: The true Root Mean Square voltage over the entire waveform.Max: The maximum amplitude. The most positive peak voltage measured over the
entire waveform.Min: The minimum amplitude. The most negative peak voltage measured over the
entire waveform.Vtop: Voltage of the waveform's flat top, useful for square/pulse waveforms.Vbase: Voltage of the waveform's flat base, useful for square/pulse waveforms.Vamp: Voltage between Vtop and Vbase of a waveform.OverShoot: Defined as (Vmax-Vtop)/Vamp, useful for square and pulse
waveforms.PreShoot: Defined as (Vmin-Vbase)/Vamp, useful for square and pulse
waveforms.Cycle RMS: The true Root Mean Square voltage over the first entire period of the
waveform.Cursor RMS: The true Root Mean Square voltage over the range of two cursors.
The automatic measurement of time parameters
The oscilloscopes provide time parameters auto-measurements include Period,Frequency, Rise Time, Fall Time, +D width, -D width, +Duty, -Duty, DelayA→B , Delay A→B , and Duty cycle.
Figure 4- 16 shows a pulse with some of the time measurement points.
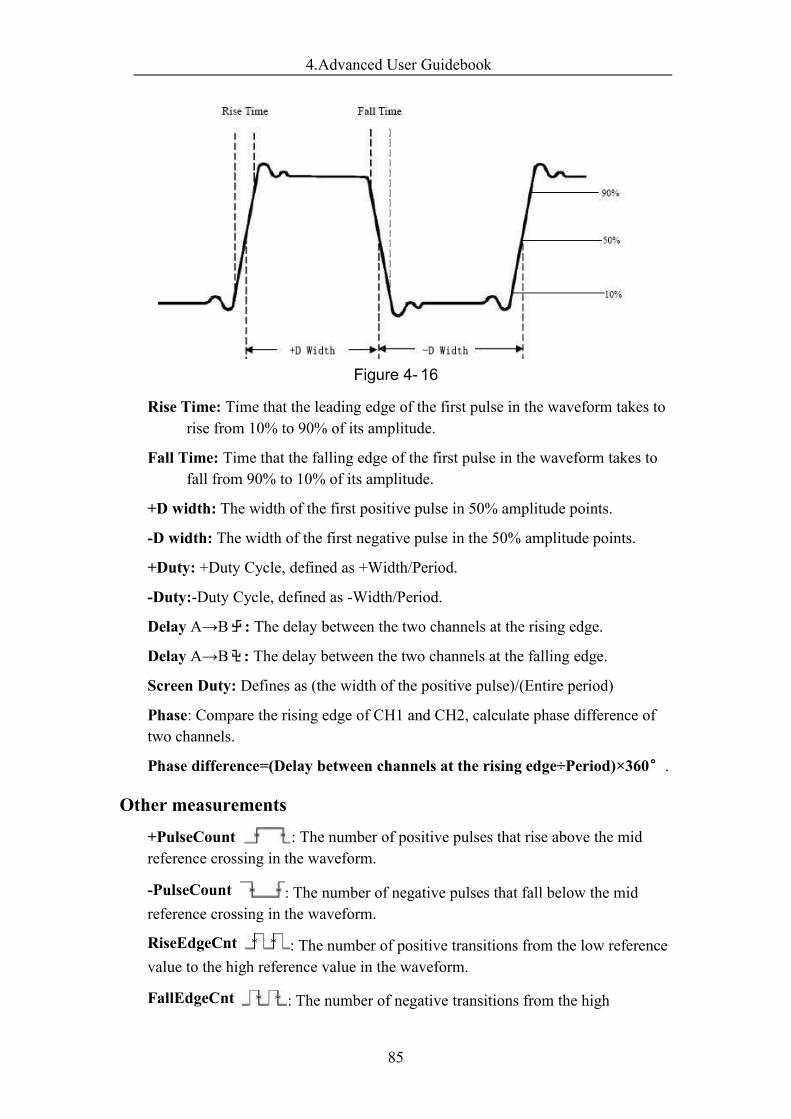
4.Advanced User Guidebook
85
Figure 4- 16
Rise Time: Time that the leading edge of the first pulse in the waveform takes torise from 10% to 90% of its amplitude.
Fall Time: Time that the falling edge of the first pulse in the waveform takes tofall from 90% to 10% of its amplitude.
+D width: The width of the first positive pulse in 50% amplitude points.
-D width: The width of the first negative pulse in the 50% amplitude points.
+Duty: +Duty Cycle, defined as +Width/Period.
-Duty:-Duty Cycle, defined as -Width/Period.
Delay A→B : The delay between the two channels at the rising edge.
Delay A→B : The delay between the two channels at the falling edge.
Screen Duty: Defines as (the width of the positive pulse)/(Entire period)
Phase: Compare the rising edge of CH1 and CH2, calculate phase difference oftwo channels.
Phase difference=(Delay between channels at the rising edge÷Period)×360°.
Other measurements
+PulseCount : The number of positive pulses that rise above the midreference crossing in the waveform.
-PulseCount : The number of negative pulses that fall below the midreference crossing in the waveform.
RiseEdgeCnt : The number of positive transitions from the low referencevalue to the high reference value in the waveform.
FallEdgeCnt : The number of negative transitions from the high
4.Advanced User Guidebook
86
reference value to the low reference value in the waveform.
Area : The area of the whole waveform within the screen and the unit isvoltage-second. The area measured above the zero reference (namely the verticaloffset) is positive; the area measured below the zero reference is negative. Thearea measured is the algebraic sum of the area of the whole waveform within thescreen.
Cycle Area : The area of the first period of waveform on the screen andthe unit is voltage-second. The area above the zero reference (namely the verticaloffset) is positive and the area below the zero reference is negative. The areameasured is the algebraic sum of the area of the whole period waveform.Note: When the waveform on the screen is less than a period, the period areameasured is 0.
How to Measure with CursorsPush the Cursor button to turn cursors on and display the cursor menu. Push itagain to turn cursors off.
The Cursor Measurement for normal mode:The description of the cursor menu is shown as the following table:
FunctionMenu Setting Description
Type
VoltageTime
Time&Voltage
AutoCursr
Display the voltage measurement cursor and menu.Display the time measurement cursor and menu.Display the time and voltage measurement cursorand menu.The horizontal cursors are set as the intersections ofthe vertical cursors and the waveform
Line Type(Time&Voltage type)
TimeVoltage
Makes the vertical cursors active.Makes the horizontal cursors active.
Window(Wavezoommode)
MainExtension
Measure in the main window.Measure in the extension window.
Line
abab
Turn theM knob to move line a.Turn theM knob to move line b.Two cursors are linked. Turn the M knob to movethe pair of cursors.
Source CH1CH2
Display the channel to which the cursormeasurement will be applied.
Perform the following operation steps for the time and voltage cursor measurementof the channel CH1:
1. Push Cursor to display the cursor menu.
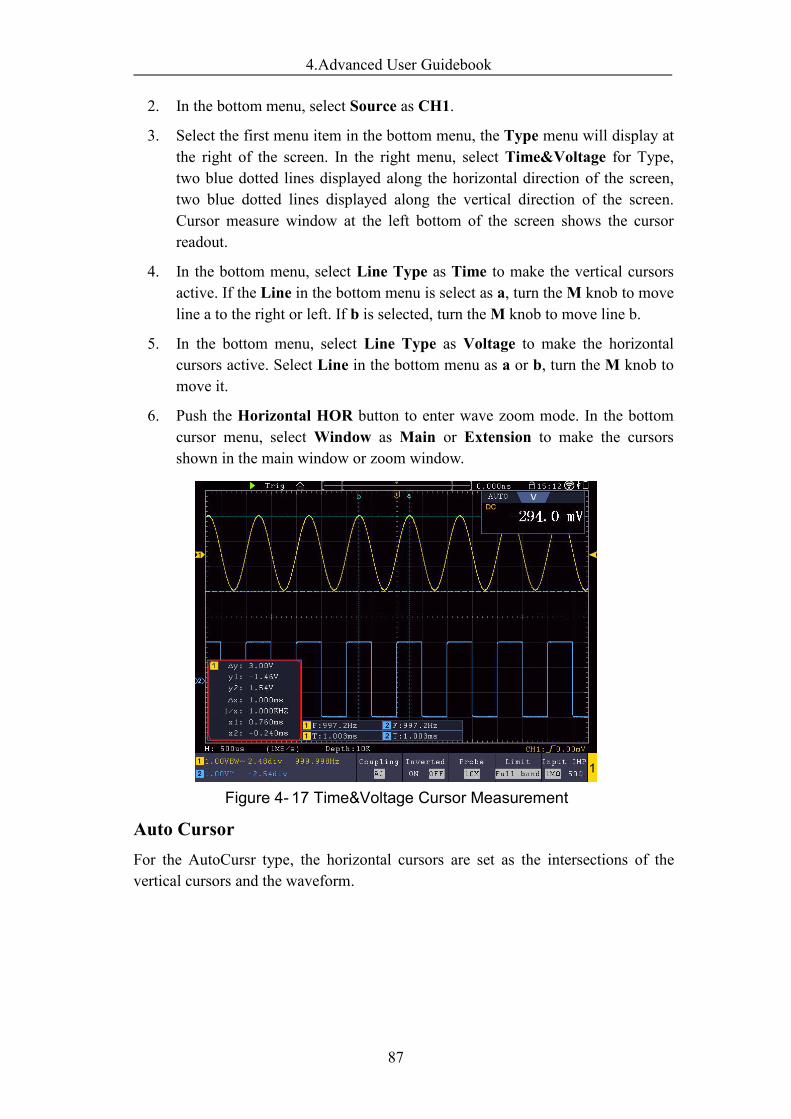
4.Advanced User Guidebook
87
2. In the bottom menu, select Source as CH1.
3. Select the first menu item in the bottom menu, the Type menu will display atthe right of the screen. In the right menu, select Time&Voltage for Type,two blue dotted lines displayed along the horizontal direction of the screen,two blue dotted lines displayed along the vertical direction of the screen.Cursor measure window at the left bottom of the screen shows the cursorreadout.
4. In the bottom menu, select Line Type as Time to make the vertical cursorsactive. If the Line in the bottom menu is select as a, turn theM knob to moveline a to the right or left. If b is selected, turn theM knob to move line b.
5. In the bottom menu, select Line Type as Voltage to make the horizontalcursors active. Select Line in the bottom menu as a or b, turn the M knob tomove it.
6. Push the Horizontal HOR button to enter wave zoom mode. In the bottomcursor menu, select Window as Main or Extension to make the cursorsshown in the main window or zoom window.
Figure 4- 17 Time&Voltage Cursor Measurement
Auto CursorFor the AutoCursr type, the horizontal cursors are set as the intersections of thevertical cursors and the waveform.
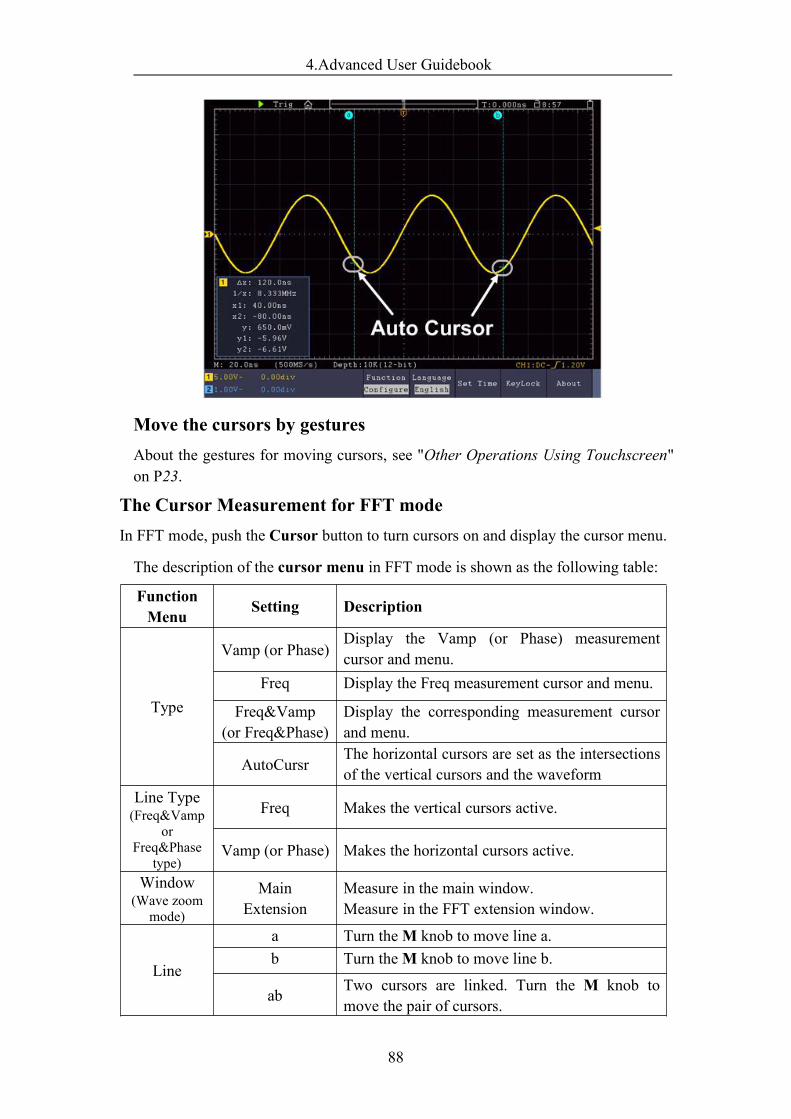
4.Advanced User Guidebook
88
Move the cursors by gesturesAbout the gestures for moving cursors, see "Other Operations Using Touchscreen"on P23.
The Cursor Measurement for FFT modeIn FFT mode, push the Cursor button to turn cursors on and display the cursor menu.
The description of the cursor menu in FFT mode is shown as the following table:
FunctionMenu Setting Description
Type
Vamp (or Phase)Display the Vamp (or Phase) measurementcursor and menu.
Freq Display the Freq measurement cursor and menu.
Freq&Vamp(or Freq&Phase)
Display the corresponding measurement cursorand menu.
AutoCursrThe horizontal cursors are set as the intersectionsof the vertical cursors and the waveform
Line Type(Freq&Vamp
orFreq&Phase
type)
Freq Makes the vertical cursors active.
Vamp (or Phase) Makes the horizontal cursors active.
Window(Wave zoom
mode)
MainExtension
Measure in the main window.Measure in the FFT extension window.
Line
a Turn theM knob to move line a.b Turn theM knob to move line b.
ab Two cursors are linked. Turn the M knob tomove the pair of cursors.
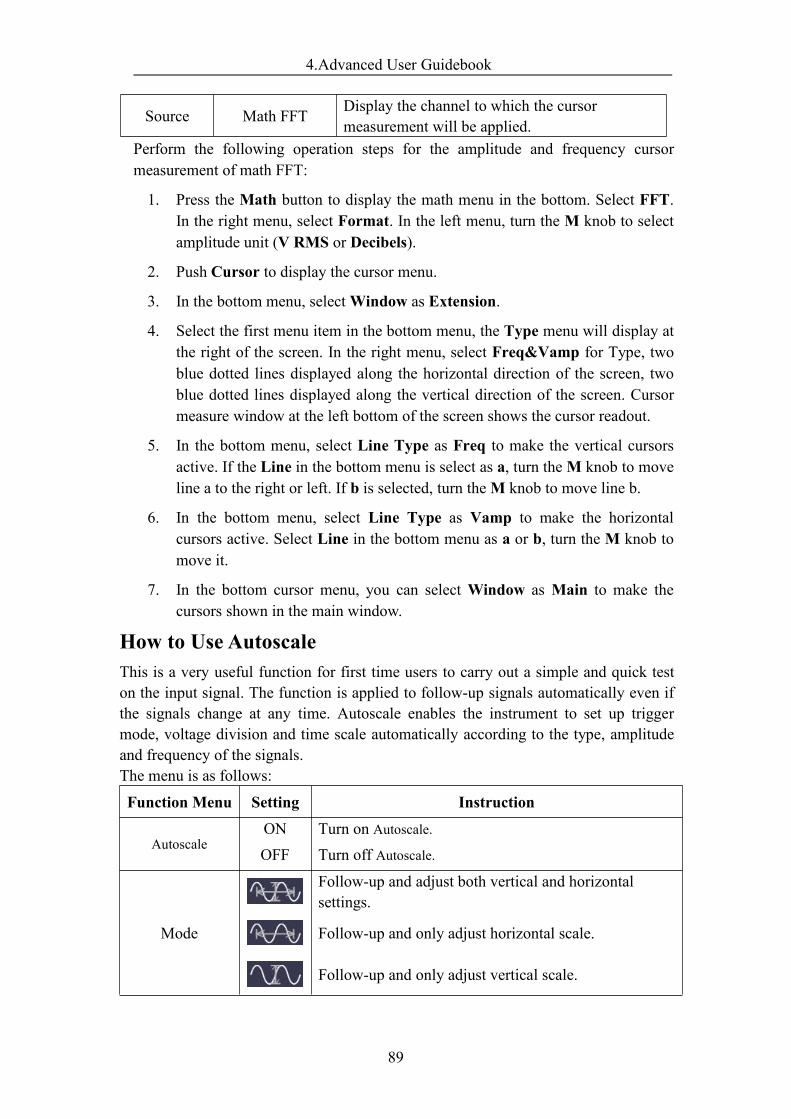
4.Advanced User Guidebook
89
Source Math FFT Display the channel to which the cursormeasurement will be applied.
Perform the following operation steps for the amplitude and frequency cursormeasurement of math FFT:
1. Press the Math button to display the math menu in the bottom. Select FFT.In the right menu, select Format. In the left menu, turn the M knob to selectamplitude unit (V RMS or Decibels).
2. Push Cursor to display the cursor menu.
3. In the bottom menu, selectWindow as Extension.
4. Select the first menu item in the bottom menu, the Type menu will display atthe right of the screen. In the right menu, select Freq&Vamp for Type, twoblue dotted lines displayed along the horizontal direction of the screen, twoblue dotted lines displayed along the vertical direction of the screen. Cursormeasure window at the left bottom of the screen shows the cursor readout.
5. In the bottom menu, select Line Type as Freq to make the vertical cursorsactive. If the Line in the bottom menu is select as a, turn theM knob to moveline a to the right or left. If b is selected, turn theM knob to move line b.
6. In the bottom menu, select Line Type as Vamp to make the horizontalcursors active. Select Line in the bottom menu as a or b, turn the M knob tomove it.
7. In the bottom cursor menu, you can select Window as Main to make thecursors shown in the main window.
How to Use AutoscaleThis is a very useful function for first time users to carry out a simple and quick teston the input signal. The function is applied to follow-up signals automatically even ifthe signals change at any time. Autoscale enables the instrument to set up triggermode, voltage division and time scale automatically according to the type, amplitudeand frequency of the signals.The menu is as follows:
Function Menu Setting Instruction
AutoscaleONOFF
Turn on Autoscale.Turn off Autoscale.
Mode
Follow-up and adjust both vertical and horizontalsettings.
Follow-up and only adjust horizontal scale.
Follow-up and only adjust vertical scale.
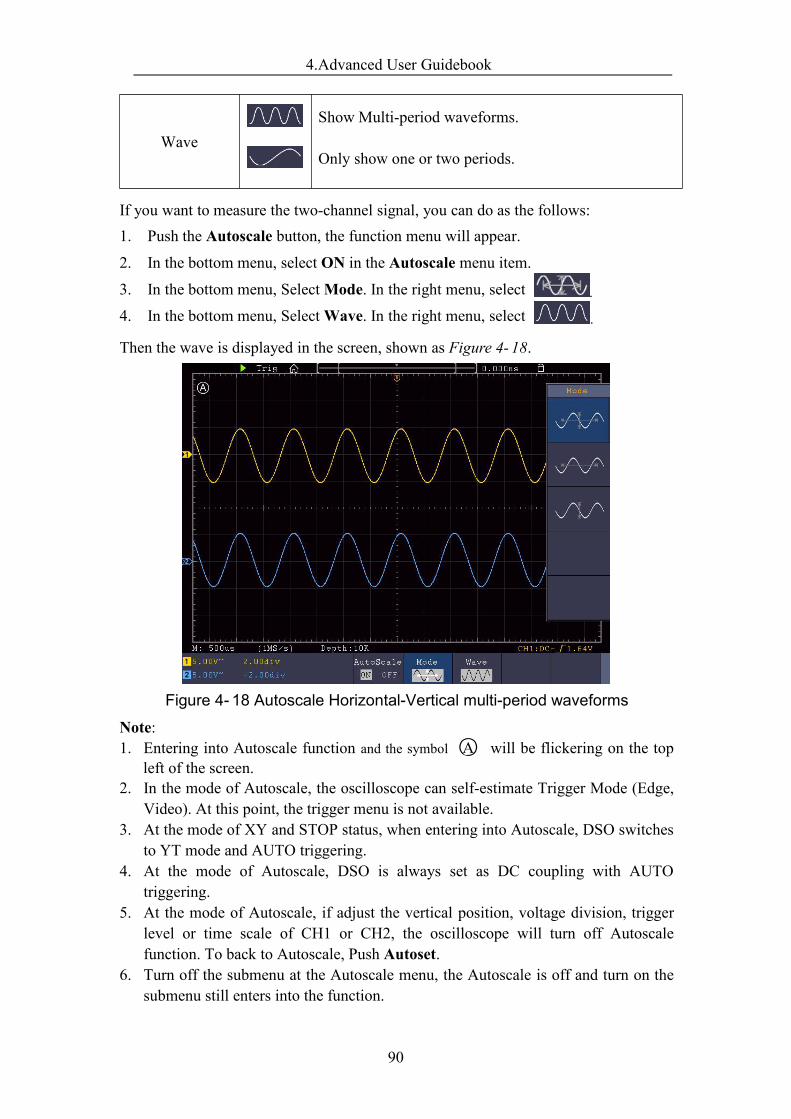
4.Advanced User Guidebook
90
WaveShow Multi-period waveforms.
Only show one or two periods.
If you want to measure the two-channel signal, you can do as the follows:1. Push the Autoscale button, the function menu will appear.
2. In the bottom menu, select ON in the Autoscale menu item.
3. In the bottom menu, SelectMode. In the right menu, select .
4. In the bottom menu, SelectWave. In the right menu, select .
Then the wave is displayed in the screen, shown as Figure 4- 18.
Figure 4- 18 Autoscale Horizontal-Vertical multi-period waveformsNote:1. Entering into Autoscale function and the symbol ○A will be flickering on the top
left of the screen.2. In the mode of Autoscale, the oscilloscope can self-estimate Trigger Mode (Edge,
Video). At this point, the trigger menu is not available.3. At the mode of XY and STOP status, when entering into Autoscale, DSO switches
to YT mode and AUTO triggering.4. At the mode of Autoscale, DSO is always set as DC coupling with AUTO
triggering.5. At the mode of Autoscale, if adjust the vertical position, voltage division, trigger
level or time scale of CH1 or CH2, the oscilloscope will turn off Autoscalefunction. To back to Autoscale, Push Autoset.
6. Turn off the submenu at the Autoscale menu, the Autoscale is off and turn on thesubmenu still enters into the function.
4.Advanced User Guidebook
91
7. When video triggering, the horizontal time scale is 50us. If one channel isshowing edge signal, the other channel is showing video one, the time scale refersto 50us as video one as standard.
8. While the Autoscale is working, the settings below will be made forcibly:The DSO will switch from the wave zoom mode to the normal mode.
How to Use Built-in Help1. Push Help button, the catalog will display in the screen.2. In the bottom menu, press Prev Page or Next Page to choose help topic, or just
turn theM knob to choose.3. Press OK to view the details about the topic, or just push the M knob.4. Press Quit to exit the help, or just do other operations.
How to Use Executive ButtonsExecutive Buttons include Autoset, Run/Stop, Single, Copy.
AutosetIt's a very useful and quick way to apply a set of pre-set functions to the incomingsignal, and display the best possible viewing waveform of the signal and alsoworks out some measurements for user as well.
The details of functions applied to the signal when using Autoset are shown asthe following table:
Function Items SettingVertical Coupling CurrentChannel Coupling CurrentVertical Scale Adjust to the proper division.Bandwidth FullHorizontal Level Middle or ±2 divHorizontal Sale Adjust to the proper divisionTrigger Type Slope or VideoTrigger Source CH1 or CH2Trigger Coupling DCTrigger Slope CurrentTrigger Level 3/5 of the waveformTrigger Mode AutoDisplay Format YTForce StopHelp ExitPass/Fail OffInverted OffZoom Mode Exit
Judge waveform type by Autoset
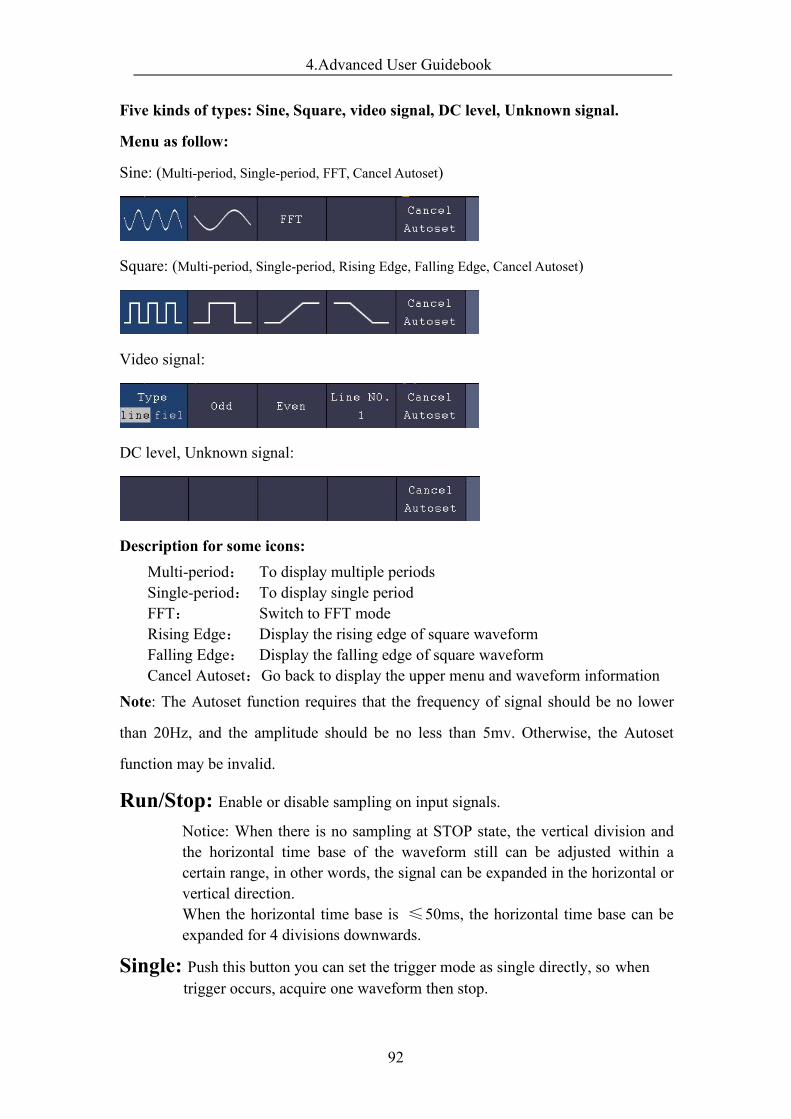
4.Advanced User Guidebook
92
Five kinds of types: Sine, Square, video signal, DC level, Unknown signal.
Menu as follow:
Sine: (Multi-period, Single-period, FFT, Cancel Autoset)
Square: (Multi-period, Single-period, Rising Edge, Falling Edge, Cancel Autoset)
Video signal:
DC level, Unknown signal:
Description for some icons:Multi-period: To display multiple periodsSingle-period: To display single periodFFT: Switch to FFT modeRising Edge: Display the rising edge of square waveformFalling Edge: Display the falling edge of square waveformCancel Autoset:Go back to display the upper menu and waveform information
Note: The Autoset function requires that the frequency of signal should be no lower
than 20Hz, and the amplitude should be no less than 5mv. Otherwise, the Autoset
function may be invalid.
Run/Stop: Enable or disable sampling on input signals.Notice: When there is no sampling at STOP state, the vertical division andthe horizontal time base of the waveform still can be adjusted within acertain range, in other words, the signal can be expanded in the horizontal orvertical direction.When the horizontal time base is ≤50ms, the horizontal time base can beexpanded for 4 divisions downwards.
Single: Push this button you can set the trigger mode as single directly, so whentrigger occurs, acquire one waveform then stop.
4.Advanced User Guidebook
93
Copy: You can save the waveform by just pushing the Copy panel button in anyuser interface. The source wave and the storage location are according to thesettings of the Save function menu when the Type is Wave. For moredetails, please see "Save Function Menu" on P62.
How to Print the Screen ImageTo print an image of what appears on the oscilloscope screen, do as the follows:
(1) Connect the printer to the USB Device port on the rear panel of the oscilloscope.Note: The USB Device port supports PictBridge compatible printers.
(2) Push the Utility button, select Function in the bottom menu, select Output in theleft menu.
(3) In the bottom menu, select Device as PICT. (When PC is selected, you can getan image by Oscilloscope software.)
(4) In the bottom menu, select Print Setup. In the right menu, set up print parameters.The On selection of Ink Saver will print out a copy with a white background.
(5) Once you have connected a printer to your oscilloscope and set up printparameters, you can print current screen images with a single push of the Printbutton on the front panel.
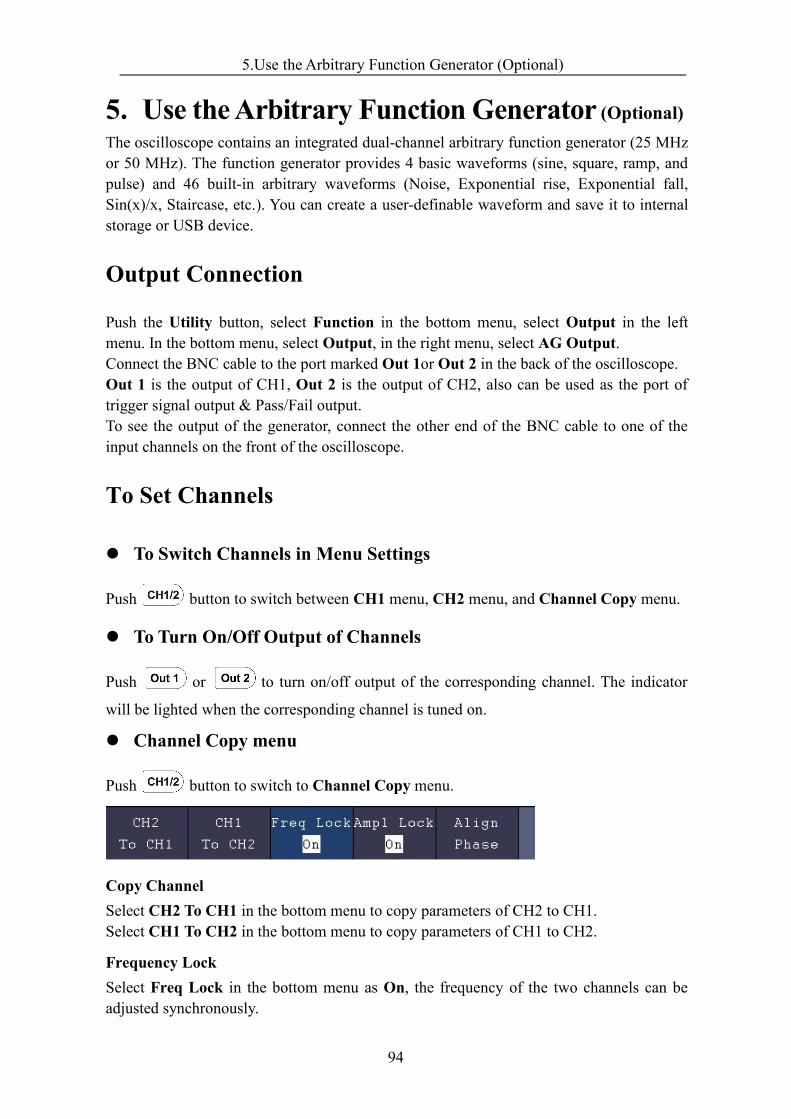
5.Use the Arbitrary Function Generator (Optional)
94
5. Use theArbitrary Function Generator (Optional)The oscilloscope contains an integrated dual-channel arbitrary function generator (25 MHzor 50 MHz). The function generator provides 4 basic waveforms (sine, square, ramp, andpulse) and 46 built-in arbitrary waveforms (Noise, Exponential rise, Exponential fall,Sin(x)/x, Staircase, etc.). You can create a user-definable waveform and save it to internalstorage or USB device.
Output Connection
Push the Utility button, select Function in the bottom menu, select Output in the leftmenu. In the bottom menu, select Output, in the right menu, select AG Output.Connect the BNC cable to the port marked Out 1or Out 2 in the back of the oscilloscope.Out 1 is the output of CH1, Out 2 is the output of CH2, also can be used as the port oftrigger signal output & Pass/Fail output.To see the output of the generator, connect the other end of the BNC cable to one of theinput channels on the front of the oscilloscope.
To Set Channels
To Switch Channels in Menu Settings
Push button to switch between CH1 menu, CH2 menu, and Channel Copy menu.
To Turn On/Off Output of Channels
Push or to turn on/off output of the corresponding channel. The indicator
will be lighted when the corresponding channel is tuned on.
Channel Copy menu
Push button to switch to Channel Copy menu.
Copy ChannelSelect CH2 To CH1 in the bottom menu to copy parameters of CH2 to CH1.Select CH1 To CH2 in the bottom menu to copy parameters of CH1 to CH2.
Frequency LockSelect Freq Lock in the bottom menu as On, the frequency of the two channels can beadjusted synchronously.
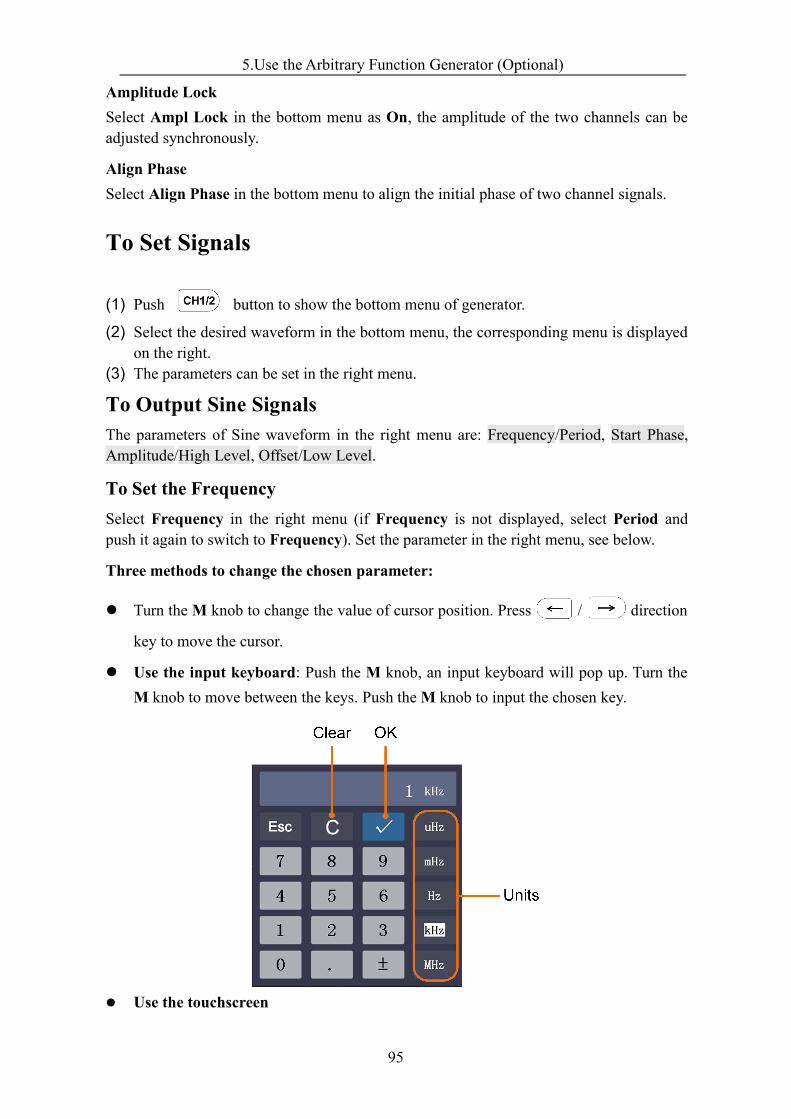
5.Use the Arbitrary Function Generator (Optional)
95
Amplitude LockSelect Ampl Lock in the bottom menu as On, the amplitude of the two channels can beadjusted synchronously.
Align PhaseSelect Align Phase in the bottom menu to align the initial phase of two channel signals.
To Set Signals
(1) Push button to show the bottom menu of generator.
(2) Select the desired waveform in the bottom menu, the corresponding menu is displayedon the right.
(3) The parameters can be set in the right menu.
To Output Sine SignalsThe parameters of Sine waveform in the right menu are: Frequency/Period, Start Phase,Amplitude/High Level, Offset/Low Level.
To Set the FrequencySelect Frequency in the right menu (if Frequency is not displayed, select Period andpush it again to switch to Frequency). Set the parameter in the right menu, see below.
Three methods to change the chosen parameter:
Turn theM knob to change the value of cursor position. Press / direction
key to move the cursor.
Use the input keyboard: Push the M knob, an input keyboard will pop up. Turn theM knob to move between the keys. Push theM knob to input the chosen key.
Use the touchscreen
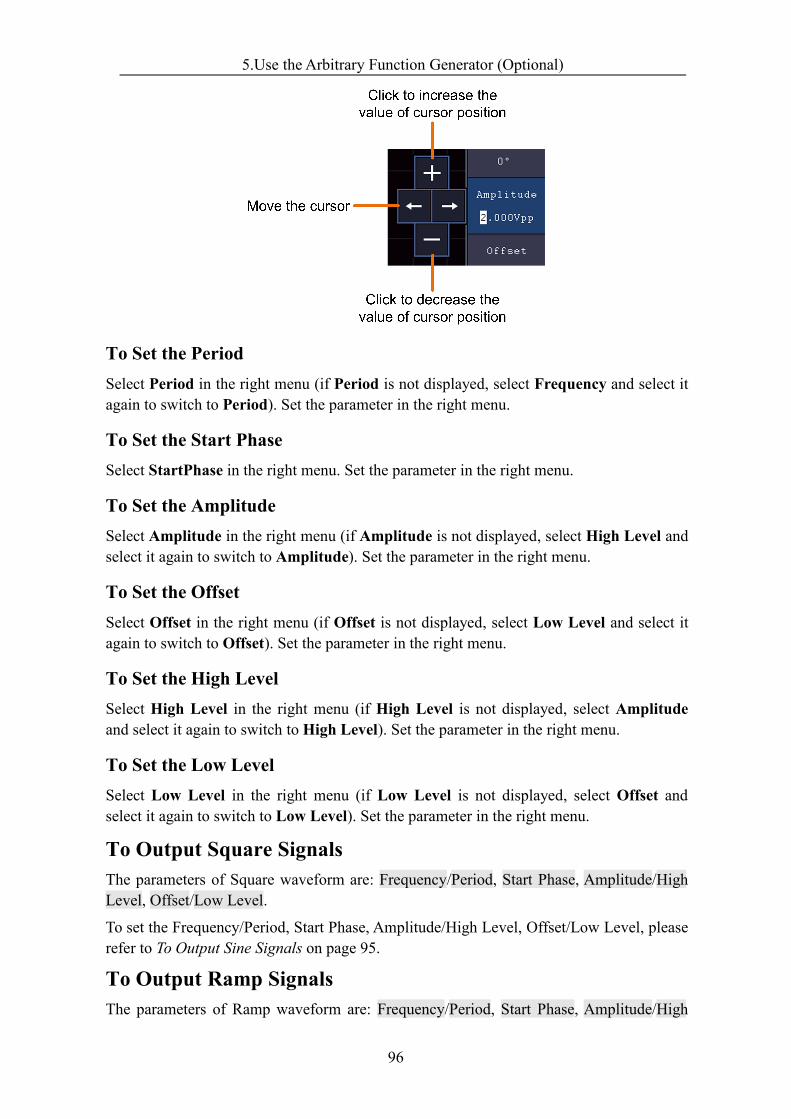
5.Use the Arbitrary Function Generator (Optional)
96
To Set the PeriodSelect Period in the right menu (if Period is not displayed, select Frequency and select itagain to switch to Period). Set the parameter in the right menu.
To Set the Start PhaseSelect StartPhase in the right menu. Set the parameter in the right menu.
To Set the AmplitudeSelect Amplitude in the right menu (if Amplitude is not displayed, select High Level andselect it again to switch to Amplitude). Set the parameter in the right menu.
To Set the OffsetSelect Offset in the right menu (if Offset is not displayed, select Low Level and select itagain to switch to Offset). Set the parameter in the right menu.
To Set the High LevelSelect High Level in the right menu (if High Level is not displayed, select Amplitudeand select it again to switch to High Level). Set the parameter in the right menu.
To Set the Low LevelSelect Low Level in the right menu (if Low Level is not displayed, select Offset andselect it again to switch to Low Level). Set the parameter in the right menu.
To Output Square SignalsThe parameters of Square waveform are: Frequency/Period, Start Phase, Amplitude/HighLevel, Offset/Low Level.
To set the Frequency/Period, Start Phase, Amplitude/High Level, Offset/Low Level, pleaserefer to To Output Sine Signals on page 95.
To Output Ramp SignalsThe parameters of Ramp waveform are: Frequency/Period, Start Phase, Amplitude/High
5.Use the Arbitrary Function Generator (Optional)
97
Level, Offset/Low Level, Symmetry.
To set the Frequency/Period, Start Phase, Amplitude/High Level, Offset/Low Level, pleaserefer to To Output Sine Signals on page 95.
To Set the Symmetry of Ramp
Select Symmetry in the right menu of Ramp. Set the parameter in the right menu.
To Output Pulse SignalsThe parameters of Pulse waveform are: Frequency/Period, Start Phase, Amplitude/HighLevel, Offset/Low Level, Width/Duty Cycle.
To set the Frequency/Period, Start Phase, Amplitude/High Level, Offset/Low Level, pleaserefer to To Output Sine Signals on page 95.
To Set the Pulse Width of Pulse
SelectWidth in the right menu (if Width is not displayed, select Duty Cycle and select itagain to switch toWidth). Set the parameter in the right menu.
To Set the Duty Cycle of Pulse
Select Duty Cycle in the right menu (if Duty Cycle is not displayed, select Width andselect it again to switch to Duty Cycle). Set the parameter in the right menu.
To Output Arbitrary SignalsThe menu items of Arbitrary waveform are: Frequency/Period, Start Phase,Amplitude/High Level, Offset/Low Level, New, File Browse, Built-in. You can operatethe menu by using the menu selection buttons on the right.To set the Frequency/Period, Start Phase, Amplitude/High Level, Offset/Low Level, pleaserefer to To Output Sine Signals on page 95.The Arbitrary signal consists of two types: the user-definable waveform and the systembuilt-in waveform.
Create a New Waveform
(1) Enter the operation menu: Push button. Select Arb in the bottom menu,
select Others in the right menu, and select New.(2) Set the number of waveform points: Select Points in the right menu, turn the M
knob to change the value, or use the input keyboard (push the M knob to show it) toinput the value and choose the unit. X1, X1000, Xle6, Xle9 in the keyboardrespectively represent 1, 1000, 1000000, 1000000000. The waveform points range is2 - 8192.
(3) Set the interpolation: Select Intrpl in the right menu, choose between On/Off. Ifyou choose On, the points will be connected with beelines; otherwise, the voltagesbetween two consecutive points will not change, and the waveform looks like astep-up one.
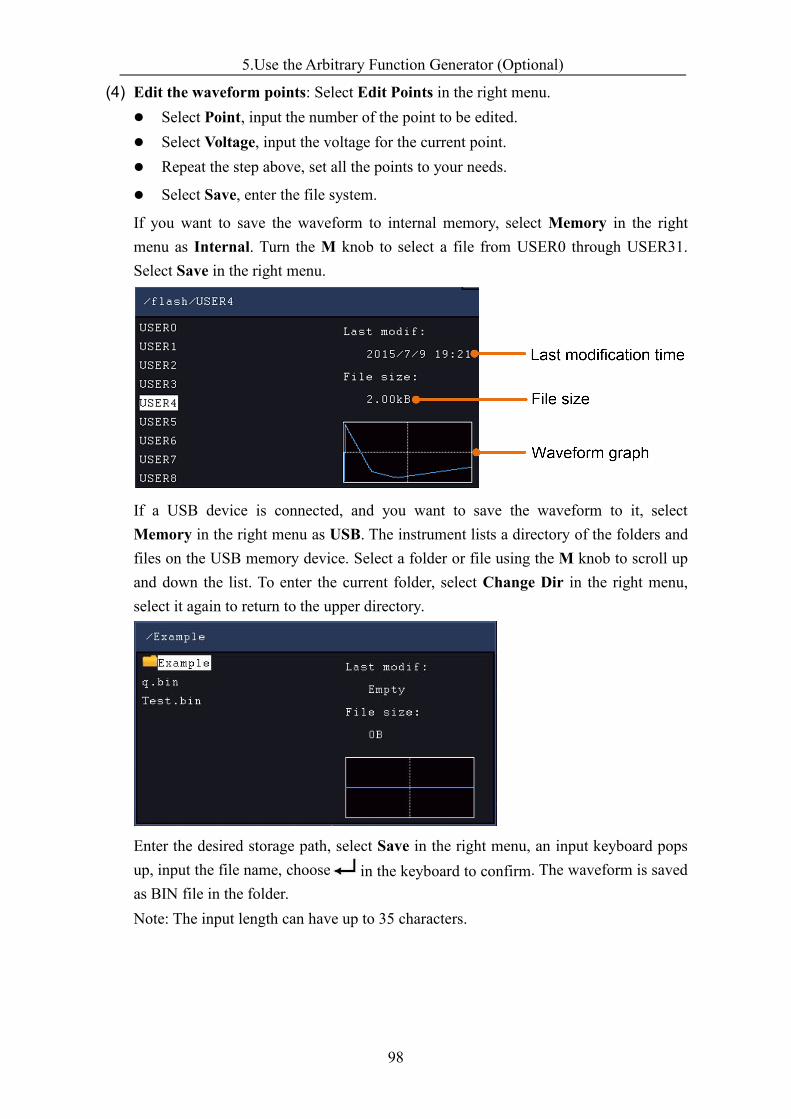
5.Use the Arbitrary Function Generator (Optional)
98
(4) Edit the waveform points: Select Edit Points in the right menu. Select Point, input the number of the point to be edited. Select Voltage, input the voltage for the current point. Repeat the step above, set all the points to your needs.
Select Save, enter the file system.
If you want to save the waveform to internal memory, select Memory in the rightmenu as Internal. Turn the M knob to select a file from USER0 through USER31.Select Save in the right menu.
If a USB device is connected, and you want to save the waveform to it, selectMemory in the right menu as USB. The instrument lists a directory of the folders andfiles on the USB memory device. Select a folder or file using the M knob to scroll upand down the list. To enter the current folder, select Change Dir in the right menu,select it again to return to the upper directory.
Enter the desired storage path, select Save in the right menu, an input keyboard popsup, input the file name, choose in the keyboard to confirm. The waveform is savedas BIN file in the folder.Note: The input length can have up to 35 characters.
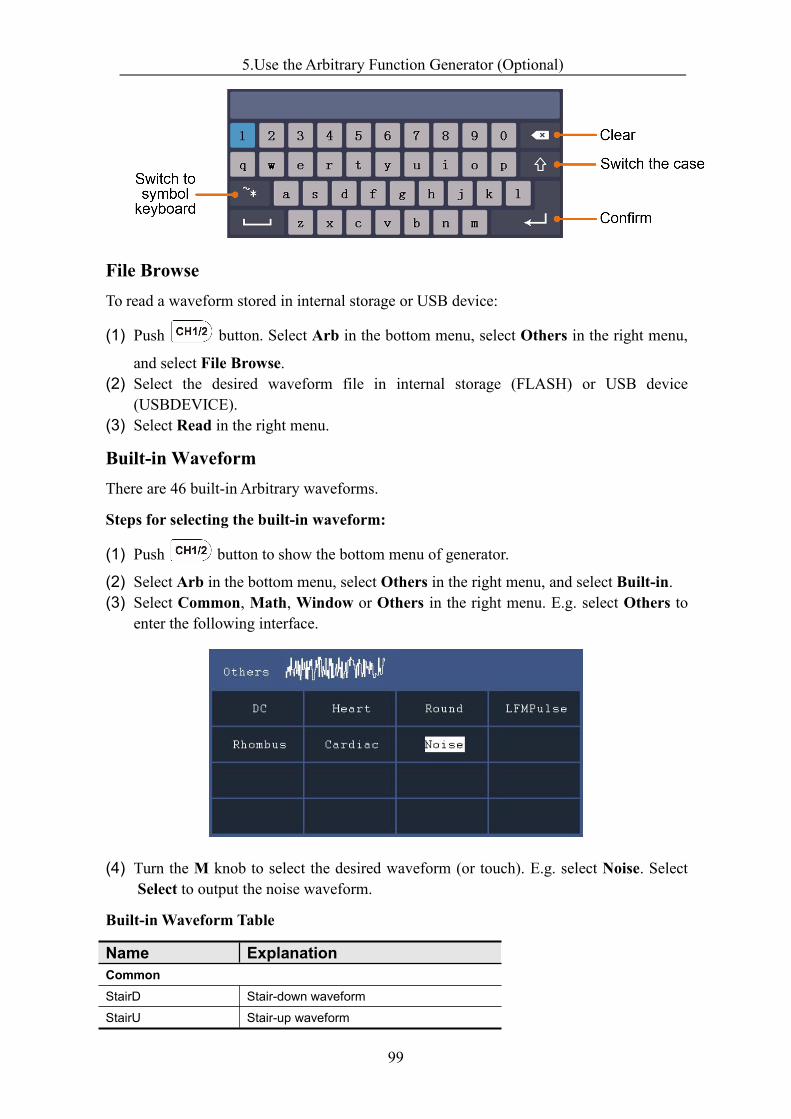
5.Use the Arbitrary Function Generator (Optional)
99
File BrowseTo read a waveform stored in internal storage or USB device:
(1) Push button. Select Arb in the bottom menu, select Others in the right menu,
and select File Browse.(2) Select the desired waveform file in internal storage (FLASH) or USB device
(USBDEVICE).(3) Select Read in the right menu.
Built-in WaveformThere are 46 built-in Arbitrary waveforms.
Steps for selecting the built-in waveform:
(1) Push button to show the bottom menu of generator.
(2) Select Arb in the bottom menu, select Others in the right menu, and select Built-in.(3) Select Common, Math, Window or Others in the right menu. E.g. select Others to
enter the following interface.
(4) Turn the M knob to select the desired waveform (or touch). E.g. select Noise. SelectSelect to output the noise waveform.
Built-in Waveform Table
Name ExplanationCommonStairD Stair-down waveformStairU Stair-up waveform

5.Use the Arbitrary Function Generator (Optional)
100
StairUD Stair-up and stair-down waveformTrapezia Trapezoid waveformRoundHalf RoundHalf waveAbsSine Absolute value of a Sine
AbsSineHalf Absolute value of half a SineSineTra Sine transverse cutSineVer Sine vertical cutNegRamp Negative rampAttALT Gain oscillation curveAmpALT Attenuation oscillation curve
CPulse Coded pulsePPulse Positive pulseNPulse Negative pulseMathsExpRise Exponential rise functionExpFall Exponential fall function
Sinc Sinc functionTan TangentCot CotangentSqrt Square rootXX Square functionHaverSine HaverSine function
Lorentz Lorentz functionln Natural logarithm functionCubic Cubic functionCauchy Cauchy distributionBesselj BesselI functionBessely BesselII function
Erf Error functionAiry Airy functionWindowsRectangle Rectangle windowGauss Gauss distributionHamming Hamming window
Hann Hanning windowBartlett Bartlett windowBlackman Blackman windowLaylight Laylight windowTriang Triangle window (Fejer window)OthersDC DC signalHeart Heart signalRound Round signalLFMPulse Linear FM pulse
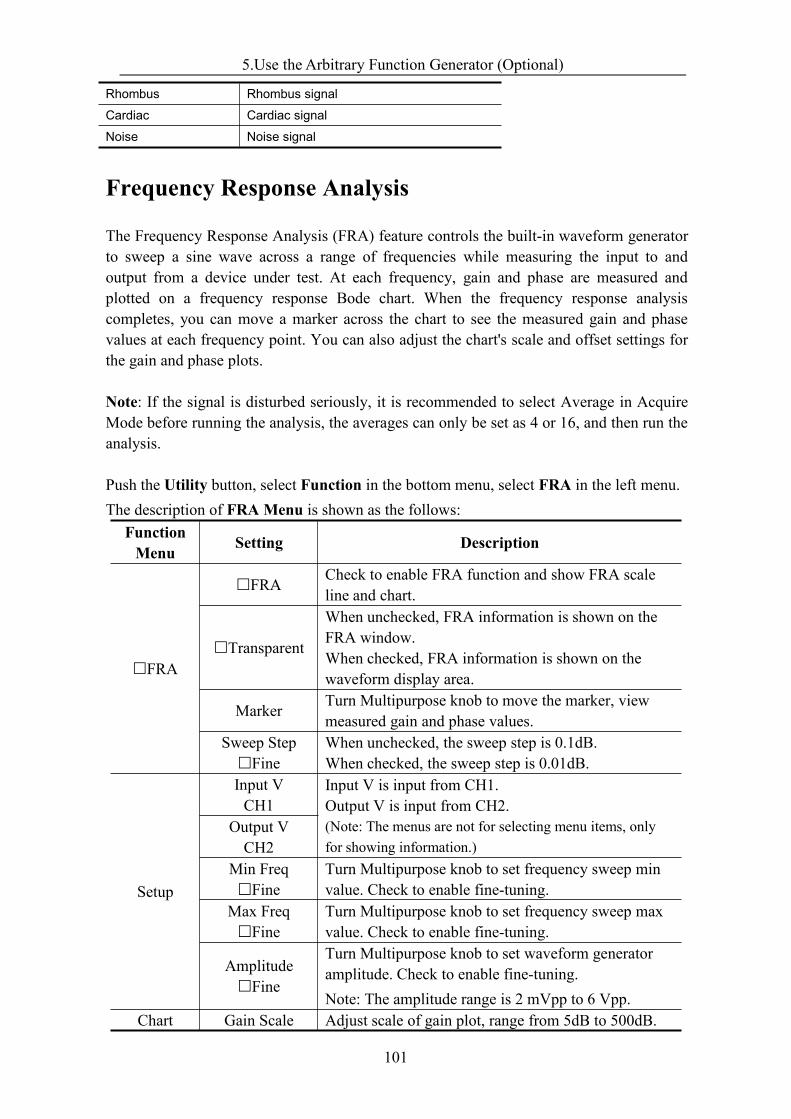
5.Use the Arbitrary Function Generator (Optional)
101
Rhombus Rhombus signalCardiac Cardiac signalNoise Noise signal
Frequency Response Analysis
The Frequency Response Analysis (FRA) feature controls the built-in waveform generatorto sweep a sine wave across a range of frequencies while measuring the input to andoutput from a device under test. At each frequency, gain and phase are measured andplotted on a frequency response Bode chart. When the frequency response analysiscompletes, you can move a marker across the chart to see the measured gain and phasevalues at each frequency point. You can also adjust the chart's scale and offset settings forthe gain and phase plots.
Note: If the signal is disturbed seriously, it is recommended to select Average in AcquireMode before running the analysis, the averages can only be set as 4 or 16, and then run theanalysis.
Push the Utility button, select Function in the bottom menu, select FRA in the left menu.The description of FRA Menu is shown as the follows:
FunctionMenu Setting Description
FRA
FRA Check to enable FRA function and show FRA scaleline and chart.
Transparent
When unchecked, FRA information is shown on theFRA window.When checked, FRA information is shown on thewaveform display area.
Marker Turn Multipurpose knob to move the marker, viewmeasured gain and phase values.
Sweep StepFine
When unchecked, the sweep step is 0.1dB.When checked, the sweep step is 0.01dB.
Setup
Input VCH1
Input V is input from CH1.Output V is input from CH2.(Note: The menus are not for selecting menu items, onlyfor showing information.)
Output VCH2
Min FreqFine
Turn Multipurpose knob to set frequency sweep minvalue. Check to enable fine-tuning.
Max FreqFine
Turn Multipurpose knob to set frequency sweep maxvalue. Check to enable fine-tuning.
AmplitudeFine
Turn Multipurpose knob to set waveform generatoramplitude. Check to enable fine-tuning.Note: The amplitude range is 2 mVpp to 6 Vpp.
Chart Gain Scale Adjust scale of gain plot, range from 5dB to 500dB.
5.Use the Arbitrary Function Generator (Optional)
102
Gain Offset Adjust offset of gain plot, range from -250dB to250dB.
Phase Scale Adjust scale of phase plot, range from 5° to 180°.Phase Offset Adjust offset of phase plot, range from -180° to 180°.Autoscale Autoscale gain and phase plots.
Analysis Run/stop the analysis.F: Frequency; G: Gain; P: Phase.
To run the frequency response analysis, do the following:1. The waveform generator output is connected to a device under test. The input to the
device is probed by CH1of the oscilloscope. The output from the device is probed byCH2of the oscilloscope.
2. Push the Utility button, select Function in the bottom menu, select FRA in the leftmenu
3. In the bottom menu, selectFRA. In the right menu, checkFRA, and set othermenu items.
4. In the bottom menu, select Setup or Chart. In the right menu, set the menu items.5. In the bottom menu, checkAnalysis to run the analysis.
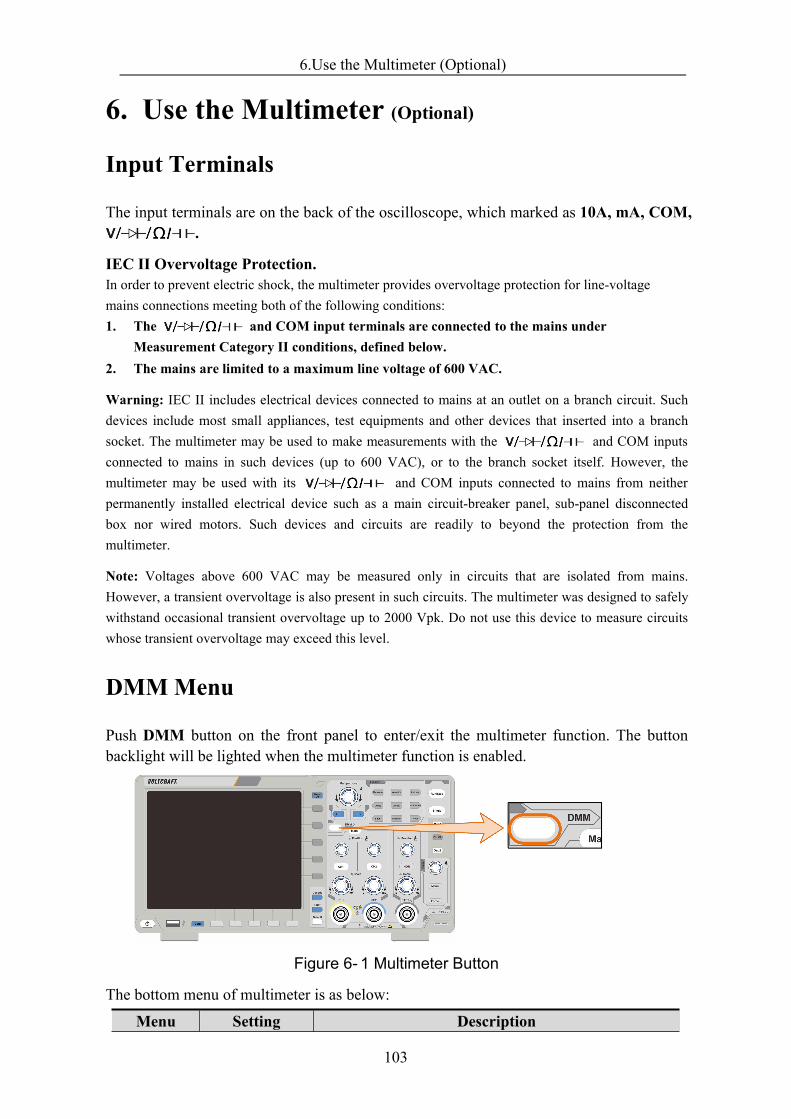
6.Use the Multimeter (Optional)
103
6. Use the Multimeter (Optional)
Input Terminals
The input terminals are on the back of the oscilloscope, which marked as 10A, mA, COM,.
IEC II Overvoltage Protection.In order to prevent electric shock, the multimeter provides overvoltage protection for line-voltagemains connections meeting both of the following conditions:1. The and COM input terminals are connected to the mains under
Measurement Category II conditions, defined below.2. The mains are limited to a maximum line voltage of 600 VAC.
Warning: IEC II includes electrical devices connected to mains at an outlet on a branch circuit. Suchdevices include most small appliances, test equipments and other devices that inserted into a branchsocket. The multimeter may be used to make measurements with the and COM inputsconnected to mains in such devices (up to 600 VAC), or to the branch socket itself. However, themultimeter may be used with its and COM inputs connected to mains from neitherpermanently installed electrical device such as a main circuit-breaker panel, sub-panel disconnectedbox nor wired motors. Such devices and circuits are readily to beyond the protection from themultimeter.
Note: Voltages above 600 VAC may be measured only in circuits that are isolated from mains.However, a transient overvoltage is also present in such circuits. The multimeter was designed to safelywithstand occasional transient overvoltage up to 2000 Vpk. Do not use this device to measure circuitswhose transient overvoltage may exceed this level.
DMMMenu
Push DMM button on the front panel to enter/exit the multimeter function. The buttonbacklight will be lighted when the multimeter function is enabled.
Figure 6- 1 Multimeter Button
The bottom menu of multimeter is as below:
Menu Setting Description
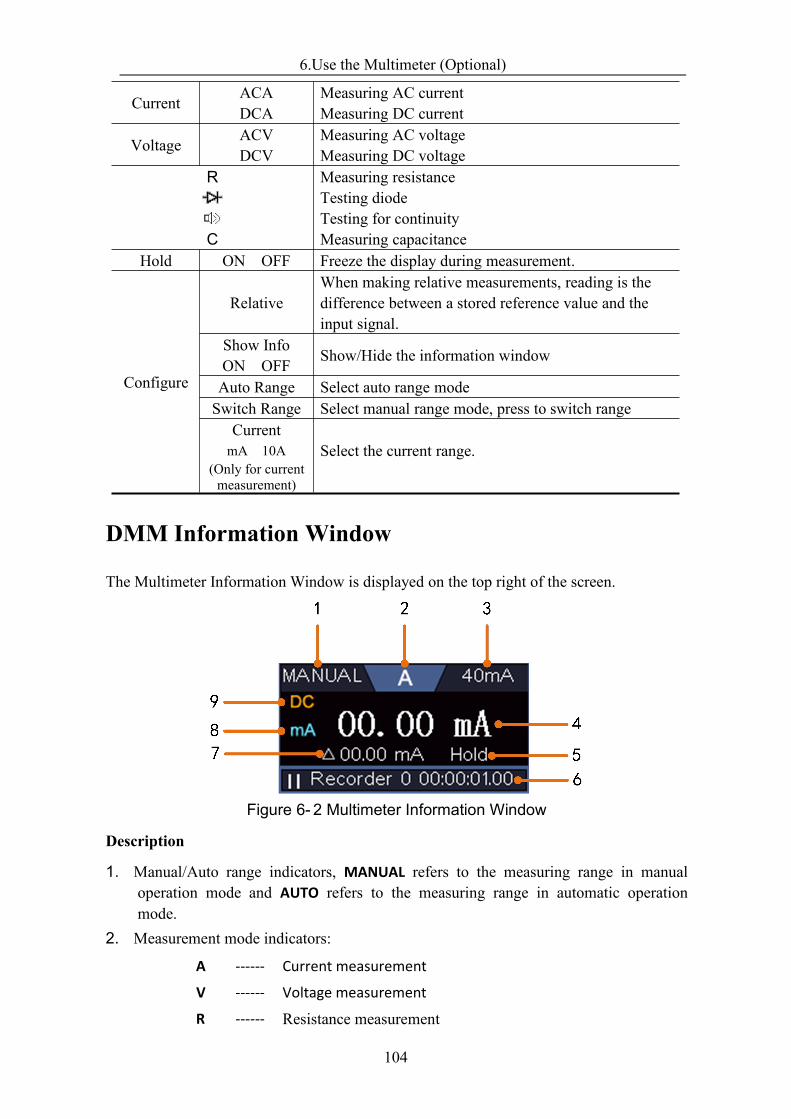
6.Use the Multimeter (Optional)
104
Current ACADCA
Measuring AC currentMeasuring DC current
Voltage ACVDCV
Measuring AC voltageMeasuring DC voltage
R
C
Measuring resistanceTesting diodeTesting for continuityMeasuring capacitance
Hold ON OFF Freeze the display during measurement.
Configure
RelativeWhen making relative measurements, reading is thedifference between a stored reference value and theinput signal.
Show InfoON OFF Show/Hide the information window
Auto Range Select auto range modeSwitch Range Select manual range mode, press to switch range
CurrentmA 10A
(Only for currentmeasurement)
Select the current range.
DMM Information Window
The Multimeter Information Window is displayed on the top right of the screen.
Figure 6- 2 Multimeter Information Window
Description
1. Manual/Auto range indicators, MANUAL refers to the measuring range in manualoperation mode and AUTO refers to the measuring range in automatic operationmode.
2. Measurement mode indicators:
A ------ Current measurement
V ------ Voltage measurement
R ------ Resistance measurement
6.Use the Multimeter (Optional)
105
------ Diode measurement------ Continuity test
C ------ Capacitance measurement
3. Range.4. Measurement display ("OL" is short for overload, indicates the reading exceeds the
display range)
5. Data hold mode is enabled.6. Multimeter recorder (See "Multimeter Recorder" on page 107).7. The reference value of the relative measurement.8. Range of measuring current: mA or 10A.9. AC or DC when measuring current or voltage.
Making Multimeter Measurements
Measuring AC or DC CurrentTo measure a AC or DC current which is less than 400 mA, do the following:
(1) Push DMM button on the front panel. Select Current in the bottom menu, select itagain to switch between ACA (AC current ) or DCA (DC current).
(2) Select Configure in the bottom menu, select Current as mA in the right menu.(3) Connect the black test lead to the COM terminal on the back of the oscilloscope.
Connect the red test lead to themA terminal.(4) Turn off the power of the measured circuit. Discharge all high- voltage capacitors.(5) Disconnect the circuit path to be tested. Connect the black test lead to one side of the
circuit (with a lower voltage); connect the red test lead to the other side (with a highervoltage). Reversing the leads will produce a negative reading, but will not damage themultimeter.
(6) Turn on the power of the measured circuit, and read the display.(7) Turn off the power of the measured circuit and discharge all high-voltage capacitors.
Remove the test leads and restore the circuit to the original condition.
To measure a AC or DC current which is 400 mA to 10 A, do the following:
(1) Push DMM button on the front panel. Select Current in the bottom menu, select itagain to switch between ACA (AC current ) or DCA (DC current).
(2) Select Configure in the bottom menu, select Current as 10A in the right menu.(3) Connect the black test lead to the COM terminal on the back of the oscilloscope.
Connect the red test lead to the 10A terminal.(4) Turn off the power of the measured circuit. Discharge all high- voltage capacitors.(5) Disconnect the circuit path to be tested. Connect the black test lead to one side of the
circuit (with a lower voltage); connect the red test lead to the other side (with a highervoltage). Reversing the leads will produce a negative reading, but will not damage themultimeter.
6.Use the Multimeter (Optional)
106
(6) Turn on the power of the measured circuit, and read the display.(7) Turn off the power of the measured circuit and discharge all high-voltage capacitors.
Remove the test leads and restore the circuit to the original condition.
Measuring AC or DC Voltage(1) Push DMM button on the front panel. Select Current in the bottom menu, select it
again to switch between ACA (AC current ) or DCA (DC current).(2) Connect the black test lead to the COM terminal on the back of the oscilloscope and
the red test lead to the terminal.(3) Probe the test points and read the display.
Measuring Resistance
(1) Push DMM button on the front panel. Select in the bottom menu, select R.
(2) Connect the black test lead to the COM terminal on the back of the oscilloscope andthe red test lead to the terminal.
(3) Probe the test points and read the display.
Testing Diodes
(1) Push DMM button on the front panel. Select in the bottom menu, select it until
switching to .(2) Connect the black test lead to the COM terminal on the back of the oscilloscope and
the red test lead to the terminal.(3) Connect the red test lead to the positive terminal (anode) of the diode and the black
test lead to the negative terminal (cathode). The cathode of a diode is indicated with aband. Read the diode forward bias.
Testing for Continuity(1) Push DMM button on the front panel. Select in the bottom menu, select it until
switching to .(2) Connect the black test lead to the COM terminal on the back of the oscilloscope and
the red test lead to the terminal.(3) Probe the test points to measure the resistance in the circuit. If the reading is below 50
, the multimeter will beep.
Measuring Capacitance
(1) Push DMM button on the front panel. Select in the bottom menu, select it until
switching to C.(2) Insert the supplied capacitance measurer to the COM terminal and the
terminal on the back of the oscilloscope.(3) Insert the capacitance to the capacitance measurer, then screen shows the capacitance
6.Use the Multimeter (Optional)
107
reading.Note: when measuring the capacitance which is less than 5 nF, please use relative valuemeasuring mode to improve measuring precision.
Multimeter Features
Data Hold ModeYou can freeze the display for any function.(1) Select Hold in the bottom menu as ON. HOLD will be shown on the display.(2) Select OFF to exit this mode.
Making Relative MeasurementsWhen making relative measurements, reading is the difference between a stored referencevalue and the input signal.(1) Select Configure in the bottom menu, select Relative in the right menu to enter the
relative mode.The measurement value at this time is stored as the reference value, and displayedbehind △.In this mode, current reading = input value - reference value.
(2) Press it again to exit the mode.
Note: This function is not available when measuring resistance, diodes, and testing forcontinuity.
Information DisplayShow/hide the information window on the top right of the display.(1) Select Configure in the bottom menu, select Show Info in the right menu as ON. The
information window will be shown on the display.(2) Select OFF to hide.
Auto or Manual RangeAuto range is set as default. To switch auto or manual range, do the following steps:(1) Select Configure in the bottom menu.(2) Select Auto Range in the right menu, AUTOwill be shown on the display.(3) Select Switch Range in the right menu, MANUAL will be shown on the display.
Press this softkey to switch range.
Note: When testing diode, testing continuity, and measuring capacitance, manual range isdisabled.
Multimeter Recorder
You can use the multimeter data recorder to record the measurements when measuringcurrent/voltage by multimeter (optional).
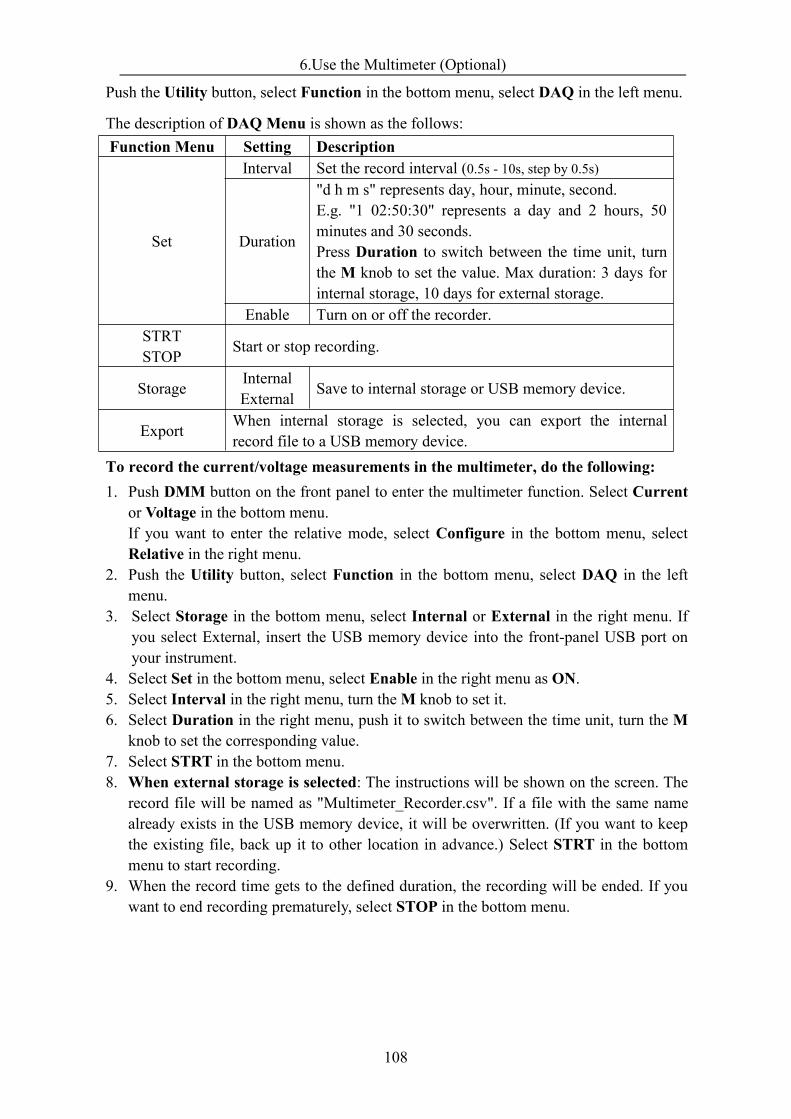
6.Use the Multimeter (Optional)
108
Push the Utility button, select Function in the bottom menu, select DAQ in the left menu.
The description of DAQMenu is shown as the follows:
To record the current/voltage measurements in the multimeter, do the following:1. Push DMM button on the front panel to enter the multimeter function. Select Current
or Voltage in the bottom menu.If you want to enter the relative mode, select Configure in the bottom menu, selectRelative in the right menu.
2. Push the Utility button, select Function in the bottom menu, select DAQ in the leftmenu.
3. Select Storage in the bottom menu, select Internal or External in the right menu. Ifyou select External, insert the USB memory device into the front-panel USB port onyour instrument.
4. Select Set in the bottom menu, select Enable in the right menu as ON.5. Select Interval in the right menu, turn theM knob to set it.6. Select Duration in the right menu, push it to switch between the time unit, turn the M
knob to set the corresponding value.7. Select STRT in the bottom menu.8. When external storage is selected: The instructions will be shown on the screen. The
record file will be named as "Multimeter_Recorder.csv". If a file with the same namealready exists in the USB memory device, it will be overwritten. (If you want to keepthe existing file, back up it to other location in advance.) Select STRT in the bottommenu to start recording.
9. When the record time gets to the defined duration, the recording will be ended. If youwant to end recording prematurely, select STOP in the bottom menu.
Function Menu Setting Description
Set
Interval Set the record interval (0.5s - 10s, step by 0.5s)
Duration
"d h m s" represents day, hour, minute, second.E.g. "1 02:50:30" represents a day and 2 hours, 50minutes and 30 seconds.Press Duration to switch between the time unit, turnthe M knob to set the value. Max duration: 3 days forinternal storage, 10 days for external storage.
Enable Turn on or off the recorder.STRTSTOP Start or stop recording.
Storage InternalExternal Save to internal storage or USB memory device.
Export When internal storage is selected, you can export the internalrecord file to a USB memory device.
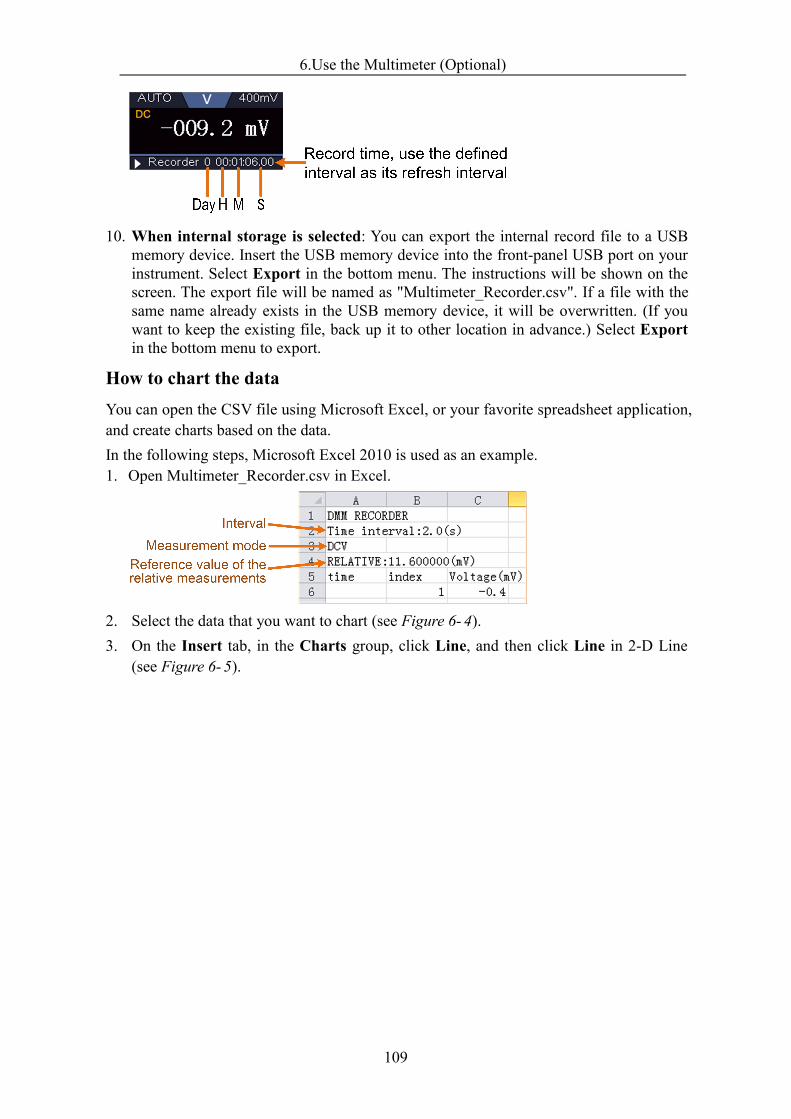
6.Use the Multimeter (Optional)
109
10. When internal storage is selected: You can export the internal record file to a USBmemory device. Insert the USB memory device into the front-panel USB port on yourinstrument. Select Export in the bottom menu. The instructions will be shown on thescreen. The export file will be named as "Multimeter_Recorder.csv". If a file with thesame name already exists in the USB memory device, it will be overwritten. (If youwant to keep the existing file, back up it to other location in advance.) Select Exportin the bottom menu to export.
How to chart the dataYou can open the CSV file using Microsoft Excel, or your favorite spreadsheet application,and create charts based on the data.In the following steps, Microsoft Excel 2010 is used as an example.1. Open Multimeter_Recorder.csv in Excel.
2. Select the data that you want to chart (see Figure 6- 4).3. On the Insert tab, in the Charts group, click Line, and then click Line in 2-D Line
(see Figure 6- 5).
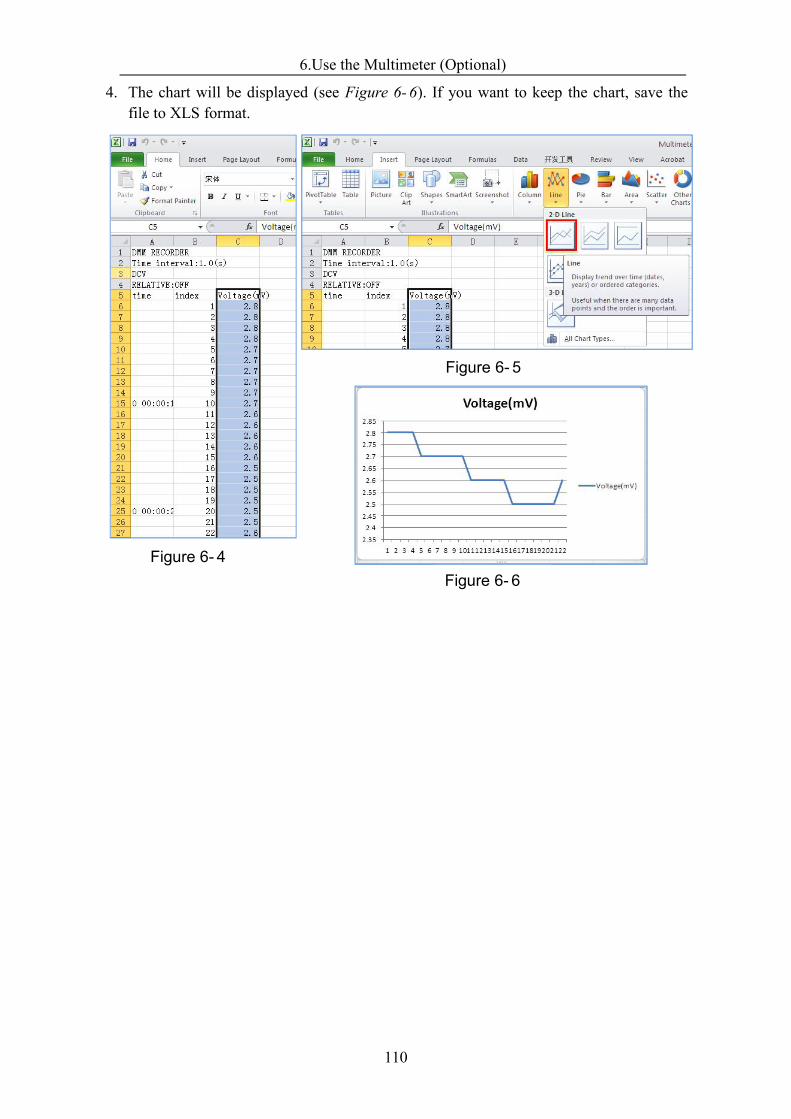
6.Use the Multimeter (Optional)
110
4. The chart will be displayed (see Figure 6- 6). If you want to keep the chart, save thefile to XLS format.
Figure 6- 6Figure 6- 4
Figure 6- 5
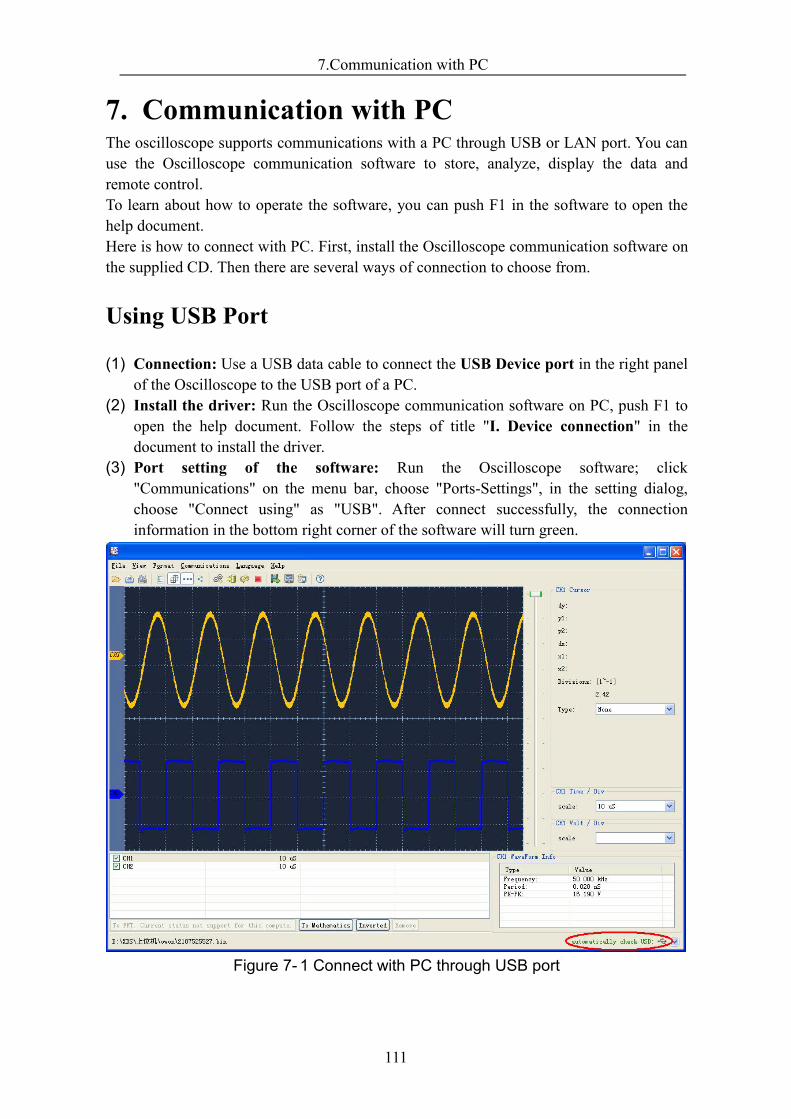
7.Communication with PC
111
7. Communication with PCThe oscilloscope supports communications with a PC through USB or LAN port. You canuse the Oscilloscope communication software to store, analyze, display the data andremote control.To learn about how to operate the software, you can push F1 in the software to open thehelp document.Here is how to connect with PC. First, install the Oscilloscope communication software onthe supplied CD. Then there are several ways of connection to choose from.
Using USB Port
(1) Connection: Use a USB data cable to connect the USB Device port in the right panelof the Oscilloscope to the USB port of a PC.
(2) Install the driver: Run the Oscilloscope communication software on PC, push F1 toopen the help document. Follow the steps of title "I. Device connection" in thedocument to install the driver.
(3) Port setting of the software: Run the Oscilloscope software; click"Communications" on the menu bar, choose "Ports-Settings", in the setting dialog,choose "Connect using" as "USB". After connect successfully, the connectioninformation in the bottom right corner of the software will turn green.
Figure 7- 1 Connect with PC through USB port
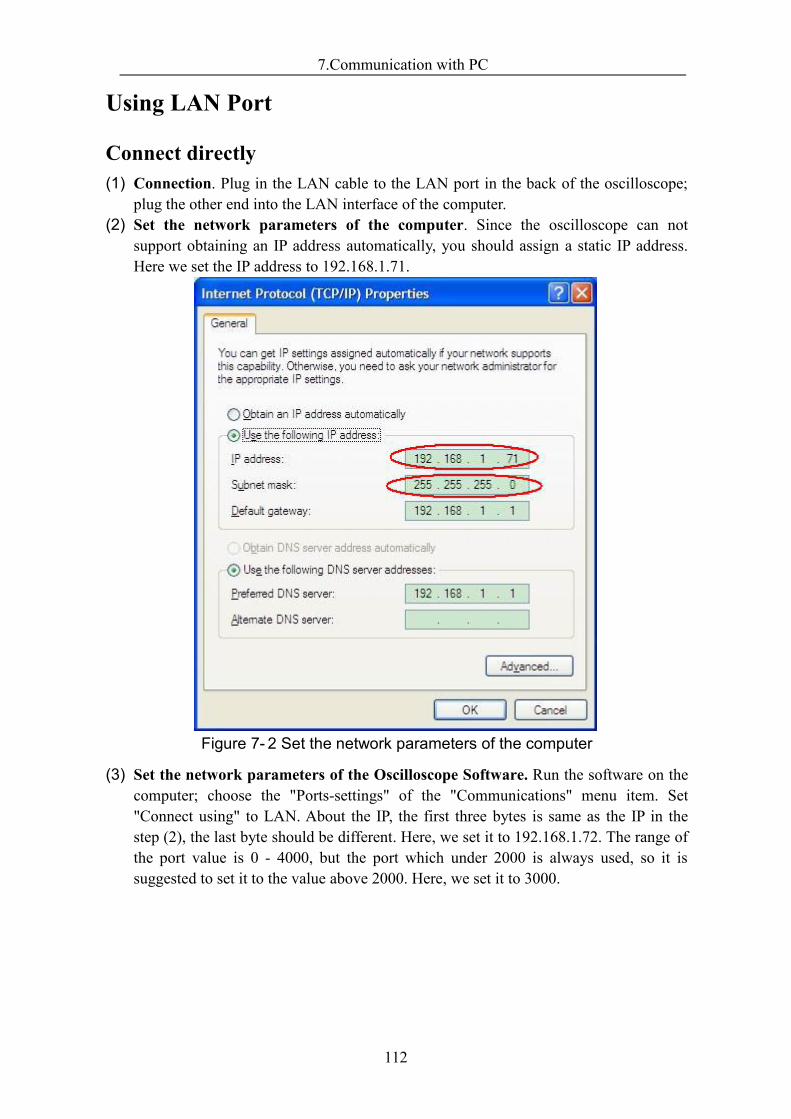
7.Communication with PC
112
Using LAN Port
Connect directly(1) Connection. Plug in the LAN cable to the LAN port in the back of the oscilloscope;
plug the other end into the LAN interface of the computer.(2) Set the network parameters of the computer. Since the oscilloscope can not
support obtaining an IP address automatically, you should assign a static IP address.Here we set the IP address to 192.168.1.71.
Figure 7- 2 Set the network parameters of the computer
(3) Set the network parameters of the Oscilloscope Software. Run the software on thecomputer; choose the "Ports-settings" of the "Communications" menu item. Set"Connect using" to LAN. About the IP, the first three bytes is same as the IP in thestep (2), the last byte should be different. Here, we set it to 192.168.1.72. The range ofthe port value is 0 - 4000, but the port which under 2000 is always used, so it issuggested to set it to the value above 2000. Here, we set it to 3000.
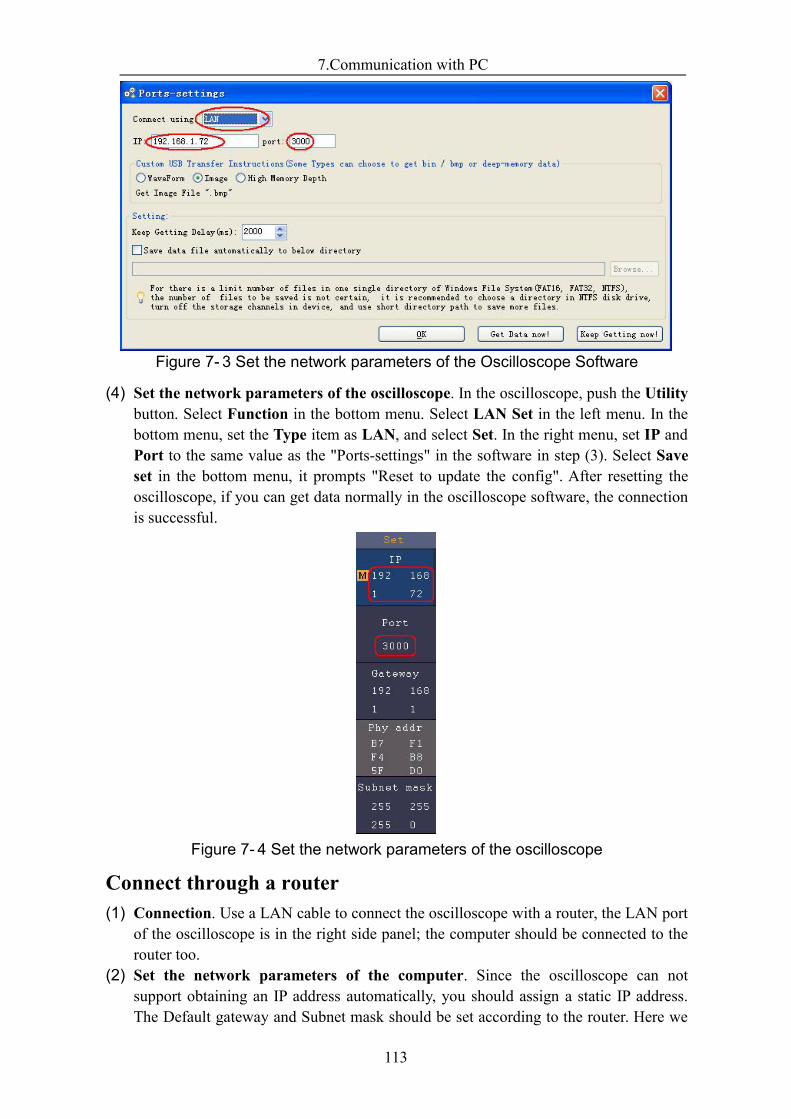
7.Communication with PC
113
Figure 7- 3 Set the network parameters of the Oscilloscope Software
(4) Set the network parameters of the oscilloscope. In the oscilloscope, push the Utilitybutton. Select Function in the bottom menu. Select LAN Set in the left menu. In thebottom menu, set the Type item as LAN, and select Set. In the right menu, set IP andPort to the same value as the "Ports-settings" in the software in step (3). Select Saveset in the bottom menu, it prompts "Reset to update the config". After resetting theoscilloscope, if you can get data normally in the oscilloscope software, the connectionis successful.
Figure 7- 4 Set the network parameters of the oscilloscope
Connect through a router(1) Connection. Use a LAN cable to connect the oscilloscope with a router, the LAN port
of the oscilloscope is in the right side panel; the computer should be connected to therouter too.
(2) Set the network parameters of the computer. Since the oscilloscope can notsupport obtaining an IP address automatically, you should assign a static IP address.The Default gateway and Subnet mask should be set according to the router. Here we
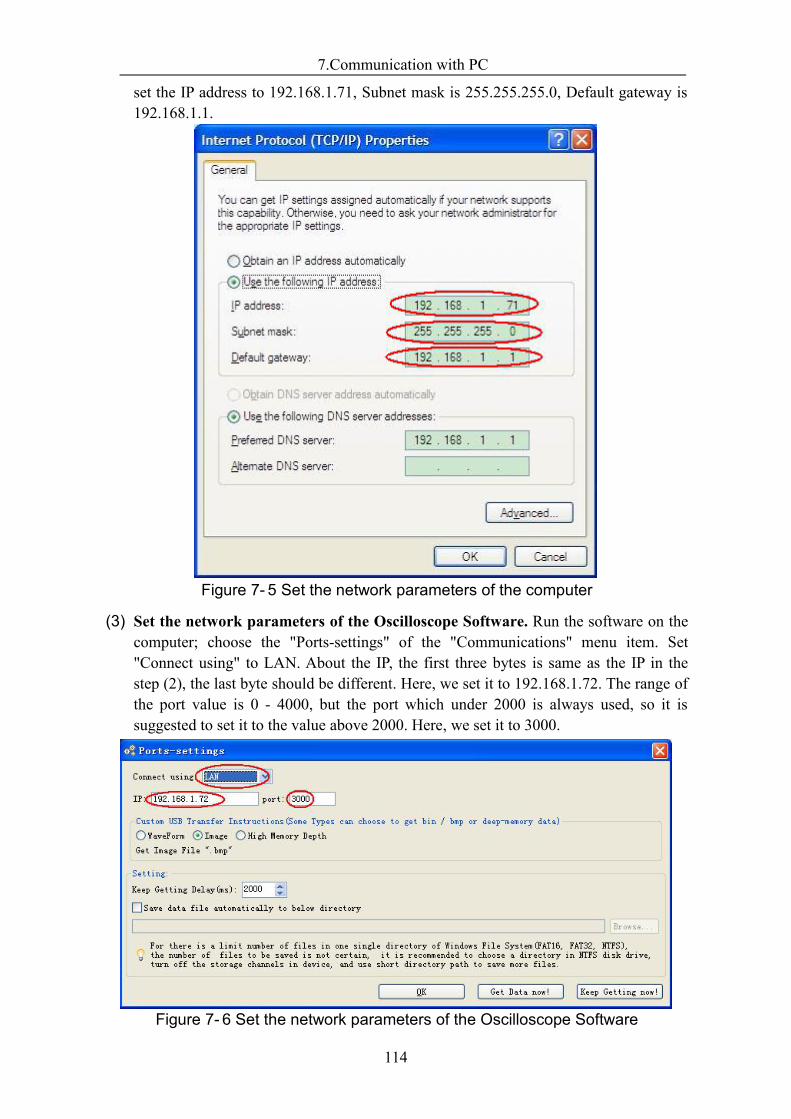
7.Communication with PC
114
set the IP address to 192.168.1.71, Subnet mask is 255.255.255.0, Default gateway is192.168.1.1.
Figure 7- 5 Set the network parameters of the computer
(3) Set the network parameters of the Oscilloscope Software. Run the software on thecomputer; choose the "Ports-settings" of the "Communications" menu item. Set"Connect using" to LAN. About the IP, the first three bytes is same as the IP in thestep (2), the last byte should be different. Here, we set it to 192.168.1.72. The range ofthe port value is 0 - 4000, but the port which under 2000 is always used, so it issuggested to set it to the value above 2000. Here, we set it to 3000.
Figure 7- 6 Set the network parameters of the Oscilloscope Software
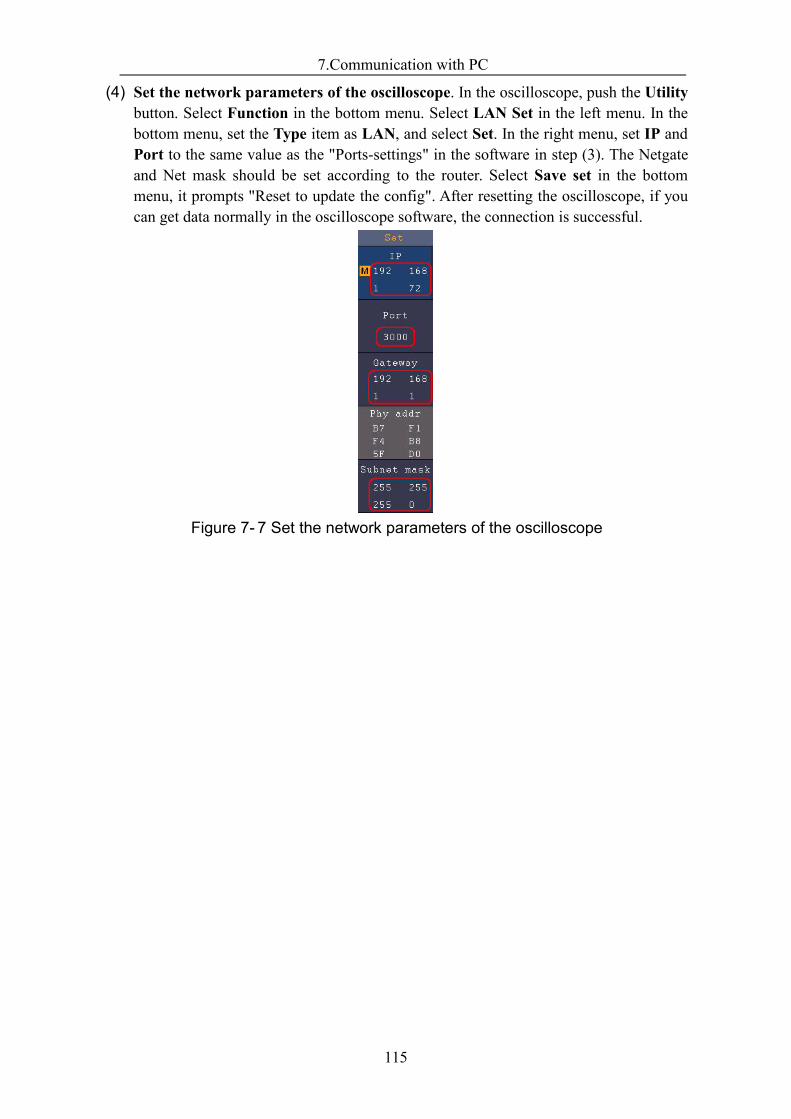
7.Communication with PC
115
(4) Set the network parameters of the oscilloscope. In the oscilloscope, push the Utilitybutton. Select Function in the bottom menu. Select LAN Set in the left menu. In thebottom menu, set the Type item as LAN, and select Set. In the right menu, set IP andPort to the same value as the "Ports-settings" in the software in step (3). The Netgateand Net mask should be set according to the router. Select Save set in the bottommenu, it prompts "Reset to update the config". After resetting the oscilloscope, if youcan get data normally in the oscilloscope software, the connection is successful.
Figure 7- 7 Set the network parameters of the oscilloscope
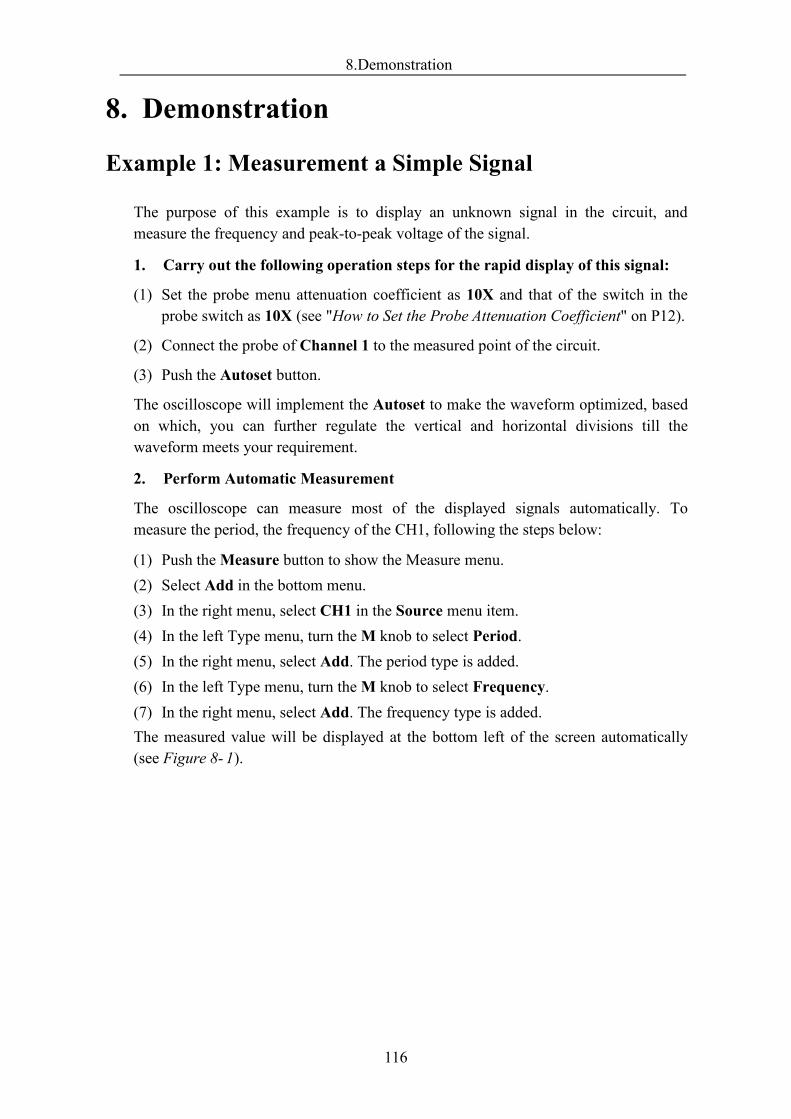
8.Demonstration
116
8. Demonstration
Example 1: Measurement a Simple Signal
The purpose of this example is to display an unknown signal in the circuit, andmeasure the frequency and peak-to-peak voltage of the signal.
1. Carry out the following operation steps for the rapid display of this signal:
(1) Set the probe menu attenuation coefficient as 10X and that of the switch in theprobe switch as 10X (see "How to Set the Probe Attenuation Coefficient" on P12).
(2) Connect the probe of Channel 1 to the measured point of the circuit.
(3) Push the Autoset button.
The oscilloscope will implement the Autoset to make the waveform optimized, basedon which, you can further regulate the vertical and horizontal divisions till thewaveform meets your requirement.
2. Perform Automatic Measurement
The oscilloscope can measure most of the displayed signals automatically. Tomeasure the period, the frequency of the CH1, following the steps below:
(1) Push theMeasure button to show the Measure menu.(2) Select Add in the bottom menu.(3) In the right menu, select CH1 in the Source menu item.(4) In the left Type menu, turn theM knob to select Period.(5) In the right menu, select Add. The period type is added.(6) In the left Type menu, turn theM knob to select Frequency.(7) In the right menu, select Add. The frequency type is added.The measured value will be displayed at the bottom left of the screen automatically(see Figure 8- 1).
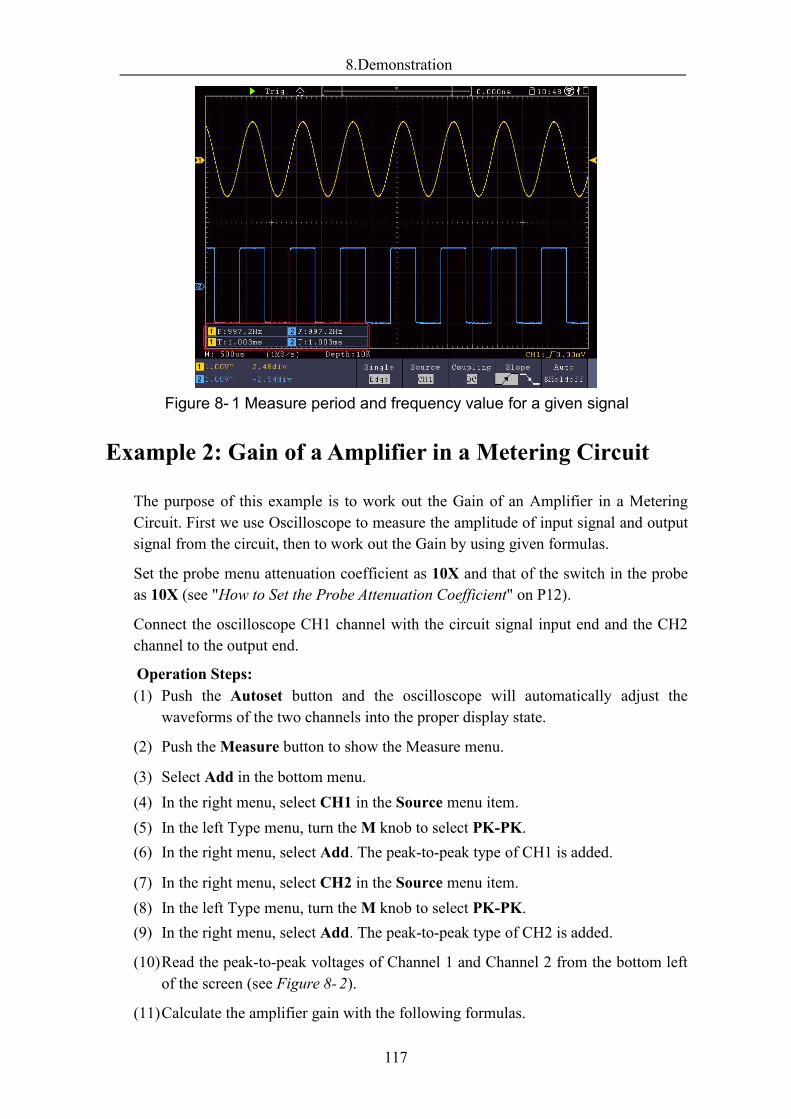
8.Demonstration
117
Figure 8- 1 Measure period and frequency value for a given signal
Example 2: Gain of a Amplifier in a Metering Circuit
The purpose of this example is to work out the Gain of an Amplifier in a MeteringCircuit. First we use Oscilloscope to measure the amplitude of input signal and outputsignal from the circuit, then to work out the Gain by using given formulas.
Set the probe menu attenuation coefficient as 10X and that of the switch in the probeas 10X (see "How to Set the Probe Attenuation Coefficient" on P12).
Connect the oscilloscope CH1 channel with the circuit signal input end and the CH2channel to the output end.
Operation Steps:(1) Push the Autoset button and the oscilloscope will automatically adjust the
waveforms of the two channels into the proper display state.
(2) Push theMeasure button to show the Measure menu.
(3) Select Add in the bottom menu.(4) In the right menu, select CH1 in the Source menu item.(5) In the left Type menu, turn theM knob to select PK-PK.(6) In the right menu, select Add. The peak-to-peak type of CH1 is added.
(7) In the right menu, select CH2 in the Source menu item.(8) In the left Type menu, turn theM knob to select PK-PK.(9) In the right menu, select Add. The peak-to-peak type of CH2 is added.
(10)Read the peak-to-peak voltages of Channel 1 and Channel 2 from the bottom leftof the screen (see Figure 8- 2).
(11)Calculate the amplifier gain with the following formulas.
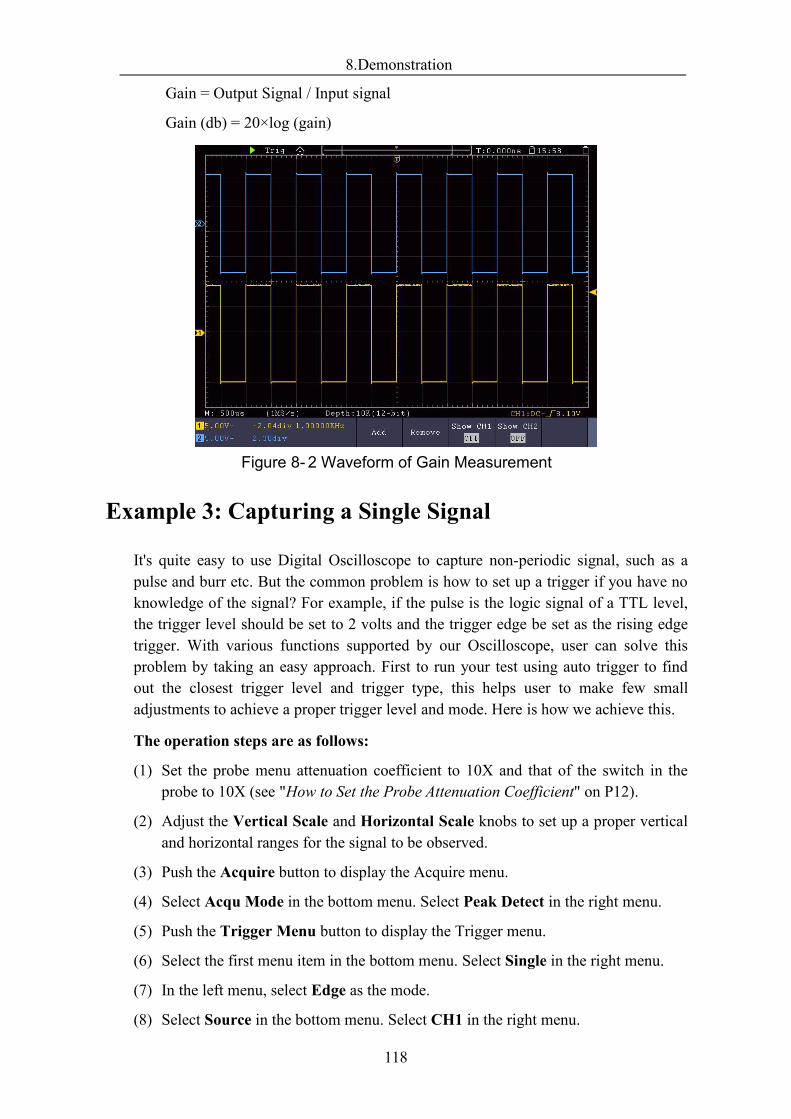
8.Demonstration
118
Gain = Output Signal / Input signal
Gain (db) = 20×log (gain)
Figure 8- 2 Waveform of Gain Measurement
Example 3: Capturing a Single Signal
It's quite easy to use Digital Oscilloscope to capture non-periodic signal, such as apulse and burr etc. But the common problem is how to set up a trigger if you have noknowledge of the signal? For example, if the pulse is the logic signal of a TTL level,the trigger level should be set to 2 volts and the trigger edge be set as the rising edgetrigger. With various functions supported by our Oscilloscope, user can solve thisproblem by taking an easy approach. First to run your test using auto trigger to findout the closest trigger level and trigger type, this helps user to make few smalladjustments to achieve a proper trigger level and mode. Here is how we achieve this.
The operation steps are as follows:
(1) Set the probe menu attenuation coefficient to 10X and that of the switch in theprobe to 10X (see "How to Set the Probe Attenuation Coefficient" on P12).
(2) Adjust the Vertical Scale and Horizontal Scale knobs to set up a proper verticaland horizontal ranges for the signal to be observed.
(3) Push the Acquire button to display the Acquire menu.
(4) Select Acqu Mode in the bottom menu. Select Peak Detect in the right menu.
(5) Push the Trigger Menu button to display the Trigger menu.
(6) Select the first menu item in the bottom menu. Select Single in the right menu.
(7) In the left menu, select Edge as the mode.
(8) Select Source in the bottom menu. Select CH1 in the right menu.
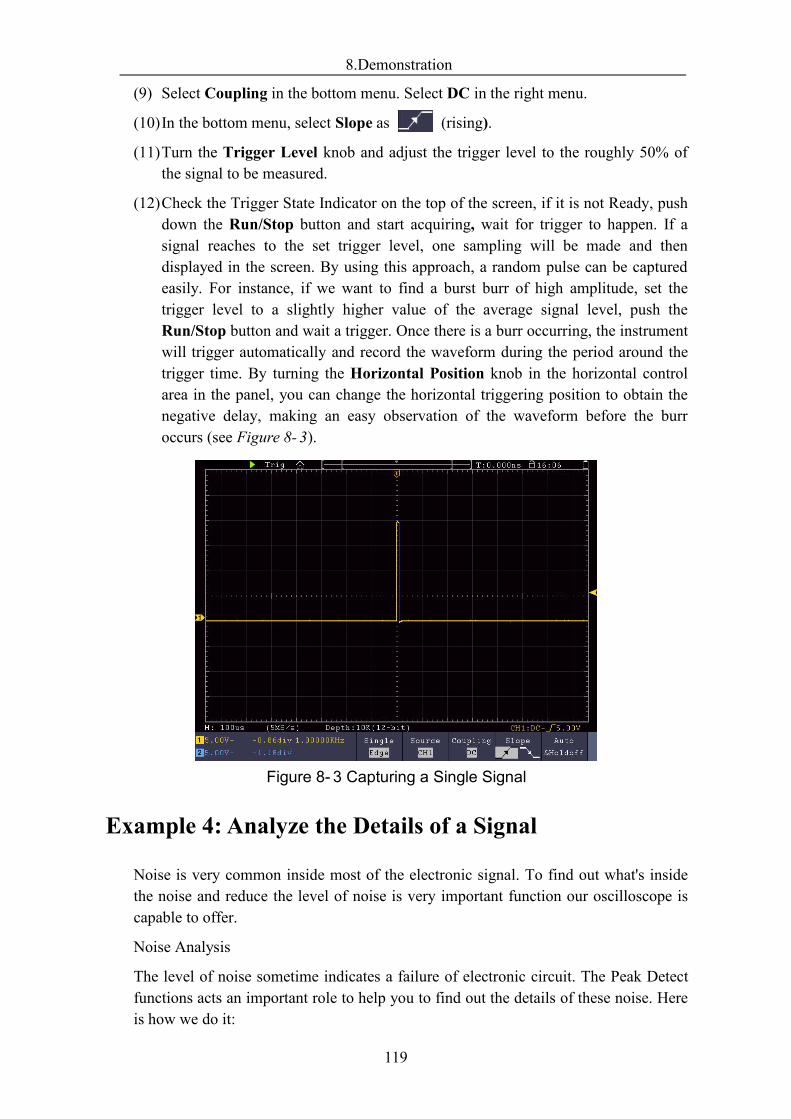
8.Demonstration
119
(9) Select Coupling in the bottom menu. Select DC in the right menu.
(10)In the bottom menu, select Slope as (rising).
(11)Turn the Trigger Level knob and adjust the trigger level to the roughly 50% ofthe signal to be measured.
(12)Check the Trigger State Indicator on the top of the screen, if it is not Ready, pushdown the Run/Stop button and start acquiring, wait for trigger to happen. If asignal reaches to the set trigger level, one sampling will be made and thendisplayed in the screen. By using this approach, a random pulse can be capturedeasily. For instance, if we want to find a burst burr of high amplitude, set thetrigger level to a slightly higher value of the average signal level, push theRun/Stop button and wait a trigger. Once there is a burr occurring, the instrumentwill trigger automatically and record the waveform during the period around thetrigger time. By turning the Horizontal Position knob in the horizontal controlarea in the panel, you can change the horizontal triggering position to obtain thenegative delay, making an easy observation of the waveform before the burroccurs (see Figure 8- 3).
Figure 8- 3 Capturing a Single Signal
Example 4: Analyze the Details of a Signal
Noise is very common inside most of the electronic signal. To find out what's insidethe noise and reduce the level of noise is very important function our oscilloscope iscapable to offer.
Noise Analysis
The level of noise sometime indicates a failure of electronic circuit. The Peak Detectfunctions acts an important role to help you to find out the details of these noise. Hereis how we do it:
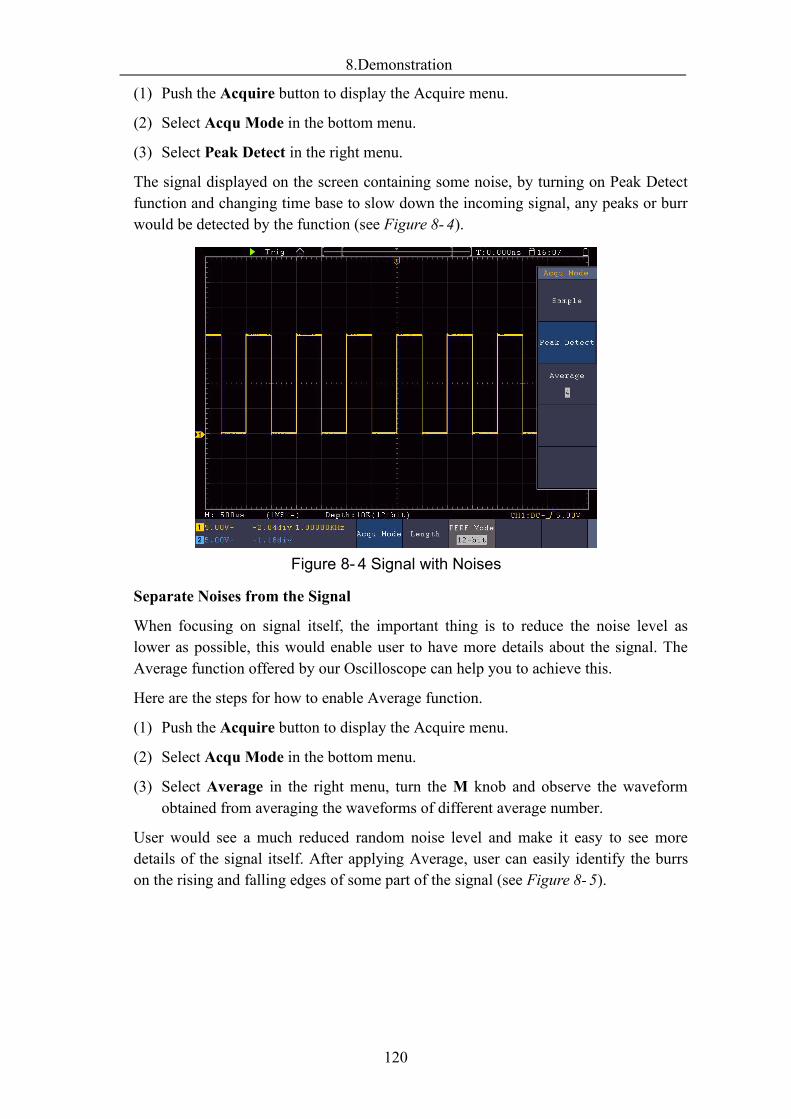
8.Demonstration
120
(1) Push the Acquire button to display the Acquire menu.
(2) Select Acqu Mode in the bottom menu.
(3) Select Peak Detect in the right menu.
The signal displayed on the screen containing some noise, by turning on Peak Detectfunction and changing time base to slow down the incoming signal, any peaks or burrwould be detected by the function (see Figure 8- 4).
Figure 8- 4 Signal with Noises
Separate Noises from the Signal
When focusing on signal itself, the important thing is to reduce the noise level aslower as possible, this would enable user to have more details about the signal. TheAverage function offered by our Oscilloscope can help you to achieve this.
Here are the steps for how to enable Average function.
(1) Push the Acquire button to display the Acquire menu.
(2) Select Acqu Mode in the bottom menu.
(3) Select Average in the right menu, turn the M knob and observe the waveformobtained from averaging the waveforms of different average number.
User would see a much reduced random noise level and make it easy to see moredetails of the signal itself. After applying Average, user can easily identify the burrson the rising and falling edges of some part of the signal (see Figure 8- 5).
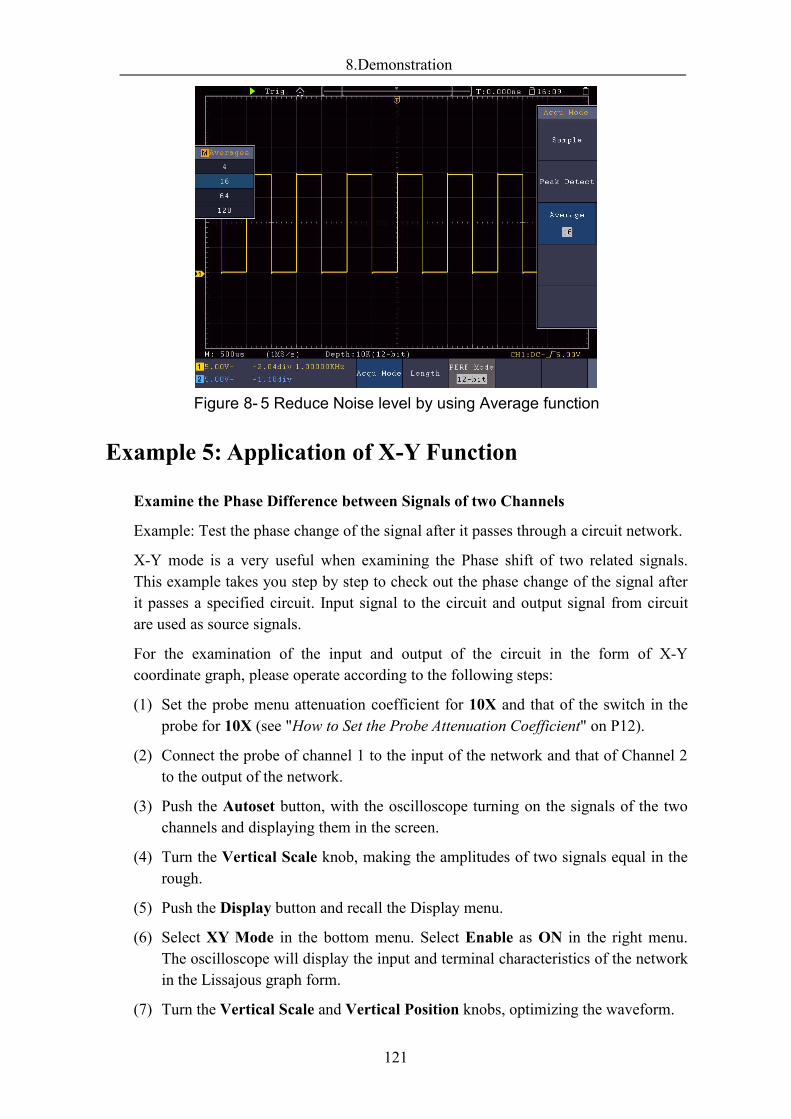
8.Demonstration
121
Figure 8- 5 Reduce Noise level by using Average function
Example 5: Application of X-Y Function
Examine the Phase Difference between Signals of two Channels
Example: Test the phase change of the signal after it passes through a circuit network.
X-Y mode is a very useful when examining the Phase shift of two related signals.This example takes you step by step to check out the phase change of the signal afterit passes a specified circuit. Input signal to the circuit and output signal from circuitare used as source signals.
For the examination of the input and output of the circuit in the form of X-Ycoordinate graph, please operate according to the following steps:
(1) Set the probe menu attenuation coefficient for 10X and that of the switch in theprobe for 10X (see "How to Set the Probe Attenuation Coefficient" on P12).
(2) Connect the probe of channel 1 to the input of the network and that of Channel 2to the output of the network.
(3) Push the Autoset button, with the oscilloscope turning on the signals of the twochannels and displaying them in the screen.
(4) Turn the Vertical Scale knob, making the amplitudes of two signals equal in therough.
(5) Push the Display button and recall the Display menu.
(6) Select XY Mode in the bottom menu. Select Enable as ON in the right menu.The oscilloscope will display the input and terminal characteristics of the networkin the Lissajous graph form.
(7) Turn the Vertical Scale and Vertical Position knobs, optimizing the waveform.
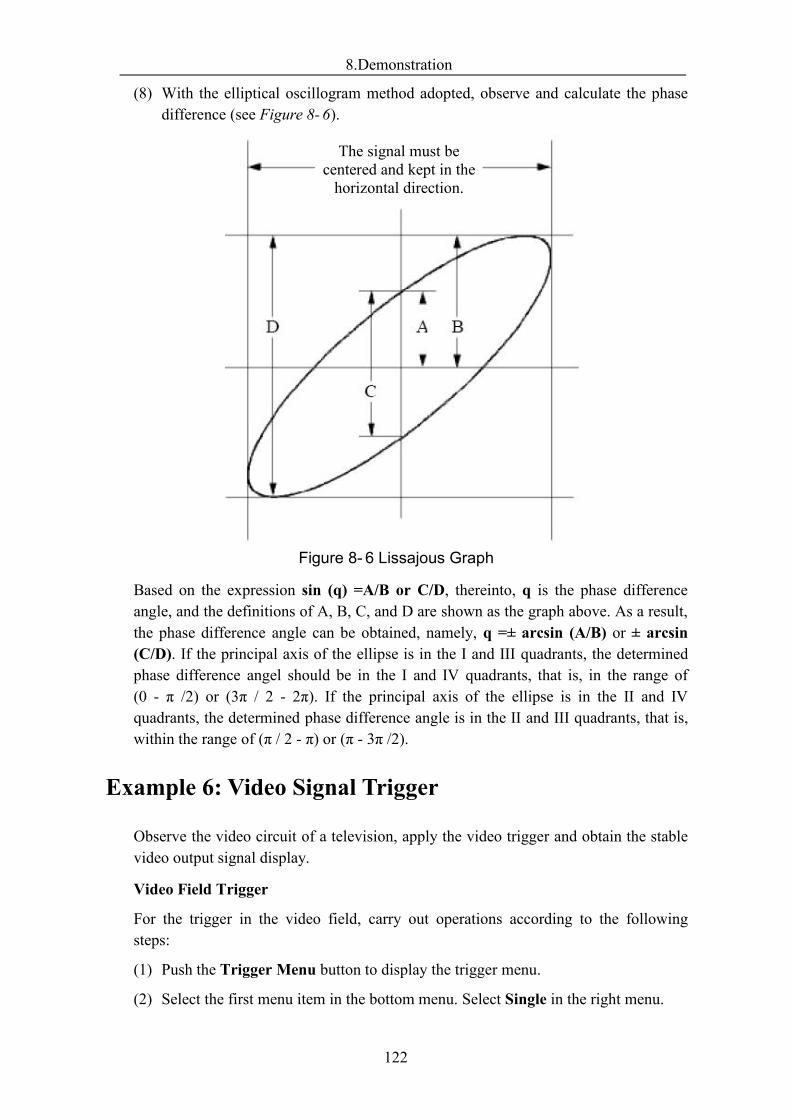
8.Demonstration
122
(8) With the elliptical oscillogram method adopted, observe and calculate the phasedifference (see Figure 8- 6).
Figure 8- 6 Lissajous Graph
Based on the expression sin (q) =A/B or C/D, thereinto, q is the phase differenceangle, and the definitions of A, B, C, and D are shown as the graph above. As a result,the phase difference angle can be obtained, namely, q =± arcsin (A/B) or ± arcsin(C/D). If the principal axis of the ellipse is in the I and III quadrants, the determinedphase difference angel should be in the I and IV quadrants, that is, in the range of(0 - π /2) or (3π / 2 - 2π). If the principal axis of the ellipse is in the II and IVquadrants, the determined phase difference angle is in the II and III quadrants, that is,within the range of (π / 2 - π) or (π - 3π /2).
Example 6: Video Signal Trigger
Observe the video circuit of a television, apply the video trigger and obtain the stablevideo output signal display.
Video Field Trigger
For the trigger in the video field, carry out operations according to the followingsteps:
(1) Push the Trigger Menu button to display the trigger menu.
(2) Select the first menu item in the bottom menu. Select Single in the right menu.
The signal must becentered and kept in thehorizontal direction.
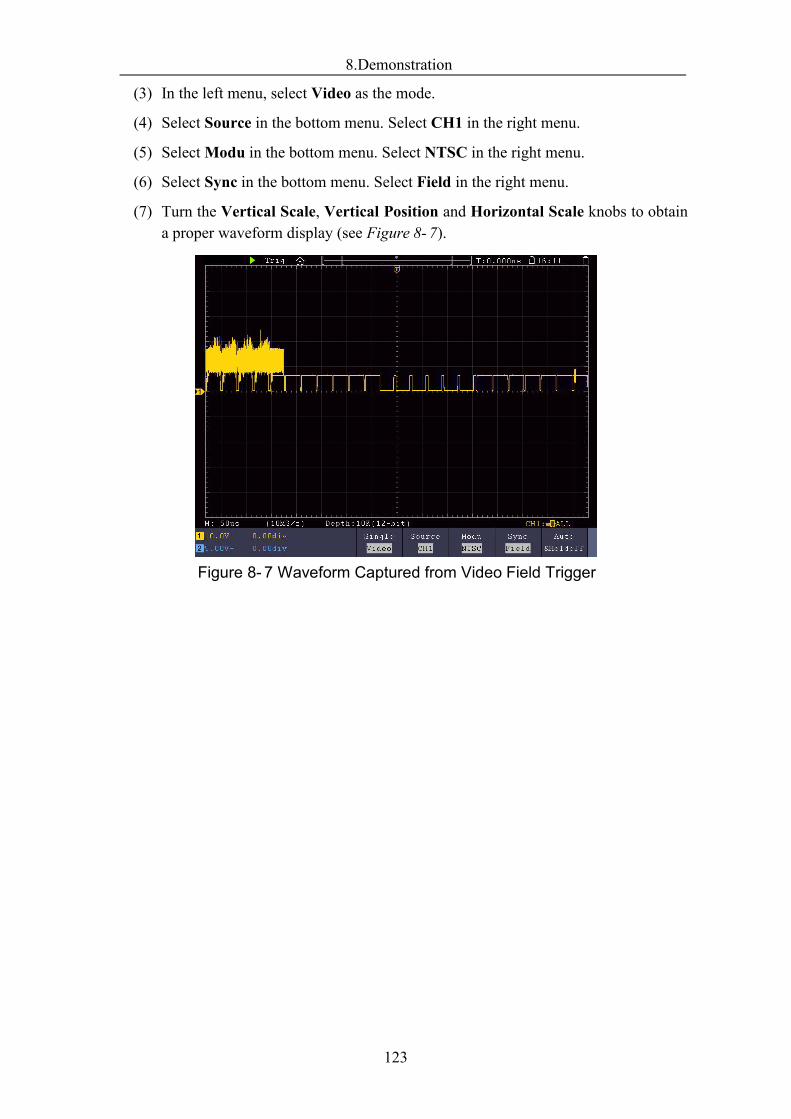
8.Demonstration
123
(3) In the left menu, select Video as the mode.
(4) Select Source in the bottom menu. Select CH1 in the right menu.
(5) SelectModu in the bottom menu. Select NTSC in the right menu.
(6) Select Sync in the bottom menu. Select Field in the right menu.
(7) Turn the Vertical Scale, Vertical Position and Horizontal Scale knobs to obtaina proper waveform display (see Figure 8- 7).
Figure 8- 7 Waveform Captured from Video Field Trigger
9.Troubleshooting
124
9. Troubleshooting1. Oscilloscope is powered on but no Display.
Check whether the power connection is connected properly. Check whether the fuse which is beside the AC power input jack is blew (the
cover can be pried open with a straight screwdriver). Restart the instrument after completing the checks above. If the problem persists, please contact us and we will be under your service.
2. After acquiring the signal, the waveform of the signal is not displayed in thescreen. Check whether the probe is properly connected to the signal connecting wire. Check whether the signal connecting wire is correctly connected to the BNC
(namely, the channel connector). Check whether the probe is properly connected with the object to be measured. Check whether there is any signal generated from the object to be measured (the
trouble can be shot by the connection of the channel from which there is a signalgenerated with the channel in fault).
Make the signal acquisition operation again.
3. The measured voltage amplitude value is 10 times or 1/10 of the actual value.Look at the attenuation coefficient for the input channel and the attenuation ration ofthe probe, to make sure they are match (see "How to Set the Probe AttenuationCoefficient" on P12).
4. There is a waveform displayed, but it is not stable. Check whether the Source item in the TRIG MODE menu is in conformity with
the signal channel used in the practical application. Check on the trigger Type item: The common signal chooses the Edge trigger
mode for Type and the video signal the Video. If Alternate trigger is selected,both of the channel 1 and channel 2 trigger levels should be adjusted to theproper position. Only if a proper trigger mode is applied, the waveform can bedisplayed steadily.
Try to change the trigger coupling into the high frequency suppress and the lowfrequency suppress to smooth the high frequency or low frequency noisetriggered by the interference.
5. No Display Responses to the Push-down of Run/Stop.Check whether Normal or Single is chosen for Polarity in the TRIG MODE menu andthe trigger level exceeds the waveform range.If it is, make the trigger level is centered in the screen or set the trigger mode as Auto.In addition, with the Autoset button pressed, the setting above can be completedautomatically.
6. The displaying of waveform seems getting slow after increasing AVERAGE valuein Acqu Mode (see "How to Implement Sampling Setup" on P57 ), or a longerduration is set in the Persist in Display (see "Persist" on P60).It's normal as the Oscilloscope is working hard on many more data points.
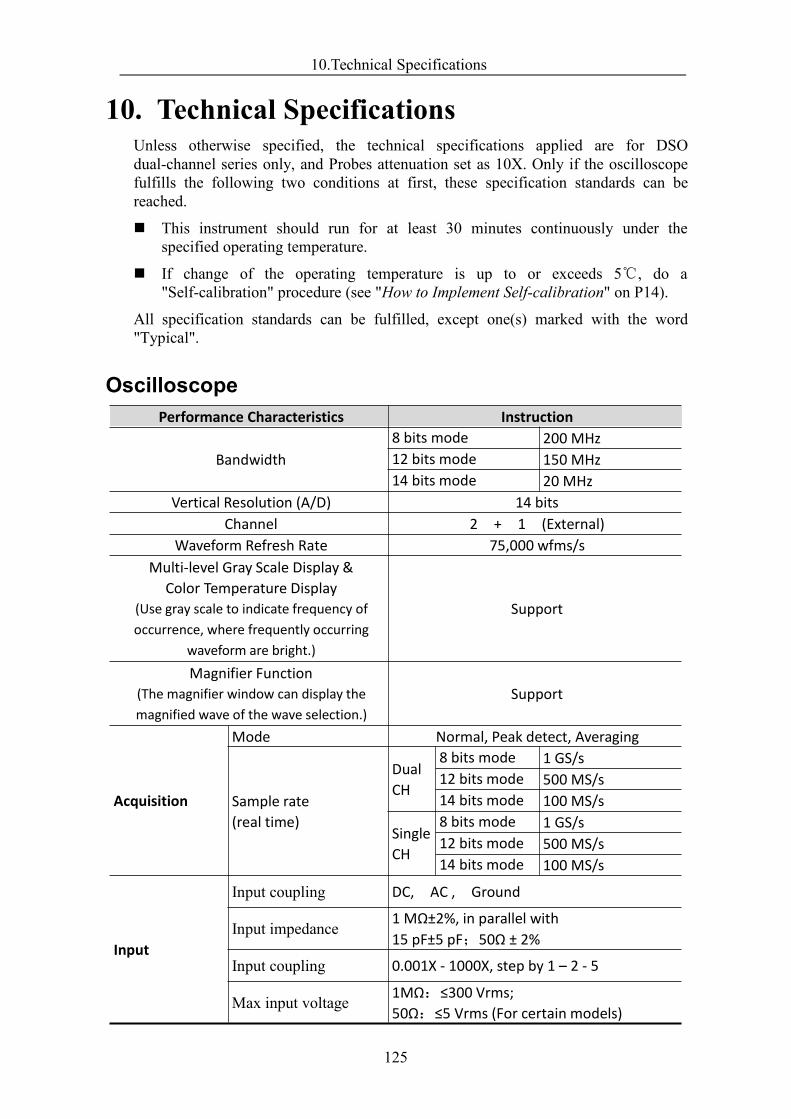
10.Technical Specifications
125
10. Technical SpecificationsUnless otherwise specified, the technical specifications applied are for DSOdual-channel series only, and Probes attenuation set as 10X. Only if the oscilloscopefulfills the following two conditions at first, these specification standards can bereached.
This instrument should run for at least 30 minutes continuously under thespecified operating temperature.
If change of the operating temperature is up to or exceeds 5℃, do a"Self-calibration" procedure (see "How to Implement Self-calibration" on P14).
All specification standards can be fulfilled, except one(s) marked with the word"Typical".
OscilloscopePerformance Characteristics Instruction
Bandwidth8 bits mode 200 MHz12 bits mode 150 MHz14 bits mode 20 MHz
Vertical Resolution (A/D) 14 bitsChannel 2 + 1 (External)
Waveform Refresh Rate 75,000 wfms/sMulti-level Gray Scale Display &
Color Temperature Display(Use gray scale to indicate frequency ofoccurrence, where frequently occurring
waveform are bright.)
Support
Magnifier Function(The magnifier window can display themagnified wave of the wave selection.)
Support
Acquisition
Mode Normal, Peak detect, Averaging
Sample rate(real time)
DualCH
8 bits mode 1 GS/s12 bits mode 500 MS/s14 bits mode 100 MS/s
SingleCH
8 bits mode 1 GS/s12 bits mode 500 MS/s14 bits mode 100 MS/s
Input
Input coupling DC, AC , Ground
Input impedance 1 MΩ±2%, in parallel with15 pF±5 pF;50Ω ± 2%
Input coupling 0.001X - 1000X, step by 1 – 2 - 5
Max input voltage 1MΩ:≤300 Vrms;50Ω:≤5 Vrms (For certain models)
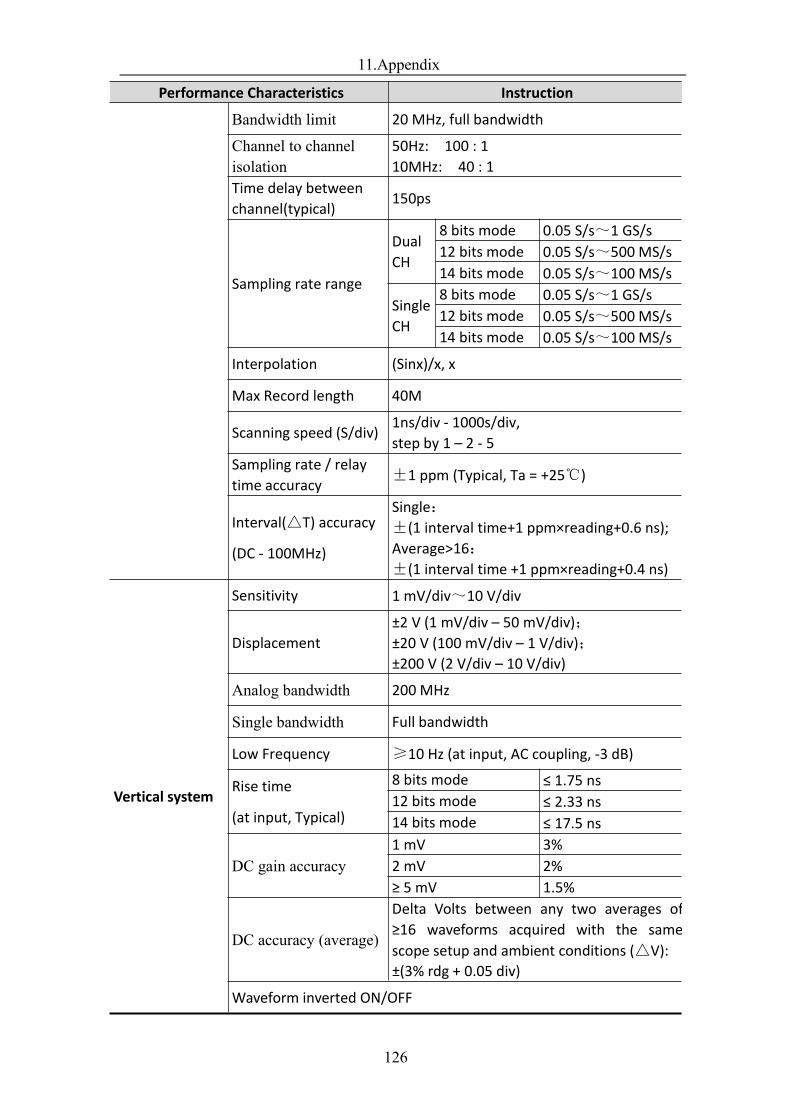
11.Appendix
126
Performance Characteristics Instruction
Bandwidth limit 20 MHz, full bandwidth
Channel to channelisolation
50Hz: 100 : 110MHz: 40 : 1
Time delay betweenchannel(typical)
150ps
Sampling rate range
DualCH
8 bits mode 0.05 S/s~1 GS/s12 bits mode 0.05 S/s~500 MS/s14 bits mode 0.05 S/s~100 MS/s
SingleCH
8 bits mode 0.05 S/s~1 GS/s12 bits mode 0.05 S/s~500 MS/s14 bits mode 0.05 S/s~100 MS/s
Interpolation (Sinx)/x, x
Max Record length 40M
Scanning speed (S/div)1ns/div - 1000s/div,step by 1 – 2 - 5
Sampling rate / relaytime accuracy ±1 ppm (Typical, Ta = +25℃)
Interval(△T) accuracy
(DC - 100MHz)
Single:±(1 interval time+1 ppm×reading+0.6 ns);Average>16:±(1 interval time +1 ppm×reading+0.4 ns)
Vertical system
Sensitivity 1 mV/div~10 V/div
Displacement±2 V (1 mV/div – 50 mV/div);±20 V (100 mV/div – 1 V/div);±200 V (2 V/div – 10 V/div)
Analog bandwidth 200 MHz
Single bandwidth Full bandwidth
Low Frequency ≥10 Hz (at input, AC coupling, -3 dB)
Rise time
(at input, Typical)
8 bits mode ≤ 1.75 ns12 bits mode ≤ 2.33 ns14 bits mode ≤ 17.5 ns
DC gain accuracy1 mV 3%2 mV 2%≥ 5 mV 1.5%
DC accuracy (average)
Delta Volts between any two averages of≥16 waveforms acquired with the samescope setup and ambient conditions (△V):±(3% rdg + 0.05 div)
Waveform inverted ON/OFF
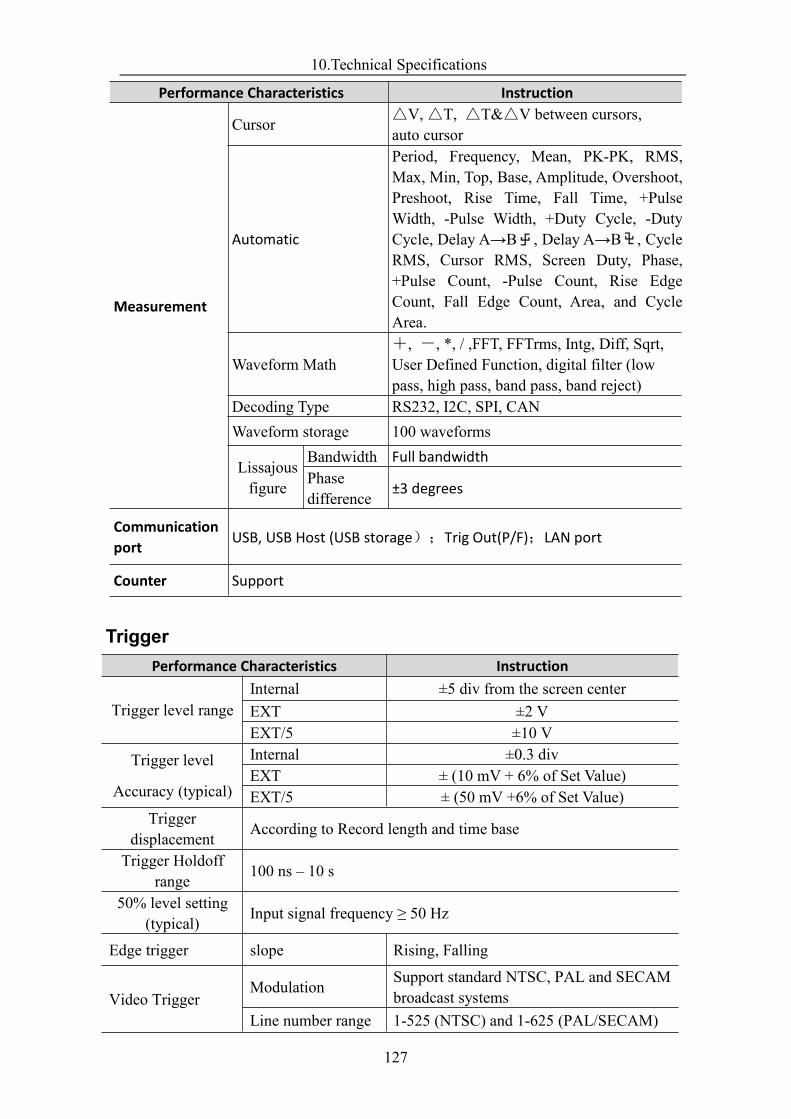
10.Technical Specifications
127
Performance Characteristics Instruction
Measurement
Cursor △V,△T, △T&△V between cursors,auto cursor
Automatic
Period, Frequency, Mean, PK-PK, RMS,Max, Min, Top, Base, Amplitude, Overshoot,Preshoot, Rise Time, Fall Time, +PulseWidth, -Pulse Width, +Duty Cycle, -DutyCycle, Delay A→B , Delay A→B , CycleRMS, Cursor RMS, Screen Duty, Phase,+Pulse Count, -Pulse Count, Rise EdgeCount, Fall Edge Count, Area, and CycleArea.
Waveform Math+, -, *, / ,FFT, FFTrms, Intg, Diff, Sqrt,User Defined Function, digital filter (lowpass, high pass, band pass, band reject)
Decoding Type RS232, I2C, SPI, CANWaveform storage 100 waveforms
Lissajousfigure
Bandwidth Full bandwidthPhasedifference ±3 degrees
Communicationport USB, USB Host (USB storage);Trig Out(P/F);LAN port
Counter Support
TriggerPerformance Characteristics Instruction
Trigger level rangeInternal ±5 div from the screen centerEXT ±2 VEXT/5 ±10 V
Trigger level
Accuracy (typical)
Internal ±0.3 divEXT ± (10 mV + 6% of Set Value)EXT/5 ± (50 mV +6% of Set Value)
Triggerdisplacement According to Record length and time base
Trigger Holdoffrange 100 ns – 10 s
50% level setting(typical) Input signal frequency ≥ 50 Hz
Edge trigger slope Rising, Falling
Video TriggerModulation Support standard NTSC, PAL and SECAM
broadcast systemsLine number range 1-525 (NTSC) and 1-625 (PAL/SECAM)
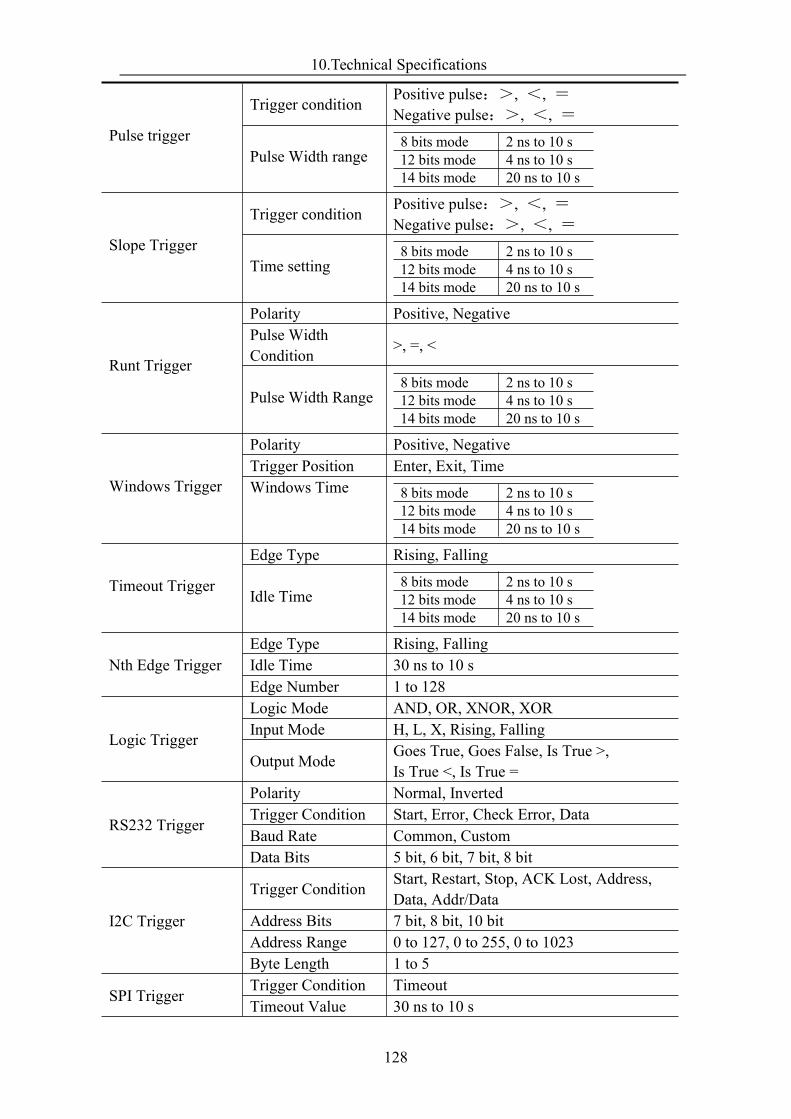
10.Technical Specifications
128
Pulse trigger
Trigger condition Positive pulse:>, <, =Negative pulse:>, <, =
Pulse Width range8 bits mode 2 ns to 10 s12 bits mode 4 ns to 10 s14 bits mode 20 ns to 10 s
Slope Trigger
Trigger condition Positive pulse:>, <, =Negative pulse:>, <, =
Time setting8 bits mode 2 ns to 10 s12 bits mode 4 ns to 10 s14 bits mode 20 ns to 10 s
Runt Trigger
Polarity Positive, NegativePulse WidthCondition >, =, <
Pulse Width Range8 bits mode 2 ns to 10 s12 bits mode 4 ns to 10 s14 bits mode 20 ns to 10 s
Windows Trigger
Polarity Positive, NegativeTrigger Position Enter, Exit, TimeWindows Time 8 bits mode 2 ns to 10 s
12 bits mode 4 ns to 10 s14 bits mode 20 ns to 10 s
Timeout Trigger
Edge Type Rising, Falling
Idle Time8 bits mode 2 ns to 10 s12 bits mode 4 ns to 10 s14 bits mode 20 ns to 10 s
Nth Edge TriggerEdge Type Rising, FallingIdle Time 30 ns to 10 sEdge Number 1 to 128
Logic Trigger
Logic Mode AND, OR, XNOR, XORInput Mode H, L, X, Rising, Falling
Output Mode Goes True, Goes False, Is True >,Is True <, Is True =
RS232 Trigger
Polarity Normal, InvertedTrigger Condition Start, Error, Check Error, DataBaud Rate Common, CustomData Bits 5 bit, 6 bit, 7 bit, 8 bit
I2C Trigger
Trigger Condition Start, Restart, Stop, ACK Lost, Address,Data, Addr/Data
Address Bits 7 bit, 8 bit, 10 bitAddress Range 0 to 127, 0 to 255, 0 to 1023Byte Length 1 to 5
SPI TriggerTrigger Condition TimeoutTimeout Value 30 ns to 10 s
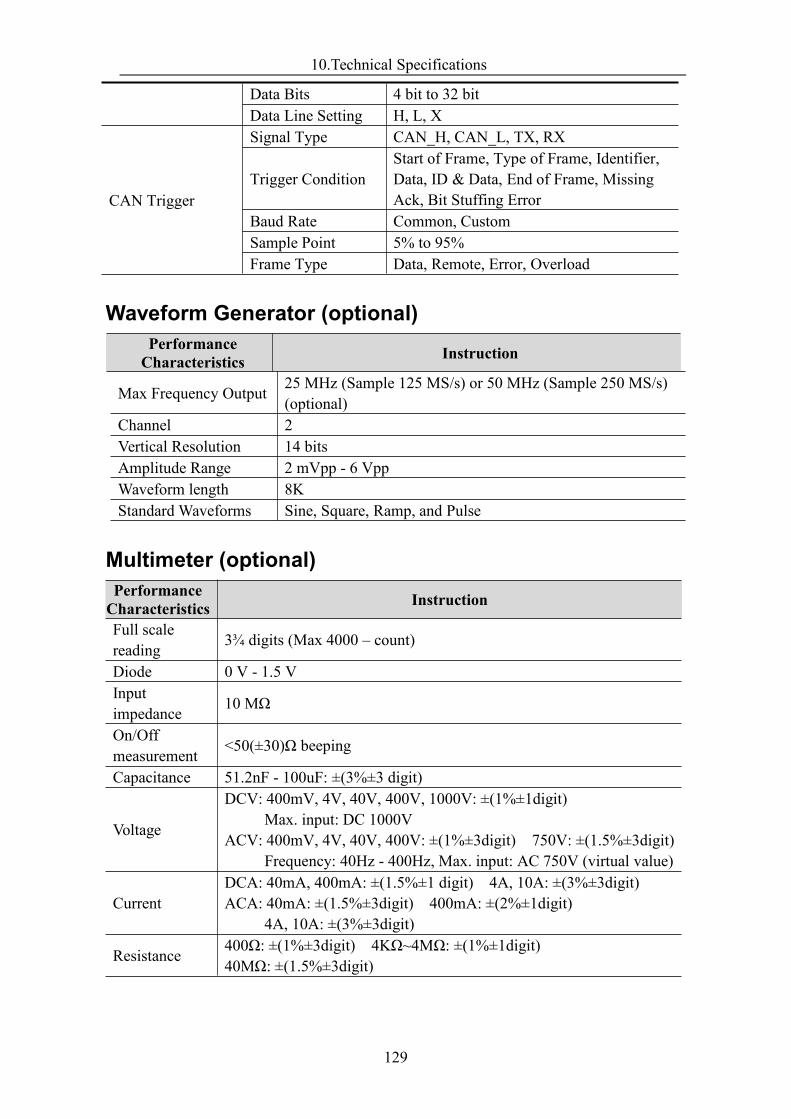
10.Technical Specifications
129
Data Bits 4 bit to 32 bitData Line Setting H, L, X
CAN Trigger
Signal Type CAN_H, CAN_L, TX, RX
Trigger ConditionStart of Frame, Type of Frame, Identifier,Data, ID & Data, End of Frame, MissingAck, Bit Stuffing Error
Baud Rate Common, CustomSample Point 5% to 95%Frame Type Data, Remote, Error, Overload
Waveform Generator (optional)PerformanceCharacteristics Instruction
Max Frequency Output 25 MHz (Sample 125 MS/s) or 50 MHz (Sample 250 MS/s)(optional)
Channel 2Vertical Resolution 14 bitsAmplitude Range 2 mVpp - 6 VppWaveform length 8KStandard Waveforms Sine, Square, Ramp, and Pulse
Multimeter (optional)PerformanceCharacteristics Instruction
Full scalereading 3¾ digits (Max 4000 – count)
Diode 0 V - 1.5 VInputimpedance 10 MΩ
On/Offmeasurement <50(±30)Ω beeping
Capacitance 51.2nF - 100uF: ±(3%±3 digit)
Voltage
DCV: 400mV, 4V, 40V, 400V, 1000V: ±(1%±1digit)Max. input: DC 1000V
ACV: 400mV, 4V, 40V, 400V: ±(1%±3digit) 750V: ±(1.5%±3digit)Frequency: 40Hz - 400Hz, Max. input: AC 750V (virtual value)
CurrentDCA: 40mA, 400mA: ±(1.5%±1 digit) 4A, 10A: ±(3%±3digit)ACA: 40mA: ±(1.5%±3digit) 400mA: ±(2%±1digit)
4A, 10A: ±(3%±3digit)
Resistance 400Ω: ±(1%±3digit) 4KΩ~4MΩ: ±(1%±1digit)40MΩ: ±(1.5%±3digit)
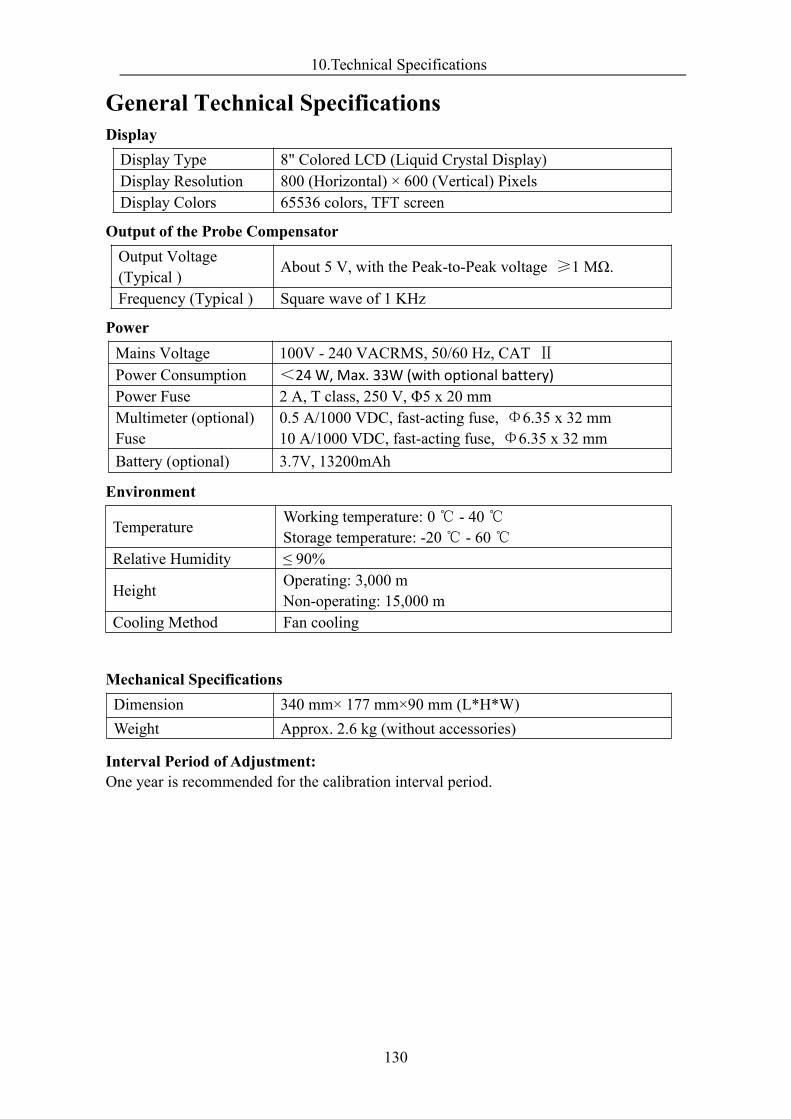
10.Technical Specifications
130
General Technical SpecificationsDisplayDisplay Type 8" Colored LCD (Liquid Crystal Display)Display Resolution 800 (Horizontal) × 600 (Vertical) PixelsDisplay Colors 65536 colors, TFT screen
Output of the Probe CompensatorOutput Voltage(Typical ) About 5 V, with the Peak-to-Peak voltage ≥1 MΩ.
Frequency (Typical ) Square wave of 1 KHz
PowerMains Voltage 100V - 240 VACRMS, 50/60 Hz, CAT Ⅱ
Power Consumption <24 W, Max. 33W (with optional battery)Power Fuse 2 A, T class, 250 V, Φ5 x 20 mmMultimeter (optional)Fuse
0.5 A/1000 VDC, fast-acting fuse, Φ6.35 x 32 mm10 A/1000 VDC, fast-acting fuse, Φ6.35 x 32 mm
Battery (optional) 3.7V, 13200mAh
Environment
Temperature Working temperature: 0℃ - 40℃Storage temperature: -20℃ - 60℃
Relative Humidity ≤ 90%
Height Operating: 3,000 mNon-operating: 15,000 m
Cooling Method Fan cooling
Mechanical SpecificationsDimension 340 mm× 177 mm×90 mm (L*H*W)Weight Approx. 2.6 kg (without accessories)
Interval Period of Adjustment:One year is recommended for the calibration interval period.
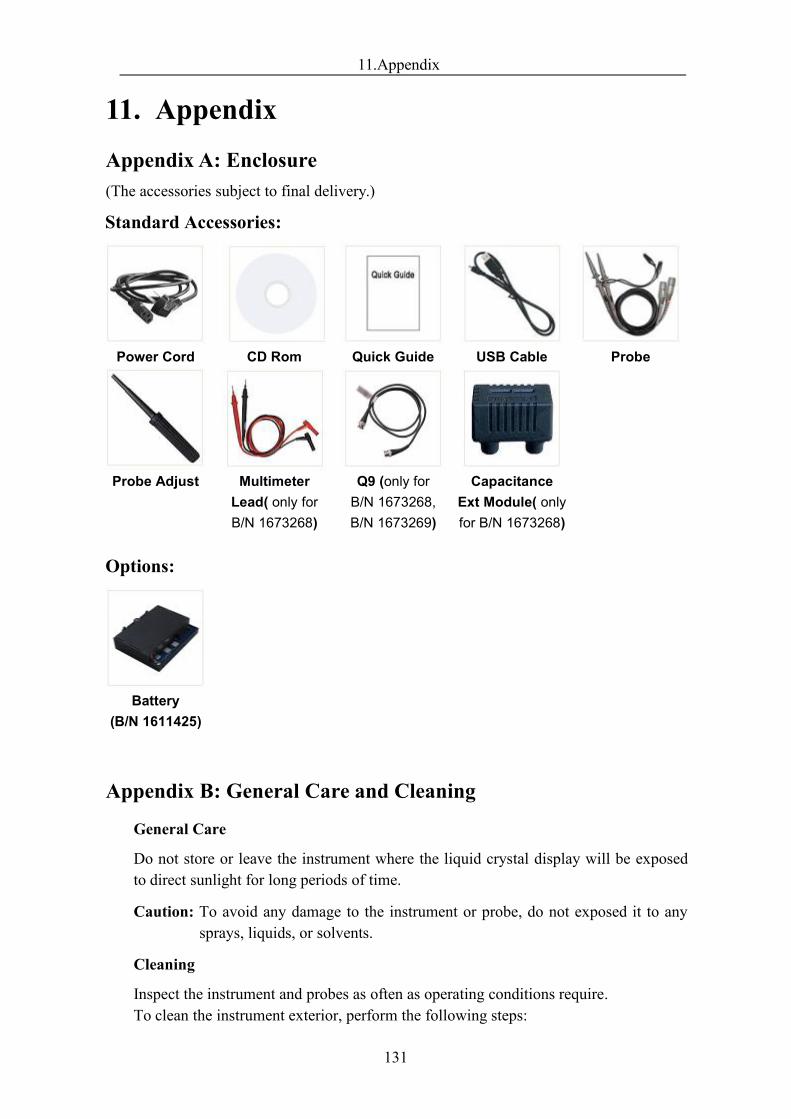
11.Appendix
131
11. AppendixAppendix A: Enclosure(The accessories subject to final delivery.)
Standard Accessories:
Power Cord CD Rom Quick Guide USB Cable Probe
Probe Adjust MultimeterLead( only forB/N 1673268)
Q9 (only forB/N 1673268,B/N 1673269)
CapacitanceExt Module( onlyfor B/N 1673268)
Options:
Battery(B/N 1611425)
Appendix B: General Care and Cleaning
General Care
Do not store or leave the instrument where the liquid crystal display will be exposedto direct sunlight for long periods of time.
Caution: To avoid any damage to the instrument or probe, do not exposed it to anysprays, liquids, or solvents.
Cleaning
Inspect the instrument and probes as often as operating conditions require.To clean the instrument exterior, perform the following steps:
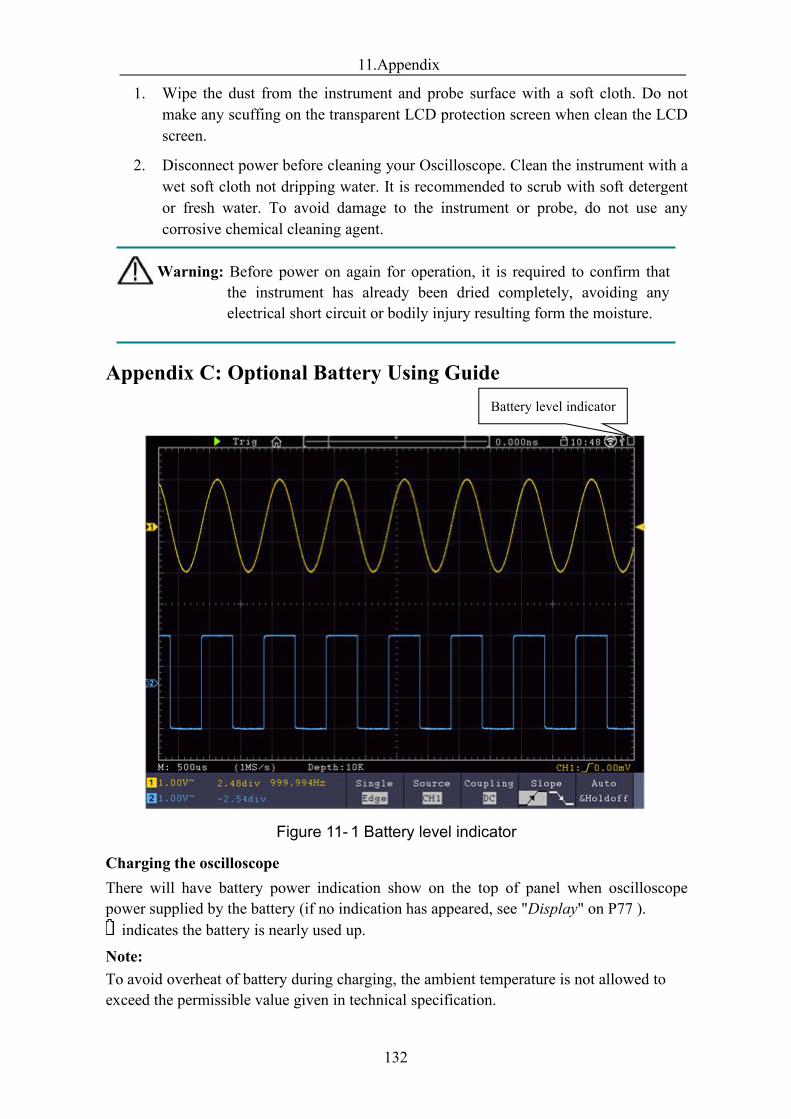
11.Appendix
132
1. Wipe the dust from the instrument and probe surface with a soft cloth. Do notmake any scuffing on the transparent LCD protection screen when clean the LCDscreen.
2. Disconnect power before cleaning your Oscilloscope. Clean the instrument with awet soft cloth not dripping water. It is recommended to scrub with soft detergentor fresh water. To avoid damage to the instrument or probe, do not use anycorrosive chemical cleaning agent.
Warning: Before power on again for operation, it is required to confirm thatthe instrument has already been dried completely, avoiding anyelectrical short circuit or bodily injury resulting form the moisture.
Appendix C: Optional Battery Using Guide
Figure 11- 1 Battery level indicator
Charging the oscilloscopeThere will have battery power indication show on the top of panel when oscilloscopepower supplied by the battery (if no indication has appeared, see "Display" on P77 ).indicates the battery is nearly used up.
Note:To avoid overheat of battery during charging, the ambient temperature is not allowed toexceed the permissible value given in technical specification.
Battery level indicator
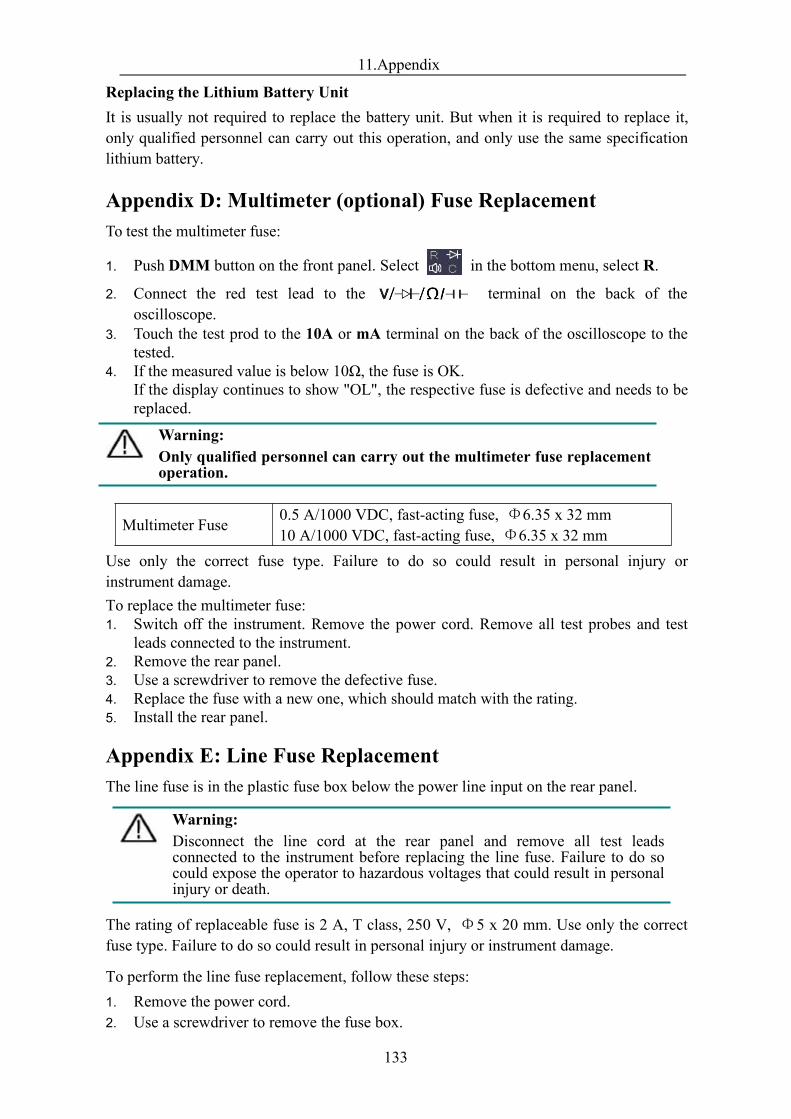
11.Appendix
133
Replacing the Lithium Battery UnitIt is usually not required to replace the battery unit. But when it is required to replace it,only qualified personnel can carry out this operation, and only use the same specificationlithium battery.
Appendix D: Multimeter (optional) Fuse ReplacementTo test the multimeter fuse:
1. Push DMM button on the front panel. Select in the bottom menu, select R.
2. Connect the red test lead to the terminal on the back of theoscilloscope.
3. Touch the test prod to the 10A or mA terminal on the back of the oscilloscope to thetested.
4. If the measured value is below 10Ω, the fuse is OK.If the display continues to show "OL", the respective fuse is defective and needs to bereplaced.
Multimeter Fuse 0.5 A/1000 VDC, fast-acting fuse, Φ6.35 x 32 mm10 A/1000 VDC, fast-acting fuse, Φ6.35 x 32 mm
Use only the correct fuse type. Failure to do so could result in personal injury orinstrument damage.To replace the multimeter fuse:1. Switch off the instrument. Remove the power cord. Remove all test probes and test
leads connected to the instrument.2. Remove the rear panel.3. Use a screwdriver to remove the defective fuse.4. Replace the fuse with a new one, which should match with the rating.5. Install the rear panel.
Appendix E: Line Fuse ReplacementThe line fuse is in the plastic fuse box below the power line input on the rear panel.
Warning:Disconnect the line cord at the rear panel and remove all test leadsconnected to the instrument before replacing the line fuse. Failure to do socould expose the operator to hazardous voltages that could result in personalinjury or death.
The rating of replaceable fuse is 2 A, T class, 250 V, Φ5 x 20 mm. Use only the correctfuse type. Failure to do so could result in personal injury or instrument damage.
To perform the line fuse replacement, follow these steps:1. Remove the power cord.2. Use a screwdriver to remove the fuse box.
Warning:Only qualified personnel can carry out the multimeter fuse replacementoperation.
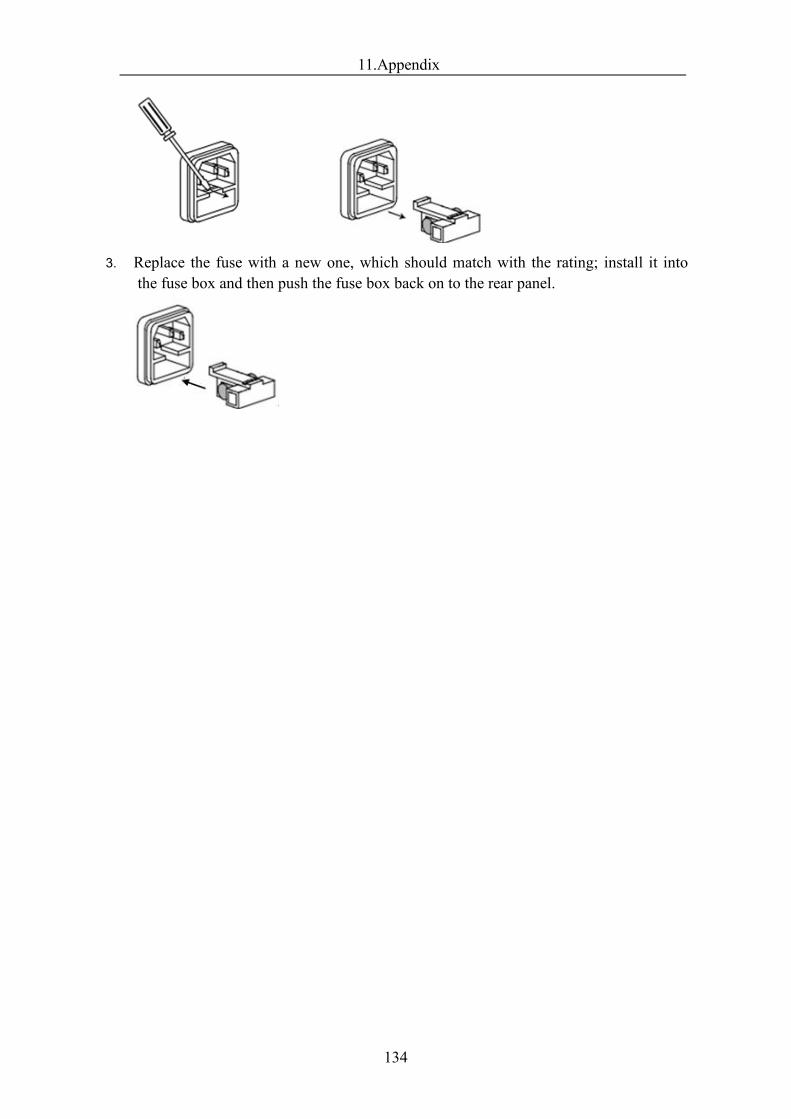
11.Appendix
134
3. Replace the fuse with a new one, which should match with the rating; install it intothe fuse box and then push the fuse box back on to the rear panel.