dow annual report 2012 data.pdf - ksb
TRANSCRIPT
1
CONTENTS KSB PUMPS LIMITED
Page Nos.
General Information ................................................................................2
Board’s Report ......................................................................................3-5
Annexures
i. Management Discussion & Analysis Report ..........................6-10
ii. Report on Corporate Governance ........................................11-19
iii. Other Annexures ..................................................................20-21
Auditors’ Report ...............................................................................22-25
Balance Sheet .........................................................................................26
Statement of Profit & Loss ..................................................................27
Cash Flow .........................................................................................28-29
Notes 1 to 44 ...................................................................................30-52
Consolidated Financial Statements ...................................................53-79
Summary of Financial Information of Subsidiary Company .................80
ANNUAL GENERAL MEETING
Date : 12th April, 2013
Day : Friday
Time : 2.00 p.m.
Venue : Bajaj Bhavan, Ground Floor, (Kamalnayan Bajaj Hall), 226, Nariman Point, Mumbai 400 021.
COMMUNICATION DETAILS
Tel No. : 022-66588787
Fax No. : 022-66588788
Shareholders’ Grievance Cell : [email protected]
Website : www.ksbindia.co.in
2
GENERAL INFORMATION
Board Of Directors
G. Swarup (Chairman)A.R. BroachaD.N. DamaniaN.N. KampaniDR. A. LeeDR. W. SchmittPradip ShahW. Spiegel (Managing Director)
Registered Office
126, Maker Chambers III, Nariman Point, Mumbai 400 021
Zonal Offices
North - NOIDAOffices - Chandigarh, Jaipur & Lucknow
East - KolkataOffices - Bhubaneshwar, Jamshedpur & Raipur
West - MumbaiOffices - Ahmedabad, Aurangabad, Baroda, Indore, Nagpur & Pune
South - ChennaiOffices - Bangalore & Secunderabad
Factories
Pimpri, Pune 411 018
Chinchwad, Pune 411 019
Vambori 413 704, Dist. Ahmednagar
NSN Palayam, Coimbatore 641 031
Sinnar, Dist. Nashik 422 103
Collaborators
KSB Aktiengesellschaft, Germany
Bankers
Central Bank of India Deutsche Bank AG Standard Chartered Bank
Auditors
Deloitte Haskins & Sells
Cost Auditors
Dhananjay V. Joshi & Associates
Registrars & Transfer Agents
Link Intime India Pvt. Ltd. Tel. No.: 022 25946970 E-mail: [email protected]
3
BOARD’S REPORT
To
The Shareholders,
The Board of Directors have pleasure to submit the report and audited Balance Sheet and Statement of Profit and Loss of the Company for the year ended 31st December, 2012.
FINANCIAL RESULTS AND DIVIDEND
(i) Financial Results:
` in Million
Year ended
31.12.2012
Year ended
31.12.2011
Revenue from operations (net) & Other Income 7404.80 7641.32Profit before taxation 806.58 622.94Less: Provision for taxation Current 265.10 207.00 Deferred (22.25) (5.43)Adjustment of tax of earlier years (16.43) (8.45)
226.42 193.12Profit after tax 580.16 429.82Balance brought forward 2651.61 2428.61Profit for appropriation 3231.77 2858.43
Appropriation:First Interim Dividend 34.81 34.81Second Interim Dividend 156.64 -Final Dividend - 104.42Tax on Dividend 31.06 22.59General Reserve 60.00 45.00Balance carried to Balance Sheet 2949.26 2651.61
3231.77 2858.43
Note: previous year’s figures have been regrouped/reclassified, wherever necessary to correspond with the current year classification/disclosure required as per revised Schedule- VI.
(ii) Dividend:
First Interim dividend of ` 1 per share of ` 10 each (10%) was paid during the year.
The Board of Directors declared Second interim dividend of ` 4.50 per share of ` 10 each ( 45%) making total dividend paid for the year ` 5.50 (55%). No Final Dividend is recommended by the Board.
GENERAL REVIEW
(i) Working:
During the year under review, the Company has earned higher profit before tax compared to the previous year even though there has been decrease in the sales. The overall economic slowdown and delay in project execution continued in 2012. Hence situation of heavy pressure on margin continued in the year. The Company has taken various cost reduction and efficiency improvement measures during the year which resulted in increased profitability despite of reduction in sale.
Export increased by ` 333 mio. from ` 701 mio. last year to ` 1034 mio.
The Company continues with its efforts to maintain growth even during the economic downturn and face new challenges.
(ii) Unclaimed Bonus Shares :
Total 23,608 bonus shares held by 152 shareholders were unclaimed in the year 2012, after allotment. Out of which 2,914 bonus shares were transferred to respective 6 shareholders who had approached for such shares. Now the total number of shares outstanding is 20,694 held by 146 shareholders.
(iii) Fixed Deposits:
The Company has no unpaid deposits except those unclaimed after the period of maturity. As on 31st December, 2012, 1 depositor (`15,000) did not claim his deposit on the due date.
4
(iv) Transfer to Investor Education & Protection Fund:
During the year, in accordance with section 205C of the Companies Act, 1956, an amount of `41,409 being unclaimed fixed deposits and interest and an amount of `205,708 being unclaimed dividends up to the year 31.12.2005, were transferred to the Investor Education & Protection Fund established by the Central Government.
(v) Subsidiary & Associate:
The Ministry of Corporate Affairs, the Government of India has vide Circular No. 2/2011 dated 8th February, 2011 granted general exemption subject to fulfillment of certain conditions from attaching the Balance Sheet of the Subsidiary to the Balance Sheet of the Company without making an application for exemption. Accordingly, the Balance Sheet, the Statement of Profit and Loss Account and other documents of the subsidiary company is not being attached with the Balance Sheet of the Company. Financial information of the subsidiary company is disclosed in the Annual Report. The Audited Annual Accounts of this subsidiary and related detailed information will be made available to any member of the Company/its subsidiary seeking such information at any point of time and are also available for inspection by any member of the Company/its subsidiary at the Registered Office of the Company. The Audited Annual Accounts of the said Subsidiary will also be available for inspection, as above, at the Head Office of the subsidiary company.
The Associate Company, MIL Controls Limited (MIL) has made a profit before tax of ` 337.7 mio for the year ended 31st December, 2012 (previous year - ` 280.5 mio).
(vi) Management Discussion and Analysis Report:
Annexed to this Report
(vii) Corporate Governance:
Annexed to this Report
(viii) Consolidated Accounts:
As per the requirement of SEBI, consolidated accounts in accordance with Accounting Standard AS 21 have been annexed to this Annual Report.
DIRECTORS
Mr. N.N. Kampani, Mr. D.N. Damania, and Dr. A. Lee retire by rotation and are eligible for re-appointment.
DIRECTORS’ RESPONSIBILITY STATEMENT
The Board of Directors confirm that
i. in the preparation of annual accounts, the applicable accounting standards have been followed and there is no material departure;
ii. the Directors have selected such accounting policies and applied them consistently and made judgements and estimates that are reasonable and prudent so as to give a true and fair view of the state of affairs of the Company at the end of the financial year and of the profit or loss of the Company for the year under review;
iii. the Directors have taken proper and sufficient care for the maintenance of adequate accounting records in accordance with the provisions of the Companies Act,1956, for safeguarding the assets of the Company and for preventing and detecting fraud and other irregularities.
iv. the Directors have prepared the annual accounts on a going concern basis.
BOARD’S REPORT (Contd.)
5
BOARD’S REPORT (Contd.)
ACKNOWLEDGEMENTS
The Board of Directors are grateful to Canadian Kay Pump Ltd., the main shareholder, and to KSB AG, Germany, the Company’s collaborators, for their valuable assistance and support. They wish to record their appreciation for the co-operation and support of the Company’s shareholders, bankers and other lending institutions, all employees including the workers, staff and middle management and all others concerned with the Company’s business.
PARTICULARS OF EMPLOYEES
The particulars prescribed under section 217(2A) of the Companies Act, 1956 are furnished in the annexure to this report.
C O N S E RVAT I O N O F E N E R G Y, TECHNOLOGY ABSORPTION AND FOREIGN EXCHANGE EARNINGS AND OUTGO
The particulars prescribed by the Companies (Disclosure of Particulars in the Report of Board of Directors) Rules, 1988 are furnished in the annexure to this report.
SAFETY AND ENVIRONMENT
The Company is committed to improve its processes and operations to achieve and enhance its initiatives towards improving environment, health and safety standards on a continuous basis.
In line with our vision under EHS and Global Compact, we have initiated several activities some of them being disposal of e-waste through authorized agency, programs initiated to increase awareness on environment conservation and distribution of saplings, improvised lamp fittings, VFDs, programmer for voltage regulation for AC’s, motion sensors in aisles etc., to save power, wet scrubbers, oil skimmers to
reduce pollution, conservation of wood & other packing material etc.
Further we have decided to have OHSAS 18001 certification for organization health and safety in coming year. Two plants will be audited and certified for OHSAS in the first phase. Extensive training programs are held to train our core team members who would be responsible to implement the requirements of this standard across all plants.
We have initiated dialogue with our supplier’s through correspondence and one-to-one meeting to begin the EHS activities at their end, this will be closely monitored in future to bring in desired result.
CORPORATE SOCIAL RESPONSIBILITY
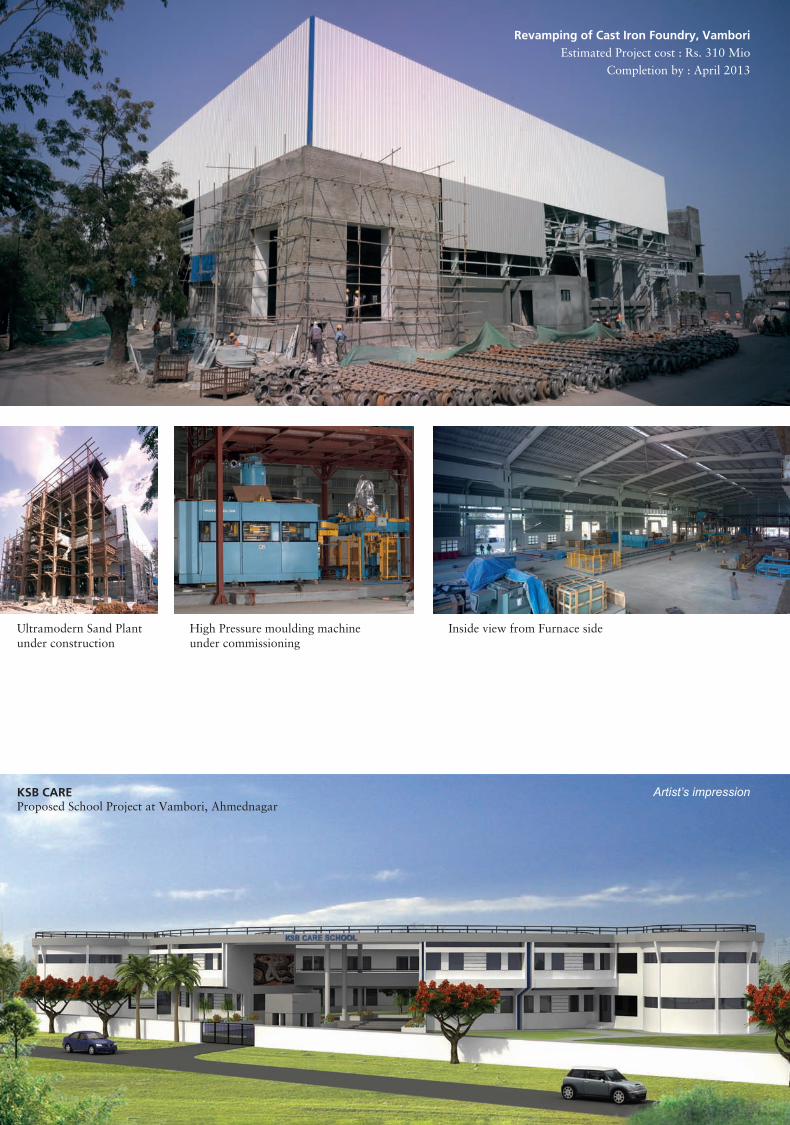
KSB Care Charitable Trust has initiated a project of supporting a school near Company’s foundry at Vambori. Proposed support is to construct a primary school building.
AUDITORS
You are requested to appoint auditors for the current year and to fix their remuneration. The retiring auditors Messrs. Deloitte Haskins & Sells, Chartered Accountants, are eligible and offer themselves for re-appointment. The Company has received a certificate from Messrs. Deloitte Haskins & Sells to the effect that their re-appointment, if made, will be within the prescribed limits specified in section 224(1B) of the Companies Act, 1956.
On behalf of the Board of Directors
G. SWARUP
CHAIRMAN
Mumbai, 22nd February, 2013
6
MANAGEMENT DISCUSSION & ANALYSIS REPORT
ANNEXURE TO BOARD’S REPORT
1.0 INTRODUCTION
The Company is engaged in the business of manufacture of power driven pumps and industrial valves. Castings are mainly produced for captive consumption.
2.0 I N D U S T RY S T R U C T U R E A N D DEVELOPMENT
2.1 General
On the backdrop of decelerated growth in 2011, growth prospects for 2012 remained uncertain. Advanced Economies clouding the global growth lost its momentum due to the protracted debt crisis in euro area and fiscal fragilities dampened business and consumer confidence. Growth in emerging markets, especially China and India, was slower beyond what was anticipated.
Contrary to expectation, Indian economy did not show signs of recovery. Lower global demand, domestic policy uncertainties and cumulative impact of monetary tightening lowered the growth rate below six percent. Industrial growth remained subdued due to supply-side bottlenecks as well as no flow of investments. The growth slowdown has been driven by sharp fall in investment which may remain sluggish in new projects. With reduced stress on global financial markets and revival of capital inflows, financial conditions improved in India. However, tight liquidity conditions saw money market rates firm-up.
Deficient monsoon conditions repercussed overall foodgrain production in the later part of the year. Industrial activities lost steam on account of weak demand for consumer durables, reflecting interest rate sensitivity, deceleration in external demand and subdued investment demand due to decline in business confidence. Growth in service sector moderated, reflecting the slowdown in construction. Persistent
inflationary pressures began easing in the initial period of year but remained sticky at about current level.
All in all, dampening of investment sentiments, global uncertainties, domestic cyclical and structural factors affected all three sectors in economy agriculture, industry and service. Alongside, reviving growth in a non-inflationary manner also posed a big challenge for Indian Economy.
2.2 Pumps & Valves Industries
After an encouraging start, the world economy cooled again in the course of 2012, which adversely affected the confidence of many investors in sound economic development. The mechanical engineering sector continued to grow in 2012 but much more slowly.
For Pumps and Valves manufacturers, the project business in energy sector continued to be characterised by low number of new orders and tight margins. Demand from chemical and petrochemical industries remained subdued as well as with no major grass root project started during the year.
3.0 OPPORTUNITIES AND THREATS
With India’s ever growing requirements of energy and capacity addition planned by the Government’s though demand is subdued at the moment, there exists substantial opportunity for the Company as the Company’s products are geared up for this sector.
With the globalisation, new international players are making a thrust in the Indian market by creation of additional manufacturing capacities. This would result in further intensification of competition leading to price pressures.
4.0 SEGMENTWISE PERFORMANCE
During the year under review, Pumps worth ` 4875 mio. (Previous year ` 5248 mio.)
7
MANAGEMENT DISCUSSION & ANALYSIS REPORT (Contd.)
were sold. Similarly during the year under review, valves worth ` 1423 mio (previous year ` 1396 mio) were sold.
EXPORT
During the year under review, exports of pumps and valves in terms of value were ` 1034 mio. as against ` 701 mio. in previous year. Agency commission earned was ` 35 mio.
5.0 OUTLOOK
Despite only moderate growth in the global economy, we expect order intake and sales revenue to grow once again in 2013.The implementation of strategic project would contribute significantly to this. Expansion of the standard business and the continued development of the service and aftermarket business will be important priorities.
Infrastructural developments in BRIC countries, urbanization in Asia Pacific countries resulted in more demand on power and fuel that would considerably contribute for growth in Pump & Valves industry.
For the current year, KSB expects the market for pumps, valves and services to grow moderately. Company is taking effective steps to improve earning before income tax in current year.
Program of production harmonization at various manufacturing locations is progressing satisfactorily. The Company continues its focus on innovation to meet the ever changing requirements of the customer.
6.0 R I S K S & C O N C E R N S T H E MANAGEMENT PERCEIVE
The competition is expected to be more aggressive leading to price pressures. Uncertainty in global economic growth coupled with inflationary pressures is
expected to impact the growth rate in India and consequently the Company’s operations.
The growth in the industrial sector depends on better infrastructure, removal of labour market rigidities and growth in agricultural sector.
7.0 INTERNAL CONTROL SYSTEM & THEIR ADEQUACY
Internal Control Systems are implemented:-
• To safeguard the Company’s assetsfrom loss or damage
• To keep constant check on coststructure
• To provide adequate financial andaccounting controls and implement accounting standards.
The system is improved and modified continuously to meet with changes in business condition, statutory and accounting requirements.
Internal controls are adequately supported by Internal Audit and periodic review by the management.
The Audit Committee meets periodically to review -
• with themanagement, and statutoryauditors, financial statements
• withtheinternalauditors,adequacy/scope of internal audit function, significant findings and follow up thereon and findings of any abnormal nature.
8.0 D I S C U S S I O N O N F I N A N C I A L PERFORMANCE WITH RESPECT TO OPERATIONAL EFFICIENCY
Due to some cost control measures, there is reduction in total expenses for 2012 as compared to last year. Consequently Profit after Tax improved even though the total turnover has decreased.
8
MANAGEMENT DISCUSSION & ANALYSIS REPORT (Contd.)
The following statements cover financial Performance Review, which are attached to this report.
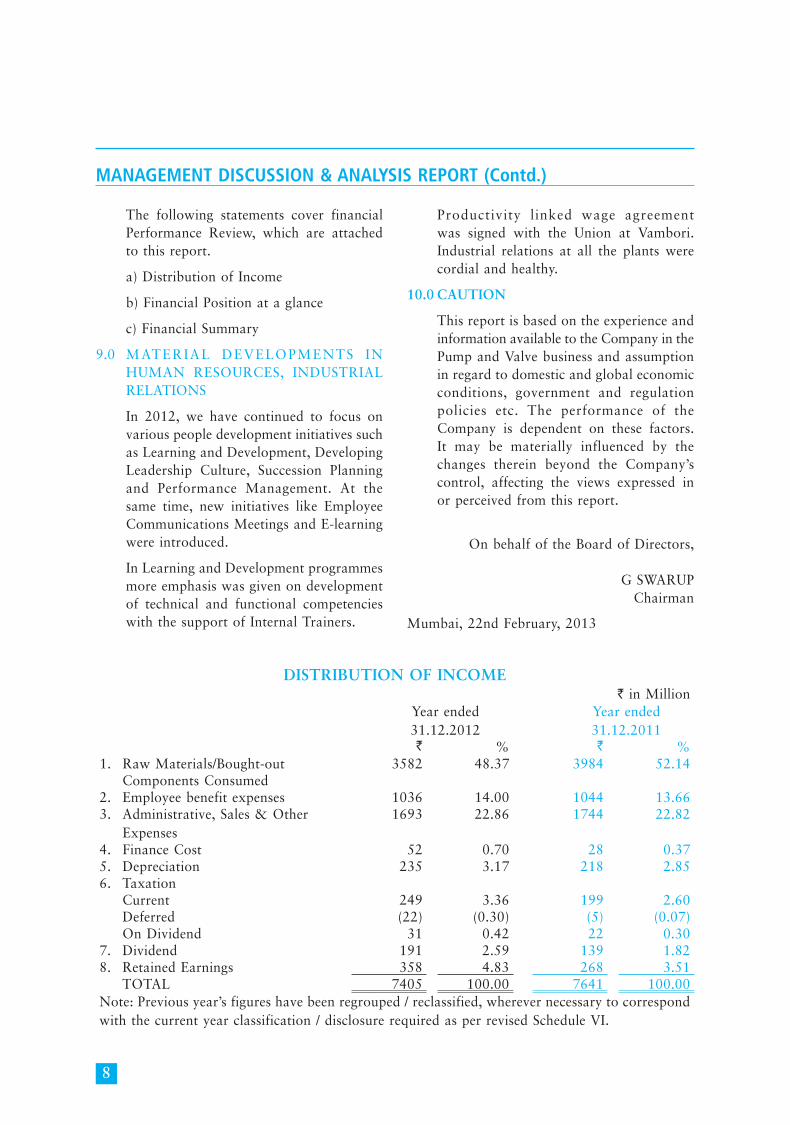
a) Distribution of Income
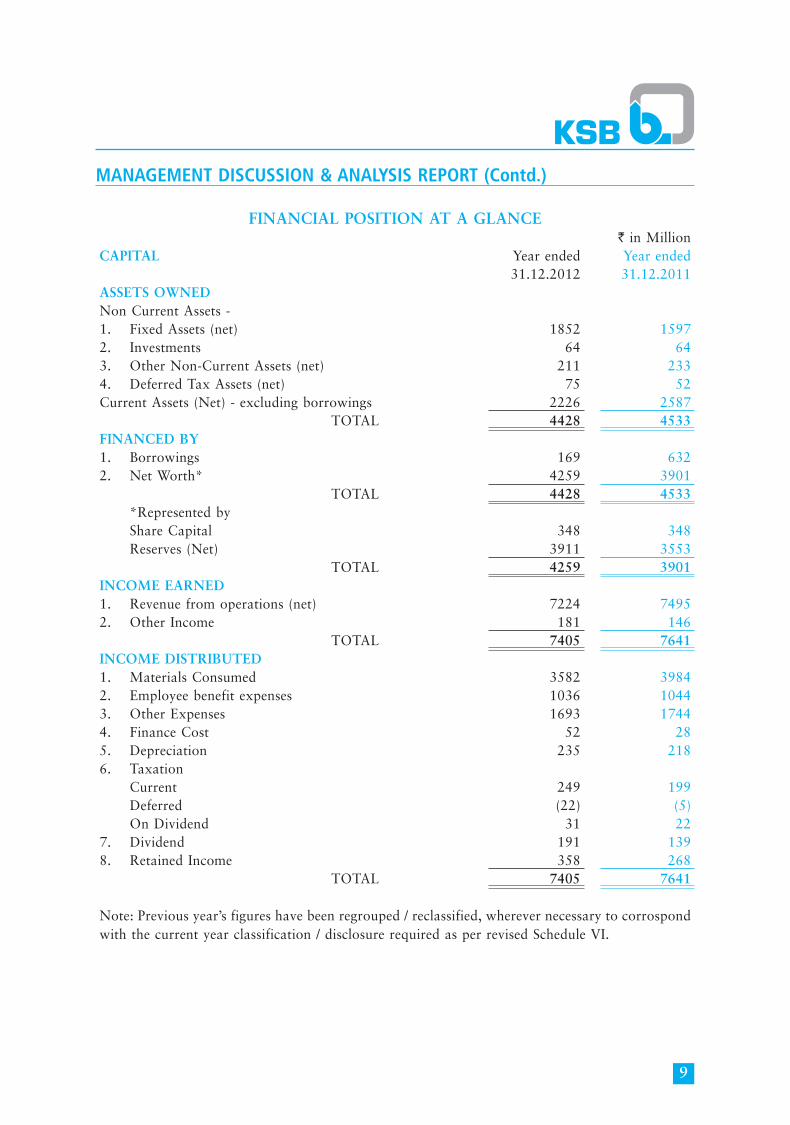
b) Financial Position at a glance
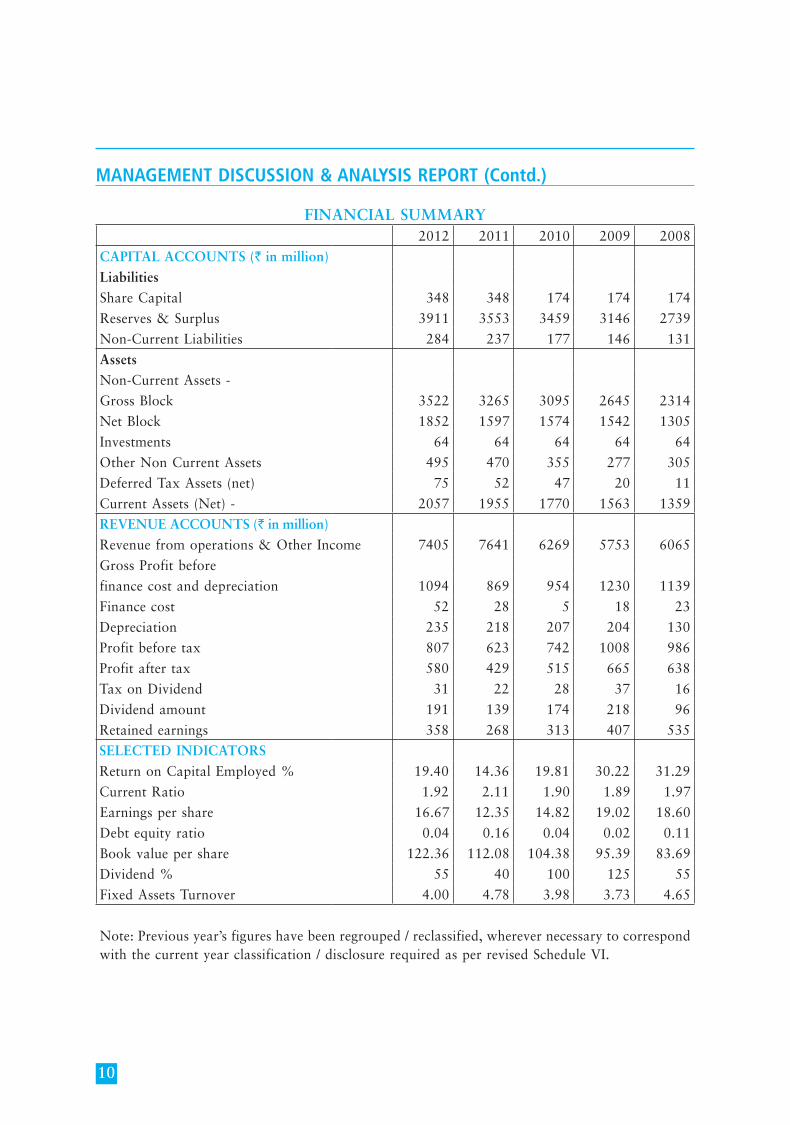
c) Financial Summary
9.0 MATERIAL DEVELOPMENTS IN HUMAN RESOURCES, INDUSTRIAL RELATIONS
In 2012, we have continued to focus on various people development initiatives such as Learning and Development, Developing Leadership Culture, Succession Planning and Performance Management. At the same time, new initiatives like Employee Communications Meetings and E-learning were introduced.
In Learning and Development programmes more emphasis was given on development of technical and functional competencies with the support of Internal Trainers.
Productivity linked wage agreement was signed with the Union at Vambori. Industrial relations at all the plants were cordial and healthy.
10.0 CAUTION
This report is based on the experience and information available to the Company in the Pump and Valve business and assumption in regard to domestic and global economic conditions, government and regulation policies etc. The performance of the Company is dependent on these factors. It may be materially influenced by the changes therein beyond the Company’s control, affecting the views expressed in or perceived from this report.
On behalf of the Board of Directors,
G SWARUPChairman
Mumbai, 22nd February, 2013
DISTRIBUTION OF INCOME` in Million
Year ended 31.12.2012
Year ended 31.12.2011
` % ` %1. Raw Materials/Bought-out 3582 48.37 3984 52.14
Components Consumed2. Employee benefit expenses 1036 14.00 1044 13.663. Administrative, Sales & Other
Expenses1693 22.86 1744 22.82
4. Finance Cost 52 0.70 28 0.375. Depreciation 235 3.17 218 2.856. Taxation
Current 249 3.36 199 2.60Deferred (22) (0.30) (5) (0.07)On Dividend 31 0.42 22 0.30
7. Dividend 191 2.59 139 1.828. Retained Earnings 358 4.83 268 3.51
TOTAL 7405 100.00 7641 100.00Note: Previous year’s figures have been regrouped / reclassified, wherever necessary to correspond with the current year classification / disclosure required as per revised Schedule VI.
9
MANAGEMENT DISCUSSION & ANALYSIS REPORT (Contd.)
FINANCIAL POSITION AT A GLANCE` in Million
CAPITAL Year ended Year ended31.12.2012 31.12.2011
ASSETS OWNEDNon Current Assets -1. Fixed Assets (net) 1852 15972. Investments 64 643. Other Non-Current Assets (net) 211 2334. Deferred Tax Assets (net) 75 52Current Assets (Net) - excluding borrowings 2226 2587
TOTAL 4428 4533FINANCED BY1. Borrowings 169 6322. Net Worth* 4259 3901
TOTAL 4428 4533 *Represented by Share Capital 348 348 Reserves (Net) 3911 3553
TOTAL 4259 3901INCOME EARNED1. Revenue from operations (net) 7224 74952. Other Income 181 146
TOTAL 7405 7641INCOME DISTRIBUTED1. Materials Consumed 3582 39842. Employee benefit expenses 1036 10443. Other Expenses 1693 17444. Finance Cost 52 285. Depreciation 235 2186. Taxation Current 249 199 Deferred (22) (5) On Dividend 31 227. Dividend 191 1398. Retained Income 358 268
TOTAL 7405 7641
Note: Previous year’s figures have been regrouped / reclassified, wherever necessary to corrospond with the current year classification / disclosure required as per revised Schedule VI.
10
MANAGEMENT DISCUSSION & ANALYSIS REPORT (Contd.)
FINANCIAL SUMMARY2012 2011 2010 2009 2008
CAPITAL ACCOUNTS (` in million)
Liabilities
Share Capital 348 348 174 174 174
Reserves & Surplus 3911 3553 3459 3146 2739
Non-Current Liabilities 284 237 177 146 131
Assets
Non-Current Assets -
Gross Block 3522 3265 3095 2645 2314
Net Block 1852 1597 1574 1542 1305
Investments 64 64 64 64 64
Other Non Current Assets 495 470 355 277 305
Deferred Tax Assets (net) 75 52 47 20 11
Current Assets (Net) - 2057 1955 1770 1563 1359
REVENUE ACCOUNTS (` in million)
Revenue from operations & Other Income 7405 7641 6269 5753 6065
Gross Profit before
finance cost and depreciation 1094 869 954 1230 1139
Finance cost 52 28 5 18 23
Depreciation 235 218 207 204 130
Profit before tax 807 623 742 1008 986
Profit after tax 580 429 515 665 638
Tax on Dividend 31 22 28 37 16
Dividend amount 191 139 174 218 96
Retained earnings 358 268 313 407 535
SELECTED INDICATORS
Return on Capital Employed % 19.40 14.36 19.81 30.22 31.29
Current Ratio 1.92 2.11 1.90 1.89 1.97
Earnings per share 16.67 12.35 14.82 19.02 18.60
Debt equity ratio 0.04 0.16 0.04 0.02 0.11
Book value per share 122.36 112.08 104.38 95.39 83.69
Dividend % 55 40 100 125 55
Fixed Assets Turnover 4.00 4.78 3.98 3.73 4.65
Note: Previous year’s figures have been regrouped / reclassified, wherever necessary to correspond with the current year classification / disclosure required as per revised Schedule VI.
11
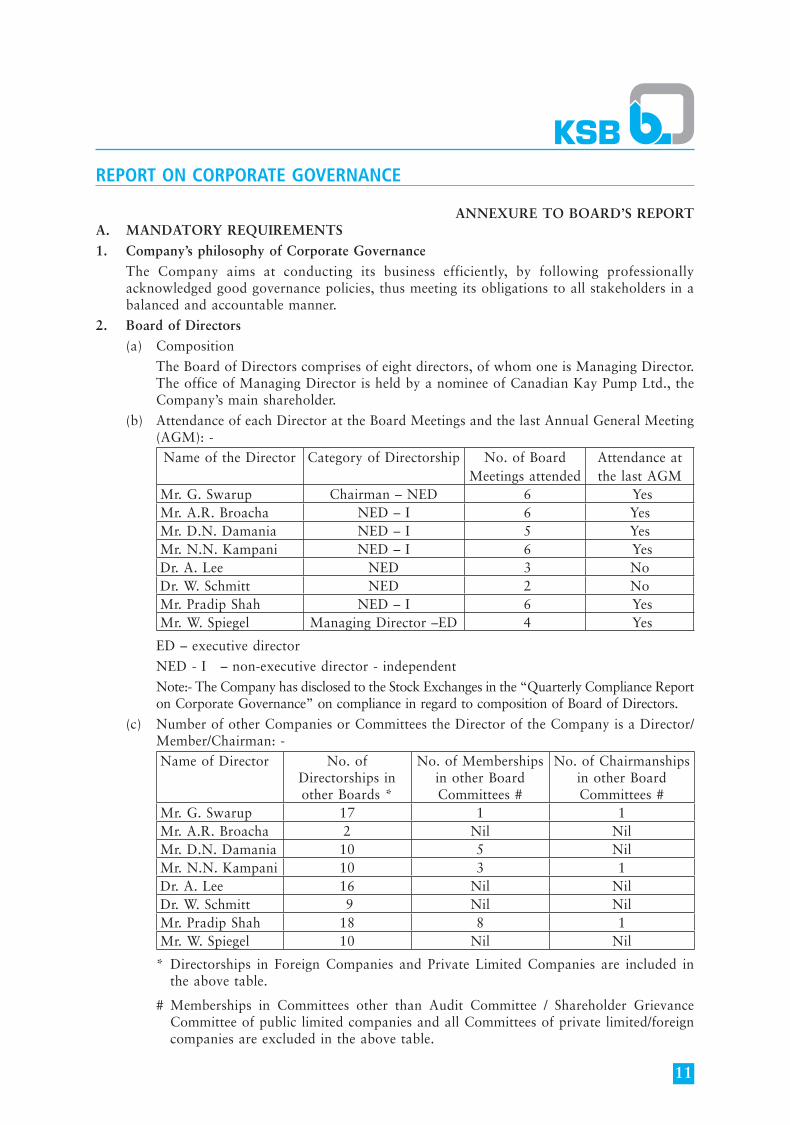
ANNEXURE TO BOARD’S REPORTA. MANDATORY REQUIREMENTS
1. Company’s philosophy of Corporate Governance
The Company aims at conducting its business efficiently, by following professionally acknowledged good governance policies, thus meeting its obligations to all stakeholders in a balanced and accountable manner.
2. Board of Directors
(a) Composition
The Board of Directors comprises of eight directors, of whom one is Managing Director. The office of Managing Director is held by a nominee of Canadian Kay Pump Ltd., the Company’s main shareholder.
(b) Attendance of each Director at the Board Meetings and the last Annual General Meeting (AGM): -Name of the Director Category of Directorship No. of Board
Meetings attendedAttendance at the last AGM
Mr. G. Swarup Chairman – NED 6 YesMr. A.R. Broacha NED – I 6 YesMr. D.N. Damania NED – I 5 YesMr. N.N. Kampani NED – I 6 YesDr. A. Lee NED 3 NoDr. W. Schmitt NED 2 NoMr. Pradip Shah NED – I 6 YesMr. W. Spiegel Managing Director –ED 4 Yes
ED – executive director
NED - I – non-executive director - independent
Note:- The Company has disclosed to the Stock Exchanges in the “Quarterly Compliance Report on Corporate Governance” on compliance in regard to composition of Board of Directors.
(c) Number of other Companies or Committees the Director of the Company is a Director/Member/Chairman: -Name of Director No. of
Directorships in other Boards *
No. of Memberships in other Board Committees #
No. of Chairmanships in other Board Committees #
Mr. G. Swarup 17 1 1Mr. A.R. Broacha 2 Nil NilMr. D.N. Damania 10 5 NilMr. N.N. Kampani 10 3 1Dr. A. Lee 16 Nil NilDr. W. Schmitt 9 Nil NilMr. Pradip Shah 18 8 1Mr. W. Spiegel 10 Nil Nil
* Directorships in Foreign Companies and Private Limited Companies are included in the above table.
# Memberships in Committees other than Audit Committee / Shareholder Grievance Committee of public limited companies and all Committees of private limited/foreign companies are excluded in the above table.
REPORT ON CORPORATE GOVERNANCE
12
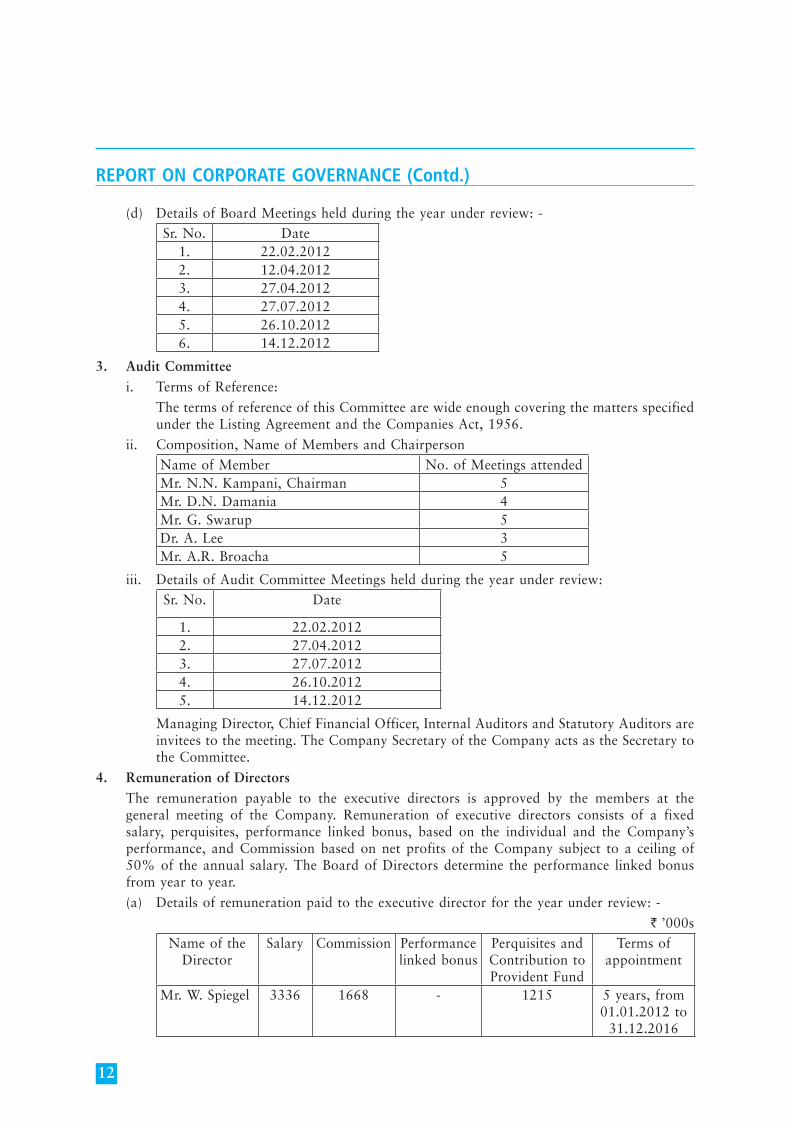
(d) Details of Board Meetings held during the year under review: -Sr. No. Date
1. 22.02.2012 2. 12.04.20123. 27.04.20124. 27.07.20125. 26.10.20126. 14.12.2012
3. Audit Committee
i. Terms of Reference:
The terms of reference of this Committee are wide enough covering the matters specified under the Listing Agreement and the Companies Act, 1956.
ii. Composition, Name of Members and ChairpersonName of Member No. of Meetings attendedMr. N.N. Kampani, Chairman 5Mr. D.N. Damania 4Mr. G. Swarup 5Dr. A. Lee 3Mr. A.R. Broacha 5
iii. Details of Audit Committee Meetings held during the year under review: Sr. No. Date
1. 22.02.20122. 27.04.20123. 27.07.20124. 26.10.20125. 14.12.2012
Managing Director, Chief Financial Officer, Internal Auditors and Statutory Auditors are invitees to the meeting. The Company Secretary of the Company acts as the Secretary to the Committee.
4. Remuneration of Directors
The remuneration payable to the executive directors is approved by the members at the general meeting of the Company. Remuneration of executive directors consists of a fixed salary, perquisites, performance linked bonus, based on the individual and the Company’s performance, and Commission based on net profits of the Company subject to a ceiling of 50% of the annual salary. The Board of Directors determine the performance linked bonus from year to year.
(a) Details of remuneration paid to the executive director for the year under review: -
` ’000sName of the
DirectorSalary Commission Performance
linked bonusPerquisites and Contribution to Provident Fund
Terms of appointment
Mr. W. Spiegel 3336 1668 - 1215 5 years, from 01.01.2012 to
31.12.2016
REPORT ON CORPORATE GOVERNANCE (Contd.)
13
REPORT ON CORPORATE GOVERNANCE (Contd.)
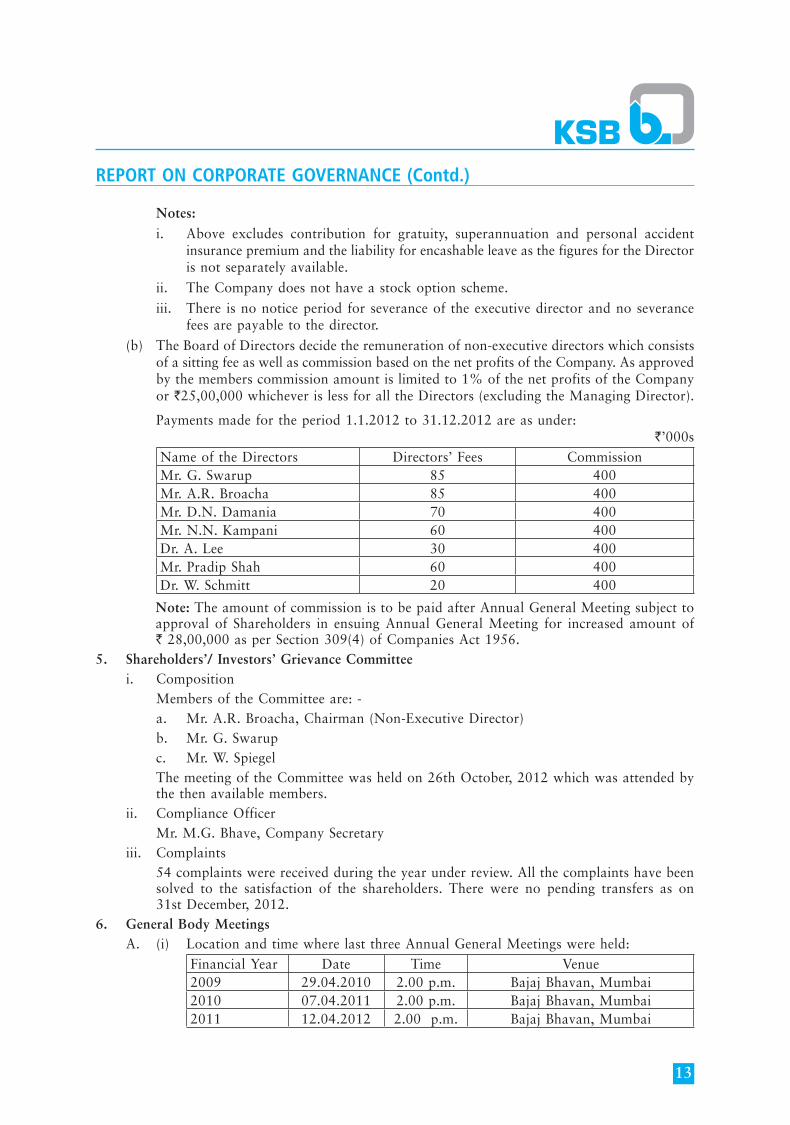
Notes:
i. Above excludes contribution for gratuity, superannuation and personal accident insurance premium and the liability for encashable leave as the figures for the Director is not separately available.
ii. The Company does not have a stock option scheme.
iii. There is no notice period for severance of the executive director and no severance fees are payable to the director.
(b) The Board of Directors decide the remuneration of non-executive directors which consists of a sitting fee as well as commission based on the net profits of the Company. As approved by the members commission amount is limited to 1% of the net profits of the Company or `25,00,000 whichever is less for all the Directors (excluding the Managing Director).
Payments made for the period 1.1.2012 to 31.12.2012 are as under:`’000s
Name of the Directors Directors’ Fees CommissionMr. G. Swarup 85 400Mr. A.R. Broacha 85 400Mr. D.N. Damania 70 400Mr. N.N. Kampani 60 400Dr. A. Lee 30 400Mr. Pradip Shah 60 400Dr. W. Schmitt 20 400
Note: The amount of commission is to be paid after Annual General Meeting subject to approval of Shareholders in ensuing Annual General Meeting for increased amount of ` 28,00,000 as per Section 309(4) of Companies Act 1956.
5. Shareholders’/ Investors’ Grievance Committee i. Composition Members of the Committee are: - a. Mr. A.R. Broacha, Chairman (Non-Executive Director) b. Mr. G. Swarup c. Mr. W. Spiegel The meeting of the Committee was held on 26th October, 2012 which was attended by
the then available members. ii. Compliance Officer Mr. M.G. Bhave, Company Secretary iii. Complaints 54 complaints were received during the year under review. All the complaints have been
solved to the satisfaction of the shareholders. There were no pending transfers as on 31st December, 2012.
6. General Body Meetings A. (i) Location and time where last three Annual General Meetings were held:
Financial Year Date Time Venue2009 29.04.2010 2.00 p.m. Bajaj Bhavan, Mumbai2010 07.04.2011 2.00 p.m. Bajaj Bhavan, Mumbai2011 12.04.2012 2.00 p.m. Bajaj Bhavan, Mumbai
14
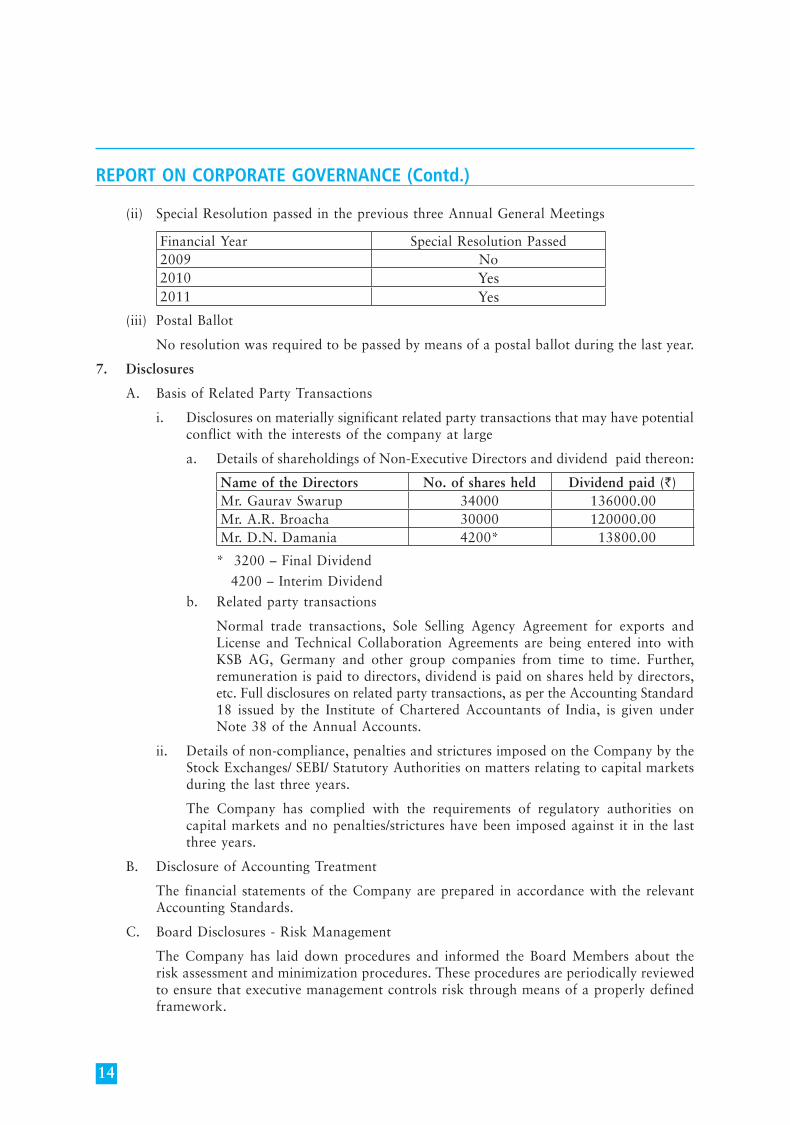
(ii) Special Resolution passed in the previous three Annual General Meetings
Financial Year Special Resolution Passed2009 No2010 Yes2011 Yes
(iii) Postal Ballot
No resolution was required to be passed by means of a postal ballot during the last year.
7. Disclosures
A. Basis of Related Party Transactions
i. Disclosures on materially significant related party transactions that may have potential conflict with the interests of the company at large
a. Details of shareholdings of Non-Executive Directors and dividend paid thereon:
Name of the Directors No. of shares held Dividend paid (`)Mr. Gaurav Swarup 34000 136000.00Mr. A.R. Broacha 30000 120000.00Mr. D.N. Damania 4200* 13800.00
* 3200 – Final Dividend
4200 – Interim Dividend
b. Related party transactions
Normal trade transactions, Sole Selling Agency Agreement for exports and License and Technical Collaboration Agreements are being entered into with KSB AG, Germany and other group companies from time to time. Further, remuneration is paid to directors, dividend is paid on shares held by directors, etc. Full disclosures on related party transactions, as per the Accounting Standard 18 issued by the Institute of Chartered Accountants of India, is given under Note 38 of the Annual Accounts.
ii. Details of non-compliance, penalties and strictures imposed on the Company by the Stock Exchanges/ SEBI/ Statutory Authorities on matters relating to capital markets during the last three years.
The Company has complied with the requirements of regulatory authorities on capital markets and no penalties/strictures have been imposed against it in the last three years.
B. Disclosure of Accounting Treatment
The financial statements of the Company are prepared in accordance with the relevant Accounting Standards.
C. Board Disclosures - Risk Management
The Company has laid down procedures and informed the Board Members about the risk assessment and minimization procedures. These procedures are periodically reviewed to ensure that executive management controls risk through means of a properly defined framework.
REPORT ON CORPORATE GOVERNANCE (Contd.)
15
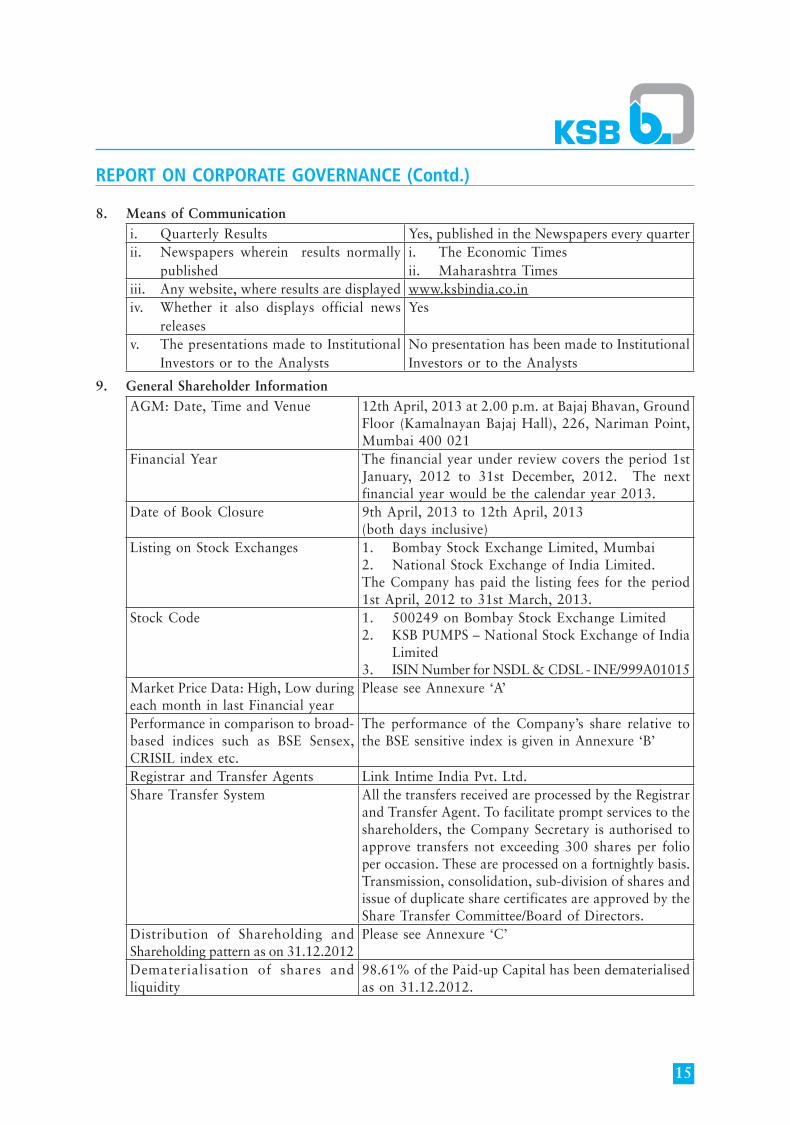
8. Means of Communicationi. Quarterly Results Yes, published in the Newspapers every quarter ii. Newspapers wherein results normally
publishedi. The Economic Timesii. Maharashtra Times
iii. Any website, where results are displayed www.ksbindia.co.iniv. Whether it also displays official news
releasesYes
v. The presentations made to Institutional Investors or to the Analysts
No presentation has been made to Institutional Investors or to the Analysts
9. General Shareholder Information AGM: Date, Time and Venue 12th April, 2013 at 2.00 p.m. at Bajaj Bhavan, Ground
Floor (Kamalnayan Bajaj Hall), 226, Nariman Point, Mumbai 400 021
Financial Year The financial year under review covers the period 1st January, 2012 to 31st December, 2012. The next financial year would be the calendar year 2013.
Date of Book Closure 9th April, 2013 to 12th April, 2013(both days inclusive)
Listing on Stock Exchanges 1. Bombay Stock Exchange Limited, Mumbai 2. National Stock Exchange of India Limited.The Company has paid the listing fees for the period 1st April, 2012 to 31st March, 2013.
Stock Code 1. 500249 on Bombay Stock Exchange Limited2. KSB PUMPS – National Stock Exchange of India
Limited3. ISIN Number for NSDL & CDSL - INE/999A01015
Market Price Data: High, Low during each month in last Financial year
Please see Annexure ‘A’
Performance in comparison to broad-based indices such as BSE Sensex, CRISIL index etc.
The performance of the Company’s share relative to the BSE sensitive index is given in Annexure ‘B’
Registrar and Transfer Agents Link Intime India Pvt. Ltd.Share Transfer System All the transfers received are processed by the Registrar
and Transfer Agent. To facilitate prompt services to the shareholders, the Company Secretary is authorised to approve transfers not exceeding 300 shares per folio per occasion. These are processed on a fortnightly basis. Transmission, consolidation, sub-division of shares and issue of duplicate share certificates are approved by the Share Transfer Committee/Board of Directors.
Distribution of Shareholding and Shareholding pattern as on 31.12.2012
Please see Annexure ‘C’
Dematerialisation of shares and liquidity
98.61% of the Paid-up Capital has been dematerialised as on 31.12.2012.
REPORT ON CORPORATE GOVERNANCE (Contd.)
16
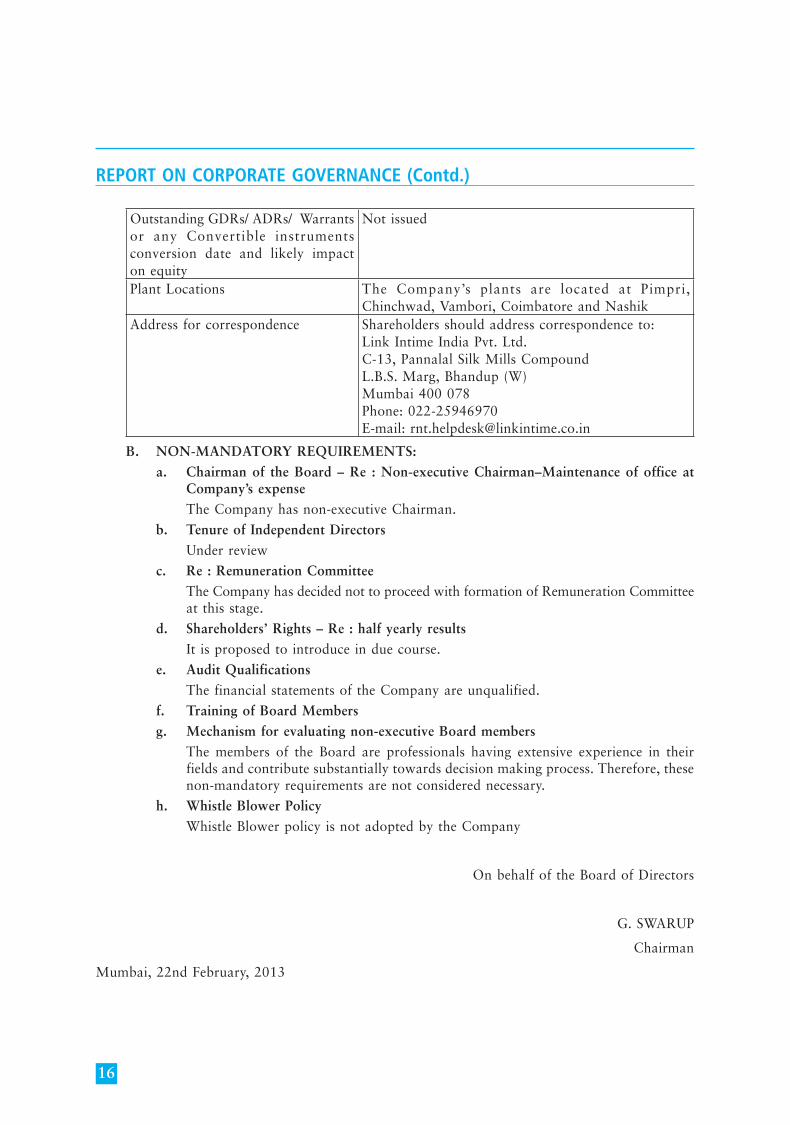
Outstanding GDRs/ ADRs/ Warrants or any Convertible instruments conversion date and likely impact on equity
Not issued
Plant Locations The Company’s plants are located at Pimpri, Chinchwad, Vambori, Coimbatore and Nashik
Address for correspondence Shareholders should address correspondence to:Link Intime India Pvt. Ltd. C-13, Pannalal Silk Mills CompoundL.B.S. Marg, Bhandup (W)Mumbai 400 078 Phone: 022-25946970E-mail: [email protected]
B. NON-MANDATORY REQUIREMENTS:
a. Chairman of the Board – Re : Non-executive Chairman–Maintenance of office at Company’s expense
The Company has non-executive Chairman.
b. Tenure of Independent Directors
Under review
c. Re : Remuneration Committee
The Company has decided not to proceed with formation of Remuneration Committee at this stage.
d. Shareholders’ Rights – Re : half yearly results
It is proposed to introduce in due course.
e. Audit Qualifications
The financial statements of the Company are unqualified.
f. Training of Board Members
g. Mechanism for evaluating non-executive Board members
The members of the Board are professionals having extensive experience in their fields and contribute substantially towards decision making process. Therefore, these non-mandatory requirements are not considered necessary.
h. Whistle Blower Policy
Whistle Blower policy is not adopted by the Company
On behalf of the Board of Directors
G. SWARUP
Chairman
Mumbai, 22nd February, 2013
REPORT ON CORPORATE GOVERNANCE (Contd.)
17
REPORT ON CORPORATE GOVERNANCE (Contd.)
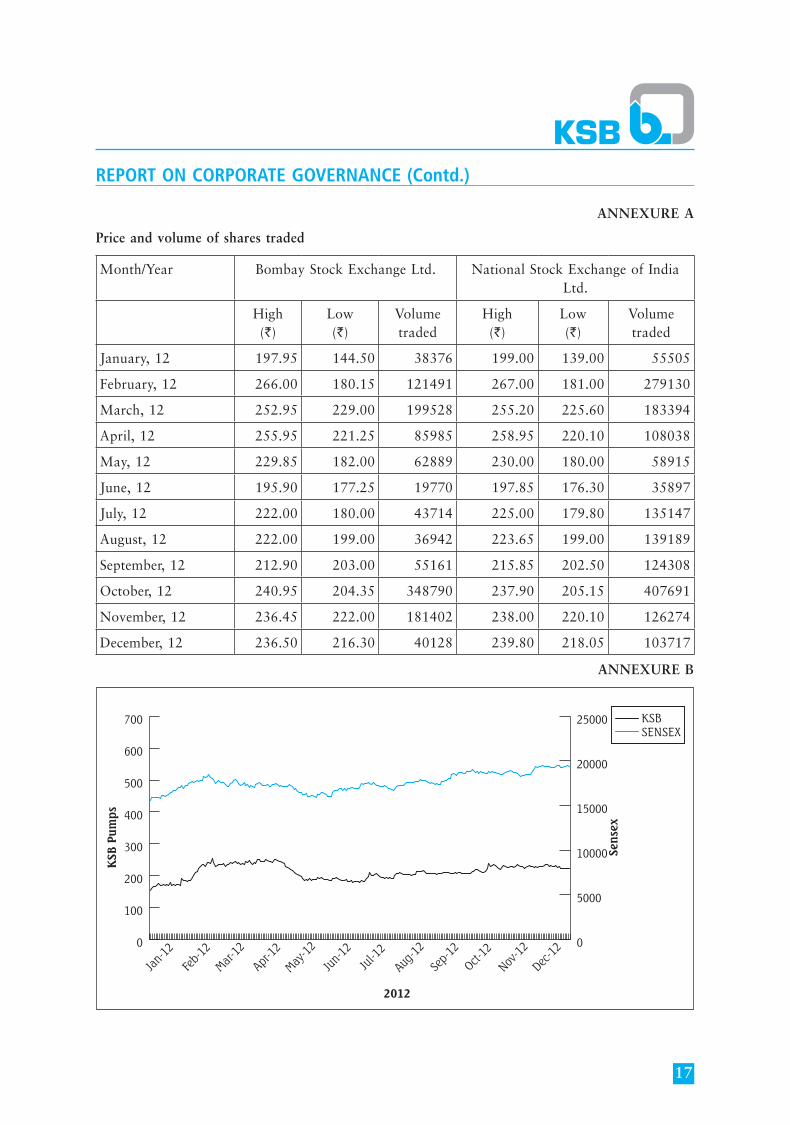
ANNEXURE A
Price and volume of shares traded
Month/Year Bombay Stock Exchange Ltd. National Stock Exchange of India Ltd.
High(`)
Low(`)
Volume traded
High(`)
Low(`)
Volumetraded
January, 12 197.95 144.50 38376 199.00 139.00 55505
February, 12 266.00 180.15 121491 267.00 181.00 279130
March, 12 252.95 229.00 199528 255.20 225.60 183394
April, 12 255.95 221.25 85985 258.95 220.10 108038
May, 12 229.85 182.00 62889 230.00 180.00 58915
June, 12 195.90 177.25 19770 197.85 176.30 35897
July, 12 222.00 180.00 43714 225.00 179.80 135147
August, 12 222.00 199.00 36942 223.65 199.00 139189
September, 12 212.90 203.00 55161 215.85 202.50 124308
October, 12 240.95 204.35 348790 237.90 205.15 407691
November, 12 236.45 222.00 181402 238.00 220.10 126274
December, 12 236.50 216.30 40128 239.80 218.05 103717
ANNEXURE B
0
100
200
300
400
500
600
700
Dec-12
Nov-12
Oct-12
Sep-
12
Aug-12
Jul-1
2
Jun-
12
May-12
Apr-12
Mar-12
Feb-
12
Jan-
120
5000
10000
15000
20000
25000
KSB
Pum
ps
Sens
ex
2012
KSBSENSEX
18
REPORT ON CORPORATE GOVERNANCE (Contd.)
ANNEXURE C
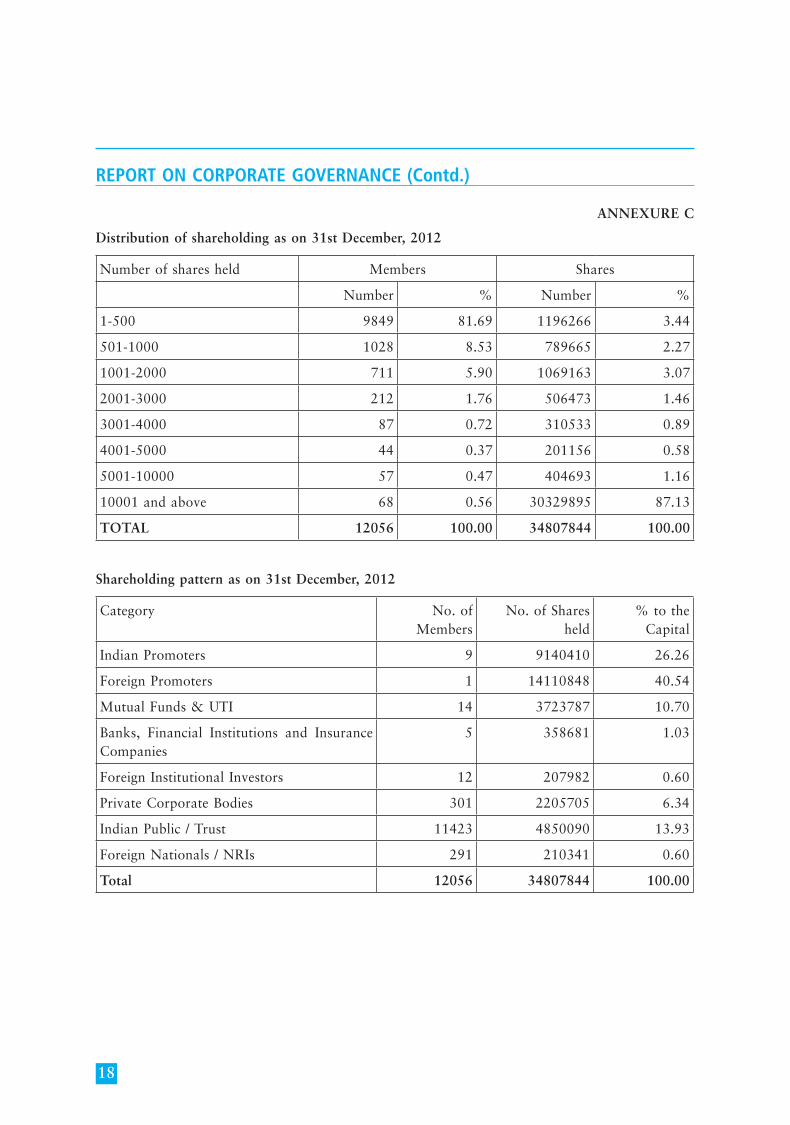
Distribution of shareholding as on 31st December, 2012
Number of shares held Members Shares
Number % Number %
1-500 9849 81.69 1196266 3.44
501-1000 1028 8.53 789665 2.27
1001-2000 711 5.90 1069163 3.07
2001-3000 212 1.76 506473 1.46
3001-4000 87 0.72 310533 0.89
4001-5000 44 0.37 201156 0.58
5001-10000 57 0.47 404693 1.16
10001 and above 68 0.56 30329895 87.13
TOTAL 12056 100.00 34807844 100.00
Shareholding pattern as on 31st December, 2012
Category No. of Members
No. of Shares held
% to the Capital
Indian Promoters 9 9140410 26.26
Foreign Promoters 1 14110848 40.54
Mutual Funds & UTI 14 3723787 10.70
Banks, Financial Institutions and Insurance Companies
5 358681 1.03
Foreign Institutional Investors 12 207982 0.60
Private Corporate Bodies 301 2205705 6.34
Indian Public / Trust 11423 4850090 13.93
Foreign Nationals / NRIs 291 210341 0.60
Total 12056 34807844 100.00
19
REPORT ON CORPORATE GOVERNANCE (Contd.)
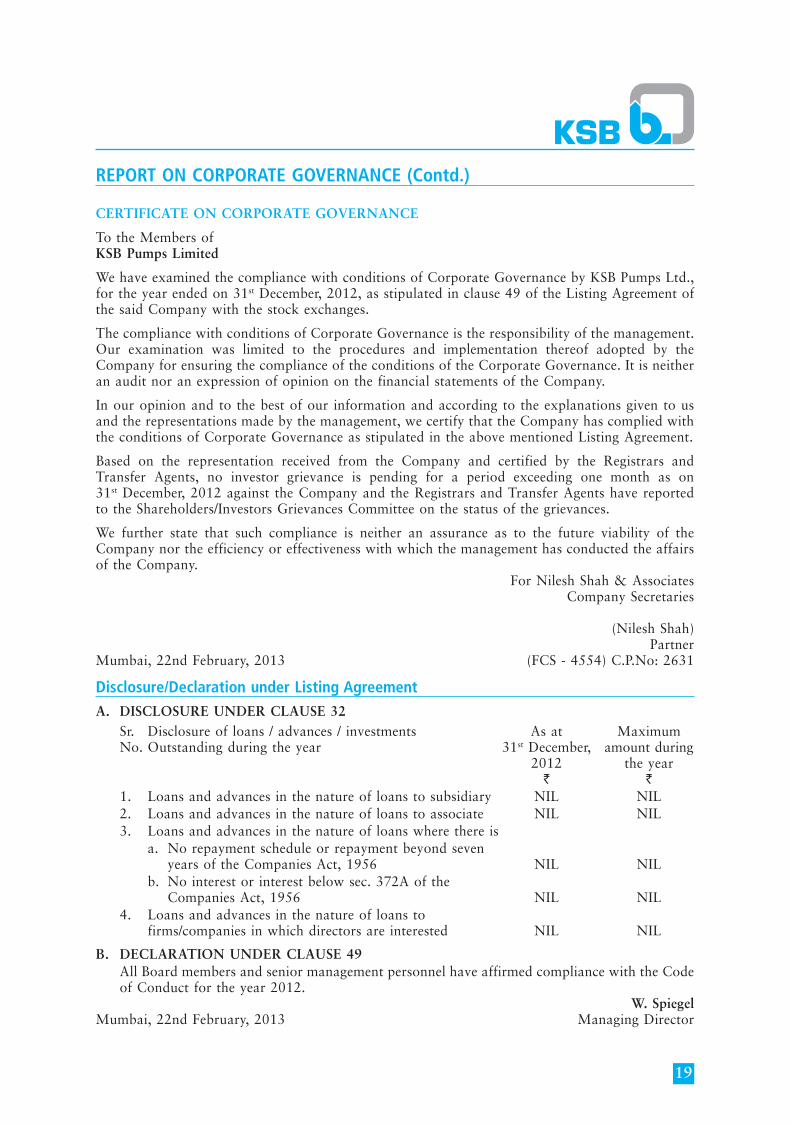
CERTIFICATE ON CORPORATE GOVERNANCE
To the Members ofKSB Pumps Limited
We have examined the compliance with conditions of Corporate Governance by KSB Pumps Ltd., for the year ended on 31st December, 2012, as stipulated in clause 49 of the Listing Agreement of the said Company with the stock exchanges.
The compliance with conditions of Corporate Governance is the responsibility of the management. Our examination was limited to the procedures and implementation thereof adopted by the Company for ensuring the compliance of the conditions of the Corporate Governance. It is neither an audit nor an expression of opinion on the financial statements of the Company.
In our opinion and to the best of our information and according to the explanations given to us and the representations made by the management, we certify that the Company has complied with the conditions of Corporate Governance as stipulated in the above mentioned Listing Agreement.
Based on the representation received from the Company and certified by the Registrars and Transfer Agents, no investor grievance is pending for a period exceeding one month as on 31st December, 2012 against the Company and the Registrars and Transfer Agents have reported to the Shareholders/Investors Grievances Committee on the status of the grievances.
We further state that such compliance is neither an assurance as to the future viability of the Company nor the efficiency or effectiveness with which the management has conducted the affairs of the Company.
For Nilesh Shah & AssociatesCompany Secretaries
(Nilesh Shah) Partner Mumbai, 22nd February, 2013 (FCS - 4554) C.P.No: 2631
Disclosure/Declaration under Listing AgreementA. DISCLOSURE UNDER CLAUSE 32 Sr. Disclosure of loans / advances / investments As at Maximum No. Outstanding during the year 31st December, amount during 2012 the year ` ` 1. Loans and advances in the nature of loans to subsidiary NIL NIL 2. Loans and advances in the nature of loans to associate NIL NIL 3. Loans and advances in the nature of loans where there is a. No repayment schedule or repayment beyond seven years of the Companies Act, 1956 NIL NIL b. No interest or interest below sec. 372A of the Companies Act, 1956 NIL NIL 4. Loans and advances in the nature of loans to firms/companies in which directors are interested NIL NIL
B. DECLARATION UNDER CLAUSE 49 All Board members and senior management personnel have affirmed compliance with the Code
of Conduct for the year 2012. W. SpiegelMumbai, 22nd February, 2013 Managing Director
20
ANNEXURE TO BOARD’S REPORT
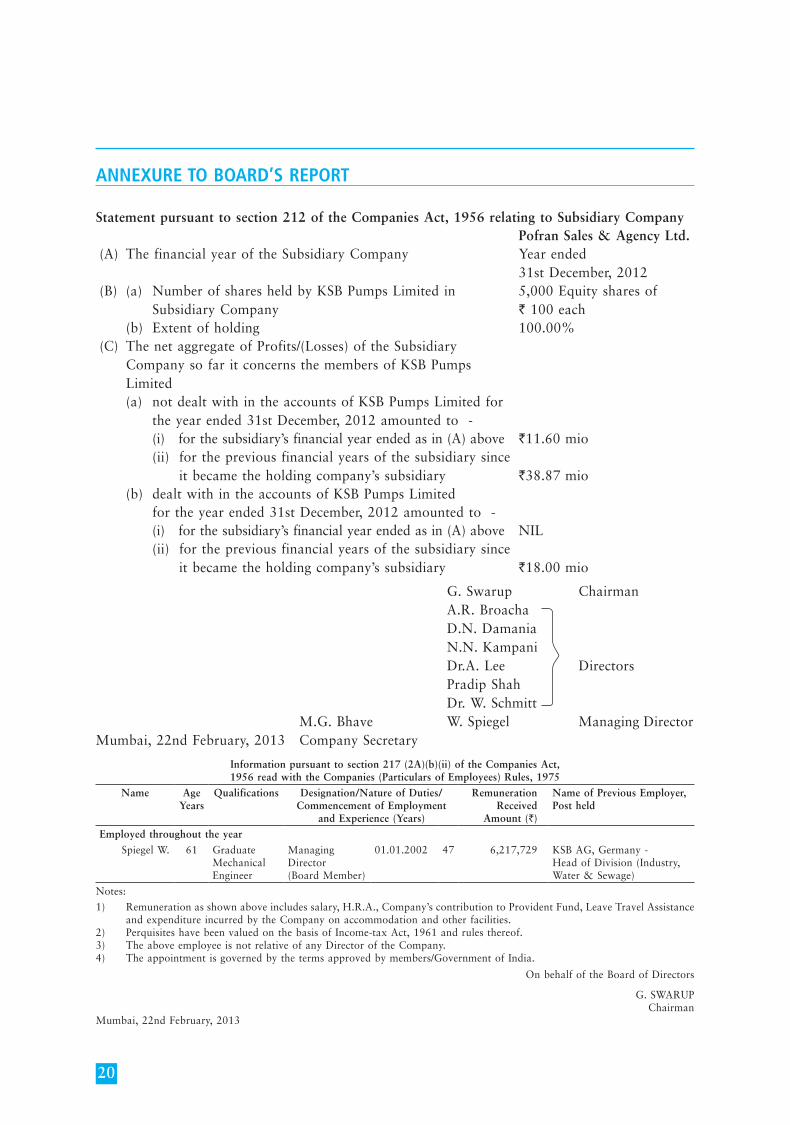
Information pursuant to section 217 (2A)(b)(ii) of the Companies Act, 1956 read with the Companies (Particulars of Employees) Rules, 1975
Name AgeYears
Qualifications Designation/Nature of Duties/Commencement of Employment
and Experience (Years)
RemunerationReceived
Amount (`)
Name of Previous Employer, Post held
Employed throughout the year
Spiegel W. 61 Graduate MechanicalEngineer
Managing Director (Board Member)
01.01.2002 47 6,217,729 KSB AG, Germany -Head of Division (Industry, Water & Sewage)
Notes:
1) Remuneration as shown above includes salary, H.R.A., Company’s contribution to Provident Fund, Leave Travel Assistance and expenditure incurred by the Company on accommodation and other facilities.
2) Perquisites have been valued on the basis of Income-tax Act, 1961 and rules thereof.3) The above employee is not relative of any Director of the Company.4) The appointment is governed by the terms approved by members/Government of India.
On behalf of the Board of Directors
G. SWARUPChairman
Mumbai, 22nd February, 2013
Statement pursuant to section 212 of the Companies Act, 1956 relating to Subsidiary CompanyPofran Sales & Agency Ltd.
(A) The financial year of the Subsidiary Company Year ended 31st December, 2012
(B) (a) Number of shares held by KSB Pumps Limited in Subsidiary Company
5,000 Equity shares of ` 100 each
(b) Extent of holding 100.00%(C) The net aggregate of Profits/(Losses) of the Subsidiary
Company so far it concerns the members of KSB Pumps Limited(a) not dealt with in the accounts of KSB Pumps Limited for
the year ended 31st December, 2012 amounted to -(i) for the subsidiary’s financial year ended as in (A) above `11.60 mio(ii) for the previous financial years of the subsidiary since
it became the holding company’s subsidiary `38.87 mio(b) dealt with in the accounts of KSB Pumps Limited
for the year ended 31st December, 2012 amounted to -(i) for the subsidiary’s financial year ended as in (A) above NIL(ii) for the previous financial years of the subsidiary since
it became the holding company’s subsidiary `18.00 mio
G. Swarup Chairman A.R. Broacha D.N. Damania N.N. Kampani Dr.A. Lee Directors Pradip Shah Dr. W. Schmitt M.G. Bhave W. Spiegel Managing DirectorMumbai, 22nd February, 2013 Company Secretary
21
ANNEXURE TO BOARD’S REPORT
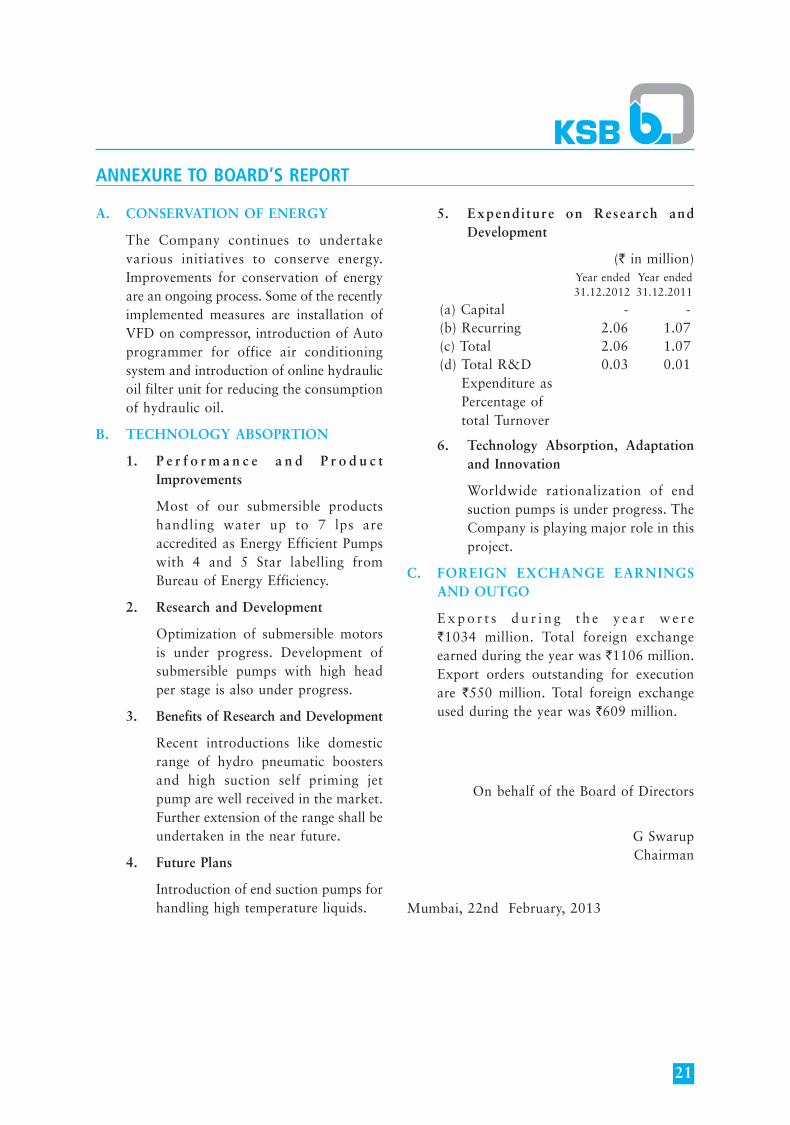
A. CONSERVATION OF ENERGY
The Company continues to undertake various initiatives to conserve energy. Improvements for conservation of energy are an ongoing process. Some of the recently implemented measures are installation of VFD on compressor, introduction of Auto programmer for office air conditioning system and introduction of online hydraulic oil filter unit for reducing the consumption of hydraulic oil.
B. TECHNOLOGY ABSOPRTION
1. P e r f o r m a n c e a n d P r o d u c t Improvements
Most of our submersible products handling water up to 7 lps are accredited as Energy Efficient Pumps with 4 and 5 Star labelling from Bureau of Energy Efficiency.
2. Research and Development
Optimization of submersible motors is under progress. Development of submersible pumps with high head per stage is also under progress.
3. Benefits of Research and Development
Recent introductions like domestic range of hydro pneumatic boosters and high suction self priming jet pump are well received in the market. Further extension of the range shall be undertaken in the near future.
4. Future Plans
Introduction of end suction pumps for handling high temperature liquids.
5. Expenditure on Research and Development
(` in million)Year ended 31.12.2012
Year ended 31.12.2011
(a) Capital - -(b) Recurring 2.06 1.07(c) Total 2.06 1.07(d) Total R&D
Expenditure as Percentage of total Turnover
0.03 0.01
6. Technology Absorption, Adaptation and Innovation
Worldwide rationalization of end suction pumps is under progress. The Company is playing major role in this project.
C. FOREIGN EXCHANGE EARNINGS AND OUTGO
E x p o r t s d u r i n g t h e y e a r w e r e `1034 million. Total foreign exchange earned during the year was `1106 million. Export orders outstanding for execution are `550 million. Total foreign exchange used during the year was `609 million.
On behalf of the Board of Directors
G SwarupChairman
Mumbai, 22nd February, 2013
22
AUDITORS’ REPORT TO THE SHAREHOLDERS
(1) We have audited the attached Balance Sheet of KSB Pumps Limited as at 31st December, 2012, the Statement of Profit and Loss and the Cash Flow Statement for the year ended on that date annexed thereto. These financial statements are the responsibility of the Company’s management. Our responsibility is to express an opinion on these financial statements based on our audit.
(2) We conducted our audit in accordance with the auditing standards generally accepted in India. Those Standards require that we plan and perform the audit to obtain reasonable assurance about whether the financial statements are free of material misstatement. An audit includes examining, on a test basis, evidence supporting the amounts and disclosures in the financial statements. An audit also includes assessing the accounting principles used and significant estimates made by management, as well as evaluating the overall financial statement presentation. We believe that our audit provides a reasonable basis for our opinion.
(3) As required by the Companies (Auditor’s Report) Order, 2003 issued by the Central Government of India in terms of sub-section (4A) of section 227 of the Companies Act, 1956, we enclose in the Annexure a statement on the matters specified in paragraphs 4 and 5 of the said Order.
(4) Further to our comments in the annexure referred to above, we report that:
i) we have obtained all the information and explanations, which to the best of our knowledge and belief were necessary for the purposes of our audit;
ii) in our opinion, proper books of account as required by law have been kept by the Company, so far as appears from our examination of those books;
iii) the balance sheet, the statement of profit and loss and cash flow
statement dealt with by this report are in agreement with the books of account;
iv) in our opinion, the balance sheet, the statement of profit and loss and cash flow statement dealt with by this report comply with the accounting standards referred to in sub-section (3C) of section 211 of the Companies Act, 1956;
v) in our opinion and to the best of our information and according to the explanations given to us, the said accounts give the information required by the Companies Act, 1956 in the manner so required and give a true and fair view in conformity with the accounting principles generally accepted in India:
a) in the case of the Balance Sheet, of the state of affairs of the Company as at 31st December, 2012;
b) in the case of the statement of profit and loss, of the profit for the year ended on that date; and
c) in the case of Cash Flow Statement, of the cash flows for the year ended on that date.
(5) On the basis of written representations received from the directors, as on 31st December, 2012 and taken on record by the Board of Directors, we report that none of the directors is disqualified as on 31st December, 2012, from being appointed as a director in terms of clause (g) of sub-section (1) of section 274 of the Companies Act,1956.
For Deloitte Haskins & SellsChartered Accountants
Registration No.: 117366W
Hemant M. Joshi Partner Membership No.: 038019
Pune, 22nd February, 2013
23
ANNEXURE TO THE AUDITORS’ REPORT
STATEMENT REFERRED TO IN PARAGRAPH 3 OF OUR REPORT OF EVEN DATE TO THE MEMBERS OF KSB PUMPS LIMITED ON THE ACCOUNTS FOR THE YEAR ENDED 31st DECEMBER, 2012.
(i) (a) The Company has maintained proper records showing full particulars including quantitative details and situation of fixed assets.
(b) As explained to us, the management has physically verified most of the fixed assets during the year, other than patterns lying with third parties for which confirmations have been obtained from parties in most of the cases, and no material discrepancies were noticed on such verification. In our opinion, the frequency of physical verification of fixed assets is reasonable having regard to the size of the Company and the nature of the assets.
(c) The fixed assets disposed off during the year, in our opinion, do not constitute substantial part of the fixed assets of the Company and such disposal has, in our opinion, not affected the going concern status of the Company.
(ii) (a) Inventories have been physically verified during the period by the management. In respect of inventories lying with third parties confirmation have been obtained for a major portion of inventories. In our opinion, the frequency of verification is reasonable.
(b) In our opinion, the procedures of physical verification of inventory followed by the management are reasonable and adequate in relation to the size of the Company and the nature of its business.
(c) In our opinion and according to the information and explanations given to us, the Company has maintained proper records of its inventories. The discrepancies noticed on verification between physical stocks and book stocks were not material having
regard to the size of operations of the Company and have been properly dealt with in the books of accounts.
(iii) According to the information and explanations given to us, the Company has not granted or taken any loans, secured or unsecured, to or from companies, firms or other parties covered in the register maintained under section 301 of the Companies Act, 1956. Accordingly clauses (iii)(a) to (iii)(g) of paragraph 4 of the Companies (Auditor’s Report) Order, 2003 are not applicable.
(iv) In our opinion and according to the information and explanations given to us and having regard to the explanation that some of the items purchased/ sold are of a special nature and comparable alternative quotations/ prices are not available, there is an adequate internal control system commensurate with the size of the Company and the nature of its business, with regard to purchase of inventory and fixed assets and for the sale of goods and services. There is no continuing failure to correct major weaknesses, if any, in internal controls system.
(v) (a) Based upon the audit procedures applied by us and according to the information and explanations given to us, contracts or arrangements that need to be entered into the register maintained in pursuance of section 301 of the Companies Act, 1956 have been so entered.
(b) The transactions made in pursuance of such contracts or arrangements have been made at prices which are reasonable having regard to the prevailing market prices at the relevant time.
(vi) The Company has not accepted any deposits from the public to which the provisions of sections 58A, 58AA or any other relevant provisions of the Companies Act, 1956 and the rules framed there under apply.
(vii) In our opinion, the Company has an internal audit system commensurate with its size and nature of its business.
24
ANNEXURE TO THE AUDITORS’ REPORT (Contd.)
(viii) We have broadly reviewed the books of account maintained by the Company pursuant to the notification of the Central Government for the maintenance of cost records under section 209(1)(d) of the Companies Act, 1956 and, on the basis of the information received, are of the opinion that prima facie the prescribed accounts and records have been maintained / are being made up. We have not, however, made a detailed examination of the records with a view to determining whether they are accurate or complete.
(ix) (a) According to the records of the Company, apart from the certain instances of delays in depositing undisputed income tax deducted at source, Provident Fund, Employees’ State Insurance and Sales tax, the Company has been regular in depositing undisputed statutory dues including Provident Fund, Employees’ State Insurance, Investor Education and Protection Fund, Income tax, Sales tax, Service Tax, Wealth tax, Customs Duty, Excise Duty, cess and other statutory dues with the appropriate authorities. Based on our audit procedures and according to the information and explanations given to us, there are no arrears of statutory dues which has remained outstanding as at 31st December, 2012 for a period of more than six months from the date they became payable.
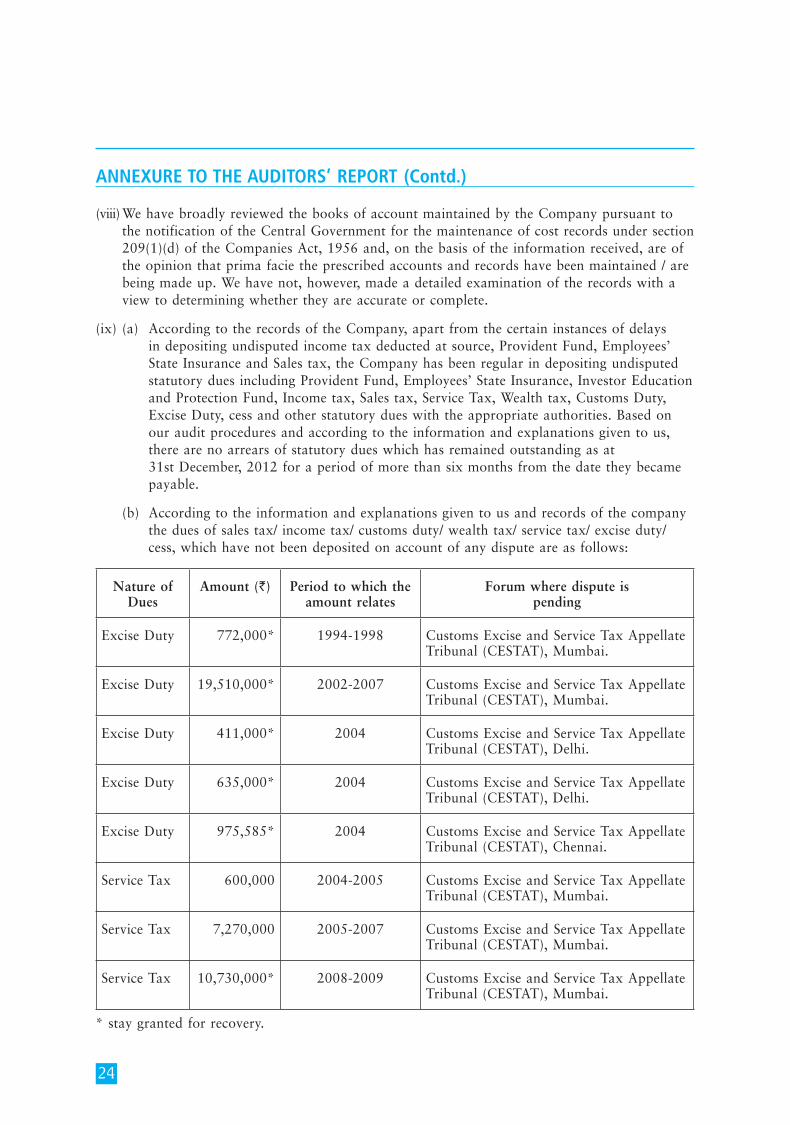
(b) According to the information and explanations given to us and records of the company the dues of sales tax/ income tax/ customs duty/ wealth tax/ service tax/ excise duty/ cess, which have not been deposited on account of any dispute are as follows:
Nature of Dues
Amount (`) Period to which the amount relates
Forum where dispute is pending
Excise Duty 772,000* 1994-1998 Customs Excise and Service Tax Appellate Tribunal (CESTAT), Mumbai.
Excise Duty 19,510,000* 2002-2007 Customs Excise and Service Tax Appellate Tribunal (CESTAT), Mumbai.
Excise Duty 411,000* 2004 Customs Excise and Service Tax Appellate Tribunal (CESTAT), Delhi.
Excise Duty 635,000* 2004 Customs Excise and Service Tax Appellate Tribunal (CESTAT), Delhi.
Excise Duty 975,585* 2004 Customs Excise and Service Tax Appellate Tribunal (CESTAT), Chennai.
Service Tax 600,000 2004-2005 Customs Excise and Service Tax Appellate Tribunal (CESTAT), Mumbai.
Service Tax 7,270,000 2005-2007 Customs Excise and Service Tax Appellate Tribunal (CESTAT), Mumbai.
Service Tax 10,730,000* 2008-2009 Customs Excise and Service Tax Appellate Tribunal (CESTAT), Mumbai.
* stay granted for recovery.
25
ANNEXURE TO THE AUDITORS’ REPORT (Contd.)
(x) The Company does not have any accumulated losses as at 31st December, 2012. The Company has not incurred any cash losses during the financial year covered by our audit and the immediately preceding financial year.
(xi) Based on our audit procedures and according to the information and explanations given to us, the Company has not defaulted in repayment of dues to financial institution/ bank/ debenture holders.
(xii) According to the information and explanations given to us, the Company has not granted any loans and advances on the basis of security by way of pledge of shares, debentures and other securities.
(xiii) The Company is not a chit fund, nidhi/ mutual benefit fund and therefore the requirements pertaining to such class of companies is not applicable.
(xiv) The Company is not dealing or trading in shares, securities, debentures and other investments.
(xv) According to the information and explanations given to us, the Company has not given any guarantee for loans taken by others from banks or financial institutions.
(xvi) To the best of our knowledge and belief and according to the information and explanations given to us, in our opinion, the Company has not availed any term loans during the year.
(xvii) According to the information and explanations given to us, and on an overall examination of the Balance Sheet
of the Company, funds raised on short-term basis have not been used during the year for long term investments.
(xviii) The Company has not made any preferential allotment of shares during the year to parties and companies covered in the Register maintained under section 301 of the Companies Act, 1956.
(xix) The Company has not issued any debentures during the year and therefore the question of creating security or charge in respect thereof does not arise.
(xx) The Company has not made any public issue during the year and therefore the question of disclosing the end use of money does not arise.
(xxi) Based upon the audit procedures performed and according to the information and explanations given and representations made by the management, we report that no fraud on or by the Company has been noticed or reported during the year.
For Deloitte Haskins & SellsChartered Accountants
Registration No.: 117366W
Hemant M. Joshi Partner Membership No.: 038019
Pune, 22nd February, 2013
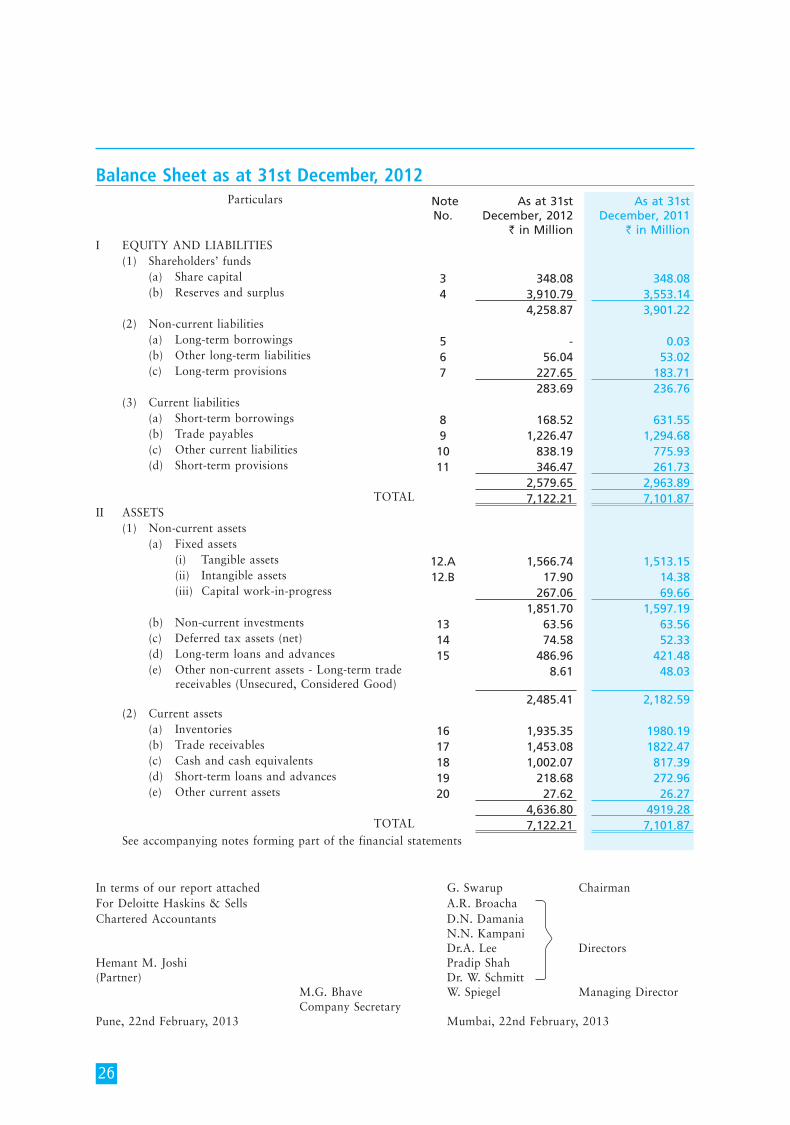
26
Particulars Note No.
As at 31st December, 2012
` in Million
As at 31st December, 2011
` in Million I EQUITY AND LIABILITIES
(1) Shareholders’ funds (a) Share capital 3 348.08 348.08 (b) Reserves and surplus 4 3,910.79 3,553.14
4,258.87 3,901.22 (2) Non-current liabilities (a) Long-term borrowings 5 - 0.03 (b) Other long-term liabilities 6 56.04 53.02 (c) Long-term provisions 7 227.65 183.71
283.69 236.76 (3) Current liabilities (a) Short-term borrowings 8 168.52 631.55 (b) Trade payables 9 1,226.47 1,294.68 (c) Other current liabilities 10 838.19 775.93 (d) Short-term provisions 11 346.47 261.73
2,579.65 2,963.89 TOTAL 7,122.21 7,101.87
II ASSETS (1) Non-current assets
(a) Fixed assets (i) Tangible assets 12.A 1,566.74 1,513.15 (ii) Intangible assets 12.B 17.90 14.38 (iii) Capital work-in-progress 267.06 69.66
1,851.70 1,597.19 (b) Non-current investments 13 63.56 63.56 (c) Deferred tax assets (net) 14 74.58 52.33 (d) Long-term loans and advances 15 486.96 421.48 (e) Other non-current assets - Long-term trade
receivables (Unsecured, Considered Good) 8.61 48.03
2,485.41 2,182.59 (2) Current assets
(a) Inventories 16 1,935.35 1980.19 (b) Trade receivables 17 1,453.08 1822.47 (c) Cash and cash equivalents 18 1,002.07 817.39 (d) Short-term loans and advances 19 218.68 272.96 (e) Other current assets 20 27.62 26.27
4,636.80 4919.28TOTAL 7,122.21 7,101.87
See accompanying notes forming part of the financial statements
Balance Sheet as at 31st December, 2012
In terms of our report attached G. Swarup ChairmanFor Deloitte Haskins & Sells A.R. Broacha Chartered Accountants D.N. Damania N.N. Kampani Dr.A. Lee DirectorsHemant M. Joshi Pradip Shah (Partner) Dr. W. Schmitt M.G. Bhave W. Spiegel Managing Director Company Secretary Pune, 22nd February, 2013 Mumbai, 22nd February, 2013

27
Statement of Profit and Loss for the year ended 31st December, 2012Particulars Note
No.Year ended
31st December, 2012
` in Million
Year ended 31st December,
2011 ` in Million
1 Revenue from operations (gross) 21 7,697.96 7,933.99
Less: Excise duty 21 (474.30) (438.56)
Revenue from operations (net) 7,223.66 7,495.43
2 Other income 22 181.14 145.89
3 Total revenue (1+2) 7,404.80 7,641.32
4 Expenses
Cost of materials consumed 23.a 3,415.15 4,147.91
Purchases of stock-in-trade 108.17 112.40
Changes in inventories of finished goods, work-in-progress and stock-in-trade
23.b 58.10 (276.80)
Employee benefits expense 24 1,036.30 1,044.17
Finance costs 25 52.40 27.76
Depreciation and amortisation expense 12.A & 12.B
235.39 218.95
Other expenses 26 1,701.49 1,756.71
Expenditure transferred to capital account (8.78) (12.72)
Total expenses 6,598.22 7,018.38
5 Profit before tax (3 - 4) 806.58 622.94
6 Tax expense:
(a) Current tax 265.10 207.00
(b) Short / (excess) provision in respect of earlier years (16.43) (8.45)
(c) Deferred tax (22.25) (5.43)
226.42 193.12
7 Profit for the year (5 - 6) 580.16 429.82
8 Earnings per equity share (Face Value per share ` 10/-): (Refer Note 41) (a) Basic 16.67 12.35
(b) Diluted 16.67 12.35 See accompanying notes forming part of the financial statements
In terms of our report attached to the Balance Sheet G. Swarup ChairmanFor Deloitte Haskins & Sells A.R. Broacha Chartered Accountants D.N. Damania N.N. Kampani Dr.A. Lee DirectorsHemant M. Joshi Pradip Shah (Partner) Dr. W. Schmitt M.G. Bhave W. Spiegel Managing Director Company Secretary Pune, 22nd February, 2013 Mumbai, 22nd February, 2013

28
2012 2011
Particulars ` in Million ` in Million ` in Million ` in Million
A. Cash flow from operating activities
Net Profit/(Loss) before tax 806.58 622.94
Adjustments for:
Depreciation and amortisation 235.39 218.95
(Profit)/loss on sale/write off of assets (1.84) 0.42
Finance costs 52.40 27.76
Interest income (103.34) (81.87)
Income from non-trade investements (non-current)
(38.96) (38.96)
Dividend from subsidiary company - (8.00)
Unrealised exchange (gain)/loss (5.17) (1.66)
138.48 116.64
Operating profit/(loss) before working capital changes
945.06 739.58
Adjustment for changes in working capital:
Inventories 44.84 (395.18)
Trade receivables 369.39 (695.48)
Short-term loans and advances 54.28 92.35
Long-term loans and advances (26.32) (149.88)
Other non-current assets - Long-term trade receivables
39.42 (48.03)
Trade payables (68.21) 75.22
Other current liabilities 56.20 170.21
Other long-term liabilities 3.02 4.41
Short-term provisions (5.83) 4.14
Long-term provisions 43.94 55.94
510.73 (886.30)
Cash generated from operations 1,455.79 (146.72)
Direct taxes paid (209.41) (166.09)
Net cash flow from/(used in) operating activities (A) 1,246.38 (312.81)
B. Cash flow from investing activities
Purchase of Fixed Assets (534.27) (245.20)
Proceeds from sale of fixed assets 3.52 1.34
Interest received 101.99 69.68
Income from non-trade investements (non-current)
38.96 38.96
Dividend from subsidiary company - 8.00
Net cash flow from/(used in) investing activities (B) (389.80) (127.22)
Cash Flow Statement for the year ended 31st December, 2012
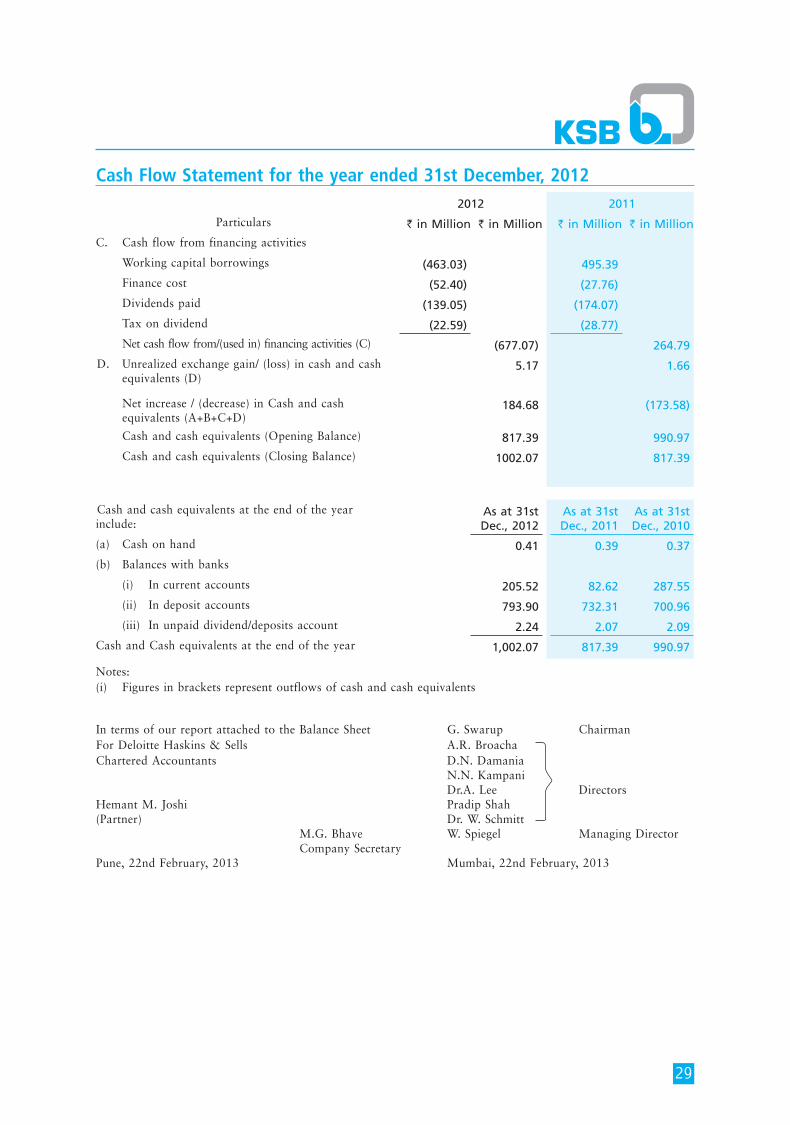
29
Cash Flow Statement for the year ended 31st December, 20122012 2011
Particulars ` in Million ` in Million ` in Million ` in Million
C. Cash flow from financing activities
Working capital borrowings (463.03) 495.39
Finance cost (52.40) (27.76)
Dividends paid (139.05) (174.07)
Tax on dividend (22.59) (28.77)
Net cash flow from/(used in) financing activities (C) (677.07) 264.79
D. Unrealized exchange gain/ (loss) in cash and cash equivalents (D)
5.17 1.66
Net increase / (decrease) in Cash and cash equivalents (A+B+C+D)
184.68 (173.58)
Cash and cash equivalents (Opening Balance) 817.39 990.97
Cash and cash equivalents (Closing Balance) 1002.07 817.39
Cash and cash equivalents at the end of the year include:
As at 31st Dec., 2012
As at 31st Dec., 2011
As at 31st Dec., 2010
(a) Cash on hand 0.41 0.39 0.37
(b) Balances with banks
(i) In current accounts 205.52 82.62 287.55
(ii) In deposit accounts 793.90 732.31 700.96
(iii) In unpaid dividend/deposits account 2.24 2.07 2.09
Cash and Cash equivalents at the end of the year 1,002.07 817.39 990.97
Notes: (i) Figures in brackets represent outflows of cash and cash equivalents
In terms of our report attached to the Balance Sheet G. Swarup ChairmanFor Deloitte Haskins & Sells A.R. Broacha Chartered Accountants D.N. Damania N.N. Kampani Dr.A. Lee DirectorsHemant M. Joshi Pradip Shah (Partner) Dr. W. Schmitt M.G. Bhave W. Spiegel Managing Director Company Secretary Pune, 22nd February, 2013 Mumbai, 22nd February, 2013
30
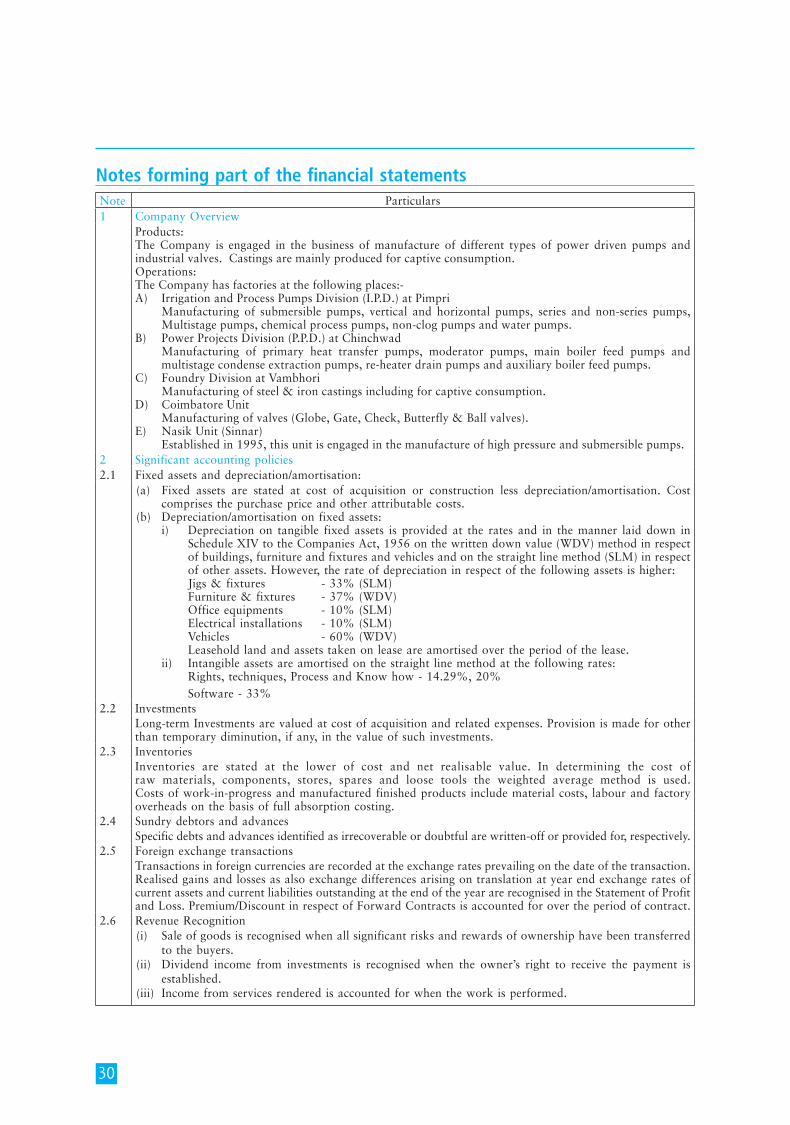
Note Particulars1 Company Overview
Products:The Company is engaged in the business of manufacture of different types of power driven pumps and industrial valves. Castings are mainly produced for captive consumption. Operations:The Company has factories at the following places:-A) Irrigation and Process Pumps Division (I.P.D.) at Pimpri Manufacturing of submersible pumps, vertical and horizontal pumps, series and non-series pumps,
Multistage pumps, chemical process pumps, non-clog pumps and water pumps.B) Power Projects Division (P.P.D.) at Chinchwad Manufacturing of primary heat transfer pumps, moderator pumps, main boiler feed pumps and
multistage condense extraction pumps, re-heater drain pumps and auxiliary boiler feed pumps. C) Foundry Division at Vambhori Manufacturing of steel & iron castings including for captive consumption. D) Coimbatore Unit Manufacturing of valves (Globe, Gate, Check, Butterfly & Ball valves). E) Nasik Unit (Sinnar) Established in 1995, this unit is engaged in the manufacture of high pressure and submersible pumps.
2 Significant accounting policies2.1 Fixed assets and depreciation/amortisation:
(a) Fixed assets are stated at cost of acquisition or construction less depreciation/amortisation. Cost comprises the purchase price and other attributable costs.
(b) Depreciation/amortisation on fixed assets: i) Depreciation on tangible fixed assets is provided at the rates and in the manner laid down in
Schedule XIV to the Companies Act, 1956 on the written down value (WDV) method in respect of buildings, furniture and fixtures and vehicles and on the straight line method (SLM) in respect of other assets. However, the rate of depreciation in respect of the following assets is higher:
Jigs & fixtures - 33% (SLM) Furniture & fixtures - 37% (WDV) Office equipments - 10% (SLM) Electrical installations - 10% (SLM) Vehicles - 60% (WDV) Leasehold land and assets taken on lease are amortised over the period of the lease. ii) Intangible assets are amortised on the straight line method at the following rates: Rights, techniques, Process and Know how - 14.29%, 20% Software - 33%
2.2 InvestmentsLong-term Investments are valued at cost of acquisition and related expenses. Provision is made for other than temporary diminution, if any, in the value of such investments.
2.3 InventoriesInventories are stated at the lower of cost and net realisable value. In determining the cost of raw materials, components, stores, spares and loose tools the weighted average method is used. Costs of work-in-progress and manufactured finished products include material costs, labour and factory overheads on the basis of full absorption costing.
2.4 Sundry debtors and advancesSpecific debts and advances identified as irrecoverable or doubtful are written-off or provided for, respectively.
2.5 Foreign exchange transactionsTransactions in foreign currencies are recorded at the exchange rates prevailing on the date of the transaction. Realised gains and losses as also exchange differences arising on translation at year end exchange rates of current assets and current liabilities outstanding at the end of the year are recognised in the Statement of Profit and Loss. Premium/Discount in respect of Forward Contracts is accounted for over the period of contract.
2.6 Revenue Recognition(i) Sale of goods is recognised when all significant risks and rewards of ownership have been transferred
to the buyers. (ii) Dividend income from investments is recognised when the owner’s right to receive the payment is
established. (iii) Income from services rendered is accounted for when the work is performed.
Notes forming part of the financial statements
31
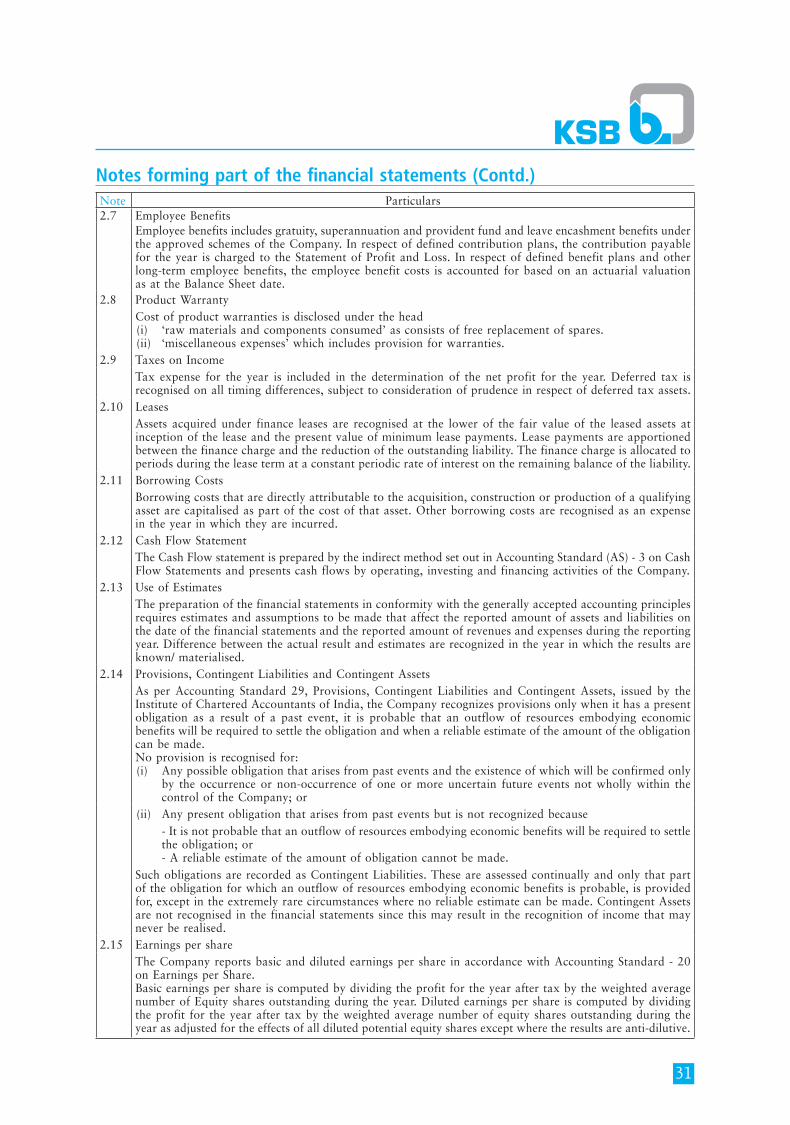
Note Particulars2.7 Employee Benefits
Employee benefits includes gratuity, superannuation and provident fund and leave encashment benefits under the approved schemes of the Company. In respect of defined contribution plans, the contribution payable for the year is charged to the Statement of Profit and Loss. In respect of defined benefit plans and other long-term employee benefits, the employee benefit costs is accounted for based on an actuarial valuation as at the Balance Sheet date.
2.8 Product WarrantyCost of product warranties is disclosed under the head (i) ‘raw materials and components consumed’ as consists of free replacement of spares. (ii) ‘miscellaneous expenses’ which includes provision for warranties.
2.9 Taxes on Income Tax expense for the year is included in the determination of the net profit for the year. Deferred tax is recognised on all timing differences, subject to consideration of prudence in respect of deferred tax assets.
2.10 LeasesAssets acquired under finance leases are recognised at the lower of the fair value of the leased assets at inception of the lease and the present value of minimum lease payments. Lease payments are apportioned between the finance charge and the reduction of the outstanding liability. The finance charge is allocated to periods during the lease term at a constant periodic rate of interest on the remaining balance of the liability.
2.11 Borrowing CostsBorrowing costs that are directly attributable to the acquisition, construction or production of a qualifying asset are capitalised as part of the cost of that asset. Other borrowing costs are recognised as an expense in the year in which they are incurred.
2.12 Cash Flow StatementThe Cash Flow statement is prepared by the indirect method set out in Accounting Standard (AS) - 3 on Cash Flow Statements and presents cash flows by operating, investing and financing activities of the Company.
2.13 Use of EstimatesThe preparation of the financial statements in conformity with the generally accepted accounting principles requires estimates and assumptions to be made that affect the reported amount of assets and liabilities on the date of the financial statements and the reported amount of revenues and expenses during the reporting year. Difference between the actual result and estimates are recognized in the year in which the results are known/ materialised.
2.14 Provisions, Contingent Liabilities and Contingent AssetsAs per Accounting Standard 29, Provisions, Contingent Liabilities and Contingent Assets, issued by the Institute of Chartered Accountants of India, the Company recognizes provisions only when it has a present obligation as a result of a past event, it is probable that an outflow of resources embodying economic benefits will be required to settle the obligation and when a reliable estimate of the amount of the obligation can be made. No provision is recognised for: (i) Any possible obligation that arises from past events and the existence of which will be confirmed only
by the occurrence or non-occurrence of one or more uncertain future events not wholly within the control of the Company; or
(ii) Any present obligation that arises from past events but is not recognized because - It is not probable that an outflow of resources embodying economic benefits will be required to settle
the obligation; or - A reliable estimate of the amount of obligation cannot be made. Such obligations are recorded as Contingent Liabilities. These are assessed continually and only that part of the obligation for which an outflow of resources embodying economic benefits is probable, is provided for, except in the extremely rare circumstances where no reliable estimate can be made. Contingent Assets are not recognised in the financial statements since this may result in the recognition of income that may never be realised.
2.15 Earnings per shareThe Company reports basic and diluted earnings per share in accordance with Accounting Standard - 20 on Earnings per Share.Basic earnings per share is computed by dividing the profit for the year after tax by the weighted average number of Equity shares outstanding during the year. Diluted earnings per share is computed by dividing the profit for the year after tax by the weighted average number of equity shares outstanding during the year as adjusted for the effects of all diluted potential equity shares except where the results are anti-dilutive.
Notes forming part of the financial statements (Contd.)
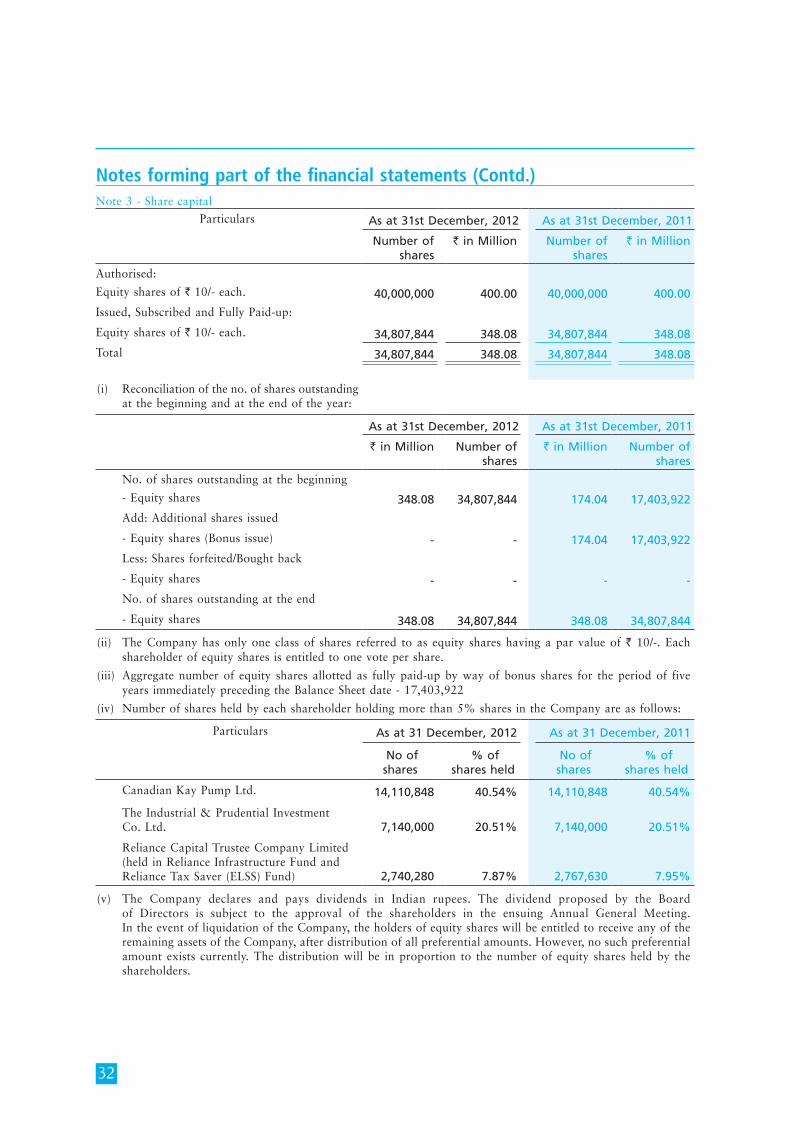
32
Note 3 - Share capitalParticulars As at 31st December, 2012 As at 31st December, 2011
Number of shares
` in Million Number of shares
` in Million
Authorised:
Equity shares of ` 10/- each. 40,000,000 400.00 40,000,000 400.00
Issued, Subscribed and Fully Paid-up:
Equity shares of ` 10/- each. 34,807,844 348.08 34,807,844 348.08
Total 34,807,844 348.08 34,807,844 348.08
(i) Reconciliation of the no. of shares outstanding at the beginning and at the end of the year:
As at 31st December, 2012 As at 31st December, 2011
` in Million Number of shares
` in Million Number of shares
No. of shares outstanding at the beginning
- Equity shares 348.08 34,807,844 174.04 17,403,922
Add: Additional shares issued
- Equity shares (Bonus issue) - - 174.04 17,403,922
Less: Shares forfeited/Bought back
- Equity shares - - - -
No. of shares outstanding at the end
- Equity shares 348.08 34,807,844 348.08 34,807,844
(ii) The Company has only one class of shares referred to as equity shares having a par value of ` 10/-. Each shareholder of equity shares is entitled to one vote per share.
(iii) Aggregate number of equity shares allotted as fully paid-up by way of bonus shares for the period of five years immediately preceding the Balance Sheet date - 17,403,922
(iv) Number of shares held by each shareholder holding more than 5% shares in the Company are as follows:
Particulars As at 31 December, 2012 As at 31 December, 2011
No of shares
% of shares held
No of shares
% of shares held
Canadian Kay Pump Ltd. 14,110,848 40.54% 14,110,848 40.54%
The Industrial & Prudential Investment Co. Ltd. 7,140,000 20.51% 7,140,000 20.51%
Reliance Capital Trustee Company Limited (held in Reliance Infrastructure Fund and Reliance Tax Saver (ELSS) Fund) 2,740,280 7.87% 2,767,630 7.95%
(v) The Company declares and pays dividends in Indian rupees. The dividend proposed by the Board of Directors is subject to the approval of the shareholders in the ensuing Annual General Meeting. In the event of liquidation of the Company, the holders of equity shares will be entitled to receive any of the remaining assets of the Company, after distribution of all preferential amounts. However, no such preferential amount exists currently. The distribution will be in proportion to the number of equity shares held by the shareholders.
Notes forming part of the financial statements (Contd.)
33
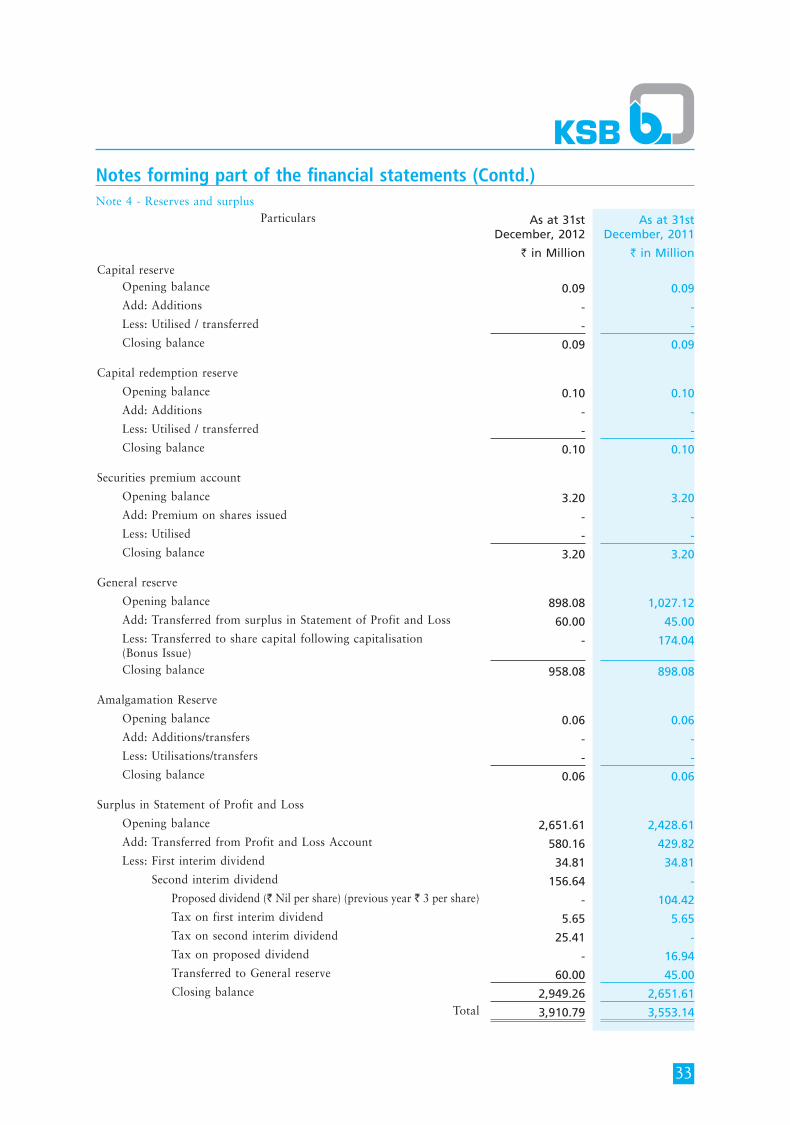
Notes forming part of the financial statements (Contd.)Note 4 - Reserves and surplus
Particulars As at 31st December, 2012
As at 31st December, 2011
` in Million ` in MillionCapital reserve Opening balance 0.09 0.09 Add: Additions - - Less: Utilised / transferred - - Closing balance 0.09 0.09
Capital redemption reserve
Opening balance 0.10 0.10 Add: Additions - - Less: Utilised / transferred - - Closing balance 0.10 0.10
Securities premium account
Opening balance 3.20 3.20 Add: Premium on shares issued - - Less: Utilised - - Closing balance 3.20 3.20
General reserve
Opening balance 898.08 1,027.12 Add: Transferred from surplus in Statement of Profit and Loss 60.00 45.00 Less: Transferred to share capital following capitalisation
(Bonus Issue)- 174.04
Closing balance 958.08 898.08
Amalgamation Reserve
Opening balance 0.06 0.06 Add: Additions/transfers - - Less: Utilisations/transfers - - Closing balance 0.06 0.06
Surplus in Statement of Profit and Loss
Opening balance 2,651.61 2,428.61 Add: Transferred from Profit and Loss Account 580.16 429.82 Less: First interim dividend 34.81 34.81 Second interim dividend 156.64 - Proposed dividend (` Nil per share) (previous year ` 3 per share) - 104.42 Tax on first interim dividend 5.65 5.65 Tax on second interim dividend 25.41 - Tax on proposed dividend - 16.94 Transferred to General reserve 60.00 45.00 Closing balance 2,949.26 2,651.61
Total 3,910.79 3,553.14

34
Notes forming part of the financial statements (Contd.)Note 5 - Long-term borrowings
Particulars As at 31st December, 2012
As at 31st December, 2011
` in Million ` in MillionLong-term maturities of finance lease obligations (Unsecured) - 0.03(Refer Note 36)
Total - 0.03
Note 6 - Other long-term liabilities
Other than trade payables:
Other Payables (includes Deposits received from dealers, etc.) 56.04 53.02 Total 56.04 53.02
Note 7 - Long-term provisions
Provision for employee benefits (Refer Note 37) 218.90 175.63Other Provisions:
Provision for Warranty (Refer Note 40) 8.75 8.08Total 227.65 183.71
Note 8 - Short-term borrowings
Loans Repayable on Demand
Working Capital Facilities/ Packing credit from banks (Secured) 151.72 631.55 Book overdraft (Unsecured) 16.80 -
Total 168.52 631.55
Note:
(i) Details of security for the secured short-term borrowings:
Particulars Nature of security As at 31st December, 2012
` in Million
As at 31st December, 2011
` in Million
Working Capital Facility -1 Pledge of Fixed Deposits of ` 220 Million (previous year ` 220 Million)
2.04 189.92
Working Capital Facility -2 Pledge of Fixed Deposits of ` 433.76 Million (Previous year ` 433.76 Million) and hypothecation of stocks including loose tools, stores and spares, book debts.
40.21 406.92
Working Capital Facility -3 Hypothecation of stocks including loose tools, stores and spares, book debts.
109.47 34.71
Total 151.72 631.55
35
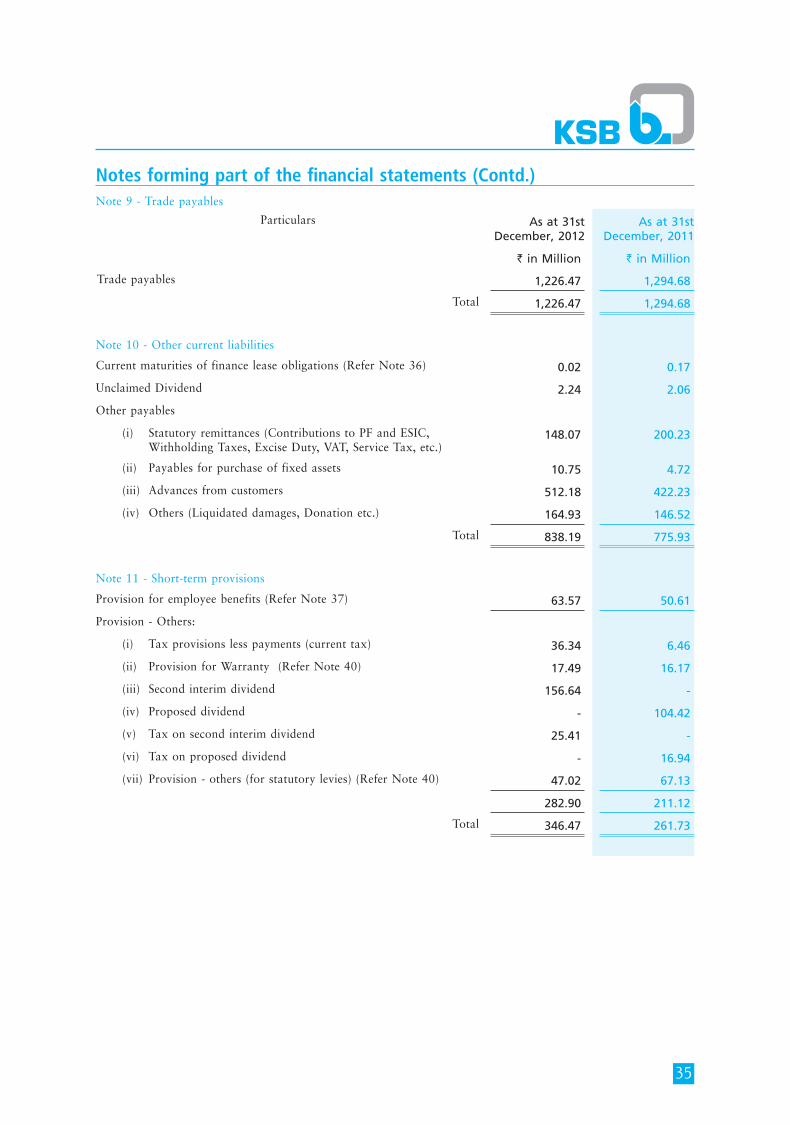
Notes forming part of the financial statements (Contd.)Note 9 - Trade payables
Particulars As at 31st December, 2012
As at 31st December, 2011
` in Million ` in Million
Trade payables 1,226.47 1,294.68
Total 1,226.47 1,294.68
Note 10 - Other current liabilities
Current maturities of finance lease obligations (Refer Note 36) 0.02 0.17
Unclaimed Dividend 2.24 2.06
Other payables
(i) Statutory remittances (Contributions to PF and ESIC, Withholding Taxes, Excise Duty, VAT, Service Tax, etc.)
148.07 200.23
(ii) Payables for purchase of fixed assets 10.75 4.72
(iii) Advances from customers 512.18 422.23
(iv) Others (Liquidated damages, Donation etc.) 164.93 146.52
Total 838.19 775.93
Note 11 - Short-term provisions
Provision for employee benefits (Refer Note 37) 63.57 50.61
Provision - Others:
(i) Tax provisions less payments (current tax) 36.34 6.46
(ii) Provision for Warranty (Refer Note 40) 17.49 16.17
(iii) Second interim dividend 156.64 -
(iv) Proposed dividend - 104.42
(v) Tax on second interim dividend 25.41 -
(vi) Tax on proposed dividend - 16.94
(vii) Provision - others (for statutory levies) (Refer Note 40) 47.02 67.13
282.90 211.12
Total 346.47 261.73
36
Notes forming part of the financial statements (Contd.)
Not
e 12
- F
ixed
ass
ets
- Ta
ngib
le a
nd I
ntan
gibl
e as
sets
` i
n M
illio
n
Part
icul
ars
Gro
ss b
lock
Dep
reci
atio
n/A
mor
tisa
tion
Net
blo
ck
As
at 3
1st
Dec
embe
r, 20
11
Add
itio
ns
duri
ng t
he
year
Ded
ucti
ons
duri
ng t
he
year
As
at 3
1st
Dec
embe
r, 20
12
Upt
o 31
st
Dec
embe
r, 20
11
Prov
ided
du
ring
the
ye
ar
Ded
ucti
ons
duri
ng t
he
year
Upt
o 31
st
Dec
embe
r, 20
12
As
at 3
1st
Dec
embe
r, 20
12
As
at 3
1st
Dec
embe
r, 20
11A
. Ta
ngib
le A
sset
s
(a)
Lan
d
-
Free
hold
3.0
1 -
-
3
.01
-
-
-
-
3.0
1 3
.01
-
Lea
seho
ld 1
5.51
-
0
.36
15.
15
3.0
1 0
.19
0.3
4 2
.86
12.
29
12.
50
(b)
Bui
ldin
gs (
See
Not
e) 4
95.1
4 4
3.34
2
.62
535
.86
230
.62
28.
25
1.5
2 2
57.3
5 2
78.5
1 2
64.5
2
(c)
Plan
t an
d E
quip
men
t 2
,468
.08
227
.42
29.
66
2,6
65.8
4 1
,299
.08
178
.99
29.
54
1,4
48.5
3 1
,217
.31
1,1
69.0
0
(d)
Furn
itur
e an
d Fi
xtur
es 7
6.39
2
.37
0.0
8 7
8.68
6
2.92
5
.80
0.0
8 6
8.64
1
0.04
1
3.47
(e)
Veh
icle
s
-
Ow
ned
46.
12
3.4
3 2
.46
47.
09
33.
22
7.7
0 2
.19
38.
73
8.3
6 1
2.90
-
Take
n un
der
fina
nce
leas
e (R
efer
Not
e 36
) 0
.90
-
0.6
9 0
.21
0.8
5 0
.01
0.6
6 0
.20
0.0
1 0
.05
(f)
Off
ice
equi
pmen
t 7
7.81
6
.78
1.3
6 8
3.23
4
0.11
7
.13
1.2
2 4
6.02
3
7.21
3
7.70
(g)
Dev
elop
men
t of
Pr
oper
ty 0
.04
-
-
0.0
4 0
.04
-
-
0.0
4 -
-
Tota
l Ta
ngib
le A
sset
s 3
,183
.00
283
.34
37.
23
3,4
29.1
1 1
,669
.85
228
.07
35.
55
1,8
62.3
7 1
,566
.74
1,5
13.1
5
Prev
ious
yea
r 3
,026
.54
221
.74
65.
28
3,1
83.0
0 1
,519
.77
213
.60
63.
52
1,6
69.8
5 1
,513
.15
B.
Inta
ngib
le A
sset
s
(o
ther
tha
n in
tern
ally
ge
nera
ted)
(a)
Com
pute
r so
ftw
are
28.
36
7.9
2 -
3
6.28
2
1.43
5
.90
-
27.
33
8.9
5 6
.93
(b)
Cop
yrig
hts,
pat
ents
an
d ot
her
inte
llect
ual
prop
erty
rig
hts,
ser
vice
s an
d op
erat
ing
righ
ts
53.
53
2.9
2 -
5
6.45
4
6.08
1
.42
-
47.
50
8.9
5 7
.45
Tota
l In
tang
ible
Ass
ets
81.
89
10.
84
-
92.
73
67.
51
7.3
2 -
7
4.83
1
7.90
1
4.38
Prev
ious
yea
r 6
8.66
1
3.23
-
8
1.89
6
2.16
5
.35
-
67.
51
14.
38
Not
e:
Bui
ldin
gs i
nclu
de `
10,
750
(pre
viou
s ye
ar -
` 1
0,75
0) b
eing
the
cos
t of
sha
res
in c
o-op
erat
ive
hous
ing/
indu
stri
al s
ocie
ties
.
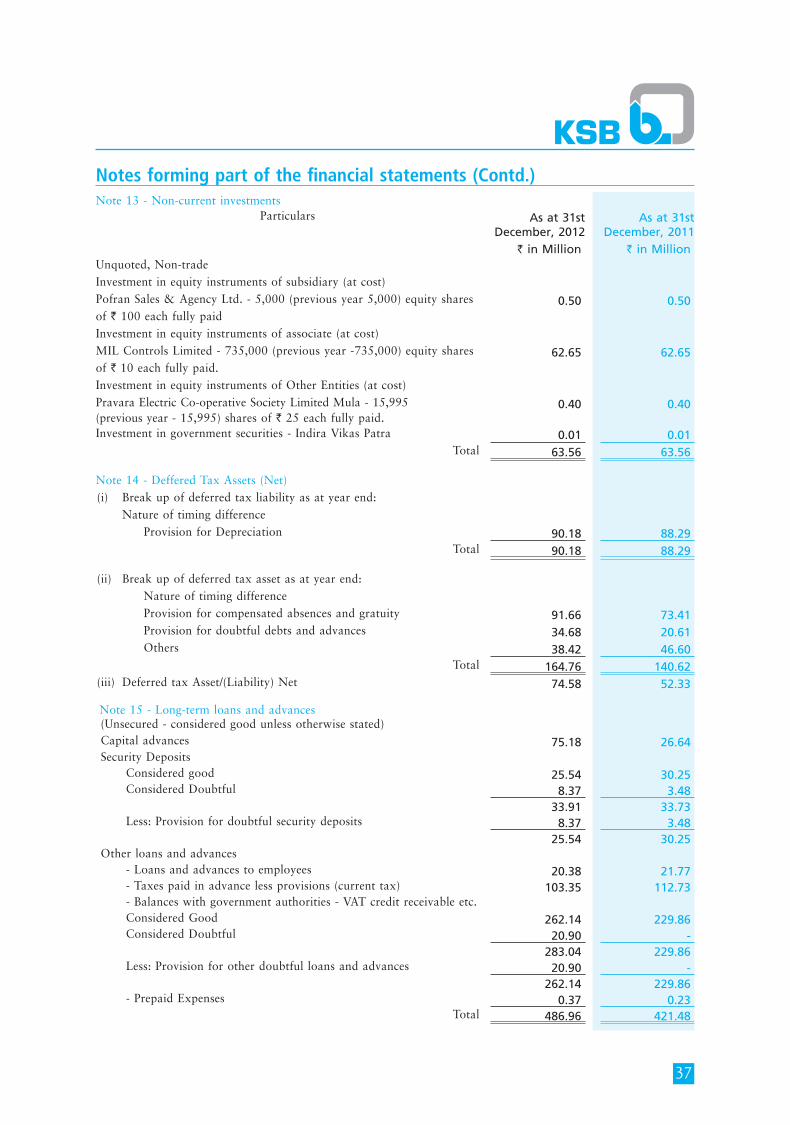
37
Notes forming part of the financial statements (Contd.)Note 13 - Non-current investments
Particulars As at 31st December, 2012
As at 31st December, 2011
` in Million ` in MillionUnquoted, Non-tradeInvestment in equity instruments of subsidiary (at cost) Pofran Sales & Agency Ltd. - 5,000 (previous year 5,000) equity shares 0.50 0.50 of ` 100 each fully paid Investment in equity instruments of associate (at cost) MIL Controls Limited - 735,000 (previous year -735,000) equity shares 62.65 62.65 of ` 10 each fully paid. Investment in equity instruments of Other Entities (at cost) Pravara Electric Co-operative Society Limited Mula - 15,995 (previous year - 15,995) shares of ` 25 each fully paid.
0.40 0.40
Investment in government securities - Indira Vikas Patra 0.01 0.01 Total 63.56 63.56
Note 14 - Deffered Tax Assets (Net)(i) Break up of deferred tax liability as at year end: Nature of timing difference Provision for Depreciation 90.18 88.29
Total 90.18 88.29
(ii) Break up of deferred tax asset as at year end: Nature of timing difference Provision for compensated absences and gratuity 91.66 73.41 Provision for doubtful debts and advances 34.68 20.61 Others 38.42 46.60
Total 164.76 140.62 (iii) Deferred tax Asset/(Liability) Net 74.58 52.33
Note 15 - Long-term loans and advances(Unsecured - considered good unless otherwise stated)Capital advances 75.18 26.64 Security Deposits Considered good 25.54 30.25 Considered Doubtful 8.37 3.48
33.91 33.73 Less: Provision for doubtful security deposits 8.37 3.48
25.54 30.25 Other loans and advances - Loans and advances to employees 20.38 21.77 - Taxes paid in advance less provisions (current tax) 103.35 112.73 - Balances with government authorities - VAT credit receivable etc. Considered Good 262.14 229.86 Considered Doubtful 20.90 -
283.04 229.86 Less: Provision for other doubtful loans and advances 20.90 -
262.14 229.86 - Prepaid Expenses 0.37 0.23
Total 486.96 421.48
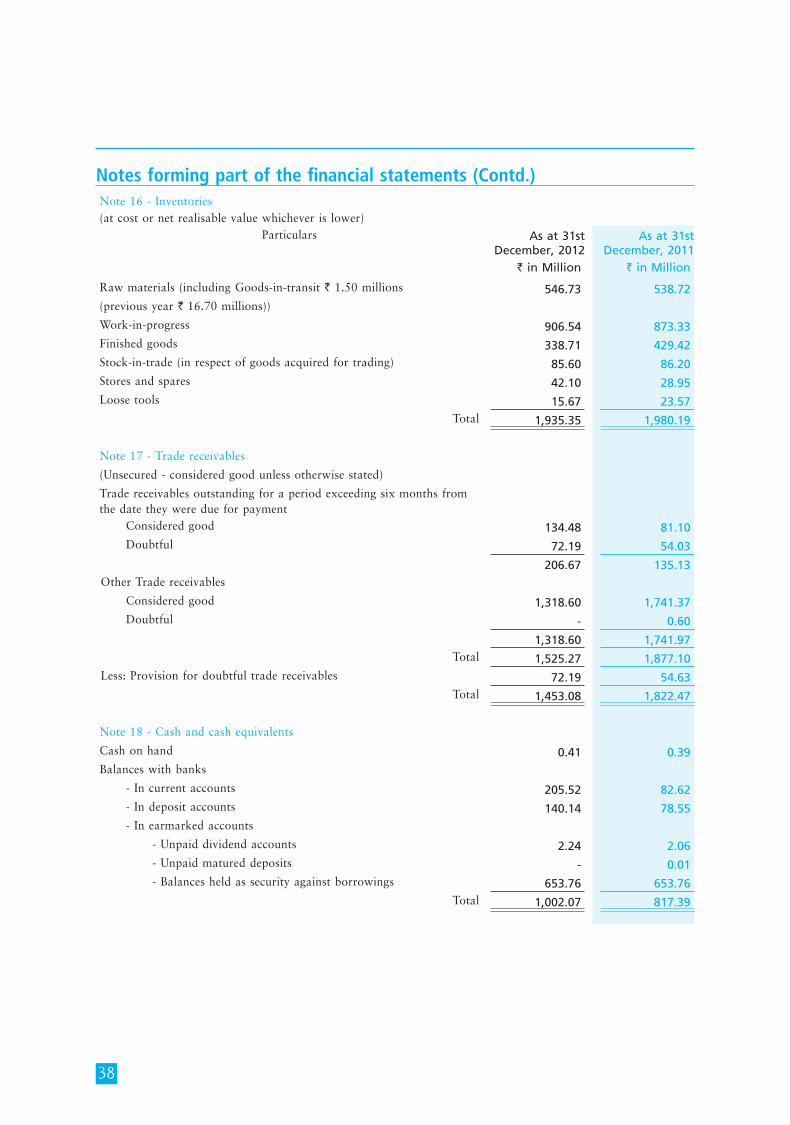
38
Note 16 - Inventories(at cost or net realisable value whichever is lower)
Particulars As at 31st December, 2012
As at 31st December, 2011
` in Million ` in Million
Raw materials (including Goods-in-transit ` 1.50 millions 546.73 538.72 (previous year ` 16.70 millions))
Work-in-progress 906.54 873.33 Finished goods 338.71 429.42 Stock-in-trade (in respect of goods acquired for trading) 85.60 86.20 Stores and spares 42.10 28.95 Loose tools 15.67 23.57
Total 1,935.35 1,980.19
Note 17 - Trade receivables
(Unsecured - considered good unless otherwise stated)
Trade receivables outstanding for a period exceeding six months from the date they were due for payment Considered good 134.48 81.10 Doubtful 72.19 54.03
206.67 135.13 Other Trade receivables
Considered good 1,318.60 1,741.37 Doubtful - 0.60
1,318.60 1,741.97 Total 1,525.27 1,877.10
Less: Provision for doubtful trade receivables 72.19 54.63 Total 1,453.08 1,822.47
Note 18 - Cash and cash equivalents
Cash on hand 0.41 0.39Balances with banks
- In current accounts 205.52 82.62 - In deposit accounts 140.14 78.55 - In earmarked accounts
- Unpaid dividend accounts 2.24 2.06 - Unpaid matured deposits - 0.01 - Balances held as security against borrowings 653.76 653.76
Total 1,002.07 817.39
Notes forming part of the financial statements (Contd.)
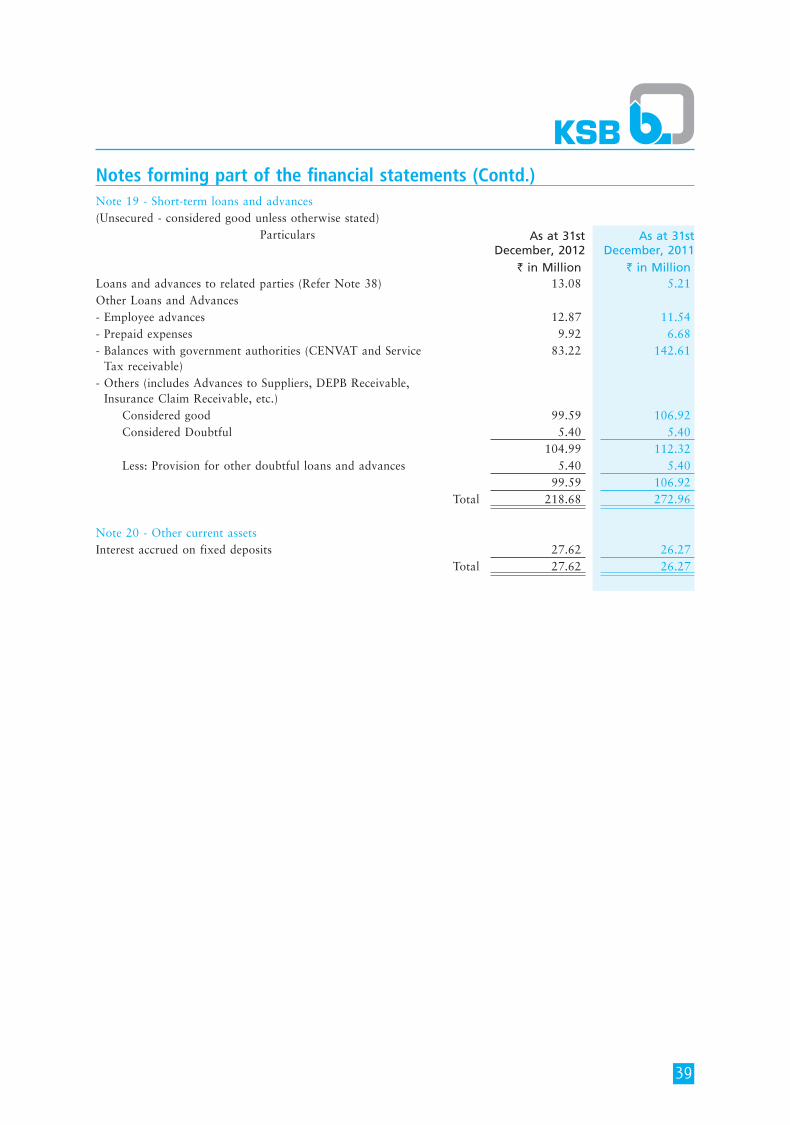
39
Notes forming part of the financial statements (Contd.)Note 19 - Short-term loans and advances(Unsecured - considered good unless otherwise stated)
Particulars As at 31st December, 2012
As at 31st December, 2011
` in Million ` in MillionLoans and advances to related parties (Refer Note 38) 13.08 5.21 Other Loans and Advances- Employee advances 12.87 11.54 - Prepaid expenses 9.92 6.68 - Balances with government authorities (CENVAT and Service Tax receivable)
83.22 142.61
- Others (includes Advances to Suppliers, DEPB Receivable, Insurance Claim Receivable, etc.) Considered good 99.59 106.92 Considered Doubtful 5.40 5.40
104.99 112.32 Less: Provision for other doubtful loans and advances 5.40 5.40
99.59 106.92 Total 218.68 272.96
Note 20 - Other current assetsInterest accrued on fixed deposits 27.62 26.27
Total 27.62 26.27
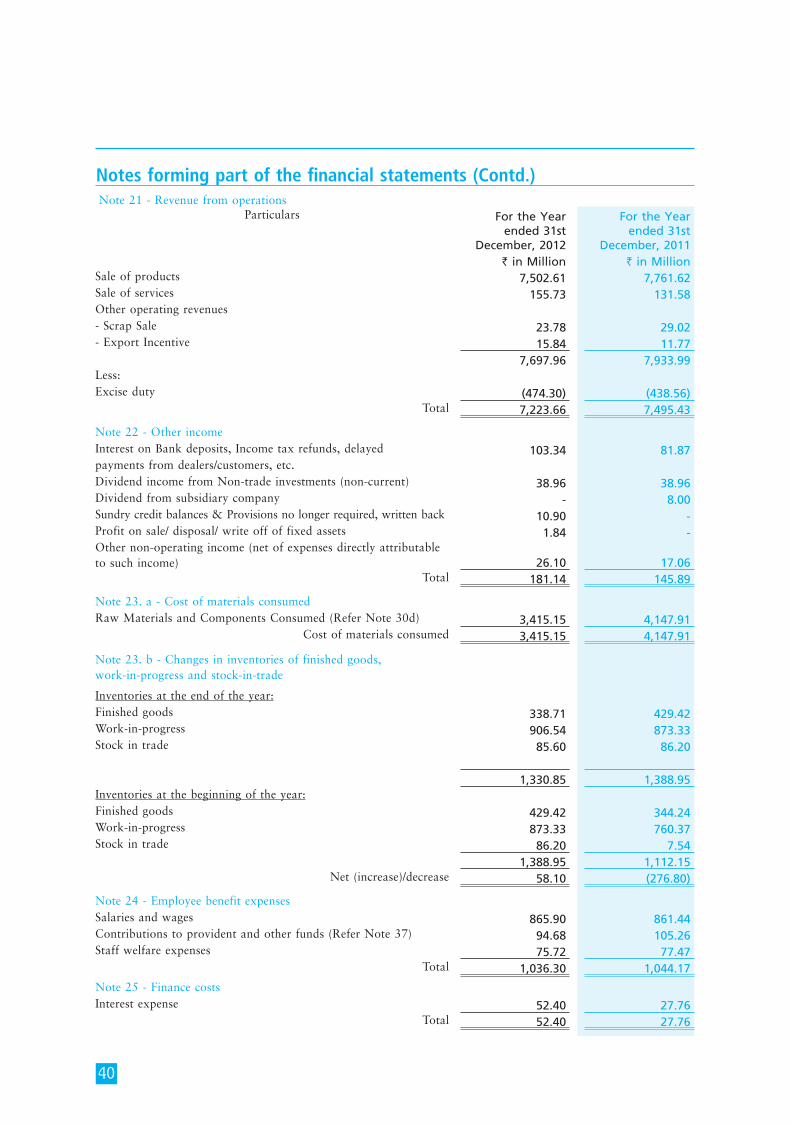
40
Notes forming part of the financial statements (Contd.)Note 21 - Revenue from operations
Particulars For the Year ended 31st
December, 2012
For the Year ended 31st
December, 2011` in Million ` in Million
Sale of products 7,502.61 7,761.62 Sale of services 155.73 131.58 Other operating revenues - Scrap Sale 23.78 29.02 - Export Incentive 15.84 11.77
7,697.96 7,933.99 Less:Excise duty (474.30) (438.56)
Total 7,223.66 7,495.43
Note 22 - Other incomeInterest on Bank deposits, Income tax refunds, delayed 103.34 81.87 payments from dealers/customers, etc.Dividend income from Non-trade investments (non-current) 38.96 38.96 Dividend from subsidiary company - 8.00 Sundry credit balances & Provisions no longer required, written back 10.90 - Profit on sale/ disposal/ write off of fixed assets 1.84 - Other non-operating income (net of expenses directly attributable to such income) 26.10 17.06
Total 181.14 145.89
Note 23. a - Cost of materials consumed Raw Materials and Components Consumed (Refer Note 30d) 3,415.15 4,147.91
Cost of materials consumed 3,415.15 4,147.91
Note 23. b - Changes in inventories of finished goods, work-in-progress and stock-in-trade
Inventories at the end of the year:Finished goods 338.71 429.42 Work-in-progress 906.54 873.33 Stock in trade 85.60 86.20
1,330.85 1,388.95 Inventories at the beginning of the year:Finished goods 429.42 344.24 Work-in-progress 873.33 760.37 Stock in trade 86.20 7.54
1,388.95 1,112.15 Net (increase)/decrease 58.10 (276.80)
Note 24 - Employee benefit expensesSalaries and wages 865.90 861.44 Contributions to provident and other funds (Refer Note 37) 94.68 105.26 Staff welfare expenses 75.72 77.47
Total 1,036.30 1,044.17
Note 25 - Finance costsInterest expense 52.40 27.76
Total 52.40 27.76
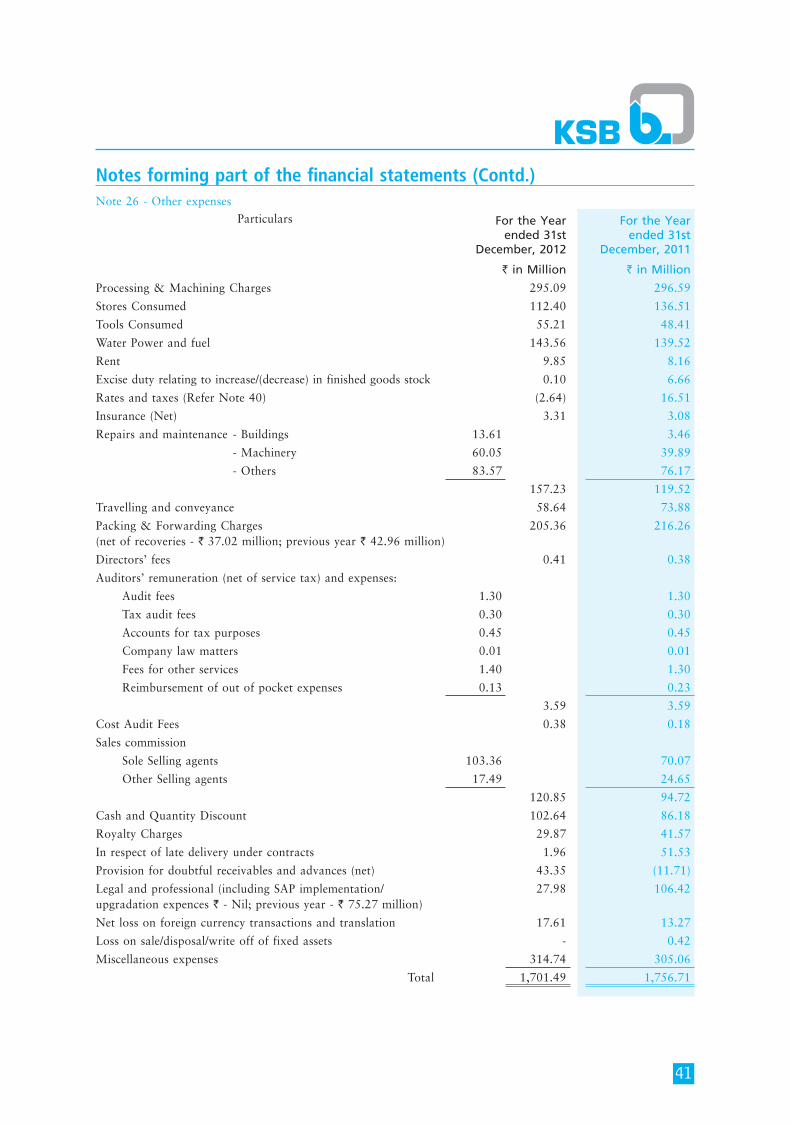
41
Notes forming part of the financial statements (Contd.)Note 26 - Other expenses
Particulars For the Year ended 31st
December, 2012
For the Year ended 31st
December, 2011
` in Million ` in Million
Processing & Machining Charges 295.09 296.59
Stores Consumed 112.40 136.51
Tools Consumed 55.21 48.41
Water Power and fuel 143.56 139.52
Rent 9.85 8.16
Excise duty relating to increase/(decrease) in finished goods stock 0.10 6.66
Rates and taxes (Refer Note 40) (2.64) 16.51
Insurance (Net) 3.31 3.08
Repairs and maintenance - Buildings 13.61 3.46
- Machinery 60.05 39.89
- Others 83.57 76.17
157.23 119.52
Travelling and conveyance 58.64 73.88
Packing & Forwarding Charges (net of recoveries - ` 37.02 million; previous year ` 42.96 million)
205.36 216.26
Directors’ fees 0.41 0.38
Auditors’ remuneration (net of service tax) and expenses:
Audit fees 1.30 1.30
Tax audit fees 0.30 0.30
Accounts for tax purposes 0.45 0.45
Company law matters 0.01 0.01
Fees for other services 1.40 1.30
Reimbursement of out of pocket expenses 0.13 0.23
3.59 3.59
Cost Audit Fees 0.38 0.18
Sales commission
Sole Selling agents 103.36 70.07
Other Selling agents 17.49 24.65
120.85 94.72
Cash and Quantity Discount 102.64 86.18
Royalty Charges 29.87 41.57
In respect of late delivery under contracts 1.96 51.53
Provision for doubtful receivables and advances (net) 43.35 (11.71)
Legal and professional (including SAP implementation/ upgradation expences ` - Nil; previous year - ` 75.27 million)
27.98 106.42
Net loss on foreign currency transactions and translation 17.61 13.27
Loss on sale/disposal/write off of fixed assets - 0.42
Miscellaneous expenses 314.74 305.06
Total 1,701.49 1,756.71
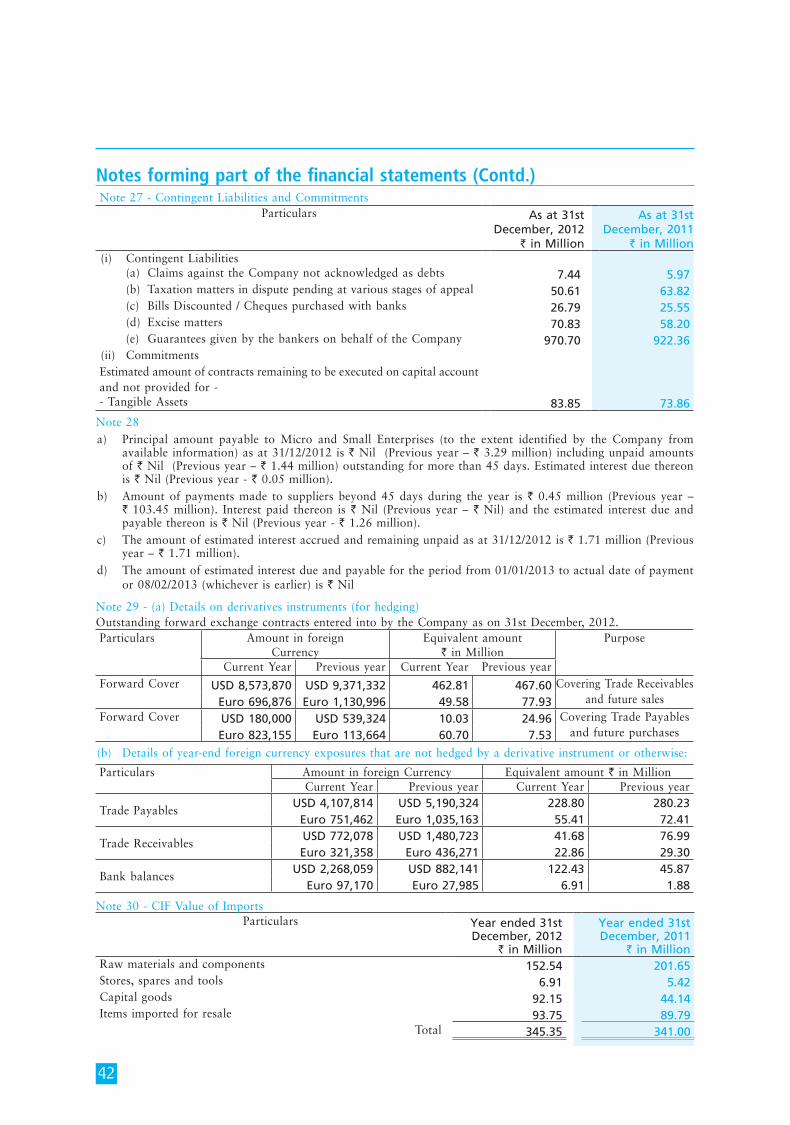
42
Note 27 - Contingent Liabilities and CommitmentsParticulars As at 31st
December, 2012` in Million
As at 31st December, 2011
` in Million(i) Contingent Liabilities (a) Claims against the Company not acknowledged as debts 7.44 5.97 (b) Taxation matters in dispute pending at various stages of appeal 50.61 63.82 (c) Bills Discounted / Cheques purchased with banks 26.79 25.55 (d) Excise matters 70.83 58.20 (e) Guarantees given by the bankers on behalf of the Company 970.70 922.36 (ii) Commitments Estimated amount of contracts remaining to be executed on capital account and not provided for -- Tangible Assets 83.85 73.86
Note 28 a) Principal amount payable to Micro and Small Enterprises (to the extent identified by the Company from
available information) as at 31/12/2012 is ` Nil (Previous year – ` 3.29 million) including unpaid amounts of ` Nil (Previous year – ` 1.44 million) outstanding for more than 45 days. Estimated interest due thereon is ` Nil (Previous year - ` 0.05 million).
b) Amount of payments made to suppliers beyond 45 days during the year is ` 0.45 million (Previous year – ` 103.45 million). Interest paid thereon is ` Nil (Previous year – ` Nil) and the estimated interest due and payable thereon is ` Nil (Previous year - ` 1.26 million).
c) The amount of estimated interest accrued and remaining unpaid as at 31/12/2012 is ` 1.71 million (Previous year – ` 1.71 million).
d) The amount of estimated interest due and payable for the period from 01/01/2013 to actual date of payment or 08/02/2013 (whichever is earlier) is ` Nil
Note 29 - (a) Details on derivatives instruments (for hedging)Outstanding forward exchange contracts entered into by the Company as on 31st December, 2012.Particulars Amount in foreign
CurrencyEquivalent amount
` in MillionPurpose
Current Year Previous year Current Year Previous year Forward Cover USD 8,573,870 USD 9,371,332 462.81 467.60 Covering Trade Receivables
and future sales Euro 696,876 Euro 1,130,996 49.58 77.93 Forward Cover USD 180,000 USD 539,324 10.03 24.96 Covering Trade Payables
and future purchases Euro 823,155 Euro 113,664 60.70 7.53
(b) Details of year-end foreign currency exposures that are not hedged by a derivative instrument or otherwise:
Particulars Amount in foreign Currency Equivalent amount ` in MillionCurrent Year Previous year Current Year Previous year
Trade Payables USD 4,107,814 USD 5,190,324 228.80 280.23
Euro 751,462 Euro 1,035,163 55.41 72.41
Trade Receivables USD 772,078 USD 1,480,723 41.68 76.99 Euro 321,358 Euro 436,271 22.86 29.30
Bank balances USD 2,268,059 USD 882,141 122.43 45.87
Euro 97,170 Euro 27,985 6.91 1.88
Note 30 - CIF Value of ImportsParticulars Year ended 31st
December, 2012 ` in Million
Year ended 31st December, 2011
` in MillionRaw materials and components 152.54 201.65 Stores, spares and tools 6.91 5.42 Capital goods 92.15 44.14 Items imported for resale 93.75 89.79
Total 345.35 341.00
Notes forming part of the financial statements (Contd.)
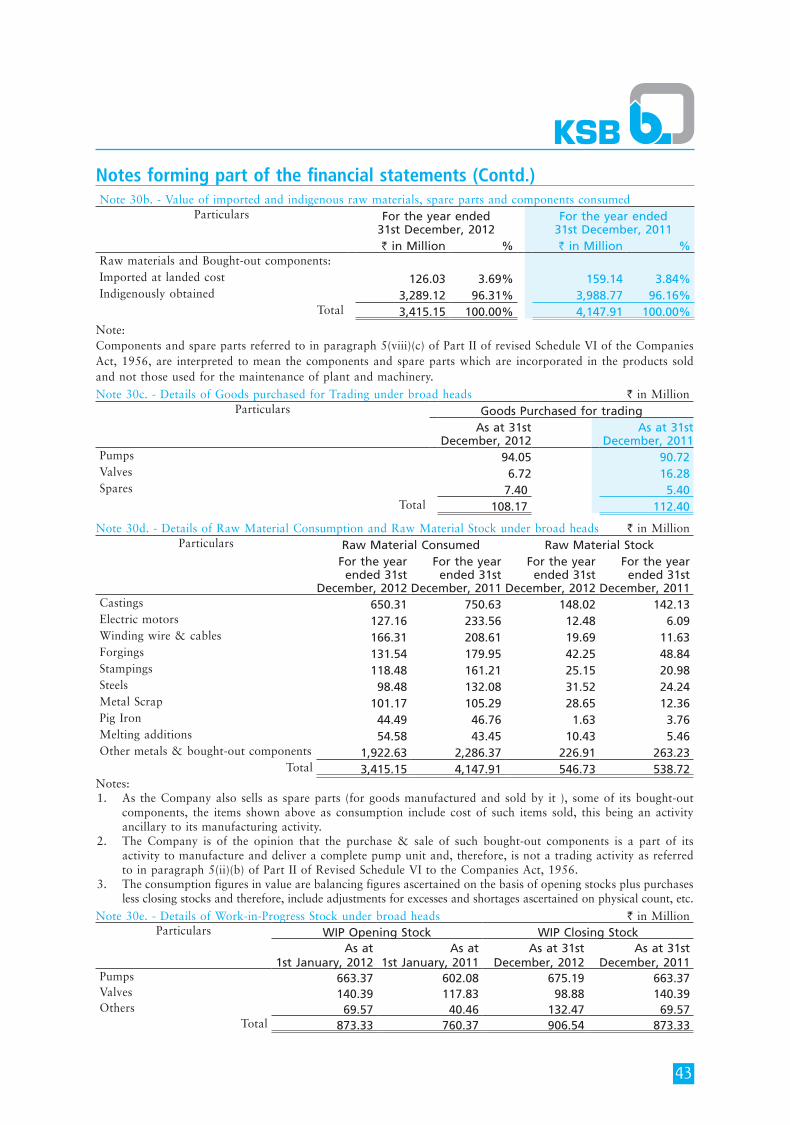
43
Notes forming part of the financial statements (Contd.)Note 30b. - Value of imported and indigenous raw materials, spare parts and components consumed
Particulars For the year ended 31st December, 2012
For the year ended 31st December, 2011
` in Million % ` in Million % Raw materials and Bought-out components:Imported at landed cost 126.03 3.69% 159.14 3.84%Indigenously obtained 3,289.12 96.31% 3,988.77 96.16%
Total 3,415.15 100.00% 4,147.91 100.00%
Note:Components and spare parts referred to in paragraph 5(viii)(c) of Part II of revised Schedule VI of the Companies Act, 1956, are interpreted to mean the components and spare parts which are incorporated in the products sold and not those used for the maintenance of plant and machinery.
Note 30c. - Details of Goods purchased for Trading under broad heads ` in MillionParticulars Goods Purchased for trading
As at 31st December, 2012
As at 31st December, 2011
Pumps 94.05 90.72 Valves 6.72 16.28 Spares 7.40 5.40
Total 108.17 112.40
Note 30d. - Details of Raw Material Consumption and Raw Material Stock under broad heads ` in MillionParticulars Raw Material Consumed Raw Material Stock
For the year ended 31st
December, 2012
For the year ended 31st
December, 2011
For the year ended 31st
December, 2012
For the year ended 31st
December, 2011Castings 650.31 750.63 148.02 142.13Electric motors 127.16 233.56 12.48 6.09Winding wire & cables 166.31 208.61 19.69 11.63Forgings 131.54 179.95 42.25 48.84Stampings 118.48 161.21 25.15 20.98Steels 98.48 132.08 31.52 24.24Metal Scrap 101.17 105.29 28.65 12.36Pig Iron 44.49 46.76 1.63 3.76Melting additions 54.58 43.45 10.43 5.46Other metals & bought-out components 1,922.63 2,286.37 226.91 263.23
Total 3,415.15 4,147.91 546.73 538.72Notes:1. As the Company also sells as spare parts (for goods manufactured and sold by it ), some of its bought-out
components, the items shown above as consumption include cost of such items sold, this being an activity ancillary to its manufacturing activity.
2. The Company is of the opinion that the purchase & sale of such bought-out components is a part of its activity to manufacture and deliver a complete pump unit and, therefore, is not a trading activity as referred to in paragraph 5(ii)(b) of Part II of Revised Schedule VI to the Companies Act, 1956.
3. The consumption figures in value are balancing figures ascertained on the basis of opening stocks plus purchases less closing stocks and therefore, include adjustments for excesses and shortages ascertained on physical count, etc.
Note 30e. - Details of Work-in-Progress Stock under broad heads ` in MillionParticulars WIP Opening Stock WIP Closing Stock
As at 1st January, 2012
As at 1st January, 2011
As at 31st December, 2012
As at 31st December, 2011
Pumps 663.37 602.08 675.19 663.37 Valves 140.39 117.83 98.88 140.39 Others 69.57 40.46 132.47 69.57
Total 873.33 760.37 906.54 873.33
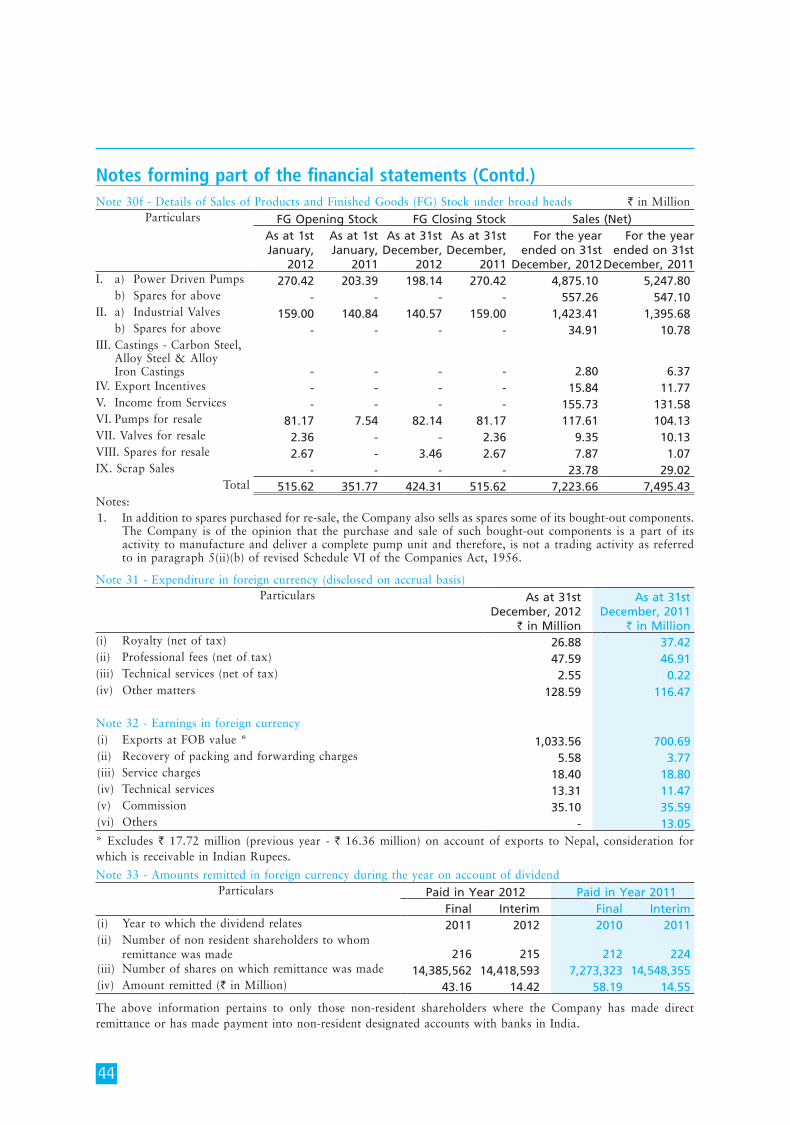
44
Note 30f - Details of Sales of Products and Finished Goods (FG) Stock under broad heads ` in MillionParticulars FG Opening Stock FG Closing Stock Sales (Net)
As at 1st January,
2012
As at 1st January,
2011
As at 31st December,
2012
As at 31st December,
2011
For the year ended on 31st
December, 2012
For the year ended on 31st
December, 2011I. a) Power Driven Pumps 270.42 203.39 198.14 270.42 4,875.10 5,247.80 b) Spares for above - - - - 557.26 547.10 II. a) Industrial Valves 159.00 140.84 140.57 159.00 1,423.41 1,395.68 b) Spares for above - - - - 34.91 10.78 III. Castings - Carbon Steel, Alloy Steel & Alloy Iron Castings - - - - 2.80 6.37 IV. Export Incentives - - - - 15.84 11.77 V. Income from Services - - - - 155.73 131.58 VI. Pumps for resale 81.17 7.54 82.14 81.17 117.61 104.13 VII. Valves for resale 2.36 - - 2.36 9.35 10.13 VIII. Spares for resale 2.67 - 3.46 2.67 7.87 1.07 IX. Scrap Sales - - - - 23.78 29.02
Total 515.62 351.77 424.31 515.62 7,223.66 7,495.43 Notes:1. In addition to spares purchased for re-sale, the Company also sells as spares some of its bought-out components.
The Company is of the opinion that the purchase and sale of such bought-out components is a part of its activity to manufacture and deliver a complete pump unit and therefore, is not a trading activity as referred to in paragraph 5(ii)(b) of revised Schedule VI of the Companies Act, 1956.
Note 31 - Expenditure in foreign currency (disclosed on accrual basis)Particulars As at 31st
December, 2012 ` in Million
As at 31st December, 2011
` in Million (i) Royalty (net of tax) 26.88 37.42 (ii) Professional fees (net of tax) 47.59 46.91 (iii) Technical services (net of tax) 2.55 0.22 (iv) Other matters 128.59 116.47
Note 32 - Earnings in foreign currency(i) Exports at FOB value * 1,033.56 700.69 (ii) Recovery of packing and forwarding charges 5.58 3.77 (iii) Service charges 18.40 18.80 (iv) Technical services 13.31 11.47 (v) Commission 35.10 35.59 (vi) Others - 13.05* Excludes ` 17.72 million (previous year - ` 16.36 million) on account of exports to Nepal, consideration for which is receivable in Indian Rupees.
Note 33 - Amounts remitted in foreign currency during the year on account of dividendParticulars Paid in Year 2012 Paid in Year 2011
Final Interim Final Interim (i) Year to which the dividend relates 2011 2012 2010 2011(ii) Number of non resident shareholders to whom
remittance was made 216 215 212 224(iii) Number of shares on which remittance was made 14,385,562 14,418,593 7,273,323 14,548,355 (iv) Amount remitted (` in Million) 43.16 14.42 58.19 14.55
The above information pertains to only those non-resident shareholders where the Company has made direct remittance or has made payment into non-resident designated accounts with banks in India.
Notes forming part of the financial statements (Contd.)
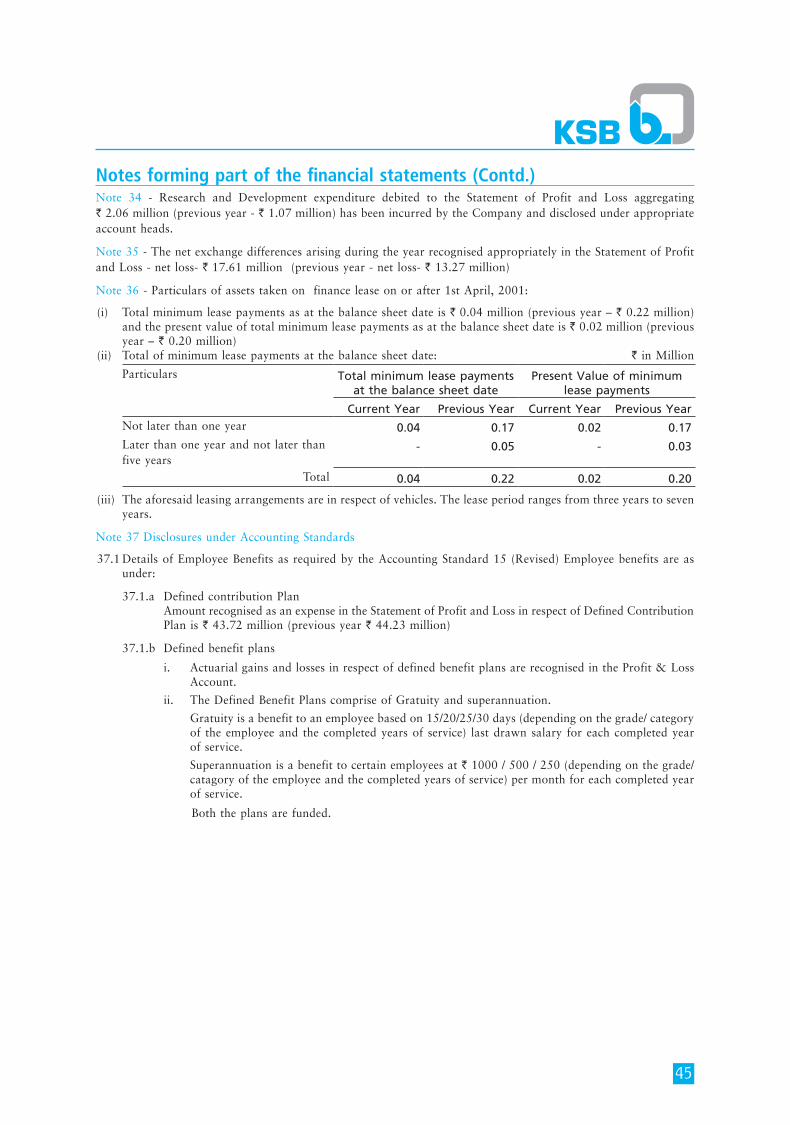
45
Notes forming part of the financial statements (Contd.)Note 34 - Research and Development expenditure debited to the Statement of Profit and Loss aggregating ` 2.06 million (previous year - ` 1.07 million) has been incurred by the Company and disclosed under appropriate account heads.
Note 35 - The net exchange differences arising during the year recognised appropriately in the Statement of Profit and Loss - net loss- ` 17.61 million (previous year - net loss- ` 13.27 million)
Note 36 - Particulars of assets taken on finance lease on or after 1st April, 2001:
(i) Total minimum lease payments as at the balance sheet date is ` 0.04 million (previous year – ` 0.22 million) and the present value of total minimum lease payments as at the balance sheet date is ` 0.02 million (previous year – ` 0.20 million)
(ii) Total of minimum lease payments at the balance sheet date: ` in Million
Particulars Total minimum lease payments at the balance sheet date
Present Value of minimum lease payments
Current Year Previous Year Current Year Previous Year Not later than one year 0.04 0.17 0.02 0.17 Later than one year and not later than five years
- 0.05 - 0.03
Total 0.04 0.22 0.02 0.20
(iii) The aforesaid leasing arrangements are in respect of vehicles. The lease period ranges from three years to seven years.
Note 37 Disclosures under Accounting Standards
37.1 Details of Employee Benefits as required by the Accounting Standard 15 (Revised) Employee benefits are as under:
37.1.a Defined contribution Plan Amount recognised as an expense in the Statement of Profit and Loss in respect of Defined Contribution
Plan is ` 43.72 million (previous year ` 44.23 million)
37.1.b Defined benefit plans
i. Actuarial gains and losses in respect of defined benefit plans are recognised in the Profit & Loss Account.
ii. The Defined Benefit Plans comprise of Gratuity and superannuation.
Gratuity is a benefit to an employee based on 15/20/25/30 days (depending on the grade/ category of the employee and the completed years of service) last drawn salary for each completed year of service.
Superannuation is a benefit to certain employees at ` 1000 / 500 / 250 (depending on the grade/catagory of the employee and the completed years of service) per month for each completed year of service.
Both the plans are funded.
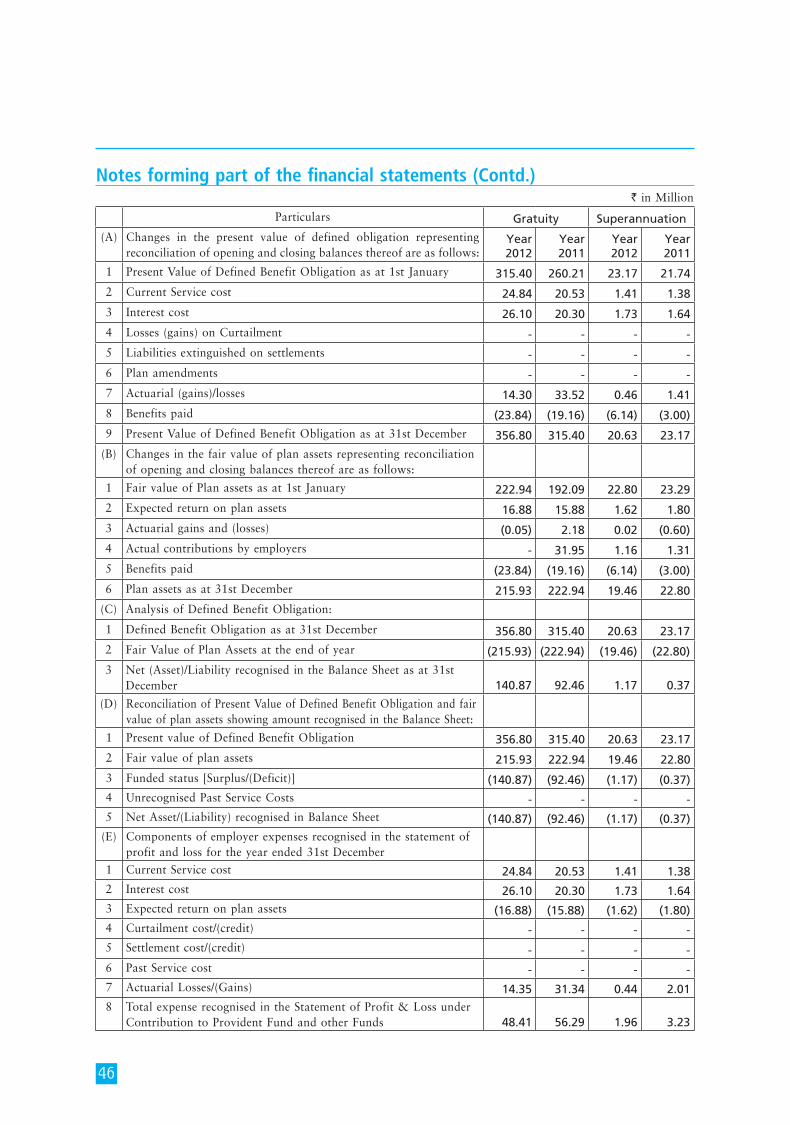
46
` in Million
Particulars Gratuity Superannuation
(A) Changes in the present value of defined obligation representing reconciliation of opening and closing balances thereof are as follows:
Year 2012
Year 2011
Year 2012
Year 2011
1 Present Value of Defined Benefit Obligation as at 1st January 315.40 260.21 23.17 21.74
2 Current Service cost 24.84 20.53 1.41 1.38
3 Interest cost 26.10 20.30 1.73 1.64
4 Losses (gains) on Curtailment - - - -
5 Liabilities extinguished on settlements - - - -
6 Plan amendments - - - -
7 Actuarial (gains)/losses 14.30 33.52 0.46 1.41
8 Benefits paid (23.84) (19.16) (6.14) (3.00)
9 Present Value of Defined Benefit Obligation as at 31st December 356.80 315.40 20.63 23.17
(B) Changes in the fair value of plan assets representing reconciliation of opening and closing balances thereof are as follows:
1 Fair value of Plan assets as at 1st January 222.94 192.09 22.80 23.29
2 Expected return on plan assets 16.88 15.88 1.62 1.80
3 Actuarial gains and (losses) (0.05) 2.18 0.02 (0.60)
4 Actual contributions by employers - 31.95 1.16 1.31
5 Benefits paid (23.84) (19.16) (6.14) (3.00)
6 Plan assets as at 31st December 215.93 222.94 19.46 22.80
(C) Analysis of Defined Benefit Obligation:
1 Defined Benefit Obligation as at 31st December 356.80 315.40 20.63 23.17
2 Fair Value of Plan Assets at the end of year (215.93) (222.94) (19.46) (22.80)
3 Net (Asset)/Liability recognised in the Balance Sheet as at 31st December 140.87 92.46 1.17 0.37
(D) Reconciliation of Present Value of Defined Benefit Obligation and fair value of plan assets showing amount recognised in the Balance Sheet:
1 Present value of Defined Benefit Obligation 356.80 315.40 20.63 23.17
2 Fair value of plan assets 215.93 222.94 19.46 22.80
3 Funded status [Surplus/(Deficit)] (140.87) (92.46) (1.17) (0.37)
4 Unrecognised Past Service Costs - - - -
5 Net Asset/(Liability) recognised in Balance Sheet (140.87) (92.46) (1.17) (0.37)
(E) Components of employer expenses recognised in the statement of profit and loss for the year ended 31st December
1 Current Service cost 24.84 20.53 1.41 1.38
2 Interest cost 26.10 20.30 1.73 1.64
3 Expected return on plan assets (16.88) (15.88) (1.62) (1.80)
4 Curtailment cost/(credit) - - - -
5 Settlement cost/(credit) - - - -
6 Past Service cost - - - -
7 Actuarial Losses/(Gains) 14.35 31.34 0.44 2.01
8 Total expense recognised in the Statement of Profit & Loss under Contribution to Provident Fund and other Funds 48.41 56.29 1.96 3.23
Notes forming part of the financial statements (Contd.)
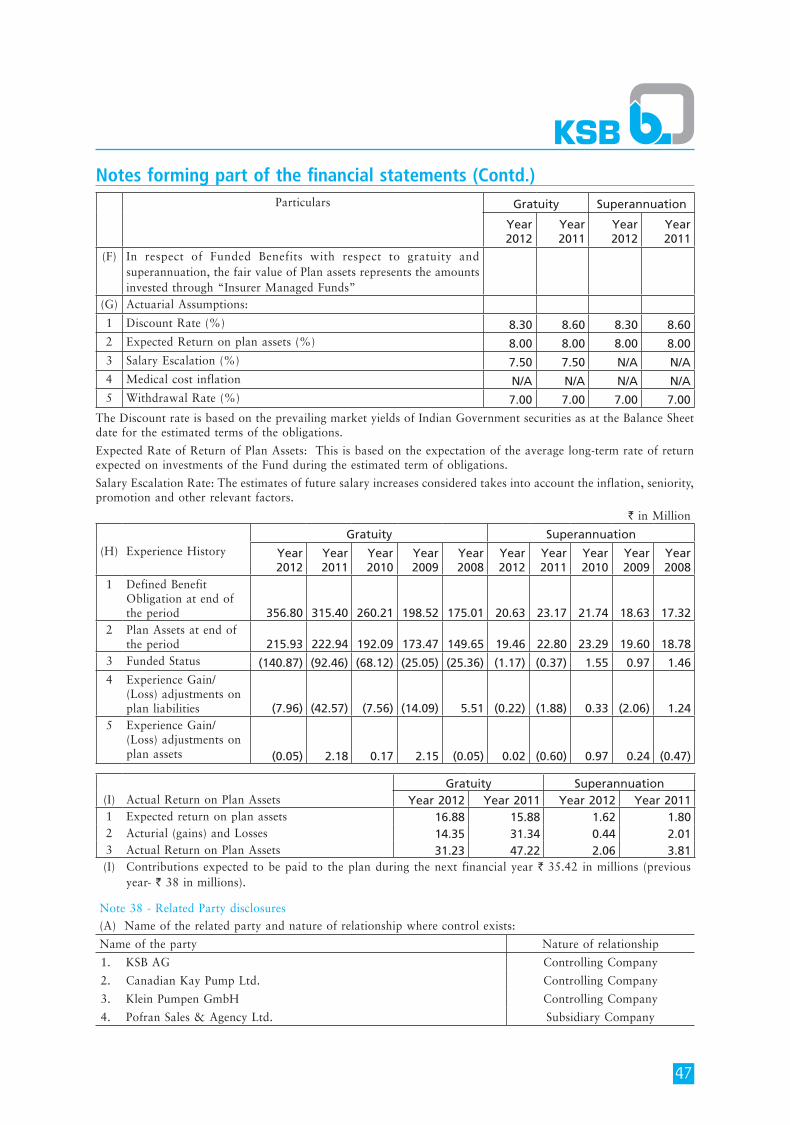
47
Notes forming part of the financial statements (Contd.)Particulars Gratuity Superannuation
Year 2012
Year 2011
Year 2012
Year 2011
(F) In respect of Funded Benefits with respect to gratuity and superannuation, the fair value of Plan assets represents the amounts invested through “Insurer Managed Funds”
(G) Actuarial Assumptions:
1 Discount Rate (%) 8.30 8.60 8.30 8.602 Expected Return on plan assets (%) 8.00 8.00 8.00 8.003 Salary Escalation (%) 7.50 7.50 N/A N/A4 Medical cost inflation N/A N/A N/A N/A5 Withdrawal Rate (%) 7.00 7.00 7.00 7.00
The Discount rate is based on the prevailing market yields of Indian Government securities as at the Balance Sheet date for the estimated terms of the obligations.
Expected Rate of Return of Plan Assets: This is based on the expectation of the average long-term rate of return expected on investments of the Fund during the estimated term of obligations.
Salary Escalation Rate: The estimates of future salary increases considered takes into account the inflation, seniority, promotion and other relevant factors.
` in Million
Gratuity Superannuation(H) Experience History Year
2012Year 2011
Year 2010
Year 2009
Year 2008
Year 2012
Year 2011
Year 2010
Year 2009
Year 2008
1 Defined Benefit Obligation at end of the period 356.80 315.40 260.21 198.52 175.01 20.63 23.17 21.74 18.63 17.32
2 Plan Assets at end of the period 215.93 222.94 192.09 173.47 149.65 19.46 22.80 23.29 19.60 18.78
3 Funded Status (140.87) (92.46) (68.12) (25.05) (25.36) (1.17) (0.37) 1.55 0.97 1.46 4 Experience Gain/
(Loss) adjustments on plan liabilities (7.96) (42.57) (7.56) (14.09) 5.51 (0.22) (1.88) 0.33 (2.06) 1.24
5 Experience Gain/ (Loss) adjustments on plan assets (0.05) 2.18 0.17 2.15 (0.05) 0.02 (0.60) 0.97 0.24 (0.47)
Gratuity Superannuation(I) Actual Return on Plan Assets Year 2012 Year 2011 Year 2012 Year 20111 Expected return on plan assets 16.88 15.88 1.62 1.80 2 Acturial (gains) and Losses 14.35 31.34 0.44 2.01 3 Actual Return on Plan Assets 31.23 47.22 2.06 3.81 (I) Contributions expected to be paid to the plan during the next financial year ` 35.42 in millions (previous
year- ` 38 in millions).
Note 38 - Related Party disclosures(A) Name of the related party and nature of relationship where control exists:
Name of the party Nature of relationship
1. KSB AG Controlling Company
2. Canadian Kay Pump Ltd. Controlling Company
3. Klein Pumpen GmbH Controlling Company
4. Pofran Sales & Agency Ltd. Subsidiary Company
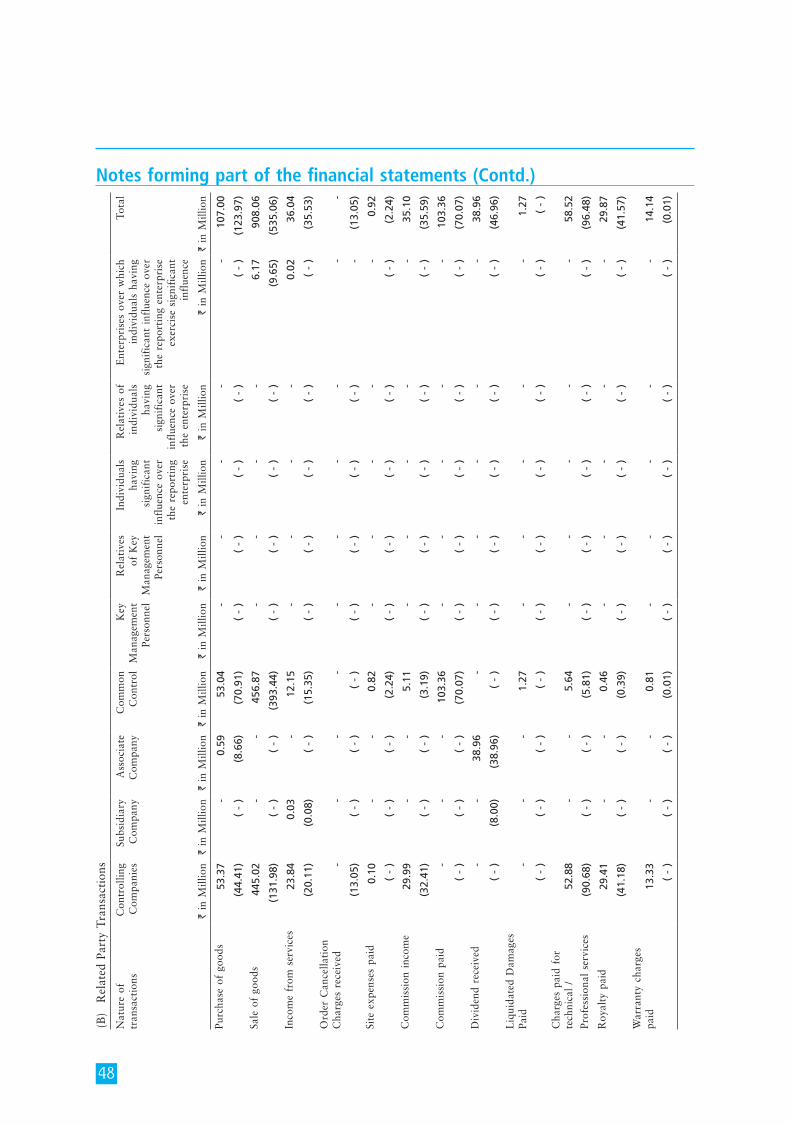
48
(B)
Rel
ated
Par
ty T
rans
acti
ons
Nat
ure
of
tran
sact
ions
Con
trol
ling
Com
pani
esSu
bsid
iary
C
ompa
nyA
ssoc
iate
C
ompa
nyC
omm
on
Con
trol
Key
M
anag
emen
t Pe
rson
nel
Rel
ativ
es
of K
ey
Man
agem
ent
Pers
onne
l
Indi
vidu
als
havi
ng
sign
ific
ant
infl
uenc
e ov
er
the
repo
rtin
g en
terp
rise
Rel
ativ
es o
f in
divi
dual
s ha
ving
si
gnif
ican
t in
flue
nce
over
th
e en
terp
rise
Ent
erpr
ises
ove
r w
hich
in
divi
dual
s ha
ving
si
gnif
ican
t in
flue
nce
over
th
e re
port
ing
ente
rpri
se
exer
cise
sig
nifi
cant
in
flue
nce
Tota
l
` in
Mill
ion
` in
Mill
ion
` in
Mill
ion
` in
Mill
ion
` in
Mill
ion
` in
Mill
ion
` in
Mill
ion
` in
Mill
ion
` in
Mill
ion
` in
Mill
ion
Purc
hase
of
good
s 5
3.37
-
0
.59
53.
04
-
-
-
-
-
107
.00
(44
.41)
( -
)
(8.
66)
(70
.91)
( -
)
( -
)
( -
)
( -
)
( -
)
(12
3.97
)
Sale
of
good
s 4
45.0
2 -
-
4
56.8
7 -
-
-
-
6
.17
908
.06
(13
1.98
) (
- )
(
- )
(
393.
44)
( -
)
( -
)
( -
)
( -
)
(9.
65)
(53
5.06
)
Inco
me
from
ser
vice
s 2
3.84
0
.03
-
12.
15
-
-
-
-
0.0
2 3
6.04
(20
.11)
(0.
08)
( -
)
(15
.35)
( -
)
( -
)
( -
)
( -
)
( -
)
(35
.53)
Ord
er C
ance
llati
on
Cha
rges
rec
eive
d -
-
-
-
-
-
-
-
-
-
(13
.05)
( -
)
( -
)
( -
)
( -
)
( -
)
( -
)
( -
)
-
(13
.05)
Site
exp
ense
s pa
id 0
.10
-
-
0.8
2 -
-
-
-
-
0
.92
( -
)
( -
)
( -
)
(2.
24)
( -
)
( -
)
( -
)
( -
)
( -
)
(2.
24)
Com
mis
sion
inc
ome
29.
99
-
-
5.1
1 -
-
-
-
-
3
5.10
(32
.41)
( -
)
( -
)
(3.
19)
( -
)
( -
)
( -
)
( -
)
( -
)
(35
.59)
Com
mis
sion
pai
d -
-
-
1
03.3
6 -
-
-
-
-
1
03.3
6
( -
)
( -
)
( -
)
(70
.07)
( -
)
( -
)
( -
)
( -
)
( -
)
(70
.07)
Div
iden
d re
ceiv
ed -
-
3
8.96
-
-
-
-
-
-
3
8.96
( -
)
(8.
00)
(38
.96)
( -
)
( -
)
( -
)
( -
)
( -
)
( -
)
(46
.96)
Liq
uida
ted
Dam
ages
Pa
id -
-
-
1
.27
-
-
-
-
-
1.2
7
( -
)
( -
)
( -
)
( -
)
( -
)
( -
)
( -
)
( -
)
( -
)
( -
)
Cha
rges
pai
d fo
r te
chni
cal
/ 5
2.88
-
-
5
.64
-
-
-
-
-
58.
52
Prof
essi
onal
ser
vice
s (
90.6
8) (
- )
(
- )
(
5.81
) (
- )
(
- )
(
- )
(
- )
(
- )
(
96.4
8)
Roy
alty
pai
d 2
9.41
-
-
0
.46
-
-
-
-
-
29.
87
(41
.18)
( -
)
( -
)
(0.
39)
( -
)
( -
)
( -
)
( -
)
( -
)
(41
.57)
War
rant
y ch
arge
s pa
id 1
3.33
-
-
0
.81
-
-
-
-
-
14.
14
( -
)
( -
)
( -
)
(0.
01)
( -
)
( -
)
( -
)
( -
)
( -
)
(0.
01)
Notes forming part of the financial statements (Contd.)
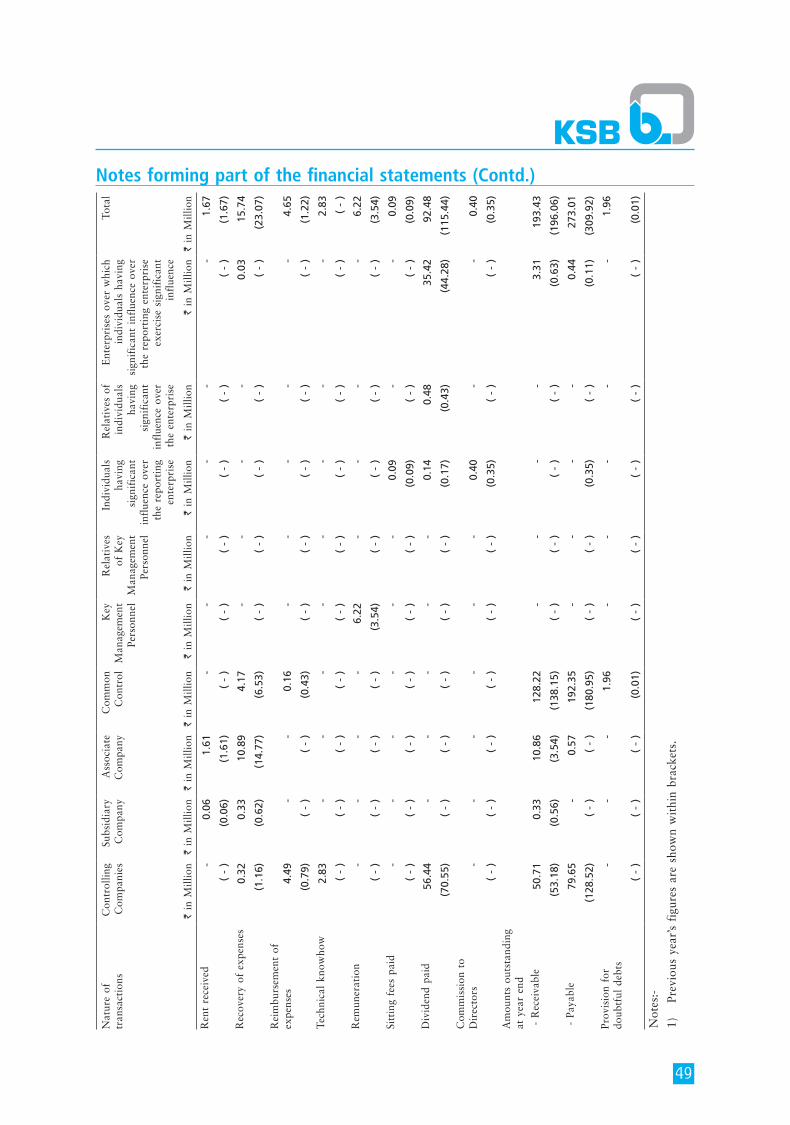
49
Notes forming part of the financial statements (Contd.)
Nat
ure
of
tran
sact
ions
Con
trol
ling
Com
pani
esSu
bsid
iary
C
ompa
nyA
ssoc
iate
C
ompa
nyC
omm
on
Con
trol
Key
M
anag
emen
t Pe
rson
nel
Rel
ativ
es
of K
ey
Man
agem
ent
Pers
onne
l
Indi
vidu
als
havi
ng
sign
ific
ant
infl
uenc
e ov
er
the
repo
rtin
g en
terp
rise
Rel
ativ
es o
f in
divi
dual
s ha
ving
si
gnif
ican
t in
flue
nce
over
th
e en
terp
rise
Ent
erpr
ises
ove
r w
hich
in
divi
dual
s ha
ving
si
gnif
ican
t in
flue
nce
over
th
e re
port
ing
ente
rpri
se
exer
cise
sig
nifi
cant
in
flue
nce
Tota
l
` in
Mill
ion
` in
Mill
ion
` in
Mill
ion
` in
Mill
ion
` in
Mill
ion
` in
Mill
ion
` in
Mill
ion
` in
Mill
ion
` in
Mill
ion
` in
Mill
ion
Ren
t re
ceiv
ed
-
0.0
6 1
.61
-
-
-
-
-
-
1.6
7
( -
)
(0.
06)
(1.
61)
( -
)
( -
)
( -
)
( -
)
( -
)
( -
)
(1.
67)
Rec
over
y of
exp
ense
s 0
.32
0.3
3 1
0.89
4
.17
-
-
-
-
0.0
3 1
5.74
(1.
16)
(0.
62)
(14
.77)
(6.
53)
( -
)
( -
)
( -
)
( -
)
( -
)
(23
.07)
Rei
mbu
rsem
ent
of
expe
nses
4.4
9 -
-
0
.16
-
-
-
-
-
4.6
5
(0.
79)
( -
)
( -
)
(0.
43)
( -
)
( -
)
( -
)
( -
)
( -
)
(1.
22)
Tech
nica
l kn
owho
w 2
.83
-
-
-
-
-
-
-
-
2.8
3
( -
)
( -
)
( -
)
( -
)
( -
)
( -
)
( -
)
( -
)
( -
)
( -
)
Rem
uner
atio
n -
-
-
-
6
.22
-
-
-
-
6.2
2
( -
)
( -
)
( -
)
( -
)
(3.
54)
( -
)
( -
)
( -
)
( -
)
(3.
54)
Sitt
ing
fees
pai
d -
-
-
-
-
-
0
.09
-
-
0.0
9
( -
)
( -
)
( -
)
( -
)
( -
)
( -
)
(0.
09)
( -
)
( -
)
(0.
09)
Div
iden
d pa
id 5
6.44
-
-
-
-
-
0
.14
0.4
8 3
5.42
9
2.48
(70
.55)
( -
)
( -
)
( -
)
( -
)
( -
)
(0.
17)
(0.
43)
(44
.28)
(11
5.44
)
Com
mis
sion
to
Dir
ecto
rs -
-
-
-
-
-
0
.40
-
-
0.4
0
( -
)
( -
)
( -
)
( -
)
( -
)
( -
)
(0.
35)
( -
)
( -
)
(0.
35)
Am
ount
s ou
tsta
ndin
g at
yea
r en
d
- R
ecei
vabl
e 5
0.71
0
.33
10.
86
128
.22
-
-
-
-
3.3
1 1
93.4
3
(53
.18)
(0.
56)
(3.
54)
(13
8.15
) (
- )
(
- )
(
- )
(
- )
(
0.63
) (
196.
06)
- P
ayab
le 7
9.65
-
0
.57
192
.35
-
-
-
-
0.4
4 2
73.0
1
(12
8.52
) (
- )
(
- )
(
180.
95)
( -
)
( -
)
(0.
35)
( -
)
(0.
11)
(30
9.92
)
Prov
isio
n fo
r do
ubtf
ul d
ebts
-
-
-
1.9
6 -
-
-
-
-
1
.96
( -
)
( -
)
( -
)
(0.
01)
( -
)
( -
)
( -
)
( -
)
( -
)
(0.
01)
Not
es:-
1)
Prev
ious
yea
r’s
figu
res
are
show
n w
ithi
n br
acke
ts.

50
2)
The
rel
ated
par
ties
inc
lude
d in
the
var
ious
cat
egor
ies
abov
e, w
here
tra
nsac
tion
s ha
ve t
aken
pla
ce a
re g
iven
bel
ow:
Con
trol
ling
Com
pani
esK
SB A
GC
anad
ian
Kay
Pum
p L
td.
Ass
ocia
te C
ompa
nyM
IL C
ontr
ols
Ltd
.Su
bsid
iary
Com
pany
Pofr
an S
ales
& A
genc
y L
td.
Com
mon
Con
trol
KSB
S.A
.K
SB I
nc.,
USA
KSB
Pum
ps (
S.A
.) (
Pty.
) L
td.,
Sout
h A
fric
aK
SB A
ustr
alia
KSB
Chi
le S
.A.
KSB
Sin
gapo
re (
Asi
a Pa
cifi
c) P
TE
Ltd
., Si
ngap
ore
KSB
Lim
ited
, H
ongk
ong
KSB
Pum
ps C
o. L
td.,
Tha
iland
P.T.
KSB
., In
done
sia
KSB
Tai
wan
Co.
, L
td.
KSB
Ltd
., To
kyo
KSB
Bra
zil
KSB
Kor
ea
KSB
Mex
ico
KSB
Ned
erla
ndD
P In
dust
ries
B.V
., N
eder
land
KSB
Pum
ps A
rabi
a L
td.
KSB
Ltd
., U
.K.
KSB
Ita
lia S
.p.A
., It
aly
KSB
Pom
pa T
urke
yK
SB S
hang
hai
Pum
p C
o. L
td.,
Chi
naK
SB V
alve
s (S
hang
hai)
Co.
Ltd
., C
hina
Mer
cant
ile-K
SB O
y A
B,
Finl
and
KSB
Pak
ista
nD
elia
n K
SB A
mri
Val
ves
Co.
Ltd
., C
hina
Bom
bas
ITU
R S
.A.,
Spai
nK
SB T
ESM
A S
.A.,
Gri
eche
nlan
dK
SB T
ech.
Pvt
. L
td.,
Indi
aG
IW I
ndus
trie
s In
c.,
USA
KSB
Mid
dle
Eas
t FZ
E,
Dub
ai
Notes forming part of the financial statements (Contd.)
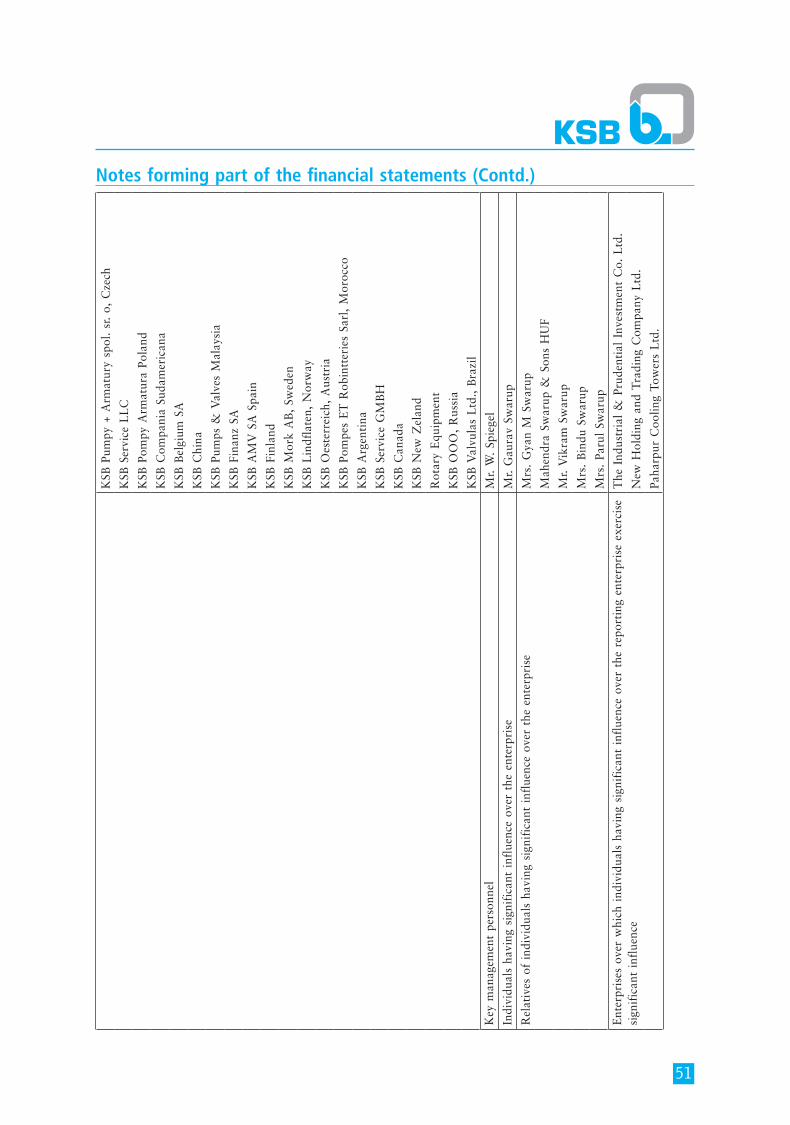
51
KSB
Pum
py +
Arm
atur
y sp
ol.
sr.
o, C
zech
KSB
Ser
vice
LL
C
KSB
Pom
py A
rmat
ura
Pola
nd
KSB
Com
pani
a Su
dam
eric
ana
KSB
Bel
gium
SA
KSB
Chi
na
KSB
Pum
ps &
Val
ves
Mal
aysi
a
KSB
Fin
anz
SA
KSB
AM
V S
A S
pain
KSB
Fin
land
KSB
Mor
k A
B,
Swed
en
KSB
Lin
dfla
ten,
Nor
way
KSB
Oes
terr
eich
, A
ustr
ia
KSB
Pom
pes
ET
Rob
intt
erie
s Sa
rl,
Mor
occo
KSB
Arg
enti
na
KSB
Ser
vice
GM
BH
KSB
Can
ada
KSB
New
Zel
and
Rot
ary
Equ
ipm
ent
KSB
OO
O,
Rus
sia
KSB
Val
vula
s L
td.,
Bra
zil
Key
man
agem
ent
pers
onne
lM
r. W
. Sp
iege
lIn
divi
dual
s ha
ving
sig
nifi
cant
inf
luen
ce o
ver
the
ente
rpri
seM
r. G
aura
v Sw
arup
Rel
ativ
es o
f in
divi
dual
s ha
ving
sig
nifi
cant
inf
luen
ce o
ver
the
ente
rpri
seM
rs.
Gya
n M
Sw
arup
Mah
endr
a Sw
arup
& S
ons
HU
F
Mr.
Vik
ram
Sw
arup
Mrs
. B
indu
Sw
arup
Mrs
. Pa
rul
Swar
upE
nter
pris
es o
ver
whi
ch i
ndiv
idua
ls h
avin
g si
gnif
ican
t in
flue
nce
over
the
rep
orti
ng e
nter
pris
e ex
erci
se
sign
ific
ant
infl
uenc
e T
he I
ndus
tria
l &
Pru
dent
ial
Inve
stm
ent
Co.
Ltd
.
New
Hol
ding
and
Tra
ding
Com
pany
Ltd
.
Paha
rpur
Coo
ling
Tow
ers
Ltd
.
Notes forming part of the financial statements (Contd.)
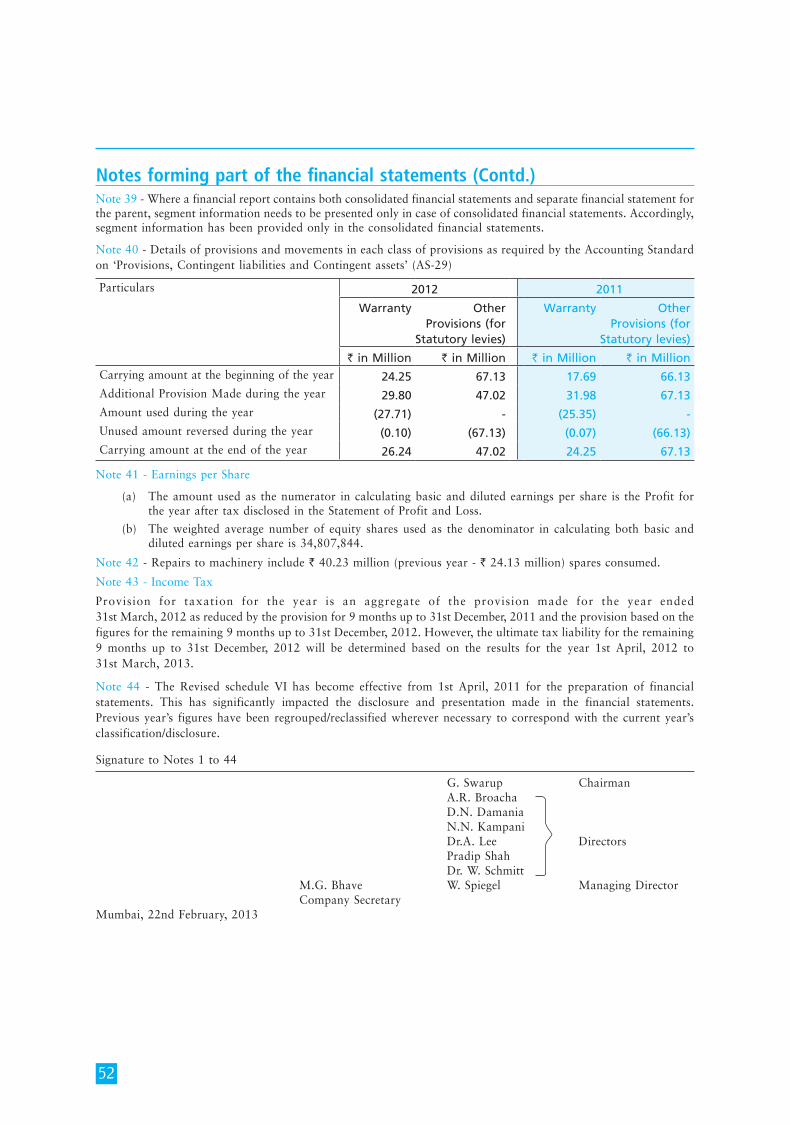
52
Note 39 - Where a financial report contains both consolidated financial statements and separate financial statement for the parent, segment information needs to be presented only in case of consolidated financial statements. Accordingly, segment information has been provided only in the consolidated financial statements.
Note 40 - Details of provisions and movements in each class of provisions as required by the Accounting Standard on ‘Provisions, Contingent liabilities and Contingent assets’ (AS-29)
Particulars 2012 2011
Warranty Other Provisions (for
Statutory levies)
Warranty Other Provisions (for
Statutory levies)
` in Million ` in Million ` in Million ` in MillionCarrying amount at the beginning of the year 24.25 67.13 17.69 66.13 Additional Provision Made during the year 29.80 47.02 31.98 67.13 Amount used during the year (27.71) - (25.35) - Unused amount reversed during the year (0.10) (67.13) (0.07) (66.13)Carrying amount at the end of the year 26.24 47.02 24.25 67.13
Note 41 - Earnings per Share
(a) The amount used as the numerator in calculating basic and diluted earnings per share is the Profit for the year after tax disclosed in the Statement of Profit and Loss.
(b) The weighted average number of equity shares used as the denominator in calculating both basic and diluted earnings per share is 34,807,844.
Note 42 - Repairs to machinery include ` 40.23 million (previous year - ` 24.13 million) spares consumed.
Note 43 - Income Tax
Provision for taxation for the year is an aggregate of the provision made for the year ended 31st March, 2012 as reduced by the provision for 9 months up to 31st December, 2011 and the provision based on the figures for the remaining 9 months up to 31st December, 2012. However, the ultimate tax liability for the remaining 9 months up to 31st December, 2012 will be determined based on the results for the year 1st April, 2012 to 31st March, 2013.
Note 44 - The Revised schedule VI has become effective from 1st April, 2011 for the preparation of financial statements. This has significantly impacted the disclosure and presentation made in the financial statements. Previous year’s figures have been regrouped/reclassified wherever necessary to correspond with the current year’s classification/disclosure.
Notes forming part of the financial statements (Contd.)
Signature to Notes 1 to 44
G. Swarup Chairman A.R. Broacha D.N. Damania N.N. Kampani Dr.A. Lee Directors Pradip Shah Dr. W. Schmitt M.G. Bhave W. Spiegel Managing Director Company Secretary Mumbai, 22nd February, 2013
53
AUDITORS’ REPORT CONSOLIDATED
The Board of Directors,KSB Pumps Limited.126, Maker Chambers III,Nariman Point, Mumbai 400021.
REPORT ON CONSOLIDATED FINANCIAL STATEMENTS OF KSB PUMPS LIMITED AND ITS SUBSIDIARY
We have audited the attached Consolidated Balance Sheet of KSB Pumps Limited (“the Company”) and its subsidiary (the Company and its subsidiary constitute “the Group”) as at 31st December, 2012, the Consolidated Statement of Profit and Loss and the Consolidated Cash Flow Statement of the Group for the year ended on that date, both annexed thereto. The Consolidated Financial Statements include investment in an associate accounted on the equity method in accordance with Accounting Standard 23 (Accounting for Investments in Associates in Consolidated Financial Statements) as notified under the Companies (Accounting Standards) Rules, 2006. These financial statements are the responsibility of the Company’s Management and have been prepared by the management on the basis of separate financial statements and other financial information regarding components. Our responsibility is to express an opinion on these Consolidated Financial Statements based on our audit.
We conducted our audit in accordance with auditing standards generally accepted in India. Those standards require that we plan and perform the audit to obtain reasonable assurance about whether the financial statements are free of material misstatement. An audit includes examining, on a test basis, evidence supporting the amounts and disclosures in the financial statements. An audit also includes assessing the accounting principles used and significant estimates made by management, as well as evaluating the overall financial statements presentation. We believe that our audit provides a reasonable basis for our opinion.
We did not audit the financial statements of Pofran Sales and Agency Limited, a subsidiary,
whose financial statements reflect total assets of ` 51,348,320 as at 31st December, 2012, the total revenues of ` 18,596,810 and cash flows amounting to ` 5,053,080 for the year then ended. These financial statements and other financial information have been audited by other auditors whose report has been furnished to us, and our opinion is based solely on the report of the other auditors.
We report that the Consolidated Financial Statements have been prepared by the Company in accordance with the requirements of Accounting Standard (AS) 21, Consolidated financial statements and Accounting Standard (AS) 23, Accounting for Investments in Associates in Consolidated Financial Statement.
Based on our audit and on consideration of reports of other auditors on separate financial statements and on the other financial information of the components, and to the best of our information and according to the explanations given to us, we are of the opinion that the attached consolidated financial statements give a true and fair view in conformity with the accounting principles generally accepted in India:
(a) in the case of the Consolidated Balance Sheet, of the state of affairs of KSB Pumps Limited and its subsidiary as at 31st December, 2012;
(b) in the case of the Consolidated Statement of Profit and Loss, of the profit for the year ended on that date; and
(c) in the case of the Consolidated Cash Flow Statement, of the cash flows for the year ended on that date.
For Deloitte Haskins & SellsChartered Accountants
Registration No.: 117366W
Hemant M. Joshi Partner Membership No.: 038019
Pune, 22nd February, 2013
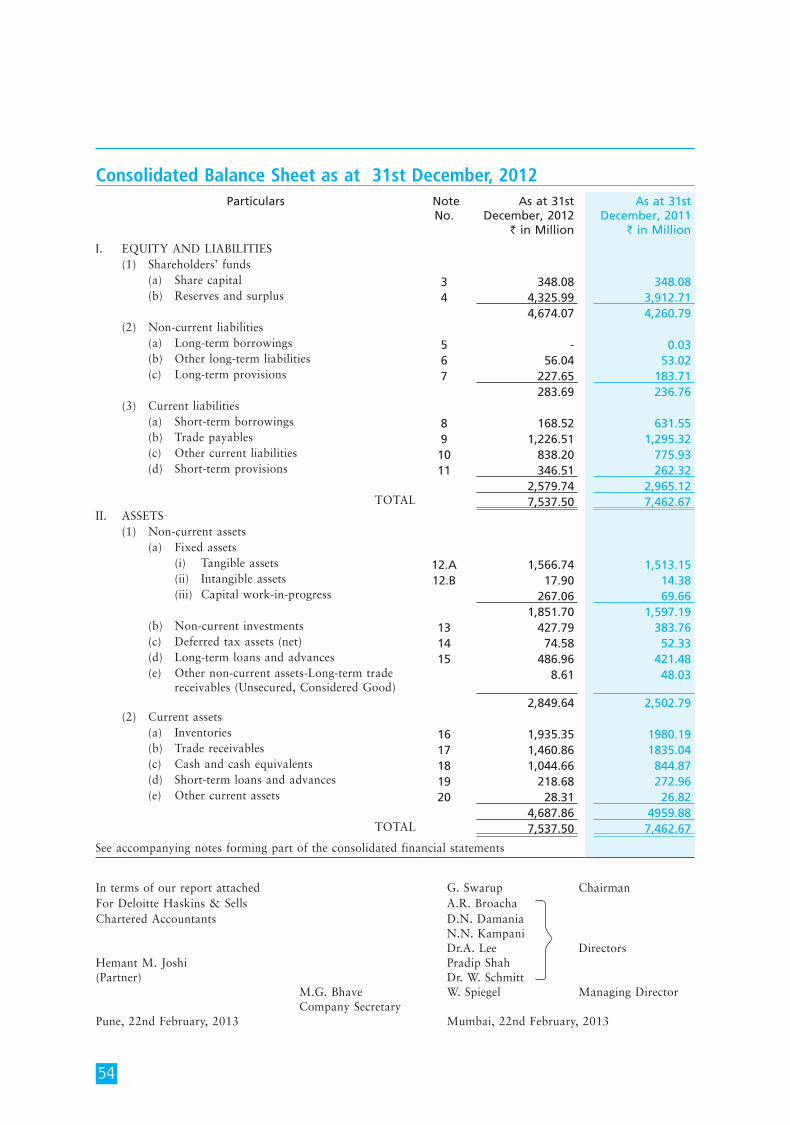
54
Consolidated Balance Sheet as at 31st December, 2012Particulars Note
No. As at 31st
December, 2012 ` in Million
As at 31st December, 2011
` in Million
I. EQUITY AND LIABILITIES (1) Shareholders’ funds
(a) Share capital 3 348.08 348.08 (b) Reserves and surplus 4 4,325.99 3,912.71
4,674.07 4,260.79 (2) Non-current liabilities (a) Long-term borrowings 5 - 0.03 (b) Other long-term liabilities 6 56.04 53.02 (c) Long-term provisions 7 227.65 183.71
283.69 236.76 (3) Current liabilities
(a) Short-term borrowings 8 168.52 631.55 (b) Trade payables 9 1,226.51 1,295.32 (c) Other current liabilities 10 838.20 775.93 (d) Short-term provisions 11 346.51 262.32
2,579.74 2,965.12 TOTAL 7,537.50 7,462.67
II. ASSETS (1) Non-current assets
(a) Fixed assets (i) Tangible assets 12.A 1,566.74 1,513.15 (ii) Intangible assets 12.B 17.90 14.38 (iii) Capital work-in-progress 267.06 69.66
1,851.70 1,597.19 (b) Non-current investments 13 427.79 383.76 (c) Deferred tax assets (net) 14 74.58 52.33 (d) Long-term loans and advances 15 486.96 421.48 (e) Other non-current assets-Long-term trade
receivables (Unsecured, Considered Good) 8.61 48.03
2,849.64 2,502.79 (2) Current assets
(a) Inventories 16 1,935.35 1980.19 (b) Trade receivables 17 1,460.86 1835.04 (c) Cash and cash equivalents 18 1,044.66 844.87 (d) Short-term loans and advances 19 218.68 272.96 (e) Other current assets 20 28.31 26.82
4,687.86 4959.88TOTAL 7,537.50 7,462.67
See accompanying notes forming part of the consolidated financial statements
In terms of our report attached G. Swarup ChairmanFor Deloitte Haskins & Sells A.R. Broacha Chartered Accountants D.N. Damania N.N. Kampani Dr.A. Lee DirectorsHemant M. Joshi Pradip Shah (Partner) Dr. W. Schmitt M.G. Bhave W. Spiegel Managing Director Company Secretary Pune, 22nd February, 2013 Mumbai, 22nd February, 2013
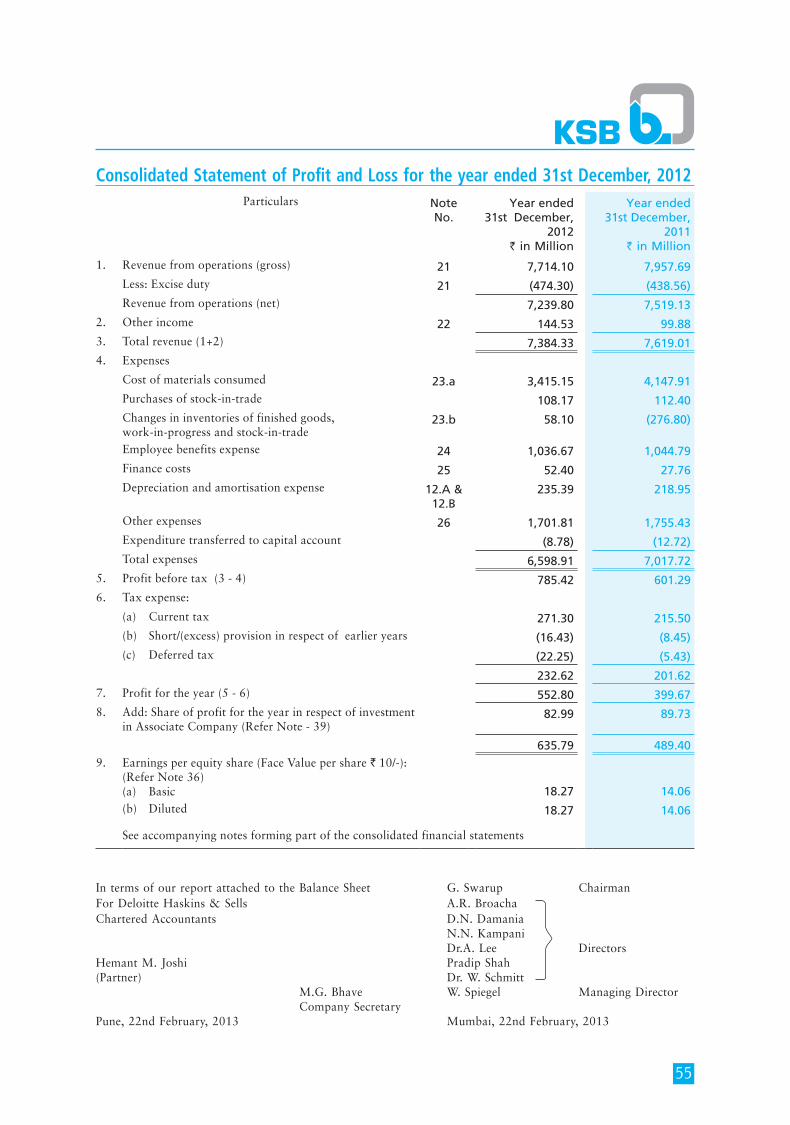
55
Consolidated Statement of Profit and Loss for the year ended 31st December, 2012Particulars Note
No.Year ended
31st December, 2012
` in Million
Year ended 31st December,
2011` in Million
1. Revenue from operations (gross) 21 7,714.10 7,957.69 Less: Excise duty 21 (474.30) (438.56)Revenue from operations (net) 7,239.80 7,519.13
2. Other income 22 144.53 99.88 3. Total revenue (1+2) 7,384.33 7,619.01 4. Expenses
Cost of materials consumed 23.a 3,415.15 4,147.91 Purchases of stock-in-trade 108.17 112.40 Changes in inventories of finished goods, work-in-progress and stock-in-trade
23.b 58.10 (276.80)
Employee benefits expense 24 1,036.67 1,044.79 Finance costs 25 52.40 27.76 Depreciation and amortisation expense 12.A &
12.B 235.39 218.95
Other expenses 26 1,701.81 1,755.43 Expenditure transferred to capital account (8.78) (12.72)Total expenses 6,598.91 7,017.72
5. Profit before tax (3 - 4) 785.42 601.29 6. Tax expense:
(a) Current tax 271.30 215.50 (b) Short/(excess) provision in respect of earlier years (16.43) (8.45)(c) Deferred tax (22.25) (5.43)
232.62 201.62 7. Profit for the year (5 - 6) 552.80 399.67 8. Add: Share of profit for the year in respect of investment
in Associate Company (Refer Note - 39) 82.99 89.73
635.79 489.40 9. Earnings per equity share (Face Value per share ` 10/-):
(Refer Note 36) (a) Basic 18.27 14.06 (b) Diluted 18.27 14.06
See accompanying notes forming part of the consolidated financial statements
In terms of our report attached to the Balance Sheet G. Swarup ChairmanFor Deloitte Haskins & Sells A.R. Broacha Chartered Accountants D.N. Damania N.N. Kampani Dr.A. Lee DirectorsHemant M. Joshi Pradip Shah (Partner) Dr. W. Schmitt M.G. Bhave W. Spiegel Managing Director Company Secretary Pune, 22nd February, 2013 Mumbai, 22nd February, 2013
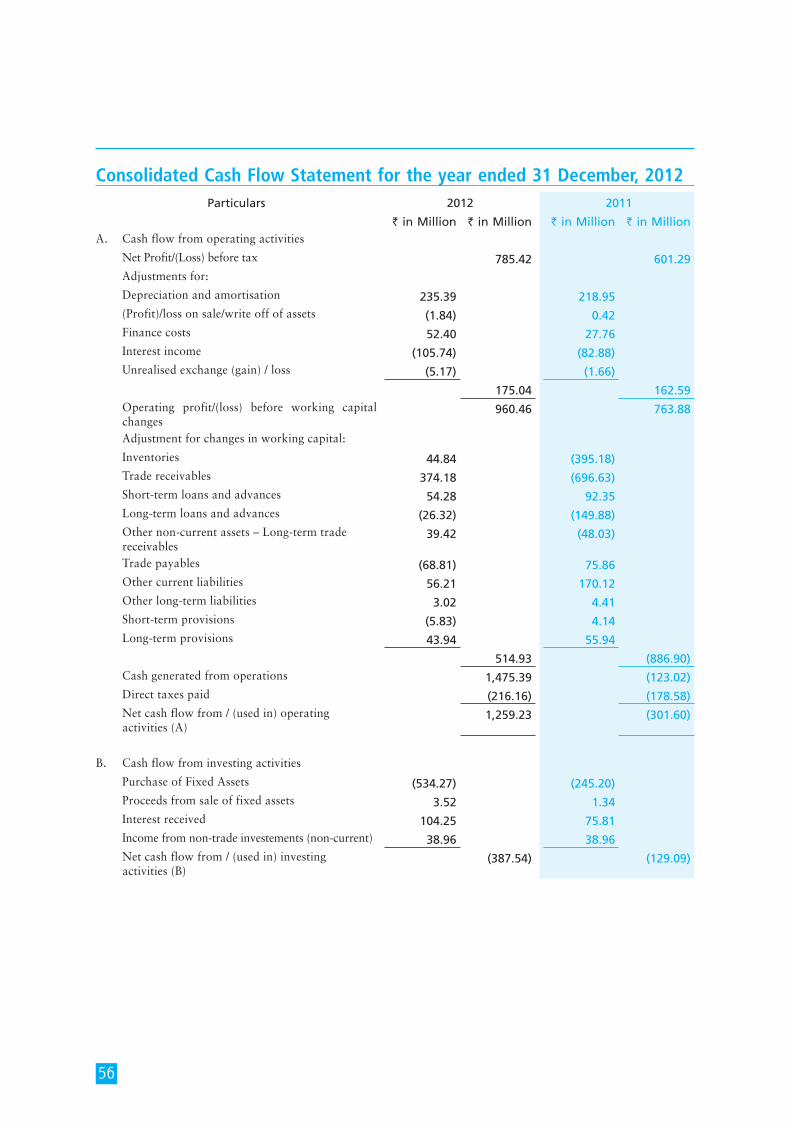
56
Consolidated Cash Flow Statement for the year ended 31 December, 2012Particulars 2012 2011
` in Million ` in Million ` in Million ` in Million A. Cash flow from operating activities
Net Profit/(Loss) before tax 785.42 601.29 Adjustments for:
Depreciation and amortisation 235.39 218.95 (Profit)/loss on sale/write off of assets (1.84) 0.42 Finance costs 52.40 27.76 Interest income (105.74) (82.88) Unrealised exchange (gain) / loss (5.17) (1.66)
175.04 162.59 Operating profit/(loss) before working capital
changes 960.46 763.88
Adjustment for changes in working capital:
Inventories 44.84 (395.18) Trade receivables 374.18 (696.63) Short-term loans and advances 54.28 92.35 Long-term loans and advances (26.32) (149.88) Other non-current assets – Long-term trade
receivables39.42 (48.03)
Trade payables (68.81) 75.86 Other current liabilities 56.21 170.12 Other long-term liabilities 3.02 4.41 Short-term provisions (5.83) 4.14 Long-term provisions 43.94 55.94
514.93 (886.90) Cash generated from operations 1,475.39 (123.02) Direct taxes paid (216.16) (178.58) Net cash flow from / (used in) operating
activities (A) 1,259.23 (301.60)
B. Cash flow from investing activities
Purchase of Fixed Assets (534.27) (245.20) Proceeds from sale of fixed assets 3.52 1.34 Interest received 104.25 75.81 Income from non-trade investements (non-current) 38.96 38.96 Net cash flow from / (used in) investing
activities (B)(387.54) (129.09)
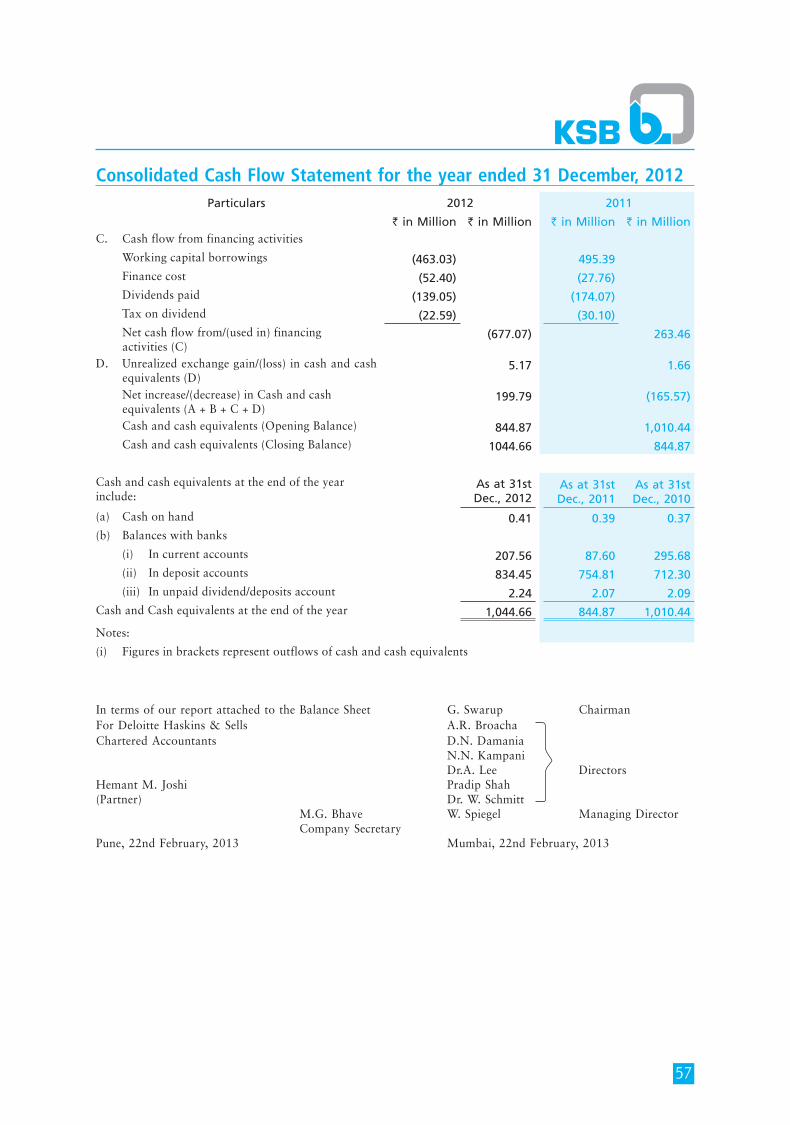
57
Consolidated Cash Flow Statement for the year ended 31 December, 2012Particulars 2012 2011
` in Million ` in Million ` in Million ` in Million C. Cash flow from financing activities
Working capital borrowings (463.03) 495.39 Finance cost (52.40) (27.76) Dividends paid (139.05) (174.07) Tax on dividend (22.59) (30.10) Net cash flow from/(used in) financing
activities (C)(677.07) 263.46
D. Unrealized exchange gain/(loss) in cash and cash equivalents (D)
5.17 1.66
Net increase/(decrease) in Cash and cash equivalents (A + B + C + D)
199.79 (165.57)
Cash and cash equivalents (Opening Balance) 844.87 1,010.44 Cash and cash equivalents (Closing Balance) 1044.66 844.87
Cash and cash equivalents at the end of the year include:
As at 31st Dec., 2012
As at 31st Dec., 2011
As at 31st Dec., 2010
(a) Cash on hand 0.41 0.39 0.37 (b) Balances with banks
(i) In current accounts 207.56 87.60 295.68 (ii) In deposit accounts 834.45 754.81 712.30 (iii) In unpaid dividend/deposits account 2.24 2.07 2.09 Cash and Cash equivalents at the end of the year 1,044.66 844.87 1,010.44
Notes:
(i) Figures in brackets represent outflows of cash and cash equivalents
In terms of our report attached to the Balance Sheet G. Swarup ChairmanFor Deloitte Haskins & Sells A.R. Broacha Chartered Accountants D.N. Damania N.N. Kampani Dr.A. Lee DirectorsHemant M. Joshi Pradip Shah (Partner) Dr. W. Schmitt M.G. Bhave W. Spiegel Managing Director Company Secretary Pune, 22nd February, 2013 Mumbai, 22nd February, 2013
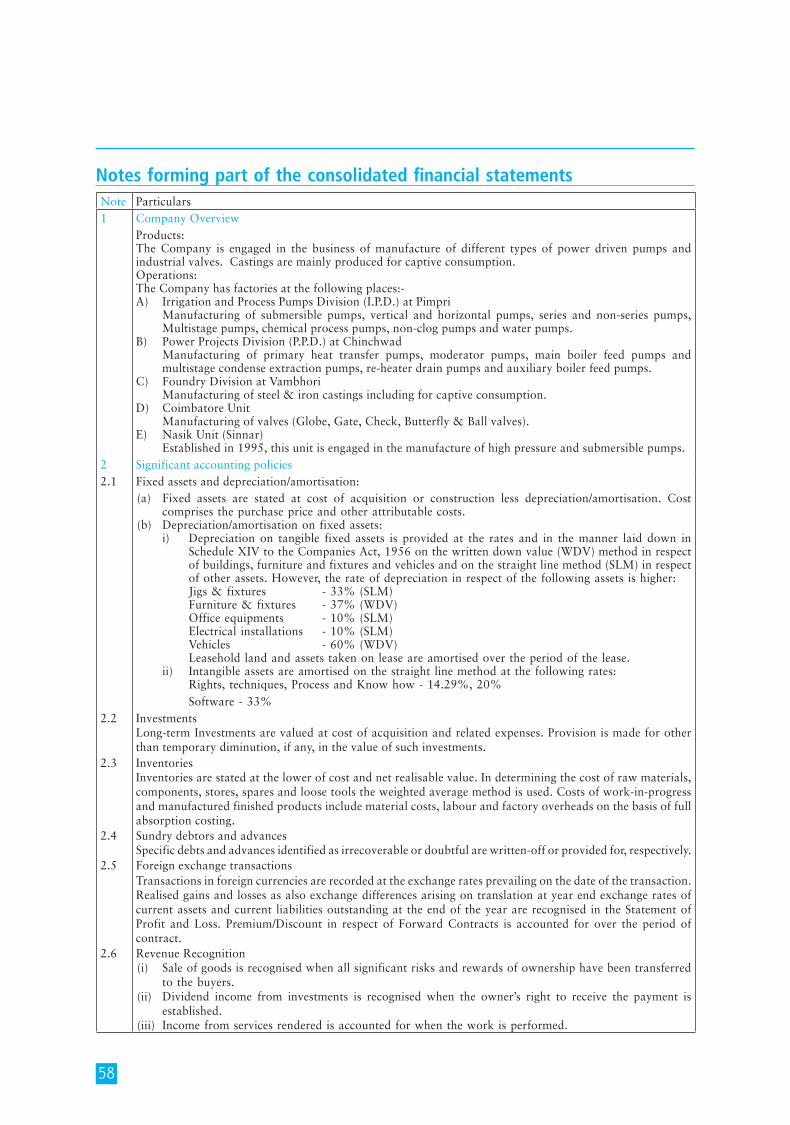
58
Notes forming part of the consolidated financial statementsNote Particulars1 Company Overview
Products:The Company is engaged in the business of manufacture of different types of power driven pumps and industrial valves. Castings are mainly produced for captive consumption. Operations:The Company has factories at the following places:-A) Irrigation and Process Pumps Division (I.P.D.) at Pimpri Manufacturing of submersible pumps, vertical and horizontal pumps, series and non-series pumps,
Multistage pumps, chemical process pumps, non-clog pumps and water pumps.B) Power Projects Division (P.P.D.) at Chinchwad Manufacturing of primary heat transfer pumps, moderator pumps, main boiler feed pumps and
multistage condense extraction pumps, re-heater drain pumps and auxiliary boiler feed pumps. C) Foundry Division at Vambhori Manufacturing of steel & iron castings including for captive consumption. D) Coimbatore Unit Manufacturing of valves (Globe, Gate, Check, Butterfly & Ball valves). E) Nasik Unit (Sinnar) Established in 1995, this unit is engaged in the manufacture of high pressure and submersible pumps.
2 Significant accounting policies2.1 Fixed assets and depreciation/amortisation:
(a) Fixed assets are stated at cost of acquisition or construction less depreciation/amortisation. Cost comprises the purchase price and other attributable costs.
(b) Depreciation/amortisation on fixed assets: i) Depreciation on tangible fixed assets is provided at the rates and in the manner laid down in
Schedule XIV to the Companies Act, 1956 on the written down value (WDV) method in respect of buildings, furniture and fixtures and vehicles and on the straight line method (SLM) in respect of other assets. However, the rate of depreciation in respect of the following assets is higher:
Jigs & fixtures - 33% (SLM) Furniture & fixtures - 37% (WDV) Office equipments - 10% (SLM) Electrical installations - 10% (SLM) Vehicles - 60% (WDV) Leasehold land and assets taken on lease are amortised over the period of the lease. ii) Intangible assets are amortised on the straight line method at the following rates: Rights, techniques, Process and Know how - 14.29%, 20% Software - 33%
2.2 InvestmentsLong-term Investments are valued at cost of acquisition and related expenses. Provision is made for other than temporary diminution, if any, in the value of such investments.
2.3 InventoriesInventories are stated at the lower of cost and net realisable value. In determining the cost of raw materials, components, stores, spares and loose tools the weighted average method is used. Costs of work-in-progress and manufactured finished products include material costs, labour and factory overheads on the basis of full absorption costing.
2.4 Sundry debtors and advancesSpecific debts and advances identified as irrecoverable or doubtful are written-off or provided for, respectively.
2.5 Foreign exchange transactionsTransactions in foreign currencies are recorded at the exchange rates prevailing on the date of the transaction. Realised gains and losses as also exchange differences arising on translation at year end exchange rates of current assets and current liabilities outstanding at the end of the year are recognised in the Statement of Profit and Loss. Premium/Discount in respect of Forward Contracts is accounted for over the period of contract.
2.6 Revenue Recognition(i) Sale of goods is recognised when all significant risks and rewards of ownership have been transferred
to the buyers. (ii) Dividend income from investments is recognised when the owner’s right to receive the payment is
established. (iii) Income from services rendered is accounted for when the work is performed.
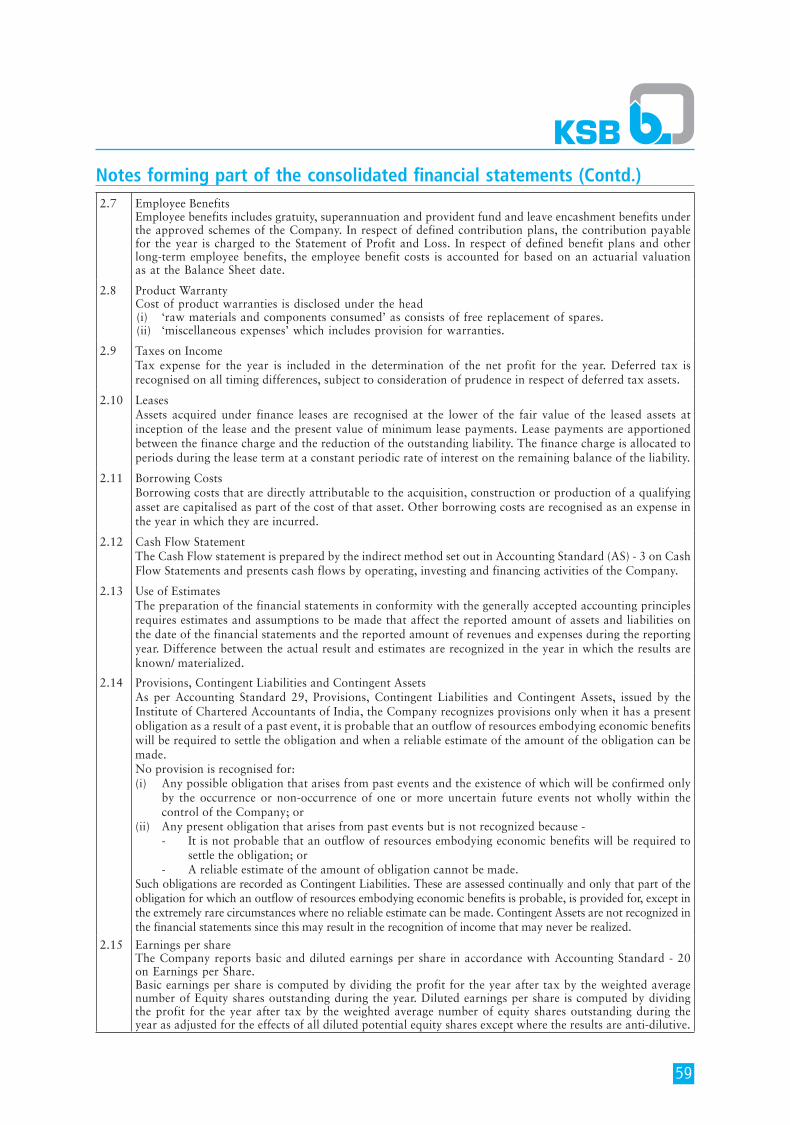
59
Notes forming part of the consolidated financial statements (Contd.)2.7 Employee Benefits
Employee benefits includes gratuity, superannuation and provident fund and leave encashment benefits under the approved schemes of the Company. In respect of defined contribution plans, the contribution payable for the year is charged to the Statement of Profit and Loss. In respect of defined benefit plans and other long-term employee benefits, the employee benefit costs is accounted for based on an actuarial valuation as at the Balance Sheet date.
2.8 Product WarrantyCost of product warranties is disclosed under the head (i) ‘raw materials and components consumed’ as consists of free replacement of spares. (ii) ‘miscellaneous expenses’ which includes provision for warranties.
2.9 Taxes on IncomeTax expense for the year is included in the determination of the net profit for the year. Deferred tax is recognised on all timing differences, subject to consideration of prudence in respect of deferred tax assets.
2.10 LeasesAssets acquired under finance leases are recognised at the lower of the fair value of the leased assets at inception of the lease and the present value of minimum lease payments. Lease payments are apportioned between the finance charge and the reduction of the outstanding liability. The finance charge is allocated to periods during the lease term at a constant periodic rate of interest on the remaining balance of the liability.
2.11 Borrowing CostsBorrowing costs that are directly attributable to the acquisition, construction or production of a qualifying asset are capitalised as part of the cost of that asset. Other borrowing costs are recognised as an expense in the year in which they are incurred.
2.12 Cash Flow StatementThe Cash Flow statement is prepared by the indirect method set out in Accounting Standard (AS) - 3 on Cash Flow Statements and presents cash flows by operating, investing and financing activities of the Company.
2.13 Use of EstimatesThe preparation of the financial statements in conformity with the generally accepted accounting principles requires estimates and assumptions to be made that affect the reported amount of assets and liabilities on the date of the financial statements and the reported amount of revenues and expenses during the reporting year. Difference between the actual result and estimates are recognized in the year in which the results are known/ materialized.
2.14 Provisions, Contingent Liabilities and Contingent AssetsAs per Accounting Standard 29, Provisions, Contingent Liabilities and Contingent Assets, issued by the Institute of Chartered Accountants of India, the Company recognizes provisions only when it has a present obligation as a result of a past event, it is probable that an outflow of resources embodying economic benefits will be required to settle the obligation and when a reliable estimate of the amount of the obligation can be made.No provision is recognised for: (i) Any possible obligation that arises from past events and the existence of which will be confirmed only
by the occurrence or non-occurrence of one or more uncertain future events not wholly within the control of the Company; or
(ii) Any present obligation that arises from past events but is not recognized because - - It is not probable that an outflow of resources embodying economic benefits will be required to
settle the obligation; or - A reliable estimate of the amount of obligation cannot be made.Such obligations are recorded as Contingent Liabilities. These are assessed continually and only that part of the obligation for which an outflow of resources embodying economic benefits is probable, is provided for, except in the extremely rare circumstances where no reliable estimate can be made. Contingent Assets are not recognized in the financial statements since this may result in the recognition of income that may never be realized.
2.15 Earnings per shareThe Company reports basic and diluted earnings per share in accordance with Accounting Standard - 20 on Earnings per Share.Basic earnings per share is computed by dividing the profit for the year after tax by the weighted average number of Equity shares outstanding during the year. Diluted earnings per share is computed by dividing the profit for the year after tax by the weighted average number of equity shares outstanding during the year as adjusted for the effects of all diluted potential equity shares except where the results are anti-dilutive.
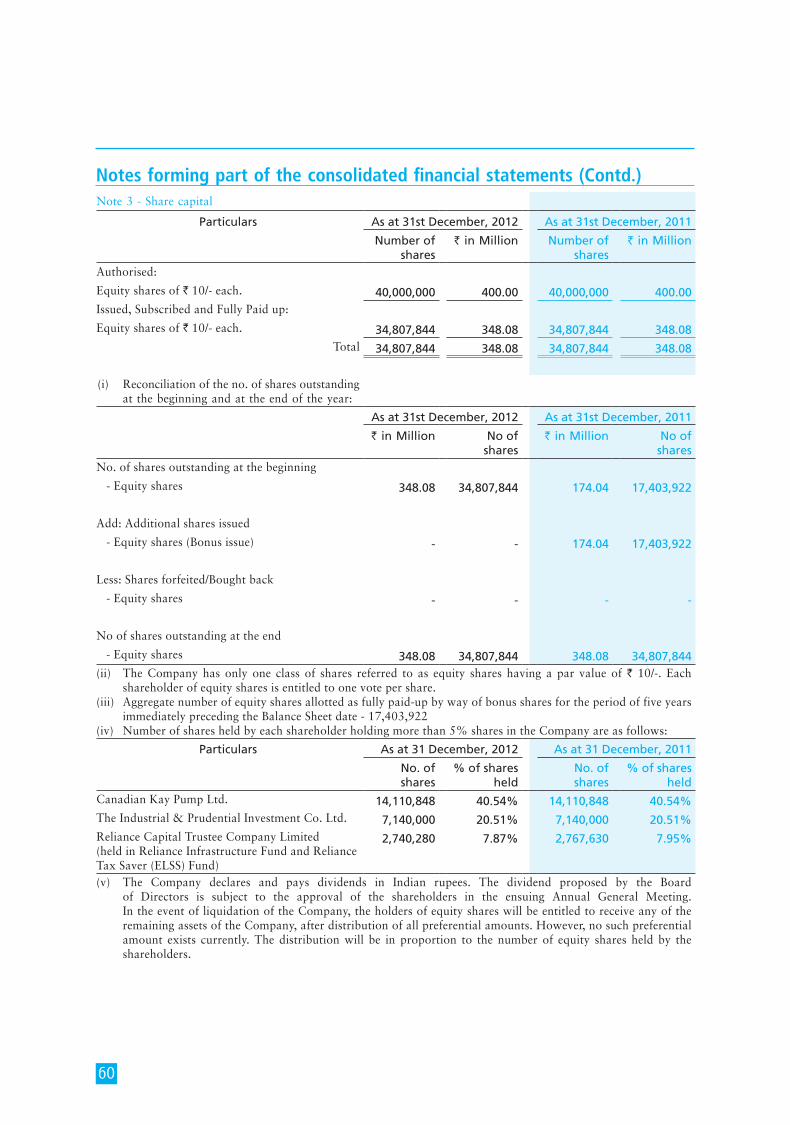
60
Notes forming part of the consolidated financial statements (Contd.)Note 3 - Share capital
Particulars As at 31st December, 2012 As at 31st December, 2011
Number of shares
` in Million Number of shares
` in Million
Authorised:
Equity shares of ` 10/- each. 40,000,000 400.00 40,000,000 400.00 Issued, Subscribed and Fully Paid up:
Equity shares of ` 10/- each. 34,807,844 348.08 34,807,844 348.08 Total 34,807,844 348.08 34,807,844 348.08
(i) Reconciliation of the no. of shares outstanding at the beginning and at the end of the year:
As at 31st December, 2012 As at 31st December, 2011
` in Million No of shares
` in Million No of shares
No. of shares outstanding at the beginning
- Equity shares 348.08 34,807,844 174.04 17,403,922
Add: Additional shares issued
- Equity shares (Bonus issue) - - 174.04 17,403,922
Less: Shares forfeited/Bought back
- Equity shares - - - -
No of shares outstanding at the end
- Equity shares 348.08 34,807,844 348.08 34,807,844(ii) The Company has only one class of shares referred to as equity shares having a par value of ` 10/-. Each
shareholder of equity shares is entitled to one vote per share.(iii) Aggregate number of equity shares allotted as fully paid-up by way of bonus shares for the period of five years
immediately preceding the Balance Sheet date - 17,403,922(iv) Number of shares held by each shareholder holding more than 5% shares in the Company are as follows:
Particulars As at 31 December, 2012 As at 31 December, 2011
No. of shares
% of shares held
No. of shares
% of shares held
Canadian Kay Pump Ltd. 14,110,848 40.54% 14,110,848 40.54%The Industrial & Prudential Investment Co. Ltd. 7,140,000 20.51% 7,140,000 20.51%Reliance Capital Trustee Company Limited (held in Reliance Infrastructure Fund and Reliance Tax Saver (ELSS) Fund)
2,740,280 7.87% 2,767,630 7.95%
(v) The Company declares and pays dividends in Indian rupees. The dividend proposed by the Board of Directors is subject to the approval of the shareholders in the ensuing Annual General Meeting. In the event of liquidation of the Company, the holders of equity shares will be entitled to receive any of the remaining assets of the Company, after distribution of all preferential amounts. However, no such preferential amount exists currently. The distribution will be in proportion to the number of equity shares held by the shareholders.
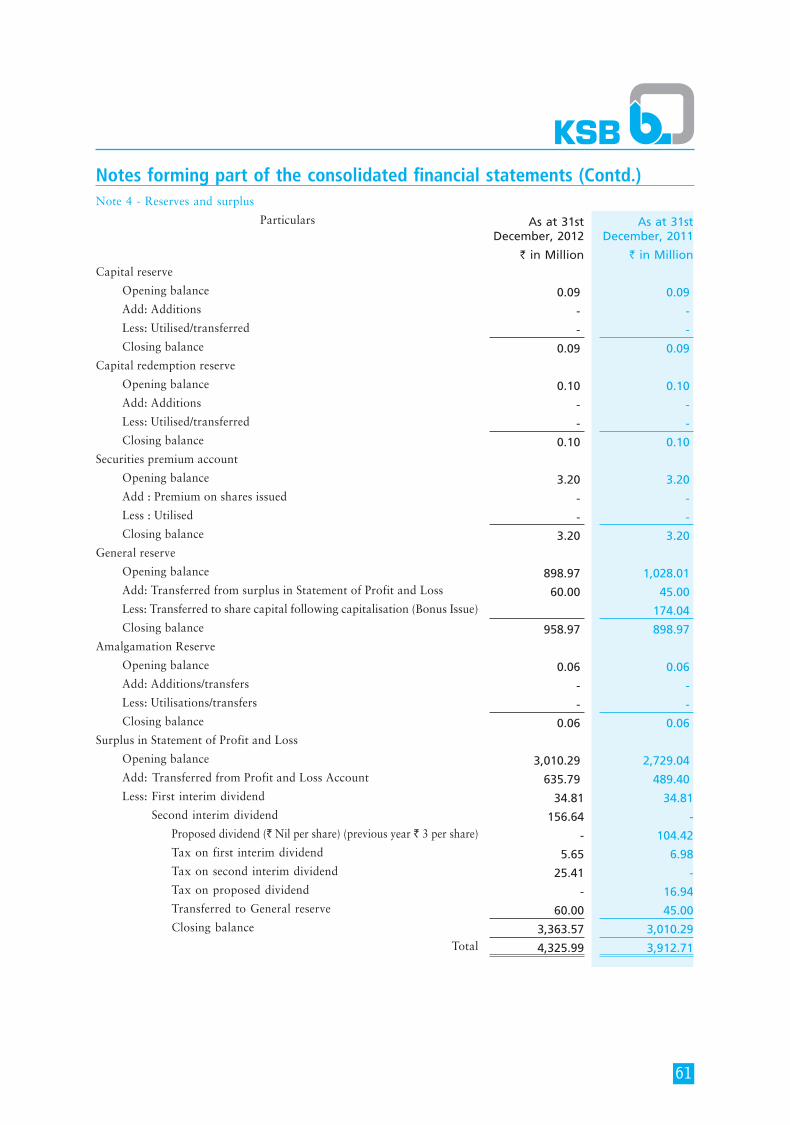
61
Notes forming part of the consolidated financial statements (Contd.)Note 4 - Reserves and surplus
Particulars As at 31st December, 2012
As at 31st December, 2011
` in Million ` in MillionCapital reserve
Opening balance 0.09 0.09 Add: Additions - - Less: Utilised/transferred - - Closing balance 0.09 0.09 Capital redemption reserve
Opening balance 0.10 0.10 Add: Additions - - Less: Utilised/transferred - - Closing balance 0.10 0.10 Securities premium account
Opening balance 3.20 3.20 Add : Premium on shares issued - - Less : Utilised - - Closing balance 3.20 3.20 General reserve
Opening balance 898.97 1,028.01 Add: Transferred from surplus in Statement of Profit and Loss 60.00 45.00 Less: Transferred to share capital following capitalisation (Bonus Issue) 174.04 Closing balance 958.97 898.97 Amalgamation Reserve
Opening balance 0.06 0.06 Add: Additions/transfers - - Less: Utilisations/transfers - - Closing balance 0.06 0.06 Surplus in Statement of Profit and Loss
Opening balance 3,010.29 2,729.04 Add: Transferred from Profit and Loss Account 635.79 489.40 Less: First interim dividend 34.81 34.81 Second interim dividend 156.64 - Proposed dividend (` Nil per share) (previous year ` 3 per share) - 104.42 Tax on first interim dividend 5.65 6.98 Tax on second interim dividend 25.41 - Tax on proposed dividend - 16.94 Transferred to General reserve 60.00 45.00 Closing balance 3,363.57 3,010.29
Total 4,325.99 3,912.71
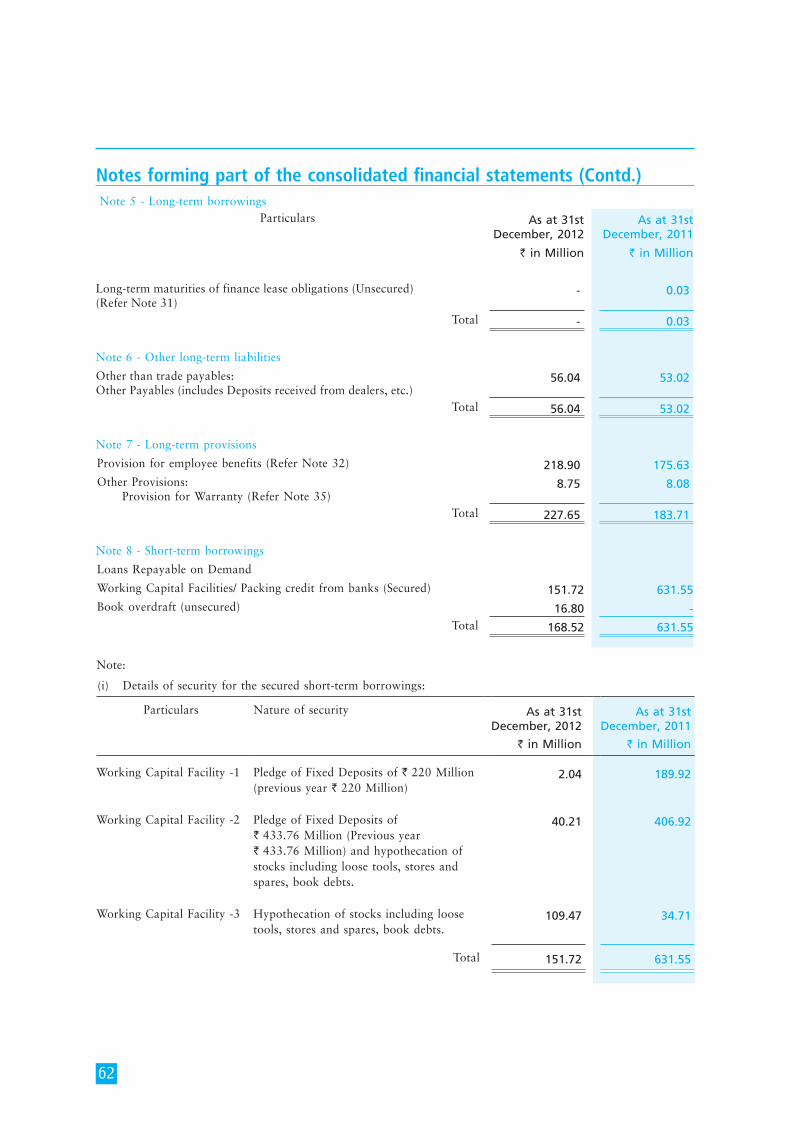
62
Notes forming part of the consolidated financial statements (Contd.)Note 5 - Long-term borrowings
Particulars As at 31st December, 2012
As at 31st December, 2011
` in Million ` in Million
Long-term maturities of finance lease obligations (Unsecured)(Refer Note 31)
- 0.03
Total - 0.03
Note 6 - Other long-term liabilities
Other than trade payables:Other Payables (includes Deposits received from dealers, etc.)
56.04 53.02
Total 56.04 53.02
Note 7 - Long-term provisions
Provision for employee benefits (Refer Note 32) 218.90 175.63Other Provisions: Provision for Warranty (Refer Note 35)
8.75 8.08
Total 227.65 183.71
Note 8 - Short-term borrowings
Loans Repayable on Demand
Working Capital Facilities/ Packing credit from banks (Secured) 151.72 631.55 Book overdraft (unsecured) 16.80 -
Total 168.52 631.55
Note:
(i) Details of security for the secured short-term borrowings:
Particulars Nature of security As at 31st December, 2012
` in Million
As at 31st December, 2011
` in Million
Working Capital Facility -1 Pledge of Fixed Deposits of ` 220 Million (previous year ` 220 Million)
2.04 189.92
Working Capital Facility -2 Pledge of Fixed Deposits of ` 433.76 Million (Previous year ` 433.76 Million) and hypothecation of stocks including loose tools, stores and spares, book debts.
40.21 406.92
Working Capital Facility -3 Hypothecation of stocks including loose tools, stores and spares, book debts.
109.47 34.71
Total 151.72 631.55
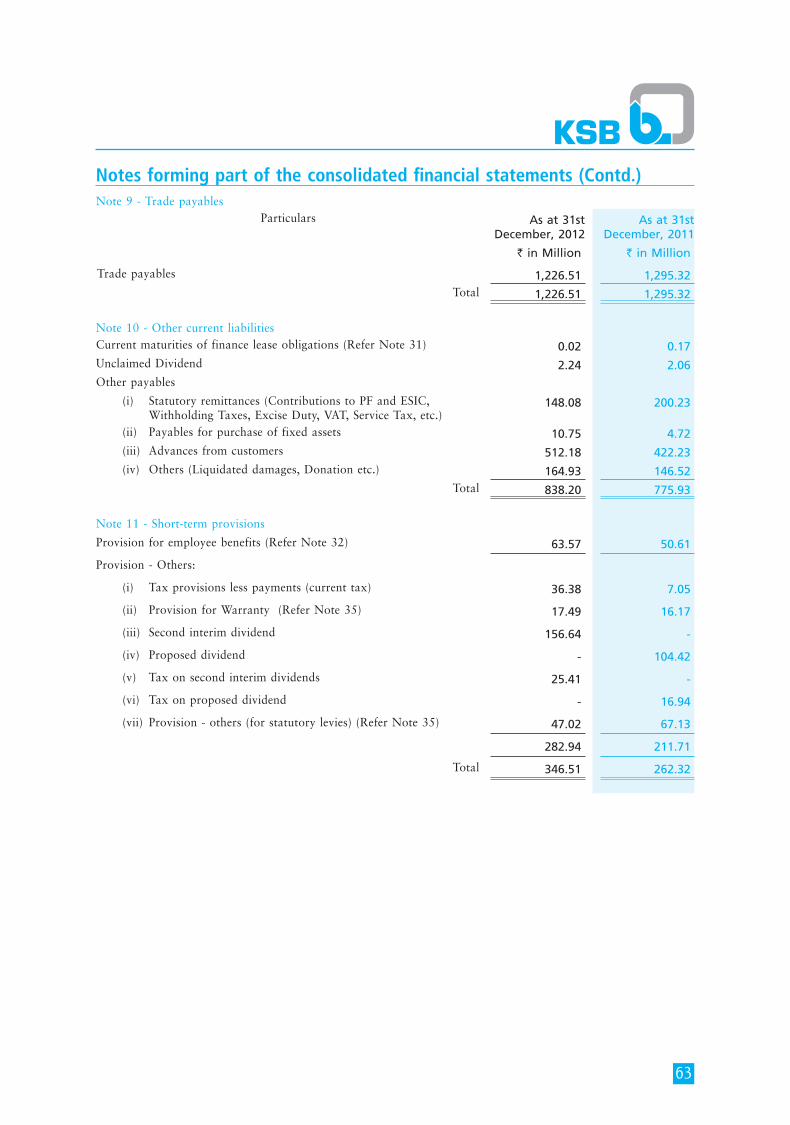
63
Notes forming part of the consolidated financial statements (Contd.)Note 9 - Trade payables
Particulars As at 31st December, 2012
As at 31st December, 2011
` in Million ` in Million
Trade payables 1,226.51 1,295.32 Total 1,226.51 1,295.32
Note 10 - Other current liabilitiesCurrent maturities of finance lease obligations (Refer Note 31) 0.02 0.17 Unclaimed Dividend 2.24 2.06 Other payables
(i) Statutory remittances (Contributions to PF and ESIC, Withholding Taxes, Excise Duty, VAT, Service Tax, etc.)
148.08 200.23
(ii) Payables for purchase of fixed assets 10.75 4.72 (iii) Advances from customers 512.18 422.23 (iv) Others (Liquidated damages, Donation etc.) 164.93 146.52
Total 838.20 775.93
Note 11 - Short-term provisions
Provision for employee benefits (Refer Note 32) 63.57 50.61
Provision - Others:
(i) Tax provisions less payments (current tax) 36.38 7.05
(ii) Provision for Warranty (Refer Note 35) 17.49 16.17
(iii) Second interim dividend 156.64 -
(iv) Proposed dividend - 104.42
(v) Tax on second interim dividends 25.41 -
(vi) Tax on proposed dividend - 16.94
(vii) Provision - others (for statutory levies) (Refer Note 35) 47.02 67.13
282.94 211.71
Total 346.51 262.32
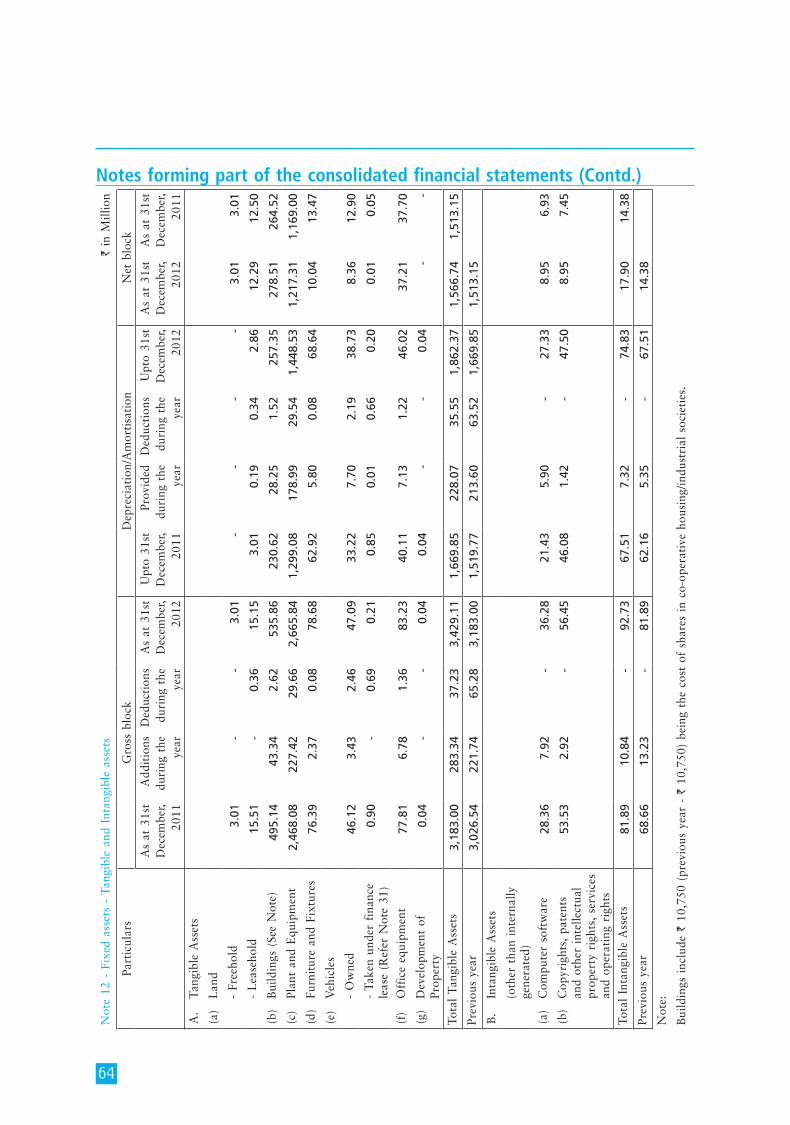
64
Not
e 12
- F
ixed
ass
ets
- Ta
ngib
le a
nd I
ntan
gibl
e as
sets
` i
n M
illio
n
Part
icul
ars
Gro
ss b
lock
Dep
reci
atio
n/A
mor
tisa
tion
Net
blo
ck
As
at 3
1st
Dec
embe
r, 20
11
Add
itio
ns
duri
ng t
he
year
Ded
ucti
ons
duri
ng t
he
year
As
at 3
1st
Dec
embe
r, 20
12
Upt
o 31
st
Dec
embe
r, 20
11
Prov
ided
du
ring
the
ye
ar
Ded
ucti
ons
duri
ng t
he
year
Upt
o 31
st
Dec
embe
r, 20
12
As
at 3
1st
Dec
embe
r, 20
12
As
at 3
1st
Dec
embe
r, 20
11A
. Ta
ngib
le A
sset
s
(a)
Lan
d
-
Free
hold
3.0
1 -
-
3
.01
-
-
-
-
3.0
1 3
.01
-
Lea
seho
ld 1
5.51
-
0
.36
15.
15
3.0
1 0
.19
0.3
4 2
.86
12.
29
12.
50
(b)
Bui
ldin
gs (
See
Not
e) 4
95.1
4 4
3.34
2
.62
535
.86
230
.62
28.
25
1.5
2 2
57.3
5 2
78.5
1 2
64.5
2
(c)
Plan
t an
d E
quip
men
t 2
,468
.08
227
.42
29.
66
2,6
65.8
4 1
,299
.08
178
.99
29.
54
1,4
48.5
3 1
,217
.31
1,1
69.0
0
(d)
Furn
itur
e an
d Fi
xtur
es 7
6.39
2
.37
0.0
8 7
8.68
6
2.92
5
.80
0.0
8 6
8.64
1
0.04
1
3.47
(e)
Veh
icle
s
-
Ow
ned
46.
12
3.4
3 2
.46
47.
09
33.
22
7.7
0 2
.19
38.
73
8.3
6 1
2.90
-
Take
n un
der
fina
nce
leas
e (R
efer
Not
e 31
) 0
.90
-
0.6
9 0
.21
0.8
5 0
.01
0.6
6 0
.20
0.0
1 0
.05
(f)
Off
ice
equi
pmen
t 7
7.81
6
.78
1.3
6 8
3.23
4
0.11
7
.13
1.2
2 4
6.02
3
7.21
3
7.70
(g)
Dev
elop
men
t of
Pr
oper
ty 0
.04
-
-
0.0
4 0
.04
-
-
0.0
4 -
-
Tota
l Ta
ngib
le A
sset
s 3
,183
.00
283
.34
37.
23
3,4
29.1
1 1
,669
.85
228
.07
35.
55
1,8
62.3
7 1
,566
.74
1,5
13.1
5
Prev
ious
yea
r 3
,026
.54
221
.74
65.
28
3,1
83.0
0 1
,519
.77
213
.60
63.
52
1,6
69.8
5 1
,513
.15
B.
Inta
ngib
le A
sset
s
(o
ther
tha
n in
tern
ally
ge
nera
ted)
(a)
Com
pute
r so
ftw
are
28.
36
7.9
2 -
3
6.28
2
1.43
5
.90
-
27.
33
8.9
5 6
.93
(b)
Cop
yrig
hts,
pat
ents
an
d ot
her
inte
llect
ual
prop
erty
rig
hts,
ser
vice
s an
d op
erat
ing
righ
ts
53.
53
2.9
2 -
5
6.45
4
6.08
1
.42
-
47.
50
8.9
5 7
.45
Tota
l In
tang
ible
Ass
ets
81.
89
10.
84
-
92.
73
67.
51
7.3
2 -
7
4.83
1
7.90
1
4.38
Prev
ious
yea
r 6
8.66
1
3.23
-
8
1.89
6
2.16
5
.35
-
67.
51
14.
38
Not
e:
Bui
ldin
gs i
nclu
de `
10,
750
(pre
viou
s ye
ar -
` 1
0,75
0) b
eing
the
cos
t of
sha
res
in c
o-op
erat
ive
hous
ing/
indu
stri
al s
ocie
ties
.
Notes forming part of the consolidated financial statements (Contd.)
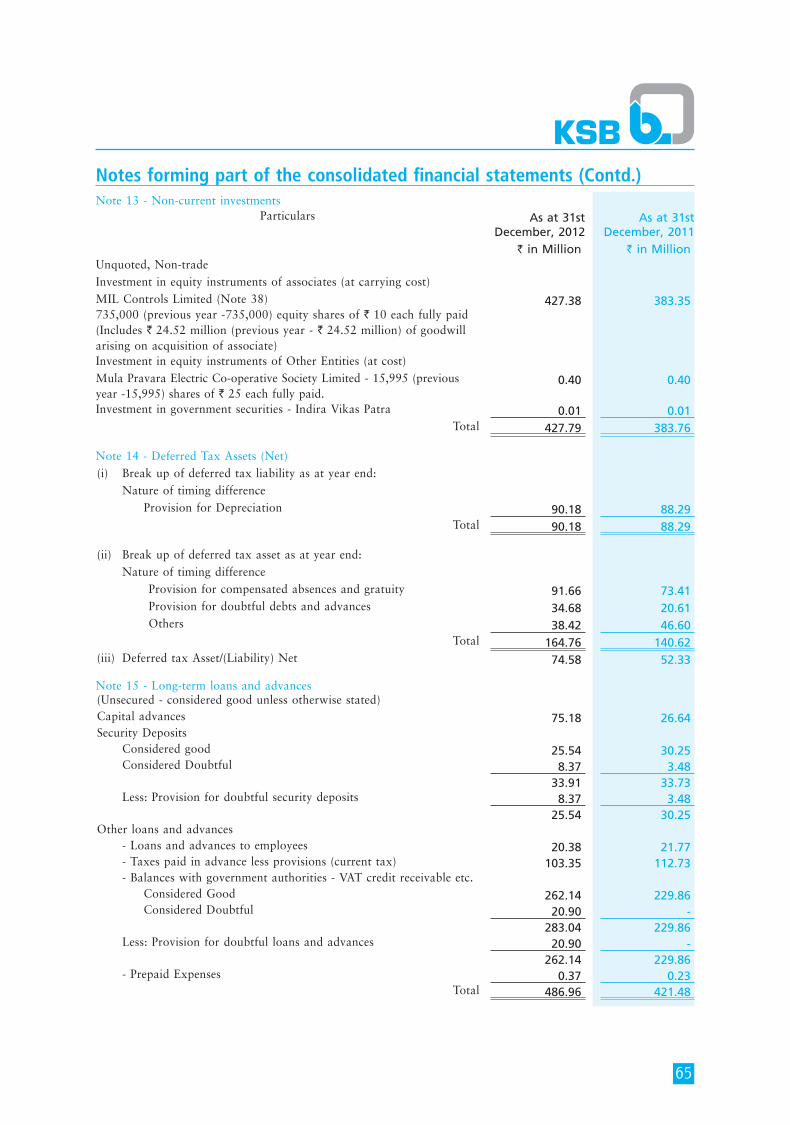
65
Note 13 - Non-current investmentsParticulars As at 31st
December, 2012As at 31st
December, 2011 ` in Million ` in Million
Unquoted, Non-tradeInvestment in equity instruments of associates (at carrying cost)MIL Controls Limited (Note 38)735,000 (previous year -735,000) equity shares of ` 10 each fully paid (Includes ` 24.52 million (previous year - ` 24.52 million) of goodwill arising on acquisition of associate)
427.38 383.35
Investment in equity instruments of Other Entities (at cost) Mula Pravara Electric Co-operative Society Limited - 15,995 (previous year -15,995) shares of ` 25 each fully paid.
0.40 0.40
Investment in government securities - Indira Vikas Patra 0.01 0.01 Total 427.79 383.76
Note 14 - Deferred Tax Assets (Net)(i) Break up of deferred tax liability as at year end: Nature of timing difference Provision for Depreciation 90.18 88.29
Total 90.18 88.29
(ii) Break up of deferred tax asset as at year end: Nature of timing difference Provision for compensated absences and gratuity 91.66 73.41 Provision for doubtful debts and advances 34.68 20.61 Others 38.42 46.60
Total 164.76 140.62 (iii) Deferred tax Asset/(Liability) Net 74.58 52.33
Note 15 - Long-term loans and advances(Unsecured - considered good unless otherwise stated)Capital advances 75.18 26.64 Security Deposits Considered good 25.54 30.25 Considered Doubtful 8.37 3.48
33.91 33.73 Less: Provision for doubtful security deposits 8.37 3.48
25.54 30.25 Other loans and advances - Loans and advances to employees 20.38 21.77 - Taxes paid in advance less provisions (current tax) 103.35 112.73 - Balances with government authorities - VAT credit receivable etc. Considered Good 262.14 229.86 Considered Doubtful 20.90 -
283.04 229.86 Less: Provision for doubtful loans and advances 20.90 -
262.14 229.86 - Prepaid Expenses 0.37 0.23
Total 486.96 421.48
Notes forming part of the consolidated financial statements (Contd.)
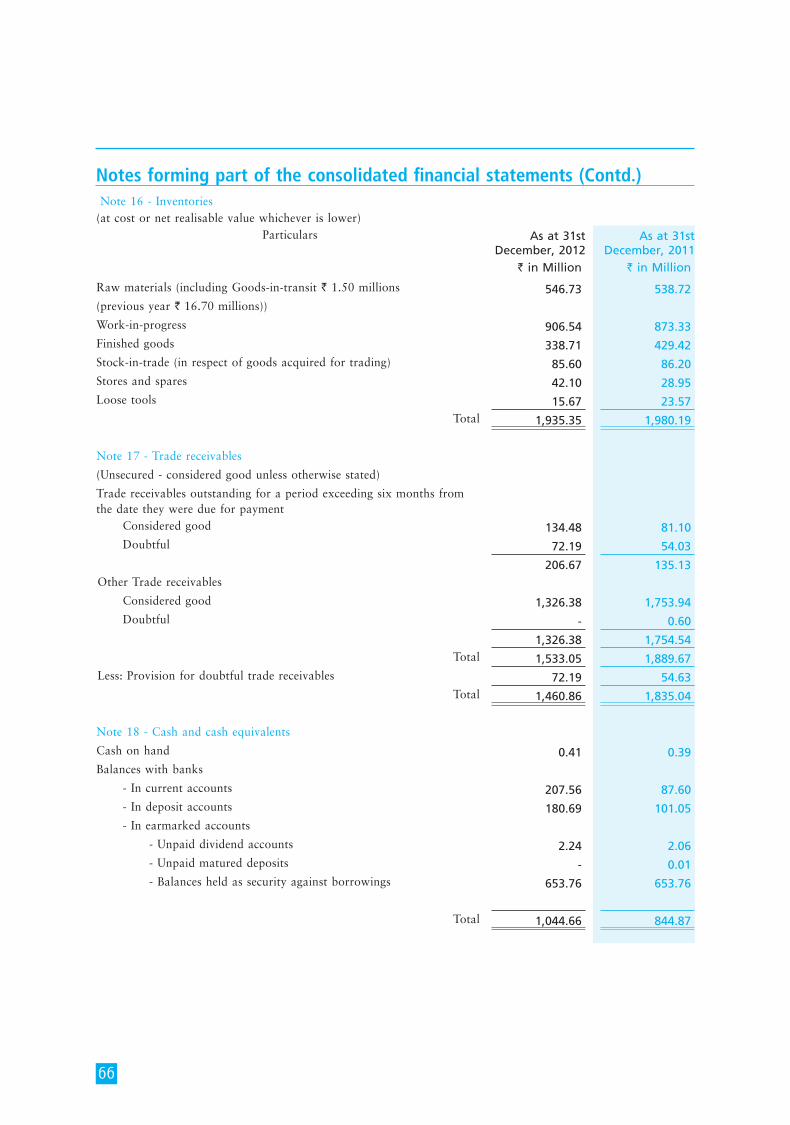
66
Note 16 - Inventories(at cost or net realisable value whichever is lower)
Particulars As at 31st December, 2012
As at 31st December, 2011
` in Million ` in Million
Raw materials (including Goods-in-transit ` 1.50 millions 546.73 538.72 (previous year ` 16.70 millions))
Work-in-progress 906.54 873.33 Finished goods 338.71 429.42 Stock-in-trade (in respect of goods acquired for trading) 85.60 86.20 Stores and spares 42.10 28.95 Loose tools 15.67 23.57
Total 1,935.35 1,980.19
Note 17 - Trade receivables
(Unsecured - considered good unless otherwise stated)
Trade receivables outstanding for a period exceeding six months from the date they were due for payment Considered good 134.48 81.10 Doubtful 72.19 54.03
206.67 135.13 Other Trade receivables
Considered good 1,326.38 1,753.94 Doubtful - 0.60
1,326.38 1,754.54 Total 1,533.05 1,889.67
Less: Provision for doubtful trade receivables 72.19 54.63 Total 1,460.86 1,835.04
Note 18 - Cash and cash equivalents
Cash on hand 0.41 0.39Balances with banks
- In current accounts 207.56 87.60 - In deposit accounts 180.69 101.05 - In earmarked accounts
- Unpaid dividend accounts 2.24 2.06 - Unpaid matured deposits - 0.01 - Balances held as security against borrowings 653.76 653.76
Total 1,044.66 844.87
Notes forming part of the consolidated financial statements (Contd.)
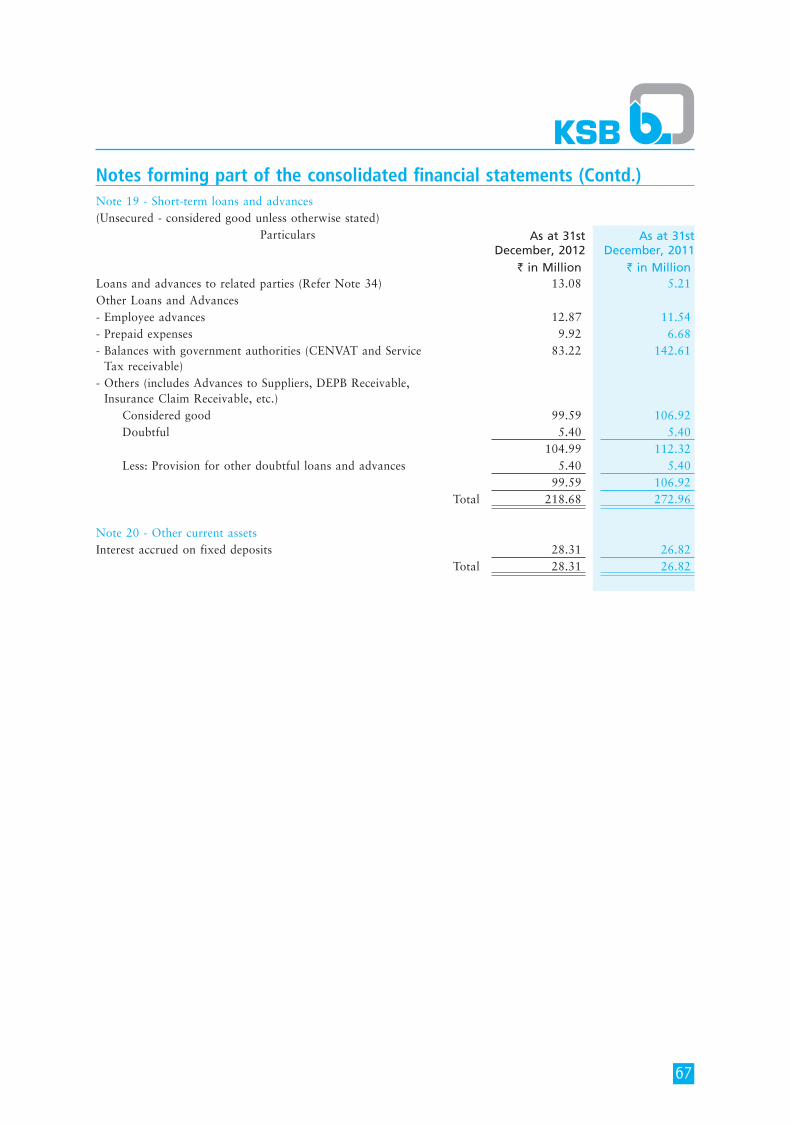
67
Note 19 - Short-term loans and advances(Unsecured - considered good unless otherwise stated)
Particulars As at 31st December, 2012
As at 31st December, 2011
` in Million ` in MillionLoans and advances to related parties (Refer Note 34) 13.08 5.21 Other Loans and Advances- Employee advances 12.87 11.54 - Prepaid expenses 9.92 6.68 - Balances with government authorities (CENVAT and Service Tax receivable)
83.22 142.61
- Others (includes Advances to Suppliers, DEPB Receivable, Insurance Claim Receivable, etc.) Considered good 99.59 106.92 Doubtful 5.40 5.40
104.99 112.32 Less: Provision for other doubtful loans and advances 5.40 5.40
99.59 106.92 Total 218.68 272.96
Note 20 - Other current assetsInterest accrued on fixed deposits 28.31 26.82
Total 28.31 26.82
Notes forming part of the consolidated financial statements (Contd.)
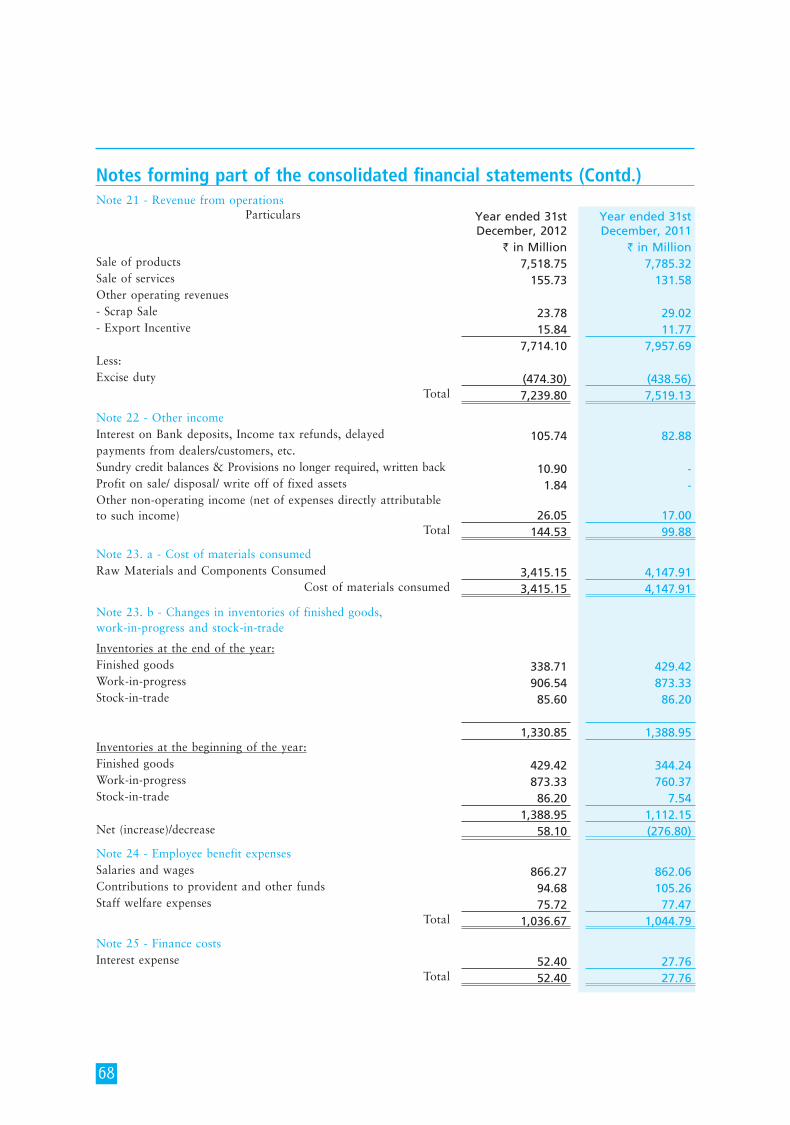
68
Notes forming part of the consolidated financial statements (Contd.)Note 21 - Revenue from operations
Particulars Year ended 31st December, 2012
Year ended 31st December, 2011
` in Million ` in MillionSale of products 7,518.75 7,785.32 Sale of services 155.73 131.58 Other operating revenues - Scrap Sale 23.78 29.02 - Export Incentive 15.84 11.77
7,714.10 7,957.69 Less:Excise duty (474.30) (438.56)
Total 7,239.80 7,519.13
Note 22 - Other incomeInterest on Bank deposits, Income tax refunds, delayed 105.74 82.88 payments from dealers/customers, etc.Sundry credit balances & Provisions no longer required, written back 10.90 - Profit on sale/ disposal/ write off of fixed assets 1.84 - Other non-operating income (net of expenses directly attributable to such income) 26.05 17.00
Total 144.53 99.88
Note 23. a - Cost of materials consumed Raw Materials and Components Consumed 3,415.15 4,147.91
Cost of materials consumed 3,415.15 4,147.91
Note 23. b - Changes in inventories of finished goods, work-in-progress and stock-in-trade
Inventories at the end of the year:Finished goods 338.71 429.42 Work-in-progress 906.54 873.33 Stock-in-trade 85.60 86.20
1,330.85 1,388.95 Inventories at the beginning of the year:Finished goods 429.42 344.24 Work-in-progress 873.33 760.37 Stock-in-trade 86.20 7.54
1,388.95 1,112.15 Net (increase)/decrease 58.10 (276.80)
Note 24 - Employee benefit expensesSalaries and wages 866.27 862.06 Contributions to provident and other funds 94.68 105.26 Staff welfare expenses 75.72 77.47
Total 1,036.67 1,044.79
Note 25 - Finance costsInterest expense 52.40 27.76
Total 52.40 27.76
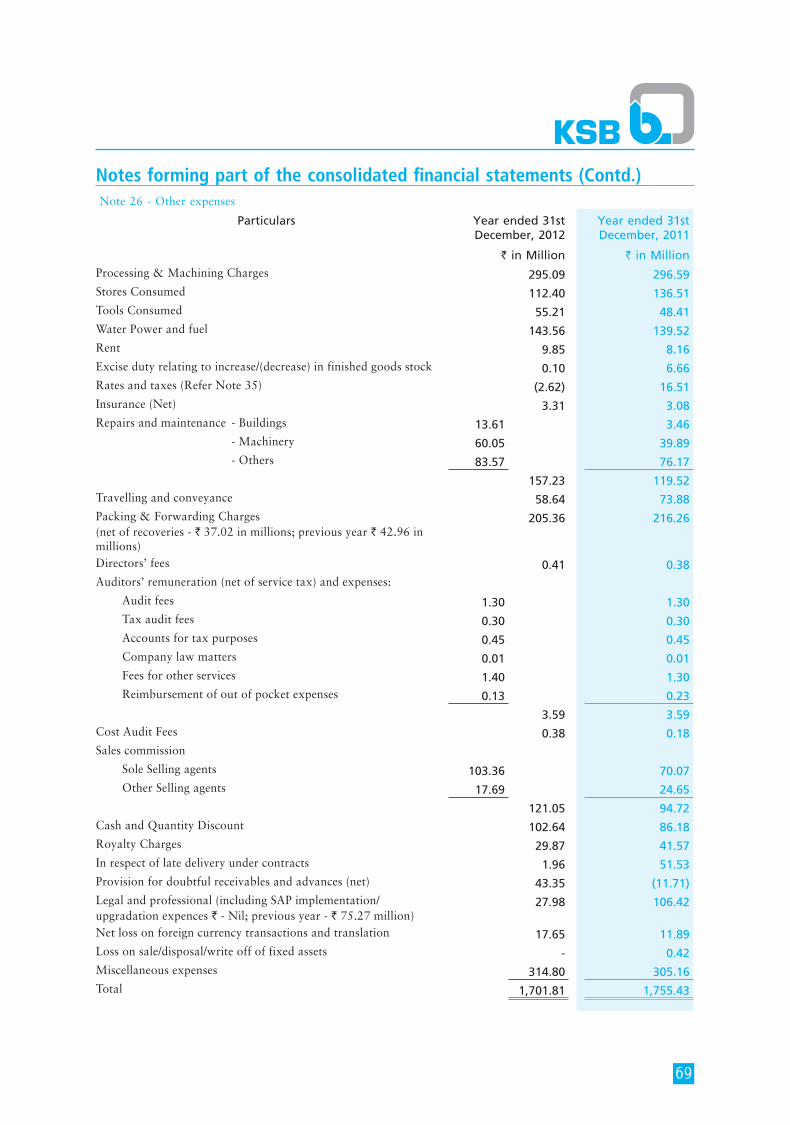
69
Notes forming part of the consolidated financial statements (Contd.)Note 26 - Other expenses
Particulars Year ended 31st December, 2012
Year ended 31st December, 2011
` in Million ` in Million
Processing & Machining Charges 295.09 296.59 Stores Consumed 112.40 136.51 Tools Consumed 55.21 48.41 Water Power and fuel 143.56 139.52 Rent 9.85 8.16 Excise duty relating to increase/(decrease) in finished goods stock 0.10 6.66 Rates and taxes (Refer Note 35) (2.62) 16.51 Insurance (Net) 3.31 3.08 Repairs and maintenance - Buildings 13.61 3.46 - Machinery 60.05 39.89 - Others 83.57 76.17
157.23 119.52 Travelling and conveyance 58.64 73.88 Packing & Forwarding Charges (net of recoveries - ` 37.02 in millions; previous year ` 42.96 in millions)
205.36 216.26
Directors’ fees 0.41 0.38 Auditors’ remuneration (net of service tax) and expenses:
Audit fees 1.30 1.30 Tax audit fees 0.30 0.30 Accounts for tax purposes 0.45 0.45 Company law matters 0.01 0.01 Fees for other services 1.40 1.30 Reimbursement of out of pocket expenses 0.13 0.23
3.59 3.59 Cost Audit Fees 0.38 0.18 Sales commission
Sole Selling agents 103.36 70.07 Other Selling agents 17.69 24.65
121.05 94.72 Cash and Quantity Discount 102.64 86.18 Royalty Charges 29.87 41.57 In respect of late delivery under contracts 1.96 51.53 Provision for doubtful receivables and advances (net) 43.35 (11.71)Legal and professional (including SAP implementation/ upgradation expences ` - Nil; previous year - ` 75.27 million)
27.98 106.42
Net loss on foreign currency transactions and translation 17.65 11.89 Loss on sale/disposal/write off of fixed assets - 0.42 Miscellaneous expenses 314.80 305.16 Total 1,701.81 1,755.43
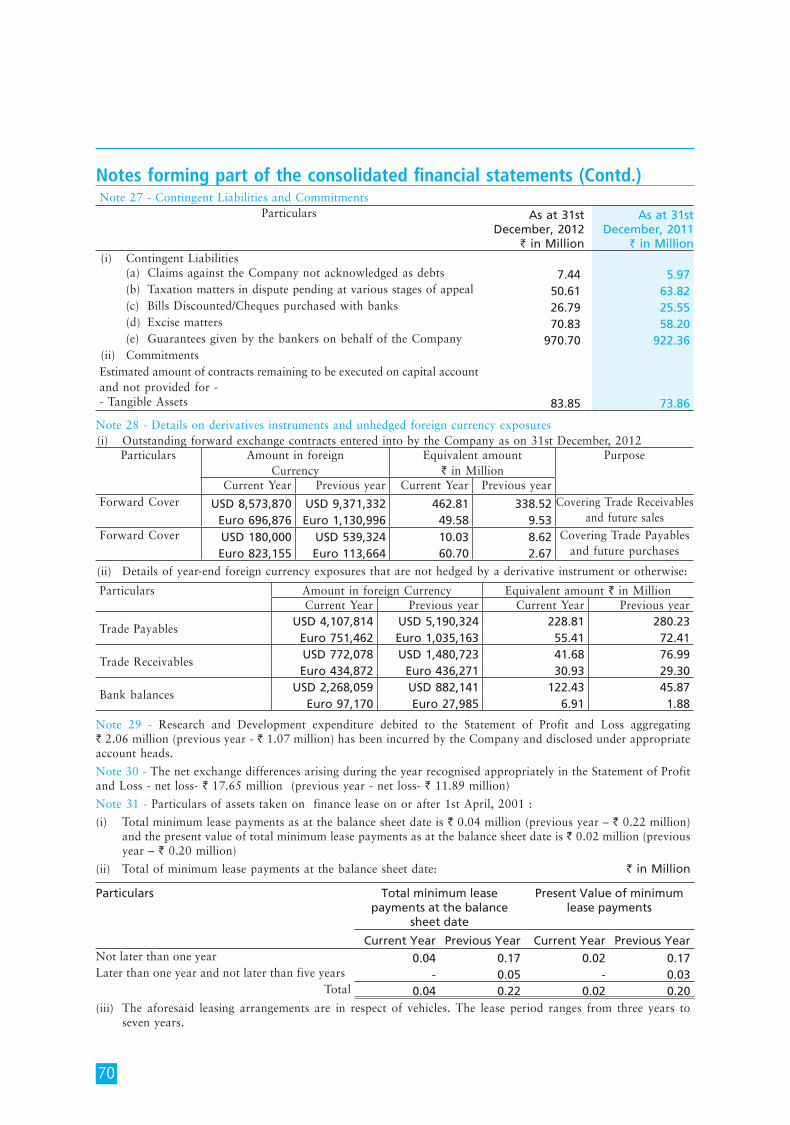
70
Notes forming part of the consolidated financial statements (Contd.)Note 27 - Contingent Liabilities and Commitments
Particulars As at 31st December, 2012
` in Million
As at 31st December, 2011
` in Million(i) Contingent Liabilities (a) Claims against the Company not acknowledged as debts 7.44 5.97 (b) Taxation matters in dispute pending at various stages of appeal 50.61 63.82 (c) Bills Discounted/Cheques purchased with banks 26.79 25.55 (d) Excise matters 70.83 58.20 (e) Guarantees given by the bankers on behalf of the Company 970.70 922.36 (ii) Commitments Estimated amount of contracts remaining to be executed on capital account and not provided for -- Tangible Assets 83.85 73.86
Note 28 - Details on derivatives instruments and unhedged foreign currency exposures(i) Outstanding forward exchange contracts entered into by the Company as on 31st December, 2012
Particulars Amount in foreign Currency
Equivalent amount ` in Million
Purpose
Current Year Previous year Current Year Previous year Forward Cover USD 8,573,870 USD 9,371,332 462.81 338.52 Covering Trade Receivables
and future sales Euro 696,876 Euro 1,130,996 49.58 9.53 Forward Cover USD 180,000 USD 539,324 10.03 8.62 Covering Trade Payables
and future purchases Euro 823,155 Euro 113,664 60.70 2.67
(ii) Details of year-end foreign currency exposures that are not hedged by a derivative instrument or otherwise:
Particulars Amount in foreign Currency Equivalent amount ` in MillionCurrent Year Previous year Current Year Previous year
Trade Payables USD 4,107,814 USD 5,190,324 228.81 280.23
Euro 751,462 Euro 1,035,163 55.41 72.41
Trade Receivables USD 772,078 USD 1,480,723 41.68 76.99 Euro 434,872 Euro 436,271 30.93 29.30
Bank balances USD 2,268,059 USD 882,141 122.43 45.87
Euro 97,170 Euro 27,985 6.91 1.88
Note 29 - Research and Development expenditure debited to the Statement of Profit and Loss aggregating ` 2.06 million (previous year - ` 1.07 million) has been incurred by the Company and disclosed under appropriate account heads.
Note 30 - The net exchange differences arising during the year recognised appropriately in the Statement of Profit and Loss - net loss- ` 17.65 million (previous year - net loss- ` 11.89 million)
Note 31 - Particulars of assets taken on finance lease on or after 1st April, 2001 :
(i) Total minimum lease payments as at the balance sheet date is ` 0.04 million (previous year – ` 0.22 million) and the present value of total minimum lease payments as at the balance sheet date is ` 0.02 million (previous year – ` 0.20 million)
(ii) Total of minimum lease payments at the balance sheet date: ` in Million
Particulars Total minimum lease payments at the balance
sheet date
Present Value of minimum lease payments
Current Year Previous Year Current Year Previous Year Not later than one year 0.04 0.17 0.02 0.17 Later than one year and not later than five years - 0.05 - 0.03
Total 0.04 0.22 0.02 0.20 (iii) The aforesaid leasing arrangements are in respect of vehicles. The lease period ranges from three years to
seven years.
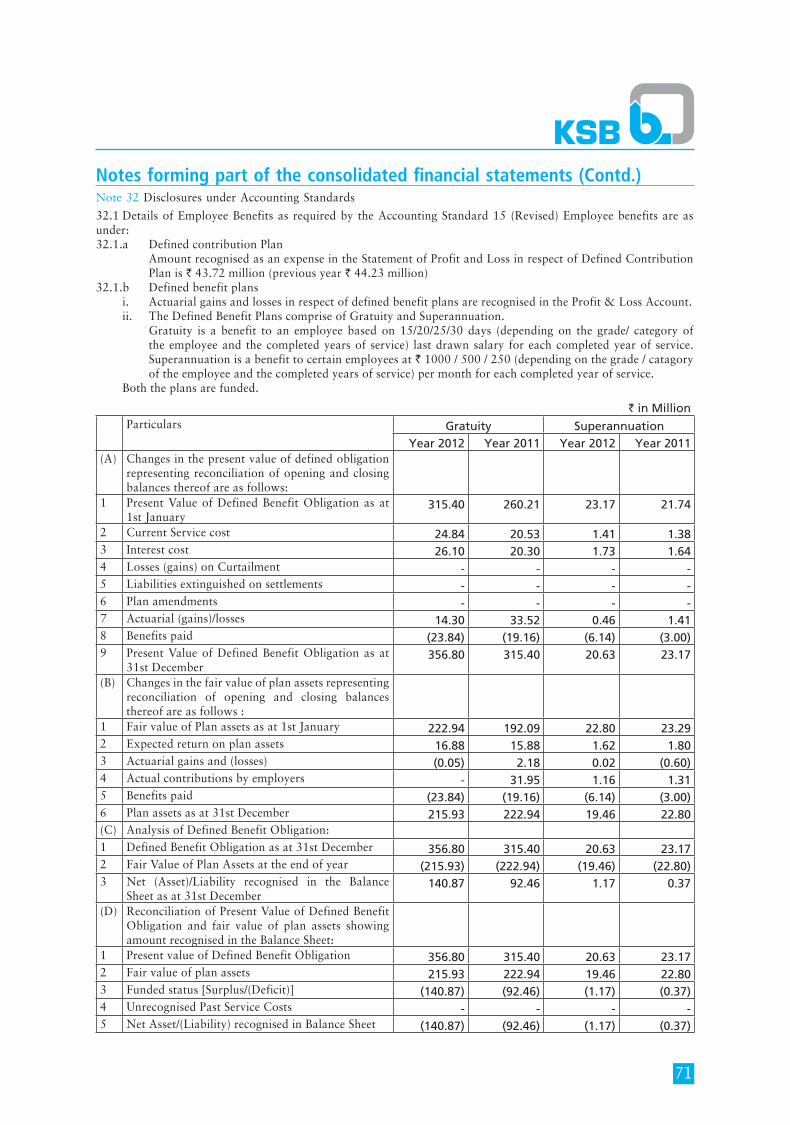
71
Notes forming part of the consolidated financial statements (Contd.)Note 32 Disclosures under Accounting Standards
32.1 Details of Employee Benefits as required by the Accounting Standard 15 (Revised) Employee benefits are as under:32.1.a Defined contribution Plan Amount recognised as an expense in the Statement of Profit and Loss in respect of Defined Contribution
Plan is ` 43.72 million (previous year ` 44.23 million)32.1.b Defined benefit plans i. Actuarial gains and losses in respect of defined benefit plans are recognised in the Profit & Loss Account. ii. The Defined Benefit Plans comprise of Gratuity and Superannuation. Gratuity is a benefit to an employee based on 15/20/25/30 days (depending on the grade/ category of
the employee and the completed years of service) last drawn salary for each completed year of service. Superannuation is a benefit to certain employees at ` 1000 / 500 / 250 (depending on the grade / catagory of the employee and the completed years of service) per month for each completed year of service.
Both the plans are funded.
` in MillionParticulars Gratuity Superannuation
Year 2012 Year 2011 Year 2012 Year 2011(A) Changes in the present value of defined obligation
representing reconciliation of opening and closing balances thereof are as follows:
1 Present Value of Defined Benefit Obligation as at 1st January
315.40 260.21 23.17 21.74
2 Current Service cost 24.84 20.53 1.41 1.38 3 Interest cost 26.10 20.30 1.73 1.64 4 Losses (gains) on Curtailment - - - - 5 Liabilities extinguished on settlements - - - - 6 Plan amendments - - - - 7 Actuarial (gains)/losses 14.30 33.52 0.46 1.41 8 Benefits paid (23.84) (19.16) (6.14) (3.00)9 Present Value of Defined Benefit Obligation as at
31st December 356.80 315.40 20.63 23.17
(B) Changes in the fair value of plan assets representing reconciliation of opening and closing balances thereof are as follows :
1 Fair value of Plan assets as at 1st January 222.94 192.09 22.80 23.29 2 Expected return on plan assets 16.88 15.88 1.62 1.80 3 Actuarial gains and (losses) (0.05) 2.18 0.02 (0.60)4 Actual contributions by employers - 31.95 1.16 1.31 5 Benefits paid (23.84) (19.16) (6.14) (3.00)6 Plan assets as at 31st December 215.93 222.94 19.46 22.80 (C) Analysis of Defined Benefit Obligation:1 Defined Benefit Obligation as at 31st December 356.80 315.40 20.63 23.17 2 Fair Value of Plan Assets at the end of year (215.93) (222.94) (19.46) (22.80)3 Net (Asset)/Liability recognised in the Balance
Sheet as at 31st December 140.87 92.46 1.17 0.37
(D) Reconciliation of Present Value of Defined Benefit Obligation and fair value of plan assets showing amount recognised in the Balance Sheet:
1 Present value of Defined Benefit Obligation 356.80 315.40 20.63 23.17 2 Fair value of plan assets 215.93 222.94 19.46 22.80 3 Funded status [Surplus/(Deficit)] (140.87) (92.46) (1.17) (0.37)4 Unrecognised Past Service Costs - - - - 5 Net Asset/(Liability) recognised in Balance Sheet (140.87) (92.46) (1.17) (0.37)
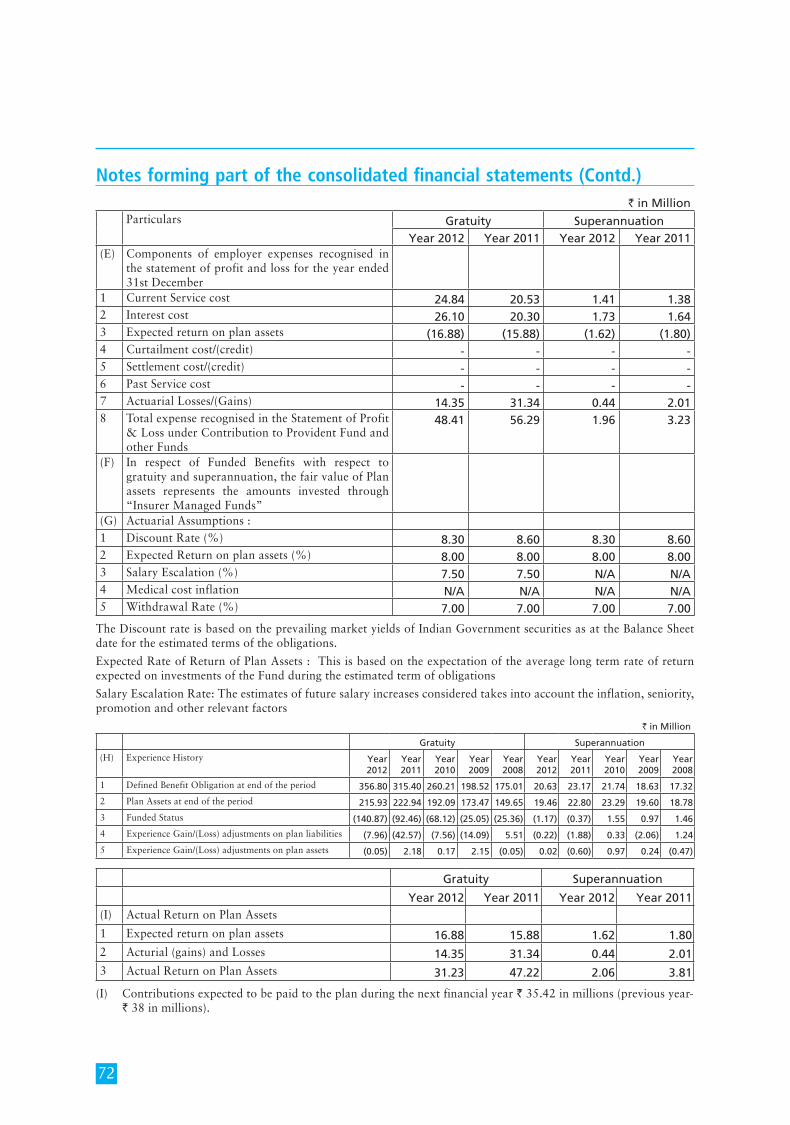
72
Notes forming part of the consolidated financial statements (Contd.)` in Million
Particulars Gratuity SuperannuationYear 2012 Year 2011 Year 2012 Year 2011
(E) Components of employer expenses recognised in the statement of profit and loss for the year ended 31st December
1 Current Service cost 24.84 20.53 1.41 1.38 2 Interest cost 26.10 20.30 1.73 1.64 3 Expected return on plan assets (16.88) (15.88) (1.62) (1.80)4 Curtailment cost/(credit) - - - - 5 Settlement cost/(credit) - - - - 6 Past Service cost - - - - 7 Actuarial Losses/(Gains) 14.35 31.34 0.44 2.01 8 Total expense recognised in the Statement of Profit
& Loss under Contribution to Provident Fund and other Funds
48.41 56.29 1.96 3.23
(F) In respect of Funded Benefits with respect to gratuity and superannuation, the fair value of Plan assets represents the amounts invested through “Insurer Managed Funds”
(G) Actuarial Assumptions :1 Discount Rate (%) 8.30 8.60 8.30 8.602 Expected Return on plan assets (%) 8.00 8.00 8.00 8.003 Salary Escalation (%) 7.50 7.50 N/A N/A4 Medical cost inflation N/A N/A N/A N/A5 Withdrawal Rate (%) 7.00 7.00 7.00 7.00
The Discount rate is based on the prevailing market yields of Indian Government securities as at the Balance Sheet date for the estimated terms of the obligations.
Expected Rate of Return of Plan Assets : This is based on the expectation of the average long term rate of return expected on investments of the Fund during the estimated term of obligations
Salary Escalation Rate: The estimates of future salary increases considered takes into account the inflation, seniority, promotion and other relevant factors
` in Million
Gratuity Superannuation
(H) Experience History Year 2012
Year 2011
Year 2010
Year 2009
Year 2008
Year 2012
Year 2011
Year 2010
Year 2009
Year 2008
1 Defined Benefit Obligation at end of the period 356.80 315.40 260.21 198.52 175.01 20.63 23.17 21.74 18.63 17.32
2 Plan Assets at end of the period 215.93 222.94 192.09 173.47 149.65 19.46 22.80 23.29 19.60 18.78
3 Funded Status (140.87) (92.46) (68.12) (25.05) (25.36) (1.17) (0.37) 1.55 0.97 1.46
4 Experience Gain/(Loss) adjustments on plan liabilities (7.96) (42.57) (7.56) (14.09) 5.51 (0.22) (1.88) 0.33 (2.06) 1.24
5 Experience Gain/(Loss) adjustments on plan assets (0.05) 2.18 0.17 2.15 (0.05) 0.02 (0.60) 0.97 0.24 (0.47)
Gratuity Superannuation
Year 2012 Year 2011 Year 2012 Year 2011(I) Actual Return on Plan Assets
1 Expected return on plan assets 16.88 15.88 1.62 1.80 2 Acturial (gains) and Losses 14.35 31.34 0.44 2.01 3 Actual Return on Plan Assets 31.23 47.22 2.06 3.81
(I) Contributions expected to be paid to the plan during the next financial year ` 35.42 in millions (previous year- ` 38 in millions).
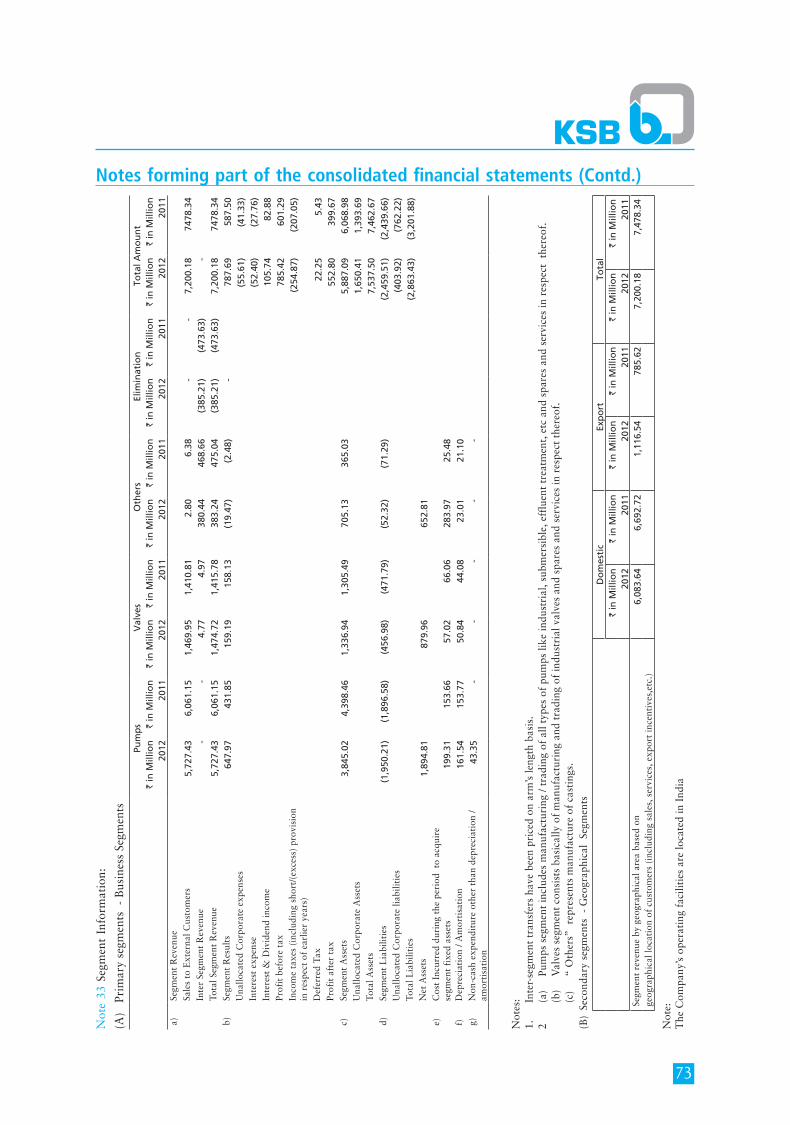
73
Notes forming part of the consolidated financial statements (Contd.)
Not
e 33
Seg
men
t In
form
atio
n:
(A)
Prim
ary
segm
ents
- B
usin
ess
Segm
ents
Pum
ps
Val
ves
Oth
ers
Elim
inat
ion
Tota
l Am
ou
nt
` in
Mill
ion
` in
Mill
ion
` in
Mill
ion
` in
Mill
ion
` in
Mill
ion
` in
Mill
ion
` in
Mill
ion
` in
Mill
ion
` in
Mill
ion
` in
Mill
ion
2012
2011
2012
2011
2012
2011
2012
2011
2012
2011
a)Se
gmen
t R
even
ueSa
les
to E
xter
nal C
usto
mer
s5,
727.
43
6,06
1.15
1,
469.
95
1,41
0.81
2
.80
6.3
8 -
-
7,
200.
18
7478
.34
Inte
r Se
gmen
t R
even
ue -
-
4
.77
4.9
7 3
80.4
4 4
68.6
6 (3
85.2
1)(4
73.6
3) -
To
tal S
egm
ent
Rev
enue
5,72
7.43
6,
061.
15
1,47
4.72
1,
415.
78
383
.24
475
.04
(385
.21)
(473
.63)
7,20
0.18
74
78.3
4b)
Segm
ent
Res
ults
647
.97
431
.85
159
.19
158
.13
(19
.47)
(2.
48)
-
787
.69
587.
50U
nallo
cate
d C
orpo
rate
exp
ense
s (
55.6
1) (
41.3
3)In
tere
st e
xpen
se (
52.4
0) (
27.7
6)In
tere
st &
Div
iden
d in
com
e 1
05.7
4 8
2.88
Pr
ofit
bef
ore
tax
785
.42
601
.29
Inco
me
taxe
s (i
nclu
ding
sho
rt/(
exce
ss)
prov
isio
n in
res
pect
of
earl
ier
year
s)(2
54.8
7)(2
07.0
5)
Def
erre
d Ta
x 2
2.25
5
.43
Prof
it a
fter
tax
552
.80
399
.67
c)Se
gmen
t A
sset
s3,
845.
02
4,39
8.46
1,
336.
94
1,30
5.49
7
05.1
3 3
65.0
3 5,
887.
09
6,06
8.98
U
nallo
cate
d C
orpo
rate
Ass
ets
1,65
0.41
1,
393.
69
Tota
l Ass
ets
7,53
7.50
7,
462.
67
d)Se
gmen
t L
iabi
litie
s(1
,950
.21)
(1,8
96.5
8)(4
56.9
8)(4
71.7
9) (
52.3
2) (
71.2
9)(2
,459
.51)
(2,4
39.6
6)U
nallo
cate
d C
orpo
rate
liab
iliti
es(4
03.9
2)(7
62.2
2)To
tal L
iabi
litie
s(2
,863
.43)
(3,2
01.8
8)N
et A
sset
s1,
894.
81
879
.96
652
.81
e)C
ost
Incu
rred
dur
ing
the
peri
od t
o ac
quir
e
segm
ent
fixe
d as
sets
199.
31
153
.66
57.
02
66.
06
283
.97
25.
48
f)D
epre
ciat
ion
/ Am
orti
sati
on 1
61.5
4 1
53.7
7 5
0.84
4
4.08
2
3.01
2
1.10
g)
Non
-cas
h ex
pend
itur
e ot
her
than
dep
reci
atio
n /
amor
tisa
tion
43.3
5-
--
--
Not
es:
1.
Inte
r-se
gmen
t tr
ansf
ers
have
bee
n pr
iced
on
arm
’s le
ngth
bas
is.
2 (a
) Pu
mps
seg
men
t in
clud
es m
anuf
actu
ring
/ tr
adin
g of
all
type
s of
pum
ps li
ke in
dust
rial
, sub
mer
sibl
e, e
fflu
ent
trea
tmen
t, e
tc a
nd s
pare
s an
d se
rvic
es in
res
pect
the
reof
.
(b)
Val
ves
segm
ent
cons
ists
bas
ical
ly o
f m
anuf
actu
ring
and
tra
ding
of
indu
stri
al v
alve
s an
d sp
ares
and
ser
vice
s in
res
pect
the
reof
.
(c)
“ O
ther
s” r
epre
sent
s m
anuf
actu
re o
f ca
stin
gs.
(B)
Seco
ndar
y se
gmen
ts -
Geo
grap
hica
l Se
gmen
ts
Do
mes
tic
Exp
ort
Tota
l`
in M
illio
n`
in M
illio
n`
in M
illio
n`
in M
illio
n`
in M
illio
n`
in M
illio
n20
1220
1120
1220
1120
1220
11Se
gmen
t re
venu
e by
geo
grap
hica
l are
a ba
sed
on6,
083.
646,
692.
721,
116.
5478
5.62
7,20
0.18
7,47
8.34
geog
raph
ical
loca
tion
of
cust
omer
s (i
nclu
ding
sal
es, s
ervi
ces,
exp
ort
ince
ntiv
es,e
tc.)
Not
e:
The
Com
pany
’s o
pera
ting
fac
iliti
es a
re lo
cate
d in
Ind
ia
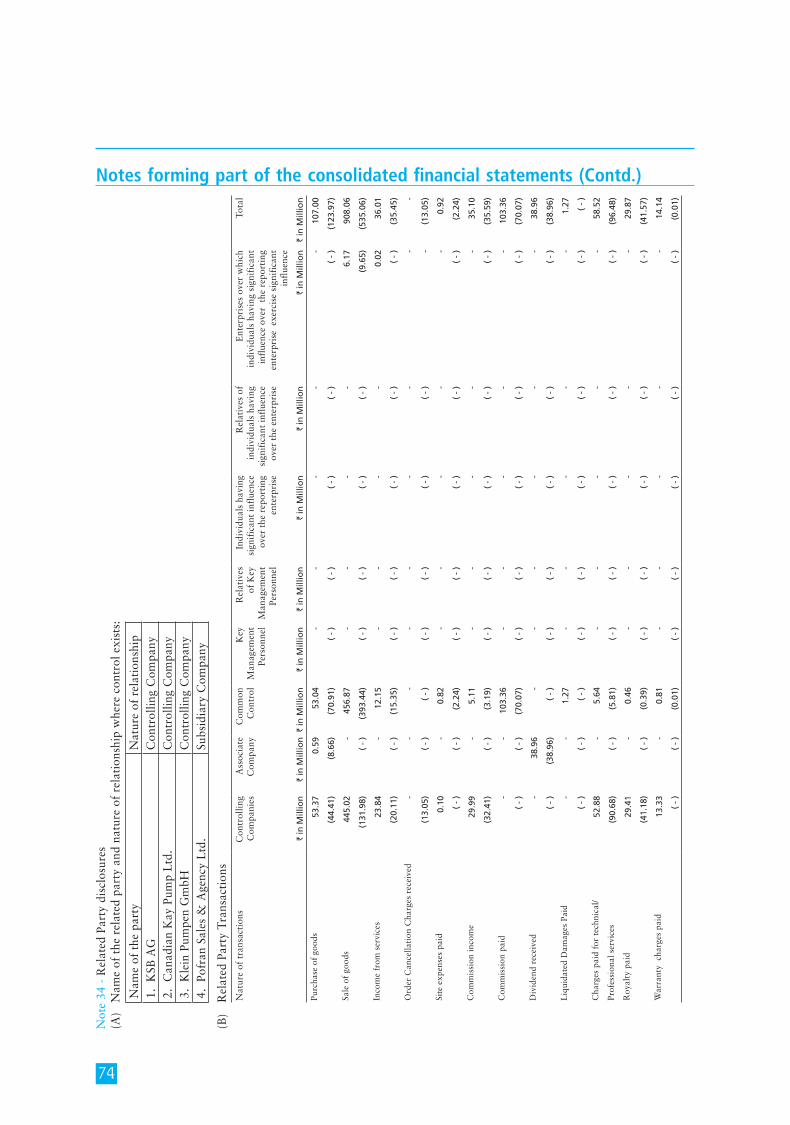
74
Notes forming part of the consolidated financial statements (Contd.)
Not
e 34
- R
elat
ed P
arty
dis
clos
ures
(A)
Nam
e of
the
rel
ated
par
ty a
nd n
atur
e of
rel
atio
nshi
p w
here
con
trol
exi
sts:
Nam
e of
the
par
tyN
atur
e of
rel
atio
nshi
p1.
KSB
AG
Con
trol
ling
Com
pany
2. C
anad
ian
Kay
Pum
p L
td.
Con
trol
ling
Com
pany
3. K
lein
Pum
pen
Gm
bHC
ontr
ollin
g C
ompa
ny4.
Pof
ran
Sale
s &
Age
ncy
Ltd
.Su
bsid
iary
Com
pany
(B)
Rel
ated
Par
ty T
rans
acti
ons
Nat
ure
of t
rans
acti
ons
Con
trol
ling
Com
pani
esA
ssoc
iate
C
ompa
nyC
omm
on
Con
trol
Key
M
anag
emen
t Pe
rson
nel
Rel
ativ
es
of K
ey
Man
agem
ent
Pers
onne
l
Indi
vidu
als
havi
ng
sign
ific
ant
infl
uenc
e ov
er t
he r
epor
ting
en
terp
rise
Rel
ativ
es o
f in
divi
dual
s ha
ving
si
gnif
ican
t in
flue
nce
over
the
ent
erpr
ise
Ent
erpr
ises
ove
r w
hich
in
divi
dual
s ha
ving
sig
nifi
cant
in
flue
nce
over
the
rep
orti
ng
ente
rpri
se e
xerc
ise
sign
ific
ant
infl
uenc
e
Tota
l
` in
Mill
ion
` in
Mill
ion
` in
Mill
ion
` in
Mill
ion
` in
Mill
ion
` in
Mill
ion
` in
Mill
ion
` in
Mill
ion
` in
Mill
ion
Purc
hase
of
good
s 5
3.37
0
.59
53.
04
-
-
-
-
-
107
.00
(44
.41)
(8.
66)
(70
.91)
( -
)
( -
)
( -
)
( -
)
( -
)
(12
3.97
)
Sale
of
good
s 4
45.0
2 -
4
56.8
7 -
-
-
-
6
.17
908
.06
(13
1.98
) (
- )
(
393.
44)
( -
)
( -
)
( -
)
( -
)
(9.
65)
(53
5.06
)
Inco
me
from
ser
vice
s 2
3.84
-
1
2.15
-
-
-
-
0
.02
36.
01
(20
.11)
( -
)
(15
.35)
( -
)
( -
)
( -
)
( -
)
( -
)
(35
.45)
Ord
er C
ance
llati
on C
harg
es r
ecei
ved
-
-
-
-
-
-
-
-
-
(13
.05)
( -
)
( -
)
( -
)
( -
)
( -
)
( -
)
-
(13
.05)
Site
exp
ense
s pa
id 0
.10
-
0.8
2 -
-
-
-
-
0
.92
( -
)
( -
)
(2.
24)
( -
)
( -
)
( -
)
( -
)
( -
)
(2.
24)
Com
mis
sion
inco
me
29.
99
-
5.1
1 -
-
-
-
-
3
5.10
(32
.41)
( -
)
(3.
19)
( -
)
( -
)
( -
)
( -
)
( -
)
(35
.59)
Com
mis
sion
pai
d -
-
1
03.3
6 -
-
-
-
-
1
03.3
6
( -
)
( -
)
(70
.07)
( -
)
( -
)
( -
)
( -
)
( -
)
(70
.07)
Div
iden
d re
ceiv
ed -
3
8.96
-
-
-
-
-
-
3
8.96
( -
)
(38
.96)
( -
)
( -
)
( -
)
( -
)
( -
)
( -
)
(38
.96)
Liq
uida
ted
Dam
ages
Pai
d -
-
1
.27
-
-
-
-
-
1.2
7
( -
)
( -
)
( -
)
( -
)
( -
)
( -
)
( -
)
( -
)
( -
)
Cha
rges
pai
d fo
r te
chni
cal/
52.
88
-
5.6
4 -
-
-
-
-
5
8.52
Prof
essi
onal
ser
vice
s (
90.6
8) (
- )
(
5.81
) (
- )
(
- )
(
- )
(
- )
(
- )
(
96.4
8)
Roy
alty
pai
d 2
9.41
-
0
.46
-
-
-
-
-
29.
87
(41
.18)
( -
)
(0.
39)
( -
)
( -
)
( -
)
( -
)
( -
)
(41
.57)
War
rant
y c
harg
es p
aid
13.
33
-
0.8
1 -
-
-
-
-
1
4.14
( -
)
( -
)
(0.
01)
( -
)
( -
)
( -
)
( -
)
( -
)
(0.
01)
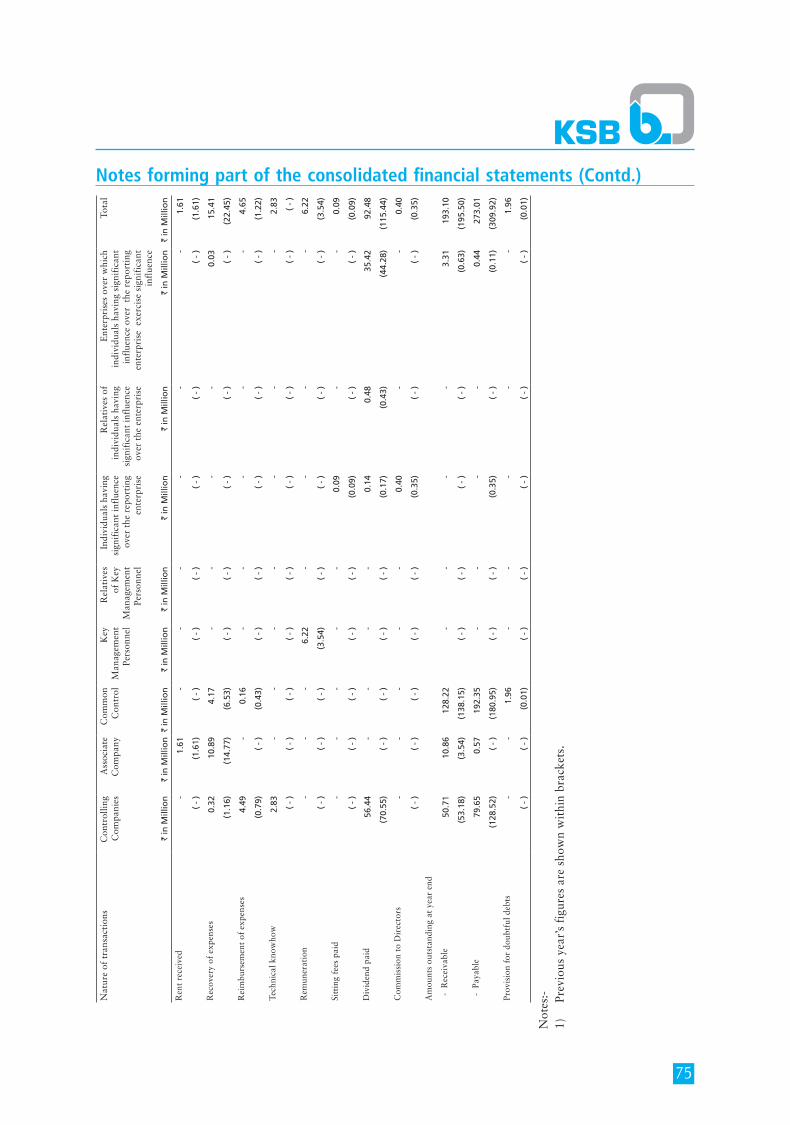
75
Nat
ure
of t
rans
acti
ons
Con
trol
ling
Com
pani
esA
ssoc
iate
C
ompa
nyC
omm
on
Con
trol
Key
M
anag
emen
t Pe
rson
nel
Rel
ativ
es
of K
ey
Man
agem
ent
Pers
onne
l
Indi
vidu
als
havi
ng
sign
ific
ant
infl
uenc
e ov
er t
he r
epor
ting
en
terp
rise
Rel
ativ
es o
f in
divi
dual
s ha
ving
si
gnif
ican
t in
flue
nce
over
the
ent
erpr
ise
Ent
erpr
ises
ove
r w
hich
in
divi
dual
s ha
ving
sig
nifi
cant
in
flue
nce
over
the
rep
orti
ng
ente
rpri
se e
xerc
ise
sign
ific
ant
infl
uenc
e
Tota
l
` in
Mill
ion
` in
Mill
ion
` in
Mill
ion
` in
Mill
ion
` in
Mill
ion
` in
Mill
ion
` in
Mill
ion
` in
Mill
ion
` in
Mill
ion
Ren
t re
ceiv
ed
-
1.6
1 -
-
-
-
-
-
1
.61
( -
)
(1.
61)
( -
)
( -
)
( -
)
( -
)
( -
)
( -
)
(1.
61)
Rec
over
y of
exp
ense
s 0
.32
10.
89
4.1
7 -
-
-
-
0
.03
15.
41
(1.
16)
(14
.77)
(6.
53)
( -
)
( -
)
( -
)
( -
)
( -
)
(22
.45)
Rei
mbu
rsem
ent
of e
xpen
ses
4.4
9 -
0
.16
-
-
-
-
-
4.6
5
(0.
79)
( -
)
(0.
43)
( -
)
( -
)
( -
)
( -
)
( -
)
(1.
22)
Tech
nica
l kno
who
w 2
.83
-
-
-
-
-
-
-
2.8
3
( -
)
( -
)
( -
)
( -
)
( -
)
( -
)
( -
)
( -
)
( -
)
Rem
uner
atio
n -
-
-
6
.22
-
-
-
-
6.2
2
( -
)
( -
)
( -
)
(3.
54)
( -
)
( -
)
( -
)
( -
)
(3.
54)
Sitt
ing
fees
pai
d -
-
-
-
-
0
.09
-
-
0.0
9
( -
)
( -
)
( -
)
( -
)
( -
)
(0.
09)
( -
)
( -
)
(0.
09)
Div
iden
d pa
id 5
6.44
-
-
-
-
0
.14
0.4
8 3
5.42
9
2.48
(70
.55)
( -
)
( -
)
( -
)
( -
)
(0.
17)
(0.
43)
(44
.28)
(11
5.44
)
Com
mis
sion
to
Dir
ecto
rs -
-
-
-
-
0
.40
-
-
0.4
0
( -
)
( -
)
( -
)
( -
)
( -
)
(0.
35)
( -
)
( -
)
(0.
35)
Am
ount
s ou
tsta
ndin
g at
yea
r en
d
- R
ecei
vabl
e 5
0.71
1
0.86
1
28.2
2 -
-
-
-
3
.31
193
.10
(53
.18)
(3.
54)
(13
8.15
) (
- )
(
- )
(
- )
(
- )
(
0.63
) (
195.
50)
- P
ayab
le 7
9.65
0
.57
192
.35
-
-
-
-
0.4
4 2
73.0
1
(12
8.52
) (
- )
(
180.
95)
( -
)
( -
)
(0.
35)
( -
)
(0.
11)
(30
9.92
)
Prov
isio
n fo
r do
ubtf
ul d
ebts
-
-
1.9
6 -
-
-
-
-
1
.96
( -
)
( -
)
(0.
01)
( -
)
( -
)
( -
)
( -
)
( -
)
(0.
01)
Not
es:-
1)
Prev
ious
yea
r’s
figu
res
are
show
n w
ithi
n br
acke
ts.
Notes forming part of the consolidated financial statements (Contd.)
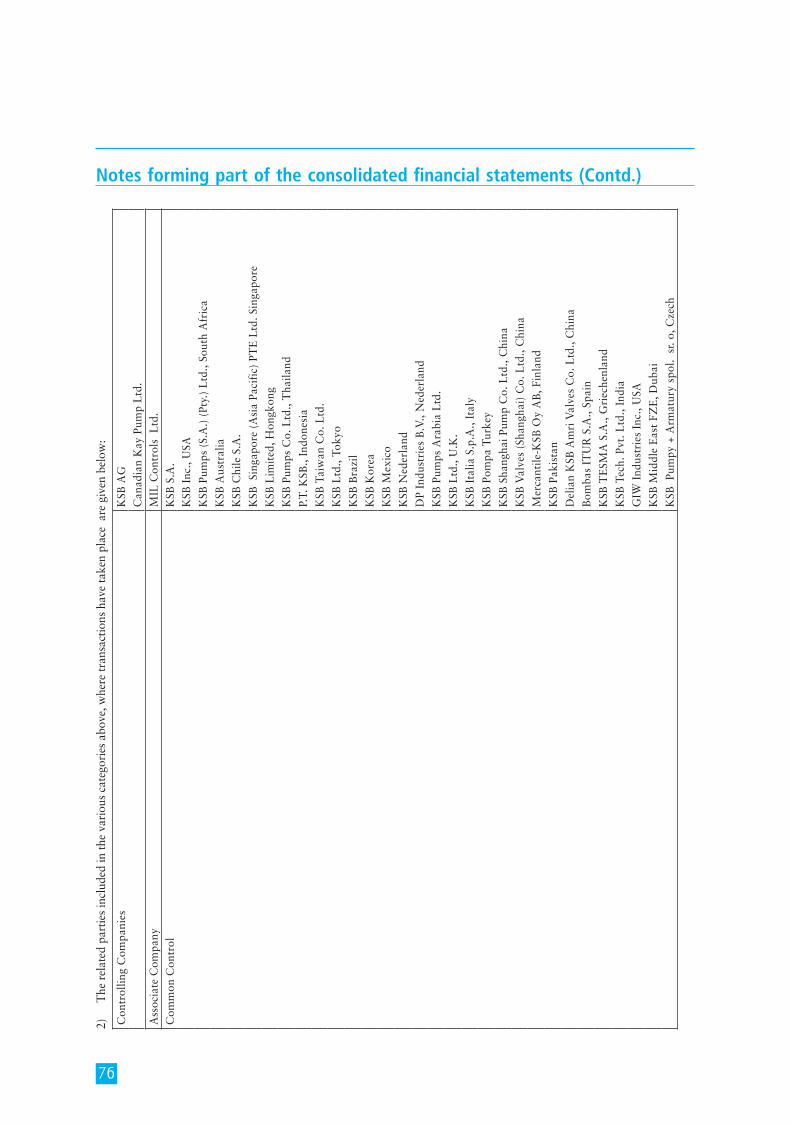
76
2)
The
rel
ated
par
ties
incl
uded
in th
e va
riou
s ca
tego
ries
abo
ve, w
here
tran
sact
ions
hav
e ta
ken
plac
e a
re g
iven
bel
ow:
Con
trol
ling
Com
pani
esK
SB A
GC
anad
ian
Kay
Pum
p L
td.
Ass
ocia
te C
ompa
nyM
IL C
ontr
ols
Ltd
.C
omm
on C
ontr
olK
SB S
.A.
KSB
Inc
., U
SA
KSB
Pum
ps (
S.A
.) (
Pty.
) L
td.,
Sout
h A
fric
a
KSB
Aus
tral
ia
KSB
Chi
le S
.A.
KSB
Sin
gapo
re (
Asi
a Pa
cifi
c) P
TE
Ltd
. Sin
gapo
re
KSB
Lim
ited
, Hon
gkon
g
KSB
Pum
ps C
o. L
td.,
Tha
iland
P.T.
KSB
., In
done
sia
KSB
Tai
wan
Co.
Ltd
.
KSB
Ltd
., To
kyo
KSB
Bra
zil
KSB
Kor
ea
KSB
Mex
ico
KSB
Ned
erla
nd
DP
Indu
stri
es B
.V.,
Ned
erla
nd
KSB
Pum
ps A
rabi
a L
td.
KSB
Ltd
., U
.K.
KSB
Ita
lia S
.p.A
., It
aly
KSB
Pom
pa T
urke
y
KSB
Sha
ngha
i Pum
p C
o. L
td.,
Chi
na
KSB
Val
ves
(Sha
ngha
i) C
o. L
td.,
Chi
na
Mer
cant
ile-K
SB O
y A
B, F
inla
nd
KSB
Pak
ista
n
Del
ian
KSB
Am
ri V
alve
s C
o. L
td.,
Chi
na
Bom
bas
ITU
R S
.A.,
Spai
n
KSB
TE
SMA
S.A
., G
riec
henl
and
KSB
Tec
h. P
vt. L
td.,
Indi
a
GIW
Ind
ustr
ies
Inc.
, USA
KSB
Mid
dle
Eas
t FZ
E, D
ubai
KSB
Pum
py +
Arm
atur
y sp
ol.
sr. o
, Cze
ch
Notes forming part of the consolidated financial statements (Contd.)
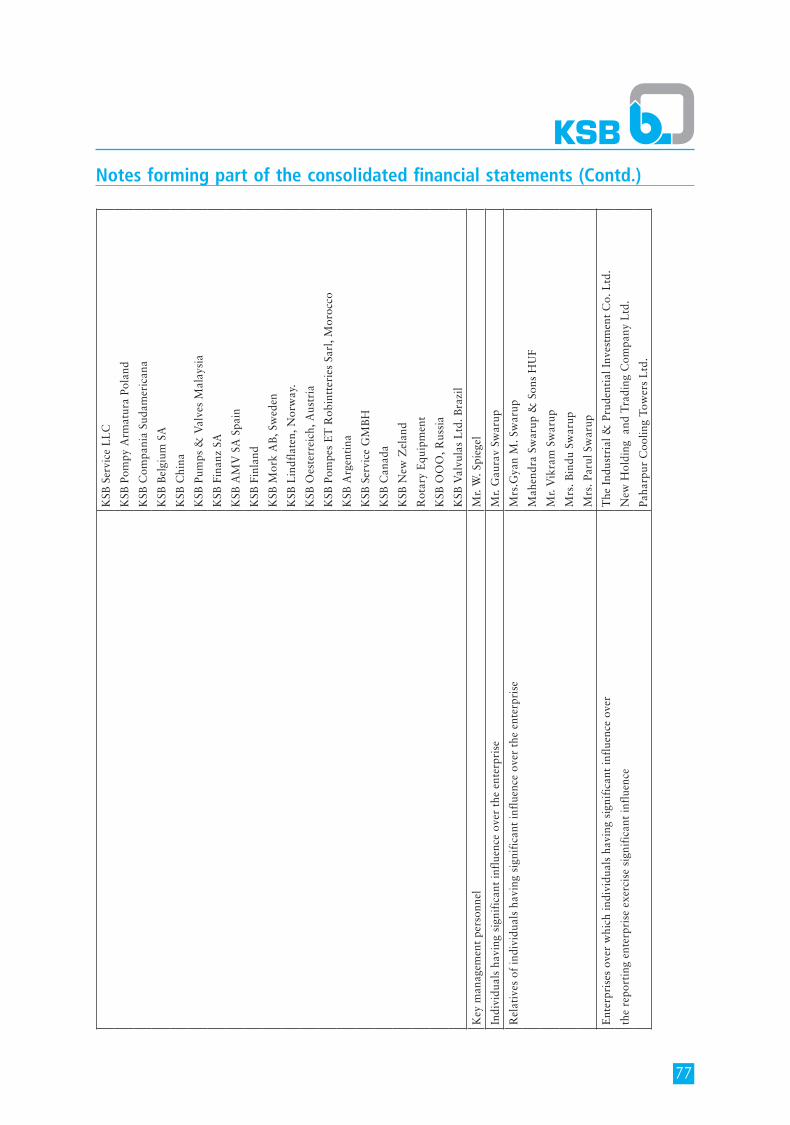
77
KSB
Ser
vice
LL
C
KSB
Pom
py A
rmat
ura
Pola
nd
KSB
Com
pani
a Su
dam
eric
ana
KSB
Bel
gium
SA
KSB
Chi
na
KSB
Pum
ps &
Val
ves
Mal
aysi
a
KSB
Fin
anz
SA
KSB
AM
V S
A S
pain
KSB
Fin
land
KSB
Mor
k A
B, S
wed
en
KSB
Lin
dfla
ten,
Nor
way
.
KSB
Oes
terr
eich
, Aus
tria
KSB
Pom
pes
ET
Rob
intt
erie
s Sa
rl, M
oroc
co
KSB
Arg
enti
na
KSB
Ser
vice
GM
BH
KSB
Can
ada
KSB
New
Zel
and
Rot
ary
Equ
ipm
ent
KSB
OO
O, R
ussi
a
KSB
Val
vula
s L
td. B
razi
l
Key
man
agem
ent
pers
onne
lM
r. W
. Spi
egel
Indi
vidu
als
havi
ng s
igni
fica
nt in
flue
nce
over
the
ent
erpr
ise
Mr.
Gau
rav
Swar
up
Rel
ativ
es o
f in
divi
dual
s ha
ving
sig
nifi
cant
infl
uenc
e ov
er t
he e
nter
pris
eM
rs.G
yan
M. S
war
up
Mah
endr
a Sw
arup
& S
ons
HU
F
Mr.
Vik
ram
Sw
arup
Mrs
. Bin
du S
war
up
Mrs
. Par
ul S
war
up
Ent
erpr
ises
ove
r w
hich
indi
vidu
als
havi
ng s
igni
fica
nt in
flue
nce
over
T
he I
ndus
tria
l & P
rude
ntia
l Inv
estm
ent
Co.
Ltd
.
the
repo
rtin
g en
terp
rise
exe
rcis
e si
gnif
ican
t in
flue
nce
New
Hol
ding
and
Tra
ding
Com
pany
Ltd
.
Paha
rpur
Coo
ling
Tow
ers
Ltd
.
Notes forming part of the consolidated financial statements (Contd.)
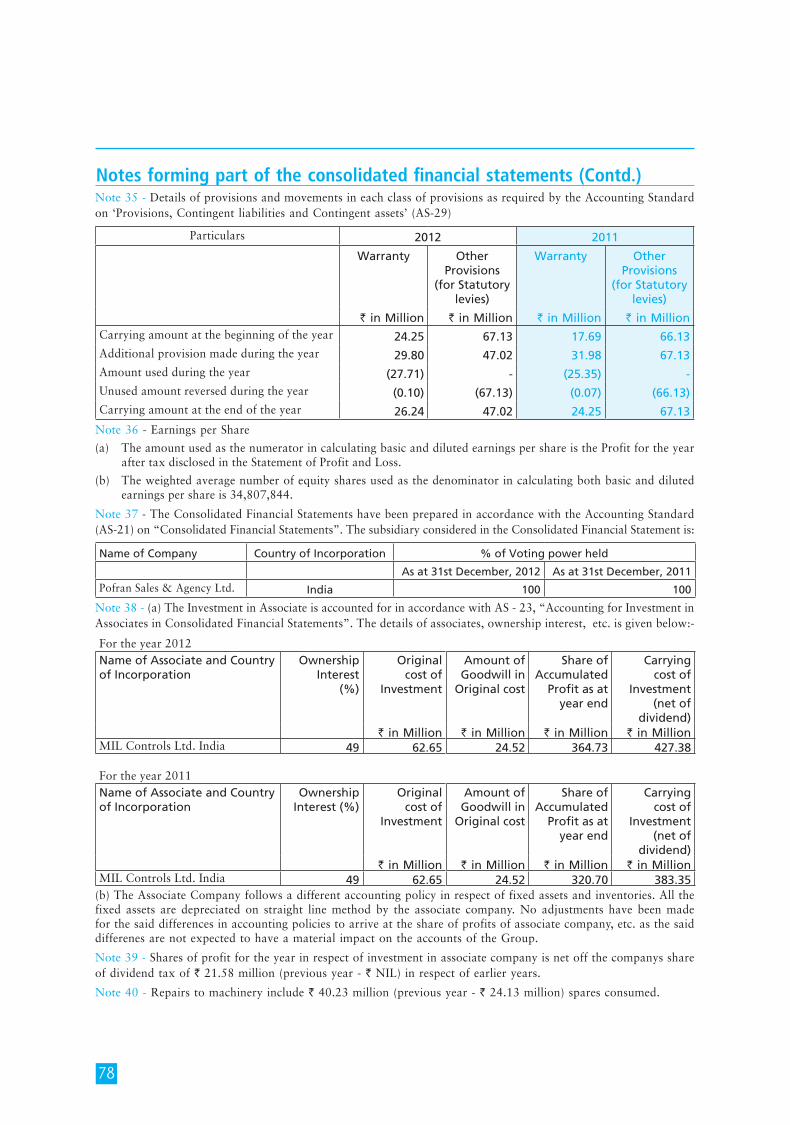
78
Notes forming part of the consolidated financial statements (Contd.)Note 35 - Details of provisions and movements in each class of provisions as required by the Accounting Standard on ‘Provisions, Contingent liabilities and Contingent assets’ (AS-29)
Particulars 2012 2011
Warranty Other Provisions
(for Statutory levies)
Warranty Other Provisions
(for Statutory levies)
` in Million ` in Million ` in Million ` in Million Carrying amount at the beginning of the year 24.25 67.13 17.69 66.13 Additional provision made during the year 29.80 47.02 31.98 67.13 Amount used during the year (27.71) - (25.35) - Unused amount reversed during the year (0.10) (67.13) (0.07) (66.13)Carrying amount at the end of the year 26.24 47.02 24.25 67.13
Note 36 - Earnings per Share
(a) The amount used as the numerator in calculating basic and diluted earnings per share is the Profit for the year after tax disclosed in the Statement of Profit and Loss.
(b) The weighted average number of equity shares used as the denominator in calculating both basic and diluted earnings per share is 34,807,844.
Note 37 - The Consolidated Financial Statements have been prepared in accordance with the Accounting Standard (AS-21) on “Consolidated Financial Statements”. The subsidiary considered in the Consolidated Financial Statement is:
Name of Company Country of Incorporation % of Voting power held
As at 31st December, 2012 As at 31st December, 2011Pofran Sales & Agency Ltd. India 100 100
Note 38 - (a) The Investment in Associate is accounted for in accordance with AS - 23, “Accounting for Investment in Associates in Consolidated Financial Statements”. The details of associates, ownership interest, etc. is given below:-
For the year 2012Name of Associate and Country of Incorporation
Ownership Interest
(%)
Original cost of
Investment
Amount of Goodwill in
Original cost
Share of Accumulated
Profit as at year end
Carrying cost of
Investment (net of
dividend)` in Million ` in Million ` in Million ` in Million
MIL Controls Ltd. India 49 62.65 24.52 364.73 427.38
For the year 2011Name of Associate and Country of Incorporation
Ownership Interest (%)
Original cost of
Investment
Amount of Goodwill in
Original cost
Share of Accumulated
Profit as at year end
Carrying cost of
Investment (net of
dividend)` in Million ` in Million ` in Million ` in Million
MIL Controls Ltd. India 49 62.65 24.52 320.70 383.35 (b) The Associate Company follows a different accounting policy in respect of fixed assets and inventories. All the fixed assets are depreciated on straight line method by the associate company. No adjustments have been made for the said differences in accounting policies to arrive at the share of profits of associate company, etc. as the said differenes are not expected to have a material impact on the accounts of the Group.
Note 39 - Shares of profit for the year in respect of investment in associate company is net off the companys share of dividend tax of ` 21.58 million (previous year - ` NIL) in respect of earlier years.
Note 40 - Repairs to machinery include ` 40.23 million (previous year - ` 24.13 million) spares consumed.
79
Notes forming part of the consolidated financial statements (Contd.)Note 41 - Income Tax
Provision for taxation for the year is an aggregate of the provision made for the year ended 31st March, 2012 as reduced by the provision for 9 months up to 31st December, 2011 and the provision based on the figures for the remaining 9 months up to 31st December, 2012. However the ultimate tax liability for the remaining 9 months up to 31st December, 2012, will be determined based on the results for the year 1st April, 2012 to 31st March, 2013
Note 42 - The Revised Schedule VI has become effective from 1st April, 2011 for the preparation of financial statements. This has significantly impacted the disclosure and presentation made in the financial statements. Previous year’s figures have been regrouped/reclassified wherever necessary to correspond with the current year’s classification/disclosure.
Signature to Notes 1 to 42
G. Swarup Chairman A.R. Broacha D.N. Damania N.N. Kampani Dr.A. Lee Directors Pradip Shah Dr. W. Schmitt M.G. Bhave W. Spiegel Managing Director Company Secretary Mumbai, 22nd February, 2013
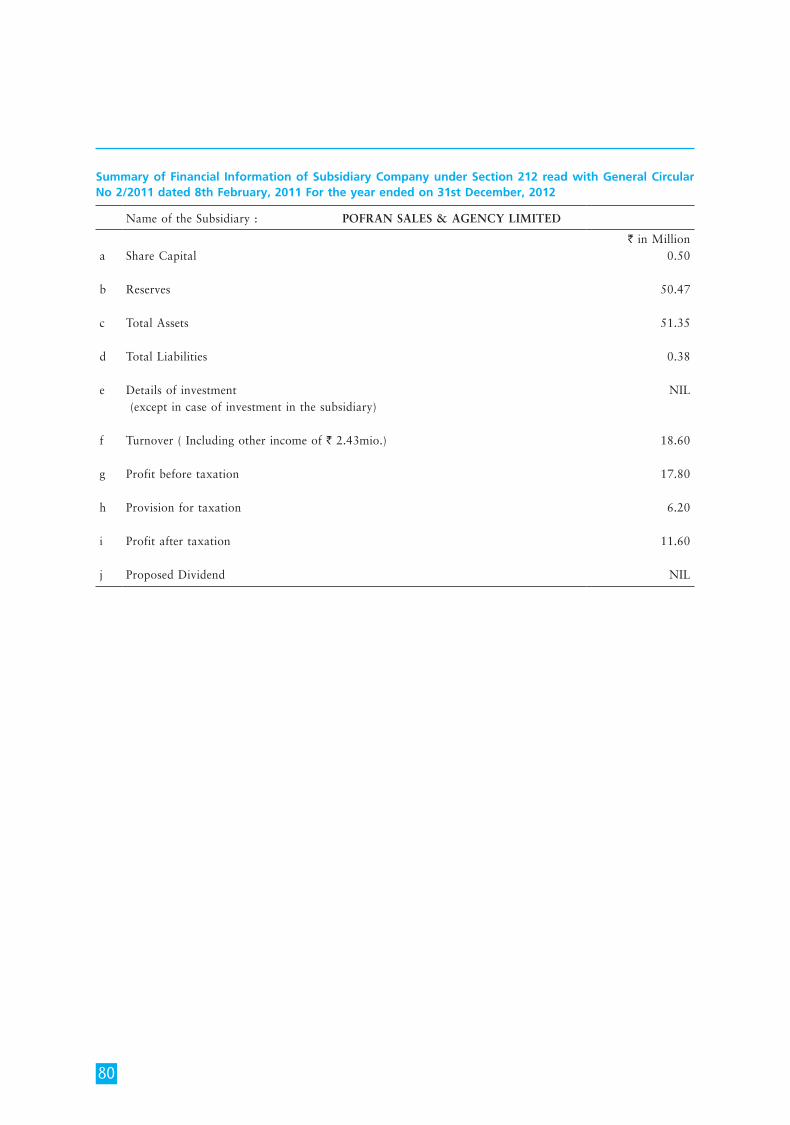
80
Summary of Financial Information of Subsidiary Company under Section 212 read with General Circular No 2/2011 dated 8th February, 2011 For the year ended on 31st December, 2012
Name of the Subsidiary : POFRAN SALES & AGENCY LIMITED
` in Milliona Share Capital 0.50
b Reserves 50.47
c Total Assets 51.35
d Total Liabilities 0.38
e Details of investment NIL (except in case of investment in the subsidiary)
f Turnover ( Including other income of ` 2.43mio.) 18.60
g Profit before taxation 17.80
h Provision for taxation 6.20
i Profit after taxation 11.60
j Proposed Dividend NIL