domestic steel manufacturing: overview and prospects
TRANSCRIPT
Domestic Steel Manufacturing:
Overview and Prospects
May 17, 2022
Congressional Research Service
https://crsreports.congress.gov
R47107
Congressional Research Service
SUMMARY
Domestic Steel Manufacturing: Overview and Prospects Based on 2020 volumes, the United States ranked as the world’s fourth-largest steel producing
country, second-largest steel importer, and twentieth-largest steel exporter. According to U.S.
Census Bureau data, steel producers recorded $29.6 billion in profits in 2021, compared with
$2.7 billion in 2020, as capacity utilization reached the highest level since 2007. Direct
employment in steel manufacturing has declined by 49%, from 257,200 workers in 1990 to
131,400 workers in 2021. Steel is a major component in many consumer and industrial products,
including motor vehicles, farm equipment, appliances in many types of buildings and highway construction, as well as in
commercial and multifamily home construction.
Over the past decade, the share of U.S. steel consumption supplied by domestic mills has varied from 70% to 90%. A
growing share of domestic production comes from “mini-mills” that melt steel scrap or direct reduced iron in electric arc
furnaces, continuing the long-standing shift away from large, integrated mills that use ovens to heat coal into coke, combine
the coke with iron ore in a blast furnace to produce pig iron, and then melt the pig iron in a basic oxygen furnace to produce
liquid steel. The mini-mill sector maintains lower capital and energy costs per ton produced than the integrated mill sector. In
addition, it has a largely nonunion workforce compared with highly unionized integrated mills. Many mini-mills are located
in the South, with some in the Midwest and West, whereas most integrated mills are in Indiana, Michigan, Ohio, and
Pennsylvania.
Since the 1970s, the U.S. government repeatedly has imposed duties on steel imports to protect U.S. steel production and
employment. As of January 2022, 311 orders were in force imposing punitive duties on imported iron and steel mill products
that were found to have been subsidized or sold below cost in the U.S. market and threaten the U.S. industry. In 2018, the
Trump Administration imposed a separate set of tariffs on steel imports from almost all countries on national security
grounds; during the Biden Administration the United States subsequently reached agreements with the European Union,
Japan, and the United Kingdom to suspend those tariffs on specified quantities of their exports. The United States also has
made increased use of domestic preference laws to require that iron and steel used in many federal projects and projects
funded by federal grants be produced in the United States.
These measures and an expanding economy helped the domestic steel industry operate at 81.1% of rated capacity in 2021, the
highest level since 2007. Domestic steel prices registered record highs throughout 2021 and remain high relative to prices
abroad. High prices and the likelihood of greater demand due to the recently enacted Infrastructure Investment and Jobs Act
(P.L. 117-58) have encouraged investments that are expected to add 8% to industry steelmaking capacity. However, they
have not led to improved productivity; steel mill tonnage per employee has been generally flat for nearly two decades.
Excess steelmaking capacity has been a long-standing concern for domestic producers. The Organisation of Economic Co-
operation and Development estimated excess capacity globally to be approximately 625 million metric tons in 2020. The
large majority of capacity is in China, which accounted for over half of global steel output in 2020, while the United States
accounted for approximately 4%. The Biden Administration has sought to address excess capacity in negotiations with
trading partners over U.S. import restrictions.
Federal and state regulations have required steelmakers to control various air emissions, water discharges, and waste
generation. No such federal standards exist for greenhouse gas emissions at present, but the possibility of future regulations
represents a potential risk for steelmakers investing in long-lived production facilities. Reducing greenhouse gas emissions
from steelmaking is likely to require new technologies in an industry that traditionally has spent little on research and
development domestically. Several new approaches to reducing iron ore to elemental iron are in developmental phases, and
implementing them is likely to require significant capital investments. The House-passed version of the America
COMPETES Act of 2022 (H.R. 4521) seeks to establish a Department of Energy-led led research and development program
specific to low-emissions steel manufacturing, working in collaboration with partners that span academia, industry, and
government.
R47107
May 17, 2022
Christopher D. Watson Analyst in Industrial Organization and Business
Domestic Steel Manufacturing: Overview and Prospects
Congressional Research Service
Contents
Introduction ..................................................................................................................................... 1
The Iron and Steel Manufacturing Process ..................................................................................... 1
Raw Materials Sourcing ............................................................................................................ 3
Operating Environment of the Domestic Industry .......................................................................... 3
Steel Prices and Downstream Industries ................................................................................... 5 Domestic Content Regimes ....................................................................................................... 8
Steel Manufacturing Employment and Productivity ....................................................................... 8
Steel Mill Productivity .............................................................................................................. 9
“Green Steel” ................................................................................................................................. 10
Research and Development Funding and Decarbonized Efforts ............................................. 12
Issues for Congress ........................................................................................................................ 14
Figures
Figure 1. The Iron and Steel Manufacturing Process ...................................................................... 2
Figure 2. U.S. Steel Industry Capacity and Domestic Production................................................... 4
Figure 3. Domestic Steel Consumption, Exports, and Imports ....................................................... 5
Figure 4. U.S. Antidumping and Countervailing Duty Orders on Iron and Steel ............................ 7
Figure 5. U.S. Steel Manufacturing Employment ......................................................................... 10
Figure 6. U.S. Steel Mill Productivity ........................................................................................... 10
Contacts
Author Information ........................................................................................................................ 15
Domestic Steel Manufacturing: Overview and Prospects
Congressional Research Service 1
Introduction The condition of the domestic steel industry has been a long-standing concern of Congress
because of steel’s use in a wide range of consumer and industrial products—including motor
vehicles, farm equipment, and appliances in many types of buildings and highway construction—
and because of the economic activity and manufacturing jobs steel mills generate.
This report provides an overview of the domestic steel industry and its operating environment. It
discusses industry capacity and output, steel prices, steel trade and regulatory measures, and
employment and productivity. The report also examines efforts to reduce the industry’s
greenhouse gas emissions by developing “green steel.” The report concludes with a discussion of
select issues that may be of potential interest to Congress.
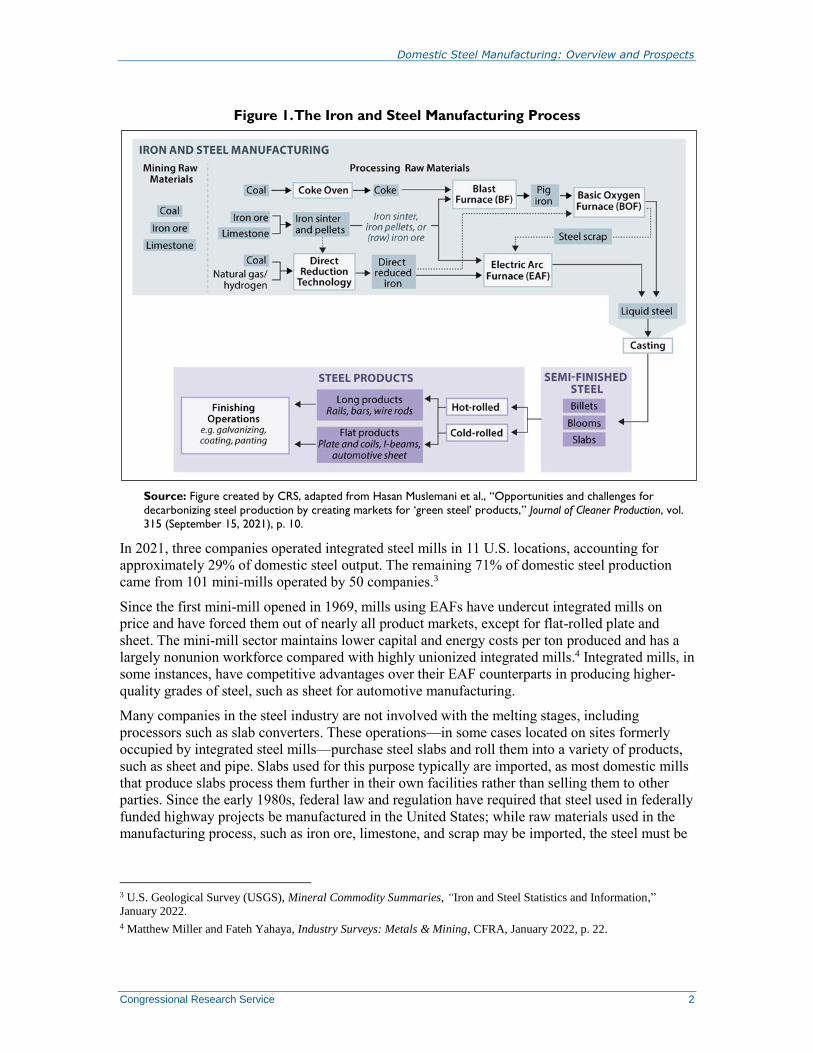
The Iron and Steel Manufacturing Process Steel mills operate in two distinct ways. The traditional production method occurs at large,
vertically integrated mills, which use ovens to heat coal into coke;1 combine the coke with iron
ore in a blast furnace to produce pig iron; and then melt the pig iron in a basic oxygen furnace to
produce liquid steel. This production process is commonly known as the Blast-Furnace/Basic
Oxygen Furnace (BF-BOF) method.
The alternate method occurs through “mini-mills,” which use electric arc furnaces (EAFs) to melt
steel scrap and, in some instances, use iron pellets to produce liquid steel. Unlike integrated mills,
mini-mills do not require coke ovens or blast furnaces. However, some mini-mills use a process
called direct reduction to remove oxygen from iron ore with heat from burning natural gas; the
resulting product, direct reduced iron (DRI) or sponge iron, is turned into a lump, pellet, or
briquetted form that can be transformed into liquid steel in EAFs.2
Once steel is produced in its liquid state, it is cast into rectangular slabs (long billets a few inches
on a side) or other shapes and left to cool. Rolling mills then shape the semifinished steel into a
variety of products, generally classified as either “flat” products (plate and coils of steel sheet) or
“long” products (bars, rails, wire rods). The rolled steel products often undergo additional
finishing operations, such as coating, painting, and galvanizing, to produce finished steel. Figure
1 shows the process for manufacturing iron, steel, and finished steel products.
1 Coke or coking coal—a solid mostly consisting of carbon—is the result of coal being heated at high temperatures in a
coking oven, which drives off volatile compounds. In integrated steelmaking, coking coal is a necessary input that is
combined with iron ore in a blast furnace to produce pig iron.
2 Three domestic producers operate direct reduction facilities. Nucor Corporation operates a direct reduced iron facility
in Convent, LA. Cleveland-Cliffs and Voestalpine Texas operate hot-briquetted iron facilities, which use a more
compacted form of direct reduction technology, in Toledo, OH, and Corpus Christi, TX, respectively.
Domestic Steel Manufacturing: Overview and Prospects
Congressional Research Service 2
Figure 1. The Iron and Steel Manufacturing Process
Source: Figure created by CRS, adapted from Hasan Muslemani et al., “Opportunities and challenges for
decarbonizing steel production by creating markets for ‘green steel’ products,” Journal of Cleaner Production, vol.
315 (September 15, 2021), p. 10.
In 2021, three companies operated integrated steel mills in 11 U.S. locations, accounting for
approximately 29% of domestic steel output. The remaining 71% of domestic steel production
came from 101 mini-mills operated by 50 companies.3
Since the first mini-mill opened in 1969, mills using EAFs have undercut integrated mills on
price and have forced them out of nearly all product markets, except for flat-rolled plate and
sheet. The mini-mill sector maintains lower capital and energy costs per ton produced and has a
largely nonunion workforce compared with highly unionized integrated mills.4 Integrated mills, in
some instances, have competitive advantages over their EAF counterparts in producing higher-
quality grades of steel, such as sheet for automotive manufacturing.
Many companies in the steel industry are not involved with the melting stages, including
processors such as slab converters. These operations—in some cases located on sites formerly
occupied by integrated steel mills—purchase steel slabs and roll them into a variety of products,
such as sheet and pipe. Slabs used for this purpose typically are imported, as most domestic mills
that produce slabs process them further in their own facilities rather than selling them to other
parties. Since the early 1980s, federal law and regulation have required that steel used in federally
funded highway projects be manufactured in the United States; while raw materials used in the
manufacturing process, such as iron ore, limestone, and scrap may be imported, the steel must be
3 U.S. Geological Survey (USGS), Mineral Commodity Summaries, “Iron and Steel Statistics and Information,”
January 2022.
4 Matthew Miller and Fateh Yahaya, Industry Surveys: Metals & Mining, CFRA, January 2022, p. 22.
Domestic Steel Manufacturing: Overview and Prospects
Congressional Research Service 3
melted and poured in the United States.5 Since 2021, federal law has extended the melted and
poured requirement for iron and steel to more types of federally funded infrastructure projects.6
Consequently, steel mill products made by slab converters using imported slabs do not qualify.
Raw Materials Sourcing
The raw materials used by both integrated mills and mini-mills in steel production are largely
sourced in the United States. Integrated steel mills primarily use iron ore obtained from mines in
Michigan and Minnesota, which account for more than 90% of domestic iron ore supply.7 U.S.-
mined iron ore takes the form of taconite, a relatively low-grade source of iron-bearing rock that
must be ground and then rolled into pellets to be useful in steelmaking.8 Nearly all steel scrap
used by mini-mills is obtained from domestic sources.9 However, the end products from which
steel scrap is derived, such as motor vehicle bodies and beams used in construction, may have
originally been imported.
Operating Environment of the Domestic Industry Demand for steel is highly cyclical, coming overwhelmingly from interest rate-sensitive sectors,
such as construction and automotive manufacturing. Domestic steel consumption was 98 million
metric tons in 2021, up 18% from 2020—when the Coronavirus Disease 2019 (COVID-19)
pandemic led to temporary shutdowns of auto assembly lines—but well below the peak of 117
million metric tons in 2014. The two largest end-markets for steel in 2021 were construction and
automotive, accounting for 47% and 25% of demand, respectively.10
The industry’s profitability depends heavily on its capacity utilization. Steelmakers often lose
money when demand is weak and production capacity is underutilized, but a small increase in
capacity utilization can bring dramatic increase in profits. In 2021, steel producers recorded $29.6
billion in profits, compared with $2.7 billion in 2020, according to U.S. Census Bureau data.11
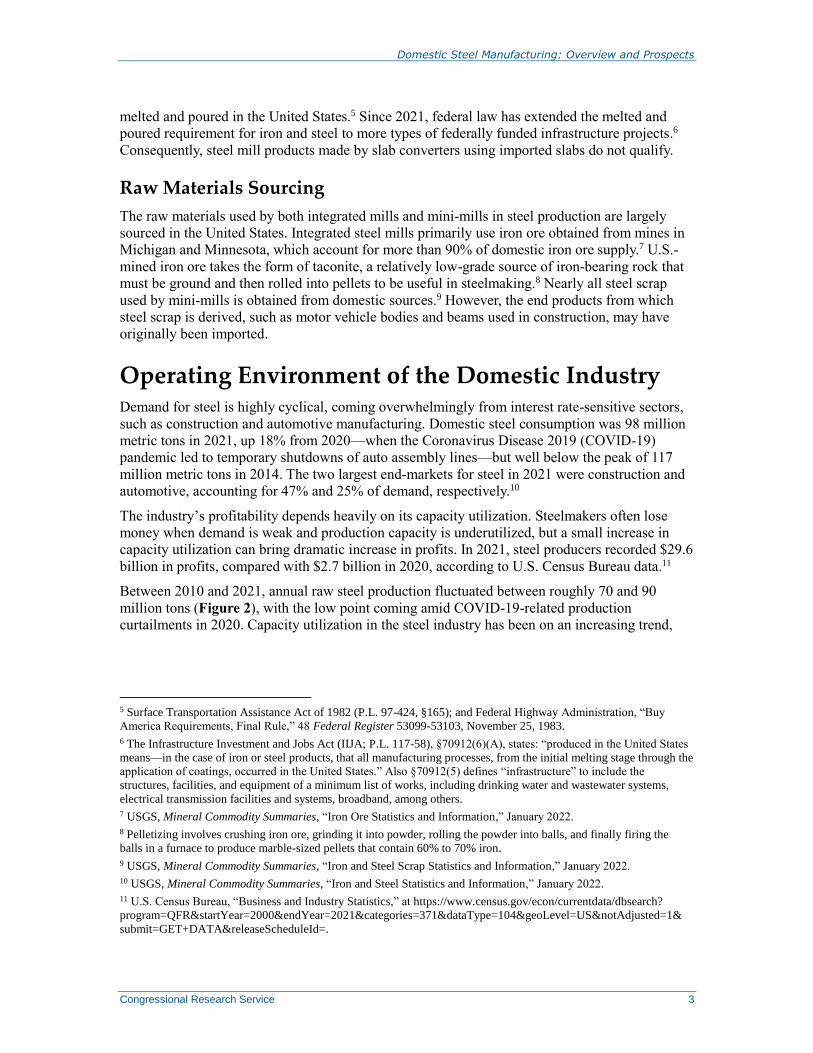
Between 2010 and 2021, annual raw steel production fluctuated between roughly 70 and 90
million tons (Figure 2), with the low point coming amid COVID-19-related production
curtailments in 2020. Capacity utilization in the steel industry has been on an increasing trend,
5 Surface Transportation Assistance Act of 1982 (P.L. 97-424, §165); and Federal Highway Administration, “Buy
America Requirements, Final Rule,” 48 Federal Register 53099-53103, November 25, 1983.
6 The Infrastructure Investment and Jobs Act (IIJA; P.L. 117-58), §70912(6)(A), states: “produced in the United States
means—in the case of iron or steel products, that all manufacturing processes, from the initial melting stage through the
application of coatings, occurred in the United States.” Also §70912(5) defines “infrastructure” to include the
structures, facilities, and equipment of a minimum list of works, including drinking water and wastewater systems,
electrical transmission facilities and systems, broadband, among others.
7 USGS, Mineral Commodity Summaries, “Iron Ore Statistics and Information,” January 2022.
8 Pelletizing involves crushing iron ore, grinding it into powder, rolling the powder into balls, and finally firing the
balls in a furnace to produce marble-sized pellets that contain 60% to 70% iron.
9 USGS, Mineral Commodity Summaries, “Iron and Steel Scrap Statistics and Information,” January 2022.
10 USGS, Mineral Commodity Summaries, “Iron and Steel Statistics and Information,” January 2022.
11 U.S. Census Bureau, “Business and Industry Statistics,” at https://www.census.gov/econ/currentdata/dbsearch?
program=QFR&startYear=2000&endYear=2021&categories=371&dataType=104&geoLevel=US¬Adjusted=1&
submit=GET+DATA&releaseScheduleId=.
Domestic Steel Manufacturing: Overview and Prospects
Congressional Research Service 4
save for a drop in 2020; in 2021, 81.1% of production capacity was utilized, the highest level
since 2007.12
One long-standing concern for domestic producers is global excess steelmaking capacity, which
the Organisation for Economic Co-operation and Development (OECD) estimated at
approximately 625 million metric tons in 2020.13 In short, excess capacity means that steelmaking
facilities have the capacity to produce more steel than the market demands. The large majority of
capacity is in China, which accounted for 57% of global steel output in 2020, with all other
producing countries having shares of 6% or less.14
Figure 2. U.S. Steel Industry Capacity and Domestic Production
Source: American Iron and Steel Institute (AISI), 2020 Annual Statistical Report, p. 3; and U.S. Geological Survey
(USGS), “Iron and Steel Statistics and Information.”
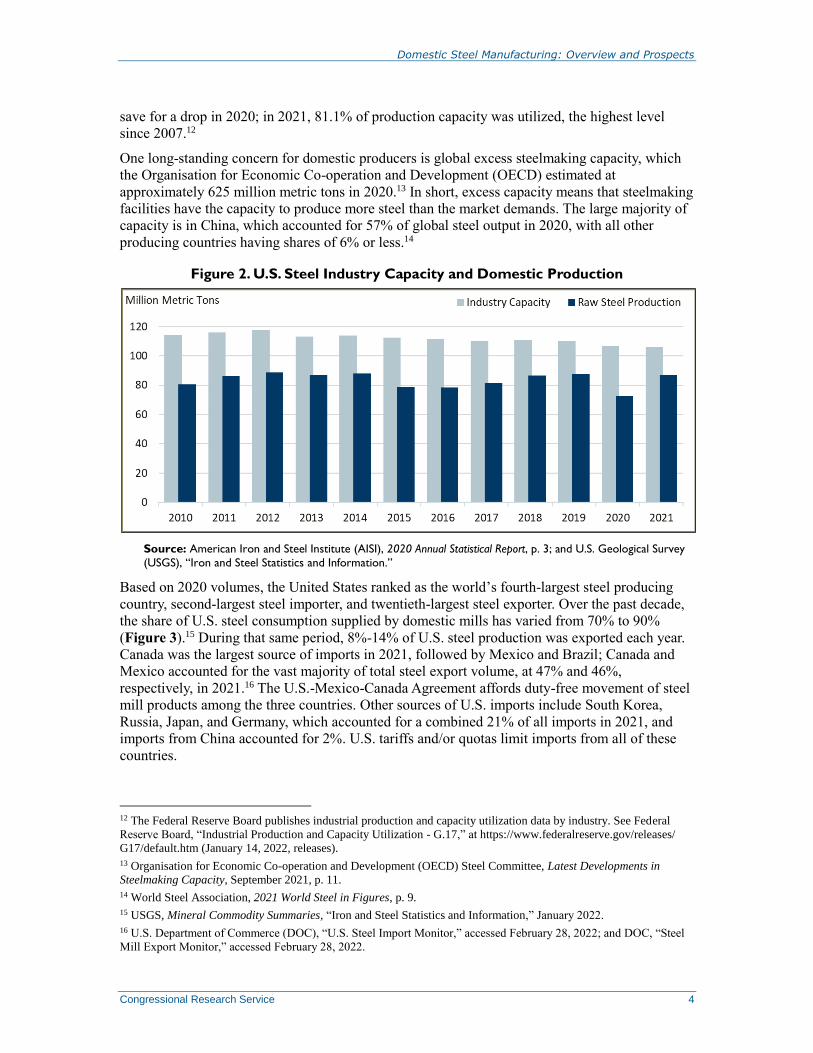
Based on 2020 volumes, the United States ranked as the world’s fourth-largest steel producing
country, second-largest steel importer, and twentieth-largest steel exporter. Over the past decade,
the share of U.S. steel consumption supplied by domestic mills has varied from 70% to 90%
(Figure 3).15 During that same period, 8%-14% of U.S. steel production was exported each year.
Canada was the largest source of imports in 2021, followed by Mexico and Brazil; Canada and
Mexico accounted for the vast majority of total steel export volume, at 47% and 46%,
respectively, in 2021.16 The U.S.-Mexico-Canada Agreement affords duty-free movement of steel
mill products among the three countries. Other sources of U.S. imports include South Korea,
Russia, Japan, and Germany, which accounted for a combined 21% of all imports in 2021, and
imports from China accounted for 2%. U.S. tariffs and/or quotas limit imports from all of these
countries.
12 The Federal Reserve Board publishes industrial production and capacity utilization data by industry. See Federal
Reserve Board, “Industrial Production and Capacity Utilization - G.17,” at https://www.federalreserve.gov/releases/
G17/default.htm (January 14, 2022, releases).
13 Organisation for Economic Co-operation and Development (OECD) Steel Committee, Latest Developments in
Steelmaking Capacity, September 2021, p. 11.
14 World Steel Association, 2021 World Steel in Figures, p. 9.
15 USGS, Mineral Commodity Summaries, “Iron and Steel Statistics and Information,” January 2022.
16 U.S. Department of Commerce (DOC), “U.S. Steel Import Monitor,” accessed February 28, 2022; and DOC, “Steel
Mill Export Monitor,” accessed February 28, 2022.
Domestic Steel Manufacturing: Overview and Prospects
Congressional Research Service 5
Figure 3. Domestic Steel Consumption, Exports, and Imports
Sources: AISI; USGS, “Iron and Steel Statistics and Information”; and U.S. Department of Commerce, “Global
Steel Trade Monitor” (various reports).
Investments presently underway are expected to add roughly 8% to industry steelmaking
capacity.17 The large majority of these investments are in EAF mills, continuing the long-standing
shift away from integrated production. For example, in 2021, the United States Steel Corporation
(U.S. Steel), now the third-largest producer of raw steel in the United States, cancelled plans to
modernize its integrated Mon Valley Works in western Pennsylvania and discontinued production
of raw steel at its integrated Great Lakes Works near Detroit. U.S. Steel also acquired full control
of an Arkansas mini-mill operator, Big River Steel, which is building a new mill with an EAF.18
No new U.S. blast furnaces are being built, and several have been idled in recent years.
Domestic steel manufacturing operations have expanded geographically over the years.
Traditionally, integrated mills operated primarily in Indiana, Michigan, Ohio, and Pennsylvania.
The shift of manufacturing and construction to parts of the South and West, however, has led steel
producers to open mini-mills in those areas to be closer to customers.
Steel Prices and Downstream Industries
Domestic steel prices in the United States are higher than those in other major markets. In
December 2021, the price of hot-rolled band steel per metric ton was $646 in China and $1,031 in
Europe, compared with $1,855 in the United States.19 CFRA, an industry research firm, contends
17 This CRS calculation is based on U.S. steel industry capacity of 106 million metric tons in 2021, based on USGS,
Mineral Commodity Summaries, “Iron and Steel Statistics and Information,” January 2022 and SteelOrbis, “US steel
industry: A look back at 2021 and a look ahead to 2022,” December 30, 2021, at https://www.steelorbis.com/steel-
news/latest-news/us-steel-industry-a-look-back-at-2021-and-a-look-ahead-to-2022-1228244.htm.
18 United States Steel Corporation (U.S. Steel), Form 10-K for the year ending December 31, 2021, pp. 4, 8; U.S. Steel,
“First Quarter 2021 Earnings Call,” April 30, 2021, p. 10, at https://s26.q4cdn.com/153509673/files/doc_financials/
2021/q1/1Q-2021-Earnings-Call-Slides-20210430-vFINAL.pdf; U.S. Steel, “U. S. Steel Selects Osceola, Arkansas as
Location for Most Advanced Steelmaking Facility in North America,” January 11, 2022, at
https://investors.ussteel.com/news/news-details/2022/U.-S.-Steel-Selects-Osceola-Arkansas-as-Location-for-Most-
Advanced-Steelmaking-Facility-in-North-America/default.aspx; and Nucor Corporation, “Nucor to Build State-of-the-
Art Sheet Mill,” September 20, 2021, at https://www.nucor.com/news-release/#item=18306.
19 World Steel Dynamics, SteelBenchmarker: Price History, Tables and Charts, December 27, 2021, at
http://steelbenchmarker.com/history.pdf.
Domestic Steel Manufacturing: Overview and Prospects
Congressional Research Service 6
that U.S. steel prices were at unsustainable levels in 2021 and will ultimately correct as supply
chains begin to rebalance and that the domestic industry’s record earnings in 2021 will be the
cyclical peak.20 Domestic steel prices have dropped in 2022, averaging $1,481 per ton through
March, yet remain high relative to prices abroad.21
A key reason domestic steel prices are higher than foreign prices is that the United States
maintains significant restrictions on steel imports. These restrictions help shield domestic
producers from foreign competition by limiting the volume of imports into the U.S. market.
Import protection has been in effect, in various forms, since the late 1970s. Sources of import
competition have shifted across different countries over the decades as trading partners have
sought to support and expand their own domestic steel production.
Over the past 50 years, the United States has repeatedly imposed or negotiated restraints on
imports of steel or steel products in response to complaints by U.S. steelmakers and unions that
the U.S. industry was injured or threatened with injury by imports that were subsidized, sold
below fair market value (“dumped”), or otherwise supported by unfair trade practices.22 One
example occurred in March 2018 when the Trump Administration imposed a 25% tariff on certain
steel products from virtually all countries under Section 232 of the Trade Expansion Act of 1962
(19 U.S.C. §1862, as amended), which allows restrictions, such as tariffs or import quotas, on
imports that have been found to harm national security.23 The Trump Administration’s stated
objective was to reduce import volumes to a level that would enable the domestic industry to
operate at 80% or more of rated production capacity.24 In October 2021, the United States and the
European Union (EU) reached an agreement under which the Section 232 tariffs were replaced
with a tariff-rate quota allowing a specified quantity of steel imported from the EU to enter the
United States duty-free each year.25 The United States reached similar agreements with Japan in
February 2022 and with the United Kingdom in March 2022.26
As of January 2022, 311 antidumping duty and countervailing duty orders were in force imposing
punitive duties on iron and steel mill products from other countries, accounting for 47% of all
20 Matthew Miller and Fateh Yahaya, Industry Surveys: Metals & Mining, CFRA, January 2022, p. 4.
21 World Steel Dynamics, SteelBenchmarker: Price History, Tables and Charts, March 28, 2022, at
http://steelbenchmarker.com/history.pdf.
22 For more information on trade remedies, see CRS Report R46296, Trade Remedies: Antidumping, by Christopher A.
Casey; and CRS Report R46882, Trade Remedies: Countervailing Duties, by Christopher A. Casey and Liana Wong.
23 At the same time, Section 232 tariffs were applied to aluminum imports at a 10% rate. In May 2019, Canada and
Mexico were exempted permanently from the Section 232 tariffs. Australia is not subject to any import restrictions;
Argentina, Brazil, and South Korea are subject to annualized quotas in lieu of the tariffs.
24 Bureau of Industry and Security, The Effect of Imports of Steel on the National Security, 2018, p. 5.
25 Under the agreement, the United States will exempt up to 3.3 million metric tons of steel products imported from the
European Union from Section 232 tariffs each year. If imports were to exceed this quantity, then the Section 232 duties
would be reimposed for the remainder of the calendar year. Office of the United States Trade Representative (USTR),
“Joint US-EU Statement on Trade in Steel and Aluminum,” press release, October 31, 2021, at https://ustr.gov/about-
us/policy-offices/press-office/press-releases/2021/october/joint-us-eu-statement-trade-steel-and-aluminum.
26 The agreement with Japan allows 1.25 million metric tons of steel per year to enter the United States duty-free. It
took effect on April 1, 2022. USTR, “Tai, Raimondo Statements on 232 Tariff Agreement with Japan,” press release,
February 7, 2022, at https://ustr.gov/about-us/policy-offices/press-office/press-releases/2022/february/tai-raimondo-
statements-232-tariff-agreement-japan. The agreement with the United Kingdom allows 0.5 million tons of steel
products in 54 categories to enter duty-free each year, effective June 1, 2022. USTR, “Announcement of Action on UK
Imports Under Section 232,” March 22, 2022, at https://www.commerce.gov/sites/default/files/2022-03/UK232-US-
Statement.pdf.
Domestic Steel Manufacturing: Overview and Prospects
Congressional Research Service 7
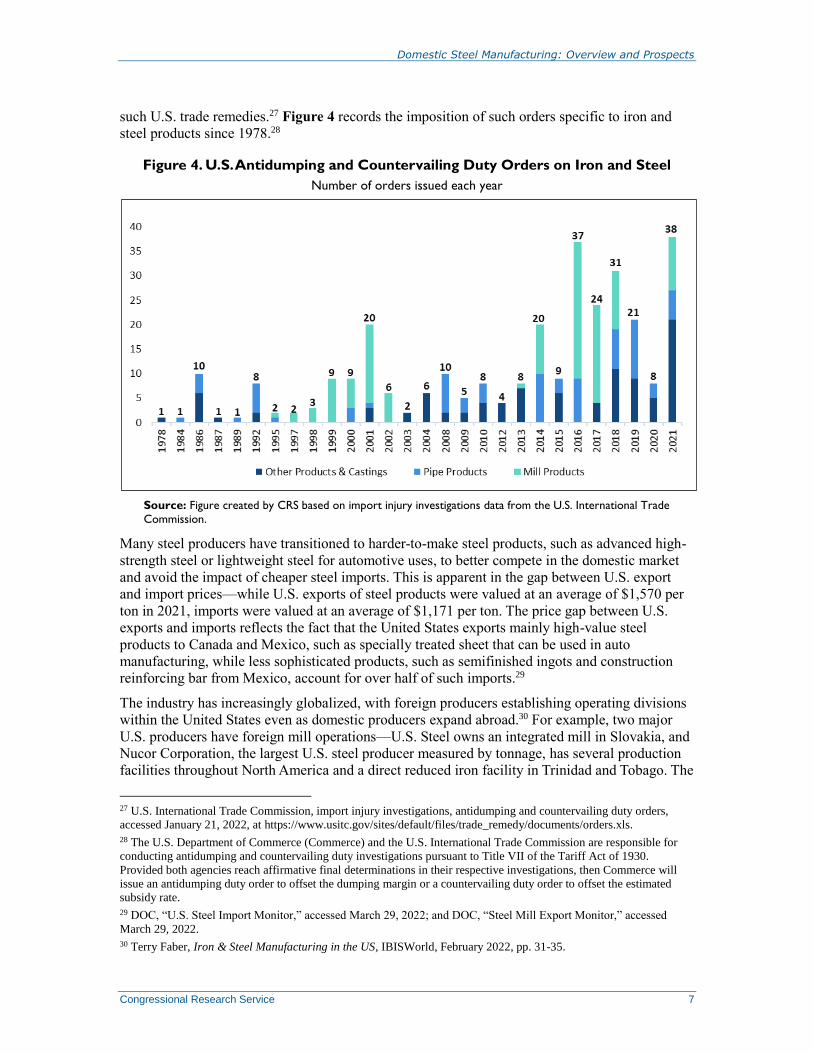
such U.S. trade remedies.27 Figure 4 records the imposition of such orders specific to iron and
steel products since 1978.28
Figure 4. U.S. Antidumping and Countervailing Duty Orders on Iron and Steel
Number of orders issued each year
Source: Figure created by CRS based on import injury investigations data from the U.S. International Trade
Commission.
Many steel producers have transitioned to harder-to-make steel products, such as advanced high-
strength steel or lightweight steel for automotive uses, to better compete in the domestic market
and avoid the impact of cheaper steel imports. This is apparent in the gap between U.S. export
and import prices—while U.S. exports of steel products were valued at an average of $1,570 per
ton in 2021, imports were valued at an average of $1,171 per ton. The price gap between U.S.
exports and imports reflects the fact that the United States exports mainly high-value steel
products to Canada and Mexico, such as specially treated sheet that can be used in auto
manufacturing, while less sophisticated products, such as semifinished ingots and construction
reinforcing bar from Mexico, account for over half of such imports.29
The industry has increasingly globalized, with foreign producers establishing operating divisions
within the United States even as domestic producers expand abroad.30 For example, two major
U.S. producers have foreign mill operations—U.S. Steel owns an integrated mill in Slovakia, and
Nucor Corporation, the largest U.S. steel producer measured by tonnage, has several production
facilities throughout North America and a direct reduced iron facility in Trinidad and Tobago. The
27 U.S. International Trade Commission, import injury investigations, antidumping and countervailing duty orders,
accessed January 21, 2022, at https://www.usitc.gov/sites/default/files/trade_remedy/documents/orders.xls.
28 The U.S. Department of Commerce (Commerce) and the U.S. International Trade Commission are responsible for
conducting antidumping and countervailing duty investigations pursuant to Title VII of the Tariff Act of 1930.
Provided both agencies reach affirmative final determinations in their respective investigations, then Commerce will
issue an antidumping duty order to offset the dumping margin or a countervailing duty order to offset the estimated
subsidy rate.
29 DOC, “U.S. Steel Import Monitor,” accessed March 29, 2022; and DOC, “Steel Mill Export Monitor,” accessed
March 29, 2022.
30 Terry Faber, Iron & Steel Manufacturing in the US, IBISWorld, February 2022, pp. 31-35.
Domestic Steel Manufacturing: Overview and Prospects
Congressional Research Service 8
Brazilian steelmaker Gerdau operates steel mills in the United States and Canada, while Welded
Tube of Canada, a producer of oil country tubular goods—pipes and casings used in oil drilling—
produces unfinished welded tubular products at its two mills in New York State, exports the
unfinished goods to its Canadian parent for finishing operations, such as heat treatment and
threading, and ships the final products back to the United States.
Domestic Content Regimes
In addition to trade measures, domestic preference statutes provide support to the U.S. steel
industry. The Buy American Act of 1933 governs purchases by the federal government and
requires that final products be mined, produced, or manufactured in the United States. If
manufactured, either at least 55% of the cost of components (by value) must be manufactured in
the United States or the end product must be a commercially available off-the-shelf item. In
March 2022, the Biden Administration announced that the domestic content threshold specific to
federal procurement would increase from 55% to 60% later that year, to 65% in 2024, and to 75%
in 2029.31
Separately, several statutes and regulations, referred to collectively as “Buy America,” require
certain recipients of federal financial assistance for infrastructure-related projects to use domestic
steel. Traditionally, Buy America covered highways, public transportation, airports, aviation, and
intercity passenger rail, including Amtrak. The Infrastructure Investment and Jobs Act (IIJA; P.L.
117-58), enacted in November 2021, appropriates approximately $1.2 trillion through 2026 for a
wide range of infrastructure investments, including electric transmission facilities, structures and
equipment of electric utilities, broadband infrastructure, real property and buildings, wastewater
facilities, and transportation facilities. The law extended Buy America to cover federally funded
projects in all of these sectors.32 In general, all iron and steel purchased for such projects must be
melted and poured in the United States, and most components or equipment containing iron or
steel must come from U.S. producers. Federal agencies administering these laws may grant
waivers under certain circumstances.
Slab converters have sought waivers for products they manufacture in the United States from
imported steel slabs, claiming there is insufficient domestic supply of semifinished steel slabs
from U.S. mills.33 To date, the Federal Highway Administration has not granted a waiver to slab
converters. Provisions in the IIJA may make waivers more difficult to obtain.34
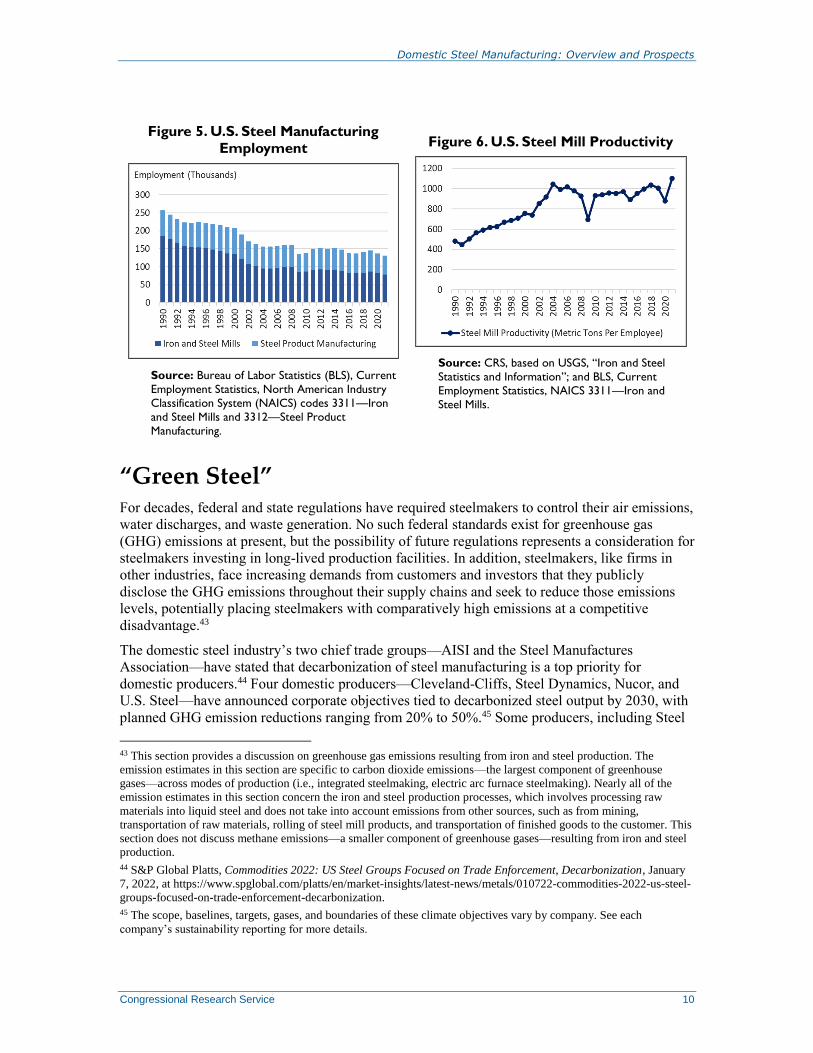
Steel Manufacturing Employment and Productivity Steel mills directly employed 78,900 workers in 2021, representing less than 1% of the nation’s
12.3 million manufacturing jobs. Steel mill employment declined 58% between 1990 and 2021
(Figure 5). The U.S. government projects employment in steel mills to rise approximately 1%
31 Department of Defense, General Services Administration, National Aeronautics and Space Administration, “Federal
Acquisition Regulation: Amendments to the FAR Buy American Act Requirements,” 87 Federal Register 12780,
March 7, 2022.
32 For more information on Buy America and the IIJA, see CRS In Focus IF11989, Congress Expands Buy America
Requirements in the Infrastructure Investment and Jobs Act (P.L. 117-58), by Christopher D. Watson.
33 Slab converters include firms such as California Steel Industries and NLMK USA that produce hot-rolled, cold-
rolled, and galvanized sheet from slabs poured by steel mills, including foreign suppliers. California Steel Industries,
Comments on Section 232 National Security Investigation of Imports of Steel, May 31, 2017, pp. 2-3; NLMK USA,
Comments on Section 232 National Security Investigation of Imports of Steel, May 31, 2017, pp. 2-4.
34 IIJA (P.L. 117-58) §70916(c), §70921(b-c), and §70923(b-c).
Domestic Steel Manufacturing: Overview and Prospects
Congressional Research Service 9
between 2020 and 2030.35 A relatively large segment of the steel industry is comprised of firms
involved in steel product manufacturing, which includes steel processors. In 2021, steel product
manufacturing directly employed 52,500 workers, representing 40% of total steel industry
employment.36 Between 1990 and 2021, steel product manufacturing employment averaged
approximately one-third of total steel industry employment. Total steel industry employment has
declined 49%, from 257,200 workers in 1990 to 131,400 workers in 2021. Steel mill workers
earned an average annual wage of $88,325 in 2020, higher than the annual average of $73,397 for
all manufacturing.37 The average annual wage in steel product manufacturing was $68,585.
The domestic content provisions in the IIJA could preserve or increase employment in the steel
industry. The American Iron and Steel Institute (AISI) estimates that 2.1 labor hours were
required to produce one ton of steel in 2020.38 Based on AISI’s estimate that $100 billion of
infrastructure investment will create demand for five million tons of steel, an additional federal
outlay of that amount would be expected to lead to 5,048 worker-years of employment in steel
production, excluding activities such as administrative support, maintenance, and sales and
marketing.39 Other assumptions and data sources may yield other employment estimates.
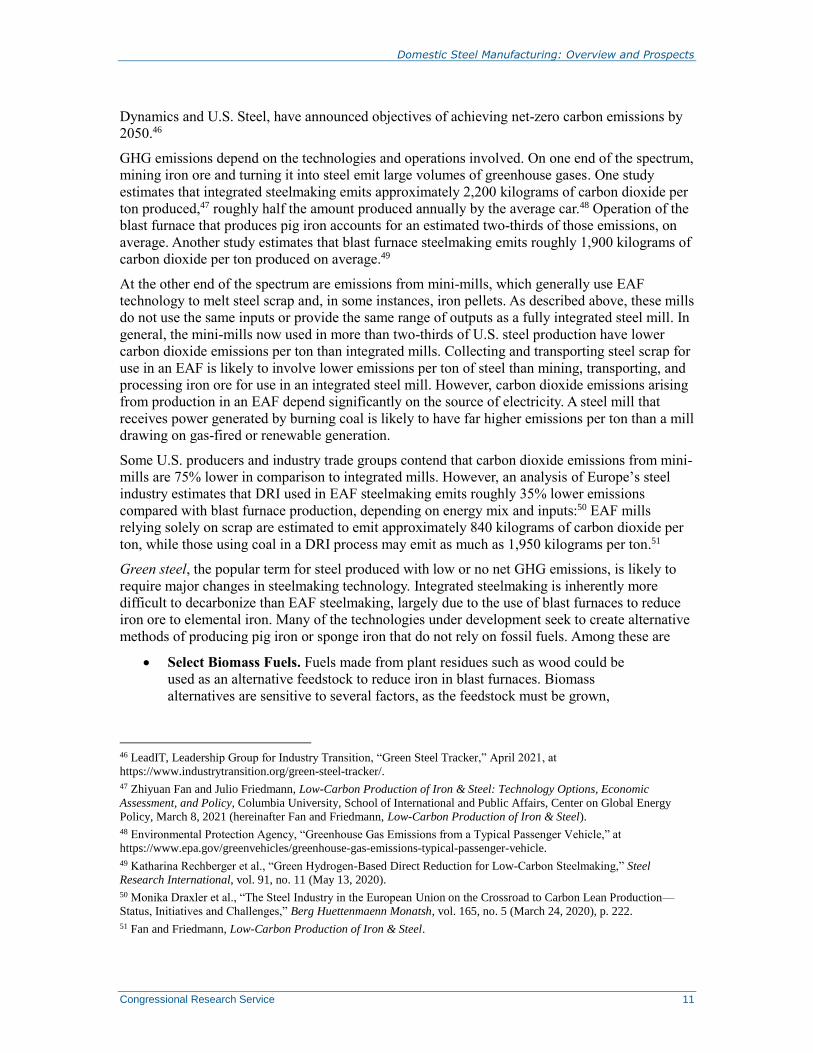
Steel Mill Productivity
The increased use of electric arc furnaces to melt steel and their competitive impact on vertically
integrated mills led to large increases in steel industry productivity between the late 1900s and
2004.40 Mill productivity more than doubled, from 480 tons per employee in 1990 to 1,045 tons
per employee in 2004 (Figure 6). Since then, industry productivity has remained generally flat,
even as labor costs have fallen from more than 20% of total operating costs in the 1990s to an
average of 11% in the 2010s.41 The causes of this productivity stagnation are unclear. Research
from the OECD indicates that steel industry productivity growth worldwide has been weak in
recent years. OECD economists attribute this in part to government policies that keep older steel
mills from closing (thereby keeping older technology in use), preventing reallocation of resources
to the most productive firms and hindering the growth prospects of more innovative firms.42
35 Bureau of Labor Statistics (BLS), Employment and Output by Industry, Table 2.11, accessed February 28, 2022, at
https://www.bls.gov/emp/tables/industry-employment-and-output.htm.
36 BLS, Current Employment Statistics, NAICS 3312—Steel Product Manufacturing, accessed February 28, 2022.
37 BLS, Quarterly Census of Employment and Wages, accessed February 28, 2022.
38 The American Iron and Steel Institute (AISI) attributes productivity gains to capital investments in particular
facilities and a technically sound workforce with the ability to operate advanced steelmaking equipment and
technology. AISI, 2020 Annual Statistical Report, Executive Summary, p. 15.
39 This CRS calculation assumed a work year of 2,080 hours and a one-time expenditure; it does not assume
expenditures beyond the initial $100 billion. AISI, “AISI Applauds House Passage of Bipartisan Infrastructure Bill,”
press release, November 6, 2021, at https://www.steel.org/2021/11/aisi-applauds-house-passage-of-bipartisan-
infrastructure-bill/.
40 Allan Collard-Wexler and Jan De Loecker, “Reallocation and Technology: Evidence from the US Steel Industry,”
American Economic Review, vol. 105, no. 1 (2015), pp. 131-135.
41 BLS, Industry Productivity Viewer, NAICS 3311—Iron and Steel Mills, accessed April 4, 2022.
42 Filipe Silva and Anthony de Carvalho, Research and Development, Innovation, and Productivity Growth in the Steel
Sector, OECD, March 28, 2016, pp. 36-37. See also Filipe Silva, Evaluating the Financial Health of the Steel Industry,
OECD, June 9, 2017, p. 9.
Domestic Steel Manufacturing: Overview and Prospects
Congressional Research Service 10
Figure 5. U.S. Steel Manufacturing
Employment
Source: Bureau of Labor Statistics (BLS), Current
Employment Statistics, North American Industry
Classification System (NAICS) codes 3311—Iron
and Steel Mills and 3312—Steel Product
Manufacturing.
Figure 6. U.S. Steel Mill Productivity
Source: CRS, based on USGS, “Iron and Steel
Statistics and Information”; and BLS, Current
Employment Statistics, NAICS 3311—Iron and
Steel Mills.
“Green Steel” For decades, federal and state regulations have required steelmakers to control their air emissions,
water discharges, and waste generation. No such federal standards exist for greenhouse gas
(GHG) emissions at present, but the possibility of future regulations represents a consideration for
steelmakers investing in long-lived production facilities. In addition, steelmakers, like firms in
other industries, face increasing demands from customers and investors that they publicly
disclose the GHG emissions throughout their supply chains and seek to reduce those emissions
levels, potentially placing steelmakers with comparatively high emissions at a competitive
disadvantage.43
The domestic steel industry’s two chief trade groups—AISI and the Steel Manufactures
Association—have stated that decarbonization of steel manufacturing is a top priority for
domestic producers.44 Four domestic producers—Cleveland-Cliffs, Steel Dynamics, Nucor, and
U.S. Steel—have announced corporate objectives tied to decarbonized steel output by 2030, with
planned GHG emission reductions ranging from 20% to 50%.45 Some producers, including Steel
43 This section provides a discussion on greenhouse gas emissions resulting from iron and steel production. The
emission estimates in this section are specific to carbon dioxide emissions—the largest component of greenhouse
gases—across modes of production (i.e., integrated steelmaking, electric arc furnace steelmaking). Nearly all of the
emission estimates in this section concern the iron and steel production processes, which involves processing raw
materials into liquid steel and does not take into account emissions from other sources, such as from mining,
transportation of raw materials, rolling of steel mill products, and transportation of finished goods to the customer. This
section does not discuss methane emissions—a smaller component of greenhouse gases—resulting from iron and steel
production.
44 S&P Global Platts, Commodities 2022: US Steel Groups Focused on Trade Enforcement, Decarbonization, January
7, 2022, at https://www.spglobal.com/platts/en/market-insights/latest-news/metals/010722-commodities-2022-us-steel-
groups-focused-on-trade-enforcement-decarbonization.
45 The scope, baselines, targets, gases, and boundaries of these climate objectives vary by company. See each
company’s sustainability reporting for more details.
Domestic Steel Manufacturing: Overview and Prospects
Congressional Research Service 11
Dynamics and U.S. Steel, have announced objectives of achieving net-zero carbon emissions by
2050.46
GHG emissions depend on the technologies and operations involved. On one end of the spectrum,
mining iron ore and turning it into steel emit large volumes of greenhouse gases. One study
estimates that integrated steelmaking emits approximately 2,200 kilograms of carbon dioxide per
ton produced,47 roughly half the amount produced annually by the average car.48 Operation of the
blast furnace that produces pig iron accounts for an estimated two-thirds of those emissions, on
average. Another study estimates that blast furnace steelmaking emits roughly 1,900 kilograms of
carbon dioxide per ton produced on average.49
At the other end of the spectrum are emissions from mini-mills, which generally use EAF
technology to melt steel scrap and, in some instances, iron pellets. As described above, these mills
do not use the same inputs or provide the same range of outputs as a fully integrated steel mill. In
general, the mini-mills now used in more than two-thirds of U.S. steel production have lower
carbon dioxide emissions per ton than integrated mills. Collecting and transporting steel scrap for
use in an EAF is likely to involve lower emissions per ton of steel than mining, transporting, and
processing iron ore for use in an integrated steel mill. However, carbon dioxide emissions arising
from production in an EAF depend significantly on the source of electricity. A steel mill that
receives power generated by burning coal is likely to have far higher emissions per ton than a mill
drawing on gas-fired or renewable generation.
Some U.S. producers and industry trade groups contend that carbon dioxide emissions from mini-
mills are 75% lower in comparison to integrated mills. However, an analysis of Europe’s steel
industry estimates that DRI used in EAF steelmaking emits roughly 35% lower emissions
compared with blast furnace production, depending on energy mix and inputs:50 EAF mills
relying solely on scrap are estimated to emit approximately 840 kilograms of carbon dioxide per
ton, while those using coal in a DRI process may emit as much as 1,950 kilograms per ton.51
Green steel, the popular term for steel produced with low or no net GHG emissions, is likely to
require major changes in steelmaking technology. Integrated steelmaking is inherently more
difficult to decarbonize than EAF steelmaking, largely due to the use of blast furnaces to reduce
iron ore to elemental iron. Many of the technologies under development seek to create alternative
methods of producing pig iron or sponge iron that do not rely on fossil fuels. Among these are
Select Biomass Fuels. Fuels made from plant residues such as wood could be
used as an alternative feedstock to reduce iron in blast furnaces. Biomass
alternatives are sensitive to several factors, as the feedstock must be grown,
46 LeadIT, Leadership Group for Industry Transition, “Green Steel Tracker,” April 2021, at
https://www.industrytransition.org/green-steel-tracker/.
47 Zhiyuan Fan and Julio Friedmann, Low-Carbon Production of Iron & Steel: Technology Options, Economic
Assessment, and Policy, Columbia University, School of International and Public Affairs, Center on Global Energy
Policy, March 8, 2021 (hereinafter Fan and Friedmann, Low-Carbon Production of Iron & Steel).
48 Environmental Protection Agency, “Greenhouse Gas Emissions from a Typical Passenger Vehicle,” at
https://www.epa.gov/greenvehicles/greenhouse-gas-emissions-typical-passenger-vehicle.
49 Katharina Rechberger et al., “Green Hydrogen-Based Direct Reduction for Low-Carbon Steelmaking,” Steel
Research International, vol. 91, no. 11 (May 13, 2020).
50 Monika Draxler et al., “The Steel Industry in the European Union on the Crossroad to Carbon Lean Production—
Status, Initiatives and Challenges,” Berg Huettenmaenn Monatsh, vol. 165, no. 5 (March 24, 2020), p. 222.
51 Fan and Friedmann, Low-Carbon Production of Iron & Steel.
Domestic Steel Manufacturing: Overview and Prospects
Congressional Research Service 12
harvested, processed, and transported with minimal life-cycle emissions for it to
achieve high emission reductions through fossil fuel substitution.
Carbon Capture, Utilization, and Storage (CCUS). CCUS units could be
installed or retrofitted at both integrated mills and mini-mills to capture carbon
dioxide from iron production in blast furnaces or DRI shaft furnaces. The carbon
dioxide then may be stored underground or used to produce chemicals, such as
methanol. At present, U.S. manufacturers’ use of CCUS is discouraged by
economic, technological, and other factors that have complicated wide-scale
deployment.52
Green Hydrogen—Electrolysis. Hydrogen created with electricity generated
from renewable energy could replace coking coal and other fossil fuels used to
remove oxygen from iron ore/pellets where the by-product is water rather than
carbon dioxide. This could eliminate the need for coking coal used in blast
furnaces and natural gas used in direct reduction of iron.53
Molten Oxide Electrolysis. Iron ore is dissolved into a liquid electrolyte solution
at high temperatures through a shaft furnace and then passed through an electrical
current, yielding molten iron. This process could eliminate the need to use natural
gas in direct reduction.
Research and Development Funding and Decarbonized Efforts
Reducing the steel industry’s GHG emissions is likely to require expanded research and
development (R&D) efforts. The U.S. primary metals subsector, of which iron and steel
manufacturing is the largest component, spends a smaller proportion of its revenue on R&D than
other manufacturing subsectors, such as computer and electronic products and motor vehicles.
Between 2013 and 2020, R&D expenditures of the U.S. primary metals subsector averaged
approximately 1.4% of the industry’s operating revenue.54 If R&D spending in iron and steel
manufacturing were proportionate to that of other primary metals industries, it would have been
in the range of $2 billion in 2020.55
Much current research aims at marginalizing the use of coking coal and blast furnaces, which are
the primary sources of GHG emissions from steelmaking. Boston Metal, a U.S.-based metals
technology firm, is attempting to use molten oxide electrolysis to dissolve iron ore in an
electrolyte solution at approximately 1,600ºC prior to an electric current being applied, which
then produces molten iron.56 The iron could then be fed into an EAF, avoiding the need for a
52 See CRS Report R44902, Carbon Capture and Sequestration (CCS) in the United States, by Angela C. Jones and
Ashley J. Lawson.
53 For more information on hydrogen, see CRS Report R46436, Hydrogen in Electricity’s Future, by Richard J.
Campbell.
54 Bureau of Economic Analysis, National Income and Product Accounts, Table 3.7I, “Investment in Private
Intellectual Property Products by Industry,” at https://apps.bea.gov/iTable/iTable.cfm?ReqID=10&step=2.; and U.S.
Census Bureau, Business and Industry Statistics, at https://www.census.gov/econ/currentdata/dbsearch?program=
QFR&startYear=2000&endYear=2021&categories=371&dataType=101&geoLevel=US¬Adjusted=1&submit=
GET+DATA&releaseScheduleId=.
55 The primary metal manufacturing subsector (NAICS 331) includes iron and steel mills and ferroalloy manufacturing,
steel product manufacturing, aluminum production and processing, nonferrous metals (except aluminum) production
and processing, and foundries. The subsector’s total revenue in 2020 was $196 billion, of which iron and steel mills
accounted for 53%, according to U.S. Census Bureau data.
56 Andrzej Omietanski and Rebecca Campbell, “The green edge of steel: Cutting through carbon,” White & Case, June
Domestic Steel Manufacturing: Overview and Prospects
Congressional Research Service 13
coking oven and blast furnace. Boston Metal states that electrolysis shaft furnaces can be installed
at iron ore facilities, as well as steel mills, and hopes to have a demonstration plant operational by
2025.57
Another initiative is flash ironmaking technology, which is intended to reduce iron ore fine
powders into molten iron using a reducing agent of hydrogen or natural gas and leaving behind
iron in its elemental state. This research, partially funded by the U.S. Department of Energy’s
Advanced Manufacturing Office, seeks to minimize the use of coke ovens and blast furnaces in
steelmaking by providing an alternative method of producing a relatively pure iron that could be
used in EAFs.58 Researchers have claimed that flash ironmaking in combination with green
hydrogen could offer up to 96% lower carbon dioxide emissions compared with steel production
involving a blast furnace; although that figure does not consider emissions resulting from the
electricity generation needed to power the EAFs.59
The transition to green steel is likely to require significant capital investments in alternative
technologies and in discontinuing production methods associated with high emissions.
Fastmarkets, a company that reports and forecasts commodity prices, estimates that the global
steel industry would have to invest more than $1 trillion—an average of $35 billion annually—to
reduce carbon dioxide emissions 61% by 2050, raising production costs by approximately $50 per
ton.60 Fastmarkets indicates that decarbonization of steelmaking would be most likely to occur
through DRI-EAF production, in which coking coal ovens would be replaced with hydrogen and
coal used to generate electricity replaced with renewable energy sources, such as geothermal or
solar. Bloomberg New Energy Finance offers a lower estimate, forecasting the need for $278
billion of investments by global steelmakers through 2050, specifically through hydrogen and
recycling.61 U.S. steelmaker Cleveland-Cliffs states that is has spent $1.37 billion toward its goal
of reducing emissions 25% from 2017 levels by 2030, with the majority of that amount allocated
to a new direct reduction facility that uses carbon capture technology.62
Some steelmakers have suggested that they may be able to charge higher prices for steel produced
with low-emissions technology, but the size of the potential market is unclear. The construction
sector, the largest consumer of steel, has a decentralized and fragmented supply chain in which
architects, fabricators, construction contractors, and local building officials all play roles. If green
steel costs more than steel made with traditional methods, its use in a construction project at
present would be at the option of the project owner or sponsor.63
28, 2021, at https://www.whitecase.com/publications/insight/green-edge-steel-cutting-through-carbon.
57 Boston Metal, “Transforming Metal Production”, at https://www.bostonmetal.com/transforming-metal-production/.
58 The Advanced Manufacturing Office serves as a technology development office with the objective of improving the
energy and material efficiency, competiveness, and productivity of manufacturing in the industrial sector. U.S.
Department of Energy, Advanced Manufacturing Office: Steel Industry Roundtable, Summary Report, November 2019,
pp. 11-12.
59 Mark Peplow, “Can industry decarbonize steelmaking?,” Chemical & Engineering News, June 13, 2021.
60 Fastmarkets, “The true price of green steel,” November 2021, at https://insights.fastmarkets.com/the-true-price-of-
green-steel/#lp-pom-text-74.
61 Veronkia Henze, “Steel Industry Set to Pivot to Hyrdogen in $278 Billion Green Push,” BloombergNEF, December
1, 2021, at https://about.bnef.com/blog/steel-industry-set-to-pivot-to-hydrogen-in-278-billion-green-push/.
62 Alistair MacDonald, “Steelmakers Grapple With How to Cut Carbon Emissions,” Wall Street Journal, August 21,
2021.
63 Hasan Muslemani et al., “Opportunities and challenges for decarbonizing steel production by creating markets for
‘green steel’ products,” Journal of Cleaner Production, vol. 315 (September 15, 2021), pp. 9-10 (hereinafter
Muslemani et al., “Opportunities and challenges for decarbonzing steel production”).
Domestic Steel Manufacturing: Overview and Prospects
Congressional Research Service 14
Some automotive manufacturers, including BMW, Mercedes Benz, and Volvo Cars, have signaled
interest in using green steel to reduce GHG emissions from their operations as early as 2025.64
Moreover, automakers are moving away from solely focusing on tailpipe emissions and are
seeking to reduce emissions of components and materials used in the production of vehicles, such
as steel.65 On average, 0.9 tons of steel is used to produce one vehicle. Based on this number, one
analysis estimates that the cost of green steel produced via hydrogen (i.e., melting iron ore/pellets
via blue or green hydrogen through DRI-EAF) for use in an electric vehicle would be
approximately $400 per ton higher than non-hydrogen steel, resulting in a cost premium of $360
per vehicle.66
The large majority of mini-mill production comes through EAF steelmaking relying on scrap. In
2021, the U.S. steel market totaled 98.0 million tons, with domestic output of steel scrap totaling
59.2 million tons.67 Consequently, EAF steelmaking relying solely on scrap does not have the
capacity to supply domestic steel demand and may not be feasible in serving as the primary venue
for the industry’s green push. Producers seeking both to achieve decarbonization goals and to
meet domestic steel demand may need to expand and diversify green steel investments into direct
reduction facilities that could be utilized by both integrated mills and mini-mills.68
Issues for Congress After reporting record earnings in 2021, domestic steel producers seem likely to face greater
headwinds due to a slowing economy and continued global excess steelmaking capacity. The
pressure to step up research into “green steel” and invest in decarbonization efforts is likely to
impact the industry.
The United States has imposed restrictions on imports of steel and steel products since 1978,
although the coverage of those restrictions has varied. While these import restrictions may have
preserved employment in U.S. steel manufacturing, some of them may have adversely affected
employment at steel-consuming industries by raising domestic steel prices. A study by the
Peterson Institute for International Economics estimated that trade measures used to assist the
domestic steel industry cost the U.S. economy approximately $120 billion between 1990-2019, a
figure that exceeded the enterprise value of all publicly traded steel firms in 2020.69 Congress
may want to evaluate the impact of steel import restrictions on steel-using industries and consider
whether the restrictions have achieved relevant goals, such as improving capacity utilization,
productivity, and innovation in steelmaking.
The U.S.-EU agreement on Section 232 tariffs reached in October 2021 addresses additional
subjects beyond the modification of tariffs on steel and aluminum. One such component pertains
64 William Boston, “Green Steel Becomes a Hot Commodity for Big Auto Makers,” Wall Street Journal, September 13,
2021.
65 Muslemani et al., “Opportunities and challenges for decarbonzing steel production.”
66 Yingxia Yang, Green Steel: Make Electric Vehicles Greener, Boston University, Institute for Sustainable Energy,
August 10, 2021, at https://www.bu.edu/ise/2021/08/10/green-steel-make-electric-vehicles-greener/.
67 USGS, Mineral Commodity Summaries, “Iron and Steel Statistics and Information,” January 2022, and USGS,
Mineral Commodity Summaries, “Iron and Steel Scrap Information and Statistics,” January 2022.
68 U.S. producer Cleveland-Cliffs is an example of this as it has an active direct reduction plant that produces hot-
briquetted iron (HBI), in part, to reduce ferrous scrap purchases. The HBI is then fed into either a basic oxygen furnace
or an electric arc furnace to produce liquid steel.
69 Gary Huffbauer and Eujin Jung, Scoring 50 Years of US Industrial Policy, 1970-2020, Peterson Institute of
International Economics, PIIE Briefing 21-5, November 2021, p. 20.
Domestic Steel Manufacturing: Overview and Prospects
Congressional Research Service 15
to global excess steelmaking capacity and the carbon intensity of steelmaking. The United States
and EU agreed to establish a carbon-based sectoral arrangement specific to steel and aluminum
trade.70 In addition, the United States and EU would invite like-minded countries to participate in
the arrangement and contribute to achieving goals related to global excess steelmaking capacity
and supporting the reduction of carbon intensity of steel across modes of production.71 In
February and March 2022, the United States reached agreements with Japan and the United
Kingdom, respectively, regarding Section 232 tariffs that contain similar objectives specific to
global excess steelmaking capacity and the carbon intensity of the global steel sector. Congress
may seek to explore the effectiveness of these agreements and their potential impact on domestic
steelmakers.
The domestic steel industry has become increasingly globalized, and policies that support
international cooperation regarding the industry’s transition to green steel may be an important
component of this. In particular, international standards to define and encourage the use of green
steel may be important in accelerating the industry’s transition. Congress may consider whether
or not green steel criteria should have a role in federal procurement goals and domestic content
requirements. This could involve establishing standard practices for reporting emissions intensity.
The Low-Emissions Steel Manufacturing Research Program section of the House-passed version
of America COMPETES Act of 2022 (H.R. 4521, Section 10721) would require the federal
government to establish an R&D program specific to low-emissions steel manufacturing. The
program would be led by the Department of Energy and involve other federal agencies, academic
institutions, nonprofit organizations, and private companies, including steel producers. The
provision’s stated purposes of the program include “significant net nonwater greenhouse
emissions reductions” in the iron and steel production processes. The program would support
research into carbon capture technologies, such as combustion and chemical looping processes,
medium- and high-heat generation technologies, such as biomass and hydrogen, and renewable
heat-generation technologies, such as solar and geothermal sources, among others. The Senate-
passed version of H.R. 4521, United States Innovation and Competition Act of 2021, does not
include a similar provision.
Decarbonization efforts tied to domestic steel production may unfold primarily through DRI-EAF
steelmaking and as a result could impact integrated steel mill workers, as integrated mills have a
highly unionized workforce compared with mini-mills. If decarbonization efforts lead to further
market-share gains by mini-mills, this may adversely affect integrated mills and their workers.
Author Information
Christopher D. Watson
Analyst in Industrial Organization and Business
70 According to the agreement, the United States and EU are expected to form a technical working group to confer on
methodologies for calculating steel and aluminum carbon-intensity for the purpose of market access.
71 The White House, “FACT SHEET: The United States and European Union to Negotiate World’s First Carbon-Based
Sectoral Arrangement on Steel and Aluminum Trade,” October 31, 2021.
Domestic Steel Manufacturing: Overview and Prospects
Congressional Research Service R47107 · VERSION 2 · NEW 16
Acknowledgments
The author thanks Amber Wilhelm, Visual Information Specialist, and Jamie Hutchinson, Visual
Information Specialist, for providing assistance with certain figures in this report.
Disclaimer
This document was prepared by the Congressional Research Service (CRS). CRS serves as nonpartisan
shared staff to congressional committees and Members of Congress. It operates solely at the behest of and
under the direction of Congress. Information in a CRS Report should not be relied upon for purposes other
than public understanding of information that has been provided by CRS to Members of Congress in
connection with CRS’s institutional role. CRS Reports, as a work of the United States Government, are not
subject to copyright protection in the United States. Any CRS Report may be reproduced and distributed in
its entirety without permission from CRS. However, as a CRS Report may include copyrighted images or
material from a third party, you may need to obtain the permission of the copyright holder if you wish to
copy or otherwise use copyrighted material.