does panicle initiation in tropical sorghum depend on day-to-day change in photoperiod?
TRANSCRIPT

Does panicle initiation in tropical sorghum depend onday-to-day change in photoperiod?
B. Clergeta,*, M. Dingkuhnb, J. Chantereaub, J. Hembergerb,G. Louarnb, M. Vaksmannc
aICRISAT/CIRAD Sorghum Ecophysiology Project, BP 320, Bamako, MalibCIRAD, TA40/01 Ave. Agropolis, 34398 Montpellier Cedex 5, France
cIER, BP 258, Bamako, Mali
Received 19 November 2003; received in revised form 19 November 2003; accepted 19 November 2003
Abstract
Sorghum is known as a short day plant requiring short photoperiods (PP) to flower. However, in field experiments based on
monthly plantings reported elsewhere, panicle initiation took place during long days as well as during short days even for highly
photoperiod-sensitive varieties thought to be of the absolute type, or was particularly early for the sowings in September, well
before days were shortest. In order to investigate these contradictory results, three tropical sorghum varieties of different
photoperiod sensitivity were planted monthly in Mali and the dates of panicle initiation (PI) were recorded. The results indicate
that the common concepts of a gradual (linear, or quantitative) response of photoperiod-induced phase (PIP) to PP at PI (PPi)
(case of the variety Sariaso 10) or a threshold-type response (hyperbolic, or absolute; cases of CSM 335 and IRAT 174) could be
reproduced for the sowing dates falling into the wet season (May–October), but did not describe adequately crop behaviour
during the remaining months of the year. The same varieties were tested in controlled environments with four differential PP
treatments composed of three different initial PP (12 h 15 min, 12 h 00 min and 11 h 45 min) and two opposite rates of day
length change (�1 min/day). Thus after 15 days, two pairs of treatments with opposite day length changes reached the same
average PP (12 h 07 min and 11 h 52 min) and after 30 d, another pair reached a similar average PP (12 h 00 min). In 2001, 2
varieties reached PI earlier under decreasing days and the same average PP, but no such additional effect of the rate of change of
PP was observed in 2002. Modelling exercises showed that field variation in the duration to PI was better explained with rate of
change of PP than with absolute PP observed during PIP, and best with a combination of both factors in an additive model. It is
concluded that in tropical sorghum, floral induction is strongly associated with a negative rate of change of day length in the field,
and under certain circumstances under controlled conditions, but more evidence is needed to ascertain the capability of sorghum
to sense the rate of change of PP before a definite model can be formulated.
# 2003 Elsevier B.V. All rights reserved.
Keywords: Photoperiod sensitivity; Rate of day length change; Panicle initiation; Modelling; Sorghum [Sorghum bicolor (L.) Moench]
1. Introduction
Sorghum is a short day plant that flowers only, or
most rapidly, if illuminated during less than a certain
number of hours per day (Thomas and Vince-Prue,
Field Crops Research 88 (2004) 21–37
* Corresponding author. Tel.: þ223-222-3375;
fax: þ223-222-8683.
E-mail address: [email protected] (B. Clerget).
0378-4290/$ – see front matter # 2003 Elsevier B.V. All rights reserved.
doi:10.1016/j.fcr.2003.11.008

1997). This photoperiodic behaviour is an adaptation
to region-specific climatic patterns shown by many
tropical species. It has been recently reported that
sensitivity to photoperiod (PP) remains necessary,
even for improved varieties, in the present grain
production systems in the African savannas and the
Sahel, to optimise natural resource use and minimise
the risk of adverse climatic effects (Vaksmann et al.,
1996).
The relations between day length and the duration
of the vegetative phase, which ends with floral initia-
tion, are complex and depend on temperature. Horie
(1994) summarised the effects of day length as fol-
lows: the duration of the vegetative phase is increased
by day length <8 h possibly due to trophic (nutritional,
assimilation) constraints. It attains its minimum
between 8 h and a first (‘‘critical’’) threshold. Between
this first threshold and a second (‘‘maximal’’) thresh-
old, the duration of the vegetative stage increases
proportionally to photoperiod for quantitative res-
ponse types, whereas for absolute types, floral initia-
tion is fully inhibited beyond the maximal threshold
and duration becomes theoretically infinite. Sorghum
responds in the same manner. Major (1980) modelled
the photoperiodism of two cultivars of sorghum as a
linear response between a critical and maximal thresh-
old in accordance with the concept of a quantitative
response. The crop models DSSATand APSIM use the
same approach, assuming that daily progress towards
panicle initiation (PI) is proportional to the ratio
between the biological temperature (Tmean � Tbase)
and PP during the photoperiod-sensitive phase (PIP)
(McCown et al., 1996; Jones et al., 1998). These
models, however, are unable to predict the sometimes
very long delay of flowering in guinea varieties when
grown under short days in the tropics. Franquin (1976)
and Vaksmann et al. (1996) proposed a hyperbolic
response above the critical threshold, which essen-
tially amounts to the concepts of a qualitative reaction.
In this case it was proposed that PI occurred when PP
dropped below a dynamic threshold PPt. PPt increases
with time elapsed since sowing, thus making floral
induction more probable as the plant ages (Vaksmann
et al., 1998).
The possibility that plants might respond to change
in PP, in addition to absolute day length, has received
little attention (Thomas and Vince-Prue, 1997). Where
this ‘‘dynamic’’ hypothesis (as opposed to quantitative
or qualitative) was studied, evidence largely rested on
time of sowing experiments with the inherent difficulty
to distinguish among different PP effects (dynamic,
quantitative or qualitative) and between PP and other
environmental effects. Baker et al. (1980), working on
winter wheat, found a strong, positive, linear relation-
ship between the rate of day length change at emer-
gence and the mean rate of leaf appearance during the
life cycle. Kirby et al. (1982) found a similar relation-
ship for barley and confirmed it later on various
varieties of winter wheat (Kirby et al., 1985). However,
the same author concluded 10 years later that a supple-
mental hypothesis on temperature acclimation gave a
better-adjusted model than the hypothesis using day
length dynamics (Kirby, 1995). One year earlier, Slafer
et al. (1994a,b) had concluded that the rate of change in
day length has no effect on the development rate and
leaf number of wheat.
Curtis (1968) observed that the heading date of
local varieties of sorghum in Nigeria was mainly a
varietal characteristic nearly independent of latitude in
Nigeria (between 78300N and 128N), when sown
before July. Panicle initiation therefore occurred at
different day lengths, giving rise to the hypothesis of a
specific effect of the number of days of decreasing
length following summer solstice (21 June), which is
independent of latitude. Craufurd and Qi (2001) tested
the ‘‘dynamic’’ hypothesis on data from an experiment
in Nigeria in 1975, with a local Sorghum cv. sown
weekly between 12 May and 21 July (Kassam and
Andrew, 1975). The dynamic hypothesis was rejected
because the relation between the mean day length and
the duration of the vegetative growth phase was the
same for sowing before or after summer solstice, and
the CERES model using the quantitative hypothesis
was able to simulate this data.
A study by Carberry et al. (2001) on pigeon pea in
India in 1990–1991 gave very different patterns of
vegetative phase duration between the first and second
halves of the year, with one cultivar flowering after 50
days when sown on 28 January, and after 169 days
when sown on 27 February. The authors explained this
with a qualitative response to PP, assuming that during
PIP for the February sowing, PPcrit had already been
exceeded.
In four independent studies conducted in the north-
ern hemisphere on sorghum using annual cycles of
periodic sowing (Bezot, 1963; Miller et al., 1968;
22 B. Clerget et al. / Field Crops Research 88 (2004) 21–37

Pandusastry and Krishna Murthy, 1984; Vaksmann
et al., 1997), the longer vegetative phases generally
occurred during the first half of the year (when PP
increased) and the shorter durations in the second
half of the year. A large number of cultivars showed
maximal duration when sown in March (spring equi-
nox) and minimal duration when sown in September
(autumn equinox). The maximum observed in
March is compatible with the threshold hypothesis
as discussed above for pigeon pea, but neither the
qualitative and quantitative hypotheses explain why
the minimum was associated with sowing as early as
September.
Franquin (1974) and Vaksmann et al. (1997)
claimed that such discrepancies were the consequence
of low night temperatures occurring in winter. In fact,
they obtained better relationships between the average
photoperiod and the thermal time to flowering based
only on daily temperature minima, instead of means.
(This approach is consistent with the fact that short
day plants are actually long-night plants.) However,
this explanation does not apply to Miller et al. (1968)
experiments conducted under extremely constant ther-
mal conditions in Puerto Rico. It therefore seems clear
from the four field studies on sorghum cited above,
that the classical, quantitative or qualitative models do
not fit all cultivars when studied on a full annual cycle,
and that in these cases the rate of change of PP at the
time of sowing was highly predictive of thermal
duration to flowering.
We considered there to be sufficient evidence to
justify a re-evaluation of the dynamic hypothesis for
photoperiodism in sorghum. The present study there-
fore aims at evaluating the effect of the rate of change
in day length on the duration from germination to
panicle initiation, based on three varieties with con-
trasting photoperiodic behaviour, grown in a sowing-
date experiment in Mali and in controlled environ-
ments with PP changing daily.
2. Material and methods
2.1. The monthly planting experiment in Mali
The experiment was conducted at the ICRISAT
research station in Samanko, Mali (128340N,
88040W, 330 masl). The climate is typical of the Sudan
savannas, with three seasons: a hot and humid season
from June to October during which crops are culti-
vated, a dry and cool season from November to
February, and a dry and hot season from March to
May (Table 1), astronomical day length varies from
11 h 15 min to 12 h 45 min and civil day length from
12 h 10 min to 13 h 38 min (Fig. 1). For hydrological
reasons it was inevitable that wet and dry season crops
were planted on different fields, in order to avoid water
logging in the wet season and to enable irrigation in
the dry season. The soil at the irrigated site (dry
seasons), located close to the Niger River, was a
fine, loamy Typic Haplaquet (USDA taxonomy)
(C:L:S � 25:50:25 and pHH2O¼ 4:5). The soil at the
rainfed site (wet season) was a fine, loamy, mixed,
isohyperthermic, Plinthic Paleustalf (C:L:S � 20:
35:55 and pHH2O¼ 5:0). Possible differences in soil
fertility between fields were minimised with fertiliser
application of 200, 100 and 200 kg ha�1 diamonium
phosphate, KCl and urea, respectively. Soil moisture
was never limiting due to irrigation in the dry seasons
twice a week, keeping the soil near field capacity. The
sites were 1000 m apart and weather was recorded at a
weather station located not further than 800 m from
either location. No visible differences with respect to
plant health and nutritional status were observed
between sites.
The three sorghum varieties used were CSM
335 from Mali (Sorghum Collection of Mali), a tall,
Table 1
Monthly average maximal and minimal temperature and rainfall in
Bamako, 1941–1980a
Month Maximum
temperature (8C)
Minimum
temperature (8C)
Rainfall
(mm)
January 33.5 16.9 0.0
February 36.2 19.4 1.6
March 37.5 22.8 0.2
April 38.6 23.7 8.4
May 38.0 25.2 63.0
June 35.1 23.4 173.9
July 34.2 22.1 257.4
August 30.5 21.7 336.6
September 31.7 21.6 229.6
October 33.1 21.3 97.4
November 34.8 18.5 10.1
December 33.0 16.8 1.7
a Data from ICRISAT No. 19, 1984, Bamako.
B. Clerget et al. / Field Crops Research 88 (2004) 21–37 23

traditional, guinea-type landrace known to be highly
photoperiod-sensitive; Sariaso 10, an improved,
less photoperiod-sensitive line from Burkina Faso
having caudatum ancestry; and IRAT 174, a dwarf
kafir � durra, photoperiod-sensitive line bred in Bur-
kina Faso. A monthly planting schedule was initiated
on 5 July 2000, followed by plantings on or about the
10th day of each succeeding month through August
2002. Plots had four lines 0.75 m apart and 5 m long,
with 10 seed sown every 0.20 m and thinned to 1 plant/
hill 2 weeks after plant emergence. The ICRISAT
Sorghum Breeding Program at Samanko furnished
seed of CSM 335, and seed of Sariaso 10 and IRAT
174 came from the Genetic Resources Unit at CIRAD,
Montpellier. Leaves of each plant of the two central
rows were labelled for individual observations. Weed-
ing was manual and insect control was chemical using
local standards.
Fig. 1. Daily climatic conditions at the Samanko station from 1 July 2000 to 31 October 2003: (a) minimum, maximum and average
temperatures; (b) average relative humidity; (c) global radiation; (d) day length and (e) day length rate of change.
24 B. Clerget et al. / Field Crops Research 88 (2004) 21–37

From emergence to panicle initiation, three plants
per variety were sampled every week during the first 6
weeks and every 2–3 weeks later and dissected in
order to count the number of leaves already initiated
on the apex. Panicle initiation was recorded. The dates
of panicle initiation (PI) were estimated using the
equation of the linear regression of the initiated leaf
number against time. PI was supposed to coincide with
the time when the average total number of initiated
leaves had been initiated (Fig. 2). Ten plants per plot
(corresponding to sowing date) were labelled and the
number of leaves appeared from the whorl, fully
exerted and senesced were recorded weekly for each
stem.
Air temperature and relative humidity at 2 m were
measured every minute, averaged hourly and stored in
a data logger (Campbell 21X). Daily temperature max,
min and average and humidity average were calcu-
lated (Fig. 1) Thermal time was calculated on an
hourly basis, using 11, 34 and 54 8C as base, optimal
and maximum temperatures, respectively. The first
value was calculated by Lafarge (1998) on the basis
of leaf growth and appearance rates, and the two others
by Alagarswamy and Ritchie (1991) for tropical sor-
ghum varieties. These cardinal temperatures had
been confirmed earlier using leaf elongation rates
for the three varieties in a pre-study conducted in
2000 under controlled environments. Air temperature
was increased hourly then decreased during daily
periods in order to mimic natural conditions. Hyster-
esis due to a partial recovery of the lost elongation was
observed after periods at very high temperature cor-
related with low humidity, but the three cardinal
temperatures were equal to the 11, 34 and 54 8C within
an error range less than 1 8C. Linearity of response
was assumed between the cardinal temperatures, with
thermal time equal to zero at temperatures below the
base or above the maximum. Daily summation of
thermal time made use of daily averages calculated
from the 24 hourly average temperatures, which were
in turn calculated using the model described.
For calculations of the durations of phenological
phases, it was assumed that the basic vegetative phase
(BVP) is equal to the shortest thermal time elapsing
from plant emergence to PI, and includes a juvenile
phase that is either equal to or shorter than BVP. The
photoperiod-sensitive or panicle induction phase (PIP)
was calculated as the difference in thermal time
between the end of BVP and PI.
Daily civil day length was calculated with the
equations proposed by Keisling (1982) and the day
length change of the day was calculated as the differ-
ence between the day length of the present and the
previous day.
2.2. Experiments in controlled environments
This study used the same sorghum cultivars as the
field experiment, and was carried out at CIRAD
(Montpellier, France). A preliminary study on the
duration of BVP was conducted in heated green-
houses. Ten plants of each variety CSM 335, Sariaso
10 and IRAT 174, were sown in 15 l pots on 10
November 2000 and 15 January 2001 (under very
short days). Day/night temperature was approximately
30/20 8C and lighting was complemented during
a period shorter than day length with HQL bulbs
(Hg high pressure) giving an additional PAR of
300 mmol m�2 s�1 at plant tops (1 m from source).
The minimal number of leaves initiated prior to PI
were 10.5 (CSM 335), 11.8 (Sariaso 10) and 12.2
(IRAT 174), corresponding to a BVP of 165, 204 and
216 8C day (Tbase 11 8C). These values, corresponding
to 12–15 days, are in accordance with values published
by Ellis et al. (1997) and Alagarswamy and Chandra
(1998).
The main experiments were conducted in growth
cabinets in 2001 and 2002. In 2001, four treatments
differing in day length dynamics were implemented
using fully light-insulated cabinets (1:20 m � 0:90 m
�1:95 m, W � D � H), open at the bottoms and
tops, and built inside a larger room with controlled
Fig. 2. Kinetics of leaf initiation by the apex (open circles) and
their appearance out of the whorl (closed circles) recorded for the
sowing of March 2001. The date of panicle initiation is estimated at
the crosses between the linear regression and the final number of
leaves when initiation was observed.
B. Clerget et al. / Field Crops Research 88 (2004) 21–37 25

temperature and air humidity. Illumination in the
cabinets was provided with a combination of three
HQI 150 W lamps and one incandescent 120 W lamp
giving a PAR of 600 mmol m�2 s�1 at plant tops (1 m
from source). Air temperature and relative humidity
were maintained at 27 8C and 65% in the large room.
A forced upward air flux in the cabinets using air
circulated with the larger room minimised tempera-
ture differences (<1.5 8C among cabinets during the
short periods when lighting was differential). The set
up permitted programming of day-to-day photoperiod
(PP) dynamics at a resolution of 1 min.
Drained pots contained 2 l of a growth medium
consisting of field soil (silty sand from Lavalette
experimental station, Montpellier, France), plant-
based compost and crushed volcanic ashes mixed in
a ratio 5:9:1 (v/v), soaked with de-ionised water prior
to planting. On 26 June 2001, five seeds each were
sown per pot, and 12 pots per cultivar were placed in
each of the four cabinets on adjustable tables in order
to maintain a distance of 1 m between plant tops and
light sources. One week after emergence seedlings
were thinned to one per pot. Pots were irrigated with
de-ionised water during the first 3 weeks, then with a
complete culture solution.
Initial PP was adjusted to 13 h (non-inductive) until
14 days after plant emergence (about 18 days after
sowing, or 224 8C). This first phase was believed to
fully cover the duration of BVP and consequently the
juvenile phase, during which plants are not sensitive to
PP. Thereafter, four differential PP treatments were
initiated, composed of three different initial PP (12 h
15 min, 12 h 00 min and 11 h 45 min) and two oppo-
site, constant rates of day length change (dPP)
(�1 min/day). Thus two pairs of treatments reached
the same average photoperiod after 4 weeks and
another pair after 6 weeks. The values were chosen
to be close to the PP conditions experienced by plants
in the tropics at the two annual equinoxes. At these
dates, astronomic day length is 12 h 00 min and dPP is
�40 s/day at Samanko.
Leaves were labelled on every plant and the dates of
their appearance, full exertion and death were
recorded weekly. Also at weekly intervals, three plants
were harvested and dissected to count the number of
leaves initiated and to record panicle initiation.
In 2002, two additional experiments were carried
out under the same conditions except the following
changes. A second incandescent 120 W was added in
each cabinet in order to improve the spatial light
distribution and to decrease the red/far red energetic
ratio of the light spectrum from 5.6 to 3.4, thus
balancing the red spectrum. Short day plants are
sensitive to this ratio because the PI is induced by
far red (Thomas and Vince-Prue, 1997). The board
carrying the pots was replaced with a grate and smaller
1 l pots were used, to increase the air flux inside the
cabinets. Because of limited available space, plants
were not grown in the isolated cabinets during the first
14 days after emergence, but in the common con-
trolled room with light provided by four HRI-T 250 W
bulbs. Only the variety Sariaso 10 was sown. After 14
days under the initial photoperiod of 13 h, two sub-
sequent experiments were run, resulting in eight dif-
ferent treatments, four with constant photoperiod of
11 h 40 min, 12 h 00 min, 12 h 20 min and 12 h
40 min, and four with variable photoperiod with initial
PP of 12 h 20 min, 12 h 00 min and 11 h 40 min and
daily changes of PP of �1 min, �1 min and �1 min,
respectively. After the estimated end of the PIP
(460 8C day, as recorded in September in Bamako,
under average day lengths of 12 h 40 min), nine plants
per treatment were weekly dissected to estimate the
date of panicle initiation. The 0–4 scale defined by
Lane (1963) was used to allow for interpolation, based
on the assumption that 7 days elapsed from stages 0–4.
2.3. Modelling the field observations
Five models using two main ways of calculating the
vegetative phase duration were tested with the data
obtained from the field experiment. All models had in
common the principle of a cumulating on a daily basis,
starting at end of BVP, a variable dPI representing the
rate of progress towards PI. The variable was a func-
tion, depending on the model, of current PP, incre-
mental change in PP, or both. Temperature
compensation of daily progress to PI was achieved
with dPI ¼ dTT=PIPd, with dTT being the daily bio-
logical temperature (mean temperature less base tem-
perature) and PIPd the theoretical total thermal
duration of PIP calculated on the basis of current
photoperiod conditions. The models differed in the
calculation of PIPd.
All models were parameterised by optimisation
against the measured data (26 sowing dates) through
26 B. Clerget et al. / Field Crops Research 88 (2004) 21–37

the genetic algorithm of the Microsoft Evolutionary
Solver. Although this type of optimisation procedure
does not converge towards an absolute minimum of
the sum of squares, it was preferred over other meth-
ods because parameter behaviour did not always allow
using linear or quadratic optimisation procedures. It
was verified that repeats resulted in similar estima-
tions of parameter values, within reasonable, pre-set
intervals. Then PIP was estimated with the optimised
model using ModelMaker 4.0 for sowings on each day
of year 2001, from 1 January to 31 December, using
the corresponding meteorological data. PIP estima-
tions were finally compared on scatter plots and by
linear regression with the 26 values observed during 2
years. Model accuracy was assessed using R2 derived
from the regression of observed and predicted values,
and the root mean square deviation (RMSD), calcu-
lated as RMSD ¼P
ðO � PÞ=n½ �0:5, where O and P
are the paired observed and predicted values.
� Model 1 followed the concept of quantitative PP
response described by Major (1980). The prolon-
gation of the vegetative phase caused by PP was
calculated under the assumptions of an empirical
base photoperiod Pb (below which PI is instanta-
neous after BVP has ended), and an empirical slope
coefficient describing photoperiod sensitivity (Ps,
8C day h�1). Model 1 was thus PIPd ¼ Ps½PP � Pb�,with PP being the photoperiod of the day, and
parameters Pb and Ps estimated by optimisation.
(For this and all other models, provision was made
that the terms enclosed in brackets could not become
negative.)
� Model 2 was the exact replication of Model 1 but
using the daily rate of change of photoperiod (dPP)
instead of the photoperiod itself. Model 2 was thus
PIPd ¼ dPs ½dPP � dPb�.
� Model 3 followed the concepts of quantitative or
qualitative photoperiod response proposed for
pigeon pea by Carberry et al. (2001). It uses the
same calculation as Model 1 but imposes, in addi-
tion, a critical photoperiod Pc above which progress
to PI either continues at ceiling rate (quantitative
type) or is zero until PP falls again below Pc and
immediately induces PI (qualitative type). Quali-
tative varieties are thus characterised by very dif-
ferent behaviour below and above Pc.
� Models 4 and 5 used basically the same concepts but
instead of using a function of either PP or dPP, PIPd
was calculated as an additive function of PP and dPP
(Model 4: PIPd¼ Ps ½PP � Pb� þ dPs
½dPP � dPb�.Finally, Model 5 combined the additive, double
linear function of PP and dPP with a combination
of the critical threshold Pc of the second model and a
critical threshold of the rate of change of photoper-
iod, dPc, with both critical conditions required
together for arresting progress towards PI. This rule
served to take into account the different behaviour
observed for crops sown before or after summer
equinox, under increasing (dPP > 0) or decreasing
day length (dPP < 0).
3. Results
3.1. The monthly planting experiment in Mali
Variation among sowing dates of the duration from
sowing to PI (VP, vegetative phase) and to flowering
was much greater for the guinea variety CSM 335 than
for Sariaso 10 and IRAT 174 (Fig. 3). In terms of
calendar dates, the response of CSM 335 and IRAT
174 resembled the qualitative type: all plants sown
Fig. 3. Dates of panicle initiation (close circles) and flowering (open circles) in relation to seedling date. Lines join the monthly averages of
the 2 years.
B. Clerget et al. / Field Crops Research 88 (2004) 21–37 27

between February (CSM 335) or April (IRAT 174) and
early July flowered within 1 month, between late
August and late September. According to stem dissec-
tions, PI for these flowering dates was between mid-
July and mid-August, a period during which day length
was close to its annual maximum but had started to
decrease. In terms of thermal duration of VP, response
curves of the three varieties differed markedly (Fig. 4).
Duration was generally minimal for sowings in Sep-
tember and October, around the autumn equinox,
whereas maximal duration was observed for sowing
in January–February (CSM 335), March (Sariaso 10)
and April (IRAT 174). Sowing dates gave nearly
identical duration for the 2 years, except in January
(CSM 335) and November (all cultivars).
Marked delays in PI, as indicated by sudden
increases in the duration of VP and accompanied by
increased inter-annual variability, were observed in
January for CSM 335, in March/April for IRAT 174,
and in October/November for all cultivars. The onset
of these increases of VP is thought to be associated
with threshold conditions, and the observed increase
in variability with the system instability occurring near
the threshold. On this basis, increases in VP in January
and March can be interpreted as conventional PP
thresholds encountered as day length increases. The
second increase in VP in October was associated with
decreasing minimum temperatures (Table 1), but it
must be noted that ordinary effects of temperature on
development rate are already taken care of in the
thermal time term.
This experiment gave information on the duration
of three sequential phases between seeding and flow-
ering: the VP ending at PI, and the reproductive phase
divided between the time to the appearance of the flag
leaf (PI-FL) and then the time to flowering (FL-FLO)
(Fig. 5). The data confirmed that the variation of the
duration from emergence to flowering was mainly
caused by the variation of VP, which constituted
40–80% of the total duration to flowering. However,
it also appeared that the second phase, IP-FL, was
variable and its duration was slightly correlated with
that of the previous phase (r2 ¼ 0:31, 0.25 and 0.19
and P ¼ 0:004, 0.010 and 0.0271 for CSM 335,
Sariaso 10 and IRAT 174, respectively). The phase
PI-FL comprises the development of the ultimate leaf
from its initiation until appearance outside the whorl.
The main cause of this variation was a strong decrease
of leaf appearance rates observed when more than 22–
23 leaves were produced (Fig. 2). Finally, the third
phase, FL-FLO, was constant and independent of the
sowing date, equal in average to 211, 180 and
154 8C day for CSM 335, Sariaso 10 and IRAT 174,
respectively.
For CSM 335, there was only a weak correlation
between the photoperiod-induced phase (PIP), defined
here from the end of BVP to PI, and the average
photoperiod (PP) occurring during the same period.
(Fig. 6a). However, on the basis of plantings between
May and October (wet season), an approximately
linear relationship between PIP and photoperiod PP
was observed, indicating a photoperiod threshold
(critical PP) of about 12 h 40 min (r2 ¼ 0:87 for the
model). For the same variety we could plot a hyper-
bolic relationship between PIP and PP at PI (PPi),
similar to that modelled by Franquin (1976) for sor-
ghum in Chad, but this relationship did not hold for
crops sown in November and December (points
Fig. 4. Thermal time duration to flowering in relation to seedling date. Lines join the monthly averages of the 2 years.
28 B. Clerget et al. / Field Crops Research 88 (2004) 21–37

marked 11 and 12 in Fig 6d). However this last
correlation appears to be of little explanatory value:
for plants sown at the beginning of the year which first
encountered short days, panicle initiation occurred
after a long time under long day conditions, simulta-
neously with plants sown in May or June that were
grown under long days throughout.
For Sariaso 10, there was a strong, positive, linear
relationship between PIP and PP for May–October
(r2 ¼ 0:94;P ¼ 0:002) with a photoperiod threshold
of about 12 h 20 min (Fig. 6b) but sowing on other
months gave different results. Plotting PIP against PPi
while using the same selection of sowing dates, showed
the same level of correlation (r2 ¼ 0:95;P ¼ 0:002)
Fig. 5. Thermal duration of three consecutive phases (a) to PI, (b) from PI to flag-leaf appearance and (c) from flag-leaf to flowering in relation
to seedling date. Lines join the monthly averages of the 2 years.
B. Clerget et al. / Field Crops Research 88 (2004) 21–37 29

(Fig. 6e). For IRAT 174, similar good linear relation-
ships between PIP and PP was observed for May–
October (r2 ¼ 0:88, P ¼ 0:006) with a photoperiod
threshold of about 12 h 20 min and between PIP and
PPi (r2 ¼ 0:89, P ¼ 0:006) (Fig. 6c and f).
The results show that the common concepts of a
gradual (linear or quantitative) response of PIP to PP
or PPi (case of Sariaso 10) or a threshold-type of
response (hyperbolic, or absolute; case of CSM 335
and IRAT 174) could be reproduced for the sowing
dates falling into the wet season (May–October), but
did not fit crop behaviour during the remaining months
of the year. In fact, the PIP vs. PP scattergrams
generally showed a strong hysteresis caused by
delayed panicle initiation in the dry (off-) season,
namely, between November and April. This hysteresis
became smaller, but did not entirely disappear, in the
case of CSM 335 and Sariaso 10 when PIP was plotted
against the mean day-to-day change of PP (dPP)
(Fig. 6g–i).
A correlation matrix between PIP and nine factors
that might influence it were calculated (Table 2). PIP
was significantly correlated with PP, dPP at the end of
BVP (dPPBVP), and PPi for each of the three varieties.
Fig. 6. Relationships between the thermal duration of PIP and the average photoperiod during PIP in (a)–(c), between the thermal duration of
PIP and the photoperiod at panicle initiation in (d)–(f), and between the thermal duration of PIP and the average rate of day length change
during PIP in (g)–(i). Each sowing is plotted with its occurring month. Linear relationships for summer plantings have been plotted with
dashed lines.
30 B. Clerget et al. / Field Crops Research 88 (2004) 21–37
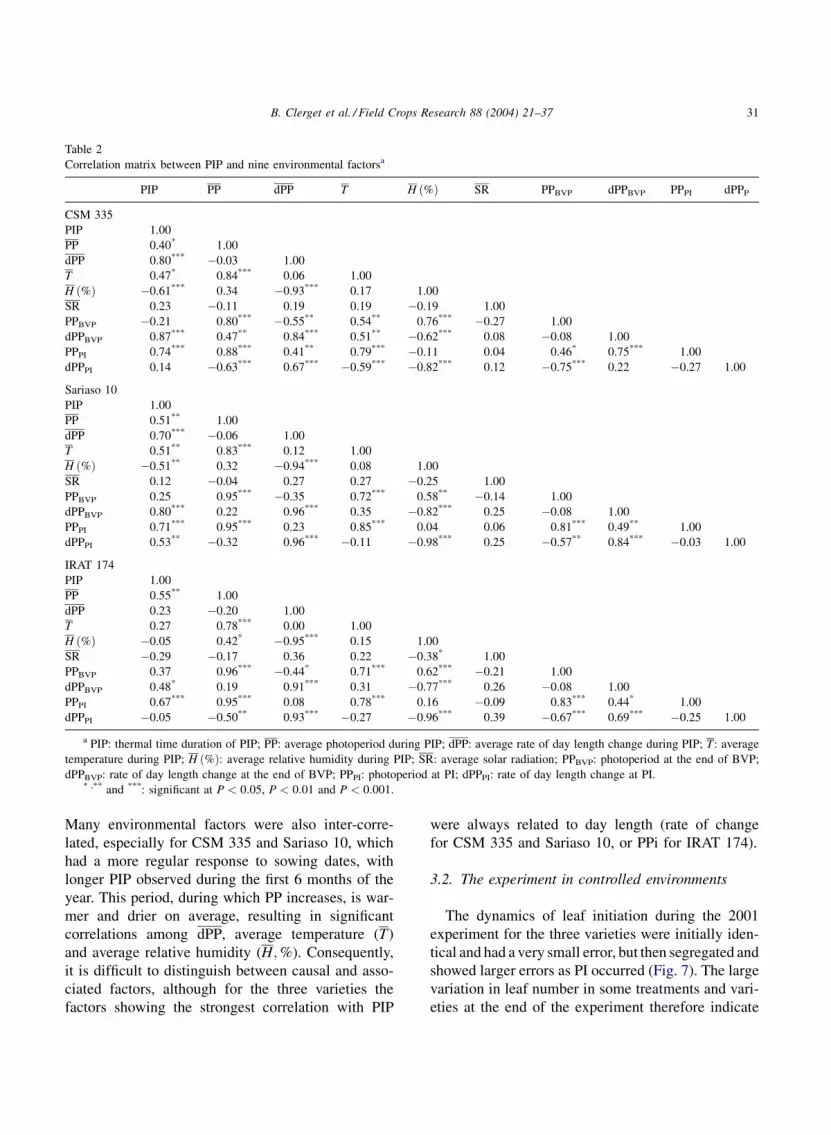
Many environmental factors were also inter-corre-
lated, especially for CSM 335 and Sariaso 10, which
had a more regular response to sowing dates, with
longer PIP observed during the first 6 months of the
year. This period, during which PP increases, is war-
mer and drier on average, resulting in significant
correlations among dPP, average temperature (T)
and average relative humidity (H;%). Consequently,
it is difficult to distinguish between causal and asso-
ciated factors, although for the three varieties the
factors showing the strongest correlation with PIP
were always related to day length (rate of change
for CSM 335 and Sariaso 10, or PPi for IRAT 174).
3.2. The experiment in controlled environments
The dynamics of leaf initiation during the 2001
experiment for the three varieties were initially iden-
tical and had a very small error, but then segregated and
showed larger errors as PI occurred (Fig. 7). The large
variation in leaf number in some treatments and vari-
eties at the end of the experiment therefore indicate
Table 2
Correlation matrix between PIP and nine environmental factorsa
PIP PP dPP T H ð%Þ SR PPBVP dPPBVP PPPI dPPP
CSM 335
PIP 1.00
PP 0.40* 1.00
dPP 0.80*** �0.03 1.00
T 0.47* 0.84*** 0.06 1.00
H ð%Þ �0.61*** 0.34 �0.93*** 0.17 1.00
SR 0.23 �0.11 0.19 0.19 �0.19 1.00
PPBVP �0.21 0.80*** �0.55** 0.54** 0.76*** �0.27 1.00
dPPBVP 0.87*** 0.47** 0.84*** 0.51** �0.62*** 0.08 �0.08 1.00
PPPI 0.74*** 0.88*** 0.41** 0.79*** �0.11 0.04 0.46* 0.75*** 1.00
dPPPI 0.14 �0.63*** 0.67*** �0.59*** �0.82*** 0.12 �0.75*** 0.22 �0.27 1.00
Sariaso 10
PIP 1.00
PP 0.51** 1.00
dPP 0.70*** �0.06 1.00
T 0.51** 0.83*** 0.12 1.00
H ð%Þ �0.51** 0.32 �0.94*** 0.08 1.00
SR 0.12 �0.04 0.27 0.27 �0.25 1.00
PPBVP 0.25 0.95*** �0.35 0.72*** 0.58** �0.14 1.00
dPPBVP 0.80*** 0.22 0.96*** 0.35 �0.82*** 0.25 �0.08 1.00
PPPI 0.71*** 0.95*** 0.23 0.85*** 0.04 0.06 0.81*** 0.49** 1.00
dPPPI 0.53** �0.32 0.96*** �0.11 �0.98*** 0.25 �0.57** 0.84*** �0.03 1.00
IRAT 174
PIP 1.00
PP 0.55** 1.00
dPP 0.23 �0.20 1.00
T 0.27 0.78*** 0.00 1.00
H ð%Þ �0.05 0.42* �0.95*** 0.15 1.00
SR �0.29 �0.17 0.36 0.22 �0.38* 1.00
PPBVP 0.37 0.96*** �0.44* 0.71*** 0.62*** �0.21 1.00
dPPBVP 0.48* 0.19 0.91*** 0.31 �0.77*** 0.26 �0.08 1.00
PPPI 0.67*** 0.95*** 0.08 0.78*** 0.16 �0.09 0.83*** 0.44* 1.00
dPPPI �0.05 �0.50** 0.93*** �0.27 �0.96*** 0.39 �0.67*** 0.69*** �0.25 1.00
a PIP: thermal time duration of PIP; PP: average photoperiod during PIP; dPP: average rate of day length change during PIP; T: average
temperature during PIP; H ð%Þ: average relative humidity during PIP; SR: average solar radiation; PPBVP: photoperiod at the end of BVP;
dPPBVP: rate of day length change at the end of BVP; PPPI: photoperiod at PI; dPPPI: rate of day length change at PI.* ,** and ***: significant at P < 0:05, P < 0:01 and P < 0:001.
B. Clerget et al. / Field Crops Research 88 (2004) 21–37 31

heterogeneity in PI among replications. Owing to this
variability, 3 of the 4 treatments for CSM 335 and the
11 h 45 þ 1 min for IRAT 174 are difficult to evaluate.
For Sariaso 10, the treatment 12 h15 � 1 min showed
large variation in final leaf number, but it can be safely
assumed that PI had occurred in all replications
because the number of initiated leaves was in all cases
less than that of the two treatments that had remained
vegetative. In the following, we use cessation of leaf
initiation as indicator of PI, instead of the less reliable
observation of the appearance of panicle primordia.
In Fig. 8 (2001 experiment) and Fig. 9 (2002), PI
occurrence wherever certain is marked by an arrow on
the PP by thermal time scattergram. In 2001, the first
panicle initiations were observed 3 weeks or
300 8C day after plant emergence. When treatments
were inductive, IRAT 174 reached PI most rapidly
among the cultivars. On two particular dates in the
experiment, pairs of treatments had equal PP: at 410
and 620 8C day, corresponding to about 2 and 4 weeks
after onset of differential treatments, or 4 and 6 weeks
after seedling emergence. In each of these cases, pairs
of treatments had opposite rates of change of PP.
For CSM 335, no clear information could be
obtained, since no treatment had clearly reached PI
Fig. 7. Leaf initiation by the apex of (a) CSM 335, (b) Sariaso 10 and (c) IRAT 174 depending on day light duration in controlled environment
in 2001. Three plants were dissected at each measurement, and the average data has been plotted together with the minimal and maximal
values.
Fig. 8. Evolution towards the panicle initiation of (a) CSM 335, (b) Sariaso 10 and (c) IRAT 174 as depending of the dynamic of the day light
duration in controlled environment in 2001. At the estimated date of PI, when occurred before the end of the experiment, line of the daily
photoperiod is disrupted and marked with an arrow.
Fig. 9. Evolution towards the panicle initiation of Sariaso 10 as
depending of the dynamic of the day light duration in controlled
environment in 2002. At the estimated date of PI, line of the daily
photoperiod is disrupted and marked with an arrow and the
Newmann and Keuls group (a ¼ 5%) of the date indicated with a
letter.
32 B. Clerget et al. / Field Crops Research 88 (2004) 21–37

before the end of the experiment. For Sariaso 10, on
the contrary, one pair of treatments gave a well-con-
trasted result: at 410 8C day, PI was observed for the
12 h 00 � 1 min treatment, whereas the 11 h
45 þ 1 min treatment was still vegetative despite iden-
tical PP (11 h 52 min). In fact, the latter treatment
remained vegetative until the end of the experiment at
620 8C. Similarly, the 12 h 15 � 1 min treatment
reached PI at about 490 8C day at PP ¼ 12 h 07 min
while the opposite treatment 12 h 00 þ 1 min that had
the same PP at that time remained vegetative. In these
two contrasting pairs of treatments, those with
decreasing photoperiod consistently reached PI before
the opposite treatments.
For IRAT 174, the pair 12 h 00 � 1 min/11 h
45 þ 1 min gave the same contrasting result as for
Sariaso 10. At 310 8C day, at PP ¼ 11 h 56 min and
respective PP¼ 11 h 52 min (descending) and 11 h
49 min (ascending), the treatment 12 h 00 � 1 min
had entirely initiated against only 1 out of 3 plants
of the opposite treatment 11 h 45 þ 1 min (same final
number of leaves), indicating that the descending
treatment was more inductive.
It must be noted that in three pairs of treatments
where PI happened earlier under descending PP, the
final PP just before PI happened was lower. In these
cases, the rate of PP change is therefore not the only
possible explanation for early PI. The only treatment�variety combination where PI happened earlier under
descending PP despite higher or equal initial, mean and
final PP, was the 12 h 00 � 1 min treatment for IRAT
174, as compared to its 11 h 45 þ 1 min opposite. This
case is compelling because all replications behaved
identically. With a lesser level of certainty, the same
observation can be made for Sariaso 10, some plants of
which showed PI above 12 h 00 min in the treatment
12 h 15 � 1 min, while none did at a PP below 12 h
00 min in the treatment 11 h 45 þ 1 min.
In summary, this rather complex experimental
design reproduced on the one hand the well-known
promotion of floral induction by short days, and in
some treatments and varieties, an additional, apparent
promotion by descending PP. At any given dynamics
of PP (increasing or decreasing), plants exposed to the
shorter day length progressed faster (Fig. 8). Conver-
sely, wherever absolute PP was smaller or equal, and
where PI was observed at all, PI happened earlier
under decreasing PP.
In 2002, the second series of experiments conducted
on Sariaso 10 only, did not confirm the first. The first
PI were observed at 360 8C day (2001: 400 8C day)
and all plants initiated before 510 8C day (2001: no PI
observed at 630 8C day in two treatments), after hav-
ing initiated between 13 and 15 leaves (2001: 16–18
leaves initiated at PI). In this experiment, the length of
the PIP was been well correlated with the average PP
(P < 0:01) and no relationships between PIP and dPP
was observed (Fig. 9).
The different behaviour of plants in 2001 and
2002 experiments under controlled conditions were
associated with a slight, but possibly important
difference in light quality, a factor that is known
to affect PIP (Thomas and Vince-Prue, 1997). In
2002, plants were raised until onset of differential PP
in a room with different light sources, and were
provided additional light from incandescent lamps
rich in red (details in Section 2). Particularly, the
latter change in lighting is likely to accelerate floral
induction, but both 2001 and 2002 environments
differ very strongly from field conditions and there-
fore are potentially prone to produce physiological
artefacts.
3.3. Modelling the field observations
It was not possible to fit the field data with Models 1
and 3, even for the quantitative response type Sariaso
10 (Fig. 10 and Table 3) because the estimated PIP
durations were not in phase with the observed, annual
pattern of PP. Unlike the results on pigeon pea, the
addition of Pc to the model did not enable fitting the
data for the qualitative response type CSM 335, again
because of a major phase shift between the physiolo-
gical response and its supposed cause, photoperiod.
This model provoked a discontinuous curve shape
because PI is immediate when PP falls below Pc for
crops that have reached end of BVP before this event.
For IRAT 174, the use of Pc permitted to fit well the
data observed in April and May. But the fit for the rest
of the year, although improved, remained unsatisfac-
tory.
Model 2, using only dPP despite the well estab-
lished fact that absolute PP is positively known to be
involved in floral induction, is presented for comple-
teness. However, it appears that for CSM 335 this
model fits much better the observations than Models 1
B. Clerget et al. / Field Crops Research 88 (2004) 21–37 33

and 3 and above all gives estimations of PIP that are
more in phase with the observed annual pattern. In
fact, predictions using dPP are slightly advanced
compared with observed patterns for CSM 335 and
Sariaso 10, whereas predictions using PP are strongly
behind, suggesting that a combined model might give
a much better fit. The photoperiodic response of IRAT
174, in turn, appears to be different.
Indeed, Model 4 strongly improved the prediction
of PIP for CSM 335 and Sariaso 10. It was able to
describe the increase of PIP at the end of the year
without the need to introduce a specific effect of low
temperatures as previously modelled by Franquin
(1974) and Vaksmann et al. (1997). But for CMS
335, Model 4 was unable to predict the longer PIP
duration observed for the first sowing dates of the year.
The addition of a combined effect of two ceiling
thresholds on the photoperiod Pc and its rate of change
dPc (Model 5) was necessary to adjust the model for
these sowings.
Fig. 10. Prediction of the duration of the vegetative phase depending on sowing dates in 2001 with (a) a model based on a linear relationship
with the daily photoperiod (Model 1, regular lines) with the addition of a critical threshold Pc (Model 3, bold lines), (b) a model based on a
linear relationship with the daily rate of day length change (Model 2, regular lines) and (c) a model combining linear relationships with the
daily photoperiod and its rate of change (Model 4, regular lines) with the addition of a critical thresholds Pc and dPc (Model 5, bold lines).
Dots represent the observed data.
34 B. Clerget et al. / Field Crops Research 88 (2004) 21–37

4. Discussion
The field experiment in Mali confirmed only partly
the concept of a linear relationship between the dura-
tion of PIP and the mean PP observed during PIP as
postulated by Major (1980) and used by numerous
crop models. In fact, Major’s model only fitted the
behaviour of crops sown between May and October,
corresponding to the rainy season. This model there-
fore, although useful to predict crop duration for the
agronomically relevant range of sowing dates, does
not satisfactorily reflect the physiological mechanisms
at work. (In fact, some traditional sorghum production
systems in West Africa using residual moisture after
flood recession are based on sowing between Novem-
ber and January (Chantereau, 2002).) Although some
of the hysteresis of PIP annual patterns might be due to
errors in the assumed cardinal temperatures or to
specific effects of very high or low temperatures, it
seems certain that the classical model is inaccurate or
incomplete.
Applying the critical photoperiod threshold Pc pro-
posed by Carberry et al. (2001) failed to improve
predictions mainly because it did not remove the
major problem constituted by phase shift between
the annual patterns of PP and PIP. On the other hand,
the hypothesis of an influence of the rate of day length
change, either quantitative for Sariaso 10 or qualitative
for CSM 335, as evidenced by the superior fit with
field data and the results of the 2001 experiment in
controlled environments, gave a large improvement of
the model (Models 3 and 4). Model 5, that is quite
complex with 2 input variables, 2 critical and 2 ceiling
thresholds, extends the model proposed by Carberry
et al. (2001) on pigeon pea by adding an additional
sensitivity to dPP. This model was able to explain
the somewhat odd behaviour of IRAT 174, but the use
of a large number of variables and rules reduces its
credibility, or likelihood of having generic value.
Essentially, the introduction of dPP in Models 3–5
enabled predictions for both the first and second
half of the year, under increasing or decreasing day
Table 3
Parameters of the phenology models and estimations of model fit using r2 for regressions of observed vs. predicted values and RMSD (see text)
Model Variety Pb (h) Ps
(8C day h�1)
Pc (h) dPb
(min)
dPs
(8C day min�1)
dPc
(min)
r2 RMSD
(8C day)
Model 1
PIP ¼ Ps*(PP � Pb) CSM 335 11.05 602 0.14 656
While PP > Pb Sariaso 10 11.16 273 0.37 158
IRAT 174 11.43 346 0.34 254
Model 2
PIP ¼ dPs*(dPP � dPb) CSM 335 �0.93 1036 0.68 408
While Dpp > dPb Sariaso 10 �1.63 271 0.46 147
IRAT 174 �2.54 190 0.07 302
Model 3
PIP ¼ Ps*(PP � Pb) CSM 335 11.03 428 13.5 0.13 700
While Pb < PP < Pc Sariaso 10 11.31 316 13.17 0.40 154
IRAT 174 10.94 192 13.5 0.72 243
Model 4
PIP ¼ Ps*(PP � Pb) þdPs*(dPP�dPb)
CSM 335 12.11 483 �0.54 1080 0.82 313
While dP < dPP < dPb Sariaso 10 11.82 271 �0.46 303 0.89 67
IRAT 174 11.47 359 1.47 1008 0.35 253
Model 5
PIP ¼ Ps*(PP � Pb) þdPs*(dPP � dPb)
CSM 335 11.45 235 13.11 �0.63 677 0.07 0.95 151
While Pb < PP < Pc and
dPb < dPP < dPb
Sariaso 10 11.76 248 13.89 �0.44 333 0.16 0.88 69
IRAT 174 11.72 307 13.36 �1.31 73 0.27 0.60 197
B. Clerget et al. / Field Crops Research 88 (2004) 21–37 35

lengths, which was not possible with absolute PP
alone.
These results support the hypothesis that in sorghum
the photoperiod sensitivity would be proportional to
both PP and dPP, possibly in an additive fashion. On the
other hand, this may not be the only possible explana-
tion, and a mathematical artefact could be suspected
since PP and dPP are inter-dependent, with a constant
p/2 phase shift between them. Unfortunately, the results
obtained in controlled environments did not conclu-
sively support the hypothesis of dPP directly affecting
PIP. In fact, they demonstrated that profoundly differ-
ent effects of day length might be generated with
different light quality, thus raising the question how
meaningful experiments under artificial lighting are if
the complex dynamics of field situations cannot be
mimicked. For instance, it is obvious than natural dawn
and dusk are very different from an abrupt switching on
and off of the light source, both in terms of light quality
and quantity. For example, plants are sensitive to
dynamics of both light intensity and its shifting red/
far red ratio associated with dawn and dusk (Salisbury
and Ross, 1985). Moreover, the inability to fit the more
complex PIP pattern for IRAT 174 with a reasonably
simple model shows that the hypotheses remain incom-
plete and that other, unknown factors must have influ-
enced the panicle initiation of this variety.
Finally, it appears impossible to conclude defini-
tively in favour of the hypothesis of an effect of the
rate of day length change on the duration of PIP.
Indirect evidence has been presented here, the stron-
gest of which might be this model’s ability to predict
accurately the behaviour of both the quantitative
variety Sariaso 10 and the qualitative variety CSM
335 on a yearly cycle. But results presented for IRAT
174 and the failure to reproduce in 2002 the observa-
tions made under controlled environment in 2001
leaves this question open. Consequently, this study
provided a model that significantly improves the
simulation of sorghum phenology in the field, but
not necessarily on the basis of established physiolo-
gical knowledge.
Acknowledgements
The authors are grateful to D. Fabre (CIRAD) for
his cooperation during the experiment in controlled
environment and to M. Sidibe (ICRISAT) for the hard
work done for field data recording during the last 3
years.
References
Alagarswamy, G., Chandra, S., 1998. Pattern analysis of interna-
tional sorghum multi-environment trials for grain-yield adapta-
tion. Theor. Appl. Genet. 96, 397–405.
Alagarswamy, G., Ritchie, J.T., 1991. Phasic development in
CERES-Sorghum model. In: Hodges, T. (Ed.), Predicting Crop
Phenology. CRC Press, Boca Raton, FL, pp. 143–152.
Baker, C.K., Gallagher, J.N., Monteith, J.L., 1980. Day length
change and leaf appearance in winter wheat. Plant Cell
Environ. 3, 285–287.
Bezot, P., 1963. L’amelioration des sorghos au Tchad. Agron.
Tropicale. 18, 985–1007.
Carberry, P.S., Ranganathan, R., Reddy, L.J., Chauhan, Y.S.,
Robertson, M.J., 2001. Predicting growth and development of
pigeonpea: flowering response to photoperiod. Field Crops Res.
69, 151–162.
Chantereau, J., 2002. Connaissance et utilisation de la diversite des
sorghos de decrue en Afrique de l’Ouest et du Centre au Cirad
(Knowledge on and utilisation of the diversity of flood
recession sorghums of West and Central Africa at CIRAD).
In: Cormas, J., MacPherson, H.G. (Eds.), La culture du sorgho
de decrue en Afrique de l’Ouest et du Centre. AECI, FAO,
ICRISAT, pp. 39–50.
Craufurd, P.Q., Qi, A., 2001. Photothermal adaptation of sorghum
(Sorghum bicolor) in Nigeria. Agric. For. Meteorol. 108, 199–
211.
Curtis, D.L., 1968. The relationship between the date of heading of
Nigerian sorghums and the duration of growing season. J. Appl.
Ecol. 5, 215–226.
Ellis, R.H., QI, A., Craufurd, P.Q., Summerfield, R.J., Roberts,
E.H., 1997. Effects of photoperiod, temperature and asyn-
chrony between thermoperiod and photoperiod on development
to panicle initiation in sorghum. Annals of Botany 79, 169–
178.
Franquin, P., 1974. Formulation des phenomenes apparents de
photothermoperiodisme en conditions naturelles. Principes de
base. Cah. ORSTOM, ser. Biol. 23, 31–43.
Franquin, P., 1976. Formulation des phenomenes apparents de
photoperiodisme en conditions naturelles. Des modeles pro-
gressifs. Physiol. Veg. 14, 179–191.
Horie, T., 1994. Crop ontogeny and development. In: Physiology
and Determination of Crop Yield. ASA–CSSA–SSSA, Madi-
son, WI, USA, pp. 153–167.
Jones, J.W., Tsuji, G.Y., Hoogenboom, G., Hunt, L.A.,
Thornton, P.K., Wilkens, P.W., Imamura, D.T., Bowen,
W.T., Sing, U., 1998. Decision support system for agrotech-
nology transfer DSSAT v3. In: Tsuji, G.Y., Hoogenboom, G.,
Thornton, P.K. (Eds.), Understanding Options for Agricul-
tural Production. Kluwer Academic Publishers, Dordrecht,
pp. 157–177.
36 B. Clerget et al. / Field Crops Research 88 (2004) 21–37

Kassam, A.H., Andrew, D.J., 1975. Effects of sowing dates on
growth, development and yield of photosensitive sorghum at
Samaru, Northern Nigeria. Expl. Agric. 11, 227–240.
Keisling, T.C., 1982. Calculation of the length of day. Agron. J. 74,
758–759.
Kirby, E.J.M., 1995. Factors affecting rate of leaf emergence in
barley and wheat. Crop Sci. 35, 11–19.
Kirby, E.J.M., Appleyard, M., Fellowes, G., 1982. Effect of sowing
date on the temperature response of leaf emergence and leaf
size in barley. Plant Cell Environ. 5, 477–484.
Kirby, E.J.M., Appleyard, M., Fellowes, G., 1985. Effect of sowing
date and variety on main shoot leaf emergence and number of
leaves of barley and wheat. Agronomie 5, 117–126.
Lafarge, T., 1998. Analyse de la mise en place de la surface foliaire
du sorgho-grain (Sorghum bicolor L. Moench) au champ. Paris-
Sud, Orsay, France, 69 pp.
Lane, H.C., 1963. Effect of light quality on maturity in the Milo
group of sorghum. Crop Sci. 3, 496–498.
Major, D.J., 1980. Photoperiod response characteristics controlling
flowering of nine crop species. Can. J. Plant Sci. 60, 777–
784.
McCown, R.L., Hammer, G.L., Harvreaves, J.N.H., Holzworth,
D.P., Freebarin, D.P., 1996. APSIM: a novel software system
for model development model testing and simulation in
agricultural systems research. Agric. Syst. 50, 255–271.
Miller, F.R., Barnes, D.K., Cruzado, H.J., 1968. Effect of tropical
photoperiods on the growth of sorghum when grown in 12
monthly plantings. Crop Sci. 8, 499–502.
Pandusastry, K., Krishna Murthy, K., 1984. Panicle development
and its relationship within sorghum genotypes. Indian J. Plant
Physiol. 27, 26–33.
Salisbury, F.B., Ross, C.W., 1985. Photoperiodism. In: Plant
Physiology. Wadsworth, Belmont, CA, pp. 426–446.
Slafer, G.A., Connor, D.J., Halloran, G.M., 1994a. Rate of leaf
appearance and final number of leaves in wheat: effects of
duration and rate of change of photoperiod. Ann. Bot. 74, 427–
467.
Slafer, G.A., Halloran, G.H., Connor, D.J., 1994b. Development
rate in wheat as affected by duration and rate of change of
photoperiod. Ann. Bot. 73, 671–677.
Thomas, B., Vince-Prue, D., 1997. Photoperiodism in Plants.
Academic Press, New York, 428 pp.
Vaksmann, M., Chantereau, J., Bahmani, I., Ag Hamada, M.,
Chartrier, M., Bonhomme, R., 1997. Influence of night
temperature on photoperiod response of a West African guinea
sorghum landrace. In: Amelioration du sorgho et de sa culture
en Afrique de l’Ouest et du Centre, CIRAD. Montpellier,
France, pp. 23–28.
Vaksmann, M., Traore, S.B., Kouressy, M., Coulibaly, H., Reyniers,
F.-N., 1998. Etude du developpement d’un sorgho photoper-
iodique du Mali. In: Le futur des cereales photoperiodiques
pour une production durable en Afrique semi-aride. Florence,
Italia, CIRAD et Ce.S.I.A. Florence, Italy, pp. 109–122.
Vaksmann, M., Traore, S.B., Niangado, O., 1996. Le photoper-
iodisme des sorghos africains. Agriculture et Developpement 9,
13–18.
B. Clerget et al. / Field Crops Research 88 (2004) 21–37 37